UNITED STATES
SECURITIES AND EXCHANGE COMMISSION
Washington, D.C. 20549
FORM N-CSR
CERTIFIED SHAREHOLDER REPORT OF REGISTERED MANAGEMENT INVESTMENT
COMPANIES
| | |
| Investment Company Act file number: | | 811-23324 |
| |
| Exact name of registrant as specified in charter: | | PGIM ETF Trust |
| |
| Address of principal executive offices: | | 655 Broad Street, 6th Floor |
| | Newark, New Jersey 07102 |
| |
| Name and address of agent for service: | | Andrew R. French |
| | 655 Broad Street, 6th Floor |
| | Newark, New Jersey 07102 |
| |
| Registrant’s telephone number, including area code: | | 800-225-1852 |
| |
| Date of fiscal year end: | | 08/31/2022 |
| |
| Date of reporting period: | | 08/31/2022 |
Item 1 – Reports to Stockholders

PGIM FIXED INCOME ETFs
PGIM Ultra Short Bond ETF (PULS)
PGIM Active High Yield Bond ETF (PHYL)
PGIM Active Aggregate Bond ETF (PAB)
PGIM Total Return Bond ETF (PTRB)
PGIM Floating Rate Income ETF (PFRL)
ANNUAL REPORT
AUGUST 31, 2022

To enroll in e-delivery, go to pgim.com/investments/resource/edelivery
Table of Contents
This report is not authorized for distribution to prospective investors unless preceded or accompanied by a current prospectus.
The views expressed in this report and information about the Funds’ portfolio holdings are for the period covered by this report and are subject to change thereafter.
Exchange-traded funds are distributed by Prudential Investment Management Services LLC (PIMS), member SIPC. PGIM Fixed Income is a unit of PGIM, Inc. (PGIM), a registered investment adviser. PIMS and PGIM are Prudential Financial companies. © 2022 Prudential Financial, Inc. and its related entities. PGIM and the PGIM logo are service marks of Prudential Financial, Inc. and its related entities, registered in many jurisdictions worldwide.
2 Visit our website at pgim.com/investments
Letter from the President
| | |
 | | Dear Shareholder: We hope you find the annual report for the PGIM Fixed Income ETFs informative and useful. The report covers performance for the 12-month period that ended August 31, 2022. The attention of the global economy and financial markets pivoted during the period from the COVID-19 pandemic to the challenge of rapidly rising inflation. While job growth and corporate profits remained strong, prices for a wide range of goods and services rose in response to economic re-openings, supply-chain disruptions, governmental stimulus, and Russia’s invasion of Ukraine. With inflation surging to a 40-year high, the US Federal Reserve and other central banks |
aggressively hiked interest rates, prompting recession concerns.
After rising to record levels at the end of 2021, stocks have fallen sharply in 2022 as investors worried about higher prices, slowing economic growth, geopolitical uncertainty, and new COVID-19 outbreaks. Equities rallied for a time during the summer but began falling again in late August on fears that the Fed would keep raising rates to tame inflation. For the entire 12-month period, equities suffered a broad-based global decline, although large-cap US stocks outperformed their small-cap counterparts by a significant margin. International developed and emerging markets trailed the US market during this time.
Rising rates and economic uncertainty drove fixed income prices broadly lower as well. US and global investment-grade bonds, along with US high yield corporate bonds and emerging market debt, all posted negative returns during the period.
Regarding your investments with PGIM, we believe it is important to maintain a diversified portfolio of funds consistent with your tolerance for risk, time horizon, and financial goals. Your financial advisor can help you create a diversified investment plan that may include funds covering all the basic asset classes and that reflects your personal investor profile and risk tolerance. However, diversification and asset allocation strategies do not assure a profit or protect against loss in declining markets.
At PGIM Investments, we provide access to active investment strategies across the global markets in the pursuit of consistent outperformance for investors. PGIM is the world’s 11th-largest investment manager with more than $1.5 trillion in assets under management. Our scale and investment expertise allow us to deliver a diversified suite of actively managed solutions across a broad spectrum of asset classes and investment styles.
Thank you for choosing our family of funds.
Sincerely,

Stuart S. Parker, President
PGIM Fixed Income ETFs
October 14, 2022
PGIM Fixed Income ETFs 3
PGIM Ultra Short Bond ETF
Your Fund’s Performance (unaudited)
Performance data quoted represent past performance. Past performance does not guarantee future results. The investment return and principal value of an investment will fluctuate so that an investor’s shares, when sold or redeemed, may be worth more or less than their original cost. Current performance may be lower or higher than the past performance data quoted. An investor may obtain performance data as of the most recent month-end by visiting our website at pgim.com/investments or by calling (800) 225-1852.
| | | | |
| |
| | | Average Annual Total Returns as of 8/31/22 |
| | |
| | | One Year (%) | | Since Inception (%) |
| | |
Net Asset Value (NAV) | | 0.21 | | 1.60 (04/05/2018) |
| | |
Market Price* | | 0.23 | | 1.60 (04/05/2018) |
*The market price is determined using the midpoint between the highest bid and the lowest offer on the listing exchange, as of the time that the Fund’s NAV is calculated. The first day of secondary market trading is typically several days after the date on which the Fund commenced investment operations; therefore, the NAV of the Fund is used as a proxy for the period from inception of investment operations to the first day of secondary market trading to calculate the market price returns.
The ICE BofA US 3-Month Treasury Bill Index was adopted as the Fund’s primary benchmark in March 2022 due to the pending discontinuation of LIBOR.
The returns in the table do not reflect the deduction of taxes that a shareholder would pay on Fund distributions or following the redemption or sale of Fund shares.
Market returns do not include brokerage commissions that may be payable on secondary market transactions. If brokerage commissions were included, market returns would be lower. Market and NAV returns assume that dividends and capital gain distributions, if any, have been reinvested in the Fund at market price and NAV, respectively.
4 Visit our website at pgim.com/investments
Growth of a $10,000 Investment (unaudited)
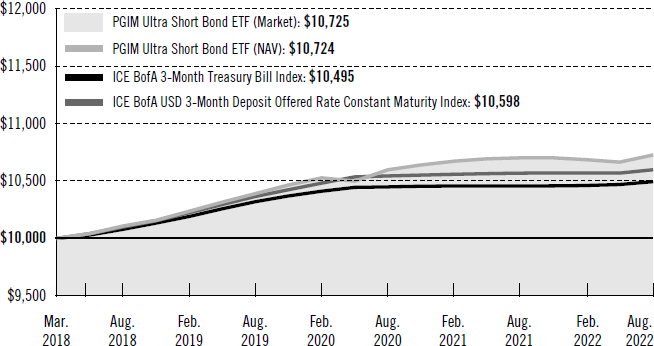
The graph compares a $10,000 investment in the ICE BofA 3-Month Treasury Bill Index and the ICE BofA USD 3-Month Deposit Offered Rate Constant Maturity Index by portraying the initial account values at the commencement of operations (April 5, 2018) and the account values at the end of the current fiscal year (August 31, 2022), as measured on a quarterly basis. The Fund assumes an initial investment on April 5, 2018, while the benchmark and the Index assume that the initial investment occurred on March 31, 2018. For purposes of the graph, and unless otherwise indicated, it has been assumed that (a) all recurring fees (including management fees) were deducted and (b) all dividends and distributions were reinvested. Without waiver of fees and/or expense reimbursements, if any, the returns would have been lower.
Past performance does not predict future performance. Total returns and the ending account values in the graphs include changes in share price and reinvestment of dividends and capital gains distributions in a hypothetical investment for the periods shown. The Fund’s total returns do not reflect the deduction of income taxes on an individual’s investment. Taxes may reduce your actual investment returns on income or gains paid by the Fund or any gains you may realize if you sell your shares.
PGIM Fixed Income ETFs 5
PGIM Ultra Short Bond ETF
Your Fund’s Performance (continued)
Benchmark Definitions
ICE BofA US 3-Month Treasury Bill Index—The ICE BofA US 3-Month Treasury Bill Index is an unmanaged index which is comprised of a single issue purchased at the beginning of the month and held for a full month. At the end of the month that issue is sold and rolled into a newly selected issue. The issue selected at each month-end rebalancing is the outstanding Treasury Bill that matures closest to, but not beyond, three months from the rebalancing date. To qualify for selection, an issue must have settled on or before the month-end rebalancing date.
ICE BofA USD 3-Month Deposit Offered Rate Constant Maturity Index—The ICE BofA USD 3-Month Deposit Offered Rate Constant Maturity Index is an unmanaged index which tracks the performance of a synthetic asset paying LIBOR to a stated maturity. The Index is based on the assumed purchase at par of a synthetic instrument having exactly its stated maturity and with a coupon equal to that day’s fixing rate. That issue is assumed to be sold the following business day (priced at a yield equal to the current day fixing rate) and rolled into a new instrument.
ICE BOFA IS LICENSING THE BOFA INDICES “AS IS,” MAKES NO WARRANTIES REGARDING THE SAME, DOES NOT GUARANTEE THE SUITABILITY, QUALITY, ACCURACY, TIMELINESS, AND/OR COMPLETENESS OF THE ICE BOFA INDICES OR ANY DATA INCLUDED IN, RELATED TO, OR DERIVED THEREFROM, ASSUMES NO LIABILITY IN CONNECTION WITH THEIR USE, AND DOES NOT SPONSOR, ENDORSE, OR RECOMMEND THE FUND, OR ANY OF ITS PRODUCTS OR SERVICES.
Investors cannot invest directly in an index. The returns for the Indexes would be lower if they included the effects of operating expenses or taxes that may be paid by an investor.
6 Visit our website at pgim.com/investments
| | | | |
| |
Credit Quality expressed as a percentage of total investments as of 8/31/22 (%) | | | | |
| |
AAA | | | 32.2 | |
| |
AA | | | 24.3 | |
| |
A | | | 21.3 | |
| |
BBB | | | 17.6 | |
| |
Not Rated | | | 1.0 | |
| |
Cash/Cash Equivalents | | | 3.6 | |
| | |
Total | | | 100.0 | |
Credit ratings reflect the highest rating assigned by a nationally recognized statistical rating organization (NRSRO) such as Moody’s Investors Service, Inc. (Moody’s), S&P Global Ratings (S&P), or Fitch, Inc. (Fitch). Credit ratings reflect the common nomenclature used by both S&P and Fitch. Where applicable, ratings are converted to the comparable S&P/Fitch rating tier nomenclature. These rating agencies are independent and are widely used. The Not Rated category consists of securities that have not been rated by an NRSRO. Credit ratings are subject to change.
| | | | | | | | | | | | |
|
| Distributions and Yields as of 8/31/22 | |
| | | |
| | | | | | | SEC 30-Day | | | | SEC 30-Day | |
| | | Total Dividends Paid | | | | Subsidized | | | | Unsubsidized | |
| | | |
| | | for One Year ($) | | | | Yield* (%) | | | | Yield** (%) | |
| | | |
| | | 0.64 | | | | 3.18 | | | | 3.18 | |
*SEC 30-Day Subsidized Yield (%)—A standardized yield calculation created by the Securities and Exchange Commission, it reflects the income earned during a 30-day period, after the deduction of the Fund’s net expenses (net of any expense waivers or reimbursements). The investor experience is represented by the SEC 30-Day Subsidized Yield.
**SEC 30-Day Unsubsidized Yield (%)—A standardized yield calculation created by the Securities and Exchange Commission, it reflects the income earned during a 30-day period, after the deduction of the Fund’s gross expenses. The investor experience is represented by the SEC 30-Day Subsidized Yield.
PGIM Fixed Income ETFs 7
Strategy and Performance Overview*
(unaudited)
How did the Fund perform?
The PGIM Ultra Short Bond ETF (the Fund) returned 0.21% based on net asset value in the 12-month reporting period that ended August 31, 2022, underperforming the 0.30% return of the ICE BofA USD 3-Month Deposit Offered Rate Constant Maturity Index (the Index).
What were the market conditions?
| ● | | From a starting point of low yields and tight spreads, the shift in fundamentals—most notably, high inflation—drove a wholesale repricing of markets during the period. Concerns about central bank tightening, hard economic landings (i.e., a significant slowdown after a period of rapid growth), and the war in Ukraine led credit spreads notably wider, while rate volatility increased as markets first began pricing in more aggressive Federal Open Market Committee policy tightening and then later began to price in a hard economic landing. |
| ● | | Against the backdrop of historic lows in unemployment and generational highs in inflation, central banks signaled an increased willingness to accept more economic and market volatility than they had been over the prior decade of low inflation. A succession of rate hikes over the first half of 2022—including outsized hikes of 75 basis points (bps) by the Federal Reserve in both June and July—confirmed to markets that the Fed is fully focused on tackling inflation. (One basis point equals 0.01%.) |
| ● | | At the August 2022 Jackson Hole symposium, Fed Chairman Jerome Powell’s speech was successful in lifting investors’ expectations for rate hikes in 2022 and removing the prospects for rate cuts in 2023. While long-run inflation expectations remained relatively subdued through the end of the period, Powell expressed the need to exercise vigilance about the trajectory of expectations to avoid a self-fulfilling inflation spiral. Underpinning his escalation in rhetoric was the reality that Fed officials don’t know how high they will ultimately take the federal funds rate in order to tame inflation. |
| ● | | As a result, significant volatility continued to be priced into US Treasuries, with sharply higher front-end rates and lower long-dated yields forming a substantially flatter US Treasury yield curve before the curve finally inverted the last two months of the period. From 1.10% on August 31, 2021, the 10-year/2-year Treasury spread declined to -0.28% by the end of the period. |
| ● | | After rising to nearly 3.5% in June 2022, US 10-year Treasury yields ended the period at 3.20%. Meanwhile, the yield on the 2-year Treasury note ended the period at 3.48%, a rise of 327 bps over the period. |
| ● | | Just as longer-term Treasuries saw substantial volatility throughout the period, yields on short-term securities, which influence money market yields, also rose substantially. |
8 Visit our website at pgim.com/investments
| | The 3-month Treasury bill rose from 0.05% to 2.93% during the period, while the 3-month London Interbank Offered Rate (LIBOR) rose from 0.12% to 3.10%. Meanwhile, the Secured Overnight Financing Rate (SOFR) rose from 0.05% to 2.29%. |
| ● | | In the short-term credit markets, investment-grade credit spreads widened during the period. The Bloomberg 1-3 Year Credit Index, a proxy for the short-term spread market, underperformed similar short-duration Treasuries by -0.31% during the period. |
What worked?
The Fund emphasized spread assets—including short-term, investment-grade debt of financial, consumer cyclical and non-cyclical, and utility companies—ranging across the rating spectrum from AAA to BBB. Other spread sector assets included commercial mortgage-backed securities (CMBS) and collateralized loan obligations (CLOs). Overall positioning in CMBS contributed to performance during the period.
What didn’t work?
| ● | | The duration of the Fund was tactically managed during the period. Overall, duration positioning detracted from performance. (Duration measures the sensitivity of the price—the value of principal—of a bond to a change in interest rates.) |
| ● | | Overall positioning in CLOs and investment-grade corporates detracted from performance during the period. |
Did the Fund use derivatives?
During the period, the Fund used interest rate swaps and futures to help manage duration positioning and yield curve exposure. These instruments allowed the Fund to capture higher yields available farther out on the short-term portion of the yield curve and in spread-sector assets versus Treasuries, while mitigating interest rate risk. Overall, the positions added to performance during the period.
Current outlook
| ● | | Against the backdrop of historic lows in unemployment and generational highs in inflation, the Fed is signaling an increased willingness to accept more economic and market pain than it had been over the last decade of low inflation. If the Fed can avoid a recession, it will; but more than anything else, Fed officials want to get inflation under control. |
| ● | | Tighter financial conditions are expected to continue working their way through the economy with lagged effects in coming quarters. For now, the Fed is focused on currently high monthly inflation readings, vowing to keep up the pressure until readings show convincing signs of softening toward the Fed’s target. At some point, though, PGIM Fixed Income expects the Fed will likely pivot back toward a focus on the projected lagged effects of its tightening and—should material signs of softening accumulate—adopt a more measured pace of policy normalization. |
PGIM Fixed Income ETFs 9
Strategy and Performance Overview* (continued)
| ● | | PGIM Fixed Income continues to emphasize well-researched, short-term credit sectors, with the expectation that these assets offer the most value from a total return perspective, and it continues to seek out investments with the best total return potential in light of the more challenging market environment. |
| ● | | PGIM Fixed Income continues to find value within investment-grade corporates and structured products (CLOs, CMBS), which represent attractive value in relation to Treasuries and agency mortgage-backed securities, and it will remain selective as the front end of the market continues to adjust to the new rate-and-spread environment. |
*This strategy and performance overview, which discusses what strategies or holdings (including derivatives, if applicable) affected the Fund’s performance, is compiled based on how the Fund performed relative to the Fund’s benchmark index and is viewed for performance attribution purposes at the aggregate Fund level, which in most instances will not directly correlate to the amounts disclosed in the Statement of Operations which conform to U.S. generally accepted accounting principles.
10 Visit our website at pgim.com/investments
PGIM Active High Yield Bond ETF
Your Fund’s Performance (unaudited)
Performance data quoted represent past performance. Past performance does not guarantee future results. The investment return and principal value of an investment will fluctuate so that an investor’s shares, when sold or redeemed, may be worth more or less than their original cost. Current performance may be lower or higher than the past performance data quoted. An investor may obtain performance data as of the most recent month-end by visiting our website at pgim.com/investments or by calling (800) 225-1852.
| | | | |
| |
| | | Average Annual Total Returns as of 8/31/22 |
| | |
| | | One Year (%) | | Since Inception (%) |
| | |
Net Asset Value (NAV) | | -11.01 | | 3.03 (09/24/2018) |
| | |
Market Price* | | -11.14 | | 2.96 (09/24/2018) |
*The market price is determined using the midpoint between the highest bid and the lowest offer on the listing exchange, as of the time that the Fund’s NAV is calculated. The first day of secondary market trading is typically several days after the date on which the Fund commenced investment operations; therefore, the NAV of the Fund is used as a proxy for the period from inception of investment operations to the first day of secondary market trading to calculate the market price returns.
The returns in the table do not reflect the deduction of taxes that a shareholder would pay on Fund distributions or following the redemption or sale of Fund shares.
Market returns do not include brokerage commissions that may be payable on secondary market transactions. If brokerage commissions were included, market returns would be lower. Market and NAV returns assume that dividends and capital gain distributions, if any, have been reinvested in the Fund at market price and NAV, respectively.
PGIM Fixed Income ETFs 11
PGIM Active High Yield Bond ETF
Your Fund’s Performance (continued)
Growth of a $10,000 Investment (unaudited)
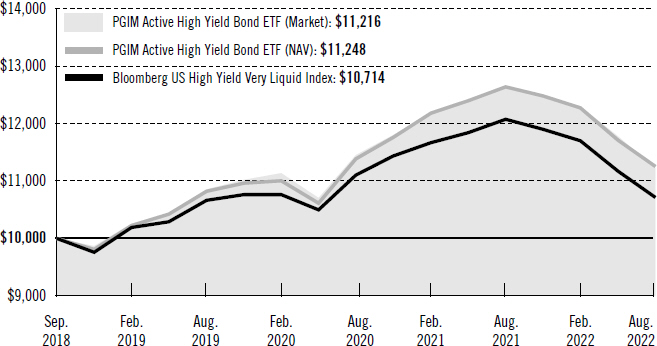
The graph compares a $10,000 investment in the Fund with a similar investment in the Bloomberg US High Yield Very Liquid Index by portraying the initial account values at the commencement of operations (September 24, 2018) and the account values at the end of the current fiscal year (August 31, 2022), as measured on a quarterly basis. The Fund assumes an initial investment on September 24, 2018, while the benchmark and the Index assume that the initial investment occurred on September 30, 2018. For purposes of the graph, and unless otherwise indicated, it has been assumed that (a) all recurring fees (including management fees) were deducted and (b) all dividends and distributions were reinvested. Without waiver of fees and/or expense reimbursements, if any, the returns would have been lower.
Past performance does not predict future performance. Total returns and the ending account values in the graphs include changes in share price and reinvestment of dividends and capital gains distributions in a hypothetical investment for the periods shown. The Fund’s total returns do not reflect the deduction of income taxes on an individual’s investment. Taxes may reduce your actual investment returns on income or gains paid by the Fund or any gains you may realize if you sell your shares.
12 Visit our website at pgim.com/investments
Benchmark Definition
Bloomberg US High Yield Very Liquid Index (VLI)—The Bloomberg US High Yield Very Liquid Index is a component of the US Corporate High Yield Index that is designed to track a more liquid component of the USD-denominated, high yield, fixed rate corporate bond market. The Index uses the same eligibility criteria as the US Corporate High Yield Index, but includes only the three largest bonds from each issuer that have a minimum amount outstanding of USD500mn and less than five years from issue date. The Index also limits the exposure of each issuer to 2% of the total market value and redistributes any excess market value index-wide on a pro rata basis.
Investors cannot invest directly in an index. The returns for the Index would be lower if they included the effects of operating expenses or taxes that may be paid by an investor.
PGIM Fixed Income ETFs 13
PGIM Active High Yield Bond ETF
Your Fund’s Performance (continued)
| | | | |
| |
Credit Quality expressed as a percentage of total investments as of 8/31/22 (%) | | | | |
| |
AAA | | | 12.0 | |
| |
BBB | | | 2.8 | |
| |
BB | | | 47.1 | |
| |
B | | | 24.0 | |
| |
CCC | | | 8.7 | |
| |
CC | | | 0.2 | |
| |
C | | | 0.1 | |
| |
Not Rated | | | 2.7 | |
| |
Cash/Cash Equivalents | | | 2.4 | |
| | |
Total | | | 100.0 | |
Credit ratings reflect the highest rating assigned by a nationally recognized statistical rating organization (NRSRO) such as Moody’s Investors Service, Inc. (Moody’s), S&P Global Ratings (S&P), or Fitch, Inc. (Fitch). Credit ratings reflect the common nomenclature used by both S&P and Fitch. Where applicable, ratings are converted to the comparable S&P/Fitch rating tier nomenclature. These rating agencies are independent and are widely used. The Not Rated category consists of securities that have not been rated by an NRSRO. Credit ratings are subject to change.
| | | | | | |
|
| Distributions and Yields as of 8/31/22 |
| | | |
| | Total Dividends | | SEC 30-Day | | SEC 30-Day |
| | Paid for | | Subsidized | | Unsubsidized |
| | | |
| | One Year ($) | | Yield* (%) | | Yield** (%) |
| | | |
| | | 2.40 | | 7.22 | | 7.22 |
*SEC 30-Day Subsidized Yield (%)—A standardized yield calculation created by the Securities and Exchange Commission, it reflects the income earned during a 30-day period, after the deduction of the Fund’s net expenses (net of any expense waivers or reimbursements). The investor experience is represented by the SEC 30-Day Subsidized Yield.
**SEC 30-Day Unsubsidized Yield (%)—A standardized yield calculation created by the Securities and Exchange Commission, it reflects the income earned during a 30-day period, after the deduction of the Fund’s gross expenses. The investor experience is represented by the SEC 30-Day Subsidized Yield.
14 Visit our website at pgim.com/investments
Strategy and Performance Overview*
(unaudited)
How did the Fund perform?
The PGIM Active High Yield Bond ETF (the Fund) returned –11.01% based on net asset value (NAV) in the 12-month reporting period that ended August 31, 2022, outperforming the –11.28% return of the Bloomberg US High Yield Very Liquid Index (the Index).
What were the market conditions?
| ● | | After posting gains during the latter part of 2021, US high yield bonds posted significant declines over the first eight months of 2022—including, in the second quarter, their worst quarterly performance since the first quarter of 2020—as rate hike concerns, high and persistent inflation, and recession fears overshadowed the strength of earnings and credit fundamentals. |
| ● | | Retail demand for high yield remained negative throughout much of the period as a combination of slowing global growth and higher-than-expected inflation leading to an increasingly hawkish Federal Reserve (Fed) drove outflows from high yield bond mutual funds. However, subdued primary market activity combined with a high volume of calls, tenders, and coupon payments provided for a relatively solid technical backdrop. |
| ● | | After posting outflows of $14 billion during 2021, high yield bond mutual funds saw nearly $41 billion of outflows during the first eight months of 2022. For the period, spreads on the Bloomberg US Corporate High Yield Bond Index widened 196 basis points (bps) to 484 bps as of August 31, 2022. (One basis point equals 0.01%). By quality, higher-quality (BB-rated and B-rated) credits outperformed their lower-quality (CCC-rated) peers during the period as investors sought out the relative safety of higher-rated credits. |
| ● | | After seeing record gross issuance in 2021, the high yield primary market slowed considerably during the first part of 2022 as issuers sat out the volatility, helping to offset some of the technical headwinds from negative fund flows. After issuing $484 billion in high yield bonds during 2021, companies issued a mere $81 billion through the first eight months of 2022. |
| ● | | The par-weighted US high yield default rate, including distressed exchanges, ended the period at 1.20%, up from 1.13% the year before, and below the long-term historical average of 3.20%, according to J.P. Morgan. |
What worked?
| ● | | Overall security selection and sector allocation both contributed to performance during the period. Within security selection, positions in the upstream energy, telecom, and technology industries contributed the most. Within sector allocation, relative to the Index, overweights to upstream energy and electric utilities—along with an underweight to media & entertainment—contributed. |
| ● | | In individual security selection, positions in Chesapeake Energy Corp. (upstream energy), Veon Ltd. (telecom), and Civitas Resources Inc. (upstream energy) were the largest contributors to performance. |
PGIM Fixed Income ETFs 15
Strategy and Performance Overview* (continued)
| ● | | Having slightly more beta, on average, in the Fund relative to the Index over the period had a negligible impact on returns. (Beta is a measure of the volatility or risk of a security or portfolio compared to the market or index.) |
What didn’t work?
| ● | | While overall security selection contributed to returns over the period, selection in media & entertainment, cable & satellite, and automotive detracted. |
| ● | | While overall sector allocation was positive, relative to the Index, underweights to the healthcare & pharmaceuticals and downstream energy industries—along with an overweight to building materials & home construction—detracted. |
| ● | | In individual security selection, overweights to Bausch Health Americas Inc. (healthcare & pharmaceuticals), Diamond Sports Group LLC (media & entertainment), and Intelsat SA (cable & satellite) relative to the Index, detracted from results. |
Did the Fund use derivatives?
The Fund used credit index derivatives and interest rate futures to manage its overall risk profile during the reporting period—the aggregate impact of which was negative.
Current outlook
| ● | | While strong credit fundamentals continue to sustain low US high yield default rates, PGIM Fixed Income has grown more cautious in light of increased geopolitical, inflation, and recession risks. In PGIM Fixed Income’s view, most US high yield issuers should be able to withstand the impacts of higher rates, slower growth, and inflation, aided in large part by a lack of near-term maturities. However, PGIM Fixed Income now anticipates higher default rates of 3% and 7% over the next two years, should the economy follow its base-case scenario of a shallow recession— induced by aggressive rate hikes and persistent inflation—occurring in that time. |
| ● | | Although PGIM Fixed Income remains defensive and is prepared for further spread widening, it does not expect defaults to be as severe as in previous downturns due to the favorable position most issuers find themselves in today, with strong debt serviceability, favorable maturity profiles, and strong cash flows. Notably, if inflation subsides sooner than expected, and/or the Fed engineers a soft landing, there is meaningful upside potential in the market given current wider-than-average spreads and significant price discounts. As such, PGIM Fixed Income believes the market is reasonably close to fair value, with only modest spread widening needed to balance the risks and rewards. |
| ● | | In terms of positioning, PGIM Fixed Income is reducing its allocation to lower-quality issuers in favor of higher-quality BB-rated bonds and maintaining an overweight to independent power producers and housing. |
*This strategy and performance overview, which discusses what strategies or holdings (including derivatives, if applicable) affected the Fund’s performance, is compiled based on how the Fund performed relative to the Fund’s benchmark index and is viewed for
16 Visit our website at pgim.com/investments
performance attribution purposes at the aggregate Fund level, which in most instances will not directly correlate to the amounts disclosed in the Statement of Operations which conform to U.S. generally accepted accounting principles.
PGIM Fixed Income ETFs 17
PGIM Active Aggregate Bond ETF
Your Fund’s Performance (unaudited)
Performance data quoted represent past performance. Past performance does not guarantee future results. The investment return and principal value of an investment will fluctuate so that an investor’s shares, when sold or redeemed, may be worth more or less than their original cost. Current performance may be lower or higher than the past performance data quoted. An investor may obtain performance data as of the most recent month-end by visiting our website at pgim.com/investments or by calling (800) 225-1852.
| | | | |
| |
| | | Average Annual Total Returns as of 8/31/22 |
| | |
| | | One Year (%) | | Since Inception (%) |
| | |
Net Asset Value (NAV) | | -12.62 | | -7.57 (04/12/2021) |
| | |
Market Price* | | -12.64 | | -7.55 (04/12/2021) |
*The market price is determined using the midpoint between the highest bid and the lowest offer on the listing exchange, as of the time that the Fund’s NAV is calculated. The first day of secondary market trading is typically several days after the date on which the Fund commenced investment operations; therefore, the NAV of the Fund is used as a proxy for the period from inception of investment operations to the first day of secondary market trading to calculate the market price returns.
The returns in the table do not reflect the deduction of taxes that a shareholder would pay on Fund distributions or following the redemption or sale of Fund shares.
Market returns do not include brokerage commissions that may be payable on secondary market transactions. If brokerage commissions were included, market returns would be lower. Market and NAV returns assume that dividends and capital gain distributions, if any, have been reinvested in the Fund at market price and NAV, respectively.
18 Visit our website at pgim.com/investments
Growth of a $10,000 Investment (unaudited)
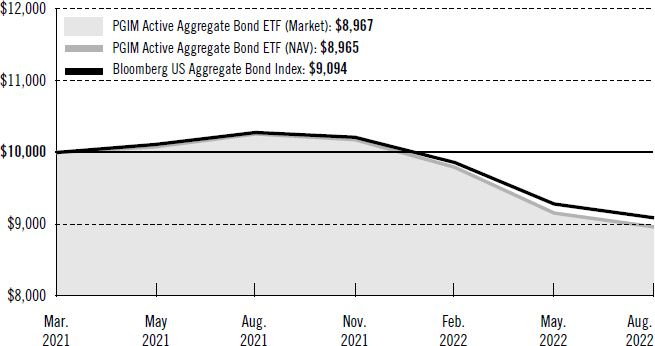
The graph compares a $10,000 investment in the Fund with a similar investment in the Bloomberg US Aggregate Bond Index by portraying the initial account values at the commencement of operations (April 12, 2021) and the account values at the end of the current fiscal year (August 31, 2022), as measured on a quarterly basis. The Fund assumes an initial investment on April 15, 2021, while the benchmark and the Index assume that the initial investment occurred on March 31, 2021. For purposes of the graph, and unless otherwise indicated, it has been assumed that (a) all recurring fees (including management fees) were deducted and (b) all dividends and distributions were reinvested. Without waiver of fees and/or expense reimbursements, if any, the returns would have been lower.
Past performance does not predict future performance. Total returns and the ending account values in the graphs include changes in share price and reinvestment of dividends and capital gains distributions in a hypothetical investment for the periods shown. The Fund’s total returns do not reflect the deduction of income taxes on an individual’s investment. Taxes may reduce your actual investment returns on income or gains paid by the Fund or any gains you may realize if you sell your shares.
PGIM Fixed Income ETFs 19
PGIM Active Aggregate Bond ETF
Your Fund’s Performance (continued)
Benchmark Definition
Bloomberg US Aggregate Bond Index—The Bloomberg US Aggregate Bond Index is unmanaged and represents securities that are taxable and US dollar denominated. It covers the US investment-grade fixed rate bond market, with index components for government and corporate securities, mortgage pass-through securities, and asset-backed securities.
Investors cannot invest directly in an index. The returns for the Index would be lower if they included the effects of operating expenses or taxes that may be paid by an investor.
| | | | |
| |
Credit Quality expressed as a percentage of total investments as of 8/31/22 (%) | | | | |
| |
AAA | | | 68.6 | |
| |
AA | | | 5.7 | |
| |
A | | | 8.5 | |
| |
BBB | | | 16.7 | |
| |
Cash/Cash Equivalents | | | 0.5 | |
| | |
Total | | | 100.0 | |
Credit ratings reflect the highest rating assigned by a nationally recognized statistical rating organization (NRSRO) such as Moody’s Investors Service, Inc. (Moody’s), S&P Global Ratings (S&P), or Fitch, Inc. (Fitch). Credit ratings reflect the common nomenclature used by both S&P and Fitch. Where applicable, ratings are converted to the comparable S&P/Fitch rating tier nomenclature. These rating agencies are independent and are widely used. The Not Rated category consists of securities that have not been rated by an NRSRO. Credit ratings are subject to change.
| | | | | | | | | | | | |
|
| Distributions and Yields as of 8/31/22 | |
| | | |
| | | | | | | SEC 30-Day | | | | SEC 30-Day | |
| | | Total Dividends Paid | | | | Subsidized | | | | Unsubsidized | |
| | | |
| | | for One Year ($) | | | | Yield* (%) | | | | Yield** (%) | |
| | | |
| | | 1.56 | | | | 3.51 | | | | 3.51 | |
*SEC 30-Day Subsidized Yield (%)—A standardized yield calculation created by the Securities and Exchange Commission, it reflects the income earned during a 30-day period, after the deduction of the Fund’s net expenses (net of any expense waivers or reimbursements). The investor experience is represented by the SEC 30-Day Subsidized Yield.
**SEC 30-Day Unsubsidized Yield (%)—A standardized yield calculation created by the Securities and Exchange Commission, it reflects the income earned during a 30-day period, after the deduction of the Fund’s gross expenses. The investor experience is represented by the SEC 30-Day Subsidized Yield.
20 Visit our website at pgim.com/investments
Strategy and Performance Overview*
(unaudited)
How did the Fund perform?
The PGIM Active Aggregate Bond ETF (the Fund) returned –12.62% based on net asset value in the 12-month reporting period that ended August 31, 2022, underperforming the –11.52% return of the Bloomberg US Aggregate Bond Index (the Index).
What were the market conditions?
| ● | | From a starting point of low yields, tight spreads, and high equity multiples, the shift in fundamentals—most notably, high inflation—drove a wholesale repricing of markets during the period. Concerns about central bank tightening, hard economic landings (i.e., a significant slowdown after a period of rapid growth), and the war in Ukraine led global credit spreads notably wider, while rate volatility increased as markets first began pricing in more aggressive Federal Open Market Committee policy tightening and then later began to price in a hard economic landing. |
| ● | | Against the backdrop of historic lows in unemployment and generational highs in inflation, central banks signaled an increased willingness to accept more economic and market volatility than they had been over the prior decade of low inflation. A succession of hikes during the second quarter of 2022— including outsized hikes of 75 basis points (bps) by the Federal Reserve in both June and July—confirmed to markets that the Fed is fully focused on tackling inflation. (One basis point equals 0.01%.) |
| ● | | At the August 2022 Jackson Hole symposium, Fed Chairman Jerome Powell’s speech was successful in lifting investors’ expectations for rate hikes in 2022 and removing the prospects for rate cuts in 2023. While long-run inflation expectations remained relatively subdued through the end of the period, Powell expressed the need to exercise vigilance about the trajectory of expectations to avoid a self-fulfilling inflation spiral. Underpinning this escalation in rhetoric was the reality that Fed officials don’t know how high they will ultimately take the federal funds rate in order to tame inflation. |
| ● | | As a result, significant volatility continued to be priced into US Treasuries, with sharply higher front-end rates and lower long-dated yields forming a substantially flatter US Treasury yield curve before the curve finally inverted during the last two months of the period. From 1.10% on August 31, 2021, the 10-year/2-year Treasury spread declined to –0.28% by the end of the period. |
| ● | | After rising to nearly 3.5% in June 2022, US 10-year Treasury yields ended the period at 3.20%. Meanwhile, the yield on the 2-year Treasury note ended the period at 3.48%, a rise of 327 bps over the period. |
| ● | | US investment-grade corporate spreads widened significantly as corporates were challenged by elevated inflationary pressures, a slower growth outlook, and increased event and geopolitical risk. US high yield bonds posted significant declines through much of 2022 as rate hike concerns, high and persistent inflation, and recession fears overshadowed the strength of earnings and credit fundamentals. Securitized credit spreads widened, with collateralized loan obligation (CLO) and commercial |
PGIM Fixed Income ETFs 21
Strategy and Performance Overview* (continued)
| | mortgage-backed securities (CMBS) spreads trading well above their recent tights by the end of the period. The emerging-markets sector posted negative total returns, and spreads widened as markets were pressured by tightening financial conditions and slowing growth in China and Europe. Meanwhile, agency mortgage-backed securities (MBS) underperformed Treasuries on concerns that the Fed may begin selling MBS if officials need to step up their inflation fight. |
What worked?
| ● | | Security selections in CMBS, municipal bonds, emerging markets, and CLOs contributed to performance. |
| ● | | In terms of sector allocation, underweights, relative to the Index, to MBS and agencies contributed. |
| ● | | Within credit, positioning in upstream energy, telecom, and gaming/lodging/leisure contributed to results. |
| ● | | In individual security selection, the Fund benefited, relative to the Index, from an underweight to Oracle Corp. (technology), along with overweights to Cenovus Energy Inc. (upstream energy) and the Republic of Indonesia. |
| ● | | The Fund’s yield curve positioning was modestly positive over the period. |
What didn’t work?
| ● | | Overall security selection detracted, with selections in Treasuries, investment-grade corporates, and MBS detracting the most. |
| ● | | Overall sector allocation detracted, with overweights, relative to the Index, to CMBS, CLOs, and investment-grade corporates detracting the most. |
| ● | | Within credit, positioning in banking, healthcare & pharmaceuticals, and media & entertainment detracted during the period. |
| ● | | In individual security selection, the Fund’s overweight positioning, relative to the Index, in Viatris Inc. (healthcare & pharmaceuticals), Bank of America Corp. (banking), and Charter Communications Inc. (cable & satellite) detracted from performance. |
| ● | | The Fund’s duration positioning detracted from performance during the period. |
Did the Fund use derivatives?
The Fund uses derivatives when they facilitate implementation of the overall investment approach. During the period, the Fund used interest rate futures to help manage duration positioning and yield curve exposure. In aggregate, these positions detracted from performance.
Current outlook
| ● | | Tighter financial conditions are expected to continue working their way through the economy with lagged effects in coming quarters. For now, the Fed is focused on currently high monthly inflation readings, vowing to keep up the pressure until readings show convincing signs of softening toward the Fed’s target. At some point, |
22 Visit our website at pgim.com/investments
| | though, PGIM Fixed Income expects the Fed will likely pivot back toward a focus on the projected lagged effects of its tightening and—should material signs of softening accumulate—adopt a more measured pace of policy normalization. |
| ● | | Even though fundamentals and issuer liquidity are arguably well braced for recession and spread widening has already generated value in a number of sectors, PGIM Fixed Income believes spreads may remain soft until most of the current bad news (e.g., the cutoff of Russian gas supplies, cooling of the housing market) has largely played out. However, over the intermediate and longer term, the sell-off in rates and spreads could turn out to be a positive as the overarching trends of aging demographics, high debt burdens, and other factors that conspired for decades to push equilibrium interest rates down are more likely hibernating than reversing. It is anticipated that once the reopening enthusiasm and supply-chain problems have passed, inflation will likely be back at, or below, targets, and bonds are expected to post solid returns for an extended period. In the meantime, PGIM Fixed Income believes the best course will be to focus on the micro-alpha opportunities within and across sectors. |
| ● | | PGIM Fixed Income maintains its positive view of the spread sectors over the medium to long term. Relative to the Index, the Fund is overweight structured products (CLOs, CMBS), with a more modest overweight to investment-grade corporates. The Fund is underweight MBS in favor of more attractive opportunities across spread sectors. |
| ● | | In terms of calling the cycle top in long-term rates, given the economic strength and level of inflation, PGIM Fixed income believes it’s too early to preclude the possibility of higher interest rates. Yet, from a long-term perspective, exposure to developed-market duration is becoming more compelling after the broad repricing and with the looming moderation in global growth. While acknowledging the immediate trajectory of inflation is going to dictate market volatility and the path of the US Treasury 10-year yield, PGIM Fixed Income’s base case is that implied volatility will ultimately decline, and the 10-year yield will stay below the federal funds terminal rate when it is eventually reached. |
*This strategy and performance overview, which discusses what strategies or holdings (including derivatives, if applicable) affected the Fund’s performance, is compiled based on how the Fund performed relative to the Fund’s benchmark index and is viewed for performance attribution purposes at the aggregate Fund level, which in most instances will not directly correlate to the amounts disclosed in the Statement of Operations which conform to U.S. generally accepted accounting principles.
PGIM Fixed Income ETFs 23
PGIM Total Return Bond ETF
Your Fund’s Performance (unaudited)
Performance data quoted represent past performance. Past performance does not guarantee future results. The investment return and principal value of an investment will fluctuate so that an investor’s shares, when sold or redeemed, may be worth more or less than their original cost. Current performance may be lower or higher than the past performance data quoted. An investor may obtain performance data as of the most recent month-end by visiting our website at pgim.com/investments or by calling (800) 225-1852.
| | |
| |
| | | Total Returns as of 8/31/22 |
| |
| | | Since Inception (%) |
| |
Net Asset Value (NAV) | | -12.81 (12/02/2021) |
| |
Market Price* | | -12.69 (12/02/2021) |
*The market price is determined using the midpoint between the highest bid and the lowest offer on the listing exchange, as of the time that the Fund’s NAV is calculated. The first day of secondary market trading is typically several days after the date on which the Fund commenced investment operations; therefore, the NAV of the Fund is used as a proxy for the period from inception of investment operations to the first day of secondary market trading to calculate the market price returns.
The returns in the table do not reflect the deduction of taxes that a shareholder would pay on Fund distributions or following the redemption or sale of Fund shares.
Market returns do not include brokerage commissions that may be payable on secondary market transactions. If brokerage commissions were included, market returns would be lower. Market and NAV returns assume that dividends and capital gain distributions, if any, have been reinvested in the Fund at market price and NAV, respectively.
24 Visit our website at pgim.com/investments
Growth of a $10,000 Investment (unaudited)
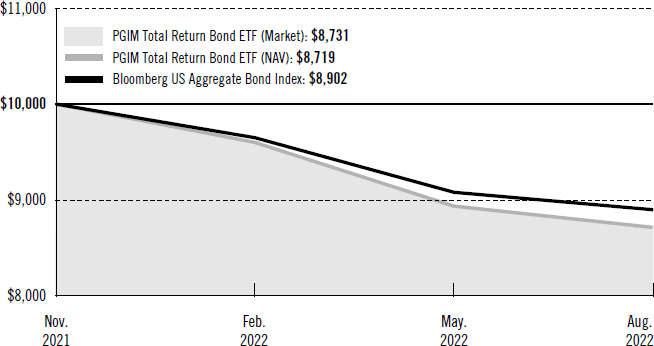
The graph compares a $10,000 investment in the Bloomberg US Aggregate Bond Index by portraying the initial account values at the commencement of operations (December 2, 2021) and the account values at the end of the current fiscal year (August 31, 2022), as measured on a quarterly basis. The Fund assumes an initial investment on December 8, 2021, while the benchmark and the Index assume that the initial investment occurred on November 30, 2021. For purposes of the graph, and unless otherwise indicated, it has been assumed that (a) all recurring fees (including management fees) were deducted and (b) all dividends and distributions were reinvested. Without waiver of fees and/or expense reimbursements, if any, the returns would have been lower.
Past performance does not predict future performance. Total returns and the ending account values in the graphs include changes in share price and reinvestment of dividends and capital gains distributions in a hypothetical investment for the periods shown. The Fund’s total returns do not reflect the deduction of income taxes on an individual’s investment. Taxes may reduce your actual investment returns on income or gains paid by the Fund or any gains you may realize if you sell your shares.
PGIM Fixed Income ETFs 25
PGIM Total Return Bond ETF
Your Fund’s Performance (continued)
Benchmark Definition
Bloomberg US Aggregate Bond Index—The Bloomberg US Aggregate Bond Index is unmanaged and represents securities that are taxable and US dollar denominated. It covers the US investment-grade fixed rate bond market, with index components for government and corporate securities, mortgage pass-through securities, and asset-backed securities.
Investors cannot invest directly in an index. The returns for the Index would be lower if they included the effects of operating expenses or taxes that may be paid by an investor.
26 Visit our website at pgim.com/investments
| | | | |
| |
Credit Quality expressed as a percentage of total investments as of 8/31/22 (%) | | | | |
| |
AAA | | | 55.2 | |
| |
AA | | | 7.3 | |
| |
A | | | 7.8 | |
| |
BBB | | | 18.6 | |
| |
BB | | | 8.1 | |
| |
B | | | 2.3 | |
| |
CCC | | | 0.4 | |
| |
Not Rated | | | 0.1 | |
| |
Cash/Cash Equivalents | | | 0.2 | |
| | |
Total | | | 100.0 | |
Credit ratings reflect the highest rating assigned by a nationally recognized statistical rating organization (NRSRO) such as Moody’s Investors Service, Inc. (Moody’s), S&P Global Ratings (S&P), or Fitch, Inc. (Fitch). Credit ratings reflect the common nomenclature used by both S&P and Fitch. Where applicable, ratings are converted to the comparable S&P/Fitch rating tier nomenclature. These rating agencies are independent and are widely used. The Not Rated category consists of securities that have not been rated by an NRSRO. Credit ratings are subject to change.
| | | | | | | | | | | | |
|
| Distributions and Yields as of 8/31/22 | |
| | | |
| | | | | | | SEC 30-Day | | | | SEC 30-Day | |
| | | Total Dividends Paid | | | | Subsidized | | | | Unsubsidized | |
| | | |
| | | for One Year ($) | | | | Yield* (%) | | | | Yield** (%) | |
| | | |
| | | 0.69 | | | | 3.83 | | | | 3.83 | |
*SEC 30-Day Subsidized Yield (%)—A standardized yield calculation created by the Securities and Exchange Commission, it reflects the income earned during a 30-day period, after the deduction of the Fund’s net expenses (net of any expense waivers or reimbursements). The investor experience is represented by the SEC 30-Day Subsidized Yield.
**SEC 30-Day Unsubsidized Yield (%)—A standardized yield calculation created by the Securities and Exchange Commission, it reflects the income earned during a 30-day period, after the deduction of the Fund’s gross expenses. The investor experience is represented by the SEC 30-Day Subsidized Yield.
PGIM Fixed Income ETFs 27
Strategy and Performance Overview*
(unaudited)
How did the Fund perform?
The PGIM Total Return Bond ETF (the Fund) returned –12.81% based on net asset value in the nine-month reporting period from the Fund’s inception on December 2, 2021, through August 31, 2022, underperforming the –10.98% return of the Bloomberg US Aggregate Bond Index (the Index) during that same time.
What were the market conditions?
| ● | | From a starting point of low yields, tight spreads, and high equity multiples, the shift in fundamentals—most notably, high inflation—drove a wholesale repricing of markets during the period. Concerns about central bank tightening, hard economic landings (i.e., a significant slowdown after a period of rapid growth), and the war in Ukraine led global credit spreads notably wider, while rate volatility increased as markets first began pricing in more aggressive Federal Open Market Committee policy tightening and then later began to price in a hard economic landing. |
| ● | | Against the backdrop of historic lows in unemployment and generational highs in inflation, central banks signaled an increased willingness to accept more economic and market volatility than they had been over the prior decade of low inflation. A succession of hikes during the second quarter of 2022—including outsized hikes of 75 basis points (bps) by the Federal Reserve in both June and July—confirmed to markets that the Fed is fully focused on tackling inflation. (One basis point equals 0.01%.) |
| ● | | At the August 2022 Jackson Hole symposium, Fed Chairman Jerome Powell’s speech was successful in lifting investors’ expectations for rate hikes in 2022 and removing the prospects for rate cuts in 2023. While long-run inflation expectations remained relatively subdued through the end of the period, Powell expressed the need to exercise vigilance about the trajectory of expectations to avoid a self-fulfilling inflation spiral. Underpinning this escalation in rhetoric was the reality that Fed officials don’t know how high they will ultimately take the federal funds rate in order to tame inflation. |
| ● | | As a result, significant volatility continued to be priced into US Treasuries, with sharply higher front-end rates and lower long-dated yields forming a substantially flatter US Treasury yield curve before the curve finally inverted during the last two months of the period. From 0.81% on December 2, 2021, the 10-year/2-year Treasury spread declined to –0.28% by the end of the period. |
| ● | | After rising to nearly 3.5% in June 2022, US 10-year Treasury yields ended the period at 3.20%. Meanwhile, the yield on the 2-year Treasury note ended the period at 3.48%, a rise of 286 bps since the Fund’s inception. |
| ● | | US investment-grade corporate spreads widened significantly as corporates were challenged by elevated inflationary pressures, a slower growth outlook, and increased event and geopolitical risk. US high yield bonds posted significant declines through much of 2022 as rate hike concerns, high and persistent inflation, and recession fears overshadowed the strength of earnings and credit fundamentals. Securitized |
28 Visit our website at pgim.com/investments
| | credit spreads widened, with collateralized loan obligation (CLO) and commercial mortgage-backed securities (CMBS) spreads trading well above their recent tights by the end of the period. The emerging-markets sector posted negative total returns, and spreads widened as markets were pressured by tightening financial conditions and slowing growth in China and Europe. Meanwhile, agency mortgage-backed securities (MBS) underperformed Treasuries on concerns that the Fed may begin selling MBS if officials need to step up their inflation fight. |
What worked?
| ● | | Security selections in CLOs, municipal bonds, and MBS contributed to returns. |
| ● | | In terms of sector allocation, underweights, relative to the Index, to MBS and municipal bonds contributed. |
| ● | | Within credit, positioning in upstream energy, telecom, and gaming/lodging/leisure contributed to results. |
| ● | | In individual security selection, the Fund benefited from overweights, relative to the Index, to Bellis Holdco Ltd. (consumer non-cyclical), Sasol Ltd. (chemicals), and Merck & Co. Inc. (healthcare & pharmaceuticals). |
| ● | | The Fund’s yield curve positioning, particularly in US rates, contributed to returns. |
What didn’t work?
| ● | | Overall security selection detracted, with selections in investment-grade corporates, emerging markets, and CMBS detracting the most. |
| ● | | Within sector allocation, overweights, relative to the Index, to high yield, CLOs, and CMBS detracted from performance. |
| ● | | Within credit, positioning in foreign non-corporates, banking, and healthcare & pharmaceuticals detracted from performance during the period. |
| ● | | In individual security selection, the Fund’s overweight positioning in the Republic of Ukraine, Bank of America Corp. (banking), and Viatris Inc. (healthcare & pharmaceuticals) detracted from performance. |
| ● | | The Fund’s duration positioning detracted from returns during the period. (Duration measures the sensitivity of the price—the value of principal—of a bond to a change in interest rates.) |
Did the Fund use derivatives?
The Fund uses derivatives when they facilitate implementation of the overall investment approach. During the period, the Fund used interest rate futures and swaps to help manage duration positioning and yield curve exposure. In aggregate, these positions detracted from performance.
Current outlook
| ● | | Tighter financial conditions are expected to continue working their way through the economy with lagged effects in coming quarters. For now, the Fed is focused on |
PGIM Fixed Income ETFs 29
Strategy and Performance Overview* (continued)
| | currently high monthly inflation readings, vowing to keep up the pressure until readings show convincing signs of softening toward the Fed’s target. At some point, though, PGIM Fixed Income expects the Fed will likely pivot back toward a focus on the projected lagged effects of its tightening and—should material signs of softening accumulate—adopt a more measured pace of policy normalization. |
| ● | | Even though fundamentals and issuer liquidity are arguably well braced for recession, and spread widening has already generated value in a number of sectors, PGIM Fixed Income believes spreads may remain soft until most of the current bad news (e.g., the cutoff of Russian gas supplies, cooling of the housing market) has largely played out. However, over the intermediate and longer term, the sell-off in rates and spreads could turn out to be a positive as the overarching trends of aging demographics, high debt burdens, and other factors that conspired for decades to push equilibrium interest rates down are more likely hibernating than reversing. It is anticipated that once the reopening enthusiasm and supply-chain problems have passed, inflation will likely be back at, or below, targets, and bonds are expected to post solid returns for an extended period. In the meantime, PGIM Fixed Income believes the best course will be to focus on identifying alpha opportunities within and across sectors. |
| ● | | PGIM Fixed Income maintains its positive view of the spread sectors over the medium to long term. Relative to the Index, the Fund is overweight to structured products (CLOs, CMBS), with more modest overweights to investment-grade corporates, high yield, and emerging markets. The Fund is underweight to MBS in favor of more attractive opportunities across spread sectors. |
| ● | | In terms of calling the cycle top in long-term rates, given the economic strength and level of inflation, PGIM Fixed income believes it’s too early to preclude the possibility of higher interest rates. Yet, from a long-term perspective, exposure to developed-market duration is becoming more compelling after the broad repricing and with the looming moderation in global growth. While acknowledging the immediate trajectory of inflation is going to dictate market volatility and the path of the US Treasury 10-year yield, PGIM Fixed Income’s base case is that implied volatility will ultimately decline, and the 10-year yield will stay below the federal funds terminal rate when it is eventually reached. |
*This strategy and performance overview, which discusses what strategies or holdings (including derivatives, if applicable) affected the Fund’s performance, is compiled based on how the Fund performed relative to the Fund’s benchmark index and is viewed for performance attribution purposes at the aggregate Fund level, which in most instances will not directly correlate to the amounts disclosed in the Statement of Operations which conform to U.S. generally accepted accounting principles.
30 Visit our website at pgim.com/investments
PGIM Floating Rate Income ETF
Your Fund’s Performance (unaudited)
Performance data quoted represent past performance. Past performance does not guarantee future results. The investment return and principal value of an investment will fluctuate so that an investor’s shares, when sold or redeemed, may be worth more or less than their original cost. Current performance may be lower or higher than the past performance data quoted. An investor may obtain performance data as of the most recent month-end by visiting our website at pgim.com/investments or by calling (800) 225-1852.
| | |
| | | Total Returns as of 8/31/22 Since Inception (%) |
| |
Net Asset Value (NAV) | | 0.89 (05/17/2022) |
| |
Market Price* | | 0.87 (05/17/2022) |
| |
Credit Suisse Leveraged Loan Index | | |
| | | 1.30 |
*The market price is determined using the midpoint between the highest bid and the lowest offer on the listing exchange, as of the time that the Fund’s NAV is calculated. The first day of secondary market trading is typically several days after the date on which the Fund commenced investment operations; therefore, the NAV of the Fund is used as a proxy for the period from inception of investment operations to the first day of secondary market trading to calculate the market price returns.
The returns in the table do not reflect the deduction of taxes that a shareholder would pay on Fund distributions or following the redemption or sale of Fund shares.
Market returns do not include brokerage commissions that may be payable on secondary market transactions. If brokerage commissions were included, market returns would be lower. Market and NAV returns assume that dividends and capital gain distributions, if any, have been reinvested in the Fund at market price and NAV, respectively.
PGIM Fixed Income ETFs 31
PGIM Floating Rate Income ETF
Your Fund’s Performance (continued)
Growth of a $10,000 Investment (unaudited)
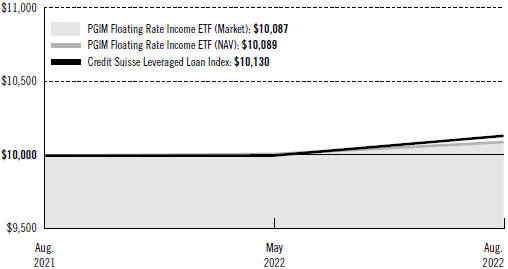
The graph compares a $10,000 investment in the Credit Suisse Leveraged Loan Index by portraying the initial account values at the commencement of operations (May 17, 2022) and the account values at the end of the current fiscal year (August 31, 2022), as measured on a quarterly basis. The Fund assumes an initial investment on May 17, 2022, while the benchmark and the Index assume that the initial investment occurred on May 31, 2022. For purposes of the graph, and unless otherwise indicated, it has been assumed that (a) all recurring fees (including management fees) were deducted and (b) all dividends and distributions were reinvested. Without waiver of fees and/or expense reimbursements, if any, the returns would have been lower.
Past performance does not predict future performance. Total returns and the ending account values in the graphs include changes in share price and reinvestment of dividends and capital gains distributions in a hypothetical investment for the periods shown. The Fund’s total returns do not reflect the deduction of income taxes on an individual’s investment. Taxes may reduce your actual investment returns on income or gains paid by the Fund or any gains you may realize if you sell your shares.
32 Visit our website at pgim.com/investments
Benchmark Definition
Credit Suisse Leveraged Loan Index—The Credit Suisse Leveraged Loan Index is an unmanaged index that represents the investable universe of the US dollar-denominated leveraged loan market.
Investors cannot invest directly in an index. The returns for the Index would be lower if they included the effects of operating expenses or taxes that may be paid by an investor.
| | | | |
| |
Credit Quality expressed as a percentage of total investments as of 8/31/22 (%) | | | |
| |
AAA | | | 1.7 | |
| |
AA | | | 0.7 | |
| |
BBB | | | 8.6 | |
| |
BB | | | 28.2 | |
| |
B | | | 57.2 | |
| |
CCC | | | 1.3 | |
| |
Cash/Cash Equivalents | | | 2.3 | |
| | |
Total | | | 100.0 | |
Credit ratings reflect the highest rating assigned by a nationally recognized statistical rating organization (NRSRO) such as Moody’s Investors Service, Inc. (Moody’s), S&P Global Ratings (S&P), or Fitch, Inc. (Fitch). Credit ratings reflect the common nomenclature used by both S&P and Fitch. Where applicable, ratings are converted to the comparable S&P/Fitch rating tier nomenclature. These rating agencies are independent and are widely used. The Not Rated category consists of securities that have not been rated by an NRSRO. Credit ratings are subject to change.
| | | | | | | | | | | | |
| | | |
Distributions and Yields as of 8/31/22 | | | | | | | | | |
| | | |
| | | Total Dividends Paid for One Year ($) | | | SEC 30-Day Subsidized Yield* (%) | | | SEC 30-Day
Unsubsidized
Yield** (%) | |
| | | |
| | | 0.33 | | | | 5.66 | | | | 5.66 | |
*SEC 30-Day Subsidized Yield (%)—A standardized yield calculation created by the Securities and Exchange Commission, it reflects the income earned during a 30-day period, after the deduction of the Fund’s net expenses (net of any expense waivers or reimbursements). The investor experience is represented by the SEC 30-Day Subsidized Yield.
**SEC 30-Day Unsubsidized Yield (%)—A standardized yield calculation created by the Securities and Exchange Commission, it reflects the income earned during a 30-day period, after the deduction of the Fund’s gross expenses. The investor experience is represented by the SEC 30-Day Subsidized Yield.
PGIM Fixed Income ETFs 33
Strategy and Performance Overview*
(unaudited)
How did the Fund perform?
The PGIM Floating Rate Income ETF (the Fund) returned 0.89% based on net asset value in the three-month reporting period from the Fund’s inception on May 17, 2022 through August 31, 2022, underperforming the 1.30% return of the Credit Suisse Leveraged Loan Index (the Index) during that same time.
What were the market conditions?
| ● | | US leveraged loan performance was mixed during the period, declining in the second quarter of 2022, as economic growth concerns and broad market volatility weighed on risk sentiment before rebounding in July and August amid lighter new supply and more hawkish rhetoric from the Federal Reserve. |
| ● | | Shifting monetary policy expectations, combined with a broader risk-off tone, resulted in sizeable outflows from bank loan mutual funds over the period. Following 17 straight months of inflows totaling $71.8 billon, loan funds saw a fourth consecutive month of outflows in August. Though significant, August’s $1.4 billion outflow was a sharp deceleration from the combined $14.8 billion in outflows seen over the prior three months. Meanwhile, collateralized loan obligation (CLO) formation continued to slow from 2021’s record-setting pace, with new US CLO volume declining to a year-to-date low in August. |
| ● | | Loan issuance slowed throughout 2022 amid heightened volatility, with gross issuance through the first eight months of 2022 totaling $197 billion, down 67% from the same period in the prior year. |
| ● | | Heightened geopolitical-related volatility drove a decline in prices in June and July before recouping most of the declines in August. Beginning the period at approximately $95, the average price of all loans in the Index ended the period at $94.19. Meanwhile, average spreads ended the period at approximately 564 basis points (bps), relatively flat from where they stood at the Fund’s inception. (One basis point equals 0.01%.) By quality, BB-rated loans outperformed in May, June, and July before underperforming B-rated loans in August. |
| ● | | Despite broad market volatility, solid credit fundamentals and a lack of near-term maturities continued to keep default rates below the long-term average of 3.1%. The par-weighted loan default rate, including distressed exchanges, ended August 2022 at 1.36%, up 29 bps from August 2021. |
What worked?
| ● | | Overall security selection was the largest contributor to performance during the period, with selections in banking, capital goods, and transportation & environmental services contributing the most. |
| ● | | Relative to the Index, having less beta, on average, during the period was also a strong contributor to performance. (Beta is a measure of the volatility or risk of a security or portfolio compared to the market or index.) |
34 Visit our website at pgim.com/investments
| ● | | While overall sector allocation detracted, underweights, relative to the Index, to healthcare & pharmaceuticals, technology, and consumer non-cyclicals contributed to performance. |
| ● | | From a single-name credit perspective, positioning in Avaya Inc. (technology), Adtalem Global Education Inc. (other industrial), and Envision Healthcare Corp. (paper & packaging) added value. |
What didn’t work?
| ● | | Overall sector allocation detracted from performance during the period, with, relative to the Index, an overweight to the banking industry—along with underweights to chemicals and upstream energy—the largest detractors. |
| ● | | While overall security selection contributed, selections in media & entertainment, telecom, and cable & satellite detracted. |
| ● | | Diamond Sports Group LLC (media & entertainment), Allen Media Group LLC (media & entertainment), and ConvergeOne Holdings Corp. (technology) were the largest single-name detractors from performance. |
Did the Fund use derivatives?
The Fund held interest rate futures and swaps to help manage its duration and yield curve exposure and to reduce its sensitivity to changes in the levels of interest rates. Overall, this strategy had a positive impact on performance during the period. (Duration measures the sensitivity of the price—the value of principal—of a bond to a change in interest rates.) The Fund also participated in credit default swaps to increase or reduce credit risk to specific issuers. This strategy also had a positive impact on performance.
Current outlook
| ● | | Looking forward, PGIM Fixed Income expects loan performance to be largely driven by technicals over the next three to six months. While CLO formation has started to pick up again after evaporating in the last part of the second quarter of 2022, it is highly dependent on AAA-tranche buyers, which have yet to meaningfully return to the market. Meanwhile, PGIM Fixed Income expects flows into loan mutual funds to remain dependent on broader risk sentiment, as well as shifting monetary policy expectations. |
| ● | | While the short-term outlook is tempered by expected price volatility, PGIM Fixed Income’s long-term outlook is more constructive given the anticipated rise in base rates, which could make all-in loan coupons and yields increasingly attractive as 2022 progresses. Ultimately, actively managed credit selection is expected to be a differentiating factor between managers in volatile markets. |
*This strategy and performance overview, which discusses what strategies or holdings (including derivatives, if applicable) affected the Fund’s performance, is compiled based on how the Fund performed relative to the Fund’s benchmark index and is viewed for performance attribution purposes at the aggregate Fund level, which in most instances
PGIM Fixed Income ETFs 35
Strategy and Performance Overview* (continued)
will not directly correlate to the amounts disclosed in the Statement of Operations which conform to U.S. generally accepted accounting principles.
36 Visit our website at pgim.com/investments
Fees and Expenses (unaudited)
As a shareholder of the Fund, you incur ongoing costs, including investment management fees. This example is intended to help you understand your ongoing costs (in dollars) of investing in the Fund and to compare these costs with the ongoing costs of investing in other funds.
The example is based on an investment of $1,000 held through the six-month period ended August 31, 2022. The example is for illustrative purposes only.
Actual Expenses
The first line in the tables on the following page provides information about actual account values and actual expenses. You may use the information on this line, together with the amount you invested, to estimate the expenses that you paid over the period. Simply divide your account value by $1,000 (for example, an $8,600 account value ÷ $1,000 = 8.6), then multiply the result by the number on the first line under the heading “Expenses Paid During the Six-Month Period” to estimate the expenses you paid on your account during this period.
Hypothetical Example for Comparison Purposes
The second line in the tables on the following page provides information about hypothetical account values and hypothetical expenses based on the Fund’s actual expense ratio and an assumed rate of return of 5% per year before expenses, which is not the Fund’s actual return. The hypothetical account values and expenses may not be used to estimate the actual ending account balance or expenses you paid for the period. You may use this information to compare the ongoing costs of investing in the Fund and other funds. To do so, compare this 5% hypothetical example with the 5% hypothetical examples that appear in the shareholder reports of the other funds.
Please note that the expenses shown in the tables are meant to highlight your ongoing costs only and do not reflect any transactional costs, brokerage commissions paid on purchases and sales of Fund shares. Therefore, the ending account values and expenses paid for the period are useful in comparing ongoing costs only and will not help you determine the relative total costs of owning different funds. In addition, if these transactional costs were included, your costs would have been higher.
PGIM Fixed Income ETFs 37
Fees and Expenses (continued)
| | | | | | | | |
| | | | | |
PGIM Ultra Short Bond
ETF | | Beginning
Account Value
March 1, 2022 | | Ending
Account Value
August 31, 2022 | | Annualized Expense
Ratio Based on the
Six-Month Period | | Expenses Paid
During the
Six-Month Period* |
| | | | | |
| Actual | | $1,000.00 | | $1,003.90 | | 0.15% | | $0.76 |
| | | | | |
| Hypothetical | | $1,000.00 | | $1,024.45 | | 0.15% | | $0.77 |
| | | | | | | | |
| | | | | |
PGIM Active High Yield Bond ETF | | Beginning Account Value March 1, 2022 | | Ending
Account Value
August 31, 2022 | | Annualized Expense
Ratio Based on the
Six-Month Period | | Expenses Paid
During the
Six-Month Period* |
| | | | | |
| Actual | | $1,000.00 | | $ 916.70 | | 0.53% | | $2.56 |
| | | | | |
| Hypothetical | | $1,000.00 | | $1,022.53 | | 0.53% | | $2.70 |
| | | | | | | | |
| | | | | |
PGIM Active Aggregate Bond ETF | | Beginning Account Value March 1, 2022 | | Ending
Account Value
August 31, 2022 | | Annualized Expense
Ratio Based on the
Six-Month Period | | Expenses Paid
During the
Six-Month Period* |
| | | | | |
| Actual | | $1,000.00 | | $ 915.40 | | 0.19% | | $0.92 |
| | | | | |
| Hypothetical | | $1,000.00 | | $1,024.25 | | 0.19% | | $0.97 |
| | | | | | | | |
| | | | | |
PGIM Total Return Bond ETF | | Beginning Account Value March 1, 2022 | | Ending
Account Value
August 31, 2022 | | Annualized Expense
Ratio Based on the
Six-Month Period | | Expenses Paid
During the
Six-Month Period* |
| | | | | |
| Actual | | $1,000.00 | | $ 908.30 | | 0.49% | | $2.36 |
| | | | | |
| Hypothetical | | $1,000.00 | | $1,022.74 | | 0.49% | | $2.50 |
| | | | | | | | |
| | | | | |
PGIM Floating Rate Income ETF | | Beginning Account Value March 1, 2022 | | Ending
Account Value
August 31, 2022 | | Annualized Expense
Ratio Based on the
Six-Month Period | | Expenses Paid
During the
Six-Month Period* |
| | | | | |
| Actual** | | $1,000.00 | | $1,008.90 | | 0.74% | | $2.16 |
| | | | | |
| Hypothetical | | $1,000.00 | | $1,021.48 | | 0.74% | | $3.77 |
*Fund expenses (net of fee waivers or subsidies, if any) are equal to the annualized expense ratio (provided in the table), multiplied by the average account value over the period, multiplied by the 184 days in the six-month period ended August 31, 2022, and divided by the 365 days in the Fund’s fiscal year ended August 31, 2022 (to reflect the six-month period). Expenses presented in the table include the expenses of any underlying portfolios in which the Fund may invest.
**“Actual” expenses are calculated using 106-day period ended August 31, 2022 due to the Fund’s inception date on May 17, 2022.
38 Visit our website at pgim.com/investments
Glossary
The following abbreviations are used in the Funds’ descriptions:
EUR—Euro
GBP—British Pound
USD—US Dollar
144A—Security was purchased pursuant to Rule 144A under the Securities Act of 1933 and, pursuant to the requirements of Rule 144A, may not be resold except to qualified institutional buyers.
A—Annual payment frequency for swaps
BABs—Build America Bonds
BSBY—Bloomberg Short-Term Bank Yield Index
CDX—Credit Derivative Index
CLO—Collateralized Loan Obligation
CVR—Contingent Value Rights
DIP—Debtor-In-Possession
EMTN—Euro Medium Term Note
EURIBOR—Euro Interbank Offered Rate
FHLMC—Federal Home Loan Mortgage Corporation
GMTN—Global Medium Term Note
iBoxx—Bond Market Indices
IO—Interest Only (Principal amount represents notional)
LIBOR—London Interbank Offered Rate
LP—Limited Partnership
MTN—Medium Term Note
OTC—Over-the-counter
PIK—Payment-in-Kind
Q—Quarterly payment frequency for swaps
REITs—Real Estate Investment Trust
REMIC—Real Estate Mortgage Investment Conduit
S—Semiannual payment frequency for swaps
SOFR—Secured Overnight Financing Rate
SONIA—Sterling Overnight Index Average
STRIPs—Separate Trading of Registered Interest and Principal of Securities
T—Swap payment upon termination
TBA—To Be Announced
USOIS—United States Overnight Index Swap
39
PGIM Ultra Short Bond ETF
Schedule of Investments
as of August 31, 2022
| | | | | | | | | | | | |
| | | | |
| Description | | Interest
Rate | | Maturity
Date | | Principal
Amount
(000)# | | | Value | |
| | | | |
LONG-TERM INVESTMENTS 74.6% | | | | | | | | | | | | |
| | | | |
ASSET-BACKED SECURITIES 16.8% | | | | | | | | | | | | |
| | | | |
Automobiles 1.5% | | | | | | | | | | | | |
ARI Fleet Lease Trust,
Series 2022-A, Class A2, 144A | | 3.120% | | 01/15/31 | | | 2,880 | | | $ | 2,826,940 | |
Donlen Fleet Lease Funding LLC,
Series 2021-02, Class A2, 144A | | 0.560 | | 12/11/34 | | | 4,080 | | | | 3,950,374 | |
Enterprise Fleet Financing LLC, | | | | | | | | | | | | |
Series 2021-02, Class A2, 144A | | 0.480 | | 05/20/27 | | | 5,168 | | | | 4,942,162 | |
Series 2022-01, Class A2, 144A | | 3.030 | | 01/20/28 | | | 12,500 | | | | 12,244,009 | |
Series 2022-03, Class A2, 144A | | 4.380 | | 07/20/29 | | | 800 | | | | 799,736 | |
GM Financial Consumer Automobile Receivables Trust,
Series 2022-02, Class A2 | | 2.520 | | 05/16/25 | | | 5,000 | | | | 4,958,797 | |
Honda Auto Receivables Owner Trust,
Series 2020-01, Class A3 | | 1.610 | | 04/22/24 | | | 2,267 | | | | 2,249,578 | |
World Omni Automobile Lease Securitization Trust,
Series 2022-A, Class A2 | | 2.630 | | 10/15/24 | | | 4,481 | | | | 4,440,303 | |
| | | | | | | | | | | | |
| | | | |
| | | | | | | | | | | 36,411,899 | |
| | | | |
Collateralized Loan Obligations 14.8% | | | | | | | | | | | | |
Allegro CLO Ltd. (Cayman Islands),
Series 2016-01A, Class AR2, 144A, 3 Month LIBOR + 0.950% (Cap N/A, Floor 0.950%) | | 3.462(c) | | 01/15/30 | | | 7,642 | | | | 7,559,506 | |
Anchorage Capital CLO Ltd. (Cayman Islands),
Series 2015-07A, Class AR2, 144A, 3 Month LIBOR + 1.090% (Cap N/A, Floor 1.090%) | | 3.883(c) | | 01/28/31 | | | 5,000 | | | | 4,944,165 | |
Atlas Senior Loan Fund Ltd. (Cayman Islands),
Series 2013-01A, Class AR, 144A, 3 Month LIBOR + 0.830% (Cap N/A, Floor 0.000%) | | 3.772(c) | | 11/17/27 | | | 2,554 | | | | 2,532,712 | |
Bain Capital Credit CLO Ltd. (Cayman Islands),
Series 2018-01A, Class A1, 144A, 3 Month LIBOR + 0.960% (Cap N/A, Floor 0.000%) | | 3.743(c) | | 04/23/31 | | | 4,000 | | | | 3,938,556 | |
Ballyrock CLO Ltd. (Cayman Islands),
Series 2020-02A, Class A1R, 144A, 3 Month LIBOR + 1.010% (Cap N/A, Floor 1.010%) | | 3.720(c) | | 10/20/31 | | | 18,000 | | | | 17,712,288 | |
Benefit Street Partners CLO Ltd. (Cayman Islands),
Series 2013-IIA, Class A1R2, 144A, 3 Month LIBOR + 0.870% (Cap N/A, Floor 0.870%) | | 3.382(c) | | 07/15/29 | | | 3,120 | | | | 3,080,375 | |
Series 2017-12A, Class A1R, 144A, 3 Month LIBOR + 0.950% (Cap N/A, Floor 0.950%) | | 3.462(c) | | 10/15/30 | | | 18,000 | | | | 17,784,792 | |
| | |
See Notes to Financial Statements. 40 | | |
PGIM Ultra Short Bond ETF
Schedule of Investments (continued)
as of August 31, 2022
| | | | | | | | | | | | | | | | |
| | | | |
| Description | | Interest
Rate | | | Maturity
Date | | | Principal
Amount
(000)# | | | Value | |
| | | | |
ASSET-BACKED SECURITIES (Continued) | | | | | | | | | | | | | | | | |
| | | | |
Collateralized Loan Obligations (cont’d.) | | | | | | | | | | | | | | | | |
BlueMountain CLO Ltd. (Cayman Islands),
Series 2018-22A, Class A1, 144A, 3 Month LIBOR + 1.080% (Cap N/A, Floor 0.000%) | | | 3.592%(c) | | | | 07/15/31 | | | | 4,500 | | | $ | 4,410,000 | |
Brookside Mill CLO Ltd. (Cayman Islands),
Series 2013-01A, Class AR, 144A, 3 Month LIBOR + 0.820% (Cap N/A, Floor 0.000%) | | | 3.560(c) | | | | 01/17/28 | | | | 33 | | | | 32,958 | |
Canyon Capital CLO Ltd. (Cayman Islands),
Series 2017-01A, Class AR, 144A, 3 Month LIBOR + 1.000% (Cap N/A, Floor 1.000%) (original cost $15,000,000; purchased 08/03/21)(f) | | | 3.512(c) | | | | 07/15/30 | | | | 15,000 | | | | 14,757,000 | |
Carlyle Global Market Strategies CLO Ltd. (Cayman Islands), | | | | | | | | | | | | | | | | |
Series 2014-01A, Class A1R2, 144A, 3 Month LIBOR + 0.970% (Cap N/A, Floor 0.970%) | | | 3.710(c) | | | | 04/17/31 | | | | 4,985 | | | | 4,897,724 | |
Series 2015-05A, Class A1RR, 144A, 3 Month LIBOR + 1.080% (Cap N/A, Floor 1.080%) | | | 3.790(c) | | | | 01/20/32 | | | | 18,000 | | | | 17,622,000 | |
Carlyle US CLO Ltd. (Cayman Islands),
Series 2017-01A, Class A1R, 144A, 3 Month LIBOR + 1.000% (Cap N/A, Floor 1.000%) | | | 3.710(c) | | | | 04/20/31 | | | | 13,000 | | | | 12,814,412 | |
CIFC Funding Ltd. (Cayman Islands),
Series 2013-03RA, Class A1, 144A, 3 Month LIBOR + 0.980% (Cap N/A, Floor 0.980%) | | | 3.763(c) | | | | 04/24/31 | | | | 2,000 | | | | 1,969,542 | |
Series 2017-01A, Class AR, 144A, 3 Month LIBOR + 1.010% (Cap N/A, Floor 1.010%) | | | 3.742(c) | | | | 04/23/29 | | | | 4,741 | | | | 4,686,970 | |
Elevation CLO Ltd. (Cayman Islands),
Series 2014-02A, Class A1R, 144A, 3 Month SOFR + 1.492% (Cap N/A, Floor 0.000%) | | | 3.819(c) | | | | 10/15/29 | | | | 1,329 | | | | 1,318,220 | |
Ellington CLO Ltd. (Cayman Islands),
Series 2019-04A, Class AR, 144A, 3 Month LIBOR + 1.580% (Cap N/A, Floor 1.580%) | | | 4.092(c) | | | | 04/15/29 | | | | 5,135 | | | | 5,102,282 | |
Generate CLO Ltd. (Cayman Islands),
Series 02A, Class AR, 144A, 3 Month LIBOR + 1.150% (Cap N/A, Floor 1.150%) | | | 3.909(c) | | | | 01/22/31 | | | | 10,340 | | | | 10,196,491 | |
ICG US CLO Ltd. (Cayman Islands),
Series 2014-03A, Class A1RR, 144A, 3 Month LIBOR + 1.030% (Cap N/A, Floor 0.000%) | | | 3.813(c) | | | | 04/25/31 | | | | 7,083 | | | | 6,980,906 | |
JMP Credit Advisors CLO Ltd. (Cayman Islands),
Series 2017-01A, Class AR, 144A, 3 Month LIBOR + 1.280% (Cap N/A, Floor 1.280%) | | | 4.020(c) | | | | 07/17/29 | | | | 9,147 | | | | 9,066,171 | |
See Notes to Financial Statements.
PGIM Fixed Income ETFs 41
PGIM Ultra Short Bond ETF
Schedule of Investments (continued)
as of August 31, 2022
| | | | | | | | | | | | | | | | |
| | | | |
| Description | | Interest
Rate | | | Maturity
Date | | | Principal
Amount
(000)# | | | Value | |
| | | | |
ASSET-BACKED SECURITIES (Continued) | | | | | | | | | | | | | | | | |
| | | | |
Collateralized Loan Obligations (cont’d.) | | | | | | | | | | | | | | | | |
KKR CLO Ltd. (Cayman Islands),
Series 11, Class AR, 144A, 3 Month LIBOR + 1.180% (Cap N/A, Floor 1.180%) | | | 3.692%(c) | | | | 01/15/31 | | | | 1,000 | | | $ | 988,706 | |
Series 18, Class AR, 144A, 3 Month LIBOR + 0.940% (Cap N/A, Floor 0.940%) | | | 3.680(c) | | | | 07/18/30 | | | | 18,000 | | | | 17,767,134 | |
KKR CLO Ltd.,
Series 30A, Class A1R, 144A, 3 Month LIBOR + 1.020% (Cap N/A, Floor 1.020%) | | | 3.760(c) | | | | 10/17/31 | | | | 14,000 | | | | 13,823,950 | |
Madison Park Funding Ltd. (Cayman Islands),
Series 12A, Class AR, 144A, 3 Month LIBOR + 0.830% (Cap N/A, Floor 0.000%) | | | 3.589(c) | | | | 04/22/27 | | | | 6,965 | | | | 6,883,940 | |
Series 2015-18A, Class ARR, 144A, 3 Month LIBOR + 0.940% (Cap N/A, Floor 0.940%) | | | 3.672(c) | | | | 10/21/30 | | | | 3,000 | | | | 2,958,750 | |
Series 2021-38A, Class X, 144A, 3 Month LIBOR + 0.950% (Cap N/A, Floor 0.950%) | | | 3.690(c) | | | | 07/17/34 | | | | 3,500 | | | | 3,448,788 | |
Magnetite Ltd. (Cayman Islands),
Series 2015-16A, Class AR, 144A, 3 Month LIBOR + 0.800% (Cap N/A, Floor 0.000%) | | | 3.540(c) | | | | 01/18/28 | | | | 1,928 | | | | 1,908,149 | |
MidOcean Credit CLO (Cayman Islands),
Series 2016-05A, Class AR, 144A, 3 Month LIBOR + 1.120% (Cap N/A, Floor 0.000%) | | | 3.858(c) | | | | 07/19/28 | | | | 2,279 | | | | 2,251,324 | |
Series 2017-07A, Class A1R, 144A, 3 Month LIBOR + 1.040% (Cap N/A, Floor 0.000%) | | | 3.552(c) | | | | 07/15/29 | | | | 9,287 | | | | 9,179,120 | |
Series 2018-09A, Class A1, 144A, 3 Month LIBOR + 1.150% (Cap N/A, Floor 1.150%) | | | 3.860(c) | | | | 07/20/31 | | | | 5,250 | | | | 5,184,947 | |
Mountain View CLO Ltd. (Cayman Islands),
Series 2013-01A, Class ARR, 144A, 3 Month LIBOR + 1.000% (Cap N/A, Floor 1.000%) | | | 3.423(c) | | | | 10/12/30 | | | | 13,500 | | | | 13,344,183 | |
Ocean Trails CLO (Cayman Islands),
Series 2019-07A, Class AR, 144A, 3 Month LIBOR + 1.010% (Cap N/A, Floor 1.010%) | | | 3.750(c) | | | | 04/17/30 | | | | 4,938 | | | | 4,881,468 | |
OZLM Ltd. (Cayman Islands), | | | | | | | | | | | | | | | | |
Series 2014-06A, Class A1S, 144A, 3 Month LIBOR + 1.080% (Cap N/A, Floor 0.000%) | | | 3.820(c) | | | | 04/17/31 | | | | 8,867 | | | | 8,737,654 | |
Series 2014-09A, Class A1A3, 144A, 3 Month LIBOR + 1.100% (Cap N/A, Floor 1.100%) | | | 3.810(c) | | | | 10/20/31 | | | | 18,000 | | | | 17,720,118 | |
Series 2015-12A, Class A1R, 144A, 3 Month LIBOR + 1.050% (Cap N/A, Floor 1.050%) | | | 3.832(c) | | | | 04/30/27 | | | | —(r | ) | | | 30 | |
See Notes to Financial Statements.
42
PGIM Ultra Short Bond ETF
Schedule of Investments (continued)
as of August 31, 2022
| | | | | | | | | | | | | | | | |
| | | | |
| Description | | Interest
Rate | | | Maturity
Date | | | Principal
Amount
(000)# | | | Value | |
| | | | |
ASSET-BACKED SECURITIES (Continued) | | | | | | | | | | | | | | | | |
| | | | |
Collateralized Loan Obligations (cont’d.) | | | | | | | | | | | | | | | | |
Palmer Square CLO Ltd. (Cayman Islands), | | | | | | | | | | | | | | | | |
Series 2014-01A, Class A1R2, 144A, 3 Month LIBOR + 1.130% (Cap N/A, Floor 1.130%) | | | 3.870%(c) | | | | 01/17/31 | | | | 1,250 | | | $ | 1,237,445 | |
Series 2015-02A, Class A1R2, 144A, 3 Month LIBOR + 1.100% (Cap N/A, Floor 0.000%) | | | 3.810(c) | | | | 07/20/30 | | | | 1,400 | | | | 1,383,259 | |
Park Avenue Institutional Advisers CLO Ltd. (Cayman Islands), | | | | | | | | | | | | | | | | |
Series 2018-01A, Class A1AR, 144A, 3 Month LIBOR + 1.000% (Cap N/A, Floor 1.000%) | | | 3.710(c) | | | | 10/20/31 | | | | 10,000 | | | | 9,807,160 | |
Sound Point CLO Ltd. (Cayman Islands), | | | | | | | | | | | | | | | | |
Series 2014-03RA, Class A1R, 144A, 3 Month LIBOR + 1.070% (Cap N/A, Floor 1.070%) | | | 3.853(c) | | | | 10/23/31 | | | | 10,000 | | | | 9,843,170 | |
Series 2017-03A, Class A1R, 144A, 3 Month LIBOR + 0.980% (Cap N/A, Floor 0.980%) | | | 3.690(c) | | | | 10/20/30 | | | | 10,000 | | | | 9,865,700 | |
Series 2019-01A, Class AR, 144A, 3 Month LIBOR + 1.080% (Cap N/A, Floor 1.080%) | | | 3.790(c) | | | | 01/20/32 | | | | 13,000 | | | | 12,791,506 | |
TICP CLO Ltd. (Cayman Islands), | | | | | | | | | | | | | | | | |
Series 2018-03R, Class A, 144A, 3 Month LIBOR + 0.840% (Cap N/A, Floor 0.840%) | | | 3.550(c) | | | | 04/20/28 | | | | 895 | | | | 887,454 | |
Trinitas CLO Ltd. (Cayman Islands), | | | | | | | | | | | | | | | | |
Series 2016-04A, Class A1L2, 144A, 3 Month LIBOR + 1.100% (Cap N/A, Floor 1.100%) | | | 3.840(c) | | | | 10/18/31 | | | | 12,000 | | | | 11,760,000 | |
Series 2016-05A, Class ARR, 144A, 3 Month LIBOR + 1.030% (Cap N/A, Floor 1.030%) | | | 3.813(c) | | | | 10/25/28 | | | | 2,424 | | | | 2,409,394 | |
Venture CLO Ltd. (Cayman Islands), | | | | | | | | | | | | | | | | |
Series 2015-21A, Class AR, 144A, 3 Month LIBOR + 0.880% (Cap N/A, Floor 0.000%) | | | 3.392(c) | | | | 07/15/27 | | | | 109 | | | | 108,263 | |
Series 2016-24A, Class ARR, 144A, 3 Month LIBOR + 0.900% (Cap N/A, Floor 0.900%) | | | 3.610(c) | | | | 10/20/28 | | | | 8,465 | | | | 8,338,464 | |
Voya CLO Ltd. (Cayman Islands), | | | | | | | | | | | | | | | | |
Series 2013-02A, Class A1R, 144A, 3 Month SOFR + 1.232% (Cap N/A, Floor 0.970%) | | | 3.773(c) | | | | 04/25/31 | | | | 4,000 | | | | 3,944,536 | |
Series 2014-01A, Class AAR2, 144A, 3 Month SOFR + 1.252% (Cap N/A, Floor 0.000%) | | | 3.732(c) | | | | 04/18/31 | | | | 1,864 | | | | 1,834,844 | |
Series 2014-02A, Class A1RR, 144A, 3 Month LIBOR + 1.020% (Cap N/A, Floor 1.020%) | | | 3.760(c) | | | | 04/17/30 | | | | 1,678 | | | | 1,659,905 | |
Wellfleet CLO Ltd. (Cayman Islands), | | | | | | | | | | | | | | | | |
Series 2016-02A, Class A1R, 144A, 3 Month LIBOR + 1.140% (Cap N/A, Floor 1.140%) | | | 3.850(c) | | | | 10/20/28 | | | | 3,934 | | | | 3,899,146 | |
See Notes to Financial Statements.
PGIM Fixed Income ETFs 43
PGIM Ultra Short Bond ETF
Schedule of Investments (continued)
as of August 31, 2022
| | | | | | | | | | | | | | | | |
| | | | |
| Description | | Interest
Rate | | | Maturity
Date | | | Principal
Amount
(000)# | | | Value | |
| | | | |
ASSET-BACKED SECURITIES (Continued) | | | | | | | | | | | | | | | | |
| | | | |
Collateralized Loan Obligations (cont’d.) | | | | | | | | | | | | | | | | |
Wellfleet CLO Ltd. (Cayman Islands), (cont’d.) | | | | | | | | | | | | | | | | |
Series 2017-02A, Class A1R, 144A, 3 Month LIBOR + 1.060% (Cap N/A, Floor 0.000%) | | | 3.770%(c) | | | | 10/20/29 | | | | 1,392 | | | $ | 1,371,680 | |
Series 2019-01A, Class A1R, 144A, 3 Month LIBOR + 1.120% (Cap N/A, Floor 1.120%) | | | 3.830(c) | | | | 07/20/32 | | | | 20,000 | | | | 19,618,400 | |
Zais CLO Ltd. (Cayman Islands), | | | | | | | | | | | | | | | | |
Series 2017-02A, Class A, 144A, 3 Month LIBOR + 1.290% (Cap N/A, Floor 0.000%) | | | 3.802(c) | | | | 04/15/30 | | | | 237 | | | | 234,289 | |
Series 2018-01A, Class A, 144A, 3 Month LIBOR + 0.950% (Cap N/A, Floor 0.000%) | | | 3.462(c) | | | | 04/15/29 | | | | 451 | | | | 446,180 | |
| | | | | | | | | | | | | | | | |
| | | | |
| | | | | | | | | | | | | | | 361,926,126 | |
| | | | |
Consumer Loans 0.1% | | | | | | | | | | | | | | | | |
SoFi Consumer Loan Program Trust,
Series 2021-01, Class A, 144A | | | 0.490 | | | | 09/25/30 | | | | 1,321 | | | | 1,279,504 | |
| | | | |
Equipment 0.4% | | | | | | | | | | | | | | | | |
MMAF Equipment Finance LLC,
Series 2022-A, Class A2, 144A | | | 2.770 | | | | 02/13/25 | | | | 11,000 | | | | 10,829,847 | |
| | | | | | | | | | | | | | | | |
| | | | |
TOTAL ASSET-BACKED SECURITIES
(cost $416,325,634) | | | | | | | | | | | | | | | 410,447,376 | |
| | | | | | | | | | | | | | | | |
| | | | |
CERTIFICATE OF DEPOSIT 0.6% | | | | | | | | | | | | | | | | |
Lloyds Bank Corporate Markets PLC, SOFR + 0.540%
(cost $15,000,000) | | | 2.830(c) | | | | 01/31/24 | | | | 15,000 | | | | 14,947,563 | |
| | | | | | | | | | | | | | | | |
| | | | |
COMMERCIAL MORTGAGE-BACKED SECURITIES 13.4% | | | | | | | | | | | | | | | | |
Benchmark Mortgage Trust, | | | | | | | | | | | | | | | | |
Series 2018-B02, Class A2 | | | 3.662 | | | | 02/15/51 | | | | 721 | | | | 717,103 | |
Series 2018-B03, Class A2 | | | 3.848 | | | | 04/10/51 | | | | 421 | | | | 419,043 | |
Series 2018-B05, Class A2 | | | 4.077 | | | | 07/15/51 | | | | 800 | | | | 791,753 | |
Citigroup Commercial Mortgage Trust, | | | | | | | | | | | | | | | | |
Series 2014-GC21, Class A4 | | | 3.575 | | | | 05/10/47 | | | | 6,453 | | | | 6,358,098 | |
Series 2014-GC21, Class AAB | | | 3.477 | | | | 05/10/47 | | | | 167 | | | | 165,760 | |
Series 2014-GC23, Class A3 | | | 3.356 | | | | 07/10/47 | | | | 11,062 | | | | 10,814,928 | |
Series 2014-GC23, Class AAB | | | 3.337 | | | | 07/10/47 | | | | 532 | | | | 526,132 | |
Series 2014-GC25, Class A3 | | | 3.372 | | | | 10/10/47 | | | | 6,519 | | | | 6,347,612 | |
Series 2016-P04, Class A2 | | | 2.450 | | | | 07/10/49 | | | | 3,635 | | | | 3,458,976 | |
See Notes to Financial Statements.
44
PGIM Ultra Short Bond ETF
Schedule of Investments (continued)
as of August 31, 2022
| | | | | | | | | | | | | | | | |
| | | | |
| Description | | Interest
Rate | | | Maturity
Date | | | Principal
Amount
(000)# | | | Value | |
| | | | |
COMMERCIAL MORTGAGE-BACKED SECURITIES (Continued) | | | | | | | | | | | | | | | | |
Citigroup Commercial Mortgage Trust, (cont’d.) | | | | | | | | | | | | | | | | |
Series 2017-P08, Class A1 | | | 2.065% | | | | 09/15/50 | | | | —(r | ) | | $ | 172 | |
Commercial Mortgage Trust, | | | | | | | | | | | | | | | | |
Series 2012-CR04, Class A3 | | | 2.853 | | | | 10/15/45 | | | | 1,295 | | | | 1,290,250 | |
Series 2012-CR05, Class A4 | | | 2.771 | | | | 12/10/45 | | | | 3,733 | | | | 3,721,723 | |
Series 2013-CR07, Class ASB | | | 2.739 | | | | 03/10/46 | | | | 41 | | | | 41,163 | |
Series 2013-CR08, Class A4 | | | 3.334 | | | | 06/10/46 | | | | 409 | | | | 405,488 | |
Series 2013-CR08, Class A5 | | | 3.612(cc) | | | | 06/10/46 | | | | 5,081 | | | | 5,051,925 | |
Series 2013-CR11, Class ASB | | | 3.660 | | | | 08/10/50 | | | | 244 | | | | 242,792 | |
Series 2014-CR16, Class A3 | | | 3.775 | | | | 04/10/47 | | | | 11,527 | | | | 11,374,859 | |
Series 2014-CR17, Class ASB | | | 3.598 | | | | 05/10/47 | | | | 235 | | | | 232,770 | |
Series 2014-CR20, Class A3 | | | 3.326 | | | | 11/10/47 | | | | 4,545 | | | | 4,429,726 | |
Series 2014-UBS02, Class ASB | | | 3.472 | | | | 03/10/47 | | | | 509 | | | | 505,309 | |
Series 2014-UBS04, Class A4 | | | 3.420 | | | | 08/10/47 | | | | 14,250 | | | | 13,997,803 | |
Series 2014-UBS05, Class A3 | | | 3.565 | | | | 09/10/47 | | | | 25,000 | | | | 24,441,327 | |
Series 2015-CR22, Class A3 | | | 3.207 | | | | 03/10/48 | | | | 820 | | | | 818,925 | |
Series 2015-CR23, Class ASB | | | 3.257 | | | | 05/10/48 | | | | 1,120 | | | | 1,102,520 | |
Series 2015-CR24, Class ASB | | | 3.445 | | | | 08/10/48 | | | | 2,066 | | | | 2,039,924 | |
Series 2015-LC19, Class A3 | | | 2.922 | | | | 02/10/48 | | | | 17,197 | | | | 16,638,919 | |
Series 2015-LC23, Class A2 | | | 3.221 | | | | 10/10/48 | | | | 184 | | | | 183,592 | |
CSAIL Commercial Mortgage Trust,
Series 2016-C05, Class ASB | | | 3.533 | | | | 11/15/48 | | | | 2,664 | | | | 2,616,890 | |
Deutsche Bank Commercial Mortgage Trust, | | | | | | | | | | | | | | | | |
Series 2016-C03, Class A2 | | | 1.886 | | | | 08/10/49 | | | | 97 | | | | 93,985 | |
Series 2017-C06, Class A3 | | | 3.269 | | | | 06/10/50 | | | | 4,040 | | | | 3,937,102 | |
GS Mortgage Securities Corp. Trust,
Series 2021-RENT, Class A, 144A, 1 Month LIBOR + 0.700% (Cap N/A, Floor 0.700%) | | | 3.068(c) | | | | 11/21/35 | | | | 5,369 | | | | 5,254,436 | |
GS Mortgage Securities Trust, | | | | | | | | | | | | | | | | |
Series 2014-GC18, Class A3 | | | 3.801 | | | | 01/10/47 | | | | 2,531 | | | | 2,498,662 | |
Series 2014-GC22, Class A4 | | | 3.587 | | | | 06/10/47 | | | | 4,840 | | | | 4,777,666 | |
Series 2014-GC22, Class AAB | | | 3.467 | | | | 06/10/47 | | | | 301 | | | | 298,916 | |
Series 2014-GC24, Class A4 | | | 3.666 | | | | 09/10/47 | | | | 19,488 | | | | 19,164,790 | |
JPMBB Commercial Mortgage Securities Trust, | | | | | | | | | | | | | | | | |
Series 2013-C12, Class A4 | | | 3.363 | | | | 07/15/45 | | | | 2,332 | | | | 2,306,973 | |
Series 2013-C14, Class ASB | | | 3.761(cc) | | | | 08/15/46 | | | | 4,282 | | | | 4,254,708 | |
Series 2014-C18, Class A4A2, 144A | | | 3.794 | | | | 02/15/47 | | | | 7,590 | | | | 7,453,208 | |
Series 2014-C21, Class A4 | | | 3.493 | | | | 08/15/47 | | | | 15,788 | | | | 15,494,957 | |
Series 2014-C25, Class ASB | | | 3.407 | | | | 11/15/47 | | | | 2,630 | | | | 2,591,712 | |
Series 2014-C26, Class A3 | | | 3.231 | | | | 01/15/48 | | | | 19,817 | | | | 19,263,384 | |
Series 2015-C32, Class A4 | | | 3.329 | | | | 11/15/48 | | | | 3,500 | | | | 3,434,769 | |
See Notes to Financial Statements.
PGIM Fixed Income ETFs 45
PGIM Ultra Short Bond ETF
Schedule of Investments (continued)
as of August 31, 2022
| | | | | | | | | | | | |
| | | | |
| Description | | Interest
Rate | | Maturity
Date | | Principal
Amount
(000)# | | | Value | |
| | | | |
COMMERCIAL MORTGAGE-BACKED SECURITIES (Continued) | | | | | | | | | | | | |
JPMorgan Chase Commercial Mortgage Securities Trust, | | | | | | | | | | | | |
Series 2013-LC11, Class A5 | | 2.960% | | 04/15/46 | | | 7,287 | | | $ | 7,203,516 | |
Series 2016-JP02, Class ASB | | 2.713 | | 08/15/49 | | | 6,543 | | | | 6,325,503 | |
Morgan Stanley Bank of America Merrill Lynch Trust, | | | | | | | | | | | | |
Series 2012-C06, Class A4 | | 2.858 | | 11/15/45 | | | 94 | | | | 94,194 | |
Series 2013-C08, Class A4 | | 3.134 | | 12/15/48 | | | 3,878 | | | | 3,865,902 | |
Series 2013-C09, Class AAB | | 2.657 | | 05/15/46 | | | 118 | | | | 117,907 | |
Series 2013-C12, Class ASB | | 3.824 | | 10/15/46 | | | 1,842 | | | | 1,837,228 | |
Series 2014-C15, Class A3 | | 3.773 | | 04/15/47 | | | 2,550 | | | | 2,521,296 | |
Series 2014-C16, Class A4 | | 3.600 | | 06/15/47 | | | 23,408 | | | | 23,088,828 | |
Series 2014-C19, Class ASB | | 3.326 | | 12/15/47 | | | 3,866 | | | | 3,812,631 | |
Series 2015-C23, Class ASB | | 3.398 | | 07/15/50 | | | 1,397 | | | | 1,376,462 | |
Morgan Stanley Capital I Trust,
Series 2018-H03, Class A2 | | 3.997 | | 07/15/51 | | | 516 | | | | 513,039 | |
One New York Plaza Trust,
Series 2020-01NYP, Class A, 144A, 1 Month LIBOR + 0.950% (Cap N/A, Floor 0.950%) | | 3.341(c) | | 01/15/36 | | | 19,065 | | | | 18,373,066 | |
UBS-Barclays Commercial Mortgage Trust, | | | | | | | | | | | | |
Series 2012-C04, Class A5 | | 2.850 | | 12/10/45 | | | 6,685 | | | | 6,678,857 | |
Series 2013-C05, Class A4 | | 3.185 | | 03/10/46 | | | 7,889 | | | | 7,856,553 | |
Wells Fargo Commercial Mortgage Trust, | | | | | | | | | | | | |
Series 2013-LC12, Class A4 | | 4.218(cc) | | 07/15/46 | | | 17,500 | | | | 17,400,162 | |
Series 2013-LC12, Class ASB | | 3.928(cc) | | 07/15/46 | | | 2,858 | | | | 2,848,846 | |
Series 2015-NXS02, Class A2 | | 3.020 | | 07/15/58 | | | 137 | | | | 133,914 | |
Series 2015-NXS02, Class A4 | | 3.498 | | 07/15/58 | | | 10,300 | | | | 10,007,092 | |
Series 2016-C34, Class ASB | | 2.911 | | 06/15/49 | | | 3,717 | | | | 3,607,300 | |
Series 2017-C42, Class A1 | | 2.338 | | 12/15/50 | | | 191 | | | | 190,255 | |
| | | | | | | | | | | | |
| | | | |
TOTAL COMMERCIAL MORTGAGE-BACKED SECURITIES | | | | | | | | | | | | |
(cost $339,378,647) | | | | | | | | | | | 327,413,301 | |
| | | | | | | | | | | | |
| | | | |
CORPORATE BONDS 42.7% | | | | | | | | | | | | |
| | | | |
Aerospace & Defense 0.4% | | | | | | | | | | | | |
Boeing Co. (The),
Sr. Unsec’d. Notes | | 1.167 | | 02/04/23 | | | 10,000 | | | | 9,875,184 | |
| | | | |
Agriculture 0.5% | | | | | | | | | | | | |
Cargill, Inc., | | | | | | | | | | | | |
Sr. Unsec’d. Notes, 144A | | 1.375 | | 07/23/23 | | | 1,000 | | | | 979,115 | |
Sr. Unsec’d. Notes, 144A | | 3.500 | | 04/22/25 | | | 6,750 | | | | 6,653,227 | |
See Notes to Financial Statements.
46
PGIM Ultra Short Bond ETF
Schedule of Investments (continued)
as of August 31, 2022
| | | | | | | | | | | | |
| | | | |
| Description | | Interest
Rate | | Maturity
Date | | Principal
Amount
(000)# | | | Value | |
| | | | |
CORPORATE BONDS (Continued) | | | | | | | | | | | | |
| | | | |
Agriculture (cont’d.) | | | | | | | | | | | | |
Philip Morris International, Inc.,
Sr. Unsec’d. Notes | | 1.125% | | 05/01/23 | | | 3,000 | | | $ | 2,947,525 | |
| | | | | | | | | | | | |
| | | | |
| | | | | | | | | | | 10,579,867 | |
| | | | |
Auto Manufacturers 3.8% | | | | | | | | | | | | |
American Honda Finance Corp.,
Sr. Unsec’d. Notes, MTN | | 0.750 | | 08/09/24 | | | 4,500 | | | | 4,242,192 | |
BMW US Capital LLC (Germany), | | | | | | | | | | | | |
Gtd. Notes, 144A, SOFR Index + 0.530% | | 2.582(c) | | 04/01/24 | | | 4,000 | | | | 3,982,082 | |
Gtd. Notes, 144A | | 3.250 | | 04/01/25 | | | 7,000 | | | | 6,842,938 | |
Gtd. Notes, 144A | | 3.800 | | 04/06/23 | | | 4,000 | | | | 4,004,566 | |
Mercedes-Benz Finance North America LLC (Germany),
Gtd. Notes, 144A | | 0.750 | | 03/01/24 | | | 13,500 | | | | 12,814,810 | |
PACCAR Financial Corp.,
Sr. Unsec’d. Notes, MTN | | 3.550 | | 08/11/25 | | | 25,000 | | | | 24,771,419 | |
Toyota Motor Credit Corp., | | | | | | | | | | | | |
Sr. Unsec’d. Notes, MTN | | 3.650 | | 08/18/25 | | | 5,000 | | | | 4,952,145 | |
Sr. Unsec’d. Notes, MTN | | 3.950 | | 06/30/25 | | | 18,750 | | | | 18,730,544 | |
Volkswagen Group of America Finance LLC (Germany),
Gtd. Notes, 144A | | 3.950 | | 06/06/25 | | | 13,250 | | | | 13,046,878 | |
| | | | | | | | | | | | |
| | | | |
| | | | | | | | | | | 93,387,574 | |
| | | | |
Banks 11.0% | | | | | | | | | | | | |
Bank of America Corp.,
Sr. Unsec’d. Notes, MTN, 3 Month BSBY + 0.430% | | 3.342(c) | | 05/28/24 | | | 15,000 | | | | 14,837,709 | |
Bank of Nova Scotia (The) (Canada), | | | | | | | | | | | | |
Sr. Unsec’d. Notes | | 1.625 | | 05/01/23 | | | 6,000 | | | | 5,917,756 | |
Sr. Unsec’d. Notes, MTN, SOFR + 0.460% | | 2.577(c) | | 01/10/25 | | | 7,750 | | | | 7,589,111 | |
Banque Federative du Credit Mutuel SA (France), | | | | | | | | | | | | |
Sr. Unsec’d. Notes, 144A | | 0.650 | | 02/27/24 | | | 7,250 | | | | 6,873,629 | |
Sr. Unsec’d. Notes, 144A, SOFR Index + 0.410% | | 2.704(c) | | 02/04/25 | | | 20,000 | | | | 19,595,090 | |
Canadian Imperial Bank of Commerce (Canada), | | | | | | | | | | | | |
Sr. Unsec’d. Notes, SOFR Index + 0.420% | | 2.597(c) | | 10/18/24 | | | 10,000 | | | | 9,822,007 | |
Sr. Unsec’d. Notes, SOFR + 0.800% | | 2.751(c) | | 03/17/23 | | | 6,000 | | | | 5,998,585 | |
Cooperatieve Rabobank UA (Netherlands),
Sr. Unsec’d. Notes, SOFR Index + 0.300% (Cap N/A, Floor 0.000%) | | 2.426(c) | | 01/12/24 | | | 5,500 | | | | 5,445,247 | |
See Notes to Financial Statements.
PGIM Fixed Income ETFs 47
PGIM Ultra Short Bond ETF
Schedule of Investments (continued)
as of August 31, 2022
| | | | | | | | | | | | |
| | | | |
| Description | | Interest
Rate | | Maturity
Date | | Principal
Amount
(000)# | | | Value | |
| | | | |
CORPORATE BONDS (Continued) | | | | | | | | | | | | |
| | | | |
Banks (cont’d.) | | | | | | | | | | | | |
Credit Agricole Corporate & Investment Bank SA (France),
Bank Gtd. Notes, MTN | | 0.400% | | 01/15/23 | | | 11,600 | | | $ | 11,446,216 | |
Credit Suisse AG (Switzerland),
Sr. Unsec’d. Notes, SOFR Index + 0.390% | | 2.684(c) | | 02/02/24 | | | 2,500 | | | | 2,466,366 | |
Deutsche Bank AG (Germany),
Sr. Unsec’d. Notes, Series E, SOFR + 0.500% (Cap N/A, Floor 0.000%) | | 2.794(c) | | 11/08/23 | | | 20,000 | | | | 19,851,690 | |
Federation des Caisses Desjardins du Quebec (Canada),
Sr. Unsec’d. Notes, 144A | | 4.400 | | 08/23/25 | | | 25,000 | | | | 24,806,700 | |
Fifth Third Bank NA,
Sr. Unsec’d. Notes, MTN | | 1.800 | | 01/30/23 | | | 5,000 | | | | 4,957,088 | |
Goldman Sachs Group, Inc. (The),
Sr. Unsec’d. Notes | | 0.627(ff) | | 11/17/23 | | | 5,000 | | | | 4,959,165 | |
JPMorgan Chase & Co.,
Sr. Unsec’d. Notes | | 0.768(ff) | | 08/09/25 | | | 15,000 | | | | 13,970,570 | |
Morgan Stanley,
Sr. Unsec’d. Notes, GMTN | | 3.750 | | 02/25/23 | | | 10,000 | | | | 10,006,711 | |
Sr. Unsec’d. Notes, MTN, 3 Month LIBOR + 1.400% | | 4.183(c) | | 10/24/23 | | | 4,750 | | | | 4,750,369 | |
National Australia Bank Ltd. (Australia),
Sr. Unsec’d. Notes | | 3.500 | | 06/09/25 | | | 7,250 | | | | 7,126,145 | |
National Securities Clearing Corp.,
Sr. Unsec’d. Notes, 144A | | 0.400 | | 12/07/23 | | | 3,750 | | | | 3,590,486 | |
Sr. Unsec’d. Notes, 144A | | 1.200 | | 04/23/23 | | | 3,000 | | | | 2,955,616 | |
NatWest Markets PLC (United Kingdom),
Sr. Unsec’d. Notes, 144A, SOFR + 1.450% | | 3.405(c) | | 03/22/25 | | | 9,000 | | | | 9,005,659 | |
Nordea Bank Abp (Finland),
Sr. Unsec’d. Notes, 144A | | 0.625 | | 05/24/24 | | | 9,500 | | | | 8,917,029 | |
Royal Bank of Canada (Canada),
Sr. Unsec’d. Notes, GMTN, SOFR Index + 0.340% | | 2.443(c) | | 10/07/24 | | | 10,000 | | | | 9,822,549 | |
Skandinaviska Enskilda Banken AB (Sweden),
Sr. Unsec’d. Notes, 144A | | 0.650 | | 09/09/24 | | | 11,250 | | | | 10,441,917 | |
Sumitomo Mitsui Trust Bank Ltd. (Japan),
Sr. Unsec’d. Notes, 144A, MTN, SOFR + 0.440% | | 2.282(c) | | 09/16/24 | | | 7,500 | | | | 7,404,185 | |
Toronto-Dominion Bank (The) (Canada),
Sr. Unsec’d. Notes, MTN, SOFR + 0.350% | | 2.148(c) | | 09/10/24 | | | 8,000 | | | | 7,863,918 | |
Sr. Unsec’d. Notes, MTN, SOFR + 0.480% | | 2.748(c) | | 01/27/23 | | | 7,138 | | | | 7,154,405 | |
Truist Bank,
Sr. Unsec’d. Notes, SOFR + 0.200% | | 2.377(c) | | 01/17/24 | | | 10,000 | | | | 9,902,539 | |
See Notes to Financial Statements.
48
PGIM Ultra Short Bond ETF
Schedule of Investments (continued)
as of August 31, 2022
| | | | | | | | | | | | |
| | | | |
| Description | | Interest
Rate | | Maturity
Date | | Principal
Amount
(000)# | | | Value | |
| | | | |
CORPORATE BONDS (Continued) | | | | | | | | | | | | |
| | | | |
Banks (cont’d.) | | | | | | | | | | | | |
Truist Bank, (cont’d.) | | | | | | | | | | | | |
Sr. Unsec’d. Notes, SOFR + 0.730% (Cap N/A, Floor 0.000%) | | 2.512%(c) | | 03/09/23 | | | 2,000 | | | $ | 1,998,557 | |
UBS AG (Switzerland),
Sr. Unsec’d. Notes, 144A, MTN | | 0.450 | | 02/09/24 | | | 3,000 | | | | 2,841,841 | |
Sr. Unsec’d. Notes, 144A, MTN, SOFR + 0.360% | | 2.654(c) | | 02/09/24 | | | 4,500 | | | | 4,476,555 | |
UBS Group AG (Switzerland),
Sr. Unsec’d. Notes, 144A | | 1.008(ff) | | 07/30/24 | | | 1,250 | | | | 1,210,037 | |
| | | | | | | | | | | | |
| | | | |
| | | | | | | | | | | 268,005,447 | |
| | | | |
Beverages 1.5% | | | | | | | | | | | | |
Coca-Cola Europacific Partners PLC (United Kingdom),
Sr. Unsec’d. Notes, 144A | | 0.500 | | 05/05/23 | | | 5,600 | | | | 5,460,733 | |
Sr. Unsec’d. Notes, 144A | | 0.800 | | 05/03/24 | | | 3,000 | | | | 2,834,101 | |
Keurig Dr. Pepper, Inc.,
Gtd. Notes | | 0.750 | | 03/15/24 | | | 25,000 | | | | 23,774,961 | |
PepsiCo, Inc.,
Sr. Unsec’d. Notes | | 0.400 | | 10/07/23 | | | 5,500 | | | | 5,311,572 | |
| | | | | | | | | | | | |
| | | | |
| | | | | | | | | | | 37,381,367 | |
| | | | |
Biotechnology 0.1% | | | | | | | | | | | | |
Gilead Sciences, Inc.,
Sr. Unsec’d. Notes | | 0.750 | | 09/29/23 | | | 2,250 | | | | 2,176,661 | |
| | | | |
Building Materials 0.1% | | | | | | | | | | | | |
Martin Marietta Materials, Inc.,
Sr. Unsec’d. Notes | | 0.650 | | 07/15/23 | | | 2,250 | | | | 2,186,727 | |
| | | | |
Chemicals 0.5% | | | | | | | | | | | | |
Air Liquide Finance SA (France),
Gtd. Notes, 144A | | 2.250 | | 09/27/23 | | | 1,000 | | | | 983,761 | |
Nutrien Ltd. (Canada),
Sr. Unsec’d. Notes | | 1.900 | | 05/13/23 | | | 3,000 | | | | 2,959,339 | |
See Notes to Financial Statements.
PGIM Fixed Income ETFs 49
PGIM Ultra Short Bond ETF
Schedule of Investments (continued)
as of August 31, 2022
| | | | | | | | | | | | |
| | | | |
| Description | | Interest
Rate | | Maturity
Date | | Principal
Amount
(000)# | | | Value | |
| | | | |
CORPORATE BONDS (Continued) | | | | | | | | | | | | |
| | | | |
Chemicals (cont’d.) | | | | | | | | | | | | |
Sherwin-Williams Co. (The),
Sr. Unsec’d. Notes | | 4.250% | | 08/08/25 | | | 5,500 | | | $ | 5,495,105 | |
Westlake Corp.,
Sr. Unsec’d. Notes | | 0.875 | | 08/15/24 | | | 2,750 | | | | 2,599,157 | |
| | | | | | | | | | | | |
| | | | |
| | | | | | | | | | | 12,037,362 | |
| | | | |
Computers 0.2% | | | | | | | | | | | | |
Apple, Inc.,
Sr. Unsec’d. Notes | | 1.700 | | 09/11/22 | | | 5,000 | | | | 4,998,667 | |
| | | | |
Cosmetics/Personal Care 0.5% | | | | | | | | | | | | |
Colgate-Palmolive Co.,
Sr. Unsec’d. Notes | | 3.100 | | 08/15/25 | | | 6,750 | | | | 6,637,141 | |
GSK Consumer Healthcare Capital US LLC,
Gtd. Notes, 144A, SOFR + 0.890% | | 2.879(c) | | 03/24/24 | | | 6,250 | | | | 6,223,197 | |
| | | | | | | | | | | | |
| | | | |
| | | | | | | | | | | 12,860,338 | |
| | | | |
Diversified Financial Services 2.3% | | | | | | | | | | | | |
AIG Global Funding,
Sr. Sec’d. Notes, 144A | | 0.650 | | 06/17/24 | | | 12,750 | | | | 11,985,883 | |
Air Lease Corp.,
Sr. Unsec’d. Notes, MTN, 3 Month LIBOR + 0.350% (Cap N/A, Floor 0.000%) | | 2.179(c) | | 12/15/22 | | | 20,000 | | | | 19,957,946 | |
American Express Co.,
Sr. Unsec’d. Notes | | 3.400 | | 02/27/23 | | | 10,000 | | | | 9,998,095 | |
Capital One Financial Corp.,
Sr. Unsec’d. Notes, 3 Month LIBOR + 0.720% | | 3.526(c) | | 01/30/23 | | | 1,660 | | | | 1,654,553 | |
Citigroup Global Markets Holdings, Inc.,
Gtd. Notes, MTN | | 0.750 | | 06/07/24 | | | 13,250 | | | | 12,488,905 | |
| | | | | | | | | | | | |
| | | | |
| | | | | | | | | | | 56,085,382 | |
| | | | |
Electric 4.7% | | | | | | | | | | | | |
American Electric Power Co., Inc.,
Sr. Unsec’d. Notes, Series A, 3 Month LIBOR + 0.480% | | 3.262(c) | | 11/01/23 | | | 3,000 | | | | 2,992,952 | |
CenterPoint Energy, Inc.,
Sr. Unsec’d. Notes, SOFR Index + 0.650% | | 2.944(c) | | 05/13/24 | | | 10,000 | | | | 9,988,763 | |
See Notes to Financial Statements.
50
PGIM Ultra Short Bond ETF
Schedule of Investments (continued)
as of August 31, 2022
| | | | | | | | | | | | |
| | | | |
| Description | | Interest
Rate | | Maturity
Date | | Principal
Amount
(000)# | | | Value | |
| | | | |
CORPORATE BONDS (Continued) | | | | | | | | | | | | |
| | | | |
Electric (cont’d.) | | | | | | | | | | | | |
DTE Energy Co., | | | | | | | | | | | | |
Sr. Unsec’d. Notes | | 2.250% | | 11/01/22 | | | 8,000 | | | $ | 7,983,922 | |
Sr. Unsec’d. Notes | | 4.220 | | 11/01/24 | | | 8,250 | | | | 8,218,846 | |
Sr. Unsec’d. Notes, Series H | | 0.550 | | 11/01/22 | | | 12,000 | | | | 11,923,212 | |
Entergy Louisiana LLC,
First Mortgage | | 0.620 | | 11/17/23 | | | 2,569 | | | | 2,481,286 | |
Florida Power & Light Co.,
Sr. Unsec’d. Notes, SOFR Index + 0.250% | | 2.544(c) | | 05/10/23 | | | 12,000 | | | | 11,967,545 | |
NextEra Energy Capital Holdings, Inc.,
Gtd. Notes | | 2.940 | | 03/21/24 | | | 15,000 | | | | 14,738,935 | |
OGE Energy Corp.,
Sr. Unsec’d. Notes | | 0.703 | | 05/26/23 | | | 3,500 | | | | 3,416,521 | |
PPL Electric Utilities Corp., | | | | | | | | | | | | |
First Mortgage, SOFR + 0.330% | | 2.323(c) | | 06/24/24 | | | 2,250 | | | | 2,245,584 | |
First Mortgage | | 2.500 | | 09/01/22 | | | 4,800 | | | | 4,800,000 | |
Southern California Edison Co., | | | | | | | | | | | | |
First Mortgage, Series C | | 4.200 | | 06/01/25 | | | 14,250 | | | | 14,219,519 | |
First Mortgage, Series D | | 3.400 | | 06/01/23 | | | 13,475 | | | | 13,415,907 | |
WEC Energy Group, Inc.,
Sr. Unsec’d. Notes | | 0.800 | | 03/15/24 | | | 7,250 | | | | 6,908,505 | |
| | | | | | | | | | | | |
| | | | |
| | | | | | | | | | | 115,301,497 | |
| | | | |
Entertainment 0.3% | | | | | | | | | | | | |
Magallanes, Inc.,
Gtd. Notes, 144A, SOFR Index + 1.780% | | 3.662(c) | | 03/15/24 | | | 7,500 | | | | 7,497,583 | |
| | | | |
Foods 0.3% | | | | | | | | | | | | |
Hormel Foods Corp.,
Sr. Unsec’d. Notes | | 0.650 | | 06/03/24 | | | 3,500 | | | | 3,324,615 | |
Nestle Holdings, Inc.,
Gtd. Notes, 144A | | 0.375 | | 01/15/24 | | | 5,000 | | | | 4,774,477 | |
| | | | | | | | | | | | |
| | | | |
| | | | | | | | | | | 8,099,092 | |
| | | | |
Forest Products & Paper 0.3% | | | | | | | | | | | | |
Georgia-Pacific LLC,
Sr. Unsec’d. Notes, 144A | | 3.734 | | 07/15/23 | | | 7,000 | | | | 6,984,599 | |
See Notes to Financial Statements.
PGIM Fixed Income ETFs 51
PGIM Ultra Short Bond ETF
Schedule of Investments (continued)
as of August 31, 2022
| | | | | | | | | | | | |
| | | | |
| Description | | Interest
Rate | | Maturity
Date | | Principal
Amount
(000)# | | | Value | |
| | | | |
CORPORATE BONDS (Continued) | | | | | | | | | | | | |
| | | | |
Gas 0.2% | | | | | | | | | | | | |
Atmos Energy Corp.,
Sr. Unsec’d. Notes, 3 Month LIBOR + 0.380% | | 2.070%(c) | | 03/09/23 | | | 5,250 | | | $ | 5,242,287 | |
| | | | |
Healthcare-Products 1.5% | | | | | | | | | | | | |
Baxter International, Inc., | | | | | | | | | | | | |
Sr. Unsec’d. Notes | | 0.868 | | 12/01/23 | | | 10,000 | | | | 9,617,980 | |
Sr. Unsec’d. Notes, SOFR Index + 0.260% | | 2.556(c) | | 12/01/23 | | | 20,000 | | | | 19,853,967 | |
Stryker Corp.,
Sr. Unsec’d. Notes | | 0.600 | | 12/01/23 | | | 1,250 | | | | 1,200,564 | |
Thermo Fisher Scientific, Inc.,
Sr. Unsec’d. Notes, SOFR Index + 0.530% | | 2.707(c) | | 10/18/24 | | | 6,750 | | | | 6,708,340 | |
| | | | | | | | | | | | |
| | | | |
| | | | | | | | | | | 37,380,851 | |
| | | | |
Healthcare-Services 0.3% | | | | | | | | | | | | |
UnitedHealth Group, Inc.,
Sr. Unsec’d. Notes | | 0.550 | | 05/15/24 | | | 7,250 | | | | 6,885,793 | |
| | | | |
Household Products/Wares 0.5% | | | | | | | | | | | | |
Avery Dennison Corp.,
Sr. Unsec’d. Notes | | 0.850 | | 08/15/24 | | | 12,350 | | | | 11,566,841 | |
| | | | |
Insurance 4.0% | | | | | | | | | | | | |
Berkshire Hathaway, Inc.,
Sr. Unsec’d. Notes | | 2.750 | | 03/15/23 | | | 4,853 | | | | 4,842,360 | |
Corebridge Financial, Inc.,
Sr. Unsec’d. Notes, 144A | | 3.500 | | 04/04/25 | | | 8,000 | | | | 7,709,730 | |
Equitable Financial Life Global Funding, | | | | | | | | | | | | |
Sec’d. Notes, 144A | | 0.800 | | 08/12/24 | | | 3,000 | | | | 2,794,980 | |
Sec’d. Notes, 144A, SOFR + 0.390% | | 2.494(c) | | 04/06/23 | | | 10,000 | | | | 9,964,602 | |
Metropolitan Life Global Funding I,
Sec’d. Notes, 144A, MTN | | 4.050 | | 08/25/25 | | | 23,250 | | | | 23,112,370 | |
New York Life Global Funding, | | | | | | | | | | | | |
Sec’d. Notes, 144A | | 2.900 | | 01/17/24 | | | 4,190 | | | | 4,128,893 | |
Sec’d. Notes, 144A, MTN | | 3.600 | | 08/05/25 | | | 19,750 | | | | 19,399,966 | |
Pacific Life Global Funding II,
Sr. Sec’d. Notes, 144A | | 0.500 | | 09/23/23 | | | 4,750 | | | | 4,584,097 | |
Principal Life Global Funding II,
Sec’d. Notes, 144A | | 0.500 | | 01/08/24 | | | 7,250 | | | | 6,899,547 | |
See Notes to Financial Statements.
52
PGIM Ultra Short Bond ETF
Schedule of Investments (continued)
as of August 31, 2022
| | | | | | | | | | | | |
| | | | |
| Description | | Interest
Rate | | Maturity
Date | | Principal
Amount
(000)# | | | Value | |
| | | | |
CORPORATE BONDS (Continued) | | | | | | | | | | | | |
| | | | |
Insurance (cont’d.) | | | | | | | | | | | | |
Principal Life Global Funding II, (cont’d.)
Sec’d. Notes, 144A, SOFR + 0.450% | | 2.576%(c) | | 04/12/24 | | | 1,250 | | | $ | 1,238,158 | |
Protective Life Global Funding, | | | | | | | | | | | | |
Sec’d. Notes, 144A | | 0.631 | | 10/13/23 | | | 4,250 | | | | 4,098,912 | |
Sr. Sec’d. Notes, 144A | | 0.473 | | 01/12/24 | | | 10,000 | | | | 9,491,412 | |
| | | | | | | | | | | | |
| | | | |
| | | | | | | | | | | 98,265,027 | |
| | | | |
Iron/Steel 0.3% | | | | | | | | | | | | |
Nucor Corp.,
Sr. Unsec’d. Notes | | 3.950 | | 05/23/25 | | | 8,000 | | | | 7,941,778 | |
| | | | |
Machinery-Construction & Mining 1.0% | | | | | | | | | | | | |
Caterpillar Financial Services Corp., | | | | | | | | | | | | |
Sr. Unsec’d. Notes, MTN | | 0.450 | | 09/14/23 | | | 10,000 | | | | 9,680,569 | |
Sr. Unsec’d. Notes, MTN, SOFR + 0.150% | | 2.445(c) | | 11/17/22 | | | 15,000 | | | | 14,989,665 | |
| | | | | | | | | | | | |
| | | | |
| | | | | | | | | | | 24,670,234 | |
| | | | |
Machinery-Diversified 0.5% | | | | | | | | | | | | |
CNH Industrial Capital LLC,
Gtd. Notes | | 3.950 | | 05/23/25 | | | 12,500 | | | | 12,286,872 | |
| | | | |
Media 0.1% | | | | | | | | | | | | |
Walt Disney Co. (The),
Gtd. Notes, 3 Month LIBOR + 0.390% | | 1.970(c) | | 09/01/22 | | | 3,000 | | | | 3,000,000 | |
| | | | |
Miscellaneous Manufacturing 0.5% | | | | | | | | | | | | |
Carlisle Cos., Inc.,
Sr. Unsec’d. Notes | | 0.550 | | 09/01/23 | | | 3,000 | | | | 2,898,448 | |
General Electric Co.,
Sr. Unsec’d. Notes, GMTN | | 3.100 | | 01/09/23 | | | 10,000 | | | | 9,976,523 | |
| | | | | | | | | | | | |
| | | | |
| | | | | | | | | | | 12,874,971 | |
| | | | |
Oil & Gas 0.4% | | | | | | | | | | | | |
Exxon Mobil Corp.,
Sr. Unsec’d. Notes | | 1.571 | | 04/15/23 | | | 4,000 | | | | 3,953,825 | |
See Notes to Financial Statements.
PGIM Fixed Income ETFs 53
PGIM Ultra Short Bond ETF
Schedule of Investments (continued)
as of August 31, 2022
| | | | | | | | | | | | |
| | | | |
| Description | | Interest
Rate | | Maturity
Date | | Principal
Amount
(000)# | | | Value | |
| | | | |
CORPORATE BONDS (Continued) | | | | | | | | | | | | |
| | | | |
Oil & Gas (cont’d.) | | | | | | | | | | | | |
Phillips 66,
Gtd. Notes | | 0.900% | | 02/15/24 | | | 4,000 | | | $ | 3,826,895 | |
Pioneer Natural Resources Co.,
Sr. Unsec’d. Notes | | 0.550 | | 05/15/23 | | | 2,500 | | | | 2,440,049 | |
| | | | | | | | | | | | |
| | | | |
| | | | | | | | | | | 10,220,769 | |
| | | | |
Pharmaceuticals 1.6% | | | | | | | | | | | | |
AbbVie, Inc.,
Sr. Unsec’d. Notes, 3 Month LIBOR + 0.650% | | 3.634(c) | | 11/21/22 | | | 3,000 | | | | 3,002,473 | |
AmerisourceBergen Corp.,
Sr. Unsec’d. Notes | | 0.737 | | 03/15/23 | | | 8,066 | | | | 7,924,813 | |
Astrazeneca Finance LLC (United Kingdom),
Gtd. Notes | | 0.700 | | 05/28/24 | | | 12,250 | | | | 11,613,542 | |
Bristol-Myers Squibb Co.,
Sr. Unsec’d. Notes | | 0.537 | | 11/13/23 | | | 10,000 | | | | 9,665,717 | |
GlaxoSmithKline Capital PLC (United Kingdom),
Gtd. Notes | | 0.534 | | 10/01/23 | | | 6,500 | | | | 6,317,230 | |
| | | | | | | | | | | | |
| | | | |
| | | | | | | | | | | 38,523,775 | |
| | | | |
Pipelines 0.9% | �� | | | | | | | | | | | |
Enbridge, Inc. (Canada),
Gtd. Notes | | 0.550 | | 10/04/23 | | | 8,000 | | | | 7,696,743 | |
Southern Natural Gas Co. LLC,
Sr. Unsec’d. Notes, 144A | | 0.625 | | 04/28/23 | | | 5,250 | | | | 5,096,553 | |
TransCanada PipeLines Ltd. (Canada),
Sr. Unsec’d. Notes | | 1.000 | | 10/12/24 | | | 9,750 | | | | 9,087,853 | |
| | | | | | | | | | | | |
| | | | |
| | | | | | | | | | | 21,881,149 | |
| | | | |
Real Estate Investment Trusts (REITs) 0.4% | | | | | | | | | | | | |
Public Storage,
Sr. Unsec’d. Notes, SOFR + 0.470% | | 2.705(c) | | 04/23/24 | | | 8,500 | | | | 8,456,400 | |
| | | | |
Retail 0.4% | | | | | | | | | | | | |
7-Eleven, Inc., | | | | | | | | | | | | |
Sr. Unsec’d. Notes, 144A | | 0.625 | | 02/10/23 | | | 1,750 | | | | 1,724,426 | |
Sr. Unsec’d. Notes, 144A | | 0.800 | | 02/10/24 | | | 2,250 | | | | 2,144,619 | |
See Notes to Financial Statements.
54
PGIM Ultra Short Bond ETF
Schedule of Investments (continued)
as of August 31, 2022
| | | | | | | | | | | | |
| | | | |
| Description | | Interest
Rate | | Maturity
Date | | Principal
Amount
(000)# | | | Value | |
| | | | |
CORPORATE BONDS (Continued) | | | | | | | | | | | | |
| | | | |
Retail (cont’d.) | | | | | | | | | | | | |
Home Depot, Inc. (The),
Sr. Unsec’d. Notes | | 2.700% | | 04/15/25 | | | 6,000 | | | $ | 5,858,121 | |
| | | | | | | | | | | | |
| | | | |
| | | | | | | | | | | 9,727,166 | |
| | | | |
Savings & Loans 0.4% | | | | | | | | | | | | |
Nationwide Building Society (United Kingdom),
Sr. Unsec’d. Notes, 144A | | 0.550 | | 01/22/24 | | | 9,750 | | | | 9,246,589 | |
| | | | |
Semiconductors 1.2% | | | | | | | | | | | | |
Analog Devices, Inc.,
Sr. Unsec’d. Notes, SOFR + 0.250% | | 2.302(c) | | 10/01/24 | | | 2,000 | | | | 1,963,860 | |
Microchip Technology, Inc.,
Sr. Sec’d. Notes | | 0.972 | | 02/15/24 | | | 28,500 | | | | 27,091,464 | |
| | | | | | | | | | | | |
| | | | |
| | | | | | | | | | | 29,055,324 | |
| | | | |
Software 0.7% | | | | | | | | | | | | |
Fidelity National Information Services, Inc.,
Sr. Unsec’d. Notes | | 0.600 | | 03/01/24 | | | 5,750 | | | | 5,451,036 | |
Infor, Inc.,
Sr. Unsec’d. Notes, 144A | | 1.450 | | 07/15/23 | | | 1,200 | | | | 1,164,595 | |
Oracle Corp.,
Sr. Unsec’d. Notes | | 2.500 | | 10/15/22 | | | 9,000 | | | | 8,987,752 | |
| | | | | | | | | | | | |
| | | | |
| | | | | | | | | | | 15,603,383 | |
| | | | |
Telecommunications 1.3% | | | | | | | | | | | | |
NTT Finance Corp. (Japan), | | | | | | | | | | | | |
Gtd. Notes, 144A | | 0.583 | | 03/01/24 | | | 6,500 | | | | 6,181,628 | |
Sr. Unsec’d. Notes, 144A | | 4.142 | | 07/26/24 | | | 3,000 | | | | 3,004,578 | |
Verizon Communications, Inc., | | | | | | | | | | | | |
Sr. Unsec’d. Notes | | 0.750 | | 03/22/24 | | | 8,000 | | | | 7,635,489 | |
Sr. Unsec’d. Notes, SOFR Index + 0.500% | | 2.455(c) | | 03/22/24 | | | 7,000 | | | | 6,945,218 | |
See Notes to Financial Statements.
PGIM Fixed Income ETFs 55
PGIM Ultra Short Bond ETF
Schedule of Investments (continued)
as of August 31, 2022
| | | | | | | | | | | | | | | | |
| | | | |
| Description | | Interest
Rate | | | Maturity
Date | | | Principal
Amount
(000)# | | | Value | |
| | | | |
CORPORATE BONDS (Continued) | | | | | | | | | | | | | | | | |
| | | | |
Telecommunications (cont’d.) | | | | | | | | | | | | | | | | |
Vodafone Group PLC (United Kingdom),
Sr. Unsec’d. Notes | | | 2.500% | | | | 09/26/22 | | | | 8,000 | | | $ | 7,993,950 | |
| | | | | | | | | | | | | | | | |
| | | | |
| | | | | | | | | | | | | | | 31,760,863 | |
| | | | | | | | | | | | | | | | |
| | | | |
TOTAL CORPORATE BONDS
(cost $1,062,724,999) | | | | | | | | | | | | | | | 1,042,047,419 | |
| | | | | | | | | | | | | | | | |
| | | | |
RESIDENTIAL MORTGAGE-BACKED SECURITIES 1.1% | | | | | | | | | | | | | | | | |
Mortgage Repurchase Agreement Financing Trust,
Series 2021-S01, Class A1, 144A, 1 Month LIBOR + 0.500% (Cap N/A, Floor 0.500%) | | | 2.889(c) | | | | 09/10/22 | | | | 17,000 | | | | 16,999,978 | |
Towd Point Mortgage Trust,
Series 2021-SJ01, Class A1, 144A | | | 2.250(cc) | | | | 07/25/68 | | | | 11,375 | | | | 10,796,235 | |
| | | | | | | | | | | | | | | | |
| | | | |
TOTAL RESIDENTIAL MORTGAGE-BACKED SECURITIES
(cost $28,494,349) | | | | | | | | | | | | | | | 27,796,213 | |
| | | | | | | | | | | | | | | | |
| | | | |
TOTAL LONG-TERM INVESTMENTS
(cost $1,861,923,629) | | | | | | | | | | | | | | | 1,822,651,872 | |
| | | | | | | | | | | | | | | | |
| | | | |
SHORT-TERM INVESTMENTS 23.5% | | | | | | | | | | | | | | | | |
| | | | |
CERTIFICATES OF DEPOSIT 6.4% | | | | | | | | | | | | | | | | |
BNP Paribas SA, SOFR + 0.510% | | | 2.800(c) | | | | 09/21/22 | | | | 7,000 | | | | 7,001,338 | |
Citibank NA | | | 3.600 | | | | 02/10/23 | | | | 2,500 | | | | 2,501,055 | |
Credit Agricole Corporate & Investment Bank SA | | | 2.380 | | | | 09/22/22 | | | | 30,000 | | | | 30,000,099 | |
MUFG Bank Ltd. | | | 0.300 | | | | 10/25/22 | | | | 10,000 | | | | 9,966,157 | |
Nordea Bank Abp, | | | | | | | | | | | | | | | | |
SOFR + 0.500% | | | 2.790(c) | | | | 09/09/22 | | | | 15,000 | | | | 15,001,645 | |
SOFR + 0.540% | | | 2.830(c) | | | | 05/26/23 | | | | 15,000 | | | | 15,004,476 | |
Skandinaviska Enskilda Banken AB, SOFR + 0.730% | | | 3.020(c) | | | | 03/17/23 | | | | 15,000 | | | | 15,022,060 | |
Standard Chartered Bank, SOFR + 0.420% | | | 2.710(c) | | | | 07/28/23 | | | | 13,000 | | | | 12,988,105 | |
Sumitomo Mitsui Trust Bank Ltd., SOFR + 0.340% | | | 2.630(c) | | | | 10/13/22 | | | | 25,000 | | | | 25,002,627 | |
Svenska Handelsbanken, SOFR + 0.700% | | | 2.990(c) | | | | 03/15/23 | | | | 25,000 | | | | 25,031,675 | |
| | | | | | | | | | | | | | | | |
| | | | |
TOTAL CERTIFICATES OF DEPOSIT
(cost $157,496,466) | | | | | | | | | | | | | | | 157,519,237 | |
| | | | | | | | | | | | | | | | |
See Notes to Financial Statements.
56
PGIM Ultra Short Bond ETF
Schedule of Investments (continued)
as of August 31, 2022
| | | | | | | | | | | | |
| | | | |
| Description | | Interest
Rate | | Maturity
Date | | Principal
Amount
(000)# | | | Value | |
| | | | |
COMMERCIAL PAPER 14.1% | | | | | | | | | | | | |
Alimentation Couche-Tard, Inc.,
144A | | 2.725%(n) | | 09/13/22 | | | 5,000 | | | $ | 4,995,172 | |
Banco Santander SA,
144A | | 3.291(n) | | 12/01/22 | | | 13,000 | | | | 12,899,835 | |
Bell Canada, | | | | | | | | | | | | |
144A | | 2.706(n) | | 09/08/22 | | | 6,000 | | | | 5,996,779 | |
144A | | 2.716(n) | | 09/16/22 | | | 10,000 | | | | 9,989,044 | |
BNP Paribas SA,
144A, SOFR + 0.420% | | 2.710(c) | | 12/07/22 | | | 20,000 | | | | 20,012,125 | |
Enbridge, Inc., | | | | | | | | | | | | |
144A | | 2.755(n) | | 09/08/22 | | | 3,000 | | | | 2,998,165 | |
144A | | 2.756(n) | | 09/16/22 | | | 14,000 | | | | 13,982,721 | |
Enel Finance America LLC, | | | | | | | | | | | | |
144A | | 3.367(n) | | 09/23/22 | | | 15,000 | | | | 14,974,336 | |
144A | | 3.464(n) | | 09/28/22 | | | 10,000 | | | | 9,978,883 | |
Federation des Caisses Desjardins du Quebec,
144A | | 2.414(n) | | 10/03/22 | | | 25,000 | | | | 24,943,740 | |
Glencore Funding LLC, | | | | | | | | | | | | |
144A | | 2.910(n) | | 09/22/22 | | | 11,000 | | | | 10,981,124 | |
144A | | 2.961(n) | | 09/26/22 | | | 14,000 | | | | 13,971,497 | |
144A | | 2.971(n) | | 09/27/22 | | | 2,000 | | | | 1,995,767 | |
HCP, Inc., | | | | | | | | | | | | |
144A | | 2.758(n) | | 09/21/22 | | | 5,000 | | | | 4,992,145 | |
144A | | 2.819(n) | | 09/27/22 | | | 10,000 | | | | 9,979,465 | |
Hewlett Packard Enterprise Co.,
144A | | 2.754(n) | | 09/16/22 | | | 5,000 | | | | 4,994,164 | |
HP Enterprise Corp.,
144A | | 2.849(n) | | 09/22/22 | | | 7,000 | | | | 6,988,578 | |
Mitsubishi Corp.,
144A | | 2.446(n) | | 09/12/22 | | | 10,000 | | | | 9,992,130 | |
National Australia Bank Ltd.,
144A, SOFR + 0.180% | | 2.450(c) | | 09/01/22 | | | 20,000 | | | | 20,000,105 | |
National Securities Clearing Corp.,
144A | | 2.354(n) | | 09/02/22 | | | 20,000 | | | | 19,997,452 | |
Nutrien Ltd.,
144A | | 2.868(n) | | 09/14/22 | | | 12,000 | | | | 11,987,624 | |
Ontario Teachers’ Finance Trust,
144A | | 3.151(n) | | 01/12/23 | | | 10,000 | | | | 9,876,311 | |
Raytheon Technologies Corp.,
144A | | 3.269(n) | | 10/14/22 | | | 12,000 | | | | 11,957,775 | |
ST Engineering North America, Inc.,
144A | | 2.871(n) | | 11/07/22 | | | 15,000 | | | | 14,917,437 | |
See Notes to Financial Statements.
PGIM Fixed Income ETFs 57
PGIM Ultra Short Bond ETF
Schedule of Investments (continued)
as of August 31, 2022
| | | | | | | | | | | | |
| | | | |
| Description | | Interest
Rate | | Maturity
Date | | Principal
Amount
(000)# | | | Value | |
| | | | |
COMMERCIAL PAPER (Continued) | | | | | | | | | | | | |
Swedbank AB, SOFR + 0.410% | | 2.700%(c) | | 11/14/22 | | | 20,000 | | | $ | 20,004,333 | |
TransCanada PipeLines Ltd.,
144A | | 2.755(n) | | 09/06/22 | | | 10,000 | | | | 9,995,735 | |
UDR, Inc.,
144A | | 2.726(n) | | 09/07/22 | | | 4,000 | | | | 3,998,009 | |
Virginia Electric & Power Co.,
144A | | 2.655(n) | | 09/12/22 | | | 10,000 | | | | 9,991,863 | |
Waste Management, Inc.,
144A | | 0.305(n) | | 09/09/22 | | | 6,500 | | | | 6,495,822 | |
Welltower, Inc., | | | | | | | | | | | | |
144A | | 2.736(n) | | 09/01/22 | | | 10,000 | | | | 9,999,291 | |
144A | | 2.856(n) | | 09/26/22 | | | 10,000 | | | | 9,980,500 | |
| | | | | | | | | | | | |
| | | | |
TOTAL COMMERCIAL PAPER
(cost $343,838,778) | | | | | | | | | | | 343,867,927 | |
| | | | | | | | | | | | |
| | | | |
| | | | | | | Shares | | | | |
| | | | |
UNAFFILIATED FUND 3.0% | | | | | | | | | | | | |
Dreyfus Government Cash Management (Institutional Shares)
(cost $72,118,129) | | | | | | | 72,118,129 | | | | 72,118,129 | |
| | | | | | | | | | | | |
| | | | |
TOTAL SHORT-TERM INVESTMENTS
(cost $573,453,373) | | | | | | | | | | | 573,505,293 | |
| | | | | | | | | | | | |
| | | | |
TOTAL INVESTMENTS 98.1%
(cost $2,435,377,002) | | | | | | | | | | | 2,396,157,165 | |
Other assets in excess of liabilities(z) 1.9% | | | | | | | | | | | 46,168,289 | |
| | | | | | | | | | | | |
| | | | |
NET ASSETS 100.0% | | | | | | | | | | $ | 2,442,325,454 | |
| | | | | | | | | | | | |
See the Glossary for a list of the abbreviation(s) used in the annual report.
| # | Principal or notional amount is shown in U.S. dollars unless otherwise stated. |
| (c) | Variable rate instrument. The interest rate shown reflects the rate in effect at August 31, 2022. |
| (cc) | Variable rate instrument. The rate shown is based on the latest available information as of August 31, 2022. Certain variable rate securities are not based on a published reference rate and spread but are determined by the issuer or agent and are based on current market conditions. These securities do not indicate a reference rate and spread in their description. |
| (f) | Indicates a restricted security that is acquired in unregistered, private sales from the issuing company or from an affiliate of the issuer and is considered restricted as to disposition under federal securities law; the aggregate original cost of such securities is $15,000,000. The aggregate value of $14,757,000 is 0.6% of net assets. |
See Notes to Financial Statements.
58
PGIM Ultra Short Bond ETF
Schedule of Investments (continued)
as of August 31, 2022
| (ff) | Variable rate security. Security may be issued at a fixed coupon rate, which converts to a variable rate at a specified date. Rate shown is the rate in effect as of period end. |
| (n) | Rate shown reflects yield to maturity at purchased date. |
| (r) | Principal or notional amount is less than $500 par. |
| (z) | Includes net unrealized appreciation/(depreciation) and/or market value of the below holdings which are excluded from the Schedule of Investments: |
Futures contracts outstanding at August 31, 2022:
| | | | | | | | | | | | | | | | | | | | | | | | | |
Number
of
Contracts | | | | Type | | | | Expiration
Date | | | | Current
Notional
Amount | | | | Value /
Unrealized
Appreciation
(Depreciation) |
Short Position: | | | | | | | | | | | | | | | | | | | | | |
20 2 Year U.S. Treasury Notes | | | | | | Dec. 2022 | | | | | | | $4,166,563 | | | | | | | $11,093 | |
| | | | | | | | | | | | | | | | | | | | | | | | | |
Interest rate swap agreements outstanding at August 31, 2022:
| | | | | | | | | | | | | | | | | | | | | | | | | | | | | | | | |
Notional
Amount
(000)# | | | | Termination
Date | | | | | Fixed
Rate | | | | Floating Rate | | | | Value at
Trade Date | | | | | Value at
August 31,
2022 | | | | | Unrealized
Appreciation
(Depreciation) | |
Centrally Cleared Interest Rate Swap Agreements: | | | | | | | | | | | | | | | | |
19,000 | | | | | 09/03/22 | | | | | 1.919%(S) | | | | 3 Month LIBOR(1)(Q) | | | | $ | (617 | ) | | | | $ | (155,777 | ) | | | | $ | (155,160 | ) |
2,000 | | | | | 12/10/22 | | | | | 0.362%(S) | | | | 1 Day USOIS(1)(A) | | | | | 3 | | | | | | 22,041 | | | | | | 22,038 | |
7,000 | | | | | 01/14/23 | | | | | (0.006)%(S) | | | | 1 Day USOIS(1)(A) | | | | | 25 | | | | | | 127,708 | | | | | | 127,683 | |
25,000 | | | | | 01/30/23 | | | | | 1.467%(S) | | | | 3 Month LIBOR(1)(Q) | | | | | (3,459 | ) | | | | | 202,464 | | | | | | 205,923 | |
5,000 | | | | | 04/13/23 | | | | | (0.013)%(S) | | | | 1 Day USOIS(1)(A) | | | | | 36 | | | | | | 137,212 | | | | | | 137,176 | |
8,560 | | | | | 05/11/23 | | | | | 2.250%(S) | | | | 1 Day USOIS(1)(A) | | | | | (146,332 | ) | | | | | 59,943 | | | | | | 206,275 | |
18,000 | | | | | 06/07/23 | | | | | 0.148%(S) | | | | 1 Day USOIS(1)(A) | | | | | 73 | | | | | | 540,358 | | | | | | 540,285 | |
75,000 | | | | | 07/26/23 | | | | | 0.192%(S) | | | | 1 Day USOIS(1)(A) | | | | | 143 | | | | | | 2,454,916 | | | | | | 2,454,773 | |
11,000 | | | | | 09/06/23 | | | | | 2.114%(S) | | | | 1 Day SOFR(1)(A) | | | | | 125 | | | | | | 128,369 | | | | | | 128,244 | |
4,000 | | | | | 09/11/23 | | | | | 1.423%(S) | | | | 1 Day SOFR(1)(A) | | | | | 109 | | | | | | 83,286 | | | | | | 83,177 | |
8,000 | | | | | 10/01/23 | | | | | 0.251%(S) | | | | 1 Day SOFR(1)(A) | | | | | 91 | | | | | | 313,843 | | | | | | 313,752 | |
10,000 | | | | | 12/01/23 | | | | | 2.634%(S) | | | | 1 Day SOFR(1)(A) | | | | | 136 | | | | | | 85,912 | | | | | | 85,776 | |
5,000 | | | | | 12/07/23 | | | | | 0.221%(S) | | | | 1 Day USOIS(1)(A) | | | | | 81 | | | | | | 234,966 | | | | | | 234,885 | |
8,750 | | | | | 02/04/24 | | | | | 0.133%(S) | | | | 1 Day USOIS(1)(A) | | | | | 4,873 | | | | | | 474,039 | | | | | | 469,166 | |
19,500 | | | | | 03/01/24 | | | | | 0.230%(S) | | | | 1 Day USOIS(1)(A) | | | | | 12,083 | | | | | | 1,062,774 | | | | | | 1,050,691 | |
28,500 | | | | | 03/01/24 | | | | | 2.478%(S) | | | | 1 Day SOFR(1)(A) | | | | | 214 | | | | | | 416,252 | | | | | | 416,038 | |
46,000 | | | | | 03/09/24 | | | | | 1.440%(S) | | | | 1 Day SOFR(1)(A) | | | | | 24,506 | | | | | | 1,416,784 | | | | | | 1,392,278 | |
8,000 | | | | | 03/15/24 | | | | | 0.276%(S) | | | | 1 Day USOIS(1)(A) | | | | | 86 | | | | | | 436,482 | | | | | | 436,396 | |
23,000 | | | | | 03/15/24 | | | | | 1.658%(S) | | | | 1 Day SOFR(1)(A) | | | | | 154 | | | | | | 620,248 | | | | | | 620,094 | |
7,000 | | | | | 03/18/24 | | | | | 0.278%(S) | | | | 1 Day USOIS(1)(A) | | | | | 85 | | | | | | 376,338 | | | | | | 376,253 | |
12,500 | | | | | 03/25/24 | | | | | 2.055%(S) | | | | 1 Day SOFR(1)(A) | | | | | 139 | | | | | | 250,530 | | | | | | 250,391 | |
68,000 | | | | | 03/31/24 | | | | | 2.305%(S) | | | | 1 Day SOFR(1)(A) | | | | | 211,085 | | | | | | 1,060,562 | | | | | | 849,477 | |
3,000 | | | | | 04/26/24 | | | | | 0.305%(S) | | | | 1 Day USOIS(1)(A) | | | | | 86 | | | | | | 171,998 | | | | | | 171,912 | |
11,250 | | | | | 05/11/24 | | | | | 0.300%(S) | | | | 1 Day SOFR(1)(A) | | | | | (984 | ) | | | | | 652,991 | | | | | | 653,975 | |
15,000 | | | | | 05/11/24 | | | | | 2.603%(S) | | | | 1 Day SOFR(1)(A) | | | | | (11,883 | ) | | | | | 197,061 | | | | | | 208,944 | |
16,750 | | | | | 05/20/24 | | | | | 0.296%(S) | | | | 1 Day USOIS(1)(A) | | | | | 107 | | | | | | 993,572 | | | | | | 993,465 | |
See Notes to Financial Statements.
PGIM Fixed Income ETFs 59
PGIM Ultra Short Bond ETF
Schedule of Investments (continued)
as of August 31, 2022
Interest rate swap agreements outstanding at August 31, 2022 (continued):
| | | | | | | | | | | | | | | | | | | | | | | | | | | | | | | | | | |
Notional
Amount
(000)# | | | | Termination
Date | | | | | Fixed
Rate | | | | | Floating Rate | | | | Value at
Trade Date | | | | | Value at
August 31,
2022 | | | | | Unrealized
Appreciation
(Depreciation) | |
Centrally Cleared Interest Rate Swap Agreements (cont’d.): | | | | | | | | | | |
| 10,900 | | | | | 06/07/24 | | | | | | 0.318%(S) | | | | | 1 Day USOIS(1)(A) | | | | $ | 103 | | | | | $ | 653,865 | | | | | $ | 653,762 | |
| 12,750 | | | | | 06/16/24 | | | | | | 0.304%(S) | | | | | 1 Day USOIS(1)(A) | | | | | 107 | | | | | | 775,964 | | | | | | 775,857 | |
| 15,000 | | | | | 08/05/24 | | | | | | 0.261%(S) | | | | | 1 Day SOFR(1)(A) | | | | | 118 | | | | | | 939,967 | | | | | | 939,849 | |
| 29,000 | | | | | 08/08/24 | | | | | | 2.512%(S) | | | | | 1 Day SOFR(1)(A) | | | | | 166,045 | | | | | | 557,070 | | | | | | 391,025 | |
| 3,000 | | | | | 08/13/24 | | | | | | 0.368%(S) | | | | | 1 Day SOFR(1)(A) | | | | | 102 | | | | | | 181,949 | | | | | | 181,847 | |
| 8,000 | | | | | 08/31/24 | | | | | | 0.399%(S) | | | | | 1 Day USOIS(1)(A) | | | | | 107 | | | | | | 487,841 | | | | | | 487,734 | |
| 12,500 | | | | | 09/01/24 | | | | | | 2.500%(S) | | | | | 1 Day SOFR(1)(A) | | | | | 4,344 | | | | | | 216,232 | | | | | | 211,888 | |
| 4,500 | | | | | 09/09/24 | | | | | | 0.368%(S) | | | | | 1 Day SOFR(1)(A) | | | | | (11 | ) | | | | | 284,465 | | | | | | 284,476 | |
| 46,500 | | | | | 09/09/24 | | | | | | 1.484%(S) | | | | | 1 Day SOFR(1)(A) | | | | | 60,524 | | | | | | 1,753,954 | | | | | | 1,693,430 | |
| 9,750 | | | | | 10/12/24 | | | | | | 0.511%(S) | | | | | 1 Day SOFR(1)(A) | | | | | 172 | | | | | | 600,244 | | | | | | 600,072 | |
| 12,000 | | | | | 03/21/25 | | | | | | 1.998%(S) | | | | | 1 Day SOFR(1)(A) | | | | | 150 | | | | | | 370,594 | | | | | | 370,444 | |
| 83,500 | | | | | 03/30/25 | | | | | | 2.418%(S) | | | | | 1 Day SOFR(1)(A) | | | | | 343,744 | | | | | | 1,623,949 | | | | | | 1,280,205 | |
| 16,000 | | | | | 05/11/25 | | | | | | 0.450%(S) | | | | | 1 Day SOFR(1)(A) | | | | | 13,855 | | | | | | 1,260,404 | | | | | | 1,246,549 | |
| 18,750 | | | | | 06/29/25 | | | | | | 3.083%(S) | | | | | 1 Day SOFR(1)(A) | | | | | — | | | | | | 105,272 | | | | | | 105,272 | |
| 57,000 | | | | | 06/29/25 | | | | | | 3.086%(S) | | | | | 1 Day SOFR(1)(A) | | | | | (509,702 | ) | | | | | 318,215 | | | | | | 827,917 | |
| 53,250 | | | | | 08/17/25 | | | | | | 2.957%(S) | | | | | 1 Day SOFR(1)(A) | | | | | 115,302 | | | | | | 555,765 | | | | | | 440,463 | |
| | | | | | | | | | | | | | | | | | | | | | | | | | | | | | | | | | |
| | | | | | | | | | | | | | | | | | | | $ | 285,925 | | | | | $ | 23,050,622 | | | | | $ | 22,764,697 | |
| | | | | | | | | | | | | | | | | | | | | | | | | | | | | | | | | | |
| (1) | The Fund pays the fixed rate and receives the floating rate. |
| (2) | The Fund pays the floating rate and receives the fixed rate. |
Summary of Collateral for Centrally Cleared/Exchange-traded Derivatives:
Cash and securities segregated as collateral, including pending settlement for closed positions, to cover requirements for centrally cleared/exchange-traded derivatives are listed by broker as follows:
| | | | | | | | | | |
Broker | | Cash and/or Foreign Currency | | Securities Market Value |
| | |
Citigroup Global Markets, Inc. | | | $ | 11,142,000 | | | | $ | — | |
| | | | | | | | | | |
See Notes to Financial Statements.
60
PGIM Ultra Short Bond ETF
Schedule of Investments (continued)
as of August 31, 2022
Fair Value Measurements:
Various inputs are used in determining the value of the Fund’s investments. These inputs are summarized in the three broad levels listed below.
Level 1—unadjusted quoted prices generally in active markets for identical securities.
Level 2—quoted prices for similar securities, interest rates and yield curves, prepayment speeds, foreign currency exchange rates and other observable inputs.
Level 3—unobservable inputs for securities valued in accordance with Board approved fair valuation procedures.
The following is a summary of the inputs used as of August 31, 2022 in valuing such portfolio securities:
| | | | | | | | | | | | | | | |
| | | Level 1 | | Level 2 | | Level 3 |
Investments in Securities | | | | | | | | | | | | | | | |
Assets | | | | | | | | | | | | | | | |
Long-Term Investments | | | | | | | | | | | | | | | |
Asset-Backed Securities | | | | | | | | | | | | | | | |
Automobiles | | | $ | — | | | | $ | 36,411,899 | | | | | $— | |
Collateralized Loan Obligations | | | | — | | | | | 361,926,126 | | | | | — | |
Consumer Loans | | | | — | | | | | 1,279,504 | | | | | — | |
Equipment | | | | — | | | | | 10,829,847 | | | | | — | |
Certificate of Deposit | | | | — | | | | | 14,947,563 | | | | | — | |
Commercial Mortgage-Backed Securities | | | | — | | | | | 327,413,301 | | | | | — | |
Corporate Bonds | | | | — | | | | | 1,042,047,419 | | | | | — | |
Residential Mortgage-Backed Securities | | | | — | | | | | 27,796,213 | | | | | — | |
Short-Term Investments | | | | | | | | | | | | | | | |
Certificates of Deposit | | | | — | | | | | 157,519,237 | | | | | — | |
Commercial Paper | | | | — | | | | | 343,867,927 | | | | | — | |
Unaffiliated Fund | | | | 72,118,129 | | | | | — | | | | | — | |
| | | | | | | | | | | | | | | |
Total | | | $ | 72,118,129 | | | | $ | 2,324,039,036 | | | | | $— | |
| | | | | | | | | | | | | | | |
| | | |
Other Financial Instruments* | | | | | | | | | | | | | | | |
Assets | | | | | | | | | | | | | | | |
Futures Contracts | | | $ | 11,093 | | | | $ | — | | | | | $— | |
Centrally Cleared Interest Rate Swap Agreements | | | | — | | | | | 22,919,857 | | | | | — | |
| | | | | | | | | | | | | | | |
Total | | | $ | 11,093 | | | | $ | 22,919,857 | | | | | $— | |
| | | | | | | | | | | | | | | |
| | | |
Liabilities | | | | | | | | | | | | | | | |
Centrally Cleared Interest Rate Swap Agreement | | | $ | — | | | | $ | (155,160 | ) | | | | $— | |
| | | | | | | | | | | | | | | |
| * | Other financial instruments are derivative instruments not reflected in the Schedule of Investments, such as futures, forwards and centrally cleared swap contracts, which are recorded at the unrealized appreciation (depreciation) on the instrument, and OTC swap contracts which are recorded at fair value. |
See Notes to Financial Statements.
PGIM Fixed Income ETFs 61
PGIM Ultra Short Bond ETF
Schedule of Investments (continued)
as of August 31, 2022
Industry Classification:
The industry classification of investments and other assets in excess of liabilities shown as a percentage of net assets as of August 31, 2022 were as follows:
| | | | |
Collateralized Loan Obligations | | | 14.8 | % |
Commercial Paper | | | 14.1 | |
Commercial Mortgage-Backed Securities | | | 13.4 | |
Banks | | | 11.0 | |
Certificates of Deposit | | | 7.0 | |
Electric | | | 4.7 | |
Insurance | | | 4.0 | |
Auto Manufacturers | | | 3.8 | |
Unaffiliated Fund | | | 3.0 | |
Diversified Financial Services | | | 2.3 | |
Pharmaceuticals | | | 1.6 | |
Beverages | | | 1.5 | |
Healthcare-Products | | | 1.5 | |
Automobiles | | | 1.5 | |
Telecommunications | | | 1.3 | |
Semiconductors | | | 1.2 | |
Residential Mortgage-Backed Securities | | | 1.1 | |
Machinery-Construction & Mining | | | 1.0 | |
Pipelines | | | 0.9 | |
Software | | | 0.7 | |
Miscellaneous Manufacturing | | | 0.5 | |
Cosmetics/Personal Care | | | 0.5 | |
Machinery-Diversified | | | 0.5 | |
Chemicals | | | 0.5 | |
Household Products/Wares | | | 0.5 | |
| | | | |
Agriculture | | | 0.5 | % |
Equipment | | | 0.4 | |
Oil & Gas | | | 0.4 | |
Aerospace & Defense | | | 0.4 | |
Retail | | | 0.4 | |
Savings & Loans | | | 0.4 | |
Real Estate Investment Trusts (REITs) | | | 0.4 | |
Foods | | | 0.3 | |
Iron/Steel | | | 0.3 | |
Entertainment | | | 0.3 | |
Forest Products & Paper | | | 0.3 | |
Healthcare-Services | | | 0.3 | |
Gas | | | 0.2 | |
Computers | | | 0.2 | |
Media | | | 0.1 | |
Building Materials | | | 0.1 | |
Biotechnology | | | 0.1 | |
Consumer Loans | | | 0.1 | |
| | | | |
| | | 98.1 | |
Other assets in excess of liabilities | | | 1.9 | |
| | | | |
| |
| | | 100.0 | % |
| | | | |
Effects of Derivative Instruments on the Financial Statements and Primary Underlying Risk Exposure:
The Fund invested in derivative instruments during the reporting period. The primary type of risk associated with these derivative instruments is interest rate contracts risk. See the Notes to Financial Statements for additional detail regarding these derivative instruments and their risks. The effect of such derivative instruments on the Fund’s financial position and financial performance as reflected in the Statement of Assets and Liabilities and Statement of Operations is presented in the summary below.
See Notes to Financial Statements.
62
PGIM Ultra Short Bond ETF
Schedule of Investments (continued)
as of August 31, 2022
Fair values of derivative instruments as of August 31, 2022 as presented in the Statement of Assets and Liabilities:
| | | | | | | | | | | | |
| | | Asset Derivatives | | | Liability Derivatives | |
| | | | |
Derivatives not accounted for
as hedging instruments,
carried at fair value | | Statement
of Assets and
Liabilities Location | | Fair
Value | | | Statement of
Assets and
Liabilities Location | | Fair
Value | |
Interest rate contracts | | Due from/to broker-variation margin futures | | $ | 11,093* | | | — | | $ | — | |
Interest rate contracts | | Due from/to broker-variation margin swaps | | | 22,919,857 | * | | Due from/to broker-variation margin swaps | | | 155,160 | * |
| | | | | | | | | | | | |
| | | | $ | 22,930,950 | | | | | $ | 155,160 | |
| | | | | | | | | | | | |
| * | Includes cumulative appreciation (depreciation) as reported in the schedule of open futures and centrally cleared swap contracts. Only unsettled variation margin receivable (payable) is reported within the Statement of Assets and Liabilities. |
The effects of derivative instruments on the Statement of Operations for the year ended August 31, 2022 are as follows:
| | | | | | | | |
Amount of Realized Gain (Loss) on Derivatives Recognized in Income | |
Derivatives not accounted for as hedging instruments, carried at fair value | | Futures | | | Swaps | |
Interest rate contracts | | $ | 239,957 | | | $ | (873,996 | ) |
| | | | | | | | |
| | | | | | | | |
Change in Unrealized Appreciation (Depreciation) on Derivatives Recognized in Income | |
Derivatives not accounted for as hedging instruments, carried at fair value | | Futures | | | Swaps | |
Interest rate contracts | | $ | 15,808 | | | $ | 25,059,273 | |
| | | | | | | | |
For the year ended August 31, 2022, the Fund’s average volume of derivative activities is as follows:
| | | | |
| Derivative Contract Type | | Average Volume of Derivative Activities* |
Futures Contracts - Short Positions (1) | | $ 5,602,317 |
Interest Rate Swap Agreements (1) | | 572,897,000 |
| * | Average volume is based on average quarter end balances as noted for the year ended August 31, 2022. |
| (1) | Notional Amount in USD. |
See Notes to Financial Statements.
PGIM Fixed Income ETFs 63
PGIM Ultra Short Bond ETF
Statement of Assets & Liabilities
as of August 31, 2022
| | | | |
Assets | | | | |
| |
Unaffiliated investments (cost $2,435,377,002) | | $ | 2,396,157,165 | |
Receivable for Fund shares sold | | | 38,103,760 | |
Deposit with broker for centrally cleared/exchange-traded derivatives | | | 11,142,000 | |
Dividends and interest receivable | | | 7,271,017 | |
Due from former custodian | | | 5,582,418 | |
Tax reclaim receivable | | | 4,097 | |
Other assets | | | 542,678 | |
| | | | |
| |
Total Assets | | | 2,458,803,135 | |
| | | | |
| |
Liabilities | | | | |
| |
Payable for Fund shares purchased | | | 15,979,376 | |
Management fee payable | | | 305,078 | |
Due to broker—variation margin swaps | | | 192,446 | |
Due to broker—variation margin futures | | | 781 | |
| | | | |
| |
Total Liabilities | | | 16,477,681 | |
| | | | |
| |
Net Assets | | $ | 2,442,325,454 | |
| | | | |
| | | | |
| | |
Net assets were comprised of: | | | | |
Common Stock, at par | | $ | 49,675 | |
Paid-in capital in excess of par | | | 2,478,598,809 | |
Total distributable earnings (loss) | | | (36,323,030 | ) |
| | | | |
| |
Net assets, August 31, 2022 | | $ | 2,442,325,454 | |
| | | | |
| |
Net asset value, offering price and redemption price per share, ($2,442,325,454 ÷ 49,675,000 shares of common stock issued and outstanding) | | $ | 49.17 | |
| | | | |
See Notes to Financial Statements.
64
PGIM Ultra Short Bond ETF
Statement of Operations
Year Ended August 31, 2022
| | | | |
Net Investment Income (Loss) | | | | |
| |
Income | | | | |
Interest income (net of $4,230 foreign withholding tax) | | $ | 31,219,401 | |
Unaffiliated dividend income | | | 598,617 | |
Affiliated dividend income | | | 30,823 | |
Income from securities lending, net (including affiliated income of $426) | | | 1,323 | |
| | | | |
| |
Total income | | | 31,850,164 | |
| | | | |
| |
Expenses | | | | |
Management fee | | | 3,402,205 | |
| | | | |
| |
Net investment income (loss) | | | 28,447,959 | |
| | | | |
| |
Realized And Unrealized Gain (Loss) On Investment And Foreign Currency Transactions | | | | |
| |
Net realized gain (loss) on: | | | | |
Investment transactions (including affiliated of $(1,124)) | | | (3,838,267 | ) |
Futures transactions | | | 239,957 | |
Swap agreement transactions | | | (873,996 | ) |
Foreign currency transactions | | | (3 | ) |
| | | | |
| |
| | | (4,472,309 | ) |
| | | | |
Net change in unrealized appreciation (depreciation) on: | | | | |
Investments (including affiliated of $600) | | | (42,916,547 | ) |
Futures | | | 15,808 | |
Swap agreements | | | 25,059,273 | |
Foreign currencies | | | 4 | |
| | | | |
| |
| | | (17,841,462 | ) |
| | | | |
| |
Net gain (loss) on investment and foreign currency transactions | | | (22,313,771 | ) |
| | | | |
| |
Net Increase (Decrease) In Net Assets Resulting From Operations | | $ | 6,134,188 | |
| | | | |
See Notes to Financial Statements.
PGIM Fixed Income ETFs 65
PGIM Ultra Short Bond ETF
Statements of Changes in Net Assets
| | | | | | | | | | | | |
| | |
| | | Year Ended
August 31, | | | | |
| | | |
| | | 2022 | | | 2021 | | | | |
Increase (Decrease) in Net Assets | | | | | | | | | | | | |
| | | |
Operations | | | | | | | | | | | | |
Net investment income (loss) | | $ | 28,447,959 | | | $ | 16,827,976 | | | | | |
Net realized gain (loss) on investment and foreign currency transactions | | | (4,472,309 | ) | | | (4,807,851 | ) | | | | |
Net change in unrealized appreciation (depreciation) on investments and foreign currencies | | | (17,841,462 | ) | | | 68,868 | | | | | |
| | | | | | | | | | | | |
| | | |
Net increase (decrease) in net assets resulting from operations | | | 6,134,188 | | | | 12,088,993 | | | | | |
| | | | | | | | | | | | |
| | | |
Dividends and Distributions | | | | | | | | | | | | |
Distributions from distributable earnings | | | (29,966,721 | ) | | | (18,216,405 | ) | | | | |
| | | | | | | | | | | | |
| | | |
Fund share transactions | | | | | | | | | | | | |
Net proceeds from shares sold (29,900,000 and 18,775,000 shares, respectively) | | | 1,471,938,881 | | | | 934,975,118 | | | | | |
Cost of shares purchased (17,975,000 and 1,850,000 shares, respectively) | | | (882,319,618 | ) | | | (92,197,152 | ) | | | | |
| | | | | | | | | | | | |
Net increase (decrease) in net assets from Fund share transactions | | | 589,619,263 | | | | 842,777,966 | | | | | |
| | | | | | | | | | | | |
| | | |
Total increase (decrease) | | | 565,786,730 | | | | 836,650,554 | | | | | |
| | | |
Net Assets: | | | | | | | | | | | | |
| | | | |
Beginning of year | | | 1,876,538,724 | | | | 1,039,888,170 | | | | | |
| | | | | | | | | | | | |
| | | |
End of year | | $ | 2,442,325,454 | | | $ | 1,876,538,724 | | | | | |
| | | | | | | | | | | | |
See Notes to Financial Statements.
66
PGIM Ultra Short Bond ETF
Financial Highlights
| | | | | | | | | | | | | | | | | | | | | | | | | | | | |
| | | | | |
| | | Year Ended August 31, | | | April 05, 2018(a) through August 31, 2018 | |
| | | 2022 | | | 2021 | | | 2020 | | | 2019 | |
| | | | | | | | |
| Per Share Operating Performance(b): | | | | | | | | | | | | | | | | | | | | | | | | | | | | |
| Net Asset Value, Beginning of Period | | | $49.71 | | | | $49.93 | | | | $50.15 | | | | $50.12 | | | | | | | | $50.00 | | | | | |
| Income (loss) from investment operations: | | | | | | | | | | | | | | | | | | | | | | | | | | | | |
| Net investment income (loss) | | | 0.62 | | | | 0.64 | | | | 1.06 | | | | 1.40 | | | | | | | | 0.53 | | | | | |
| Net realized and unrealized gain (loss) on investment transactions | | | (0.52 | ) | | | (0.15 | ) | | | (0.08 | ) | | | (0.02 | ) | | | | | | | 0.01 | | | | | |
| Total from investment operations | | | 0.10 | | | | 0.49 | | | | 0.98 | | | | 1.38 | | | | | | | | 0.54 | | | | | |
| Less Dividends and Distributions: | | | | | | | | | | | | | | | | | | | | | | | | | | | | |
| Dividends from net investment income | | | (0.64 | ) | | | (0.71 | ) | | | (1.20 | ) | | | (1.35 | ) | | | | | | | (0.42 | ) | | | | |
| Net asset value, end of period | | | $49.17 | | | | $49.71 | | | | $49.93 | | | | $50.15 | | | | | | | | $50.12 | | | | | |
| Total Return(c): | | | 0.21 | % | | | 0.98 | % | | | 1.99 | % | | | 2.80 | % | | | | | | | 1.08 | % | | | | |
| | | | | | | | |
| | | | | | | | | | | | | | | | | | | | | | | | | | | | | |
| | | | | | | | |
| Ratios/Supplemental Data: | | | | | | | | | | | | | | | | | | | | | | | | | | | | |
| Net assets, end of period (000) | | | $2,442,325 | | | | $1,876,539 | | | | $1,039,888 | | | | $562,990 | | | | | | | | $52,627 | | | | | |
| Average net assets (000) | | | $2,267,793 | | | | $1,320,282 | | | | $883,274 | | | | $246,678 | | | | | | | | $33,209 | | | | | |
| Ratios to average net assets(d): | | | | | | | | | | | | | | | | | | | | | | | | | | | | |
| Expenses after waivers and/or expense reimbursement | | | 0.15 | % | | | 0.15 | % | | | 0.15 | % | | | 0.15 | % | | | | | | | 0.15 | %(e) | | | | |
| Expenses before waivers and/or expense reimbursement | | | 0.15 | % | | | 0.15 | % | | | 0.15 | % | | | 0.15 | % | | | | | | | 0.15 | %(e) | | | | |
| Net investment income (loss) | | | 1.25 | % | | | 1.27 | % | | | 2.12 | % | | | 2.77 | % | | | | | | | 2.58 | %(e) | | | | |
| Portfolio turnover rate(f) | | | 9 | % | | | 10 | % | | | 47 | % | | | 7 | % | | | | | | | 145 | % | | | | |
| (a) | Commencement of operations. |
| (b) | Calculated based on average shares outstanding during the period. |
| (c) | Total return is calculated assuming a purchase of a share on the first day and a sale on the last day of each period reported and includes reinvestment of dividends and distributions, if any. Total returns may reflect adjustments to conform to GAAP. Total returns for periods less than one full year are not annualized. |
| (d) | Does not include expenses of the underlying funds in which the Fund invests. |
| (f) | The Fund’s portfolio turnover rate is calculated in accordance with regulatory requirements, without regard to transactions involving short-term investments, certain derivatives and in-kind transactions (if any). If such transactions were included, the Fund’s portfolio turnover rate may be higher. |
See Notes to Financial Statements.
PGIM Fixed Income ETFs 67
PGIM Active High Yield Bond ETF
Schedule of Investments
as of August 31, 2022
| | | | | | | | | | | | |
| | | | |
| Description | | Interest
Rate | | Maturity
Date | | Principal
Amount (000)# | | | Value | |
| | | | |
LONG-TERM INVESTMENTS 96.2% | | | | | | | | | | | | |
| | | | |
ASSET-BACKED SECURITIES 3.3% | | | | | | | | | | | | |
| | | | |
Collateralized Loan Obligations | | | | | | | | | | | | |
| | | | |
Carlyle Global Market Strategies CLO Ltd. (Cayman Islands), | | | | | | | | | | | | |
Series 2015-05A, Class A1RR, 144A, 3 Month LIBOR + 1.080% (Cap N/A, Floor 1.080%) | | 3.790%(c) | | 01/20/32 | | | 750 | | | $ | 734,250 | |
Madison Park Funding Ltd. (Cayman Islands), | | | | | | | | | | | | |
Series 2019-33A, Class AR, 144A, 3 Month SOFR + 1.290% (Cap N/A, Floor 1.290%) | | 3.618(c) | | 10/15/32 | | | 1,000 | | | | 987,029 | |
Race Point CLO Ltd. (Cayman Islands), | | | | | | | | | | | | |
Series 2013-08A, Class AR2, 144A, 3 Month LIBOR + 1.040% (Cap N/A, Floor 1.040%) | | 4.024(c) | | 02/20/30 | | | 712 | | | | 702,734 | |
Voya CLO Ltd. (Cayman Islands), | | | | | | | | | | | | |
Series 2014-02A, Class A1RR, 144A, 3 Month LIBOR + 1.020% (Cap N/A, Floor 1.020%) | | 3.760(c) | | 04/17/30 | | | 740 | | | | 732,311 | |
| | | | | | | | | | | | |
| | | | |
TOTAL ASSET-BACKED SECURITIES
(cost $3,176,239) | | | | | | | | | | | 3,156,324 | |
| | | | | | | | | | | | |
| | | | |
BANK LOANS 1.9% | | | | | | | | | | | | |
| | | | |
Airlines 0.1% | | | | | | | | | | | | |
| | | | |
United Airlines, Inc., | | | | | | | | | | | | |
Class B Term Loan, 3 Month LIBOR + 3.750% | | 6.533(c) | | 04/21/28 | | | 153 | | | | 147,870 | |
| | | | |
Chemicals 0.0% | | | | | | | | | | | | |
| | | | |
TPC Group, Inc., | | | | | | | | | | | | |
DIP Facility, 3 Month SOFR + 10.000%^ | | 10.051(c) | | 03/01/23 | | | 16 | | | | 15,527 | |
| | | | |
Electric 0.1% | | | | | | | | | | | | |
| | | | |
Heritage Power LLC, | | | | | | | | | | | | |
Term Loan B, 3 Month LIBOR + 6.000% | | 8.806(c) | | 07/30/26 | | | 141 | | | | 55,334 | |
| | | | |
Insurance 0.2% | | | | | | | | | | | | |
| | | | |
Asurion LLC, | | | | | | | | | | | | |
New B-4 Term Loan, 1 Month LIBOR + 5.250% | | 7.622(c) | | 01/20/29 | | | 225 | | | | 190,969 | |
See Notes to Financial Statements.
68
PGIM Active High Yield Bond ETF
Schedule of Investments (continued)
as of August 31, 2022
| | | | | | | | | | | | | | | | |
| | | | |
| Description | | Interest
Rate | | | Maturity
Date | | | Principal
Amount (000)# | | | Value | |
| | | | |
BANK LOANS (Continued) | | | | | | | | | | | | | | | | |
| | | | |
Media 0.1% | | | | | | | | | | | | | | | | |
| | | | |
Diamond Sports Group LLC, | | | | | | | | | | | | | | | | |
First Lien Term Loan, 1 Month SOFR + 8.000% | | | 10.387%(c) | | | | 05/25/26 | | | | 140 | | | $ | 131,857 | |
Second Lien Term Loan, 1 Month SOFR + 3.350% | | | 5.637(c) | | | | 08/24/26 | | | | 40 | | | | 7,134 | |
| | | | | | | | | | | | | | | | |
| | | | |
| | | | | | | | | | | | | | | 138,991 | |
| | | | |
Oil & Gas 0.2% | | | | | | | | | | | | | | | | |
| | | | |
Ascent Resources Utica Holdings LLC, | | | | | | | | | | | | | | | | |
Second Lien Term Loan, 3 Month LIBOR + 9.000% | | | 11.455(c) | | | | 11/01/25 | | | | 118 | | | | 124,490 | |
Citgo Petroleum Corp., | | | | | | | | | | | | | | | | |
2019 Incremental Term B Loan, 1 Month LIBOR + 6.250% | | | 8.774(c) | | | | 03/28/24 | | | | 66 | | | | 66,078 | |
| | | | | | | | | | | | | | | | |
| | | | |
| | | | | | | | | | | | | | | 190,568 | |
| | | | |
Retail 0.1% | | | | | | | | | | | | | | | | |
| | | | |
EG America LLC (United Kingdom), | | | | | | | | | | | | | | | | |
Project Becker Additional Facility, 3 Month LIBOR + 4.250% | | | 6.500(c) | | | | 03/31/26 | | | | 30 | | | | 28,980 | |
Great Outdoors Group LLC, | | | | | | | | | | | | | | | | |
Term B-2 Loan, 1 Month LIBOR + 3.750% | | | 6.274(c) | | | | 03/06/28 | | | | 49 | | | | 47,566 | |
| | | | | | | | | | | | | | | | |
| | | | |
| | | | | | | | | | | | | | | 76,546 | |
| | | | |
Software 0.4% | | | | | | | | | | | | | | | | |
| | | | |
Boxer Parent Co., Inc., | | | | | | | | | | | | | | | | |
Second Lien Incremental Term Loan, 1 Month LIBOR + 5.500% | | | 8.024(c) | | | | 02/27/26 | | | | 50 | | | | 46,800 | |
Finastra USA, Inc., | | | | | | | | | | | | | | | | |
First Lien Dollar Term Loan, 6 Month LIBOR + 3.500% | | | 6.871(c) | | | | 06/13/24 | | | | 123 | | | | 115,018 | |
Skillsoft Finance II, Inc., | | | | | | | | | | | | | | | | |
Initial Term Loan, 1 Month SOFR + 5.250% | | | 7.652(c) | | | | 07/14/28 | | | | 194 | | | | 186,194 | |
| | | | | | | | | | | | | | | | |
| | | | |
| | | | | | | | | | | | | | | 348,012 | |
See Notes to Financial Statements.
PGIM Fixed Income ETFs 69
PGIM Active High Yield Bond ETF
Schedule of Investments (continued)
as of August 31, 2022
| | | | | | | | | | | | | | | | |
| | | | |
| Description | | Interest
Rate | | | Maturity
Date | | | Principal
Amount (000)# | | | Value | |
| | | | |
BANK LOANS (Continued) | | | | | | | | | | | | | | | | |
| | | | |
Telecommunications 0.7% | | | | | | | | | | | | | | | | |
| | | | |
West Corp., | | | | | | | | | | | | | | | | |
Initial Term B Loan, 1 Month LIBOR + 4.000% | | | 6.524%(c) | | | | 10/10/24 | | | | 520 | | | $ | 422,733 | |
Xplornet Communications, Inc. (Canada), | | | | | | | | | | | | | | | | |
Refinancing Term Loan, 1 Month LIBOR + 4.000% | | | 6.524(c) | | | | 10/02/28 | | | | 223 | | | | 205,448 | |
| | | | | | | | | | | | | | | | |
| | | | |
| | | | | | | | | | | | | | | 628,181 | |
| | | | | | | | | | | | | | | | |
| | | | |
TOTAL BANK LOANS
(cost $1,883,586) | | | | | | | | | | | | | | | 1,791,998 | |
| | | | | | | | | | | | | | | | |
| | | | |
CORPORATE BONDS 80.0% | | | | | | | | | | | | | | | | |
| | | | |
Advertising 0.5% | | | | | | | | | | | | | | | | |
| | | | |
CMG Media Corp., | | | | | | | | | | | | | | | | |
Gtd. Notes, 144A | | | 8.875 | | | | 12/15/27 | | | | 515 | | | | 450,184 | |
| | | | |
Aerospace & Defense 2.9% | | | | | | | | | | | | | | | | |
| | | | |
Boeing Co. (The), | | | | | | | | | | | | | | | | |
Sr. Unsec’d. Notes | | | 5.805 | | | | 05/01/50 | | | | 150 | | | | 143,878 | |
Sr. Unsec’d. Notes | | | 5.930 | | | | 05/01/60 | | | | 350 | | | | 334,194 | |
Bombardier, Inc. (Canada), | | | | | | | | | | | | | | | | |
Sr. Unsec’d. Notes, 144A | | | 6.000 | | | | 02/15/28 | | | | 150 | | | | 133,005 | |
Sr. Unsec’d. Notes, 144A | | | 7.125 | | | | 06/15/26 | | | | 300 | | | | 284,925 | |
Sr. Unsec’d. Notes, 144A | | | 7.500 | | | | 12/01/24 | | | | 299 | | | | 297,056 | |
Sr. Unsec’d. Notes, 144A | | | 7.500 | | | | 03/15/25 | | | | 304 | | | | 297,355 | |
Sr. Unsec’d. Notes, 144A | | | 7.875 | | | | 04/15/27 | | | | 490 | | | | 466,970 | |
Spirit AeroSystems, Inc., | | | | | | | | | | | | | | | | |
Sec’d. Notes, 144A | | | 7.500 | | | | 04/15/25 | | | | 225 | | | | 220,278 | |
TransDigm, Inc., | | | | | | | | | | | | | | | | |
Gtd. Notes | | | 4.625 | | | | 01/15/29 | | | | 50 | | | | 42,338 | |
Gtd. Notes | | | 5.500 | | | | 11/15/27 | | | | 450 | | | | 404,931 | |
Sr. Sec’d. Notes, 144A | | | 6.250 | | | | 03/15/26 | | | | 100 | | | | 98,208 | |
| | | | | | | | | | | | | | | | |
| | | | |
| | | | | | | | | | | | | | | 2,723,138 | |
| | | | |
Agriculture 0.2% | | | | | | | | | | | | | | | | |
| | | | |
Vector Group Ltd., | | | | | | | | | | | | | | | | |
Sr. Sec’d. Notes, 144A | | | 5.750 | | | | 02/01/29 | | | | 175 | | | | 151,728 | |
See Notes to Financial Statements.
70
PGIM Active High Yield Bond ETF
Schedule of Investments (continued)
as of August 31, 2022
| | | | | | | | | | | | | | |
| | | | |
| Description | | Interest
Rate | | | Maturity
Date | | Principal
Amount (000)# | | | Value | |
| | | | |
CORPORATE BONDS (Continued) | | | | | | | | | | | | | | |
| | | | |
Airlines 0.8% | | | | | | | | | | | | | | |
| | | | |
American Airlines, Inc., | | | | | | | | | | | | | | |
Sr. Sec’d. Notes, 144A | | | 11.750% | | | 07/15/25 | | | 175 | | | $ | 193,321 | |
American Airlines, Inc./AAdvantage Loyalty IP Ltd., | | | | | | | | | | | | | | |
Sr. Sec’d. Notes, 144A | | | 5.500 | | | 04/20/26 | | | 150 | | | | 142,337 | |
Sr. Sec’d. Notes, 144A | | | 5.750 | | | 04/20/29 | | | 125 | | | | 112,530 | |
Hawaiian Brand Intellectual Property | | | | | | | | | | | | | | |
Ltd./HawaiianMiles Loyalty Ltd., | | | | | | | | | | | | | | |
Sr. Sec’d. Notes, 144A | | | 5.750 | | | 01/20/26 | | | 50 | | | | 45,473 | |
United Airlines, Inc., | | | | | | | | | | | | | | |
Sr. Sec’d. Notes, 144A | | | 4.625 | | | 04/15/29 | | | 300 | | | | 263,320 | |
| | | | | | | | | | | | | | |
| | | | |
| | | | | | | | | | | | | 756,981 | |
| | | | |
Apparel 0.7% | | | | | | | | | | | | | | |
| | | | |
Kontoor Brands, Inc., | | | | | | | | | | | | | | |
Gtd. Notes, 144A | | | 4.125 | | | 11/15/29 | | | 50 | | | | 42,785 | |
William Carter Co. (The), | | | | | | | | | | | | | | |
Gtd. Notes, 144A | | | 5.625 | | | 03/15/27 | | | 325 | | | | 315,181 | |
Wolverine World Wide, Inc., | | | | | | | | | | | | | | |
Gtd. Notes, 144A | | | 4.000 | | | 08/15/29 | | | 375 | | | | 306,605 | |
| | | | | | | | | | | | | | |
| | | | |
| | | | | | | | | | | | | 664,571 | |
| | | | |
Auto Manufacturers 2.6% | | | | | | | | | | | | | | |
| | | | |
Allison Transmission, Inc., | | | | | | | | | | | | | | |
Gtd. Notes, 144A | | | 3.750 | | | 01/30/31 | | | 350 | | | | 282,794 | |
Sr. Unsec’d. Notes, 144A | | | 5.875 | | | 06/01/29 | | | 25 | | | | 23,659 | |
Ford Holdings LLC, | | | | | | | | | | | | | | |
Gtd. Notes | | | 9.300 | | | 03/01/30 | | | 100 | | | | 115,645 | |
Ford Motor Co., | | | | | | | | | | | | | | |
Sr. Unsec’d. Notes | | | 4.750 | | | 01/15/43 | | | 685 | | | | 514,239 | |
Sr. Unsec’d. Notes | | | 5.291 | | | 12/08/46 | | | 75 | | | | 60,945 | |
Sr. Unsec’d. Notes | | | 7.400 | | | 11/01/46 | | | 275 | | | | 285,939 | |
Sr. Unsec’d. Notes | | | 9.625 | | | 04/22/30 | | | 265 | | | | 310,600 | |
Ford Motor Credit Co. LLC, | | | | | | | | | | | | | | |
Sr. Unsec’d. Notes | | | 4.000 | | | 11/13/30 | | | 400 | | | | 336,992 | |
Sr. Unsec’d. Notes | | | 5.113 | | | 05/03/29 | | | 388 | | | | 358,724 | |
See Notes to Financial Statements.
PGIM Fixed Income ETFs 71
PGIM Active High Yield Bond ETF
Schedule of Investments (continued)
as of August 31, 2022
| | | | | | | | | | | | |
| | | | |
| Description | | Interest
Rate | | Maturity
Date | | Principal
Amount (000)# | | | Value | |
| | | | |
CORPORATE BONDS (Continued) | | | | | | | | | | | | |
| | | | |
Auto Manufacturers (cont’d.) | | | | | | | | | | | | |
| | | | |
PM General Purchaser LLC, | | | | | | | | | | | | |
Sr. Sec’d. Notes, 144A | | 9.500% | | 10/01/28 | | | 175 | | | $ | 154,812 | |
| | | | | | | | | | | | |
| | | | |
| | | | | | | | | | | 2,444,349 | |
| | | | |
Auto Parts & Equipment 1.0% | | | | | | | | | | | | |
| | | | |
Adient Global Holdings Ltd., | | | | | | | | | | | | |
Gtd. Notes, 144A | | 4.875 | | 08/15/26 | | | 400 | | | | 367,500 | |
American Axle & Manufacturing, Inc., | | | | | | | | | | | | |
Gtd. Notes | | 6.250 | | 03/15/26 | | | 45 | | | | 43,679 | |
Gtd. Notes | | 6.500 | | 04/01/27 | | | 200 | | | | 186,928 | |
Cooper-Standard Automotive, Inc., | | | | | | | | | | | | |
Gtd. Notes, 144A | | 5.625 | | 11/15/26 | | | 48 | | | | 24,015 | |
Dana, Inc., | | | | | | | | | | | | |
Sr. Unsec’d. Notes | | 4.250 | | 09/01/30 | | | 125 | | | | 101,484 | |
Sr. Unsec’d. Notes | | 4.500 | | 02/15/32 | | | 100 | | | | 80,591 | |
Sr. Unsec’d. Notes | | 5.625 | | 06/15/28 | | | 35 | | | | 31,485 | |
Tenneco, Inc., | | | | | | | | | | | | |
Sr. Sec’d. Notes, 144A | | 7.875 | | 01/15/29 | | | 25 | | | | 25,137 | |
Titan International, Inc., | | | | | | | | | | | | |
Sr. Sec’d. Notes | | 7.000 | | 04/30/28 | | | 100 | | | | 95,625 | |
| | | | | | | | | | | | |
| | | | |
| | | | | | | | | | | 956,444 | |
| | | | |
Banks 0.1% | | | | | | | | | | | | |
| | | | |
Citigroup, Inc., | | | | | | | | | | | | |
Jr. Sub. Notes | | 3.875(ff) | | 02/18/26(oo) | | | 75 | | | | 65,135 | |
Freedom Mortgage Corp., | | | | | | | | | | | | |
Sr. Unsec’d. Notes, 144A | | 7.625 | | 05/01/26 | | | 75 | | | | 62,038 | |
| | | | | | | | | | | | |
| | | | |
| | | | | | | | | | | 127,173 | |
| | | | |
Building Materials 2.0% | | | | | | | | | | | | |
| | | | |
Camelot Return Merger Sub, Inc., | | | | | | | | | | | | |
Sr. Sec’d. Notes, 144A | | 8.750 | | 08/01/28 | | | 100 | | | | 90,628 | |
Cornerstone Building Brands, Inc., | | | | | | | | | | | | |
Gtd. Notes, 144A | | 6.125 | | 01/15/29 | | | 165 | | | | 115,433 | |
Eco Material Technologies, Inc., | | | | | | | | | | | | |
Sr. Sec’d. Notes, 144A | | 7.875 | | 01/31/27 | | | 150 | | | | 139,109 | |
See Notes to Financial Statements.
72
PGIM Active High Yield Bond ETF
Schedule of Investments (continued)
as of August 31, 2022
| | | | | | | | | | | | | | |
| | | | |
| Description | | Interest
Rate | | | Maturity
Date | | Principal
Amount (000)# | | | Value | |
| | | | |
CORPORATE BONDS (Continued) | | | | | | | | | | | | | | |
| | | | |
Building Materials (cont’d.) | | | | | | | | | | | | | | |
| | | | |
Griffon Corp., | | | | | | | | | | | | | | |
Gtd. Notes | | | 5.750% | | | 03/01/28 | | | 175 | | | $ | 161,904 | |
JELD-WEN, Inc., | | | | | | | | | | | | | | |
Gtd. Notes, 144A | | | 4.625 | | | 12/15/25 | | | 175 | | | | 150,678 | |
Masonite International Corp., | | | | | | | | | | | | | | |
Gtd. Notes, 144A | | | 3.500 | | | 02/15/30 | | | 170 | | | | 136,425 | |
Gtd. Notes, 144A | | | 5.375 | | | 02/01/28 | | | 25 | | | | 23,250 | |
MIWD Holdco II LLC/MIWD Finance Corp., | | | | | | | | | | | | | | |
Gtd. Notes, 144A | | | 5.500 | | | 02/01/30 | | | 125 | | | | 103,347 | |
SRM Escrow Issuer LLC, | | | | | | | | | | | | | | |
Sr. Sec’d. Notes, 144A | | | 6.000 | | | 11/01/28 | | | 500 | | | | 453,266 | |
Standard Industries, Inc., | | | | | | | | | | | | | | |
Sr. Unsec’d. Notes, 144A | | | 3.375 | | | 01/15/31 | | | 325 | | | | 240,890 | |
Sr. Unsec’d. Notes, 144A | | | 4.375 | | | 07/15/30 | | | 150 | | | | 119,156 | |
Sr. Unsec’d. Notes, 144A | | | 4.750 | | | 01/15/28 | | | 48 | | | | 42,159 | |
Sr. Unsec’d. Notes, 144A | | | 5.000 | | | 02/15/27 | | | 120 | | | | 110,526 | |
| | | | | | | | | | | | | | |
| | | | |
| | | | | | | | | | | | | 1,886,771 | |
| | | | |
Chemicals 2.3% | | | | | | | | | | | | | | |
| | | | |
Ashland LLC, | | | | | | | | | | | | | | |
Gtd. Notes | | | 6.875 | | | 05/15/43 | | | 75 | | | | 77,215 | |
ASP Unifrax Holdings, Inc., | | | | | | | | | | | | | | |
Sr. Sec’d. Notes, 144A | | | 5.250 | | | 09/30/28 | | | 50 | | | | 40,768 | |
Sr. Unsec’d. Notes, 144A | | | 7.500 | | | 09/30/29 | | | 25 | | | | 18,590 | |
Avient Corp., | | | | | | | | | | | | | | |
Sr. Unsec’d. Notes, 144A | | | 5.750 | | | 05/15/25 | | | 100 | | | | 98,593 | |
Chemours Co. (The), | | | | | | | | | | | | | | |
Gtd. Notes, 144A | | | 4.625 | | | 11/15/29 | | | 185 | | | | 153,545 | |
Gtd. Notes, 144A | | | 5.750 | | | 11/15/28 | | | 140 | | | | 126,292 | |
Cornerstone Chemical Co., | | | | | | | | | | | | | | |
Sr. Sec’d. Notes, 144A | | | 6.750 | | | 08/15/24 | | | 75 | | | | 64,860 | |
Diamond BC BV, | | | | | | | | | | | | | | |
Gtd. Notes, 144A | | | 4.625 | | | 10/01/29 | | | 155 | | | | 130,006 | |
EverArc Escrow Sarl, | | | | | | | | | | | | | | |
Sr. Sec’d. Notes, 144A | | | 5.000 | | | 10/30/29 | | | 105 | | | | 89,946 | |
Iris Holding, Inc., | | | | | | | | | | | | | | |
Sr. Unsec’d. Notes, 144A | | | 10.000 | | | 12/15/28 | | | 150 | | | | 131,322 | |
Rain CII Carbon LLC/CII Carbon Corp., | | | | | | | | | | | | | | |
Sec’d. Notes, 144A | | | 7.250 | | | 04/01/25 | | | 100 | | | | 93,756 | |
See Notes to Financial Statements.
PGIM Fixed Income ETFs 73
PGIM Active High Yield Bond ETF
Schedule of Investments (continued)
as of August 31, 2022
| | | | | | | | | | | | | | |
| | | | |
| Description | | Interest
Rate | | | Maturity
Date | | Principal
Amount (000)# | | | Value | |
| | | | |
CORPORATE BONDS (Continued) | | | | | | | | | | | | | | |
| | | | |
Chemicals (cont’d.) | | | | | | | | | | | | | | |
| | | | |
SCIH Salt Holdings, Inc., | | | | | | | | | | | | | | |
Sr. Unsec’d. Notes, 144A | | | 6.625% | | | 05/01/29 | | | 25 | | | $ | 20,577 | |
SPCM SA (France), | | | | | | | | | | | | | | |
Sr. Unsec’d. Notes, 144A | | | 3.125 | | | 03/15/27 | | | 200 | | | | 178,000 | |
TPC Group, Inc., | | | | | | | | | | | | | | |
Sr. Sec’d. Notes, 144A | | | 10.500 | | | 08/01/24(d) | | | 185 | | | | 102,097 | |
Sr. Sec’d. Notes, 144A | | | 10.875 | | | 08/01/24(d) | | | 46 | | | | 45,930 | |
Tronox, Inc., | | | | | | | | | | | | | | |
Gtd. Notes, 144A | | | 4.625 | | | 03/15/29 | | | 360 | | | | 299,441 | |
Valvoline, Inc., | | | | | | | | | | | | | | |
Gtd. Notes, 144A | | | 4.250 | | | 02/15/30 | | | 25 | | | | 24,400 | |
Sr. Unsec’d. Notes, 144A | | | 3.625 | | | 06/15/31 | | | 100 | | | | 80,462 | |
Venator Finance Sarl/Venator Materials LLC, | | | | | | | | | | | | | | |
Gtd. Notes, 144A | | | 5.750 | | | 07/15/25 | | | 250 | | | | 182,812 | |
Sr. Sec’d. Notes, 144A | | | 9.500 | | | 07/01/25 | | | 125 | | | | 120,625 | |
WR Grace Holdings LLC, | | | | | | | | | | | | | | |
Sr. Sec’d. Notes, 144A | | | 4.875 | | | 06/15/27 | | | 50 | | | | 46,464 | |
Sr. Sec’d. Notes, 144A | | | 5.625 | | | 10/01/24 | | | 25 | | | | 24,612 | |
| | | | | | | | | | | | | | |
| | | | |
| | | | | | | | | | | | | 2,150,313 | |
| | | | |
Coal 0.0% | | | | | | | | | | | | | | |
| | | | |
Coronado Finance Pty Ltd. (Australia), | | | | | | | | | | | | | | |
Sr. Sec’d. Notes, 144A | | | 10.750 | | | 05/15/26 | | | 41 | | | | 42,332 | |
| | | | |
Commercial Services 4.3% | | | | | | | | | | | | | | |
| | | | |
Adtalem Global Education, Inc., | | | | | | | | | | | | | | |
Sr. Sec’d. Notes, 144A | | | 5.500 | | | 03/01/28 | | | 66 | | | | 62,291 | |
Allied Universal Holdco LLC/Allied Universal Finance Corp., | | | | | | | | | | | | | | |
Sr. Sec’d. Notes, 144A | | | 6.625 | | | 07/15/26 | | | 210 | | | | 196,593 | |
Sr. Unsec’d. Notes, 144A | | | 6.000 | | | 06/01/29 | | | 400 | | | | 299,664 | |
Sr. Unsec’d. Notes, 144A | | | 9.750 | | | 07/15/27 | | | 275 | | | | 251,303 | |
Allied Universal Holdco LLC/Allied Universal Finance Corp./Atlas Luxco 4 Sarl, | | | | | | | | | | | | | | |
Sr. Sec’d. Notes, 144A | | | 4.625 | | | 06/01/28 | | | 600 | | | | 501,507 | |
Alta Equipment Group, Inc., | | | | | | | | | | | | | | |
Sec’d. Notes, 144A | | | 5.625 | | | 04/15/26 | | | 50 | | | | 43,448 | |
AMN Healthcare, Inc., | | | | | | | | | | | | | | |
Gtd. Notes, 144A | | | 4.000 | | | 04/15/29 | | | 150 | | | | 129,450 | |
See Notes to Financial Statements.
74
PGIM Active High Yield Bond ETF
Schedule of Investments (continued)
as of August 31, 2022
| | | | | | | | | | | | | | | | |
| | | | |
| Description | | Interest
Rate | | | Maturity
Date | | | Principal
Amount (000)# | | | Value | |
| | | | |
CORPORATE BONDS (Continued) | | | | | | | | | | | | | | | | |
| | | | |
Commercial Services (cont’d.) | | | | | | | | | | | | | | | | |
| | | | |
AMN Healthcare, Inc., (cont’d.) | | | | | | | | | | | | | | | | |
Gtd. Notes, 144A | | | 4.625% | | | | 10/01/27 | | | | 50 | | | $ | 46,317 | |
APi Group DE, Inc., | | | | | | | | | | | | | | | | |
Gtd. Notes, 144A | | | 4.750 | | | | 10/15/29 | | | | 50 | | | | 41,828 | |
Avis Budget Car Rental LLC/Avis Budget Finance, Inc., | | | | | | | | | | | | | | | | |
Gtd. Notes, 144A | | | 4.750 | | | | 04/01/28 | | | | 100 | | | | 87,338 | |
Gtd. Notes, 144A | | | 5.375 | | | | 03/01/29 | | | | 125 | | | | 109,025 | |
Brink’s Co. (The), | | | | | | | | | | | | | | | | |
Gtd. Notes, 144A | | | 4.625 | | | | 10/15/27 | | | | 25 | | | | 22,503 | |
Gartner, Inc., | | | | | | | | | | | | | | | | |
Gtd. Notes, 144A | | | 3.625 | | | | 06/15/29 | | | | 50 | | | | 43,221 | |
Herc Holdings, Inc., | | | | | | | | | | | | | | | | |
Gtd. Notes, 144A | | | 5.500 | | | | 07/15/27 | | | | 350 | | | | 330,750 | |
Hertz Corp. (The), | | | | | | | | | | | | | | | | |
Gtd. Notes, 144A | | | 4.625 | | | | 12/01/26 | | | | 25 | | | | 21,443 | |
Gtd. Notes, 144A | | | 5.000 | | | | 12/01/29 | | | | 50 | | | | 40,232 | |
Metis Merger Sub LLC, | | | | | | | | | | | | | | | | |
Sr. Unsec’d. Notes, 144A | | | 6.500 | | | | 05/15/29 | | | | 350 | | | | 306,263 | |
MPH Acquisition Holdings LLC, | | | | | | | | | | | | | | | | |
Sr. Sec’d. Notes, 144A | | | 5.500 | | | | 09/01/28 | | | | 200 | | | | 170,461 | |
NESCO Holdings II, Inc., | | | | | | | | | | | | | | | | |
Sec’d. Notes, 144A | | | 5.500 | | | | 04/15/29 | | | | 100 | | | | 88,645 | |
Service Corp. International, | | | | | | | | | | | | | | | | |
Sr. Unsec’d. Notes | | | 4.000 | | | | 05/15/31 | | | | 150 | | | | 128,473 | |
United Rentals North America, Inc., | | | | | | | | | | | | | | | | |
Gtd. Notes | | | 3.750 | | | | 01/15/32 | | | | 175 | | | | 146,628 | |
Gtd. Notes | | | 3.875 | | | | 02/15/31 | | | | 175 | | | | 151,105 | |
Gtd. Notes | | | 4.875 | | | | 01/15/28 | | | | 75 | | | | 70,160 | |
Gtd. Notes | | | 5.250 | | | | 01/15/30 | | | | 275 | | | | 260,083 | |
Verscend Escrow Corp., | | | | | | | | | | | | | | | | |
Sr. Unsec’d. Notes, 144A | | | 9.750 | | | | 08/15/26 | | | | 515 | | | | 520,394 | |
| | | | | | | | | | | | | | | | |
| | | | |
| | | | | | | | | | | | | | | 4,069,125 | |
| | | | |
Computers 0.6% | | | | | | | | | | | | | | | | |
| | | | |
Condor Merger Sub, Inc., | | | | | | | | | | | | | | | | |
Sr. Unsec’d. Notes, 144A | | | 7.375 | | | | 02/15/30 | | | | 165 | | | | 137,533 | |
NCR Corp., | | | | | | | | | | | | | | | | |
Gtd. Notes, 144A | | | 5.000 | | | | 10/01/28 | | | | 275 | | | | 258,899 | |
See Notes to Financial Statements.
PGIM Fixed Income ETFs 75
PGIM Active High Yield Bond ETF
Schedule of Investments (continued)
as of August 31, 2022
| | | | | | | | | | | | | | | | |
| | | | |
| Description | | Interest
Rate | | | Maturity
Date | | | Principal
Amount (000)# | | | Value | |
| | | | |
CORPORATE BONDS (Continued) | | | | | | | | | | | | | | | | |
| | | | |
Computers (cont’d.) | | | | | | | | | | | | | | | | |
| | | | |
NCR Corp., (cont’d.) | | | | | | | | | | | | | | | | |
Gtd. Notes, 144A | | | 5.125% | | | | 04/15/29 | | | | 150 | | | $ | 140,053 | |
Gtd. Notes, 144A | | | 5.250 | | | | 10/01/30 | | | | 50 | | | | 46,548 | |
| | | | | | | | | | | | | | | | |
| | | | |
| | | | | | | | | | | | | | | 583,033 | |
| | | | |
Distribution/Wholesale 0.5% | | | | | | | | | | | | | | | | |
| | | | |
H&E Equipment Services, Inc., | | | | | | | | | | | | | | | | |
Gtd. Notes, 144A | | | 3.875 | | | | 12/15/28 | | | | 575 | | | | 485,944 | |
| | | | |
Diversified Financial Services 3.6% | | | | | | | | | | | | | | | | |
| | | | |
Bread Financial Holdings, Inc., | | | | | | | | | | | | | | | | |
Gtd. Notes, 144A | | | 4.750 | | | | 12/15/24 | | | | 100 | | | | 88,397 | |
goeasy Ltd. (Canada), | | | | | | | | | | | | | | | | |
Gtd. Notes, 144A | | | 4.375 | | | | 05/01/26 | | | | 150 | | | | 134,250 | |
Home Point Capital, Inc., | | | | | | | | | | | | | | | | |
Gtd. Notes, 144A | | | 5.000 | | | | 02/01/26 | | | | 125 | | | | 88,786 | |
Jefferies Finance LLC/JFIN Co-Issuer Corp., | | | | | | | | | | | | | | | | |
Sr. Unsec’d. Notes, 144A | | | 5.000 | | | | 08/15/28 | | | | 400 | | | | 341,384 | |
LD Holdings Group LLC, | | | | | | | | | | | | | | | | |
Gtd. Notes, 144A | | | 6.125 | | | | 04/01/28 | | | | 150 | | | | 81,017 | |
LFS Topco LLC, | | | | | | | | | | | | | | | | |
Gtd. Notes, 144A | | | 5.875 | | | | 10/15/26 | | | | 125 | | | | 101,459 | |
LPL Holdings, Inc., | | | | | | | | | | | | | | | | |
Gtd. Notes, 144A | | | 4.000 | | | | 03/15/29 | | | | 350 | | | | 312,506 | |
Gtd. Notes, 144A | | | 4.375 | | | | 05/15/31 | | | | 50 | | | | 43,989 | |
Nationstar Mortgage Holdings, Inc., | | | | | | | | | | | | | | | | |
Gtd. Notes, 144A | | | 5.125 | | | | 12/15/30 | | | | 400 | | | | 314,865 | |
Gtd. Notes, 144A | | | 5.500 | | | | 08/15/28 | | | | 100 | | | | 84,262 | |
Gtd. Notes, 144A | | | 6.000 | | | | 01/15/27 | | | | 125 | | | | 111,698 | |
Navient Corp., | | | | | | | | | | | | | | | | |
Sr. Unsec’d. Notes | | | 5.500 | | | | 03/15/29 | | | | 75 | | | | 60,833 | |
OneMain Finance Corp., | | | | | | | | | | | | | | | | |
Gtd. Notes | | | 3.875 | | | | 09/15/28 | | | | 150 | | | | 117,962 | |
Gtd. Notes | | | 4.000 | | | | 09/15/30 | | | | 150 | | | | 112,003 | |
Gtd. Notes | | | 6.625 | | | | 01/15/28 | | | | 594 | | | | 546,050 | |
Gtd. Notes | | | 6.875 | | | | 03/15/25 | | | | 125 | | | | 121,756 | |
Gtd. Notes | | | 7.125 | | | | 03/15/26 | | | | 250 | | | | 232,934 | |
PennyMac Financial Services, Inc., | | | | | | | | | | | | | | | | |
Gtd. Notes, 144A | | | 4.250 | | | | 02/15/29 | | | | 50 | | | | 39,179 | |
See Notes to Financial Statements.
76
PGIM Active High Yield Bond ETF
Schedule of Investments (continued)
as of August 31, 2022
| | | | | | | | | | | | |
| | | | |
| Description | | Interest
Rate | | Maturity
Date | | Principal
Amount (000)# | | | Value | |
| | | | |
CORPORATE BONDS (Continued) | | | | | | | | | | | | |
| | | | |
Diversified Financial Services (cont’d.) | | | | | | | | | | | | |
PennyMac Financial Services, Inc., (cont’d.) | | | | | | | | | | | | |
Gtd. Notes, 144A | | 5.375% | | 10/15/25 | | | 175 | | | $ | 160,153 | |
Rocket Mortgage LLC/Rocket Mortgage Co-Issuer, Inc., | | | | | | | | | | | | |
Gtd. Notes, 144A | | 3.625 | | 03/01/29 | | | 75 | | | | 60,693 | |
Gtd. Notes, 144A | | 4.000 | | 10/15/33 | | | 50 | | | | 37,286 | |
VistaJet Malta Finance PLC/XO Management Holding, Inc. (Switzerland), | | | | | | | | | | | | |
Sr. Unsec’d. Notes, 144A | | 6.375 | | 02/01/30 | | | 150 | | | | 129,000 | |
Sr. Unsec’d. Notes, 144A | | 7.875 | | 05/01/27 | | | 75 | | | | 69,187 | |
| | | | | | | | | | | | |
| | | | |
| | | | | | | | | | | 3,389,649 | |
| | | | |
Electric 4.9% | | | | | | | | | | | | |
Calpine Corp., | | | | | | | | | | | | |
Sr. Sec’d. Notes, 144A | | 3.750 | | 03/01/31 | | | 375 | | | | 308,208 | |
Sr. Sec’d. Notes, 144A | | 4.500 | | 02/15/28 | | | 186 | | | | 170,188 | |
Sr. Unsec’d. Notes, 144A | | 4.625 | | 02/01/29 | | | 240 | | | | 205,305 | |
Sr. Unsec’d. Notes, 144A | | 5.000 | | 02/01/31 | | | 350 | | | | 295,169 | |
Sr. Unsec’d. Notes, 144A | | 5.125 | | 03/15/28 | | | 834 | | | | 744,963 | |
NRG Energy, Inc., | | | | | | | | | | | | |
Gtd. Notes | | 5.750 | | 01/15/28 | | | 140 | | | | 132,022 | |
Gtd. Notes | | 6.625 | | 01/15/27 | | | 30 | | | | 29,897 | |
Gtd. Notes, 144A | | 3.375 | | 02/15/29 | | | 175 | | | | 144,675 | |
Gtd. Notes, 144A | | 3.625 | | 02/15/31 | | | 225 | | | | 178,690 | |
Gtd. Notes, 144A | | 3.875 | | 02/15/32 | | | 50 | | | | 39,532 | |
Gtd. Notes, 144A | | 5.250 | | 06/15/29 | | | 350 | | | | 313,022 | |
PG&E Corp., | | | | | | | | | | | | |
Sr. Sec’d. Notes | �� | 5.000 | | 07/01/28 | | | 175 | | | | 155,476 | |
Sr. Sec’d. Notes | | 5.250 | | 07/01/30 | | | 443 | | | | 383,259 | |
Vistra Corp., | | | | | | | | | | | | |
Jr. Sub. Notes, 144A | | 7.000(ff) | | 12/15/26(oo) | | | 233 | | | | 216,690 | |
Jr. Sub. Notes, 144A | | 8.000(ff) | | 10/15/26(oo) | | | 125 | | | | 119,687 | |
Vistra Operations Co. LLC, | | | | | | | | | | | | |
Gtd. Notes, 144A | | 4.375 | | 05/01/29 | | | 200 | | | | 174,285 | |
Gtd. Notes, 144A | | 5.000 | | 07/31/27 | | | 290 | | | | 270,127 | |
Gtd. Notes, 144A | | 5.500 | | 09/01/26 | | | 50 | | | | 48,260 | |
Gtd. Notes, 144A | | 5.625 | | 02/15/27 | | | 750 | | | | 725,014 | |
| | | | | | | | | | | | |
| | | | |
| | | | | | | | | | | 4,654,469 | |
See Notes to Financial Statements.
PGIM Fixed Income ETFs 77
PGIM Active High Yield Bond ETF
Schedule of Investments (continued)
as of August 31, 2022
| | | | | | | | | | | | |
| | | | |
| Description | | Interest
Rate | | Maturity
Date | | Principal
Amount (000)# | | | Value | |
| | | | |
CORPORATE BONDS (Continued) | | | | | | | | | | | | |
| | | | |
Electrical Components & Equipment 0.6% | | | | | | | | | | | | |
Energizer Holdings, Inc., | | | | | | | | | | | | |
Gtd. Notes, 144A | | 4.375% | | 03/31/29 | | | 250 | | | $ | 202,765 | |
WESCO Distribution, Inc., | | | | | | | | | | | | |
Gtd. Notes, 144A | | 7.125 | | 06/15/25 | | | 300 | | | | 301,222 | |
Gtd. Notes, 144A | | 7.250 | | 06/15/28 | | | 100 | | | | 100,963 | |
| | | | | | | | | | | | |
| | | | |
| | | | | | | | | | | 604,950 | |
| | | | |
Electronics 0.2% | | | | | | | | | | | | |
Likewize Corp., | | | | | | | | | | | | |
Sr. Sec’d. Notes, 144A | | 9.750 | | 10/15/25 | | | 200 | | | | 191,252 | |
Sensata Technologies, Inc., | | | | | | | | | | | | |
Gtd. Notes, 144A | | 3.750 | | 02/15/31 | | | 15 | | | | 12,510 | |
| | | | | | | | | | | | |
| | | | |
| | | | | | | | | | | 203,762 | |
| | | | |
Engineering & Construction 0.1% | | | | | | | | | | | | |
AECOM, | | | | | | | | | | | | |
Gtd. Notes | | 5.125 | | 03/15/27 | | | 50 | | | | 48,820 | |
Artera Services LLC, | | | | | | | | | | | | |
Sr. Sec’d. Notes, 144A | | 9.033 | | 12/04/25 | | | 50 | | | | 41,067 | |
TopBuild Corp., | | | | | | | | | | | | |
Gtd. Notes, 144A | | 4.125 | | 02/15/32 | | | 50 | | | | 41,300 | |
| | | | | | | | | | | | |
| | | | |
| | | | | | | | | | | 131,187 | |
| | | | |
Entertainment 2.6% | | | | | | | | | | | | |
AMC Entertainment Holdings, Inc., | | | | | | | | | | | | |
Sec’d. Notes, 144A, Cash coupon 10.000% or PIK 12.000% or Cash coupon 5.000% and PIK 6.000% | | 10.000 | | 06/15/26 | | | 82 | | | | 65,143 | |
Caesars Entertainment, Inc., | | | | | | | | | | | | |
Sr. Sec’d. Notes, 144A | | 6.250 | | 07/01/25 | | | 490 | | | | 478,412 | |
Sr. Unsec’d. Notes, 144A | | 4.625 | | 10/15/29 | | | 100 | | | | 80,468 | |
CCM Merger, Inc., | | | | | | | | | | | | |
Sr. Unsec’d. Notes, 144A | | 6.375 | | 05/01/26 | | | 150 | | | | 141,414 | |
Everi Holdings, Inc., | | | | | | | | | | | | |
Gtd. Notes, 144A | | 5.000 | | 07/15/29 | | | 25 | | | | 22,059 | |
Golden Entertainment, Inc., | | | | | | | | | | | | |
Sr. Unsec’d. Notes, 144A | | 7.625 | | 04/15/26 | | | 225 | | | | 230,052 | |
See Notes to Financial Statements.
78
PGIM Active High Yield Bond ETF
Schedule of Investments (continued)
as of August 31, 2022
| | | | | | | | | | | | |
| | | | |
| Description | | Interest
Rate | | Maturity
Date | | Principal
Amount (000)# | | | Value | |
| | | | |
CORPORATE BONDS (Continued) | | | | | | | | | | | | |
| | | | |
Entertainment (cont’d.) | | | | | | | | | | | | |
International Game Technology PLC, | | | | | | | | | | | | |
Sr. Sec’d. Notes, 144A | | 4.125% | | 04/15/26 | | | 275 | | | $ | 252,139 | |
Jacobs Entertainment, Inc., | | | | | | | | | | | | |
Sr. Unsec’d. Notes, 144A | | 6.750 | | 02/15/29 | | | 75 | | | | 66,477 | |
Midwest Gaming Borrower LLC/Midwest Gaming Finance Corp., | | | | | | | | | | | | |
Sr. Sec’d. Notes, 144A | | 4.875 | | 05/01/29 | | | 225 | | | | 197,822 | |
Penn Entertainment, Inc., | | | | | | | | | | | | |
Sr. Unsec’d. Notes, 144A | | 4.125 | | 07/01/29 | | | 75 | | | | 60,751 | |
Sr. Unsec’d. Notes, 144A | | 5.625 | | 01/15/27 | | | 367 | | | | 336,032 | |
Premier Entertainment Sub LLC/Premier Entertainment Finance Corp., | | | | | | | | | | | | |
Gtd. Notes, 144A | | 5.875 | | 09/01/31 | | | 200 | | | | 139,843 | |
Scientific Games Holdings LP/Scientific Games US FinCo, Inc., | | | | | | | | | | | | |
Sr. Unsec’d. Notes, 144A | | 6.625 | | 03/01/30 | | | 225 | | | | 200,648 | |
Wynn Resorts Finance LLC/Wynn Resorts Capital Corp., | | | | | | | | | | | | |
Gtd. Notes, 144A | | 5.125 | | 10/01/29 | | | 180 | | | | 151,109 | |
Sr. Unsec’d. Notes, 144A | | 7.750 | | 04/15/25 | | | 25 | | | | 24,929 | |
| | | | | | | | | | | | |
| | | | |
| | | | | | | | | | | 2,447,298 | |
| | | | |
Environmental Control 0.1% | | | | | | | | | | | | |
GFL Environmental, Inc. (Canada), | | | | | | | | | | | | |
Gtd. Notes, 144A | | 4.000 | | 08/01/28 | | | 25 | | | | 21,256 | |
Gtd. Notes, 144A | | 4.375 | | 08/15/29 | | | 125 | | | | 105,465 | |
| | | | | | | | | | | | |
| | | | |
| | | | | | | | | | | 126,721 | |
| | | | |
Foods 3.0% | | | | | | | | | | | | |
Albertson’s Cos., Inc./Safeway, Inc./New Albertson’s LP/Albertson’s LLC, | | | | | | | | | | | | |
Gtd. Notes, 144A | | 3.500 | | 03/15/29 | | | 325 | | | | 267,058 | |
Gtd. Notes, 144A | | 5.875 | | 02/15/28 | | | 25 | | | | 23,828 | |
B&G Foods, Inc., | | | | | | | | | | | | |
Gtd. Notes | | 5.250 | | 09/15/27 | | | 375 | | | | 312,790 | |
C&S Group Enterprises LLC, | | | | | | | | | | | | |
Gtd. Notes, 144A | | 5.000 | | 12/15/28 | | | 75 | | | | 55,903 | |
Chobani LLC/Chobani Finance Corp., Inc., | | | | | | | | | | | | |
Gtd. Notes, 144A | | 7.500 | | 04/15/25 | | | 150 | | | | 143,120 | |
See Notes to Financial Statements.
PGIM Fixed Income ETFs 79
PGIM Active High Yield Bond ETF
Schedule of Investments (continued)
as of August 31, 2022
| | | | | | | | | | | | |
| | | | |
| Description | | Interest
Rate | | Maturity
Date | | Principal
Amount (000)# | | | Value | |
| | | | |
CORPORATE BONDS (Continued) | | | | | | | | | | | | |
| | | | |
Foods (cont’d.) | | | | | | | | | | | | |
JBS USA LUX SA/JBS USA Food Co./JBS USA Finance, Inc., | | | | | | | | | | | | |
Gtd. Notes, 144A | | 3.625% | | 01/15/32 | | | 340 | | | $ | 294,367 | |
Gtd. Notes, 144A | | 6.500 | | 04/15/29 | | | 44 | | | | 45,573 | |
Sr. Unsec’d. Notes, 144A | | 5.500 | | 01/15/30 | | | 25 | | | | 24,993 | |
Kraft Heinz Foods Co., | | | | | | | | | | | | |
Gtd. Notes | | 4.375 | | 06/01/46 | | | 50 | | | | 42,430 | |
Gtd. Notes | | 5.200 | | 07/15/45 | | | 25 | | | | 23,496 | |
Gtd. Notes | | 5.500 | | 06/01/50 | | | 25 | | | | 24,765 | |
Gtd. Notes | | 6.500 | | 02/09/40 | | | 25 | | | | 26,752 | |
Lamb Weston Holdings, Inc., | | | | | | | | | | | | |
Gtd. Notes, 144A | | 4.125 | | 01/31/30 | | | 325 | | | | 292,732 | |
Gtd. Notes, 144A | | 4.375 | | 01/31/32 | | | 75 | | | | 66,624 | |
Market Bidco Finco PLC (United Kingdom), | | | | | | | | | | | | |
Sr. Sec’d. Notes, 144A | | 5.500 | | 11/04/27 | | GBP | 100 | | | | 95,259 | |
Pilgrim’s Pride Corp., | | | | | | | | | | | | |
Gtd. Notes, 144A | | 3.500 | | 03/01/32 | | | 50 | | | | 40,632 | |
Gtd. Notes, 144A | | 4.250 | | 04/15/31 | | | 675 | | | | 581,866 | |
Post Holdings, Inc., | | | | | | | | | | | | |
Gtd. Notes, 144A | | 4.625 | | 04/15/30 | | | 200 | | | | 173,746 | |
Gtd. Notes, 144A | | 5.500 | | 12/15/29 | | | 75 | | | | 68,752 | |
Sr. Unsec’d. Notes, 144A | | 4.500 | | 09/15/31 | | | 250 | | | | 212,564 | |
| | | | | | | | | | | | |
| | | | |
| | | | | | | | | | | 2,817,250 | |
| | | | |
Gas 0.5% | | | | | | | | | | | | |
AmeriGas Partners LP/AmeriGas Finance Corp., | | | | | | | | | | | | |
Sr. Unsec’d. Notes | | 5.500 | | 05/20/25 | | | 75 | | | | 71,213 | |
Sr. Unsec’d. Notes | | 5.750 | | 05/20/27 | | | 375 | | | | 353,782 | |
Sr. Unsec’d. Notes | | 5.875 | | 08/20/26 | | | 78 | | | | 74,647 | |
| | | | | | | | | | | | |
| | | | |
| | | | | | | | | | | 499,642 | |
| | | | |
Healthcare-Products 0.9% | | | | | | | | | | | | |
Medline Borrower LP, | | | | | | | | | | | | |
Sr. Sec’d. Notes, 144A | | 3.875 | | 04/01/29 | | | 450 | | | | 381,031 | |
Sr. Unsec’d. Notes, 144A | | 5.250 | | 10/01/29 | | | 525 | | | | 441,290 | |
| | | | | | | | | | | | |
| | | | |
| | | | | | | | | | | 822,321 | |
See Notes to Financial Statements.
80
PGIM Active High Yield Bond ETF
Schedule of Investments (continued)
as of August 31, 2022
| | | | | | | | | | | | |
| | | | |
| Description | | Interest
Rate | | Maturity
Date | | Principal
Amount (000)# | | | Value | |
| | | | |
CORPORATE BONDS (Continued) | | | | | | | | | | | | |
| | | | |
Healthcare-Services 3.5% | | | | | | | | | | | | |
DaVita, Inc., | | | | | | | | | | | | |
Gtd. Notes, 144A | | 3.750% | | 02/15/31 | | | 911 | | | $ | 670,967 | |
Gtd. Notes, 144A | | 4.625 | | 06/01/30 | | | 100 | | | | 80,185 | |
HCA, Inc., | | | | | | | | | | | | |
Gtd. Notes | | 5.875 | | 02/15/26 | | | 75 | | | | 76,529 | |
Gtd. Notes | | 7.500 | | 11/06/33 | | | 75 | | | | 82,334 | |
Legacy LifePoint Health LLC, | | | | | | | | | | | | |
Sr. Sec’d. Notes, 144A | | 4.375 | | 02/15/27 | | | 50 | | | | 43,466 | |
Sr. Sec’d. Notes, 144A | | 6.750 | | 04/15/25 | | | 50 | | | | 49,087 | |
LifePoint Health, Inc., | | | | | | | | | | | | |
Gtd. Notes, 144A | | 5.375 | | 01/15/29 | | | 725 | | | | 549,627 | |
Prime Healthcare Services, Inc., | | | | | | | | | | | | |
Sr. Sec’d. Notes, 144A | | 7.250 | | 11/01/25 | | | 150 | | | | 137,180 | |
RegionalCare Hospital Partners Holdings, Inc./LifePoint Health, Inc., | | | | | | | | | | | | |
Gtd. Notes, 144A | | 9.750 | | 12/01/26 | | | 100 | | | | 95,572 | |
Tenet Healthcare Corp., | | | | | | | | | | | | |
Gtd. Notes, 144A | | 6.125 | | 10/01/28 | | | 175 | | | | 160,449 | |
Sr. Sec’d. Notes, 144A | | 4.250 | | 06/01/29 | | | 875 | | | | 755,191 | |
Sr. Sec’d. Notes, 144A | | 4.375 | | 01/15/30 | | | 350 | | | | 306,249 | |
Sr. Sec’d. Notes, 144A | | 6.125 | | 06/15/30 | | | 75 | | | | 72,021 | |
Sr. Unsec’d. Notes | | 6.875 | | 11/15/31 | | | 250 | | | | 234,853 | |
| | | | | | | | | | | | |
| | | | |
| | | | | | | | | | | 3,313,710 | |
| | | | |
Home Builders 4.1% | | | | | | | | | | | | |
Ashton Woods USA LLC/Ashton Woods Finance Co., | | | | | | | | | | | | |
Sr. Unsec’d. Notes, 144A | | 4.625 | | 08/01/29 | | | 100 | | | | 78,527 | |
Sr. Unsec’d. Notes, 144A | | 4.625 | | 04/01/30 | | | 75 | | | | 58,818 | |
Beazer Homes USA, Inc., | | | | | | | | | | | | |
Gtd. Notes | | 5.875 | | 10/15/27 | | | 250 | | | | 206,523 | |
Gtd. Notes | | 7.250 | | 10/15/29 | | | 470 | | | | 406,703 | |
Brookfield Residential Properties, Inc./Brookfield Residential US LLC (Canada), | | | | | | | | | | | | |
Gtd. Notes, 144A | | 4.875 | | 02/15/30 | | | 350 | | | | 269,500 | |
Gtd. Notes, 144A | | 6.250 | | 09/15/27 | | | 145 | | | | 128,383 | |
Sr. Unsec’d. Notes, 144A | | 5.000 | | 06/15/29 | | | 50 | | | | 39,570 | |
Century Communities, Inc., | | | | | | | | | | | | |
Gtd. Notes | | 6.750 | | 06/01/27 | | | 25 | | | | 24,511 | |
Gtd. Notes, 144A | | 3.875 | | 08/15/29 | | | 225 | | | | 180,935 | |
See Notes to Financial Statements.
PGIM Fixed Income ETFs 81
PGIM Active High Yield Bond ETF
Schedule of Investments (continued)
as of August 31, 2022
| | | | | | | | | | | | |
| | | | |
| Description | | Interest
Rate | | Maturity
Date | | Principal
Amount (000)# | | | Value | |
| | | | |
CORPORATE BONDS (Continued) | | | | | | | | | | | | |
| | | | |
Home Builders (cont’d.) | | | | | | | | | | | | |
Forestar Group, Inc., | | | | | | | | | | | | |
Gtd. Notes, 144A | | 3.850% | | 05/15/26 | | | 200 | | | $ | 170,134 | |
Gtd. Notes, 144A | | 5.000 | | 03/01/28 | | | 75 | | | | 62,111 | |
KB Home, | | | | | | | | | | | | |
Gtd. Notes | | 4.000 | | 06/15/31 | | | 375 | | | | 295,877 | |
Gtd. Notes | | 4.800 | | 11/15/29 | | | 250 | | | | 213,307 | |
Gtd. Notes | | 7.250 | | 07/15/30 | | | 25 | | | | 24,100 | |
M/I Homes, Inc., | | | | | | | | | | | | |
Gtd. Notes | | 3.950 | | 02/15/30 | | | 150 | | | | 120,294 | |
Gtd. Notes | | 4.950 | | 02/01/28 | | | 125 | | | | 110,856 | |
Mattamy Group Corp. (Canada), | | | | | | | | | | | | |
Sr. Unsec’d. Notes, 144A | | 4.625 | | 03/01/30 | | | 175 | | | | 140,438 | |
Sr. Unsec’d. Notes, 144A | | 5.250 | | 12/15/27 | | | 250 | | | | 221,250 | |
Shea Homes LP/Shea Homes Funding Corp., | | | | | | | | | | | | |
Sr. Unsec’d. Notes, 144A | | 4.750 | | 02/15/28 | | | 225 | | | | 187,706 | |
Sr. Unsec’d. Notes, 144A | | 4.750 | | 04/01/29 | | | 50 | | | | 40,345 | |
STL Holding Co. LLC, | | | | | | | | | | | | |
Sr. Unsec’d. Notes, 144A | | 7.500 | | 02/15/26 | | | 200 | | | | 178,931 | |
Taylor Morrison Communities, Inc., | | | | | | | | | | | | |
Gtd. Notes, 144A | | 5.875 | | 06/15/27 | | | 300 | | | | 290,038 | |
Sr. Unsec’d. Notes, 144A | | 5.125 | | 08/01/30 | | | 435 | | | | 373,342 | |
Tri Pointe Homes, Inc., | | | | | | | | | | | | |
Gtd. Notes | | 5.250 | | 06/01/27 | | | 75 | | | | 68,560 | |
Gtd. Notes | | 5.700 | | 06/15/28 | | | 15 | | | | 13,521 | |
| | | | | | | | | | | | |
| | | | |
| | | | | | | | | | | 3,904,280 | |
| | | | |
Home Furnishings 0.2% | | | | | | | | | | | | |
Tempur Sealy International, Inc., | | | | | | | | | | | | |
Gtd. Notes, 144A | | 4.000 | | 04/15/29 | | | 200 | | | | 164,653 | |
| | | | |
Household Products/Wares 0.4% | | | | | | | | | | | | |
ACCO Brands Corp., | | | | | | | | | | | | |
Gtd. Notes, 144A | | 4.250 | | 03/15/29 | | | 250 | | | | 208,882 | |
Kronos Acquisition Holdings, Inc./KIK Custom Products, Inc. (Canada), | | | | | | | | | | | | |
Gtd. Notes, 144A | | 7.000 | | 12/31/27 | | | 125 | | | | 103,125 | |
Sr. Sec’d. Notes, 144A | | 5.000 | | 12/31/26 | | | 25 | | | | 22,594 | |
| | | | | | | | | | | | |
| | | | |
| | | | | | | | | | | 334,601 | |
See Notes to Financial Statements.
82
PGIM Active High Yield Bond ETF
Schedule of Investments (continued)
as of August 31, 2022
| | | | | | | | | | | | |
| | | | |
| Description | | Interest
Rate | | Maturity
Date | | Principal
Amount (000)# | | | Value | |
| | | | |
CORPORATE BONDS (Continued) | | | | | | | | | | | | |
| | | | |
Housewares 0.5% | | | | | | | | | | | | |
Scotts Miracle-Gro Co. (The), | | | | | | | | | | | | |
Gtd. Notes | | 4.000% | | 04/01/31 | | | 175 | | | $ | 132,328 | |
Gtd. Notes | | 4.375 | | 02/01/32 | | | 50 | | | | 37,743 | |
SWF Escrow Issuer Corp., | | | | | | | | | | | | |
Sr. Unsec’d. Notes, 144A | | 6.500 | | 10/01/29 | | | 375 | | | | 272,241 | |
| | | | | | | | | | | | |
| | | | |
| | | | | | | | | | | 442,312 | |
| | | | |
Insurance 0.1% | | | | | | | | | | | | |
BroadStreet Partners, Inc., | | | | | | | | | | | | |
Sr. Unsec’d. Notes, 144A | | 5.875 | | 04/15/29 | | | 75 | | | | 62,209 | |
| | | | |
Internet 0.4% | | | | | | | | | | | | |
Go Daddy Operating Co. LLC/GD Finance Co., Inc., | | | | | | | | | | | | |
Gtd. Notes, 144A | | 3.500 | | 03/01/29 | | | 245 | | | | 207,639 | |
NortonLifeLock, Inc., | | | | | | | | | | | | |
Sr. Unsec’d. Notes, 144A | | 5.000 | | 04/15/25 | | | 140 | | | | 138,093 | |
| | | | | | | | | | | | |
| | | | |
| | | | | | | | | | | 345,732 | |
| | | | |
Iron/Steel 0.3% | | | | | | | | | | | | |
Big River Steel LLC/BRS Finance Corp., | | | | | | | | | | | | |
Sr. Sec’d. Notes, 144A | | 6.625 | | 01/31/29 | | | 116 | | | | 116,259 | |
Commercial Metals Co., | | | | | | | | | | | | |
Sr. Unsec’d. Notes | | 4.125 | | 01/15/30 | | | 25 | | | | 21,948 | |
Sr. Unsec’d. Notes | | 4.375 | | 03/15/32 | | | 100 | | | | 85,271 | |
TMS International Corp., | | | | | | | | | | | | |
Sr. Unsec’d. Notes, 144A | | 6.250 | | 04/15/29 | | | 25 | | | | 17,438 | |
United States Steel Corp., | | | | | | | | | | | | |
Sr. Unsec’d. Notes | | 6.875 | | 03/01/29 | | | 50 | | | | 48,431 | |
| | | | | | | | | | | | |
| | | | |
| | | | | | | | | | | 289,347 | |
| | | | |
Leisure Time 0.1% | | | | | | | | | | | | |
Viking Cruises Ltd., | | | | | | | | | | | | |
Gtd. Notes, 144A | | 5.875 | | 09/15/27 | | | 25 | | | | 20,163 | |
See Notes to Financial Statements.
PGIM Fixed Income ETFs 83
PGIM Active High Yield Bond ETF
Schedule of Investments (continued)
as of August 31, 2022
| | | | | | | | | | | | |
| | | | |
| Description | | Interest
Rate | | Maturity
Date | | Principal
Amount (000)# | | | Value | |
| | | | |
CORPORATE BONDS (Continued) | | | | | | | | | | | | |
| | | | |
Leisure Time (cont’d.) | | | | | | | | | | | | |
Viking Ocean Cruises Ship VII Ltd., | | | | | | | | | | | | |
Sr. Sec’d. Notes, 144A | | 5.625% | | 02/15/29 | | | 25 | | | $ | 20,375 | |
Vista Outdoor, Inc., | | | | | | | | | | | | |
Gtd. Notes, 144A | | 4.500 | | 03/15/29 | | | 50 | | | | 37,373 | |
| | | | | | | | | | | | |
| | | | |
| | | | | | | | | | | 77,911 | |
| | | | |
Lodging 1.5% | | | | | | | | | | | | |
Boyd Gaming Corp., | | | | | | | | | | | | |
Gtd. Notes, 144A | | 4.750 | | 06/15/31 | | | 50 | | | | 43,558 | |
Hilton Domestic Operating Co., Inc., | | | | | | | | | | | | |
Gtd. Notes, 144A | | 3.625 | | 02/15/32 | | | 605 | | | | 488,707 | |
MGM Resorts International, | | | | | | | | | | | | |
Gtd. Notes | | 4.625 | | 09/01/26 | | | 75 | | | | 68,362 | |
Gtd. Notes | | 4.750 | | 10/15/28 | | | 450 | | | | 395,728 | |
Gtd. Notes | | 5.500 | | 04/15/27 | | | 300 | | | | 276,477 | |
Wynn Macau Ltd. (Macau), | | | | | | | | | | | | |
Sr. Unsec’d. Notes, 144A | | 5.625 | | 08/26/28 | | | 200 | | | | 140,000 | |
| | | | | | | | | | | | |
| | | | |
| | | | | | | | | | | 1,412,832 | |
| | | | |
Machinery-Construction & Mining 0.2% | | | | | | | | | | | | |
Terex Corp., | | | | | | | | | | | | |
Gtd. Notes, 144A | | 5.000 | | 05/15/29 | | | 250 | | | | 223,864 | |
| | | | |
Machinery-Diversified 0.8% | | | | | | | | | | | | |
GrafTech Finance, Inc., | | | | | | | | | | | | |
Sr. Sec’d. Notes, 144A | | 4.625 | | 12/15/28 | | | 190 | | | | 162,191 | |
Maxim Crane Works Holdings Capital LLC, | | | | | | | | | | | | |
Sec’d. Notes, 144A | | 10.125 | | 08/01/24 | | | 382 | | | | 363,322 | |
TK Elevator US Newco, Inc. (Germany), | | | | | | | | | | | | |
Sr. Sec’d. Notes, 144A | | 5.250 | | 07/15/27 | | | 250 | | | | 227,500 | |
| | | | | | | | | | | | |
| | | | |
| | | | | | | | | | | 753,013 | |
| | | | |
Media 7.8% | | | | | | | | | | | | |
CCO Holdings LLC/CCO Holdings Capital Corp., | | | | | | | | | | | | |
Sr. Unsec’d. Notes | | 4.500 | | 05/01/32 | | | 872 | | | | 707,078 | |
Sr. Unsec’d. Notes, 144A | | 4.250 | | 02/01/31 | | | 650 | | | | 530,786 | |
Sr. Unsec’d. Notes, 144A | | 4.250 | | 01/15/34 | | | 250 | | | | 190,322 | |
See Notes to Financial Statements.
84
PGIM Active High Yield Bond ETF
Schedule of Investments (continued)
as of August 31, 2022
| | | | | | | | | | | | |
| | | | |
| Description | | Interest
Rate | | Maturity
Date | | Principal
Amount (000)# | | | Value | |
| | | | |
CORPORATE BONDS (Continued) | | | | | | | | | | | | |
| | | | |
Media (cont’d.) | | | | | | | | | | | | |
CCO Holdings LLC/CCO Holdings Capital Corp., (cont’d.) | | | | | | | | | | | | |
Sr. Unsec’d. Notes, 144A | | 4.500% | | 06/01/33 | | | 575 | | | $ | 454,808 | |
Sr. Unsec’d. Notes, 144A | | 4.750 | | 03/01/30 | | | 367 | | | | 315,353 | |
Sr. Unsec’d. Notes, 144A | | 4.750 | | 02/01/32 | | | 100 | | | | 82,821 | |
Sr. Unsec’d. Notes, 144A | | 5.000 | | 02/01/28 | | | 50 | | | | 45,646 | |
Sr. Unsec’d. Notes, 144A | | 5.375 | | 06/01/29 | | | 100 | | | | 91,399 | |
Sr. Unsec’d. Notes, 144A | | 5.500 | | 05/01/26 | | | 200 | | | | 197,178 | |
CSC Holdings LLC, | | | | | | | | | | | | |
Gtd. Notes, 144A | | 3.375 | | 02/15/31 | | | 200 | | | | 150,021 | |
Gtd. Notes, 144A | | 4.125 | | 12/01/30 | | | 200 | | | | 162,000 | |
Gtd. Notes, 144A | | 4.500 | | 11/15/31 | | | 200 | | | | 161,238 | |
Gtd. Notes, 144A | | 5.375 | | 02/01/28 | | | 680 | | | | 614,597 | |
Sr. Unsec’d. Notes, 144A | | 4.625 | | 12/01/30 | | | 325 | | | | 232,263 | |
Sr. Unsec’d. Notes, 144A | | 5.750 | | 01/15/30 | | | 500 | | | | 387,048 | |
Diamond Sports Group LLC/Diamond Sports Finance Co., | | | | | | | | | | | | |
Gtd. Notes, 144A | | 6.625 | | 08/15/27 | | | 1,251 | | | | 112,941 | |
Sec’d. Notes, 144A | | 5.375 | | 08/15/26 | | | 1,235 | | | | 234,799 | |
DISH DBS Corp., | | | | | | | | | | | | |
Gtd. Notes | | 5.125 | | 06/01/29 | | | 555 | | | | 328,699 | |
Gtd. Notes | | 7.375 | | 07/01/28 | | | 280 | | | | 183,460 | |
Gtd. Notes | | 7.750 | | 07/01/26 | | | 309 | | | | 243,404 | |
Gray Television, Inc., | | | | | | | | | | | | |
Gtd. Notes, 144A | | 5.875 | | 07/15/26 | | | 100 | | | | 96,545 | |
Gtd. Notes, 144A | | 7.000 | | 05/15/27 | | | 75 | | | | 74,029 | |
iHeartCommunications, Inc., | | | | | | | | | | | | |
Sr. Sec’d. Notes | | 6.375 | | 05/01/26 | | | 40 | | | | 37,819 | |
Sr. Sec’d. Notes, 144A | | 5.250 | | 08/15/27 | | | 100 | | | | 90,039 | |
News Corp., | | | | | | | | | | | | |
Sr. Unsec’d. Notes, 144A | | 3.875 | | 05/15/29 | | | 25 | | | | 21,982 | |
Nexstar Media, Inc., | | | | | | | | | | | | |
Gtd. Notes, 144A | | 4.750 | | 11/01/28 | | | 50 | | | | 45,280 | |
Gtd. Notes, 144A | | 5.625 | | 07/15/27 | | | 150 | | | | 142,934 | |
Radiate Holdco LLC/Radiate Finance, Inc., | | | | | | | | | | | | |
Sr. Sec’d. Notes, 144A | | 4.500 | | 09/15/26 | | | 225 | | | | 194,056 | |
Sr. Unsec’d. Notes, 144A | | 6.500 | | 09/15/28 | | | 200 | | | | 149,014 | |
Univision Communications, Inc., | | | | | | | | | | | | |
Sr. Sec’d. Notes, 144A | | 4.500 | | 05/01/29 | | | 175 | | | | 153,008 | |
Sr. Sec’d. Notes, 144A | | 5.125 | | 02/15/25 | | | 100 | | | | 96,589 | |
Sr. Sec’d. Notes, 144A | | 6.625 | | 06/01/27 | | | 325 | | | | 314,703 | |
See Notes to Financial Statements.
PGIM Fixed Income ETFs 85
PGIM Active High Yield Bond ETF
Schedule of Investments (continued)
as of August 31, 2022
| | | | | | | | | | | | |
| | | | |
| Description | | Interest
Rate | | Maturity
Date | | Principal
Amount (000)# | | | Value | |
| | | | |
CORPORATE BONDS (Continued) | | | | | | | | | | | | |
| | | | |
Media (cont’d.) | | | | | | | | | | | | |
Videotron Ltd. (Canada), | | | | | | | | | | | | |
Gtd. Notes, 144A | | 5.125% | | 04/15/27 | | | 150 | | | $ | 140,625 | |
VZ Secured Financing BV (Netherlands), | | | | | | | | | | | | |
Sr. Sec’d. Notes, 144A | | 5.000 | | 01/15/32 | | | 450 | | | | 369,000 | |
| | | | | | | | | | | | |
| | | | |
| | | | | | | | | | | 7,351,484 | |
| | | | |
Mining 1.1% | | | | | | | | | | | | |
Eldorado Gold Corp. (Turkey), | | | | | | | | | | | | |
Sr. Unsec’d. Notes, 144A | | 6.250 | | 09/01/29 | | | 200 | | | | 159,938 | |
First Quantum Minerals Ltd. (Zambia), | | | | | | | | | | | | |
Gtd. Notes, 144A | | 6.500 | | 03/01/24 | | | 315 | | | | 311,850 | |
FMG Resources August 2006 Pty Ltd. (Australia), | | | | | | | | | | | | |
Sr. Unsec’d. Notes, 144A | | 6.125 | | 04/15/32 | | | 100 | | | | 92,194 | |
Hecla Mining Co., | | | | | | | | | | | | |
Gtd. Notes | | 7.250 | | 02/15/28 | | | 75 | | | | 71,466 | |
Hudbay Minerals, Inc. (Canada), | | | | | | | | | | | | |
Gtd. Notes, 144A | | 4.500 | | 04/01/26 | | | 50 | | | | 44,750 | |
Gtd. Notes, 144A | | 6.125 | | 04/01/29 | | | 110 | | | | 96,250 | |
New Gold, Inc. (Canada), | | | | | | | | | | | | |
Gtd. Notes, 144A | | 7.500 | | 07/15/27 | | | 170 | | | | 134,300 | |
Novelis Corp., | | | | | | | | | | | | |
Gtd. Notes, 144A | | 3.875 | | 08/15/31 | | | 100 | | | | 80,692 | |
Gtd. Notes, 144A | | 4.750 | | 01/30/30 | | | 75 | | | | 65,548 | |
| | | | | | | | | | | | |
| | | | |
| | | | | | | | | | | 1,056,988 | |
| | | | |
Miscellaneous Manufacturing 0.3% | | | | | | | | | | | | |
Amsted Industries, Inc., | | | | | | | | | | | | |
Gtd. Notes, 144A | | 5.625 | | 07/01/27 | | | 25 | | | | 24,251 | |
Sr. Unsec’d. Notes, 144A | | 4.625 | | 05/15/30 | | | 235 | | | | 209,652 | |
| | | | | | | | | | | | |
| | | | |
| | | | | | | | | | | 233,903 | |
| | | | |
Office/Business Equipment 0.1% | | | | | | | | | | | | |
CDW LLC/CDW Finance Corp., | | | | | | | | | | | | |
Gtd. Notes | | 3.250 | | 02/15/29 | | | 75 | | | | 65,226 | |
See Notes to Financial Statements.
86
PGIM Active High Yield Bond ETF
Schedule of Investments (continued)
as of August 31, 2022
| | | | | | | | | | | | |
| | | | |
| Description | | Interest
Rate | | Maturity
Date | | Principal
Amount (000)# | | | Value | |
| | | | |
CORPORATE BONDS (Continued) | | | | | | | | | | | | |
| | | | |
Oil & Gas 6.0% | | | | | | | | | | | | |
Aethon United BR LP/Aethon United Finance Corp., | | | | | | | | | | | | |
Sr. Unsec’d. Notes, 144A | | 8.250% | | 02/15/26 | | | 125 | | | $ | 125,059 | |
Alta Mesa Holdings LP/Alta Mesa Finance Services Corp., | | | | | | | | | | | | |
Sr. Unsec’d. Notes^ | | 7.875 | | 12/15/24(d) | | | 310 | | | | 2,108 | |
Antero Resources Corp., | | | | | | | | | | | | |
Gtd. Notes, 144A | | 5.375 | | 03/01/30 | | | 325 | | | | 305,997 | |
Gtd. Notes, 144A | | 7.625 | | 02/01/29 | | | 103 | | | | 104,773 | |
Ascent Resources Utica Holdings LLC/ARU Finance Corp., | | | | | | | | | | | | |
Gtd. Notes, 144A | | 7.000 | | 11/01/26 | | | 400 | | | | 392,559 | |
Gtd. Notes, 144A | | 9.000 | | 11/01/27 | | | 112 | | | | 136,060 | |
Athabasca Oil Corp. (Canada), | | | | | | | | | | | | |
Sec’d. Notes, 144A | | 9.750 | | 11/01/26 | | | 212 | | | | 221,540 | |
Chesapeake Energy Corp., | | | | | | | | | | | | |
Gtd. Notes, 144A | | 5.500 | | 02/01/26 | | | 25 | | | | 24,109 | |
Gtd. Notes, 144A | | 5.875 | | 02/01/29 | | | 250 | | | | 239,031 | |
Gtd. Notes, 144A | | 6.750 | | 04/15/29 | | | 100 | | | | 98,270 | |
CITGO Petroleum Corp., | | | | | | | | | | | | |
Sr. Sec’d. Notes, 144A | | 7.000 | | 06/15/25 | | | 100 | | | | 97,569 | |
CNX Resources Corp., | | | | | | | | | | | | |
Gtd. Notes, 144A | | 7.250 | | 03/14/27 | | | 275 | | | | 273,334 | |
Comstock Resources, Inc., | | | | | | | | | | | | |
Gtd. Notes, 144A | | 5.875 | | 01/15/30 | | | 50 | | | | 46,052 | |
Gtd. Notes, 144A | | 6.750 | | 03/01/29 | | | 125 | | | | 119,446 | |
CrownRock LP/CrownRock Finance, Inc., | | | | | | | | | | | | |
Sr. Unsec’d. Notes, 144A | | 5.000 | | 05/01/29 | | | 25 | | | | 23,138 | |
Sr. Unsec’d. Notes, 144A | | 5.625 | | 10/15/25 | | | 25 | | | | 24,626 | |
Endeavor Energy Resources LP/EER Finance, Inc., | | | | | | | | | | | | |
Sr. Unsec’d. Notes, 144A | | 5.750 | | 01/30/28 | | | 325 | | | | 321,182 | |
Hilcorp Energy I LP/Hilcorp Finance Co., | | | | | | | | | | | | |
Sr. Unsec’d. Notes, 144A | | 5.750 | | 02/01/29 | | | 175 | | | | 160,799 | |
Sr. Unsec’d. Notes, 144A | | 6.000 | | 04/15/30 | | | 75 | | | | 69,185 | |
Sr. Unsec’d. Notes, 144A | | 6.000 | | 02/01/31 | | | 225 | | | | 203,854 | |
Sr. Unsec’d. Notes, 144A | | 6.250 | | 11/01/28 | | | 25 | | | | 23,704 | |
Sr. Unsec’d. Notes, 144A | | 6.250 | | 04/15/32 | | | 100 | | | | 89,934 | |
MEG Energy Corp. (Canada), | | | | | | | | | | | | |
Gtd. Notes, 144A | | 5.875 | | 02/01/29 | | | 50 | | | | 46,500 | |
Gtd. Notes, 144A | | 7.125 | | 02/01/27 | | | 350 | | | | 352,145 | |
See Notes to Financial Statements.
PGIM Fixed Income ETFs 87
PGIM Active High Yield Bond ETF
Schedule of Investments (continued)
as of August 31, 2022
| | | | | | | | | | | | |
| | | | |
| Description | | Interest
Rate | | Maturity
Date | | Principal
Amount (000)# | | | Value | |
| | | | |
CORPORATE BONDS (Continued) | | | | | | | | | | | | |
| | | | |
Oil & Gas (cont’d.) | | | | | | | | | | | | |
Nabors Industries Ltd., | | | | | | | | | | | | |
Gtd. Notes, 144A | | 7.250% | | 01/15/26 | | | 125 | | | $ | 113,250 | |
Gtd. Notes, 144A | | 7.500 | | 01/15/28 | | | 325 | | | | 293,248 | |
Nabors Industries, Inc., | | | | | | | | | | | | |
Gtd. Notes | | 5.750 | | 02/01/25 | | | 275 | | | | 253,443 | |
Occidental Petroleum Corp., | | | | | | | | | | | | |
Sr. Unsec’d. Notes | | 7.150 | | 05/15/28 | | | 50 | | | | 53,369 | |
Parkland Corp. (Canada), | | | | | | | | | | | | |
Gtd. Notes, 144A | | 4.500 | | 10/01/29 | | | 125 | | | | 106,875 | |
Gtd. Notes, 144A | | 4.625 | | 05/01/30 | | | 150 | | | | 128,250 | |
Precision Drilling Corp. (Canada), | | | | | | | | | | | | |
Gtd. Notes, 144A | | 6.875 | | 01/15/29 | | | 25 | | | | 22,813 | |
Gtd. Notes, 144A | | 7.125 | | 01/15/26 | | | 75 | | | | 71,813 | |
Range Resources Corp., | | | | | | | | | | | | |
Gtd. Notes | | 4.875 | | 05/15/25 | | | 250 | | | | 242,426 | |
Gtd. Notes, 144A | | 4.750 | | 02/15/30 | | | 145 | | | | 134,428 | |
Southwestern Energy Co., | | | | | | | | | | | | |
Gtd. Notes | | 4.750 | | 02/01/32 | | | 300 | | | | 267,163 | |
Gtd. Notes | | 5.375 | | 02/01/29 | | | 25 | | | | 23,661 | |
Gtd. Notes | | 5.375 | | 03/15/30 | | | 125 | | | | 117,010 | |
Sunoco LP/Sunoco Finance Corp., | | | | | | | | | | | | |
Gtd. Notes | | 4.500 | | 05/15/29 | | | 75 | | | | 64,543 | |
Gtd. Notes | | 4.500 | | 04/30/30 | | | 75 | | | | 64,023 | |
Gtd. Notes | | 5.875 | | 03/15/28 | | | 100 | | | | 93,565 | |
Transocean, Inc., | | | | | | | | | | | | |
Gtd. Notes, 144A | | 7.250 | | 11/01/25 | | | 85 | | | | 67,575 | |
| | | | | | | | | | | | |
| | | | |
| | | | | | | | | | | 5,618,429 | |
| | | | |
Packaging & Containers 1.4% | | | | | | | | | | | | |
ARD Finance SA (Luxembourg), | | | | | | | | | | | | |
Sr. Sec’d. Notes, 144A, Cash coupon 6.500% or PIK 7.250% | | 6.500 | | 06/30/27 | | | 200 | | | | 155,112 | |
Ardagh Metal Packaging Finance USA LLC/Ardagh Metal Packaging Finance PLC, | | | | | | | | | | | | |
Sr. Unsec’d. Notes, 144A | | 4.000 | | 09/01/29 | | | 200 | | | | 164,000 | |
Graham Packaging Co., Inc., | | | | | | | | | | | | |
Gtd. Notes, 144A | | 7.125 | | 08/15/28 | | | 85 | | | | 73,022 | |
See Notes to Financial Statements.
88
PGIM Active High Yield Bond ETF
Schedule of Investments (continued)
as of August 31, 2022
| | | | | | | | | | | | |
| | | | |
| Description | | Interest
Rate | | Maturity
Date | | Principal
Amount (000)# | | | Value | |
| | | | |
CORPORATE BONDS (Continued) | | | | | | | | | | | | |
| | | | |
Packaging & Containers (cont’d.) | | | | | | | | | | | | |
Intelligent Packaging Holdco Issuer LP (Canada), | | | | | | | | | | | | |
Sr. Unsec’d. Notes, 144A, Cash coupon 9.000% or PIK 9.750% | | 9.000% | | 01/15/26 | | | 75 | | | $ | 61,594 | |
Intelligent Packaging Ltd. Finco, Inc./Intelligent Packaging Ltd. Co-Issuer LLC (Canada), | | | | | | | | | | | | |
Sr. Sec’d. Notes, 144A | | 6.000 | | 09/15/28 | | | 275 | | | | 235,125 | |
LABL, Inc., | | | | | | | | | | | | |
Sr. Sec’d. Notes, 144A | | 5.875 | | 11/01/28 | | | 175 | | | | 157,512 | |
Sr. Unsec’d. Notes, 144A | | 8.250 | | 11/01/29 | | | 175 | | | | 141,711 | |
Sr. Unsec’d. Notes, 144A | | 10.500 | | 07/15/27 | | | 75 | | | | 71,345 | |
OI European Group BV, | | | | | | | | | | | | |
Gtd. Notes, 144A | | 4.750 | | 02/15/30 | | | 50 | | | | 40,485 | |
Owens-Brockway Glass Container, Inc., | | | | | | | | | | | | |
Gtd. Notes, 144A | | 6.375 | | 08/15/25 | | | 50 | | | | 48,361 | |
Gtd. Notes, 144A | | 6.625 | | 05/13/27 | | | 25 | | | | 23,261 | |
Pactiv Evergreen Group Issuer LLC/Pactiv Evergreen Group Issuer, Inc., | | | | | | | | | | | | |
Sr. Sec’d. Notes, 144A | | 4.375 | | 10/15/28 | | | 50 | | | | 44,056 | |
Trident TPI Holdings, Inc., | | | | | | | | | | | | |
Gtd. Notes, 144A | | 9.250 | | 08/01/24 | | | 50 | | | | 46,725 | |
TriMas Corp., | | | | | | | | | | | | |
Gtd. Notes, 144A | | 4.125 | | 04/15/29 | | | 50 | | | | 44,278 | |
| | | | | | | | | | | | |
| | | | |
| | | | | | | | | | | 1,306,587 | |
| | | | |
Pharmaceuticals 2.2% | | | | | | | | | | | | |
AdaptHealth LLC, | | | | | | | | | | | | |
Gtd. Notes, 144A | | 4.625 | | 08/01/29 | | | 175 | | | | 143,453 | |
Gtd. Notes, 144A | | 5.125 | | 03/01/30 | | | 50 | | | | 42,940 | |
Gtd. Notes, 144A | | 6.125 | | 08/01/28 | | | 145 | | | | 136,321 | |
Bausch Health Americas, Inc., | | | | | | | | | | | | |
Gtd. Notes, 144A | | 8.500 | | 01/31/27 | | | 400 | | | | 191,900 | |
Bausch Health Cos., Inc., | | | | | | | | | | | | |
Gtd. Notes, 144A | | 5.000 | | 02/15/29 | | | 50 | | | | 19,375 | |
Gtd. Notes, 144A | | 5.250 | | 01/30/30 | | | 250 | | | | 92,500 | |
Gtd. Notes, 144A | | 5.250 | | 02/15/31 | | | 150 | | | | 57,375 | |
Gtd. Notes, 144A | | 6.250 | | 02/15/29 | | | 1,515 | | | | 568,125 | |
Sr. Sec’d. Notes, 144A | | 4.875 | | 06/01/28 | | | 50 | | | | 34,563 | |
Embecta Corp., | | | | | | | | | | | | |
Sr. Sec’d. Notes, 144A | | 5.000 | | 02/15/30 | | | 150 | | | | 131,627 | |
See Notes to Financial Statements.
PGIM Fixed Income ETFs 89
PGIM Active High Yield Bond ETF
Schedule of Investments (continued)
as of August 31, 2022
| | | | | | | | | | | | |
| | | | |
| Description | | Interest
Rate | | Maturity
Date | | Principal
Amount (000)# | | | Value | |
| | | | |
CORPORATE BONDS (Continued) | | | | | | | | | | | | |
| | | | |
Pharmaceuticals (cont’d.) | | | | | | | | | | | | |
Embecta Corp., (cont’d.) | | | | | | | | | | | | |
Sr. Sec’d. Notes, 144A | | 6.750% | | 02/15/30 | | | 25 | | | $ | 23,995 | |
Jazz Securities DAC, | | | | | | | | | | | | |
Sr. Sec’d. Notes, 144A | | 4.375 | | 01/15/29 | | | 200 | | | | 179,700 | |
Organon & Co./Organon Foreign Debt Co-Issuer BV, | | | | | | | | | | | | |
Sr. Sec’d. Notes, 144A | | 4.125 | | 04/30/28 | | | 200 | | | | 179,290 | |
Sr. Unsec’d. Notes, 144A | | 5.125 | | 04/30/31 | | | 200 | | | | 175,010 | |
P&L Development LLC/PLD Finance Corp., | | | | | | | | | | | | |
Sr. Sec’d. Notes, 144A | | 7.750 | | 11/15/25 | | | 125 | | | | 88,916 | |
| | | | | | | | | | | | |
| | | | |
| | | | | | | | | | | 2,065,090 | |
| | | | |
Pipelines 2.6% | | | | | | | | | | | | |
Antero Midstream Partners LP/Antero Midstream Finance Corp., | | | | | | | | | | | | |
Gtd. Notes, 144A | | 5.375 | | 06/15/29 | | | 75 | | | | 68,907 | |
Gtd. Notes, 144A | | 5.750 | | 03/01/27 | | | 285 | | | | 271,071 | |
Gtd. Notes, 144A | | 5.750 | | 01/15/28 | | | 125 | | | | 118,774 | |
Gtd. Notes, 144A | | 7.875 | | 05/15/26 | | | 100 | | | | 101,840 | |
Cheniere Energy Partners LP, | | | | | | | | | | | | |
Gtd. Notes | | 4.000 | | 03/01/31 | | | 150 | | | | 130,831 | |
Gtd. Notes | | 4.500 | | 10/01/29 | | | 100 | | | | 92,129 | |
Cheniere Energy, Inc., | | | | | | | | | | | | |
Sr. Unsec’d. Notes | | 4.625 | | 10/15/28 | | | 300 | | | | 288,901 | |
CNX Midstream Partners LP, | | | | | | | | | | | | |
Gtd. Notes, 144A | | 4.750 | | 04/15/30 | | | 25 | | | | 21,000 | |
DCP Midstream Operating LP, | | | | | | | | | | | | |
Gtd. Notes | | 5.625 | | 07/15/27 | | | 20 | | | | 20,255 | |
Energy Transfer LP, | | | | | | | | | | | | |
Jr. Sub. Notes, Series G | | 7.125(ff) | | 05/15/30(oo) | | | 50 | | | | 45,680 | |
EQM Midstream Partners LP, | | | | | | | | | | | | |
Sr. Unsec’d. Notes | | 5.500 | | 07/15/28 | | | 25 | | | | 22,901 | |
Sr. Unsec’d. Notes, 144A | | 6.000 | | 07/01/25 | | | 45 | | | | 43,527 | |
Sr. Unsec’d. Notes, 144A | | 6.500 | | 07/01/27 | | | 70 | | | | 67,702 | |
Sr. Unsec’d. Notes, 144A | | 7.500 | | 06/01/27 | | | 100 | | | | 98,995 | |
Sr. Unsec’d. Notes, 144A | | 7.500 | | 06/01/30 | | | 25 | | | | 24,827 | |
Global Partners LP/GLP Finance Corp., | | | | | | | | | | | | |
Gtd. Notes | | 6.875 | | 01/15/29 | | | 175 | | | | 160,679 | |
Rockies Express Pipeline LLC, | | | | | | | | | | | | |
Sr. Unsec’d. Notes, 144A | | 3.600 | | 05/15/25 | | | 200 | | | | 184,173 | |
See Notes to Financial Statements.
90
PGIM Active High Yield Bond ETF
Schedule of Investments (continued)
as of August 31, 2022
| | | | | | | | | | | | |
| | | | |
| Description | | Interest
Rate | | Maturity
Date | | Principal
Amount (000)# | | | Value | |
| | | | |
CORPORATE BONDS (Continued) | | | | | | | | | | | | |
| | | | |
Pipelines (cont’d.) | | | | | | | | | | | | |
Rockies Express Pipeline LLC, (cont’d.) | | | | | | | | | | | | |
Sr. Unsec’d. Notes, 144A | | 7.500% | | 07/15/38 | | | 125 | | | $ | 109,344 | |
Tallgrass Energy Partners LP/Tallgrass Energy Finance Corp., | | | | | | | | | | | | |
Gtd. Notes, 144A | | 5.500 | | 01/15/28 | | | 75 | | | | 64,423 | |
Gtd. Notes, 144A | | 6.000 | | 03/01/27 | | | 134 | | | | 122,812 | |
Gtd. Notes, 144A | | 6.000 | | 12/31/30 | | | 75 | | | | 66,047 | |
Gtd. Notes, 144A | | 6.000 | | 09/01/31 | | | 50 | | | | 43,990 | |
Gtd. Notes, 144A | | 7.500 | | 10/01/25 | | | 100 | | | | 100,110 | |
Venture Global Calcasieu Pass LLC, | | | | | | | | | | | | |
Sr. Sec’d. Notes, 144A | | 3.875 | | 08/15/29 | | | 190 | | | | 166,818 | |
Sr. Sec’d. Notes, 144A | | 4.125 | | 08/15/31 | | | 40 | | | | 34,873 | |
Western Midstream Operating LP, | | | | | | | | | | | | |
Sr. Unsec’d. Notes | | 3.950 | | 06/01/25 | | | 25 | | | | 23,922 | |
| | | | | | | | | | | | |
| | | | |
| | | | | | | | | | | 2,494,531 | |
| | | | |
Real Estate 1.6% | | | | | | | | | | | | |
Five Point Operating Co. LP/Five Point Capital Corp., | | | | | | | | | | | | |
Gtd. Notes, 144A | | 7.875 | | 11/15/25 | | | 352 | | | | 312,066 | |
Greystar Real Estate Partners LLC, | | | | | | | | | | | | |
Sr. Sec’d. Notes, 144A | | 5.750 | | 12/01/25 | | | 225 | | | | 222,918 | |
Howard Hughes Corp. (The), | | | | | | | | | | | | |
Gtd. Notes, 144A | | 4.125 | | 02/01/29 | | | 250 | | | | 211,551 | |
Gtd. Notes, 144A | | 4.375 | | 02/01/31 | | | 250 | | | | 200,134 | |
Gtd. Notes, 144A | | 5.375 | | 08/01/28 | | | 80 | | | | 71,185 | |
Hunt Cos., Inc., | | | | | | | | | | | | |
Sr. Sec’d. Notes, 144A | | 5.250 | | 04/15/29 | | | 325 | | | | 276,315 | |
Realogy Group LLC/Realogy Co-Issuer Corp., | | | | | | | | | | | | |
Gtd. Notes, 144A | | 5.250 | | 04/15/30 | | | 175 | | | | 131,890 | |
Gtd. Notes, 144A | | 5.750 | | 01/15/29 | | | 50 | | | | 39,203 | |
| | | | | | | | | | | | |
| | | | |
| | | | | | | | | | | 1,465,262 | |
| | | | |
Real Estate Investment Trusts (REITs) 2.2% | | | | | | | | | | | | |
Diversified Healthcare Trust, | | | | | | | | | | | | |
Gtd. Notes | | 4.375 | | 03/01/31 | | | 225 | | | | 154,354 | |
Gtd. Notes | | 9.750 | | 06/15/25 | | | 215 | | | | 211,296 | |
Sr. Unsec’d. Notes | | 4.750 | | 05/01/24 | | | 200 | | | | 182,495 | |
Sr. Unsec’d. Notes | | 4.750 | | 02/15/28 | | | 225 | | | | 165,356 | |
See Notes to Financial Statements.
PGIM Fixed Income ETFs 91
PGIM Active High Yield Bond ETF
Schedule of Investments (continued)
as of August 31, 2022
| | | | | | | | | | | | |
| Description | | Interest Rate | | Maturity Date | | Principal Amount (000)# | | | Value | |
| | | | |
CORPORATE BONDS (Continued) | | | | | | | | | | | | |
| | | | |
Real Estate Investment Trusts (REITs) (cont’d.) | | | | | | | | | | | | |
Park Intermediate Holdings LLC/PK Domestic Property LLC/PK Finance Co-Issuer, | | | | | | | | | | | | |
Sr. Sec’d. Notes, 144A | | 7.500% | | 06/01/25 | | | 196 | | | $ | 197,980 | |
RHP Hotel Properties LP/RHP Finance Corp.,
Gtd. Notes | | 4.750 | | 10/15/27 | | | 100 | | | | 90,915 | |
Uniti Group LP/Uniti Fiber Holdings, Inc./CSL Capital LLC, | | | | | | | | | | | | |
Sr. Sec’d. Notes, 144A | | 7.875 | | 02/15/25 | | | 980 | | | | 970,908 | |
Uniti Group LP/Uniti Group Finance, Inc./CSL Capital LLC, | | | | | | | | | | | | |
Sr. Sec’d. Notes, 144A | | 4.750 | | 04/15/28 | | | 150 | | | | 126,173 | |
| | | | | | | | | | | | |
| | | | |
| | | | | | | | | | | 2,099,477 | |
| | | | |
Retail 3.2% | | | | | | | | | | | | |
| | | | |
1011778 BC ULC/New Red Finance, Inc. (Canada), | | | | | | | | | | | | |
Sec’d. Notes, 144A | | 4.000 | | 10/15/30 | | | 250 | | | | 202,032 | |
Sr. Sec’d. Notes, 144A | | 3.875 | | 01/15/28 | | | 125 | | | | 110,706 | |
At Home Group, Inc., | | | | | | | | | | | | |
Gtd. Notes, 144A(a) | | 7.125 | | 07/15/29 | | | 200 | | | | 128,416 | |
Sr. Sec’d. Notes, 144A | | 4.875 | | 07/15/28 | | | 50 | | | | 36,619 | |
| | | | |
BCPE Ulysses Intermediate, Inc., | | | | | | | | | | | | |
Sr. Unsec’d. Notes, 144A, Cash coupon 7.750% or PIK 8.500% | | 7.750 | | 04/01/27 | | | 25 | | | | 18,760 | |
| | | | |
Carrols Restaurant Group, Inc., | | | | | | | | | | | | |
Gtd. Notes, 144A | | 5.875 | | 07/01/29 | | | 150 | | | | 113,114 | |
eG Global Finance PLC (United Kingdom), | | | | | | | | | | | | |
Sr. Sec’d. Notes, 144A | | 6.750 | | 02/07/25 | | | 400 | | | | 377,920 | |
Ferrellgas LP/Ferrellgas Finance Corp., | | | | | | | | | | | | |
Sr. Unsec’d. Notes, 144A | | 5.375 | | 04/01/26 | | | 25 | | | | 22,059 | |
Sr. Unsec’d. Notes, 144A | | 5.875 | | 04/01/29 | | | 75 | | | | 61,341 | |
Fertitta Entertainment LLC/Fertitta Entertainment Finance Co., Inc., | | | | | | | | | | | | |
Gtd. Notes, 144A | | 6.750 | | 01/15/30 | | | 250 | | | | 204,041 | |
Sr. Sec’d. Notes, 144A | | 4.625 | | 01/15/29 | | | 100 | | | | 87,331 | |
Foundation Building Materials, Inc., | | | | | | | | | | | | |
Gtd. Notes, 144A | | 6.000 | | 03/01/29 | | | 150 | | | | 122,692 | |
Gap, Inc. (The), | | | | | | | | | | | | |
Gtd. Notes, 144A | | 3.625 | | 10/01/29 | | | 100 | | | | 69,575 | |
Gtd. Notes, 144A | | 3.875 | | 10/01/31 | | | 275 | | | | 190,908 | |
See Notes to Financial Statements.
92
PGIM Active High Yield Bond ETF
Schedule of Investments (continued)
as of August 31, 2022
| | | | | | | | | | | | |
| Description | | Interest Rate | | Maturity Date | | Principal Amount (000)# | | | Value | |
| | | | |
CORPORATE BONDS (Continued) | | | | | | | | | | | | |
| | | | |
Retail (cont’d.) | | | | | | | | | | | | |
LBM Acquisition LLC, | | | | | | | | | | | | |
Gtd. Notes, 144A | | 6.250% | | 01/15/29 | | | 180 | | | $ | 135,028 | |
LCM Investments Holdings II LLC, | | | | | | | | | | | | |
Sr. Unsec’d. Notes, 144A | | 4.875 | | 05/01/29 | | | 75 | | | | 63,413 | |
Park River Holdings, Inc., | | | | | | | | | | | | |
Gtd. Notes, 144A | | 5.625 | | 02/01/29 | | | 250 | | | | 181,764 | |
Patrick Industries, Inc., | | | | | | | | | | | | |
Gtd. Notes, 144A | | 4.750 | | 05/01/29 | | | 75 | | | | 61,388 | |
Gtd. Notes, 144A | | 7.500 | | 10/15/27 | | | 75 | | | | 71,304 | �� |
SRS Distribution, Inc., | | | | | | | | | | | | |
Gtd. Notes, 144A | | 6.000 | | 12/01/29 | | | 75 | | | | 61,091 | |
Suburban Propane Partners LP/Suburban Energy Finance Corp., | | | | | | | | | | | | |
Sr. Unsec’d. Notes | | 5.875 | | 03/01/27 | | | 125 | | | | 122,095 | |
Sr. Unsec’d. Notes, 144A | | 5.000 | | 06/01/31 | | | 225 | | | | 198,957 | |
| | | | |
Superior Plus LP/Superior General Partner, Inc. (Canada), | | | | | | | | | | | | |
Gtd. Notes, 144A | | 4.500 | | 03/15/29 | | | 200 | | | | 176,362 | |
| | | | |
White Cap Buyer LLC, | | | | | | | | | | | | |
Sr. Unsec’d. Notes, 144A | | 6.875 | | 10/15/28 | | | 175 | | | | 154,020 | |
| | | | | | | | | | | | |
| | | | |
| | | | | | | | | | | 2,970,936 | |
| | | | |
Software 0.5% | | | | | | | | | | | | |
Black Knight InfoServ LLC, | | | | | | | | | | | | |
Gtd. Notes, 144A | | 3.625 | | 09/01/28 | | | 250 | | | | 219,222 | |
Boxer Parent Co., Inc., | | | | | | | | | | | | |
Sr. Sec’d. Notes, 144A | | 7.125 | | 10/02/25 | | | 50 | | | | 49,786 | |
Camelot Finance SA, | | | | | | | | | | | | |
Sr. Sec’d. Notes, 144A | | 4.500 | | 11/01/26 | | | 150 | | | | 139,500 | |
Dun & Bradstreet Corp. (The), | | | | | | | | | | | | |
Gtd. Notes, 144A | | 5.000 | | 12/15/29 | | | 25 | | | | 22,183 | |
Rackspace Technology Global, Inc., | | | | | | | | | | | | |
Sr. Sec’d. Notes, 144A | | 3.500 | | 02/15/28 | | | 110 | | | | 79,480 | |
| | | | | | | | | | | | |
| | | | |
| | | | | | | | | | | 510,171 | |
| | | | |
Telecommunications 3.8% | | | | | | | | | | | | |
| | | | |
Altice France SA (France), | | | | | | | | | | | | |
Sr. Sec’d. Notes, 144A | | 8.125 | | 02/01/27 | | | 600 | | | | 569,250 | |
See Notes to Financial Statements.
PGIM Fixed Income ETFs 93
PGIM Active High Yield Bond ETF
Schedule of Investments (continued)
as of August 31, 2022
| | | | | | | | | | | | |
| Description | | Interest Rate | | Maturity Date | | Principal Amount (000)# | | | Value | |
| | | | |
CORPORATE BONDS (Continued) | | | | | | | | | | | | |
| | | | |
Telecommunications (cont’d.) | | | | | | | | | | | | |
CommScope, Inc., | | | | | | | | | | | | |
Sr. Sec’d. Notes, 144A | | 6.000% | | 03/01/26 | | | 170 | | | $ | 160,768 | |
Digicel Group Holdings Ltd. (Jamaica), | | | | | | | | | | | | |
Sr. Unsec’d. Notes, 144A, Cash coupon 5.000% and PIK 3.000% | | 8.000 | | 04/01/25 | | | 203 | | | | 129,577 | |
Digicel International Finance Ltd./Digicel International Holdings Ltd. (Jamaica), | | | | | | | | | | | | |
Gtd. Notes, 144A | | 8.000 | | 12/31/26 | | | 200 | | | | 128,500 | |
Sr. Sec’d. Notes, 144A | | 8.750 | | 05/25/24 | | | 250 | | | | 234,688 | |
Digicel Ltd. (Jamaica), | | | | | | | | | | | | |
Gtd. Notes, 144A | | 6.750 | | 03/01/23 | | | 325 | | | | 205,124 | |
Iliad Holding SASU (France), | | | | | | | | | | | | |
Sr. Sec’d. Notes, 144A | | 7.000 | | 10/15/28 | | | 400 | | | | 361,124 | |
Intelsat Jackson Holdings SA (Luxembourg), | | | | | | | | | | | | |
Gtd. Notes, 144A^ | | 8.500 | | 10/15/24(d) | | | 25 | | | | — | |
Gtd. Notes, 144A^ | | 9.750 | | 07/15/25(d) | | | 295 | | | | — | |
Sr. Sec’d. Notes, 144A | | 6.500 | | 03/15/30 | | | 300 | | | | 271,944 | |
Sr. Unsec’d. Notes^ | | 5.500 | | 08/01/23(d) | | | 490 | | | | 1 | |
Level 3 Financing, Inc., | | | | | | | | | | | | |
Gtd. Notes, 144A | | 4.250 | | 07/01/28 | | | 600 | | | | 499,149 | |
Quebecor Media, Inc. (Canada), | | | | | | | | | | | | |
Sr. Unsec’d. Notes | | 5.750 | | 01/15/23 | | | 250 | | | | 249,375 | |
Sprint Capital Corp., | | | | | | | | | | | | |
Gtd. Notes | | 8.750 | | 03/15/32 | | | 125 | | | | 150,826 | |
Sprint Corp., | | | | | | | | | | | | |
Gtd. Notes | | 7.625 | | 03/01/26 | | | 75 | | | | 79,468 | |
Gtd. Notes | | 7.875 | | 09/15/23 | | | 75 | | | | 77,290 | |
Switch Ltd., | | | | | | | | | | | | |
Gtd. Notes, 144A | | 4.125 | | 06/15/29 | | | 25 | | | | 24,998 | |
Viasat, Inc., | | | | | | | | | | | | |
Sr. Unsec’d. Notes, 144A | | 5.625 | | 09/15/25 | | | 235 | | | | 209,382 | |
Zayo Group Holdings, Inc., | | | | | | | | | | | | |
Sr. Sec’d. Notes, 144A | | 4.000 | | 03/01/27 | | | 125 | | | | 106,596 | |
Sr. Unsec’d. Notes, 144A | | 6.125 | | 03/01/28 | | | 205 | | | | 157,063 | |
| | | | | | | | | | | | |
| | | | |
| | | | | | | | | | | 3,615,123 | |
See Notes to Financial Statements.
94
PGIM Active High Yield Bond ETF
Schedule of Investments (continued)
as of August 31, 2022
| | | | | | | | | | | | | | | | |
| Description | | Interest Rate | | | Maturity Date | | | Principal Amount (000)# | | | Value | |
| | | | |
CORPORATE BONDS (Continued) | | | | | | | | | | | | | | | | |
| | | | |
Trucking & Leasing 0.1% | | | | | | | | | | | | | | | | |
Fortress Transportation & Infrastructure Investors LLC, | | | | | | | | | | | | | | | | |
Sr. Unsec’d. Notes, 144A | | | 5.500% | | | | 05/01/28 | | | | 125 | | | $ | 106,996 | |
| | | | | | | | | | | | | | | | |
| | | | |
TOTAL CORPORATE BONDS
(cost $88,378,291) | | | | | | | | | | | | | | | 75,474,002 | |
| | | | | | | | | | | | | | | | |
| | | | |
U.S. TREASURY OBLIGATIONS 8.6% | | | | | | | | | | | | | | | | |
U.S. Treasury Notes(k) | | | 2.500 | | | | 03/31/27 | | | | 2,290 | | | | 2,205,019 | |
U.S. Treasury Notes | | | 2.625 | | | | 05/31/27 | | | | 4,020 | | | | 3,893,433 | |
U.S. Treasury Notes | | | 3.000 | | | | 07/31/24 | | | | 2,010 | | | | 1,992,570 | |
| | | | | | | | | | | | | | | | |
| | | | |
TOTAL U.S. TREASURY OBLIGATIONS
(cost $8,200,991) | | | | | | | | | | | | | | | 8,091,022 | |
| | | | | | | | | | | | | | | | |
| | | | |
| | | | | | | | | Shares | | | | |
| | | | |
COMMON STOCKS 1.8% | | | | | | | | | | | | | | | | |
| | | | |
Gas Utilities 0.1% | | | | | | | | | | | | | | | | |
Ferrellgas Partners LP (Class B Stock) | | | | | | | | | | | 728 | | | | 116,116 | |
| | | | |
Oil, Gas & Consumable Fuels 1.5% | | | | | | | | | | | | | | | | |
Chesapeake Energy Corp. | | | | | | | | | | | 11,582 | | | | 1,163,875 | |
Chesapeake Energy Corp. Backstop Commitment | | | | | | | | | | | 68 | | | | 6,833 | |
Civitas Resources, Inc. | | | | | | | | | | | 2,951 | | | | 198,278 | |
| | | | | | | | | | | | | | | | |
| | | | |
| | | | | | | | | | | | | | | 1,368,986 | |
| | | | |
Wireless Telecommunication Services 0.2% | | | | | | | | | | | | | | | | |
Intelsat Emergence SA (Luxembourg)* | | | | | | | | | | | 7,625 | | | | 219,856 | |
| | | | | | | | | | | | | | | | |
| | | | |
TOTAL COMMON STOCKS
(cost $835,126) | | | | | | | | | | | | | | | 1,704,958 | |
| | | | | | | | | | | | | | | | |
| | | | |
PREFERRED STOCK 0.6% | | | | | | | | | | | | | | | | |
| | | | |
Electronic Equipment, Instruments & Components | | | | | | | | | | | | | | | | |
Ferrellgas Escrow LLC, 8.956%, Maturing 03/30/31^
(cost $590,560) | | | | | | | | | | | 600 | | | | 600,000 | |
| | | | | | | | | | | | | | | | |
See Notes to Financial Statements.
PGIM Fixed Income ETFs 95
PGIM Active High Yield Bond ETF
Schedule of Investments (continued)
as of August 31, 2022
| | | | | | | | | | | | | | |
| | | | |
| Description | | | | | | | Units | | Value | |
| | | | |
RIGHTS* 0.0% | | | | | | | | | | | | | | |
| | | | |
Wireless Telecommunication Services | | | | | | | | | | | | | | |
Intelsat Jackson Holdings SA, Series A (Luxembourg), CVR, expiring 12/05/25^ | | | | | | | | | | 797 | | $ | 7,596 | |
Intelsat Jackson Holdings SA, Series B (Luxembourg), CVR, expiring 12/05/25^ | | | | | | | | | | 797 | | | 1,578 | |
| | | | | | | | | | | | | | |
| | | | |
TOTAL RIGHTS
(cost $0) | | | | | | | | | | | | | 9,174 | |
| | | | | | | | | | | | | | |
| | | | |
WARRANTS* 0.0% | | | | | | | | | | | | | | |
| | | | |
Chemicals | | | | | | | | | | | | | | |
| | | | |
TPC Group, Inc., expiring 08/01/24^
(cost $0) | | | | | | | | | | 129,605 | | | 13 | |
| | | | | | | | | | | | | | |
| | | | |
TOTAL LONG-TERM INVESTMENTS
(cost $103,064,793) | | | | | | | | | | | | | 90,827,491 | |
| | | | | | | | | | | | | | |
| | | | |
| | | | | | | | Shares | | | |
| | | | |
SHORT-TERM INVESTMENTS 2.1% | | | | | | | | | | | | | | |
| | | | |
AFFILIATED MUTUAL FUND 0.1% | | | | | | | | | | | | | | |
PGIM Institutional Money Market Fund | | | | | | | | | | | | | | |
(cost $121,461; includes $121,321 of cash collateral for securities on loan)(b)(wa) | | | | | | | | | | 121,558 | | | 121,485 | |
| | | | | | | | | | | | | | |
| | | | |
UNAFFILIATED FUND 2.0% | | | | | | | | | | | | | | |
Dreyfus Government Cash Management (Institutional Shares)
(cost $1,876,924) | | | | | | | | | | 1,876,924 | | | 1,876,924 | |
| | | | | | | | | | | | | | |
| | | | |
TOTAL SHORT-TERM INVESTMENTS
(cost $1,998,385) | | | | | | | | | | | | | 1,998,409 | |
| | | | | | | | | | | | | | |
| | | | |
TOTAL INVESTMENTS 98.3%
(cost $105,063,178) | | | | | | | | | | | | | 92,825,900 | |
Other assets in excess of liabilities(z) 1.7% | | | | | | | | | | | | | 1,569,960 | |
| | | | | | | | | | | | | | |
| | | | |
NET ASSETS 100.0% | | | | | | | | | | | | $ | 94,395,860 | |
| | | | | | | | | | | | | | |
See the Glossary for a list of the abbreviation(s) used in the annual report.
| * | Non-income producing security. |
| # | Principal or notional amount is shown in U.S. dollars unless otherwise stated. |
See Notes to Financial Statements.
96
PGIM Active High Yield Bond ETF
Schedule of Investments (continued)
as of August 31, 2022
| ^ | Indicates a Level 3 instrument. The aggregate value of Level 3 instruments is $626,823 and 0.7% of net assets. |
| (a) | All or a portion of security is on loan. The aggregate market value of such securities, including those sold and pending settlement, is $116,839; cash collateral of $121,321 (included in liabilities) was received with which the Fund purchased highly liquid short-term investments. In the event of significant appreciation in value of securities on loan on the last business day of the reporting period, the Fund may reflect a collateral value that is less than the market value of the loaned securities and such shortfall is remedied the following business day. |
| (b) | Represents security, or portion thereof, purchased with cash collateral received for securities on loan and includes dividend reinvestment. |
| (c) | Variable rate instrument. The interest rate shown reflects the rate in effect at August 31, 2022. |
| (d) | Represents issuer in default on interest payments and/or principal repayment. Non-income producing security. Such securities may be post-maturity. |
| (ff) | Variable rate security. Security may be issued at a fixed coupon rate, which converts to a variable rate at a specified date. Rate shown is the rate in effect as of period end. |
| (k) | Represents security, or a portion thereof, segregated as collateral for centrally cleared/exchange-traded derivatives. |
| (oo) | Perpetual security. Maturity date represents next call date. |
| (wa) | PGIM Investments LLC, the manager of the Fund, also serves as manager of the PGIM Core Ultra Short Bond Fund and PGIM Institutional Money Market Fund, if applicable. |
| (z) | Includes net unrealized appreciation/(depreciation) and/or market value of the below holdings which are excluded from the Schedule of Investments: |
Unfunded loan commitment outstanding at August 31, 2022:
| | | | | | | | | | | | | | | | | | | | |
Borrower | | Principal
Amount
(000)# | | Current
Value | | Unrealized
Appreciation | | Unrealized
Depreciation |
| | | | |
TPC Group, Inc., Term Loan DIP Facility, 3 Month LIBOR + 5.000%, 5.000%(c), Maturity Date 03/01/23 (cost $7,628)^ | | 8 | | | $ | 7,628 | | | | $ | — | | | | $ | — | |
| | | | | | | | | | | | | | | | | |
Futures contracts outstanding at August 31, 2022:
| | | | | | | | | | | | | | | | | | | | | | | | | | | | | |
Number of Contracts | | | | Type | | Expiration
Date | | Current
Notional
Amount | | Value /
Unrealized
Appreciation (Depreciation) |
| | | | | | | | | | | | | | | | | | | |
| | |
Long Positions: | | | | | | | | | | | |
9 | | | | 2 Year U.S. Treasury Notes | | | | Dec. 2022 | | | | $ | 1,874,953 | | | | | | | | | $ | (4,101 | ) | | | | | |
14 | | | | 5 Year U.S. Treasury Notes | | | | Dec. 2022 | | | | | 1,551,484 | | | | | | | | | | (5,469 | ) | | | | | |
35 | | | | 10 Year U.S. Treasury Notes | | | | Dec. 2022 | | | | | 4,091,719 | | | | | | | | | | (20,616 | ) | | | | | |
| | | | | | | | | | | | | | | | | | | | | | | | | | | | | |
| | | | | | | | | | | | | | | | | | | | | | | (30,186 | ) | | | | | |
| | | | | | | | | | | | | | | | | | | | | | | | | | | | | |
| | |
Short Positions: | | | | | | | | | | | |
5 | | | | 20 Year U.S. Treasury Bonds | | | | Dec. 2022 | | | | | 679,219 | | | | | | | | | | 3,965 | | | | | | |
3 | | | | 30 Year U.S. Ultra Treasury Bonds | | | | Dec. 2022 | | | | | 448,500 | | | | | | | | | | 328 | | | | | | |
| | | | | | | | | | | | | | | | | | | | | | | | | | | | | |
| | | | | | | | | | | | | | | | | | | | | | | 4,293 | | | | | | |
| | | | | | | | | | | | | | | | | | | | | | | | | | | | | |
| | | | | | | | | | | | | | | | | | | | | | $ | (25,893 | ) | | | | | |
| | | | | | | | | | | | | | | | | | | | | | | | | | | | | |
See Notes to Financial Statements.
PGIM Fixed Income ETFs 97
PGIM Active High Yield Bond ETF
Schedule of Investments (continued)
as of August 31, 2022
Forward foreign currency exchange contracts outstanding at August 31, 2022:
| | | | | | | | | | | | | | | | | | | | | | | | | | | | | | | | |
Purchase Contracts | | Counterparty | | Notional
Amount
(000) | | Value at
Settlement
Date | | Current
Value | | Unrealized
Appreciation | | Unrealized
Depreciation |
| | | | | |
OTC Forward Foreign Currency Exchange Contracts: | | | | | | | | | | | | | | | | | | | | | | | | | |
British Pound, | | | | | | | | | | | | | | | | | | | | | | | | | | | |
Expiring 09/02/22 | | JPMorgan Chase Bank, N.A. | | | | GBP | | | | | 89 | | | | $ | 105,198 | | | | $ | 103,391 | | | | $ | — | | | | $ | (1,807 | ) |
| | | | | | | | | | | | | | | | | | | | | | | | | | | | | | | | |
| | | | | | | | | | | | | | | | | | | | | | | | | | | | | | | | |
| | | | | | |
Sale Contracts | | Counterparty | | Notional
Amount
(000) | | Value at
Settlement
Date | | Current
Value | | Unrealized
Appreciation | | Unrealized
Depreciation |
| | | | | |
OTC Forward Foreign Currency Exchange Contracts: | | | | | | | | | | | | | | | | | | | | | | | | | |
British Pound, | | | | | | | | | | | | | | | | | | | | | | | | | | | |
Expiring 09/02/22 | | Bank of America, N.A. | | | | GBP | | | | | 89 | | | | $ | 107,522 | | | | $ | 103,391 | | | | $ | 4,131 | | | | $ | — | |
Expiring 10/04/22 | | JPMorgan Chase Bank, N.A. | | | | GBP | | | | | 89 | | | | | 105,262 | | | | | 103,461 | | | | | 1,801 | | | | | — | |
| | | | | | | | | | | | | | | | | | | | | | | | | | | | | | | | |
| | | | | | | |
| | | | | | | | | | | | | | | $ | 212,784 | | | | $ | 206,852 | | | | | 5,932 | | | | | — | |
| | | | | | | | | | | | | | | | | | | | | | | | | | | | | | | | |
| | | | | | | |
| | | | | | | | | | | | | | | | | | | | | | | | | $ | 5,932 | | | | $ | (1,807 | ) |
| | | | | | | | | | | | | | | | | | | | | | | | | | | | | | | | |
Credit default swap agreements outstanding at August 31, 2022:
| | | | | | | | | | | | | | | | | | | | | | | | | | | | | | | | | | | | | | | | | | | | | | | | | | | | | | | | | | | | | | | | | | | | | | | | | | | | | | | | |
Reference Entity/ Obligation | | Termination
Date | | Fixed Rate | | Notional
Amount
(000)#(3) | | Value at
Trade Date | | Value at
August 31,
2022 | | Unrealized Appreciation
(Depreciation) |
| | | | | | | | | | | | | | | | | | | | | | | | | | | | | | | | | | | | | | | | | | | | | | | | | | | | | | | | | | | | | | | | | | | | | | | | | | | | | | | | |
| | | | | | | | | | | | | | | | | | | | | | | | | | | | | | |
Centrally Cleared Credit Default Swap Agreement on credit indices - Buy Protection(1): | | | | | | | | | | | | | | | | | | | | | |
CDX.NA.IG.38.V1 | | | | | | | | | 06/20/32 | | | | | | | | | | 1.000%(Q) | | | | | | | | | | 1,695 | | | | | | | | | | | | | | $ | 23,091 | | | | | | | | | | | | | | $ | 33,550 | | | | | | | | | | | | | | $ | 10,459 | | | | | | |
| | | | | | | | | | | | | | | | | | | | | | | | | | | | | | | | | | | | | | | | | | | | | | | | | | | | | | | | | | | | | | | | | | | | | | | | | | | | | | | | |
| | | | | | | | | | | | | | | | | | | | | | | | | | | | | | | | | | | | | | | | | | | | | | | | | | | | | | | | | | | | | | | | | | | | | | | | | | | | | | | | | | | | | | | | | | | | | | | |
Reference Entity/ Obligation | | Termination
Date | | Fixed Rate | | Notional
Amount
(000)#(3) | | Implied Credit
Spread at
August 31,
2022(4) | | Value at
Trade Date | | Value at
August 31,
2022 | | | | Unrealized
Appreciation
(Depreciation) | | |
| | | | | | | | | | | | | | | | | | | | | | | | | | | | | | | | | | | | | | | | | | | | | | | | | | | | | | | | | | | | | | | | | | | | | | | | | | | | | | | | | | | | | | | | | | | | | | | |
| | | | | | | | | | | | | | | | | | | | | | | | | | | | | | | | | | | |
Centrally Cleared Credit Default Swap Agreement on credit indices - Sell Protection(2): | | | | | | | | | | | | | | | | | | | | | | | | | | |
CDX.NA.HY.38.V2 | | | | | | | | | 06/20/27 | | | | | | | | | | 5.000%(Q) | | | | | | | | | | 6,029 | | | | | | | | | | | | | | | 5.325% | | | | | | | | | | | | | | $ | (110,648 | ) | | | | | | | | | | | | | $ | (12,745 | ) | | | | | | | | | | | | | $ | 97,903 | | | | | | |
| | | | | | | | | | | | | | | | | | | | | | | | | | | | | | | | | | | | | | | | | | | | | | | | | | | | | | | | | | | | | | | | | | | | | | | | | | | | | | | | | | | | | | | | | | | | | | | |
The Fund entered into credit default swaps (“CDS”) to provide a measure of protection against defaults or to take an active long or short position with respect to the likelihood of a particular issuer’s default or the reference entity’s credit soundness. CDS contracts generally trade based on a spread which represents the cost a protection buyer has to pay the protection seller. The protection buyer is said to be short the credit as the value of the contract rises the more the credit deteriorates. The value of the CDS contract increases for the protection buyer if the spread increases.
| (1) | If the Fund is a buyer of protection, it pays the fixed rate. When a credit event occurs, as defined under the terms of that particular swap agreement, the Fund will either (i) receive from the seller of protection an amount equal to the notional |
See Notes to Financial Statements.
98
PGIM Active High Yield Bond ETF
Schedule of Investments (continued)
as of August 31, 2022
| | amount of the swap and make delivery of the referenced obligation or underlying securities comprising the referenced index or (ii) receive a net settlement amount in the form of cash or securities equal to the notional amount of the swap less the recovery value of the referenced obligation or underlying securities comprising the referenced index. |
| (2) | If the Fund is a seller of protection, it receives the fixed rate. When a credit event occurs, as defined under the terms of that particular swap agreement, the Fund will either (i) pay to the buyer of protection an amount equal to the notional amount of the swap and take delivery of the referenced obligation or underlying securities comprising the referenced index or (ii) pay a net settlement amount in the form of cash or securities equal to the notional amount of the swap less the recovery value of the referenced obligation or underlying securities comprising the referenced index. |
| (3) | Notional amount represents the maximum potential amount the Fund could be required to pay as a seller of credit protection or receive as a buyer of credit protection if a credit event occurs as defined under the terms of that particular swap agreement. |
| (4) | Implied credit spreads, represented in absolute terms, utilized in determining the fair value of credit default swap agreements where the Fund is the seller of protection as of the reporting date serve as an indicator of the current status of the payment/ performance risk and represent the likelihood of risk of default for the credit derivative. The implied credit spread of a particular referenced entity reflects the cost of buying/selling protection and may include up-front payments required to be made to enter into the agreement. Wider credit spreads represent a deterioration of the referenced entity’s credit soundness and a greater likelihood of risk of default or other credit event occurring as defined under the terms of the agreement. |
Total return swap agreements outstanding at August 31, 2022:
| | | | | | | | | | | | | | | | | | | | | | | | | | | | | | | | | | | |
Reference Entity | | Financing
Rate | | Counterparty | | Termination
Date | | Long (Short)
Notional
Amount
(000)#(1) | | Fair
Value | | Upfront
Premiums
Paid
(Received) | | Unrealized
Appreciation
(Depreciation)(2) |
OTC Total Return Swap Agreement: | | | | | | | | | | | | | | | | | | | | | | | | | | | | | | | | |
iBoxx US Dollar Liquid High Yield Index(T) | | 1 Day SOFR(Q) | | | | BNP Paribas S.A. | | | | | 03/20/23 | | | | | (70 | ) | | | $ | 319 | | | | $ | — | | | | $ | 319 | |
| | | | | | | | | | | | | | | | | | | | | | | | | | | | | | | | |
| (1) | On a long total return swap, the Fund receives payments for any positive return on the reference entity (makes payments for any negative return) and pays the financing rate. On a short total return swap, the Fund makes payments for any positive return on the reference entity (receives payments for any negative return) and receives the financing rate. |
| (2) | Upfront/recurring fees or commissions, as applicable, are included in the net unrealized appreciation (depreciation). |
Balances Reported in the Statement of Assets and Liabilities for OTC Swap Agreements:
| | | | | | | | | | | | | | | | | | | | |
| | | Premiums Paid | | Premiums Received | | Unrealized
Appreciation | | Unrealized
Depreciation |
| | | | |
OTC Swap Agreements | | | $ | — | | | | $ | — | | | | $ | 319 | | | | $ | — | |
See Notes to Financial Statements.
PGIM Fixed Income ETFs 99
PGIM Active High Yield Bond ETF
Schedule of Investments (continued)
as of August 31, 2022
Summary of Collateral for Centrally Cleared/Exchange-traded Derivatives:
Cash and securities segregated as collateral, including pending settlement for closed positions, to cover requirements for centrally cleared/exchange-traded derivatives are listed by broker as follows:
| | | | | | | | | | |
Broker | | Cash and/or Foreign Currency | | Securities Market Value |
| | |
Citigroup Global Markets, Inc. | | | $ | 150,000 | | | | $ | 636,471 | |
| | | | | | | | | | |
Fair Value Measurements:
Various inputs are used in determining the value of the Fund’s investments. These inputs are summarized in the three broad levels listed below.
Level 1—unadjusted quoted prices generally in active markets for identical securities.
Level 2—quoted prices for similar securities, interest rates and yield curves, prepayment speeds, foreign currency exchange rates and other observable inputs.
Level 3—unobservable inputs for securities valued in accordance with Board approved fair valuation procedures.
The following is a summary of the inputs used as of August 31, 2022 in valuing such portfolio securities:
| | | | | | | | | | | | | | | |
| | | Level 1 | | Level 2 | | Level 3 |
Investments in Securities | | | | | | | | | | | | | | | |
Assets | | | | | | | | | | | | | | | |
Long-Term Investments | | | | | | | | | | | | | | | |
Asset-Backed Securities | | | | | | | | | | | | | | | |
Collateralized Loan Obligations | | | $ | — | | | | $ | 3,156,324 | | | | $ | — | |
Bank Loans | | | | — | | | | | 1,776,471 | | | | | 15,527 | |
Corporate Bonds | | | | — | | | | | 75,471,893 | | | | | 2,109 | |
U.S. Treasury Obligations | | | | — | | | | | 8,091,022 | | | | | — | |
Common Stocks | | | | 1,362,153 | | | | | 342,805 | | | | | — | |
Preferred Stock. | | | | — | | | | | — | | | | | 600,000 | |
Rights | | | | — | | | | | — | | | | | 9,174 | |
Warrants | | | | — | | | | | — | | | | | 13 | |
Short-Term Investments | | | | | | | | | | | | | | | |
Affiliated Mutual Fund | | | | 121,485 | | | | | — | | | | | — | |
Unaffiliated Fund | | | | 1,876,924 | | | | | — | | | | | — | |
| | | | | | | | | | | | | | | |
| | | |
Total | | | $ | 3,360,562 | | | | $ | 88,838,515 | | | | $ | 626,823 | |
| | | | | | | | | | | | | | | |
| | | |
Other Financial Instruments* | | | | | | | | | | | | | | | |
Assets | | | | | | | | | | | | | | | |
Unfunded Loan Commitment | | | $ | — | | | | $ | — | | | | $ | — | |
Futures Contracts | | | | 4,293 | | | | | — | | | | | — | |
OTC Forward Foreign Currency Exchange Contracts | | | | — | | | | | 5,932 | | | | | — | |
See Notes to Financial Statements.
100
PGIM Active High Yield Bond ETF
Schedule of Investments (continued)
as of August 31, 2022
| | | | | | | | | | | | | | | |
| | | Level 1 | | Level 2 | | Level 3 |
| | | |
Other Financial Instruments* (continued) | | | | | | | | | | | | | | | |
Assets (continued) | | | | | | | | | | | | | | | |
Centrally Cleared Credit Default Swap Agreements | | | $ | — | | | | $ | 108,362 | | | | $ | — | |
OTC Total Return Swap Agreement | | | | — | | | | | 319 | | | | | — | |
| | | | | | | | | | | | | | | |
| | | |
Total | | | $ | 4,293 | | | | $ | 114,613 | | | | $ | — | |
| | | | | | | | | | | | | | | |
| | | |
Liabilities | | | | | | | | | | | | | | | |
Futures Contracts | | | $ | (30,186 | ) | | | $ | — | | | | $ | — | |
OTC Forward Foreign Currency Exchange Contract | | | | — | | | | | (1,807 | ) | | | | — | |
| | | | | | | | | | | | | | | |
| | | |
Total | | | $ | (30,186 | ) | | | $ | (1,807 | ) | | | $ | — | |
| | | | | | | | | | | | | | | |
| * | Other financial instruments are derivative instruments, with the exception of unfunded loan commitments, and are not reflected in the Schedule of Investments. Futures, forwards, centrally cleared swap contracts and unfunded loan commitments are recorded at net unrealized appreciation (depreciation) and OTC swap contracts are recorded at fair value. |
Industry Classification:
The industry classification of investments and other assets in excess of liabilities shown as a percentage of net assets as of August 31, 2022 were as follows:
| | | | |
U.S. Treasury Obligations | | | 8.6 | % |
Media | | | 7.9 | |
Oil & Gas | | | 6.2 | |
Electric | | | 5.0 | |
Telecommunications | | | 4.5 | |
Commercial Services | | | 4.3 | |
Home Builders | | | 4.1 | |
Diversified Financial Services | | | 3.6 | |
Healthcare-Services | | | 3.5 | |
Collateralized Loan Obligations | | | 3.3 | |
Retail | | | 3.3 | |
Foods | | | 3.0 | |
Aerospace & Defense | | | 2.9 | |
Pipelines | | | 2.6 | |
Entertainment | | | 2.6 | |
Auto Manufacturers | | | 2.6 | |
Chemicals | | | 2.3 | |
Real Estate Investment Trusts (REITs) | | | 2.2 | |
Pharmaceuticals | | | 2.2 | |
Building Materials | | | 2.0 | |
Unaffiliated Fund | | | 2.0 | |
Real Estate | | | 1.6 | |
| | | | |
Lodging | | | 1.5 | % |
Oil, Gas & Consumable Fuels | | | 1.5 | |
Packaging & Containers | | | 1.4 | |
Mining | | | 1.1 | |
Auto Parts & Equipment | | | 1.0 | |
Airlines | | | 0.9 | |
Software | | | 0.9 | |
Healthcare-Products | | | 0.9 | |
Machinery-Diversified | | | 0.8 | |
Apparel | | | 0.7 | |
Electrical Components & Equipment | | | 0.6 | |
Electronic Equipment, Instruments & Components | | | 0.6 | |
Computers | | | 0.6 | |
Gas | | | 0.5 | |
Distribution/Wholesale | | | 0.5 | |
Advertising | | | 0.5 | |
Housewares | | | 0.5 | |
Internet | | | 0.4 | |
Household Products/Wares | | | 0.4 | |
Iron/Steel | | | 0.3 | |
Insurance | | | 0.3 | |
Miscellaneous Manufacturing | | | 0.3 | |
See Notes to Financial Statements.
PGIM Fixed Income ETFs 101
PGIM Active High Yield Bond ETF
Schedule of Investments (continued)
as of August 31, 2022
Industry Classification (continued):
| | | | |
Wireless Telecommunication Services | | | 0.2 | % |
Machinery-Construction & Mining | | | 0.2 | |
Electronics | | | 0.2 | |
Home Furnishings | | | 0.2 | |
Agriculture | | | 0.2 | |
Engineering & Construction | | | 0.1 | |
Banks | | | 0.1 | |
Environmental Control | | | 0.1 | |
Affiliated Mutual Fund (0.1% represents investments purchased with collateral from securities on loan) | | | 0.1 | |
Gas Utilities | | | 0.1 | |
| | | | |
Trucking & Leasing | | | 0.1 | % |
Leisure Time | | | 0.1 | |
Office/Business Equipment | | | 0.1 | |
Coal | | | 0.0 | * |
| | | | |
| | | 98.3 | |
Other assets in excess of liabilities | | | 1.7 | |
| | | | |
| |
| | | 100.0 | % |
| | | | |
Effects of Derivative Instruments on the Financial Statements and Primary Underlying Risk Exposure:
The Fund invested in derivative instruments during the reporting period. The primary types of risk associated with these derivative instruments are credit contracts risk, foreign exchange contracts risk and interest rate contracts risk. See the Notes to Financial Statements for additional detail regarding these derivative instruments and their risks. The effect of such derivative instruments on the Fund’s financial position and financial performance as reflected in the Statement of Assets and Liabilities and Statement of Operations is presented in the summary below.
Fair values of derivative instruments as of August 31, 2022 as presented in the Statement of Assets and Liabilities:
| | | | | | | | | | | | |
| | | Asset Derivatives | | | Liability Derivatives | |
Derivatives not accounted for as
hedging instruments, carried at
fair value | | Statement of Assets and Liabilities Location | | Fair
Value | | | Statement of Assets and Liabilities Location | | Fair
Value | |
Credit contracts | | Due from/to broker-variation margin swaps | | $ | 108,362 | * | | — | | $ | — | |
Foreign exchange contracts | | Unrealized appreciation on OTC forward foreign currency exchange contracts | | | 5,932 | | | Unrealized depreciation on OTC forward foreign currency exchange contracts | | | 1,807 | |
Interest rate contracts | | Due from/to broker-variation margin futures | | | 4,293 | * | | Due from/to broker-variation margin futures | | | 30,186 | * |
Interest rate contracts | | Unrealized appreciation on OTC swap agreements | | | 319 | | | — | | | — | |
| | | | | | | | | | | | |
| | | | $ | 118,906 | | | | | $ | 31,993 | |
| | | | | | | | | | | | |
See Notes to Financial Statements.
102
PGIM Active High Yield Bond ETF
Schedule of Investments (continued)
as of August 31, 2022
| * | Includes cumulative appreciation (depreciation) as reported in the schedule of open futures and centrally cleared swap contracts. Only unsettled variation margin receivable (payable) is reported within the Statement of Assets and Liabilities. |
The effects of derivative instruments on the Statement of Operations for the year ended August 31, 2022 are as follows:
| | | | | | | | | | | | | | | |
| Amount of Realized Gain (Loss) on Derivatives Recognized in Income |
| | | |
Derivatives not accounted for as hedging instruments, carried at fair value | | Futures | | Forward
Currency
Exchange
Contracts | | Swaps |
| | | |
Credit contracts | | | $ | — | | | | $ | — | | | | $ | (109,491 | ) |
Foreign exchange contracts | | | | — | | | | | 1,874 | | | | | — | |
Interest rate contracts | | | | (453,810 | ) | | | | — | | | | | (396,180 | ) |
| | | | | | | | | | | | | | | |
| | | |
Total | | | $ | (453,810 | ) | | | $ | 1,874 | | | | $ | (505,671 | ) |
| | | | | | | | | | | | | | | |
| | | | | | | | | | | | | | | |
| Change in Unrealized Appreciation (Depreciation) on Derivatives Recognized in Income |
| | | |
Derivatives not accounted for as hedging instruments, carried at fair value | | Futures | | Forward
Currency
Exchange
Contracts | | Swaps |
| | | |
Credit contracts | | | $ | — | | | | $ | — | | | | $ | 108,362 | |
Foreign exchange contracts | | | | — | | | | | 4,125 | | | | | — | |
Interest rate contracts | | | | (48,419 | ) | | | | — | | | | | 319 | |
| | | | | | | | | | | | | | | |
| | | |
Total | | | $ | (48,419 | ) | | | $ | 4,125 | | | | $ | 108,681 | |
| | | | | | | | | | | | | | | |
For the year ended August 31, 2022, the Fund’s average volume of derivative activities is as follows:
| | | | |
| Derivative Contract Type | | Average Volume of Derivative Activities* | |
| |
Futures Contracts - Long Positions (1) | | | $8,824,061 | |
Futures Contracts - Short Positions (1) | | | 2,026,206 | |
Forward Foreign Currency Exchange Contracts - Purchased (2) | | | 43,288 | |
Forward Foreign Currency Exchange Contracts - Sold (2) | | | 87,420 | |
| |
Credit Default Swap Agreements - Buy Protection (1) | | | 892,000 | |
Credit Default Swap Agreements - Sell Protection (1) | | | 1,713,820 | |
Total Return Swap Agreements (1) | | | 2,428,000 | |
| * | Average volume is based on average quarter end balances as noted for the year ended August 31, 2022. |
| (1) | Notional Amount in USD. |
| (2) | Value at Settlement Date. |
See Notes to Financial Statements.
PGIM Fixed Income ETFs 103
PGIM Active High Yield Bond ETF
Schedule of Investments (continued)
as of August 31, 2022
Financial Instruments/Transactions—Summary of Offsetting and Netting Arrangements:
The Fund invested in OTC derivatives and entered into financial instruments/transactions during the reporting period that are either offset in accordance with current requirements or are subject to enforceable master netting arrangements or similar agreements that permit offsetting. The information about offsetting and related netting arrangements for OTC derivatives and financial instruments/transactions where the legal right to set-off exists is presented in the summary below.
Offsetting of financial instrument/transaction assets and liabilities:
| | | | | | |
| Description | | Gross Market Value of Recognized Assets/(Liabilities) | | Collateral Pledged/(Received)(2) | | Net Amount |
Securities on Loan | | $116,839 | | $(116,839) | | $— |
Offsetting of OTC derivative assets and liabilities:
| | | | | | | | | | | | | | | | | | | | | | | | | |
Counterparty | | Gross Amounts of
Recognized
Assets(1) | | Gross Amounts of
Recognized
Liabilities(1) | | Net Amounts of
Recognized
Assets/(Liabilities) | | Collateral
Pledged/(Received)(2) | | Net Amount |
Bank of America, N.A. | | | $ | 4,131 | | | | $ | — | | | | $ | 4,131 | | | | $ | — | | | | $ | 4,131 | |
BNP Paribas S.A. | | | | 319 | | | | | — | | | | | 319 | | | | | — | | | | | 319 | |
JPMorgan Chase Bank, N.A. | | | | 1,801 | | | | | (1,807 | ) | | | | (6 | ) | | | | — | | | | | (6 | ) |
| | | | | | | | | | | | | | | | | | | | | | | | | |
| | | $ | 6,251 | | | | $ | (1,807 | ) | | | $ | 4,444 | | | | $ | — | | | | $ | 4,444 | |
| | | | | | | | | | | | | | | | | | | | | | | | | |
| (1) | Includes unrealized appreciation/(depreciation) on swaps and forwards, premiums paid/(received) on swap agreements and market value of purchased and written options, as represented on the Statement of Assets and Liabilities. |
| (2) | Collateral amount disclosed by the Fund is limited to the market value of financial instruments/transactions and the Fund’s OTC derivative exposure by counterparty. |
See Notes to Financial Statements.
104
PGIM Active High Yield Bond ETF
Statement of Assets & Liabilities
as of August 31, 2022
| | | | |
Assets | | | | |
| |
Investments at value, including securities on loan of $116,839: | | | | |
Unaffiliated investments (cost $104,941,717) | | $ | 92,704,415 | |
Affiliated investments (cost $121,461) | | | 121,485 | |
Cash | | | 22,503 | |
Dividends and interest receivable | | | 1,355,949 | |
Receivable for investments sold | | | 188,676 | |
Due from former custodian | | | 182,003 | |
Deposit with broker for centrally cleared/exchange-traded derivatives | | | 150,000 | |
Unrealized appreciation on OTC forward foreign currency exchange contracts | | | 5,932 | |
Unrealized appreciation on OTC swap agreements | | | 319 | |
Other assets | | | 11,052 | |
| | | | |
Total Assets | | | 94,742,334 | |
| | | | |
| |
| Liabilities | | | |
| |
Payable for investments purchased | | | 170,165 | |
Payable to broker for collateral for securities on loan | | | 121,321 | |
Management fee payable | | | 45,504 | |
Due to broker—variation margin swaps | | | 6,857 | |
Unrealized depreciation on OTC forward foreign currency exchange contracts | | | 1,807 | |
Due to broker—variation margin futures | | | 820 | |
| | | | |
Total Liabilities | | | 346,474 | |
| | | | |
| |
Net Assets | | $ | 94,395,860 | |
| | | | |
| |
| | | | | |
| |
Net assets were comprised of: | | | | |
Common stock, at par | | $ | 2,725 | |
Paid-in capital in excess of par | | | 108,591,823 | |
Total distributable earnings (loss) | | | (14,198,688 | ) |
| | | | |
| |
Net assets, August 31, 2022 | | $ | 94,395,860 | |
| | | | |
| |
Net asset value, offering price and redemption price per share.
($94,395,860 ÷ 2,725,000 shares of common stock issued and outstanding) | | $ | 34.64 | |
| | | | |
See Notes to Financial Statements.
PGIM Fixed Income ETFs 105
PGIM Active High Yield Bond ETF
Statement of Operations
Year Ended August 31, 2022
| | | | |
Net Investment Income (Loss) | | | | |
| |
Income | | | | |
Interest income (net of $202 foreign withholding tax) | | $ | 4,515,107 | |
Unaffiliated dividend income | | | 112,125 | |
Affiliated dividend income | | | 1,355 | |
Income from securities lending, net (including affiliated income of $351) | | | 889 | |
| | | | |
Total income | | | 4,629,476 | |
| | | | |
| |
Expenses | | | | |
Management fee | | | 455,181 | |
Miscellaneous | | | 49 | |
| | | | |
Total expenses | | | 455,230 | |
| | | | |
Net investment income (loss) | | | 4,174,246 | |
| | | | |
| Realized And Unrealized Gain (Loss) On Investment And Foreign Currency Transactions | | | |
| |
Net realized gain (loss) on: | | | | |
Investment transactions (including affiliated of $(13)) | | | (538,556 | ) |
Futures transactions | | | (453,810 | ) |
In-kind redemptions | | | 443,931 | |
Forward currency contract transactions | | | 1,874 | |
Swap agreement transactions | | | (505,671 | ) |
Foreign currency transactions | | | 2,976 | |
| | | | |
| | | (1,049,256 | ) |
| | | | |
Net change in unrealized appreciation (depreciation) on: | | | | |
Investments (including affiliated of $24) | | | (14,156,485 | ) |
Futures | | | (48,419 | ) |
Forward currency contracts | | | 4,125 | |
Swap agreements | | | 108,681 | |
Foreign currencies | | | (90 | ) |
| | | | |
| | | (14,092,188 | ) |
| | | | |
Net gain (loss) on investment and foreign currency transactions | | | (15,141,444 | ) |
| | | | |
| |
Net Increase (Decrease) In Net Assets Resulting From Operations | | $ | (10,967,198 | ) |
| | | | |
See Notes to Financial Statements.
106
PGIM Active High Yield Bond ETF
Statements of Changes in Net Assets
| | | | | | | | |
| |
| | | Year Ended August 31, | |
| | | | |
| | |
| | | 2022 | | | 2021 | |
| | |
Increase (Decrease) in Net Assets | | | | | | | | |
| | |
Operations | | | | | | | | |
Net investment income (loss) | | $ | 4,174,246 | | | $ | 2,775,060 | |
Net realized gain (loss) on investment, in-kind redemptions and foreign currency transactions | | | (1,049,256 | ) | | | 611,714 | |
Net change in unrealized appreciation (depreciation) on investments and foreign currencies | | | (14,092,188 | ) | | | 2,435,162 | |
| | | | | | | | |
Net increase (decrease) in net assets resulting from operations | | | (10,967,198 | ) | | | 5,821,936 | |
| | | | | | | | |
| | |
Dividends and Distributions | | | | | | | | |
Distributions from distributable earnings | | | (5,220,879 | ) | | | (3,660,138 | ) |
| | | | | | | | |
| | |
Fund share transactions | | | | | | | | |
Net proceeds from shares sold (1,225,000 and 1,825,000 shares, respectively) | | | 47,478,094 | | | | 74,395,702 | |
Shares redeemed in-kind (475,000 and 0 shares, respectively) | | | (19,479,038 | ) | | | — | |
Cost of shares purchased (125,000 and 600,000 shares, respectively) | | | (4,390,976 | ) | | | (24,576,005 | ) |
| | | | | | | | |
Net increase (decrease) in net assets from Fund share transactions | | | 23,608,080 | | | | 49,819,697 | |
| | | | | | | | |
Total increase (decrease) | | | 7,420,003 | | | | 51,981,495 | |
| | |
| Net Assets: | | | | | | |
| | |
Beginning of year | | | 86,975,857 | | | | 34,994,362 | |
| | | | | | | | |
End of year | | $ | 94,395,860 | | | $ | 86,975,857 | |
| | | | | | | | |
See Notes to Financial Statements.
PGIM Fixed Income ETFs 107
PGIM Active High Yield Bond ETF
Financial Highlights
| | | | | | | | | | | | | | | | | | | | | | | | | |
| | | | | | |
| | | | | | | | | | | | | | | | | | | | | | | | | |
| | | Year Ended August 31, | | September 24, 2018(a)
through August 31,
2019 | | |
| | | | | | |
| | | 2022 | | 2021 | | 2020 | | |
| | | | | | |
Per Share Operating Performance(b): | | | | | | | | | | | | | | | | | | | | | | | | | |
| | | | | | |
Net Asset Value, Beginning of Period | | | | $41.42 | | | | | $39.99 | | | | | $40.96 | | | | | $40.00 | | | | | | |
| | | | | | |
Income (loss) from investment operations: | | | | | | | | | | | | | | | | | | | | | | | | | |
| | | | | | |
Net investment income (loss) | | | | 1.85 | | | | | 1.95 | | | | | 2.49 | | | | | 2.30 | | | | | | |
| | | | | | |
Net realized and unrealized gain (loss) on investment and foreign currency transactions | | | | (6.23 | ) | | | | 2.30 | | | | | (0.49 | ) | | | | 0.85 | | | | | | |
| | | | | | |
Total from investment operations | | | | (4.38 | ) | | | | 4.25 | | | | | 2.00 | | | | | 3.15 | | | | | | |
| | | | | | |
Less Dividends and Distributions: | | | | | | | | | | | | | | | | | | | | | | | | | |
| | | | | | |
Dividends from net investment income | | | | (1.92 | ) | | | | (2.24 | ) | | | | (2.55 | ) | | | | (2.19 | ) | | | | | |
| | | | | | |
Distributions from net realized gains | | | | (0.48 | ) | | | | (0.58 | ) | | | | (0.42 | ) | | | | - | | | | | | |
| | | | | | |
Total dividends and distributions | | | | (2.40 | ) | | | | (2.82 | ) | | | | (2.97 | ) | | | | (2.19 | ) | �� | | | | |
| | | | | | |
Net asset value, end of period | | | | $34.64 | | | | | $41.42 | | | | | $39.99 | | | | | $40.96 | | | | | | |
| | | | | | |
Total Return(c): | | | | (11.01 | )% | | | | 11.00 | % | | | | 5.24 | % | | | | 8.20 | % | | | | | |
| | | | | | |
| | | | | | | | | | | | | | | | | | | | | | | | | |
| | | | | | |
Ratios/Supplemental Data: | | | | | | | | | | | | | | | | | | | | | | | | | |
| | | | | | |
Net assets, end of period (000) | | | | $94,396 | | | | | $86,976 | | | | | $34,994 | | | | | $27,649 | | | | | | |
| | | | | | |
Average net assets (000) | | | | $85,683 | | | | | $58,270 | | | | | $29,367 | | | | | $26,467 | | | | | | |
| | | | | | |
Ratios to average net assets(d): | | | | | | | | | | | | | | | | | | | | | | | | | |
| | | | | | |
Expenses after waivers and/or expense reimbursement | | | | 0.53 | % | | | | 0.53 | % | | | | 0.53 | % | | | | 0.52 | %(e) | | | | | |
| | | | | | |
Expenses before waivers and/or expense reimbursement | | | | 0.53 | % | | | | 0.53 | % | | | | 0.53 | % | | | | 0.53 | %(e) | | | | | |
| | | | | | |
Net investment income (loss) | | | | 4.87 | % | | | | 4.76 | % | | | | 6.37 | % | | | | 6.15 | %(e) | | | | | |
| | | | | | |
Portfolio turnover rate(f) | | | | 31 | % | | | | 85 | % | | | | 57 | % | | | | 55 | % | | | | | |
| (a) | Commencement of operations. |
| (b) | Calculated based on average shares outstanding during the period. |
| (c) | Total return is calculated assuming a purchase of a share on the first day and a sale on the last day of each period reported and includes reinvestment of dividends and distributions, if any. Total returns may reflect adjustments to conform to GAAP. Total returns for periods less than one full year are not annualized. |
| (d) | Does not include expenses of the underlying funds in which the Fund invests. |
| (f) | The Fund’s portfolio turnover rate is calculated in accordance with regulatory requirements, without regard to transactions involving short-term investments, certain derivatives and in-kind transactions (if any). If such transactions were included, the Fund’s portfolio turnover rate may be higher. |
See Notes to Financial Statements.
108
PGIM Active Aggregate Bond ETF
Schedule of Investments
as of August 31, 2022
| | | | | | | | | | | | |
| | | | | | | Principal | | | | |
| | | Interest | | Maturity | | Amount | | | | |
| Description | | Rate | | Date | | (000)# | | | Value | |
| | | | |
LONG-TERM INVESTMENTS 99.1% | | | | | | | | | | | | |
| | | | |
ASSET-BACKED SECURITIES 11.2% | | | | | | | | | | | | |
| | | | |
Automobiles 0.7% | | | | | | | | | | | | |
Avis Budget Rental Car Funding AESOP LLC, | | | | | | | | | | | | |
Series 2022-01A, Class A, 144A | | 3.830% | | 08/21/28 | | | 100 | | | $ | 97,685 | |
CarMax Auto Owner Trust, | | | | | | | | | | | | |
Series 2022-01, Class D | | 2.470 | | 07/17/28 | | | 100 | | | | 92,423 | |
Hertz Vehicle Financing LLC, | | | | | | | | | | | | |
Series 2022-02A, Class A, 144A | | 2.330 | | 06/26/28 | | | 100 | | | | 89,676 | |
| | | | | | | | | | | | |
| | | | |
| | | | | | | | | | | 279,784 | |
| | | | |
Collateralized Loan Obligations 10.1% | | | | | | | | | | | | |
AIG CLO LLC (Cayman Islands), | | | | | | | | | | | | |
Series 2018-01A, Class A1R, 144A, 3 Month LIBOR +
1.120% (Cap N/A, Floor 1.120%) | | 3.830(c) | | 04/20/32 | | | 400 | | | | 392,794 | |
Anchorage Capital CLO Ltd. (Cayman Islands), | | | | | | | | | | | | |
Series 2022-25A, Class A1, 144A, 3 Month SOFR +
1.390% (Cap N/A, Floor 1.390%) | | 3.867(c) | | 04/20/35 | | | 250 | | | | 242,901 | |
Atlas Senior Loan Fund Ltd. (Cayman Islands), | | | | | | | | | | | | |
Series 2016-07A, Class A1R2, 144A, 3 Month LIBOR +
1.100% (Cap N/A, Floor 1.100%) | | 4.143(c) | | 11/27/31 | | | 250 | | | | 246,116 | |
Bain Capital Credit CLO Ltd. (Cayman Islands), | | | | | | | | | | | | |
Series 2022-01A, Class A1, 144A, 3 Month SOFR +
1.320% (Cap N/A, Floor 1.320%) | | 2.219(c) | | 04/18/35 | | | 250 | | | | 242,761 | |
Balboa Bay Loan Funding Ltd. (Cayman Islands), | | | | | | | | | | | | |
Series 2020-01A, Class AR, 144A, 3 Month LIBOR +
1.120% (Cap N/A, Floor 1.120%) | | 3.830(c) | | 01/20/32 | | | 250 | | | | 245,942 | |
Crown City CLO (Cayman Islands), | | | | | | | | | | | | |
Series 2020-02A, Class A1AR, 144A, 3 Month SOFR +
1.340% (Cap N/A, Floor 1.340%) | | 3.817(c) | | 04/20/35 | | | 250 | | | | 243,078 | |
Elevation CLO Ltd. (Cayman Islands), | | | | | | | | | | | | |
Series 2021-13A, Class A1, 144A, 3 Month LIBOR +
1.190% (Cap N/A, Floor 1.190%) | | 3.702(c) | | 07/15/34 | | | 250 | | | | 242,072 | |
HPS Loan Management Ltd. (Cayman Islands), | | | | | | | | | | | | |
Series 10A-16, Class A1RR, 144A, 3 Month LIBOR +
1.140% (Cap N/A, Floor 1.140%) | | 3.850(c) | | 04/20/34 | | | 250 | | | | 243,750 | |
ICG US CLO Ltd. (Cayman Islands), | | | | | | | | | | | | |
Series 2015-02RA, Class A1, 144A, 3 Month LIBOR +
1.370% (Cap N/A, Floor 1.370%) | | 4.110(c) | | 01/16/33 | | | 250 | | | | 247,707 | |
Madison Park Funding Ltd. (Cayman Islands), | | | | | | | | | | | | |
Series 2019-33A, Class AR, 144A, 3 Month SOFR +
1.290% (Cap N/A, Floor 1.290%) | | 3.618(c) | | 10/15/32 | | | 250 | | | | 246,757 | |
See Notes to Financial Statements.
PGIM Fixed Income ETFs 109
PGIM Active Aggregate Bond ETF
Schedule of Investments (continued)
as of August 31, 2022
| | | | | | | | | | | | |
| | | | | | | Principal | | | | |
| | | Interest | | Maturity | | Amount | | | | |
| Description | | Rate | | Date | | (000)# | | | Value | |
| | | | |
ASSET-BACKED SECURITIES (Continued) | | | | | | | | | | | | |
| | | | |
Collateralized Loan Obligations (cont’d.) | | | | | | | | | | | | |
Madison Park Funding Ltd. (Cayman Islands), (cont’d.) | | | | | | | | | | | | |
Series 2019-34A, Class AR, 144A, 3 Month LIBOR + 1.120% (Cap N/A, Floor 1.120%) | | 3.903%(c) | | 04/25/32 | | | 400 | | | $ | 392,943 | |
Northwoods Capital Ltd. (Cayman Islands), | | | | | | | | | | | | |
Series 2017-15A, Class A1R, 144A, 3 Month LIBOR + 1.210% (Cap N/A, Floor 1.210%) | | 3.273(c) | | 06/20/34 | | | 250 | | | | 243,914 | |
Romark CLO Ltd. (Cayman Islands), | | | | | | | | | | | | |
Series 2021-04A, Class A1, 144A, 3 Month LIBOR + 1.170% (Cap N/A, Floor 1.170%) | | 3.598(c) | | 07/10/34 | | | 400 | | | | 389,951 | |
TCW CLO Ltd. (Cayman Islands), | | | | | | | | | | | | |
Series 2019-02A, Class A1R, 144A, 3 Month SOFR + 1.280% (Cap N/A, Floor 1.280%) | | 3.757(c) | | 10/20/32 | | | 250 | | | | 245,724 | |
Whitebox CLO Ltd. (Cayman Islands), | | | | | | | | | | | | |
Series 2019-01A, Class ANAR, 144A, 3 Month LIBOR + 1.130% (Cap N/A, Floor 1.130%) | | 3.913(c) | | 07/24/32 | | | 500 | | | | 491,320 | |
| | | | | | | | | | | | |
| | | | |
| | | | | | | | | | | 4,357,730 | |
| | | | | | | | | | | | |
| | | | |
Consumer Loans 0.4% | | | | | | | | | | | | |
OneMain Financial Issuance Trust, | | | | | | | | | | | | |
Series 2020-02A, Class A, 144A | | 1.750 | | 09/14/35 | | | 200 | | | | 179,391 | |
| | | | | | | | | | | | |
| | | | |
TOTAL ASSET-BACKED SECURITIES | | | | | | | | | | | | |
(cost $4,945,842) | | | | | | | | | | | 4,816,905 | |
| | | | | | | | | | | | |
| | | | |
COMMERCIAL MORTGAGE-BACKED SECURITIES 11.0% | | | | | | | | | | | | |
BANK, | | | | | | | | | | | | |
Series 2019-BN22, Class A3 | | 2.726 | | 11/15/62 | | | 250 | | | | 223,109 | |
Series 2021-BN38, Class A4 | | 2.275 | | 12/15/64 | | | 100 | | | | 83,854 | |
Barclays Commercial Mortgage Securities Trust, | | | | | | | | | | | | |
Series 2021-C12, Class A4 | | 2.421 | | 11/15/54 | | | 250 | | | | 214,013 | |
Benchmark Mortgage Trust, | | | | | | | | | | | | |
Series 2021-B25, Class A3 | | 1.906 | | 04/15/54 | | | 500 | | | | 435,622 | |
Series 2021-B31, Class A4 | | 2.420 | | 12/15/54 | | | 100 | | | | 84,881 | |
CD Mortgage Trust, | | | | | | | | | | | | |
Series 2019-CD08, Class A3 | | 2.657 | | 08/15/57 | | | 500 | | | | 440,451 | |
Commercial Mortgage Trust, | | | | | | | | | | | | |
Series 2014-UBS04, Class A4 | | 3.420 | | 08/10/47 | | | 500 | | | | 491,151 | |
Series 2015-DC01, Class A4 | | 3.078 | | 02/10/48 | | | 500 | | | | 487,009 | |
See Notes to Financial Statements.
110
PGIM Active Aggregate Bond ETF
Schedule of Investments (continued)
as of August 31, 2022
| | | | | | | | | | | | | | |
| | | | | | | | Principal | | | | |
| | | Interest | | Maturity | | | Amount | | | | |
| Description | | Rate | | Date | | | (000)# | | | Value | |
| | | |
COMMERCIAL MORTGAGE-BACKED SECURITIES (Continued) | | | | | | | | | | | | |
GS Mortgage Securities Trust, | | | | | | | | | | | | | | |
Series 2019-GC42, Class A3 | | 2.749% | | | 09/01/52 | | | | 250 | | | $ | 224,014 | |
JPMCC Commercial Mortgage Securities Trust, | | | | | | | | | | | | | | |
Series 2019-COR05, Class A3 | | 3.123 | | | 06/13/52 | | | | 500 | | | | 458,596 | |
Wells Fargo Commercial Mortgage Trust, | | | | | | | | | | | | | | |
Series 2017-C39, Class A4 | | 3.157 | | | 09/15/50 | | | | 500 | | | | 472,760 | |
Series 2019-C52, Class A4 | | 2.643 | | | 08/15/52 | | | | 436 | | | | 389,822 | |
Series 2020-C56, Class A4 | | 2.194 | | | 06/15/53 | | | | 500 | | | | 426,508 | |
Series 2021-C59, Class A3 | | 1.958 | | | 04/15/54 | | | | 350 | | | | 305,358 | |
| | | | | | | | | | | | | | |
| | | | |
TOTAL COMMERCIAL MORTGAGE-BACKED SECURITIES
(cost $5,314,600) | | | | | | | | | | | | | 4,737,148 | |
| | | | | | | | | | | | | | |
| | | | |
CORPORATE BONDS 29.3% | | | | | | | | | | | | | | |
| | | | |
Aerospace & Defense 0.8% | | | | | | | | | | | | | | |
| |
Boeing Co. (The), | | | | | | | | | | | | | | |
Sr. Unsec’d. Notes | | 2.196 | | | 02/04/26 | | | | 253 | | | | 231,583 | |
Sr. Unsec’d. Notes | | 3.750 | | | 02/01/50 | | | | 34 | | | | 24,363 | |
Sr. Unsec’d. Notes | | 5.150 | | | 05/01/30 | | | | 45 | | | | 44,277 | |
Raytheon Technologies Corp., | | | | | | | | | | | | | | |
Sr. Unsec’d. Notes | | 4.125 | | | 11/16/28 | | | | 13 | | | | 12,692 | |
Sr. Unsec’d. Notes | | 6.125 | | | 07/15/38 | | | | 15 | | | | 16,689 | |
| | | | | | | | | | | | | | |
| | | | |
| | | | | | | | | | | | | 329,604 | |
| | | | |
Agriculture 0.4% | | | | | | | | | | | | | | |
| |
Altria Group, Inc., | | | | | | | | | | | | | | |
Gtd. Notes | | 3.400 | | | 05/06/30 | | | | 48 | | | | 41,543 | |
Gtd. Notes | | 3.400 | | | 02/04/41 | | | | 50 | | | | 33,746 | |
BAT International Finance PLC (United Kingdom), | | | | | | | | | | | | | | |
Gtd. Notes | | 1.668 | | | 03/25/26 | | | | 124 | | | | 110,391 | |
| | | | | | | | | | | | | | |
| | | | |
| | | | | | | | | | | | | 185,680 | |
| | | | |
Airlines 0.1% | | | | | | | | | | | | | | |
| |
Southwest Airlines Co., | | | | | | | | | | | | | | |
Sr. Unsec’d. Notes | | 5.125 | | | 06/15/27 | | | | 50 | | | | 51,023 | |
United Airlines 2013-1 Class A Pass-Through Trust, | | | | | | | | | | | | | | |
Pass-Through Certificates | | 4.300 | | | 02/15/27 | | | | 9 | | | | 8,502 | |
| | | | | | | | | | | | | | |
| | | | |
| | | | | | | | | | | | | 59,525 | |
See Notes to Financial Statements.
PGIM Fixed Income ETFs 111
PGIM Active Aggregate Bond ETF
Schedule of Investments (continued)
as of August 31, 2022
| | | | | | | | | | | | | | | | |
| | | | | | | | | Principal | | | | |
| | | Interest | | | Maturity | | | Amount | | | | |
| Description | | Rate | | | Date | | | (000)# | | | Value | |
| | | | |
CORPORATE BONDS (Continued) | | | | | | | | | | | | | | | | |
| | | | |
Auto Manufacturers 0.8% | | | | | | | | | | | | | | | | |
| |
| | | | |
Daimler Trucks Finance North America LLC (Germany), | | | | | | | | | | | | | | | | |
Gtd. Notes, 144A | | | 1.625% | | | | 12/13/24 | | | | 150 | | | $ | 140,390 | |
General Motors Co., | | | | | | | | | | | | | | | | |
Sr. Unsec’d. Notes | | | 6.250 | | | | 10/02/43 | | | | 51 | | | | 48,741 | |
Sr. Unsec’d. Notes | | | 6.600 | | | | 04/01/36 | | | | 17 | | | | 17,199 | |
General Motors Financial Co., Inc., | | | | | | | | | | | | | | | | |
Gtd. Notes | | | 3.700 | | | | 05/09/23 | | | | 25 | | | | 24,950 | |
Sr. Unsec’d. Notes | | | 2.900 | | | | 02/26/25 | | | | 113 | | | | 108,134 | |
Toyota Motor Credit Corp., | | | | | | | | | | | | | | | | |
Sr. Unsec’d. Notes, MTN | | | 0.800 | | | | 10/16/25 | | | | 17 | | | | 15,463 | |
| | | | | | | | | | | | | | | | |
| | | | |
| | | | | | | | | | | | | | | 354,877 | |
| | | | |
Auto Parts & Equipment 0.0% | | | | | | | | | | | | | | | | |
| |
| | | | |
Aptiv PLC/Aptiv Corp., | | | | | | | | | | | | | | | | |
Gtd. Notes | | | 3.250 | | | | 03/01/32 | | | | 15 | | | | 12,627 | |
| | | | |
Banks 7.6% | | | | | | | | | | | | | | | | |
| |
| | | | |
Bank of America Corp., | | | | | | | | | | | | | | | | |
Sr. Unsec’d. Notes | | | 2.299(ff) | | | | 07/21/32 | | | | 60 | | | | 47,930 | |
Sr. Unsec’d. Notes | | | 2.687(ff) | | | | 04/22/32 | | | | 115 | | | | 95,534 | |
Sr. Unsec’d. Notes, MTN | | | 2.496(ff) | | | | 02/13/31 | | | | 375 | | | | 314,807 | |
Sr. Unsec’d. Notes, MTN | | | 3.970(ff) | | | | 03/05/29 | | | | 175 | | | | 165,101 | |
Sr. Unsec’d. Notes, Series N | | | 1.658(ff) | | | | 03/11/27 | | | | 30 | | | | 26,817 | |
Sub. Notes, MTN | | | 4.450 | | | | 03/03/26 | | | | 115 | | | | 114,535 | |
Bank of New York Mellon Corp. (The), | | | | | | | | | | | | | | | | |
Sr. Unsec’d. Notes, MTN | | | 2.950 | | | | 01/29/23 | | | | 20 | | | | 19,946 | |
BNP Paribas SA (France), | | | | | | | | | | | | | | | | |
Gtd. Notes, MTN | | | 3.250 | | | | 03/03/23 | | | | 119 | | | | 118,668 | |
Citigroup, Inc., | | | | | | | | | | | | | | | | |
Sr. Unsec’d. Notes | | | 2.666(ff) | | | | 01/29/31 | | | | 210 | | | | 178,140 | |
Sr. Unsec’d. Notes | | | 2.976(ff) | | | | 11/05/30 | | | | 120 | | | | 104,508 | |
Sr. Unsec’d. Notes | | | 3.700 | | | | 01/12/26 | | | | 64 | | | | 62,517 | |
Sr. Unsec’d. Notes | | | 4.075(ff) | | | | 04/23/29 | | | | 80 | | | | 76,111 | |
Sub. Notes | | | 4.400 | | | | 06/10/25 | | | | 55 | | | | 54,784 | |
Sub. Notes | | | 4.450 | | | | 09/29/27 | | | | 21 | | | | 20,486 | |
Deutsche Bank AG (Germany), | | | | | | | | | | | | | | | | |
Sr. Unsec’d. Notes, MTN | | | 3.700 | | | | 05/30/24 | | | | 62 | | | | 61,225 | |
Goldman Sachs Group, Inc. (The), | | | | | | | | | | | | | | | | |
Sr. Unsec’d. Notes | | | 1.992(ff) | | | | 01/27/32 | | | | 165 | | | | 130,283 | |
See Notes to Financial Statements.
112
PGIM Active Aggregate Bond ETF
Schedule of Investments (continued)
as of August 31, 2022
| | | | | | | | | | | | | | | | |
| | | | | | | | | Principal | | | | |
| | | Interest | | | Maturity | | | Amount | | | | |
| Description | | Rate | | | Date | | | (000)# | | | Value | |
| | | | |
CORPORATE BONDS (Continued) | | | | | | | | | | | | | | | | |
| | | | |
Banks (cont’d.) | | | | | | | | | | | | | | | | |
| |
| | | | |
Goldman Sachs Group, Inc. (The), (cont’d.) | | | | | | | | | | | | | | | | |
Sr. Unsec’d. Notes | | | 2.615%(ff) | | | | 04/22/32 | | | | 85 | | | $ | 70,016 | |
Sr. Unsec’d. Notes | | | 3.750 | | | | 02/25/26 | | | | 25 | | | | 24,486 | |
Sr. Unsec’d. Notes | | | 3.814(ff) | | | | 04/23/29 | | | | 80 | | | | 75,069 | |
| | | | |
JPMorgan Chase & Co., | | | | | | | | | | | | | | | | |
Sr. Unsec’d. Notes | | | 1.578(ff) | | | | 04/22/27 | | | | 100 | | | | 89,346 | |
Sr. Unsec’d. Notes | | | 2.522(ff) | | | | 04/22/31 | | | | 370 | | | | 313,012 | |
Sr. Unsec’d. Notes | | | 2.545(ff) | | | | 11/08/32 | | | | 5 | | | | 4,120 | |
Sr. Unsec’d. Notes | | | 2.580(ff) | | | | 04/22/32 | | | | 42 | | | | 34,745 | |
Sr. Unsec’d. Notes | | | 2.739(ff) | | | | 10/15/30 | | | | 150 | | | | 129,911 | |
Sr. Unsec’d. Notes | | | 3.509(ff) | | | | 01/23/29 | | | | 150 | | | | 138,972 | |
Sub. Notes | | | 2.956(ff) | | | | 05/13/31 | | | | 21 | | | | 18,102 | |
Sub. Notes | | | 4.250 | | | | 10/01/27 | | | | 21 | | | | 20,782 | |
| | | | |
Morgan Stanley, | | | | | | | | | | | | | | | | |
Sr. Unsec’d. Notes, GMTN | | | 2.239(ff) | | | | 07/21/32 | | | | 40 | | | | 32,259 | |
Sr. Unsec’d. Notes, GMTN | | | 2.699(ff) | | | | 01/22/31 | | | | 255 | | | | 220,782 | |
Sr. Unsec’d. Notes, GMTN | | | 3.750 | | | | 02/25/23 | | | | 34 | | | | 34,023 | |
Sr. Unsec’d. Notes, GMTN | | | 3.772(ff) | | | | 01/24/29 | | | | 110 | | | | 103,566 | |
Sr. Unsec’d. Notes, GMTN | | | 3.875 | | | | 01/27/26 | | | | 76 | | | | 74,978 | |
Sr. Unsec’d. Notes, MTN | | | 1.928(ff) | | | | 04/28/32 | | | | 90 | | | | 71,099 | |
| | | | |
Wells Fargo & Co., | | | | | | | | | | | | | | | | |
Sr. Unsec’d. Notes, MTN | | | 2.572(ff) | | | | 02/11/31 | | | | 282 | | | | 240,139 | |
| | | | | | | | | | | | | | | | |
| | | | |
| | | | | | | | | | | | | | | 3,286,799 | |
| | | | |
Beverages 0.6% | | | | | | | | | | | | | | | | |
| |
| | | | |
Anheuser-Busch InBev Finance, Inc. (Belgium), | | | | | | | | | | | | | | | | |
Gtd. Notes | | | 4.000 | | | | 01/17/43 | | | | 115 | | | | 96,503 | |
| | | | |
Anheuser-Busch InBev Worldwide, Inc. (Belgium), | | | | | | | | | | | | | | | | |
Gtd. Notes | | | 4.750 | | | | 01/23/29 | | | | 75 | | | | 76,477 | |
| | | | |
Constellation Brands, Inc., | | | | | | | | | | | | | | | | |
Sr. Unsec’d. Notes | | | 2.250 | | | | 08/01/31 | | | | 80 | | | | 65,135 | |
| | | | |
Keurig Dr. Pepper, Inc., | | | | | | | | | | | | | | | | |
Gtd. Notes | | | 3.200 | | | | 05/01/30 | | | | 20 | | | | 17,958 | |
| | | | | | | | | | | | | | | | |
| | | | |
| | | | | | | | | | | | | | | 256,073 | |
See Notes to Financial Statements.
PGIM Fixed Income ETFs 113
PGIM Active Aggregate Bond ETF
Schedule of Investments (continued)
as of August 31, 2022
| | | | | | | | | | | | | | | | |
| | | | | | | | | Principal | | | | |
| | | Interest | | | Maturity | | | Amount | | | | |
| Description | | Rate | | | Date | | | (000)# | | | Value | |
| | | | |
CORPORATE BONDS (Continued) | | | | | | | | | | | | | | | | |
| | | | |
Biotechnology 0.1% | | | | | | | | | | | | | | | | |
| | | | |
Amgen, Inc., | | | | | | | | | | | | | | | | |
Sr. Unsec’d. Notes | | | 2.800% | | | | 08/15/41 | | | | 45 | | | $ | 33,773 | |
Sr. Unsec’d. Notes | | | 4.663 | | | | 06/15/51 | | | | 13 | | | | 12,191 | |
| | | | | | | | | | | | | | | | |
| | | | |
| | | | | | | | | | | | | | | 45,964 | |
| | | | |
Building Materials 0.4% | | | | | | | | | | | | | | | | |
| | | | |
Martin Marietta Materials, Inc., | | | | | | | | | | | | | | | | |
Sr. Unsec’d. Notes | | | 2.400 | | | | 07/15/31 | | | | 11 | | | | 9,053 | |
Sr. Unsec’d. Notes | | | 4.250 | | | | 07/02/24 | | | | 21 | | | | 20,948 | |
Owens Corning, | | | | | | | | | | | | | | | | |
Sr. Unsec’d. Notes | | | 3.400 | | | | 08/15/26 | | | | 25 | | | | 23,814 | |
Sr. Unsec’d. Notes | | | 3.950 | | | | 08/15/29 | | | | 95 | | | | 89,075 | |
Vulcan Materials Co., | | | | | | | | | | | | | | | | |
Sr. Unsec’d. Notes | | | 3.500 | | | | 06/01/30 | | | | 13 | | | | 11,747 | |
| | | | | | | | | | | | | | | | |
| | | | |
| | | | | | | | | | | | | | | 154,637 | |
| | | | |
Chemicals 0.3% | | | | | | | | | | | | | | | | |
| | | | |
Dow Chemical Co. (The), | | | | | | | | | | | | | | | | |
Sr. Unsec’d. Notes | | | 3.600 | | | | 11/15/50 | | | | 17 | | | | 13,004 | |
FMC Corp., | | | | | | | | | | | | | | | | |
Sr. Unsec’d. Notes | | | 3.450 | | | | 10/01/29 | | | | 90 | | | | 80,613 | |
Sr. Unsec’d. Notes | | | 4.500 | | | | 10/01/49 | | | | 13 | | | | 10,951 | |
LYB International Finance III LLC, | | | | | | | | | | | | | | | | |
Gtd. Notes | | | 4.200 | | | | 10/15/49 | | | | 17 | | | | 13,664 | |
Nutrien Ltd. (Canada), | | | | | | | | | | | | | | | | |
Sr. Unsec’d. Notes | | | 4.900 | | | | 06/01/43 | | | | 21 | | | | 20,256 | |
| | | | | | | | | | | | | | | | |
| | | | |
| | | | | | | | | | | | | | | 138,488 | |
| | | | |
Commercial Services 1.1% | | | | | | | | | | | | | | | | |
| | | | |
California Institute of Technology, | | | | | | | | | | | | | | | | |
Sr. Unsec’d. Notes | | | 3.650 | | | | 09/01/2119 | | | | 20 | | | | 14,331 | |
Equifax, Inc., | | | | | | | | | | | | | | | | |
Sr. Unsec’d. Notes | | | 2.350 | | | | 09/15/31 | | | | 20 | | | | 16,123 | |
Sr. Unsec’d. Notes | | | 2.600 | | | | 12/01/24 | | | | 121 | | | | 116,929 | |
ERAC USA Finance LLC, | | | | | | | | | | | | | | | | |
Gtd. Notes, 144A | | | 3.300 | | | | 12/01/26 | | | | 45 | | | | 42,509 | |
See Notes to Financial Statements.
114
PGIM Active Aggregate Bond ETF
Schedule of Investments (continued)
as of August 31, 2022
| | | | | | | | | | | | | | | | |
| | | | | | | | | Principal | | | | |
| | | Interest | | | Maturity | | | Amount | | | | |
| Description | | Rate | | | Date | | | (000)# | | | Value | |
| | | | |
CORPORATE BONDS (Continued) | | | | | | | | | | | | | | | | |
| | | | |
Commercial Services (cont’d.) | | | | | | | | | | | | | | | | |
| | | | |
Global Payments, Inc., | | | | | | | | | | | | | | | | |
Sr. Unsec’d. Notes | | | 1.200% | | | | 03/01/26 | | | | 21 | | | $ | 18,527 | |
| | | | |
Massachusetts Institute of Technology, | | | | | | | | | | | | | | | | |
Sr. Unsec’d. Notes, Series F | | | 2.989 | | | | 07/01/50 | | | | 10 | | | | 8,029 | |
Unsec’d. Notes | | | 4.678 | | | | 07/01/2114 | | | | 30 | | | | 29,248 | |
| | | | |
President & Fellows of Harvard College, | | | | | | | | | | | | | | | | |
Unsec’d. Notes | | | 2.517 | | | | 10/15/50 | | | | 35 | | | | 25,548 | |
Unsec’d. Notes | | | 3.150 | | | | 07/15/46 | | | | 35 | | | | 29,494 | |
| | | | |
Thomas Jefferson University, | | | | | | | | | | | | | | | | |
Sec’d. Notes | | | 3.847 | | | | 11/01/57 | | | | 45 | | | | 36,916 | |
| | | | |
Trustees of Boston University, | | | | | | | | | | | | | | | | |
Sec’d. Notes, Series CC | | | 4.061 | | | | 10/01/48 | | | | 20 | | | | 18,553 | |
| | | | |
Trustees of the University of Pennsylvania (The), | | | | | | | | | | | | | | | | |
Sr. Unsec’d. Notes | | | 3.610 | | | | 02/15/2119 | | | | 25 | | | | 18,248 | |
| | | | |
University of Southern California, | | | | | | | | | | | | | | | | |
Unsec’d. Notes, Series 2017 | | | 3.841 | | | | 10/01/47 | | | | 10 | | | | 9,100 | |
| | | | |
Washington University (The), | | | | | | | | | | | | | | | | |
Sr. Unsec’d. Notes, Series 2022 | | | 3.524 | | | | 04/15/54 | | | | 80 | | | | 68,750 | |
| | | | |
Yale University, | | | | | | | | | | | | | | | | |
Unsec’d. Notes, Series 2020 | | | 2.402 | | | | 04/15/50 | | | | 20 | | | | 14,316 | |
| | | | | | | | | | | | | | | | |
| | | | |
| | | | | | | | | | | | | | | 466,621 | |
| | | | |
Computers 0.1% | | | | | | | | | | | | | | | | |
| | | | |
Apple, Inc., | | | | | | | | | | | | | | | | |
Sr. Unsec’d. Notes | | | 3.250 | | | | 02/23/26 | | | | 50 | | | | 49,223 | |
| | | | |
International Business Machines Corp., | | | | | | | | | | | | | | | | |
Sr. Unsec’d. Notes | | | 5.875 | | | | 11/29/32 | | | | 8 | | | | 8,756 | |
| | | | | | | | | | | | | | | | |
| | | | |
| | | | | | | | | | | | | | | 57,979 | |
| | | | |
Diversified Financial Services 0.1% | | | | | | | | | | | | | | | | |
| | | | |
Discover Financial Services, | | | | | | | | | | | | | | | | |
Sr. Unsec’d. Notes | | | 3.750 | | | | 03/04/25 | | | | 21 | | | | 20,473 | |
| | | | |
Jefferies Group LLC/Jefferies Group Capital Finance, Inc., | | | | | | | | | | | | | | | | |
Sr. Unsec’d. Notes | | | 2.625 | | | | 10/15/31 | | | | 25 | | | | 19,402 | |
| | | | | | | | | | | | | | | | |
| | | | |
| | | | | | | | | | | | | | | 39,875 | |
See Notes to Financial Statements.
PGIM Fixed Income ETFs 115
PGIM Active Aggregate Bond ETF
Schedule of Investments (continued)
as of August 31, 2022
| | | | | | | | | | | | | | | | |
| | | | | | | | | Principal | | | | |
| | | Interest | | | Maturity | | | Amount | | | | |
| Description | | Rate | | | Date | | | (000)# | | | Value | |
| | | | |
CORPORATE BONDS (Continued) | | | | | | | | | | | | | | | | |
| | | | |
Electric 2.2% | | | | | | | | | | | | | | | | |
| | | | |
AEP Texas, Inc., | | | | | | | | | | | | | | | | |
Sr. Unsec’d. Notes | | | 3.450% | | | | 05/15/51 | | | | 13 | | | $ | 10,037 | |
Sr. Unsec’d. Notes, Series I | | | 2.100 | | | | 07/01/30 | | | | 62 | | | | 51,224 | |
AEP Transmission Co. LLC, | | | | | | | | | | | | | | | | |
Sr. Unsec’d. Notes | | | 4.250 | | | | 09/15/48 | | | | 17 | | | | 15,287 | |
Ameren Corp., | | | | | | | | | | | | | | | | |
Sr. Unsec’d. Notes | | | 2.500 | | | | 09/15/24 | | | | 21 | | | | 20,247 | |
Arizona Public Service Co., | | | | | | | | | | | | | | | | |
Sr. Unsec’d. Notes | | | 2.600 | | | | 08/15/29 | | | | 8 | | | | 6,908 | |
Consolidated Edison Co. of New York, Inc., | | | | | | | | | | | | | | | | |
Sr. Unsec’d. Notes, Series C | | | 4.300 | | | | 12/01/56 | | | | 4 | | | | 3,480 | |
Dominion Energy South Carolina, Inc., | | | | | | | | | | | | | | | | |
First Mortgage | | | 4.600 | | | | 06/15/43 | | | | 32 | | | | 30,378 | |
DTE Electric Co., | | | | | | | | | | | | | | | | |
General Ref. Mortgage, Series A | | | 4.050 | | | | 05/15/48 | | | | 21 | | | | 19,100 | |
Duke Energy Carolinas LLC, | | | | | | | | | | | | | | | | |
Sr. Unsec’d. Notes | | | 6.100 | | | | 06/01/37 | | | | 21 | | | | 22,472 | |
Duke Energy Florida LLC, | | | | | | | | | | | | | | | | |
First Mortgage | | | 2.400 | | | | 12/15/31 | | | | 95 | | | | 80,885 | |
Emera US Finance LP (Canada), | | | | | | | | | | | | | | | | |
Gtd. Notes | | | 2.639 | | | | 06/15/31 | | | | 13 | | | | 10,780 | |
Gtd. Notes | | | 4.750 | | | | 06/15/46 | | | | 13 | | | | 11,508 | |
Entergy Louisiana LLC, | | | | | | | | | | | | | | | | |
Collateral Trust | | | 4.200 | | | | 09/01/48 | | | | 8 | | | | 7,160 | |
Eversource Energy, | | | | | | | | | | | | | | | | |
Sr. Unsec’d. Notes, Series O | | | 4.250 | | | | 04/01/29 | | | | 41 | | | | 39,954 | |
Florida Power & Light Co., | | | | | | | | | | | | | | | | |
First Mortgage | | | 4.050 | | | | 06/01/42 | | | | 15 | | | | 13,852 | |
Jersey Central Power & Light Co., | | | | | | | | | | | | | | | | |
Sr. Unsec’d. Notes, 144A | | | 4.700 | | | | 04/01/24 | | | | 17 | | | | 16,901 | |
MidAmerican Energy Co., | | | | | | | | | | | | | | | | |
First Mortgage | | | 4.250 | | | | 07/15/49 | | | | 34 | | | | 31,541 | |
Mississippi Power Co., | | | | | | | | | | | | | | | | |
Sr. Unsec’d. Notes, Series 12-A | | | 4.250 | | | | 03/15/42 | | | | 33 | | | | 28,776 | |
Monongahela Power Co., | | | | | | | | | | | | | | | | |
First Mortgage, 144A | | | 3.550 | | | | 05/15/27 | | | | 96 | | | | 90,783 | |
Northern States Power Co., | | | | | | | | | | | | | | | | |
First Mortgage | | | 3.400 | | | | 08/15/42 | | | | 34 | | | | 28,672 | |
NRG Energy, Inc., | | | | | | | | | | | | | | | | |
Sr. Sec’d. Notes, 144A | | | 3.750 | | | | 06/15/24 | | | | 17 | | | | 16,501 | |
See Notes to Financial Statements.
116
PGIM Active Aggregate Bond ETF
Schedule of Investments (continued)
as of August 31, 2022
| | | | | | | | | | | | |
| | | | | | | Principal | | | | |
| | | Interest | | Maturity | | Amount | | | | |
| Description | | Rate | | Date | | (000)# | | | Value | |
| | | | |
CORPORATE BONDS (Continued) | | | | | | | | | | | | |
| | | | |
Electric (cont’d.) | | | | | | | | | | | | |
| | | | |
Pacific Gas & Electric Co., | | | | | | | | | | | | |
First Mortgage | | 3.500% | | 08/01/50 | | | 29 | | | $ | 19,262 | |
First Mortgage | | 4.550 | | 07/01/30 | | | 20 | | | | 17,802 | |
First Mortgage | | 4.950 | | 07/01/50 | | | 40 | | | | 32,003 | |
PECO Energy Co., | | | | | | | | | | | | |
First Mortgage | | 2.800 | | 06/15/50 | | | 32 | | | | 23,088 | |
PPL Electric Utilities Corp., | | | | | | | | | | | | |
First Mortgage | | 3.000 | | 10/01/49 | | | 13 | | | | 9,713 | |
Public Service Electric & Gas Co., | | | | | | | | | | | | |
First Mortgage, MTN | | 3.600 | | 12/01/47 | | | 13 | | | | 10,904 | |
First Mortgage, MTN | | 3.700 | | 05/01/28 | | | 38 | | | | 37,127 | |
Puget Energy, Inc., | | | | | | | | | | | | |
Sr. Sec’d. Notes | | 2.379 | | 06/15/28 | | | 5 | | | | 4,357 | |
Sr. Sec’d. Notes | | 4.100 | | 06/15/30 | | | 75 | | | | 69,385 | |
San Diego Gas & Electric Co., | | | | | | | | | | | | |
First Mortgage | | 4.150 | | 05/15/48 | | | 15 | | | | 13,621 | |
Sempra Energy, | | | | | | | | | | | | |
Sr. Unsec’d. Notes | | 3.300 | | 04/01/25 | | | 35 | | | | 34,053 | |
Sr. Unsec’d. Notes | | 4.000 | | 02/01/48 | | | 15 | | | | 12,522 | |
Southern California Edison Co., | | | | | | | | | | | | |
First Ref. Mortgage | | 4.000 | | 04/01/47 | | | 55 | | | | 44,342 | |
Tucson Electric Power Co., | | | | | | | | | | | | |
Sr. Unsec’d. Notes | | 3.250 | | 05/15/32 | | | 30 | | | | 26,716 | |
Vistra Operations Co. LLC, | | | | | | | | | | | | |
Sr. Sec’d. Notes, 144A | | 3.550 | | 07/15/24 | | | 47 | | | | 45,309 | |
Xcel Energy, Inc., | | | | | | | | | | | | |
Sr. Unsec’d. Notes | | 1.750 | | 03/15/27 | | | 10 | | | | 8,951 | |
| | | | | | | | | | | | |
| | | | |
| | | | | | | | | | | 965,601 | |
| | | | |
Engineering & Construction 0.4% | | | | | | | | | | | | |
| | | | |
Mexico City Airport Trust (Mexico), | | | | | | | | | | | | |
Sr. Sec’d. Notes, 144A | | 4.250 | | 10/31/26 | | | 200 | | | | 188,000 | |
| | | | |
Entertainment 0.2% | | | | | | | | | | | | |
| | | | |
Magallanes, Inc., | | | | | | | | | | | | |
Gtd. Notes, 144A | | 4.279 | | 03/15/32 | | | 20 | | | | 17,373 | |
Gtd. Notes, 144A | | 5.141 | | 03/15/52 | | | 70 | | | | 56,357 | |
| | | | | | | | | | | | |
| | | | |
| | | | | | | | | | | 73,730 | |
See Notes to Financial Statements.
PGIM Fixed Income ETFs 117
PGIM Active Aggregate Bond ETF
Schedule of Investments (continued)
as of August 31, 2022
| | | | | | | | | | | | | | | | |
| | | | | | | | | Principal | | | | |
| | | Interest | | | Maturity | | | Amount | | | | |
| Description | | Rate | | | Date | | | (000)# | | | Value | |
| | | |
CORPORATE BONDS (Continued) | | | | | | | | | | | | | |
| | | | |
Foods 0.4% | | | | | | | | | | | | | | | | |
| | | | |
Campbell Soup Co., | | | | | | | | | | | | | | | | |
Sr. Unsec’d. Notes | | | 3.300% | | | | 03/19/25 | | | | 51 | | | $ | 49,792 | |
| | | | |
Hormel Foods Corp., | | | | | | | | | | | | | | | | |
Sr. Unsec’d. Notes | | | 0.650 | | | | 06/03/24 | | | | 8 | | | | 7,599 | |
| | | | |
JBS USA LUX SA/JBS USA Food Co./JBS USA Finance, Inc., | | | | | | | | | | | | | | | | |
Gtd. Notes, 144A | | | 3.000 | | | | 02/02/29 | | | | 100 | | | | 86,579 | |
| | | | |
Mars, Inc., | | | | | | | | | | | | | | | | |
Gtd. Notes, 144A | | | 3.600 | | | | 04/01/34 | | | | 10 | | | | 9,174 | |
| | | | | | | | | | | | | | | | |
| | | | |
| | | | | | | | | | | | | | | 153,144 | |
| | | | |
Gas 0.2% | | | | | | | | | | | | | | | | |
| | | | |
CenterPoint Energy Resources Corp., | | | | | | | | | | | | | | | | |
Sr. Unsec’d. Notes | | | 4.100 | | | | 09/01/47 | | | | 21 | | | | 18,653 | |
| | | | |
NiSource, Inc., | | | | | | | | | | | | | | | | |
Sr. Unsec’d. Notes | | | 3.490 | | | | 05/15/27 | | | | 13 | | | | 12,443 | |
| | | | |
Piedmont Natural Gas Co., Inc., | | | | | | | | | | | | | | | | |
Sr. Unsec’d. Notes | | | 3.500 | | | | 06/01/29 | | | | 21 | | | | 19,557 | |
| | | | |
Southern California Gas Co., | | | | | | | | | | | | | | | | |
First Mortgage | | | 3.750 | | | | 09/15/42 | | | | 30 | | | | 24,957 | |
| | | | | | | | | | | | | | | | |
| | | | |
| | | | | | | | | | | | | | | 75,610 | |
| | | | |
Healthcare-Services 1.0% | | | | | | | | | | | | | | | | |
| | | | |
Ascension Health, | | | | | | | | | | | | | | | | |
Sr. Unsec’d. Notes, Series B | | | 2.532 | | | | 11/15/29 | | | | 35 | | | | 31,312 | |
| | | | |
Elevance Health, Inc., | | | | | | | | | | | | | | | | |
Sr. Unsec’d. Notes | | | 4.625 | | | | 05/15/42 | | | | 50 | | | | 47,567 | |
| | | | |
Kaiser Foundation Hospitals, | | | | | | | | | | | | | | | | |
Unsec’d. Notes, Series 2021 | | | 2.810 | | | | 06/01/41 | | | | 70 | | | | 53,445 | |
Unsec’d. Notes, Series 2021 | | | 3.002 | | | | 06/01/51 | | | | 10 | | | | 7,441 | |
| | | | |
Memorial Sloan-Kettering Cancer Center, | | | | | | | | | | | | | | | | |
Unsec’d. Notes, Series 2020 | | | 2.955 | | | | 01/01/50 | | | | 15 | | | | 11,011 | |
| | | | |
Methodist Hospital (The), | | | | | | | | | | | | | | | | |
Unsec’d. Notes, Series 20A | | | 2.705 | | | | 12/01/50 | | | | 10 | | | | 6,929 | |
| | | | |
New York & Presbyterian Hospital (The), | | | | | | | | | | | | | | | | |
Unsec’d. Notes | | | 4.024 | | | | 08/01/45 | | | | 20 | | | | 18,302 | |
| | | | |
Northwestern Memorial Healthcare Obligated Group, | | | | | | | | | | | | | | | | |
Unsec’d. Notes, Series 2021 | | | 2.633 | | | | 07/15/51 | | | | 20 | | | | 13,969 | |
See Notes to Financial Statements.
118
PGIM Active Aggregate Bond ETF
Schedule of Investments (continued)
as of August 31, 2022
| | | | | | | | | | | | | | | | |
| | | | | | | | | Principal | | | | |
| | | Interest | | | Maturity | | | Amount | | | | |
| Description | | Rate | | | Date | | | (000)# | | | Value | |
| | | | |
CORPORATE BONDS (Continued) | | | | | | | | | | | | | | | | |
| | | | |
Healthcare-Services (cont’d.) | | | | | | | | | | | | | | | | |
| | | | |
OhioHealth Corp., | | | | | | | | | | | | | | | | |
Sec’d. Notes | | | 2.297% | | | | 11/15/31 | | | | 30 | | | $ | 25,241 | |
| | | | |
Piedmont Healthcare, Inc., | | | | | | | | | | | | | | | | |
Sec’d. Notes, Series 2042 | | | 2.719 | | | | 01/01/42 | | | | 15 | | | | 11,004 | |
| | | | |
Quest Diagnostics, Inc., | | | | | | | | | | | | | | | | |
Sr. Unsec’d. Notes | | | 4.700 | | | | 03/30/45 | | | | 8 | | | | 7,161 | |
| | | | |
Sentara Healthcare, | | | | | | | | | | | | | | | | |
Sr. Unsec’d. Notes, Series 2021 | | | 2.927 | | | | 11/01/51 | | | | 65 | | | | 47,840 | |
| | | | |
Stanford Health Care, | | | | | | | | | | | | | | | | |
Unsec’d. Notes | | | 3.027 | | | | 08/15/51 | | | | 35 | | | | 25,793 | |
| | | | |
UnitedHealth Group, Inc., | | | | | | | | | | | | | | | | |
Sr. Unsec’d. Notes | | | 2.300 | | | | 05/15/31 | | | | 45 | | | | 38,631 | |
Sr. Unsec’d. Notes | | | 3.950 | | | | 10/15/42 | | | | 60 | | | | 53,794 | |
Sr. Unsec’d. Notes | | | 4.950 | | | | 05/15/62 | | | | 10 | | | | 10,034 | |
| | | | | | | | | | | | | | | | |
| | | | |
| | | | | | | | | | | | | | | 409,474 | |
| | | | |
Home Builders 0.5% | | | | | | | | | | | | | | | | |
| | | | |
Toll Brothers Finance Corp., | | | | | | | | | | | | | | | | |
Gtd. Notes | | | 4.875 | | | | 03/15/27 | | | | 220 | | | | 211,709 | |
| | | | |
Insurance 0.5% | | | | | | | | | | | | | | | | |
| | | | |
Chubb INA Holdings, Inc., | | | | | | | | | | | | | | | | |
Gtd. Notes | | | 2.700 | | | | 03/13/23 | | | | 48 | | | | 47,746 | |
| | | | |
Corebridge Financial, Inc., | | | | | | | | | | | | | | | | |
Sr. Unsec’d. Notes, 144A | | | 3.900 | | | | 04/05/32 | | | | 45 | | | | 40,448 | |
| | | | |
Everest Reinsurance Holdings, Inc., | | | | | | | | | | | | | | | | |
Sr. Unsec’d. Notes | | | 3.500 | | | | 10/15/50 | | | | 8 | | | | 5,981 | |
Sr. Unsec’d. Notes | | | 4.868 | | | | 06/01/44 | | | | 30 | | | | 27,499 | |
| | | | |
Fairfax Financial Holdings Ltd. (Canada), | | | | | | | | | | | | | | | | |
Sr. Unsec’d. Notes, 144A | | | 5.625 | | | | 08/16/32 | | | | 15 | | | | 14,711 | |
| | | | |
Liberty Mutual Group, Inc., | | | | | | | | | | | | | | | | |
Gtd. Notes, 144A | | | 3.951 | | | | 10/15/50 | | | | 38 | | | | 29,167 | |
| | | | |
Lincoln National Corp., | | | | | | | | | | | | | | | | |
Sr. Unsec’d. Notes | | | 3.050 | | | | 01/15/30 | | | | 8 | | | | 7,019 | |
| | | | |
Markel Corp., | | | | | | | | | | | | | | | | |
Sr. Unsec’d. Notes | | | 4.150 | | | | 09/17/50 | | | | 17 | | | | 13,938 | |
See Notes to Financial Statements.
PGIM Fixed Income ETFs 119
PGIM Active Aggregate Bond ETF
Schedule of Investments (continued)
as of August 31, 2022
| | | | | | | | | | | | | | | | |
| | | | | | | | | Principal | | | | |
| | | Interest | | | Maturity | | | Amount | | | | |
| Description | | Rate | | | Date | | | (000)# | | | Value | |
| | | | |
CORPORATE BONDS (Continued) | | | | | | | | | | | | | | | | |
| | | | |
Insurance (cont’d.) | | | | | | | | | | | | | | | | |
| | | | |
Principal Financial Group, Inc., | | | | | | | | | | | | | | | | |
Gtd. Notes | | | 4.625% | | | | 09/15/42 | | | | 32 | | | $ | 29,410 | |
| | | | |
W.R. Berkley Corp., | | | | | | | | | | | | | | | | |
Sr. Unsec’d. Notes | | | 4.000 | | | | 05/12/50 | | | | 8 | | | | 6,626 | |
| | | | | | | | | | | | | | | | |
| | | | |
| | | | | | | | | | | | | | | 222,545 | |
| | | | |
Iron/Steel 0.3% | | | | | | | | | | | | | | | | |
| | | | |
Nucor Corp., | | | | | | | | | | | | | | | | |
Sr. Unsec’d. Notes | | | 4.300 | | | | 05/23/27 | | | | 25 | | | | 24,865 | |
| | | | |
Steel Dynamics, Inc., | | | | | | | | | | | | | | | | |
Sr. Unsec’d. Notes | | | 3.450 | | | | 04/15/30 | | | | 80 | | | | 71,298 | |
| | | | |
Vale Overseas Ltd. (Brazil), | | | | | | | | | | | | | | | | |
Gtd. Notes | | | 6.250 | | | | 08/10/26 | | | | 10 | | | | 10,472 | |
| | | | | | | | | | | | | | | | |
| | | | |
| | | | | | | | | | | | | | | 106,635 | |
| | | | |
Lodging 0.2% | | | | | | | | | | | | | | | | |
| | | | |
Marriott International, Inc., | | | | | | | | | | | | | | | | |
Sr. Unsec’d. Notes, Series R | | | 3.125 | | | | 06/15/26 | | | | 83 | | | | 78,746 | |
| | | | |
Machinery-Construction & Mining 0.0% | | | | | | | | | | | | | | | | |
| | | | |
Caterpillar, Inc., | | | | | | | | | | | | | | | | |
Sr. Unsec’d. Notes | | | 2.600 | | | | 09/19/29 | | | | 13 | | | | 11,855 | |
| | | | |
Machinery-Diversified 0.2% | | | | | | | | | | | | | | | | |
| | | | |
Flowserve Corp., | | | | | | | | | | | | | | | | |
Sr. Unsec’d. Notes | | | 2.800 | | | | 01/15/32 | | | | 5 | | | | 3,886 | |
| | | | |
Westinghouse Air Brake Technologies Corp., | | | | | | | | | | | | | | | | |
Gtd. Notes | | | 3.200 | | | | 06/15/25 | | | | 88 | | | | 83,940 | |
| | | | | | | | | | | | | | | | |
| | | | |
| | | | | | | | | | | | | | | 87,826 | |
| | | | |
Media 1.1% | | | | | | | | | | | | | | | | |
| | | | |
Charter Communications Operating LLC/Charter Communications Operating Capital, | | | | | | | | | | | | | | | | |
Sr. Sec’d. Notes | | | 4.800 | | | | 03/01/50 | | | | 64 | | | | 50,280 | |
Sr. Sec’d. Notes | | | 4.908 | | | | 07/23/25 | | | | 93 | | | | 92,784 | |
Sr. Sec’d. Notes | | | 6.384 | | | | 10/23/35 | | | | 120 | | | | 119,559 | |
See Notes to Financial Statements.
120
PGIM Active Aggregate Bond ETF
Schedule of Investments (continued)
as of August 31, 2022
| | | | | | | | | | | | | | | | |
| | | | | | | | | Principal | | | | |
| | | Interest | | | Maturity | | | Amount | | | | |
| Description | | Rate | | | Date | | | (000)# | | | Value | |
| | | | |
CORPORATE BONDS (Continued) | | | | | | | | | | | | | | | | |
| | | | |
Media (cont’d.) | | | | | | | | | | | | | | | | |
| | | | |
Comcast Corp., | | | | | | | | | | | | | | | | |
Gtd. Notes | | | 3.999% | | | | 11/01/49 | | | | 42 | | | $ | 35,997 | |
Gtd. Notes | | | 4.250 | | | | 10/15/30 | | | | 30 | | | | 29,616 | |
| | | | |
Cox Communications, Inc., | | | | | | | | | | | | | | | | |
Sr. Unsec’d. Notes, 144A | | | 3.150 | | | | 08/15/24 | | | | 43 | | | | 41,749 | |
| | | | |
Discovery Communications LLC, | | | | | | | | | | | | | | | | |
Gtd. Notes | | | 2.950 | | | | 03/20/23 | | | | 25 | | | | 24,872 | |
Gtd. Notes | | | 5.200 | | | | 09/20/47 | | | | 23 | | | | 18,755 | |
| | | | |
Paramount Global, | | | | | | | | | | | | | | | | |
Sr. Unsec’d. Notes | | | 4.375 | | | | 03/15/43 | | | | 78 | | | | 58,460 | |
| | | | |
Walt Disney Co. (The), | | | | | | | | | | | | | | | | |
Gtd. Notes | | | 3.600 | | | | 01/13/51 | | | | 12 | | | | 10,054 | |
| | | | | | | | | | | | | | | | |
| | | | |
| | | | | | | | | | | | | | | 482,126 | |
| | | | |
Mining 1.0% | | | | | | | | | | | | | | | | |
| | | | |
Barrick North America Finance LLC (Canada), | | | | | | | | | | | | | | | | |
Gtd. Notes | | | 5.750 | | | | 05/01/43 | | | | 55 | | | | 56,338 | |
| | | | |
Freeport-McMoRan, Inc., | | | | | | | | | | | | | | | | |
Gtd. Notes | | | 4.125 | | | | 03/01/28 | | | | 25 | | | | 23,395 | |
Gtd. Notes | | | 4.375 | | | | 08/01/28 | | | | 50 | | | | 47,139 | |
| | | | |
Indonesia Asahan Aluminium Persero PT (Indonesia), | | | | | | | | | | | | | | | | |
Sr. Unsec’d. Notes, 144A | | | 6.530 | | | | 11/15/28 | | | | 200 | | | | 207,287 | |
| | | | |
Newmont Corp., | | | | | | | | | | | | | | | | |
Gtd. Notes | | | 2.600 | | | | 07/15/32 | | �� | | 5 | | | | 4,088 | |
Gtd. Notes | | | 2.800 | | | | 10/01/29 | | | | 122 | | | | 106,502 | |
| | | | | | | | | | | | | | | | |
| | | | |
| | | | | | | | | | | | | | | 444,749 | |
| | | | |
Miscellaneous Manufacturing 0.2% | | | | | | | | | | | | | | | | |
| | | | |
Carlisle Cos., Inc., | | | | | | | | | | | | | | | | |
Sr. Unsec’d. Notes | | | 2.200 | | | | 03/01/32 | | | | 30 | | | | 23,597 | |
| | | | |
Textron, Inc., | | | | | | | | | | | | | | | | |
Sr. Unsec’d. Notes | | | 3.375 | | | | 03/01/28 | | | | 84 | | | | 77,253 | |
| | | | | | | | | | | | | | | | |
| | | | |
| | | | | | | | | | | | | | | 100,850 | |
| | | | |
Multi-National 0.2% | | | | | | | | | | | | | | | | |
| | | | |
Corp. Andina de Fomento (Supranational Bank), | | | | | | | | | | | | | | | | |
Sr. Unsec’d. Notes | | | 3.750 | | | | 11/23/23 | | | | 100 | | | | 99,456 | |
See Notes to Financial Statements.
PGIM Fixed Income ETFs 121
PGIM Active Aggregate Bond ETF
Schedule of Investments (continued)
as of August 31, 2022
| | | | | | | | | | | | | | | | |
| | | | | | | | | Principal | | | | |
| | | Interest | | | Maturity | | | Amount | | | | |
| Description | | Rate | | | Date | | | (000)# | | | Value | |
| | | | |
CORPORATE BONDS (Continued) | | | | | | | | | | | | | | | | |
| | | | |
Oil & Gas 1.1% | | | | | | | | | | | | | | | | |
| | | | |
Canadian Natural Resources Ltd. (Canada), | | | | | | | | | | | | | | | | |
Sr. Unsec’d. Notes | | | 2.950% | | | | 01/15/23 | | | | 42 | | | $ | 41,777 | |
| | | | |
Cenovus Energy, Inc. (Canada), | | | | | | | | | | | | | | | | |
Sr. Unsec’d. Notes | | | 3.750 | | | | 02/15/52 | | | | 5 | | | | 3,849 | |
Sr. Unsec’d. Notes | | | 4.250 | | | | 04/15/27 | | | | 98 | | | | 96,519 | |
Sr. Unsec’d. Notes | | | 5.400 | | | | 06/15/47 | | | | 57 | | | | 55,618 | |
| | | | |
Continental Resources, Inc., | | | | | | | | | | | | | | | | |
Gtd. Notes, 144A | | | 2.268 | | | | 11/15/26 | | | | 15 | | | | 13,259 | |
| | | | |
Devon Energy Corp., | | | | | | | | | | | | | | | | |
Sr. Unsec’d. Notes | | | 5.600 | | | | 07/15/41 | | | | 36 | | | | 35,610 | |
| | | | |
Ecopetrol SA (Colombia), | | | | | | | | | | | | | | | | |
Sr. Unsec’d. Notes | | | 5.375 | | | | 06/26/26 | | | | 40 | | | | 37,485 | |
| | | | |
Exxon Mobil Corp., | | | | | | | | | | | | | | | | |
Sr. Unsec’d. Notes | | | 3.452 | | | | 04/15/51 | | | | 8 | | | | 6,613 | |
| | | | |
Helmerich & Payne, Inc., | | | | | | | | | | | | | | | | |
Sr. Unsec’d. Notes | | | 2.900 | | | | 09/29/31 | | | | 30 | | | | 25,367 | |
| | | | |
Phillips 66, | | | | | | | | | | | | | | | | |
Gtd. Notes | | | 2.150 | | | | 12/15/30 | | | | 84 | | | | 68,918 | |
| | | | |
Phillips 66 Co., | | | | | | | | | | | | | | | | |
Gtd. Notes, 144A | | | 3.550 | | | | 10/01/26 | | | | 17 | | | | 16,338 | |
| | | | |
Pioneer Natural Resources Co., | | | | | | | | | | | | | | | | |
Sr. Unsec’d. Notes | | | 1.125 | | | | 01/15/26 | | | | 77 | | | | 68,806 | |
| | | | | | | | | | | | | | | | |
| | | | |
| | | | | | | | | | | | | | | 470,159 | |
| | | | |
Pharmaceuticals 1.5% | | | | | | | | | | | | | | | | |
| | | | |
AbbVie, Inc., | | | | | | | | | | | | | | | | |
Sr. Unsec’d. Notes | | | 3.200 | | | | 11/21/29 | | | | 100 | | | | 91,414 | |
Sr. Unsec’d. Notes | | | 4.050 | | | | 11/21/39 | | | | 15 | | | | 13,228 | |
Sr. Unsec’d. Notes | | | 4.550 | | | | 03/15/35 | | | | 60 | | | | 57,548 | |
Sr. Unsec’d. Notes | | | 4.625 | | | | 10/01/42 | | | | 15 | | | | 13,781 | |
| | | | |
Astrazeneca Finance LLC (United Kingdom), | | | | | | | | | | | | | | | | |
Gtd. Notes | | | 2.250 | | | | 05/28/31 | | | | 3 | | | | 2,604 | |
| | | | |
Becton, Dickinson & Co., | | | | | | | | | | | | | | | | |
Sr. Unsec’d. Notes | | | 3.734 | | | | 12/15/24 | | | | 53 | | | | 52,326 | |
| | | | |
Bristol-Myers Squibb Co., | | | | | | | | | | | | | | | | |
Sr. Unsec’d. Notes | | | 3.400 | | | | 07/26/29 | | | | 5 | | | | 4,774 | |
| | | | |
Cigna Corp., | | | | | | | | | | | | | | | | |
Gtd. Notes | | | 4.375 | | | | 10/15/28 | | | | 30 | | | | 29,563 | |
Sr. Unsec’d. Notes | | | 2.400 | | | | 03/15/30 | | | | 40 | | | | 34,282 | |
See Notes to Financial Statements.
122
PGIM Active Aggregate Bond ETF
Schedule of Investments (continued)
as of August 31, 2022
| | | | | | | | | | | | | | | | |
| | | | | | | | | Principal | | | | |
| | | Interest | | | Maturity | | | Amount | | | | |
| Description | | Rate | | | Date | | | (000)# | | | Value | |
| | | | |
CORPORATE BONDS (Continued) | | | | | | | | | | | | | | | | |
| | | | |
Pharmaceuticals (cont’d.) | | | | | | | | | | | | | | | | |
| | | | |
CVS Health Corp., | | | | | | | | | | | | | | | | |
Sr. Unsec’d. Notes | | | 5.125% | | | | 07/20/45 | | | | 82 | | | $ | 78,503 | |
Johnson & Johnson, | | | | | | | | | | | | | | | | |
Sr. Unsec’d. Notes | | | 2.100 | | | | 09/01/40 | | | | 10 | | | | 7,276 | |
Merck & Co., Inc., | | | | | | | | | | | | | | | | |
Sr. Unsec’d. Notes | | | 3.400 | | | | 03/07/29 | | | | 8 | | | | 7,707 | |
Mylan, Inc., | | | | | | | | | | | | | | | | |
Gtd. Notes | | | 5.200 | | | | 04/15/48 | | | | 40 | | | | 30,942 | |
Pfizer, Inc., | | | | | | | | | | | | | | | | |
Sr. Unsec’d. Notes | | | 2.550 | | | | 05/28/40 | | | | 13 | | | | 9,988 | |
Shire Acquisitions Investments Ireland DAC, | | | | | | | | | | | | | | | | |
Gtd. Notes | | | 2.875 | | | | 09/23/23 | | | | 26 | | | | 25,662 | |
Gtd. Notes | | | 3.200 | | | | 09/23/26 | | | | 144 | | | | 137,093 | |
Viatris, Inc., | | | | | | | | | | | | | | | | |
Gtd. Notes | | | 3.850 | | | | 06/22/40 | | | | 98 | | | | 68,033 | |
| | | | | | | | | | | | | | | | |
| | | | |
| | | | | | | | | | | | | | | 664,724 | |
| | | | |
Pipelines 1.8% | | | | | | | | | | | | | | | | |
| | | | |
DCP Midstream Operating LP, | | | | | | | | | | | | | | | | |
Gtd. Notes | | | 5.125 | | | | 05/15/29 | | | | 65 | | | | 63,431 | |
Energy Transfer LP, | | | | | | | | | | | | | | | | |
Sr. Unsec’d. Notes | | | 4.950 | | | | 06/15/28 | | | | 133 | | | | 130,841 | |
Sr. Unsec’d. Notes | | | 6.250 | | | | 04/15/49 | | | | 34 | | | | 33,368 | |
Sr. Unsec’d. Notes, Series 20Y | | | 5.800 | | | | 06/15/38 | | | | 50 | | | | 46,848 | |
Enterprise Products Operating LLC, | | | | | | | | | | | | | | | | |
Gtd. Notes | | | 3.125 | | | | 07/31/29 | | | | 30 | | | | 27,214 | |
Gtd. Notes | | | 4.850 | | | | 03/15/44 | | | | 15 | | | | 13,968 | |
Kinder Morgan, Inc., | | | | | | | | | | | | | | | | |
Gtd. Notes | | | 2.000 | | | | 02/15/31 | | | | 34 | | | | 27,037 | |
Gtd. Notes | | | 3.250 | | | | 08/01/50 | | | | 17 | | | | 11,820 | |
MPLX LP, | | | | | | | | | | | | | | | | |
Sr. Unsec’d. Notes | | | 2.650 | | | | 08/15/30 | | | | 75 | | | | 62,594 | |
Sr. Unsec’d. Notes | | | 4.500 | | | | 04/15/38 | | | | 63 | | | | 55,712 | |
Sr. Unsec’d. Notes | | | 4.875 | | | | 06/01/25 | | | | 55 | | | | 55,276 | |
Sr. Unsec’d. Notes | | | 5.500 | | | | 02/15/49 | | | | 17 | | | | 16,186 | |
ONEOK Partners LP, | | | | | | | | | | | | | | | | |
Gtd. Notes | | | 6.125 | | | | 02/01/41 | | | | 25 | | | | 24,153 | |
ONEOK, Inc., | | | | | | | | | | | | | | | | |
Gtd. Notes | | | 3.100 | | | | 03/15/30 | | | | 82 | | | | 70,813 | |
See Notes to Financial Statements.
PGIM Fixed Income ETFs 123
PGIM Active Aggregate Bond ETF
Schedule of Investments (continued)
as of August 31, 2022
| | | | | | | | | | | | | | | | |
| | | | | | | | | Principal | | | | |
| | | Interest | | | Maturity | | | Amount | | | | |
| Description | | Rate | | | Date | | | (000)# | | | Value | |
| | | | |
CORPORATE BONDS (Continued) | | | | | | | | | | | | | | | | |
| | | | |
Pipelines (cont’d.) | | | | | | | | | | | | | | | | |
| | | | |
ONEOK, Inc., (cont’d.) | | | | | | | | | | | | | | | | |
Gtd. Notes | | | 3.400% | | | | 09/01/29 | | | | 15 | | | $ | 13,277 | |
Gtd. Notes | | | 4.950 | | | | 07/13/47 | | | | 21 | | | | 18,107 | |
Plains All American Pipeline LP/PAA Finance Corp., | | | | | | | | | | | | | | | | |
Sr. Unsec’d. Notes | | | 4.500 | | | | 12/15/26 | | | | 17 | | | | 16,569 | |
Targa Resources Corp., | | | | | | | | | | | | | | | | |
Gtd. Notes | | | 4.200 | | | | 02/01/33 | | | | 10 | | | | 8,990 | |
Transcontinental Gas Pipe Line Co. LLC, | | | | | | | | | | | | | | | | |
Sr. Unsec’d. Notes | | | 3.250 | | | | 05/15/30 | | | | 66 | | | | 58,936 | |
Sr. Unsec’d. Notes | | | 3.950 | | | | 05/15/50 | | | | 31 | | | | 25,736 | |
| | | | | | | | | | | | | | | | |
| | | | |
| | | | | | | | | | | | | | | 780,876 | |
| | | | |
Real Estate Investment Trusts (REITs) 1.6% | | | | | | | | | | | | | | | | |
| | | | |
Brixmor Operating Partnership LP, | | | | | | | | | | | | | | | | |
Sr. Unsec’d. Notes | | | 3.650 | | | | 06/15/24 | | | | 130 | | | | 126,996 | |
CubeSmart LP, | | | | | | | | | | | | | | | | |
Gtd. Notes | | | 2.250 | | | | 12/15/28 | | | | 15 | | | | 12,680 | |
GLP Capital LP/GLP Financing II, Inc., | | | | | | | | | | | | | | | | |
Gtd. Notes | | | 3.250 | | | | 01/15/32 | | | | 5 | | | | 4,047 | |
Host Hotels & Resorts LP, | | | | | | | | | | | | | | | | |
Sr. Unsec’d. Notes, Series J | | | 2.900 | | | | 12/15/31 | | | | 5 | | | | 3,894 | |
Kimco Realty Corp., | | | | | | | | | | | | | | | | |
Sr. Unsec’d. Notes | | | 1.900 | | | | 03/01/28 | | | | 55 | | | | 47,200 | |
Sr. Unsec’d. Notes | | | 3.200 | | | | 04/01/32 | | | | 25 | | | | 21,643 | |
Realty Income Corp., | | | | | | | | | | | | | | | | |
Sr. Unsec’d. Notes | | | 2.200 | | | | 06/15/28 | | | | 80 | | | | 70,227 | |
Sr. Unsec’d. Notes | | | 3.100 | | | | 12/15/29 | | | | 29 | | | | 26,368 | |
Sr. Unsec’d. Notes | | | 3.250 | | | | 01/15/31 | | | | 25 | | | | 22,445 | |
Simon Property Group LP, | | | | | | | | | | | | | | | | |
Sr. Unsec’d. Notes | | | 2.450 | | | | 09/13/29 | | | | 70 | | | | 60,361 | |
Sr. Unsec’d. Notes | | | 3.750 | | | | 02/01/24 | | | | 105 | | | | 104,546 | |
Spirit Realty LP, | | | | | | | | | | | | | | | | |
Gtd. Notes | | | 2.700 | | | | 02/15/32 | | | | 33 | | | | 25,584 | |
Ventas Realty LP, | | | | | | | | | | | | | | | | |
Gtd. Notes | | | 4.125 | | | | 01/15/26 | | | | 127 | | | | 124,519 | |
VICI Properties LP, | | | | | | | | | | | | | | | | |
Sr. Unsec’d. Notes | | | 4.750 | | | | 02/15/28 | | | | 20 | | | | 19,219 | |
| | | | | | | | | | | | | | | | |
| | | | |
| | | | | | | | | | | | | | | 669,729 | |
See Notes to Financial Statements.
124
PGIM Active Aggregate Bond ETF
Schedule of Investments (continued)
as of August 31, 2022
| | | | | | | | | | | | | | | | |
| | | | | | | | | Principal | | | | |
| | | Interest | | | Maturity | | | Amount | | | | |
| Description | | Rate | | | Date | | | (000)# | | | Value | |
| | | | |
CORPORATE BONDS (Continued) | | | | | | | | | | | | | | | | |
| | | | |
Retail 0.3% | | | | | | | | | | | | | | | | |
| | | | |
Alimentation Couche-Tard, Inc. (Canada), | | | | | | | | | | | | | | | | |
Gtd. Notes, 144A | | | 4.500% | | | | 07/26/47 | | | | 27 | | | $ | 22,340 | |
AutoZone, Inc., | | | | | | | | | | | | | | | | |
Sr. Unsec’d. Notes | | | 3.750 | | | | 04/18/29 | | | | 38 | | | | 35,816 | |
Home Depot, Inc. (The), | | | | | | | | | | | | | | | | |
Sr. Unsec’d. Notes | | | 5.875 | | | | 12/16/36 | | | | 8 | | | | 8,989 | |
McDonald’s Corp., | | | | | | | | | | | | | | | | |
Sr. Unsec’d. Notes, MTN | | | 4.700 | | | | 12/09/35 | | | | 18 | | | | 17,863 | |
O’Reilly Automotive, Inc., | | | | | | | | | | | | | | | | |
Sr. Unsec’d. Notes | | | 4.700 | | | | 06/15/32 | | | | 60 | | | | 59,411 | |
| | | | | | | | | | | | | | | | |
| | | | |
| | | | | | | | | | | | | | | 144,419 | |
| | | | |
Semiconductors 0.8% | | | | | | | | | | | | | | | | |
| | | | |
Advanced Micro Devices, Inc., | | | | | | | | | | | | | | | | |
Sr. Unsec’d. Notes | | | 3.924 | | | | 06/01/32 | | | | 160 | | | | 154,726 | |
Broadcom Corp./Broadcom Cayman Finance Ltd., | | | | | | | | | | | | | | | | |
Gtd. Notes | | | 3.500 | | | | 01/15/28 | | | | 45 | | | | 41,761 | |
Broadcom, Inc., | | | | | | | | | | | | | | | | |
Sr. Unsec’d. Notes, 144A | | | 3.137 | | | | 11/15/35 | | | | 42 | | | | 31,841 | |
Sr. Unsec’d. Notes, 144A | | | 3.419 | | | | 04/15/33 | | | | 120 | | | | 98,970 | |
Sr. Unsec’d. Notes, 144A | | | 4.000 | | | | 04/15/29 | | | | 25 | | | | 23,176 | |
| | | | | | | | | | | | | | | | |
| | | | |
| | | | | | | | | | | | | | | 350,474 | |
| | | | |
Software 0.2% | | | | | | | | | | | | | | | | |
| | | | |
Microsoft Corp., | | | | | | | | | | | | | | | | |
Sr. Unsec’d. Notes | | | 2.525 | | | | 06/01/50 | | | | 63 | | | | 45,890 | |
Oracle Corp., | | | | | | | | | | | | | | | | |
Sr. Unsec’d. Notes | | | 3.850 | | | | 04/01/60 | | | | 8 | | | | 5,311 | |
Workday, Inc., | | | | | | | | | | | | | | | | |
Sr. Unsec’d. Notes | | | 3.500 | | | | 04/01/27 | | | | 10 | | | | 9,549 | |
Sr. Unsec’d. Notes | | | 3.700 | | | | 04/01/29 | | | | 20 | | | | 18,759 | |
| | | | | | | | | | | | | | | | |
| | | | |
| | | | | | | | | | | | | | | 79,509 | |
| | | | |
Telecommunications 0.9% | | | | | | | | | | | | | | | | |
| | | | |
AT&T, Inc., | | | | | | | | | | | | | | | | |
Sr. Unsec’d. Notes | | | 3.500 | | | | 09/15/53 | | | | 140 | | | | 103,985 | |
Sr. Unsec’d. Notes | | | 4.300 | | | | 02/15/30 | | | | 70 | | | | 67,319 | |
See Notes to Financial Statements.
PGIM Fixed Income ETFs 125
PGIM Active Aggregate Bond ETF
Schedule of Investments (continued)
as of August 31, 2022
| | | | | | | | | | | | | | | | |
| | | | | | | | | Principal | | | | |
| | | Interest | | | Maturity | | | Amount | | | | |
| Description | | Rate | | | Date | | | (000)# | | | Value | |
| | | | |
CORPORATE BONDS (Continued) | | | | | | | | | | | | | | | | |
| | | | |
Telecommunications (cont’d.) | | | | | | | | | | | | | | | | |
| | | | |
AT&T, Inc., (cont’d.) | | | | | | | | | | | | | | | | |
Sr. Unsec’d. Notes | | | 4.500% | | | | 05/15/35 | | | | 65 | | | $ | 61,023 | |
T-Mobile USA, Inc., | | | | | | | | | | | | | | | | |
Sr. Unsec’d. Notes | | | 2.050 | | | | 02/15/28 | | | | 61 | | | | 52,988 | |
Sr. Unsec’d. Notes | | | 3.000 | | | | 02/15/41 | | | | 40 | | | | 29,002 | |
Sr. Unsec’d. Notes | | | 3.875 | | | | 04/15/30 | | | | 30 | | | | 27,730 | |
Verizon Communications, Inc., | | | | | | | | | | | | | | | | |
Sr. Unsec’d. Notes | | | 4.016 | | | | 12/03/29 | | | | 37 | | | | 35,495 | |
| | | | | | | | | | | | | | | | |
| | | | |
| | | | | | | | | | | | | | | 377,542 | |
| | | | |
Transportation 0.1% | | | | | | | | | | | | | | | | |
| | | | |
CSX Corp., | | | | | | | | | | | | | | | | |
Sr. Unsec’d. Notes | | | 6.150 | | | | 05/01/37 | | | | 33 | | | | 36,964 | |
| | | | | | | | | | | | | | | | |
| | | | |
TOTAL CORPORATE BONDS
(cost $14,736,731) | | | | | | | | | | | | | | | 12,675,201 | |
| | | | | | | | | | | | | | | | |
| | | | |
MUNICIPAL BONDS 0.3% | | | | | | | | | | | | | | | | |
| | | | |
Michigan 0.1% | | | | | | | | | | | | | | | | |
| | | | |
University of Michigan, | | | | | | | | | | | | | | | | |
Taxable, Revenue Bonds, Series B | | | 3.504 | | | | 04/01/52 | | | | 35 | | | | 29,883 | |
| | | | |
New Jersey 0.0% | | | | | | | | | | | | | | | | |
| | | | |
New Jersey Turnpike Authority, | | | | | | | | | | | | | | | | |
Taxable, Revenue Bonds, BABs, Series F | | | 7.414 | | | | 01/01/40 | | | | 10 | | | | 13,001 | |
| | | | |
New York 0.1% | | | | | | | | | | | | | | | | |
| | | | |
New York State Dormitory Authority, | | | | | | | | | | | | | | | | |
Taxable, Revenue Bonds, Series C | | | 2.202 | | | | 03/15/34 | | | | 15 | | | | 12,100 | |
| | | | |
Port Authority of New York & New Jersey, | | | | | | | | | | | | | | | | |
Consolidated, Taxable, Revenue Bonds, Series 174 | | | 4.458 | | | | 10/01/62 | | | | 10 | | | | 9,676 | |
| | | | | | | | | | | | | | | | |
| | | | |
| | | | | | | | | | | | | | | 21,776 | |
| | | | |
Ohio 0.0% | | | | | | | | | | | | | | | | |
| | | | |
Ohio State University (The), | | | | | | | | | | | | | | | | |
Taxable, Revenue Bonds, Series A | | | 4.800 | | | | 06/01/2111 | | | | 10 | | | | 9,422 | |
See Notes to Financial Statements.
126
PGIM Active Aggregate Bond ETF
Schedule of Investments (continued)
as of August 31, 2022
| | | | | | | | | | | | | | | | |
| | | | | | | | | Principal | | | | |
| | | Interest | | | Maturity | | | Amount | | | | |
| Description | | Rate | | | Date | | | (000)# | | | Value | |
| | | | |
MUNICIPAL BONDS (Continued) | | | | | | | | | | | | | | | | |
| | | | |
Pennsylvania 0.0% | | | | | | | | | | | | | | | | |
Pennsylvania Turnpike Commission, | | | | | | | | | | | | | | | | |
Revenue Bonds, BABs, Series B | | | 5.511% | | | | 12/01/45 | | | | 10 | | | $ | 10,950 | |
| | | | |
Texas 0.1% | | | | | | | | | | | | | | | | |
Dallas Fort Worth International Airport, | | | | | | | | | | | | | | | | |
Taxable, Revenue Bonds, Series A | | | 4.087 | | | | 11/01/51 | | | | 20 | | | | 18,069 | |
| | | | |
Virginia 0.0% | | | | | | | | | | | | | | | | |
University of Virginia, | | | | | | | | | | | | | | | | |
Taxable, Revenue Bonds, Series B | | | 2.584 | | | | 11/01/51 | | | | 25 | | | | 17,150 | |
| | | | | | | | | | | | | | | | |
| | | | |
TOTAL MUNICIPAL BONDS
(cost $151,044) | | | | | | | | | | | | | | | 120,251 | |
| | | | | | | | | | | | | | | | |
| | | | |
RESIDENTIAL MORTGAGE-BACKED SECURITIES 0.6% | | | | | | | | | | | | | | | | |
Bellemeade Re Ltd., | | | | | | | | | | | | | | | | |
Series 2021-02A, Class M1A, 144A, 30 Day Average | | | | | | | | | | | | | | | | |
SOFR + 1.200% (Cap N/A, Floor 1.200%) | | | 3.383(c) | | | | 06/25/31 | | | | 122 | | | | 120,524 | |
FHLMC Structured Agency Credit Risk REMIC Trust, | | | | | | | | | | | | | | | | |
Series 2021-DNA03, Class M2, 144A, 30 Day Average | | | | | | | | | | | | | | | | |
SOFR + 2.100% (Cap N/A, Floor 0.000%) | | | 4.283(c) | | | | 10/25/33 | | | | 50 | | | | 48,493 | |
Series 2022-DNA03, Class M1B, 144A, 30 Day | | | | | | | | | | | | | | | | |
Average SOFR + 2.900% (Cap N/A, Floor 0.000%) | | | 5.083(c) | | | | 04/25/42 | | | | 30 | | | | 29,823 | |
MFA Trust, | | | | | | | | | | | | | | | | |
Series 2021-RPL01, Class A1, 144A | | | 1.131(cc) | | | | 07/25/60 | | | | 69 | | | | 63,030 | |
| | | | | | | | | | | | | | | | |
| | | | |
TOTAL RESIDENTIAL MORTGAGE-BACKED SECURITIES
(cost $271,430) | | | | | | | | | | | | | | | 261,870 | |
| | | | | | | | | | | | | | | | |
| | | | |
SOVEREIGN BONDS 0.9% | | | | | | | | | | | | | | | | |
Indonesia Government International Bond (Indonesia), | | | | | | | | | | | | | | | | |
Sr. Unsec’d. Notes | | | 3.500 | | | | 01/11/28 | | | | 200 | | | | 194,350 | |
Mexico Government International Bond (Mexico), | | | | | | | | | | | | | | | | |
Sr. Unsec’d. Notes, MTN | | | 6.050 | | | | 01/11/40 | | | | 50 | | | | 50,056 | |
Peruvian Government International Bond (Peru), | | | | | | | | | | | | | | | | |
Sr. Unsec’d. Notes | | | 4.125 | | | | 08/25/27 | | | | 50 | | | | 48,963 | |
Romanian Government International Bond (Romania), | | | | | | | | | | | | | | | | |
Unsec’d. Notes, 144A, MTN | | | 6.000 | | | | 05/25/34 | | | | 86 | | | | 82,022 | |
See Notes to Financial Statements.
PGIM Fixed Income ETFs 127
PGIM Active Aggregate Bond ETF
Schedule of Investments (continued)
as of August 31, 2022
| | | | | | | | | | | | | | | | |
| | | | | | | | | Principal | | | | |
| | | Interest | | | Maturity | | | Amount | | | | |
| Description | | Rate | | | Date | | | (000)# | | | Value | |
| | | | |
SOVEREIGN BONDS (Continued) | | | | | | | | | | | | | | | | |
Uruguay Government International Bond (Uruguay), | | | | | | | | | | | | | | | | |
Sr. Unsec’d. Notes | | | 5.100% | | | | 06/18/50 | | | | 15 | | | $ | 15,228 | |
| | | | | | | | | | | | | | | | |
| | | | |
TOTAL SOVEREIGN BONDS
(cost $435,497) | | | | | | | | | | | | | | | 390,619 | |
| | | | | | | | | | | | | | | | |
| | | | |
U.S. GOVERNMENT AGENCY OBLIGATIONS 24.6% | | | | | | | | | | | | | | | | |
Federal Home Loan Mortgage Corp. | | | 1.500 | | | | 04/01/51 | | | | 447 | | | | 366,303 | |
Federal Home Loan Mortgage Corp. | | | 2.000 | | | | 02/01/51 | | | | 939 | | | | 809,031 | |
Federal Home Loan Mortgage Corp. | | | 2.000 | | | | 07/01/51 | | | | 503 | | | | 433,719 | |
Federal Home Loan Mortgage Corp. | | | 2.000 | | | | 05/01/52 | | | | 494 | | | | 425,999 | |
Federal Home Loan Mortgage Corp. | | | 2.500 | | | | 04/01/51 | | | | 731 | | | | 654,329 | |
Federal Home Loan Mortgage Corp. | | | 3.000 | | | | 04/01/52 | | | | 246 | | | | 227,665 | |
Federal National Mortgage Assoc. | | | 1.500 | | | | 12/01/50 | | | | 357 | | | | 292,680 | |
Federal National Mortgage Assoc. | | | 2.000 | | | | TBA | | | | 250 | | | | 230,449 | |
Federal National Mortgage Assoc. | | | 2.000 | | | | 05/01/36 | | | | 410 | | | | 378,732 | |
Federal National Mortgage Assoc. | | | 2.000 | | | | 05/01/51 | | | | 238 | | | | 205,220 | |
Federal National Mortgage Assoc. | | | 2.500 | | | | TBA | | | | 250 | | | | 223,203 | |
Federal National Mortgage Assoc. | | | 2.500 | | | | TBA | | | | 250 | | | | 236,484 | |
Federal National Mortgage Assoc.(k) | | | 2.500 | | | | 04/01/51 | | | | 1,400 | | | | 1,253,475 | |
Federal National Mortgage Assoc. | | | 2.500 | | | | 05/01/52 | | | | 491 | | | | 440,819 | |
Federal National Mortgage Assoc. | | | 3.000 | | | | 02/01/52 | | | | 482 | | | | 446,665 | |
Federal National Mortgage Assoc. | | | 3.000 | | | | 03/01/52 | | | | 476 | | | | 444,691 | |
Federal National Mortgage Assoc. | | | 3.000 | | | | 05/01/52 | | | | 487 | | | | 456,398 | |
Federal National Mortgage Assoc. | | | 3.500 | | | | TBA | | | | 250 | | | | 238,184 | |
Federal National Mortgage Assoc. | | | 3.500 | | | | 06/01/47 | | | | 373 | | | | 360,272 | |
Federal National Mortgage Assoc. | | | 4.000 | | | | 03/01/49 | | | | 420 | | | | 416,389 | |
Federal National Mortgage Assoc. | | | 4.000 | | | | 05/01/52 | | | | 252 | | | | 246,249 | |
Federal National Mortgage Assoc. | | | 4.500 | | | | TBA | | | | 500 | | | | 496,953 | |
Federal National Mortgage Assoc. | | | 4.500 | | | | 05/01/52 | | | | 327 | | | | 324,994 | |
Government National Mortgage Assoc. | | | 2.000 | | | | 03/20/51 | | | | 442 | | | | 392,662 | |
Government National Mortgage Assoc. | | | 3.000 | | | | 01/20/51 | | | | 641 | | | | 603,819 | |
Tennessee Valley Authority, Sr. Unsec’d. Notes | | | 1.500 | | | | 09/15/31 | | | | 15 | | | | 12,444 | |
| | | | | | | | | | | | | | | | |
| | | | |
TOTAL U.S. GOVERNMENT AGENCY OBLIGATIONS
(cost $11,417,366) | | | | | | | | | | | | | | | 10,617,828 | |
| | | | | | | | | | | | | | | | |
| | | | |
U.S. TREASURY OBLIGATIONS 21.2% | | | | | | | | | | | | | | | | |
U.S. Treasury Bonds | | | 1.250 | | | | 05/15/50 | | | | 55 | | | | 34,014 | |
U.S. Treasury Bonds | | | 1.750 | | | | 08/15/41 | | | | 21 | | | | 15,609 | |
U.S. Treasury Bonds | | | 1.875 | | | | 02/15/41 | | | | 915 | | | | 701,262 | |
U.S. Treasury Bonds | | | 2.000 | | | | 11/15/41 | | | | 895 | | | | 695,303 | |
U.S. Treasury Bonds | | | 2.250 | | | | 05/15/41 | | | | 105 | | | | 85,641 | |
See Notes to Financial Statements.
128
PGIM Active Aggregate Bond ETF
Schedule of Investments (continued)
as of August 31, 2022
| | | | | | | | | | | | | | | | |
| | | | | | | | | Principal | | | | |
| | | Interest | | | Maturity | | | Amount | | | | |
| Description | | Rate | | | Date | | | (000)# | | | Value | |
| | | | |
U.S. TREASURY OBLIGATIONS(Continued) | | | | | | | | | | | | | | | | |
U.S. Treasury Bonds | | | 2.375% | | | | 02/15/42 | | | | 1,170 | | | $ | 970,369 | |
U.S. Treasury Bonds | | | 2.500 | | | | 02/15/46 | | | | 395 | | | | 325,628 | |
U.S. Treasury Bonds | | | 2.500 | | | | 05/15/46 | | | | 690 | | | | 568,495 | |
U.S. Treasury Bonds | | | 2.875 | | | | 05/15/52 | | | | 120 | | | | 110,662 | |
U.S. Treasury Bonds | | | 3.000 | | | | 05/15/47 | | | | 340 | | | | 308,922 | |
U.S. Treasury Bonds | | | 3.000 | | | | 02/15/48 | | | | 30 | | | | 27,487 | |
U.S. Treasury Bonds | | | 3.250 | | | | 05/15/42 | | | | 45 | | | | 43,059 | |
U.S. Treasury Notes | | | 0.250 | | | | 05/15/24 | | | | 215 | | | | 203,561 | |
U.S. Treasury Notes | | | 0.375 | | | | 01/31/26 | | | | 50 | | | | 45,012 | |
U.S. Treasury Notes(k) | | | 0.750 | | | | 03/31/26 | | | | 460 | | | | 417,989 | |
U.S. Treasury Notes | | | 1.250 | | | | 11/30/26 | | | | 1,115 | | | | 1,020,225 | |
U.S. Treasury Notes | | | 1.250 | | | | 12/31/26 | | | | 2,360 | | | | 2,156,450 | |
U.S. Treasury Notes | | | 1.250 | | | | 09/30/28 | | | | 5 | | | | 4,423 | |
U.S. Treasury Notes | | | 2.250 | | | | 11/15/25 | | | | 40 | | | | 38,494 | |
U.S. Treasury Notes | | | 2.750 | | | | 08/15/32 | | | | 260 | | | | 250,900 | |
U.S. Treasury Notes | | | 3.125 | | | | 08/31/27 | | | | 100 | | | | 99,117 | |
U.S. Treasury Strips Coupon | | | 2.221(s) | | | | 02/15/42 | | | | 1,395 | | | | 675,867 | |
U.S. Treasury Strips Coupon | | | 2.527(s) | | | | 08/15/44 | | | | 305 | | | | 133,545 | |
U.S. Treasury Strips Coupon | | | 2.542(s) | | | | 02/15/46 | | | | 450 | | | | 187,330 | |
U.S. Treasury Strips Coupon | | | 2.561(s) | | | | 11/15/45 | | | | 80 | | | | 33,628 | |
| | | | | | | | | | | | | | | | |
| | | | |
TOTAL U.S. TREASURY OBLIGATIONS
(cost $10,608,735) | | | | | | | | | | | | | | | 9,152,992 | |
| | | | | | | | | | | | | | | | |
| | | | |
TOTAL LONG-TERM INVESTMENTS
(cost $47,881,245) | | | | | | | | | | | | | | | 42,772,814 | |
| | | | | | | | | | | | | | | | |
| | | | |
| | | | | | | | | Shares | | | | |
| | | | |
SHORT-TERM INVESTMENT 3.9% | | | | | | | | | | | | | | | | |
| | | | |
UNAFFILIATED FUND | | | | | | | | | | | | | | | | |
Dreyfus Government Cash Management (Institutional Shares)
(cost $1,701,049) | | | | | | | | | | | 1,701,049 | | | | 1,701,049 | |
| | | | | | | | | | | | | | | | |
| | | | |
TOTAL INVESTMENTS 103.0%
(cost $49,582,294) | | | | | | | | | | | | | | | 44,473,863 | |
Liabilities in excess of other assets(z) (3.0)% | | | | | | | | | | | | | | | (1,288,265 | ) |
| | | | | | | | | | | | | | | | |
| | | | |
NET ASSETS 100.0% | | | | | | | | | | | | | | $ | 43,185,598 | |
| | | | | | | | | | | | | | | | |
See the Glossary for a list of the abbreviation(s) used in the annual report.
| # | Principal or notional amount is shown in U.S. dollars unless otherwise stated. |
See Notes to Financial Statements.
PGIM Fixed Income ETFs 129
PGIM Active Aggregate Bond ETF
Schedule of Investments (continued)
as of August 31, 2022
| (c) | Variable rate instrument. The interest rate shown reflects the rate in effect at August 31, 2022. |
| (cc) | Variable rate instrument. The rate shown is based on the latest available information as of August 31, 2022. Certain variable rate securities are not based on a published reference rate and spread but are determined by the issuer or agent and are based on current market conditions. These securities do not indicate a reference rate and spread in their description. |
| (ff) | Variable rate security. Security may be issued at a fixed coupon rate, which converts to a variable rate at a specified date. Rate shown is the rate in effect as of period end. |
| (k) | Represents security, or a portion thereof, segregated as collateral for centrally cleared/exchange-traded derivatives. |
| (s) | Represents zero coupon bond or principal only security. Rate represents yield to maturity at purchase date. |
| (z) | Includes net unrealized appreciation/(depreciation) and/or market value of the below holdings which are excluded from the Schedule of Investments: |
Futures contracts outstanding at August 31, 2022:
| | | | | | | | | | | | | | | | | | | | | |
Number
of
Contracts | | Type | | Expiration
Date | | Current
Notional
Amount | | Value /
Unrealized
Appreciation
(Depreciation) |
Long Positions: | | | | | | | | | | | | | | | | | | | | | |
18 | | 2 Year U.S. Treasury Notes | | | | Dec. 2022 | | | | $ | 3,749,907 | | | | | | $ | (8,627 | ) | | |
4 | | 5 Year U.S. Treasury Notes | | | | Dec. 2022 | | | | | 443,281 | | | | | | | (1,562 | ) | | |
37 | | 10 Year U.S. Treasury Notes | | | | Dec. 2022 | | | | | 4,325,531 | | | | | | | (20,831 | ) | | |
6 | | 30 Year U.S. Ultra Treasury Bonds | | | | Dec. 2022 | | | | | 897,000 | | | | | | | (860 | ) | | |
| | | | | | | | | | | | | | | | | | | | | |
| | | | | | | | | | | | | | | | | | (31,880 | ) | | |
| | | | | | | | | | | | | | | | | | | | | |
Short Positions: | | | | | | | | | | | | | | | | | | | |
20 | | 10 Year U.S. Ultra Treasury Notes | | | | Dec. 2022 | | | | | 2,503,750 | | | | | | | 17,890 | | | |
23 | | 20 Year U.S. Treasury Bonds | | | | Dec. 2022 | | | | | 3,124,406 | | | | | | | 17,296 | | | |
| | | | | | | | | | | | | | | | | | | | | |
| | | | | | | | | | | | | | | | | | 35,186 | | | |
| | | | | | | | | | | | | | | | | | | | | |
| | | | | | | | | | | | | | | | | $ | 3,306 | | | |
| | | | | | | | | | | | | | | | | | | | | |
Credit default swap agreements outstanding at August 31, 2022:
| | | | | | | | | | | | | | | | | | | | | | | | | | | | | | | | | | |
Reference Entity/ Obligation | | Termination
Date | | | Fixed
Rate | | | Notional
Amount
(000)#(3) | | | Value at Trade Date | | Value at
August 31,
2022 | | | Unrealized Appreciation (Depreciation) | |
| | | | | | | | | | | | | | | | | | | | | | | | | | | | |
Centrally Cleared Credit Default Swap Agreement on credit indices - Buy Protection(1): | |
CDX.NA.IG.38.V1 | | | 06/20/27 | | | | 1.000%(Q) | | | | 1,580 | | | | | $ | (13,810) | | | | | $ | (8,440 | ) | | | | $ | 5,370 | | | | | |
| | | | | | | | | | | | | | | | | | | | | | | | | | | | | | | | | | |
The Fund entered into credit default swaps (“CDS”) to provide a measure of protection against defaults or to take an active long or short position with respect to the likelihood of a particular issuer’s default or the reference entity’s credit soundness. CDS contracts generally trade based on a spread which represents the cost a protection buyer has to pay the protection seller. The protection buyer is said to be short the credit as the value of the contract rises the more the credit deteriorates. The value of the CDS contract increases for the protection buyer if the spread increases.
| (1) | If the Fund is a buyer of protection, it pays the fixed rate. When a credit event occurs, as defined under the terms of that |
See Notes to Financial Statements.
130
PGIM Active Aggregate Bond ETF
Schedule of Investments (continued)
as of August 31, 2022
| | particular swap agreement, the Fund will either (i) receive from the seller of protection an amount equal to the notional amount of the swap and make delivery of the referenced obligation or underlying securities comprising the referenced index or (ii) receive a net settlement amount in the form of cash or securities equal to the notional amount of the swap less the recovery value of the referenced obligation or underlying securities comprising the referenced index. |
| (2) | If the Fund is a seller of protection, it receives the fixed rate. When a credit event occurs, as defined under the terms of that particular swap agreement, the Fund will either (i) pay to the buyer of protection an amount equal to the notional amount of the swap and take delivery of the referenced obligation or underlying securities comprising the referenced index or (ii) pay a net settlement amount in the form of cash or securities equal to the notional amount of the swap less the recovery value of the referenced obligation or underlying securities comprising the referenced index. |
| (3) | Notional amount represents the maximum potential amount the Fund could be required to pay as a seller of credit protection or receive as a buyer of credit protection if a credit event occurs as defined under the terms of that particular swap agreement. |
| (4) | Implied credit spreads, represented in absolute terms, utilized in determining the fair value of credit default swap agreements where the Fund is the seller of protection as of the reporting date serve as an indicator of the current status of the payment/ performance risk and represent the likelihood of risk of default for the credit derivative. The implied credit spread of a particular referenced entity reflects the cost of buying/selling protection and may include up-front payments required to be made to enter into the agreement. Wider credit spreads represent a deterioration of the referenced entity’s credit soundness and a greater likelihood of risk of default or other credit event occurring as defined under the terms of the agreement. |
Summary of Collateral for Centrally Cleared/Exchange-traded Derivatives:
Cash and securities segregated as collateral, including pending settlement for closed positions, to cover requirements for centrally cleared/exchange-traded derivatives are listed by broker as follows:
| | | | | | | | | | |
Broker | | Cash and/or Foreign Currency | | Securities Market Value |
| | |
Citigroup Global Markets, Inc. | | | $ | — | | | | $ | 320,561 | |
| | |
J.P. Morgan Securities LLC | | | | — | | | | | 190,821 | |
| | | | | | | | | | |
| | |
Total | | | $ | — | | | | $ | 511,382 | |
| | | | | | | | | | |
Fair Value Measurements:
Various inputs are used in determining the value of the Fund’s investments. These inputs are summarized in the three broad levels listed below.
Level 1—unadjusted quoted prices generally in active markets for identical securities.
Level 2—quoted prices for similar securities, interest rates and yield curves, prepayment speeds, foreign currency exchange rates and other observable inputs.
Level 3—unobservable inputs for securities valued in accordance with Board approved fair valuation procedures.
See Notes to Financial Statements.
PGIM Fixed Income ETFs 131
PGIM Active Aggregate Bond ETF
Schedule of Investments (continued)
as of August 31, 2022
The following is a summary of the inputs used as of August 31, 2022 in valuing such portfolio securities:
| | | | | | | | | | | | |
| | | Level 1 | | | Level 2 | | | Level 3 | |
Investments in Securities | | | | | | | | | | | | |
Assets | | | | | | | | | | | | |
Long-Term Investments | | | | | | | | | | | | |
Asset-Backed Securities | | | | | | | | | | | | |
Automobiles | | $ | — | | | $ | 279,784 | | | | $— | |
Collateralized Loan Obligations | | | — | | | | 4,357,730 | | | | — | |
Consumer Loans | | | — | | | | 179,391 | | | | — | |
Commercial Mortgage-Backed Securities | | | — | | | | 4,737,148 | | | | — | |
Corporate Bonds | | | — | | | | 12,675,201 | | | | — | |
Municipal Bonds | | | — | | | | 120,251 | | | | — | |
Residential Mortgage-Backed Securities | | | — | | | | 261,870 | | | | — | |
Sovereign Bonds | | | — | | | | 390,619 | | | | — | |
U.S. Government Agency Obligations | | | — | | | | 10,617,828 | | | | — | |
U.S. Treasury Obligations | | | — | | | | 9,152,992 | | | | — | |
Short-Term Investment | | | | | | | | | | | | |
Unaffiliated Fund | | | 1,701,049 | | | | — | | | | — | |
| | | | | | | | | | | | |
Total | | $ | 1,701,049 | | | $ | 42,772,814 | | | | $— | |
| | | | | | | | | | | | |
Other Financial Instruments* | | | | | | | | | | | | |
Assets | | | | | | | | | | | | |
Futures Contracts | | $ | 35,186 | | | $ | — | | | | $— | |
Centrally Cleared Credit Default Swap Agreement | | | — | | | | 5,370 | | | | — | |
| | | | | | | | | | | | |
Total | | $ | 35,186 | | | $ | 5,370 | | | | $— | |
| | | | | | | | | | | | |
Liabilities | | | | | | | | | | | | |
Futures Contracts | | $ | (31,880 | ) | | $ | — | | | | $— | |
| | | | | | | | | | | | |
| * | Other financial instruments are derivative instruments not reflected in the Schedule of Investments, such as futures, forwards and centrally cleared swap contracts, which are recorded at the unrealized appreciation (depreciation) on the instrument, and OTC swap contracts which are recorded at fair value. |
Industry Classification:
The industry classification of investments and liabilities in excess of other assets shown as a percentage of net assets as of August 31, 2022 were as follows:
| | | | |
U.S. Government Agency Obligations | | | 24.6 | % |
U.S. Treasury Obligations | | | 21.2 | |
Commercial Mortgage-Backed Securities | | | 11.0 | |
Collateralized Loan Obligations | | | 10.1 | |
Banks | | | 7.6 | |
Unaffiliated Fund | | | 3.9 | |
Electric | | | 2.2 | |
| | | | |
Pipelines | | | 1.8 | % |
Real Estate Investment Trusts (REITs) | | | 1.6 | |
Pharmaceuticals | | | 1.5 | |
Media | | | 1.1 | |
Oil & Gas | | | 1.1 | |
Commercial Services | | | 1.1 | |
Mining | | | 1.0 | |
See Notes to Financial Statements.
132
PGIM Active Aggregate Bond ETF
Schedule of Investments (continued)
as of August 31, 2022
Industry Classification (continued):
| | | | |
Healthcare-Services | | | 1.0 | % |
Sovereign Bonds | | | 0.9 | |
Telecommunications | | | 0.9 | |
Auto Manufacturers | | | 0.8 | |
Semiconductors | | | 0.8 | |
Aerospace & Defense | | | 0.8 | |
Automobiles | | | 0.7 | |
Residential Mortgage-Backed Securities | | | 0.6 | |
Beverages | | | 0.6 | |
Insurance | | | 0.5 | |
Home Builders | | | 0.5 | |
Engineering & Construction | | | 0.4 | |
Agriculture | | | 0.4 | |
Consumer Loans | | | 0.4 | |
Building Materials | | | 0.4 | |
Foods | | | 0.4 | |
Retail | | | 0.3 | |
Chemicals | | | 0.3 | |
Municipal Bonds | | | 0.3 | |
Iron/Steel | | | 0.3 | |
Miscellaneous Manufacturing | | | 0.2 | |
| | | | |
Multi-National | | | 0.2 | % |
Machinery-Diversified | | | 0.2 | |
Software | | | 0.2 | |
Lodging | | | 0.2 | |
Gas | | | 0.2 | |
Entertainment | | | 0.2 | |
Airlines | | | 0.1 | |
Computers | | | 0.1 | |
Biotechnology | | | 0.1 | |
Diversified Financial Services | | | 0.1 | |
Transportation | | | 0.1 | |
Auto Parts & Equipment | | | 0.0 | * |
Machinery-Construction & Mining | | | 0.0 | * |
| | | | |
| |
| | | 103.0 | |
Liabilities in excess of other assets | | | (3.0 | ) |
| | | | |
| |
| | | 100.0 | % |
| | | | |
Effects of Derivative Instruments on the Financial Statements and Primary Underlying Risk Exposure:
The Fund invested in derivative instruments during the reporting period. The primary types of risk associated with these derivative instruments are credit contracts risk and interest rate contracts risk. See the Notes to Financial Statements for additional detail regarding these derivative instruments and their risks. The effect of such derivative instruments on the Fund’s financial position and financial performance as reflected in the Statement of Assets and Liabilities and Statement of Operations is presented in the summary below.
Fair values of derivative instruments as of August 31, 2022 as presented in the Statement of Assets and Liabilities:
| | | | | | | | | | | | |
| | Asset Derivatives | | | Liability Derivatives | |
| | | | |
Derivatives not accounted for as hedging instruments, carried at fair value | | Statement of
Assets and
Liabilities Location | | Fair
Value | | | Statement of
Assets and
Liabilities Location | | Fair
Value | |
Credit contracts | | Due from/to broker-variation margin swaps | | $ | 5,370* | | | — | | $ | — | |
See Notes to Financial Statements.
PGIM Fixed Income ETFs 133
PGIM Active Aggregate Bond ETF
Schedule of Investments (continued)
as of August 31, 2022
| | | | | | | | | | | | |
| | | Asset Derivatives | | | Liability Derivatives | |
| | | | |
Derivatives not accounted for
as hedging instruments,
carried at fair value | | Statement of
Assets and
Liabilities Location | | Fair
Value | | | Statement of
Assets and
Liabilities Location | | Fair
Value | |
Interest rate contracts | | Due from/to broker-variation margin futures | | $ | 35,186* | | | Due from/to broker-variation margin futures | | $ | 31,880* | |
| | | | | | | | | | | | |
| | | | $ | 40,556 | | | | | $ | 31,880 | |
| | | | | | | | | | | | |
| * | Includes cumulative appreciation (depreciation) as reported in the schedule of open futures and centrally cleared swap contracts. Only unsettled variation margin receivable (payable) is reported within the Statement of Assets and Liabilities. |
The effects of derivative instruments on the Statement of Operations for the year ended August 31, 2022 are as follows:
| | | | | | | | |
Amount of Realized Gain (Loss) on Derivatives Recognized in Income | |
Derivatives not accounted for as hedging instruments, carried at fair value | | Futures | | | Swaps | |
Credit contracts | | $ | — | | | $ | (865 | ) |
Interest rate contracts | | | (138,373 | ) | | | — | |
| | | | | | | | |
| | |
Total | | $ | (138,373 | ) | | $ | (865 | ) |
| | | | | | | | |
| | | | | | | | |
Change in Unrealized Appreciation (Depreciation) on Derivatives Recognized in Income | |
Derivatives not accounted for
as hedging instruments,
carried at fair value | | Futures | | | Swaps | |
Credit contracts | | $ | — | | | $ | 5,370 | |
Interest rate contracts | | | (13,780 | ) | | | — | |
| | | | | | | | |
| | |
Total | | $ | (13,780 | ) | | $ | 5,370 | |
| | | | | | | | |
For the year ended August 31, 2022, the Fund’s average volume of derivative activities is as follows:
| | |
| Derivative Contract Type | | Average Volume of Derivative Activities* |
Futures Contracts - Long Positions (1) | | $8,441,786 |
Futures Contracts - Short Positions (1) | | 5,122,550 |
Credit Default Swap Agreements - Buy Protection (1) | | 316,000 |
| * | Average volume is based on average quarter end balances as noted for the year ended August 31, 2022. |
| (1) | Notional Amount in USD. |
See Notes to Financial Statements.
134
PGIM Active Aggregate Bond ETF
Statement of Assets & Liabilities
as of August 31, 2022
| | | | |
Assets | | | | |
| |
Unaffiliated investments (cost $49,582,294) | | $ | 44,473,863 | |
Cash | | | 64,629 | |
Receivable for investments sold | | | 954,704 | |
Dividends and interest receivable | | | 229,784 | |
Due from broker—variation margin futures | | | 2,750 | |
Due from broker—variation margin swaps | | | 803 | |
Other assets | | | 1,720 | |
| | | | |
| |
Total Assets | | | 45,728,253 | |
| | | | |
| |
Liabilities | | | | |
| |
Payable for investments purchased | | | 2,535,564 | |
Management fee payable | | | 7,087 | |
Due to broker | | | 4 | |
| | | | |
| |
Total Liabilities | | | 2,542,655 | |
| | | | |
| |
Net Assets | | $ | 43,185,598 | |
| | | | |
| |
| | | | |
| | |
Net assets were comprised of: | | | | |
Shares of beneficial interest, at par | | $ | 1,000 | |
Paid-in capital in excess of par | | | 49,494,853 | |
Total distributable earnings (loss) | | | (6,310,255 | ) |
| | | | |
| |
Net assets, August 31, 2022 | | $ | 43,185,598 | |
| | | | |
| |
Net asset value, offering price and redemption price per share. ($43,185,598 ÷ 1,000,000 shares of common stock issued and outstanding) | | $ | 43.19 | |
| | | | |
See Notes to Financial Statements.
PGIM Fixed Income ETFs 135
PGIM Active Aggregate Bond ETF
Statement of Operations
Year Ended August 31, 2022
| | | | |
Net Investment Income (Loss) | | | | |
| |
Income | | | | |
Interest income | | $ | 835,624 | |
Unaffiliated dividend income | | | 8,823 | |
Affiliated dividend income | | | 2,465 | |
| | | | |
| |
Total income | | | 846,912 | |
| | | | |
| |
Expenses | | | | |
Management fee | | | 72,741 | |
Miscellaneous | | | 51 | |
| | | | |
| |
Total expenses | | | 72,792 | |
| | | | |
| |
Net investment income (loss) | | | 774,120 | |
| | | | |
| |
Realized And Unrealized Gain (Loss) On Investments | | | | |
| |
Net realized gain (loss) on: | | | | |
Investment transactions | | | (846,248 | ) |
Futures transactions | | | (138,373 | ) |
Swap agreement transactions | | | (865 | ) |
| | | | |
| |
| | | (985,486 | ) |
| | | | |
Net change in unrealized appreciation (depreciation) on: | | | | |
Investments | | | (5,566,032 | ) |
Futures | | | (13,780 | ) |
Swap agreements | | | 5,370 | |
| | | | |
| |
| | | (5,574,442 | ) |
| | | | |
| |
Net gain (loss) on investment transactions | | | (6,559,928 | ) |
| | | | |
| |
Net Increase (Decrease) In Net Assets Resulting From Operations | | $ | (5,785,808 | ) |
| | | | |
See Notes to Financial Statements.
136
PGIM Active Aggregate Bond ETF
Statements of Changes in Net Assets
| | | | | | | | | | | | |
| | | |
| | | Year Ended
August 31, 2022 | | | April 12, 2021*
through
August 31, 2021 | | | | |
Increase (Decrease) in Net Assets | | | | | | | | | | | | |
| | | |
Operations | | | | | | | | | | | | |
Net investment income (loss) | | $ | 774,120 | | | | $ 137,837 | | | | | |
Net realized gain (loss) on investment transactions | | | (985,486 | ) | | | 106,616 | | | | | |
Net change in unrealized appreciation (depreciation) on investments | | | (5,574,442 | ) | | | 474,687 | | | | | |
| | | | | | | | | | | | |
| | | |
Net increase (decrease) in net assets resulting from operations | | | (5,785,808 | ) | | | 719,140 | | | | | |
| | | | | | | | | | | | |
| | | |
Dividends and Distributions | | | | | | | | | | | | |
Distributions from distributable earnings | | | (1,113,234 | ) | | | (130,353 | ) | | | | |
| | | | | | | | | | | | |
| | | |
Fund share transactions | | | | | | | | | | | | |
Net proceeds from shares sold (475,000 and 625,000 shares, respectively) | | | 23,274,700 | | | | 31,322,713 | | | | | |
Cost of shares purchased (0 and 100,000 shares, respectively) | | | — | | | | (5,101,560 | ) | | | | |
| | | | | | | | | | | | |
Net increase (decrease) in net assets from Fund share transactions | | | 23,274,700 | | | | 26,221,153 | | | | | |
| | | | | | | | | | | | |
| | | |
Total increase (decrease) | | | 16,375,658 | | | | 26,809,940 | | | | | |
| | | |
Net Assets: | | | | | | | | | | | | |
| | | | |
Beginning of period | | | 26,809,940 | | | | — | | | | | |
| | | | | | | | | | | | |
| | | |
End of period | | $ | 43,185,598 | | | | $26,809,940 | | | | | |
| | | | | | | | | | | | |
| * | Commencement of operations. |
See Notes to Financial Statements.
PGIM Fixed Income ETFs 137
PGIM Active Aggregate Bond ETF
Financial Highlights
| | | | | | | | | | | | | | | |
| | | | |
| | | | | | | | | | | | | | | |
| | | | | Year Ended August 31,
2022 | | April 12, 2021(a)
through August 31,
2021 |
| Per Share Operating Performance(b): | | | | | | | | | | | | | | | |
| Net Asset Value, Beginning of Period | | | | | | | | | $51.07 | | | | | $50.00 | |
| Income (loss) from investment operations: | | | | | | | | | | | | | | | |
Net investment income (loss) | | | | | | | | | 0.95 | | | | | 0.25 | |
Net realized and unrealized gain (loss) on investment | | | | | | | | | (7.27) | | | | | 1.05 | |
Total from investment operations | | | | | | | | | (6.32) | | | | | 1.30 | |
Less Dividends and Distributions: | | | | | | | | | | | | | | | |
Dividends from net investment income | | | | | | | | | (1.02) | | | | | (0.23 | ) |
Distributions from net realized gains | | | | | | | | | (0.54) | | | | | - | |
Total dividends and distributions | | | | | | | | | (1.56) | | | | | (0.23 | ) |
Net asset value, end of period | | | | | | | | | $43.19 | | | | | $51.07 | |
Total Return(c): | | | | | | | | | (12.62)% | | | | | 2.59 | % |
| | | | | | | | | | | | | | | | |
| | | | |
Ratios/Supplemental Data: | | | | | | | | | | | | | | | |
Net assets, end of period (000) | | | | | | | | | $43,186 | | | | | $26,810 | |
Average net assets (000) | | | | | | | | | $38,280 | | | | | $27,915 | |
Ratios to average net assets(d): | | | | | | | | | | | | | | | |
Expenses after waivers and/or expense reimbursement | | | | | | | | | 0.19% | | | | | 0.19 | %(e) |
Expenses before waivers and/or expense reimbursement | | | | | | | | | 0.19% | | | | | 0.19 | %(e) |
Net investment income (loss) | | | | | | | | | 2.02% | | | | | 1.28 | %(e) |
Portfolio turnover rate(f) | | | | | | | | | 409% | | | | | 337 | % |
| (a) | Commencement of operations. |
| (b) | Calculated based on average shares outstanding during the period. |
| (c) | Total return is calculated assuming a purchase of a share on the first day and a sale on the last day of each period reported and includes reinvestment of dividends and distributions, if any. Total returns may reflect adjustments to conform to GAAP. Total returns for periods less than one full year are not annualized. |
| (d) | Does not include expenses of the underlying funds in which the Fund invests. |
| (f) | The Fund’s portfolio turnover rate is calculated in accordance with regulatory requirements, without regard to transactions involving short-term investments, certain derivatives and in-kind transactions (if any). If such transactions were included, the Fund’s portfolio turnover rate may be higher. |
See Notes to Financial Statements.
138
PGIM Total Return Bond ETF
Schedule of Investments
as of August 31, 2022
| | | | | | | | | | | | | | |
| Description | | Interest Rate | | Maturity Date | | Principal Amount (000)# | | | Value | |
| | | | | |
LONG-TERM INVESTMENTS 99.1% | | | | | | | | | | | | | | |
| | | | | |
ASSET-BACKED SECURITIES 20.4% | | | | | | | | | | | | | | |
| | | | | |
Automobiles 0.1% | | | | | | | | | | | | | | |
| | | | | |
Hertz Vehicle Financing III LLC, | | | | | | | | | | | | | | |
Series 2022-01A, Class C, 144A | | 2.630% | | 06/25/26 | | | | | 100 | | | $ | 91,182 | |
| | | | | |
Collateralized Loan Obligations 19.8% | | | | | | | | | | | | | | |
| | | | | |
AlbaCore Euro CLO (Ireland), | | | | | | | | | | | | | | |
Series 04A, Class B1, 144A, 3 Month EURIBOR + 2.600% (Cap N/A, Floor 2.600%) | | 2.600(c) | | 07/15/35 | | EUR | | | 500 | | | | 496,548 | |
Anchorage Capital CLO Ltd. (Cayman Islands), | | | | | | | | | | | | | | |
Series 2022-25A, Class A1, 144A, 3 Month SOFR + 1.390% (Cap N/A, Floor 1.390%) | | 3.867(c) | | 04/20/35 | | | | | 500 | | | | 485,801 | |
Atlas Senior Loan Fund (Cayman Islands), | | | | | | | | | | | | | | |
Series 2019-14A, Class AR, 144A | | 0.000(cc) | | 07/20/32 | | | | | 500 | | | | 486,857 | |
Atlas Static Senior Loan Fund Ltd. (Cayman Islands), | | | | | | | | | | | | | | |
Series 2022-01A, Class A, 144A, 3 Month SOFR + 2.600% (Cap N/A, Floor 2.600%) | | 5.100(c) | | 07/15/30 | | | | | 500 | | | | 500,000 | |
Bain Capital Credit CLO Ltd. (Cayman Islands), | | | | | | | | | | | | | | |
Series 2019-03A, Class AR, 144A, 3 Month LIBOR + 1.160% (Cap N/A, Floor 1.160%) | | 3.892(c) | | 10/21/34 | | | | | 500 | | | | 488,524 | |
Series 2022-01A, Class A1, 144A, 3 Month SOFR + 1.320% (Cap N/A, Floor 1.320%) | | 2.219(c) | | 04/18/35 | | | | | 250 | | | | 242,761 | |
Ballyrock CLO Ltd. (Cayman Islands), | | | | | | | | | | | | | | |
Series 2020-02A, Class A1R, 144A, 3 Month LIBOR + 1.010% (Cap N/A, Floor 1.010%) | | 3.720(c) | | 10/20/31 | | | | | 250 | | | | 246,004 | |
Barings CLO Ltd. (Cayman Islands), | | | | | | | | | | | | | | |
Series 2020-02A, Class AR, 144A, 3 Month LIBOR + 1.010% (Cap N/A, Floor 1.010%) | | 3.522(c) | | 10/15/33 | | | | | 250 | | | | 245,851 | |
Battalion CLO Ltd. (Cayman Islands), | | | | | | | | | | | | | | |
Series 2016-10A, Class A1R2, 144A, 3 Month LIBOR + 1.170% (Cap N/A, Floor 1.170%) | | 3.953(c) | | 01/25/35 | | | | | 1,000 | | | | 980,380 | |
Series 2017-11A, Class AR, 144A, 3 Month LIBOR + 1.150% (Cap N/A, Floor 1.150%) | | 3.933(c) | | 04/24/34 | | | | | 1,000 | | | | 981,257 | |
Benefit Street Partners CLO Ltd. (Cayman Islands), | | | | | | | | | | | | | | |
Series 2013-03A, Class A1R2, 144A, 3 Month LIBOR + 1.000% (Cap N/A, Floor 1.000%) | | 3.710(c) | | 07/20/29 | | | | | 153 | | | | 151,838 | |
Canyon Capital CLO Ltd. (Cayman Islands), | | | | | | | | | | | | | | |
Series 2019-01A, Class A1R, 144A, 3 Month LIBOR + 1.100% (Cap N/A, Floor 1.100%) (original cost $990,500; purchased 03/18/22)(f) | | 3.612(c) | | 04/15/32 | | | | | 1,000 | | | | 983,529 | |
See Notes to Financial Statements.
PGIM Fixed Income ETFs 139
PGIM Total Return Bond ETF
Schedule of Investments (continued)
as of August 31, 2022
| | | | | | | | | | | | | | |
| Description | | Interest Rate | | Maturity Date | | Principal Amount (000)# | | | Value | |
| | | | | |
ASSET-BACKED SECURITIES (Continued) | | | | | | | | | | | | | | |
| | | | | |
Collateralized Loan Obligations (cont’d.) | | | | | | | | | | | | | | |
| | | | | |
Carlyle CLO Ltd. (Cayman Islands), | | | | | | | | | | | | | | |
Series C17A, Class A1AR, 144A, 3 Month LIBOR + 1.030% (Cap N/A, Floor 0.000%) | | 3.812%(c) | | 04/30/31 | | | | | 250 | | | $ | 247,738 | |
Carlyle Global Market Strategies CLO Ltd. (Cayman Islands), | | | | | | | | | | | | | | |
Series 2014-01A, Class A1R2, 144A, 3 Month LIBOR + 0.970% (Cap N/A, Floor 0.970%) | | 3.710(c) | | 04/17/31 | | | | | 249 | | | | 244,886 | |
Carlyle US CLO Ltd. (Cayman Islands), | | | | | | | | | | | | | | |
Series 2021-11A, Class A, 144A, 3 Month LIBOR + 1.095% (Cap N/A, Floor 1.095%) | | 3.878(c) | | 01/25/33 | | | | | 500 | | | | 490,653 | |
CIFC Funding Ltd. (Cayman Islands), | | | | | | | | | | | | | | |
Series 2015-01A, Class ARR, 144A, 3 Month LIBOR + 1.110% (Cap N/A, Floor 1.110%) | | 3.869(c) | | 01/22/31 | | | | | 750 | | | | 739,515 | |
Cordatus CLO PLC (Ireland), | | | | | | | | | | | | | | |
Series 23A, Class B1, 144A, 3 Month EURIBOR + 2.300% (Cap N/A, Floor 2.300%) | | 2.300(c) | | 04/25/36 | | EUR | | | 250 | | | | 241,855 | |
Crown City CLO (Cayman Islands), | | | | | | | | | | | | | | |
Series 2020-02A, Class A1AR, 144A, 3 Month SOFR + 1.340% (Cap N/A, Floor 1.340%) | | 3.817(c) | | 04/20/35 | | | | | 250 | | | | 243,078 | |
Crown Point CLO Ltd. (Cayman Islands), | | | | | | | | | | | | | | |
Series 2021-11A, Class A, 144A, 3 Month LIBOR + 1.120% (Cap N/A, Floor 1.120%) | | 3.860(c) | | 01/17/34 | | | | | 500 | | | | 488,243 | |
Elevation CLO Ltd. (Cayman Islands), | | | | | | | | | | | | | | |
Series 2018-03A, Class A1R, 144A, 3 Month LIBOR + 1.210% (Cap N/A, Floor 1.210%) | | 3.993(c) | | 01/25/35 | | | | | 500 | | | | 486,302 | |
Generate CLO Ltd. (Cayman Islands), | | | | | | | | | | | | | | |
Series 4A, Class A1R, 144A, 3 Month LIBOR + 1.090% (Cap N/A, Floor 0.000%) | | 3.800(c) | | 04/20/32 | | | | | 250 | | | | 246,694 | |
Greenwood Park CLO Ltd. (Cayman Islands), | | | | | | | | | | | | | | |
Series 2018-01A, Class A2, 144A, 3 Month LIBOR + 1.010% (Cap N/A, Floor 0.000%) | | 3.522(c) | | 04/15/31 | | | | | 250 | | | | 247,348 | |
HPS Loan Management Ltd. (Cayman Islands), | | | | | | | | | | | | | | |
Series 10A-16, Class A1RR, 144A, 3 Month LIBOR + 1.140% (Cap N/A, Floor 1.140%) | | 3.850(c) | | 04/20/34 | | | | | 300 | | | | 292,500 | |
ICG US CLO Ltd. (Cayman Islands), | | | | | | | | | | | | | | |
Series 2014-03A, Class A1RR, 144A, 3 Month LIBOR + 1.030% (Cap N/A, Floor 0.000%) | | 3.813(c) | | 04/25/31 | | | | | 249 | | | | 245,807 | |
Series 2015-02RA, Class A1, 144A, 3 Month LIBOR + 1.370% (Cap N/A, Floor 1.370%) | | 4.110(c) | | 01/16/33 | | | | | 250 | | | | 247,707 | |
See Notes to Financial Statements.
140
PGIM Total Return Bond ETF
Schedule of Investments (continued)
as of August 31, 2022
| | | | | | | | | | | | | | |
| Description | | Interest Rate | | Maturity Date | | Principal Amount (000)# | | | Value | |
| | | | | |
ASSET-BACKED SECURITIES (Continued) | | | | | | | | | | | | | | |
| | | | | |
Collateralized Loan Obligations (cont’d.) | | | | | | | | | | | | | | |
| | | | | |
KKR CLO Ltd. (Cayman Islands), | | | | | | | | | | | | | | |
Series 11, Class AR, 144A, 3 Month LIBOR + 1.180% (Cap N/A, Floor 1.180%) | | 3.692%(c) | | 01/15/31 | | | | | 250 | | | $ | 247,177 | |
Series 33A, Class A, 144A, 3 Month LIBOR + 1.170% (Cap N/A, Floor 1.170%) | | 3.880(c) | | 07/20/34 | | | | | 500 | | | | 488,030 | |
Madison Park Euro Funding (Ireland), | | | | | | | | | | | | | | |
Series 14A, Class A1R, 144A, 3 Month EURIBOR + 0.800% (Cap N/A, Floor 0.800%) | | 0.800(c) | | 07/15/32 | | EUR | | | 250 | | | | 245,188 | |
Northwoods Capital Ltd. (Cayman Islands), | | | | | | | | | | | | | | |
Series 2020-22A, Class AR, 144A, 3 Month SOFR + 1.450% (Cap N/A, Floor 1.450%) | | 2.883(c) | | 09/01/31 | | | | | 750 | | | | 742,952 | |
OCP CLO Ltd. (Cayman Islands), | | | | | | | | | | | | | | |
Series 2015-09A, Class A1R2, 144A, 3 Month SOFR + 1.250% (Cap N/A, Floor 1.250%) | | 2.096(c) | | 01/15/33 | | | | | 250 | | | | 246,575 | |
OFSI BSL Ltd. (Cayman Islands), | | | | | | | | | | | | | | |
Series 2022-11A, Class A1, 144A, 3 Month SOFR + 2.100% (Cap N/A, Floor 2.100%) | | 3.618(c) | | 07/18/31 | | | | | 500 | | | | 495,860 | |
OZLM Ltd. (Cayman Islands), | | | | | | | | | | | | | | |
Series 2018-18A, Class A, 144A, 3 Month LIBOR + 1.020% (Cap N/A, Floor 1.020%) | | 3.532(c) | | 04/15/31 | | | | | 250 | | | | 245,934 | |
Palmer Square CLO Ltd. (Cayman Islands), | | | | | | | | | | | | | | |
Series 2015-01A, Class A2R4, 144A, 3 Month LIBOR + 1.700% (Cap N/A, Floor 1.700%) | | 4.684(c) | | 05/21/34 | | | | | 465 | | | | 449,729 | |
Series 2018-02A, Class A1A, 144A, 3 Month LIBOR + 1.100% (Cap N/A, Floor 0.000%) | | 3.840(c) | | 07/16/31 | | | | | 500 | | | | 492,170 | |
Park Avenue Institutional Advisers CLO Ltd. (Cayman Islands), | | | | | | | | | | | | | | |
Series 2019-02A, Class A1R, 144A, 3 Month LIBOR + 1.180% (Cap N/A, Floor 1.180%) | | 3.692(c) | | 10/15/34 | | | | | 500 | | | | 486,752 | |
Regatta Funding Ltd. (Cayman Islands), | | | | | | | | | | | | | | |
Series 2021-04A, Class A1, 144A, 3 Month LIBOR + 1.150% (Cap N/A, Floor 1.150%) | | 3.860(c) | | 01/20/35 | | | | | 750 | | | | 733,954 | |
Rockford Tower CLO Ltd., | | | | | | | | | | | | | | |
Series 2022-02A, Class A1, 144A, 3 Month SOFR + 2.000% (Cap N/A, Floor 2.000%) | | 4.328(c) | | 07/20/33 | | | | | 750 | | | | 743,280 | |
Sixth Street CLO Ltd. (Cayman Islands), | | | | | | | | | | | | | | |
Series 2020-16A, Class A1A, 144A, 3 Month LIBOR + 1.320% (Cap N/A, Floor 1.320%) | | 4.030(c) | | 10/20/32 | | | | | 1,000 | | | | 988,030 | |
See Notes to Financial Statements.
PGIM Fixed Income ETFs 141
PGIM Total Return Bond ETF
Schedule of Investments (continued)
as of August 31, 2022
| | | | | | | | | | | | |
| | | | |
| Description | | Interest
Rate | | Maturity
Date | | Principal
Amount (000)# | | | Value | |
| | | | |
ASSET-BACKED SECURITIES (Continued) | | | | | | | | | | | | |
| | | | |
Collateralized Loan Obligations (cont’d.) | | | | | | | | | | | | |
| | | | |
TCW CLO Ltd. (Cayman Islands), | | | | | | | | | | | | |
Series 2019-02A, Class A1R, 144A, 3 Month SOFR + 1.280% (Cap N/A, Floor 1.280%) | | 3.757%(c) | | 10/20/32 | | | 250 | | | $ | 245,724 | |
Trinitas CLO Ltd. (Cayman Islands), | | | | | | | | | | | | |
Series 2016-05A, Class ARR, 144A, 3 Month LIBOR + 1.030% (Cap N/A, Floor 1.030%) | | 3.813(c) | | 10/25/28 | | | 64 | | | | 63,741 | |
Trinitas Euro CLO (Ireland), | | | | | | | | | | | | |
Series 02A, Class CR, 144A, 3 Month EURIBOR + 3.750% (Cap N/A, Floor 3.750%) | | 3.750(c) | | 04/15/35 | | EUR | 500 | | | | 496,912 | |
TSTAT Ltd., | | | | | | | | | | | | |
Series 2022-01A, Class A1, 144A, 3 Month SOFR + 2.300% (Cap N/A, Floor 2.300%) | | 4.854(c) | | 07/20/31 | | | 500 | | | | 495,354 | |
Venture CLO Ltd. (Cayman Islands), | | | | | | | | | | | | |
Series 2021-43A, Class A1, 144A, 3 Month LIBOR + 1.240% (Cap N/A, Floor 1.240%) | | 3.752(c) | | 04/15/34 | | | 250 | | | | 243,795 | |
| | | | | | | | | | | | |
| | | | |
| | | | | | | | | | | 18,902,833 | |
| | | | |
Consumer Loans 0.5% | | | | | | | | | | | | |
| | | | |
Mariner Finance Issuance Trust, | | | | | | | | | | | | |
Series 2020-AA, Class A, 144A
| | 2.190 | | 08/21/34 | | | 150 | | | | 145,397 | |
Oportun Funding XIV LLC, | | | | | | | | | | | | |
Series 2021-A, Class C, 144A | | 3.440 | | 03/08/28 | | | 100 | | | | 92,227 | |
Oportun Issuance Trust, | | | | | | | | | | | | |
Series 2022-02, Class A, 144A | | 5.940 | | 10/09/29 | | | 200 | | | | 199,505 | |
Regional Management Issuance Trust, | | | | | | | | | | | | |
Series 2022-01, Class A, 144A | | 3.070 | | 03/15/32 | | | 100 | | | | 92,424 | |
| | | | | | | | | | | | |
| | | | |
| | | | | | | | | | | 529,553 | |
| | | | | | | | | | | | |
| | | | |
TOTAL ASSET-BACKED SECURITIES
(cost $19,926,771) | | | | | | | | | | | 19,523,568 | |
| | | | | | | | | | | | |
| | | | |
COMMERCIAL MORTGAGE-BACKED SECURITIES 7.8% | | | | | | | | | | | | |
BANK, | | | | | | | | | | | | |
Series 2021-BN35, Class A4 | | 2.031 | | 06/15/64 | | | 500 | | | | 414,449 | |
Series 2021-BN38, Class A4 | | 2.275 | | 12/15/64 | | | 250 | | | | 209,636 | |
Bank of America Merrill Lynch Commercial Mortgage Trust, | | | | | | | | | | | | |
Series 2017-BNK03, Class XB, IO | | 0.736(cc) | | 02/15/50 | | | 8,410 | | | | 198,784 | |
See Notes to Financial Statements.
142
PGIM Total Return Bond ETF
Schedule of Investments (continued)
as of August 31, 2022
| | | | | | | | | | | | |
| | | | |
| Description | | Interest
Rate | | Maturity
Date | | Principal
Amount (000)# | | | Value | |
| | | | |
COMMERCIAL MORTGAGE-BACKED SECURITIES (Continued) | | | | | | | | | | | | |
Barclays Commercial Mortgage Securities Trust, | | | | | | | | | | | | |
Series 2020-C07, Class XB | | 1.100%(cc) | | 04/15/53 | | | 1,019 | | | $ | 63,360 | |
Series 2022-C14, Class A4 | | 2.692 | | 02/15/55 | | | 200 | | | | 173,648 | |
Series 2022-C15, Class A5 | | 3.662(cc) | | 04/15/55 | | | 250 | | | | 234,347 | |
Benchmark Mortgage Trust, | | | | | | | | | | | | |
Series 2020-B19, Class A1 | | 0.628 | | 09/15/53 | | | 437 | | | | 414,660 | |
Series 2020-B21, Class A5 | | 1.978 | | 12/17/53 | | | 825 | | | | 684,500 | |
Series 2021-B31, Class A4 | | 2.420 | | 12/15/54 | | | 500 | | | | 424,403 | |
BMO Mortgage Trust, | | | | | | | | | | | | |
Series 2022-C01, Class A5 | | 3.374(cc) | | 02/15/55 | | | 200 | | | | 182,692 | |
BX Commercial Mortgage Trust, | | | | | | | | | | | | |
Series 2019-XL, Class F, 144A, 1 Month LIBOR + 2.000% (Cap N/A, Floor 2.000%) | | 4.391(c) | | 10/15/36 | | | 255 | | | | 246,873 | |
Series 2019-XL, Class J, 144A, 1 Month LIBOR + 2.650% (Cap N/A, Floor 2.650%) | | 5.041(c) | | 10/15/36 | | | 340 | | | | 325,182 | |
Series 2021-CIP, Class E, 144A, 1 Month LIBOR + 2.820% (Cap N/A, Floor 2.820%) | | 5.211(c) | | 12/15/38 | | | 150 | | | | 140,625 | |
BXP Trust, | | | | | | | | | | | | |
Series 2021-601L, Class A, 144A | | 2.618 | | 01/15/44 | | | 250 | | | | 202,007 | |
Citigroup Commercial Mortgage Trust, | | | | | | | | | | | | |
Series 2019-GC43, Class A3 | | 2.782 | | 11/10/52 | | | 500 | | | | 449,124 | |
Credit Suisse Mortgage Capital Certificates, | | | | | | | | | | | | |
Series 2019-ICE04, Class F, 144A, 1 Month LIBOR + 2.650% (Cap N/A, Floor 2.650%) | | 5.041(c) | | 05/15/36 | | | 900 | | | | 868,499 | |
Credit Suisse Mortgage Trust, | | | | | | | | | | | | |
Series 2014-USA, Class A2, 144A | | 3.953 | | 09/15/37 | | | 250 | | | | 234,036 | |
GS Mortgage Securities Corp. Trust, | | | | | | | | | | | | |
Series 2021-IP, Class E, 144A, 1 Month LIBOR + 3.550% (Cap N/A, Floor 3.550%) | | 5.941(c) | | 10/15/36 | | | 180 | | | | 171,076 | |
GS Mortgage Securities Trust, | | | | | | | | | | | | |
Series 2021-GSA03, Class A4 | | 2.369 | | 12/15/54 | | | 200 | | | | 167,435 | |
Series 2021-GSA03, Class XB, IO | | 0.747(cc) | | 12/15/54 | | | 2,000 | | | | 101,480 | |
JPMorgan Chase Commercial Mortgage Securities Trust, | | | | | | | | | | | | |
Series 2021-NYAH, Class H, 144A, 1 Month LIBOR + 3.390% (Cap N/A, Floor 3.390%) | | 5.781(c) | | 06/15/38 | | | 150 | | | | 141,260 | |
MHC Commercial Mortgage Trust, | | | | | | | | | | | | |
Series 2021-MHC, Class F, 144A, 1 Month LIBOR + 2.601% (Cap N/A, Floor 2.601%) | | 4.992(c) | | 04/15/38 | | | 369 | | | | 350,618 | |
One New York Plaza Trust, | | | | | | | | | | | | |
Series 2020-01NYP, Class A, 144A, 1 Month LIBOR + 0.950% (Cap N/A, Floor 0.950%) | | 3.341(c) | | 01/15/36 | | | 600 | | | | 578,224 | |
See Notes to Financial Statements.
PGIM Fixed Income ETFs 143
PGIM Total Return Bond ETF
Schedule of Investments (continued)
as of August 31, 2022
| | | | | | | | | | | | |
| | | | |
| Description | | Interest
Rate | | Maturity
Date | | Principal
Amount (000)# | | | Value | |
| | | | |
COMMERCIAL MORTGAGE-BACKED SECURITIES (Continued) | | | | | | | | | | | | |
| | | | |
One New York Plaza Trust, (cont’d.) | | | | | | | | | | | | |
Series 2020-01NYP, Class AJ, 144A, 1 Month LIBOR + 1.250% (Cap N/A, Floor 1.250%) | | 3.641%(c) | | 01/15/36 | | | 310 | | | $ | 300,035 | |
Series 2020-01NYP, Class B, 144A, 1 Month LIBOR + 1.500% (Cap N/A, Floor 1.500%) | | 3.891(c) | | 01/15/36 | | | 175 | | | | 165,852 | |
| | | | | | | | | | | | |
| | | | |
TOTAL COMMERCIAL MORTGAGE-BACKED SECURITIES
(cost $8,033,115) | | | | | | | | | | | 7,442,805 | |
| | | | | | | | | | | | |
| | | | |
CORPORATE BONDS 37.5% | | | | | | | | | | | | |
| | | | |
Aerospace & Defense 0.4% | | | | | | | | | | | | |
| | | | |
Boeing Co. (The), | | | | | | | | | | | | |
Sr. Unsec’d. Notes | | 3.900 | | 05/01/49 | | | 275 | | | | 199,000 | |
Bombardier, Inc. (Canada), | | | | | | | | | | | | |
Sr. Unsec’d. Notes, 144A | | 7.875 | | 04/15/27 | | | 75 | | | | 71,475 | |
Teledyne Technologies, Inc., | | | | | | | | | | | | |
Gtd. Notes | | 2.750 | | 04/01/31 | | | 175 | | | | 145,594 | |
| | | | | | | | | | | | |
| | | | |
| | | | | | | | | | | 416,069 | |
| | | | |
Agriculture 0.6% | | | | | | | | | | | | |
| | | | |
Altria Group, Inc., | | | | | | | | | | | | |
Gtd. Notes | | 2.450 | | 02/04/32 | | | 370 | | | | 279,590 | |
BAT International Finance PLC (United Kingdom), | | | | | | | | | | | | |
Gtd. Notes | | 4.448 | | 03/16/28 | | | 180 | | | | 171,175 | |
Gtd. Notes, 144A | | 3.950 | | 06/15/25 | | | 160 | | | | 156,560 | |
| | | | | | | | | | | | |
| | | | |
| | | | | | | | | | | 607,325 | |
| | | | |
Airlines 0.2% | | | | | | | | | | | | |
| | | | |
Southwest Airlines Co., | | | | | | | | | | | | |
Sr. Unsec’d. Notes | | 5.125 | | 06/15/27 | | | 220 | | | | 224,502 | |
| | | | |
Apparel 0.0% | | | | | | | | | | | | |
| | | | |
Kontoor Brands, Inc., | | | | | | | | | | | | |
Gtd. Notes, 144A | | 4.125 | | 11/15/29 | | | 50 | | | | 42,785 | |
| | | | |
Auto Manufacturers 1.1% | | | | | | | | | | | | |
| | | | |
Ford Motor Co., | | | | | | | | | | | | |
Sr. Unsec’d. Notes | | 4.750 | | 01/15/43 | | | 50 | | | | 37,536 | |
Sr. Unsec’d. Notes | | 6.100 | | 08/19/32 | | | 330 | | | | 321,809 | |
See Notes to Financial Statements.
144
PGIM Total Return Bond ETF
Schedule of Investments (continued)
as of August 31, 2022
| | | | | | | | | | | | |
| | | | |
| Description | | Interest
Rate | | Maturity
Date | | Principal
Amount (000)# | | | Value | |
| | | | |
CORPORATE BONDS (Continued) | | | | | | | | | | | | |
| | | | |
Auto Manufacturers (cont’d.) | | | | | | | | | | | | |
| | | | |
Ford Motor Credit Co. LLC, | | | | | | | | | | | | |
Sr. Unsec’d. Notes | | 4.271% | | 01/09/27 | | | 200 | | | $ | 183,602 | |
General Motors Co., | | | | | | | | | | | | |
Sr. Unsec’d. Notes | | 6.250 | | 10/02/43 | | | 230 | | | | 219,813 | |
General Motors Financial Co., Inc., | | | | | | | | | | | | |
Sr. Unsec’d. Notes | | 5.000 | | 04/09/27 | | | 275 | | | | 271,125 | |
| | | | | | | | | | | | |
| | | | |
| | | | | | | | | | | 1,033,885 | |
| | | | |
Banks 11.1% | | | | | | | | | | | | |
| | | | |
Bank of America Corp., | | | | | | | | | | | | |
Jr. Sub. Notes, Series MM | | 4.300(ff) | | 01/28/25(oo) | | | 190 | | | | 159,349 | |
Sr. Unsec’d. Notes, Series N | | 2.651(ff) | | 03/11/32 | | | 1,970 | | | | 1,635,586 | |
BNP Paribas SA (France), | | | | | | | | | | | | |
Sr. Unsec’d. Notes, 144A | | 1.323(ff) | | 01/13/27 | | | 630 | | | | 552,540 | |
Citigroup, Inc., | | | | | | | | | | | | |
Jr. Sub. Notes | | 3.875(ff) | | 02/18/26(oo) | | | 40 | | | | 34,739 | |
Sr. Unsec’d. Notes | | 2.666(ff) | | 01/29/31 | | | 1,490 | | | | 1,263,947 | |
Credit Suisse Group AG (Switzerland), | | | | | | | | | | | | |
Sr. Unsec’d. Notes, 144A | | 6.537(ff) | | 08/12/33 | | | 270 | | | | 257,981 | |
Danske Bank A/S (Denmark), | | | | | | | | | | | | |
Sr. Unsec’d. Notes, 144A | | 3.773(ff) | | 03/28/25 | | | 220 | | | | 214,197 | |
Deutsche Bank AG (Germany), | | | | | | | | | | | | |
Sr. Unsec’d. Notes | | 2.311(ff) | | 11/16/27 | | | 470 | | | | 400,789 | |
Goldman Sachs Group, Inc. (The), | | | | | | | | | | | | |
Jr. Sub. Notes, Series V | | 4.125(ff) | | 11/10/26(oo) | | | 55 | | | | 47,178 | |
Sr. Unsec’d. Notes | | 4.223(ff) | | 05/01/29 | | | 1,110 | | | | 1,061,001 | |
JPMorgan Chase & Co., | | | | | | | | | | | | |
Jr. Sub. Notes, Series HH | | 4.600(ff) | | 02/01/25(oo) | | | 190 | | | | 166,542 | |
Sr. Unsec’d. Notes | | 2.739(ff) | | 10/15/30 | | | 1,840 | | | | 1,593,572 | |
Morgan Stanley, | | | | | | | | | | | | |
Sr. Unsec’d. Notes, GMTN | | 2.699(ff) | | 01/22/31 | | | 785 | | | | 679,662 | |
Sr. Unsec’d. Notes, MTN | | 2.943(ff) | | 01/21/33 | | | 680 | | | | 579,987 | |
Sr. Unsec’d. Notes, MTN | | 4.889(ff) | | 07/20/33 | | | 40 | | | | 39,828 | |
Sub. Notes, GMTN | | 4.350 | | 09/08/26 | | | 290 | | | | 286,672 | |
Societe Generale SA (France), | | | | | | | | | | | | |
Sr. Unsec’d. Notes, 144A | | 2.797(ff) | | 01/19/28 | | | 400 | | | | 352,454 | |
State Street Corp., | | | | | | | | | | | | |
Sr. Unsec’d. Notes | | 4.164(ff) | | 08/04/33 | | | 290 | | | | 280,241 | |
See Notes to Financial Statements.
PGIM Fixed Income ETFs 145
PGIM Total Return Bond ETF
Schedule of Investments (continued)
as of August 31, 2022
| | | | | | | | | | | | |
| | | | |
| Description | | Interest
Rate | | Maturity
Date | | Principal
Amount (000)# | | | Value | |
| | | | |
CORPORATE BONDS (Continued) | | | | | | | | | | | | |
| | | | |
Banks (cont’d.) | | | | | | | | | | | | |
| | | | |
UBS Group AG (Switzerland), | | | | | | | | | | | | |
Sr. Unsec’d. Notes, 144A, SOFR + 1.580% | | 3.867%(c) | | 05/12/26 | | | 200 | | | $ | 200,456 | |
Wells Fargo & Co., | | | | | | | | | | | | |
Sr. Unsec’d. Notes, MTN | | 2.879(ff) | | 10/30/30 | | | 395 | | | | 346,365 | |
Sr. Unsec’d. Notes, MTN | | 4.808(ff) | | 07/25/28 | | | 450 | | | | 447,618 | |
| | | | | | | | | | | | |
| | | | |
| | | | | | | | | | | 10,600,704 | |
| | | | |
Beverages 0.2% | | | | | | | | | | | | |
| | | | |
Anheuser-Busch InBev Finance, Inc. (Belgium), | | | | | | | | | | | | |
Gtd. Notes | | 4.000 | | 01/17/43 | | | 185 | | | | 155,244 | |
Gtd. Notes | | 4.625 | | 02/01/44 | | | 60 | | | | 54,777 | |
| | | | | | | | | | | | |
| | | | |
| | | | | | | | | | | 210,021 | |
| | | | |
Biotechnology 0.1% | | | | | | | | | | | | |
| | | | |
Amgen, Inc., | | | | | | | | | | | | |
Sr. Unsec’d. Notes | | 4.875 | | 03/01/53 | | | 130 | | | | 126,133 | |
| | | | |
Building Materials 1.1% | | | | | | | | | | | | |
| | | | |
Fortune Brands Home & Security, Inc., | | | | | | | | | | | | |
Sr. Unsec’d. Notes | | 3.250 | | 09/15/29 | | | 270 | | | | 235,677 | |
Griffon Corp., | | | | | | | | | | | | |
Gtd. Notes | | 5.750 | | 03/01/28 | | | 48 | | | | 44,408 | |
Masco Corp., | | | | | | | | | | | | |
Sr. Unsec’d. Notes | | 3.500 | | 11/15/27 | | | 350 | | | | 326,135 | |
Owens Corning, | | | | | | | | | | | | |
Sr. Unsec’d. Notes | | 3.875 | | 06/01/30 | | | 270 | | | | 245,868 | |
SRM Escrow Issuer LLC, | | | | | | | | | | | | |
Sr. Sec’d. Notes, 144A | | 6.000 | | 11/01/28 | | | 100 | | | | 90,653 | |
Standard Industries, Inc., | | | | | | | | | | | | |
Sr. Unsec’d. Notes, 144A | | 4.375 | | 07/15/30 | | | 75 | | | | 59,578 | |
| | | | | | | | | | | | |
| | | | |
| | | | | | | | | | | 1,002,319 | |
| | | | |
Chemicals 0.6% | | | | | | | | | | | | |
| | | | |
CF Industries, Inc., | | | | | | | | | | | | |
Gtd. Notes | | 5.150 | | 03/15/34 | | | 195 | | | | 188,140 | |
Chemours Co. (The), | | | | | | | | | | | | |
Gtd. Notes | | 5.375 | | 05/15/27 | | | 50 | | | | 46,122 | |
See Notes to Financial Statements.
146
PGIM Total Return Bond ETF
Schedule of Investments (continued)
as of August 31, 2022
| | | | | | | | | | | | |
| | | | |
| Description | | Interest
Rate | | Maturity
Date | | Principal
Amount (000)# | | | Value | |
| | | | |
CORPORATE BONDS (Continued) | | | | | | | | | | | | |
| | | | |
Chemicals (cont’d.) | | | | | | | | | | | | |
| | | | |
LYB International Finance BV, | | | | | | | | | | | | |
Gtd. Notes | | 5.250% | | 07/15/43 | | | 140 | | | $ | 132,032 | |
RPM International, Inc., | | | | | | | | | | | | |
Sr. Unsec’d. Notes | | 2.950 | | 01/15/32 | | | 30 | | | | 24,420 | |
Sasol Financing USA LLC (South Africa), | | | | | | | | | | | | |
Gtd. Notes | | 5.875 | | 03/27/24 | | | 200 | | | | 199,300 | |
| | | | | | | | | | | | |
| | | | |
| | | | | | | | | | | 590,014 | |
| | | | |
Commercial Services 0.9% | | | | | | | | | | | | |
| | | | |
Allied Universal Holdco LLC/Allied Universal Finance Corp., | | | | | | | | | | | | |
Sr. Sec’d. Notes, 144A | | 6.625 | | 07/15/26 | | | 75 | | | | 70,211 | |
ERAC USA Finance LLC, | | | | | | | | | | | | |
Gtd. Notes, 144A | | 3.300 | | 12/01/26 | | | 250 | | | | 236,161 | |
Herc Holdings, Inc., | | | | | | | | | | | | |
Gtd. Notes, 144A | | 5.500 | | 07/15/27 | | | 100 | | | | 94,500 | |
Metis Merger Sub LLC, | | | | | | | | | | | | |
Sr. Unsec’d. Notes, 144A | | 6.500 | | 05/15/29 | | | 75 | | | | 65,628 | |
Nexi SpA (Italy), | | | | | | | | | | | | |
Sr. Unsec’d. Notes | | 2.125 | | 04/30/29 | | EUR | 252 | | | | 195,581 | |
RELX Capital, Inc. (United Kingdom), | | | | | | | | | | | | |
Gtd. Notes | | 4.750 | | 05/20/32 | | | 45 | | | | 45,166 | |
Thomas Jefferson University, | | | | | | | | | | | | |
Sec’d. Notes | | 3.847 | | 11/01/57 | | | 25 | | | | 20,509 | |
United Rentals North America, Inc., | | | | | | | | | | | | |
Gtd. Notes | | 3.750 | | 01/15/32 | | | 50 | | | | 41,894 | |
Washington University (The), | | | | | | | | | | | | |
Sr. Unsec’d. Notes | | 4.349 | | 04/15/2122 | | | 80 | | | | 67,576 | |
| | | | | | | | | | | | |
| | | | |
| | | | | | | | | | | 837,226 | |
| | | | |
Distribution/Wholesale 0.2% | | | | | | | | | | | | |
| | | | |
Ferguson Finance PLC, | | | | | | | | | | | | |
Sr. Unsec’d. Notes, 144A | | 4.650 | | 04/20/32 | | | 200 | | | | 185,271 | |
H&E Equipment Services, Inc., | | | | | | | | | | | | |
Gtd. Notes, 144A | | 3.875 | | 12/15/28 | | | 50 | | | | 42,256 | |
| | | | | | | | | | | | |
| | | | |
| | | | | | | | | | | 227,527 | |
See Notes to Financial Statements.
PGIM Fixed Income ETFs 147
PGIM Total Return Bond ETF
Schedule of Investments (continued)
as of August 31, 2022
| | | | | | | | | | | | |
| | | | |
| Description | | Interest
Rate | | Maturity
Date | | Principal
Amount (000)# | | | Value | |
| | | | |
CORPORATE BONDS (Continued) | | | | | | | | | | | | |
| | | | |
Diversified Financial Services 0.7% | | | | | | | | | | | | |
| | | | |
Cantor Fitzgerald LP, | | | | | | | | | | | | |
Sr. Unsec’d. Notes, 144A | | 4.875% | | 05/01/24 | | | 250 | | | $ | 248,872 | |
Jefferies Group LLC/Jefferies Group Capital Finance, Inc., | | | | | | | | | | | | |
Sr. Unsec’d. Notes | | 2.625 | | 10/15/31 | | | 180 | | | | 139,697 | |
LFS Topco LLC, | | | | | | | | | | | | |
Gtd. Notes, 144A | | 5.875 | | 10/15/26 | | | 25 | | | | 20,292 | |
OneMain Finance Corp., | | | | | | | | | | | | |
Gtd. Notes | | 6.875 | | 03/15/25 | | | 50 | | | | 48,702 | |
Power Finance Corp. Ltd. (India), | | | | | | | | | | | | |
Sr. Unsec’d. Notes, 144A, MTN | | 6.150 | | 12/06/28 | | | 200 | | | | 205,850 | |
| | | | | | | | | | | | |
| | | | |
| | | | | | | | | | | 663,413 | |
| | | | |
Electric 1.3% | | | | | | | | | | | | |
| | | | |
Calpine Corp., | | | | | | | | | | | | |
Sr. Sec’d. Notes, 144A | | 3.750 | | 03/01/31 | | | 75 | | | | 61,642 | |
Sr. Unsec’d. Notes, 144A | | 5.000 | | 02/01/31 | | | 50 | | | | 42,167 | |
Comision Federal de Electricidad (Mexico), | | | | | | | | | | | | |
Gtd. Notes, 144A | | 4.688 | | 05/15/29 | | | 200 | | | | 179,600 | |
Eskom Holdings SOC Ltd. (South Africa), | | | | | | | | | | | | |
Sr. Unsec’d. Notes, 144A, MTN | | 6.750 | | 08/06/23 | | | 200 | | | | 193,912 | |
NRG Energy, Inc., | | | | | | | | | | | | |
Gtd. Notes, 144A | | 3.375 | | 02/15/29 | | | 50 | | | | 41,336 | |
Gtd. Notes, 144A | | 3.875 | | 02/15/32 | | | 50 | | | | 39,532 | |
Pacific Gas & Electric Co., | | | | | | | | | | | | |
First Mortgage | | 3.500 | | 08/01/50 | | | 150 | | | | 99,632 | |
Puget Energy, Inc., | | | | | | | | | | | | |
Sr. Sec’d. Notes | | 4.224 | | 03/15/32 | | | 220 | | | | 203,350 | |
Sempra Energy, | | | | | | | | | | | | |
Jr. Sub. Notes | | 4.125(ff) | | 04/01/52 | | | 180 | | | | 152,298 | |
Southern California Edison Co., | | | | | | | | | | | | |
First Mortgage | | 3.450 | | 02/01/52 | | | 45 | | | | 34,527 | |
Southern Co. (The), | | | | | | | | | | | | |
Jr. Sub. Notes | | 5.113 | | 08/01/27 | | | 60 | | | | 60,017 | |
Vistra Corp., | | | | | | | | | | | | |
Jr. Sub. Notes, 144A | | 7.000(ff) | | 12/15/26(oo) | | | 25 | | | | 23,250 | |
See Notes to Financial Statements.
148
PGIM Total Return Bond ETF
Schedule of Investments (continued)
as of August 31, 2022
| | | | | | | | | | | | |
| | | | |
| Description | | Interest
Rate | | Maturity
Date | | Principal
Amount (000)# | | | Value | |
| | | | |
CORPORATE BONDS (Continued) | | | | | | | | | | | | |
| | | | |
Electric (cont’d.) | | | | | | | | | | | | |
| | | | |
Vistra Operations Co. LLC, | | | | | | | | | | | | |
Gtd. Notes, 144A | | 4.375% | | 05/01/29 | | | 50 | | | $ | 43,571 | |
Xcel Energy, Inc., | | | | | | | | | | | | |
Sr. Unsec’d. Notes | | 4.600 | | 06/01/32 | | | 50 | | | | 49,594 | |
| | | | | | | | | | | | |
| | | | |
| | | | | | | | | | | 1,224,428 | |
| | | | |
Electronics 0.1% | | | | | | | | | | | | |
| | | | |
Likewize Corp., | | | | | | | | | | | | |
Sr. Sec’d. Notes, 144A | | 9.750 | | 10/15/25 | | | 50 | | | | 47,813 | |
| | | | |
Engineering & Construction 0.2% | | | | | | | | | | | | |
| | | | |
Mexico City Airport Trust (Mexico), | | | | | | | | | | | | |
Sr. Sec’d. Notes, 144A | | 4.250 | | 10/31/26 | | | 200 | | | | 188,000 | |
| | | | |
Entertainment 0.6% | | | | | | | | | | | | |
| | | | |
Caesars Resort Collection LLC/CRC Finco, Inc., | | | | | | | | | | | | |
Sr. Sec’d. Notes, 144A | | 5.750 | | 07/01/25 | | | 50 | | | | 49,130 | |
Magallanes, Inc., | | | | | | | | | | | | |
Gtd. Notes, 144A | | 5.050 | | 03/15/42 | | | 145 | | | | 118,495 | |
Gtd. Notes, 144A | | 5.141 | | 03/15/52 | | | 195 | | | | 156,993 | |
Gtd. Notes, 144A | | 5.391 | | 03/15/62 | | | 25 | | | | 20,104 | |
Penn Entertainment, Inc., | | | | | | | | | | | | |
Sr. Unsec’d. Notes, 144A | | 4.125 | | 07/01/29 | | | 50 | | | | 40,500 | |
Wynn Resorts Finance LLC/Wynn Resorts Capital Corp., | | | | | | | | | | | | |
Sr. Unsec’d. Notes, 144A | | 7.750 | | 04/15/25 | | | 150 | | | | 149,576 | |
| | | | | | | | | | | | |
| | | | |
| | | | | | | | | | | 534,798 | |
| | | | |
Foods 0.8% | | | | | | | | | | | | |
| | | | |
Albertson’s Cos., Inc./Safeway, Inc./New Albertson’s LP/Albertson’s LLC, | | | | | | | | | | | | |
Gtd. Notes, 144A | | 3.500 | | 03/15/29 | | | 50 | | | | 41,086 | |
B&G Foods, Inc., | | | | | | | | | | | | |
Gtd. Notes | | 5.250 | | 04/01/25 | | | 50 | | | | 44,633 | |
Bellis Finco PLC (United Kingdom), | | | | | | | | | | | | |
Gtd. Notes | | 4.000 | | 02/16/27 | | GBP | 218 | | | | 165,676 | |
Chobani LLC/Chobani Finance Corp., Inc., | | | | | | | | | | | | |
Gtd. Notes, 144A | | 7.500 | | 04/15/25 | | | 50 | | | | 47,707 | |
See Notes to Financial Statements.
PGIM Fixed Income ETFs 149
PGIM Total Return Bond ETF
Schedule of Investments (continued)
as of August 31, 2022
| | | | | | | | | | | | |
| | | | |
| Description | | Interest
Rate | | Maturity
Date | | Principal
Amount (000)# | | | Value | |
| | | | |
CORPORATE BONDS (Continued) | | | | | | | | | | | | |
| | | | |
Foods (cont’d.) | | | | | | | | | | | | |
| | | | |
JBS USA LUX SA/JBS USA Food Co./JBS USA Finance, Inc., | | | | | | | | | | | | |
Gtd. Notes, 144A | | 5.125% | | 02/01/28 | | | 70 | | | $ | 69,691 | |
Gtd. Notes, 144A | | 6.500 | | 04/15/29 | | | 29 | | | | 30,037 | |
Lamb Weston Holdings, Inc., | | | | | | | | | | | | |
Gtd. Notes, 144A | | 4.125 | | 01/31/30 | | | 75 | | | | 67,554 | |
Gtd. Notes, 144A | | 4.375 | | 01/31/32 | | | 25 | | | | 22,208 | |
Market Bidco Finco PLC (United Kingdom), | | | | | | | | | | | | |
Sr. Sec’d. Notes, 144A | | 5.500 | | 11/04/27 | | GBP | 200 | | | | 190,518 | |
Pilgrim’s Pride Corp., | | | | | | | | | | | | |
Gtd. Notes, 144A | | 3.500 | | 03/01/32 | | | 50 | | | | 40,632 | |
Post Holdings, Inc., | | | | | | | | | | | | |
Sr. Unsec’d. Notes, 144A | | 4.500 | | 09/15/31 | | | 75 | | | | 63,769 | |
| | | | | | | | | | | | |
| | | | |
| | | | | | | | | | | 783,511 | |
| | | | |
Gas 0.1% | | | | | | | | | | | | |
| | | | |
Piedmont Natural Gas Co., Inc., | | | | | | | | | | | | |
Sr. Unsec’d. Notes | | 5.050 | | 05/15/52 | | | 110 | | | | 107,575 | |
| | | | |
Healthcare-Products 0.2% | | | | | | | | | | | | |
| | | | |
Avantor Funding, Inc., | | | | | | | | | | | | |
Gtd. Notes | | 3.875 | | 07/15/28 | | EUR | 192 | | | | 176,066 | |
Medline Borrower LP, | | | | | | | | | | | | |
Sr. Sec’d. Notes, 144A | | 3.875 | | 04/01/29 | | | 25 | | | | 21,168 | |
Sr. Unsec’d. Notes, 144A | | 5.250 | | 10/01/29 | | | 25 | | | | 21,014 | |
| | | | | | | | | | | | |
| | | | |
| | | | | | | | | | | 218,248 | |
| | | | |
Healthcare-Services 1.1% | | | | | | | | | | | | |
| | | | |
DaVita, Inc., | | | | | | | | | | | | |
Gtd. Notes, 144A | | 4.625 | | 06/01/30 | | | 200 | | | | 160,369 | |
Inova Health System Foundation, | | | | | | | | | | | | |
Unsec’d. Notes | | 4.068 | | 05/15/52 | | | 250 | | | | 227,015 | |
Legacy LifePoint Health LLC, | | | | | | | | | | | | |
Sr. Sec’d. Notes, 144A | | 4.375 | | 02/15/27 | | | 75 | | | | 65,199 | |
Nationwide Children’s Hospital, Inc., | | | | | | | | | | | | |
Unsec’d. Notes | | 4.556 | | 11/01/52 | | | 220 | | | | 215,548 | |
Presbyterian Healthcare Services, | | | | | | | | | | | | |
Unsec’d. Notes | | 4.875 | | 08/01/52 | | | 150 | | | | 153,124 | |
See Notes to Financial Statements.
150
PGIM Total Return Bond ETF
Schedule of Investments (continued)
as of August 31, 2022
| | | | | | | | | | | | |
| | | | |
| Description | | Interest
Rate | | Maturity
Date | | Principal
Amount (000)# | | | Value | |
| | | | |
CORPORATE BONDS (Continued) | | | | | | | | | | | | |
| | | | |
Healthcare-Services (cont’d.) | | | | | | | | | | | | |
| | | | |
Queen’s Health Systems (The), | | | | | | | | | | | | |
Sec’d. Notes | | 4.810% | | 07/01/52 | | | 90 | | | $ | 90,852 | |
Tenet Healthcare Corp., | | | | | | | | | | | | |
Gtd. Notes, 144A | | 6.125 | | 10/01/28 | | | 50 | | | | 45,843 | |
Sr. Sec’d. Notes, 144A | | 6.125 | | 06/15/30 | | | 75 | | | | 72,022 | |
| | | | | | | | | | | | |
| | | | |
| | | | | | | | | | | 1,029,972 | |
| | | | |
Home Builders 0.4% | | | | | | | | | | | | |
| | | | |
Ashton Woods USA LLC/Ashton Woods Finance Co., | | | | | | | | | | | | |
Sr. Unsec’d. Notes, 144A | | 4.625 | | 08/01/29 | | | 50 | | | | 39,264 | |
Beazer Homes USA, Inc., | | | | | | | | | | | | |
Gtd. Notes | | 7.250 | | 10/15/29 | | | 75 | | | | 64,899 | |
Brookfield Residential Properties, Inc./Brookfield Residential US LLC (Canada), | | | | | | | | | | | | |
Gtd. Notes, 144A | | 4.875 | | 02/15/30 | | | 125 | | | | 96,250 | |
Century Communities, Inc., | | | | | | | | | | | | |
Gtd. Notes | | 6.750 | | 06/01/27 | | | 50 | | | | 49,022 | |
Empire Communities Corp. (Canada), | | | | | | | | | | | | |
Sr. Unsec’d. Notes, 144A | | 7.000 | | 12/15/25 | | | 50 | | | | 43,125 | |
Forestar Group, Inc., | | | | | | | | | | | | |
Gtd. Notes, 144A | | 3.850 | | 05/15/26 | | | 50 | | | | 42,533 | |
Shea Homes LP/Shea Homes Funding Corp., | | | | | | | | | | | | |
Sr. Unsec’d. Notes, 144A | | 4.750 | | 04/01/29 | | | 50 | | | | 40,345 | |
| | | | | | | | | | | | |
| | | | |
| | | | | | | | | | | 375,438 | |
| | | | |
Housewares 0.0% | | | | | | | | | | | | |
| | | | |
Scotts Miracle-Gro Co. (The), | | | | | | | | | | | | |
Gtd. Notes | | 4.000 | | 04/01/31 | | | 50 | | | | 37,808 | |
| | | | |
Insurance 0.8% | | | | | | | | | | | | |
| | | | |
Corebridge Financial, Inc., | | | | | | | | | | | | |
Sr. Unsec’d. Notes, 144A | | 4.400 | | 04/05/52 | | | 150 | | | | 123,337 | |
Fairfax Financial Holdings Ltd. (Canada), | | | | | | | | | | | | |
Sr. Unsec’d. Notes | | 3.375 | | 03/03/31 | | | 175 | | | | 152,015 | |
Sr. Unsec’d. Notes, 144A | | 5.625 | | 08/16/32 | | | 200 | | | | 196,149 | |
See Notes to Financial Statements.
PGIM Fixed Income ETFs 151
PGIM Total Return Bond ETF
Schedule of Investments (continued)
as of August 31, 2022
| | | | | | | | | | | | |
| | | | |
| Description | | Interest
Rate | | Maturity
Date | | Principal
Amount (000)# | | | Value | |
| | | | |
CORPORATE BONDS (Continued) | | | | | | | | | | | | |
| | | | |
Insurance (cont’d.) | | | | | | | | | | | | |
| | | | |
Liberty Mutual Group, Inc., | | | | | | | | | | | | |
Gtd. Notes, 144A | | 4.569% | | 02/01/29 | | | 245 | | | $ | 238,466 | |
Gtd. Notes, 144A | | 5.500 | | 06/15/52 | | | 75 | | | | 73,113 | |
| | | | | | | | | | | | |
| | | | |
| | | | | | | | | | | 783,080 | |
| | | | |
Internet 0.3% | | | | | | | | | | | | |
| | | | |
NortonLifeLock, Inc., | | | | | | | | | | | | |
Sr. Unsec’d. Notes, 144A | | 5.000 | | 04/15/25 | | | 250 | | | | 246,594 | |
| | | | |
Iron/Steel 0.2% | | | | | | | | | | | | |
| | | | |
Steel Dynamics, Inc., | | | | | | | | | | | | |
Sr. Unsec’d. Notes | | 3.450 | | 04/15/30 | | | 180 | | | | 160,420 | |
| | | | |
Lodging 0.1% | | | | | | | | | | | | |
| | | | |
Hilton Domestic Operating Co., Inc., | | | | | | | | | | | | |
Gtd. Notes, 144A | | 5.750 | | 05/01/28 | | | 50 | | | | 48,904 | |
MGM Resorts International, | | | | | | | | | | | | |
Gtd. Notes | | 4.750 | | 10/15/28 | | | 75 | | | | 65,955 | |
| | | | | | | | | | | | |
| | | | |
| | | | | | | | | | | 114,859 | |
| | | | |
Machinery-Diversified 0.2% | | | | | | | | | | | | |
| | | | |
Westinghouse Air Brake Technologies Corp., | | | | | | | | | | | | |
Gtd. Notes | | 4.950 | | 09/15/28 | | | 215 | | | | 209,000 | |
| | | | |
Media 1.6% | | | | | | | | | | | | |
| | | | |
CCO Holdings LLC/CCO Holdings Capital Corp., | | | | | | | | | | | | |
Sr. Unsec’d. Notes | | 4.500 | | 05/01/32 | | | 50 | | | | 40,544 | |
Sr. Unsec’d. Notes, 144A | | 4.000 | | 03/01/23 | | | 175 | | | | 174,813 | |
Sr. Unsec’d. Notes, 144A | | 4.250 | | 01/15/34 | | | 25 | | | | 19,032 | |
Sr. Unsec’d. Notes, 144A | | 4.500 | | 06/01/33 | | | 100 | | | | 79,097 | |
Charter Communications Operating LLC/Charter Communications Operating Capital, | | | | | | | | | | | | |
Sr. Sec’d. Notes | | 3.900 | | 06/01/52 | | | 615 | | | | 417,156 | |
CSC Holdings LLC, | | | | | | | | | | | | |
Gtd. Notes, 144A | | 6.500 | | 02/01/29 | | | 400 | | | | 368,045 | |
Sr. Unsec’d. Notes | | 5.875 | | 09/15/22 | | | 50 | | | | 50,000 | |
See Notes to Financial Statements.
152
PGIM Total Return Bond ETF
Schedule of Investments (continued)
as of August 31, 2022
| | | | | | | | | | | | |
| | | | |
| Description | | Interest
Rate | | Maturity
Date | | Principal
Amount (000)# | | | Value | |
| | | | |
CORPORATE BONDS (Continued) | | | | | | | | | | | | |
| | | | |
Media (cont’d.) | | | | | | | | | | | | |
| | | | |
Diamond Sports Group LLC/Diamond Sports Finance Co., | | | | | | | | | | | | |
Sec’d. Notes, 144A | | 5.375% | | 08/15/26 | | | 200 | | | $ | 38,024 | |
DISH DBS Corp., | | | | | | | | | | | | |
Gtd. Notes | | 5.125 | | 06/01/29 | | | 50 | | | | 29,613 | |
Paramount Global, | | | | | | | | | | | | |
Sr. Unsec’d. Notes | | 4.375 | | 03/15/43 | | | 140 | | | | 104,928 | |
Virgin Media Secured Finance PLC (United Kingdom), | | | | | | | | | | | | |
Sr. Sec’d. Notes | | 4.250 | | 01/15/30 | | GBP | 206 | | | | 199,999 | |
| | | | | | | | | | | | |
| | | | |
| | | | | | | | | | | 1,521,251 | |
| | | | |
Mining 0.9% | | | | | | | | | | | | |
| | | | |
Freeport-McMoRan, Inc., | | | | | | | | | | | | |
Gtd. Notes | | 5.400 | | 11/14/34 | | | 210 | | | | 198,751 | |
Indonesia Asahan Aluminium Persero PT (Indonesia), | | | | | | | | | | | | |
Sr. Unsec’d. Notes | | 4.750 | | 05/15/25 | | | 200 | | | | 200,730 | |
Kinross Gold Corp. (Canada), | | | | | | | | | | | | |
Gtd. Notes | | 4.500 | | 07/15/27 | | | 230 | | | | 222,985 | |
Newmont Corp., | | | | | | | | | | | | |
Gtd. Notes | | 2.250 | | 10/01/30 | | | 250 | | | | 205,451 | |
Gtd. Notes | | 2.600 | | 07/15/32 | | | 40 | | | | 32,701 | |
| | | | | | | | | | | | |
| | | | |
| | | | | | | | | | | 860,618 | |
| | | | |
Office/Business Equipment 0.2% | | | | | | | | | | | | |
| | | | |
CDW LLC/CDW Finance Corp., | | | | | | | | | | | | |
Gtd. Notes | | 2.670 | | 12/01/26 | | | 220 | | | | 197,599 | |
| | | | |
Oil & Gas 2.3% | | | | | | | | | | | | |
| | | | |
Aker BP ASA (Norway), | | | | | | | | | | | | |
Gtd. Notes, 144A | | 2.000 | | 07/15/26 | | | 200 | | | | 178,042 | |
Gtd. Notes, 144A | | 3.100 | | 07/15/31 | | | 200 | | | | 167,771 | |
Cenovus Energy, Inc. (Canada), | | | | | | | | | | | | |
Sr. Unsec’d. Notes | | 3.750 | | 02/15/52 | | | 150 | | | | 115,489 | |
Chesapeake Energy Corp., | | | | | | | | | | | | |
Gtd. Notes, 144A | | 5.875 | | 02/01/29 | | | 50 | | | | 47,806 | |
See Notes to Financial Statements.
PGIM Fixed Income ETFs 153
PGIM Total Return Bond ETF
Schedule of Investments (continued)
as of August 31, 2022
| | | | | | | | | | | | |
| | | | |
| Description | | Interest
Rate | | Maturity
Date | | Principal
Amount (000)# | | | Value | |
| | | | |
CORPORATE BONDS (Continued) | | | | | | | | | | | | |
| | | | |
Oil & Gas (cont’d.) | | | | | | | | | | | | |
| | | | |
Continental Resources, Inc., | | | | | | | | | | | | |
Gtd. Notes | | 4.500% | | 04/15/23 | | | 250 | | | $ | 249,975 | |
Devon Energy Corp., | | | | | | | | | | | | |
Sr. Unsec’d. Notes | | 5.875 | | 06/15/28 | | | 145 | | | | 147,739 | |
Ecopetrol SA (Colombia), | | | | | | | | | | | | |
Sr. Unsec’d. Notes | | 6.875 | | 04/29/30 | | | 30 | | | | 27,806 | |
Endeavor Energy Resources LP/EER Finance, Inc., | | | | | | | | | | | | |
Sr. Unsec’d. Notes, 144A | | 5.750 | | 01/30/28 | | | 75 | | | | 74,119 | |
Energean Israel Finance Ltd. (Israel), | | | | | | | | | | | | |
Sr. Sec’d. Notes, 144A | | 4.500 | | 03/30/24 | | | 30 | | | | 28,856 | |
Sr. Sec’d. Notes, 144A | | 4.875 | | 03/30/26 | | | 90 | | | | 83,025 | |
Sr. Sec’d. Notes, 144A | | 5.375 | | 03/30/28 | | | 40 | | | | 35,900 | |
Helmerich & Payne, Inc., | | | | | | | | | | | | |
Sr. Unsec’d. Notes | | 2.900 | | 09/29/31 | | | 100 | | | | 84,557 | |
Hilcorp Energy I LP/Hilcorp Finance Co., | | | | | | | | | | | | |
Sr. Unsec’d. Notes, 144A | | 6.000 | | 04/15/30 | | | 25 | | | | 23,062 | |
Sr. Unsec’d. Notes, 144A | | 6.250 | | 04/15/32 | | | 25 | | | | 22,484 | |
Petroleos Mexicanos (Mexico), | | | | | | | | | | | | |
Gtd. Notes | | 4.750 | | 02/26/29 | | EUR | 100 | | | | 79,391 | |
Gtd. Notes | | 5.350 | | 02/12/28 | | | 100 | | | | 81,260 | |
Gtd. Notes | | 6.500 | | 03/13/27 | | | 200 | | | | 176,160 | |
Gtd. Notes | | 6.500 | | 01/23/29 | | | 100 | | | | 82,790 | |
Gtd. Notes, EMTN | | 4.875 | | 02/21/28 | | EUR | 130 | | | | 108,435 | |
Pioneer Natural Resources Co., | | | | | | | | | | | | |
Sr. Unsec’d. Notes | | 2.150 | | 01/15/31 | | | 190 | | | | 156,407 | |
Var Energi ASA (Norway), | | | | | | | | | | | | |
Sr. Unsec’d. Notes, 144A | | 5.000 | | 05/18/27 | | | 200 | | | | 195,915 | |
| | | | | | | | | | | | |
| | | | |
| | | | | | | | | | | 2,166,989 | |
| | | | |
Packaging & Containers 0.5% | | | | | | | | | | | | |
| | | | |
AptarGroup, Inc., | | | | | | | | | | | | |
Sr. Unsec’d. Notes | | 3.600 | | 03/15/32 | | | 215 | | | | 187,232 | |
Graphic Packaging International LLC, | | | | | | | | | | | | |
Gtd. Notes | | 4.125 | | 08/15/24 | | | 50 | | | | 49,020 | |
See Notes to Financial Statements.
154
PGIM Total Return Bond ETF
Schedule of Investments (continued)
as of August 31, 2022
| | | | | | | | | | | | |
| | | | |
| Description | | Interest
Rate | | Maturity
Date | | Principal
Amount (000)# | | | Value | |
| | | | |
CORPORATE BONDS (Continued) | | | | | | | | | | | | |
| | | | |
Packaging & Containers (cont’d.) | | | | | | | | | | | | |
| | | | |
Pactiv Evergreen Group Issuer LLC/Pactiv Evergreen Group Issuer, Inc., | | | | | | | | | | | | |
Sr. Sec’d. Notes, 144A | | 4.375% | | 10/15/28 | | | 50 | | | $ | 44,056 | |
Verallia SA (France), | | | | | | | | | | | | |
Gtd. Notes | | 1.625 | | 05/14/28 | | EUR | 200 | | | | 174,149 | |
| | | | | | | | | | | | |
| | | | |
| | | | | | | | | | | 454,457 | |
| | | | |
Pharmaceuticals 1.5% | | | | | | | | | | | | |
| | | | |
AbbVie, Inc., | | | | | | | | | | | | |
Sr. Unsec’d. Notes | | 4.050 | | 11/21/39 | | | 405 | | | | 357,162 | |
Bausch Health Cos., Inc., | | | | | | | | | | | | |
Gtd. Notes, 144A | | 6.250 | | 02/15/29 | | | 50 | | | | 18,750 | |
Cigna Corp., | | | | | | | | | | | | |
Sr. Unsec’d. Notes | | 3.200 | | 03/15/40 | | | 360 | | | | 283,372 | |
CVS Health Corp., | | | | | | | | | | | | |
Sr. Unsec’d. Notes | | 2.700 | | 08/21/40 | | | 195 | | | | 139,946 | |
Merck & Co., Inc., | | | | | | | | | | | | |
Sr. Unsec’d. Notes | | 2.900 | | 12/10/61 | | | 190 | | | | 132,046 | |
Shire Acquisitions Investments Ireland DAC, | | | | | | | | | | | | |
Gtd. Notes | | 3.200 | | 09/23/26 | | | 340 | | | | 323,691 | |
Viatris, Inc., | | | | | | | | | | | | |
Gtd. Notes | | 3.850 | | 06/22/40 | | | 190 | | | | 131,900 | |
| | | | | | | | | | | | |
| | | | |
| | | | | | | | | | | 1,386,867 | |
| | | | |
Pipelines 2.1% | | | | | | | | | | | | |
| | | | |
Antero Midstream Partners LP/Antero Midstream Finance Corp., | | | | | | | | | | | | |
Gtd. Notes, 144A | | 7.875 | | 05/15/26 | | | 150 | | | | 152,760 | |
Energy Transfer LP, | | | | | | | | | | | | |
Jr. Sub. Notes, Series G | | 7.125(ff) | | 05/15/30(oo) | | | 85 | | | | 77,656 | |
Sr. Unsec’d. Notes | | 5.400 | | 10/01/47 | | | 430 | | | | 382,692 | |
EQM Midstream Partners LP, | | | | | | | | | | | | |
Sr. Unsec’d. Notes, 144A | | 7.500 | | 06/01/27 | | | 25 | | | | 24,749 | |
Sr. Unsec’d. Notes, 144A | | 7.500 | | 06/01/30 | | | 25 | | | | 24,827 | |
Kinder Morgan, Inc., | | | | | | | | | | | | |
Gtd. Notes | | 5.450 | | 08/01/52 | | | 210 | | | | 204,011 | |
MPLX LP, | | | | | | | | | | | | |
Sr. Unsec’d. Notes | | 4.950 | | 03/14/52 | | | 80 | | | | 70,452 | |
See Notes to Financial Statements.
PGIM Fixed Income ETFs 155
PGIM Total Return Bond ETF
Schedule of Investments (continued)
as of August 31, 2022
| | | | | | | | | | | | |
| | | | |
| Description | | Interest
Rate | | Maturity
Date | | Principal
Amount (000)# | | | Value | |
| | | | |
CORPORATE BONDS (Continued) | | | | | | | | | | | | |
| | | | |
Pipelines (cont’d.) | | | | | | | | | | | | |
| | | | |
MPLX LP, (cont’d.) | | | | | | | | | | | | |
Sr. Unsec’d. Notes | | 5.200% | | 03/01/47 | | | 155 | | | $ | 140,657 | |
ONEOK, Inc., | | | | | | | | | | | | |
Gtd. Notes | | 4.450 | | 09/01/49 | | | 230 | | | | 183,333 | |
Gtd. Notes | | 5.200 | | 07/15/48 | | | 100 | | | | 89,832 | |
Plains All American Pipeline LP/PAA Finance Corp., | | | | | | | | | | | | |
Sr. Unsec’d. Notes | | 5.150 | | 06/01/42 | | | 90 | | | | 75,285 | |
Tallgrass Energy Partners LP/Tallgrass Energy Finance Corp., | | | | | | | | | | | | |
Gtd. Notes, 144A | | 5.500 | | 01/15/28 | | | 75 | | | | 64,423 | |
Targa Resources Corp., | | | | | | | | | | | | |
Gtd. Notes | | 4.200 | | 02/01/33 | | | 60 | | | | 53,940 | |
Williams Cos., Inc. (The), | | | | | | | | | | | | |
Sr. Unsec’d. Notes | | 2.600 | | 03/15/31 | | | 325 | | | | 271,422 | |
Sr. Unsec’d. Notes | | 5.300 | | 08/15/52 | | | 225 | | | | 219,325 | |
| | | | | | | | | | | | |
| | | | |
| | | | | | | | | | | 2,035,364 | |
| | | | |
Real Estate 0.1% | | | | | | | | | | | | |
| | | | |
Greystar Real Estate Partners LLC, | | | | | | | | | | | | |
Sr. Sec’d. Notes, 144A | | 5.750 | | 12/01/25 | | | 30 | | | | 29,722 | |
Howard Hughes Corp. (The), | | | | | | | | | | | | |
Gtd. Notes, 144A | | 4.375 | | 02/01/31 | | | 50 | | | | 40,027 | |
| | | | | | | | | | | | |
| | | | |
| | | | | | | | | | | 69,749 | |
| | | | |
Real Estate Investment Trusts (REITs) 2.6% | | | | | | | | | | | | |
| | | | |
Brixmor Operating Partnership LP, | | | | | | | | | | | | |
Sr. Unsec’d. Notes | | 4.050 | | 07/01/30 | | | 215 | | | | 191,294 | |
Corporate Office Properties LP, | | | | | | | | | | | | |
Gtd. Notes | | 2.750 | | 04/15/31 | | | 175 | | | | 137,650 | |
Diversified Healthcare Trust, | | | | | | | | | | | | |
Gtd. Notes | | 4.375 | | 03/01/31 | | | 75 | | | | 51,452 | |
Extra Space Storage LP, | | | | | | | | | | | | |
Gtd. Notes | | 3.900 | | 04/01/29 | | | 205 | | | | 190,562 | |
GLP Capital LP/GLP Financing II, Inc., | | | | | | | | | | | | |
Gtd. Notes | | 3.250 | | 01/15/32 | | | 85 | | | | 68,799 | |
Kimco Realty Corp., | | | | | | | | | | | | |
Sr. Unsec’d. Notes | | 4.600 | | 02/01/33 | | | 135 | | | | 130,535 | |
See Notes to Financial Statements.
156
PGIM Total Return Bond ETF
Schedule of Investments (continued)
as of August 31, 2022
| | | | | | | | | | | | |
| | | | |
| Description | | Interest
Rate | | Maturity
Date | | Principal
Amount (000)# | | | Value | |
| | | | |
CORPORATE BONDS (Continued) | | | | | | | | | | | | |
| | | | |
Real Estate Investment Trusts (REITs) (cont’d.) | | | | | | | | | | | | |
| | | | |
MPT Operating Partnership LP/MPT Finance Corp., | | | | | | | | | | | | |
Gtd. Notes | | 5.000% | | 10/15/27 | | | 175 | | | $ | 158,158 | |
Spirit Realty LP, | | | | | | | | | | | | |
Gtd. Notes | | 2.700 | | 02/15/32 | | | 205 | | | | 158,929 | |
Sun Communities Operating LP, | | | | | | | | | | | | |
Gtd. Notes | | 2.300 | | 11/01/28 | | | 235 | | | | 198,590 | |
Gtd. Notes | | 4.200 | | 04/15/32 | | | 120 | | | | 107,216 | |
Uniti Group LP/Uniti Fiber Holdings, Inc./CSL Capital LLC, | | | | | | | | | | | | |
Sr. Sec’d. Notes, 144A | | 7.875 | | 02/15/25 | | | 775 | | | | 767,810 | |
VICI Properties LP, | | | | | | | | | | | | |
Sr. Unsec’d. Notes | | 4.750 | | 02/15/28 | | | 90 | | | | 86,485 | |
Welltower, Inc., | | | | | | | | | | | | |
Sr. Unsec’d. Notes | | 4.250 | | 04/15/28 | | | 260 | | | | 252,929 | |
| | | | | | | | | | | | |
| | | | |
| | | | | | | | | | | 2,500,409 | |
| | | | |
Retail 0.5% | | | | | | | | | | | | |
| | | | |
1011778 BC ULC/New Red Finance, Inc. (Canada), | | | | | | | | | | | | |
Sr. Sec’d. Notes, 144A | | 3.500 | | 02/15/29 | | | 25 | | | | 21,437 | |
eG Global Finance PLC (United Kingdom), | | | | | | | | | | | | |
Sr. Sec’d. Notes | | 6.250 | | 10/30/25 | | EUR | 231 | | | | 216,322 | |
Gap, Inc. (The), | | | | | | | | | | | | |
Gtd. Notes, 144A | | 3.875 | | 10/01/31 | | | 50 | | | | 34,710 | |
O’Reilly Automotive, Inc., | | | | | | | | | | | | |
Sr. Unsec’d. Notes | | 4.700 | | 06/15/32 | | | 125 | | | | 123,773 | |
Sally Holdings LLC/Sally Capital, Inc., | | | | | | | | | | | | |
Gtd. Notes | | 5.625 | | 12/01/25 | | | 75 | | | | 72,898 | |
Suburban Propane Partners LP/Suburban Energy Finance Corp., | | | | | | | | | | | | |
Sr. Unsec’d. Notes, 144A | | 5.000 | | 06/01/31 | | | 50 | | | | 44,213 | |
| | | | | | | | | | | | |
| | | | |
| | | | | | | | | | | 513,353 | |
| | | | |
Semiconductors 0.3% | | | | | | | | | | | | |
| | | | |
Broadcom, Inc., | | | | | | | | | | | | |
Sr. Unsec’d. Notes, 144A | | 3.137 | | 11/15/35 | | | 315 | | | | 238,809 | |
See Notes to Financial Statements.
PGIM Fixed Income ETFs 157
PGIM Total Return Bond ETF
Schedule of Investments (continued)
as of August 31, 2022
| | | | | | | | | | | | | | | | |
| | | | |
| Description | | Interest
Rate | | | Maturity
Date | | | Principal
Amount (000)# | | | Value | |
| | | | |
CORPORATE BONDS (Continued) | | | | | | | | | | | | | | | | |
| | | | |
Telecommunications 1.3% | | | | | | | | | | | | | | | | |
| | | | |
AT&T, Inc., | | | | | | | | | | | | | | | | |
Sr. Unsec’d. Notes | | | 3.550% | | | | 09/15/55 | | | | 415 | | | $ | 303,215 | |
T-Mobile USA, Inc., | | | | | | | | | | | | | | | | |
Sr. Unsec’d. Notes | | | 2.550 | | | | 02/15/31 | | | | 685 | | | | 570,688 | |
Verizon Communications, Inc., | | | | | | | | | | | | | | | | |
Sr. Unsec’d. Notes | | | 4.016 | | | | 12/03/29 | | | | 355 | | | | 340,557 | |
| | | | | | | | | | | | | | | | |
| | | | |
| | | | | | | | | | | | | | | 1,214,460 | |
| | | | |
Transportation 0.0% | | | | | | | | | | | | | | | | |
| | | | |
Burlington Northern Santa Fe LLC, | | | | | | | | | | | | | | | | |
Sr. Unsec’d. Notes | | | 4.450 | | | | 01/15/53 | | | | 20 | | | | 19,344 | |
| | | | | | | | | | | | | | | | |
| | | | |
TOTAL CORPORATE BONDS
(cost $40,048,143) | | | | | | | | | | | | | | | 35,822,736 | |
| | | | | | | | | | | | | | | | |
| | | | |
MUNICIPAL BONDS 0.2% | | | | | | | | | | | | | | | | |
| | | | |
Michigan 0.1% | | | | | | | | | | | | | | | | |
| | | | |
Michigan State University, | | | | | | | | | | | | | | | | |
Taxable, Revenue Bonds, Series A | | | 4.165 | | | | 08/15/2122 | | | | 45 | | | | 36,729 | |
University of Michigan, | | | | | | | | | | | | | | | | |
Taxable, Revenue Bonds, Series A | | | 4.454 | | | | 04/01/2122 | | | | 100 | | | | 89,306 | |
| | | | | | | | | | | | | | | | |
| | | | | | | | | | | | | | | 126,035 | |
| | | | |
Minnesota 0.1% | | | | | | | | | | | | | | | | |
| | | | |
University of Minnesota, | | | | | | | | | | | | | | | | |
Taxable, Revenue Bonds | | | 4.048 | | | | 04/01/52 | | | | 95 | | | | 89,767 | |
| | | | | | | | | | | | | | | | |
| | | | |
TOTAL MUNICIPAL BONDS
(cost $240,000) | | | | | | | | | | | | | | | 215,802 | |
| | | | | | | | | | | | | | | | |
| | | | |
RESIDENTIAL MORTGAGE-BACKED SECURITIES 0.5% | | | | | | | | | | | | | | | | |
| | | | |
Bellemeade Re Ltd.,
Series 2019-02A, Class M2, 144A, 1 Month LIBOR + 3.100% (Cap N/A, Floor 3.100%) | | | 5.544(c) | | | | 04/25/29 | | | | 200 | | | | 196,611 | |
Citigroup Mortgage Loan Trust, | | | | | | | | | | | | | | | | |
Series 2022-A, Class A1, 144A | | | 6.170 | | | | 09/25/62 | | | | 100 | | | | 99,823 | |
See Notes to Financial Statements.
158
PGIM Total Return Bond ETF
Schedule of Investments (continued)
as of August 31, 2022
| | | | | | | | | | | | | | | | |
| | | | |
| Description | | Interest
Rate | | | Maturity
Date | | | Principal
Amount (000)# | | | Value | |
| | | | |
RESIDENTIAL MORTGAGE-BACKED SECURITIES (Continued) | | | | | | | | | | | | | | | | |
| | | | |
Connecticut Avenue Securities Trust,
Series 2022-R03, Class 1B1, 144A, 30 Day Average SOFR + 6.250% (Cap N/A, Floor 0.000%) | | | 8.433%(c) | | | | 03/25/42 | | | | 15 | | | $ | 15,432 | |
Series 2022-R04, Class 1B1, 144A, 30 Day Average SOFR + 5.250% (Cap N/A, Floor 0.000%) | | | 7.433(c) | | | | 03/25/42 | | | | 20 | | | | 19,900 | |
FHLMC Structured Agency Credit Risk REMIC Trust, | | | | | | | | | | | | | | | | |
Series 2022-DNA03, Class M1B, 144A, 30 Day Average SOFR + 2.900% (Cap N/A, Floor 0.000%) | | | 5.083(c) | | | | 04/25/42 | | | | 110 | | | | 109,351 | |
| | | | | | | | | | | | | | | | |
| | | | |
TOTAL RESIDENTIAL MORTGAGE-BACKED SECURITIES
(cost $446,556) | | | | | | | | | | | | | | | 441,117 | |
| | | | | | | | | | | | | | | | |
| | | | |
SOVEREIGN BONDS 0.9% | | | | | | | | | | | | | | | | |
| | | | |
Brazil Minas SPE via State of Minas Gerais (Brazil),
Gov’t. Gtd. Notes | | | 5.333 | | | | 02/15/28 | | | | 120 | | | | 117,135 | |
Dominican Republic International Bond (Dominican Republic), | | | | | | | | | | | | | | | | |
Sr. Unsec’d. Notes, 144A | | | 5.500 | | | | 02/22/29 | | | | 150 | | | | 136,481 | |
Indonesia Government International Bond (Indonesia), | | | | | | | | | | | | | | | | |
Sr. Unsec’d. Notes | | | 0.900 | | | | 02/14/27 | | | EUR | 150 | | | | 135,886 | |
Sr. Unsec’d. Notes | | | 1.100 | | | | 03/12/33 | | | EUR | 100 | | | | 74,367 | |
Romanian Government International Bond (Romania), | | | | | | | | | | | | | | | | |
Sr. Unsec’d. Notes, EMTN | | | 1.750 | | | | 07/13/30 | | | EUR | 160 | | | | 115,449 | |
Serbia International Bond (Serbia), | | | | | | | | | | | | | | | | |
Sr. Unsec’d. Notes | | | 3.125 | | | | 05/15/27 | | | EUR | 300 | | | | 260,409 | |
Ukraine Government International Bond (Ukraine), | | | | | | | | | | | | | | | | |
Sr. Unsec’d. Notes | | | 7.750 | | | | 09/01/26(d) | | | | 100 | | | | 20,250 | |
| | | | | | | | | | | | | | | | |
| | | | |
TOTAL SOVEREIGN BONDS
(cost $1,113,770) | | | | | | | | | | | | | | | 859,977 | |
| | | | | | | | | | | | | | | | |
| | | | |
U.S. GOVERNMENT AGENCY OBLIGATIONS 10.6% | | | | | | | | | | | | | | | | |
| | | | |
Federal Home Loan Mortgage Corp. | | | 2.500 | | | | 03/01/51 | | | | 624 | | | | 559,153 | |
Federal Home Loan Mortgage Corp. | | | 3.000 | | | | 01/01/52 | | | | 494 | | | | 457,741 | |
Federal Home Loan Mortgage Corp. | | | 3.000 | | | | 02/01/52 | | | | 487 | | | | 451,286 | |
Federal National Mortgage Assoc. | | | 2.000 | | | | 11/01/50 | | | | 443 | | | | 383,035 | |
Federal National Mortgage Assoc. | | | 2.000 | | | | 08/01/51 | | | | 250 | | | | 214,887 | |
See Notes to Financial Statements.
PGIM Fixed Income ETFs 159
PGIM Total Return Bond ETF
Schedule of Investments (continued)
as of August 31, 2022
| | | | | | | | | | | | | | | | |
| | | | |
| Description | | Interest
Rate | | | Maturity
Date | | | Principal
Amount
(000)# | | | Value | |
| | | | |
U.S. GOVERNMENT AGENCY OBLIGATIONS(Continued) | | | | | | | | | | | | | | | | |
Federal National Mortgage Assoc. | | | 2.000% | | | | 11/01/51 | | | | 275 | | | $ | 237,014 | |
Federal National Mortgage Assoc. | | | 2.500 | | | | TBA | | | | 500 | | | | 446,223 | |
Federal National Mortgage Assoc. | | | 3.000 | | | | 12/01/51 | | | | 490 | | | | 453,953 | |
Federal National Mortgage Assoc. | | | 3.000 | | | | 03/01/52 | | | | 488 | | | | 452,589 | |
Federal National Mortgage Assoc. | | | 3.500 | | | | 02/01/52 | | | | 971 | | | | 926,412 | |
Federal National Mortgage Assoc. | | | 4.000 | | | | TBA | | | | 1,000 | | | | 976,016 | |
Federal National Mortgage Assoc. | | | 4.000 | | | | 05/01/52 | | | | 1,229 | | | | 1,201,254 | |
Federal National Mortgage Assoc. | | | 4.500 | | | | TBA | | | | 1,500 | | | | 1,488,809 | |
Federal National Mortgage Assoc. | | | 4.500 | | | | 06/01/52 | | | | 491 | | | | 489,079 | |
Federal National Mortgage Assoc. | | | 5.000 | | | | 06/01/52 | | | | 247 | | | | 249,410 | |
Federal National Mortgage Assoc. | | | 5.000 | | | | 07/01/52 | | | | 501 | | | | 506,031 | |
Government National Mortgage Assoc. | | | 3.000 | | | | 08/20/51 | | | | 720 | | | | 679,067 | |
| | | | | | | | | | | | | | | | |
| | | | |
TOTAL U.S. GOVERNMENT AGENCY OBLIGATIONS
(cost $10,308,296) | | | | | | | | | | | | | | | 10,171,959 | |
| | | | | | | | | | | | | | | | |
| | | | |
U.S. TREASURY OBLIGATIONS 21.2% | | | | | | | | | | | | | | | | |
U.S. Treasury Bonds | | | 1.250 | | | | 05/15/50 | | | | 280 | | | | 173,163 | |
U.S. Treasury Bonds | | | 2.000 | | | | 11/15/41 | | | | 2,830 | | | | 2,198,556 | |
U.S. Treasury Bonds | | | 2.375 | | | | 02/15/42 | | | | 4,335 | | | | 3,595,341 | |
U.S. Treasury Bonds | | | 2.375 | | | | 05/15/51 | | | | 510 | | | | 420,033 | |
U.S. Treasury Bonds | | | 2.500 | | | | 05/15/46 | | | | 1,540 | | | | 1,268,816 | |
U.S. Treasury Bonds | | | 2.875 | | | | 05/15/52 | | | | 260 | | | | 239,769 | |
U.S. Treasury Notes | | | 0.375 | | | | 01/31/26 | | | | 2,415 | | | | 2,174,066 | |
U.S. Treasury Notes | | | 0.750 | | | | 03/31/26 | | | | 6,615 | | | | 6,010,864 | |
U.S. Treasury Notes(k) | | | 1.250 | | | | 11/30/26 | | | | 160 | | | | 146,400 | |
U.S. Treasury Notes(k) | | | 1.250 | | | | 12/31/26 | | | | 2,620 | | | | 2,394,025 | |
U.S. Treasury Notes | | | 2.625 | | | | 07/31/29 | | | | 460 | | | | 441,025 | |
U.S. Treasury Notes | | | 2.750 | | | | 08/15/32 | | | | 240 | | | | 231,600 | |
U.S. Treasury Strips Coupon(k) | | | 2.438(s) | | | | 11/15/41 | | | | 1,880 | | | | 921,934 | |
| | | | | | | | | | | | | | | | |
| | | | |
TOTAL U.S. TREASURY OBLIGATIONS
(cost $22,107,139) | | | | | | | | | | | | | | | 20,215,592 | |
| | | | | | | | | | | | | | | | |
| | | | |
TOTAL LONG-TERM INVESTMENTS
(cost $102,223,790) | | | | | | | | | | | | | | | 94,693,556 | |
| | | | | | | | | | | | | | | | |
See Notes to Financial Statements.
160
PGIM Total Return Bond ETF
Schedule of Investments (continued)
as of August 31, 2022
| | | | | | | | |
| | |
| Description | | Shares | | | Value | |
| | |
SHORT-TERM INVESTMENT 3.9% | | | | | | | | |
| | |
UNAFFILIATED FUND | | | | | | | | |
Dreyfus Government Cash Management (Institutional Shares)
(cost $3,717,068) | | | 3,717,068 | | | $ | 3,717,068 | |
| | | | | | | | |
| | |
TOTAL INVESTMENTS 103.0% | | | | | | | | |
(cost $105,940,858) | | | | | | | 98,410,624 | |
Liabilities in excess of other assets(z) (3.0)% | | | | | | | (2,871,199 | ) |
| | | | | | | | |
| | |
NET ASSETS 100.0% | | | | | | $ | 95,539,425 | |
| | | | | | | | |
See the Glossary for a list of the abbreviation(s) used in the annual report.
| # | Principal or notional amount is shown in U.S. dollars unless otherwise stated. |
| (c) | Variable rate instrument. The interest rate shown reflects the rate in effect at August 31, 2022. |
| (cc) | Variable rate instrument. The rate shown is based on the latest available information as of August 31, 2022. Certain variable rate securities are not based on a published reference rate and spread but are determined by the issuer or agent and are based on current market conditions. These securities do not indicate a reference rate and spread in their description. |
| (d) | Represents issuer in default on interest payments and/or principal repayment. Non-income producing security. Such securities may be post-maturity. |
| (f) | Indicates a restricted security that is acquired in unregistered, private sales from the issuing company or from an affiliate of the issuer and is considered restricted as to disposition under federal securities law; the aggregate original cost of such securities is $990,500. The aggregate value of $983,529 is 1.0% of net assets. |
| (ff) | Variable rate security. Security may be issued at a fixed coupon rate, which converts to a variable rate at a specified date. Rate shown is the rate in effect as of period end. |
| (k) | Represents security, or a portion thereof, segregated as collateral for centrally cleared/exchange-traded derivatives. |
| (oo) | Perpetual security. Maturity date represents next call date. |
| (s) | Represents zero coupon bond or principal only security. Rate represents yield to maturity at purchase date. |
| (z) | Includes net unrealized appreciation/(depreciation) and/or market value of the below holdings which are excluded from the Schedule of Investments: |
Futures contracts outstanding at August 31, 2022:
| | | | | | | | | | | | | | | | | |
Number of
Contracts | | Type | | Expiration
Date | | Current
Notional
Amount | | Value /
Unrealized
Appreciation
(Depreciation) |
| | | |
Long Positions: | | | | | | | | | | | | | | | |
80 | | 2 Year U.S. Treasury Notes | | | | Dec. 2022 | | | | $ | 16,666,250 | | | | $ | (35,090 | ) |
26 | | 5 Year U.S. Treasury Notes | | | | Dec. 2022 | | | | | 2,881,328 | | | | | (10,015 | ) |
41 | | 10 Year U.S. Treasury Notes | | | | Dec. 2022 | | | | | 4,793,156 | | | | | (26,414 | ) |
19 | | 30 Year U.S. Ultra Treasury Bonds | | | | Dec. 2022 | | | | | 2,840,500 | | | | | (17,258 | ) |
| | | | | | | | | | | | | | | | | |
| | | | | | | | | | | | | | | | (88,777 | ) |
| | | | | | | | | | | | | | | | | |
See Notes to Financial Statements.
PGIM Fixed Income ETFs 161
PGIM Total Return Bond ETF
Schedule of Investments (continued)
as of August 31, 2022
Futures contracts outstanding at August 31, 2022 (continued):
| | | | | | | | | | | | | | | | | |
Number of Contracts | | Type | | Expiration
Date | | Current Notional Amount | | Value /
Unrealized
Appreciation
(Depreciation) |
| | | |
Short Positions: | | | | | | | | | | | | | | | |
5 | | 5 Year Euro-Bobl | | | | Sep. 2022 | | | | $ | 615,400 | | | | $ | 11,705 | |
4 | | 10 Year Euro-Bund | | | | Sep. 2022 | | | | | 591,880 | | | | | 16,284 | |
4 | | 20 Year U.S. Treasury Bonds | | | | Dec. 2022 | | | | | 543,375 | | | | | 2,872 | |
1 | | Euro Schatz Index | | | | Sep. 2022 | | | | | 108,610 | | | | | 789 | |
| | | | | | | | | | | | | | | | | |
| | | | | | | | | | | | | | | | 31,650 | |
| | | | | | | | | | | | | | | | | |
| | | | | | | | | | | | | | | $ | (57,127 | ) |
| | | | | | | | | | | | | | | | | |
Forward foreign currency exchange contracts outstanding at August 31, 2022:
| | | | | | | | | | | | | | | | | | | | | | | | | | | | | | | | |
Purchase
Contracts | | Counterparty | | Notional
Amount
(000) | | Value at Settlement Date | | Current Value | | Unrealized
Appreciation | | Unrealized
Depreciation |
OTC Forward Foreign Currency Exchange Contracts: | | | | | | | | | | | | | | | | | | | | | | | | | | | | | | |
British Pound,
Expiring 09/02/22 | | Morgan Stanley & Co. International PLC | | | | GBP | | | | | 535 | | | | $ | 632,541 | | | | $ | 621,847 | | | | $ | — | | | | $ | (10,694 | ) |
Euro,
Expiring 09/02/22 | | BNP Paribas S.A. | | | | EUR | | | | | 3,014 | | | | | 3,006,004 | | | | | 3,029,337 | | | | | 23,333 | | | | | — | |
| | | | | | | | | | | | | | | | | | | | | | | | | | | | | | | | |
| | | | | | | | | | | | | | | $ | 3,638,545 | | | | $ | 3,651,184 | | | | | 23,333 | | | | | (10,694 | ) |
| | | | | | | | | | | | | | | | | | | | | | | | | | | | | | | | |
| | | | | | |
Sale Contracts | | Counterparty | | Notional
Amount
(000) | | Value at Settlement Date | | Current Value | | Unrealized
Appreciation | | Unrealized
Depreciation |
OTC Forward Foreign Currency Exchange Contracts: | | | | | | | | | | | | | | | | | | | | | | | | | | | | | | |
British Pound,
Expiring 09/02/22 | | The Toronto-Dominion Bank | | | | GBP | | | | | 535 | | | | $ | 646,611 | | | | $ | 621,847 | | | | $ | 24,764 | | | | $ | — | |
Expiring 10/04/22 | | Morgan Stanley & Co. International PLC | | | | GBP | | | | | 535 | | | | | 632,918 | | | | | 622,268 | | | | | 10,650 | | | | | — | |
Euro,
Expiring 09/02/22 | | BNP Paribas S.A. | | | | EUR | | | | | 2,944 | | | | | 3,021,148 | | | | | 2,958,658 | | | | | 62,490 | | | | | — | |
Expiring 09/02/22 | | The Toronto-Dominion Bank | | | | EUR | | | | | 70 | | | | | 71,542 | | | | | 70,678 | | | | | 864 | | | | | — | |
Expiring 10/04/22 | | BNP Paribas S.A. | | | | EUR | | | | | 3,014 | | | | | 3,012,555 | | | | | 3,036,341 | | | | | — | | | | | (23,786 | ) |
Expiring 10/04/22 | | Morgan Stanley & Co. International PLC | | | | EUR | | | | | 132 | | | | | 133,133 | | | | | 133,086 | | | | | 47 | | | | | — | |
| | | | | | | | | | | | | | | | | | | | | | | | | | | | | | | | |
| | | | | | | | | | | | | | | $ | 7,517,907 | | | | $ | 7,442,878 | | | | | 98,815 | | | | | (23,786 | ) |
| | | | | | | | | | | | | | | | | | | | | | | | | | | | | | | | |
| | | | | | | | | | | | | | | | | | | | | | | | | $ | 122,148 | | | | $ | (34,480 | ) |
| | | | | | | | | | | | | | | | | | | | | | | | | | | | | | | | |
See Notes to Financial Statements.
162
PGIM Total Return Bond ETF
Schedule of Investments (continued)
as of August 31, 2022
Credit default swap agreements outstanding at August 31, 2022:
| | | | | | | | | | | | | | | | | | | | | | | | | | | | | | | | | | | | | | | | | | | | | | | | | |
Reference
Entity/
Obligation | | | | Termination
Date | | | | Fixed
Rate | | | | Notional
Amount
(000)#(3) | | | | Implied Credit
Spread at
August 31,
2022(4) | | | | Value at
Trade Date | | | | Value at
August 31,
2022 | | | | Unrealized
Appreciation
(Depreciation) |
| | | | | | | | | | | | | | | | | | | | | | | | | | | | | |
Centrally Cleared Credit Default Swap Agreements on credit indices - Sell Protection(2): | | | | | | | | | | | | | | | | | | | | | | |
CDX.NA.HY.37.V2 | | | | | | 12/20/26 | | | | | | | 5.000 | %(Q) | | | | | | 1,733 | | | | | | | 4.973% | | | | | | $ | 89,331 | | | | | | $ | 19,196 | | | | | | $ | (70,135 | ) |
CDX.NA.HY.38.V2 | | | | | | 06/20/27 | | | | | | | 5.000 | %(Q) | | | | | | 1,238 | | | | | | | 5.325% | | | | | | | (32,148 | ) | | | | | | (2,616 | ) | | | | | | 29,532 | |
| | | | | | | | | | | | | | | | | | | | | | | | | | | | | | | | | | | | | | | | | | | | | | | | | |
| | | | | | | | | | | | | | | | | | | | | | | | | | | | | | | | | $ | 57,183 | | | | | | $ | 16,580 | | | | | | $ | (40,603 | ) |
| | | | | | | | | | | | | | | | | | | | | | | | | | | | | | | | | | | | | | | | | | | | | | | | | |
The Fund entered into credit default swaps (“CDS”) to provide a measure of protection against defaults or to take an active long or short position with respect to the likelihood of a particular issuer’s default or the reference entity’s credit soundness. CDS contracts generally trade based on a spread which represents the cost a protection buyer has to pay the protection seller. The protection buyer is said to be short the credit as the value of the contract rises the more the credit deteriorates. The value of the CDS contract increases for the protection buyer if the spread increases.
| (1) | If the Fund is a buyer of protection, it pays the fixed rate. When a credit event occurs, as defined under the terms of that particular swap agreement, the Fund will either (i) receive from the seller of protection an amount equal to the notional amount of the swap and make delivery of the referenced obligation or underlying securities comprising the referenced index or (ii) receive a net settlement amount in the form of cash or securities equal to the notional amount of the swap less the recovery value of the referenced obligation or underlying securities comprising the referenced index. |
| (2) | If the Fund is a seller of protection, it receives the fixed rate. When a credit event occurs, as defined under the terms of that particular swap agreement, the Fund will either (i) pay to the buyer of protection an amount equal to the notional amount of the swap and take delivery of the referenced obligation or underlying securities comprising the referenced index or (ii) pay a net settlement amount in the form of cash or securities equal to the notional amount of the swap less the recovery value of the referenced obligation or underlying securities comprising the referenced index. |
| (3) | Notional amount represents the maximum potential amount the Fund could be required to pay as a seller of credit protection or receive as a buyer of credit protection if a credit event occurs as defined under the terms of that particular swap agreement. |
| (4) | Implied credit spreads, represented in absolute terms, utilized in determining the fair value of credit default swap agreements where the Fund is the seller of protection as of the reporting date serve as an indicator of the current status of the payment/ performance risk and represent the likelihood of risk of default for the credit derivative. The implied credit spread of a particular referenced entity reflects the cost of buying/selling protection and may include up-front payments required to be made to enter into the agreement. Wider credit spreads represent a deterioration of the referenced entity’s credit soundness and a greater likelihood of risk of default or other credit event occurring as defined under the terms of the agreement. |
See Notes to Financial Statements.
PGIM Fixed Income ETFs 163
PGIM Total Return Bond ETF
Schedule of Investments (continued)
as of August 31, 2022
Interest rate swap agreements outstanding at August 31, 2022:
| | | | | | | | | | | | | | | | | | | | | | | | | | | | | | | | | | |
Notional
Amount
(000)# | | | | Termination
Date | | | | | Fixed
Rate | | | | | Floating Rate | | | | Value at
Trade Date | | | | | Value at
August 31,
2022 | | | | | Unrealized
Appreciation
(Depreciation) | |
Centrally Cleared Interest Rate Swap Agreements: | |
GBP 140 | | | | | 05/08/27 | | | | | | 1.050%(A) | | | | | 1 Day SONIA(1)(A) | | | | $ | (1,406 | ) | | | | $ | 16,360 | | | | | $ | 17,766 | |
GBP 120 | | | | | 05/08/32 | | | | | | 1.150%(A) | | | | | 1 Day SONIA(1)(A) | | | | | 7,557 | | | | | | 21,185 | | | | | | 13,628 | |
| | | | | | | | | | | | | | | | | | | | | | | | | | | | | | | | | | |
| | | | | | | | | | | | | | | | | | | | $ | 6,151 | | | | | $ | 37,545 | | | | | $ | 31,394 | |
| | | | | | | | | | | | | | | | | | | | | | | | | | | | | | | | | | |
| (1) | The Fund pays the fixed rate and receives the floating rate. |
| (2) | The Fund pays the floating rate and receives the fixed rate. |
Summary of Collateral for Centrally Cleared/Exchange-traded Derivatives:
Cash and securities segregated as collateral, including pending settlement for closed positions, to cover requirements for centrally cleared/exchange-traded derivatives are listed by broker as follows:
| | | | | | | | | | |
Broker | | Cash and/or Foreign Currency | | Securities Market Value |
Citigroup Global Markets, Inc. | | | $ | — | | | | $ | 434,486 | |
J.P. Morgan Securities LLC | | | | — | | | | | 611,499 | |
| | | | | | | | | | |
Total | | | $ | — | | | | $ | 1,045,985 | |
| | | | | | | | | | |
Fair Value Measurements:
Various inputs are used in determining the value of the Fund’s investments. These inputs are summarized in the three broad levels listed below.
Level 1—unadjusted quoted prices generally in active markets for identical securities.
Level 2—quoted prices for similar securities, interest rates and yield curves, prepayment speeds, foreign currency exchange rates and other observable inputs.
Level 3—unobservable inputs for securities valued in accordance with Board approved fair valuation procedures.
The following is a summary of the inputs used as of August 31, 2022 in valuing such portfolio securities:
| | | | | | | | | | | | | | | |
| | | Level 1 | | Level 2 | | Level 3 |
Investments in Securities | | | | | | | | | | | | | | | |
Assets | | | | | | | | | | | | | | | |
Long-Term Investments | | | | | | | | | | | | | | | |
Asset-Backed Securities | | | | | | | | | | | | | | | |
Automobiles | | | $ | — | | | | $ | 91,182 | | | | $ | — | |
Collateralized Loan Obligations | | | | — | | | | | 18,902,833 | | | | | — | |
Consumer Loans | | | | — | | | | | 529,553 | | | | | — | |
Commercial Mortgage-Backed Securities | | | | — | | | | | 7,442,805 | | | | | — | |
Corporate Bonds. | | | | — | | | | | 35,822,736 | | | | | — | |
Municipal Bonds. | | | | — | | | | | 215,802 | | | | | — | |
See Notes to Financial Statements.
164
PGIM Total Return Bond ETF
Schedule of Investments (continued)
as of August 31, 2022
| | | | | | | | | | | | | | | |
| | | Level 1 | | Level 2 | | Level 3 |
Investments in Securities (continued) | | | | | | | | | | | | | | | |
Assets (continued) | | | | | | | | | | | | | | | |
Long-Term Investments (continued) | | | | | | | | | | | | | | | |
Residential Mortgage-Backed Securities | | | $ | — | | | | $ | 441,117 | | | | $ | — | |
Sovereign Bonds | | | | — | | | | | 859,977 | | | | | — | |
U.S. Government Agency Obligations | | | | — | | | | | 10,171,959 | | | | | — | |
U.S. Treasury Obligations | | | | — | | | | | 20,215,592 | | | | | — | |
Short-Term Investment | | | | | | | | | | | | | | | |
Unaffiliated Fund | | | | 3,717,068 | | | | | — | | | | | — | |
| | | | | | | | | | | | | | | |
Total | | | $ | 3,717,068 | | | | $ | 94,693,556 | | | | $ | — | |
| | | | | | | | | | | | | | | |
| | | |
Other Financial Instruments* | | | | | | | | | | | | | | | |
Assets | | | | | | | | | | | | | | | |
Futures Contracts | | | $ | 31,650 | | | | $ | — | | | | $ | — | |
OTC Forward Foreign Currency Exchange Contracts | | | | — | | | | | 122,148 | | | | | — | |
Centrally Cleared Credit Default Swap Agreement | | | | — | | | | | 29,532 | | | | | — | |
Centrally Cleared Interest Rate Swap Agreements | | | | — | | | | | 31,394 | | | | | — | |
| | | | | | | | | | | | | | | |
Total | | | $ | 31,650 | | | | $ | 183,074 | | | | $ | — | |
| | | | | | | | | | | | | | | |
| | | |
Liabilities | | | | | | | | | | | | | | | |
Futures Contracts | | | $ | (88,777 | ) | | | $ | — | | | | $ | — | |
OTC Forward Foreign Currency Exchange Contracts | | | | — | | | | | (34,480 | ) | | | | — | |
Centrally Cleared Credit Default Swap Agreement | | | | — | | | | | (70,135 | ) | | | | — | |
| | | | | | | | | | | | | | | |
Total | | | $ | (88,777 | ) | | | $ | (104,615 | ) | | | $ | — | |
| | | | | | | | | | | | | | | |
| * | Other financial instruments are derivative instruments not reflected in the Schedule of Investments, such as futures, forwards and centrally cleared swap contracts, which are recorded at the unrealized appreciation (depreciation) on the instrument, and OTC swap contracts which are recorded at fair value. |
Industry Classification:
The industry classification of investments and liabilities in excess of other assets shown as a percentage of net assets as of August 31, 2022 were as follows:
| | | | |
U.S. Treasury Obligations | | | 21.2 | % |
Collateralized Loan Obligations | | | 19.8 | |
Banks | | | 11.1 | |
U.S. Government Agency Obligations | | | 10.6 | |
Commercial Mortgage-Backed Securities | | | 7.8 | |
Unaffiliated Fund | | | 3.9 | |
Real Estate Investment Trusts (REITs) | | | 2.6 | |
Oil & Gas | | | 2.3 | |
| | | | |
Pipelines | | | 2.1 | % |
Media | | | 1.6 | |
Pharmaceuticals | | | 1.5 | |
Electric | | | 1.3 | |
Telecommunications | | | 1.3 | |
Auto Manufacturers | | | 1.1 | |
Healthcare-Services | | | 1.1 | |
Building Materials | | | 1.1 | |
See Notes to Financial Statements.
PGIM Fixed Income ETFs 165
PGIM Total Return Bond ETF
Schedule of Investments (continued)
as of August 31, 2022
Industry Classification (continued):
| | | | |
Mining | | | 0.9 | % |
Sovereign Bonds | | | 0.9 | |
Commercial Services | | | 0.9 | |
Foods | | | 0.8 | |
Insurance | | | 0.8 | |
Diversified Financial Services | | | 0.7 | |
Agriculture | | | 0.6 | |
Chemicals | | | 0.6 | |
Entertainment | | | 0.6 | |
Consumer Loans | | | 0.5 | |
Retail | | | 0.5 | |
Packaging & Containers | | | 0.5 | |
Residential Mortgage-Backed Securities | | | 0.5 | |
Aerospace & Defense | | | 0.4 | |
Home Builders | | | 0.4 | |
Internet | | | 0.3 | |
Semiconductors | | | 0.3 | |
Distribution/Wholesale | | | 0.2 | |
Airlines | | | 0.2 | |
Healthcare-Products | | | 0.2 | |
Municipal Bonds | | | 0.2 | |
Beverages | | | 0.2 | |
| | | | |
Machinery-Diversified | | | 0.2 | % |
Office/Business Equipment | | | 0.2 | |
Engineering & Construction | | | 0.2 | |
Iron/Steel | | | 0.2 | |
Biotechnology | | | 0.1 | |
Lodging | | | 0.1 | |
Gas | | | 0.1 | |
Automobiles | | | 0.1 | |
Real Estate | | | 0.1 | |
Electronics | | | 0.1 | |
Apparel | | | 0.0 | * |
Housewares | | | 0.0 | * |
Transportation | | | 0.0 | * |
| | | | |
| | | 103.0 | |
Liabilities in excess of other assets | | | (3.0 | ) |
| | | | |
| |
| | | 100.0 | % |
| | | | |
Effects of Derivative Instruments on the Financial Statements and Primary Underlying Risk Exposure:
The Fund invested in derivative instruments during the reporting period. The primary types of risk associated with these derivative instruments are credit contracts risk, foreign exchange contracts risk and interest rate contracts risk. See the Notes to Financial Statements for additional detail regarding these derivative instruments and their risks. The effect of such derivative instruments on the Fund’s financial position and financial performance as reflected in the Statement of Assets and Liabilities and Statement of Operations is presented in the summary below.
Fair values of derivative instruments as of August 31, 2022 as presented in the Statement of Assets and Liabilities:
| | | | | | | | | | | | |
| | | Asset Derivatives | | | Liability Derivatives | |
Derivatives not accounted for as hedging instruments, carried at fair value | | Statement of Assets and Liabilities Location | | Fair
Value | | | Statement of Assets and Liabilities Location | | Fair
Value | |
Credit contracts | | Due from/to broker-variation margin swaps | | $ | 29,532* | | | Due from/to broker-variation margin swaps | | $ | 70,135* | |
See Notes to Financial Statements.
166
PGIM Total Return Bond ETF
Schedule of Investments (continued)
as of August 31, 2022
| | | | | | | | | | | | |
| | | Asset Derivatives | | | Liability Derivatives | |
Derivatives not accounted for as hedging instruments, carried at fair value | | Statement of Assets and Liabilities Location | | Fair
Value | | | Statement of Assets and Liabilities Location | | Fair
Value | |
Foreign exchange contracts | | Unrealized appreciation on OTC forward foreign currency exchange contracts | | $ | 122,148 | | | Unrealized depreciation on OTC forward foreign currency exchange contracts | | $ | 34,480 | |
Interest rate contracts | | Due from/to broker-variation margin futures | | | 31,650 | * | | Due from/to broker-variation margin futures | | | 88,777 | * |
Interest rate contracts | | Due from/to broker-variation margin swaps | | | 31,394 | * | | — | | | — | |
| | | | | | | | | | | | |
| | | | $ | 214,724 | | | | | $ | 193,392 | |
| | | | | | | | | | | | |
| * | Includes cumulative appreciation (depreciation) as reported in the schedule of open futures and centrally cleared swap contracts. Only unsettled variation margin receivable (payable) is reported within the Statement of Assets and Liabilities. |
The effects of derivative instruments on the Statement of Operations for the period ended August 31, 2022 are as follows:
| | | | | | | | | | | | | | | |
Amount of Realized Gain (Loss) on Derivatives Recognized in Income |
Derivatives not accounted for as hedging instruments, carried at fair value | | Futures | | Forward
Currency
Exchange
Contracts | | Swaps |
Credit contracts | | | $ | — | | | | $ | — | | | | $ | (37,962 | ) |
Foreign exchange contracts | | | | — | | | | | 179,292 | | | | | — | |
Interest rate contracts | | | | (1,400,050 | ) | | | | — | | | | | (8,086 | ) |
| | | | | | | | | | | | | | | |
Total | | | $ | (1,400,050 | ) | | | $ | 179,292 | | | | $ | (46,048 | ) |
| | | | | | | | | | | | | | | |
Change in Unrealized Appreciation (Depreciation) on Derivatives Recognized in Income
| | | | | | | | | | | | | | | |
Derivatives not accounted for as hedging instruments, carried at fair value | | Futures | | Forward
Currency
Exchange
Contracts | | Swaps |
Credit contracts | | | $ | — | | | | $ | — | | | | $ | (40,603 | ) |
Foreign exchange contracts | | | | — | | | | | 87,668 | | | | | — | |
Interest rate contracts | | | | (57,127 | ) | | | | — | | | | | 31,394 | |
| | | | | | | | | | | | | | | |
Total | | | $ | (57,127 | ) | | | $ | 87,668 | | | | $ | (9,209 | ) |
| | | | | | | | | | | | | | | |
See Notes to Financial Statements.
PGIM Fixed Income ETFs 167
PGIM Total Return Bond ETF
Schedule of Investments (continued)
as of August 31, 2022
For the period ended August 31, 2022, the Fund’s average volume of derivative activities is as follows:
| | |
| Derivative Contract Type | | Average Volume of Derivative Activities* |
Futures Contracts - Long Positions (1) | | $28,922,429 |
Futures Contracts - Short Positions (1) | | 8,218,084 |
Forward Foreign Currency Exchange Contracts - Purchased (2) | | 4,635,497 |
Forward Foreign Currency Exchange Contracts - Sold (2) | | 9,311,721 |
Interest Rate Swap Agreements (1) | | 408,739 |
Credit Default Swap Agreements - Sell Protection (1) | | 2,985,000 |
| * | Average volume is based on average quarter end balances as noted for the period ended August 31, 2022. |
| (1) | Notional Amount in USD. |
| (2) | Value at Settlement Date. |
Financial Instruments/Transactions—Summary of Offsetting and Netting Arrangements:
The Fund invested in OTC derivatives during the reporting period that are either offset in accordance with current requirements or are subject to enforceable master netting arrangements or similar agreements that permit offsetting. The information about offsetting and related netting arrangements for OTC derivatives where the legal right to set-off exists is presented in the summary below.
Offsetting of OTC derivative assets and liabilities:
| | | | | | | | | | | | | | | | | | | | | | | | | |
Counterparty | | Gross Amounts of Recognized Assets(1) | | Gross Amounts of Recognized Liabilities(1) | | Net Amounts of Recognized Assets/(Liabilities) | | Collateral Pledged/(Received)(2) | | Net Amount |
BNP Paribas S.A. | | | $ | 85,823 | | | | $ | (23,786 | ) | | | $ | 62,037 | | | | $ | — | | | | $ | 62,037 | |
Morgan Stanley & Co. International PLC | | | | 10,697 | | | | | (10,694 | ) | | | | 3 | | | | | — | | | | | 3 | |
The Toronto-Dominion Bank | | | | 25,628 | | | | | — | | | | | 25,628 | | | | | — | | | | | 25,628 | |
| | | | | | | | | | | | | | | | | | | | | | | | | |
| | | $ | 122,148 | | | | $ | (34,480 | ) | | | $ | 87,668 | | | | $ | — | | | | $ | 87,668 | |
| | | | | | | | | | | | | | | | | | | | | | | | | |
| (1) | Includes unrealized appreciation/(depreciation) on swaps and forwards, premiums paid/(received) on swap agreements and market value of purchased and written options, as represented on the Statement of Assets and Liabilities. |
| (2) | Collateral amount disclosed by the Fund is limited to the market value of financial instruments/transactions and the Fund’s OTC derivative exposure by counterparty. |
See Notes to Financial Statements.
168
PGIM Total Return Bond ETF
Statement of Assets & Liabilities
as of August 31, 2022
| | | | |
Assets | | | | |
Unaffiliated investments (cost $105,940,858) | | $ | 98,410,624 | |
Foreign currency, at value (cost $23) | | | 23 | |
Receivable for investments sold | | | 7,354,433 | |
Dividends and interest receivable | | | 671,335 | |
Unrealized appreciation on OTC forward foreign currency exchange contracts | | | 122,148 | |
Tax reclaim receivable | | | 2,608 | |
Other assets | | | 520 | |
| | | | |
Total Assets | | | 106,561,691 | |
| | | | |
| |
| Liabilities | | | |
Payable for investments purchased | | | 10,928,661 | |
Management fee payable | | | 40,163 | |
Unrealized depreciation on OTC forward foreign currency exchange contracts | | | 34,480 | |
Due to broker—variation margin futures | | | 13,483 | |
Other liabilities | | | 2,937 | |
Due to broker—variation margin swaps | | | 2,542 | |
| | | | |
Total Liabilities | | | 11,022,266 | |
| | | | |
| |
Net Assets | | $ | 95,539,425 | |
| | | | |
| | | | |
Net assets were comprised of: | | | | |
Common stock, at par | | $ | 2,225 | |
Paid-in capital in excess of par | | | 105,630,514 | |
Total distributable earnings (loss) | | | (10,093,314 | ) |
| | | | |
Net assets, August 31, 2022 | | $ | 95,539,425 | |
| | | | |
| |
Net asset value, offering price and redemption price per share | | | | |
($95,539,425 ÷ 2,225,000 shares of common stock issued and outstanding) | | $ | 42.94 | |
| | | | |
See Notes to Financial Statements.
PGIM Fixed Income ETFs 169
PGIM Total Return Bond ETF
Statement of Operations
For the Period December 02, 2021* through August 31, 2022
| | | | |
Net Investment Income (Loss) | | | | |
Income | | | | |
Interest income (net of $667 foreign withholding tax) | | $ | 1,492,078 | |
Unaffiliated dividend income | | | 30,861 | |
Affiliated dividend income | | | 444 | |
| | | | |
| |
Total income | | | 1,523,383 | |
| | | | |
| |
Expenses | | | | |
Management fee | | | 246,470 | |
| | | | |
Net investment income (loss) | | | 1,276,913 | |
| | | | |
Realized And Unrealized Gain (Loss) On Investment And Foreign Currency Transactions | | | | |
Net realized gain (loss) on: | | | | |
Investment transactions | | | (1,597,613 | ) |
Futures transactions | | | (1,400,050 | ) |
Forward currency contract transactions | | | 179,292 | |
Swap agreement transactions | | | (46,048 | ) |
Foreign currency transactions | | | 151,516 | |
| | | | |
| | | (2,712,903 | ) |
| | | | |
Net change in unrealized appreciation (depreciation) on: | | | | |
Investments | | | (7,530,234 | ) |
Futures | | | (57,127 | ) |
Forward currency contracts | | | 87,668 | |
Swap agreements | | | (9,209 | ) |
Foreign currencies | | | (1,639 | ) |
| | | | |
| | | (7,510,541 | ) |
| | | | |
Net gain (loss) on investment and foreign currency transactions | | | (10,223,444 | ) |
| | | | |
Net Increase (Decrease) In Net Assets Resulting From Operations | | $ | (8,946,531 | ) |
| | | | |
| * | Commencement of operations. |
See Notes to Financial Statements.
170
PGIM Total Return Bond ETF
Statement of Changes in Net Assets
| | | | | | | |
| | | December 02, 2021*
through
August 31, 2022 | | |
Increase (Decrease) in Net Assets | | | | | | | |
Operations | | | | | | | |
Net investment income (loss) | | | $ | 1,276,913 | | | |
Net realized gain (loss) on investment and foreign currency transactions | | | | (2,712,903 | ) | | |
Net change in unrealized appreciation (depreciation) on investments and foreign currencies | | | | (7,510,541 | ) | | |
| | | | | | | |
Net increase (decrease) in net assets resulting from operations | | | | (8,946,531 | ) | | |
| | | | | | | |
Dividends and Distributions | | | | | | | |
Distributions from distributable earnings | | | | (1,146,783 | ) | | |
| | | | | | | |
Fund share transactions | | | | | | | |
Net proceeds from shares sold (2,225,000 shares) | | | | 105,632,739 | | | |
| | | | | | | |
Total increase (decrease) | | | | 95,539,425 | | | |
| | |
Net Assets: | | | | | | | |
Beginning of period | | | | — | | | |
| | | | | | | |
End of period | | | $ | 95,539,425 | | | |
| | | | | | | |
| * | Commencement of operations. |
See Notes to Financial Statements.
PGIM Fixed Income ETFs 171
PGIM Total Return Bond ETF
Financial Highlights
| | | | | | | | |
| | | | |
| | | | | | | | | |
| | | December 02, 2021(a) through August 31, 2022 | | | | | |
Per Share Operating Performance(b) : | | | | | | | | |
Net Asset Value, beginning of period | | $50.00 | | | | | | |
Income (loss) from investment operations: | | | | | | | | |
Net investment income (loss) | | 0.86 | | | | | | |
Net realized and unrealized gain (loss) on investment and foreign currency transactions | | (7.23) | | | | | | |
Total from investment operations | | (6.37) | | | | | | |
Less Dividends and Distributions: | | | | | | | | |
Dividends from net investment income | | (0.69) | | | | | | |
Net asset value, end of period | | $42.94 | | | | | | |
Total Return(c) : | | (12.81)% | | | | | | |
| | | | |
| | | | | | | | |
Ratios/Supplemental Data: | | | | | | | | |
Net assets, end of period (000) | | $95,539 | | | | | | |
Average net assets (000) | | $67,327 | | | | | | |
Ratios to average net assets(d) : | | | | | | | | |
Expenses after waivers and/or expense reimbursement | | 0.49%(e) | | | | | | |
Expenses before waivers and/or expense reimbursement | | 0.49%(e) | | | | | | |
Net investment income (loss) | | 2.54%(e) | | | | | | |
Portfolio turnover rate(f) | | 150% | | | | | | |
| (a) | Commencement of operations. |
| (b) | Calculated based on average shares outstanding during the period. |
| (c) | Total return is calculated assuming a purchase of a share on the first day and a sale on the last day of each period reported and includes reinvestment of dividends and distributions, if any. Total returns may reflect adjustments to conform to GAAP. Total returns for periods less than one full year are not annualized. |
| (d) | Does not include expenses of the underlying funds in which the Fund invests. |
| (f) | The Fund’s portfolio turnover rate is calculated in accordance with regulatory requirements, without regard to transactions involving short-term investments, certain derivatives and in-kind transactions (if any). If such transactions were included, the Fund’s portfolio turnover rate may be higher. |
See Notes to Financial Statements.
172
PGIM Floating Rate Income ETF
Schedule of Investments
as of August 31, 2022
| | | | | | | | | | | | | | | | |
| | | | |
| Description | | Interest
Rate | | Maturity
Date | | | Principal
Amount (000)# | | | Value | |
| | | | |
LONG-TERM INVESTMENTS 97.4% | | | | | | | | | | | | | | | | |
| | | | |
ASSET-BACKED SECURITIES 2.4% | | | | | | | | | | | | | | | | |
| | | | |
Collateralized Loan Obligations | | | | | | | | | | | | | | | | |
Carlyle US CLO Ltd. (Cayman Islands),
Series 2021-11A, Class A, 144A, 3 Month LIBOR + 1.095% (Cap N/A, Floor 1.095%) | | | 3.878%(c) | | | | 01/25/33 | | | | 250 | | | $ | 245,327 | |
MidOcean Credit CLO (Cayman Islands),
Series 2017-07A, Class A1R, 144A, 3 Month LIBOR + 1.040% (Cap N/A, Floor 0.000%) | | | 3.552(c) | | | | 07/15/29 | | | | 325 | | | | 321,269 | |
Palmer Square CLO Ltd. (Cayman Islands),
Series 2015-01A, Class A2R4, 144A, 3 Month LIBOR + 1.700% (Cap N/A, Floor 1.700%) | | | 4.684(c) | | | | 05/21/34 | | | | 250 | | | | 241,790 | |
| | | | | | | | | | | | | | | | |
| | | | |
TOTAL ASSET-BACKED SECURITIES
(cost $805,567) | | | | | | | | | | | | | | | 808,386 | |
| | | | | | | | | | | | | | | | |
| | | | |
BANK LOANS 87.8% | | | | | | | | | | | | | | | | |
| | | | |
Advertising 0.2% | | | | | | | | | | | | | | | | |
Terrier Media Buyer, Inc.,
2021 Refinancing Term B Loans, 1 Month LIBOR + 3.500% | | | 6.024(c) | | | | 12/17/26 | | | | 85 | | | | 82,100 | |
| | | | |
Aerospace & Defense 2.0% | | | | | | | | | | | | | | | | |
Cobham Ultra U.S. Co-Borrower LLC,
Facility B Loan, 3 Month LIBOR + 3.750% | | | 7.063(c) | | | | 12/24/28 | | | | 250 | | | | 242,344 | |
Dynasty Acquisition Co., Inc.,
2020 Specified Refinancing Term B-1 Facility, 1 Month LIBOR + 3.500% | | | 6.024(c) | | | | 04/06/26 | | | | 97 | | | | 93,785 | |
2020 Specified Refinancing Term B-2 Facility, 1 Month LIBOR + 3.500% | | | 6.024(c) | | | | 04/06/26 | | | | 52 | | | | 50,422 | |
Spirit AeroSystems, Inc.,
Term Loan B, 1 Month LIBOR + 3.750% | | | 6.274(c) | | | | 01/15/25 | | | | 200 | | | | 198,063 | |
TransDigm, Inc.,
Tranche F Refinancing Term Loan, 1 Month LIBOR + 2.250% | | | 4.774(c) | | | | 12/09/25 | | | | 100 | | | | 97,140 | |
| | | | | | | | | | | | | | | | |
| | | | |
| | | | | | | | | | | | | | | 681,754 | |
| | | | |
Airlines 3.3% | | | | | | | | | | | | | | | | |
Air Canada (Canada),
Term Loan, 3 Month LIBOR + 3.500% | | | 6.421(c) | | | | 08/11/28 | | | | 150 | | | | 144,804 | |
See Notes to Financial Statements.
PGIM Fixed Income ETFs 173
PGIM Floating Rate Income ETF
Schedule of Investments (continued)
as of August 31, 2022
| | | | | | | | | | | | | | | | |
| | | | |
| Description | | Interest
Rate | | Maturity
Date | | | Principal
Amount (000)# | | | Value | |
| | | | |
BANK LOANS (Continued) | | | | | | | | | | | | | | | | |
| | | | |
Airlines (cont’d.) | | | | | | | | | | | | | | | | |
American Airlines, Inc.,
2017 Replacement Class B Term Loan, 1 Month LIBOR + 2.000% | | | 4.391%(c) | | | | 12/15/23 | | | | 250 | | | $ | 246,771 | |
Initial Term Loan, 3 Month LIBOR + 4.750% | | | 7.460(c) | | | | 04/20/28 | | | | 300 | | | | 295,125 | |
Delta Air Lines, Inc.,
Initial Term Loan, 3 Month LIBOR + 3.750% | | | 6.460(c) | | | | 10/20/27 | | | | 125 | | | | 126,484 | |
Mileage Plus Holdings LLC,
Initial Term Loan, 3 Month LIBOR + 5.250% | | | 7.313(c) | | | | 06/21/27 | | | | 200 | | | | 202,700 | |
United Airlines, Inc.,
Class B Term Loan, 3 Month LIBOR + 3.750% | | | 6.533(c) | | | | 04/21/28 | | | | 100 | | | | 96,629 | |
| | | | | | | | | | | | | | | | |
| | | | |
| | | | | | | | | | | | | | | 1,112,513 | |
| | | | |
Apparel 0.4% | | | | | | | | | | | | | | | | |
Calceus Acquisition, Inc.,
Term Loan, 1 Month LIBOR + 5.500% | | | 8.024(c) | | | | 02/12/25 | | | | 75 | | | | 66,844 | |
Fanatics Commerce Intermediate Holdco LLC,
Initial Term Loan, 3 Month LIBOR + 3.250%^ | | | 6.056(c) | | | | 11/24/28 | | | | 75 | | | | 73,316 | |
| | | | | | | | | | | | | | | | |
| | | | |
| | | | | | | | | | | | | | | 140,160 | |
| | | | |
Auto Manufacturers 0.2% | | | | | | | | | | | | | | | | |
American Trailer World Corp.,
First Lien Initial Term Loan, 1 Month SOFR + 3.850% | | | 6.305(c) | | | | 03/03/28 | | | | 75 | | | | 69,630 | |
| | | | |
Auto Parts & Equipment 1.3% | | | | | | | | | | | | | | | | |
Autokiniton U.S. Holdings, Inc.,
Closing Date Term B Loan, 1 Month LIBOR + 4.500% | | | 6.873(c) | | | | 04/06/28 | | | | 100 | | | | 96,535 | |
Dexko Global, Inc.,
First Lien Closing Date Dollar Term Loan, 3 Month LIBOR + 3.750% | | | 6.000(c) | | | | 10/04/28 | | | | 150 | | | | 142,798 | |
First Brands Group LLC,
First Lien 2021 Term Loan, 6 Month SOFR + 5.000% | | | 8.368(c) | | | | 03/30/27 | | | | 50 | | | | 48,081 | |
Holley, Inc.,
Initial Term Loan, 3 Month LIBOR + 3.750% | | | 6.711(c) | | | | 11/17/28 | | | | 50 | | | | 46,851 | |
Truck Hero, Inc.,
Initial Term Loan, 1 Month LIBOR + 3.500% | | | 6.024(c) | | | | 01/31/28 | | | | 100 | | | | 90,533 | |
| | | | | | | | | | | | | | | | |
| | | | |
| | | | | | | | | | | | | | | 424,798 | |
See Notes to Financial Statements.
174
PGIM Floating Rate Income ETF
Schedule of Investments (continued)
as of August 31, 2022
| | | | | | | | | | | | | | | | |
| | | | |
| Description | | Interest
Rate | | Maturity
Date | | | Principal
Amount (000)# | | | Value | |
| | | | |
BANK LOANS (Continued) | | | | | | | | | | | | | | | | |
| | | | |
Beverages 1.2% | | | | | | | | | | | | | | | | |
Arctic Glacier USA, Inc.,
Specified Refinancing Term Loan, 3 Month LIBOR + 3.500% | | | 5.750%(c) | | | | 03/20/24 | | | | 100 | | | $ | 89,175 | |
City Brewing Co. LLC,
First Lien Closing Date Term Loan, 1 Month LIBOR + 3.500% | | | 5.873(c) | | | | 04/05/28 | | | | 200 | | | | 173,448 | |
Pegasus Bidco BV (Netherlands),
Facility Term loan B2, 3 Month SOFR + 4.250% | | | 6.962(c) | | | | 07/12/29 | | | | 150 | | | | 145,313 | |
| | | | | | | | | | | | | | | | |
| | | | |
| | | | | | | | | | | | | | | 407,936 | |
| | | | |
Building Materials 1.1% | | | | | | | | | | | | | | | | |
Cornerstone Building Brands, Inc.,
Term Loan, 1 Month SOFR + 5.625% | | | 7.882(c) | | | | 08/01/28 | | | | 75 | | | | 70,313 | |
Hunter Douglas, Inc. (Netherlands),
Tranche B-1 Term Loan, 3 Month SOFR + 3.500% | | | 6.340(c) | | | | 02/26/29 | | | | 125 | | | | 108,937 | |
PHRG Intermediate LLC,
Initial Term Loans, 1 Month LIBOR + 6.000%^ | | | 8.368(c) | | | | 12/16/26 | | | | 99 | | | | 96,891 | |
Smyrna Ready Mix Concrete LLC,
Initial Term Loan, 1 Month SOFR + 4.250%^ | | | 6.805(c) | | | | 04/02/29 | | | | 100 | | | | 97,250 | |
| | | | | | | | | | | | | | | | |
| | | | |
| | | | | | | | | | | | | | | 373,391 | |
| | | | |
Chemicals 3.9% | | | | | | | | | | | | | | | | |
Albaugh LLC,
Term Loan B, 1 - 3 Month LIBOR + 3.750% | | | 6.203(c) | | | | 04/06/29 | | | | 125 | | | | 123,337 | |
Ascend Performance Materials Operations LLC,
2021 Refinancing Term Loan, 3 Month LIBOR + 4.750% | | | 7.000(c) | | | | 08/27/26 | | | | 200 | | | | 198,937 | |
DuBois Chemicals Group, Inc.,
First Lien Initial Term Loan, 1 Month LIBOR + 4.500%^ | | | 7.024(c) | | | | 09/30/26 | | | | 200 | | | | 193,378 | |
Geon Performance Solutions LLC,
Initial Term Loans, 1 Month LIBOR + 4.500% | | | 7.024(c) | | | | 08/18/28 | | | | 75 | | | | 73,502 | |
Ineos U.S. Petrochem LLC,
2026 Tranche B Dollar Term Loan, 1 Month LIBOR + 2.750% | | | 5.274(c) | | | | 01/29/26 | | | | 50 | | | | 48,586 | |
Iris Holdings Ltd.,
Initial Term Loan, 1 - 3 Month SOFR + 4.750% | | | 6.859(c) | | | | 06/28/28 | | | | 75 | | | | 71,031 | |
See Notes to Financial Statements.
PGIM Fixed Income ETFs 175
PGIM Floating Rate Income ETF
Schedule of Investments (continued)
as of August 31, 2022
| | | | | | | | | | | | | | | | |
| | | | |
| Description | | Interest
Rate | | Maturity
Date | | | Principal
Amount (000)# | | | Value | |
| | | | |
BANK LOANS (Continued) | | | | | | | | | | | | | | | | |
| | | | |
Chemicals (cont’d.) | | | | | | | | | | | | | | | | |
LSF11 A5 HoldCo., LLC,
Term Loan, 1 Month SOFR + 3.500% | | | 6.070%(c) | | | | 10/15/28 | | | | 115 | | | $ | 112,103 | |
Olympus Water US Holding Corp.,
Initial Dollar Term Loan, 3 Month LIBOR + 3.750% | | | 6.063(c) | | | | 11/09/28 | | | | 100 | | | | 96,047 | |
Oxea Corp.,
Tranche B-2 Term Loan, 1 Month LIBOR + 3.250% | | | 5.688(c) | | | | 10/14/24 | | | | 50 | | | | 47,802 | |
Perstorp Holding AB (Sweden),
Facility B Loan, 3 Month LIBOR + 4.750% | | | 6.250(c) | | | | 02/27/26 | | | | 250 | | | | 247,292 | |
Starfruit Finco BV (Netherlands),
Initial Dollar Term Loan, 3 Month LIBOR + 2.825% | | | 5.125(c) | | | | 10/01/25 | | | | 50 | | | | 48,499 | |
Tronox Finance LLC,
First Lien 2022 Incremental Term Loan, 3 Month SOFR + 3.250% | | | 5.304(c) | | | | 04/04/29 | | | | 75 | | | | 73,036 | |
| | | | | | | | | | | | | | | | |
| | | | |
| | | | | | | | | | | | | | | 1,333,550 | |
| | | | |
Commercial Services 5.3% | | | | | | | | | | | | | | | | |
Adtalem Global Education, Inc.,
Term B Loan, 1 Month LIBOR + 4.500% | | | 6.368(c) | | | | 08/12/28 | | | | 150 | | | | 148,500 | |
AG Group Holdings, Inc.,
Term Loan, 3 Month SOFR + 4.000% | | | 6.577(c) | | | | 12/29/28 | | | | 75 | | | | 73,223 | |
Amentum Government Services Holdings LLC,
Tranche 3 Term Loan, 3 Month SOFR + 4.000% | | | 5.187(c) | | | | 02/15/29 | | | | 125 | | | | 121,563 | |
ArchKey Holdings, Inc.,
First Lien Initial Term Loan, 1 Month LIBOR + 5.250%^ | | | 7.774(c) | | | | 06/29/28 | | | | 150 | | | | 140,882 | |
Avis Budget Car Rental LLC,
New Tranche B Term Loan, 1 Month LIBOR + 1.750% | | | 4.280(c) | | | | 08/06/27 | | | | 199 | | | | 192,216 | |
CoreLogic Inc,
First Lien Initial Term Loan, 1 Month LIBOR + 3.500% | | | 6.063(c) | | | | 06/02/28 | | | | 75 | | | | 64,163 | |
EAB Global, Inc.,
Term Loan, 1 - 3 Month LIBOR + 3.500% | | | 6.212(c) | | | | 08/16/28 | | | | 200 | | | | 191,817 | |
Inmar, Inc.,
Initial Term Loan (First Lien), 1 Month LIBOR + 4.000% | | | 6.524(c) | | | | 05/01/24 | | | | 60 | | | | 57,729 | |
Kingpin Intermediate Holdings LLC,
2018 Refinancing Term Loan, 1 Month LIBOR + 3.500% | | | 6.030(c) | | | | 07/03/24 | | | | 75 | | | | 73,684 | |
Latham Pool Products, Inc.,
Initial Term Loan, 3 Month SOFR + 3.750% | | | 6.681(c) | | | | 02/23/29 | | | | 50 | | | | 48,129 | |
See Notes to Financial Statements.
176
PGIM Floating Rate Income ETF
Schedule of Investments (continued)
as of August 31, 2022
| | | | | | | | | | | | | | | | |
| | | | |
| Description | | Interest
Rate | | Maturity
Date | | | Principal
Amount (000)# | | | Value | |
| | | | |
BANK LOANS (Continued) | | | | | | | | | | | | | | | | |
| | | | |
Commercial Services (cont’d.) | | | | | | | | | | | | | | | | |
Mavis Tire Express Services TopCo LP,
First Lien Initial Term Loan, 1 Month SOFR + 4.000% | | | 6.375%(c) | | | | 05/04/28 | | | | 75 | | | $ | 72,847 | |
MPH Acquisition Holdings LLC,
Initial Term Loan, 3 Month LIBOR + 4.250% | | | 7.320(c) | | | | 09/01/28 | | | | 125 | | | | 117,672 | |
NAB Holdings LLC,
Initial Term Loan, 3 Month SOFR + 3.000% | | | 5.204(c) | | | | 11/23/28 | | | | 50 | | �� | | 48,142 | |
RLG Holdings LLC,
First Lien Closing Date Initial Term Loan, 1 Month LIBOR + 4.000% | | | 6.524(c) | | | | 07/07/28 | | | | 75 | | | | 72,100 | |
Safe Fleet Holdings LLC,
Term Loan^ | | | — (p) | | | | 02/23/29 | | | | 50 | | | | 49,000 | |
Spectrum Group Buyer, Inc.,
Initial Term Loan, 3 Month SOFR + 6.500% | | | 9.440(c) | | | | 05/19/28 | | | | 150 | | | | 145,462 | |
University Support Services LLC (Canada),
Initial Term Loan, 1 Month LIBOR + 3.250% | | | 5.774(c) | | | | 02/10/29 | | | | 75 | | | | 72,194 | |
VT Topco, Inc.,
First Lien 2021 Delayed Draw Term Loan, 3 Month LIBOR + 3.750% | | | 5.973(c) | | | | 08/01/25 | | | | 5 | | | | 4,581 | |
First Lien 2021 Term Loan, 1 Month LIBOR + 3.750% | | | 6.274(c) | | | | 08/01/25 | | | | 70 | | | | 68,776 | |
WMB Holdings, Inc.,
Term Loan^ | | | — (p) | | | | 12/31/29 | | | | 46 | | | | 45,425 | |
| | | | | | | | | | | | | | | | |
| | | | |
| | | | | | | | | | | | | | | 1,808,105 | |
| | | | |
Computers 3.1% | | | | | | | | | | | | | | | | |
ConvergeOne Holdings Corp.,
First Lien Initial Term Loan, 1 Month LIBOR + 5.000% | | | 7.372(c) | | | | 01/04/26 | | | | 125 | | | | 100,277 | |
McAfee Corp.,
Tranche B-1 Term Loan, 1 - 3 Month SOFR + 3.750% | | | 6.282(c) | | | | 03/01/29 | | | | 150 | | | | 142,200 | |
Peraton Corp.,
First Lien Term B Loan, 1 Month LIBOR + 3.750% | | | 6.274(c) | | | | 02/01/28 | | | | 250 | | | | 241,938 | |
Procera Networks, Inc. (Canada),
Term Loan, 1 Month LIBOR + 4.500% | | | 7.024(c) | | | | 10/31/25 | | | | 75 | | | | 72,812 | |
Redstone Holdco LP,
First Lien Initial Term Loan, 3 Month LIBOR + 4.750% | | | 7.533(c) | | | | 04/27/28 | | | | 100 | | | | 84,911 | |
SonicWall U.S. Holdings, Inc.,
First Lien Term Loan, 3 Month LIBOR + 3.750% | | | 6.730(c) | | | | 05/16/25 | | | | 100 | | | | 96,525 | |
See Notes to Financial Statements.
PGIM Fixed Income ETFs 177
PGIM Floating Rate Income ETF
Schedule of Investments (continued)
as of August 31, 2022
| | | | | | | | | | | | | | | | |
| | | | |
| Description | | Interest
Rate | | Maturity
Date | | | Principal
Amount (000)# | | | Value | |
| | | | |
BANK LOANS (Continued) | | | | | | | | | | | | | | | | |
| | | | |
Computers (cont’d.) | | | | | | | | | | | | | | | | |
VeriFone Systems, Inc.,
First Lien Initial Term Loan, 3 Month LIBOR + 4.000% | | | 6.997%(c) | | | | 08/20/25 | | | | 200 | | | $ | 183,787 | |
Vision Solutions, Inc.,
Third Amendment Term Loan (First Lien), 3 Month LIBOR + 4.000% | | | 6.783(c) | | | | 04/24/28 | | | | 125 | | | | 118,125 | |
| | | | | | | | | | | | | | | | |
| | | | |
| | | | | | | | | | | | | | | 1,040,575 | |
| | | | |
Cosmetics/Personal Care 0.4% | | | | | | | | | | | | | | | | |
Conair Holdings LLC,
First Lien Initial Term Loan, 3 Month LIBOR + 3.750% | | | 6.000(c) | | | | 05/17/28 | | | | 150 | | | | 127,590 | |
| | | | |
Diversified Financial Services 3.2% | | | | | | | | | | | | | | | | |
Castlelake Aviation One DAC,
Initial Term Loan, 3 Month LIBOR + 2.750% | | | 4.579(c) | | | | 10/22/26 | | | | 135 | | | | 131,968 | |
Cowen, Inc.,
Initial Term Loan, 3 Month LIBOR + 3.250% | | | 4.635(c) | | | | 03/24/28 | | | | 300 | | | | 298,248 | |
Hightower Holding LLC,
Initial Term Loan, 3 Month LIBOR + 4.000% | | | 6.732(c) | | | | 04/21/28 | | | | 75 | | | | 72,442 | |
Hudson River Trading LLC,
Term Loan, 3 Month SOFR + 3.000% | | | 6.164(c) | | | | 03/20/28 | | | | 275 | | | | 254,770 | |
LHS Borrower LLC,
Term Loan, 1 Month SOFR + 4.7500% | | | 7.305(c) | | | | 02/18/29 | | | | 75 | | | | 67,144 | |
Paysafe Holdings U.S. Corp.,
Facility B1, 1 Month LIBOR + 2.750% | | | 5.274(c) | | | | 06/28/28 | | | | 75 | | | | 69,902 | |
Setanta Aircraft Leasing DAC (Ireland),
Term Loan, 3 Month LIBOR + 2.000% | | | 4.250(c) | | | | 11/05/28 | | | | 100 | | | | 98,021 | |
VFH Parent LLC,
Initial Term Loan, 1 Month SOFR + 3.000% | | | 5.397(c) | | | | 01/13/29 | | | | 95 | | | | 92,387 | |
| | | | | | | | | | | | | | | | |
| | | | |
| | | | | | | | | | | | | | | 1,084,882 | |
| | | | |
Electric 0.7% | | | | | | | | | | | | | | | | |
Lightstone HoldCo LLC,
Extended Term Loan B, 3 Month SOFR + 5.750% | | | 8.051(c) | | | | 02/01/27 | | | | 95 | | | | 84,236 | |
Extended Term Loan C, 1 Month SOFR + 5.750% | | | 8.051(c) | | | | 02/01/27 | | | | 5 | | | | 4,679 | |
See Notes to Financial Statements.
178
PGIM Floating Rate Income ETF
Schedule of Investments (continued)
as of August 31, 2022
| | | | | | | | | | | | | | | | |
| | | | |
| Description | | Interest
Rate | | Maturity
Date | | | Principal
Amount (000)# | | | Value | |
| | | | |
BANK LOANS (Continued) | | | | | | | | | | | | | | | | |
| | | | |
Electric (cont’d.) | | | | | | | | | | | | | | | | |
Pike Corp.,
Term Loan B, 1 Month SOFR + 3.500%^ | | | 5.807%(c) | | | | 01/21/28 | | | | 50 | | | $ | 49,125 | |
Vistra Operations Co. LLC,
Term Loan, 1 Month LIBOR + 1.7500% | | | 4.274(c) | | | | 12/31/25 | | | | 99 | | | | 97,344 | |
| | | | | | | | | | | | | | | | |
| | | | |
| | | | | | | | | | | | | | | 235,384 | |
| | | | |
Electronics 0.3% | | | | | | | | | | | | | | | | |
II-VI, Inc.,
Term Loan B, 3 Month LIBOR + 2.750% | | | 5.123(c) | | | | 07/02/29 | | | | 75 | | | | 73,195 | |
Token Buyer, Inc.,
Initial Term Loan, 1 Month SOFR + 6.000%^ | | | 8.555(c) | | | | 05/31/29 | | | | 25 | | | | 23,375 | |
| | | | | | | | | | | | | | | | |
| | | | |
| | | | | | | | | | | | | | | 96,570 | |
| | | | |
Energy-Alternate Sources 0.4% | | | | | | | | | | | | | | | | |
WIN Waste Innovations Holdings, Inc.,
Initial Term Loan, 3 Month LIBOR + 2.750% | | | 5.000(c) | | | | 03/24/28 | | | | 125 | | | | 121,880 | |
| | | | |
Engineering & Construction 0.6% | | | | | | | | | | | | | | | | |
Brand Industrial Services, Inc.,
Initial Term Loan, 3 Month LIBOR + 4.250% | | | 6.944(c) | | | | 06/21/24 | | | | 50 | | | | 45,282 | |
Brown Group Holding LLC,
Incremental Term B-2 Facility, 1 Month SOFR + 3.750% | | | 6.205(c) | | | | 07/02/29 | | | | 25 | | | | 24,588 | |
Osmose Utilities Services, Inc.,
First Lien Initial Term Loan, 3 Month LIBOR + 3.250% | | | 5.774(c) | | | | 06/23/28 | | | | 90 | | | | 85,285 | |
TMC Buyer, Inc.,
Term Loan, 1 Month SOFR + 6.000%^ | | | 8.054(c) | | | | 08/31/28 | | | | 47 | | | | 42,798 | |
| | | | | | | | | | | | | | | | |
| | | | |
| | | | | | | | | | | | | | | 197,953 | |
| | | | |
Entertainment 3.2% | | | | | | | | | | | | | | | | |
Allen Media LLC,
Term B Loan, 3 Month SOFR + 5.500% | | | 7.704(c) | | | | 02/10/27 | | | | 165 | | | | 143,321 | |
AP Gaming I LLC,
Term Loan B, 3 Month SOFR + 4.000%^ | | | 6.204(c) | | | | 02/15/29 | | | | 75 | | | | 72,755 | |
CBAC Borrower LLC,
Term B Loan, 1 Month LIBOR + 4.000% | | | 6.372(c) | | | | 07/08/24 | | | | 100 | | | | 97,487 | |
See Notes to Financial Statements.
PGIM Fixed Income ETFs 179
PGIM Floating Rate Income ETF
Schedule of Investments (continued)
as of August 31, 2022
| | | | | | | | | | | | | | | | |
| | | | |
| Description | | Interest
Rate | | Maturity
Date | | | Principal
Amount (000)# | | | Value | |
| | | | |
BANK LOANS (Continued) | | | | | | | | | | | | | | | | |
| | | | |
Entertainment (cont’d.) | | | | | | | | | | | | | | | | |
J&J Ventures Gaming LLC,
Initial Term Loan, 3 Month LIBOR + 4.000%^ | | | 6.250%(c) | | | | 04/26/28 | | | | 150 | | | $ | 142,321 | |
Maverick Gaming LLC,
Term B Loan, 3 Month LIBOR + 7.500% | | | 10.570(c) | | | | 09/03/26 | | | | 75 | | | | 67,330 | |
Raptor Acquisition Corp.,
Term B Loan, 3 Month LIBOR + 4.000% | | | 6.096(c) | | | | 11/01/26 | | | | 75 | | | | 73,406 | |
Scientific Games Holdings LP,
Term Loan B-2, 3 Month SOFR + 3.500% | | | 5.617(c) | | | | 04/04/29 | | | | 250 | | | | 240,625 | |
Scientific Games International, Inc.,
Initial Term B Loan, 1 Month SOFR + 3.000% | | | 5.407(c) | | | | 04/13/29 | | | | 250 | | | | 244,115 | |
| | | | | | | | | | | | | | | | |
| | | | |
| | | | | | | | | | | | | | | 1,081,360 | |
| | | | |
Environmental Control 1.6% | | | | | | | | | | | | | | | | |
EWT Holdings III Corp.,
Term Loan, 1 Month LIBOR + 2.500% | | | 5.063(c) | | | | 04/01/28 | | | | 75 | | | | 73,782 | |
Filtration Group Corp.,
Initial Dollar Term Loan, 1 Month LIBOR + 3.000% | | | 5.524(c) | | | | 03/31/25 | | | | 150 | | | | 146,714 | |
GFL Environmental, Inc. (Canada),
2020 Term Loan, 3 Month LIBOR + 3.000% | | | 5.806(c) | | | | 05/30/25 | | | | 100 | | | | 99,141 | |
Harsco Corp.,
Term Loan, 1 Month LIBOR + 2.250% | | | 4.750(c) | | | | 03/10/28 | | | | 100 | | | | 93,763 | |
Madison IAQ LLC,
Initial Term Loan, 6 Month LIBOR + 3.250% | | | 4.524(c) | | | | 06/21/28 | | | | 54 | | | | 52,446 | |
Packers Holdings LLC,
Initial Term Loan, 1 Month LIBOR + 3.250% | | | 5.630(c) | | | | 03/09/28 | | | | 75 | | | | 70,793 | |
| | | | | | | | | | | | | | | | |
| | | | |
| | | | | | | | | | | | | �� | | 536,639 | |
| | | | |
Foods 1.4% | | | | | | | | | | | | | | | | |
American Seafoods Group LLC,
Incremental Tranche B Term Loan, 1 - 3 Month LIBOR + 2.750%^ | | | 4.953(c) | | | | 08/21/23 | | | | 150 | | | | 146,250 | |
BCPE North Star U.S. Holdco, Inc.,
First Lien Initial Term Loan, 3 Month LIBOR + 4.000% | | | 6.250(c) | | | | 06/09/28 | | | | 69 | | | | 65,027 | |
Term Loan, 3 Month LIBOR + 4.000% | | | 4.000(c) | | | | 06/10/28 | | | | 6 | | | | 5,747 | |
Chefs Warehouse,
Term Loan, 1 Month SOFR + 4.750%^ | | | 7.163(c) | | | | 08/23/29 | | | | 54 | | | | 52,920 | |
CHG PPC Parent LLC,
Term Loan, 1 Month LIBOR + 3.000%^ | | | 5.563(c) | | | | 12/08/28 | | | | 50 | | | | 48,504 | |
See Notes to Financial Statements.
180
PGIM Floating Rate Income ETF
Schedule of Investments (continued)
as of August 31, 2022
| | | | | | | | | | | | | | | | |
| | | | |
| Description | | Interest
Rate | | Maturity
Date | | | Principal
Amount (000)# | | | Value | |
| | | | |
BANK LOANS (Continued) | | | | | | | | | | | | | | | | |
| | | | |
Foods (cont’d.) | | | | | | | | | | | | | | | | |
H-Food Holdings LLC,
Initial Term Loan, 1 Month LIBOR + 3.688% | | | 6.211%(c) | | | | 05/23/25 | | | | 75 | | | $ | 69,328 | |
Shearer’s Foods LLC,
Refinancing Term Loan (First Lien), 1 Month LIBOR + 3.500% | | | 6.024(c) | | | | 09/23/27 | | | | 75 | | | | 72,416 | |
| | | | | | | | | | | | | | | | |
| | | | |
| | | | | | | | | | | | | | | 460,192 | |
| | | | |
Forest Products & Paper 0.5% | | | | | | | | | | | | | | | | |
Asplundh Tree Expert LLC,
2021 Refinancing Term Loan, 1 Month LIBOR + 1.750% | | | 4.274(c) | | | | 09/07/27 | | | | 75 | | | | 73,621 | |
Domtar Corp.,
Initial Term Loan, 1 Month LIBOR + 5.500%^ | | | 8.256(c) | | | | 11/30/28 | | | | 100 | | | | 94,500 | |
| | | | | | | | | | | | | | | | |
| | | | |
| | | | | | | | | | | | | | | 168,121 | |
| | | | |
Hand/Machine Tools 0.2% | | | | | | | | | | | | | | | | |
Alliance Laundry Systems LLC,
Initial Term B Loan, 3 Month LIBOR + 3.500% | | | 5.955(c) | | | | 10/08/27 | | | | 75 | | | | 73,106 | |
| | | | |
Healthcare-Products 0.2% | | | | | | | | | | | | | | | | |
Bausch + Lomb Corp.,
Initial Term Loan, 1 Month SOFR + 3.350% | | | 5.653(c) | | | | 05/10/27 | | | | 60 | | | | 56,275 | |
| | | | |
Healthcare-Services 4.1% | | | | | | | | | | | | | | | | |
Accelerated Health Systems LLC,
Initial Term B Loan, 3 Month SOFR + 4.500% | | | 7.389(c) | | | | 02/15/29 | | | | 200 | | | | 188,750 | |
Charlotte Buyer,
Term Loan B - 1st Lien, 3 Month SOFR + 5.250% | | | 7.980(c) | | | | 02/11/28 | | | | 150 | | | | 143,812 | |
Electron Bidco, Inc.,
Initial Term Loan, 1 Month LIBOR + 3.000% | | | 5.524(c) | | | | 11/01/28 | | | | 50 | | | | 48,566 | |
eResearch Technology, Inc.,
First Lien Initial Term Loan, 1 Month LIBOR + 4.500% | | | 7.024(c) | | | | 02/04/27 | | | | 150 | | | | 142,392 | |
Global Medical Response, Inc.,
2017-2 New Term Loan, 1 Month LIBOR + 4.250% | | | 6.774(c) | | | | 03/14/25 | | | | 100 | | | | 90,765 | |
2020 Term Loan, 1 Month LIBOR + 4.250% | | | 6.623(c) | | | | 10/02/25 | | | | 100 | | | | 91,125 | |
LifePoint Health, Inc.,
First Lien Term B Loan, 1 Month LIBOR + 3.750% | | | 6.274(c) | | | | 11/16/25 | | | | 150 | | | | 145,000 | |
See Notes to Financial Statements.
PGIM Fixed Income ETFs 181
PGIM Floating Rate Income ETF
Schedule of Investments (continued)
as of August 31, 2022
| | | | | | | | | | | | | | | | |
| | | | |
| Description | | Interest
Rate | | Maturity
Date | | | Principal
Amount (000)# | | | Value | |
| | | | |
BANK LOANS (Continued) | | | | | | | | | | | | | | | | |
| | | | |
Healthcare-Services (cont’d.) | | | | | | | | | | | | | | | | |
Mamba Purchaser, Inc.,
Initial Term Loan, 1 Month LIBOR + 3.500% | | | 5.662%(c) | | | | 10/16/28 | | | | 50 | | | $ | 48,628 | |
Phoenix Guarantor, Inc.,
Tranche B-1 Term Loan, 1 Month LIBOR + 3.250% | | | 5.774(c) | | | | 03/05/26 | | | | 125 | | | | 120,521 | |
Radnet Management, Inc.,
First Lien Initial Term Loan, 1 Month LIBOR + 3.000% | | | 5.493(c) | | | | 04/23/28 | | | | 90 | | | | 87,080 | |
Surgery Center Holdings, Inc.,
2021 New Term Loan, 1 Month LIBOR + 3.750% | | | 6.140(c) | | | | 08/31/26 | | | | 100 | | | | 96,561 | |
U.S. Anesthesia Partners, Inc.,
Initial Term Loan, 1 Month LIBOR + 4.250% | | | 6.623(c) | | | | 10/02/28 | | | | 50 | | | | 47,796 | |
Upstream Newco, Inc.,
August 2021 Incremental Term Loan, 1 Month SOFR + 4.250% | | | 6.820(c) | | | | 11/20/26 | | | | 75 | | | | 71,008 | |
WP CityMD Bidco LLC,
Second Amendment Refinancing Term Loan, 1 Month LIBOR + 3.250% | | | 5.504(c) | | | | 12/22/28 | | | | 75 | | | | 72,849 | |
| | | | | | | | | | | | | | | | |
| | | | |
| | | | | | | | | | | | | | | 1,394,853 | |
| | | | |
Holding Companies-Diversified 0.3% | | | | | | | | | | | | | | | | |
Belfor Holdings, Inc.,
First Lien Tranche B-2 Term Loan, 1 Month SOFR + 4.250%^ | | | 6.705(c) | | | | 04/06/26 | | | | 100 | | | | 98,500 | |
| | | | |
Home Furnishings 0.6% | | | | | | | | | | | | | | | | |
AI Aqua Merger Sub, Inc.,
Term Loan | | | — (p) | | | | 07/30/28 | | | | 23 | | | | 22,228 | |
Culligan,
Term Loan | | | — (p) | | | | 07/30/28 | | | | 102 | | | | 97,803 | |
Snap One Holdings Corp.,
Term Loan, 6 Month LIBOR + 4.500% | | | 7.377(c) | | | | 12/08/28 | | | | 75 | | | | 68,188 | |
| | | | | | | | | | | | | | | | |
| | | | |
| | | | | | | | | | | | | | | 188,219 | |
| | | | |
Household Products/Wares 0.2% | | | | | | | | | | | | | | | | |
Kronos Acquisition Holdings, Inc. (Canada),
Tranche B-1 Term Loan, 3 Month LIBOR + 3.750% | | | 6.820(c) | | | | 12/22/26 | | | | 75 | | | | 71,818 | |
See Notes to Financial Statements.
182
PGIM Floating Rate Income ETF
Schedule of Investments (continued)
as of August 31, 2022
| | | | | | | | | | | | | | | | |
| | | | |
| Description | | Interest
Rate | | Maturity
Date | | | Principal
Amount (000)# | | | Value | |
| | | | |
BANK LOANS (Continued) | | | | | | | | | | | | | | | | |
| | | | |
Housewares 0.5% | | | | | | | | | | | | | | | | |
Lifetime Brands, Inc.,
Tranche B Term Loan, 1 Month LIBOR + 3.500%^ | | | 6.024%(c) | | | | 02/28/25 | | | | 75 | | | $ | 72,375 | |
SWF Holdings I Corp.,
Initial Term Loan, 1 Month LIBOR + 4.000% | | | 6.368(c) | | | | 10/06/28 | | | | 125 | | | | 108,984 | |
| | | | | | | | | | | | | | | | |
| | | | |
| | | | | | | | | | | | | | | 181,359 | |
| | | | |
Insurance 1.8% | | | | | | | | | | | | | | | | |
Acrisure LLC,
First Lien 2021-1 Additioanl Term Loan, 1 Month LIBOR + 3.750% | | | 6.274(c) | | | | 02/15/27 | | | | 200 | | | | 192,125 | |
AmWINS Group, Inc.,
Term Loan, 1 Month LIBOR + 2.250% | | | 4.774(c) | | | | 02/19/28 | | | | 90 | | | | 87,791 | |
Asurion LLC,
New B-10 Term Loan, 3 Month SOFR + 4.100% | | | 6.401(c) | | | | 08/19/28 | | | | 116 | | | | 108,170 | |
New B-9 Term Loan, 1 Month LIBOR + 3.250% | | | 5.774(c) | | | | 07/31/27 | | | | 199 | | | | 182,289 | |
Second Lien Term Loan B3, 1 Month LIBOR + 5.250% | | | 7.774(c) | | | | 01/31/28 | | | | 50 | | | | 42,812 | |
| | | | | | | | | | | | | | | | |
| | | | |
| | | | | | | | | | | | | | | 613,187 | |
| | | | |
Internet 0.8% | | | | | | | | | | | | | | | | |
CMI Marketing, Inc.,
Term Loan B, 1 Month LIBOR + 4.250%^ | | | 6.743(c) | | | | 03/23/28 | | | | 100 | | | | 92,267 | |
MH Sub I LLC,
2020 June New Term Loan, 1 Month LIBOR + 3.750% | | | 6.274(c) | | | | 09/13/24 | | | | 100 | | | | 97,484 | |
Northwest Fiber LLC,
First Lien Term B-2 Loan, 1 Month LIBOR + 3.750% | | | 6.127(c) | | | | 04/30/27 | | | | 100 | | | | 93,680 | |
| | | | | | | | | | | | | | | | |
| | | | |
| | | | | | | | | | | | | | | 283,431 | |
| | | | |
Investment Companies 0.4% | | | | | | | | | | | | | | | | |
EIG Management Co. LLC,
Initial Term Loan, 1 Month LIBOR + 3.750% | | | 6.274(c) | | | | 02/24/25 | | | | 125 | | | | 122,181 | |
See Notes to Financial Statements.
PGIM Fixed Income ETFs 183
PGIM Floating Rate Income ETF
Schedule of Investments (continued)
as of August 31, 2022
| | | | | | | | | | | | | | | | |
| | | | |
| Description | | Interest
Rate | | Maturity
Date | | | Principal
Amount (000)# | | | Value | |
| | | | |
BANK LOANS (Continued) | | | | | | | | | | | | | | | | |
| | | | |
Leisure Time 0.8% | | | | | | | | | | | | | | | | |
Fender Musical Instruments Corp.,
Initial Term Loan, 1 Month SOFR + 4.000%^ | | | 6.393%(c) | | | | 12/01/28 | | | | 75 | | | $ | 71,456 | |
Recess Holdings, Inc.,
Initial Term Loan (First Lien), 3 Month LIBOR + 3.750% | | | 6.556(c) | | | | 09/30/24 | | | | 200 | | | | 194,995 | |
| | | | | | | | | | | | | | | | |
| | | | |
| | | | | | | | | | | | | | | 266,451 | |
| | | | |
Lodging 0.6% | | | | | | | | | | | | | | | | |
Caesars Resort Collection LLC,
Term B Loan, 1 Month LIBOR + 2.750% | | | 5.274(c) | | | | 12/23/24 | | | | 75 | | | | 73,738 | |
Fertitta Entertainment LLC,
Initial B Term Loan, 1 Month SOFR + 4.000% | | | 6.455(c) | | | | 01/27/29 | | | | 50 | | | | 47,800 | |
Spectacle Gary Holdings LLC,
Term B Loan, 1 Month LIBOR + 4.250%^ | | | 6.743(c) | | | | 12/11/28 | | | | 75 | | | | 72,000 | |
| | | | | | | | | | | | | | | | |
| | | | |
| | | | | | | | | | | | | | | 193,538 | |
| | | | |
Machinery-Construction & Mining 0.3% | | | | | | | | | | | | | | | | |
Vertiv Group Corp.,
Term B Loan, 1 Month LIBOR + 2.750% | | | 5.112(c) | | | | 03/02/27 | | | | 100 | | | | 96,006 | |
| | | | |
Machinery-Diversified 2.3% | | | | | | | | | | | | | | | | |
ASP Blade Holdings, Inc.,
Initial Term Loan, 1 Month LIBOR + 4.000% | | | 6.524(c) | | | | 10/13/28 | | | | 135 | | | | 125,217 | |
Clark Equipment Co. (South Korea),
Term Loan, 3 Month SOFR + 2.500% | | | 4.654(c) | | | | 04/20/29 | | | | 150 | | | | 148,578 | |
Columbus McKinnon Corp.,
Initial Term Loan, 3 Month LIBOR + 2.750% | | | 5.063(c) | | | | 05/15/28 | | | | 74 | | | | 72,405 | |
CPM Holdings, Inc.,
First Lien Initial Term Loan, 1 Month LIBOR + 3.500% | | | 5.873(c) | | | | 11/17/25 | | | | 75 | | | | 73,240 | |
Gardner Denver, Inc.,
New Tranche B-1 Dollar Term Loan, 1 Month LIBOR + 1.850% | | | 4.305(c) | | | | 03/01/27 | | | | 75 | | | | 73,515 | |
Pro Mach Group, Inc.,
Initial Term Loan, 1 Month LIBOR + 4.000% | | | 6.524(c) | | | | 08/31/28 | | | | 65 | | | | 63,342 | |
Project Castle, Inc.,
Initial Term Loan, 3 Month SOFR + 5.500%^ | | | 6.900(c) | | | | 06/01/29 | | | | 75 | | | | 68,625 | |
See Notes to Financial Statements.
184
PGIM Floating Rate Income ETF
Schedule of Investments (continued)
as of August 31, 2022
| | | | | | | | | | | | | | | | |
| | | | |
| Description | | Interest
Rate | | Maturity
Date | | | Principal
Amount (000)# | | | Value | |
| | | | |
BANK LOANS (Continued) | | | | | | | | | | | | | | | | |
| | | | |
Machinery-Diversified (cont’d.) | | | | | | | | | | | | | | | | |
Vantage Elevator Solutions,
First Lien Initial Term Loan, 3 Month LIBOR + 3.750%^ | | | 5.813%(c) | | | | 11/17/28 | | | | 75 | | | $ | 71,625 | |
Vertical Midco Gmbh (Germany),
Term Loan B, 6 Month LIBOR + 3.500% | | | 6.871(c) | | | | 07/30/27 | | | | 100 | | | | 96,653 | |
| | | | | | | | | | | | | | | | |
| | | | |
| | | | | | | | | | | | | | | 793,200 | |
| | | | |
Media 4.0% | | | | | | | | | | | | | | | | |
Charter Communications Operating LLC,
Term Loan B-2, 1 Month LIBOR + 1.750% | | | 4.280(c) | | | | 02/01/27 | | | | 324 | | | | 313,805 | |
CSC Holdings LLC,
September 2019 Term Loan, 1 Month LIBOR + 2.500% | | | 4.891(c) | | | | 04/15/27 | | | | 125 | | | | 120,235 | |
Diamond Sports Group LLC,
Second Lien Term Loan, 1 Month SOFR + 3.350% | | | 5.637(c) | | | | 08/24/26 | | | | 399 | | | | 71,891 | |
Entercom Media Corp.,
Term Loan B-2, 1 Month LIBOR + 2.500% | | | 4.993(c) | | | | 11/18/24 | | | | 75 | | | | 65,109 | |
iHeartCommunications, Inc.,
New Term Loan, 1 Month LIBOR + 3.000% | | | 5.524(c) | | | | 05/01/26 | | | | 130 | | | | 125,396 | |
Radiate Holdco LLC,
Amendment No. 6 New Term Loan, 1 Month LIBOR + 3.250% | | | 5.774(c) | | | | 09/25/26 | | | | 125 | | | | 118,653 | |
Sinclair Television Group, Inc.,
Term B-3 Loan, 1 Month LIBOR + 3.000% | | | 5.530(c) | | | | 04/01/28 | | | | 200 | | | | 189,250 | |
Univision Communications, Inc.,
Initial First Lien Term Loan, 1 Month LIBOR + 3.250% | | | 5.774(c) | | | | 01/31/29 | | | | 100 | | | | 96,695 | |
Term Loan B, 3 Month SOFR + 4.250% | | | 6.254(c) | | | | 06/24/29 | | | | 50 | | | | 49,000 | |
WideOpenWest Finance LLC,
Term B Loan, 1 Month SOFR + 3.000% | | | 5.300(c) | | | | 12/20/28 | | | | 199 | | | | 195,359 | |
| | | | | | | | | | | | | | | | |
| | | | |
| | | | | | | | | | | | | | | 1,345,393 | |
| | | | |
Metal Fabricate/Hardware 1.5% | | | | | | | | | | | | | | | | |
AZZ, Inc.,
Initial Term Loan, 1 Month SOFR + 4.400% | | | 6.893(c) | | | | 05/11/29 | | | | 200 | | | | 196,840 | |
Crosby U.S. Acquisition Corp.,
First Lien Initial Term Loan, 1 Month LIBOR + 4.750% | | | 7.194(c) | | | | 06/26/26 | | | | 100 | | | | 94,706 | |
See Notes to Financial Statements.
PGIM Fixed Income ETFs 185
PGIM Floating Rate Income ETF
Schedule of Investments (continued)
as of August 31, 2022
| | | | | | | | | | | | | | | | |
| | | | |
| Description | | Interest
Rate | | Maturity
Date | | | Principal
Amount (000)# | | | Value | |
| | | | |
BANK LOANS (Continued) | | | | | | | | | | | | | | | | |
| | | | |
Metal Fabricate/Hardware (cont’d.) | | | | | | | | | | | | | | | | |
Grinding Media, Inc.,
First Lien Initial Term Loan, 3 Month LIBOR + 4.000%^ | | | 4.796%(c) | | | | 10/12/28 | | | | 87 | | | $ | 83,789 | |
WireCo WorldGroup, Inc.,
Initial Term Loan, 3 Month LIBOR + 4.250% | | | 7.188(c) | | | | 11/13/28 | | | | 150 | | | | 147,187 | |
| | | | | | | | | | | | | | | | |
| | | | |
| | | | | | | | | | | | | | | 522,522 | |
| | | | |
Oil & Gas 0.9% | | | | | | | | | | | | | | | | |
Apro LLC,
Replacement Term Loan, 3 Month LIBOR + 3.750% | | | 5.380(c) | | | | 11/14/26 | | | | 75 | | | | 72,473 | |
Citgo Petroleum Corp.,
2019 Incremental Term B Loan, 1 Month LIBOR + 6.250% | | | 8.774(c) | | | | 03/28/24 | | | | 145 | | | | 144,225 | |
Delek U.S. Holdings, Inc.,
Term Loan, 1 Month LIBOR + 2.250% | | | 4.774(c) | | | | 03/31/25 | | | | 100 | | | | 97,531 | |
| | | | | | | | | | | | | | | | |
| | | | |
| | | | | | | | | | | | | | | 314,229 | |
| | | | |
Packaging & Containers 4.2% | | | | | | | | | | | | | | | | |
BWay Holding Co.,
Initial Term Loan, 1 Month LIBOR + 3.250% | | | 5.623(c) | | | | 04/03/24 | | | | 100 | | | | 97,369 | |
Charter Next Generation, Inc.,
Refinancing 2021 Term Loan, 3 Month LIBOR + 3.750% | | | 6.556(c) | | | | 12/01/27 | | | | 225 | | | | 217,410 | |
Clydesdale Acquisition Holdings, Inc.,
Term B Loan, 1 Month SOFR + 4.175% | | | 6.730(c) | | | | 04/13/29 | | | | 190 | | | | 183,231 | |
Graham Packaging Co., Inc.,
New Term Loan, 1 Month LIBOR + 3.000% | | | 5.524(c) | | | | 08/04/27 | | | | 100 | | | | 97,325 | |
Pactiv Evergreen Group Holdings, Inc.,
Tranche B-3 U.S. Term Loan, 1 Month LIBOR + 3.500% | | | 6.024(c) | | | | 09/25/28 | | | | 100 | | | | 96,881 | |
Pregis Topco LLC,
First Lien Initial Term Loan, 1 - 3 Month LIBOR + 4.000% | | | 6.688(c) | | | | 07/31/26 | | | | 50 | | | | 48,345 | |
Pretium PKG Holdings, Inc.,
First Lien Initial Term Loan, 1 - 3 Month LIBOR + 4.000% | | | 6.314(c) | | | | 10/02/28 | | | | 299 | | | | 280,967 | |
Proampac PG Borrower LLC,
2020-1 Term Loan, 1 - 3 Month LIBOR + 3.750% | | | 6.035(c) | | | | 11/03/25 | | | | 100 | | | | 97,000 | |
See Notes to Financial Statements.
186
PGIM Floating Rate Income ETF
Schedule of Investments (continued)
as of August 31, 2022
| | | | | | | | | | | | | | | | |
| | | | |
| Description | | Interest
Rate | | Maturity
Date | | | Principal
Amount (000)# | | | Value | |
| | | | |
BANK LOANS (Continued) | | | | | | | | | | | | | | | | |
| | | | |
Packaging & Containers (cont’d.) | | | | | | | | | | | | | | | | |
Reynolds Group Holdings, Inc.,
Tranche B-2 US Term Loan, 1 Month LIBOR + 3.250% | | | 5.774%(c) | | | | 02/05/26 | | | | 100 | | | $ | 97,253 | |
Trident TPI Holdings, Inc.,
Tranche B-1 Term Loan, 3 Month LIBOR + 3.250% | | | 5.500(c) | | | | 10/17/24 | | | | 100 | | | | 98,318 | |
Tranche B-3 DDTL Commitments, 3 Month LIBOR + 4.000% | | | 6.250(c) | | | | 09/15/28 | | | | 12 | | | | 12,020 | |
Tranche B-3 Initial Term Loans, 3 Month LIBOR + 4.000% | | | 6.250(c) | | | | 09/15/28 | | | | 87 | | | | 84,456 | |
| | | | | | | | | | | | | | | | |
| | | | |
| | | | | | | | | | | | | | | 1,410,575 | |
| | | | |
Pharmaceuticals 2.3% | | | | | | | | | | | | | | | | |
Amneal Pharmaceuticals LLC,
Initial Term Loan, 1 - 3 Month LIBOR + 3.500% | | | 5.938(c) | | | | 05/04/25 | | | | 200 | | | | 190,426 | |
Bausch Health Cos., Inc.,
Second Amendment Term Loan, 1 Month SOFR + 5.350% | | | 7.662(c) | | | | 02/01/27 | | | | 125 | | | | 99,509 | |
Change Healthcare Holdings LLC,
Closing Date Term Loan, 1 Month LIBOR + 2.500% | | | 5.024(c) | | | | 03/01/24 | | | | 225 | | | | 223,347 | |
Gainwell Acquisition Corp.,
Term B Loan, 3 Month LIBOR + 4.000% | | | 6.250(c) | | | | 10/01/27 | | | | 150 | | | | 145,880 | |
Milk Specialties Co.,
2021 Refinancing Term Loan, 3 Month LIBOR + 4.000% | | | 6.250(c) | | | | 08/15/25 | | | | 125 | | | | 122,628 | |
| | | | | | | | | | | | | | | | |
| | | | |
| | | | | | | | | | | | | | | 781,790 | |
| | | | |
Pipelines 1.2% | | | | | | | | | | | | | | | | |
AL GCX Holdings LLC,
Term Loan B, 1 Month SOFR + 3.900% | | | 6.066(c) | | | | 05/17/29 | | | | 75 | | | | 73,969 | |
BCP Renaissance Parent LLC,
Term Loan, 3 Month SOFR + 3.500% | | | 5.554(c) | | | | 10/31/26 | | | | 150 | | | | 147,375 | |
Prairie ECI Acquiror, LP,
Initial Term Loan, 1 Month LIBOR + 4.750% | | | 7.274(c) | | | | 03/11/26 | | | | 200 | | | | 190,286 | |
| | | | | | | | | | | | | | | | |
| | | | |
| | | | | | | | | | | | | | | 411,630 | |
| | | | |
Real Estate 0.7% | | | | | | | | | | | | | | | | |
Brookfield Property REIT, Inc.,
Initial Term B Loan, 1 Month SOFR + 2.500% | | | 5.055(c) | | | | 08/27/25 | | | | 247 | | | | 243,095 | |
See Notes to Financial Statements.
PGIM Fixed Income ETFs 187
PGIM Floating Rate Income ETF
Schedule of Investments (continued)
as of August 31, 2022
| | | | | | | | | | | | | | | | |
| | | | |
| Description | | Interest
Rate | | Maturity
Date | | | Principal
Amount (000)# | | | Value | |
| | | | |
BANK LOANS (Continued) | | | | | | | | | | | | | | | | |
| | | | |
Real Estate Investment Trusts (REITs) 0.9% | | | | | | | | | | | | | | | | |
Blackstone Mortgage Trust, Inc.,
Term Loan, 1 Month LIBOR + 2.750% | | | 5.274%(c) | | | | 04/23/26 | | | | 100 | | | $ | 96,875 | |
Term Loan, 1 Month SOFR + 3.500%^ | | | 5.955(c) | | | | 05/09/29 | | | | 200 | | | | 195,000 | |
| | | | | | | | | | | | | | | | |
| | | | |
| | | | | | | | | | | | | | | 291,875 | |
| | | | |
Retail 4.4% | | | | | | | | | | | | | | | | |
Dave & Buster’s, Inc.,
Term Loan, 1 Month SOFR + 5.000% | | | 7.427(c) | | | | 06/29/29 | | | | 75 | | | | 73,087 | |
EG America LLC (United Kingdom),
Additional Facility Loan, 3 Month LIBOR + 4.000% | | | 6.250(c) | | | | 02/07/25 | | | | 100 | | | | 97,015 | |
Project Becker Additional Facility, 3 Month LIBOR + 4.250% | | | 6.500(c) | | | | 03/31/26 | | | | 100 | | | | 97,406 | |
Empire Today LLC,
Closing Date Term Loan, 1 Month LIBOR + 5.000% | | | 7.373(c) | | | | 04/03/28 | | | | 125 | | | | 100,223 | |
Fogo de Chao, Inc.,
2018 Refinancing Term Loan, 1 Month LIBOR + 4.250% | | | 6.774(c) | | | | 04/07/25 | | | | 125 | | | | 118,646 | |
Foundation Building Materials, Inc.,
Initial Term Loan (First Lien), 1 - 3 Month LIBOR + 3.250% | | | 6.056(c) | | | | 01/31/28 | | | | 100 | | | | 94,939 | |
Great Outdoors Group LLC,
Term B-2 Loan, 1 Month LIBOR + 3.750% | | | 6.274(c) | | | | 03/06/28 | | | | 150 | | | | 144,620 | |
LBM Acquisition LLC,
First Lien Initial Term Loan, 6 Month LIBOR + 3.750% | | | 7.121(c) | | | | 12/17/27 | | | | 150 | | | | 136,209 | |
Pacific Bells LLC,
Initial Term Loan, 3 Month SOFR + 4.500% | | | 6.816(c) | | | | 11/10/28 | | | | 100 | | | | 95,500 | |
Park River Holdings, Inc.,
Intial Term Loan, 3 Month LIBOR + 3.250% | | | 5.527(c) | | | | 12/28/27 | | | | 175 | | | | 158,256 | |
Petco Health & Wellness Co., Inc.,
First Lien Initial Term Loan, 3 Month LIBOR + 3.250% | | | 5.500(c) | | | | 03/03/28 | | | | 100 | | | | 96,481 | |
Pilot Travel Centers LLC,
Initial Tranche B Term Loan, 1 Month SOFR + 2.000% | | | 4.555(c) | | | | 08/04/28 | | | | 100 | | | | 97,454 | |
See Notes to Financial Statements.
188
PGIM Floating Rate Income ETF
Schedule of Investments (continued)
as of August 31, 2022
| | | | | | | | | | | | | | | | |
| | | | |
| Description | | Interest
Rate | | Maturity
Date | | | Principal
Amount (000)# | | | Value | |
| | | | |
BANK LOANS (Continued) | | | | | | | | | | | | | | | | |
| | | | |
Retail (cont’d.) | | | | | | | | | | | | | | | | |
SRS Distribution, Inc.,
2021 Refinancing Term Loan, 3 Month LIBOR + 3.500% | | | 6.306%(c) | | | | 06/02/28 | | | | 100 | | | $ | 95,571 | |
White Cap Buyer LLC,
Initial Closing Date Term Loan, 1 Month SOFR + 3.750% | | | 6.205(c) | | | | 10/19/27 | | | | 100 | | | | 96,196 | |
| | | | | | | | | | | | | | | | |
| | | | |
| | | | | | | | | | | | | | | 1,501,603 | |
| | | | |
Semiconductors 0.4% | | | | | | | | | | | | | | | | |
Altar Bidco, Inc.,
Initial Term Loan, 6 - 12 Month SOFR + 3.350% | | | 5.750(c) | | | | 02/01/29 | | | | 100 | | | | 95,875 | |
Natel Engineering Co., Inc.,
Initial Term Loan, 3 Month LIBOR + 6.250%^ | | | 7.743(c) | | | | 04/30/26 | | | | 50 | | | | 46,120 | |
| | | | | | | | | | | | | | | | |
| | | | |
| | | | | | | | | | | | | | | 141,995 | |
| | | | |
Software 10.3% | | | | | | | | | | | | | | | | |
AppLovin Corp.,
Amendment No. 6 New Term Loans, 3 Month LIBOR + 3.000% | | | 5.250(c) | | | | 10/25/28 | | | | 200 | | | | 194,100 | |
athenahealth, Inc.,
Initial Term Loan, 1 Month SOFR + 3.500% | | | 5.800(c) | | | | 02/15/29 | | | | 171 | | | | 162,748 | |
Boxer Parent Co., Inc.,
2021 Replacement Dollar Term Loan, 1 Month LIBOR + 3.750% | | | 6.274(c) | | | | 10/02/25 | | | | 150 | | | | 144,034 | |
Second Lien Incremental Term Loan, 1 Month LIBOR + 5.500% | | | 8.024(c) | | | | 02/27/26 | | | | 125 | | | | 117,000 | |
CDK Global, Inc.,
Initial Term Loan, 3 Month SOFR + 4.500% | | | 6.610(c) | | | | 07/06/29 | | | | 225 | | | | 218,625 | |
Cloudera, Inc.,
Initial Term Loan, 1 Month LIBOR + 3.750% | | | 6.274(c) | | | | 10/08/28 | | | | 115 | | | | 109,404 | |
ConnectWise LLC,
Initial Term Loans, 3 Month LIBOR + 3.500% | | | 5.750(c) | | | | 09/29/28 | | | | 50 | | | | 48,291 | |
Cornerstone OnDemand, Inc.,
Initial Term Loans, 1 Month LIBOR + 3.750% | | | 6.274(c) | | | | 10/16/28 | | | | 200 | | | | 186,750 | |
CT Technologies Intermediate Holdings, Inc.,
Term Loan 2021 Reprice, 1 Month LIBOR + 4.250% | | | 6.774(c) | | | | 12/16/25 | | | | 75 | | | | 71,070 | |
See Notes to Financial Statements.
PGIM Fixed Income ETFs 189
PGIM Floating Rate Income ETF
Schedule of Investments (continued)
as of August 31, 2022
| | | | | | | | | | | | | | | | |
| | | | |
| Description | | Interest
Rate | | Maturity
Date | | | Principal
Amount (000)# | | | Value | |
| | | | |
BANK LOANS (Continued) | | | | | | | | | | | | | | | | |
| | | | |
Software (cont’d.) | | | | | | | | | | | | | | | | |
Dun & Bradstreet Corp.,
2022 Incremental Term B-2 Loan, 1 Month SOFR + 3.250% | | | 5.709%(c) | | | | 01/18/29 | | | | 250 | | | $ | 243,646 | |
EagleView Technology Corp.,
First Lien Term Loan, 3 Month LIBOR + 3.500% | | | 5.750(c) | | | | 08/14/25 | | | | 100 | | | | 93,937 | |
Finastra USA, Inc.,
Dollar Term Loan (Second Lien), 6 Month LIBOR + 7.250% | | | 10.621(c) | | | | 06/13/25 | | | | 100 | | | | 88,312 | |
First Lien Dollar Term Loan, 6 Month LIBOR + 3.500% | | | 6.871(c) | | | | 06/13/24 | | | | 249 | | | | 232,337 | |
Greeneden U.S. Holdings II LLC,
B-4 Dollar Term Loan, 1 Month LIBOR + 4.000% | | | 6.524(c) | | | | 12/01/27 | | | | 75 | | | | 73,434 | |
HS Purchaser LLC,
Term Loan, 3 Month SOFR + 4.000% | | | 6.559(c) | | | | 11/19/26 | | | | 75 | | | | 72,222 | |
MH Sub I LLC,
Amendment No. 2 Initial Term Loan (First Lien), 1 Month LIBOR + 3.750% | | | 6.274(c) | | | | 09/13/24 | | | | 75 | | | | 72,747 | |
Polaris Newco LLC,
First Lien Dollar Term Loan, 1 Month LIBOR + 4.000% | | | 6.524(c) | | | | 06/02/28 | | | | 100 | | | | 95,622 | |
Rackspace Technology Global, Inc.,
Term B Loan, 3 Month LIBOR + 2.750% | | | 5.617(c) | | | | 02/15/28 | | | | 100 | | | | 80,646 | |
Red Planet Borrower LLC,
First Lien Initial Term Loan, 1 Month LIBOR + 3.750%^ | | | 6.274(c) | | | | 10/02/28 | | | | 100 | | | | 81,295 | |
Renaissance Holding Corp.,
Term Loan, 1 Month SOFR + 4.500% | | | 7.095(c) | | | | 03/30/29 | | | | 117 | | | | 113,929 | |
Skillsoft Finance II, Inc.,
Initial Term Loan, 1 Month SOFR + 5.250% | | | 7.652(c) | | | | 07/14/28 | | | | 190 | | | | 182,130 | |
Sovos Compliance LLC,
First Lien Initial Term Loan, 1 Month LIBOR + 4.500% | | | 7.024(c) | | | | 08/11/28 | | | | 100 | | | | 97,092 | |
TIBCO Software, Inc.,
Term Loan B-3, 1 Month LIBOR + 3.750% | | | 6.280(c) | | | | 06/30/26 | | | | 698 | | | | 693,520 | |
| | | | | | | | | | | | | | | | |
| | | | |
| | | | | | | | | | | | | | | 3,472,891 | |
| | | | |
Telecommunications 7.8% | | | | | | | | | | | | | | | | |
CCI Buyer, Inc.,
First Lien Initial Term Loan, 3 Month SOFR + 4.000% | | | 6.054(c) | | | | 12/17/27 | | | | 250 | | | | 239,601 | |
Cincinnati Bell, Inc.,
Term B-2 Loan, 1 Month SOFR + 3.350% | | | 5.805(c) | | | | 11/22/28 | | | | 100 | | | | 97,455 | |
See Notes to Financial Statements.
190
PGIM Floating Rate Income ETF
Schedule of Investments (continued)
as of August 31, 2022
| | | | | | | | | | | | | | | | |
| | | | |
| Description | | Interest
Rate | | Maturity
Date | | | Principal
Amount (000)# | | | Value | |
| | | | |
BANK LOANS (Continued) | | | | | | | | | | | | | | | | |
| | | | |
Telecommunications (cont’d.) | | | | | | | | | | | | | | | | |
CommScope, Inc.,
Initial Term Loan, 1 Month LIBOR + 3.250% | | | 5.774%(c) | | | | 04/06/26 | | | | 75 | | | $ | 71,067 | |
Connect Finco Sarl (United Kingdom),
Amendment No. 1 Refinancing Term Loan, 1 Month LIBOR + 3.500% | | | 6.030(c) | | | | 12/11/26 | | | | 105 | | | | 101,459 | |
Crown Subsea Communications Holding, Inc.,
Initial Term Loan, 1 Month LIBOR + 4.750% | | | 7.123(c) | | | | 04/27/27 | | | | 200 | | | | 194,500 | |
Digicel International Finance Ltd. (Saint Lucia),
First Lien Initial Term B Loan, 1 Month LIBOR + 3.250% | | | 5.774(c) | | | | 05/27/24 | | | | 130 | | | | 119,179 | |
Global Tel Link Corp.,
First Lien Term Loan, 3 Month LIBOR + 4.250% | | | 7.056(c) | | | | 11/29/25 | | | | 100 | | | | 91,866 | |
Gogo Intermediate Holdings LLC,
Initial Term Loan, 3 Month LIBOR + 3.750% | | | 6.556(c) | | | | 04/30/28 | | | | 200 | | | | 195,361 | |
Intelsat Jackson Holdings SA (Luxembourg),
Term B Loan, 3 Month SOFR + 4.250% | | | 7.445(c) | | | | 02/01/29 | | | | 310 | | | | 293,384 | |
Iridium Satellite LLC,
Term B-2 Loan, 1 Month LIBOR + 2.500% | | | 5.024(c) | | | | 11/04/26 | | | | 100 | | | | 98,332 | |
Maxar Technologies, Inc.,
Initial Term Loan, 1 Month SOFR + 4.250% | | | 6.805(c) | | | | 06/14/29 | | | | 250 | | | | 240,521 | |
MLN U.S. HoldCo., LLC,
Term B Loan (First Lien), 1 Month LIBOR + 4.500% | | | 6.873(c) | | | | 11/30/25 | | | | 50 | | | | 26,500 | |
ORBCOMM, Inc.,
Closing Date Term Loan, 1 - 3 Month LIBOR + 4.250% | | | 6.956(c) | | | | 09/01/28 | | | | 100 | | | | 94,512 | |
Patagonia Holdco LLC,
Term Loan, 3 Month SOFR + 5.750% | | | 8.386(c) | | | | 08/01/29 | | | | 140 | | | | 118,300 | |
Securus Technologies Holdings, Inc.,
Initial Term Loan (First Lien), 3 Month LIBOR + 4.500% | | | 6.750(c) | | | | 11/01/24 | | | | 100 | | | | 89,516 | |
Viasat, Inc.,
Initial Term Loan, 1 Month SOFR + 4.614% | | | 7.070(c) | | | | 03/02/29 | | | | 175 | | | | 160,672 | |
West Corp.,
Initial Term B Loan, 1 Month LIBOR + 4.000% | | | 6.524(c) | | | | 10/10/24 | | | | 250 | | | | 203,125 | |
Xplornet Communications, Inc. (Canada),
Refinancing Term Loan, 1 Month LIBOR + 4.000% | | | 6.524(c) | | | | 10/02/28 | | | | 100 | | | | 91,769 | |
Zacapa Sarl (Luxembourg),
Initial Term Loans 2022, 3 Month SOFR + 4.250% | | | 6.304(c) | | | | 03/22/29 | | | | 125 | | | | 120,323 | |
| | | | | | | | | | | | | | | | |
| | | | |
| | | | | | | | | | | | | | | 2,647,442 | |
See Notes to Financial Statements.
PGIM Fixed Income ETFs 191
PGIM Floating Rate Income ETF
Schedule of Investments (continued)
as of August 31, 2022
| | | | | | | | | | | | | | | | |
| | | | |
| Description | | Interest
Rate | | Maturity
Date | | | Principal
Amount (000)# | | | Value | |
| | | | |
BANK LOANS (Continued) | | | | | | | | | | | | | | | | |
| | | | |
Textiles 0.4% | | | | | | | | | | | | | | | | |
ASP Unifrax Holdings, Inc.,
USD Term Loan (First Lien), 3 Month LIBOR + 3.750% | | | 6.000%(c) | | | | 12/12/25 | | | | 150 | | | $ | 137,924 | |
| | | | |
Transportation 1.4% | | | | | | | | | | | | | | | | |
Daseke Cos., Inc.,
Term Loan, 1 Month LIBOR + 4.000% | | | 6.370(c) | | | | 03/09/28 | | | | 62 | | | | 60,368 | |
First Student Bidco, Inc.,
2022 Incremental Term B Loans, 3 Month SOFR + 4.100% | | | 6.154(c) | | | | 07/21/28 | | | | 164 | | | | 157,705 | |
Incremental Term C Loan, 3 Month SOFR + 4.100% | | | 6.154(c) | | | | 07/21/28 | | | | 11 | | | | 10,952 | |
LaserShip, Inc.,
First Lien Initial Term Loan, 3 Month LIBOR + 4.500% | | | 7.377(c) | | | | 05/08/28 | | | | 50 | | | | 44,014 | |
PODS LLC,
Term Loan, 1 Month LIBOR + 3.000% | | | 5.524(c) | | | | 03/31/28 | | | | 75 | | | | 72,260 | |
Savage Enterprises LLC,
Term Loan B, 1 Month LIBOR + 3.250% | | | 5.700(c) | | | | 09/15/28 | | | | 73 | | | | 71,989 | |
XPO Logistics, Inc.,
Refinancing Term Loan, 1 Month LIBOR + 1.750% | | | 4.123(c) | | | | 02/24/25 | | | | 50 | | | | 48,992 | |
| | | | | | | | | | | | | | | | |
| | | | |
| | | | | | | | | | | | | | | 466,280 | |
| | | | | | | | | | | | | | | | |
| | | | |
TOTAL BANK LOANS
(cost $29,925,360) | | | | | | | | | | | | | | | 29,706,451 | |
| | | | | | | | | | | | | | | | |
| | | | |
CORPORATE BONDS 7.2% | | | | | | | | | | | | | | | | |
| | | | |
Auto Manufacturers 0.3% | | | | | | | | | | | | | | | | |
General Motors Co.,
Sr. Unsec’d. Notes | | | 5.600 | | | | 10/15/32 | | | | 105 | | | | 100,649 | |
| | | | |
Banks 4.6% | | | | | | | | | | | | | | | | |
Bank of America Corp.,
Jr. Sub. Notes, Series MM | | | 4.300(ff) | | | | 01/28/25(oo) | | | | 150 | | | | 125,801 | |
Jr. Sub. Notes, Series RR | | | 4.375(ff) | | | | 01/27/27(oo) | | | | 150 | | | | 128,714 | |
Citigroup, Inc.,
Jr. Sub. Notes, Series V | | | 4.700(ff) | | | | 01/30/25(oo) | | | | 400 | | | | 338,704 | |
Goldman Sachs Group, Inc. (The),
Jr. Sub. Notes, Series U | | | 3.650(ff) | | | | 08/10/26(oo) | | | | 100 | | | | 81,396 | |
Jr. Sub. Notes, Series V | | | 4.125(ff) | | | | 11/10/26(oo) | | | | 200 | | | | 171,554 | |
See Notes to Financial Statements.
192
PGIM Floating Rate Income ETF
Schedule of Investments (continued)
as of August 31, 2022
| | | | | | | | | | | | | | | | |
| | | | |
| Description | | Interest
Rate | | Maturity
Date | | | Principal
Amount (000)# | | | Value | |
| | | | |
CORPORATE BONDS (Continued) | | | | | | | | | | | | | | | | |
| | | | |
Banks (cont’d.) | | | | | | | | | | | | | | | | |
JPMorgan Chase & Co.,
Jr. Sub. Notes, Series HH | | | 4.600%(ff) | | | | 02/01/25(oo) | | | | 800 | | | $ | 701,228 | |
| | | | | | | | | | | | | | | | |
| | | | |
| | | | | | | | | | | | | | | 1,547,397 | |
| | | | |
Building Materials 0.1% | | | | | | | | | | | | | | | | |
SRM Escrow Issuer LLC,
Sr. Sec’d. Notes, 144A | | | 6.000 | | | | 11/01/28 | | | | 50 | | | | 45,327 | |
| | | | |
Commercial Services 0.4% | | | | | | | | | | | | | | | | |
Adtalem Global Education, Inc.,
Sr. Sec’d. Notes, 144A | | | 5.500 | | | | 03/01/28 | | | | 150 | | | | 141,569 | |
| | | | |
Electric 0.5% | | | | | | | | | | | | | | | | |
Calpine Corp.,
Sr. Unsec’d. Notes, 144A | | | 4.625 | | | | 02/01/29 | | | | 100 | | | | 85,544 | |
Vistra Corp.,
Jr. Sub. Notes, 144A | | | 7.000(ff) | | | | 12/15/26(oo) | | | | 100 | | | | 93,000 | |
| | | | | | | | | | | | | | | | |
| | | | |
| | | | | | | | | | | | | | | 178,544 | |
| | | | |
Healthcare-Products 0.2% | | | | | | | | | | | | | | | | |
Medline Borrower LP,
Sr. Sec’d. Notes, 144A | | | 3.875 | | | | 04/01/29 | | | | 70 | | | | 59,272 | |
| | | | |
Media 0.2% | | | | | | | | | | | | | | | | |
Charter Communications Operating LLC/Charter Communications Operating Capital,
Sr. Sec’d. Notes | | | 4.400 | | | | 04/01/33 | | | | 75 | | | | 66,266 | |
| | | | |
Oil & Gas 0.2% | | | | | | | | | | | | | | | | |
MEG Energy Corp. (Canada),
Gtd. Notes, 144A | | | 7.125 | | | | 02/01/27 | | | | 80 | | | | 80,490 | |
| | | | |
Packaging & Containers 0.2% | | | | | | | | | | | | | | | | |
Sealed Air Corp.,
Gtd. Notes, 144A | | | 5.000 | | | | 04/15/29 | | | | 50 | | | | 47,556 | |
See Notes to Financial Statements.
PGIM Fixed Income ETFs 193
PGIM Floating Rate Income ETF
Schedule of Investments (continued)
as of August 31, 2022
| | | | | | | | | | | | | | | | |
| | | | |
| Description | | Interest
Rate | | Maturity
Date | | | Principal
Amount (000)# | | | Value | |
| | | | |
CORPORATE BONDS (Continued) | | | | | | | | | | | | | | | | |
| | | | |
Pipelines 0.4% | | | | | | | | | | | | | | | | |
Energy Transfer LP,
Sr. Unsec’d. Notes | | | 3.750% | | | | 05/15/30 | | | | 75 | | | $ | 67,590 | |
Targa Resources Corp.,
Gtd. Notes | | | 4.200 | | | | 02/01/33 | | | | 75 | | | | 67,425 | |
| | | | | | | | | | | | | | | | |
| | | | |
| | | | | | | | | | | | | | | 135,015 | |
| | | | |
Real Estate Investment Trusts (REITs) 0.1% | | | | | | | | | | | | | | | | |
Diversified Healthcare Trust,
Gtd. Notes | | | 4.375 | | | | 03/01/31 | | | | 60 | | | | 41,161 | |
| | | | | | | | | | | | | | | | |
| | | | |
TOTAL CORPORATE BONDS
(cost $2,494,910) | | | | | | | | | | | | | | | 2,443,246 | |
| | | | | | | | | | | | | | | | |
| | | | |
TOTAL LONG-TERM INVESTMENTS
(cost $33,225,837) | | | | | | | | | | | | | | | 32,958,083 | |
| | | | | | | | | | | | | | | | |
| | | | |
| | | | | | | | Shares | | | | |
| | | | |
SHORT-TERM INVESTMENT 16.8% | | | | | | | | | | | | | | | | |
| | | | |
UNAFFILIATED FUND | | | | | | | | | | | | | | | | |
Dreyfus Government Cash Management (Institutional Shares)
(cost $5,688,016) | | | | | | | | | | | 5,688,016 | | | | 5,688,016 | |
| | | | | | | | | | | | | | | | |
| | | | |
TOTAL INVESTMENTS 114.2%
(cost $38,913,853) | | | | | | | | | | | | | | | 38,646,099 | |
Liabilities in excess of other assets(z) (14.2)% | | | | | | | | | | | | | | | (4,818,519 | ) |
| | | | | | | | | | | | | | | | |
| | | | |
NET ASSETS 100.0% | | | | | | | | | | | | | | $ | 33,827,580 | |
| | | | | | | | | | | | | | | | |
See the Glossary for a list of the abbreviation(s) used in the annual report.
| # | Principal or notional amount is shown in U.S. dollars unless otherwise stated. |
| ^ | Indicates a Level 3 instrument. The aggregate value of Level 3 instruments is $2,321,759 and 6.9% of net assets. |
| (c) | Variable rate instrument. The interest rate shown reflects the rate in effect at August 31, 2022. |
| (ff) | Variable rate security. Security may be issued at a fixed coupon rate, which converts to a variable rate at a specified date. Rate shown is the rate in effect as of period end. |
| (oo) | Perpetual security. Maturity date represents next call date. |
| (p) | Represents a security with a delayed settlement and therefore the interest rate is not available until settlement which is after the period end. |
See Notes to Financial Statements.
194
PGIM Floating Rate Income ETF
Schedule of Investments (continued)
as of August 31, 2022
| (z) | Includes net unrealized appreciation/(depreciation) and/or market value of the below holdings which are excluded from the Schedule of Investments: |
Unfunded loan commitments outstanding at August 31, 2022:
| | | | | | | | | | | | | | | | | | | | |
Borrower | | Principal
Amount
(000)# | | Current
Value | | Unrealized
Appreciation | | Unrealized
Depreciation |
athenaHealth, Inc., Initial Delayed Draw Term Loan, 1 Month SOFR + 3.500%,
3.500%(c), Maturity Date 02/15/29 (cost $27,882) | | | | 29 | | | | $ | 27,627 | | | | $ | — | | | | $ | (255 | ) |
TMC Buyer, Inc., Delayed Draw Term Loan, 1 Month LIBOR + 0.000%, 1.000%(c), Maturity Date 06/30/28 (cost $2,935)^ | | | | 3 | | | | | 2,952 | | | | | 17 | | | | | — | |
Trident TPI Holdings, Inc., Tranche B-3 DDTL Commitments, 3 Month LIBOR + 4.000%, 6.250%(c), Maturity Date 09/15/28 (cost $4,418) | | | | 5 | | | | | 4,490 | | | | | 72 | | | | | — | |
| | | | | | | | | | | | | | | | | | | | |
| | | | | | | | $ | 35,069 | | | | $ | 89 | | | | $ | (255 | ) |
| | | | | | | | | | | | | | | | | | | | |
Futures contracts outstanding at August 31, 2022:
| | | | | | | | | | | | | | | | | | | | | | |
Number
of
Contracts | | Type | | | | Expiration
Date | | Current
Notional
Amount | | Value /
Unrealized
Appreciation
(Depreciation) |
| | | | | | | | | | | | | | | | | | | | | | |
| Short Positions: | | | | | | | | | | | | | | | | | | | | |
8 | | 5 Year U.S. Treasury Notes | | | | | | | | | Dec. 2022 | | | | $ | 886,563 | | | | $ | 3,187 | |
5 | | 10 Year U.S. Treasury Notes | | | | | | | | | Dec. 2022 | | | | | 584,531 | | | | | 2,188 | |
| | | | | | | | | | | | | | | | | | | | | | |
| | | | | | | | | | | | | | | | | | | | $ | 5,375 | |
| | | | | | | | | | | | | | | | | | | | | | |
Credit default swap agreements outstanding at August 31, 2022:
| | | | | | | | | | | | | | | | | | | | | | | | | | | | | | | | | | | |
Reference Entity/ Obligation | | Termination
Date | | Fixed
Rate | | Notional
Amount
(000)#(3) | | Implied Credit
Spread at
August 31,
2022(4) | | Value at
Trade Date | | Value at
August 31,
2022 | | Unrealized
Appreciation
(Depreciation) |
| | | | | | | | | | | | | | | | | | | | | | | | | | | | | | | | | | | |
Centrally Cleared Credit Default Swap Agreement on corporate and/or sovereign issues - Sell Protection(2): | |
CDX.NA.HY.38.V2 | | | | 06/20/27 | | | | | 5.000% | | | | | 594 | | | | | 5.325% | | | | $ | (1,625 | ) | | | $ | (1,256 | ) | | | $ | 369 | |
| | | | | | | | | | | | | | | | | | | | | | | | | | | | | | | | | | | |
The Fund entered into credit default swaps (“CDS”) to provide a measure of protection against defaults or to take an active long or short position with respect to the likelihood of a particular issuer’s default or the reference entity’s credit soundness. CDS contracts generally trade based on a spread which represents the cost a protection buyer has to pay the protection seller. The protection buyer is said to be short the credit as the value of the contract rises the more the credit deteriorates. The value of the CDS contract increases for the protection buyer if the spread increases.
| (1) | If the Fund is a buyer of protection, it pays the fixed rate. When a credit event occurs, as defined under the terms of that particular swap agreement, the Fund will either (i) receive from the seller of protection an amount equal to the notional |
See Notes to Financial Statements.
PGIM Fixed Income ETFs 195
PGIM Floating Rate Income ETF
Schedule of Investments (continued)
as of August 31, 2022
| | amount of the swap and make delivery of the referenced obligation or underlying securities comprising the referenced index or (ii) receive a net settlement amount in the form of cash or securities equal to the notional amount of the swap less the recovery value of the referenced obligation or underlying securities comprising the referenced index. |
| (2) | If the Fund is a seller of protection, it receives the fixed rate. When a credit event occurs, as defined under the terms of that particular swap agreement, the Fund will either (i) pay to the buyer of protection an amount equal to the notional amount of the swap and take delivery of the referenced obligation or underlying securities comprising the referenced index or (ii) pay a net settlement amount in the form of cash or securities equal to the notional amount of the swap less the recovery value of the referenced obligation or underlying securities comprising the referenced index. |
| (3) | Notional amount represents the maximum potential amount the Fund could be required to pay as a seller of credit protection or receive as a buyer of credit protection if a credit event occurs as defined under the terms of that particular swap agreement. |
| (4) | Implied credit spreads, represented in absolute terms, utilized in determining the fair value of credit default swap agreements where the Fund is the seller of protection as of the reporting date serve as an indicator of the current status of the payment/ performance risk and represent the likelihood of risk of default for the credit derivative. The implied credit spread of a particular referenced entity reflects the cost of buying/selling protection and may include up-front payments required to be made to enter into the agreement. Wider credit spreads represent a deterioration of the referenced entity’s credit soundness and a greater likelihood of risk of default or other credit event occurring as defined under the terms of the agreement. |
Summary of Collateral for Centrally Cleared/Exchange-traded Derivatives:
Cash and securities segregated as collateral, including pending settlement for closed positions, to cover requirements for centrally cleared/exchange-traded derivatives are listed by broker as follows:
| | | | | | | | | | | | | | | | | | | | | | | | |
Broker | | Cash and/or Foreign Currency | | | Securities Market Value | |
Citigroup Global Markets, Inc. | | | | | | $ | 130,000 | | | | | | | | | | | $ | — | | | | | |
J.P. Morgan Securities LLC | | | | | | | 150,000 | | | | | | | | | | | | — | | | | | |
| | | | | | | | | | | | | | | | | | | | | | | | |
Total | | | | | | $ | 280,000 | | | | | | | | | | | $ | — | | | | | |
| | | | | | | | | | | | | | | | | | | | | | | | |
Fair Value Measurements:
Various inputs are used in determining the value of the Fund’s investments. These inputs are summarized in the three broad levels listed below.
Level 1—unadjusted quoted prices generally in active markets for identical securities.
Level 2—quoted prices for similar securities, interest rates and yield curves, prepayment speeds, foreign currency exchange rates and other observable inputs.
Level 3—unobservable inputs for securities valued in accordance with Board approved fair valuation procedures.
See Notes to Financial Statements.
196
PGIM Floating Rate Income ETF
Schedule of Investments (continued)
as of August 31, 2022
The following is a summary of the inputs used as of August 31, 2022 in valuing such portfolio securities:
| | | | | | | | | | | | | | | |
| | | Level 1 | | Level 2 | | Level 3 |
| | | |
Investments in Securities | | | | | | | | | | | | | | | |
Assets | | | | | | | | | | | | | | | |
Long-Term Investments | | | | | | | | | | | | | | | |
Asset-Backed Securities | | | | | | | | | | | | | | | |
Collateralized Loan Obligations | | | $ | — | | | | $ | 808,386 | | | | $ | — | |
Bank Loans | | | | — | | | | | 27,384,709 | | | | | 2,321,742 | |
Corporate Bonds | | | | — | | | | | 2,443,246 | | | | | — | |
Short-Term Investment | | | | | | | | | | | | | | | |
Unaffiliated Fund | | | | 5,688,016 | | | | | — | | | | | — | |
| | | | | | | | | | | | | | | |
Total | | | $ | 5,688,016 | | | | $ | 30,636,341 | | | | $ | 2,321,742 | |
| | | | | | | | | | | | | | | |
| | | |
Other Financial Instruments* | | | | | | | | | | | | | | | |
Assets | | | | | | | | | | | | | | | |
Unfunded Loan Commitments | | | $ | — | | | | $ | 72 | | | | $ | 17 | |
Futures Contracts | | | | 5,375 | | | | | — | | | | | — | |
Centrally Cleared Credit Default Swap Agreement | | | | — | | | | | 369 | | | | | — | |
| | | | | | | | | | | | | | | |
Total | | | $ | 5,375 | | | | $ | 441 | | | | $ | 17 | |
| | | | | | | | | | | | | | | |
| | | |
Liabilities | | | | | | | | | | | | | | | |
Unfunded Loan Commitment | | | $ | — | | | | $ | (255 | ) | | | $ | — | |
| | | | | | | | | | | | | | | |
| * | Other financial instruments are derivative instruments, with the exception of unfunded loan commitments, and are not reflected in the Schedule of Investments. Futures, forwards, centrally cleared swap contracts and unfunded loan commitments are recorded at net unrealized appreciation (depreciation) and OTC swap contracts are recorded at fair value. |
The following is a reconciliation of assets in which unobservable inputs (Level 3) were used in determining fair value:
| | | | | | | | | | | | | | | |
| | | Bank Loans | | Unfunded loan
commitments | | |
| | | |
Balance as of 08/31/21 | | | $ | — | | | | $ | — | | | | | | |
Realized gain (loss) | | | | 374 | | | | | — | | | | | | |
Change in unrealized appreciation (depreciation) | | | | (28,398 | ) | | | | 17 | | | | | | |
Purchases/Exchanges/Issuances | | | | 2,917,286 | | | | | — | | | | | | |
Sales/Paydowns | | | | (568,865 | ) | | | | — | | | | | | |
Accrued discount/premium | | | | 1,345 | | | | | — | | | | | | |
Transfers into Level 3* | | | | — | | | | | — | | | | | | |
Transfers out of Level 3* | | | | — | | | | | — | | | | | | |
| | | | | | | | | | | | | | | |
Balance as of 08/31/22 | | | $ | 2,321,742 | | | | $ | 17 | | | | | | |
| | | | | | | | | | | | | | | |
See Notes to Financial Statements.
PGIM Fixed Income ETFs 197
PGIM Floating Rate Income ETF
Schedule of Investments (continued)
as of August 31, 2022
| | | | | | | | | | | | | | | |
| | | Bank Loans | | Unfunded loan
commitments | | |
Change in unrealized appreciation (depreciation) relating to securities still held at reporting period end | | | $ | (28,398 | ) | | | $ | 17 | | | | | | |
| | | | | | | | | | | | | | | |
| * | It is the Fund’s policy to recognize transfers in and transfers out at the securities’ fair values as of the beginning of period. Securities transferred between Level 2 and Level 3 are due to changes in the method utilized in valuing the investments. Transfers from Level 2 to Level 3 are typically a result of a change from the use of methods used by independent pricing services (Level 2) to the use of a single broker quote or valuation technique which utilizes significant unobservable inputs due to an absence of current or reliable market quotations (Level 3). Transfers from Level 3 to Level 2 are a result of the availability of current and reliable market data provided by independent pricing services or other valuation techniques which utilize observable inputs. In accordance with the requirements of ASC 820, the amounts of transfers into and out of Level 3, if material, are disclosed in the Notes to the Schedule of Investments of the Fund. |
As of August 31, 2022, the aggregate value of Level 3 securities and/or derivatives that are valued by independent pricing vendors or brokers was $2,321,759. The unobservable inputs for these investments were not developed by the Fund and are not readily available.
Industry Classification:
The industry classification of investments and liabilities in excess of other assets shown as a percentage of net assets as of August 31, 2022 were as follows:
| | | | |
Unaffiliated Fund | | | 16.8 | % |
Software | | | 10.3 | |
Telecommunications | | | 7.8 | |
Commercial Services | | | 5.7 | |
Banks | | | 4.6 | |
Retail | | | 4.4 | |
Packaging & Containers | | | 4.4 | |
Media | | | 4.2 | |
Healthcare-Services | | | 4.1 | |
Chemicals | | | 3.9 | |
Airlines | | | 3.3 | |
Diversified Financial Services | | | 3.2 | |
Entertainment | | | 3.2 | |
Computers | | | 3.1 | |
Collateralized Loan Obligations | | | 2.4 | |
Machinery-Diversified | | | 2.3 | |
Pharmaceuticals | | | 2.3 | |
Aerospace & Defense | | | 2.0 | |
Insurance | | | 1.8 | |
Pipelines | | | 1.6 | |
Environmental Control | | | 1.6 | |
| | | | |
| Metal Fabricate/Hardware | | | 1.5 | % |
| Transportation | | | 1.4 | |
| Foods | | | 1.4 | |
| Auto Parts & Equipment | | | 1.3 | |
| Building Materials | | | 1.2 | |
| Electric | | | 1.2 | |
| Beverages | | | 1.2 | |
| Oil & Gas | | | 1.1 | |
| Real Estate Investment Trusts (REITs) | | | 1.0 | |
| Internet | | | 0.8 | |
| Leisure Time | | | 0.8 | |
| Real Estate | | | 0.7 | |
| Engineering & Construction | | | 0.6 | |
| Lodging | | | 0.6 | |
| Home Furnishings | | | 0.6 | |
| Housewares | | | 0.5 | |
| Auto Manufacturers | | | 0.5 | |
| Forest Products & Paper | | | 0.5 | |
| Semiconductors | | | 0.4 | |
| Apparel | | | 0.4 | |
| Textiles | | | 0.4 | |
See Notes to Financial Statements.
198
PGIM Floating Rate Income ETF
Schedule of Investments (continued)
as of August 31, 2022
Industry Classification (continued):
| | | | | | |
| | |
Cosmetics/Personal Care | | | 0.4 | % | | |
Investment Companies | | | 0.4 | | | |
Energy-Alternate Sources | | | 0.4 | | | |
Healthcare-Products | | | 0.4 | | | |
Holding Companies-Diversified | | | 0.3 | | | |
Electronics | | | 0.3 | | | |
Machinery-Construction & Mining | | | 0.3 | | | |
Advertising | | | 0.2 | | | |
| | | | |
| |
| Hand/Machine Tools | | | 0.2 | % |
| Household Products/Wares | | | 0.2 | |
| | | | |
| | | 114.2 | |
| Liabilities in excess of other assets | | | (14.2 | ) |
| | | | |
| |
| | | 100.0 | % |
| | | | |
Effects of Derivative Instruments on the Financial Statements and Primary Underlying Risk Exposure:
The Fund invested in derivative instruments during the reporting period. The primary types of risk associated with these derivative instruments are credit contracts risks and interest rate contracts risk. See the Notes to Financial Statements for additional detail regarding these derivative instruments and their risks. The effect of such derivative instruments on the Fund’s financial position and financial performance as reflected in the Statement of Assets and Liabilities and Statement of Operations is presented in the summary below.
Fair values of derivative instruments as of August 31, 2022 as presented in the Statement of Assets and Liabilities:
| | | | | | | | | | | | |
| | | Asset Derivatives | | | Liability Derivatives | |
Derivatives not accounted for as
hedging instruments, carried at fair
value | | Statement of Assets and Liabilities Location | | Fair
Value | | | Statement of Assets and Liabilities Location | | Fair
Value | |
Credit contracts | | Due from/to broker-variation margin swaps | | $ | 369 | * | | — | | $ | — | |
Interest rate contracts | | Due from/to broker-variation margin futures | | | 5,375 | * | | — | | | — | |
| | | | | | | | | | | | |
| | | | $ | 5,744 | | | | | $ | — | |
| | | | | | | | | | | | �� |
| * | Includes cumulative appreciation (depreciation) as reported in the schedule of open futures and centrally cleared swap contracts. Only unsettled variation margin receivable (payable) is reported within the Statement of Assets and Liabilities. |
See Notes to Financial Statements.
PGIM Fixed Income ETFs 199
PGIM Floating Rate Income ETF
Schedule of Investments (continued)
as of August 31, 2022
The effects of derivative instruments on the Statement of Operations for the period ended August 31, 2022 are as follows:
| | | | | | | | | | |
| Amount of Realized Gain (Loss) on Derivatives Recognized in Income |
| | |
Derivatives not accounted for as hedging instruments, carried at fair value | | Futures | | Swaps |
Credit contracts | | | $ | — | | | | $ | 1,045 | |
Interest rate contracts | | | | 15,734 | | | | | — | |
| | | | | | | | | | |
Total | | | $ | 15,734 | | | | $ | 1,045 | |
| | | | | | | | | | |
| | | | | | | | | | |
| Change in Unrealized Appreciation (Depreciation) on Derivatives Recognized in Income |
| | |
Derivatives not accounted for
as hedging instruments,
carried at fair value | | Futures | | Swaps |
Credit contracts | | | $ | — | | | | $ | 369 | |
Interest rate contracts | | | | 5,375 | | | | | — | |
| | | | | | | | | | |
Total | | | $ | 5,375 | | | | $ | 369 | |
| | | | | | | | | | |
For the period ended August 31, 2022, the Fund’s average volume of derivative activities is as follows:
| | | | | |
| Derivative Contract Type | | Average Volume of Derivative Activities* |
Futures Contracts - Short Positions (1) | | | | $1,021,180 | |
Credit Default Swap Agreements - Sell Protection (1) | | | | 547,000 | |
| * | Average volume is based on average quarter end balances as noted for the period ended August 31, 2022. |
| (1) | Notional Amount in USD. |
See Notes to Financial Statements.
200
PGIM Floating Rate Income ETF
Statement of Assets & Liabilities
as of August 31, 2022
| | | | |
Assets | | | | |
Unaffiliated investments (cost $38,913,853) | | $ | 38,646,099 | |
Receivable for investments sold | | | 712,199 | |
Deposit with broker for centrally cleared/exchange-traded derivatives | | | 280,000 | |
Dividends and interest receivable | | | 100,973 | |
Due from broker—variation margin futures | | | 859 | |
Unrealized appreciation on unfunded loan commitment | | | 89 | |
Due from broker | | | 9 | |
| | | | |
Total Assets | | | 39,740,228 | |
| | | | |
| |
Liabilities | | | | |
Payable for investments purchased | | | 5,883,298 | |
Management fee payable | | | 18,724 | |
Payable to custodian | | | 9,293 | |
Due to broker—variation margin swaps | | | 812 | |
Other liabilities | | | 266 | |
Unrealized depreciation on unfunded loan commitments | | | 255 | |
| | | | |
Total Liabilities | | | 5,912,648 | |
| | | | |
| |
Net Assets | | $ | 33,827,580 | |
| | | | |
| | | | | |
Net assets were comprised of: | | | | |
Common stock, at par | | $ | 6,750 | |
Paid-in capital in excess of par | | | 33,888,042 | |
Total distributable earnings (loss) | | | (67,212 | ) |
| | | | |
| |
Net assets, August 31, 2022 | | $ | 33,827,580 | |
| | | | |
| |
Net asset value, offering price and redemption price per share. ($33,827,580 ÷ 675,000 shares of common stock issued and outstanding) | | $ | 50.11 | |
| | | | |
See Notes to Financial Statements.
PGIM Fixed Income ETFs 201
PGIM Floating Rate Income ETF
Statement of Operations
For the Period May 17, 2022* through August 31, 2022
| | | | |
Net Investment Income (Loss) | | | | |
Income | | | | |
Interest income | | $ | 341,659 | |
Unaffiliated dividend income | | | 45,442 | |
| | | | |
Total income | | | 387,101 | |
| | | | |
| |
Expenses | | | | |
Management fee | | | 55,323 | |
| | | | |
Net investment income (loss) | | | 331,778 | |
| | | | |
| |
Realized And Unrealized Gain (Loss) On Investments | | | | |
Net realized gain (loss) on: | | | | |
Investment transactions | | | 10,262 | |
Futures transactions | | | 15,734 | |
Swap agreement transactions | | | 1,045 | |
| | | | |
| | | 27,041 | |
| | | | |
Net change in unrealized appreciation (depreciation) on: | | | | |
Investments | | | (267,754 | ) |
Futures | | | 5,375 | |
Swap agreements | | | 369 | |
Unfunded loan commitments | | | (166 | ) |
| | | | |
| | | (262,176 | ) |
| | | | |
Net gain (loss) on investment transactions | | | (235,135 | ) |
| | | | |
Net Increase (Decrease) In Net Assets Resulting From Operations | | $ | 96,643 | |
| | | | |
| * | Commencement of operations. |
See Notes to Financial Statements.
202
PGIM Floating Rate Income ETF
Statement of Changes in Net Assets
| | | | | | | | | | |
| |
| | | May 17, 2022*
through
August 31, 2022 |
| | | | | | | |
Increase (Decrease) in Net Assets | | | | | | | |
Operations | | | | | | | |
Net investment income (loss) | | | $ | 331,778 | | | |
Net realized gain (loss) on investment transactions | | | | 27,041 | | | |
Net change in unrealized appreciation (depreciation) on investments | | | | (262,176 | ) | | |
| | | | | | | |
Net increase (decrease) in net assets resulting from operations | | | | 96,643 | | | |
| | | | | | | |
| | |
Dividends and Distributions | | | | | | | |
Distributions from distributable earnings | | | | (163,855 | ) | | |
| | | | | | | |
| | |
Fund share transactions | | | | | | | |
Net proceeds from shares sold (675,000 shares) | | | | 33,894,792 | | | |
| | | | | | | |
Total increase (decrease) | | | | 33,827,580 | | | |
| | |
Net Assets: | | | | | | | |
Beginning of period | | | | — | | | |
| | | | | | | |
End of period | | | $ | 33,827,580 | | | |
| | | | | | | |
| * | Commencement of operations. |
See Notes to Financial Statements.
PGIM Fixed Income ETFs 203
PGIM Floating Rate Income ETF
Financial Highlights
| | | | | | | |
| | | | | | | | |
| | | May 17, 2022(a)
through August 31,
2022 | | |
| | | |
| Per Share Operating Performance(b): | | | | | | | |
| Net Asset Value, beginning of period | | | | $50.00 | | | |
| Income (loss) from investment operations: | | | | | | | |
| Net investment income (loss) | | | | 0.62 | | | |
| Net realized and unrealized gain (loss) on investment and foreign currency transactions | | | | (0.18 | ) | | |
| Total from investment operations | | | | 0.44 | | | |
| Less Dividends and Distributions: | | | | | | | |
| Dividends from net investment income | | | | (0.33 | ) | | |
| Net asset value, end of period | | | | $50.11 | | | |
| Total Return(c): | | | | 0.89 | % | | |
| | | | | | | | |
| | | |
| Ratios/Supplemental Data: | | | | | | | |
| Net assets, end of period (000) | | | | $33,828 | | | |
| Average net assets (000) | | | | $26,460 | | | |
| Ratios to average net assets(d): | | | | | | | |
| Expenses after waivers and/or expense reimbursement | | | | 0.72 | %(e) | | |
| Expenses before waivers and/or expense reimbursement | | | | 0.72 | %(e) | | |
| Net investment income (loss) | | | | 4.32 | %(e) | | |
| Portfolio turnover rate(f) | | | | 9 | % | | |
| (a) | Commencement of operations. |
| (b) | Calculated based on average shares outstanding during the period. |
| (c) | Total return is calculated assuming a purchase of a share on the first day and a sale on the last day of each period reported and includes reinvestment of dividends and distributions, if any. Total returns may reflect adjustments to conform to GAAP. Total returns for periods less than one full year are not annualized. |
| (d) | Does not include expenses of the underlying funds in which the Fund invests. |
| (f) | The Fund’s portfolio turnover rate is calculated in accordance with regulatory requirements, without regard to transactions involving short-term investments, certain derivatives and in-kind transactions (if any). If such transactions were included, the Fund’s portfolio turnover rate may be higher. |
See Notes to Financial Statements.
204
Notes to Financial Statements
PGIM ETF Trust (the “Registered Investment Company” or “RIC”) is registered under the Investment Company Act of 1940, as amended (“1940 Act”), as an open-end management investment company. The RIC is organized as a Delaware Statutory Trust. These financial statements relate only to the following series of the RIC: PGIM Ultra Short Bond ETF, PGIM Active High Yield Bond ETF, PGIM Active Aggregate Bond ETF, PGIM Total Return Bond ETF and PGIM Floating Rate Income ETF (each a “Fund” and collectively, the “Funds”). The Funds are classified as diversified funds for purposes of the 1940 Act. Each Fund operates as an exchange-traded fund.
The Funds have the following investment objectives:
| | | | |
Fund | | | | Investment Objective(s) |
PGIM Ultra Short Bond ETF | | | | Seeks total return through a combination of current income and capital appreciation, consistent with preservation of capital. |
PGIM Active High Yield Bond ETF | | | | Seeks total return through a combination of current income and capital appreciation. |
PGIM Active Aggregate Bond ETF | | | | Seeks total return through a combination of current income and capital appreciation. |
PGIM Total Return Bond ETF | | | | Seeks total return through a combination of current income and capital appreciation. |
PGIM Floating Rate Income ETF | | | | Seeks to maximize current income with a secondary objective of capital appreciation. |
The Funds follow the investment company accounting and reporting guidance of the Financial Accounting Standards Board (“FASB”) Accounting Standard Codification (“ASC”) Topic 946 Financial Services — Investment Companies. The following is a summary of significant accounting policies followed by the Funds in the preparation of its financial statements. The policies conform to U.S. generally accepted accounting principles (“GAAP”). The Funds consistently follow such policies in the preparation of their financial statements.
Securities Valuation: The Funds hold securities and other assets and liabilities that are fair valued as of the close of each day (generally, 4:00 PM Eastern time) the New York Stock Exchange (“NYSE”) is open for trading. As described in further detail below, the Funds’
PGIM Fixed Income ETFs 205
Notes to Financial Statements (continued)
investments are valued daily based on a number of factors, including the type of investment and whether market quotations are readily available. The RIC’s Board of Trustees (the “Board”) has approved the Funds’ valuation policies and procedures for security valuation and designated to PGIM Investments LLC (“PGIM Investments” or the “Manager”) as the Valuation Designee pursuant to SEC Rule 2a-5(b) to perform the fair value determination relating to all Funds investments. Pursuant to the Board’s oversight, the Valuation Designee has established a Valuation Committee to perform the duties and responsibilities as valuation designee under SEC Rule 2a-5. The valuation procedures permit the Funds to utilize independent pricing vendor services, quotations from market makers, and alternative valuation methods when market quotations are either not readily available or not deemed representative of fair value. Fair value is the price that would be received to sell an asset or paid to transfer a liability in an orderly transaction between market participants on the measurement date. A record of the Valuation Committee’s actions is provided to the Board at the first quarterly meeting following the quarter in which such actions take place.
For the fiscal reporting year-end, securities and other assets and liabilities were fair valued at the close of the last U.S. business day. Trading in certain foreign securities may occur when the NYSE is closed (including weekends and holidays). Because such foreign securities trade in markets that are open on weekends and U.S. holidays, the values of some of the Funds’ foreign investments may change on days when investors cannot purchase or redeem Fund shares.
Various inputs determine how the Funds’ investments are valued, all of which are categorized according to the three broad levels (Level 1, 2, or 3) detailed in the Schedule of Investments and referred to herein as the “fair value hierarchy” in accordance with FASB ASC Topic 820 - Fair Value Measurement.
Common or preferred stocks, exchange-traded funds and derivative instruments, if applicable, that are traded on a national securities exchange are valued at the last sale price as of the close of trading on the applicable exchange where the security principally trades. Securities traded via NASDAQ are valued at the NASDAQ official closing price. To the extent these securities are valued at the last sale price or NASDAQ official closing price, they are classified as Level 1 in the fair value hierarchy. In the event that no sale or official closing price on valuation date exists, these securities are generally valued at the mean between the last reported bid and ask prices, or at the last bid price in the absence of an ask price. These securities are classified as Level 2 in the fair value hierarchy.
Investments in open-end funds (other than exchange-traded funds) are valued at their net asset values as of the close of the NYSE on the date of valuation. These securities are classified as Level 1 in the fair value hierarchy since they may be purchased or sold at their net asset values on the date of valuation.
206
Fixed income securities traded in the OTC market are generally classified as Level 2 in the fair value hierarchy. Such fixed income securities are typically valued using the market approach which generally involves obtaining data from an approved independent third-party vendor source. The Funds utilize the market approach as the primary method to value securities when market prices of identical or comparable instruments are available. The third-party vendors’ valuation techniques used to derive the evaluated bid price are based on evaluating observable inputs, including but not limited to, yield curves, yield spreads, credit ratings, deal terms, tranche level attributes, default rates, cash flows, prepayment speeds, broker/dealer quotations and reported trades. Certain Level 3 securities are also valued using the market approach when obtaining a single broker quote or when utilizing transaction prices for identical securities that have been used in excess of five business days. During the reporting period, there were no changes to report with respect to the valuation approach and/or valuation techniques discussed above.
Floating rate and other loans are generally valued at prices provided by approved independent pricing vendors. The pricing vendors utilize broker/dealer quotations and provide prices based on the average of such quotations. Floating rate and other loans valued using such vendor prices are generally classified as Level 2 in the fair value hierarchy. Floating rate and other loans valued based on a single broker quote or at the original transaction price in excess of five business days are classified as Level 3 in the fair value hierarchy.
OTC and centrally cleared derivative instruments are generally classified as Level 2 in the fair value hierarchy. Such derivative instruments are typically valued using the market approach and/or income approach which generally involves obtaining data from an approved independent third-party vendor source. The Funds utilize the market approach when quoted prices in broker-dealer markets are available but also include consideration of alternative valuation approaches, including the income approach. In the absence of reliable market quotations, the income approach is typically utilized for purposes of valuing derivatives such as interest rate swaps based on a discounted cash flow analysis whereby the value of the instrument is equal to the present value of its future cash inflows or outflows. Such analysis includes projecting future cash flows and determining the discount rate (including the present value factors that affect the discount rate) used to discount the future cash flows. In addition, the third-party vendors’ valuation techniques used to derive the evaluated derivative price is based on evaluating observable inputs, including but not limited to, underlying asset prices, indices, spreads, interest rates and exchange rates. Certain derivatives may be classified as Level 3 when valued using the market approach by obtaining a single broker quote or when utilizing unobservable inputs in the income approach. During the reporting period, there were no changes to report with respect to the valuation approach and/or valuation techniques discussed above.
Securities and other assets that cannot be priced according to the methods described above are valued based on policies and procedures approved by the Board. In the event that unobservable inputs are used when determining such valuations, the securities will be
PGIM Fixed Income ETFs 207
Notes to Financial Statements (continued)
classified as Level 3 in the fair value hierarchy. Altering one or more unobservable inputs may result in a significant change to a Level 3 security’s fair value measurement.
When determining the fair value of securities, some of the factors influencing the valuation include: the nature of any restrictions on disposition of the securities; assessment of the general liquidity of the securities; the issuer’s financial condition and the markets in which it does business; the cost of the investment; the size of the holding and the capitalization of the issuer; the prices of any recent transactions or bids/offers for such securities or any comparable securities; any available analyst media or other reports or information deemed reliable by the Valuation Designee regarding the issuer or the markets or industry in which it operates. Using fair value to price securities may result in a value that is different from a security’s most recent closing price and from the price used by other unaffiliated mutual funds to calculate their net asset values.
Foreign Currency Translation: The books and records of the Funds are maintained in U.S. dollars. Foreign currency amounts are translated into U.S. dollars on the following basis:
(i) market value of investment securities, other assets and liabilities — at the exchange rate as of the valuation date;
(ii) purchases and sales of investment securities, income and expenses — at the rates of exchange prevailing on the respective dates of such transactions.
Although the net assets of the Funds are presented at the foreign exchange rates and market values at the close of the period, the Funds do not generally isolate that portion of the results of operations arising as a result of changes in the foreign exchange rates from the fluctuations arising from changes in the market prices of long-term portfolio securities held at the end of the period. Similarly, the Funds do not isolate the effect of changes in foreign exchange rates from the fluctuations arising from changes in the market prices of long-term portfolio securities sold during the period. Accordingly, holding period unrealized and realized foreign currency gains (losses) are included in the reported net change in unrealized appreciation (depreciation) on investments and net realized gains (losses) on investment transactions on the Statements of Operations.
Additionally, net realized gains (losses) on foreign currency transactions represent net foreign exchange gains (losses) from the disposition of holdings of foreign currencies, currency gains (losses) realized between the trade and settlement dates on investment transactions, and the difference between the amounts of interest, dividends and foreign withholding taxes recorded on the Funds’ books and the U.S. dollar equivalent amounts actually received or paid. Net unrealized currency gains (losses) arise from valuing foreign
208
currency denominated assets and liabilities (other than investments) at period end exchange rates.
Forward and Cross Currency Contracts: A forward currency contract is a commitment to purchase or sell a foreign currency at a future date at a negotiated forward rate. Certain Funds enter into forward currency contracts, as defined in the prospectus, in order to hedge its exposure to changes in foreign currency exchange rates on its foreign portfolio holdings or on specific receivables and payables denominated in a foreign currency and to gain exposure to certain currencies. The contracts are valued daily at current forward exchange rates and any unrealized gain (loss) is included in net unrealized appreciation or depreciation on forward and cross currency contracts. Gain (loss) is realized on the settlement date of the contract equal to the difference between the settlement value of the original and negotiated forward contracts. This gain (loss), if any, is included in net realized gain (loss) on forward and cross currency contract transactions. Risks may arise upon entering into these contracts from the potential inability of the counterparties to meet the terms of their contracts. Forward currency contracts involve risks from currency exchange rate and credit risk in excess of the amounts reflected on the Statement of Assets and Liabilities. The Funds’ maximum risk of loss from counterparty credit risk is the net value of the cash flows to be received from the counterparty at the end of the contract’s life. A cross currency contract is a forward contract where a specified amount of one foreign currency will be exchanged for a specified amount of another foreign currency.
Financial Futures Contracts: A financial futures contract is an agreement to purchase (long) or sell (short) an agreed amount of securities at a set price for delivery on a future date. Upon entering into a financial futures contract, the Funds are required to pledge to the broker an amount of cash and/or other assets equal to a certain percentage of the contract amount. This amount is known as the “initial margin.” Subsequent payments, known as “variation margin,” are made or received by the Funds each day, depending on the daily fluctuations in the value of the underlying security. Such variation margin is recorded for financial statement purposes on a daily basis as unrealized gain (loss). When the contract expires or is closed, the gain (loss) is realized and is presented in the Statement of Operations as net realized gain (loss) on futures transactions.
The Funds invested in financial futures contracts in order to hedge their existing portfolio securities, or securities the Funds intend to purchase, against fluctuations in value caused by changes in prevailing interest rates. Should interest rates move unexpectedly, the Funds may not achieve the anticipated benefits of the financial futures contracts and may realize a loss. The use of futures transactions involves the risk of imperfect correlation in movements in the price of futures contracts, interest rates and the underlying hedged assets. Since futures contracts are exchange-traded, there is minimal counterparty credit risk to the Funds since the exchanges’ clearinghouse acts as counterparty to all exchange-traded futures and guarantees the futures contracts against default.
Swap Agreements: Certain Funds entered into certain types of swap agreements detailed in the disclosures below. A swap agreement is an agreement to exchange the return generated
PGIM Fixed Income ETFs 209
Notes to Financial Statements (continued)
by one instrument for the return generated by another instrument. Swap agreements are negotiated in the OTC market and may be executed either directly with a counterparty (“OTC-traded”) or through a central clearing facility, such as a registered exchange. Swap agreements are valued daily at current market value and any change in value is included in the net unrealized appreciation or depreciation on swap agreements. Centrally cleared swaps pay or receive an amount known as “variation margin”, based on daily changes in the valuation of the swap contract. For OTC-traded, upfront premiums paid and received are shown as swap premiums paid and swap premiums received in the Statement of Assets and Liabilities. Risk of loss may exceed amounts recognized on the Statement of Assets and Liabilities. Swap agreements outstanding at period end, if any, are listed on the Schedule of Investments.
Interest Rate Swaps: Interest rate swaps represent an agreement between counterparties to exchange cash flows based on the difference between two interest rates, applied to a notional principal amount for a specified period. The Funds are subject to interest rate risk exposure in the normal course of pursuing their investment objective. The Funds used interest rate swaps to maintain their ability to generate steady cash flow by receiving a stream of fixed rate payments or to increase exposure to prevailing market rates by receiving floating rate payments. The Funds’ maximum risk of loss from counterparty credit risk is the discounted net present value of the cash flows to be received from the counterparty over the contract’s remaining life.
Credit Default Swaps (“CDS”): CDS involve one party (the protection buyer) making a stream of payments to another party (the protection seller) in exchange for the right to receive a specified payment in the event of a default or as a result of a default (collectively a “credit event”) for the referenced entity (typically corporate issues or sovereign issues of an emerging country) on its obligation; or in the event of a write-down, principal shortfall, interest shortfall or default of all or part of the referenced entities comprising a credit index.
The Funds are subject to credit risk in the normal course of pursuing their investment objectives, and as such, have entered into CDS contracts to provide a measure of protection against defaults or to take an active long or short position with respect to the likelihood of a particular issuer’s default or the reference entity’s credit soundness. CDS contracts generally trade based on a spread which represents the cost a protection buyer has to pay the protection seller. The protection buyer is said to be short the credit as the value of the contract rises the more the credit deteriorates. The value of the CDS contract increases for the protection buyer if the spread increases. A Fund’s maximum risk of loss from counterparty credit risk for purchased CDS is the inability of the counterparty to honor the contract up to the notional value due to a credit event.
210
As a seller of protection on credit default swap agreements, the Fund generally receives an agreed upon payment from the buyer of protection throughout the term of the swap, provided no credit event occurs. As the seller, the Fund effectively increases its investment risk because, in addition to its total net assets, the Fund may be subject to investment exposure on the notional amount of the swap.
The maximum amount of the payment that the Fund, as a seller of protection, could be required to make under a credit default swap agreement would be equal to the notional amount of the underlying security or index contract as a result of a credit event. This potential amount will be partially offset by any recovery values of the respective referenced obligations, or net amounts received from the settlement of buy protection credit default swap agreements which the Fund entered into for the same referenced entity or index. As a buyer of protection, the Fund generally receives an amount up to the notional value of the swap if a credit event occurs.
Implied credit spreads, represented in absolute terms, utilized in determining the market value of credit default swap agreements where the Fund is the seller of protection as of period end are disclosed in the footnotes to the Schedule of Investments, if applicable. These spreads serve as indicators of the current status of the payment/performance risk and represent the likelihood of default risk for the credit derivative. The implied credit spread of a particular referenced entity reflects the cost of buying/selling protection and may include upfront payments required to enter into the agreement. Wider credit spreads and increased market value in absolute terms, when compared to the notional amount of the swap, represent a deterioration of the referenced entity’s credit soundness and a greater likelihood of risk of default or other credit event occurring as defined under the terms of the agreement.
Total Return Swaps: In a total return swap, one party receives payments based on the market value of the security or the commodity involved, or total return of a specific referenced asset, such as an equity, index or bond, and in return pays a defined amount. The Funds are subject to risk exposures associated with the referenced asset in the normal course of pursuing their investment objectives. The Funds entered into total return swaps to manage their exposure to a security or an index. The Funds’ maximum risk of loss from counterparty credit risk is the change in the value of the security, in the Fund’s favor, from the point of entering into the contract.
Floating Rate and other Loans (i.e. bank loans): Certain Funds invested in floating rate and other loans. Floating rate and other loans include loans that are privately negotiated between a corporate borrower and one or more financial institutions, including, but not limited to, term loans, revolvers, and other instruments issued in the floating rate and other loans market. The Funds acquire interests in loans directly (by way of assignment from the selling institution) and/or indirectly (by way of the purchase of a participation interest from the selling institution). Under a floating rate and other loans assignment, the Funds generally will succeed to all the rights and obligations of an assigning lending institution and become a lender under the loan agreement with the relevant borrower in connection with that loan.
PGIM Fixed Income ETFs 211
Notes to Financial Statements (continued)
Under a floating rate and other loans participation, the Funds generally will have a contractual relationship only with the lender, not with the relevant borrower. As a result, the Funds generally will have the right to receive payments of principal, interest, and any fees to which they are entitled only from the lender selling the participation and only upon receipt by the lender of the payments from the relevant borrower. The Funds may not directly benefit from the collateral supporting the debt obligation in which they have purchased the participation. As a result, the Funds will assume the credit risk of both the borrower and the institution selling the participation to the Funds.
Mortgage-Backed and Asset-Backed Securities: Mortgage-backed securities are pass-through securities, meaning that principal and interest payments made by the borrower on the underlying mortgages are passed through to the Fund. Asset-backed securities directly or indirectly represent a participation interest in, or are secured by and payable from, a stream of payments generated by particular assets such as motor vehicle or credit card receivables. Asset-backed securities may be classified as pass-through certificates or collateralized obligations, such as collateralized bond obligations, collateralized loan obligations and other similarly structured securities. The value of mortgage-backed and asset-backed securities varies with changes in interest rates and may be affected by changes in credit quality or value of the mortgage loans or other assets that support the securities.
Stripped mortgage-backed securities are usually structured with two classes that receive different proportions of the interest (“IO”) and principal (“PO”) distributions on a pool of mortgage assets. Payments received for IOs are included in interest income on the Statements of Operations. Because no principal will be received at the maturity of an IO, adjustments are made to the cost of the security on a monthly basis until maturity. These adjustments are included in interest income on the Statements of Operations. Payments received for POs are treated as reductions to the cost and par value of the securities.
Master Netting Arrangements: The RIC, on behalf of the Funds, is subject to various Master Agreements, or netting arrangements, with select counterparties. These are agreements which a subadviser may have negotiated and entered into on behalf of all or a portion of a Fund. A master netting arrangement between the Fund and the counterparty permits the Fund to offset amounts payable by the Fund to the same counterparty against amounts to be received; and by the receipt of collateral from the counterparty by the Funds to cover the Funds’ exposure to the counterparty. However, there is no assurance that such mitigating factors are easily enforceable. In addition to master netting arrangements, the right to set-off exists when all the conditions are met such that each of the parties owes the other determinable amounts, the reporting party has the right to set-off the amount owed with the amount owed by the other party, the reporting party intends to set-off and the right of set-off is enforceable by law.
212
The RIC, on behalf of the Funds, is a party to International Swaps and Derivatives Association, Inc. (“ISDA”) Master Agreements with certain counterparties that govern OTC derivative and foreign exchange contracts entered into from time to time. The Master Agreements may contain provisions regarding, among other things, the parties’ general obligations, representations, agreements, collateral requirements, events of default and early termination. With respect to certain counterparties, in accordance with the terms of the Master Agreements, collateral posted to the Fund is held in a segregated account by the Fund’s custodian and with respect to those amounts which can be sold or re-pledged, is presented in the Schedule of Investments. Collateral pledged by the Fund is segregated by the Fund’s custodian and identified in the Schedule of Investments. Collateral can be in the form of cash or debt securities issued by the U.S. Government or related agencies or other securities as agreed to by the Fund and the applicable counterparty. Collateral requirements are determined based on the Fund’s net position with each counterparty. Termination events applicable to the Fund may occur upon a decline in the Fund’s net assets below a specified threshold over a certain period of time. Termination events applicable to counterparties may occur upon a decline in the counterparty’s long-term and short-term credit ratings below a specified level. In each case, upon occurrence, the other party may elect to terminate early and cause settlement of all derivative and foreign exchange contracts outstanding, including the payment of any losses and costs resulting from such early termination, as reasonably determined by the terminating party. Any decision by one or more of the Fund’s counterparties to elect early termination could impact the Fund’s future derivative activity.
In addition to each instrument’s primary underlying risk exposure (e.g. interest rate, credit, equity or foreign exchange, etc.), swap agreements involve, to varying degrees, elements of credit, market and documentation risk. Such risks involve the possibility that no liquid market for these agreements will exist, the counterparty to the agreement may default on its obligation to perform or disagree on the contractual terms of the agreement, and changes in net interest rates will be unfavorable. In connection with these agreements, securities in the portfolio may be identified or received as collateral from the counterparty in accordance with the terms of the respective swap agreements to provide or receive assets of value and to serve as recourse in the event of default or bankruptcy/insolvency of either party. Such OTC derivative agreements include conditions which, when materialized, give the counterparty the right to cause an early termination of the transactions under those agreements. Any election by the counterparty for early termination of the contract(s) may impact the amounts reported on financial statements.
Short sales and OTC contracts, including forward foreign currency exchange contracts, swaps, forward rate agreements and written options involve elements of both market and credit risk in excess of the amounts reflected on the Statement of Assets and Liabilities, if applicable. Such risks may be mitigated by engaging in master netting arrangements.
Warrants and Rights: The Funds held warrants and rights acquired either through a direct purchase or pursuant to corporate actions. Warrants and rights entitle the holder to buy a proportionate amount of common stock, or such other security that the issuer may specify, at a specific price and time through the expiration dates. Such warrants and rights are held
PGIM Fixed Income ETFs 213
Notes to Financial Statements (continued)
as long positions by the Funds until exercised, sold or expired. Warrants and rights are valued at fair value in accordance with the Board approved fair valuation procedures.
Payment-In-Kind: The Funds invested in the open market or received pursuant to debt restructuring, securities that pay-in-kind (PIK) the interest due on such debt instruments. The PIK interest, computed at the contractual rate specified, is added to the existing principal balance of the debt when issued bonds have same terms as the bond or recorded as a separate bond when terms are different from the existing debt, and is recorded as interest income.
Securities Lending: Certain Funds lend their portfolio securities to banks and broker-dealers. The loans are secured by collateral at least equal to the market value of the securities loaned. Collateral pledged by each borrower is invested in an affiliated money market fund and is marked to market daily, based on the previous day’s market value, such that the value of the collateral exceeds the value of the loaned securities. In the event of significant appreciation in value of securities on loan on the last business day of the reporting period, the financial statements may reflect a collateral value that is less than the market value of the loaned securities. Such shortfall is remedied as described above. Loans are subject to termination at the option of the borrower or the Fund. Upon termination of the loan, the borrower will return to the Fund securities identical to the loaned securities. The remaining open loans of the securities lending transactions are considered overnight and continuous. Should the borrower of the securities fail financially, the Fund has the right to repurchase the securities in the open market using the collateral.
The Fund recognizes income, net of any rebate and securities lending agent fees, for lending its securities in the form of fees or interest on the investment of any cash received as collateral. The borrower receives all interest and dividends from the securities loaned and such payments are passed back to the lender in amounts equivalent thereto, which are reflected in interest income or unaffiliated dividend income based on the nature of the payment on the Statement of Operations. The Fund also continues to recognize any unrealized gain (loss) in the market price of the securities loaned and on the change in the value of the collateral invested that may occur during the term of the loan. In addition, realized gain (loss) is recognized on changes in the value of the collateral invested upon liquidation of the collateral. Net earnings from securities lending are disclosed in the Statement of Operations.
Equity and Mortgage Real Estate Investment Trusts (collectively REITs): The Funds invested in REITs, which report information on the source of their distributions annually. Based on current and historical information, a portion of distributions received from REITs during the period is estimated to be dividend income, capital gain or return of capital and recorded
214
accordingly. When material, these estimates are adjusted periodically when the actual source of distributions is disclosed by the REITs.
Securities Transactions and Net Investment Income: Securities transactions are recorded on the trade date. Realized gains (losses) from investment and currency transactions are calculated on the specific identification method. Dividend income is recorded on the ex-date, or for certain foreign securities, when the Funds become aware of such dividends. Interest income, including amortization of premium and accretion of discount on debt securities, as required, is recorded on the accrual basis. Expenses are recorded on an accrual basis, which may require the use of certain estimates by management that may differ from actual.
Taxes: It is each Fund’s policy to continue to meet the requirements of the Internal Revenue Code applicable to regulated investment companies and to distribute all of its taxable net investment income and capital gains, if any, to its shareholders. Therefore, no federal income tax provision is required. Withholding taxes on foreign dividends, interest and capital gains, if any, are recorded, net of reclaimable amounts, at the time the related income is earned.
Dividends and Distributions: Dividends and distributions to shareholders, which are determined in accordance with federal income tax regulations and which may differ from GAAP, are recorded on the ex-date. Permanent book/tax differences relating to income and gain (loss) are reclassified between total distributable earnings (loss) and paid-in capital in excess of par, as appropriate. The chart below sets forth the expected frequency of dividend and capital gains distributions to shareholders. Various factors may impact the frequency of dividend distributions to shareholders, including but not limited to adverse market conditions or portfolio holding-specific events.
| | | | |
| | |
| Expected Distribution Schedule to Shareholders* | | Frequency |
Net Investment Income | | | Monthly | |
| |
Short-Term Capital Gains | | | Annually | |
| |
Long-Term Capital Gains | | | Annually | |
| * | Under certain circumstances, each Fund may make more than one distribution of short-term and/or long-term capital gains during a fiscal year. |
Estimates: The preparation of financial statements requires management to make estimates and assumptions that affect the reported amounts and disclosures in the financial statements. Actual results could differ from those estimates.
Pursuant to a management agreement with the RIC on behalf of the Funds (the Management Agreement), PGIM Investments manages each Fund’s investment operations and administers its business affairs. PGIM Investments is also responsible for supervising each Fund’s subadviser.
PGIM Fixed Income ETFs 215
Notes to Financial Statements (continued)
Pursuant to the management agreement relating to each Fund, there is a unitary fee structure for the funds whereby PGIM Investments is responsible for substantially all expenses of each Fund, except taxes, brokerage expenses, interest expenses, distribution fees or expenses, expenses incident to shareholder meetings and extraordinary expenses. Each Fund may also pay for any costs or expenses of investing in other funds. For more information on the unitary management fee structure please refer to the Funds’ Statement of Additional Information.
The unitary fee paid to the Manager is accrued daily and payable monthly, at an annual rate of each Fund’s average daily net assets specified below. The Manager has contractually agreed, beginning from each Fund’s inception date, to waive any management fees it receives from the Funds in an amount equal to the subadvisory fees paid by the Funds to the PGIM Institutional Money Market Fund due to the Funds’ investment of their excess overnight cash in the PGIM Institutional Money Market Fund. This waiver will remain in effect for as long as the Funds remain invested or intend to invest in the PGIM Institutional Money Market Fund.
| | | | |
| | |
| Fund | | Unitary
Fee Rate |
PGIM Ultra Short Bond ETF | | | 0.15 | % |
| |
PGIM Active High Yield Bond ETF | | | 0.53 | % |
| |
PGIM Active Aggregate Bond ETF | | | 0.19 | % |
| |
PGIM Total Return Bond ETF | | | 0.49 | % |
| |
PGIM Floating Rate Income ETF | | | 0.72 | % |
The Manager has entered into a subadvisory agreement (Subadvisory Agreement) with PGIM, Inc., which provides subadvisory services to the Funds through its business unit PGIM Fixed Income (and, for the PGIM Ultra Short Bond ETF and PGIM Total Return Bond ETF, PGIM Limited) (the “subadviser”). The Manager pays for the services of the subadviser.
Effective June 6, 2022, the Bank of New York Mellon (“BNY”) serves as the Custodian, Transfer Agent and Administrative Agent for the Trust. BNY receives compensation from the Manager and is reimbursed for expenses, including custodian, transfer agency and administration fees and certain out-of-pocket expenses including, but not limited to, postage, stationery, printing, allocable communication expenses and other costs. The Manager is responsible for compensating BNY under the Custodian, Transfer Agency and Service and Administration and Accounting Agreements.
Prior to June 6, 2022, Brown Brothers Harriman & Co. (“BBH”) served as the Custodian, Transfer Agent, Administrative Agent and Securities Lending Agent for the Trust. The Manager was responsible for compensating BBH under the Custodian and Administrative and Transfer Agency Agreements. As securities lending agent, BBH was responsible for marketing to approved borrowers available securities from the Funds’ portfolios. BBH
216
received as compensation for its services a portion of the amount earned by the Funds for lending securities.
Prudential Investment Management Services LLC (“PIMS” or the “Distributor”), acts as the distributor of each Fund, pursuant to the terms of a distribution agreement (“Distribution Agreement”) between the RIC and the Distributor. The Distributor is a subsidiary of Prudential. Shares are continuously offered for sale by the Distributor only. Although the Distributor does not receive any fees under the Distribution Agreement, the Manager or its affiliates may pay the Distributor for certain distribution related services.
PGIM Investments, PGIM, Inc., PGIM Limited and PIMS are indirect, wholly-owned subsidiaries of Prudential Financial, Inc. (“Prudential”).
| 4. | Other Transactions with Affiliates |
The Funds may invest their overnight sweep cash in the PGIM Core Ultra Short Bond Fund (the “Core Fund”), and their securities lending cash collateral in the PGIM Institutional Money Market Fund (the “Money Market Fund”), each a fund of Prudential Investment Portfolios 2, registered under the 1940 Act and managed by PGIM Investments. PGIM Investments and/or its affiliates are paid fees or reimbursed for providing their services to the Core Fund. In addition to the realized and unrealized gains on investments in the Core Fund and Money Market Fund, earnings from such investments are disclosed on the Statement of Operations as “Affiliated dividend income” and “Income from securities lending, net”, respectively. Effective January 2022, the Funds changed their overnight cash sweep vehicle from the Core Fund to an unaffiliated money market fund.
The Funds may enter into certain securities purchase or sale transactions under Board approved Rule 17a-7 procedures. Rule 17a-7 is an exemptive rule under the 1940 Act, that subject to certain conditions, permits purchase and sale transactions among affiliated investment companies, or between an investment company and a person that is affiliated solely by reason of having a common (or affiliated) investment adviser, common directors/trustees, and/or common officers. For the year ended August 31, 2022, no 17a-7 transactions were entered into by the Funds.
The aggregate cost of purchases and proceeds from sales of portfolio securities (excluding short-term investments and U.S. Government securities) for the year ended August 31, 2022, were as follows:
| | | | | | | | |
| | | |
| Fund | | Cost of
Purchases | | | Proceeds
from Sales | |
PGIM Ultra Short Bond ETF | | $ | 1,063,831,395 | | | $ | 149,000,433 | |
| | |
PGIM Active High Yield Bond ETF | | | 63,418,204 | | | | 23,549,624 | |
| | |
PGIM Active Aggregate Bond ETF | | | 26,031,348 | | | | 12,003,001 | |
| | |
PGIM Total Return Bond ETF | | | 106,948,300 | | | | 31,181,733 | |
PGIM Fixed Income ETFs 217
Notes to Financial Statements (continued)
| | | | | | |
| | | | |
| Fund | | Cost of
Purchases | | | | Proceeds
from Sales |
PGIM Floating Rate Income ETF | | $ 32,204,243 | | | | $ 2,158,111 |
A summary of the cost of purchases and proceeds from sales of shares of affiliated mutual funds for the year ended August 31, 2022, is presented as follows:
PGIM Ultra Short Bond ETF
| | | | | | | | | | | | | | | | |
| | | | | | | | |
Value,
Beginning
of Year | | Cost of
Purchases | | Proceeds
from Sales | | Change in
Unrealized
Gain (Loss) | | Realized Gain (Loss) | | Value,
End of Year | | Shares, End of Year | | Income | |
| | | |
Short-Term Investments - Affiliated Mutual Funds: | | | | | | | | |
| | | | | |
PGIM Core Ultra Short Bond Fund(1)(wa) | | | | | | | | | | | | |
$145,724,638 | | $434,575,635 | | $580,300,273 | | $— | | $— | | $— | | — | | | $30,823 | |
| | | | | |
PGIM Institutional Money Market Fund(1)(b)(wa) | | | | | | | | | | | | |
2,327,971 | | 12,186,672 | | 14,514,119 | | 600 | | (1,124) | | — | | — | | | 426 | (2) |
$148,052,609 | | $446,762,307 | | $594,814,392 | | $600 | | $(1,124) | | $— | | | | | $31,249 | |
PGIM Active High Yield Bond ETF | |
| | | | | | | | |
Value,
Beginning
of Year | | Cost of
Purchases | | Proceeds
from Sales | | Change in
Unrealized
Gain (Loss) | | Realized Gain (Loss) | | Value, End of Year | | Shares, End of Year | | Income | |
| | | |
Short-Term Investments - Affiliated Mutual Funds: | | | | | | | | |
| | | | | |
PGIM Core Ultra Short Bond Fund(1)(wa) | | | | | | | | | | | | |
$3,188,704 | | $7,920,241 | | $11,108,945 | | $— | | $— | | $— | | — | | | $1,355 | |
| | | | | |
PGIM Institutional Money Market Fund(1)(b)(wa) | | | | | | | | | | | | |
408,020 | | 1,333,136 | | 1,619,682 | | 24 | | (13) | | 121,485 | | 121,558 | | | 351 | (2) |
$3,596,724 | | $9,253,377 | | $12,728,627 | | $ 24 | | $(13) | | $121,485 | | | | | $1,706 | |
| | | | | | | | | | | | | | |
PGIM Active Aggregate Bond ETF |
| | | | | | | | | | | | | | | | |
| | | | | | | | |
Value,
Beginning
of Year | | Cost of
Purchases | | Proceeds
from Sales | | Change in
Unrealized
Gain (Loss) | | Realized Gain (Loss) | | Value,
End of Year | | Shares, End of Year | | Income | |
| | | |
Short-Term Investments - Affiliated Mutual Fund: | | | | | | | | |
| | | | | |
PGIM Core Ultra Short Bond Fund(1)(wb) | | | | | | | | | | | | |
$5,752,344 | | $3,923,197 | | $9,675,541 | | $— | | $— | | $— | | — | | | $2,465 | |
218
| | | | | | | | | | | | | | | | |
PGIM Total Return Bond ETF | |
Value, Beginning of
Period | | Cost of
Purchases | | Proceeds
from Sales | | Change in
Unrealized
Gain (Loss) | | Realized Gain (Loss) | | Value, End of Period | | Shares, End of Period | | Income | |
| | | |
Short-Term Investments - Affiliated Mutual Fund: | | | | | | | | |
| | | | | |
PGIM Core Ultra Short Bond Fund(1)(wb) | | | | | | | | | | | | |
$— | | $30,950,414 | | $30,950,414 | | $— | | $— | | $— | | — | | | $444 | |
| (1) | The Fund did not have any capital gain distributions during the reporting period. |
| (2) | The amount, or a portion thereof, represents the affiliated securities lending income shown on the Statement of Operations. |
| (b) | Represents security, or portion thereof, purchased with cash collateral received for securities on loan and includes dividend reinvestment. |
| (wa) | PGIM Investments LLC, the manager of the Fund, also serves as manager of the PGIM Core Ultra Short Bond Fund and PGIM Institutional Money Market Fund, if applicable. |
| (wb) | PGIM Investments LLC, the manager of the Fund, also serves as manager of the PGIM Core Ultra Short Bond Fund. |
| 6. | Distributions and Tax Information |
Distributions to shareholders, which are determined in accordance with federal income tax regulations and which may differ from GAAP, are recorded on the ex-date. In order to present total distributable earnings (loss) and paid-in capital on the Statement of Assets and Liabilities that more closely represent their tax character, certain adjustments have been made to total distributable earnings (loss) and paid-in capital for the fund indicated below.
For the year ended August 31, 2022, the adjustments were as follows:
| | | | | | |
| Fund | | Total Distributable
Earnings (Loss) | | Paid-in
Capital |
PGIM Active High Yield Bond ETF (a) | | $(443,931) | | | $443,931 | |
| (a) | Due to redemption in-kind adjustments. |
For the year ended August 31, 2022, the tax character of dividends paid as reflected in the Statement of Changes in Net Assets were as follows:
| | | | | | | | | | |
| | | | |
| Fund | | Ordinary
Income | | Long-Term
Capital Gains | | Total Dividends
and Distributions |
| | | |
PGIM Ultra Short Bond ETF | | | $29,966,721 | | | $ — | | | $29,966,721 | |
| | | |
PGIM Active High Yield Bond ETF | | | 5,040,362 | | | 180,517 | | | 5,220,879 | |
| | | |
PGIM Active Aggregate Bond ETF | | | 1,113,234 | | | — | | | 1,113,234 | |
| | | |
PGIM Total Return Bond ETF | | | 1,146,783 | | | — | | | 1,146,783 | |
| | | |
PGIM Floating Rate Income ETF | | | 163,855 | | | — | | | 163,855 | |
For the year ended August 31, 2021, the tax character of dividends paid as reflected in the Statement of Changes in Net Assets were as follows: | |
| | | | |
| Fund | | Ordinary
Income | | Long-Term
Capital Gains | | Total Dividends
and Distributions |
| | | |
PGIM Ultra Short Bond ETF | | | $18,216,405 | | | $— | | | $18,216,405 | |
PGIM Fixed Income ETFs 219
Notes to Financial Statements (continued)
| | | | | | | | | | | | |
| | | | |
| Fund | | Ordinary
Income | | Long-Term
Capital Gains | | | Total Dividends
and Distributions |
PGIM Active High Yield Bond ETF | | $ | 3,547,447 | | | $ | 112,691 | | | $ | 3,660,138 | |
PGIM Active Aggregate Bond ETF | | | 130,353 | | | | — | | | | 130,353 | |
PGIM Total Return Bond ETF | | | — | | | | — | | | | — | |
PGIM Floating Rate Income ETF | | | — | | | | — | | | | — | |
For the year ended August 31, 2022, the Funds had the following amounts of accumulated undistributed earnings on a tax basis:
| | | | | | | | |
| Fund | | Undistributed
Ordinary
Income | | Undistributed
Long-Term
Capital Gains |
PGIM Ultra Short Bond ETF | | | $6,458,856 | | | | $ — | |
PGIM Active High Yield Bond ETF | | | 646,002 | | | | — | |
PGIM Active Aggregate Bond ETF | | | 96,057 | | | | — | |
PGIM Total Return Bond ETF | | | 695,632 | | | | — | |
PGIM Floating Rate Income ETF | | | 194,455 | | | | 12,112 | |
The United States federal income tax basis of the Funds’ investments and the net unrealized appreciation (depreciation) as of August 31, 2022 were as follows:
| | | | | | | | | | | | | | | | | | | | | | | | | | | | |
| Fund | | Tax Basis | | | | | | Gross
Unrealized
Appreciation | | | | | | Gross
Unrealized
Depreciation | | | | Net
Unrealized
Depreciation |
PGIM Ultra Short Bond ETF | | $ | 2,436,772,647 | | | | | | | $ | 24,011,486 | | | | | | | $ | (41,572,667 | ) | | | | | | $ | (17,561,181 | ) |
PGIM Active High Yield Bond ETF | | | 105,647,100 | | | | | | | | 1,413,642 | | | | | | | | (14,190,676 | ) | | | | | | | (12,777,034 | ) |
PGIM Active Aggregate Bond ETF | | | 49,717,426 | | | | | | | | 9,285 | | | | | | | | (5,244,858 | ) | | | | | | | (5,235,573 | ) |
PGIM Total Return Bond ETF | | | 106,181,684 | | | | | | | | 107,305 | | | | | | | | (7,910,276 | ) | | | | | | | (7,802,971 | ) |
PGIM Floating Rate Income ETF | | | 38,913,985 | | | | | | | | 182,291 | | | | | | | | (456,070 | ) | | | | | | | (273,779 | ) |
The difference between GAAP and tax basis were primarily attributable to deferred losses on wash sales, swaps, straddle loss deferral, differences in the treatment of premium amortization for GAAP and tax purposes and other cost basis adjustments.
For federal income tax purposes, the following Funds had a capital loss carryforward as of August 31, 2022 which can be carried forward for an unlimited period. No capital gains distributions are expected to be paid to shareholders until net gains have been realized in excess of such losses.
| | | | |
| Fund | | Capital Loss
Carryforward |
PGIM Ultra Short Bond ETF | | | $25,219,000 | |
220
| | | | |
| Fund | | Capital Loss
Carryforward |
PGIM Active High Yield Bond ETF | | $ | 2,067,000 | |
PGIM Active Aggregate Bond ETF | | | 1,170,000 | |
PGIM Total Return Bond ETF | | | 2,976,000 | |
The Manager has analyzed the Funds’ tax positions taken on federal, state and local income tax returns for all open tax years and has concluded that no provision for income tax is required in the Funds’ financial statements for the current reporting period. Since tax authorities can examine previously filed tax returns, the Funds’ U.S. federal and state tax returns for each of the four fiscal years up to the most recent fiscal year ended August 31, 2022 are subject to such review.
Each Fund is an exchange-traded fund, commonly known as an “ETF”. Individual shares of the Funds may only be purchased and sold in secondary market transactions through brokers or other financial intermediaries. Shares of the Funds are listed for trading on the NYSE Arca, Inc. (the “Exchange”), and because the shares of the Funds trade at market prices rather than NAV, shares of the Funds may trade at a price greater than NAV (a premium) or less than NAV (a discount). Each Fund will issue and redeem its shares at NAV only in aggregations of a specified number of shares called a “Creation Unit”. An Authorized Participant is a member or participant of a clearing agency registered with the SEC, which has a written agreement with the Funds or one of their service providers that allows the Authorized Participant to place orders for the purchase and redemption of Creation Units.
A creation transaction, which is subject to acceptance by the Distributor and each Fund, generally takes place when an Authorized Participant deposits into each Fund a designated portfolio of securities, assets or other positions (a “creation basket”, and an amount of cash (including any cash representing the value of substituted securities, assets or other positions), if any, which together approximate the holdings of each Fund in exchange for a specified number of Creation Units. Similarly, shares can be redeemed only in Creation Units, generally for a designated portfolio of securities, assets or other propositions (the “redemption basket”) held by each Fund and an amount of cash (including any portion of such securities for which cash may be substituted). The Funds may, in certain circumstances, offer Creation Units partially or solely for cash. Except when aggregated in Creation Units, shares are not redeemable by the Funds. Creation and redemption baskets may differ and the Funds may accept “custom baskets”.
A Creation Unit consists of 25,000 shares of each Fund. Authorized Participants generally are required to pay a fixed creation transaction fee and/or a fixed redemption transaction fee, as applicable, for each transaction in a Creation Unit regardless of the number of Creation Units created or redeemed on that day. From time to time, the Funds may waive all or a portion of their applicable transaction fee(s). An additional charge or a variable charge may be applied to certain creation and redemption transactions, including non-standard orders and whole or partial cash purchases or redemptions when deemed appropriate. For
PGIM Fixed Income ETFs 221
Notes to Financial Statements (continued)
the reporting period ended August 31, 2022, the following fixed transaction fees were waived by the Funds through June 3, 2022 which PGIM Investments paid on behalf of the Authorized Participants. Effective June 6, 2022, such waiver will no longer be applicable.:
| | | | |
| | |
| Fund | | Amount |
PGIM Ultra Short Bond ETF | | $ | 14,500 | |
PGIM Active High Yield Bond ETF | | | 1,500 | |
PGIM Active Aggregate Bond ETF | | | 250 | |
PGIM Total Return Bond ETF | | | 750 | |
The RIC is authorized to issue an unlimited number of shares of beneficial interest, $0.001 par value per share.
As of August 31, 2022, Prudential, through its affiliated entities, including affiliated funds (if applicable), owned shares of the Funds as follows:
| | | | |
| | | |
| Fund | | Number of Shares | | Percentage of
Outstanding Shares |
PGIM Ultra Short Bond ETF | | 3,525,179 | | 7.1% |
PGIM Active High Yield Bond ETF | | 1,526,600 | | 56.0% |
PGIM Active Aggregate Bond ETF | | 965,000 | | 96.5% |
PGIM Total Return Bond ETF | | 470,000 | | 21.1% |
PGIM Floating Rate Income ETF | | 498,500 | | 73.9% |
At the reporting period end, the number of shareholders holding greater than 5% of the Fund are as follows:
| | | | | | |
| | | |
| Fund | | Number of Shareholders | | Percentage of Outstanding Shares |
Affiliated: | | | | | | |
PGIM Ultra Short Bond ETF | | 1 | | | 7.0 | % |
PGIM Active High Yield Bond ETF | | 2 | | | 54.4 | |
PGIM Active Aggregate Bond ETF | | 3 | | | 96.5 | |
PGIM Total Return Bond ETF | | 1 | | | 18.9 | |
PGIM Floating Rate Income ETF | | 2 | | | 73.9 | |
Unaffiliated: | | | | | | |
PGIM Ultra Short Bond ETF | | 5 | | | 60.8 | |
PGIM Active High Yield Bond ETF | | 4 | | | 34.5 | |
PGIM Active Aggregate Bond ETF | | — | | | — | |
PGIM Total Return Bond ETF | | 2 | | | 72.0 | |
PGIM Floating Rate Income ETF | | 2 | | | 25.0 | |
The Fund may make payment for Fund shares redeemed and contributed wholly or in part by distributing portfolio securities to shareholders. For the year ended August 31, 2022, the Funds had no subscriptions in-kind and had redemptions in-kind with total proceeds in the amounts presented on the Statements of Changes.
222
The RIC, on behalf of the Funds, along with other affiliated registered investment companies (the “Participating Funds”), is a party to a Syndicated Credit Agreement (“SCA”) with a group of banks. The purpose of the SCA is to provide an alternative source of temporary funding for capital share redemptions. The table below provides details of the current SCA in effect at the reporting period-end as well as the prior SCA.
| | | | | | |
| | | | |
| | | | | Current SCA* | | Prior SCA** |
Term of Commitment | | | | 10/1/2021 – 9/29/2022 | | 10/2/2020 – 9/30/2021 |
Total Commitment | | | | $1,200,000,000 | | $1,200,000,000 |
Annualized Commitment Fee on the Unused Portion of the SCA | | | | 0.15% | | 0.15% |
Annualized Interest Rate on Borrowings | | | | 1.20% plus the higher of (1) the effective federal funds rate, (2) the one-month LIBOR rate or (3) zero percent | | 1.30% plus the higher of (1) the effective federal funds rate, (2) the one-month LIBOR rate or (3) zero percent |
| * | The Current SCA did not include PGIM Total Return Bond ETF and PGIM Floating Rate Income ETF. |
| ** | The Prior SCA did not include PGIM Active Aggregate Bond ETF and PGIM Floating Rate Income ETF. |
Subsequent to the reporting period end, the SCA has been renewed and effective September 30, 2022 through September 28, 2023 will provide a commitment of $1,325,000,000 of which $1,200,000,000 (“Tranche A”) will be available for all Participating Funds (including the PGIM Floating Rate Income ETF and the PGIM Total Return Bond ETF), and of which $125,000,000 (“Tranche B”) will be solely available to the PGIM Floating Rate Income Fund and the PGIM Floating Rate Income ETF (the “Floating Rate Funds”). The commitment fee paid by the Participating Funds will continue to be 0.15% of the unused portion of the Tranche A SCA and the commitment fee paid by the Floating Rate Funds will be 0.15% of the unused portion of the Tranche B SCA. The interest on borrowings under the renewed SCA will be paid monthly and at a per annum interest rate of 1.00% plus the higher of (1) the effective federal funds rate, (2) the daily SOFR rate plus 0.10% or (3) zero percent.
Certain affiliated registered investment companies that are parties to the SCA include portfolios that are subject to a predetermined mathematical formula used to manage certain benefit guarantees offered under variable annuity contracts. The formula may result in large scale asset flows into and out of these portfolios. Consequently, these portfolios may be more likely to utilize the SCA for purposes of funding redemptions. It may be possible for those portfolios to fully exhaust the committed amount of the SCA, thereby requiring the Manager to allocate available funding per a Board-approved methodology designed to treat the Participating Funds in the SCA equitably.
The Funds did not utilize the SCA during the year ended August 31, 2022.
PGIM Fixed Income ETFs 223
Notes to Financial Statements (continued)
| 9. | Risks of Investing in the Funds |
Each Fund’s risks include, but are not limited to, some or all of the risks discussed below. For further information on the risks applicable to any given Fund, please refer to the Prospectus and Statement of Additional Information of that Fund.
| | | | | | | | | | | | | | | | | | | | |
| Risks | | PGIM
Ultra Short
Bond ETF | | | PGIM
Active
High Yield
Bond ETF | | | PGIM
Active
Aggregate
Bond ETF | | | PGIM
Total Return
Bond ETF | | | PGIM
Floating
Rate
Income ETF | |
Active Trading | | | — | | | | — | | | | X | | | | X | | | | X | |
Adjustable and Floating Rate Securities | | | — | | | | — | | | | — | | | | — | | | | X | |
Authorized Participant Concentration | | | X | | | | X | | | | X | | | | X | | | | X | |
Cash Transactions | | | X | | | | X | | | | X | | | | X | | | | X | |
Collateralized Loan Obligations | | | X | | | | — | | | | — | | | | X | | | | — | |
Covenant-Lite | | | — | | | | X | | | | — | | | | X | | | | X | |
Credit | | | X | | | | X | | | | X | | | | X | | | | X | |
Currency | | | — | | | | — | | | | — | | | | X | | | | — | |
Debt Obligations | | | X | | | | X | | | | X | | | | X | | | | X | |
Derivatives | | | X | | | | X | | | | X | | | | X | | | | X | |
Distressed and Defaulted Securities | | | — | | | | X | | | | — | | | | — | | | | — | |
Economic and Market Events | | | X | | | | X | | | | X | | | | X | | | | X | |
Emerging Markets | | | — | | | | X | | | | X | | | | X | | | | X | |
ETF Shares Trading | | | X | | | | X | | | | X | | | | X | | | | X | |
Foreign Securities | | | X | | | | X | | | | X | | | | X | | | | X | |
Floating Rate and Other Loans | | | — | | | | X | | | | — | | | | X | | | | X | |
Interest Rate | | | X | | | | X | | | | X | | | | X | | | | X | |
Junk Bonds | | | — | | | | X | | | | — | | | | X | | | | X | |
Large Shareholder and Large Scale Redemption | | | X | | | | X | | | | X | | | | X | | | | X | |
Liquidity | | | — | | | | X | | | | X | | | | X | | | | X | |
Loan Liquidity and Settlement | | | — | | | | — | | | | — | | | | — | | | | X | |
Management | | | X | | | | X | | | | X | | | | X | | | | X | |
Market Disruption and Geopolitical | | | X | | | | X | | | | X | | | | X | | | | X | |
Market | | | X | | | | X | | | | X | | | | X | | | | X | |
Money Market Instruments | | | X | | | | — | | | | — | | | | — | | | | — | |
Mortgage-Backed and Asset-Backed Securities | | | X | | | | X | | | | X | | | | X | | | | — | |
New/Small Fund | | | — | | | | — | | | | X | | | | X | | | | X | |
Non-Money Market Fund | | | X | | | | — | | | | — | | | | — | | | | — | |
Prepayment | | | X | | | | — | | | | — | | | | — | | | | — | |
Reference Rate | | | X | | | | — | | | | — | | | | X | | | | X | |
Small Fund | | | — | | | | X | | | | — | | | | — | | | | — | |
Structured Products | | | — | | | | — | | | | X | | | | — | | | | — | |
U.S. Government and Agency Securities | | | X | | | | — | | | | X | | | | X | | | | — | |
Variable and Floating Rate Bonds | | | X | | | | — | | | | — | | | | — | | | | — | |
224
Active Trading Risk: The Fund actively and frequently trades its portfolio securities. High portfolio turnover results in higher transaction costs, which can affect the Fund’s performance and have adverse tax consequences. In addition, high portfolio turnover may also mean that a proportionately greater amount of distributions to shareholders will be taxed as ordinary income rather than long-term capital gains compared to investment companies with lower portfolio turnover.
Adjustable and Floating Rate Securities Risk: The value of adjustable and floating rate securities may lag behind the value of fixed rate securities when interest rates change. Such securities may be subject to extended settlement periods (longer than seven days) and in unusual market conditions, with a high volume of shareholder redemptions, may present a risk of loss to the Fund or may impair the Fund’s ability satisfy shareholder redemption requests.
Authorized Participant Concentration Risk: Only an Authorized Participant (as defined in “How to Buy and Sell Shares of the Fund” in the Fund’s Prospectus) may engage in creation or redemption transactions directly with the Fund. The Fund has a limited number of intermediaries that act as Authorized Participants and none of these Authorized Participants is or will be obligated to engage in creation or redemption transactions. To the extent that these Authorized Participants exit the business or are unable to or choose not to proceed with creation and/or redemption orders with respect to the Fund and no other Authorized Participant creates or redeems, shares of the Fund may trade at a substantial discount or premium to net asset value (“NAV”), may trade at larger spreads, and possibly face trading halts and/or delisting.
Cash Transactions Risk: Unlike certain ETFs, the Fund may effect creations and redemptions in cash or partially in cash. Therefore, it may be required to sell portfolio securities and subsequently recognize gains on such sales that the Fund might not have recognized if it were to distribute portfolio securities in-kind. As such, investments in shares of the Fund may be less tax-efficient than an investment in an ETF that distributes portfolio securities entirely in-kind.
Collateralized Loan Obligations (“CLOs”) Risk: CLOs are subject to credit, interest rate, valuation, and prepayment and extension risks. These securities also are subject to risk of default on the underlying asset, particularly during periods of economic downturn. The market value of CLOs may be affected by, among other things, changes in the market value of the underlying assets held by the CLO, changes in the distributions on the underlying assets, defaults and recoveries on the underlying assets, capital gains and losses on the underlying assets, prepayments on underlying assets and the availability, prices and interest rate of underlying assets.
“Covenant-Lite” Risk: Some of the loans or debt obligations in which the Fund may invest or get exposure to may be “covenant-lite”, which means the loans or obligations contain fewer financial maintenance covenants than other loans or obligations (in some cases, none) and do not include terms which allow the lender to monitor the borrower’s performance and
PGIM Fixed Income ETFs 225
Notes to Financial Statements (continued)
declare a default if certain criteria are breached. An investment by the Fund in a covenant-lite loan may potentially hinder the ability to reprice credit risk associated with the issuer and reduce the ability to restructure a problematic loan and mitigate potential loss. The Fund may also experience difficulty, expenses or delays in enforcing its rights on its holdings of covenant-lite loans or obligations. As a result of these risks, the Fund’s exposure to losses may be increased, which could result in an adverse impact on the Fund’s net income and NAV.
Credit Risk: This is the risk that the issuer, the guarantor or the insurer of a fixed income security, or the counterparty to a contract, may be unable or unwilling to make timely principal and interest payments, or to otherwise honor its obligations. Additionally, fixed income securities could lose value due to a loss of confidence in the ability of the issuer, guarantor, insurer or counterparty to pay back debt. The lower the credit quality of a bond, the more sensitive it is to credit risk.
Currency Risk: The Fund’s net asset value could decline as a result of changes in exchange rates, which could adversely affect the Fund’s investments in currencies, or in securities that trade in, and receive revenues related to, currencies, or in derivatives that provide exposure to currencies. Certain foreign countries may impose restrictions on the ability of issuers of foreign securities to make payment of principal and interest or dividends to investors located outside the country, due to blockage of foreign currency exchanges or otherwise.
Debt Obligations Risk: Debt obligations are subject to credit risk, market risk and interest rate risk. The Fund’s holdings, share price, yield and total return may also fluctuate in response to bond market movements. The value of bonds may decline for issuer-related reasons, including management performance, financial leverage and reduced demand for the issuer’s goods and services. Certain types of fixed income obligations also may be subject to “call and redemption risk,” which is the risk that the issuer may call a bond held by the Fund for redemption before it matures and the Fund may not be able to reinvest at the same rate of interest and therefore would earn less income.
Derivatives Risk: Derivatives involve special risks and costs and may result in losses to the Fund. The successful use of derivatives requires sophisticated management, and, to the extent that derivatives are used, the Fund will depend on the subadviser’s ability to analyze and manage derivatives transactions. The prices of derivatives may move in unexpected ways, especially in abnormal market conditions. Some derivatives are “leveraged” or may create economic leverage for the Fund. and therefore may magnify or otherwise increase investment losses to the Fund. The Fund’s use of derivatives may also increase the amount of taxes payable by shareholders.
226
Other risks arise from the potential inability to terminate or sell derivatives positions. A liquid secondary market may not always exist for the Fund’s derivatives positions. In fact, many over-the-counter derivative instruments will not have liquidity beyond the counterparty to the instrument. Over-the-counter derivative instruments also involve the risk that the other party will not meet its obligations to the Fund. The use of derivatives also exposes the Fund to operational issues, such as documentation and settlement issues, systems failures, inadequate control and human error.
Derivatives may also involve legal risks, such as insufficient documentation, the lack of capacity or authority of a counterparty to execute or settle a transaction, and the legality and enforceability of derivatives contracts. The U.S. Government and foreign governments have adopted (and may adopt further) regulations governing derivatives markets, including mandatory clearing of certain derivatives, margin and reporting requirements and risk exposure limitations. Regulation of derivatives may make derivatives more costly, limit their availability or utility to the Fund, or otherwise adversely affect their performance or disrupt markets.
Distressed and Defaulted Securities Risk: Distressed and defaulted securities are subject to particularly high credit risk, market risk and illiquidity risk. These securities are at a high risk for default, especially during economic downturns, and they are subject to greater volatility than securities of more stable issuers. To the extent that the Fund invests in bankrupt issuers, the Fund may be subject to litigation risks and costs.
Economic and Market Events Risk: Events in the U.S. and global financial markets, including actions taken by the U.S. Federal Reserve or foreign central banks to stimulate or stabilize economic growth or the functioning of the securities markets, may at times result in unusually high market volatility, which could negatively impact performance. Relatively reduced liquidity in credit and fixed income markets could adversely affect issuers worldwide.
Emerging Markets Risk: The risks of foreign investments are greater for investments in or exposed to emerging markets. Emerging market countries typically have economic and political systems that are less fully developed, and can be expected to be less stable, than those of more developed countries. For example, the economies of such countries can be subject to rapid and unpredictable rates of inflation or deflation. Low trading volumes may result in a lack of liquidity and price volatility. Emerging market countries may have policies that restrict investment by non-U.S. investors, or that prevent non-U.S. investors from withdrawing their money at will.
The Fund may invest in some emerging markets that subject it to risks such as those associated with illiquidity, custody of assets, different settlement and clearance procedures and asserting legal title under a developing legal and regulatory regime to a greater degree than in developed markets or even in other emerging markets.
PGIM Fixed Income ETFs 227
Notes to Financial Statements (continued)
ETF Shares Trading Risk: Fund shares are listed for trading on NYSE Arca, Inc. (the “Exchange”) and the shares are bought and sold in the secondary market at market prices. The market prices of the shares of the Fund are expected to fluctuate in response to changes in the Fund’s NAV, the intraday value of the Fund’s holdings and supply and demand for shares of the Fund. We cannot predict whether shares of the Fund will trade above, below or at their NAV. Trading on the Exchange, including trading of Fund shares, may be halted in certain circumstances and shareholders may not be able to sell Fund shares at the time or price desired. During periods of stressed market conditions, the market for the shares of the Fund may become less liquid in response to deteriorating liquidity in the markets for the Fund’s portfolio investments. This adverse effect on the liquidity of the Fund’s shares could lead to differences between the market price of the Fund’s shares and the NAV of those shares. There can be no assurance that the requirements of the Exchange to maintain the listing of shares of the Fund will continue to be met. At times, trading in the securities of ETFs has become volatile and unpredictable and the price of ETF shares has diverged from market driven fundamentals.
Disruptions to creations and redemptions, the existence of significant market volatility or potential lack of an active trading market for the shares of the Fund (including through a trading halt), as well as other factors, may result in the Fund’s shares trading on the Exchange significantly above (at a premium) or below (at a discount) to NAV or to the intraday value of the Fund’s holdings. Premiums and discounts relate to differences between the market price and NAV of the Fund’s shares.
During such periods, you may incur significant losses if you sell your shares of the Fund. The securities held by the Fund may be traded in markets that close at a different time than the Exchange and may trade outside of a collateralized settlement system. Liquidity in those securities may be reduced after the applicable closing times. Accordingly, during the time when the Exchange is open but after the applicable market closing, fixing or settlement times, bid-ask spreads for the Fund’s shares on the Exchange and the corresponding premium or discount between the market price for Fund shares and their NAV may widen. Additionally, during times when the Exchange is open but after the applicable market is closed, there may be changes between the last quote from the closed foreign market and the value of such security during the Fund’s trading day on the Exchange and this may lead to differences between the market price of the Fund’s shares and the underlying value of those shares.
Cost of Buying or Selling Shares: When you buy or sell shares of the Fund through a broker, you will likely incur a brokerage commission or other charges imposed by brokers. In addition, the market price of shares of the Fund, like the price of any exchange-traded security, includes a “bid-ask spread” charged by the market makers or other participants that trade the particular security. The spread of the Fund’s shares varies over time based
228
on the Fund’s trading volume, the spread of the Fund’s underlying securities, and market liquidity and may increase if the Fund’s trading volume, the spread of the Fund’s underlying securities, or market liquidity decreases. In times of severe market disruption, including when trading of the Fund’s holdings may be halted, the bid-ask spread may increase significantly. This means that the shares may trade at a discount to the Fund’s NAV, and the discount is likely to be greatest during significant market volatility.
No Guarantee of Active Trading Market Risk: While shares of the Fund are listed on the Exchange, there can be no assurance that active trading markets for the shares will develop or be maintained by market makers or by Authorized Participants. The distributor of the Fund’s shares does not maintain a secondary market in the shares.
Floating Rate and Other Loans Risk: The Fund’s ability to receive payments of principal and interest and other amounts in connection with loans (whether through participations, assignments or otherwise) will depend primarily on the financial condition of the borrower. The failure by the Fund to receive scheduled interest or principal payments on a loan because of a default, bankruptcy or any other reason would adversely affect the income of the Fund and would likely reduce the value of its assets. Even with loans secured by collateral, there is the risk that the value of the collateral may decline, may be insufficient to meet the obligations of the borrower, or be difficult to liquidate. In the event of a default, the Fund may have difficulty collecting on any collateral and would not have the ability to collect on any collateral for an uncollateralized loan. Further, the Fund’s access to collateral, if any, may be limited by bankruptcy laws. Due to the nature of the private syndication of senior loans, including, for example, lack of publicly-available information, some senior loans are not as easily purchased or sold as publicly-traded securities. In addition, loan participations generally are subject to restrictions on transfer, and only limited opportunities may exist to sell loan participations in secondary markets. As a result, it may be difficult for the Fund to value loans or sell loans at an acceptable price when it wants to sell them. Loans trade in an over-the-counter market, and confirmation and settlement, which are effected through standardized procedures and documentation, may take significantly longer than seven days to complete. Extended trade settlement periods may, in unusual market conditions with a high volume of shareholder redemptions, present a risk to shareholders regarding the Fund’s ability to pay redemption proceeds in a timely manner. In some instances, loans and loan participations are not rated by independent credit rating agencies; in such instances, a decision by the Fund to invest in a particular loan or loan participation could depend exclusively on the subadviser’s credit analysis of the borrower, or in the case of a loan participation, of the intermediary holding the portion of the loan that the Fund has purchased. To the extent the Fund invests in loans of non-U.S. issuers, the risks of investing in non-U.S. issuers are applicable. Loans may not be considered to be “securities” and as a result may not benefit from the protections of the federal securities laws, including anti-fraud protections and those with respect to the use of material non-public information, so that purchasers, such as the Fund, may not have the benefit of these protections. If the Fund is in possession of material non-public information about a borrower as a result of its investment in such borrower’s loan, the Fund may not be able to enter into a transaction
PGIM Fixed Income ETFs 229
Notes to Financial Statements (continued)
with respect to a publicly-traded security of the borrower when it would otherwise be advantageous to do so.
Foreign Securities Risk: Investments in securities of non-U.S. issuers (including those denominated in U.S. dollars) may involve more risk than investing in securities of U.S. issuers. Foreign political, economic and legal systems, especially those in developing and emerging market countries, may be less stable and more volatile than in the United States. Foreign legal systems generally have fewer regulatory requirements than the U.S. legal system, particularly those of emerging markets. In general, less information is publicly available with respect to non-U.S. companies than U.S. companies. Non-U.S. companies generally are not subject to the same accounting, auditing, and financial reporting standards as are U.S. companies. Additionally, the changing value of foreign currencies and changes in exchange rates could also affect the value of the assets the Fund holds and the Fund’s performance. Certain foreign countries may impose restrictions on the ability of issuers of foreign securities to make payment of principal and interest or dividends to investors located outside the country, due to blockage of foreign currency exchanges or otherwise.
Investments in emerging markets are subject to greater volatility and price declines.
In addition, the Fund’s investments in non-U.S. securities may be subject to the risks of nationalization or expropriation of assets, imposition of currency exchange controls or restrictions on the repatriation of non-U.S. currency, confiscatory taxation and adverse diplomatic developments. Special U.S. tax considerations may apply.
Interest Rate Risk: The value of your investment may go down when interest rates rise. A rise in rates tends to have a greater impact on the prices of longer term or duration debt securities. For example, a fixed income security with a duration of three years is expected to decrease in value by approximately 3% if interest rates increase by 1%. This is referred to as “duration risk.” When interest rates fall, the issuers of debt obligations may prepay principal more quickly than expected, and the Fund may be required to reinvest the proceeds at a lower interest rate. This is referred to as “prepayment risk.” For premium bonds (bonds acquired at prices that exceed their par or principal value) purchased by the Fund, prepayment risk may be enhanced. When interest rates rise, debt obligations may be repaid more slowly than expected, and the value of the Fund’s holdings may fall sharply. This is referred to as “extension risk.” The Fund may lose money if short-term or long-term interest rates rise sharply or in a manner not anticipated by the subadviser.
Junk Bonds Risk: High-yield, high-risk bonds have predominantly speculative characteristics, including particularly high credit risk. Junk bonds tend to have lower market liquidity than higher-rated securities. The liquidity of particular issuers or industries within a particular investment category may shrink or disappear suddenly and without warning. The non-investment grade bond market can experience sudden and sharp price swings and
230
become illiquid due to a variety of factors, including changes in economic forecasts, stock market activity, large sustained sales by major investors, a high profile default or a change in the market’s psychology.
Large Shareholder and Large Scale Redemption Risk: Certain individuals, accounts, funds (including funds affiliated with the Manager) or institutions, including the Manager and its affiliates, may from time to time own or control a substantial amount of the Fund’s shares. There is no requirement that these entities maintain their investment in the Fund. There is a risk that such large shareholders or that the Fund’s shareholders generally may redeem all or a substantial portion of their investments in the Fund in a short period of time, which could have a significant negative impact on the Fund’s NAV, liquidity, and brokerage costs. Large redemptions could also result in tax consequences to shareholders and impact the Fund’s ability to implement its investment strategy. The Fund’s ability to pursue its investment objective after one or more large scale redemptions may be impaired and, as a result, the Fund may invest a larger portion of its assets in cash or cash equivalents.
Liquidity Risk: The Fund may invest in instruments that trade in lower volumes and are more illiquid than other investments. If the Fund is forced to sell these investments to pay redemption proceeds or for other reasons, the Fund may lose money. In addition, when there is no willing buyer and investments cannot be readily sold at the desired time or price, the Fund may have to accept a lower price or may not be able to sell the instrument at all. An inability to sell a portfolio position can adversely affect the Fund’s value or prevent the Fund from being able to take advantage of other investment opportunities.
Loan Liquidity and Settlement Risk: The Fund’s investments in loans may subject it to additional illiquidity risks. Loans generally are subject to legal or contractual restrictions on resale. The liquidity of loans, including the volume and frequency of secondary market trading in such loans, varies significantly over time and among individual loans. For example, if the credit quality of a loan unexpectedly declines significantly, secondary market trading in that loan can also decline for a period of time. During periods of infrequent trading, valuing a loan can be more difficult and buying and selling a loan at an acceptable price can be more difficult and delayed. Difficulty in selling a loan can result in a loss. Certain of the Fund’s assets may be invested in assets that are considerably less liquid than debt instruments traded on national exchanges. Market quotations for such assets may be volatile and/or subject to large spreads between bid and ask prices. Loans trade in an over-the-counter market, and confirmation and settlement may take significantly longer than seven days to complete. Extended trade settlement periods may, in unusual market conditions with a high volume of shareholder redemptions, present a risk to shareholders regarding the Fund’s ability to pay redemption proceeds within the allowable time periods stated in the Fund’s Prospectus. To the extent the extended loan settlement process gives rise to short-term liquidity needs, such as the need to satisfy redemption requests, the Fund may hold cash, sell investments or temporarily borrow from banks or other lenders.
PGIM Fixed Income ETFs 231
Notes to Financial Statements (continued)
Management Risk: The value of your investment may decrease if judgments by the subadviser about the attractiveness, value or market trends affecting a particular security, industry or sector or about market movements are incorrect.
Market Disruption and Geopolitical Risks: Market disruption can be caused by economic, financial or political events and factors, including but not limited to, international wars or conflicts (including Russia’s military invasion of Ukraine), geopolitical developments (including trading and tariff arrangements, sanctions and cybersecurity attacks), instability in regions such as Asia, Eastern Europe and the Middle East, terrorism, natural disasters and public health epidemics (including the outbreak of COVID-19 globally).
The extent and duration of such events and resulting market disruptions cannot be predicted, but could be substantial and could magnify the impact of other risks to the Fund. These and other similar events could adversely affect the U.S. and foreign financial markets and lead to increased market volatility, reduced liquidity in the securities markets, significant negative impacts on issuers and the markets for certain securities and commodities and/or government intervention. They may also cause short- or long-term economic uncertainties in the United States and worldwide. As a result, whether or not the Fund invests in securities of issuers located in or with significant exposure to the countries directly affected, the value and liquidity of the Fund’s investments may be negatively impacted. Further, due to closures of certain markets and restrictions on trading certain securities, the value of certain securities held by the Fund could be significantly impacted, which could lead to such securities being valued at zero.
COVID-19 and the related governmental and public responses have had and may continue to have an impact on the Fund’s investments and net asset value and have led and may continue to lead to increased market volatility and the potential for illiquidity in certain classes of securities and sectors of the market. They have also had and may continue to result in periods of business disruption, business closures, inability to obtain raw materials, supplies and component parts, and reduced or disrupted operations for the issuers in which the Fund invests. The occurrence, reoccurrence and pendency of public health epidemics could adversely affect the economies and financial markets either in specific countries or worldwide.
Market Risk: Securities markets may be volatile and the market prices of the Fund’s securities may decline. Securities fluctuate in price based on changes in an issuer’s financial condition and overall market and economic conditions. If the market prices of the securities owned by the Fund fall, the value of your investment in the Fund will decline.
Money Market Instruments Risk: The value of money market instruments may be affected by changing interest rates and by changes in the credit ratings of those instruments. If a
232
significant amount of the Fund’s assets are invested in money market instruments, it will be more difficult for the Fund to achieve its investment objective.
Mortgage-Backed and Asset-Backed Securities Risk: Mortgage-backed and asset-backed securities tend to increase in value less than other debt securities when interest rates decline, but are subject to similar risk of decline in market value during periods of rising interest rates. The values of mortgage-backed and asset-backed securities become more volatile as interest rates rise. In a period of declining interest rates, the Fund may be required to reinvest more frequent prepayments on mortgage-backed and asset-backed securities in lower-yielding investments.
New/Small Fund Risk: The Fund recently commenced operations and has a limited operating history. As a new and relatively small fund, the Fund’s performance may not represent how the Fund is expected to or may perform in the long term if and when it becomes larger and has fully implemented its investment strategies. Investment positions may have a disproportionate impact (negative or positive) on performance in new and smaller funds. New and smaller funds may also require a period of time before they are invested in securities that meet their investment objectives and policies and achieve a representative portfolio composition. Since the Fund is new, an active secondary market for the shares of the Fund may not develop or may not continue once developed. Shareholders holding large blocks of shares of the Fund, including the Manager and its affiliates, may hold their shares for long periods of time, which may lead to reduced trading volumes, wider trading spreads and impede the development or maintenance of an active secondary trading market for Fund shares. These large shareholders may also loan or sell all or a portion of their Fund shares, which may result in increasing concentration of Fund shares in a small number of holders, and the potential for large redemptions, decreases in Fund assets and increased expenses for remaining shareholders.
Non-Money Market Fund Risk: The Fund is not a money market fund. The Fund does not seek to maintain a stable net asset value (NAV) of $1.00 per share. The Fund’s NAV and market value will fluctuate every day and these fluctuations may be significant on certain days. Also, the Fund is not subject to the liquidity requirements and investment and credit quality restrictions applicable to money market funds. There can be no guarantee that the Fund will generate higher returns than money market funds.
Prepayment Risk: The Fund may invest in mortgage-related securities and asset-backed securities, which are subject to prepayment risk. If these securities are prepaid, the Fund may have to replace them with lower-yielding securities. Stripped mortgage-backed securities are generally more sensitive to changes in prepayment and interest rates than other mortgage-related securities. Unlike mortgage-related securities, asset-backed securities are usually not collateralized. If the issuer of a non-collateralized debt security defaults on the obligation, there is no collateral that the security holder may sell to satisfy the debt.
PGIM Fixed Income ETFs 233
Notes to Financial Statements (continued)
Reference Rate Risk: The Fund may be exposed to financial instruments that are tied to the London Interbank Offered Rate (“LIBOR”) to determine payment obligations, financing terms, hedging strategies or investment value.
The United Kingdom’s Financial Conduct Authority announced a phase out of LIBOR such that after June 30, 2023, the overnight, 1-month, 3-month, 6-month and 12-month U.S. dollar LIBOR settings will cease to be published or will no longer be representative. All other LIBOR settings and certain other interbank offered rates, such as the Euro Overnight Index Average (“EONIA”), ceased to be published or representative after December 31, 2021. The Fund may have investments linked to other interbank offered rates that may also cease to be published in the future. Various financial industry groups have been planning for the transition away from LIBOR, but there remain challenges to converting certain securities and transactions to a new reference rate (e.g., the Secured Overnight Financing Rate (“SOFR”), which is intended to replace the U.S. dollar LIBOR).
Neither the effect of the LIBOR transition process nor its ultimate success can yet be known. The transition process might lead to increased volatility and illiquidity in markets for instruments whose terms currently include LIBOR as well as loan facilities used by the Fund. While some existing LIBOR-based instruments may contemplate a scenario where LIBOR is no longer available by providing for an alternative rate-setting methodology, there may be significant uncertainty regarding the effectiveness of any such alternative methodologies to replicate LIBOR. Not all existing LIBOR-based instruments may have alternative rate-setting provisions and there remains uncertainty regarding the willingness and ability of issuers to add alternative rate-setting provisions in certain existing instruments. Global regulators have advised market participants to cease entering into new contracts using LIBOR as a reference rate, and it is possible that investments in LIBOR-based instruments could invite regulatory scrutiny. In addition, a liquid market for newly-issued instruments that use a reference rate other than LIBOR still may be developing. There may also be challenges for the Fund to enter into hedging transactions against such newly-issued instruments until a market for such hedging transactions develops. All of the aforementioned may adversely affect the Fund’s performance or net asset value.
Small Fund Risk: When the Fund’s size is small, the Fund may experience low trading volume and wide bid/ask spreads. The Fund may face the risk of being delisted if it does not meet certain conditions of the listing exchange due to small size. Any resulting liquidation of the Fund could cause the Fund to incur elevated transaction costs for the Fund and negative tax consequences for its shareholders.
Structured Products Risk: Holders of structured product securities bear risks of the underlying investments, index or reference obligation. Certain structured products may be thinly traded or have a limited trading market, and as a result may be characterized as
234
illiquid. The possible lack of a liquid secondary market for structured securities and the resulting inability of the Fund to sell a structured security could expose the Fund to losses and could make structured securities more difficult for the Fund to value accurately, which may also result in additional costs. Structured products are also subject to credit risk; the assets backing the structured product may be insufficient to pay interest or principal. In addition to the general risks associated with investments in fixed income, structured products carry additional risks, including, but not limited to: the possibility that distributions from collateral securities will not be adequate to make interest or other payments; the quality of the collateral may decline in value or default; and the possibility that the structured products are subordinate to other classes. Structured securities are generally privately negotiated debt obligations where the principal and/or interest or value of the structured security is determined by reference to the performance of a specific asset, benchmark asset, market or interest rate (“reference instrument”), and changes in the reference instrument or security may cause significant price fluctuations, or could cause the interest rate on the structured security to be reduced to zero. Holders of structured products indirectly bear risks associated with the reference instrument, are subject to counterparty risk and typically do not have direct rights against the reference instrument. Structured products may also entail structural complexity and documentation risk and there is no guarantee that the courts or administrators will interpret the priority of principal and interest payments as expected.
U.S. Government and Agency Securities Risk: U.S. Government and agency securities are subject to market risk, interest rate risk and credit risk. Not all U.S. Government securities are insured or guaranteed by the full faith and credit of the U.S. Government; some are only insured or guaranteed by the issuing agency, which must rely on its own resources to repay the debt. Some agency securities carry no guarantee whatsoever and the risk of default associated with these securities would be borne by the Fund. The maximum potential liability of the issuers of some U.S. Government securities held by the Fund may greatly exceed their current resources, including their legal right to support from the U.S. Treasury. No assurance can be given that the U.S. Government would provide financial support to any such issuers if it is not obligated to do so by law. It is possible that these issuers will not have the funds to meet their payment obligations in the future. In addition, the value of U.S. Government securities may be affected by changes in the credit rating of the U.S. Government.
Variable and Floating Rate Bonds Risk: Variable and floating rate bonds are subject to credit risk, market risk and interest rate risk. In addition, the absence of an active market for these securities could make it difficult for the Fund to dispose of them if the issuer defaults. The settlement period for such bonds can be longer than seven days.
| 10. | Recent Accounting Pronouncement and Regulatory Developments |
In March 2020, the FASB issued Accounting Standard Update (“ASU”) No. 2020-04, which provides optional guidance for applying GAAP to contract modifications, hedging relationships and other transactions affected by the reference rate reform if certain criteria
PGIM Fixed Income ETFs 235
Notes to Financial Statements (continued)
are met. ASU 2020-04 is elective and is effective on March 12, 2020 through December 31, 2022. Management does not expect ASU 2020-04 to have a material impact on the financial statements.
236
Report of Independent Registered Public Accounting Firm
To the Board of Trustees of PGIM ETF Trust and Shareholders of PGIM Ultra Short Bond ETF, PGIM Active High Yield Bond ETF, PGIM Active Aggregate Bond ETF, PGIM Total Return Bond ETF and PGIM Floating Rate Income ETF
Opinions on the Financial Statements
We have audited the accompanying statements of assets and liabilities, including the schedules of investments, of PGIM Ultra Short Bond ETF, PGIM Active High Yield Bond ETF, PGIM Active Aggregate Bond ETF, PGIM Total Return Bond ETF and PGIM Floating Rate Income ETF (five of the funds constituting PGIM ETF Trust, hereafter collectively referred to as the “Funds”) as of August 31, 2022, the related statements of operations and changes in net assets for each of the periods indicated in the table below, including the related notes, and the financial highlights for each of the periods indicated therein ended on or subsequent to August 31, 2021 (collectively referred to as the “financial statements”). In our opinion, the financial statements present fairly, in all material respects, the financial position of each of the Funds as of August 31, 2022, the results of each of their operations and the changes in each of their net assets for each of the periods indicated in the table below and each of the financial highlights for each of the periods indicated therein ended on or subsequent to August 31, 2021 in conformity with accounting principles generally accepted in the United States of America.
| | |
Fund | | Statements |
PGIM Ultra Short Bond ETF PGIM Active High Yield Bond ETF | | Statements of operations for the year ended August 31, 2022 and statements of changes in net assets for each of the two years in the period ended August 31, 2022 |
| |
| PGIM Active Aggregate Bond ETF | | Statement of operations for the year ended August 31, 2022 and statement of changes in net assets for the year ended August 31, 2022 and for the period April 12, 2021 (commencement of operations) through August 31, 2021 |
| |
| PGIM Total Return Bond ETF | | Statements of operations and changes in net assets for the period December 2, 2021 (commencement of operations) through August 31, 2022 |
| |
| PGIM Floating Rate Income ETF | | Statements of operations and changes in net assets for the period May 17, 2022 (commencement of operations) through August 31, 2022 |
The financial statements of PGIM Ultra Short Bond ETF and PGIM Active High Yield Bond ETF as of and for the year ended August 31, 2020 and the financial highlights for each of the periods ended on or prior to August 31, 2020 (not presented herein, other than the financial highlights) were audited by other auditors whose report dated October 15, 2020 expressed an unqualified opinion on those financial statements and financial highlights.
PGIM Fixed Income ETFs 237
Report of Independent Registered Public Accounting Firm (continued)
Basis for Opinions
These financial statements are the responsibility of the Funds’ management. Our responsibility is to express an opinion on the Funds’ financial statements based on our audits. We are a public accounting firm registered with the Public Company Accounting Oversight Board (United States) (PCAOB) and are required to be independent with respect to the Funds in accordance with the U.S. federal securities laws and the applicable rules and regulations of the Securities and Exchange Commission and the PCAOB.
We conducted our audits of these financial statements in accordance with the standards of the PCAOB. Those standards require that we plan and perform the audit to obtain reasonable assurance about whether the financial statements are free of material misstatement, whether due to error or fraud.
Our audits included performing procedures to assess the risks of material misstatement of the financial statements, whether due to error or fraud, and performing procedures that respond to those risks. Such procedures included examining, on a test basis, evidence regarding the amounts and disclosures in the financial statements. Our audits also included evaluating the accounting principles used and significant estimates made by management, as well as evaluating the overall presentation of the financial statements. Our procedures included confirmation of securities owned as of August 31, 2022 by correspondence with the custodian, transfer agent and brokers. We believe that our audits provide a reasonable basis for our opinion.
/s/PricewaterhouseCoopers LLP
New York, New York
October 26, 2022
We have served as the auditor of one or more investment companies in the PGIM Retail Funds complex since 2020.
238
Tax Information (unaudited)
We are advising you that during the fiscal year ended August 31, 2022, the Fund reported the maximum amount allowed per share for Class Z share as a capital gain distribution in accordance with Section 852(b)(3)(C) of the Internal Revenue Code.
| | |
| | |
| Fund | | Capital Gain Distributions |
PGIM Active High Yield Bond ETF | | $0.11 |
For the year ended August 31, 2022, the following Funds reports the maximum amount allowable but not less than the following percentages as interest-related dividends in accordance with Section 871(k)(1) and 881(e)(1) of the Internal Revenue Code (IRD):
| | | | |
| | |
| Fund | | IRD |
PGIM Ultra Short Bond ETF | | | 81.01 | % |
PGIM Active High Yield Bond ETF | | | 54.55 | % |
PGIM Active Aggregate Bond ETF | | | 57.12 | % |
PGIM Total Return Bond ETF | | | 61.13 | % |
PGIM Floating Rate Income ETF | | | 92.87 | % |
In January 2023, you will be advised on IRS Form 1099-DIV or substitute 1099-DIV as to the federal tax status of the distributions received by you in calendar year 2022.
We are required by Massachusetts, Missouri and Oregon to inform you that dividends which have been derived from interest on federal obligations are not taxable to shareholders providing the Mutual Fund meets certain requirements mandated by the respective state’s taxing authorities. We are pleased to report that the two below funds qualifies for such deduction.
| | |
| | |
| Fund | | Federal Obligations Interest |
PGIM Active Aggregate Bond ETF | | 12.07% |
PGIM Total Return Bond ETF | | 14.89% |
Please consult your tax adviser or state/local authorities to properly report this information on your tax return. If you have any questions concerning the amounts listed above, please call your financial adviser.
PGIM Fixed Income ETFs 239
Liquidity Risk Management Program
(unaudited)
Consistent with Rule 22e-4 under the 1940 Act (the “Liquidity Rule”), each Fund has adopted and implemented a liquidity risk management program (the “LRMP”). Each Fund’s LRMP seeks to assess and manage each Fund’s liquidity risk, which is defined as the risk that each Fund is unable to meet investor redemption requests without significantly diluting the remaining investors’ interests in each Fund. The Board has approved PGIM Investments LLC (“PGIM Investments”), each Fund’s investment manager, to serve as the administrator of each Fund’s LRMP. As part of its responsibilities as administrator, PGIM Investments has retained a third party to perform certain functions, including providing market data and liquidity classification model information.
Each Fund’s LRMP includes a number of processes designed to support the assessment and management of its liquidity risk. In particular, each Fund’s LRMP includes no less than annual assessments of factors that influence each Fund’s liquidity risk; no less than monthly classifications of each Fund’s investments into one of four liquidity classifications provided for in the Liquidity Rule; a 15% of net assets limit on the acquisition of “illiquid investments” (as defined under the Liquidity Rule); establishment of a minimum percentage of each Fund’s assets to be invested in investments classified as “highly liquid” (as defined under the Liquidity Rule) if each Fund does not invest primarily in highly liquid investments; and regular reporting to the Board.
At a meeting of the Board on March 1-3, 2022, PGIM Investments provided a written report (“LRMP Report”) to the Board addressing the operation, adequacy, and effectiveness of each Fund’s LRMP, including any material changes to the LRMP for the period from January 1, 2021 through December 31, 2021 (“Reporting Period”). The LRMP Report concluded that each Fund’s LRMP was reasonably designed to assess and manage each Fund’s liquidity risk and was adequately and effectively implemented during the Reporting Period. There were no material changes to the LRMP during the Reporting Period. The LRMP Report further concluded that each Fund’s investment strategies continue to be appropriate given each Fund’s status as an open-end fund.
The LRMP Report also noted that given the PGIM Floating Rate Income Fund’s portfolio of investments (that is, more than 50% of the Fund’s assets were classified as less than highly liquid), the Fund maintained a Highly Liquid Investment Minimum (“HLIM”) throughout the Reporting Period.
There can be no assurance that the LRMP will achieve its objectives in the future. Additional information regarding risks of investing in each Fund including liquidity risks presented by each Fund’s investment portfolio, is found in each Fund’s Prospectus and Statement of Additional Information.
Visit our website at pgim.com/investments
INFORMATION ABOUT BOARD MEMBERS AND OFFICERS (unaudited)
Information about Board Members and Officers of the Funds is set forth below. Board Members who are not deemed to be “interested persons” of the Funds, as defined in the 1940 Act, are referred to as “Independent Board Members.” Board Members who are deemed to be “interested persons” of the Funds are referred to as “Interested Board Members.” The Board Members are responsible for the overall supervision of the operations of the Funds and perform the various duties imposed on the directors of investment companies by the 1940 Act. The Board in turn elects the Officers, who are responsible for administering the day-to-day operations of the Funds.
| | | | | | |
| | | |
| Independent Board Members | | | | |
Name Year of Birth Position(s) Portfolios Overseen | | Principal Occupation(s) During Past Five Years | | Other Directorships Held During Past Five Years | | Length of Board Service |
| | | | |
Ellen S. Alberding 1958 Board Member Portfolios Overseen: 97 | | President and Board Member, The Joyce Foundation (charitable foundation) (since 2002); formerly Vice Chair, City Colleges of Chicago (community college system) (2011-2015); Trustee, National Park Foundation (charitable foundation for national park system) (2009-2018); Trustee, Economic Club of Chicago (2009-2016); Trustee, Loyola University (since 2018). | | None. | | Since September 2013 |
| | | | |
Kevin J. Bannon 1952 Board Member Portfolios Overseen: 97 | | Retired; formerly Managing Director (April 2008-May 2015) and Chief Investment Officer (October 2008-November 2013) of Highmount Capital LLC (registered investment adviser); formerly Executive Vice President and Chief Investment Officer (April 1993-August 2007) of Bank of New York Company; President (May 2003-May 2007) of BNY Hamilton Family of Mutual Funds. | | Director of Urstadt Biddle Properties (equity real estate investment trust) (since September 2008). | | Since July 2008 |
PGIM Fixed Income ETFs
| | | | | | |
| | | |
| Independent Board Members | | | | |
Name Year of Birth Position(s) Portfolios Overseen | | Principal Occupation(s) During Past Five Years | | Other Directorships Held During Past Five Years | | Length of Board Service |
| | | | |
Linda W. Bynoe 1952 Board Member Portfolios Overseen: 94 | | President and Chief Executive Officer (since March 1995) and formerly Chief Operating Officer (December 1989-February 1995) of Telemat Limited LLC (formerly Telemat Ltd) (management consulting); formerly Vice President (January 1985-June 1989) at Morgan Stanley & Co. (broker-dealer). | | Trustee of Equity Residential (residential real estate) (since December 2009); Director of Northern Trust Corporation (financial services) (since April 2006); formerly Director of Anixter International, Inc. (communication products distributor) (January 2006-June 2020). | | Since March 2005 |
| | | | |
Barry H. Evans 1960 Board Member Portfolios Overseen: 96 | | Retired; formerly President (2005-2016), Global Chief Operating Officer (2014-2016), Chief Investment Officer - Global Head of Fixed Income (1998-2014), and various portfolio manager roles (1986-2006), Manulife Asset Management (asset management). | | Formerly Director, Manulife Trust Company (2011-2018); formerly Director, Manulife Asset Management Limited (2015-2017); formerly Chairman of the Board of Directors of Manulife Asset Management U.S. (2005-2016); formerly Chairman of the Board, Declaration Investment Management and Research (2008-2016). | | Since September 2017 |
| | | | |
Keith F. Hartstein 1956 Board Member & Independent Chair Portfolios Overseen: 97 | | Retired; Member (November 2014- September 2022) of the Governing Council of the Independent Directors Council (IDC) (organization of independent mutual fund directors); formerly Executive Committee of the IDC Board of Governors (October 2019-December 2021); formerly President and Chief Executive Officer (2005-2012), Senior Vice President (2004-2005), Senior Vice President of Sales and Marketing (1997-2004), and various executive management positions (1990-1997), John Hancock Funds, LLC (asset management); Chairman, Investment Company Institute’s Sales Force Marketing Committee (2003-2008). | | None. | | Since September 2013 |
Visit our website at pgim.com/investments
| | | | | | |
| | | |
| Independent Board Members | | | | |
Name Year of Birth Position(s) Portfolios Overseen | | Principal Occupation(s) During Past Five Years | | Other Directorships Held During Past Five Years | | Length of Board Service |
| | | | |
Laurie Simon Hodrick 1962 Board Member Portfolios Overseen: 93 | | A. Barton Hepburn Professor Emerita of Economics in the Faculty of Business, Columbia Business School (since 2018); Visiting Fellow at the Hoover Institution, Stanford University (since 2015); Sole Member, ReidCourt LLC (since 2008) (a consulting firm); formerly Visiting Professor of Law, Stanford Law School (2015-2021); formerly A. Barton Hepburn Professor of Economics in the Faculty of Business, Columbia Business School (1996-2017); formerly Managing Director, Global Head of Alternative Investment Strategies, Deutsche Bank (2006-2008). | | Independent Director, Andela (since January 2022) (global talent network); Independent Director, Roku (since December 2020) (communication services); formerly Independent Director, Synnex Corporation (2019-2021) (information technology); formerly Independent Director, Kabbage, Inc. (2018-2020) (financial services); formerly Independent Director, Corporate Capital Trust (2017-2018) (a business development company). | | Since September 2017 |
| | | | |
Brian K. Reid 1961 Board Member Portfolios Overseen: 96 | | Retired; formerly Chief Economist for the Investment Company Institute (ICI) (2005-2017); formerly Senior Economist and Director of Industry and Financial Analysis at the ICI (1998-2004); formerly Senior Economist, Industry and Financial Analysis at the ICI (1996-1998); formerly Staff Economist at the Federal Reserve Board (1989-1996); Director, ICI Mutual Insurance Company (2012-2017). | | None. | | Since March 2018 |
PGIM Fixed Income ETFs
| | | | | | |
| | | |
| Independent Board Members | | | | |
Name Year of Birth Position(s) Portfolios Overseen | | Principal Occupation(s) During Past Five Years | | Other Directorships Held During Past Five Years | | Length of Board Service |
| | | | |
Grace C. Torres 1959 Board Member Portfolios Overseen: 96 | | Retired; formerly Treasurer and Principal Financial and Accounting Officer of the PGIM Funds, Target Funds, Advanced Series Trust, Prudential Variable Contract Accounts and The Prudential Series Fund (1998-June 2014); Assistant Treasurer (March 1999-June 2014) and Senior Vice President (September 1999-June 2014) of PGIM Investments LLC; Assistant Treasurer (May 2003-June 2014) and Vice President (June 2005-June 2014) of AST Investment Services, Inc.; Senior Vice President and Assistant Treasurer (May 2003-June 2014) of Prudential Annuities Advisory Services, Inc. | | Director (since January 2018) of OceanFirst Financial Corp. and OceanFirst Bank; formerly Director (July 2015-January 2018) of Sun Bancorp, Inc. N.A. and Sun National Bank. | | Since November 2014 |
Visit our website at pgim.com/investments
| | | | | | |
| | | |
| Interested Board Members | | | | |
Name Year of Birth Position(s) Portfolios Overseen | | Principal Occupation(s) During Past Five Years | | Other Directorships Held During Past Five Years | | Length of Board Service |
| | | | |
Stuart S. Parker 1962 Board Member & President Portfolios Overseen: 96 | | President, Chief Executive Officer, Chief Operating Officer and Officer in Charge of PGIM Investments LLC (formerly known as Prudential Investments LLC) (since January 2012); President and PEO (since September 2022) of the PGIM Private Credit Fund, President and PEO (since March 2022) of the PGIM Private Real Estate Fund, Inc.; formerly Executive Vice President of Jennison Associates LLC and Head of Retail Distribution of PGIM Investments LLC (June 2005-December 2011); Investment Company Institute - Board of Governors (since May 2012). | | None. | | Since January 2012 |
| | | | |
Scott E. Benjamin 1973 Board Member & Vice President Portfolios Overseen: 97 | | Executive Vice President (since May 2009) of PGIM Investments LLC; Vice President (since June 2012) of Prudential Investment Management Services LLC; Executive Vice President (since September 2009) of AST Investment Services, Inc.; Senior Vice President of Product Development and Marketing, PGIM Investments (since February 2006); Vice President (since September 2022) of the PGIM Private Credit Fund, Vice President (since March 2022) of the PGIM Private Real Estate Fund, Inc.; formerly Vice President of Product Development and Product Management, PGIM Investments LLC (2003-2006). | | None. | | Since March 2010 |
PGIM Fixed Income ETFs
| | | | |
| | | |
| Fund Officers(a) | | | | |
Name Year of Birth Fund Position | | Principal Occupation(s) During Past Five Years | | Length of Service as Fund Officer |
| | | |
Claudia DiGiacomo 1974 Chief Legal Officer | | Chief Legal Officer, Executive Vice President and Secretary of PGIM Investments LLC (since August 2020); Chief Legal Officer of Prudential Mutual Fund Services LLC (since August 2020); Chief Legal Officer of PIFM Holdco, LLC (since August 2020); Chief Legal Officer (since September 2022) of the PGIM Private Credit Fund, Chief Legal Officer (since March 2022) of the PGIM Private Real Estate Fund, Inc.; Vice President and Corporate Counsel (since January 2005) of Prudential; and Corporate Counsel of AST Investment Services, Inc. (since August 2020); formerly Vice President and Assistant Secretary of PGIM Investments LLC (2005-2020); formerly Associate at Sidley Austin Brown & Wood LLP (1999-2004). | | Since December 2005 |
| | | |
Isabelle Sajous 1976 Chief Compliance Officer | | Chief Compliance Officer (since April 2022) of PGIM Investments LLC, the PGIM Funds, Target Funds, PGIM ETF Trust, PGIM Global High Yield Fund, Inc., PGIM High Yield Bond Fund, Inc., PGIM Short Duration High Yield Opportunities Fund, Advanced Series Trust, The Prudential Series Fund and Prudential’s Gibraltar Fund, Inc.; Chief Compliance Officer (since March 2022) of the PGIM Private Real Estate Fund, Inc.; Chief Compliance Officer (since September 2022) of the PGIM Private Credit Fund; Vice President, Compliance of PGIM Investments LLC (since December 2020); formerly Director, Compliance (July 2018-December 2020) of Credit Suisse Asset Management LLC; and Vice President, Associate General Counsel & Deputy Chief Compliance Officer of Cramer Rosenthal McGlynn, LLC (August 2014-July 2018). | | Since April 2022 |
| | | |
Andrew R. French 1962 Secretary | | Vice President (since December 2018) of PGIM Investments LLC; formerly Vice President and Corporate Counsel (2010-2018) of Prudential; Secretary (since September 2022) of the PGIM Private Credit Fund, Secretary (since March 2022) of the PGIM Private Real Estate Fund, Inc.; formerly Director and Corporate Counsel (2006-2010) of Prudential; Vice President and Assistant Secretary (since January 2007) of PGIM Investments LLC; Vice President and Assistant Secretary (since January 2007) of Prudential Mutual Fund Services LLC. | | Since October 2006 |
| | | |
Melissa Gonzalez 1980 Assistant Secretary | | Vice President and Corporate Counsel (since September 2018) of Prudential; Vice President and Assistant Secretary (since August 2020) of PGIM Investments LLC; Assistant Secretary (since September 2022) of the PGIM Private Credit Fund, Assistant Secretary (since March 2022) of the PGIM Private Real Estate Fund, Inc.; formerly Director and Corporate Counsel (March 2014-September 2018) of Prudential. | | Since March 2020 |
Visit our website at pgim.com/investments
| | | | |
| | | |
| Fund Officers(a) | | | | |
Name Year of Birth Fund Position | | Principal Occupation(s) During Past Five Years | | Length of Service as Fund Officer |
| | | |
Patrick E. McGuinness 1986 Assistant Secretary | | Vice President and Assistant Secretary (since August 2020) of PGIM Investments LLC; Director and Corporate Counsel (since February 2017) of Prudential; Assistant Secretary (since September 2022) of the PGIM Private Credit Fund, Assistant Secretary (since March 2022) of the PGIM Private Real Estate Fund, Inc. | | Since June 2020 |
| | | |
Debra Rubano 1975 Assistant Secretary | | Vice President and Corporate Counsel (since November 2020) of Prudential; Assistant Secretary (since March 2022) of the PGIM Private Real Estate Fund, Inc; Assistant Secretary (since September 2022) of the PGIM Private Credit Fund; formerly Director and Senior Counsel of Allianz Global Investors U.S. Holdings LLC (2010-2020) and Assistant Secretary of numerous funds in the Allianz fund complex (2015-2020). | | Since December 2020 |
| | | |
Christian J. Kelly 1975 Treasurer and Principal Financial and Accounting Officer | | Vice President, Head of Fund Administration of PGIM Investments LLC (since November 2018); Principal Financial Officer (since September 2022) of the PGIM Private Credit Fund; Principal Financial Officer (since March 2022) of the PGIM Private Real Estate Fund, Inc.; formerly, Treasurer and Principal Accounting Officer (March 2022- July 2022) of the PGIM Private Real Estate Fund, Inc.; formerly Director of Fund Administration of Lord Abbett & Co. LLC (2009-2018), Treasurer and Principal Accounting Officer of the Lord Abbett Family of Funds (2017-2018); Director of Accounting, Avenue Capital Group (2008-2009); Senior Manager, Investment Management Practice of Deloitte & Touche LLP (1998-2007). | | Since January 2019 |
| | | |
Lana Lomuti 1967 Assistant Treasurer | | Vice President (since 2007) and Director (2005-2007), within PGIM Investments Fund Administration; formerly Assistant Treasurer (December 2007-February 2014) of The Greater China Fund, Inc. | | Since April 2014 |
| | | |
Russ Shupak 1973 Assistant Treasurer | | Vice President (since 2017) and Director (2013-2017), within PGIM Investments Fund Administration; Assistant Treasurer (since September 2022) of the PGIM Private Credit Fund, Treasurer and Principal Accounting Officer (since July 2022) of the PGIM Private Real Estate Fund, Inc.; formerly Assistant Treasurer (March 2022 – July 2022) of the PGIM Private Real Estate Fund, Inc. | | Since October 2019 |
| | | |
Deborah Conway 1969 Assistant Treasurer | | Vice President (since 2017) and Director (2007-2017), within PGIM Investments Fund Administration. | | Since October 2019 |
| | | |
Elyse M. McLaughlin 1974 Assistant Treasurer | | Vice President (since 2017) and Director (2011-2017), within PGIM Investments Fund Administration; Treasurer and Principal Accounting Officer (since September 2022) of the PGIM Private Credit Fund, Assistant Treasurer (since March 2022) of the PGIM Private Real Estate Fund, Inc. | | Since October 2019 |
PGIM Fixed Income ETFs
| | | | |
| | | |
| Fund Officers(a) | | | | |
Name Year of Birth Fund Position | | Principal Occupation(s) During Past Five Years | | Length of Service as Fund Officer |
| | | |
Kelly Florio 1978 Anti-Money Laundering Compliance Officer | | Vice President, Corporate Compliance, Global Compliance Programs and Compliance Risk Management (since December 2021) of Prudential; formerly, Head of Fraud Risk Management (October 2019 to December 2021) at New York Life Insurance Company; formerly, Head of Key Risk Area Operations (November 2018 to October 2019), Director of the US Anti-Money Laundering Compliance Unit (2009-2018) and Bank Loss Prevention Associate (2006 -2009) at MetLife. | | Since June 2022 |
(a) Excludes Mr. Parker and Mr. Benjamin, interested Board Members who also serve as President and Vice President, respectively.
Explanatory Notes to Tables:
| ∎ | | Board Members are deemed to be “Interested,” as defined in the 1940 Act, by reason of their affiliation with PGIM Investments LLC and/or an affiliate of PGIM Investments LLC. |
| ∎ | | Unless otherwise noted, the address of all Board Members and Officers is c/o PGIM Investments LLC, 655 Broad Street, Newark, New Jersey 07102-4410. |
| ∎ | | There is no set term of office for Board Members or Officers. The Board Members have adopted a retirement policy, which calls for the retirement of Board Members on December 31 of the year in which they reach the age of 75. |
| ∎ | | “Other Directorships Held” includes all directorships of companies required to register or file reports with the SEC under the 1934 Act (that is, “public companies”) or other investment companies registered under the 1940 Act. |
| ∎ | | “Portfolios Overseen” includes all investment companies managed by PGIM Investments LLC. The investment companies for which PGIM Investments LLC serves as manager include the PGIM Mutual Funds, Target Funds, The Prudential Variable Contract Accounts, PGIM ETF Trust, PGIM Private Real Estate Fund, Inc., PGIM Private Credit Fund, PGIM High Yield Bond Fund, Inc., PGIM Global High Yield Fund, Inc., PGIM Short Duration High Yield Opportunities Fund, The Prudential Series Fund, Prudential’s Gibraltar Fund, Inc. and the Advanced Series Trust. |
| ∎ | | As used in the Fund Officers table “Prudential” means The Prudential Insurance Company of America. |
Visit our website at pgim.com/investments
Approval of Advisory Agreements (unaudited)
PGIM Ultra Short Bond ETF
The Fund’s Board of Trustees
The Board of Trustees (the “Board”) of PGIM Ultra Short Bond ETF1 (the “Fund”) consists of ten individuals, eight of whom are not “interested persons” of the Fund, as defined in the Investment Company Act of 1940, as amended (the “1940 Act”) (the “Independent Trustees”). The Board is responsible for the oversight of the Fund and its operations, and performs the various duties imposed on the Trustees of investment companies by the 1940 Act. The Independent Trustees have retained independent legal counsel to assist them in connection with their duties. The Chair of the Board is an Independent Director. The Board has established five standing committees: the Audit Committee, the Nominating and Governance Committee, the Compliance Committee and two Investment Committees. Each committee is chaired by, and composed of, Independent Trustees.
Annual Approval of the Fund’s Advisory Agreements
As required under the 1940 Act, the Board determines annually whether to renew the Fund’s management agreement with PGIM Investments LLC (“PGIM Investments”) and the Fund’s subadvisory agreement with PGIM Limited (“PGIML”) and PGIM, Inc. on behalf of its PGIM Fixed Income unit (“PGIM Fixed Income”). In considering the renewal of the agreements, the Board, including all of the Independent Trustees, met on May 26 and June 7-9, 2022 (the “Board Meeting”) and approved the renewal of the agreements through July 31, 2023, after concluding that the renewal of the agreements was in the best interests of the Fund and its shareholders.
In advance of the meetings, the Board requested and received materials relating to the agreements, and had the opportunity to ask questions and request further information in connection with its consideration. Among other things, the Board considered comparative fee information from PGIM Investments, PGIML and PGIM Fixed Income. Also, the Board considered comparisons with other mutual funds in relevant Peer Universes and Peer Groups, as is further discussed below.
In approving the agreements, the Board, including the Independent Trustees advised by independent legal counsel, considered the factors it deemed relevant, including the nature, quality and extent of services provided by PGIM Investments, the subadvisers and, as relevant, its affiliates, the performance of the Fund, the profitability of PGIM Investments and its affiliates, expenses and fees, and the potential for economies of scale that may be shared with the Fund and its shareholders as the Fund’s assets grow. In their deliberations, the Trustees did not identify any single factor which alone was responsible for the Board’s decision to approve the agreements with respect to the Fund. In connection with its deliberations, the Board considered information provided by PGIM Investments throughout the year at regular Board meetings, presentations from
1PGIM Ultra Short Bond ETF is a series of PGIM ETF Trust.
PGIM Fixed Income ETFs
Approval of Advisory Agreements (continued)
portfolio managers and other information, as well as information furnished at or in advance of the Board Meeting.
The Trustees determined that the overall arrangements between the Fund and PGIM Investments, which serves as the Fund’s investment manager pursuant to a management agreement, and between PGIM Investments and each of PGIML and PGIM Fixed Income, which serve as the Fund’s subadvisers pursuant to the terms of a subadvisory agreement with PGIM Investments, are in the best interests of the Fund and its shareholders in light of the services performed, fees charged and such other matters as the Trustees considered relevant in the exercise of their business judgment.
The material factors and conclusions that formed the basis for the Trustees’ reaching their determinations to approve the continuance of the agreements are separately discussed below.
Nature, Quality and Extent of Services
The Board received and considered information regarding the nature, quality and extent of services provided to the Fund by PGIM Investments, PGIML and PGIM Fixed Income. The Board noted that PGIML and PGIM Fixed Income are affiliated with PGIM Investments. The Board considered the services provided by PGIM Investments, including but not limited to the oversight of the subadvisers for the Fund, as well as the provision of fund recordkeeping, compliance and other services to the Fund, and PGIM Investments’ role as administrator of the Fund’s liquidity risk management program. With respect to PGIM Investments’ oversight of the subadvisers, the Board noted that PGIM Investments’ Strategic Investment Research Group (“SIRG”), which is a business unit of PGIM Investments, is responsible for monitoring and reporting to PGIM
Investments’ senior management on the performance and operations of the subadvisers. The Board also considered that PGIM Investments pays the salaries of all of the officers and interested Trustees of the Fund who are part of Fund management. The Board also considered the investment subadvisory services provided by PGIML and PGIM Fixed Income, including investment research and security selection, as well as adherence to the Fund’s investment restrictions and compliance with applicable Fund policies and procedures. The Board considered PGIM Investments’ evaluation of the subadvisers, as well as PGIM Investments’ recommendation, based on its review of the subadvisers, to renew the subadvisory agreement.
The Board considered the qualifications, backgrounds and responsibilities of PGIM Investments’ senior management responsible for the oversight of the Fund, PGIML and PGIM Fixed Income, and also considered the qualifications, backgrounds and responsibilities of the PGIML and PGIM Fixed Income portfolio managers who are responsible for the day-to-day management of the Fund’s portfolio. The Board was provided with information pertaining to PGIML’s, PGIM Investments’ and PGIM Fixed Income’s organizational structure, senior management, investment operations, and other relevant information pertaining to PGIM Investments, PGIML and PGIM Fixed Income. The Board also noted that it received favorable compliance reports from the
Visit our website at pgim.com/investments
Fund’s Chief Compliance Officer (“CCO”) as to PGIM Investments, PGIML and PGIM Fixed Income.
The Board concluded that it was satisfied with the nature, extent and quality of the investment management services provided by PGIM Investments, and the subadvisory services provided to the Fund by PGIML and PGIM Fixed Income, and that there was a reasonable basis on which to conclude that the Fund benefits from the services provided by PGIM Investments, PGIML and PGIM Fixed Income under the management agreement and the subadvisory agreement.
Costs of Services and Profits Realized by PGIM Investments
The Board was provided with information on the profitability of PGIM Investments and its affiliates in serving as the Fund’s investment manager. The Board discussed with PGIM Investments the methodology utilized in assembling the information regarding profitability and considered its reasonableness. The Board recognized that it is difficult to make comparisons of profitability from fund management contracts because comparative information is not generally publicly available and is affected by numerous factors, including the structure of the particular adviser, the types of funds it manages, its business mix, numerous assumptions regarding allocations and the adviser’s capital structure and cost of capital. However, the Board considered that the cost of services provided by PGIM Investments exceeded the management fees received by PGIM Investments, resulting in an operating loss to PGIM Investments for the year ended December 31, 2021. Taking these factors into account, the Board concluded that the profitability of PGIM Investments and its affiliates in relation to the services rendered was not unreasonable.
Economies of Scale
The Board received and discussed information concerning economies of scale that PGIM Investments may realize as the Fund’s assets grow beyond current levels. During the course of time, the Board has considered information regarding the launch date of the Fund, the management fees of the Fund compared to those of similarly managed funds and PGIM Investments’ investment in the Fund over time. The Board noted that economies of scale can be shared with the Fund in other ways, including low management fees from inception, additional technological and personnel investments to enhance shareholder services, and maintaining existing expense structures in the face of a rising cost environment. The Board also considered PGIM Investments’ assertion that it continually evaluates the management fee schedule of the Fund and the potential to share economies of scale through breakpoints or fee waivers as asset levels increase.
The Board recognized the inherent limitations of any analysis of economies of scale, stemming largely from the Board’s understanding that most of PGIM Investments’ costs are not specific to individual funds, but rather are incurred across a variety of products and services.
PGIM Fixed Income ETFs
Approval of Advisory Agreements (continued)
Other Benefits to PGIM Investments, PGIML and PGIM Fixed Income
The Board considered potential ancillary benefits that might be received by PGIM Investments, PGIML, PGIM Fixed Income and their affiliates as a result of their relationship with the Fund. The Board concluded that potential benefits to be derived by PGIM Investments included transfer agency fees received by the Fund’s transfer agent (which is affiliated with PGIM Investments), as well as benefits to its reputation or other intangible benefits resulting from PGIM Investments’ association with the Fund. The Board concluded that the potential benefits to be derived by PGIML and PGIM Fixed Income included the ability to use soft dollar credits, as well as the potential benefits consistent with those generally resulting from an increase in assets under management, specifically, potential access to additional research resources and benefits to its reputation. The Board concluded that the benefits derived by PGIM Investments, PGIML and PGIM Fixed Income were consistent with the types of benefits generally derived by investment managers and subadvisers to mutual funds.
Performance of the Fund / Fees and Expenses
The Board considered certain additional factors and made related conclusions relating to the historical performance of the Fund for the one-year period ended December 31, 2021. The Board considered that the Fund commenced operations on April 5, 2018 and that longer-term performance was not yet available.
The Board also considered the Fund’s actual management fee, as well as the Fund’s net total expense ratio, for the fiscal year ended August 31, 2021. The Board considered the management fee for the Fund as compared to the management fee charged by PGIM Investments to other funds and the fee charged by other advisers to comparable mutual funds in a Peer Group. The actual management fee represents the fee rate actually paid by Fund shareholders and includes any fee waivers or reimbursements. The net total expense ratio for the Fund represents the actual expense ratio incurred by Fund shareholders.
The mutual funds included in the Peer Universe, which was used to consider performance, and the Peer Group, which was used to consider expenses and fees, were objectively determined by Broadridge, an independent provider of mutual fund data. In certain circumstances, PGIM Investments also provided supplemental Peer Universe or Peer Group information for reasons addressed with the Board. The comparisons placed the Fund in various quartiles over various periods, with the first quartile being the best 25% of the mutual funds (for performance, the best performing mutual funds and, for expenses, the lowest cost mutual funds).
The section below summarizes key factors considered by the Board and the Board’s conclusions regarding the Fund’s performance, fees and overall expenses. The table sets forth net performance comparisons (which reflect the impact on performance of fund expenses, or any subsidies, expense caps or waivers that may be applicable) with the Peer Universe, actual management fees with the Peer Group (which reflect the
Visit our website at pgim.com/investments
impact of any subsidies or fee waivers), and net total expenses with the Peer Group, each of which were key factors considered by the Board.
| | | | | | | | |
Net Performance | | 1 Year | | 3 Years | | 5 Years | | 10 Years |
| | | 1st Quartile | | 1st Quartile | | N/A | | N/A |
Actual Management Fees: 1st Quartile |
Net Total Expenses: 1st Quartile |
| | ● | The Board noted that the Fund outperformed both of its benchmark indices over the one-year and three-year periods. |
| | ● | The Board noted that the Fund does not yet have a five-year performance record and that, therefore, the subadvisers should have more time to develop that record. |
| | ● | The Board and PGIM Investments agreed to retain the Fund’s existing contractual fee waiver, pursuant to which PGIM Investments waives any management fees it receives from the Fund in an amount equal to the subadvisory fees paid by the Fund to the PGIM Institutional Money Market Fund. |
| | ● | The Board concluded that, in light of the above, it would be in the best interests of the Fund and its shareholders to continue to allow the Fund to create a longer-term performance record, and to renew the agreements. |
| | ● | The Board concluded that the management fees (including subadvisory fees) and total expenses were reasonable in light of the services provided. |
* * *
After full consideration of these factors, the Board concluded that approval of the agreements was in the best interests of the Fund and its shareholders.
PGIM Active High Yield Bond ETF
The Fund’s Board of Trustees
The Board of Trustees (the “Board”) of PGIM Active High Yield Bond ETF2 (the “Fund”) consists of ten individuals, eight of whom are not “interested persons” of the Fund, as defined in the Investment Company Act of 1940, as amended (the “1940 Act”) (the “Independent Trustees”). The Board is responsible for the oversight of the Fund and its operations, and performs the various duties imposed on the Trustees of investment companies by the 1940 Act. The Independent Trustees have retained independent legal counsel to assist them in connection with their duties. The Chair of the Board is an Independent Director. The Board has established five standing committees: the Audit Committee, the Nominating and Governance Committee, the Compliance Committee and two Investment Committees. Each committee is chaired by, and composed of, Independent Trustees.
PGIM Fixed Income ETFs
Approval of Advisory Agreements (continued)
Annual Approval of the Fund’s Advisory Agreements
As required under the 1940 Act, the Board determines annually whether to renew the Fund’s management agreement with PGIM Investments LLC (“PGIM Investments”) and the Fund’s subadvisory agreement with PGIM, Inc. (“PGIM”) on behalf of its PGIM Fixed Income unit (“PGIM Fixed Income”). In considering the renewal of the agreements, the Board, including all of the Independent Trustees, met on May 26 and June 7-9, 2022 (the “Board Meeting”) and approved the renewal of the agreements through July 31, 2023, after concluding that the renewal of the agreements was in the best interests of the Fund and its shareholders.
In advance of the meetings, the Board requested and received materials relating to the agreements, and had the opportunity to ask questions and request further information in connection with its consideration. Among other things, the Board considered comparative fee information from PGIM Investments and PGIM. Also, the Board considered comparisons with other mutual funds in relevant Peer Universes and Peer Groups, as is further discussed below.
In approving the agreements, the Board, including the Independent Trustees advised by independent legal counsel, considered the factors it deemed relevant, including the nature, quality and extent of services provided by PGIM Investments, the subadviser and, as relevant, its affiliates, the performance of the Fund, the profitability of PGIM Investments and its affiliates, expenses and fees, and the potential for economies of scale that may be shared with the Fund and its shareholders as the Fund’s assets grow. In their deliberations, the Trustees did not identify any single factor which alone was responsible for the Board’s decision to approve the agreements with respect to the Fund. In connection with its deliberations, the Board considered information provided by PGIM Investments throughout the year at regular Board meetings, presentations from portfolio managers and other information, as well as information furnished at or in advance of the Board Meeting.
The Trustees determined that the overall arrangements between the Fund and PGIM Investments, which serves as the Fund’s investment manager pursuant to a management agreement, between PGIM Investments and PGIM, which, through its PGIM Fixed Income unit, serves as the Fund’s subadviser pursuant to the terms of a subadvisory agreement with PGIM Investments are in the best interests of the Fund and its shareholders in light of the services performed, fees charged and such other matters as the Trustees considered relevant in the exercise of their business judgment.
The material factors and conclusions that formed the basis for the Trustees’ reaching their determinations to approve the continuance of the agreements are separately discussed below.
2PGIM Active High Yield Bond ETF is a series of PGIM ETF Trust.
Visit our website at pgim.com/investments
Nature, Quality and Extent of Services
The Board received and considered information regarding the nature, quality and extent of services provided to the Fund by PGIM Investments and, PGIM Fixed Income. The Board noted that PGIM Fixed Income is affiliated with PGIM Investments. The Board considered the services provided by PGIM Investments, including but not limited to the oversight of the subadviser for the Fund, as well as the provision of fund recordkeeping, compliance and other services to the Fund, and PGIM Investments’ role as administrator of the Fund’s liquidity risk management program. With respect to PGIM Investments’ oversight of the subadviser, the Board noted that PGIM Investments’ Strategic Investment Research Group (“SIRG”), which is a business unit of PGIM Investments, is responsible for monitoring and reporting to PGIM Investments’ senior management on the performance and operations of the subadviser. The Board also considered that PGIM Investments pays the salaries of all of the officers and interested Trustees of the Fund who are part of Fund management. The Board also considered the investment subadvisory services provided by PGIM Fixed Income, including investment research and security selection, as well as adherence to the Fund’s investment restrictions and compliance with applicable Fund policies and procedures. The Board considered PGIM Investments’ evaluation of the subadviser, as well as PGIM Investments’ recommendation, based on its review of the subadviser, to renew the subadvisory agreement.
The Board considered the qualifications, backgrounds and responsibilities of PGIM Investments’ senior management responsible for the oversight of the Fund and PGIM Fixed Income, and also considered the qualifications, backgrounds and responsibilities of PGIM Fixed Income’s portfolio managers who are responsible for the day-to-day management of the Fund’s portfolio. The Board was provided with information pertaining to PGIM Investments’ and PGIM Fixed Income’s organizational structure, senior management, investment operations, and other relevant information pertaining to PGIM Investments and PGIM Fixed Income. The Board also noted that it received favorable compliance reports from the Fund’s Chief Compliance Officer (“CCO”) as to PGIM Investments and PGIM Fixed Income.
The Board concluded that it was satisfied with the nature, extent and quality of the investment management services provided by PGIM Investments, and the subadvisory services provided to the Fund by PGIM Fixed Income, and that there was a reasonable basis on which to conclude that the Fund benefits from the services provided by PGIM Investments and PGIM Fixed Income under the management, subadvisory agreement.
Costs of Services and Profits Realized by PGIM Investments
The Board was provided with information on the profitability of PGIM Investments and its affiliates in serving as the Fund’s investment manager. The Board discussed with PGIM Investments the methodology utilized in assembling the information regarding profitability and considered its reasonableness. The Board recognized that it is difficult to make comparisons of profitability from fund management contracts because
PGIM Fixed Income ETFs
Approval of Advisory Agreements (continued)
comparative information is not generally publicly available and is affected by numerous factors, including the structure of the particular adviser, the types of funds it manages, its business mix, numerous assumptions regarding allocations and the adviser’s capital structure and cost of capital. Taking these factors into account, the Board concluded that the profitability of PGIM Investments and its affiliates in relation to the services rendered was not unreasonable.
Economies of Scale
The Board received and discussed information concerning economies of scale that PGIM Investments may realize as the Fund’s assets grow beyond current levels. During the course of time, the Board has considered information regarding the launch date of the Fund, the management fees of the Fund compared to those of similarly managed funds and PGIM Investments’ investment in the Fund over time. The Board noted that economies of scale can be shared with the Fund in other ways, including low management fees from inception, additional technological and personnel investments to enhance shareholder services, and maintaining existing expense structures in the face of a rising cost environment. The Board also considered PGIM Investments’ assertion that it continually evaluates the management fee schedule of the Fund and the potential to share economies of scale through breakpoints or fee waivers as asset levels increase.
The Board recognized the inherent limitations of any analysis of economies of scale, stemming largely from the Board’s understanding that most of PGIM Investments’ costs are not specific to individual funds, but rather are incurred across a variety of products and services.
Other Benefits to PGIM Investments, and PGIM Fixed Income
The Board considered potential ancillary benefits that might be received by PGIM Investments, PGIM Fixed Income and their affiliates as a result of their relationship with the Fund. The Board concluded that potential benefits to be derived by PGIM Investments included transfer agency fees received by the Fund’s transfer agent (which is affiliated with PGIM Investments), as well as benefits to its reputation or other intangible benefits resulting from PGIM Investments’ association with the Fund. The Board concluded that the potential benefits to be derived by PGIM Fixed Income included the ability to use soft dollar credits, as well as the potential benefits consistent with those generally resulting from an increase in assets under management, specifically, potential access to additional research resources and benefits to its reputation. The Board concluded that the benefits derived by PGIM Investments and PGIM Fixed Income were consistent with the types of benefits generally derived by investment managers and subadvisers to mutual funds.
Performance of the Fund / Fees and Expenses
The Board considered certain additional factors and made related conclusions relating to the historical performance of the Fund for the one-year period ended December 31, 2021. The Board considered that the Fund commenced operations on September 24, 2018 and that longer-term performance was not yet available.
Visit our website at pgim.com/investments
The Board also considered the Fund’s actual management fee, as well as the Fund’s net total expense ratio, for the fiscal year ended August 31, 2021. The Board considered the management fee for the Fund as compared to the management fee charged by PGIM Investments to other funds and the fee charged by other advisers to comparable mutual funds in a Peer Group. The actual management fee represents the fee rate actually paid by Fund shareholders and includes any fee waivers or reimbursements. The net total expense ratio for the Fund represents the actual expense ratio incurred by Fund shareholders.
The mutual funds included in the Peer Universe, which was used to consider performance, and the Peer Group, which was used to consider expenses and fees, were objectively determined by Broadridge, an independent provider of mutual fund data. In certain circumstances, PGIM Investments also provided supplemental Peer Universe or Peer Group information for reasons addressed with the Board. The comparisons placed the Fund in various quartiles over various periods, with the first quartile being the best 25% of the mutual funds (for performance, the best performing mutual funds and, for expenses, the lowest cost mutual funds).
The section below summarizes key factors considered by the Board and the Board’s conclusions regarding the Fund’s performance, fees and overall expenses. The table sets forth net performance comparisons (which reflect the impact on performance of fund expenses, or any subsidies, expense caps or waivers that may be applicable) with the Peer Universe, actual management fees with the Peer Group (which reflect the impact of any subsidies or fee waivers), and net total expenses with the Peer Group, each of which were key factors considered by the Board.
| | | | | | | | |
Net Performance | | 1 Year | | 3 Years | | 5 Years | | 10 Years |
| | | 1st Quartile | | 1st Quartile | | N/A | | N/A |
Actual Management Fees: 3rd Quartile |
Net Total Expenses: 2nd Quartile |
| | ● | The Board noted that the Fund outperformed its benchmark index over the one-and three-year periods. |
| | ● | The Board noted that the Fund does not yet have a five-year performance record and that, therefore, the subadviser should have more time to develop that record. |
| | ● | The Board and PGIM Investments agreed to retain the Fund’s existing contractual fee waiver, pursuant to which PGIM Investments waives any management fees it receives from the Fund in an amount equal to the subadvisory fees paid by the Fund to the PGIM Institutional Money Market Fund. |
| | ● | The Board concluded that, in light of the above, it would be in the best interests of the Fund and its shareholders to continue to allow the Fund to create a longer-term performance record, and to renew the agreements. |
PGIM Fixed Income ETFs
Approval of Advisory Agreements (continued)
| | ● | The Board concluded that the management fees (including subadvisory fees) and total expenses were reasonable in light of the services provided. |
* * *
After full consideration of these factors, the Board concluded that approval of the agreements was in the best interests of the Fund and its shareholders.
PGIM Active Aggregate Bond ETF
The Fund’s Board of Trustees
The Board of Trustees (the “Board”) of PGIM Active Aggregate Bond ETF3 (the “Fund”) consists of ten individuals, eight of whom are not “interested persons” of the Fund, as defined in the Investment Company Act of 1940, as amended (the “1940 Act”) (the “Independent Trustees”). The Board is responsible for the oversight of the Fund and its operations, and performs the various duties imposed on the Trustees of investment companies by the 1940 Act. The Independent Trustees have retained independent legal counsel to assist them in connection with their duties. The Chair of the Board is an Independent Director. The Board has established five standing committees: the Audit Committee, the Nominating and Governance Committee, the Compliance Committee and two Investment Committees. Each committee is chaired by, and composed of, Independent Trustees.
Annual Approval of the Fund’s Advisory Agreements
As required under the 1940 Act, the Board determines annually whether to renew the Fund’s management agreement with PGIM Investments LLC (“PGIM Investments”) and the Fund’s subadvisory agreement with PGIM, Inc. (“PGIM”) on behalf of its PGIM Fixed Income unit (“PGIM Fixed Income”). In considering the renewal of the agreements, the Board, including all of the Independent Trustees, met on May 26 and June 7-9, 2022 (the “Board Meeting”) and approved the renewal of the agreements through July 31, 2023, after concluding that the renewal of the agreements was in the best interests of the Fund and its shareholders.
In advance of the meetings, the Board requested and received materials relating to the agreements, and had the opportunity to ask questions and request further information in connection with its consideration. Among other things, the Board considered comparative fee information from PGIM Investments and PGIM. Also, the Board considered comparisons with other mutual funds in relevant Peer Universes and Peer Groups, as is further discussed below.
In approving the agreements, the Board, including the Independent Trustees advised by independent legal counsel, considered the factors it deemed relevant, including the nature, quality and extent of services provided by PGIM Investments, the subadviser
3 PGIM Active Aggregate Bond ETF is a series of PGIM ETF Trust.
Visit our website at pgim.com/investments
and, as relevant, its affiliates, the performance of the Fund, the profitability of PGIM Investments and its affiliates, expenses and fees, and the potential for economies of scale that may be shared with the Fund and its shareholders as the Fund’s assets grow. In their deliberations, the Trustees did not identify any single factor which alone was responsible for the Board’s decision to approve the agreements with respect to the Fund. In connection with its deliberations, the Board considered information provided by PGIM Investments throughout the year at regular Board meetings, presentations from portfolio managers and other information, as well as information furnished at or in advance of the Board Meeting.
The Trustees determined that the overall arrangements between the Fund and PGIM Investments, which serves as the Fund’s investment manager pursuant to a management agreement, between PGIM Investments and PGIM, which, through its PGIM Fixed Income unit, serves as the Fund’s subadviser pursuant to the terms of a subadvisory agreement with PGIM Investments are in the best interests of the Fund and its shareholders in light of the services performed, fees charged and such other matters as the Trustees considered relevant in the exercise of their business judgment.
The material factors and conclusions that formed the basis for the Trustees’ reaching their determinations to approve the continuance of the agreements are separately discussed below.
Nature, Quality and Extent of Services
The Board received and considered information regarding the nature, quality and extent of services provided to the Fund by PGIM Investments and, PGIM Fixed Income. The Board noted that PGIM Fixed Income is affiliated with PGIM Investments. The Board considered the services provided by PGIM Investments, including but not limited to the oversight of the subadviser for the Fund, as well as the provision of fund recordkeeping, compliance and other services to the Fund, and PGIM Investments’ role as administrator of the Fund’s liquidity risk management program. With respect to PGIM Investments’ oversight of the subadviser, the Board noted that PGIM Investments’ Strategic Investment Research Group (“SIRG”), which is a business unit of PGIM Investments, is responsible for monitoring and reporting to PGIM Investments’ senior management on the performance and operations of the subadviser. The Board also considered that PGIM Investments pays the salaries of all of the officers and interested Trustees of the Fund who are part of Fund management. The Board also considered the investment subadvisory services provided by PGIM Fixed Income, including investment research and security selection, as well as adherence to the Fund’s investment restrictions and compliance with applicable Fund policies and procedures. The Board considered PGIM Investments’ evaluation of the subadviser, as well as PGIM Investments’ recommendation, based on its review of the subadviser, to renew the subadvisory agreement.
The Board considered the qualifications, backgrounds and responsibilities of PGIM Investments’ senior management responsible for the oversight of the Fund and PGIM
PGIM Fixed Income ETFs
Approval of Advisory Agreements (continued)
Fixed Income, and also considered the qualifications, backgrounds and responsibilities of PGIM Fixed Income’s portfolio managers who are responsible for the day-to-day management of the Fund’s portfolio. The Board was provided with information pertaining to PGIM Investments’ and PGIM Fixed Income’s organizational structure, senior management, investment operations, and other relevant information pertaining to PGIM Investments and PGIM Fixed Income. The Board also noted that it received favorable compliance reports from the Fund’s Chief Compliance Officer (“CCO”) as to PGIM Investments and PGIM Fixed Income.
The Board concluded that it was satisfied with the nature, extent and quality of the investment management services provided by PGIM Investments, and the subadvisory services provided to the Fund by PGIM Fixed Income, and that there was a reasonable basis on which to conclude that the Fund benefits from the services provided by PGIM Investments and PGIM Fixed Income under the management, subadvisory agreement.
Costs of Services and Profits Realized by PGIM Investments
The Board was provided with information on the profitability of PGIM Investments and its affiliates in serving as the Fund’s investment manager. The Board discussed with PGIM Investments the methodology utilized in assembling the information regarding profitability and considered its reasonableness. The Board recognized that it is difficult to make comparisons of profitability from fund management contracts because comparative information is not generally publicly available and is affected by numerous factors, including the structure of the particular adviser, the types of funds it manages, its business mix, numerous assumptions regarding allocations and the adviser’s capital structure and cost of capital. Taking these factors into account, the Board concluded that the profitability of PGIM Investments and its affiliates in relation to the services rendered was not unreasonable.
Economies of Scale
The Board received and discussed information concerning economies of scale that PGIM Investments may realize as the Fund’s assets grow beyond current levels. During the course of time, the Board has considered information regarding the launch date of the Fund, the management fees of the Fund compared to those of similarly managed funds and PGIM Investments’ investment in the Fund over time. The Board noted that economies of scale can be shared with the Fund in other ways, including low management fees from inception, additional technological and personnel investments to enhance shareholder services, and maintaining existing expense structures in the face of a rising cost environment. The Board also considered PGIM Investments’ assertion that it continually evaluates the management fee schedule of the Fund and the potential to share economies of scale through breakpoints or fee waivers as asset levels increase.
The Board recognized the inherent limitations of any analysis of economies of scale, stemming largely from the Board’s understanding that most of PGIM Investments’ costs are not specific to individual funds, but rather are incurred across a variety of products and services.
Visit our website at pgim.com/investments
Other Benefits to PGIM Investments, and PGIM Fixed Income
The Board considered potential ancillary benefits that might be received by PGIM Investments, PGIM Fixed Income and their affiliates as a result of their relationship with the Fund. The Board concluded that potential benefits to be derived by PGIM Investments included transfer agency fees received by the Fund’s transfer agent (which is affiliated with PGIM Investments), as well as benefits to its reputation or other intangible benefits resulting from PGIM Investments’ association with the Fund. The Board concluded that the potential benefits to be derived by PGIM Fixed Income included the ability to use soft dollar credits, as well as the potential benefits consistent with those generally resulting from an increase in assets under management, specifically, potential access to additional research resources and benefits to its reputation. The Board concluded that the benefits derived by PGIM Investments and PGIM Fixed Income were consistent with the types of benefits generally derived by investment managers and subadvisers to mutual funds.
Performance of the Fund / Fees and Expenses
The Board considered certain additional factors and made related conclusions relating to the historical performance of the Fund for the three-month period ended December 31, 2021. The Board considered that the Fund commenced operations on April 12, 2021 and that longer-term performance was not yet available.
The Board also considered the Fund’s actual management fee, as well as the Fund’s net total expense ratio, for the fiscal period ended August 31, 2021. The Board considered the management fee for the Fund as compared to the management fee charged by PGIM Investments to other funds and the fee charged by other advisers to comparable mutual funds in a Peer Group. The actual management fee represents the fee rate actually paid by Fund shareholders and includes any fee waivers or reimbursements. The net total expense ratio for the Fund represents the actual expense ratio incurred by Fund shareholders.
The mutual funds included in the Peer Universe, which was used to consider performance, and the Peer Group, which was used to consider expenses and fees, were objectively determined by Broadridge, an independent provider of mutual fund data. In certain circumstances, PGIM Investments also provided supplemental Peer Universe or Peer Group information for reasons addressed with the Board. The comparisons placed the Fund in various quartiles over various periods, with the first quartile being the best 25% of the mutual funds (for performance, the best performing mutual funds and, for expenses, the lowest cost mutual funds).
The section below summarizes key factors considered by the Board and the Board’s conclusions regarding the Fund’s performance, fees and overall expenses. The table sets forth net performance comparisons (which reflect the impact on performance of fund expenses, or any subsidies, expense caps or waivers that may be applicable) with the Peer Universe, actual management fees with the Peer Group (which reflect the
PGIM Fixed Income ETFs
Approval of Advisory Agreements (continued)
impact of any subsidies or fee waivers), and net total expenses with the Peer Group, each of which were key factors considered by the Board.
| | | | | | | | | | |
Net Performance | | Latest Quarter | | 1 Year | | 3 Years | | 5 Years | | 10 Years |
| | | 2nd Quartile | | N/A | | N/A | | N/A | | N/A |
| | | Actual Management Fees: 2nd Quartile |
| | | Net Total Expenses: 1st Quartile |
| | ● | The Board noted that the Fund underperformed its benchmark index over the three-month period ended December 31, 2021. |
| | ● | The Board noted that the Fund does not yet have a one-year performance record and that, therefore, the subadviser should have more time to develop that record. |
| | ● | The Board and PGIM Investments agreed to a contractual fee waiver, pursuant to which PGIM Investments waives any management fees it receives from the Fund in an amount equal to the subadvisory fees paid by the Fund to the PGIM Institutional Money Market Fund. |
| | ● | The Board concluded that, in light of the above, it would be in the best interests of the Fund and its shareholders to continue to allow the Fund to create a longer-term performance record, and to renew the agreements. |
| | ● | The Board concluded that the management fees (including subadvisory fees) and total expenses were reasonable in light of the services provided. |
* * *
After full consideration of these factors, the Board concluded that approval of the agreements was in the best interests of the Fund and its shareholders.
PGIM Total Return Bond ETF
Initial Approval of the Fund’s Advisory Agreements
As required by the Investment Company Act of 1940 (the 1940 Act), the Board considered the proposed management agreement with PGIM Investments LLC (the Manager) and the proposed subadvisory agreement between the Manager and PGIM, Inc. (PGIM), through its PGIM Fixed Income division, together with PGIM Limited, an indirect wholly-owned subsidiary of PGIM, to serve as the subadviser (together, the Subadviser) with respect to the Fund. The Board, including all of the Independent Trustees, met on September 15, 2021 (the Meeting) and approved the agreements for an initial two-year period, after concluding that approval of the agreements was in the best interests of the Fund.
Visit our website at pgim.com/investments
In advance of the Meeting, the Board requested and received materials relating to the agreements, and had the opportunity to ask questions and request further information in connection with its considerations.
In approving the agreements, the Board, including the Independent Trustees advised by independent legal counsel, considered the factors it deemed relevant, including the nature, quality and extent of services to be provided to the Fund by the Manager and the Subadviser; any relevant comparable performance information and the Subadviser’s qualifications and track record in serving other affiliated funds; and the fees proposed to be paid by the Fund to the Manager and by the Manager to the Subadviser under the agreements. In connection with its deliberations, the Board considered information provided by the Manager and the Subadviser at or in advance of the Meeting. The Board also considered information that the Trustees received throughout the year regarding the Manager and the Subadviser in their capacity as directors or trustees of other funds in the Prudential organization. In their deliberations, the Trustees did not identify any single factor which alone was responsible for the Board’s decision to approve the agreements with respect to the Fund.
The Trustees determined that the overall arrangements between the Fund and the Manager, which will serve as the Fund’s investment manager pursuant to a management agreement, and between the Manager and the Subadviser, which will serve as the Fund’s subadviser pursuant to the terms of a subadvisory agreement, are appropriate in light of the services to be performed and the fees to be charged under the agreements and such other matters as the Trustees considered relevant in the exercise of their business judgment.
A summary of certain factors and conclusions that formed the basis for the Trustees’ reaching their determinations to approve the agreements are discussed below.
Nature, quality and extent of services
With respect to the Manager, the Board noted that it had received and considered information about the Manager at the Meeting, including information relating to the approval and renewal, as applicable, of the management agreements between the Manager and the other PGIM Retail Funds, as well as information received at other regular meetings throughout the year of the PGIM Retail Funds, regarding the nature, quality and extent of services provided by the Manager. The Board considered the services to be provided by the Manager, including but not limited to the oversight of the Subadviser, as well as the provision of fund recordkeeping, compliance and other services to the Fund. With respect to the Manager’s oversight of the Subadviser, the Board noted that the Manager’s Strategic Investment Research Group, which is a business unit of the Manager, is responsible for monitoring and reporting to the Manager’s senior management on the performance and operations of the Subadviser. The Board also noted that the Manager pays the salaries of the officers of the Trust and Trustees of the Trust who are affiliated persons of the Manager or Subadviser. The Board reviewed the qualifications, backgrounds and responsibilities of the Manager’s
PGIM Fixed Income ETFs
Approval of Advisory Agreements (continued)
senior management responsible for the oversight of the Fund and the Subadviser, and was also provided with information pertaining to the Manager’s organizational structure, senior management, investment operations and other relevant information. The Board noted that the Manager had engaged personnel and consultants with experience in the management of exchanged-traded funds. The Board further noted that it received favorable compliance reports from the Fund’s Chief Compliance Officer as to the Manager for services provided to other PGIM Retail Funds. The Board noted that it had concluded that it was satisfied with the nature, quality and extent of the services provided by the Manager to the other PGIM Retail Funds and determined that it was reasonable to conclude that the nature, quality and extent of services to be provided by the Manager under the management agreement for the Fund would be similar in nature to those provided under the other management agreements.
With respect to the Subadviser, the Board noted that it had received and considered information about the Subadviser at the Meeting, including information relating to the approval and renewal, as applicable, of subadvisory agreements between the Manager and the Subadviser with respect to other PGIM Retail Funds, as well as at other regular meetings throughout the year, regarding the nature, quality and extent of services provided by the Subadviser. The Board considered, among other things, the qualifications, background and experience of the Subadviser’s portfolio managers who will be responsible for the day-to-day management of the Fund’s portfolio, as well as information on the Subadviser’s organizational structure, senior management, investment operations and other relevant information. The Board also considered the Subadviser’s experience managing other similar investment strategies. The Board further noted that it received favorable compliance reports from the Fund’s Chief Compliance Officer as to the Subadviser for services provided to other PGIM Retail Funds. The Board noted that the Subadviser is affiliated with the Manager. The Board noted that it was satisfied with the nature, quality and extent of services provided by the Subadviser with respect to the other PGIM Retail Funds served by the Subadviser and determined that it was reasonable to conclude that the nature, quality and extent of services to be provided by the Subadviser under the subadvisory agreement for the Fund would be similar in nature to those provided under the other subadvisory agreements.
Performance
Because the Fund had not yet commenced operations, no investment performance for the Fund existed for Board review. The Board reviewed the performance information of a mutual fund advised by the Manager and subadvised by the Subadviser that utilizes the same investment strategy. The Board considered the background and professional experience of the proposed portfolio management team for the Fund. The Board took note that the Manager will provide information relating to performance to the Board in connection with future annual reviews of the management agreement and subadvisory agreement.
Visit our website at pgim.com/investments
Fee Rates
The Board considered the proposed management fees to be paid by the Fund to the Manager and the compensation to be paid by the Manager to the Subadviser. The Board considered the nature of the management fee as a unitary fee and that the Manager would be responsible for the Fund’s expenses except for those expenses reflected in the management agreement as remaining the responsibility of the Fund.
The Board considered information provided by the Manager comparing the Fund’s proposed management fee rate and total expenses (including the effects of leverage) to the Lipper 15(c) Peer Group. The Board noted that the Fund’s management fee was in the third quartile and anticipated total expenses were in the fourth quartile of the Lipper Peer Group (first quartile being the lowest fee) based upon net assets assuming outstanding leverage.
The Board concluded that the proposed management fee and total expenses were reasonable in light of the services to be provided.
Profitability
Because the Fund had not yet commenced operations and the actual asset base of the Fund had not yet been determined, the Board noted that there was no historical profitability information with respect to the Fund to be reviewed. The Board noted that it would review profitability information in connection with future annual renewals of the management and subadvisory agreements.
Economies of Scale
Because the Fund had not yet commenced operations and the actual asset base of the Fund had not yet been determined, the Board noted that there was no historical information regarding economies of scale with respect to the Fund to be reviewed. The Board noted that it would review such information in connection with future annual renewals of the management and subadvisory agreements.
Other Benefits to the Manager and the Subadviser
The Board considered potential “fall-out” or ancillary benefits anticipated to be received by the Manager, the Subadviser and their affiliates as a result of their relationship with the Fund. The Board concluded that any potential benefits to be derived by the Manager were similar to benefits derived by the Manager in connection with its management of the other affiliated funds managed by the Manager, which are reviewed on an annual basis. The Board also concluded that any potential benefits to be derived by the Subadviser were consistent with those generally derived by subadvisers to the PGIM Retail Funds, and that those benefits are reviewed on an annual basis. The Board concluded that any potential benefits derived by the Manager and the Subadviser were consistent with the types of benefits generally derived by investment managers and subadvisers to funds.
PGIM Fixed Income ETFs
Approval of Advisory Agreements (continued)
* * *
After consideration of these and other factors, the Board concluded that the approval of the agreements was in the best interests of the Fund.
PGIM Floating Rate Income ETF
Initial Approval of the Fund’s Advisory Agreements
As required by the Investment Company Act of 1940 (the 1940 Act), the Board considered the proposed management agreement with PGIM Investments LLC (the Manager) and the proposed subadvisory agreement between the Manager and PGIM, Inc. (PGIM), through its PGIM Fixed Income division, together with PGIM Limited, an indirect wholly-owned subsidiary of PGIM, to serve as the subadviser (together, the Subadviser) with respect to the Fund. The Board, including all of the Independent Trustees, met on January 27, 2022 (the Meeting) and approved the agreements for an initial two-year period, after concluding that approval of the agreements was in the best interests of the Fund.
In advance of the Meeting, the Board requested and received materials relating to the agreements, and had the opportunity to ask questions and request further information in connection with its considerations.
In approving the agreements, the Board, including the Independent Trustees advised by independent legal counsel, considered the factors it deemed relevant, including the nature, quality and extent of services to be provided to the Fund by the Manager and the Subadviser; any relevant comparable performance information and the Subadviser’s qualifications and track record in serving other affiliated funds; and the fees proposed to be paid by the Fund to the Manager and by the Manager to the Subadviser under the agreements. In connection with its deliberations, the Board considered information provided by the Manager and the Subadviser at or in advance of the Meeting. The Board also considered information that the Trustees received throughout the year regarding the Manager and the Subadviser in their capacity as directors or trustees of other funds in the Prudential organization (PGIM Retail Funds). In their deliberations, the Trustees did not identify any single factor which alone was responsible for the Board’s decision to approve the agreements with respect to the Fund.
The Trustees determined that the overall arrangements between the Fund and the Manager, which will serve as the Fund’s investment manager pursuant to a management agreement, and between the Manager and the Subadviser, which will serve as the Fund’s subadviser pursuant to the terms of a subadvisory agreement, are appropriate in light of the services to be performed and the fees to be charged under the agreements and such other matters as the Trustees considered relevant in the exercise of their business judgment.
Visit our website at pgim.com/investments
A summary of certain factors and conclusions that formed the basis for the Trustees’ reaching their determinations to approve the agreements are discussed below.
Nature, quality and extent of services
With respect to the Manager, the Board noted that it had received and considered information about the Manager at the Meeting, including information relating to the approval and renewal, as applicable, of the management agreements between the Manager and the other PGIM Retail Funds, as well as information received at other regular meetings throughout the year of the PGIM Retail Funds, regarding the nature, quality and extent of services provided by the Manager. The Board considered the services to be provided by the Manager, including but not limited to the oversight of the Subadviser, as well as the provision of fund recordkeeping, compliance and other services to the Fund. With respect to the Manager’s oversight of the Subadviser, the Board noted that the Manager’s Strategic Investment Research Group, which is a business unit of the Manager, is responsible for monitoring and reporting to the Manager’s senior management on the performance and operations of the Subadviser. The Board also noted that the Manager pays the salaries of the officers of the Trust and Trustees of the Trust who are affiliated persons of the Manager or Subadviser. The Board reviewed the qualifications, backgrounds and responsibilities of the Manager’s senior management responsible for the oversight of the Fund and the Subadviser, and was also provided with information pertaining to the Manager’s organizational structure, senior management, investment operations and other relevant information. The Board noted that the Manager had engaged personnel and consultants with experience in the management of exchanged-traded funds. The Board further noted that it received favorable compliance reports from the Fund’s Chief Compliance Officer as to the Manager for services provided to other PGIM Retail Funds. The Board noted that it had concluded that it was satisfied with the nature, quality and extent of the services provided by the Manager to the other PGIM Retail Funds and determined that it was reasonable to conclude that the nature, quality and extent of services to be provided by the Manager under the management agreement for the Fund would be similar in nature to those provided under the other management agreements.
With respect to the Subadviser, the Board noted that it had received and considered information about the Subadviser at the Meeting, including information relating to the approval and renewal, as applicable, of subadvisory agreements between the Manager and the Subadviser with respect to other PGIM Retail Funds, as well as at other regular meetings throughout the year, regarding the nature, quality and extent of services provided by the Subadviser. The Board considered, among other things, the qualifications, background and experience of the Subadviser’s portfolio managers who will be responsible for the day-to-day management of the Fund’s portfolio, as well as information on the Subadviser’s organizational structure, senior management, investment operations and other relevant information. The Board also considered the Subadviser’s experience managing other similar investment strategies. The Board further noted that it received favorable compliance reports from the Fund’s Chief
PGIM Fixed Income ETFs
Approval of Advisory Agreements (continued)
Compliance Officer as to the Subadviser for services provided to other PGIM Retail Funds. The Board noted that the Subadviser is affiliated with the Manager. The Board noted that it was satisfied with the nature, quality and extent of services provided by the Subadviser with respect to the other PGIM Retail Funds served by the Subadviser and determined that it was reasonable to conclude that the nature, quality and extent of services to be provided by the Subadviser under the subadvisory agreement for the Fund would be similar in nature to those provided under the other subadvisory agreements.
Performance
Because the Fund had not yet commenced operations, no investment performance for the Fund existed for Board review. The Board reviewed the performance information of a mutual fund advised by the Manager and subadvised by the Subadviser that utilizes the same investment strategy. The Board considered the background and professional experience of the proposed portfolio management team for the Fund. The Board took note that the Manager will provide information relating to performance to the Board in connection with future annual reviews of the management agreement and subadvisory agreement.
Fee Rates
The Board considered the proposed management fees to be paid by the Fund to the Manager and the compensation to be paid by the Manager to the Subadviser. The Board considered the nature of the management fee as a unitary fee and that the Manager would be responsible for the Fund’s expenses except for those expenses reflected in the management agreement as remaining the responsibility of the Fund.
The Board considered information provided by the Manager comparing the Fund’s proposed management fee rate and total expenses (including the effects of leverage) to the Lipper 15(c) Peer Group. The Board noted that the Fund’s management fee was in the fourth quartile and anticipated total expenses were in the third quartile of the Lipper Peer Group (first quartile being the lowest fee) based upon net assets assuming outstanding leverage.
The Board concluded that the proposed management fee and total expenses were reasonable in light of the services to be provided.
Profitability
Because the Fund had not yet commenced operations and the actual asset base of the Fund had not yet been determined, the Board noted that there was no historical profitability information with respect to the Fund to be reviewed. The Board noted that it would review profitability information in connection with future annual renewals of the management and subadvisory agreements.
Visit our website at pgim.com/investments
Economies of Scale
Because the Fund had not yet commenced operations and the actual asset base of the Fund had not yet been determined, the Board noted that there was no historical information regarding economies of scale with respect to the Fund to be reviewed. The Board noted that it would review such information in connection with future annual renewals of the management and subadvisory agreements.
Other Benefits to the Manager and the Subadviser
The Board considered potential “fall-out” or ancillary benefits anticipated to be received by the Manager, the Subadviser and their affiliates as a result of their relationship with the Fund. The Board concluded that any potential benefits to be derived by the Manager were similar to benefits derived by the Manager in connection with its management of the other affiliated funds managed by the Manager, which are reviewed on an annual basis. The Board also concluded that any potential benefits to be derived by the Subadviser were consistent with those generally derived by subadvisers to the PGIM Retail Funds, and that those benefits are reviewed on an annual basis. The Board concluded that any potential benefits derived by the Manager and the Subadviser were consistent with the types of benefits generally derived by investment managers and subadvisers to funds.
* * *
After consideration of these and other factors, the Board concluded that the approval of the agreements was in the best interests of the Fund.
PGIM Fixed Income ETFs
| | | | |
∎ MAIL 655 Broad Street Newark, NJ 07102 | | ∎ TELEPHONE (800) 225-1852 | | ∎ WEBSITE pgim.com/investments |
|
PROXY VOTING |
The Board of Trustees delegated to the Funds’ subadvisers the responsibility for voting any proxies and maintaining proxy recordkeeping with respect to each Funds. A description of these proxy voting policies and procedures is available without charge, upon request, by calling (800) 225-1852 or by visiting the Securities and Exchange Commission’s website at sec.gov. Information regarding how each Funds voted proxies relating to portfolio securities during the most recent 12-month period ended June 30 is available on the Funds’ website and on the Securities and Exchange Commission’s website. |
|
TRUSTEES |
Ellen S. Alberding ● Kevin J. Bannon ● Scott E. Benjamin ● Linda W. Bynoe ● Barry H. Evans ● Keith F. Hartstein ● Laurie Simon Hodrick ● Stuart S. Parker ● Brian K. Reid ● Grace C. Torres |
|
OFFICERS |
Stuart S. Parker, President ● Scott E. Benjamin, Vice President ● Christian J. Kelly, Treasurer and Principal Financial and Accounting Officer ● Claudia DiGiacomo, Chief Legal Officer ● Isabelle Sajous, Chief Compliance Officer ● Kelly Florio, Anti-Money Laundering Compliance Officer ● Andrew R. French, Secretary ● Melissa Gonzalez, Assistant Secretary ● Kelly A. Coyne, Assistant Secretary ● Patrick E. McGuinness, Assistant Secretary ● Debra Rubano, Assistant Secretary ● Lana Lomuti, Assistant Treasurer ● Russ Shupak, Assistant Treasurer ● Elyse M. McLaughlin, Assistant Treasurer ● Deborah Conway, Assistant Treasurer |
| | | | |
MANAGER | | PGIM Investments LLC | | 655 Broad Street Newark, NJ 07102 |
SUBADVISERS | | PGIM Fixed Income | | 655 Broad Street Newark, NJ 07102 |
| | | PGIM Limited | | Grand Buildings, 1-3 Strand Trafalgar Square London, WC2N 5HR United Kingdom |
DISTRIBUTOR | | Prudential Investment Management Services LLC | | 655 Broad Street Newark, NJ 07102 |
CUSTODIAN/TRANSFER AGENT | | The Bank of New York Mellon | | 240 Greenwich Street New York, NY 10286 |
INDEPENDENT REGISTERED PUBLIC ACCOUNTING FIRM | | PricewaterhouseCoopers LLP | | 300 Madison Avenue New York, NY 10017 |
FUND COUNSEL | | Willkie Farr & Gallagher LLP | | 787 Seventh Avenue New York, NY 10019 |
|
An investor should consider the investment objectives, risks, charges, and expenses of each Funds carefully before investing. The prospectus and summary prospectus contain this and other information about the Fund. An investor may obtain the prospectus and summary prospectus by visiting our website at pgim.com/investments or by calling (800) 225-1852. The prospectus and summary prospectus should be read carefully before investing. |
|
E-DELIVERY |
To receive your fund documents online, go to pgim.com/investments/resource/edelivery and enroll. Instead of receiving printed documents by mail, you will receive notification via email when new materials are available. You can cancel your enrollment or change your email address at any time by visiting the website address above. |
|
SHAREHOLDER COMMUNICATIONS WITH TRUSTEES |
Shareholders can communicate directly with the Board of Trustees by writing to the Chair of the Board, PGIM Fixed Income ETFs, PGIM Investments, Attn: Board of Trustees, 655 Broad Street, Newark, NJ 07102. Shareholders can communicate directly with an individual Trustee by writing to that Trustee at the same address. Communications are not screened before being delivered to the addressee. |
|
AVAILABILITY OF PORTFOLIO HOLDINGS |
On each business day, before commencement of trading on the Exchange, the Fund will disclose on www.pgiminvestments.com the Fund’s portfolio holdings that will form the basis for the Fund’s calculation of NAV at the end of the business day. The Fund files its complete schedule of portfolio holdings with the Securities and Exchange Commission for the first and third quarters of each fiscal year as an exhibit to its reports on Form N-PORT. The Fund’s Form N-PORT filings are available on the Commission’s website at sec.gov. |
|
The Fund’s Statement of Additional Information contains additional information about the Fund’s Trustees and is available without charge, upon request, by calling (800) 225-1852. |
Funds:
| | | | |
ARE NOT INSURED BY THE FDIC OR ANY FEDERAL GOVERNMENT AGENCY | | MAY LOSE VALUE | | ARE NOT A DEPOSIT OF OR GUARANTEED BY ANY BANK OR ANY BANK AFFILIATE |

PGIM FIXED INCOME ETFS
| | | | | | | | |
| | | | |
| Fund | | Ticker Symbol | | | | | | |
| | | | |
PGIM Ultra Short Bond ETF | | PULS | | | | | | |
| | | | |
PGIM Active High Yield Bond ETF | | PHYL | | | | | | |
| | | | |
PGIM Active Aggregate Bond ETF | | PAB | | | | | | |
| | | | |
PGIM Total Return Bond ETF | | PTRB | | | | | | |
| | | | |
PGIM Floating Rate Income ETF | | PFRL | | | | | | |
ETF1000E

PGIM QUANT SOLUTIONS STRATEGIC ALPHA
INTERNATIONAL EQUITY ETF
ANNUAL REPORT
AUGUST 31, 2022

To enroll in e-delivery, go to pgim.com/investments/resource/edelivery
Table of Contents
This report is not authorized for distribution to prospective investors unless preceded or accompanied by a current prospectus.
The views expressed in this report and information about the Fund’s portfolio holdings are for the period covered by this report and are subject to change thereafter.
Exchange-traded funds are distributed by Prudential Investment Management Services LLC, a Prudential Financial company, member SIPC. PGIM Quantitative Solutions is the primary business name of PGIM Quantitative Solutions LLC (formerly known as QMA LLC), a wholly owned subsidiary of PGIM, Inc. (PGIM), a registered investment adviser and Prudential Financial company. © 2022 Prudential Financial, Inc. and its related entities. PGIM and the PGIM logo are service marks of Prudential Financial, Inc. and its related entities, registered in many jurisdictions worldwide.
| | |
| 2 Visit our website at pgim.com/investments | | |
Letter from the President
| | |
 | | Dear Shareholder: We hope you find the annual report for the PGIM Quant Solutions Strategic Alpha International Equity ETF informative and useful. The report covers performance for the 12-month period that ended August 31, 2022. The attention of the global economy and financial markets pivoted during the period from the COVID-19 pandemic to the challenge of rapidly rising inflation. While job growth and corporate profits remained strong, prices for a wide range of goods and services rose in response to economic re-openings, supply-chain disruptions, governmental stimulus, and Russia’s |
| invasion of Ukraine. With inflation surging to a 40-year high, the US Federal Reserve and other central banks aggressively hiked interest rates, prompting recession concerns. |
After rising to record levels at the end of 2021, stocks have fallen sharply in 2022 as investors worried about higher prices, slowing economic growth, geopolitical uncertainty, and new COVID-19 outbreaks. Equities rallied for a time during the summer but began falling again in late August on fears that the Fed would keep raising rates to tame inflation. For the entire 12-month period, equities suffered a broad-based global decline, although large-cap US stocks outperformed their small-cap counterparts by a significant margin. International developed and emerging markets trailed the US market during this time.
Rising rates and economic uncertainty drove fixed income prices broadly lower as well. US and global investment-grade bonds, along with US high yield corporate bonds and emerging market debt, all posted negative returns during the period.
Regarding your investments with PGIM, we believe it is important to maintain a diversified portfolio of funds consistent with your tolerance for risk, time horizon, and financial goals. Your financial advisor can help you create a diversified investment plan that may include funds covering all the basic asset classes and that reflects your personal investor profile and risk tolerance. However, diversification and asset allocation strategies do not assure a profit or protect against loss in declining markets.
At PGIM Investments, we provide access to active investment strategies across the global markets in the pursuit of consistent outperformance for investors. PGIM is the world’s 11th-largest investment manager with more than $1.5 trillion in assets under management. Our scale and investment expertise allow us to deliver a diversified suite of actively managed solutions across a broad spectrum of asset classes and investment styles.
Thank you for choosing our family of funds.
Sincerely,

Stuart S. Parker, President
PGIM Quant Solutions Strategic Alpha International Equity ETF
October 14, 2022
| | |
| | PGIM Quant Solutions Strategic Alpha International Equity ETF 3 |
Your Fund’s Performance (unaudited)
Performance data quoted represent past performance. Past performance does not guarantee future results. The investment return and principal value of an investment will fluctuate so that an investor’s shares, when redeemed, may be worth more or less than their original cost. Current performance may be lower or higher than the past performance data quoted. An investor may obtain performance data as of the most recent month-end by visiting our website at pgim.com/investments or by calling (800) 225-1852.
| | | | | | | | | | |
| | | Average Annual Total Returns as of 8/31/22 |
| | | One Year (%) | | Since Inception (%) |
| | |
Net Asset Value (NAV) | | | | -18.75 | | | | | 2.17 (12/04/2018) | |
| | |
Market Price* | | | | -18.91 | | | | | 2.13 (12/04/2018) | |
| | |
MSCI EAFE Index | | | | | | | | | | |
| | | | | -19.80 | | | | | 3.07 | |
*The market price is determined using the midpoint between the highest bid and the lowest offer on the listing exchange, as of the time that the Fund’s NAV is calculated. The first day of secondary market trading is typically several days after the date on which the Fund commenced investment operations; therefore, the NAV of the Fund is used as a proxy for the period from inception of investment operations to the first day of secondary market trading to calculate the market price returns. Since inception returns for the Index are measured from the closest month-end to the Fund’s inception date.
The returns in the table do not reflect the deduction of taxes that a shareholder would pay on Fund distributions or following the sale or redemption of Fund shares.
Market returns do not include brokerage commissions that may be payable on secondary market transactions. If brokerage commissions were included, market returns would be lower. Market and NAV returns assume that dividends and capital gain distributions, if any, have been reinvested in the Fund at market price and NAV, respectively.
| | |
| 4 Visit our website at pgim.com/investments | | |
Growth of a $10,000 Investment (unaudited)
The graph compares a $10,000 investment in the Fund with a similar investment in the MSCI EAFE Index by portraying the initial account values at the commencement of operations (December 4, 2018) and the account values at the end of the current fiscal year (August 31, 2022), as measured on a quarterly basis. The Fund assumes an initial investment on December 4, 2018, while the benchmark and the Index assume that the initial investment occurred on November 30, 2018. For purposes of the graph, and unless otherwise indicated, it has been assumed that (a) all recurring fees (including management fees) were deducted and (b) all dividends and distributions were reinvested. Without waiver of fees and/or expense reimbursements, if any, the returns would have been lower.
Past performance does not predict future performance. Total returns and the ending account values in the graphs include changes in share price and reinvestment of dividends and capital gains distributions in a hypothetical investment for the periods shown. The Fund’s total returns do not reflect the deduction of income taxes on an individual’s investment. Taxes may reduce your actual investment returns on income or gains paid by the Fund or any gains you may realize if you sell your shares.
Benchmark Definition
MSCI EAFE Index—The MSCI EAFE Index is a free-float-adjusted market capitalization weighted index that is designed to measure the equity performance of developed markets, excluding the U.S. and Canada.
| | |
| | PGIM Quant Solutions Strategic Alpha International Equity ETF 5 |
Your Fund’s Performance (continued)
Investors cannot invest directly in an index. The returns for the Index would be lower if they included the effects of operating expenses or taxes that may be paid by an investor.
Presentation of Fund Holdings as of 8/31/22
| | | | | | |
| | | |
Ten Largest Holdings | | Line of Business | | Country | | % of Net Assets |
| Electricite de France SA | | Electric Utilities | | France | | 0.4% |
| Norsk Hydro ASA | | Metals & Mining | | Norway | | 0.3% |
| Flutter Entertainment plc | | Hotels, Restaurants & Leisure | | Ireland | | 0.3% |
| STMicroelectronics NV | | Semiconductors & Semiconductor Equipment | | Singapore | | 0.3% |
| Seiko Epson Corp. | | Technology Hardware, Storage & Peripherals | | Japan | | 0.3% |
| Hermes International | | Textiles, Apparel & Luxury Goods | | France | | 0.3% |
| Hoya Corp. | | Health Care Equipment & Supplies | | Japan | | 0.3% |
| Suzuki Motor Corp. | | Automobiles | | Japan | | 0.3% |
| Prysmian SpA | | Electrical Equipment | | Italy | | 0.3% |
| Porsche Automobil Holding SE (PRFC) | | Automobiles | | Germany | | 0.3% |
Holdings reflect only long term investments and are subject to change.
| | |
| 6 Visit our website at pgim.com/investments | | |
Strategy and Performance Overview* (unaudited)
How did the Fund perform?
The PGIM Quant Solutions Strategic Alpha International Equity ETF (the Fund) returned –18.75%, based on net asset value, in the 12-month reporting period that ended on August 31, 2022, outperforming the –19.80% return of the MSCI EAFE Index (the Index).
What were the market conditions?
Developed international equity markets declined meaningfully during the reporting period as global growth gave way to higher inflation and higher interest rates. At the same time, Russia’s invasion of Ukraine negatively impacted economic activity across Europe and sent energy prices spiraling higher.
Large-cap stocks generally outperformed their small- and mid-cap counterparts during the period, while value stocks outperformed growth stocks across all market capitalizations.
What worked?
| · | | The Fund added value in six of the Index’s eleven sectors during the reporting period, driven by better relative returns from its value factor, as cheaper stocks within the Index outperformed their more expensive peers. |
| · | | A meaningful underweight position relative to the Index in information technology stocks (the Index’s worst-performing sector), along with an emphasis on more profitable companies through the Fund’s quality factor, aided performance. |
| · | | The Fund’s results were also helped by good selection among communications services stocks, mainly by avoiding high-valued issues in the entertainment industry, where stock prices were down nearly 40%. |
| · | | Among individual stocks, the Fund’s top relative contributors to performance were semiconductor & semiconductor equipment company ASML Holding N.V., software company SAP SE, and communication services company Sea Group. |
What didn’t work?
| · | | The Fund’s relative performance during the reporting period was hurt most by holdings in the healthcare and energy sectors. |
| · | | In healthcare, which was among the better-performing Index sectors, the Fund performed well from a security selection standpoint. However, an underweight position in larger pharmaceutical companies stemming from the Fund’s equal-weighting approach more than offset the benefit from positive security selection. |
| | |
| | PGIM Quant Solutions Strategic Alpha International Equity ETF 7 |
Strategy and Performance Overview* (continued)
| · | | In energy, which was by far the Index’s best-performing sector, performance was hindered by the Fund’s underweight position relative to the Index—largely as a result of the Fund’s equal-weighting approach—which left it underexposed to the bigger-capitalization stocks in the sector. |
| · | | Among individual stocks, the Fund’s largest detractors included energy companies BP plc and Shell plc, and food products company Nestle N.A. |
Current outlook
| · | | The turning of the calendar to 2022 presented a number of new challenges for international equity markets, which were reflected in a meaningful pullback in global stock prices. COVID-19 vaccines continued to demonstrate significant effectiveness, allowing an expanded reopening of many international markets, but significant outbreaks continued to occur on the global level, adding to the well-advertised, lagging performance of global supply chains. The recovery of both consumer and corporate demand in many parts of the world continued to fuel a fairly robust economic bounce into 2022. However, this came at a cost of much higher inflation, leading to a sea change in monetary policy from very accommodative to increasingly restrictive, and depressing both equity and fixed income valuations. Russia’s invasion of Ukraine caused further economic disruption and sent global energy prices skyrocketing. |
| · | | The challenges to equity performance across the EAFE (Europe, Australasia, Far East) landscape remain daunting, but PGIM Quantitative Solutions continues to see significant long-term opportunity across the space. The positive diversifying effects of maintaining a consistent commitment to EAFE exposure still stand, especially if the relative performance of US and international equities reverts to more typical proportions. EAFE stocks remain very cheap, both on an absolute and relative basis, with valuations at historically low levels, even when assuming very pessimistic future-earnings expectations. In addition, the market appears to be ignoring the opportunities that could spring from an improvement in, or cessation of, hostilities in the Ukrainian/Russian conflict. |
*This strategy and performance overview, which discusses what strategies or holdings (including derivatives, if applicable) affected the Fund’s performance, is compiled based on how the Fund performed relative to the Fund’s benchmark index and is viewed for performance attribution purposes at the aggregate Fund level, which in most instances will not directly correlate to the amounts disclosed in the Statement of Operations which conform to U.S. generally accepted accounting principles.
| | |
| 8 Visit our website at pgim.com/investments | | |
Fees and Expenses (unaudited)
As a shareholder of a Fund, you incur ongoing costs, including investment management fees. This example is intended to help you understand your ongoing costs (in dollars) of investing in a Fund and to compare these costs with the ongoing costs of investing in other funds.
The example is based on an investment of $1,000 held through the six-month period ended August 31, 2022. The example is for illustrative purposes only.
Actual Expenses
The first line in the table below provides information about actual account values and actual expenses. You may use the information on this line, together with the amount you invested, to estimate the expenses that you paid over the period. Simply divide your account value by $1,000 (for example, an $8,600 account value ÷ $1,000 = 8.6), then multiply the result by the number on the first line under the heading “Expenses Paid During the Six-Month Period” to estimate the expenses you paid on your account during this period.
Hypothetical Example for Comparison Purposes
The second line in the table below provides information about hypothetical account values and hypothetical expenses based on a Fund’s actual expense ratio and an assumed rate of return of 5% per year before expenses, which is not a Fund’s actual return. The hypothetical account values and expenses may not be used to estimate the actual ending account balance or expenses you paid for the period. You may use this information to compare the ongoing costs of investing in a Fund and other funds. To do so, compare this 5% hypothetical example with the 5% hypothetical examples that appear in the shareholder reports of the other funds.
Please note that the expenses shown in the table are meant to highlight your ongoing costs only and do not reflect any transactional costs, brokerage commissions paid on purchases and sales of Fund shares. Therefore, the ending account values and expenses paid for the period are useful in comparing ongoing costs only and will not help you determine the relative total costs of owning different funds. In addition, if these transactional costs were included, your costs would have been higher.
| | | | | | | | |
| | | | |
PGIM Quant Solutions
Strategic Alpha
International Equity ETF | | Beginning Account Value March 1, 2022 | | Ending Account Value August 31, 2022 | | Annualized Expense Ratio Based on the Six-Month Period | | Expenses Paid
During the Six-Month Period* |
| | | | |
| Actual | | $1,000.00 | | $ 868.80 | | 0.29% | | $1.37 |
| | | | |
| Hypothetical | | $1,000.00 | | $1,023.74 | | 0.29% | | $1.48 |
*Fund expenses (net of fee waivers or subsidies, if any) are equal to the annualized expense ratio (provided in the table), multiplied by the average account value over the period, multiplied by the 184 days in the six-month period ended August 31, 2022, and divided by the 365 days in the Fund’s fiscal year ended August 31, 2022 (to reflect the six-month period). Expenses presented in the table include the expenses of any underlying portfolios in which the Fund may invest.
| | |
| | PGIM Quant Solutions Strategic Alpha International Equity ETF 9 |
Schedule of Investments
as of August 31, 2022
| | | | | | | | |
| | |
| Description | | Shares | | | Value | |
| | |
LONG-TERM INVESTMENTS 98.1% | | | | | | | | |
| | |
COMMON STOCKS 97.0% | | | | | | | | |
| | |
Australia 4.4% | | | | | | | | |
Aristocrat Leisure Ltd. | | | 3,382 | | | $ | 82,615 | |
Aurizon Holdings Ltd. | | | 32,089 | | | | 81,899 | |
Australia & New Zealand Banking Group Ltd. | | | 5,202 | | | | 81,263 | |
BHP Group Ltd. | | | 2,887 | | | | 80,203 | |
BlueScope Steel Ltd. | | | 7,385 | | | | 84,490 | |
Coles Group Ltd. | | | 6,633 | | | | 79,699 | |
Dexus, REIT | | | 11,619 | | | | 69,406 | |
Fortescue Metals Group Ltd. | | | 6,668 | | | | 84,043 | |
Lottery Corp. Ltd. (The)* | | | 25,109 | | | | 75,939 | |
Rio Tinto Ltd. | | | 1,146 | | | | 74,102 | |
Rio Tinto PLC | | | 1,415 | | | | 78,426 | |
Scentre Group, REIT | | | 44,084 | | | | 88,684 | |
Sonic Healthcare Ltd. | | | 3,358 | | | | 78,122 | |
Stockland, REIT | | | 31,818 | | | | 78,813 | |
Transurban Group | | | 8,105 | | | | 77,420 | |
Vicinity Centres, REIT | | | 63,154 | | | | 83,618 | |
Westpac Banking Corp. | | | 5,872 | | | | 86,827 | |
Woolworths Group Ltd. | | | 3,314 | | | | 81,838 | |
| | | | | | | | |
| | |
| | | | | | | 1,447,407 | |
| | |
Austria 0.7% | | | | | | | | |
Mondi PLC | | | 4,688 | | | | 79,839 | |
OMV AG | | | 1,833 | | | | 74,199 | |
voestalpine AG | | | 3,820 | | | | 77,239 | |
| | | | | | | | |
| | |
| | | | | | | 231,277 | |
| | |
Belgium 0.5% | | | | | | | | |
Solvay SA | | | 1,021 | | | | 82,741 | |
UCB SA | | | 925 | | | | 65,164 | |
| | | | | | | | |
| | |
| | | | | | | 147,905 | |
| | |
Brazil 0.2% | | | | | | | | |
Yara International ASA | | | 1,809 | | | | 76,708 | |
| | |
Chile 0.3% | | | | | | | | |
Antofagasta PLC | | | 6,442 | | | | 82,395 | |
| | |
China 0.7% | | | | | | | | |
ESR Group Ltd., 144A* | | | 29,242 | | | | 82,152 | |
| | |
| | See Notes to Financial Statements. |
| | PGIM Quant Solutions Strategic Alpha International Equity ETF 11 |
Schedule of Investments (continued)
as of August 31, 2022
| | | | | | | | |
| | |
| Description | | Shares | | | Value | |
| | |
COMMON STOCKS (Continued) | | | | | | | | |
| | |
China (cont’d.) | | | | | | | | |
Wilmar International Ltd. | | | 26,763 | | | $ | 77,372 | |
Xinyi Glass Holdings Ltd. | | | 35,985 | | | | 66,755 | |
| | | | | | | | |
| | |
| | | | | | | 226,279 | |
| | |
Denmark 1.4% | | | | | | | | |
AP Moller - Maersk A/S (Class A Stock) | | | 33 | | | | 77,408 | |
AP Moller - Maersk A/S (Class B Stock) | | | 36 | | | | 86,367 | |
Carlsberg A/S (Class B Stock) | | | 624 | | | | 81,432 | |
Danske Bank A/S | | | 5,879 | | | | 78,787 | |
Demant A/S* | | | 1,948 | | | | 60,145 | |
Novo Nordisk A/S (Class B Stock) | | | 715 | | | | 76,565 | |
| | | | | | | | |
| | |
| | | | | | | 460,704 | |
| | |
Finland 0.7% | | | | | | | | |
Elisa OYJ | | | 1,479 | | | | 79,162 | |
Nokia OYJ | | | 15,951 | | | | 80,342 | |
Orion OYJ (Class B Stock) | | | 1,747 | | | | 79,303 | |
| | | | | | | | |
| | |
| | | | | | | 238,807 | |
| | |
France 10.1% | | | | | | | | |
Amundi SA, 144A | | | 1,570 | | | | 79,993 | |
Arkema SA | | | 887 | | | | 75,216 | |
BioMerieux | | | 822 | | | | 75,387 | |
BNP Paribas SA | | | 1,740 | | | | 81,285 | |
Bollore SE | | | 16,950 | | | | 81,354 | |
Bouygues SA | | | 2,760 | | | | 81,269 | |
Bureau Veritas SA | | | 3,193 | | | | 79,483 | |
Capgemini SE | | | 492 | | | | 85,538 | |
Carrefour SA | | | 4,220 | | | | 70,569 | |
Cie de Saint-Gobain | | | 1,932 | | | | 78,342 | |
Cie Generale des Etablissements Michelin SCA | | | 3,056 | | | | 74,644 | |
Covivio, REIT | | | 1,483 | | | | 83,161 | |
Credit Agricole SA | | | 9,064 | | | | 83,711 | |
Danone SA | | | 1,443 | | | | 76,147 | |
Dassault Aviation SA | | | 557 | | | | 76,687 | |
Eiffage SA | | | 872 | | | | 76,994 | |
Electricite de France SA | | | 9,586 | | | | 114,976 | |
Engie SA | | | 7,239 | | | | 86,338 | |
EssilorLuxottica SA | | | 547 | | | | 82,044 | |
Eurazeo SE | | | 1,314 | | | | 78,768 | |
Gecina SA, REIT | | | 892 | | | | 79,737 | |
Hermes International | | | 72 | | | | 92,798 | |
| | |
| See Notes to Financial Statements. | | |
12 | | |
| | | | | | | | |
| | |
| Description | | Shares | | | Value | |
| | |
COMMON STOCKS (Continued) | | | | | | | | |
| | |
France (cont’d.) | | | | | | | | |
Ipsen SA | | | 846 | | | $ | 81,236 | |
Kering SA | | | 160 | | | | 80,879 | |
Klepierre SA, REIT* | | | 4,283 | | | | 88,237 | |
La Francaise des Jeux SAEM, 144A | | | 2,262 | | | | 73,584 | |
Legrand SA | | | 1,077 | | | | 78,231 | |
L’Oreal SA | | | 219 | | | | 75,544 | |
LVMH Moet Hennessy Louis Vuitton SE | | | 134 | | | | 87,195 | |
Orange SA | | | 6,857 | | | | 69,585 | |
Pernod Ricard SA | | | 433 | | | | 79,871 | |
Publicis Groupe SA | | | 1,840 | | | | 90,144 | |
Sanofi | | | 854 | | | | 70,529 | |
SEB SA | | | 822 | | | | 61,129 | |
Thales SA | | | 702 | | | | 84,763 | |
TotalEnergies SE | | | 1,679 | | | | 85,530 | |
Unibail-Rodamco-Westfield, REIT* | | | 1,656 | | | | 85,540 | |
Valeo | | | 4,334 | | | | 83,364 | |
Veolia Environnement SA | | | 3,438 | | | | 76,978 | |
Vinci SA | | | 921 | | | | 85,383 | |
Vivendi SE | | | 8,248 | | | | 75,047 | |
| | | | | | | | |
| | |
| | | | | | | 3,307,210 | |
| | |
Germany 6.7% | | | | | | | | |
adidas AG | | | 459 | | | | 68,398 | |
Aroundtown SA | | | 27,250 | | | | 79,636 | |
BASF SE | | | 1,943 | | | | 82,147 | |
Bayer AG | | | 1,251 | | | | 66,129 | |
Bayerische Motoren Werke AG | | | 1,020 | | | | 75,311 | |
Beiersdorf AG | | | 773 | | | | 78,149 | |
Brenntag SE | | | 1,273 | | | | 83,692 | |
Covestro AG, 144A | | | 2,481 | | | | 75,098 | |
Daimler Truck Holding AG* | | | 3,345 | | | | 85,804 | |
Deutsche Post AG | | | 2,161 | | | | 79,039 | |
Deutsche Telekom AG | | | 4,050 | | | | 76,468 | |
E.ON SE | | | 9,652 | | | | 82,545 | |
Evonik Industries AG | | | 4,025 | | | | 75,216 | |
Fresenius Medical Care AG & Co. KGaA | | | 1,616 | | | | 55,525 | |
Fresenius SE & Co. KGaA | | | 2,464 | | | | 61,063 | |
GEA Group AG | | | 2,150 | | | | 74,953 | |
HeidelbergCement AG | | | 1,747 | | | | 79,180 | |
Henkel AG & Co. KGaA | | | 1,355 | | | | 84,835 | |
LEG Immobilien SE | | | 978 | | | | 74,028 | |
Mercedes-Benz Group AG | | | 1,497 | | | | 84,428 | |
Merck KGaA | | | 433 | | | | 74,584 | |
Puma SE | | | 1,252 | | | | 76,775 | |
| | |
| | See Notes to Financial Statements. |
| | PGIM Quant Solutions Strategic Alpha International Equity ETF 13 |
Schedule of Investments (continued)
as of August 31, 2022
| | | | | | | | |
| | |
| Description | | Shares | | | Value | |
| | |
COMMON STOCKS (Continued) | | | | | | | | |
| | |
Germany (cont’d.) | | | | | | | | |
Rational AG | | | 135 | | | $ | 73,058 | |
Rheinmetall AG | | | 406 | | | | 64,629 | |
Siemens AG | | | 815 | | | | 82,788 | |
Symrise AG | | | 712 | | | | 74,665 | |
Telefonica Deutschland Holding AG | | | 27,684 | | | | 71,918 | |
United Internet AG | | | 2,611 | | | | 59,170 | |
Volkswagen AG | | | 460 | | | | 85,152 | |
| | | | | | | | |
| | |
| | | | | | | 2,184,383 | |
| | |
Hong Kong 3.1% | | | | | | | | |
CK Asset Holdings Ltd. | | | 10,956 | | | | 74,122 | |
CK Infrastructure Holdings Ltd. | | | 13,093 | | | | 79,739 | |
CLP Holdings Ltd. | | | 8,441 | | | | 72,809 | |
HK Electric Investments & HK Electric Investments Ltd. | | | 84,585 | | | | 70,589 | |
HKT Trust & HKT Ltd. | | | 57,933 | | | | 77,798 | |
Hongkong Land Holdings Ltd. | | | 15,435 | | | | 74,705 | |
Jardine Matheson Holdings Ltd. | | | 1,566 | | | | 83,155 | |
New World Development Co. Ltd. | | | 22,343 | | | | 73,018 | |
Power Assets Holdings Ltd. | | | 13,613 | | | | 81,518 | |
Sino Land Co. Ltd. | | | 52,757 | | | | 77,300 | |
Swire Pacific Ltd. (Class A Stock) | | | 13,010 | | | | 90,091 | |
Swire Properties Ltd. | | | 32,354 | | | | 74,777 | |
WH Group Ltd., 144A | | | 101,502 | | | | 69,317 | |
| | | | | | | | |
| | |
| | | | | | | 998,938 | |
| | |
Ireland 1.1% | | | | | | | | |
CRH PLC | | | 2,223 | | | | 82,200 | |
Flutter Entertainment PLC* | | | 803 | | | | 101,074 | |
Kerry Group PLC (Class A Stock) | | | 797 | | | | 82,378 | |
Smurfit Kappa Group PLC | | | 2,500 | | | | 84,291 | |
| | | | | | | | |
| | |
| | | | | | | 349,943 | |
| | |
Israel 1.2% | | | | | | | | |
Check Point Software Technologies Ltd.* | | | 634 | | | | 76,232 | |
ICL Group Ltd. | | | 9,001 | | | | 86,462 | |
Nice Ltd.* | | | 386 | | | | 83,693 | |
Tower Semiconductor Ltd.* | | | 1,701 | | | | 79,962 | |
ZIM Integrated Shipping Services Ltd. | | | 1,842 | | | | 66,478 | |
| | | | | | | | |
| | |
| | | | | | | 392,827 | |
| | |
| See Notes to Financial Statements. | | |
14 | | |
| | | | | | | | |
| | |
| Description | | Shares | | | Value | |
| | |
COMMON STOCKS (Continued) | | | | | | | | |
| | |
Italy 2.4% | | | | | | | | |
Assicurazioni Generali SpA | | | 5,255 | | | $ | 77,314 | |
Atlantia SpA | | | 3,423 | | | | 78,534 | |
Coca-Cola HBC AG* | | | 3,560 | | | | 81,472 | |
Enel SpA | | | 15,050 | | | | 71,018 | |
Ferrari NV | | | 419 | | | | 81,352 | |
Mediobanca Banca di Credito Finanziario SpA | | | 9,536 | | | | 75,784 | |
Moncler SpA | | | 1,929 | | | | 86,537 | |
Prysmian SpA | | | 2,985 | | | | 91,824 | |
Snam SpA | | | 14,332 | | | | 68,213 | |
Terna - Rete Elettrica Nazionale | | | 10,653 | | | | 76,011 | |
| | | | | | | | |
| | |
| | | | | | | 788,059 | |
| | |
Japan 35.2% | | | | | | | | |
Advantest Corp. | | | 1,499 | | | | 86,320 | |
AGC, Inc. | | | 2,214 | | | | 75,699 | |
Ajinomoto Co., Inc. | | | 3,132 | | | | 87,044 | |
Asahi Group Holdings Ltd. | | | 2,390 | | | | 80,392 | |
Asahi Kasei Corp. | | | 10,274 | | | | 75,655 | |
Astellas Pharma, Inc. | | | 5,369 | | | | 76,694 | |
Bandai Namco Holdings, Inc. | | | 1,062 | | | | 80,152 | |
Bridgestone Corp. | | | 2,323 | | | | 89,509 | |
Brother Industries Ltd. | | | 4,399 | | | | 84,734 | |
Canon, Inc. | | | 3,423 | | | | 82,172 | |
Capcom Co. Ltd. | | | 2,993 | | | | 82,083 | |
Chiba Bank Ltd. (The) | | | 15,477 | | | | 83,777 | |
Chugai Pharmaceutical Co. Ltd. | | | 2,980 | | | | 77,415 | |
CyberAgent, Inc. | | | 7,913 | | | | 77,977 | |
Dai Nippon Printing Co. Ltd. | | | 3,833 | | | | 81,033 | |
Daikin Industries Ltd. | | | 482 | | | | 84,951 | |
Daito Trust Construction Co. Ltd. | | | 837 | | | | 82,781 | |
Dentsu Group, Inc. | | | 2,346 | | | | 76,244 | |
Disco Corp. | | | 331 | | | | 81,484 | |
Eisai Co. Ltd. | | | 1,889 | | | | 77,464 | |
Fuji Electric Co. Ltd. | | | 1,826 | | | | 79,783 | |
FUJIFILM Holdings Corp. | | | 1,461 | | | | 74,783 | |
Fujitsu Ltd. | | | 584 | | | | 69,634 | |
GLP J-REIT, REIT | | | 64 | | | | 78,270 | |
Hamamatsu Photonics KK | | | 2,008 | | | | 86,000 | |
Hirose Electric Co. Ltd. | | | 614 | | | | 87,730 | |
Hitachi Construction Machinery Co. Ltd. | | | 3,468 | | | | 71,869 | |
Hitachi Ltd. | | | 1,620 | | | | 81,580 | |
Honda Motor Co. Ltd. | | | 3,182 | | | | 85,296 | |
Hoya Corp. | | | 903 | | | | 92,624 | |
Hulic Co. Ltd. | | | 9,860 | | | | 75,232 | |
| | |
| | See Notes to Financial Statements. |
| | PGIM Quant Solutions Strategic Alpha International Equity ETF 15 |
Schedule of Investments (continued)
as of August 31, 2022
| | | | | | | | |
| | |
| Description | | Shares | | | Value | |
| | |
COMMON STOCKS (Continued) | | | | | | | | |
| | |
Japan (cont’d.) | | | | | | | | |
Ibiden Co. Ltd. | | | 2,834 | | | $ | 91,390 | |
Idemitsu Kosan Co. Ltd. | | | 3,364 | | | | 88,383 | |
Inpex Corp. | | | 7,535 | | | | 86,998 | |
Isuzu Motors Ltd. | | | 6,843 | | | | 85,264 | |
ITOCHU Corp. | | | 2,807 | | | | 77,648 | |
Itochu Techno-Solutions Corp. | | | 3,107 | | | | 79,059 | |
Japan Post Bank Co. Ltd. | | | 9,919 | | | | 72,398 | |
Japan Post Holdings Co. Ltd. | | | 11,645 | | | | 80,578 | |
Japan Post Insurance Co. Ltd. | | | 5,082 | | | | 77,990 | |
Japan Real Estate Investment Corp., REIT | | | 16 | | | | 74,285 | |
Japan Tobacco, Inc. | | | 4,518 | | | | 76,750 | |
JFE Holdings, Inc. | | | 7,365 | | | | 79,521 | |
Kajima Corp. | | | 7,177 | | | | 75,890 | |
KDDI Corp. | | | 2,688 | | | | 82,754 | |
Keyence Corp. | | | 227 | | | | 86,339 | |
Kikkoman Corp. | | | 1,350 | | | | 83,182 | |
Kintetsu Group Holdings Co. Ltd. | | | 2,546 | | | | 86,867 | |
Kirin Holdings Co. Ltd. | | | 5,440 | | | | 89,848 | |
Komatsu Ltd. | | | 3,475 | | | | 73,290 | |
Konami Group Corp. | | | 1,372 | | | | 69,921 | |
Kubota Corp. | | | 4,820 | | | | 75,479 | |
Kurita Water Industries Ltd. | | | 2,128 | | | | 83,634 | |
Kyocera Corp. | | | 1,533 | | | | 85,828 | |
Kyowa Kirin Co. Ltd. | | | 3,416 | | | | 77,086 | |
Lixil Corp. | | | 4,073 | | | | 71,507 | |
Marubeni Corp. | | | 7,830 | | | | 81,837 | |
Mazda Motor Corp. | | | 10,127 | | | | 89,734 | |
MEIJI Holdings Co. Ltd. | | | 1,545 | | | | 73,733 | |
MISUMI Group, Inc. | | | 3,524 | | | | 87,513 | |
Mitsubishi Chemical Group Corp. | | | 13,574 | | | | 71,620 | |
Mitsubishi Corp. | | | 2,436 | | | | 80,028 | |
Mitsubishi Estate Co. Ltd. | | | 5,469 | | | | 74,009 | |
Mitsubishi HC Capital, Inc. | | | 17,111 | | | | 83,261 | |
Mitsubishi Heavy Industries Ltd. | | | 2,174 | | | | 84,096 | |
Mitsubishi UFJ Financial Group, Inc. | | | 14,307 | | | | 74,261 | |
Mitsui & Co. Ltd. | | | 3,630 | | | | 85,338 | |
Mitsui Chemicals, Inc. | | | 3,652 | | | | 82,674 | |
Mitsui Fudosan Co. Ltd. | | | 3,718 | | | | 75,564 | |
Murata Manufacturing Co. Ltd. | | | 1,363 | | | | 74,113 | |
NEC Corp. | | | 2,005 | | | | 73,604 | |
NGK Insulators Ltd. | | | 6,332 | | | | 91,112 | |
Nintendo Co. Ltd. | | | 179 | | | | 73,430 | |
Nippon Building Fund, Inc., REIT | | | 16 | | | | 79,928 | |
NIPPON EXPRESS HOLDINGS, Inc. | | | 1,348 | | | | 74,617 | |
| | |
| See Notes to Financial Statements. | | |
16 | | |
| | | | | | | | |
| | |
| Description | | Shares | | | Value | |
| | |
COMMON STOCKS (Continued) | | | | | | | | |
| | |
Japan (cont’d.) | | | | | | | | |
Nippon Sanso Holdings Corp. | | | 4,746 | | | $ | 86,909 | |
Nippon Shinyaku Co. Ltd. | | | 1,221 | | | | 67,235 | |
Nippon Steel Corp. | | | 5,307 | | | | 84,366 | |
Nippon Telegraph & Telephone Corp. | | | 2,731 | | | | 74,091 | |
Nippon Yusen KK | | | 1,132 | | | | 87,105 | |
Nissan Chemical Corp. | | | 1,632 | | | | 83,054 | |
Nitto Denko Corp. | | | 1,243 | | | | 77,125 | |
Nomura Real Estate Holdings, Inc. | | | 3,244 | | | | 79,976 | |
Nomura Real Estate Master Fund, Inc., REIT | | | 63 | | | | 77,183 | |
NTT Data Corp. | | | 5,506 | | | | 78,235 | |
Obayashi Corp. | | | 10,972 | | | | 76,293 | |
Oji Holdings Corp. | | | 19,311 | | | | 77,425 | |
Olympus Corp. | | | 3,930 | | | | 85,149 | |
Ono Pharmaceutical Co. Ltd. | | | 3,068 | | | | 73,495 | |
ORIX Corp. | | | 4,739 | | | | 78,321 | |
Osaka Gas Co. Ltd. | | | 4,403 | | | | 74,289 | |
Otsuka Holdings Co. Ltd. | | | 2,394 | | | | 78,597 | |
Pan Pacific International Holdings Corp. | | | 5,068 | | | | 91,383 | |
Persol Holdings Co. Ltd. | | | 4,002 | | | | 81,235 | |
Recruit Holdings Co. Ltd. | | | 2,643 | | | | 85,288 | |
Renesas Electronics Corp.* | | | 8,781 | | | | 83,686 | |
Ricoh Co. Ltd. | | | 10,156 | | | | 80,195 | |
Rohm Co. Ltd. | | | 1,152 | | | | 87,234 | |
SBI Holdings, Inc. | | | 4,007 | | | | 79,203 | |
SCSK Corp. | | | 4,568 | | | | 74,969 | |
Secom Co. Ltd. | | | 1,218 | | | | 78,222 | |
Seiko Epson Corp. | | | 6,027 | | | | 95,269 | |
Sekisui Chemical Co. Ltd. | | | 5,698 | | | | 78,174 | |
Sekisui House Ltd. | | | 4,631 | | | | 79,136 | |
Seven & i Holdings Co. Ltd. | | | 2,002 | | | | 79,734 | |
SG Holdings Co. Ltd. | | | 4,642 | | | | 77,486 | |
Shimadzu Corp. | | | 2,559 | | | | 75,338 | |
Shin-Etsu Chemical Co. Ltd. | | | 673 | | | | 79,035 | |
Shionogi & Co. Ltd. | | | 1,523 | | | | 74,591 | |
SMC Corp. | | | 176 | | | | 84,374 | |
SoftBank Corp. | | | 7,494 | | | | 82,505 | |
Square Enix Holdings Co. Ltd. | | | 1,747 | | | | 76,331 | |
Subaru Corp. | | | 4,518 | | | | 82,457 | |
SUMCO Corp. | | | 6,209 | | | | 85,364 | |
Sumitomo Chemical Co. Ltd. | | | 18,492 | | | | 73,209 | |
Sumitomo Corp. | | | 5,790 | | | | 81,896 | |
Sumitomo Metal Mining Co. Ltd. | | | 2,582 | | | | 81,869 | |
Sumitomo Mitsui Financial Group, Inc. | | | 2,791 | | | | 84,257 | |
Sumitomo Mitsui Trust Holdings, Inc. | | | 2,544 | | | | 79,401 | |
| | |
| | See Notes to Financial Statements. |
| | PGIM Quant Solutions Strategic Alpha International Equity ETF 17 |
Schedule of Investments (continued)
as of August 31, 2022
| | | | | | | | |
| | |
| Description | | Shares | | | Value | |
| | |
COMMON STOCKS (Continued) | | | | | | | | |
| | |
Japan (cont’d.) | | | | | | | | |
Sumitomo Realty & Development Co. Ltd. | | | 3,251 | | | $ | 80,032 | |
Suntory Beverage & Food Ltd. | | | 2,062 | | | | 75,697 | |
Suzuki Motor Corp. | | | 2,625 | | | | 92,189 | |
Taisei Corp. | | | 2,522 | | | | 76,881 | |
Takeda Pharmaceutical Co. Ltd. | | | 3,059 | | | | 84,773 | |
TDK Corp. | | | 2,498 | | | | 88,376 | |
Terumo Corp. | | | 2,595 | | | | 84,168 | |
TIS, Inc. | | | 2,981 | | | | 85,616 | |
Toho Co. Ltd. | | | 2,111 | | | | 80,687 | |
Tokyo Electric Power Co. Holdings, Inc.* | | | 16,299 | | | | 63,823 | |
Tokyo Electron Ltd. | | | 250 | | | | 79,467 | |
Tokyo Gas Co. Ltd. | | | 4,160 | | | | 78,214 | |
TOPPAN, Inc. | | | 4,571 | | | | 72,090 | |
Toray Industries, Inc. | | | 13,933 | | | | 80,123 | |
Toshiba Corp. | | | 1,952 | | | | 72,600 | |
Tosoh Corp. | | | 6,104 | | | | 79,395 | |
TOTO Ltd. | | | 2,271 | | | | 79,037 | |
Toyota Tsusho Corp. | | | 2,381 | | | | 84,066 | |
USS Co. Ltd. | | | 4,457 | | | | 79,050 | |
Yakult Honsha Co. Ltd. | | | 1,355 | | | | 80,271 | |
Yamaha Corp. | | | 2,058 | | | | 80,883 | |
Yamaha Motor Co. Ltd. | | | 4,027 | | | | 84,033 | |
Yaskawa Electric Corp. | | | 2,349 | | | | 77,440 | |
Yokogawa Electric Corp. | | | 4,851 | | | | 85,375 | |
| | | | | | | | |
| | |
| | | | | | | 11,483,717 | |
| | |
Jordan 0.2% | | | | | | | | |
Hikma Pharmaceuticals PLC | | | 4,010 | | | | 61,165 | |
| | |
Luxembourg 0.5% | | | | | | | | |
ArcelorMittal SA | | | 3,657 | | | | 87,302 | |
Eurofins Scientific SE | | | 1,046 | | | | 72,637 | |
| | | | | | | | |
| | |
| | | | | | | 159,939 | |
| | |
Netherlands 2.6% | | | | | | | | |
EXOR NV | | | 1,321 | | | | 79,998 | |
Heineken Holding NV | | | 1,163 | | | | 82,748 | |
Heineken NV | | | 950 | | | | 85,675 | |
JDE Peet’s NV | | | 2,813 | | | | 86,844 | |
Koninklijke Ahold Delhaize NV | | | 2,799 | | | | 77,073 | |
Koninklijke KPN NV | | | 22,499 | | | | 71,675 | |
Koninklijke Philips NV | | | 3,808 | | | | 63,710 | |
NN Group NV | | | 1,816 | | | | 74,770 | |
| | |
| See Notes to Financial Statements. | | |
18 | | |
| | | | | | | | |
| | |
| Description | | Shares | | | Value | |
| | |
COMMON STOCKS (Continued) | | | | | | | | |
| | |
Netherlands (cont’d.) | | | | | | | | |
Randstad NV | | | 1,527 | | | $ | 71,342 | |
Shell PLC | | | 3,227 | | | | 85,847 | |
Wolters Kluwer NV | | | 840 | | | | 82,255 | |
| | | | | | | | |
| | |
| | | | | | | 861,937 | |
| | |
New Zealand 0.7% | | | | | | | | |
Mercury NZ Ltd. | | | 21,481 | | | | 76,230 | |
Meridian Energy Ltd. | | | 26,562 | | | | 81,341 | |
Spark New Zealand Ltd. | | | 26,180 | | | | 86,819 | |
| | | | | | | | |
| | |
| | | | | | | 244,390 | |
| | |
Norway 1.5% | | | | | | | | |
Aker BP ASA | | | 1,978 | | | | 69,205 | |
Equinor ASA | | | 2,359 | | | | 90,844 | |
Mowi ASA | | | 3,406 | | | | 70,020 | |
Norsk Hydro ASA | | | 14,958 | | | | 103,103 | |
Orkla ASA | | | 9,620 | | | | 80,752 | |
Telenor ASA | | | 5,933 | | | | 65,074 | |
| | | | | | | | |
| | |
| | | | | | | 478,998 | |
| | |
Portugal 0.3% | | | | | | | | |
Jeronimo Martins SGPS SA | | | 3,810 | | | | 84,618 | |
| | |
Russia 0.0% | | | | | | | | |
Evraz PLC^ | | | 10,559 | | | | 1 | |
| | |
Singapore 3.1% | | | | | | | | |
Capitaland Investment Ltd. | | | 30,158 | | | | 79,633 | |
City Developments Ltd. | | | 15,211 | | | | 88,494 | |
DBS Group Holdings Ltd. | | | 3,554 | | | | 82,908 | |
Keppel Corp. Ltd. | | | 16,852 | | | | 87,670 | |
Mapletree Pan Asia Commercial Trust, REIT | | | 61,137 | | | | 80,498 | |
Oversea-Chinese Banking Corp. Ltd. | | | 9,687 | | | | 83,807 | |
Singapore Airlines Ltd.* | | | 21,662 | | | | 82,466 | |
Singapore Technologies Engineering Ltd. | | | 29,427 | | | | 78,545 | |
STMicroelectronics NV | | | 2,732 | | | | 95,394 | |
United Overseas Bank Ltd. | | | 3,826 | | | | 74,825 | |
UOL Group Ltd. | | | 15,074 | | | | 74,644 | |
Venture Corp. Ltd. | | | 6,893 | | | | 90,216 | |
| | | | | | | | |
| | |
| | | | | | | 999,100 | |
| | |
| | See Notes to Financial Statements. |
| | PGIM Quant Solutions Strategic Alpha International Equity ETF 19 |
Schedule of Investments (continued)
as of August 31, 2022
| | | | | | | | |
| | |
| Description | | Shares | | | Value | |
| | |
COMMON STOCKS (Continued) | | | | | | | | |
| | |
South Africa 0.2% | | | | | | | | |
Anglo American PLC | | | 2,521 | | | $ | 81,504 | |
| | |
Spain 2.5% | | | | | | | | |
Acciona SA | | | 438 | | | | 85,877 | |
ACS Actividades de Construccion y Servicios SA | | | 3,344 | | | | 74,638 | |
Banco Santander SA | | | 29,754 | | | | 72,272 | |
Enagas SA | | | 3,679 | | | | 67,252 | |
Endesa SA | | | 4,150 | | | | 71,317 | |
Iberdrola SA | | | 8,185 | | | | 85,422 | |
Industria de Diseno Textil SA | | | 3,509 | | | | 75,994 | |
Naturgy Energy Group SA | | | 3,029 | | | | 83,649 | |
Red Electrica Corp. SA | | | 4,029 | | | | 73,833 | |
Repsol SA | | | 6,007 | | | | 78,387 | |
Telefonica SA | | | 15,577 | | | | 64,433 | |
| | | | | | | | |
| | |
| | | | | | | 833,074 | |
| | |
Sweden 3.1% | | | | | | | | |
Assa Abloy AB (Class B Stock) | | | 3,778 | | | | 76,801 | |
Getinge AB (Class B Stock) | | | 3,411 | | | | 63,404 | |
H & M Hennes & Mauritz AB (Class B Stock) | | | 6,382 | | | | 66,490 | |
Holmen AB (Class B Stock) | | | 2,060 | | | | 88,623 | |
Investor AB (Class B Stock) | | | 4,847 | | | | 76,706 | |
Securitas AB (Class B Stock) | | | 9,237 | | | | 81,105 | |
Skanska AB (Class B Stock) | | | 5,317 | | | | 78,882 | |
SKF AB (Class B Stock) | | | 5,468 | | | | 82,354 | |
Swedish Orphan Biovitrum AB* | | | 3,704 | | | | 81,863 | |
Telefonaktiebolaget LM Ericsson (Class B Stock) | | | 10,740 | | | | 80,580 | |
Telia Co. AB | | | 20,779 | | | | 73,253 | |
Volvo AB (Class A Stock) | | | 4,715 | | | | 78,687 | |
Volvo AB (Class B Stock) | | | 4,861 | | | | 77,192 | |
| | | | | | | | |
| | |
| | | | | | | 1,005,940 | |
| | |
Switzerland 2.2% | | | | | | | | |
ABB Ltd. | | | 3,026 | | | | 83,490 | |
Adecco Group AG* | | | 2,409 | | | | 76,521 | |
Baloise Holding AG | | | 506 | | | | 73,195 | |
Chocoladefabriken Lindt & Spruengli AG | | | 8 | | | | 84,624 | |
Geberit AG | | | 163 | | | | 75,522 | |
Kuehne + Nagel International AG | | | 321 | | | | 74,216 | |
Novartis AG | | | 975 | | | | 78,928 | |
| | |
| See Notes to Financial Statements. | | |
20 | | |
| | | | | | | | |
| | |
| Description | | Shares | | | Value | |
| | |
COMMON STOCKS (Continued) | | | | | | | | |
| | |
Switzerland (cont’d.) | | | | | | | | |
Swatch Group AG (The) | | | 344 | | | $ | 83,862 | |
Swiss Prime Site AG | | | 920 | | | | 79,341 | |
| | | | | | | | |
| | |
| | | | | | | 709,699 | |
| | |
United Kingdom 9.6% | | | | | | | | |
3i Group PLC | | | 5,979 | | | | 84,426 | |
abrdn PLC | | | 44,097 | | | | 75,227 | |
Associated British Foods PLC | | | 4,098 | | | | 72,600 | |
Auto Trader Group PLC, 144A | | | 11,662 | | | | 88,304 | |
Aviva PLC | | | 17,181 | | | | 83,569 | |
BAE Systems PLC | | | 8,163 | | | | 73,606 | |
Barclays PLC | | | 44,537 | | | | 85,110 | |
Barratt Developments PLC | | | 14,645 | | | | 72,697 | |
Berkeley Group Holdings PLC | | | 1,775 | | | | 75,367 | |
British American Tobacco PLC | | | 2,108 | | | | 84,522 | |
British Land Co. PLC (The), REIT | | | 14,870 | | | | 74,418 | |
BT Group PLC | | | 37,395 | | | | 65,467 | |
Bunzl PLC | | | 2,205 | | | | 73,286 | |
Burberry Group PLC | | | 4,157 | | | | 84,414 | |
CK Hutchison Holdings Ltd. | | | 12,184 | | | | 78,782 | |
Coca-Cola Europacific Partners PLC | | | 1,511 | | | | 74,296 | |
Compass Group PLC | | | 3,891 | | | | 84,030 | |
Diageo PLC | | | 1,872 | | | | 81,856 | |
Haleon PLC* | | | 3,676 | | | | 11,054 | |
Imperial Brands PLC | | | 3,694 | | | | 81,385 | |
Informa PLC | | | 12,768 | | | | 81,104 | |
Intertek Group PLC | | | 1,560 | | | | 71,747 | |
J Sainsbury PLC | | | 31,188 | | | | 73,694 | |
JD Sports Fashion PLC | | | 58,050 | | | | 76,170 | |
Kingfisher PLC | | | 26,250 | | | | 70,778 | |
Land Securities Group PLC, REIT | | | 10,205 | | | | 77,129 | |
Lloyds Banking Group PLC | | | 158,828 | | | | 80,963 | |
National Grid PLC | | | 5,911 | | | | 74,024 | |
NatWest Group PLC | | | 29,471 | | | | 84,375 | |
Next PLC | | | 1,108 | | | | 74,810 | |
Pearson PLC | | | 9,090 | | | | 91,110 | |
Persimmon PLC | | | 3,577 | | | | 61,334 | |
Reckitt Benckiser Group PLC | | | 1,056 | | | | 81,554 | |
RELX PLC | �� | | 3,031 | | | | 79,647 | |
Sage Group PLC (The) | | | 10,298 | | | | 85,560 | |
Segro PLC, REIT | | | 6,673 | | | | 73,101 | |
Smiths Group PLC | | | 4,771 | | | | 82,638 | |
SSE PLC | | | 3,934 | | | | 75,521 | |
Taylor Wimpey PLC | | | 57,718 | | | | 72,616 | |
| | |
| | See Notes to Financial Statements. |
| | PGIM Quant Solutions Strategic Alpha International Equity ETF 21 |
Schedule of Investments (continued)
as of August 31, 2022
| | | | | | | | |
| | |
| Description | | Shares | | | Value | |
| | |
COMMON STOCKS (Continued) | | | | | | | | |
| | |
United Kingdom (cont’d.) | | | | | | | | |
Tesco PLC | | | 25,707 | | | $ | 74,271 | |
Vodafone Group PLC | | | 56,839 | | | | 76,383 | |
| | | | | | | | |
| | |
| | | | | | | 3,122,945 | |
| | |
United States 1.8% | | | | | | | | |
Ferguson PLC | | | 670 | | | | 77,725 | |
GSK PLC | | | 2,940 | | | | 47,112 | |
Nestle SA | | | 612 | | | | 71,737 | |
QIAGEN NV* | | | 1,742 | | | | 79,216 | |
Roche Holding AG (Bearer Shares) | | | 190 | | | | 72,734 | |
Roche Holding AG (Genusschein) | | | 238 | | | | 76,793 | |
Schneider Electric SE | | | 681 | | | | 81,290 | |
Stellantis NV | | | 6,798 | | | | 91,230 | |
| | | | | | | | |
| | |
| | | | | | | 597,837 | |
| | | | | | | | |
| | |
TOTAL COMMON STOCKS
(cost $34,011,240) | | | | | | | 31,657,706 | |
| | | | | | | | |
| | |
PREFERRED STOCKS 1.1% | | | | | | | | |
| | |
Germany | | | | | | | | |
Bayerische Motoren Werke AG (PRFC) | | | 1,155 | | | | 80,380 | |
Henkel AG & Co. KGaA (PRFC) | | | 1,348 | | | | 87,025 | |
Porsche Automobil Holding SE (PRFC) | | | 1,293 | | | | 91,582 | |
Volkswagen AG (PRFC) | | | 632 | | | | 90,278 | |
| | | | | | | | |
| | |
TOTAL PREFERRED STOCKS
(cost $429,637) | | | | | | | 349,265 | |
| | | | | | | | |
| | |
TOTAL LONG-TERM INVESTMENTS
(cost $34,440,877) | | | | | | | 32,006,971 | |
| | | | | | | | |
| | |
SHORT-TERM INVESTMENT 0.9% | | | | | | | | |
| | |
UNAFFILIATED FUND | | | | | | | | |
Dreyfus Government Cash Management (Institutional Shares)
(cost $299,811) | | | 299,811 | | | | 299,811 | |
| | | | | | | | |
| | |
TOTAL INVESTMENTS 99.0%
(cost $34,740,688) | | | | | | | 32,306,782 | |
Other assets in excess of liabilities 1.0% | | | | | | | 339,760 | |
| | | | | | | | |
| | |
NET ASSETS 100.0% | | | | | | $ | 32,646,542 | |
| | | | | | | | |
| | |
| See Notes to Financial Statements. | | |
22 | | |
Below is a list of the abbreviation(s) used in the annual report:
144A—Security was purchased pursuant to Rule 144A under the Securities Act of 1933 and, pursuant to the requirements of Rule 144A, may not be resold except to qualified institutional buyers.
LIBOR—London Interbank Offered Rate
PRFC—Preference Shares
| * | Non-income producing security. |
| ^ | Indicates a Level 3 instrument. The aggregate value of Level 3 instruments is $1 and 0.0% of net assets. |
Fair Value Measurements:
Various inputs are used in determining the value of the Fund’s investments. These inputs are summarized in the three broad levels listed below.
Level 1—unadjusted quoted prices generally in active markets for identical securities.
Level 2—quoted prices for similar securities, interest rates and yield curves, prepayment speeds, foreign currency exchange rates and other observable inputs.
Level 3—unobservable inputs for securities valued in accordance with Board approved fair valuation procedures.
The following is a summary of the inputs used as of August 31, 2022 in valuing such portfolio securities:
| | | | | | | | | | | | | | | | | | | | | | | | | | | | | | | | | | | |
| | | Level 1 | | Level 2 | | Level 3 |
Investments in Securities | | | | | | | | | | | | | | | | | | | | | | | | | | | | | | | | | | | |
Assets | | | | | | | | | | | | | | | | | | | | | | | | | | | | | | | | | | | |
Long-Term Investments | | | | | | | | | | | | | | | | | | | | | | | | | | | | | | | | | | | |
Common Stocks | | | | | | | | | | | | | | | | | | | | | | | | | | | | | | | | | | | |
Australia | | | $ | 1,447,407 | | | | | | | | | $ | — | | | | | | | | | | | | | | $ | — | | | | | | |
Austria | | | | 231,277 | | | | | | | | | | — | | | | | | | | | | | | | | | — | | | | | | |
Belgium | | | | 147,905 | | | | | | | | | | — | | | | | | | | | | | | | | | — | | | | | | |
Brazil | | | | 76,708 | | | | | | | | | | — | | | | | | | | | | | | | | | — | | | | | | |
Chile | | | | 82,395 | | | | | | | | | | — | | | | | | | | | | | | | | | — | | | | | | |
China | | | | 226,279 | | | | | | | | | | — | | | | | | | | | | | | | | | — | | | | | | |
Denmark | | | | 460,704 | | | | | | | | | | — | | | | | | | | | | | | | | | — | | | | | | |
Finland | | | | 238,807 | | | | | | | | | | — | | | | | | | | | | | | | | | — | | | | | | |
France | | | | 3,307,210 | | | | | | | | | | — | | | | | | | | | | | | | | | — | | | | | | |
Germany | | | | 2,184,383 | | | | | | | | | | — | | | | | | | | | | | | | | | — | | | | | | |
Hong Kong | | | | 998,938 | | | | | | | | | | — | | | | | | | | | | | | | | | — | | | | | | |
Ireland | | | | 349,943 | | | | | | | | | | — | | | | | | | | | | | | | | | — | | | | | | |
Israel | | | | 392,827 | | | | | | | | | | — | | | | | | | | | | | | | | | — | | | | | | |
Italy | | | | 788,059 | | | | | | | | | | — | | | | | | | | | | | | | | | — | | | | | | |
Japan | | | | 11,483,717 | | | | | | | | | | — | | | | | | | | | | | | | | | — | | | | | | |
Jordan | | | | 61,165 | | | | | | | | | | — | | | | | | | | | | | | | | | — | | | | | | |
Luxembourg | | | | 159,939 | | | | | | | | | | — | | | | | | | | | | | | | | | — | | | | | | |
Netherlands | | | | 861,937 | | | | | | | | | | — | | | | | | | | | | | | | | | — | | | | | | |
New Zealand | | | | 244,390 | | | | | | | | | | — | | | | | | | | | | | | | | | — | | | | | | |
Norway | | | | 478,998 | | | | | | | | | | — | | | | | | | | | | | | | | | — | | | | | | |
Portugal | | | | 84,618 | | | | | | | | | | — | | | | | | | | | | | | | | | — | | | | | | |
Russia | | | | — | | | | | | | | | | — | | | | | | | | | | | | | | | 1 | | | | | | |
Singapore | | | | 999,100 | | | | | | | | | | — | | | | | | | | | | | | | | | — | | | | | | |
| | |
| | See Notes to Financial Statements. |
| | PGIM Quant Solutions Strategic Alpha International Equity ETF 23 |
Schedule of Investments (continued)
as of August 31, 2022
| | | | | | | | | | | | | | | | | | | | | | | | | | | | | | | | | | | |
| | | Level 1 | | Level 2 | | Level 3 |
Investments in Securities (continued) | | | | | | | | | | | | | | | | | | | | | | | | | | | | | | | | | | | |
Assets (continued) | | | | | | | | | | | | | | | | | | | | | | | | | | | | | | | | | | | |
Long-Term Investments (continued) | | | | | | | | | | | | | | | | | | | | | | | | | | | | | | | | | | | |
Common Stocks (continued) | | | | | | | | | | | | | | | | | | | | | | | | | | | | | | | | | | | |
South Africa | | | $ | 81,504 | | | | | | | | | $ | — | | | | | | | | | | | | | | $ | — | | | | | | |
Spain | | | | 833,074 | | | | | | | | | | — | | | | | | | | | | | | | | | — | | | | | | |
Sweden | | | | 1,005,940 | | | | | | | | | | — | | | | | | | | | | | | | | | — | | | | | | |
Switzerland | | | | 709,699 | | | | | | | | | | — | | | | | | | | | | | | | | | — | | | | | | |
United Kingdom | | | | 3,122,945 | | | | | | | | | | — | | | | | | | | | | | | | | | — | | | | | | |
United States | | | | 597,837 | | | | | | | | | | — | | | | | | | | | | | | | | | — | | | | | | |
Preferred Stocks | | | | | | | | | | | | | | | | | | | | | | | | | | | | | | | | | | | |
Germany | | | | 349,265 | | | | | | | | | | — | | | | | | | | | | | | | | | — | | | | | | |
Short-Term Investment | | | | | | | | | | | | | | | | | | | | | | | | | | | | | | | | | | | |
Unaffiliated Fund | | | | 299,811 | | | | | | | | | | — | | | | | | | | | | | | | | | — | | | | | | |
| | | | | | | | | | | | | | | | | | | | | | | | | | | | | | | | | | | |
Total | | | $ | 32,306,781 | | | | | | | | | $ | — | | | | | | | | | | | | | | $ | 1 | | | | | | |
| | | | | | | | | | | | | | | |
Industry Classification:
The industry classification of investments and other assets in excess of liabilities shown as a percentage of net assets as of August 31, 2022 were as follows:
| | | | |
Pharmaceuticals | | | 4.7 | % |
Real Estate Management & Development | | | 4.6 | |
Banks | | | 4.4 | |
Chemicals | | | 4.3 | |
Equity Real Estate Investment Trusts (REITs) | | | 3.9 | |
Machinery | | | 3.7 | |
Automobiles | | | 3.7 | |
Electric Utilities | | | 3.4 | |
Food Products | | | 3.4 | |
Metals & Mining | | | 3.3 | |
Diversified Telecommunication Services | | | 2.9 | |
Electronic Equipment, Instruments & Components | | | 2.6 | |
Beverages | | | 2.5 | |
Textiles, Apparel & Luxury Goods | | | 2.3 | |
Trading Companies & Distributors | | | 2.2 | |
Semiconductors & Semiconductor Equipment | | | 2.1 | |
Oil, Gas & Consumable Fuels | | | 2.0 | |
Professional Services | | | 1.9 | |
Construction & Engineering | | | 1.9 | |
Food & Staples Retailing | | | 1.9 | |
Building Products | | | 1.9 | |
Industrial Conglomerates | | | 1.7 | |
IT Services | | | 1.7 | |
Health Care Equipment & Supplies | | | 1.6 | |
Household Durables | | | 1.5 | |
| | | | |
Media | | | 1.5 | % |
Insurance | | | 1.4 | |
Entertainment | | | 1.4 | |
Hotels, Restaurants & Leisure | | | 1.3 | |
Technology Hardware, Storage & Peripherals | | | 1.3 | |
Electrical Equipment | | | 1.3 | |
Diversified Financial Services | | | 1.2 | |
Marine | | | 1.2 | |
Aerospace & Defense | | | 1.2 | |
Gas Utilities | | | 1.1 | |
Specialty Retail | | | 1.1 | |
Multi-Utilities | | | 1.0 | |
Capital Markets | | | 1.0 | |
Commercial Services & Supplies | | | 1.0 | |
Unaffiliated Fund | | | 0.9 | |
Household Products | | | 0.8 | |
Auto Components | | | 0.8 | |
Paper & Forest Products | | | 0.8 | |
Software | | | 0.7 | |
Tobacco | | | 0.7 | |
Wireless Telecommunication Services | | | 0.7 | |
Air Freight & Logistics | | | 0.7 | |
Health Care Providers & Services | | | 0.6 | |
Road & Rail | | | 0.5 | |
Multiline Retail | | | 0.5 | |
| | |
| See Notes to Financial Statements. | | |
24 | | |
Industry Classification (continued):
| | | | |
Personal Products | | | 0.5 | % |
Construction Materials | | | 0.5 | |
Leisure Products | | | 0.5 | |
Communications Equipment | | | 0.5 | |
Transportation Infrastructure | | | 0.5 | |
Life Sciences Tools & Services | | | 0.5 | |
Interactive Media & Services | | | 0.3 | |
Containers & Packaging | | | 0.3 | |
Airlines | | | 0.2 | |
| | | | |
Biotechnology | | | 0.2 | % |
Independent Power & Renewable Electricity Producers | | | 0.2 | |
| | | | |
| | | 99.0 | |
Other assets in excess of liabilities | | | 1.0 | |
| | | | |
| |
| | | 100.0 | % |
| | | | |
| | |
| | See Notes to Financial Statements. |
| | PGIM Quant Solutions Strategic Alpha International Equity ETF 25 |
Statement of Assets and Liabilities
as of August 31, 2022
| | | | | | |
| |
Assets | | | |
| | |
Unaffiliated investments (cost $34,740,688) | | $ | 32,306,782 | | | |
Foreign currency, at value (cost $177,895) | | | 175,929 | | | |
Dividends receivable | | | 97,220 | | | |
Tax reclaim receivable | | | 74,992 | | | |
| | | | | | |
| | |
Total Assets | | | 32,654,923 | | | |
| | | | | | |
| |
Liabilities | | | |
Management fee payable | | | 8,381 | | | |
| | | | | | |
| | |
Net Assets | | $ | 32,646,542 | | | |
| | | | | | |
| | |
| | | | | | | |
| | |
Net assets were comprised of: | | | | | | |
Common stock, at par | | $ | 700 | | | |
Paid-in capital in excess of par | | | 34,905,030 | | | |
Total distributable earnings (loss) | | | (2,259,188 | ) | | |
| | | | | | |
| | |
Net assets, August 31, 2022 | | $ | 32,646,542 | | | |
| | | | | | |
| | |
Net asset value, offering price and redemption price per share, ($32,646,542 ÷ 700,000 shares of common stock issued and outstanding) | | $ | 46.64 | | | |
| | | | | | |
| | |
| See Notes to Financial Statements. | | |
26 | | |
Statement of Operations
Year Ended August 31, 2022
| | | | |
Net Investment Income (Loss) | | | | |
Income | | | | |
Unaffiliated dividend income (net of $160,354 foreign withholding tax) | | $ | 1,179,884 | |
Income from securities lending, net (including affiliated income of $88) | | | 8,356 | |
Miscellaneous income | | | 32 | |
| | | | |
Total income | | | 1,188,272 | |
| | | | |
| |
Expenses | | | | |
Management fee | | | 110,436 | |
| | | | |
Net investment income (loss) | | | 1,077,836 | |
| | | | |
| |
Realized And Unrealized Gain (Loss) On Investment And Foreign Currency Transactions | | | | |
Net realized gain (loss) on: | | | | |
Investment transactions (including affiliated of $(14)) | | | (141,186 | ) |
Foreign currency transactions | | | (41,145 | ) |
| | | | |
| | | (182,331 | ) |
| | | | |
| |
Net change in unrealized appreciation (depreciation) on: | | | | |
Investments | | | (8,477,386 | ) |
Foreign currencies | | | 7,219 | |
| | | | |
| | | (8,470,167 | ) |
| | | | |
Net gain (loss) on investment and foreign currency transactions | | | (8,652,498 | ) |
| | | | |
Net Increase (Decrease) In Net Assets Resulting From Operations | | $ | (7,574,662 | ) |
| | | | |
| | |
| | See Notes to Financial Statements. |
| | PGIM Quant Solutions Strategic Alpha International Equity ETF 27 |
Statements of Changes in Net Assets
| | | | | | | | |
| |
| | | Year Ended
August 31, | |
| | | 2022 | | | 2021 | |
| | |
Increase (Decrease) in Net Assets | | | | | | | | |
Operations | | | | | | | | |
Net investment income (loss) | | $ | 1,077,836 | | | $ | 1,005,336 | |
Net realized gain (loss) on investment and foreign currency transactions | | | (182,331 | ) | | | 4,315,646 | |
Net change in unrealized appreciation (depreciation) on investments and foreign currencies | | | (8,470,167 | ) | | | 3,348,057 | |
| | | | | | | | |
Net increase (decrease) in net assets resulting from operations | | | (7,574,662 | ) | | | 8,669,039 | |
| | | | | | | | |
Dividends and Distributions | | | | | | | | |
Distributions from distributable earnings | | | (3,368,106 | ) | | | (940,968 | ) |
| | | | | | | | |
Total increase (decrease) | | | (10,942,768 | ) | | | 7,728,071 | |
| | |
Net Assets: | | | | | | | | |
Beginning of year | | | 43,589,310 | | | | 35,861,239 | |
| | | | | | | | |
End of year | | $ | 32,646,542 | | | $ | 43,589,310 | |
| | | | | | | | |
| | |
| See Notes to Financial Statements. | | |
28 | | |
Financial Highlights
| | | | | | | | | | | | | | | | | | | | |
| | | | | | |
| | | | | | | | | | | | | | | | |
| | | | | | | | | | | | December 04, 2018(a) | | | | |
| | | Year Ended August 31, | | | through August 31, | | | | |
| | | 2022 | | | 2021 | | | 2020 | | | 2019 | | | | |
| | | | | | |
| Per Share Operating Performance(b): | | | | | | | | | | | | | | | | | | | | |
| Net Asset Value, Beginning of Period | | | $62.27 | | | | $51.23 | | | | $49.55 | | | | $50.00 | | | | | |
| Income (loss) from investment operations: | | | | | | | | | | | | | | | | | | | | |
| Net investment income (loss) | | | 1.54 | | | | 1.44 | | | | 1.09 | | | | 1.16 | | | | | |
| Net realized and unrealized gain (loss) on investment and foreign currency transactions | | | (12.36 | ) | | | 10.94 | | | | 1.88 | | | | (0.63) | | | | | |
| Total from investment operations | | | (10.82 | ) | | | 12.38 | | | | 2.97 | | | | 0.53 | | | | | |
| Less Dividends and Distributions: | | | | | | | | | | | | | | | | | | | | |
| Dividends from net investment income | | | (1.49 | ) | | | (1.34 | ) | | | (1.29 | ) | | | (0.98) | | | | | |
| Distributions from net realized gains | | | (3.32 | ) | | | - | | | | - | | | | - | | | | | |
| Total dividends and distributions | | | (4.81 | ) | | | (1.34 | ) | | | (1.29 | ) | | | (0.98) | | | | | |
| Net asset value, end of period | | | $46.64 | | | | $62.27 | | | | $51.23 | | | | $49.55 | | | | | |
| Total Return(c): | | | (18.75 | )% | | | 24.43 | % | | | 6.05 | % | | | 1.09% | | | | | |
| | | | | | | | | | | | | | | | | | | | | |
| Ratios/Supplemental Data: | | | | | | | | | | | | | | | | | | | | |
| Net assets, end of period (000) | | | $32,647 | | | | $43,589 | | | | $35,861 | | | | $34,687 | | | | | |
| Average net assets (000) | | | $38,070 | | | | $40,415 | | | | $34,722 | | | | $27,908 | | | | | |
| Ratios to average net assets(d): | | | | | | | | | | | | | | | | | | | | |
| Expenses after waivers and/or expense reimbursement | | | 0.29 | % | | | 0.29 | % | | | 0.29 | % | | | 0.29%(e) | | | | | |
| Expenses before waivers and/or expense reimbursement | | | 0.29 | % | | | 0.29 | % | | | 0.29 | % | | | 0.29%(e) | | | | | |
| Net investment income (loss) | | | 2.83 | % | | | 2.49 | % | | | 2.20 | % | | | 3.12%(e) | | | | | |
| Portfolio turnover rate(f) | | | 90 | % | | | 79 | % | | | 92 | % | | | 63% | | | | | |
| (a) | Commencement of operations. |
| (b) | Calculated based on average shares outstanding during the period. |
| (c) | Total return is calculated assuming a purchase of a share on the first day and a sale on the last day of each period reported and includes reinvestment of dividends and distributions, if any. Total returns may reflect adjustments to conform to GAAP. Total returns for periods less than one full year are not annualized. |
| (d) | Does not include expenses of the underlying funds in which the Fund invests. |
| (f) | The Fund’s portfolio turnover rate is calculated in accordance with regulatory requirements, without regard to transactions involving short-term investments, certain derivatives and in-kind transactions (if any). If such transactions were included, the Fund’s portfolio turnover rate may be higher. |
| | |
| | See Notes to Financial Statements. |
| | PGIM Quant Solutions Strategic Alpha International Equity ETF 29 |
Notes to Financial Statements
PGIM ETF Trust (the “Registered Investment Company” or “RIC”) is registered under the Investment Company Act of 1940, as amended (“1940 Act”), as an open-end management investment company. The RIC is organized as a Delaware Statutory Trust. These financial statements relate only to the PGIM Quant Solutions Strategic Alpha International Equity ETF (the “Fund”), a series of the RIC. The Fund is classified as a diversified fund for purposes of the 1940 Act.
The investment objective of the Fund is to seek long-term growth of capital.
The Fund follows the investment company accounting and reporting guidance of the Financial Accounting Standards Board (“FASB”) Accounting Standard Codification (“ASC”) Topic 946 Financial Services — Investment Companies. The following is a summary of significant accounting policies followed by the Fund in the preparation of its financial statements. The policies conform to U.S. generally accepted accounting principles (“GAAP”). The Fund consistently follows such policies in the preparation of its financial statements.
Securities Valuation: The Fund holds securities and other assets and liabilities that are fair valued as of the close of each day (generally, 4:00 PM Eastern time) the New York Stock Exchange (“NYSE”) is open for trading. As described in further detail below, the Fund’s investments are valued daily based on a number of factors, including the type of investment and whether market quotations are readily available. The RIC’s Board of Directors (the “Board”) has approved the Fund’s valuation policies and procedures for security valuation and designated to PGIM Investments LLC (“PGIM Investments” or the “Manager”) as the Valuation Designee pursuant to SEC Rule 2a-5(b) to perform the fair value determination relating to all Fund investments. Pursuant to the Board’s oversight, the Valuation Designee has established a Valuation Committee to perform the duties and responsibilities as valuation designee under SEC Rule 2a-5. The valuation procedures permit the Fund to utilize independent pricing vendor services, quotations from market makers, and alternative valuation methods when market quotations are either not readily available or not deemed representative of fair value. Fair value is the price that would be received to sell an asset or paid to transfer a liability in an orderly transaction between market participants on the measurement date. A record of the Valuation Committee’s actions is provided to the Board at the first quarterly meeting following the quarter in which such actions take place.
For the fiscal reporting year-end, securities and other assets and liabilities were fair valued at the close of the last U.S. business day. Trading in certain foreign securities may occur when the NYSE is closed (including weekends and holidays). Because such foreign securities
trade in markets that are open on weekends and U.S. holidays, the values of some of the Fund’s foreign investments may change on days when investors cannot purchase or redeem Fund shares.
Various inputs determine how the Fund’s investments are valued, all of which are categorized according to the three broad levels (Level 1, 2, or 3) detailed in the Schedule of Investments and referred to herein as the “fair value hierarchy” in accordance with FASB ASC Topic 820 - Fair Value Measurement.
Common or preferred stocks, exchange-traded funds and derivative instruments, if applicable, that are traded on a national securities exchange are valued at the last sale price as of the close of trading on the applicable exchange where the security principally trades. Securities traded via NASDAQ are valued at the NASDAQ official closing price. To the extent these securities are valued at the last sale price or NASDAQ official closing price, they are classified as Level 1 in the fair value hierarchy. In the event that no sale or official closing price on valuation date exists, these securities are generally valued at the mean between the last reported bid and ask prices, or at the last bid price in the absence of an ask price. These securities are classified as Level 2 in the fair value hierarchy.
Investments in open-end funds (other than exchange-traded funds) are valued at their net asset values as of the close of the NYSE on the date of valuation. These securities are classified as Level 1 in the fair value hierarchy since they may be purchased or sold at their net asset values on the date of valuation.
Securities and other assets that cannot be priced according to the methods described above are valued based on policies and procedures approved by the Board. In the event that unobservable inputs are used when determining such valuations, the securities will be classified as Level 3 in the fair value hierarchy. Altering one or more unobservable inputs may result in a significant change to a Level 3 security’s fair value measurement.
When determining the fair value of securities, some of the factors influencing the valuation include: the nature of any restrictions on disposition of the securities; assessment of the general liquidity of the securities; the issuer’s financial condition and the markets in which it does business; the cost of the investment; the size of the holding and the capitalization of the issuer; the prices of any recent transactions or bids/offers for such securities or any comparable securities; any available analyst media or other reports or information deemed reliable by the Valuation Designee regarding the issuer or the markets or industry in which it operates. Using fair value to price securities may result in a value that is different from a security’s most recent closing price and from the price used by other unaffiliated mutual funds to calculate their net asset values.
Foreign Currency Translation: The books and records of the Fund are maintained in U.S. dollars. Foreign currency amounts are translated into U.S. dollars on the following basis:
| | |
| | PGIM Quant Solutions Strategic Alpha International Equity ETF 31 |
Notes to Financial Statements (continued)
(i) market value of investment securities, other assets and liabilities — at the exchange rate as of the valuation date;
(ii) purchases and sales of investment securities, income and expenses — at the rates of exchange prevailing on the respective dates of such transactions.
Although the net assets of the Fund are presented at the foreign exchange rates and market values at the close of the period, the Fund does not generally isolate that portion of the results of operations arising as a result of changes in the foreign exchange rates from the fluctuations arising from changes in the market prices of long-term portfolio securities held at the end of the period. Similarly, the Fund does not isolate the effect of changes in foreign exchange rates from the fluctuations arising from changes in the market prices of long-term portfolio securities sold during the period. Accordingly, holding period unrealized and realized foreign currency gains (losses) are included in the reported net change in unrealized appreciation (depreciation) on investments and net realized gains (losses) on investment transactions on the Statements of Operations.
Net realized gains (losses) on foreign currency transactions represent net foreign exchange gains (losses) from the disposition of holdings of foreign currencies, currency gains (losses) realized between the trade and settlement dates on investment transactions, and the difference between the amounts of interest, dividends and foreign withholding taxes recorded on the Fund’s books and the U.S. dollar equivalent amounts actually received or paid. Net unrealized currency gains (losses) arise from valuing foreign currency denominated assets and liabilities (other than investments) at period end exchange rates.
Master Netting Arrangements: The RIC, on behalf of the Fund, is subject to various Master Agreements, or netting arrangements, with select counterparties. These are agreements which a subadviser may have negotiated and entered into on behalf of all or a portion of the Fund. A master netting arrangement between the Fund and the counterparty permits the Fund to offset amounts payable by the Fund to the same counterparty against amounts to be received; and by the receipt of collateral from the counterparty by the Fund to cover the Fund’s exposure to the counterparty. However, there is no assurance that such mitigating factors are easily enforceable. In addition to master netting arrangements, the right to set-off exists when all the conditions are met such that each of the parties owes the other determinable amounts, the reporting party has the right to set-off the amount owed with the amount owed by the other party, the reporting party intends to set-off and the right of set-off is enforceable by law.
Securities Lending: The Fund lends its portfolio securities to banks and broker-dealers. The loans are secured by collateral at least equal to the market value of the securities loaned. Collateral pledged by each borrower is invested in an affiliated money market fund and is
marked to market daily, based on the previous day’s market value, such that the value of the collateral exceeds the value of the loaned securities. In the event of significant appreciation in value of securities on loan on the last business day of the reporting period, the financial statements may reflect a collateral value that is less than the market value of the loaned securities. Such shortfall is remedied as described above. Loans are subject to termination at the option of the borrower or the Fund. Upon termination of the loan, the borrower will return to the Fund securities identical to the loaned securities. The remaining open loans of the securities lending transactions are considered overnight and continuous. Should the borrower of the securities fail financially, the Fund has the right to repurchase the securities in the open market using the collateral.
The Fund recognizes income, net of any rebate and securities lending agent fees, for lending its securities in the form of fees or interest on the investment of any cash received as collateral. The borrower receives all interest and dividends from the securities loaned and such payments are passed back to the lender in amounts equivalent thereto, which are reflected in interest income or unaffiliated dividend income based on the nature of the payment on the Statement of Operations. The Fund also continues to recognize any unrealized gain (loss) in the market price of the securities loaned and on the change in the value of the collateral invested that may occur during the term of the loan. In addition, realized gain (loss) is recognized on changes in the value of the collateral invested upon liquidation of the collateral. Net earnings from securities lending are disclosed in the Statement of Operations.
Equity and Mortgage Real Estate Investment Trusts (collectively REITs): The Fund invested in REITs, which report information on the source of their distributions annually. Based on current and historical information, a portion of distributions received from REITs during the period is estimated to be dividend income, capital gain or return of capital and recorded accordingly. When material, these estimates are adjusted periodically when the actual source of distributions is disclosed by the REITs.
Securities Transactions and Net Investment Income: Securities transactions are recorded on the trade date. Realized gains (losses) from investment and currency transactions are calculated on the specific identification method. Dividend income is recorded on the ex-date, or for certain foreign securities, when the Fund becomes aware of such dividends. Expenses are recorded on an accrual basis, which may require the use of certain estimates by management that may differ from actual.
Taxes: It is the Fund’s policy to continue to meet the requirements of the Internal Revenue Code applicable to regulated investment companies and to distribute all of its taxable net investment income and capital gains, if any, to its shareholders. Therefore, no federal income tax provision is required. Withholding taxes on foreign dividends, interest and capital gains, if any, are recorded, net of reclaimable amounts, at the time the related income is earned.
| | |
| | PGIM Quant Solutions Strategic Alpha International Equity ETF 33 |
Notes to Financial Statements (continued)
Dividends and Distributions: Dividends and distributions to shareholders, which are determined in accordance with federal income tax regulations and which may differ from GAAP, are recorded on the ex-date. Permanent book/tax differences relating to income and gain (loss) are reclassified between total distributable earnings (loss) and paid-in capital in excess of par, as appropriate. The chart below sets forth the expected frequency of dividend and capital gains distributions to shareholders. Various factors may impact the frequency of dividend distributions to shareholders, including but not limited to adverse market conditions or portfolio holding-specific events.
| | |
| | |
| Expected Distribution Schedule to Shareholders* | | Frequency |
| |
Net Investment Income | | Quarterly |
| |
Short-Term Capital Gains | | Annually |
| |
Long-Term Capital Gains | | Annually |
| * | Under certain circumstances, the Fund may make more than one distribution of short-term and/or long-term capital gains during a fiscal year. |
Estimates: The preparation of financial statements requires management to make estimates and assumptions that affect the reported amounts and disclosures in the financial statements. Actual results could differ from those estimates.
Pursuant to a management agreement with the RIC on behalf of the Fund (the Management Agreement), PGIM Investments manages each Fund’s investment operations and administers its business affairs. PGIM Investments is also responsible for supervising each Fund’s subadviser.
Pursuant to the management agreement relating to the Fund, there is a unitary fee structure for the fund whereby PGIM Investments is responsible for substantially all expenses of the Fund, except taxes, brokerage expenses, interest expenses, distribution fees or expenses, expenses incident to shareholder meetings and extraordinary expenses. The Fund may also pay for any costs or expenses of investing in other funds. For more information on the unitary management fee structure please refer to the Fund’s Statement of Additional Information.
The unitary fee paid to the Manager is accrued daily and payable monthly, at an annual rate of the Fund’s average daily net assets specified below. The Manager has contractually agreed, beginning from the Fund’s inception date, to waive any management fees it receives from the Fund in an amount equal to the subadvisory fees paid by the Fund to the PGIM Institutional Money Market Fund due to the Fund’s investment of its excess overnight cash
in the PGIM Institutional Money Market Fund. This waiver will remain in effect for as long as the Fund remains invested or intends to invest in the PGIM Institutional Money Market Fund.
| | |
| | |
| Fund | | Unitary
Fee Rate |
| |
PGIM Quant Solutions Strategic Alpha International Equity ETF | | 0.29% |
The Manager has entered into a subadvisory agreement (Subadvisory Agreement) with PGIM Quantitative Solutions LLC (formerly known as QMA LLC), (“PGIM Quantitative Solutions”) (the “subadviser”). The Manager pays for the services of the subadviser.
Effective June 6, 2022, the Bank of New York Mellon (“BNY”) serves as the Custodian, Transfer Agent and Administrative Agent for the Trust. BNY receives compensation from the Manager and is reimbursed for expenses, including custodian, transfer agency and administration fees and certain out-of-pocket expenses including, but not limited to, postage, stationery, printing, allocable communication expenses and other costs. The Manager is responsible for compensating BNY under the Custodian, Transfer Agency and Service and Administration and Accounting Agreements.
Prior to June 6, 2022, Brown Brothers Harriman & Co. (“BBH”) served as the Custodian, Transfer Agent, Administrative Agent and Securities Lending Agent for the Trust. The Manager was responsible for compensating BBH under the Custodian and Administrative and Transfer Agency Agreements. As securities lending agent, BBH was responsible for marketing to approved borrowers available securities from the Funds’ portfolios. BBH received as compensation for its services a portion of the amount earned by the Funds for lending securities.
Prudential Investment Management Services LLC (“PIMS” or the “Distributor”), acts as the distributor of the Fund, pursuant to the terms of a distribution agreement (“Distribution Agreement”) between the RIC and the Distributor. The Distributor is a subsidiary of Prudential. Shares are continuously offered for sale by the Distributor only. Although the Distributor does not receive any fees under the Distribution Agreement, the Manager or its affiliates may pay the Distributor for certain distribution related services.
PGIM Investments, PGIM, Inc., PIMS and PGIM Quantitative Solutions are indirect, wholly-owned subsidiaries of Prudential Financial, Inc. (“Prudential”).
| 4. | Other Transactions with Affiliates |
The Fund may invest its securities lending cash collateral in the PGIM Institutional Money Market Fund (the “Money Market Fund”), a fund of Prudential Investment Portfolios 2, registered under the 1940 Act and managed by PGIM Investments. PGIM Investments and/or its affiliates are paid fees or reimbursed for providing their services to the Money Market Fund. In addition to the realized and unrealized gains on investments in the Money
| | |
| | PGIM Quant Solutions Strategic Alpha International Equity ETF 35 |
Notes to Financial Statements (continued)
Market Fund, earnings from such investments are disclosed on the Statement of Operations as “Income from securities lending, net”.
The Fund may enter into certain securities purchase or sale transactions under Board approved Rule 17a-7 procedures. Rule 17a-7 is an exemptive rule under the 1940 Act, that subject to certain conditions, permits purchase and sale transactions among affiliated investment companies, or between an investment company and a person that is affiliated solely by reason of having a common (or affiliated) investment adviser, common directors/trustees, and/or common officers. For the year ended August 31, 2022, no 17a-7 transactions were entered into by the Fund.
The aggregate cost of purchases and proceeds from sales of portfolio securities (excluding short-term investments and U.S. Government securities) for the reporting period ended August 31, 2022, were as follows:
| | |
| | |
| Cost of Purchases | | Proceeds from Sales |
| |
$32,622,666 | | $34,543,790 |
A summary of the cost of purchases and proceeds from sales of shares of affiliated mutual funds for the year ended August 31, 2022, is presented as follows:
| | | | | | | | | | | | | | | | | | | | | | | | |
| | | | | | | | |
Value,
Beginning
of Year | | Cost of
Purchases | | Proceeds
from Sales | | Change in
Unrealized
Gain
(Loss) | | | Realized
Gain
(Loss) | | | Value,
End of Year | | | Shares,
End
of Year | | | Income | |
| | | |
Short-Term Investments - Affiliated Mutual Fund: | | | | | | | | | | | | | |
| | | | | |
PGIM Institutional Money Market Fund(1)(b)(we) | | | | | | | | | | | | | | | | | | | | |
| $95,793 | | $1,207,074 | | $1,302,853 | | | $— | | | | $(14) | | | | $— | | | | — | | | | $88(2) | |
| (1) | The Fund did not have any capital gain distributions during the reporting period. |
| (2) | The amount, or a portion thereof, represents the affiliated securities lending income shown on the Statement of Operations. |
| (b) | Represents security, or portion thereof, purchased with cash collateral received for securities on loan and includes dividend reinvestment. |
| (we) | PGIM Investments LLC, the manager of the Fund, also serves as manager of the PGIM Institutional Money Market Fund. |
| 6. | Distributions and Tax Information |
Distributions to shareholders, which are determined in accordance with federal income tax regulations and which may differ from GAAP, are recorded on the ex-date.
For the year ended August 31, 2022, the tax character of dividends paid by the Fund were $3,263,764 of ordinary income and $104,342 of long-term capital gains. For the year ended August 31, 2021, the tax character of dividends paid by the Fund was $940,968 of ordinary income.
As of August 31, 2022, the accumulated undistributed earnings on a tax basis was $420,029 of ordinary income.
The United States federal income tax basis of the Fund’s investments and the net unrealized depreciation as of August 31, 2022 were as follows:
| | | | | | | | | | |
| Tax Basis | | Gross Unrealized Appreciation | | | | Gross Unrealized Depreciation | | | | Net Unrealized Depreciation |
$34,788,264 | | $1,960,981 | | | | $(4,442,463) | | | | $(2,481,482) |
The difference between GAAP basis and tax basis was primarily attributable to investments in passive foreign investment companies.
For federal income tax purposes, the Fund had a capital loss carryforward as of August 31, 2022 of approximately $207,000 which can be carried forward for an unlimited period. No capital gains distributions are expected to be paid to shareholders until net gains have been realized in excess of such losses.
The Manager has analyzed the Fund’s tax positions taken on federal, state and local income tax returns for all open tax years and has concluded that no provision for income tax is required in the Fund’s financial statements for the current reporting period. Since tax authorities can examine previously filed tax returns, the Fund’s U.S. federal and state tax returns for each of the four fiscal years up to the most recent fiscal year ended August 31, 2022 are subject to such review.
The Fund is an exchange-traded fund, commonly known as an “ETF”. Individual shares of the Fund may only be purchased and sold in secondary market transactions through brokers or other financial intermediaries. Shares of the Fund are listed for trading on the NYSE Arca, Inc. (the “Exchange”), and because the shares of the Fund trade at market prices rather than NAV, shares of the Fund may trade at a price greater than NAV (a premium) or less than NAV (a discount). The Fund will issue and redeem its shares at NAV only in aggregations of a specified number of shares called a “Creation Unit”. An Authorized Participant is a member or participant of a clearing agency registered with the SEC, which has a written agreement with the Fund or one of their service providers that allows the Authorized Participant to place orders for the purchase and redemption of Creation Units.
A creation transaction, which is subject to acceptance by the Distributor and the Fund, generally takes place when an Authorized Participant deposits into the Fund a designated
| | |
| | PGIM Quant Solutions Strategic Alpha International Equity ETF 37 |
Notes to Financial Statements (continued)
portfolio of securities, assets or other positions (a “creation basket”, and an amount of cash (including any cash representing the value of substituted securities, assets or other positions), if any, which together approximate the holdings of the Fund in exchange for a specified number of Creation Units. Similarly, shares can be redeemed only in Creation Units, generally for a designated portfolio of securities, assets or other propositions (the “redemption basket”) held by the Fund and an amount of cash (including any portion of such securities for which cash may be substituted). The Fund may, in certain circumstances, offer Creation Units partially or solely for cash. Except when aggregated in Creation Units, shares are not redeemable by the Fund. Creation and redemption baskets may differ and the Fund may accept “custom baskets”. A Creation Unit of PGIM Quant Solutions Strategic Alpha International Equity ETF consists of 100,000 shares of the Fund.
Authorized Participants generally are required to pay a fixed creation transaction fee and/or a fixed redemption transaction fee, as applicable, for each transaction in a Creation Unit regardless of the number of Creation Units created or redeemed on that day. From time to time, the Fund may waive all or a portion of their applicable transaction fee(s). An additional charge or a variable charge may be applied to certain creation and redemption transactions, including non-standard orders and whole or partial cash purchases or redemptions when deemed appropriate.
The RIC is authorized to issue an unlimited number of shares of beneficial interest, $0.001 par value per share.
As of August 31, 2022, Prudential, through its affiliated entities, including affiliated funds (if applicable), owned shares of the Fund as follows:
| | | | |
| Fund | | Number of Shares | | Percentage of
Outstanding Shares |
PGIM Quant Solutions Strategic Alpha International Equity ETF | | 695,000 | | 99.3% |
At the reporting period end, the number of shareholders holding greater than 5% of the Fund are as follows:
| | | | |
| | | Number of Shareholders | | Percentage of Outstanding Shares |
Affiliated | | 2 | | 91.5% |
Unaffiliated | | — | | — |
The Fund may make payment for Fund shares redeemed and contributed wholly or in part by distributing portfolio securities to shareholders. For the year ended August 31, 2022, the Fund had no subscriptions in-kind and no redemptions in-kind.
There were no transactions in shares of beneficial interest for the periods ended August 31, 2022 and August 31, 2021
The RIC, on behalf of the Fund, along with other affiliated registered investment companies (the “Participating Funds”), is a party to a Syndicated Credit Agreement (“SCA”) with a group of banks. The purpose of the SCA is to provide an alternative source of temporary funding for capital share redemptions. The table below provides details of the current SCA in effect at the reporting period-end as well as the prior SCA.
| | | | |
| | | Current SCA | | Prior SCA |
Term of Commitment | | 10/1/2021 – 9/29/2022 | | 10/2/2020 – 9/30/2021 |
Total Commitment | | $ 1,200,000,000 | | $ 1,200,000,000 |
Annualized Commitment Fee on the Unused Portion of the SCA | | 0.15% | | 0.15% |
Annualized Interest Rate on Borrowings | | 1.20% plus the higher of (1) the effective federal funds rate, (2) the one-month LIBOR rate or (3) zero percent | | 1.30% plus the higher of (1) the effective federal funds rate, (2) the one-month LIBOR rate or (3) zero percent |
Subsequent to the reporting period end, the SCA has been renewed and effective September 30, 2022 will provide a commitment of $1,200,000,000 through September 28, 2023. The commitment fee paid by the Participating Funds will continue to be 0.15% of the unused portion of the SCA. The interest on borrowings under the renewed SCA will be paid monthly and at a per annum interest rate of 1.00% plus the higher of (1) the effective federal funds rate, (2) the daily SOFR rate plus 0.10% or (3) zero percent.
Certain affiliated registered investment companies that are parties to the SCA include portfolios that are subject to a predetermined mathematical formula used to manage certain benefit guarantees offered under variable annuity contracts. The formula may result in large scale asset flows into and out of these portfolios. Consequently, these portfolios may be more likely to utilize the SCA for purposes of funding redemptions. It may be possible for those portfolios to fully exhaust the committed amount of the SCA, thereby requiring the Manager to allocate available funding per a Board-approved methodology designed to treat the Participating Funds in the SCA equitably.
The Fund did not utilize the SCA during the year ended August 31, 2022.
| 9. | Risks of Investing in the Fund |
The Fund’s risks include, but are not limited to, some or all of the risks discussed below. For further information on the Fund’s risks, please refer to the Fund’s Prospectus and Statement of Additional Information.
Authorized Participant Concentration Risk: Only an Authorized Participant may engage in creation or redemption transactions directly with the Fund. The Fund has a limited number of intermediaries that act as Authorized Participants and none of these Authorized Participants is or will be obligated to engage in creation or redemption transactions. To the extent that these Authorized Participants exit the business or are unable to or choose not to
| | |
| | PGIM Quant Solutions Strategic Alpha International Equity ETF 39 |
Notes to Financial Statements (continued)
proceed with creation and/or redemption orders with respect to the Fund and no other Authorized Participant creates or redeems, shares of the Fund may trade at a substantial discount or premium to net asset value (“NAV”), may trade at larger spreads, and possibly face trading halts and/or delisting.
Currency Risk: The Fund’s net asset value could decline as a result of changes in exchange rates, which could adversely affect the Fund’s investments in currencies, or in securities that trade in, and receive revenues related to, currencies, or in derivatives that provide exposure to currencies. Certain foreign countries may impose restrictions on the ability of issuers of foreign securities to make payment of principal and interest or dividends to investors located outside the country, due to blockage of foreign currency exchanges or otherwise.
Economic and Market Events Risk: Events in the U.S. and global financial markets, including actions taken by the U.S. Federal Reserve or foreign central banks to stimulate or stabilize economic growth or the functioning of the securities markets, may at times result in unusually high market volatility, which could negatively impact performance. Relatively reduced liquidity in credit and fixed income markets could adversely affect issuers worldwide.
Equity and Equity-Related Securities Risks: Equity and equity-related securities may be subject to changes in value, and their values may be more volatile than those of other asset classes. In addition to an individual security losing value, the value of the equity markets or a sector in which the Fund invests could go down. Different parts of a market can react differently to adverse issuer, market, regulatory, political and economic developments.
ETF Shares Trading Risk: Fund shares are listed for trading on NYSE Arca, Inc. (the “Exchange”) and the shares are bought and sold in the secondary market at market prices. The market prices of the shares of the Fund are expected to fluctuate in response to changes in the Fund’s NAV, the intraday value of the Fund’s holdings and supply and demand for shares of the Fund. We cannot predict whether shares of the Fund will trade above, below or at their NAV. Trading on the Exchange, including trading of Fund shares, may be halted in certain circumstances and shareholders may not be able to sell Fund shares at the time or price desired. During periods of stressed market conditions, the market for the shares of the Fund may become less liquid in response to deteriorating liquidity in the markets for the Fund’s portfolio investments. This adverse effect on the liquidity of the Fund’s shares could lead to differences between the market price of the Fund’s shares and the NAV of those shares. There can be no assurance that the requirements of the Exchange to maintain the listing of shares of the Fund will continue to be met. At times, trading in the securities of ETFs has become volatile and unpredictable and the price of ETF shares has diverged from market driven fundamentals. Disruptions to creations and redemptions, the existence of significant market volatility or potential lack of an active trading market for the
shares of the Fund (including through a trading halt), as well as other factors, may result in the Fund’s shares trading on the Exchange significantly above (at a premium) or below (at a discount) to NAV or to the intraday value of the Fund’s holdings. Premiums and discounts relate to differences between the market price and NAV of the Fund’s shares. During such periods, you may incur significant losses if you sell your shares of the Fund.
The securities held by the Fund may be traded in markets that close at a different time than the Exchange and may trade outside of a collateralized settlement system. Liquidity in those securities may be reduced after the applicable closing times. Accordingly, during the time when the Exchange is open but after the applicable market closing, fixing or settlement times, bid-ask spreads for the Fund’s shares on the
Exchange and the corresponding premium or discount between the market price for Fund shares and their NAV may widen. Additionally, during times when the Exchange is open but after the applicable market is closed, there may be changes between the last quote from the closed foreign market and the value of such security during the Fund’s trading day on the Exchange and this may lead to differences between the market price of the Fund’s shares and the underlying value of those shares.
● Cost of Buying or Selling Shares: When you buy or sell shares of the Fund through a broker, you will likely incur a brokerage commission or other charges imposed by brokers. In addition, the market price of shares of the Fund, like the price of any exchange-traded security, includes a “bid-ask spread” charged by the market makers or other participants that trade the particular security. The spread of the Fund’s shares varies over time based on the Fund’s trading volume, the spread of the Fund’s underlying securities, and market liquidity and may increase if the Fund’s trading volume, the spread of the Fund’s underlying securities, or market liquidity decreases. In times of severe market disruption, including when trading of the Fund’s holdings may be halted, the bid-ask spread may increase significantly. This means that the shares may trade at a discount to the Fund’s NAV, and the discount is likely to be greatest during significant market volatility.
● No Guarantee of Active Trading Market Risk: While shares of the Fund are listed on the Exchange, there can be no assurance that active trading markets for the shares will develop or be maintained by market makers or by Authorized Participants. The distributor of the Fund’s shares does not maintain a secondary market in the shares.
Foreign Securities Risk: Investments in securities of non-U.S. issuers (including those denominated in U.S. dollars) may involve more risk than investing in securities of U.S. issuers. Foreign political, economic and legal systems, especially those in developing and emerging market countries, may be less stable and more volatile than in the United States. Foreign legal systems generally have fewer regulatory requirements than the U.S. legal system, particularly those of emerging markets. In general, less information is publicly available with respect to non-U.S. companies than U.S. companies. Non-U.S. companies generally are not subject to the same accounting, auditing, and financial reporting standards
| | |
| | PGIM Quant Solutions Strategic Alpha International Equity ETF 41 |
Notes to Financial Statements (continued)
as are U.S. companies. Additionally, the changing value of foreign currencies and changes in exchange rates could also affect the value of the assets the Fund holds and the Fund’s performance. Certain foreign countries may impose restrictions on the ability of issuers of foreign securities to make payment of principal and interest or dividends to investors located outside the country, due to blockage of foreign currency exchanges or otherwise. Investments in emerging markets are subject to greater volatility and price declines.
In addition, the Fund’s investments in non-U.S. securities may be subject to the risks of nationalization or expropriation of assets, imposition of currency exchange controls or restrictions on the repatriation of non-U.S. currency, confiscatory taxation and adverse diplomatic developments. Special U.S. tax considerations may apply.
Geographic Concentration Risk: The Fund’s performance may be closely tied to the market, economic, political, regulatory or other conditions in the countries or regions in which the Fund invests. This can result in more pronounced risks based upon conditions that impact one or more countries or regions more or less than other countries or regions.
Large Shareholder and Large Scale Redemption Risk: Certain individuals, accounts, funds (including funds affiliated with the Manager) or institutions, including the Manager and its affiliates, may from time to time own or control a substantial amount of the Fund’s shares. There is no requirement that these entities maintain their investment in the Fund. There is a risk that such large shareholders or that the Fund’s shareholders generally may redeem all or a substantial portion of their investments in the Fund in a short period of time, which could have a significant negative impact on the Fund’s NAV, liquidity, and brokerage costs. Large redemptions could also result in tax consequences to shareholders and impact the Fund’s ability to implement its investment strategy. The Fund’s ability to pursue its investment objective after one or more large scale redemptions may be impaired and, as a result, the Fund may invest a larger portion of its assets in cash or cash equivalents.
Management Risk: The value of your investment may decrease if judgments by the subadviser about the attractiveness, value or market trends affecting a particular security, industry or sector or about market movements are incorrect.
Market Capitalization Risk: The Fund may invest in companies of any market capitalization. Generally, the stock prices of small- and mid-cap companies are less stable than the prices of large-cap stocks and may present greater risks. Large capitalization companies as a group could fall out of favor with the market, causing the Fund to underperform compared to investments that focus on smaller capitalized companies.
Market Disruption and Geopolitical Risks: Market disruption can be caused by economic, financial or political events and factors, including but not limited to, international wars or
conflicts (including Russia’s military invasion of Ukraine), geopolitical developments (including trading and tariff arrangements, sanctions and cybersecurity attacks), instability in regions such as Asia, Eastern Europe and the Middle East, terrorism, natural disasters and public health epidemics (including the outbreak of COVID-19 globally).
The extent and duration of such events and resulting market disruptions cannot be predicted, but could be substantial and could magnify the impact of other risks to the Fund. These and other similar events could adversely affect the U.S. and foreign financial markets and lead to increased market volatility, reduced liquidity in the securities markets, significant negative impacts on issuers and the markets for certain securities and commodities and/or government intervention. They may also cause short- or long-term economic uncertainties in the United States and worldwide. As a result, whether or not the Fund invests in securities of issuers located in or with significant exposure to the countries directly affected, the value and liquidity of the Fund’s investments may be negatively impacted. Further, due to closures of certain markets and restrictions on trading certain securities, the value of certain securities held by the Fund could be significantly impacted, which could lead to such securities being valued at zero.
COVID-19 and the related governmental and public responses have had and may continue to have an impact on the Fund’s investments and net asset value and have led and may continue to lead to increased market volatility and the potential for illiquidity in certain classes of securities and sectors of the market. They have also had and may continue to result in periods of business disruption, business closures, inability to obtain raw materials, supplies and component parts, and reduced or disrupted operations for the issuers in which the Fund invests. The occurrence, reoccurrence and pendency of public health epidemics could adversely affect the economies and financial markets either in specific countries or worldwide.
Market Risk: Securities markets may be volatile and the market prices of the Fund’s securities may decline. Securities fluctuate in price based on changes in an issuer’s financial condition and overall market and economic conditions. If the market prices of the securities owned by the Fund fall, the value of your investment in the Fund will decline.
Model Design Risk: The subadviser uses certain quantitative models to help guide its investment decisions. The design of the underlying models may be flawed or incomplete. The investment models the subadviser uses are based on historical and theoretical underpinnings that it believes are sound. There can be no guarantee, however, that these underpinnings will correlate with security price behavior in the manner assumed by the subadviser’s models. Additionally, the quantitative techniques that underlie the subadviser’s portfolio construction processes may fail to fully anticipate important risks.
Model Implementation Risk: While the subadviser strives to mitigate the likelihood of material implementation errors, it is impossible to completely eliminate the risk of error in the implementation of the computer models that guide the subadviser’s quantitative
| | |
| | PGIM Quant Solutions Strategic Alpha International Equity ETF 43 |
Notes to Financial Statements (continued)
investment processes. Additionally, it may be difficult to implement model recommendations in volatile and rapidly changing market conditions.
Small Fund Risk: When the Fund’s size is small, the Fund may experience low trading volume and wide bid/ask spreads. The Fund may face the risk of being delisted if it does not meet certain conditions of the listing exchange due to small size. Any resulting liquidation of the Fund could cause the Fund to incur elevated transaction costs for the Fund and negative tax consequences for its shareholders.
Value Style Risk: Since the Fund may invest significantly in value stocks or use a value investment style, there is the risk that value stocks or the value style may be out of favor for long periods of time, that the market will not recognize a security’s intrinsic value for a long time or at all, or that a stock judged to be undervalued may actually be appropriately priced or overvalued. Issuers of value stocks may have experienced adverse business developments or may be subject to special risks that have caused the stock to be out of favor. In addition, the Fund’s value investment style may go out of favor with investors, negatively affecting the Fund’s performance. If the Fund’s assessment of market conditions or a company’s value is inaccurate, the Fund could suffer losses or produce poor performance relative to other funds.
Report of Independent Registered Public Accounting Firm
To the Board of Trustees of PGIM ETF Trust and Shareholders of PGIM Quant Solutions Strategic Alpha International Equity ETF
Opinion on the Financial Statements
We have audited the accompanying statement of assets and liabilities, including the schedule of investments, of PGIM Quant Solutions Strategic Alpha International Equity ETF (the “Fund”) as of August 31, 2022, the related statement of operations for the year ended August 31, 2022, the statements of changes in net assets for each of the two years in the period ended August 31, 2022, including the related notes, and the financial highlights for each of the two years in the period ended August 31, 2022 (collectively referred to as the “financial statements”). In our opinion, the financial statements present fairly, in all material respects, the financial position of the Fund as of August 31, 2022, the results of its operations for the year then ended, the changes in its net assets and the financial highlights for each of the two years in the period ended August 31, 2022 in conformity with accounting principles generally accepted in the United States of America.
The financial statements of the Fund as of and for the year ended August 31, 2020 and the financial highlights for each of the periods ended on or prior to August 31, 2020 (not presented herein, other than the financial highlights) were audited by other auditors whose report dated October 15, 2020 expressed an unqualified opinion on those financial statements and financial highlights.
Basis for Opinion
These financial statements are the responsibility of the Fund’s management. Our responsibility is to express an opinion on the Fund’s financial statements based on our audits. We are a public accounting firm registered with the Public Company Accounting Oversight Board (United States) (PCAOB) and are required to be independent with respect to the Fund in accordance with the U.S. federal securities laws and the applicable rules and regulations of the Securities and Exchange Commission and the PCAOB.
We conducted our audits of these financial statements in accordance with the standards of the PCAOB. Those standards require that we plan and perform the audit to obtain reasonable assurance about whether the financial statements are free of material misstatement, whether due to error or fraud.
Our audits included performing procedures to assess the risks of material misstatement of the financial statements, whether due to error or fraud, and performing procedures that respond to those risks. Such procedures included examining, on a test basis, evidence regarding the amounts and disclosures in the financial statements. Our audits also included evaluating the accounting principles used and significant estimates made by management, as well as evaluating the overall presentation of the financial statements. Our procedures included confirmation of securities owned as of August 31, 2022 by correspondence with the custodian and transfer agent. We believe that our audits provide a reasonable basis for our opinion.
/s/PricewaterhouseCoopers LLP
New York, New York
October 26, 2022
We have served as the auditor of one or more investment companies in the PGIM Retail Funds complex since 2020.
| | |
| | PGIM Quant Solutions Strategic Alpha International Equity ETF 45 |
Tax Information (unaudited)
We are advising you that during the year ended August 31, 2022, the Fund reports the maximum amount allowed per share, but not less than $.20 for Class Z shares as a capital gain distribution in accordance with Section 852(b)(3)(C) of the Internal Revenue Code.
For the year ended August 31, 2022, the Fund reports, the maximum amount allowable under Section 854 of the Internal Revenue Code, but not less than, the following percentage of the ordinary income dividends paid as qualified dividend income (QDI):
| | |
| | |
| Fund | | QDI |
| |
PGIM Quant Solutions Strategic Alpha International Equity ETF | | 37.98% |
For the year ended August 31, 2022, the Fund made an election to pass through the maximum amount of the portion of the ordinary income dividends paid derived from foreign source income as well as any foreign taxes paid by the Fund in accordance with Section 853 of the Internal Revenue Code of the following amounts: $110,138 foreign tax credit from recognized foreign source income of $1,136,411.
In January 2023, you will be advised on IRS Form 1099-DIV or substitute 1099-DIV as to the federal tax status of dividends received by you in calendar year 2021.
Liquidity Risk Management Program (unaudited)
Consistent with Rule 22e-4 under the 1940 Act (the “Liquidity Rule”), the Fund has adopted and implemented a liquidity risk management program (the “LRMP”). The Fund’s LRMP seeks to assess and manage the Fund’s liquidity risk, which is defined as the risk that the Fund is unable to meet investor redemption requests without significantly diluting the remaining investors’ interests in the Fund. The Board has approved PGIM Investments LLC (“PGIM Investments”), the Fund’s investment manager, to serve as the administrator of the Fund’s LRMP. As part of its responsibilities as administrator, PGIM Investments has retained a third party to perform certain functions, including providing market data and liquidity classification model information.
The Fund’s LRMP includes a number of processes designed to support the assessment and management of its liquidity risk. In particular, the Fund’s LRMP includes no less than annual assessments of factors that influence the Fund’s liquidity risk; no less than monthly classifications of the Fund’s investments into one of four liquidity classifications provided for in the Liquidity Rule; a 15% of net assets limit on the acquisition of “illiquid investments” (as defined under the Liquidity Rule); establishment of a minimum percentage of the Fund’s assets to be invested in investments classified as “highly liquid” (as defined under the Liquidity Rule) if the Fund does not invest primarily in highly liquid investments; and regular reporting to the Board.
At a meeting of the Board on March 1-3, 2022, PGIM Investments provided a written report (“LRMP Report”) to the Board addressing the operation, adequacy, and effectiveness of the Fund’s LRMP, including any material changes to the LRMP for the period from January 1, 2021 through December 31, 2021 (“Reporting Period”). The LRMP Report concluded that the Fund’s LRMP was reasonably designed to assess and manage the Fund’s liquidity risk and was adequately and effectively implemented during the Reporting Period. There were no material changes to the LRMP during the Reporting Period. The LRMP Report further concluded that the Fund’s investment strategies continue to be appropriate given the Fund’s status as an open-end fund.
There can be no assurance that the LRMP will achieve its objectives in the future. Additional information regarding risks of investing in the Fund, including liquidity risks presented by the Fund’s investment portfolio, is found in the Fund’s Prospectus and Statement of Additional Information.
| | |
| | PGIM Quant Solutions Strategic Alpha International Equity ETF |
INFORMATION ABOUT BOARD MEMBERS AND OFFICERS (unaudited)
Information about Board Members and Officers of the Funds is set forth below. Board Members who are not deemed to be “interested persons” of the Funds, as defined in the 1940 Act, are referred to as “Independent Board Members.” Board Members who are deemed to be “interested persons” of the Funds are referred to as “Interested Board Members.” The Board Members are responsible for the overall supervision of the operations of the Funds and perform the various duties imposed on the directors of investment companies by the 1940 Act. The Board in turn elects the Officers, who are responsible for administering the day-to-day operations of the Funds.
| | | | | | |
| |
| Independent Board Members |
| | | | |
Name Year of Birth Position(s)
Portfolios Overseen | | Principal Occupation(s) During Past Five Years | | Other Directorships Held During Past Five Years | | Length of Board Service |
| | | | |
Ellen S. Alberding 1958 Board Member Portfolios Overseen: 97 | | President and Board Member, The Joyce Foundation (charitable foundation) (since 2002); formerly Vice Chair, City Colleges of Chicago (community college system) (2011-2015); Trustee, National Park Foundation (charitable foundation for national park system) (2009-2018); Trustee, Economic Club of Chicago (2009-2016); Trustee, Loyola University (since 2018). | | None. | | Since September 2013 |
| | | | |
Kevin J. Bannon 1952 Board Member Portfolios Overseen: 97 | | Retired; formerly Managing Director (April 2008-May 2015) and Chief Investment Officer (October 2008-November 2013) of Highmount Capital LLC (registered investment adviser); formerly Executive Vice President and Chief Investment Officer (April 1993-August 2007) of Bank of New York Company; President (May 2003-May 2007) of BNY Hamilton Family of Mutual Funds. | | Director of Urstadt Biddle Properties (equity real estate investment trust) (since September 2008). | | Since July 2008 |
| | |
| | PGIM Quant Solutions Strategic Alpha International Equity ETF |
| | | | | | |
| |
| Independent Board Members |
| | | | |
Name Year of Birth
Position(s) Portfolios Overseen | | Principal Occupation(s) During Past Five Years | | Other Directorships Held During Past Five Years | | Length of Board Service |
| | | | |
Linda W. Bynoe 1952 Board Member Portfolios Overseen: 94 | | President and Chief Executive Officer (since March 1995) and formerly Chief Operating Officer (December 1989-February 1995) of Telemat Limited LLC (formerly Telemat Ltd) (management consulting); formerly Vice President (January 1985-June 1989) at Morgan Stanley & Co. (broker-dealer). | | Trustee of Equity Residential (residential real estate) (since December 2009); Director of Northern Trust Corporation (financial services) (since April 2006); formerly Director of Anixter International, Inc. (communication products distributor) (January 2006-June 2020). | | Since March 2005 |
| | | | |
Barry H. Evans 1960 Board Member Portfolios Overseen: 96 | | Retired; formerly President (2005-2016), Global Chief Operating Officer (2014-2016), Chief Investment Officer - Global Head of Fixed Income (1998-2014), and various portfolio manager roles (1986-2006), Manulife Asset Management (asset management). | | Formerly Director, Manulife Trust Company (2011-2018); formerly Director, Manulife Asset Management Limited (2015-2017); formerly Chairman of the Board of Directors of Manulife Asset Management U.S. (2005-2016); formerly Chairman of the Board, Declaration Investment Management and Research (2008-2016). | | Since September 2017 |
| | | | |
Keith F. Hartstein 1956 Board Member & Independent Chair Portfolios Overseen: 97 | | Retired; Member (November 2014- September 2022) of the Governing Council of the Independent Directors Council (IDC) (organization of independent mutual fund directors); formerly Executive Committee of the IDC Board of Governors (October 2019-December 2021); formerly President and Chief Executive Officer (2005-2012), Senior Vice President (2004-2005), Senior Vice President of Sales and Marketing (1997-2004), and various executive management positions (1990-1997), John Hancock Funds, LLC (asset management); Chairman, Investment Company Institute’s Sales Force Marketing Committee (2003-2008). | | None. | | Since September 2013 |
| | |
| Visit our website at pgim.com/investments | | |
| | | | | | |
| |
| Independent Board Members |
| | | | |
Name Year of Birth
Position(s) Portfolios Overseen | | Principal Occupation(s) During Past Five Years | | Other Directorships Held During Past Five Years | | Length of Board Service |
| | | | |
Laurie Simon Hodrick 1962 Board Member Portfolios Overseen: 93 | | A. Barton Hepburn Professor Emerita of Economics in the Faculty of Business, Columbia Business School (since 2018); Visiting Fellow at the Hoover Institution, Stanford University (since 2015); Sole Member, ReidCourt LLC (since 2008) (a consulting firm); formerly Visiting Professor of Law, Stanford Law School (2015-2021); formerly A. Barton Hepburn Professor of Economics in the Faculty of Business, Columbia Business School (1996-2017); formerly Managing Director, Global Head of Alternative Investment Strategies, Deutsche Bank (2006-2008). | | Independent Director, Andela (since January 2022) (global talent network); Independent Director, Roku (since December 2020) (communication services); formerly Independent Director, Synnex Corporation (2019-2021) (information technology); formerly Independent Director, Kabbage, Inc. (2018-2020) (financial services); formerly Independent Director, Corporate Capital Trust (2017-2018) (a business development company). | | Since September 2017 |
| | | | |
Brian K. Reid 1961 Board Member Portfolios Overseen: 96 | | Retired; formerly Chief Economist for the Investment Company Institute (ICI) (2005-2017); formerly Senior Economist and Director of Industry and Financial Analysis at the ICI (1998-2004); formerly Senior Economist, Industry and Financial Analysis at the ICI (1996-1998); formerly Staff Economist at the Federal Reserve Board (1989-1996); Director, ICI Mutual Insurance Company (2012-2017). | | None. | | Since March 2018 |
| | |
| | PGIM Quant Solutions Strategic Alpha International Equity ETF |
| | | | | | |
| |
| Independent Board Members |
| | | | |
Name Year of Birth Position(s) Portfolios Overseen | | Principal Occupation(s) During Past Five Years | | Other Directorships Held During Past Five Years | | Length of Board Service |
| | | | |
Grace C. Torres 1959 Board Member Portfolios Overseen: 96 | | Retired; formerly Treasurer and Principal Financial and Accounting Officer of the PGIM Funds, Target Funds, Advanced Series Trust, Prudential Variable Contract Accounts and The Prudential Series Fund (1998-June 2014); Assistant Treasurer (March 1999-June 2014) and Senior Vice President (September 1999-June 2014) of PGIM Investments LLC; Assistant Treasurer (May 2003-June 2014) and Vice President (June 2005-June 2014) of AST Investment Services, Inc.; Senior Vice President and Assistant Treasurer (May 2003-June 2014) of Prudential Annuities Advisory Services, Inc. | | Director (since January 2018) of OceanFirst Financial Corp. and OceanFirst Bank; formerly Director (July 2015-January 2018) of Sun Bancorp, Inc. N.A. and Sun National Bank. | | Since November 2014 |
| | |
| Visit our website at pgim.com/investments | | |
| | | | | | |
| |
| Interested Board Members |
| | | | |
Name Year of Birth Position(s) Portfolios Overseen | | Principal Occupation(s) During Past Five Years | | Other Directorships Held During Past Five Years | | Length of
Board Service |
| | | | |
Stuart S. Parker 1962 Board Member & President Portfolios Overseen: 96 | | President, Chief Executive Officer, Chief Operating Officer and Officer in Charge of PGIM Investments LLC (formerly known as Prudential Investments LLC) (since January 2012); President and PEO (since September 2022) of the PGIM Private Credit Fund, President and PEO (since March 2022) of the PGIM Private Real Estate Fund, Inc.; formerly Executive Vice President of Jennison Associates LLC and Head of Retail Distribution of PGIM Investments LLC (June 2005-December 2011); Investment Company Institute - Board of Governors (since May 2012). | | None. | | Since January 2012 |
| | | | |
Scott E. Benjamin 1973 Board Member & Vice President Portfolios Overseen: 97 | | Executive Vice President (since May 2009) of PGIM Investments LLC; Vice President (since June 2012) of Prudential Investment Management Services LLC; Executive Vice President (since September 2009) of AST Investment Services, Inc.; Senior Vice President of Product Development and Marketing, PGIM Investments (since February 2006); Vice President (since September 2022) of the PGIM Private Credit Fund, Vice President (since March 2022) of the PGIM Private Real Estate Fund, Inc.; formerly Vice President of Product Development and Product Management, PGIM Investments LLC (2003-2006). | | None. | | Since March 2010 |
| | |
| | PGIM Quant Solutions Strategic Alpha International Equity ETF |
| | | | |
| |
| Fund Officers(a) |
| | | |
Name Year of Birth Fund Position | | Principal Occupation(s) During Past Five Years | | Length of Service as Fund Officer |
| | | |
Claudia DiGiacomo 1974 Chief Legal Officer | | Chief Legal Officer, Executive Vice President and Secretary of PGIM Investments LLC (since August 2020); Chief Legal Officer of Prudential Mutual Fund Services LLC (since August 2020); Chief Legal Officer of PIFM Holdco, LLC (since August 2020); Chief Legal Officer (since September 2022) of the PGIM Private Credit Fund, Chief Legal Officer (since March 2022) of the PGIM Private Real Estate Fund, Inc.; Vice President and Corporate Counsel (since January 2005) of Prudential; and Corporate Counsel of AST Investment Services, Inc. (since August 2020); formerly Vice President and Assistant Secretary of PGIM Investments LLC (2005-2020); formerly Associate at Sidley Austin Brown & Wood LLP (1999-2004). | | Since December 2005 |
| | | |
Isabelle Sajous 1976 Chief Compliance Officer | | Chief Compliance Officer (since April 2022) of PGIM Investments LLC, the PGIM Funds, Target Funds, PGIM ETF Trust, PGIM Global High Yield Fund, Inc., PGIM High Yield Bond Fund, Inc., PGIM Short Duration High Yield Opportunities Fund, Advanced Series Trust, The Prudential Series Fund and Prudential’s Gibraltar Fund, Inc.; Chief Compliance Officer (since March 2022) of the PGIM Private Real Estate Fund, Inc.; Chief Compliance Officer (since September 2022) of the PGIM Private Credit Fund; Vice President, Compliance of PGIM Investments LLC (since December 2020); formerly Director, Compliance (July 2018-December 2020) of Credit Suisse Asset Management LLC; and Vice President, Associate General Counsel & Deputy Chief Compliance Officer of Cramer Rosenthal McGlynn, LLC (August 2014-July 2018). | | Since April 2022 |
| | | |
Andrew R. French 1962 Secretary | | Vice President (since December 2018) of PGIM Investments LLC; formerly Vice President and Corporate Counsel (2010-2018) of Prudential; Secretary (since September 2022) of the PGIM Private Credit Fund, Secretary (since March 2022) of the PGIM Private Real Estate Fund, Inc.; formerly Director and Corporate Counsel (2006-2010) of Prudential; Vice President and Assistant Secretary (since January 2007) of PGIM Investments LLC; Vice President and Assistant Secretary (since January 2007) of Prudential Mutual Fund Services LLC. | | Since October 2006 |
| | | |
Melissa Gonzalez 1980 Assistant Secretary | | Vice President and Corporate Counsel (since September 2018) of Prudential; Vice President and Assistant Secretary (since August 2020) of PGIM Investments LLC; Assistant Secretary (since September 2022) of the PGIM Private Credit Fund, Assistant Secretary (since March 2022) of the PGIM Private Real Estate Fund, Inc.; formerly Director and Corporate Counsel (March 2014-September 2018) of Prudential. | | Since March 2020 |
| | |
| Visit our website at pgim.com/investments | | |
| | | | |
| |
| Fund Officers(a) |
| | | |
Name Year of Birth Fund Position | | Principal Occupation(s) During Past Five Years | | Length of Service as Fund
Officer |
| | | |
Patrick E. McGuinness 1986 Assistant Secretary | | Vice President and Assistant Secretary (since August 2020) of PGIM Investments LLC; Director and Corporate Counsel (since February 2017) of Prudential; Assistant Secretary (since September 2022) of the PGIM Private Credit Fund, Assistant Secretary (since March 2022) of the PGIM Private Real Estate Fund, Inc. | | Since June 2020 |
| | | |
Debra Rubano 1975 Assistant Secretary | | Vice President and Corporate Counsel (since November 2020) of Prudential; Assistant Secretary (since March 2022) of the PGIM Private Real Estate Fund, Inc; Assistant Secretary (since September 2022) of the PGIM Private Credit Fund; formerly Director and Senior Counsel of Allianz Global Investors U.S. Holdings LLC (2010-2020) and Assistant Secretary of numerous funds in the Allianz fund complex (2015-2020). | | Since December 2020 |
| | | |
Christian J. Kelly 1975 Treasurer and Principal Financial and Accounting Officer | | Vice President, Head of Fund Administration of PGIM Investments LLC (since November 2018); Principal Financial Officer (since September 2022) of the PGIM Private Credit Fund; Principal Financial Officer (since March 2022) of the PGIM Private Real Estate Fund, Inc.; formerly, Treasurer and Principal Accounting Officer (March 2022- July 2022) of the PGIM Private Real Estate Fund, Inc.; formerly Director of Fund Administration of Lord Abbett & Co. LLC (2009-2018), Treasurer and Principal Accounting Officer of the Lord Abbett Family of Funds (2017-2018); Director of Accounting, Avenue Capital Group (2008-2009); Senior Manager, Investment Management Practice of Deloitte & Touche LLP (1998-2007). | | Since January 2019 |
| | | |
Lana Lomuti 1967 Assistant Treasurer | | Vice President (since 2007) and Director (2005-2007), within PGIM Investments Fund Administration; formerly Assistant Treasurer (December 2007-February 2014) of The Greater China Fund, Inc. | | Since April 2014 |
| | | |
Russ Shupak 1973 Assistant Treasurer | | Vice President (since 2017) and Director (2013-2017), within PGIM Investments Fund Administration; Assistant Treasurer (since September 2022) of the PGIM Private Credit Fund, Treasurer and Principal Accounting Officer (since July 2022) of the PGIM Private Real Estate Fund, Inc.; formerly Assistant Treasurer (March 2022 – July 2022) of the PGIM Private Real Estate Fund, Inc. | | Since October 2019 |
| | | |
Deborah Conway 1969 Assistant Treasurer | | Vice President (since 2017) and Director (2007-2017), within PGIM Investments Fund Administration. | | Since October 2019 |
| | | |
Elyse M. McLaughlin 1974 Assistant Treasurer | | Vice President (since 2017) and Director (2011-2017), within PGIM Investments Fund Administration; Treasurer and Principal Accounting Officer (since September 2022) of the PGIM Private Credit Fund, Assistant Treasurer (since March 2022) of the PGIM Private Real Estate Fund, Inc. | | Since October 2019 |
| | |
| | PGIM Quant Solutions Strategic Alpha International Equity ETF |
| | | | |
| |
| Fund Officers(a) |
| | | |
Name Year of Birth Fund Position | | Principal Occupation(s) During Past Five Years | | Length of Service as Fund Officer |
| | | |
Kelly Florio 1978 Anti-Money Laundering Compliance Officer | | Vice President, Corporate Compliance, Global Compliance Programs and Compliance Risk Management (since December 2021) of Prudential; formerly, Head of Fraud Risk Management (October 2019 to December 2021) at New York Life Insurance Company; formerly, Head of Key Risk Area Operations (November 2018 to October 2019), Director of the US Anti-Money Laundering Compliance Unit (2009-2018) and Bank Loss Prevention Associate (2006 -2009) at MetLife. | | Since June 2022 |
(a) Excludes Mr. Parker and Mr. Benjamin, interested Board Members who also serve as President and Vice President, respectively.
Explanatory Notes to Tables:
| ∎ | | Board Members are deemed to be “Interested,” as defined in the 1940 Act, by reason of their affiliation with PGIM Investments LLC and/or an affiliate of PGIM Investments LLC. |
| ∎ | | Unless otherwise noted, the address of all Board Members and Officers is c/o PGIM Investments LLC, 655 Broad Street, Newark, New Jersey 07102-4410. |
| ∎ | | There is no set term of office for Board Members or Officers. The Board Members have adopted a retirement policy, which calls for the retirement of Board Members on December 31 of the year in which they reach the age of 75. |
| ∎ | | “Other Directorships Held” includes all directorships of companies required to register or file reports with the SEC under the 1934 Act (that is, “public companies”) or other investment companies registered under the 1940 Act. |
| ∎ | | “Portfolios Overseen” includes all investment companies managed by PGIM Investments LLC. The investment companies for which PGIM Investments LLC serves as manager include the PGIM Mutual Funds, Target Funds, The Prudential Variable Contract Accounts, PGIM ETF Trust, PGIM Private Real Estate Fund, Inc., PGIM Private Credit Fund, PGIM High Yield Bond Fund, Inc., PGIM Global High Yield Fund, Inc., PGIM Short Duration High Yield Opportunities Fund, The Prudential Series Fund, Prudential’s Gibraltar Fund, Inc. and the Advanced Series Trust. |
| ∎ | | As used in the Fund Officers table “Prudential” means The Prudential Insurance Company of America. |
| | |
| Visit our website at pgim.com/investments | | |
Approval of Advisory Agreements (unaudited)
The Fund’s Board of Trustees
The Board of Trustees (the “Board”) of PGIM Quant Solutions Strategic Alpha International Equity ETF (the “Fund”)1 consists of ten individuals, eight of whom are not “interested persons” of the Fund, as defined in the Investment Company Act of 1940, as amended (the “1940 Act”) (the “Independent Trustees”). The Board is responsible for the oversight of the Fund and its operations, and performs the various duties imposed on the Trustees of investment companies by the 1940 Act. The Independent Trustees have retained independent legal counsel to assist them in connection with their duties. The Chair of the Board is an Independent Director. The Board has established five standing committees: the Audit Committee, the Nominating and Governance Committee, the Compliance Committee and two Investment Committees. Each committee is chaired by, and composed of, Independent Trustees.
Annual Approval of the Fund’s Advisory Agreements
As required under the 1940 Act, the Board determines annually whether to renew the Fund’s management agreement with PGIM Investments LLC (“PGIM Investments”) and the Fund’s subadvisory agreement with PGIM Quantitative Solutions LLC (“PGIM Quantitative Solutions”). In considering the renewal of the agreements, the Board, including all of the Independent Trustees, met on May 26 and June 7-9, 2022 (the “Board Meeting”) and approved the renewal of the agreements through July 31, 2023, after concluding that the renewal of the agreements was in the best interests of the Fund and its shareholders.
In advance of the meetings, the Board requested and received materials relating to the agreements, and had the opportunity to ask questions and request further information in connection with its consideration. Among other things, the Board considered comparative fee information from PGIM Investments and PGIM Quantitative Solutions. Also, the Board considered comparisons with other mutual funds in relevant Peer Universes and Peer Groups, as is further discussed below.
In approving the agreements, the Board, including the Independent Trustees advised by independent legal counsel, considered the factors it deemed relevant, including the nature, quality and extent of services provided by PGIM Investments, the subadviser and, as relevant, its affiliates, the performance of the Fund, the profitability of PGIM Investments and its affiliates, expenses and fees, and the potential for economies of scale that may be shared with the Fund and its shareholders as the Fund’s assets grow. In their deliberations, the Trustees did not identify any single factor which alone was responsible for the Board’s decision to approve the agreements with respect to the Fund. In connection with its deliberations, the Board considered information provided by PGIM Investments throughout the year at regular Board meetings, presentations from portfolio managers and other information, as well as information furnished at or in advance of the Board Meeting.
| 1 | PGIM Quant Solutions Strategic Alpha International Equity ETF is a series of PGIM ETF Trust. |
| | |
| | PGIM Quant Solutions Strategic Alpha International Equity ETF |
Approval of Advisory Agreements (continued)
The Trustees determined that the overall arrangements between the Fund and PGIM Investments, which serves as the Fund’s investment manager pursuant to a management agreement, and between PGIM Investments and PGIM Quantitative Solutions, which serves as the Fund’s subadviser pursuant to the terms of a subadvisory agreement with PGIM Investments, are in the best interests of the Fund and its shareholders in light of the services performed, fees charged and such other matters as the Trustees considered relevant in the exercise of their business judgment.
The material factors and conclusions that formed the basis for the Trustees’ reaching their determinations to approve the continuance of the agreements are separately discussed below.
Nature, Quality and Extent of Services
The Board received and considered information regarding the nature, quality and extent of services provided to the Fund by PGIM Investments and, PGIM Quantitative Solutions. The Board noted that PGIM Quantitative Solutions is affiliated with PGIM Investments. The Board considered the services provided by PGIM Investments, including but not limited to the oversight of the subadviser for the Fund, as well as the provision of fund recordkeeping, compliance and other services to the Fund, and PGIM Investments’ role as administrator of the Fund’s liquidity risk management program. With respect to PGIM Investments’ oversight of the subadviser, the Board noted that PGIM Investments’ Strategic Investment Research Group (“SIRG”), which is a business unit of PGIM Investments, is responsible for monitoring and reporting to PGIM Investments’ senior management on the performance and operations of the subadviser. The Board also considered that PGIM Investments pays the salaries of all of the officers and interested Trustees of the Fund who are part of Fund management. The Board also considered the investment subadvisory services provided by PGIM Quantitative Solutions, including investment research and security selection, as well as adherence to the Fund’s investment restrictions and compliance with applicable Fund policies and procedures. The Board considered PGIM Investments’ evaluation of the subadviser, as well as PGIM Investments’ recommendation, based on its review of the subadviser, to renew the subadvisory agreement.
The Board considered the qualifications, backgrounds and responsibilities of PGIM Investments’ senior management responsible for the oversight of the Fund and PGIM Quantitative Solutions, and also considered the qualifications, backgrounds and responsibilities of PGIM Quantitative Solutions’ portfolio managers who are responsible for the day-to-day management of the Fund’s portfolio. The Board was provided with information pertaining to PGIM Investments’ and PGIM Quantitative Solutions’ organizational structure, senior management, investment operations, and other relevant information pertaining to PGIM Investments and PGIM Quantitative Solutions. The Board also noted that it received favorable compliance reports from the Fund’s Chief Compliance Officer (“CCO”) as to PGIM Investments and PGIM Quantitative Solutions.
| | |
| Visit our website at pgim.com/investments | | |
The Board concluded that it was satisfied with the nature, extent and quality of the investment management services provided by PGIM Investments, and the subadvisory services provided to the Fund by PGIM Quantitative Solutions, and that there was a reasonable basis on which to conclude that the Fund benefits from the services provided by PGIM Investments and PGIM Quantitative Solutions under the management, subadvisory agreement.
Costs of Services and Profits Realized by PGIM Investments
The Board was provided with information on the profitability of PGIM Investments and its affiliates in serving as the Fund’s investment manager. The Board discussed with PGIM Investments the methodology utilized in assembling the information regarding profitability and considered its reasonableness. The Board recognized that it is difficult to make comparisons of profitability from fund management contracts because comparative information is not generally publicly available and is affected by numerous factors, including the structure of the particular adviser, the types of funds it manages, its business mix, numerous assumptions regarding allocations and the adviser’s capital structure and cost of capital. Taking these factors into account, the Board concluded that the profitability of PGIM Investments and its affiliates in relation to the services rendered was not unreasonable.
Economies of Scale
The Board received and discussed information concerning economies of scale that PGIM Investments may realize as the Fund’s assets grow beyond current levels. During the course of time, the Board has considered information regarding the launch date of the Fund, the management fees of the Fund compared to those of similarly managed funds and PGIM Investments’ investment in the Fund over time. The Board noted that economies of scale can be shared with the Fund in other ways, including low management fees from inception, additional technological and personnel investments to enhance shareholder services, and maintaining existing expense structures in the face of a rising cost environment. The Board also considered PGIM Investments’ assertion that it continually evaluates the management fee schedule of the Fund and the potential to share economies of scale through breakpoints or fee waivers as asset levels increase.
The Board recognized the inherent limitations of any analysis of economies of scale, stemming largely from the Board’s understanding that most of PGIM Investments’ costs are not specific to individual funds, but rather are incurred across a variety of products and services.
Other Benefits to PGIM Investments, and PGIM Quantitative Solutions
The Board considered potential ancillary benefits that might be received by PGIM Investments, PGIM Quantitative Solutions and their affiliates as a result of their relationship with the Fund. The Board concluded that potential benefits to be derived by PGIM Investments included transfer agency fees received by the Fund’s transfer agent (which is affiliated with PGIM Investments), as well as benefits to its reputation or other intangible benefits resulting from PGIM Investments’ association with the Fund. The
| | |
| | PGIM Quant Solutions Strategic Alpha International Equity ETF |
Approval of Advisory Agreements (continued)
Board concluded that the potential benefits to be derived by PGIM Quantitative Solutions included the ability to use soft dollar credits, as well as the potential benefits consistent with those generally resulting from an increase in assets under management, specifically, potential access to additional research resources and benefits to its reputation. The Board concluded that the benefits derived by PGIM Investments and PGIM Quantitative Solutions were consistent with the types of benefits generally derived by investment managers and subadvisers to mutual funds.
Performance of the Fund / Fees and Expenses
The Board considered certain additional factors and made related conclusions relating to the historical performance of the Fund for the one-year period ended December 31, 2021. The Board considered that the Fund commenced operations in Q4 of 2018 and that longer-term performance was not yet available.
The Board also considered the Fund’s actual management fee, as well as the Fund’s net total expense ratio, for the fiscal year ended August 31, 2021. The Board considered the management fee for the Fund as compared to the management fee charged by PGIM Investments to other funds and the fee charged by other advisers to comparable mutual funds in a Peer Group. The actual management fee represents the fee rate actually paid by Fund shareholders and includes any fee waivers or reimbursements. The net total expense ratio for the Fund represents the actual expense ratio incurred by Fund shareholders.
The mutual funds included in the Peer Universe, which was used to consider performance, and the Peer Group, which was used to consider expenses and fees, were objectively determined by Broadridge, an independent provider of mutual fund data. In certain circumstances, PGIM Investments also provided supplemental Peer Universe or Peer Group information for reasons addressed with the Board. The comparisons placed the Fund in various quartiles over various periods, with the first quartile being the best 25% of the mutual funds (for performance, the best performing mutual funds and, for expenses, the lowest cost mutual funds).
The section below summarizes key factors considered by the Board and the Board’s conclusions regarding the Fund’s performance, fees and overall expenses. The table sets forth net performance comparisons (which reflect the impact on performance of fund expenses, or any subsidies, expense caps or waivers that may be applicable) with the Peer Universe, actual management fees with the Peer Group (which reflect the impact of any subsidies or fee waivers), and net total expenses with the Peer Group, each of which were key factors considered by the Board.
| | |
| Visit our website at pgim.com/investments | | |
| | | | | | | | |
| | | | | |
Net Performance | | 1 Year | | 3 Years | | 5 Years | | 10 Years |
| | | | | |
| | | 3rd Quartile | | 4th Quartile | | N/A | | N/A |
| | | |
Actual Management Fees: 1st Quartile | | | | |
| | |
Net Total Expenses: 1st Quartile | | |
| | · | | The Board noted that the Fund underperformed its benchmark index over the one-and three-year periods. |
| | · | | The Board considered PGIM Investments assertions that the Fund’s bias towards small cap stocks detracted from relative results, but that PGIM Investments expects a recovery for small cap stocks to drive a performance improvement for the Fund. |
| | · | | The Board also considered that the Fund outperformed its peer group for the first quarter of 2022. |
| | · | | The Board noted PGIM Investments’ commitment to taking actions to address performance. |
| | · | | The Board and PGIM Investments agreed to retain the Fund’s existing contractual fee waiver, pursuant to which PGIM Investments waives any management fees it receives from the Fund in an amount equal to the subadvisory fees paid by the Fund to the PGIM Institutional Money Market Fund. |
| | · | | The Board concluded that, in light of the above, it would be in the best interests of the Fund and its shareholders to continue to allow the Fund to create a longer-term performance record, and to renew the agreements. |
| | · | | The Board concluded that the management fees (including subadvisory fees) and total expenses were reasonable in light of the services provided. |
* * *
After full consideration of these factors, the Board concluded that approval of the agreements was in the best interests of the Fund and its shareholders.
| | |
| | PGIM Quant Solutions Strategic Alpha International Equity ETF |
| | | | |
| | | |
⬛ MAIL �� 655 Broad Street Newark, NJ 07102 | | ⬛ TELEPHONE (800) 225-1852 | | ⬛ WEBSITE pgim.com/investments |
|
| |
PROXY VOTING The Board of Trustees delegated to the Fund’s subadviser the responsibility for voting any proxies and maintaining proxy recordkeeping with respect to the Fund. A description of these proxy voting policies and procedures is available without charge, upon request, by calling (800) 225-1852 or by visiting the Securities and Exchange Commission’s website at sec.gov. Information regarding how the Fund voted proxies relating to portfolio securities during the most recent 12-month period ended June 30 is available on the Fund’s website and on the Securities and Exchange Commission’s website. |
|
| |
TRUSTEES Ellen S. Alberding · Kevin J. Bannon · Scott E. Benjamin · Linda W. Bynoe · Barry H. Evans · Keith F. Hartstein · Laurie Simon Hodrick · Stuart S. Parker · Brian K. Reid · Grace C. Torres |
|
| |
OFFICERS Stuart S. Parker, President · Scott E. Benjamin, Vice President · Christian J. Kelly, Treasurer and Principal Financial and Accounting Officer ·
Claudia DiGiacomo, Chief Legal Officer · Isabelle Sajous, Chief Compliance Officer · Kelly Florio, Anti-Money Laundering Compliance Officer ·
Andrew R. French, Secretary · Melissa Gonzalez, Assistant Secretary · Kelly A. Coyne, Assistant Secretary · Patrick E. McGuinness, Assistant
Secretary · Debra Rubano, Assistant Secretary · Lana Lomuti, Assistant Treasurer · Russ Shupak, Assistant Treasurer · Elyse M. McLaughlin,
Assistant Treasurer · Deborah Conway, Assistant Treasurer |
| | | | |
| MANAGER | | PGIM Investments LLC | | 655 Broad Street Newark, NJ 07102 |
| | |
| SUBADVISER | | PGIM Quantitative Solutions LLC | | Gateway Center Two 100 Mulberry Street Newark, NJ 07102 |
| | |
| DISTRIBUTOR | | Prudential Investment Management Services LLC | | 655 Broad Street Newark, NJ 07102 |
| | |
| CUSTODIAN/TRANSFER AGENT | | The Bank of New York Mellon | | 240 Greenwich Street New York, NY 10286 |
| | |
| INDEPENDENT REGISTERED PUBLIC ACCOUNTING FIRM | | PricewaterhouseCoopers LLP | | 300 Madison Avenue New York, NY 10017 |
| | |
| FUND COUNSEL | | Willkie Farr & Gallagher LLP | | 787 Seventh Avenue New York, NY 10019 |
|
An investor should consider the investment objectives, risks, charges, and expenses of the Funds carefully before investing. The prospectus and summary prospectus contain this and other information about the Fund. An investor may obtain the prospectus and summary prospectus for the Fund by visiting our website at pgim.com/investments or by calling (800) 225-1852. The prospectus and summary prospectus for the Fund should be read carefully before investing. |
|
E-DELIVERY To receive your fund documents online, go to pgim.com/investments/resource/edelivery and enroll. Instead of receiving printed documents by mail, you will receive notification via email when new materials are available. You can cancel your enrollment or change your email address at any time by visiting the website address above. |
|
SHAREHOLDER COMMUNICATIONS WITH TRUSTEES Shareholders can communicate directly with the Board of Trustees by writing to the Chair of the Board, PGIM Quant Solutions Strategic Alpha International Equity ETF, PGIM Investments, Attn: Board of Trustees, 655 Broad Street, Newark, NJ 07102. Shareholders can communicate directly with an individual Trustee by writing to that Trustee at the same address. Communications are not screened before being delivered to the addressee. |
|
AVAILABILITY OF PORTFOLIO HOLDINGS On each business day, before commencement of trading on the Exchange, the Fund will disclose on www.pgiminvestments.com the Fund’s portfolio holdings that will form the basis for the Fund’s calculation of NAV at the end of the business day. The Fund files its complete schedule of portfolio holdings with the Securities and Exchange Commission for the first and third quarters of each fiscal year as an exhibit to its reports on Form N-PORT. The Fund’s Form N-PORT filings are available on the Commission’s website at sec.gov. |
|
The Fund’s Statement of Additional Information contains additional information about the Fund’s Trustees and is available without charge, upon request, by calling (800) 225-1852. |
Funds:
| | | | |
| | | |
ARE NOT INSURED BY THE FDIC OR ANY FEDERAL GOVERNMENT AGENCY | | MAY LOSE VALUE | | ARE NOT A DEPOSIT OF OR GUARANTEED BY ANY BANK OR ANY BANK AFFILIATE |

PGIM QUANT SOLUTIONS STRATEGIC ALPHA INTERNATIONAL EQUITY ETF
| | |
| |
| Fund | | Ticker Symbol |
| |
PGIM Quant Solutions Strategic Alpha International Equity ETF | | PQIN |
ETF1002E
Item 2 – Code of Ethics — See Exhibit (a)
As of the end of the period covered by this report, the registrant has adopted a code of ethics (the “Section 406 Standards for Investment Companies – Ethical Standards for Principal Executive and Financial Officers”) that applies to the registrant’s Principal Executive Officer and Principal Financial Officer; the registrant’s Principal Financial Officer also serves as the Principal Accounting Officer.
The registrant hereby undertakes to provide any person, without charge, upon request, a copy of the code of ethics. To request a copy of the code of ethics, contact the registrant 800-225-1852, and ask for a copy of the Section 406 Standards for Investment Companies - Ethical Standards for Principal Executive and Financial Officers.
Item 3 – Audit Committee Financial Expert –
The registrant’s Board has determined that Ms. Grace C. Torres, member of the Board’s Audit Committee is an “audit committee financial expert,” and that she is “independent,” for purposes of this item.
Item 4 – Principal Accountant Fees and Services –
(a) Audit Fees
For the fiscal years ended August 31, 2022 and August 31, 2021, PricewaterhouseCoopers LLP (“PwC”), the registrant’s principal accountant, billed the registrant $143,500 and $156,500, respectively, for professional services rendered for the audit of the registrant’s annual financial statements or services that are normally provided in connection with statutory and regulatory filings.
(b) Audit-Related Fees
For the fiscal years ended August 31, 2022 and August 31, 2021, fees of $50,000 and $0 were billed to the registrant for services rendered by PwC in connection with the custodian and accounting conversion.
For the fiscal years ended August 31, 2022 and August 31, 2021, fees of $0 and $796 were billed to the registrant for services rendered by KPMG LLP (the registrant’s prior principal accountant) in connection with the auditor transition.
(c) Tax Fees
For the fiscal years ended August 31, 2022 and August 31, 2021: none.
(d) All Other Fees
For the fiscal years ended August 31, 2022 and August 31, 2021: none.
(e) (1) Audit Committee Pre-Approval Policies and Procedures
THE PGIM MUTUAL FUNDS
AUDIT COMMITTEE POLICY
on
Pre-Approval of Services Provided by the Independent
Accountants
The Audit Committee of each PGIM Mutual Fund is charged with the responsibility to monitor the independence of the Fund’s independent accountants. As part of this responsibility, the Audit Committee must pre-approve the independent accounting firm’s engagement to render audit and/or permissible non-audit services, as required by law. In evaluating a proposed engagement of the independent accountants, the Audit Committee will assess the effect that the engagement might reasonably be expected to have on the accountant’s independence. The Committee’s evaluation will be based on:
| | • | | a review of the nature of the professional services expected to be provided, |
| | • | | a review of the safeguards put into place by the accounting firm to safeguard independence, and |
| | • | | periodic meetings with the accounting firm. |
Policy for Audit and Non-Audit Services Provided to the Funds
On an annual basis, the scope of audits for each Fund, audit fees and expenses, and audit-related and non-audit services (and fees proposed in respect thereof) proposed to be performed by the Fund’s independent accountants will be presented by the Treasurer and the independent accountants to the Audit Committee for review and, as appropriate, approval prior to the initiation of such services.
Such presentation shall be accompanied by confirmation by both the Treasurer and the independent accountants that the proposed non-audit services will not adversely affect the independence of the independent accountants. Such proposed non-audit services shall be described in sufficient detail to enable the Audit Committee to assess the appropriateness of such services and fees, and the compatibility of the provision of such services with the auditor’s independence. The Committee shall receive periodic reports on the progress of the audit and other services which are approved by the Committee or by the Committee Chair pursuant to authority delegated in this Policy.
The categories of services enumerated under “Audit Services”, “Audit-related Services”, and “Tax Services” are intended to provide guidance to the Treasurer and the independent accountants as to those categories of services which the Committee believes are generally consistent with the independence of the independent accountants and which the Committee (or the Committee Chair) would expect upon the presentation of specific proposals to pre-approve. The enumerated categories are not intended as an exclusive list of audit, audit-related or tax services, which the Committee (or the Committee Chair) would consider for pre-approval.
Audit Services
The following categories of audit services are considered to be consistent with the role of the Fund’s independent accountants:
| | • | | Annual Fund financial statement audits |
| | • | | Seed audits (related to new product filings, as required) |
| | • | | SEC and regulatory filings and consents |
Audit-related Services
The following categories of audit-related services are considered to be consistent with the role of the Fund’s independent accountants:
| | • | | Accounting consultations |
| | • | | Fund merger support services |
| | • | | Agreed Upon Procedure Reports |
| | • | | Other Internal Control Reports |
Individual audit-related services that fall within one of these categories (except for fund merger support services) and are not presented to the Audit Committee as part of the annual pre-approval process are subject to an authorized pre-approval by the Audit Committee so long as the estimated fee for those services does not exceed $30,000. Any services provided under such
pre-approval will be reported to the Audit Committee at its next regular meeting. Should the amount of such services exceed $30,000 any additional fees will be subject to pre-approval by the Committee Chair (or any other Committee member on whom this responsibility has been delegated). Fees related to fund merger support services are subject to a separate authorized pre-approval by the Audit Committee with fees determined on a per occurrence and merger complexity basis.
Tax Services
The following categories of tax services are considered to be consistent with the role of the Fund’s independent accountants:
| | • | | Tax compliance services related to the filing or amendment of the following: |
| | • | | Federal, state and local income tax compliance; and, |
| | • | | Sales and use tax compliance |
| | • | | Timely RIC qualification reviews |
| | • | | Tax distribution analysis and planning |
| | • | | Tax authority examination services |
| | • | | Tax appeals support services |
| | • | | Accounting methods studies |
| | • | | Fund merger support services |
| | • | | Tax consulting services and related projects |
Individual tax services that fall within one of these categories and are not presented to the Audit Committee as part of the annual pre-approval process are subject to an authorized pre-approval by the Audit Committee so long as the estimated fee for those services does not exceed $30,000. Any services provided under such pre-approval will be reported to the Audit Committee at its next regular meeting. Should the amount of such services exceed $30,000 any additional fees will be subject to pre-approval by the Committee Chair (or any other Committee member on whom this responsibility has been delegated).
Other Non-Audit Services
Certain non-audit services that the independent accountants are legally permitted to render will be subject to pre-approval by the Committee or by one or more Committee members to whom the Committee has delegated this authority and who will report to the full Committee any pre-approval decisions made pursuant to this Policy. Non-audit services presented for pre-approval pursuant to this paragraph will be accompanied by a confirmation from both the Treasurer and the independent accountants that the proposed services will not adversely affect the independence of the independent accountants.
Proscribed Services
The Fund’s independent accountants will not render services in the following categories of non-audit services:
| | • | | Bookkeeping or other services related to the accounting records or financial statements of the Fund |
| | • | | Financial information systems design and implementation |
| | • | | Appraisal or valuation services, fairness opinions, or contribution-in-kind reports |
| | • | | Internal audit outsourcing services |
| | • | | Management functions or human resources |
| | • | | Broker or dealer, investment adviser, or investment banking services |
| | • | | Legal services and expert services unrelated to the audit |
| | • | | Any other service that the Public Company Accounting Oversight Board determines, by regulation, is impermissible. |
Pre-approval of Non-Audit Services Provided to Other Entities Within the PGIM Fund Complex
Certain non-audit services provided to PGIM Investments LLC or any of its affiliates that also provide ongoing services to the PGIM Mutual Funds will be subject to pre-approval by the Audit Committee. The only non-audit services provided to these entities that will require pre-approval are those related directly to the operations and financial reporting of the Funds. Individual projects that are not presented to the Audit Committee as part of the annual pre-approval process will be subject to pre-approval by the Committee Chair (or any other Committee member on whom this responsibility has been delegated) so long as the estimated fee for those services does not exceed $30,000. Services presented for pre-approval pursuant to this paragraph will be accompanied by a confirmation from both the Treasurer and the independent accountants that the proposed services will not adversely affect the independence of the independent accountants.
Although the Audit Committee will not pre-approve all services provided to PGIM Investments LLC and its affiliates, the Committee will receive an annual report from the Fund’s independent accounting firm showing the aggregate fees for all services provided to PGIM Investments and its affiliates.
(e) (2) Percentage of services described in each of paragraphs (b) through (d) of this Item that were approved by the audit committee pursuant to paragraph (c)(7)(i)(C) of Rule 2-01 of Regulation S-X –
| | | | |
| | Fiscal Year Ended August 31,
2022 | | Fiscal Year Ended August 31,
2021 |
4(b) | | 0% | | 0% |
4(c) | | Not applicable. | | Not applicable. |
4(d) | | Not applicable. | | Not applicable. |
(f) Percentage of hours expended attributable to work performed by other than full time employees of principal accountant if greater than 50%.
The percentage of hours expended on the principal accountant’s engagement to audit the registrant’s financial statements for the most recent fiscal year that were attributed to work performed by persons other than the principal accountant’s full-time, permanent employees was 0%.
(g) Non-Audit Fees
The aggregate non-audit fees billed by the registrant’s principal accountant for services rendered to the registrant’s investment adviser and any entity controlling, controlled by, or under common control with the investment adviser that provides ongoing services to the registrant for the fiscal years ended August 31, 2022 and August 31, 2021 was $0 and $0, respectively.
(h) Principal Accountant’s Independence
Not applicable as the registrant’s principal accountant has not provided non-audit services to the registrant’s investment adviser and any entity controlling, controlled by, or under common control with the investment adviser that provides ongoing services to the registrant that were not pre-approved pursuant to Rule 2-01(c)(7)(ii) of Regulation S-X.
(i) Not applicable.
(j) Not applicable.
Item 5 – Audit Committee of Listed Registrants – The registrant has a separately designated standing audit committee (the “Audit Committee”) established in accordance with Section 3(a)(58)(A) of the Securities Exchange Act of 1934. The members of the Audit Committee are Grace C. Torres (Chair), Laurie Simon Hodrick, Brian K. Reid and Keith F. Hartstein (ex-officio).
Item 6 – Schedule of Investments – The schedule is included as part of the report to shareholders filed under Item 1 of this Form.
Item 7 – Disclosure of Proxy Voting Policies and Procedures for Closed-End Management Investment Companies – Not
applicable.
Item 8 – Portfolio Managers of Closed-End Management Investment Companies – Not applicable.
| Item 9 – | Purchases of Equity Securities by Closed-End Management Investment Company and Affiliated Purchasers – Not applicable. |
Item 10 – Submission of Matters to a Vote of Security Holders – There have been no material changes to these procedures.
Item 11 – Controls and Procedures
| | (a) | It is the conclusion of the registrant’s principal executive officer and principal financial officer that the effectiveness of the registrant’s current disclosure controls and procedures (such disclosure controls and procedures having been evaluated within 90 days of the date of this filing) provide reasonable assurance that the information required to be disclosed by the registrant has been recorded, processed, summarized and reported within the time period specified in the Commission’s rules and forms and that the information required to be disclosed by the registrant has been accumulated and communicated to the registrant’s principal executive officer and principal financial officer in order to allow timely decisions regarding required disclosure. |
| | (b) | There has been no significant change in the registrant’s internal control over financial reporting (as defined in Rule 30a-3(d) under the Act (17 CFR 270.30a-3(d))) that occurred during the period covered by this report that has materially affected, or is reasonably likely to materially affect, the registrant’s internal control over financial reporting. |
Item 12 – Controls and Procedures - Disclosure of Securities Lending Activities for Closed-End Management Investment Companies – Not applicable.
Item 13 – Exhibits
| | | (3) Any written solicitation to purchase securities under Rule 23c-1 – Not applicable. |
SIGNATURES
Pursuant to the requirements of the Securities Exchange Act of 1934 and the Investment Company Act of 1940, the registrant has duly caused this report to be signed on its behalf by the undersigned, thereunto duly authorized.
| | | | |
| Registrant: | | | | PGIM ETF Trust |
| | |
| By: | | | | /s/ Andrew R. French |
| | | | Andrew R. French |
| | | | Secretary |
| | |
| Date: | | | | October 26, 2022 |
Pursuant to the requirements of the Securities Exchange Act of 1934 and the Investment Company Act of 1940, this report has been signed below by the following persons on behalf of the registrant and in the capacities and on the dates indicated.
| | | | |
| By: | | | | /s/ Stuart S. Parker |
| | | | Stuart S. Parker |
| | | | President and Principal Executive Officer |
| | |
| Date: | | | | October 26, 2022 |
| | |
| By: | | | | /s/ Christian J. Kelly |
| | | | Christian J. Kelly |
| | | | Treasurer and Principal Financial and Accounting Officer |
| | |
| Date: | | | | October 26, 2022 |