UNITED STATES
SECURITIES AND EXCHANGE COMMISSION
Washington, D.C. 20549
FORM N-CSR
CERTIFIED SHAREHOLDER REPORT OF REGISTERED MANAGEMENT INVESTMENT COMPANIES
| Investment Company Act file number: | 811-23324 | |
| Exact name of registrant as specified in charter: | PGIM ETF Trust | |
| Address of principal executive offices: | 655 Broad Street, 17th Floor Newark, New Jersey 07102 | |
| Name and address of agent for service: | Andrew R. French 655 Broad Street, 17th Floor Newark, New Jersey 07102 | |
| Registrant’s telephone number, including area code: | 800-225-1852 | |
| Date of fiscal year end: | 8/31/2021 | |
| Date of reporting period: | 8/31/2021 | |
Item 1 – Reports to Stockholders

PGIM FIXED INCOME ETFS
PGIM Ultra Short Bond ETF (PULS)
PGIM Active High Yield Bond ETF (PHYL)
PGIM Active Aggregate Bond ETF (PAB)
ANNUAL REPORT
AUGUST 31, 2021

To enroll in e-delivery, go to pgim.com/investments/resource/edelivery |
| 3 | ||||
| 4 | ||||
| 5 | ||||
| 8 | ||||
| 10 | ||||
| 11 | ||||
| 14 | ||||
| 16 | ||||
| 17 | ||||
| 19 | ||||
| 22 | ||||
Holdings and Financial Statements | 25 | |||
This report is not authorized for distribution to prospective investors unless preceded or accompanied by a current prospectus.
The views expressed in this report and information about the Funds’ portfolio holdings are for the period covered by this report and are subject to change thereafter.
Exchange-traded funds are distributed by Prudential Investment Management Services LLC (PIMS), member SIPC. PGIM Fixed Income is a unit of PGIM, Inc. (PGIM), a registered investment adviser. PIMS and PGIM are Prudential Financial companies. © 2021 Prudential Financial, Inc. and its related entities. PGIM and the PGIM logo are service marks of Prudential Financial, Inc. and its related entities, registered in many jurisdictions worldwide.
| 2 | Visit our website at pgim.com/investments |
 | Dear Shareholder: | |
| We hope you find the annual report for the PGIM Fixed Income ETFs informative and useful. The report covers performance for the period that ended August 31, 2021. | ||
| The COVID-19 pandemic had a significant impact on the global economy and markets early in 2020, but a dramatic recovery was underway as the summer began. The Federal Reserve slashed interest rates to encourage borrowing. Congress passed stimulus bills worth several trillion dollars to help consumers and businesses. And several effective COVID-19 vaccines received regulatory approval later in the year. |
At the start of the period, stocks had recovered most of the steep losses they had suffered at the onset of the pandemic. Equities rallied as states reopened their economies but became more volatile in the fall as investors worried that a surge in COVID-19 infections would stall the recovery. However, rising corporate profits and economic growth, the resolution of the US presidential election, and the global rollout of approved vaccines lifted equity markets to record levels, helping stocks around the globe post gains for the full period.
Much of the bond market performed well during the period as investors sought safety in fixed income. Investment-grade bonds in the US declined slightly as the economy recovered, but global bonds and emerging market debt rose. While the 10-year US Treasury yield hovered near record lows early in the period after a significant rally in interest rates, rates moved higher later on as investors began to focus on stronger economic growth and the prospects of higher inflation. The Fed also took several aggressive actions to keep the bond markets running smoothly, restarting many of the relief programs that proved to be successful in helping end the global financial crisis in 2008-09.
Regarding your investments with PGIM, we believe it is important to maintain a diversified portfolio of funds consistent with your tolerance for risk, time horizon, and financial goals. Your financial advisor can help you create a diversified investment plan that may include funds covering all the basic asset classes and that reflects your personal investor profile and risk tolerance. However, diversification and asset allocation strategies do not assure a profit or protect against loss in declining markets.
At PGIM Investments, we consider it a great privilege and responsibility to help investors participate in opportunities across global markets while meeting their toughest investment challenges. PGIM is a top-10 global investment manager with more than $1 trillion in assets under management. This scale and investment expertise allow us to deliver actively managed funds and strategies to meet the needs of investors around the globe.
Thank you for choosing our family of funds.
Sincerely,

| Stuart S. Parker, President |
| PGIM Fixed Income ETFs |
| October 15, 2021 |
| PGIM Fixed Income ETFs | 3 |
Your Fund’s Performance (unaudited)
Performance data quoted represent past performance. Past performance does not guarantee future results. The investment return and principal value of an investment will fluctuate so that an investor’s shares, when sold or redeemed, may be worth more or less than their original cost. Current performance may be lower or higher than the past performance data quoted. An investor may obtain performance data as of the most recent month-end by visiting our website at pgim.com/investments or by calling (800) 225-1852.
| Average Annual Total Returns as of 8/31/21 | ||||
| One Year (%) | Since Inception (%) | |||
Net Asset Value (NAV) | 0.98 | 2.01 (04/05/2018) | ||
Market Price* | 0.95 | 2.01 (04/05/2018) | ||
ICE BofA 3-Month T-Bill Index | 0.08 | 1.31 | ||
ICE BofA USD 3-Month Deposit Offered Rate Constant Maturity Index | 0.22 | 1.63 | ||
*The market price is determined using the midpoint between the highest bid and the lowest offer on the listing exchange, as of the time that the Fund’s NAV is calculated. The first day of secondary market trading is typically several days after the date on which the Fund commenced investment operations; therefore, the NAV of the Fund is used as a proxy for the period from inception of investment operations to the first day of secondary market trading to calculate the market price returns.
Since inception returns for the Index are measured from the closest month-end to the Fund’s inception date.
The returns in the table do not reflect the deduction of taxes that a shareholder would pay on Fund distributions or following the redemption or sale of Fund shares.
Market returns do not include brokerage commissions that may be payable on secondary market transactions. If brokerage commissions were included, market returns would be lower. Market and NAV returns assume that dividends and capital gain distributions, if any, have been reinvested in the Fund at market price and NAV, respectively.
| 4 | Visit our website at pgim.com/investments |
Growth of a $10,000 Investment (unaudited)
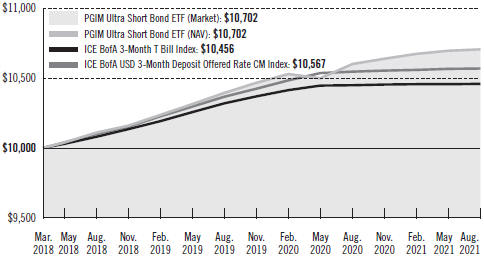
The graph compares a $10,000 investment in the ICE BofA 3-Month T Bill Index and the ICE BofA USD 3-Month Deposit Offered Rate Constant Maturity Index by portraying the initial account values at the commencement of operations (April 5, 2018) and the account values at the end of the current fiscal year (August 31, 2021), as measured on a quarterly basis.The Fund assumes an initial investment on April 5, 2018, while the benchmark and the Index assume that the initial investment occurred on March 31, 2018. For purposes of the graph, and unless otherwise indicated, it has been assumed that (a) all recurring fees (including management fees) were deducted and (b) all dividends and distributions were reinvested. Without waiver of fees and/or expense reimbursements, if any, the returns would have been lower.
Past performance does not predict future performance. Total returns and the ending account values in the graphs include changes in share price and reinvestment of dividends and capital gains distributions in a hypothetical investment for the periods shown. The Fund’s total returns do not reflect the deduction of income taxes on an individual’s investment. Taxes may reduce your actual investment returns on income or gains paid by the Fund or any gains you may realize if you sell your shares.
| PGIM Fixed Income ETFs | 5 |
PGIM Ultra Short Bond ETF
Your Fund’s Performance (continued)
Benchmark Definitions
ICE BofA 3-Month T Bill Index—The ICE BofA 3-Month US Treasury Bill Index tracks the performance of US dollar-denominated US Treasury bills publicly issued in the US domestic market with a remaining term to final maturity of 3 months.
ICE BofA USD 3-Month Deposit Offered Rate Constant Maturity Index—The ICE BofA USD 3-Month Deposit Offered Rate Constant Maturity Index is an unmanaged index which tracks the performance of a synthetic asset paying LIBOR to a stated maturity. The Index is based on the assumed purchase at par of a synthetic instrument having exactly its stated maturity and with a coupon equal to that day’s fixing rate. That issue is assumed to be sold the following business day (priced at a yield equal to the current day fixing rate) and rolled into a new instrument.
ICE BOFA IS LICENSING THE BOFA INDICES “AS IS,” MAKES NO WARRANTIES REGARDING THE SAME, DOES NOT GUARANTEE THE SUITABILITY, QUALITY, ACCURACY, TIMELINESS, AND/OR COMPLETENESS OF THE ICE BOFA INDICES OR ANY DATA INCLUDED IN, RELATED TO, OR DERIVED THEREFROM, ASSUMES NO LIABILITY IN CONNECTION WITH THEIR USE, AND DOES NOT SPONSOR, ENDORSE, OR RECOMMEND THE FUND, OR ANY OF ITS PRODUCTS OR SERVICES.
Investors cannot invest directly in an index. The returns for the Index would be lower if they included the effects of operating expenses or taxes that may be paid by an investor.
| Credit Quality expressed as a percentage of total investments as of 8/31/21 (%) | ||||
AAA | 31.7 | |||
AA | 14.2 | |||
A | 27.4 | |||
BBB | 18.5 | |||
Cash/Cash Equivalents | 8.2 | |||
Total | 100.0 | |||
Credit ratings reflect the highest rating assigned by a nationally recognized statistical rating organization (NRSRO) such as Moody’s Investors Service, Inc. (Moody’s), S&P Global Ratings (S&P), or Fitch, Inc. (Fitch). Credit ratings reflect the common nomenclature used by both S&P and Fitch. Where applicable, ratings are converted to the comparable S&P/Fitch rating tier nomenclature. These rating agencies are independent and are widely used. The Not Rated category consists of securities that have not been rated by an NRSRO. Credit ratings are subject to change.
| 6 | Visit our website at pgim.com/investments |
| Distributions and Yields as of 8/31/21 | ||||||||||||
| | Total Dividends Paid for 12 Months ($) | | | SEC 30-Day Subsidized Yield* (%) | | | SEC 30-Day Unsubsidized Yield** (%) | | ||||
| 0.71 | 0.55 | 0.55 | ||||||||||
*SEC 30-Day Subsidized Yield (%)—A standardized yield calculation created by the Securities and Exchange Commission, it reflects the income earned during a 30-day period, after the deduction of the Fund’s net expenses (net of any expense waivers or reimbursements). The investor experience is represented by the SEC 30-Day Subsidized Yield.
**SEC 30-Day Unsubsidized Yield (%)—A standardized yield calculation created by the Securities and Exchange Commission, it reflects the income earned during a 30-day period, after the deduction of the Fund’s gross expenses. The investor experience is represented by the SEC 30-Day Subsidized Yield.
| PGIM Fixed Income ETFs | 7 |
Strategy and Performance Overview (unaudited)
How did the Fund perform?
The PGIM Ultra Short Bond ETF (the Fund) returned 0.98% based on net asset value in the 12-month reporting period that ended August 31, 2021, outperforming the 0.22% return of the ICE BofA USD 3-Month Deposit Offered Rate Constant Maturity Index (the Index).
What were the market conditions?
| ● | The strong global rebound from the depths of the COVID-19 pandemic continued throughout the reporting period, as economies responded to the unprecedented monetary and fiscal stimulus programs. The rollout of vaccines, President Biden’s $1.9 trillion stimulus package, a $900 billion aid bill, and anticipation of the Biden administration’s infrastructure bill fueled growth expectations in late 2020 and early 2021. Shifts in the prospects for growth and inflation kicked off a massive “reflation trade” in bond markets, which propelled yields higher during the first quarter of 2021. |
| ● | Although yields for short-term Treasuries remained well anchored by the Federal Reserve’s (the Fed’s) commitment to maintain its low-rate policy, longer-term Treasuries sold off sharply in the first quarter of 2021, with the yield on the benchmark US 10-year Treasury note rising from 0.92% on December 31, 2020, to 1.74% on March 31, 2021. Similarly, the yield on the 30-year Treasury bond rose from 1.65% to 2.41% over the same period. |
| ● | Market volatility for rates then eased in the second quarter of 2021, escaping the sell-offs observed earlier in the year, with lower long-dated yields and higher front-end rates forming a substantially flatter Treasury yield curve. (A yield curve is a line graph that illustrates the relationship between the yields and maturities of fixed income securities. It is created by plotting the yields of different maturities for the same type of bonds.) Instead of pushing up the yield curve, the Fed’s turn toward tapering near the end of the second quarter led to a decline in long-term Treasury yields, as investors assumed a more hawkish Fed would simply mean a lower path for rates over the long run. |
| ● | Following the volatility of the first quarter of 2021, the US 10-year and 30-year Treasury yields ended the period at 1.31% and 1.93%, respectively. Meanwhile, the yield on the 2-year Treasury note ended the period at 0.21%, a rise of eight basis points over the period. (One basis point equals 0.01%.) |
| ● | While longer-term Treasuries saw substantial volatility throughout the period, yields on short-term securities, which influence money market yields, remained near zero. The 3-month Treasury bill declined from 0.107% to 0.043% during the period, while the 6-month Treasury bill declined from 0.122% to 0.058%. Meanwhile, the 3-month London Interbank Offered Rate (LIBOR) fell from 0.24% on August 31, 2020, to 0.12% by August 31, 2021. |
What worked?
| ● | The Fund emphasized spread assets—including short-term investment-grade debt of financial, consumer cyclical and non-cyclical, and utility companies—ranging across |
| 8 | Visit our website at pgim.com/investments |
the rating spectrum from AAA to BBB. Other spread-sector assets included commercial mortgage-backed securities (CMBS) and collateralized loan obligations (CLOs). |
| ● | Overall, positioning in CLOs, investment grade corporates, and CMBS all contributed to performance during the reporting period. Yield curve positioning also contributed to performance. |
What didn’t work?
The duration of the Fund was tactically managed during the period. Overall, duration positioning detracted from performance. (Duration measures the sensitivity of the price—the value of principal—of a bond to a change in interest rates.)
Did the Fund use derivatives?
During the reporting period, the Fund used interest rate swaps and futures to help manage duration positioning and yield curve exposure. These instruments allowed the Fund to capture higher yields available farther out on the short-term portion of the yield curve and in spread-sector assets versus Treasuries, while mitigating interest rate risk. Overall, the positions added to performance during the period.
Current outlook
| ● | In considering the composition of the Treasury curve, PGIM Fixed Income believes the repricing of forward rates and inflation expectations in various parts of the curve will likely continue. Even when accounting for the recent change in policy messaging, the hurdle for the Fed to raise rates remains high, and officials will likely wait to observe whether the inflation pressure is transitory. |
| ● | The US has seen a marked acceleration in inflation in recent months. Part of this increase comes from “base effects,” but the lion’s share of the gains reflects surprisingly vigorous price increases. (Base effect is the distortion in a monthly inflation figure that results from abnormally high or low levels of inflation a year earlier. In this case, inflation was low a year ago.) Recent developments suggest that inflation will likely continue to run somewhat hot through the months ahead. However, PGIM Fixed Income expects inflation to slowly abate toward the end of the year and early next year, as many of the structural factors that drove soft inflation during much of the past decade remain firmly in place. |
| ● | To date, the Fed has felt comfortable looking through these recent price pressures and has kept rates on hold. That said, the Fed seems to have recently shifted to more of a “risk management” approach. While maintaining a baseline view that the current bout of inflation will be “transitory,” the Fed at its June 2021 meeting recognized that the upside risks to inflation have increased. Even so, PGIM Fixed Income expects monetary policy to remain highly stimulative through at least this year and much of next year. |
| PGIM Fixed Income ETFs | 9 |
PGIM Active High Yield Bond ETF
Your Fund’s Performance (unaudited)
Performance data quoted represent past performance. Past performance does not guarantee future results. The investment return and principal value of an investment will fluctuate so that an investor’s shares, when sold or redeemed, may be worth more or less than their original cost. Current performance may be lower or higher than the past performance data quoted. An investor may obtain performance data as of the most recent month-end by visiting our website at pgim.com/investments or by calling (800) 225-1852.
| Average Annual Total Returns as of 8/31/21 | ||||||||
| One Year (%) | Since Inception (%) | |||||||
Net Asset Value (NAV) | 11.00 | 8.30 (09/24/2018) | ||||||
Market Price* | 10.22 | 8.25 (09/24/2018) | ||||||
Bloomberg US High Yield Very Liquid Index | ||||||||
| 8.77 | 6.68 | |||||||
*The market price is determined using the midpoint between the highest bid and the lowest offer on the listing exchange, as of the time that the Fund’s NAV is calculated. The first day of secondary market trading is typically several days after the date on which the Fund commenced investment operations; therefore, the NAV of the Fund is used as a proxy for the period from inception of investment operations to the first day of secondary market trading to calculate the market price returns.
Since inception returns for the Index are measured from the closest month-end to the Fund’s inception date.
The returns in the table do not reflect the deduction of taxes that a shareholder would pay on Fund distributions or following the redemption or sale of Fund shares.
Market returns do not include brokerage commissions that may be payable on secondary market transactions. If brokerage commissions were included, market returns would be lower. Market and NAV returns assume that dividends and capital gain distributions, if any, have been reinvested in the Fund at market price and NAV, respectively.
| 10 | Visit our website at pgim.com/investments |
Growth of a $10,000 Investment (unaudited)
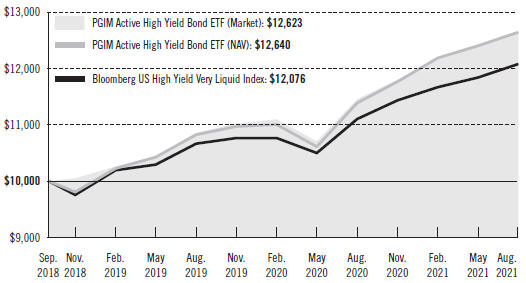
The graph compares a $10,000 investment in the Fund with a similar investment in the Bloomberg US High Yield Very Liquid Index by portraying the initial account values at the commencement of operations (September 24, 2018) and the account values at the end of the current fiscal year (August 31, 2021), as measured on a quarterly basis. The Fund assumes an initial investment on September 24, 2018, while the benchmark and the Index assume that the initial investment occurred on September 30, 2018. For purposes of the graph, and unless otherwise indicated, it has been assumed that (a) all recurring fees (including management fees) were deducted and (b) all dividends and distributions were reinvested. Without waiver of fees and/or expense reimbursements, if any, the returns would have been lower.
Past performance does not predict future performance. Total returns and the ending account values in the graphs include changes in share price and reinvestment of dividends and capital gains distributions in a hypothetical investment for the periods shown. The Fund’s total returns do not reflect the deduction of income taxes on an individual’s investment. Taxes may reduce your actual investment returns on income or gains paid by the Fund or any gains you may realize if you sell your shares.
| PGIM Fixed Income ETFs | 11 |
PGIM Active High Yield Bond ETF
Your Fund’s Performance (continued)
Benchmark Definitions
Bloomberg US High Yield Very Liquid Index (VLI)—The Bloomberg US High Yield Very Liquid Index is a component of the US Corporate High Yield Index that is designed to track a more liquid component of the USD-denominated, high yield, fixed rate corporate bond market. The Index uses the same eligibility criteria as the US Corporate High Yield Index, but includes only the three largest bonds from each issuer that have a minimum amount outstanding of USD500mn and less than five years from issue date. The Index also limits the exposure of each issuer to 2% of the total market value and redistributes any excess market value index-wide on a pro rata basis.
Investors cannot invest directly in an index. The returns for the Index would be lower if they included the effects of operating expenses or taxes that may be paid by an investor.
| Credit Quality expressed as a percentage of total investments as of 8/31/21 (%) | ||||
BBB | 4.3 | |||
BB | 47.6 | |||
B | 32.3 | |||
CCC | 9.3 | |||
CC | 0.4 | |||
NR | 2.1 | |||
Cash/Cash Equivalents | 4.0 | |||
Total | 100.0 | |||
Credit ratings reflect the highest rating assigned by a nationally recognized statistical rating organization (NRSRO) such as Moody’s Investors Service, Inc. (Moody’s), S&P Global Ratings (S&P), or Fitch, Inc. (Fitch). Credit ratings reflect the common nomenclature used by both S&P and Fitch. Where applicable, ratings are converted to the comparable S&P/Fitch rating tier nomenclature. These rating agencies are independent and are widely used. The Not Rated category consists of securities that have not been rated by an NRSRO. Credit ratings are subject to change.
| 12 | Visit our website at pgim.com/investments |
| Distributions and Yields as of 8/31/21 | ||||||
| Total Dividends Paid for 12 Months ($) | SEC 30-Day Subsidized Yield* (%) | SEC 30-Day Unsubsidized Yield** (%) | ||||
| 2.82 | 3.69 | 3.69 | ||||
*SEC 30-Day Subsidized Yield (%)—A standardized yield calculation created by the Securities and Exchange Commission, it reflects the income earned during a 30-day period, after the deduction of the Fund’s net expenses (net of any expense waivers or reimbursements). The investor experience is represented by the SEC 30-Day Subsidized Yield.
**SEC 30-Day Unsubsidized Yield (%)—A standardized yield calculation created by the Securities and Exchange Commission, it reflects the income earned during a 30-day period, after the deduction of the Fund’s gross expenses. The investor experience is represented by the SEC 30-Day Subsidized Yield.
| PGIM Fixed Income ETFs | 13 |
Strategy and Performance Overview (unaudited)
How did the Fund perform?
The PGIM Active High Yield Bond ETF (the Fund) returned 11.00% based on net asset value in the 12-month reporting period that ended August 31, 2021, outperforming the 8.77% return of the Bloomberg US High Yield Very Liquid Index (the Index).
What were the market conditions?
| ● | US high yield bonds posted strong gains during the reporting period, driven by positive COVID-19 vaccine news, an accelerated economic recovery, higher-than-expected corporate earnings, ongoing monetary and fiscal stimulus programs, and declining default rates. Low and range-bound nominal interest rates continued to support risk sentiment and an ongoing search for yield. |
| ● | While flows into high yield bond mutual funds turned negative during the last eight months of the period, strong demand from institutional accounts and a new-issue calendar consisting mostly of refinancing activity provided a strong technical backdrop for the asset class. Meanwhile, fundamentals improved markedly from their pandemic lows as default rates declined, credit quality improved, and earnings continued to surprise to the upside. |
| ● | After posting inflows of $45 billion during 2020, high yield bond mutual funds saw $14 billion of outflows during the first eight months of 2021. For the period, spreads on the Bloomberg US High Yield 1% Issuer Constrained Bond Index tightened 194 basis points (bps) to 293 bps as of August 31, 2021. (One basis point equals 0.01%.) For perspective, spreads ended the period 48 bps tighter than at the start of 2020 after widening to a pandemic high of 1,100 bps in March 2020. |
| ● | By quality, lower-quality (CCC-rated) credits significantly outperformed their higher-quality (BB-rated and B-rated) peers during the period, as many of the higher-beta and COVID-19-impacted sectors that should benefit from strong growth and a further reopening of the economy outperformed. (Beta is a measure of the volatility or risk of a security or portfolio compared to the market or index.) Airlines, energy, retail, aerospace, and metals & mining saw strong performance, while more defensive sectors lagged. |
| ● | The high yield primary market remained active, as issuers continued to take advantage of the low yield environment to push out maturities and lower their cost of capital. After issuing a record $450 billion in high yield bonds during 2020, US companies issued another $364 billion through the first eight months of 2021. |
| ● | The par-weighted US high yield default rate, including distressed exchanges, ended August 2021 at a 29-month low of 1.06%, down 470 bps year over year, according to JP Morgan. |
What worked?
| ● | Overall security selection was the largest contributor to the Fund’s returns during the reporting period, with selection in the upstream and midstream energy, telecom, aerospace & defense, gaming/lodging/leisure, and automotive industries the largest contributors. |
| 14 | Visit our website at pgim.com/investments |
| · | While overall industry selection was a modest detractor from performance, an overweight relative to the Index to the upstream energy and aerospace & defense industries—along with an underweight to downstream energy—contributed. |
| · | In individual security selection, overweights relative to the index to Chesapeake Energy Corp. (upstream energy), Digicel International (telecom), and Nabors Industries (upstream energy) were the largest contributors to performance. |
| ● | Having more beta on average in the Fund relative to the Index over the period was a strong contributor to returns. |
What didn’t work?
| ● | Overall industry selection modestly detracted from performance, with an overweight relative to the Index to building materials & home construction and electric utilities—along with an underweight to transportation & environmental services—the largest detractors. |
| ● | While overall security selection was positive, selection within the healthcare & pharmaceuticals, media & entertainment, and cable & satellite industries detracted. |
| ● | In individual security selection, overweights relative to the Index to Bausch Health Americas (healthcare & pharmaceuticals), Intelsat (cable & satellite), and Diamond Sports Group (media & entertainment) detracted from results. |
Did the Fund use derivatives?
The Fund used credit index derivatives, interest rate futures, and swaps to manage its overall risk profile, which had a positive aggregate impact on performance.
Current outlook
| ● | PGIM Fixed Income remains constructive on high yield bonds, given the enormous monetary and fiscal responses seen to date, and continues to expect spreads to tighten over the medium term. Optimism around the COVID-19 vaccines, an ongoing search for yield, a decline in defaults, and a market that is of higher quality than before the pandemic are among the factors that PGIM Fixed Income expects to drive spread compression going forward. |
| ● | PGIM Fixed Income has reduced its base-case default expectations to 0.9% over the next 12 months and to 1.0% for the following 12 months. This optimism is tempered modestly by COVID-19 mutations and the rapidly expanding delta variant, which are likely to cause growth to slow in regions around the globe that are not well vaccinated, as well as higher-than-expected inflation leading to an increasingly hawkish Federal Reserve, slowing growth in China and/or a materially higher US tax regime on corporations and higher-income individuals. |
| ● | In terms of positioning, PGIM Fixed Income believes BB-rated bonds relative to the Index are attractive on a relative-value basis. The Fund is currently underweight BB-rated bonds, but PGIM Fixed Income is selectively adding exposure. Overweights include independent power producers, housing, gaming, chemicals, and autos. |
| PGIM Fixed Income ETFs | 15 |
PGIM Active Aggregate Bond ETF
Your Fund’s Performance (unaudited)
Performance data quoted represent past performance. Past performance does not guarantee future results. The investment return and principal value of an investment will fluctuate so that an investor’s shares, when sold or redeemed, may be worth more or less than their original cost. Current performance may be lower or higher than the past performance data quoted. An investor may obtain performance data as of the most recent month-end by visiting our website at pgim.com/investments or by calling (800) 225-1852.
Average Annual Total Returns as of 8/31/21 Since Inception (%) | ||
Net Asset Value (NAV) | 2.59 (04/12/2021) | |
Market Price* | 2.64 (04/12/2021) | |
Bloomberg US Aggregate Bond Index
| 2.77
| |
*The market price is determined using the midpoint between the highest bid and the lowest offer on the listing exchange, as of the time that the Fund’s NAV is calculated. The first day of secondary market trading is typically several days after the date on which the Fund commenced investment operations; therefore, the NAV of the Fund is used as a proxy for the period from inception of investment operations to the first day of secondary market trading to calculate the market price returns.
Since inception returns for the Index are measured from the closest month-end to the Fund’s inception date.
The returns in the table do not reflect the deduction of taxes that a shareholder would pay on Fund distributions or following the redemption or sale of Fund shares.
Market returns do not include brokerage commissions that may be payable on secondary market transactions. If brokerage commissions were included, market returns would be lower. Market and NAV returns assume that dividends and capital gain distributions, if any, have been reinvested in the Fund at market price and NAV, respectively.
| 16 | Visit our website at pgim.com/investments |
Growth of a $10,000 Investment (unaudited)
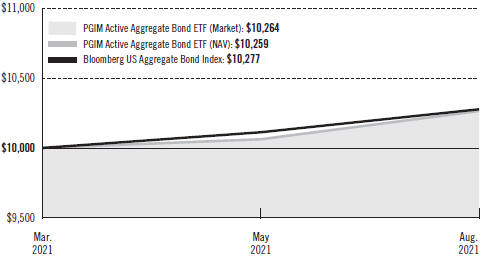
The graph compares a $10,000 investment in the Fund with a similar investment in the Bloomberg US Aggregate Bond Index by portraying the initial account values at the commencement of operations (April 12, 2021) and the account values at the end of the current fiscal year (August 31, 2021), as measured on a quarterly basis.The Fund assumes an initial investment on April 15, 2021, while the benchmark and the Index assume that the initial investment occurred on March 31, 2021. For purposes of the graph, and unless otherwise indicated, it has been assumed that (a) all recurring fees (including management fees) were deducted and (b) all dividends and distributions were reinvested. Without waiver of fees and/or expense reimbursements, if any, the returns would have been lower.
Past performance does not predict future performance. Total returns and the ending account values in the graphs include changes in share price and reinvestment of dividends and capital gains distributions in a hypothetical investment for the periods shown. The Fund’s total returns do not reflect the deduction of income taxes on an individual’s investment. Taxes may reduce your actual investment returns on income or gains paid by the Fund or any gains you may realize if you sell your shares.
| PGIM Fixed Income ETFs | 17 |
PGIM Active Aggregate Bond ETF
Your Fund’s Performance (continued)
Benchmark Definitions
Bloomberg US Aggregate Bond Index—The Bloomberg US Aggregate Bond Index is unmanaged and represents securities that are taxable and dollar denominated. It covers the US investment-grade fixed rate bond market, with index components for government and corporate securities, mortgage pass-through securities, and asset-backed securities.
Investors cannot invest directly in an index. The returns for the Index would be lower if they included the effects of operating expenses or taxes that may be paid by an investor.
| Credit Quality expressed as a percentage of total investments as of 8/31/21 (%) | ||||
AAA | 67.1 | |||
AA | 6.6 | |||
A | 9.6 | |||
BBB | 16.5 | |||
Cash/Cash Equivalents | 0.2 | |||
Total | 100.0 | |||
Credit ratings reflect the highest rating assigned by a nationally recognized statistical rating organization (NRSRO) such as Moody’s Investors Service, Inc. (Moody’s), S&P Global Ratings (S&P), or Fitch, Inc. (Fitch). Credit ratings reflect the common nomenclature used by both S&P and Fitch. Where applicable, ratings are converted to the comparable S&P/Fitch rating tier nomenclature. These rating agencies are independent and are widely used. The Not Rated category consists of securities that have not been rated by an NRSRO. Credit ratings are subject to change.
| Distributions and Yields as of 8/31/21 | ||||||||||||
|
Total Dividends Paid for the Reporting Period ($) |
| | SEC 30-Day Subsidized Yield* (%) |
| | SEC 30-Day Unsubsidized Yield** (%) |
| ||||
| 0.23 | 1.24 | 1.24 | ||||||||||
*SEC 30-Day Subsidized Yield (%)—A standardized yield calculation created by the Securities and Exchange Commission, it reflects the income earned during a 30-day period, after the deduction of the Fund’s net expenses (net of any expense waivers or reimbursements). The investor experience is represented by the SEC 30-Day Subsidized Yield.
**SEC 30-Day Unsubsidized Yield (%)—A standardized yield calculation created by the Securities and Exchange Commission, it reflects the income earned during a 30-day period, after the deduction of the Fund’s gross expenses. The investor experience is represented by the SEC 30-Day Subsidized Yield.
| 18 | Visit our website at pgim.com/investments |
Strategy and Performance Overview (unaudited)
How did the Fund perform?
The PGIM Active Aggregate Bond ETF (the Fund) returned 2.59% based on net asset value in the four-month reporting period from the Fund’s inception on April 12, 2021, through August 31, 2021, underperforming the 2.77% return of the Bloomberg US Aggregate Bond Index (the Index) during that same time.
What were the market conditions?
| ● | The strong global rebound continued throughout the reporting period, as economies responded to the unprecedented monetary and fiscal stimulus programs. Although yields for short-term Treasuries remained well anchored by the Federal Reserve’s (the Fed’s) commitment to maintain its low-rate policy, longer-term Treasuries sold off sharply in the first quarter of 2021, with the yield on the benchmark US 10-year Treasury note rising from 0.92% on December 31, 2020, to 1.74% on March 31, 2021. Similarly, the yield on the 30-year Treasury bond rose from 1.65% to 2.41% over the same period. |
| ● | Market volatility for rates then eased in the second quarter of 2021, escaping the sell-offs observed earlier in the year, with lower long-dated yields and higher front-end rates forming a substantially flatter Treasury yield curve by the end of the period. (A yield curve is a line graph that illustrates the relationship between the yields and maturities of fixed income securities. It is created by plotting the yields of different maturities for the same type of bonds.) Instead of pushing up the yield curve, the Fed’s turn toward tapering near the end of the second quarter led to a decline in long-term Treasury yields, as investors assumed a more hawkish Fed would simply mean a lower path for rates over the long run. |
| ● | Following the volatility of the first quarter of 2021, the US 10-year and 30-year Treasury yields ended the period at 1.31% and 1.93%, respectively. Meanwhile, the yield on the 2-year Treasury note ended the period at 0.21%. |
| ● | Spread markets continued to tighten, supported by the Fed’s monetary responses, fiscal stimulus, the rollout of COVID-19 vaccines, better-than-expected corporate earnings, and surging growth in the US, Europe, and some emerging market economies. |
| ● | The US investment-grade corporate bond market performed well, with spreads tightening to near-historic levels by the end of the period, supported by better-than-expected corporate earnings, positive vaccination progress, and a favorable technical backdrop. Strengthening fundamentals generally kept securitized credit on a tightening trajectory as well, with commercial mortgage-backed securities (CMBS) spreads trading well below their pre-pandemic tights by the end of the period. Meanwhile, agency mortgage-backed securities (MBS) spreads tightened on the back of ongoing Fed buying and bank purchases. |
| PGIM Fixed Income ETFs | 19 |
Strategy and Performance Overview (continued)
What worked?
| ● | Overall security selection and sector allocation both contributed to the Fund’s performance during the reporting period. Within security selection, positions in MBS, investment-grade corporates, and emerging markets were the largest contributors. |
| ● | Within sector allocation, an allocation to collateralized loan obligations (CLOs) and overweights to CMBS and investment-grade corporates contributed to returns. |
| ● | Within credit, positioning in banking, midstream energy, telecom, and retailers & restaurants contributed to results. |
| ● | In individual security selection, the Fund benefited from overweights to banking credits JP Morgan, Bank of America, and Goldman Sachs. |
| ● | The Fund’s duration and yield curve positioning both contributed to returns. (Duration measures the sensitivity of the price—the value of principal—of a bond to a change in interest rates.) |
What didn’t work?
| ● | While overall security selection was positive, selection in CLOs was a modest detractor from Fund performance. |
| ● | The Fund’s positioning in the electric utilities, healthcare insurance, and finance companies modestly detracted during the period. |
| ● | In individual security selection relative to the Index, the Fund’s overweight positioning in Edison International (electric utilities), along with underweights to General Electric (capital goods) and Mexico, detracted from performance. |
Did the Fund use derivatives?
The Fund uses derivatives when they facilitate implementation of the overall investment approach. During the reporting period, the Fund used interest rate futures to help manage duration positioning and yield curve exposure. In aggregate, these positions detracted from performance.
Current outlook
| ● | In considering the composition of the Treasury curve, PGIM Fixed Income believes the repricing of forward rates and inflation expectations in various parts of the curve will likely continue. Even when accounting for the recent change in policy messaging, the hurdle for the Fed to raise rates remains high, and officials will likely wait to observe whether the inflation pressure is transitory. |
| ● | The US saw a marked acceleration in inflation through the first half of 2021. Part of the increase came from “base effects,” but the lion’s share of the gains reflected surprisingly vigorous price increases. (Base effect is the distortion in a monthly inflation figure that results from abnormally high or low levels of inflation a year earlier. In this case, inflation was low a year ago.) Recent developments suggest that inflation will likely continue to run somewhat hot through the months ahead. However, PGIM |
| 20 | Visit our website at pgim.com/investments |
Fixed Income believes inflation could slowly abate toward the end of the year and early next year, as many of the structural factors that drove soft inflation during much of the past decade remain firmly in place. |
| ● | To date, developed markets central banks have felt comfortable looking through recent price pressures and have kept rates on hold. While maintaining a baseline view that the current bout of inflation will be “transitory,” the Fed at its June 2021 meeting recognized that the upside risks to inflation have increased. Even so, PGIM Fixed Income expects monetary policy to remain highly stimulative through at least this year and much of next year. |
| ● | PGIM Fixed Income maintains its positive view of the spread sectors over the medium to long term, and the Fund is overweight structured products (CMBS), investment-grade corporates (from a duration contribution perspective), and municipal bonds. The Fund is underweight MBS in favor of more attractive opportunities across spread sectors. |
| ● | While valuations are now a bit full, with spreads in many sectors tighter than historical norms, PGIM Fixed Income generally expects ongoing spread-sector outperformance. The combination of high cash balances and low money market rates is likely to continue pushing investors out on the risk spectrum in a search for yield. However, this outlook is not without caveats. First, the relatively narrow level of spreads diminishes the pace and magnitude of further outperformance. Additionally, narrower spreads leave little room for error, and the uncertain course of the long-term economic recovery warrants a discerning approach to credit selection. |
| ● | Within structured products, PGIM Fixed Income is biased to own the top of the capital structure, as near-zero policy rates and ongoing Fed purchases support a spread tightening environment. In investment-grade corporates, PGIM Fixed Income is looking to take advantage of spread compression in select higher-yielding BBB-rated bonds, solid credits in stressed industries, and cyclicals. While agency CMBS have benefited from strong bank demand and Fed support, a change in that dynamic—particularly from the Fed—could contribute some widening pressure on spreads. |
| PGIM Fixed Income ETFs | 21 |
As a shareholder of the Fund, you incur ongoing costs, including investment management fees. This example is intended to help you understand your ongoing costs (in dollars) of investing in the Fund and to compare these costs with the ongoing costs of investing in other funds.
The example is based on an investment of $1,000 held through the six-month period ended August 31, 2021. The example is for illustrative purposes only.
Actual Expenses
The first line in the tables below provides information about actual account values and actual expenses. You may use the information on this line, together with the amount you invested, to estimate the expenses that you paid over the period. Simply divide your account value by $1,000 (for example, an $8,600 account value ÷ $1,000 = 8.6), then multiply the result by the number on the first line under the heading “Expenses Paid During the Six-Month Period” to estimate the expenses you paid on your account during this period.
Hypothetical Example for Comparison Purposes
The second line in the tables below provides information about hypothetical account values and hypothetical expenses based on the Fund’s actual expense ratio and an assumed rate of return of 5% per year before expenses, which is not the Fund’s actual return. The hypothetical account values and expenses may not be used to estimate the actual ending account balance or expenses you paid for the period. You may use this information to compare the ongoing costs of investing in the Fund and other funds. To do so, compare this 5% hypothetical example with the 5% hypothetical examples that appear in the shareholder reports of the other funds.
Please note that the expenses shown in the tables are meant to highlight your ongoing costs only and do not reflect any transactional costs, brokerage commissions paid on purchases and sales of Fund shares. Therefore, the ending account values and expenses paid for the period are useful in comparing ongoing costs only and will not help you determine the relative total costs of owning different funds. In addition, if these transactional costs were included, your costs would have been higher.
PGIM Ultra Short Bond ETF | Beginning Account Value March 1, 2021 | Ending Account Value | Annualized Expense Ratio Based on the Six-Month Period | Expenses Paid During the Six-Month Period* | ||||
Actual | $1,000.00 | $1,002.90 | 0.15% | $0.76 | ||||
Hypothetical | $1,000.00 | $1,024.45 | 0.15% | $0.77 | ||||
| 22 | Visit our website at pgim.com/investments |
PGIM Active High Yield Bond ETF | Beginning Account Value March 1, 2021 | Ending Account Value | Annualized Expense Ratio Based on the Six-Month Period | Expenses Paid During the Six-Month Period* | ||||
Actual | $1,000.00 | $1,037.40 | 0.53% | $2.72 | ||||
Hypothetical | $1,000.00 | $1,022.53 | 0.53% | $2.70 | ||||
PGIM Active Aggregate Bond ETF | Beginning Account Value March 1, 2021 | Ending Account Value | Annualized Expense Ratio Based on the Six-Month Period | Expenses Paid During the Six-Month Period* | ||||
Actual** | $1,000.00 | $1,025.90 | 0.19% | $0.74 | ||||
Hypothetical | $1,000.00 | $1,024.25 | 0.19% | $0.97 | ||||
*Fund expenses (net of fee waivers or subsidies, if any) are equal to the annualized expense ratio (provided in the table), multiplied by the average account value over the period, multiplied by the 184 days in the six-month period ended August 31, 2021, and divided by the 365 days in the Fund’s fiscal year ended August 31, 2021 (to reflect the six-month period). Expenses presented in the table include the expenses of any underlying portfolios in which the Fund may invest.
**“Actual” expenses are calculated using 141-day period ended August 31, 2021 due to the Fund’s inception date on April 12, 2021.
| PGIM Fixed Income ETFs | 23 |
PGIM Ultra Short Bond ETF
Schedule of Investments
as of August 31, 2021
| Description | Interest Rate | Maturity Date | Principal Amount (000)# | Value | ||||||||||||
| LONG-TERM INVESTMENTS 79.4% | ||||||||||||||||
| ASSET-BACKED SECURITIES 19.1% | ||||||||||||||||
| Automobile ABS 1.0% | ||||||||||||||||
Donlen Fleet Lease Funding 2 LLC, Series 2021-2, Class A2, 144A | 0.560 | % | 12/11/34 | 6,000 | $ | 6,009,606 | ||||||||||
Enterprise Fleet Financing LLC, Series 2021-2, Class A2, 144A | 0.480 | 05/20/27 | 6,210 | 6,208,867 | ||||||||||||
Honda Auto Receivables Owner Trust, Series 2020-1, Class A3 | 1.610 | 04/22/24 | 5,500 | 5,567,109 | ||||||||||||
|
| |||||||||||||||
| 17,785,582 | ||||||||||||||||
| Collateralized Loan Obligations 18.1% | ||||||||||||||||
Adams Mill CLO Ltd. (Cayman Islands), Series 2014-1A, Class A1R, 144A, 3 Month LIBOR + 1.100% | 1.226 | (c) | 07/15/26 | 80 | 80,133 | |||||||||||
Allegro CLO IV Ltd. (Cayman Islands), Series 2016-1A, Class AR2, 144A, 3 Month LIBOR + 0.950% | 1.076 | (c) | 01/15/30 | 9,108 | 9,105,428 | |||||||||||
Anchorage Capital CLO 7 Ltd. (Cayman Islands), Series 2015-7A, Class AR2, 144A, 3 Month LIBOR + 1.090% | 1.222 | (c) | 01/28/31 | 5,000 | 5,002,500 | |||||||||||
Anchorage Capital CLO 8 Ltd. (Cayman Islands), Series 2016-8A, Class AR, 144A, 3 Month LIBOR + 1.000% | 1.132 | (c) | 07/28/28 | 1,076 | 1,076,112 | |||||||||||
Atlas Senior Loan Fund III Ltd. (Cayman Islands), Series 2013-1A, Class AR, 144A, 3 Month LIBOR + 0.830% | 0.954 | (c) | 11/17/27 | 3,874 | 3,874,609 | |||||||||||
Atrium XII (Cayman Islands), Series 12A, Class AR, 144A, 3 Month LIBOR + 0.830% | 0.968 | (c) | 04/22/27 | 7,449 | 7,449,169 | |||||||||||
Bain Capital Credit CLO (Cayman Islands), Series 2018-1A, Class A1, 144A, 3 Month LIBOR + 0.960% | 1.098 | (c) | 04/23/31 | 4,000 | 3,996,408 | |||||||||||
Battalion CLO VII Ltd. (Cayman Islands), Series 2014-7A, Class A1RR, 144A, 3 Month LIBOR + 1.040% | 1.174 | (c) | 07/17/28 | 1,684 | 1,684,295 | |||||||||||
Benefit Street Partners CLO II Ltd. (Cayman Islands), Series 2013-IIA, Class A1R2, 144A, 3 Month LIBOR + 0.870% | 0.996 | (c) | 07/15/29 | 5,000 | 4,995,934 | |||||||||||
Benefit Street Partners CLO III Ltd. (Cayman Islands), Series 2013-IIIA, Class A1R2, 144A, 3 Month LIBOR + 1.000% | 1.134 | (c) | 07/20/29 | 10,000 | 9,996,795 | |||||||||||
See Notes to Financial Statements.
PGIM Fixed Income ETFs | 25 |
PGIM Ultra Short Bond ETF
Schedule of Investments (continued)
as of August 31, 2021
| Description | Interest Rate | Maturity Date | Principal Amount (000)# | Value | ||||||||||||
| ASSET-BACKED SECURITIES (Continued) | ||||||||||||||||
| Collateralized Loan Obligations (cont'd.) | ||||||||||||||||
BlueMountain CLO XXII Ltd. (Cayman Islands), Series 2018-22A, Class A1, 144A, 3 Month LIBOR + 1.080% | 1.206 | %(c) | 07/15/31 | 4,500 | $ | 4,500,000 | ||||||||||
Brookside Mill CLO Ltd. (Cayman Islands), Series 2013-1A, Class AR, 144A, 3 Month LIBOR + 0.820% | 0.954 | (c) | 01/17/28 | 2,728 | 2,727,780 | |||||||||||
Canyon Capital CLO Ltd. (Cayman Islands), Series 2017-1A, Class AR, 144A, 3 Month LIBOR + 1.000% | 1.112 | (c) | 07/15/30 | 15,000 | 14,996,274 | |||||||||||
Carlyle US CLO Ltd. (Cayman Islands), Series 2017-1A, Class A1R, 144A, 3 Month LIBOR + 1.000% | 1.134 | (c) | 04/20/31 | 13,000 | 12,999,973 | |||||||||||
Catamaran CLO Ltd. (Cayman Islands), Series 2013-1A, Class AR, 144A, 3 Month LIBOR + 0.850% | 0.979 | (c) | 01/27/28 | 159 | 158,470 | |||||||||||
CIFC Funding Ltd. (Cayman Islands), | ||||||||||||||||
Series 2013-3RA, Class A1, 144A, 3 Month LIBOR + 0.980% | 1.105 | (c) | 04/24/31 | 2,000 | 2,000,332 | |||||||||||
Series 2017-1A, Class AR, 144A, 3 Month LIBOR + 1.010% | 1.144 | (c) | 04/23/29 | 4,997 | 4,996,998 | |||||||||||
Series 2017-2A, Class AR, 144A, 3 Month LIBOR + 0.950% | 1.084 | (c) | 04/20/30 | 15,000 | 14,983,082 | |||||||||||
Elevation CLO Ltd. (Cayman Islands), | ||||||||||||||||
Series 2014-2A, Class A1R, 144A, 3 Month LIBOR + 1.230% | 1.356 | (c) | 10/15/29 | 1,500 | 1,500,040 | |||||||||||
Series 2017-7A, Class A, 144A, 3 Month LIBOR + 1.220% | 1.346 | (c) | 07/15/30 | 1,708 | 1,708,077 | |||||||||||
Ellington CLO IV Ltd. (Cayman Islands), Series 2019-4A, Class AR, 144A, 3 Month LIBOR + 1.580% | 1.706 | (c) | 04/15/29 | 12,000 | 11,992,628 | |||||||||||
HPS Loan Management Ltd. (Cayman Islands), Series 11A-17, Class AR, 144A, 3 Month LIBOR + 1.020% | 1.142 | (c) | 05/06/30 | 3,500 | 3,501,741 | |||||||||||
ICG US CLO Ltd. (Cayman Islands), Series 2014-3A, Class A1RR, 144A, 3 Month LIBOR + 1.030% | 1.155 | (c) | 04/25/31 | 7,083 | 7,078,471 | |||||||||||
JMP Credit Advisors CLO IV Ltd. (Cayman Islands), Series 2017-1A, Class AR, 144A, 3 Month LIBOR + 1.280% | 1.414 | (c) | 07/17/29 | 12,068 | 12,064,728 | |||||||||||
KKR CLO Ltd. (Cayman Islands), Series 11, Class AR, 144A, 3 Month LIBOR + 1.180% | 1.306 | (c) | 01/15/31 | 1,000 | 999,707 | |||||||||||
See Notes to Financial Statements.
| 26 |
| Description | Interest Rate | Maturity Date | Principal Amount (000)# | Value | ||||||||||||
| ASSET-BACKED SECURITIES (Continued) | ||||||||||||||||
| Collateralized Loan Obligations (cont'd.) | ||||||||||||||||
KVK CLO Ltd. (Cayman Islands), Series 2018-1A, Class A, 144A, 3 Month LIBOR + 0.930% | 1.061 | %(c) | 05/20/29 | 1,931 | $ | 1,928,889 | ||||||||||
Madison Park Funding XXX Ltd. (Cayman Islands), Series 2018-30A, Class A, 144A, 3 Month LIBOR + 0.750% | 0.876 | (c) | 04/15/29 | 13,366 | 13,367,926 | |||||||||||
Madison Park Funding XXXVIII Ltd. (Cayman Islands), Series 2021-38A, Class X, 144A, 3 Month LIBOR + 0.950% | 1.084 | (c) | 07/17/34 | 3,500 | 3,499,918 | |||||||||||
Magnetite XVI Ltd. (Cayman Islands), Series 2015-16A, Class AR, 144A, 3 Month LIBOR + 0.800% | 0.934 | (c) | 01/18/28 | 2,404 | 2,402,943 | |||||||||||
Man GLG US CLO Ltd. (Cayman Islands), Series 2018-2A, Class A1R, 144A, 3 Month LIBOR + 1.240% | 1.366 | (c) | 10/15/28 | 1,875 | 1,875,458 | |||||||||||
Midocean Credit CLO IX (Cayman Islands), Series 2018-9A, Class A1, 144A, 3 Month LIBOR + 1.150% | 1.284 | (c) | 07/20/31 | 5,250 | 5,249,991 | |||||||||||
Midocean Credit CLO V (Cayman Islands), Series 2016-5A, Class AR, 144A, 3 Month LIBOR + 1.120% | 1.254 | (c) | 07/19/28 | 6,007 | 6,007,349 | |||||||||||
Mountain View CLO Ltd. (Cayman Islands), Series 2013-1A, Class ARR, 144A, 3 Month LIBOR + 1.000% | 1.138 | (c) | 10/12/30 | 13,500 | 13,500,432 | |||||||||||
Oaktree CLO Ltd. (Cayman Islands), Series 2015-1A, Class A1R, 144A, 3 Month LIBOR + 0.870% | 1.004 | (c) | 10/20/27 | 1,583 | 1,583,145 | |||||||||||
Ocean Trails CLO VII (Cayman Islands), Series 2019-7A, Class AR, 144A, 3 Month LIBOR + 1.010% | 1.144 | (c) | 04/17/30 | 5,000 | 4,999,503 | |||||||||||
OCP CLO Ltd. (Cayman Islands), Series 2017-13A, Class A1A, 144A, 3 Month LIBOR + 1.260% | 1.386 | (c) | 07/15/30 | 4,400 | 4,400,000 | |||||||||||
Octagon Investment Partners 31 LLC (Cayman Islands), Series 2017-1A, Class AR, 144A, 3 Month LIBOR + 1.050% | 1.184 | (c) | 07/20/30 | 8,000 | 7,990,799 | |||||||||||
OZLM VI Ltd. (Cayman Islands), Series 2014-6A, Class A1S, 144A, 3 Month LIBOR + 1.080% | 1.214 | (c) | 04/17/31 | 8,867 | 8,863,978 | |||||||||||
OZLM XII Ltd. (Cayman Islands), Series 2015-12A, Class A1R, 144A, 3 Month LIBOR + 1.050% | 1.179 | (c) | 04/30/27 | 91 | 91,292 | |||||||||||
OZLM XIII Ltd. (Cayman Islands), Series 2015-13A, Class A1R, 144A, 3 Month LIBOR + 1.080% | 1.209 | (c) | 07/30/27 | 125 | 125,337 | |||||||||||
See Notes to Financial Statements.
PGIM Fixed Income ETFs | 27 |
PGIM Ultra Short Bond ETF
Schedule of Investments (continued)
as of August 31, 2021
| Description | Interest Rate | Maturity Date | Principal Amount (000)# | Value | ||||||||||||
| ASSET-BACKED SECURITIES (Continued) | ||||||||||||||||
| Collateralized Loan Obligations (cont'd.) | ||||||||||||||||
| Palmer Square CLO Ltd. (Cayman Islands), | ||||||||||||||||
Series 2014-1A, Class A1R2, 144A, 3 Month LIBOR + 1.130% | 1.264 | %(c) | 01/17/31 | 1,250 | $ | 1,249,645 | ||||||||||
Series 2015-2A, Class A1R2, 144A, 3 Month LIBOR + 1.100% | 1.234 | (c) | 07/20/30 | 1,400 | 1,399,293 | |||||||||||
Park Avenue Institutional Advisers CLO Ltd. (Cayman Islands), Series 2018-1A, Class A1AR, 144A, 3 Month LIBOR + 1.000% | 1.134 | (c) | 10/20/31 | 10,000 | 10,005,001 | |||||||||||
Race Point VIII CLO Ltd. (Cayman Islands), Series 2013-8A, Class AR2, 144A, 3 Month LIBOR + 1.040% | 1.171 | (c) | 02/20/30 | 9,873 | 9,876,034 | |||||||||||
Sound Point CLO VII-R Ltd. (Cayman Islands), Series 2014-3RA, Class A1R, 144A, 3 Month LIBOR + 1.070% | 1.208 | (c) | 10/23/31 | 10,000 | 9,996,496 | |||||||||||
Sound Point CLO XVII Ltd. (Cayman Islands), Series 2017-3A, Class A1R, 144A, 3 Month LIBOR + 0.980% | 1.114 | (c) | 10/20/30 | 10,000 | 9,986,639 | |||||||||||
Sound Point CLO XXII Ltd. (Cayman Islands), Series 2019-1A, Class AR, 144A, 3 Month LIBOR + 1.080% | 1.193 | (c) | 01/20/32 | 13,000 | 12,971,128 | |||||||||||
TCW CLO Ltd. (Cayman Islands), Series 2017-1A, Class AR, 144A, 3 Month LIBOR + 1.030% | 1.160 | (c) | 07/29/29 | 5,500 | 5,497,838 | |||||||||||
TICP CLO III-2 Ltd. (Cayman Islands), Series 2018-3R, Class A, 144A, 3 Month LIBOR + 0.840% | 0.974 | (c) | 04/20/28 | 1,612 | 1,611,693 | |||||||||||
Trinitas CLO IV Ltd. (Cayman Islands), Series 2016-4A, Class A1L2, 144A, 3 Month LIBOR + 1.100% | 1.234 | (c) | 10/18/31 | 12,000 | 12,000,737 | |||||||||||
Trinitas CLO V Ltd. (Cayman Islands), Series 2016-5A, Class ARR, 144A, 3 Month LIBOR + 1.030% | 1.155 | (c) | 10/25/28 | 6,480 | 6,478,119 | |||||||||||
Venture XXI CLO Ltd. (Cayman Islands), Series 2015-21A, Class AR, 144A, 3 Month LIBOR + 0.880% | 1.006 | (c) | 07/15/27 | 453 | 452,900 | |||||||||||
Venture XXIV CLO Ltd. (Cayman Islands), Series 2016-24A, Class ARR, 144A, 3 Month LIBOR + 0.900% | 1.034 | (c) | 10/20/28 | 9,599 | 9,596,015 | |||||||||||
| Voya CLO Ltd. (Cayman Islands), | ||||||||||||||||
Series 2014-1A, Class AAR2, 144A, 3 Month LIBOR + 0.990% | 1.124 | (c) | 04/18/31 | 1,864 | 1,864,473 | |||||||||||
See Notes to Financial Statements.
| 28 |
| Description | Interest Rate | Maturity Date | Principal Amount (000)# | Value | ||||||||||||
| ASSET-BACKED SECURITIES (Continued) | ||||||||||||||||
| Collateralized Loan Obligations (cont'd.) | ||||||||||||||||
| Voya CLO Ltd. (Cayman Islands), (cont'd.) | ||||||||||||||||
Series 2014-2A, Class A1RR, 144A, 3 Month LIBOR + 1.020% | 1.154 | %(c) | 04/17/30 | 1,689 | $ | 1,689,444 | ||||||||||
| Wellfleet CLO Ltd. (Cayman Islands), | ||||||||||||||||
Series 2015-1A, Class AR3, 144A, 3 Month LIBOR + 1.280% | 1.414 | (c) | 07/20/29 | 7,945 | 7,945,129 | |||||||||||
Series 2016-2A, Class A1R, 144A, 3 Month LIBOR + 1.140% | 1.274 | (c) | 10/20/28 | 5,016 | 5,015,512 | |||||||||||
Series 2017-2A, Class A1R, 144A, 3 Month LIBOR + 1.060% | 1.194 | (c) | 10/20/29 | 1,750 | 1,749,917 | |||||||||||
York CLO-2 Ltd. (Cayman Islands), Series 2015-1A, Class AR, 144A, 3 Month LIBOR + 1.150% | 1.288 | (c) | 01/22/31 | 10,340 | 10,339,969 | |||||||||||
Zais CLO 7 Ltd. (Cayman Islands), Series 2017-2A, Class A, 144A, 3 Month LIBOR + 1.290% | 1.416 | (c) | 04/15/30 | 244 | 244,268 | |||||||||||
Zais CLO 8 Ltd. (Cayman Islands), Series 2018-1A, Class A, 144A, 3 Month LIBOR + 0.950% | 1.076 | (c) | 04/15/29 | 831 | 830,829 | |||||||||||
|
| |||||||||||||||
| 340,157,723 | ||||||||||||||||
|
| |||||||||||||||
TOTAL ASSET-BACKED SECURITIES |
| 357,943,305 | ||||||||||||||
|
| |||||||||||||||
| COMMERCIAL MORTGAGE-BACKED SECURITIES 13.6% | ||||||||||||||||
| BANK, | ||||||||||||||||
Series 2017-BNK5, Class A1 | 1.909 | 06/15/60 | 256 | 256,524 | ||||||||||||
Series 2017-BNK7, Class A1 | 1.984 | 09/15/60 | 16 | 15,983 | ||||||||||||
Series 2017-BNK9, Class A1 | 2.322 | 11/15/54 | 395 | 397,138 | ||||||||||||
Series 2018-BN14, Class A1 | 3.277 | 09/15/60 | 384 | 393,444 | ||||||||||||
| Benchmark Mortgage Trust, | ||||||||||||||||
Series 2018-B1, Class A1 | 2.560 | 01/15/51 | 325 | 326,909 | ||||||||||||
Series 2018-B2, Class A2 | 3.662 | 02/15/51 | 975 | 1,006,019 | ||||||||||||
Series 2018-B3, Class A2 | 3.848 | 04/10/51 | 960 | 998,056 | ||||||||||||
Series 2018-B5, Class A2 | 4.077 | 07/15/51 | 800 | 840,661 | ||||||||||||
CCUBS Commercial Mortgage Trust, Series 2017-C1, Class A1 | 2.288 | (cc) | 11/15/50 | 2,130 | 2,141,570 | |||||||||||
CGMS Commercial Mortgage Trust, Series 2017-B1, Class A1 | 2.008 | 08/15/50 | 88 | 88,236 | ||||||||||||
| Citigroup Commercial Mortgage Trust, | ||||||||||||||||
Series 2014-GC21, Class AAB | 3.477 | 05/10/47 | 291 | 302,446 | ||||||||||||
Series 2014-GC23, Class AAB | 3.337 | 07/10/47 | 797 | 828,999 | ||||||||||||
Series 2014-GC25, Class A3 | 3.372 | 10/10/47 | 7,219 | 7,650,932 | ||||||||||||
Series 2016-P4, Class A2 | 2.450 | 07/10/49 | 4,422 | 4,436,939 | ||||||||||||
Series 2017-P8, Class A1 | 2.065 | 09/15/50 | 320 | 321,828 | ||||||||||||
See Notes to Financial Statements.
PGIM Fixed Income ETFs | 29 |
PGIM Ultra Short Bond ETF
Schedule of Investments (continued)
as of August 31, 2021
| Description | Interest Rate | Maturity Date | Principal Amount (000)# | Value | ||||||||||||
| COMMERCIAL MORTGAGE-BACKED SECURITIES (Continued) | ||||||||||||||||
| COMM Mortgage Trust, | ||||||||||||||||
Series 2012-CR4, Class A3 | 2.853 | % | 10/15/45 | 2,704 | $ | 2,760,391 | ||||||||||
Series 2012-CR5, Class A4 | 2.771 | 12/10/45 | 4,750 | 4,864,879 | ||||||||||||
Series 2013-CR11, Class ASB | 3.660 | 08/10/50 | 498 | 512,216 | ||||||||||||
Series 2013-CR7, Class ASB | 2.739 | 03/10/46 | 228 | 230,876 | ||||||||||||
Series 2013-CR8, Class A4 | 3.334 | 06/10/46 | 454 | 463,254 | ||||||||||||
Series 2013-CR8, Class A5 | 3.612 | (cc) | 06/10/46 | 5,081 | 5,322,412 | |||||||||||
Series 2014-CR17, Class ASB | 3.598 | 05/10/47 | 402 | 416,472 | ||||||||||||
Series 2014-UBS2, Class ASB | 3.472 | 03/10/47 | 852 | 882,450 | ||||||||||||
Series 2014-UBS5, Class A4 | 3.838 | 09/10/47 | 10,000 | 10,847,008 | ||||||||||||
Series 2015-CR22, Class A3 | 3.207 | 03/10/48 | 2,000 | 2,012,910 | ||||||||||||
Series 2015-CR23, Class ASB | 3.257 | 05/10/48 | 1,568 | 1,634,786 | ||||||||||||
Series 2015-CR24, Class ASB | 3.445 | 08/10/48 | 2,901 | 3,044,175 | ||||||||||||
Series 2015-DC1, Class A2 | 2.870 | 02/10/48 | 194 | 194,184 | ||||||||||||
Series 2015-LC23, Class A2 | 3.221 | 10/10/48 | 683 | 688,658 | ||||||||||||
Series 2017-COR2, Class A1 | 2.111 | 09/10/50 | 85 | 85,986 | ||||||||||||
| CSAIL Commercial Mortgage Trust, | ||||||||||||||||
Series 2015-C3, Class A4 | 3.718 | 08/15/48 | 8,000 | 8,730,810 | ||||||||||||
Series 2016-C5, Class ASB | 3.533 | 11/15/48 | 3,540 | 3,738,589 | ||||||||||||
| DBJPM Mortgage Trust, | ||||||||||||||||
Series 2016-C3, Class A2 | 1.886 | 08/10/49 | 97 | 97,372 | ||||||||||||
Series 2017-C6, Class A3 | 3.269 | 06/10/50 | 5,400 | 5,651,252 | ||||||||||||
Freddie Mac STACR REMIC Trust, Series 2021-DNA5, Class M1, 144A, SOFR30A + 0.650% | 0.700 | (c) | 01/25/34 | 1,628 | 1,628,011 | |||||||||||
GS Mortgage Securities Corp. Trust, Series 2021-RENT, Class A, 144A, 1 Month LIBOR + 0.700% | 0.788 | (c) | 11/21/35 | 5,425 | 5,432,271 | |||||||||||
| GS Mortgage Securities Trust, | ||||||||||||||||
Series 2014-GC22, Class AAB | 3.467 | 06/10/47 | 500 | 518,116 | ||||||||||||
Series 2017-GS7, Class A1 | 1.950 | 08/10/50 | 605 | 607,561 | ||||||||||||
| JP Morgan Chase Commercial Mortgage Securities Trust, | ||||||||||||||||
Series 2012-C6, Class ASB | 3.144 | 05/15/45 | 542 | 544,971 | ||||||||||||
Series 2012-C8, Class A3 | 2.829 | 10/15/45 | 3,024 | 3,070,610 | ||||||||||||
Series 2013-LC11, Class A5 | 2.960 | 04/15/46 | 7,287 | 7,510,172 | ||||||||||||
Series 2016-JP2, Class ASB | 2.713 | 08/15/49 | 8,284 | 8,643,802 | ||||||||||||
| JPMBB Commercial Mortgage Securities Trust, | ||||||||||||||||
Series 2013-C12, Class A4 | 3.363 | 07/15/45 | 2,904 | 2,994,307 | ||||||||||||
Series 2013-C12, Class ASB | 3.157 | 07/15/45 | 316 | 318,678 | ||||||||||||
Series 2013-C14, Class ASB | 3.761 | (cc) | 08/15/46 | 7,300 | 7,547,243 | |||||||||||
Series 2014-C18, Class A4A2, 144A | 3.794 | 02/15/47 | 4,170 | 4,402,032 | ||||||||||||
Series 2014-C25, Class ASB | 3.407 | 11/15/47 | 3,863 | 4,036,413 | ||||||||||||
JPMCC Commercial Mortgage Securities Trust, | 1.969 | 09/15/50 | 219 | 219,639 | ||||||||||||
See Notes to Financial Statements.
| 30 |
| Description | Interest Rate | Maturity Date | Principal Amount (000)# | Value | ||||||||||||
| COMMERCIAL MORTGAGE-BACKED SECURITIES (Continued) | ||||||||||||||||
| Morgan Stanley Bank of America Merrill Lynch Trust, | ||||||||||||||||
Series 2012-C6, Class A4 | 2.858 | % | 11/15/45 | 1,413 | $ | 1,434,719 | ||||||||||
Series 2013-C12, Class ASB | 3.824 | 10/15/46 | 5,195 | 5,343,515 | ||||||||||||
Series 2013-C8, Class A4 | 3.134 | 12/15/48 | 4,750 | 4,874,513 | ||||||||||||
Series 2013-C9, Class AAB | 2.657 | 05/15/46 | 434 | 440,440 | ||||||||||||
Series 2014-C19, Class ASB | 3.326 | 12/15/47 | 5,757 | 5,992,443 | ||||||||||||
Series 2015-C23, Class ASB | 3.398 | 07/15/50 | 1,963 | 2,053,388 | ||||||||||||
Series 2017-C34, Class A1 | 2.109 | 11/15/52 | 15 | 15,072 | ||||||||||||
| Morgan Stanley Capital I Trust, | ||||||||||||||||
Series 2016-UB12, Class A2 | 2.932 | 12/15/49 | 5,029 | 5,036,983 | ||||||||||||
Series 2018-H3, Class A2 | 3.997 | 07/15/51 | 1,000 | 1,051,548 | ||||||||||||
| MSG III Securitization Trust, | ||||||||||||||||
Series 2021-1, Class A, 144A, 1 Month LIBOR + 0.750% | 0.841 | (c) | 06/25/54 | 4,480 | 4,474,428 | |||||||||||
Series 2021-1, Class B, 144A, 1 Month LIBOR + 0.900% | 0.991 | (c) | 06/25/54 | 650 | 648,198 | |||||||||||
Series 2021-1, Class C, 144A, 1 Month LIBOR + 1.100% | 1.191 | (c) | 06/25/54 | 530 | 528,533 | |||||||||||
Series 2021-1, Class D, 144A, 1 Month LIBOR + 1.300% | 1.391 | (c) | 06/25/54 | 200 | 199,448 | |||||||||||
One New York Plaza Trust, Series 2020-1NYP, Class A, 144A, 1 Month LIBOR + 0.950% | 1.046 | (c) | 01/15/26 | 4,925 | 4,948,365 | |||||||||||
| Station Place Securitization Trust, | ||||||||||||||||
Series 2021-4, Class A, 144A, 1 Month LIBOR + 0.900% | 0.986 | (c) | 04/11/22 | 6,500 | 6,493,722 | |||||||||||
Series 2021-8, Class A, 144A, 1 Month LIBOR + 0.800% | 0.886 | (c) | 06/20/22 | 9,450 | 9,457,352 | |||||||||||
| UBS Commercial Mortgage Trust, | ||||||||||||||||
Series 2012-C1, Class A3 | 3.400 | 05/10/45 | 1,177 | 1,181,913 | ||||||||||||
Series 2017-C4, Class A1 | 2.129 | 10/15/50 | 8 | 8,088 | ||||||||||||
Series 2017-C5, Class A1 | 2.139 | 11/15/50 | 277 | 278,212 | ||||||||||||
Series 2017-C6, Class A1 | 2.344 | 12/15/50 | 2,849 | 2,870,747 | ||||||||||||
Series 2018-C11, Class A1 | 3.211 | 06/15/51 | 5 | 4,707 | ||||||||||||
Series 2018-C8, Class A1 | 2.659 | 02/15/51 | 1,106 | 1,115,937 | ||||||||||||
Series 2018-C8, Class A2 | 3.713 | 02/15/51 | 1,950 | 2,015,449 | ||||||||||||
| UBS-Barclays Commercial Mortgage Trust, | ||||||||||||||||
Series 2012-C3, Class A4 | 3.091 | 08/10/49 | 8,769 | 8,929,894 | ||||||||||||
Series 2012-C4, Class A5 | 2.850 | 12/10/45 | 11,500 | 11,740,416 | ||||||||||||
Series 2013-C5, Class A4 | 3.185 | 03/10/46 | 8,311 | 8,541,540 | ||||||||||||
Series 2013-C6, Class A4 | 3.244 | 04/10/46 | 16,009 | 16,542,075 | ||||||||||||
| Wells Fargo Commercial Mortgage Trust, | ||||||||||||||||
Series 2013-LC12, Class A4 | 4.218 | (cc) | 07/15/46 | 17,500 | 18,445,430 | |||||||||||
Series 2013-LC12, Class ASB | 3.928 | (cc) | 07/15/46 | 4,783 | 4,946,788 | |||||||||||
See Notes to Financial Statements.
PGIM Fixed Income ETFs | 31 |
PGIM Ultra Short Bond ETF
Schedule of Investments (continued)
as of August 31, 2021
| Description | Interest Rate | Maturity Date | Principal Amount (000)# | Value | ||||||||||||
| COMMERCIAL MORTGAGE-BACKED SECURITIES (Continued) | ||||||||||||||||
| Wells Fargo Commercial Mortgage Trust, (cont'd.) | ||||||||||||||||
Series 2015-NXS2, Class A2 | 3.020 | % | 07/15/58 | 210 | $ | 214,538 | ||||||||||
Series 2016-C34, Class ASB | 2.911 | 06/15/49 | 4,754 | 4,983,208 | ||||||||||||
Series 2017-C42, Class A1 | 2.338 | 12/15/50 | 657 | 661,510 | ||||||||||||
|
| |||||||||||||||
TOTAL COMMERCIAL MORTGAGE-BACKED SECURITIES |
| 255,131,309 | ||||||||||||||
|
| |||||||||||||||
| CORPORATE BONDS 45.9% | ||||||||||||||||
| Advertising 0.4% | ||||||||||||||||
Interpublic Group of Cos, Inc. (The), Sr. Unsec’d. Notes | 3.750 | 10/01/21 | 8,496 | 8,519,733 | ||||||||||||
| Aerospace & Defense 0.1% | ||||||||||||||||
Lockheed Martin Corp., Sr. Unsec’d. Notes | 3.350 | 09/15/21 | 1,556 | 1,557,752 | ||||||||||||
| Agriculture 0.2% | ||||||||||||||||
Cargill, Inc., Sr. Unsec’d. Notes, 144A | 1.375 | 07/23/23 | 1,000 | 1,019,943 | ||||||||||||
Philip Morris International, Inc., Sr. Unsec’d. Notes | 1.125 | 05/01/23 | 3,000 | 3,039,304 | ||||||||||||
|
| |||||||||||||||
| 4,059,247 | ||||||||||||||||
| Airlines 0.4% | ||||||||||||||||
Southwest Airlines Co., Sr. Unsec’d. Notes(a) | 4.750 | 05/04/23 | 7,500 | 8,010,529 | ||||||||||||
| Apparel 0.4% | ||||||||||||||||
VF Corp., Sr. Unsec’d. Notes | 2.050 | 04/23/22 | 8,000 | 8,086,286 | ||||||||||||
| Auto Manufacturers 1.8% | ||||||||||||||||
American Honda Finance Corp., Sr. Unsec’d. Notes, MTN, 3 Month LIBOR + 0.290% | 0.418 | (c) | 12/10/21 | 750 | 750,384 | |||||||||||
| BMW US Capital LLC, | ||||||||||||||||
Gtd. Notes, 144A | 1.850 | 09/15/21 | 1,668 | 1,668,956 | ||||||||||||
Gtd. Notes, 144A | 3.800 | 04/06/23 | 4,000 | 4,209,992 | ||||||||||||
Gtd. Notes, 144A, SOFR + 0.530% | 0.580 | (c) | 04/01/24 | 4,000 | 4,040,055 | |||||||||||
Daimler Finance North America LLC, Gtd. Notes, 144A | 0.750 | 03/01/24 | 13,500 | 13,518,589 | ||||||||||||
Toyota Motor Credit Corp., Sr. Unsec’d. Notes, MTN, SOFR + 0.300% | 0.350 | (c) | 06/13/22 | 10,000 | 10,011,989 | |||||||||||
|
| |||||||||||||||
| 34,199,965 | ||||||||||||||||
| Banks 13.7% | ||||||||||||||||
Banco del Estado de Chile (Chile), Sr. Unsec’d. Notes, 144A | 3.875 | 02/08/22 | 4,045 | 4,102,297 | ||||||||||||
See Notes to Financial Statements.
| 32 |
| Description | Interest Rate | Maturity Date | Principal Amount (000)# | Value | ||||||||||||
| CORPORATE BONDS (Continued) | ||||||||||||||||
| Banks (cont'd.) | ||||||||||||||||
Banco Santander SA (Spain), Sr. Unsec’d. Notes | 3.500 | % | 04/11/22 | 10,400 | $ | 10,601,186 | ||||||||||
Bank of America Corp., Sr. Unsec’d. Notes, MTN, 3 Month BSBY + 0.430% | 0.529 | (c) | 05/28/24 | 15,000 | 15,026,312 | |||||||||||
Bank of Nova Scotia (The) (Canada), Sr. Unsec’d. Notes | 1.625 | 05/01/23 | 6,000 | 6,132,710 | ||||||||||||
Banque Federative du Credit Mutuel SA (France), Sr. Unsec’d. Notes, 144A | 0.650 | 02/27/24 | 7,250 | 7,253,807 | ||||||||||||
Barclays Bank PLC (United Kingdom), Sr. Unsec’d. Notes | 1.700 | 05/12/22 | 10,000 | 10,090,486 | ||||||||||||
Canadian Imperial Bank of Commerce (Canada), Sr. Unsec’d. Notes, SOFR + 0.800% | 0.850 | (c) | 03/17/23 | 6,000 | 6,057,155 | |||||||||||
Citizens Bank NA, Sr. Unsec’d. Notes, BKNT, 3 Month LIBOR + 0.810% | 0.932 | (c) | 05/26/22 | 8,500 | 8,542,359 | |||||||||||
Commonwealth Bank of Australia (Australia), Sr. Unsec’d. Notes, 144A, 3 Month LIBOR + 0.700% | 0.828 | (c) | 03/10/22 | 5,000 | 5,017,270 | |||||||||||
Cooperatieve Rabobank UA (Netherlands), Sr. Unsec’d. Notes, SOFR + 0.300% | 0.350 | (c) | 01/12/24 | 5,500 | 5,508,213 | |||||||||||
Credit Agricole Corporate & Investment Bank SA (France), MTN | 0.400 | 01/15/23 | 11,600 | 11,604,098 | ||||||||||||
| Credit Suisse AG (Switzerland), | ||||||||||||||||
Sr. Unsec’d. Notes, SOFR + 0.390% | 0.440 | (c) | 02/02/24 | 3,750 | 3,749,895 | |||||||||||
Sr. Unsec’d. Notes, SOFR + 0.450% | 0.500 | (c) | 02/04/22 | 5,000 | 5,006,428 | |||||||||||
DIB Sukuk Ltd. (Cayman Islands), Sr. Unsec’d. Notes | 3.664 | 02/14/22 | 2,400 | 2,428,364 | ||||||||||||
Fifth Third Bank NA, Sr. Unsec’d. Notes, BKNT | 1.800 | 01/30/23 | 5,000 | 5,104,354 | ||||||||||||
| Goldman Sachs Group, Inc. (The), | ||||||||||||||||
Sr. Unsec’d. Notes | 5.750 | 01/24/22 | 3,000 | 3,065,177 | ||||||||||||
Sr. Unsec’d. Notes, 3 Month LIBOR + 1.053% | 2.908 | (cc) | 06/05/23 | 7,314 | 7,451,290 | |||||||||||
Sr. Unsec’d. Notes, SOFR + 0.538% | 0.627 | (cc) | 11/17/23 | 5,000 | 5,007,020 | |||||||||||
Huntington National Bank (The), Sr. Unsec’d. Notes | 1.800 | 02/03/23 | 6,000 | 6,121,508 | ||||||||||||
Industrial & Commercial Bank of China Ltd. (China), Sr. Unsec’d. Notes | 2.452 | 10/20/21 | 1,864 | 1,868,318 | ||||||||||||
ING Groep NV (Netherlands), Sr. Unsec’d. Notes, 3 Month LIBOR + 1.150% | 1.296 | (c) | 03/29/22 | 10,500 | 10,564,002 | |||||||||||
JPMorgan Chase & Co., Sr. Unsec’d. Notes, SOFR + 0.490% | 0.768 | (cc) | 08/09/25 | 15,000 | 14,970,449 | |||||||||||
| Mitsubishi UFJ Financial Group, Inc. (Japan), | ||||||||||||||||
Sr. Unsec’d. Notes | 2.623 | 07/18/22 | 3,500 | 3,572,408 | ||||||||||||
Sr. Unsec’d. Notes | 2.665 | 07/25/22 | 3,044 | 3,109,167 | ||||||||||||
| Morgan Stanley, | ||||||||||||||||
Sr. Unsec’d. Notes | 2.750 | 05/19/22 | 3,000 | 3,054,265 | ||||||||||||
Sr. Unsec’d. Notes, MTN | 2.625 | 11/17/21 | 3,000 | 3,015,198 | ||||||||||||
Sr. Unsec’d. Notes, MTN, 3 Month LIBOR + 1.400% | 1.525 | (c) | 10/24/23 | 4,750 | 4,815,946 | |||||||||||
See Notes to Financial Statements.
PGIM Fixed Income ETFs | 33 |
PGIM Ultra Short Bond ETF
Schedule of Investments (continued)
as of August 31, 2021
| Description | Interest Rate | Maturity Date | Principal Amount (000)# | Value | ||||||||||||
| CORPORATE BONDS (Continued) | ||||||||||||||||
| Banks (cont'd.) | ||||||||||||||||
| National Securities Clearing Corp., | ||||||||||||||||
Sr. Unsec’d. Notes, 144A | 0.400 | % | 12/07/23 | 3,750 | $ | 3,757,982 | ||||||||||
Sr. Unsec’d. Notes, 144A | 1.200 | 04/23/23 | 3,000 | 3,042,739 | ||||||||||||
Nordea Bank Abp (Finland), Sr. Unsec’d. Notes, 144A | 0.625 | 05/24/24 | 9,500 | 9,521,088 | ||||||||||||
PNC Bank NA, Sr. Unsec’d. Notes, BKNT, 3 Month LIBOR + 0.325% | 0.453 | (c) | 02/24/23 | 3,000 | 3,003,688 | |||||||||||
RHB Bank Bhd (Malaysia), Sr. Unsec’d. Notes, EMTN | 2.503 | 10/06/21 | 1,300 | 1,302,342 | ||||||||||||
Royal Bank of Canada (Canada), Sr. Unsec’d. Notes, GMTN, 3 Month LIBOR + 0.730% | 0.848 | (c) | 02/01/22 | 5,050 | 5,064,987 | |||||||||||
Santander UK PLC (United Kingdom), Sr. Unsec’d. Notes, 3 Month LIBOR + 0.660% | 0.785 | (c) | 11/15/21 | 1,000 | 1,001,173 | |||||||||||
Skandinaviska Enskilda Banken AB (Sweden), 144A | 0.650 | 09/09/24 | 11,250 | 11,234,025 | ||||||||||||
Skysea International Capital Management Ltd. (British Virgin Islands), Gtd. Notes, EMTN | 4.875 | 12/07/21 | 4,300 | 4,348,479 | ||||||||||||
Standard Chartered PLC (United Kingdom), Sr. Unsec’d. Notes, 144A, 3 Month LIBOR + 1.200% | 1.328 | (c) | 09/10/22 | 10,000 | 10,002,022 | |||||||||||
Toronto-Dominion Bank (The) (Canada), Sr. Unsec’d. Notes, MTN, SOFR + 0.480% | 0.530 | (c) | 01/27/23 | 7,138 | 7,172,388 | |||||||||||
| Truist Bank, | ||||||||||||||||
Sr. Unsec’d. Notes, BKNT, 3 Month LIBOR + 0.590% | 0.714 | (c) | 05/17/22 | 3,000 | 3,011,057 | |||||||||||
Sr. Unsec’d. Notes, BKNT, SOFR + 0.730% | 0.776 | (c) | 03/09/23 | 2,000 | 2,014,247 | |||||||||||
| UBS AG (Switzerland), | ||||||||||||||||
Sr. Unsec’d. Notes, 144A | 0.450 | 02/09/24 | 3,000 | 2,988,644 | ||||||||||||
Sr. Unsec’d. Notes, 144A, SOFR + 0.360% | 0.410 | (c) | 02/09/24 | 4,500 | 4,524,103 | |||||||||||
US Bank NA, Sr. Unsec’d. Notes, BKNT, 3 Month LIBOR + 0.440% | 0.571 | (c) | 05/23/22 | 3,700 | 3,709,759 | |||||||||||
Wells Fargo Bank NA, Sr. Unsec’d. Notes, BKNT, 3 Month LIBOR + 0.650% | 2.082 | (cc) | 09/09/22 | 8,000 | 8,002,960 | |||||||||||
|
| |||||||||||||||
| 256,541,365 | ||||||||||||||||
| Beverages 0.7% | ||||||||||||||||
Coca-Cola Europacific Partners PLC (United Kingdom), | ||||||||||||||||
Sr. Unsec’d. Notes, 144A | 0.500 | 05/05/23 | 5,600 | 5,594,732 | ||||||||||||
Sr. Unsec’d. Notes, 144A | 0.800 | 05/03/24 | 3,000 | 2,996,413 | ||||||||||||
PepsiCo, Inc., Sr. Unsec’d. Notes | 0.400 | 10/07/23 | 5,500 | 5,518,168 | ||||||||||||
|
| |||||||||||||||
| 14,109,313 | ||||||||||||||||
See Notes to Financial Statements.
| 34 |
| Description | Interest Rate | Maturity Date | Principal Amount (000)# | Value | ||||||||||
| CORPORATE BONDS (Continued) | ||||||||||||||
| Biotechnology 0.3% | ||||||||||||||
Gilead Sciences, Inc., | ||||||||||||||
Sr. Unsec’d. Notes | 0.750% | 09/29/23 | 3,000 | $ | 3,000,761 | |||||||||
Sr. Unsec’d. Notes, 3 Month LIBOR + 0.520% | 0.666(c) | 09/29/23 | 3,000 | 3,000,763 | ||||||||||
|
| |||||||||||||
| 6,001,524 | ||||||||||||||
| Building Materials 0.1% | ||||||||||||||
Martin Marietta Materials, Inc., Sr. Unsec’d. Notes | 0.650 | 07/15/23 | 2,250 | 2,255,585 | ||||||||||
| Chemicals 0.4% | ||||||||||||||
Air Liquide Finance SA (France), Gtd. Notes, 144A | 2.250 | 09/27/23 | 1,000 | 1,035,249 | ||||||||||
Nutrien Ltd. (Canada), Sr. Unsec’d. Notes | 1.900 | 05/13/23 | 3,000 | 3,069,492 | ||||||||||
Westlake Chemical Corp., Sr. Unsec’d. Notes | 0.875 | 08/15/24 | 2,750 | 2,752,057 | ||||||||||
|
| |||||||||||||
| 6,856,798 | ||||||||||||||
| Coal 0.2% | ||||||||||||||
Korea Resources Corp. (South Korea), Sr. Unsec’d. Notes | 3.000 | 04/24/22 | 3,200 | 3,250,452 | ||||||||||
| Commercial Services 0.3% | ||||||||||||||
PayPal Holdings, Inc., Sr. Unsec’d. Notes | 1.350 | 06/01/23 | 5,000 | 5,088,555 | ||||||||||
| Computers 0.4% | ||||||||||||||
Apple, Inc., | ||||||||||||||
Sr. Unsec’d. Notes | 1.700 | 09/11/22 | 5,000 | 5,077,218 | ||||||||||
Sr. Unsec’d. Notes, 3 Month LIBOR + 0.500% | 0.625(c) | 02/09/22 | 2,163 | 2,167,689 | ||||||||||
|
| |||||||||||||
| 7,244,907 | ||||||||||||||
| Diversified Financial Services 3.2% | ||||||||||||||
AIG Global Funding, Sr. Sec’d. Notes, 144A | 0.650 | 06/17/24 | 12,750 | 12,762,014 | ||||||||||
Air Lease Corp., Sr. Unsec’d. Notes, MTN, 3 Month LIBOR + 0.350% | 0.484(c) | 12/15/22 | 15,000 | 15,014,373 | ||||||||||
American Express Co., Sr. Unsec’d. Notes | 3.700 | 11/05/21 | 8,000 | 8,025,897 | ||||||||||
BOC Aviation Ltd. (Singapore), Sr. Unsec’d. Notes, 144A | 2.375 | 09/15/21 | 5,000 | 5,002,469 | ||||||||||
Capital One Bank USA NA, Sub. Notes | 3.375 | 02/15/23 | 4,000 | 4,167,726 | ||||||||||
Capital One Financial Corp., Sr. Unsec’d. Notes, 3 Month LIBOR + 0.720% | 0.849(c) | 01/30/23 | 1,660 | 1,671,935 | ||||||||||
Citigroup Global Markets Holdings, Inc., Gtd. Notes, MTN | 0.750 | 06/07/24 | 13,250 | 13,198,148 | ||||||||||
|
| |||||||||||||
| 59,842,562 | ||||||||||||||
See Notes to Financial Statements.
PGIM Fixed Income ETFs | 35 |
PGIM Ultra Short Bond ETF
Schedule of Investments (continued)
as of August 31, 2021
| Description | Interest Rate | Maturity Date | Principal Amount (000)# | Value | ||||||||||
| CORPORATE BONDS (Continued) | ||||||||||||||
| Electric 3.9% | ||||||||||||||
American Electric Power Co., Inc., | ||||||||||||||
Sr. Unsec’d. Notes | 3.650% | 12/01/21 | 4,000 | $ | 4,033,502 | |||||||||
Sr. Unsec’d. Notes, 3 Month LIBOR + 0.480% | 0.606(c) | 11/01/23 | 3,000 | 3,002,204 | ||||||||||
CenterPoint Energy, Inc., Sr. Unsec’d. Notes, SOFR + 0.650% | 0.700(c) | 05/13/24 | 10,000 | 10,012,086 | ||||||||||
DTE Energy Co., Sr. Unsec’d. Notes | 2.250 | 11/01/22 | 8,000 | 8,171,221 | ||||||||||
Entergy Louisiana LLC, First Mortgage | 0.620 | 11/17/23 | 4,250 | 4,251,720 | ||||||||||
Florida Power & Light Co., Sr. Unsec’d. Notes, SOFR + 0.250% | 0.300(c) | 05/10/23 | 12,000 | 12,000,863 | ||||||||||
NextEra Energy Capital Holdings, Inc., Gtd. Notes | 2.900 | 04/01/22 | 2,500 | 2,538,095 | ||||||||||
OGE Energy Corp., Sr. Unsec’d. Notes | 0.703 | 05/26/23 | 3,500 | 3,499,296 | ||||||||||
PPL Electric Utilities Corp., | ||||||||||||||
First Mortgage | 2.500 | 09/01/22 | 4,800 | 4,881,467 | ||||||||||
First Mortgage, SOFR + 0.330% | 0.363(c) | 06/24/24 | 2,250 | 2,250,422 | ||||||||||
Saudi Electricity Global Sukuk Co. (Cayman Islands), Sr. Unsec’d. Notes | 4.211 | 04/03/22 | 1,800 | 1,838,543 | ||||||||||
Sempra Energy, Sr. Unsec’d. Notes | 2.875 | 10/01/22 | 10,354 | 10,555,918 | ||||||||||
WEC Energy Group, Inc., Sr. Unsec’d. Notes | 0.800 | 03/15/24 | 7,250 | 7,285,907 | ||||||||||
|
| |||||||||||||
| 74,321,244 | ||||||||||||||
| Food 1.4% | ||||||||||||||
Hormel Foods Corp., Sr. Unsec’d. Notes | 0.650 | 06/03/24 | 3,500 | 3,505,150 | ||||||||||
McCormick & Co., Inc., Sr. Unsec’d. Notes | 2.700 | 08/15/22 | 7,685 | 7,846,250 | ||||||||||
Mondelez International Holdings Netherlands BV (Netherlands), Gtd. Notes, 144A | 2.000 | 10/28/21 | 2,000 | 2,002,658 | ||||||||||
Mondelez International, Inc., Sr. Unsec’d. Notes | 0.625 | 07/01/22 | 8,000 | 8,025,066 | ||||||||||
Nestle Holdings, Inc., Gtd. Notes, 144A | 0.375 | 01/15/24 | 5,000 | 4,987,949 | ||||||||||
|
| |||||||||||||
| 26,367,073 | ||||||||||||||
| Forest Products & Paper 0.4% | ||||||||||||||
Georgia-Pacific LLC, Sr. Unsec’d. Notes, 144A | 3.734 | 07/15/23 | 7,000 | 7,377,802 | ||||||||||
| Gas 0.3% | ||||||||||||||
Atmos Energy Corp., Sr. Unsec’d. Notes, 3 Month LIBOR + 0.380% | 0.503(c) | 03/09/23 | 5,250 | 5,250,002 | ||||||||||
| Healthcare-Products 0.1% | ||||||||||||||
Stryker Corp., Sr. Unsec’d. Notes | 0.600 | 12/01/23 | 1,250 | 1,250,065 | ||||||||||
| Healthcare-Services 0.4% | ||||||||||||||
UnitedHealth Group, Inc., Sr. Unsec’d. Notes | 0.550 | 05/15/24 | 7,250 | 7,250,263 | ||||||||||
See Notes to Financial Statements.
| 36 |
| Description | Interest Rate | Maturity Date | Principal Amount (000)# | Value | ||||||||||||
| CORPORATE BONDS (Continued) | ||||||||||||||||
| Holding Companies-Diversified 0.1% | ||||||||||||||||
Swire Pacific Financing Ltd. (Cayman Islands), Gtd. Notes, EMTN | 4.500 | % | 02/28/22 | 2,000 | $ | 2,036,647 | ||||||||||
| Household Products/Wares 0.4% | ||||||||||||||||
Reckitt Benckiser Treasury Services PLC (United Kingdom), Gtd. Notes, 144A, 3 Month LIBOR + 0.560% | 0.694 | (c) | 06/24/22 | 8,000 | 8,031,623 | |||||||||||
| Insurance 3.0% | ||||||||||||||||
AIA Group Ltd. (Hong Kong), Sr. Unsec’d. Notes, 144A, 3 Month LIBOR + 0.520% | 0.655 | (c) | 09/20/21 | 600 | 600,038 | |||||||||||
Berkshire Hathaway, Inc., Sr. Unsec’d. Notes | 2.750 | 03/15/23 | 4,853 | 5,018,330 | ||||||||||||
Equitable Financial Life Global Funding, | ||||||||||||||||
Sec’d. Notes, 144A | 0.800 | 08/12/24 | 3,000 | 3,006,731 | ||||||||||||
Sec’d. Notes, 144A, SOFR + 0.390% | 0.440 | (c) | 04/06/23 | 10,000 | 10,015,669 | |||||||||||
Metropolitan Life Global Funding I, | ||||||||||||||||
Sec’d. Notes, 144A | 3.375 | 01/11/22 | 1,250 | 1,264,329 | ||||||||||||
Sec’d. Notes, 144A | 3.450 | 10/09/21 | 750 | 752,533 | ||||||||||||
New York Life Global Funding, | ||||||||||||||||
Sec’d. Notes, 144A | 2.900 | 01/17/24 | 4,190 | 4,425,485 | ||||||||||||
Sr. Sec’d. Notes, 144A, 3 Month LIBOR + 0.440% | 0.559 | (c) | 07/12/22 | 3,000 | 3,010,199 | |||||||||||
Pacific Life Global Funding II, Sr. Sec’d. Notes, 144A | 0.500 | 09/23/23 | 4,750 | 4,761,760 | ||||||||||||
Principal Life Global Funding II, | ||||||||||||||||
Sec’d. Notes, 144A | 0.500 | 01/08/24 | 7,250 | 7,246,560 | ||||||||||||
Sec’d. Notes, 144A, SOFR + 0.450% | 0.500 | (c) | 04/12/24 | 1,250 | 1,253,059 | |||||||||||
Protective Life Global Funding, | ||||||||||||||||
Sec’d. Notes, 144A | 0.631 | 10/13/23 | 4,250 | 4,267,960 | ||||||||||||
Sr. Sec’d. Notes, 144A | 0.473 | 01/12/24 | 10,000 | 9,972,193 | ||||||||||||
|
| |||||||||||||||
| 55,594,846 | ||||||||||||||||
| Machinery-Constructions & Mining 0.5% | ||||||||||||||||
Caterpillar Financial Services Corp., Sr. Unsec’d. Notes, MTN | 0.450 | 09/14/23 | 10,000 | 10,025,976 | ||||||||||||
| Machinery-Diversified 0.4% | ||||||||||||||||
John Deere Capital Corp., Sr. Unsec’d. Notes, MTN, 3 Month LIBOR + 0.260% | 0.388 | (c) | 09/10/21 | 400 | 400,027 | |||||||||||
Otis Worldwide Corp., Sr. Unsec’d. Notes, 3 Month LIBOR + 0.450% | 0.595 | (c) | 04/05/23 | 6,700 | 6,693,770 | |||||||||||
|
| |||||||||||||||
| 7,093,797 | ||||||||||||||||
See Notes to Financial Statements.
PGIM Fixed Income ETFs | 37 |
PGIM Ultra Short Bond ETF
Schedule of Investments (continued)
as of August 31, 2021
| Description | Interest Rate | Maturity Date | Principal Amount (000)# | Value | ||||||||||||
| CORPORATE BONDS (Continued) | ||||||||||||||||
| Media 0.1% | ||||||||||||||||
Walt Disney Co. (The), Gtd. Notes, 3 Month LIBOR + 0.390% | 0.510 | %(c) | 09/01/22 | 3,000 | $ | 3,009,790 | ||||||||||
| Oil & Gas 1.9% | ||||||||||||||||
| Exxon Mobil Corp., | ||||||||||||||||
Sr. Unsec’d. Notes | 1.571 | 04/15/23 | 4,000 | 4,080,283 | ||||||||||||
Sr. Unsec’d. Notes, 3 Month LIBOR + 0.330% | 0.455 | (c) | 08/16/22 | 4,000 | 4,011,823 | |||||||||||
| Phillips 66, | ||||||||||||||||
Gtd. Notes | 0.900 | 02/15/24 | 4,000 | 4,001,450 | ||||||||||||
Gtd. Notes | 4.300 | 04/01/22 | 5,921 | 6,056,829 | ||||||||||||
| Pioneer Natural Resources Co., | ||||||||||||||||
Sr. Unsec’d. Notes | 0.550 | 05/15/23 | 2,500 | 2,498,697 | ||||||||||||
Sr. Unsec’d. Notes | 0.750 | 01/15/24 | 4,250 | 4,241,407 | ||||||||||||
Saudi Arabian Oil Co. (Saudi Arabia), Sr. Unsec’d. Notes, 144A | 2.750 | 04/16/22 | 1,980 | 2,008,225 | ||||||||||||
Valero Energy Corp., Sr. Unsec’d. Notes | 2.700 | 04/15/23 | 8,000 | 8,265,263 | ||||||||||||
|
| |||||||||||||||
| 35,163,977 | ||||||||||||||||
| Pharmaceuticals 2.6% | ||||||||||||||||
| AbbVie, Inc., | ||||||||||||||||
Sr. Unsec’d. Notes | 3.375 | 11/14/21 | 3,730 | 3,753,513 | ||||||||||||
Sr. Unsec’d. Notes, 3 Month LIBOR + 0.650% | 0.781 | (c) | 11/21/22 | 3,000 | 3,019,019 | |||||||||||
AmerisourceBergen Corp., Sr. Unsec’d. Notes | 0.737 | 03/15/23 | 12,000 | 12,017,763 | ||||||||||||
Astrazeneca Finance LLC, Gtd. Notes | 0.700 | 05/28/24 | 12,250 | 12,264,879 | ||||||||||||
| Bristol-Myers Squibb Co., | ||||||||||||||||
Sr. Unsec’d. Notes | 0.537 | 11/13/23 | 10,000 | 10,003,003 | ||||||||||||
Sr. Unsec’d. Notes, 3 Month LIBOR + 0.380% | 0.505 | (c) | 05/16/22 | 2,000 | 2,005,027 | |||||||||||
GlaxoSmithKline Capital PLC (United Kingdom), Gtd. Notes | 0.534 | 10/01/23 | 6,500 | 6,512,013 | ||||||||||||
|
| |||||||||||||||
| 49,575,217 | ||||||||||||||||
| Pipelines 1.1% | ||||||||||||||||
Enterprise Products Operating LLC, Gtd. Notes | 3.500 | 02/01/22 | 12,350 | 12,516,446 | ||||||||||||
Southern Natural Gas Co. LLC, Sr. Unsec’d. Notes, 144A | 0.625 | 04/28/23 | 5,250 | 5,248,310 | ||||||||||||
TransCanada PipeLines Ltd. (Canada), Sr. Unsec’d. Notes | 2.500 | 08/01/22 | 3,000 | 3,060,905 | ||||||||||||
|
| |||||||||||||||
| 20,825,661 | ||||||||||||||||
See Notes to Financial Statements.
| 38 |
| Description | Interest Rate | Maturity Date | Principal Amount (000)# | Value | ||||||||||||
| CORPORATE BONDS (Continued) | ||||||||||||||||
| Real Estate 0.4% | ||||||||||||||||
Ontario Teachers’ Cadillac Fairview Properties Trust (Canada), Sr. Unsec’d. Notes, 144A | 3.125 | % | 03/20/22 | 6,775 | $ | 6,863,567 | ||||||||||
| Real Estate Investment Trusts (REITs) 1.2% | ||||||||||||||||
ERP Operating LP, Sr. Unsec’d. Notes | 4.625 | 12/15/21 | 7,605 | 7,631,083 | ||||||||||||
Kimco Realty Corp., Sr. Unsec’d. Notes | 3.400 | 11/01/22 | 5,935 | 6,112,627 | ||||||||||||
Public Storage, Sr. Unsec’d. Notes, SOFR + 0.470% | 0.520 | (c) | 04/23/24 | 8,500 | 8,504,894 | |||||||||||
|
| |||||||||||||||
| 22,248,604 | ||||||||||||||||
| Retail 1.4% | ||||||||||||||||
| 7-Eleven, Inc., | ||||||||||||||||
Sr. Unsec’d. Notes, 144A | 0.625 | 02/10/23 | 1,750 | 1,750,625 | ||||||||||||
Sr. Unsec’d. Notes, 144A | 0.800 | 02/10/24 | 2,250 | 2,249,496 | ||||||||||||
AutoZone, Inc., Sr. Unsec’d. Notes | 3.700 | 04/15/22 | 15,000 | 15,185,987 | ||||||||||||
Home Depot, Inc. (The), Sr. Unsec’d. Notes, 3 Month LIBOR + 0.310% | 0.430 | (c) | 03/01/22 | 1,500 | 1,502,068 | |||||||||||
| McDonald’s Corp., | ||||||||||||||||
Sr. Unsec’d. Notes, MTN | 2.625 | 01/15/22 | 2,193 | 2,212,348 | ||||||||||||
Sr. Unsec’d. Notes, MTN, 3 Month LIBOR + 0.430% | 0.562 | (c) | 10/28/21 | 1,900 | 1,901,169 | |||||||||||
Starbucks Corp., Sr. Unsec’d. Notes | 1.300 | 05/07/22 | 1,000 | 1,007,192 | ||||||||||||
|
| |||||||||||||||
| 25,808,885 | ||||||||||||||||
| Savings & Loans 0.5% | ||||||||||||||||
Nationwide Building Society (United Kingdom), Sr. Unsec’d. Notes, 144A | 0.550 | 01/22/24 | 9,750 | 9,734,598 | ||||||||||||
| Semiconductors 0.3% | ||||||||||||||||
Intel Corp., Sr. Unsec’d. Notes, 3 Month LIBOR + 0.350% | 0.477 | (c) | 05/11/22 | 5,000 | 5,010,492 | |||||||||||
| Software 0.9% | ||||||||||||||||
Fidelity National Information Services, Inc., Sr. Unsec’d. Notes | 0.600 | 03/01/24 | 5,750 | 5,750,661 | ||||||||||||
Infor, Inc., Sr. Unsec’d. Notes, 144A | 1.450 | 07/15/23 | 1,200 | 1,214,538 | ||||||||||||
Oracle Corp., Sr. Unsec’d. Notes | 2.500 | 10/15/22 | 9,000 | 9,218,873 | ||||||||||||
|
| |||||||||||||||
| 16,184,072 | ||||||||||||||||
See Notes to Financial Statements.
PGIM Fixed Income ETFs | 39 |
PGIM Ultra Short Bond ETF
Schedule of Investments (continued)
as of August 31, 2021
| Description | Interest Rate | Maturity Date | Principal Amount (000)# | Value | ||||||||||||
| CORPORATE BONDS (Continued) | ||||||||||||||||
| Telecommunications 1.8% | ||||||||||||||||
NTT Finance Corp. (Japan), Gtd. Notes, 144A | 0.583 | % | 03/01/24 | 6,500 | $ | 6,500,356 | ||||||||||
Rogers Communications, Inc. (Canada), Gtd. Notes, 3 Month LIBOR + 0.600% | 0.735 | (c) | 03/22/22 | 4,200 | 4,210,952 | |||||||||||
| Verizon Communications, Inc., | ||||||||||||||||
Sr. Unsec’d. Notes | 0.750 | 03/22/24 | 8,000 | 8,031,329 | ||||||||||||
Sr. Unsec’d. Notes, SOFR + 0.500% | 0.550 | (c) | 03/22/24 | 7,000 | 7,039,563 | |||||||||||
Vodafone Group PLC (United Kingdom), Sr. Unsec’d. Notes | 2.500 | 09/26/22 | 8,000 | 8,178,597 | ||||||||||||
|
| |||||||||||||||
| 33,960,797 | ||||||||||||||||
| Transportation 0.2% | ||||||||||||||||
Ryder System, Inc., Sr. Unsec’d. Notes, MTN | 2.875 | 06/01/22 | 3,000 | 3,050,585 | ||||||||||||
|
| |||||||||||||||
TOTAL CORPORATE BONDS | 861,660,156 | |||||||||||||||
|
| |||||||||||||||
| CERTIFICATES OF DEPOSIT 0.8% | ||||||||||||||||
| Banks 0.8% | ||||||||||||||||
Bank of Montreal (Canada), 3 Month LIBOR + 0.110% | 0.229 | (c) | 12/13/21 | 5,000 | 5,001,798 | |||||||||||
Credit Agricole Corporate & Investment Bank (France), 3 Month LIBOR + 0.480% | 0.605 | (c) | 09/17/21 | 920 | 920,193 | |||||||||||
Royal Bank of Canada (Canada), 3 Month LIBOR + 0.110% | 0.228 | (c) | 12/16/21 | 3,000 | 3,001,103 | |||||||||||
Westpac Banking Corp. (Australia), 3 Month LIBOR + 0.010% | 0.148 | (c) | 01/24/22 | 7,100 | 7,100,275 | |||||||||||
|
| |||||||||||||||
TOTAL CERTIFICATES OF DEPOSIT | 16,023,369 | |||||||||||||||
|
| |||||||||||||||
TOTAL LONG-TERM INVESTMENTS | 1,490,758,139 | |||||||||||||||
|
| |||||||||||||||
Shares | ||||||||||||||||
| SHORT-TERM INVESTMENTS 21.9% | ||||||||||||||||
| AFFILIATED MUTUAL FUNDS 7.9% | ||||||||||||||||
PGIM Core Ultra Short Bond Fund(wa) | 145,724,638 | 145,724,638 | ||||||||||||||
PGIM Institutional Money Market Fund | 2,329,368 | 2,327,971 | ||||||||||||||
|
| |||||||||||||||
TOTAL AFFILIATED MUTUAL FUNDS |
| 148,052,609 | ||||||||||||||
|
| |||||||||||||||
See Notes to Financial Statements.
| 40 |
| Description | Interest Rate | Maturity Date | Principal Amount (000)# | Value | ||||||||||||
| TIME DEPOSIT 1.0% | ||||||||||||||||
Skandinaviska Enskilda Banken AB | 0.005 | % | 09/01/21 | 19,495 | $ | 19,494,739 | ||||||||||
|
| |||||||||||||||
| CERTIFICATES OF DEPOSIT 1.6% | ||||||||||||||||
| Banks 1.6% | ||||||||||||||||
Bank of Montreal (Canada) | 0.230 | 05/05/22 | 5,000 | 5,001,983 | ||||||||||||
Bank of Nova Scotia (Canada) | 0.230 | 05/10/22 | 5,000 | 5,002,373 | ||||||||||||
Lloyds Bank Corporate Markets PLC (United Kingdom), 3 Month LIBOR + 0.190% | 0.312 | (c) | 11/26/21 | 10,000 | 10,004,635 | |||||||||||
Natixis SA (France), 3 Month LIBOR + 0.130% | 0.253 | (c) | 12/09/21 | 10,000 | 10,003,443 | |||||||||||
|
| |||||||||||||||
TOTAL CERTIFICATES OF DEPOSIT |
| 30,012,434 | ||||||||||||||
|
| |||||||||||||||
| COMMERCIAL PAPER 10.7% | ||||||||||||||||
AT&T, Inc. 144A | 0.381 | (s) | 11/16/21 | 10,000 | 9,996,129 | |||||||||||
BAT International Finance PLC (United Kingdom) 144A | 0.230 | (s) | 09/21/21 | 5,000 | 4,999,592 | |||||||||||
Canadian Imperial Bank of Commerce (Canada) 144A | 0.241 | (s) | 05/04/22 | 4,000 | 3,995,572 | |||||||||||
Enbridge, Inc. 144A | 0.300 | (s) | 12/10/21 | 10,000 | 9,994,277 | |||||||||||
Enbridge, Inc. 144A | 0.250 | (s) | 09/14/21 | 5,000 | 4,999,747 | |||||||||||
Enel Finance America LLC 144A | 0.392 | (s) | 07/15/22 | 5,000 | 4,987,721 | |||||||||||
Enel Finance America LLC 144A | 0.392 | (s) | 07/14/22 | 5,000 | 4,987,760 | |||||||||||
Glencore Funding LLC 144A | 0.270 | (s) | 09/24/21 | 10,000 | 9,998,273 | |||||||||||
Healthpeak Properties, Inc 144A | 0.180 | (s) | 09/15/21 | 4,185 | 4,184,564 | |||||||||||
Healthpeak Properties, Inc 144A | 0.180 | (s) | 09/09/21 | 5,000 | 4,999,800 | |||||||||||
Healthpeak Properties, Inc 144A | 0.160 | (s) | 09/01/21 | 5,000 | 4,999,982 | |||||||||||
Hitachi America Capital Ltd. 144A | 0.140 | (s) | 09/08/21 | 10,000 | 9,999,711 | |||||||||||
HSBC Bank PLC (United Kingdom) 144A, 3 Month LIBOR + 0.130% | 0.251 | (c) | 09/17/21 | 5,000 | 5,000,242 | |||||||||||
HSBC USA, Inc. 144A | 0.462 | (s) | 12/10/21 | 6,000 | 5,996,011 | |||||||||||
Hyundai Capital America 144A | 0.160 | (s) | 09/10/21 | 10,000 | 9,999,722 | |||||||||||
Ingredion, Inc. 144A | 0.250 | (s) | 11/09/21 | 11,500 | 11,495,305 | |||||||||||
Realty Income Corp. 144A | 0.180 | (s) | 09/29/21 | 11,000 | 10,998,635 | |||||||||||
Sempra Energy 144A | 0.180 | (s) | 09/20/21 | 5,000 | 4,999,616 | |||||||||||
Societe Generale SA (France) 144A, 3 Month LIBOR + 0.160% | 0.284 | (c) | 12/13/21 | 10,000 | 10,003,898 | |||||||||||
Suncor Energy, Inc. 144A | 0.250 | (s) | 09/27/21 | 10,000 | 9,998,898 | |||||||||||
Toronto-Dominion Bank (The) (Canada) 144A, 3 Month LIBOR + 0.090% | 0.222 | (c) | 12/03/21 | 3,000 | 3,000,570 | |||||||||||
See Notes to Financial Statements.
PGIM Fixed Income ETFs | 41 |
PGIM Ultra Short Bond ETF
Schedule of Investments (continued)
as of August 31, 2021
| Description | Interest Rate | Maturity Date | Principal Amount (000)# | Value | ||||||||||||
| COMMERCIAL PAPER (Continued) | ||||||||||||||||
UBS AG (United Kingdom) 144A, 3 Month LIBOR + 0.080% | 0.247 | %(c) | 10/12/21 | 5,000 | $ | 5,000,285 | ||||||||||
UDR, Inc. 144A | 0.170 | (s) | 09/14/21 | 3,500 | 3,499,823 | |||||||||||
UDR, Inc. 144A | 0.150 | (s) | 09/30/21 | 10,000 | 9,998,750 | |||||||||||
Volkswagen Group of America Finance LLC 144A | 0.523 | (s) | 10/25/21 | 7,000 | 6,995,295 | |||||||||||
VW Credit, Inc. 144A | 0.190 | (s) | 09/16/21 | 5,075 | 5,074,702 | |||||||||||
Walt Disney Co. (The) 144A | 0.271 | (s) | 03/31/22 | 7,000 | 6,991,714 | |||||||||||
Waste Management, Inc. 144A | 0.321 | (s) | 07/11/22 | 8,500 | 8,486,878 | |||||||||||
Welltower, Inc. 144A | 0.180 | (s) | 09/21/21 | 5,000 | 4,999,592 | |||||||||||
|
| |||||||||||||||
TOTAL COMMERCIAL PAPER |
| 200,683,064 | ||||||||||||||
|
| |||||||||||||||
| CORPORATE NOTES 0.7% | ||||||||||||||||
| Biotechnology 0.1% | ||||||||||||||||
Gilead Sciences, Inc., 3 Month LIBOR + 0.150% | 0.275 | (c) | 09/17/21 | 1,750 | 1,750,092 | |||||||||||
| Electric 0.6% | ||||||||||||||||
Southern California Edison Co., 3 Month LIBOR + 0.270% | 0.399 | (c) | 12/03/21 | 10,000 | 10,001,844 | |||||||||||
|
| |||||||||||||||
TOTAL CORPORATE NOTES | 11,751,936 | |||||||||||||||
|
| |||||||||||||||
TOTAL SHORT-TERM INVESTMENTS | 409,994,782 | |||||||||||||||
|
| |||||||||||||||
TOTAL INVESTMENTS 101.3% | 1,900,752,921 | |||||||||||||||
|
| |||||||||||||||
Liabilities in excess of other assets (1.3)% | (24,214,197 | ) | ||||||||||||||
|
| |||||||||||||||
NET ASSETS 100.0% | $ | 1,876,538,724 | ||||||||||||||
|
| |||||||||||||||
The following abbreviations are used in the annual report:
(A)—Annual payment frequency for swaps
(Q)—Quarterly payment frequency for swaps
(S)—Semiannual payment frequency for swaps
144A—Security was purchased pursuant to Rule 144A under the Securities Act of 1933 and may not be resold subject to that rule except to qualified institutional buyers.
BKNT—Bank Note
BSBY—Bloomberg Short-Term Bank Yield Index
CLO—Collateralized Loan Obligation
EMTN—Euro Medium Term Note
See Notes to Financial Statements.
| 42 |
FEDL01—1 Day Overnight FED Funds Effective Rate
GMTN—Global Medium Term Note
LIBOR—London Interbank Offered Rate
MTN—Medium Term Note
SOFR—Secured Overnight Financing Rate Data
| # | Principal or notional amount is shown in U.S. dollars unless otherwise stated. |
| (a) | All or a portion of security is on loan. The aggregate market value of such securities, including those sold and pending settlement, is $2,282,514; cash collateral of $2,328,443 (included in liabilities) was received with which the Fund purchased highly liquid short-term investments. In the event of significant appreciation in value of securities on loan on the last business day of the reporting period, the Fund may reflect a collateral value that is less than the market value of the loaned securities and such shortfall is remedied the following business day. |
| (b) | Represents security purchased with cash collateral received for securities on loan and includes dividend reinvestment. |
| (c) | Variable rate instrument. The interest rate shown reflects the rate in effect at August 31, 2021. |
| (cc) | Variable rate instrument. The rate shown is based on the latest available information as of August 31, 2021. Certain variable rate securities are not based on a published reference rate and spread but are determined by the issuer or agent and are based on current market conditions. These securities do not indicate a reference rate and spread in their description. |
| (s) | Represents zero coupon bond. Rate represents yield to maturity at purchase date. |
| (wa) | PGIM Investments LLC, the manager of the Fund, also serves as manager of the PGIM Core Ultra Short Bond Fund and the PGIM Institutional Money Market Fund, if applicable. |
Futures contracts outstanding at August 31, 2021:
| Number of contracts | Type | Expiration Date | Current Notional Amount | Value / Unrealized Appreciation (Depreciation) | ||||||||||||
| Short Positions: | ||||||||||||||||
| 32 | 2 Year U.S. Treasury Notes | Dec. 2021 | $ | 7,050,500 | $ | (4,715 | ) | |||||||||
|
| |||||||||||||||
Interest rate swap agreements outstanding at August 31, 2021:
Notional Amount (000)# | Termination Date | Fixed Rate | Floating Rate | Value at Trade Date | Value at August 31, 2021 | Unrealized Appreciation (Depreciation) | ||||||||||||||||||
| Centrally cleared swap agreements: | ||||||||||||||||||||||||
| 26,525 | 01/11/22 | 2.672%(S) | 3 Month LIBOR(Q) | $ | (69,687 | ) | $ | (334,879 | ) | $ | (265,192 | ) | ||||||||||||
| 24,945 | 04/01/22 | 2.265%(S) | 3 Month LIBOR(Q) | (68,490 | ) | (536,449 | ) | (467,959 | ) | |||||||||||||||
| 11,000 | 04/12/22 | 2.357%(S) | 3 Month LIBOR(Q) | (48,829 | ) | (245,097 | ) | (196,268 | ) | |||||||||||||||
| 3,250 | 06/15/22 | 1.873%(S) | 3 Month LIBOR(Q) | 8,358 | (56,219 | ) | (64,577 | ) | ||||||||||||||||
| 22,000 | 08/22/22 | 1.421%(S) | 3 Month LIBOR(Q) | (9,684 | ) | (276,491 | ) | (266,807 | ) | |||||||||||||||
| 19,000 | 09/03/22 | 1.919%(S) | 3 Month LIBOR(Q) | (75,743 | ) | (512,481 | ) | (436,738 | ) | |||||||||||||||
| 25,000 | 01/30/23 | 1.467%(S) | 3 Month LIBOR(Q) | (11,765 | ) | (477,783 | ) | (466,018 | ) | |||||||||||||||
| 9,900 | 02/12/22 | 1.420%(S) | 3 Month LIBOR(Q) | 647 | (63,759 | ) | (64,406 | ) | ||||||||||||||||
| 7,500 | 05/11/22 | 2.300%(S) | FEDL01(1)(A) | (86,102 | ) | (169,131 | ) | (83,029 | ) | |||||||||||||||
See Notes to Financial Statements.
PGIM Fixed Income ETFs | 43 |
PGIM Ultra Short Bond ETF
Schedule of Investments (continued)
as of August 31, 2021
Interest rate swap agreements outstanding at August 31, 2021 (continued):
Notional Amount (000)# | Termination Date | Fixed Rate | Floating Rate | Value at Trade Date | Value at August 31, 2021 | Unrealized Appreciation (Depreciation) | ||||||||||||||||||
| Centrally cleared swap agreements (cont’d): | ||||||||||||||||||||||||
| 2,000 | 12/10/22 | 0.362%(S) | FEDL01(1)(A) | $ | 16 | $ | (10,846 | ) | $ | (10,862 | ) | |||||||||||||
| 8,000 | 07/02/22 | (0.001)%(S) | FEDL01(1)(A) | 70 | 6,974 | 6,904 | ||||||||||||||||||
| 5,000 | 04/13/23 | (0.013)%(S) | FEDL01(1)(A) | 94 | 14,714 | 14,620 | ||||||||||||||||||
| 7,000 | 01/14/23 | (0.006)%(S) | FEDL01(1)(A) | 90 | 15,554 | 15,464 | ||||||||||||||||||
| 8,560 | 05/11/23 | 2.250%(S) | FEDL01(1)(A) | (357,443 | ) | (365,553 | ) | (8,110 | ) | |||||||||||||||
| 8,750 | 02/04/24 | 0.133%(S) | FEDL01(1)(A) | 8,280 | 28,535 | 20,255 | ||||||||||||||||||
| 19,500 | 03/01/24 | 0.230%(S) | FEDL01(1)(A) | 20,131 | 15,210 | (4,921 | ) | |||||||||||||||||
| 8,000 | 03/15/24 | 0.276%(S) | FEDL01(1)(A) | 142 | (2,976 | ) | (3,118 | ) | ||||||||||||||||
| 7,000 | 03/18/24 | 0.278%(S) | FEDL01(1)(A) | 140 | (2,635 | ) | (2,775 | ) | ||||||||||||||||
| 8,000 | 08/31/24 | 0.399%(S) | FEDL01(1)(A) | 160 | (15,900 | ) | (16,060 | ) | ||||||||||||||||
| 3,000 | 04/26/24 | 0.305%(S) | FEDL01(1)(A) | 138 | (1,324 | ) | (1,462 | ) | ||||||||||||||||
| 16,750 | 05/20/24 | 0.296%(S) | FEDL01(1)(A) | 170 | 5,351 | 5,181 | ||||||||||||||||||
| 5,000 | 12/07/23 | 0.221%(S) | FEDL01(1)(A) | 146 | 1,661 | 1,515 | ||||||||||||||||||
| 10,900 | 06/07/24 | 0.318%(S) | FEDL01(1)(A) | 160 | 474 | 314 | ||||||||||||||||||
| 18,000 | 06/07/23 | 0.148%(S) | FEDL01(1)(A) | 167 | 3,786 | 3,619 | ||||||||||||||||||
| 12,750 | 06/16/24 | 0.304%(S) | FEDL01(1)(A) | 166 | 8,409 | 8,243 | ||||||||||||||||||
| 75,000 | 07/26/23 | 0.192%(S) | FEDL01(1)(A) | 301 | (13,704 | ) | (14,005 | ) | ||||||||||||||||
| 15,000 | 08/05/24 | 0.261%(S) | SOFRRATE(A) | 179 | 29,312 | 29,133 | ||||||||||||||||||
| 3,000 | 08/13/24 | 0.368%(S) | SOFRRATE(A) | 154 | (3,355 | ) | (3,509 | ) | ||||||||||||||||
| 8,000 | 05/11/25 | 0.450%(S) | SOFRRATE(A) | 6,299 | (6,681 | ) | (12,980 | ) | ||||||||||||||||
| 11,250 | 05/11/24 | 0.300%(S) | SOFRRATE(A) | (1,564 | ) | (12,592 | ) | (11,028 | ) | |||||||||||||||
|
|
|
|
|
| |||||||||||||||||||
| $ | (683,299 | ) | $ | (2,977,875 | ) | $ | (2,294,576 | ) | ||||||||||||||||
|
|
|
|
|
| |||||||||||||||||||
| (1) | The Fund pays the fixed rate and receives the floating rate. |
| (2) | The Fund pays the floating rate and receives the fixed rate. |
Summary of Collateral for Centrally Cleared/Exchange-traded Derivatives:
Cash and securities segregated as collateral to cover requirements for open centrally cleared/ exchange-traded derivatives are listed by broker as follows:
Broker | Cash and/or Foreign Currency | Securities Market Value | ||||||
Citigroup Global Markets, Inc. | $ | 3,372,000 | $ | — | ||||
Fair Value Measurements:
Various inputs are used in determining the value of the Fund’s investments. These inputs are summarized in the three broad levels listed below.
Level 1—unadjusted quoted prices generally in active markets for identical securities.
See Notes to Financial Statements.
| 44 |
Level 2—quoted prices for similar securities, interest rates and yield curves, prepayment speeds, foreign currency exchange rates and other observable inputs.
Level 3—unobservable inputs for securities valued in accordance with Board approved fair valuation procedures.
The following is a summary of the inputs used as of August 31, 2021 in valuing such portfolio securities:
| Level 1 | Level 2 | Level 3 | ||||||||||
| Investments in Securities | ||||||||||||
| Assets | ||||||||||||
| Long-Term Investments | ||||||||||||
| Asset-Backed Securities | ||||||||||||
Automobile ABS | $ | — | $ | 17,785,582 | $ | — | ||||||
Collateralized Loan Obligations | — | 340,157,723 | — | |||||||||
Commercial Mortgage-Backed Securities | — | 255,131,309 | — | |||||||||
Corporate Bonds | — | 861,660,156 | — | |||||||||
Certificates of Deposit | — | 16,023,369 | — | |||||||||
| Short-Term Investments | ||||||||||||
Affiliated Mutual Funds | 148,052,609 | — | — | |||||||||
Time Deposit | — | 19,494,739 | — | |||||||||
Certificates of Deposit | — | 30,012,434 | — | |||||||||
Commercial Paper | — | 200,683,064 | — | |||||||||
Corporate Notes | — | 11,751,936 | — | |||||||||
|
|
|
|
|
| |||||||
Total | $ | 148,052,609 | $ | 1,752,700,312 | $ | — | ||||||
|
|
|
|
|
| |||||||
| Other Financial Instruments* | ||||||||||||
| Assets | ||||||||||||
Centrally Cleared Interest Rate Swap Agreements | $ | — | $ | 105,248 | $ | — | ||||||
|
|
|
|
|
| |||||||
Total | $ | — | $ | 105,248 | $ | — | ||||||
|
|
|
|
|
| |||||||
| Liabilities | ||||||||||||
Futures Contracts | $ | (4,715 | ) | $ | — | $ | — | |||||
Centrally Cleared Interest Rate Swap Agreements | — | (2,399,824 | ) | — | ||||||||
|
|
|
|
|
| |||||||
Total | $ | (4,715 | ) | $ | (2,399,824 | ) | $ | — | ||||
|
|
|
|
|
| |||||||
| * | Other financial instruments are derivative instruments not reflected in the Schedule of Investments, such as futures, forwards and centrally cleared swap contracts, which are recorded at the unrealized appreciation (depreciation) on the instrument, and OTC swap contracts which are recorded at fair value. |
See Notes to Financial Statements.
PGIM Fixed Income ETFs | 45 |
PGIM Ultra Short Bond ETF
Schedule of Investments (continued)
as of August 31, 2021
Industry Classification:
The industry classification of investments and other assets in excess of liabilities shown as a percentage of net assets as of August 31, 2021 were as follows (unaudited):
Collateralized Loan Obligations | 18.1 | % | ||
Banks | 16.1 | |||
Commercial Mortgage-Backed Securities | 13.6 | |||
Commercial Paper | 10.7 | |||
Affiliated Mutual Fund (0.1% represents investments purchased with collateral from securities on loan) | 7.9 | |||
Electric | 4.5 | |||
Diversified Financial Services | 3.2 | |||
Insurance | 3.0 | |||
Pharmaceuticals | 2.6 | |||
Oil & Gas | 1.9 | |||
Auto Manufacturers | 1.8 | |||
Telecommunications | 1.8 | |||
Food | 1.4 | |||
Retail | 1.4 | |||
Real Estate Investment Trusts (REITs) | 1.2 | |||
Pipelines | 1.1 | |||
Time Deposit | 1.0 | |||
Automobile ABS | 1.0 | |||
Software | 0.9 | |||
Beverages | 0.7 | |||
Machinery-Constructions & Mining | 0.5 | |||
Savings & Loans | 0.5 | |||
Advertising | 0.4 | |||
Apparel | 0.4 | |||
Household Products/Wares | 0.4 | |||
Airlines | 0.4 | |||
Biotechnology | 0.4 | |||
Forest Products & Paper | 0.4 | |||
Healthcare-Services | 0.4 | |||
Computers | 0.4 | |||
Machinery-Diversified | 0.4 | |||
Real Estate | 0.4 | |||
Chemicals | 0.4 | |||
Gas | 0.3 | |||
Commercial Services | 0.3 | |||
Semiconductors | 0.3 | |||
Agriculture | 0.2 | |||
Coal | 0.2 | |||
Transportation | 0.2 | |||
Media | 0.1 | |||
Building Materials | 0.1 | |||
Holding Companies-Diversified | 0.1 | |||
Aerospace & Defense | 0.1 | |||
Healthcare-Products | 0.1 | |||
|
| |||
| 101.3 | ||||
Liabilities in excess of other assets | (1.3 | ) | ||
|
| |||
| 100.0 | % | |||
|
|
Effects of Derivative Instruments on the Financial Statements and Primary Underlying Risk Exposure:
The Fund invested in derivative instruments during the reporting period. The primary type of risk associated with these derivative instruments is interest rate contracts risk. See the Notes to Financial Statements for additional detail regarding these derivative instruments and their risks. The effect of such derivative instruments on the Fund’s financial position and financial performance as reflected in the Statement of Assets and Liabilities and Statement of Operations is presented in the summary below.
See Notes to Financial Statements.
| 46 |
Fair values of derivative instruments as of August 31, 2021 as presented in the Statement of Assets and Liabilities:
Asset Derivatives | Liability Derivatives | |||||||||||
Derivatives not accounted | Statement of | Fair Value | Statement of | Fair Value | ||||||||
| Interest rate contracts | Due from/to broker—variation margin futures* | $ | — | Due from/to broker— variation margin futures* | $ | (4,715 | ) | |||||
| Interest rate contracts | Due from/to broker—variation margin swaps* | 105,248 | Due from/to broker— variation margin swaps* | (2,399,824 | ) | |||||||
|
|
|
| |||||||||
| $ | 105,248 | $ | (2,404,539 | ) | ||||||||
|
|
|
| |||||||||
| * | Includes cumulative appreciation (depreciation) as reported in the schedule of open futures and centrally cleared swap contracts. Only unsettled variation margin receivable (payable) is reported within the Statement of Assets and Liabilities. |
The effects of derivative instruments on the Statement of Operations for the period ended August 31, 2021 are as follows:
Amount of Realized Gain (Loss) on Derivatives Recognized in Income | ||||||||
Derivatives not accounted for as hedging | Futures | Swaps | ||||||
Interest rate contracts | $ | 3,125 | $ | (5,964,975 | ) | |||
|
|
|
| |||||
Change in Unrealized Appreciation (Depreciation) on Derivatives Recognized in Income | ||||||||
Derivatives not accounted for as hedging | Futures | Swaps | ||||||
Interest rate contracts | $ | 198 | $ | 5,905,149 | ||||
|
|
|
| |||||
For the period ended August 31, 2021 the Fund’s average volume of derivative activities is as follows:
Futures Contracts—Long Positions(1) | Futures Contracts—Short | Interest Rate Swap Agreements(1) | ||
$ — | $10,066,955 | $349,971,000 |
| (1) | Notional Amount in USD. |
See Notes to Financial Statements.
PGIM Fixed Income ETFs | 47 |
PGIM Ultra Short Bond ETF
Schedule of Investments (continued)
as of August 31, 2021
Average volume is based on average quarter end balances as noted for the year ended August 31, 2021.
Financial Instruments/Transactions—Summary of Offsetting and Netting Arrangements:
The Fund entered into financial instruments/transactions during the period that are either offset in accordance with current requirements or are subject to enforceable master netting arrangements or similar agreements that permit offsetting. The information about offsetting and related netting arrangements for financial instruments/transactions, where the legal
right to set-off exists, is presented in the summary below:
Offsetting of financial instrument/transaction assets and liabilities:
Description | Gross Market Value of Recognized Assets/(Liabilities) | Collateral Pledged/(Received)(1) | Net Amount | |||||||||
Securities on Loan | $ | 2,282,514 | $ | (2,282,514 | ) | $ | — | |||||
|
|
|
|
|
| |||||||
| (1) | Collateral amount disclosed by the Fund is limited to the market value of the financial instruments/transactions. |
See Notes to Financial Statements.
| 48 |
PGIM Ultra Short Bond ETF
Statement of Assets & Liabilities
as of August 31, 2021
Assets | ||||
Investments at value, including securities on loan of $2,282,514: | ||||
Unaffiliated investments (cost $1,749,003,002) | $ | 1,752,700,312 | ||
Affiliated investments (cost $148,053,209) | 148,052,609 | |||
Cash | 7 | |||
Receivable for Fund shares sold | 9,941,140 | |||
Interest and dividends receivable | 4,467,738 | |||
Deposit with broker for centrally cleared/exchange-traded derivatives | 3,372,000 | |||
Receivable for investments sold | 2,968 | |||
Due from broker—variation margin futures | 250 | |||
|
| |||
Total Assets | 1,918,537,024 | |||
|
| |||
| Liabilities | ||||
Payable for investments purchased | 39,413,992 | |||
Payable to broker for collateral for securities on loan | 2,328,443 | |||
Management fee payable | 229,067 | |||
Due to broker—variation margin swaps | 26,301 | |||
Other liabilities | 497 | |||
|
| |||
Total Liabilities | 41,998,300 | |||
|
| |||
Net Assets | $ | 1,876,538,724 | ||
|
| |||
Net assets were comprised of: | ||||
Common stock, at par | $ | 37,750 | ||
Paid-in capital in excess of par | 1,888,989,949 | |||
Total distributable earnings (loss) | (12,488,975 | ) | ||
|
| |||
Net assets, August 31, 2021 | $ | 1,876,538,724 | ||
|
| |||
Net asset value, offering price and redemption price per share, | $ | 49.71 | ||
|
| |||
See Notes to Financial Statements.
PGIM Fixed Income ETFs | 49 |
PGIM Ultra Short Bond ETF
Statement of Operations
Year Ended August 31, 2021
Net Investment Income (Loss) | ||||
Income | ||||
Interest income | $ | 18,710,394 | ||
Affiliated dividend income | 93,169 | |||
Income from securities lending, net (including affiliated income of $4,835) | 4,835 | |||
|
| |||
Total income | 18,808,398 | |||
|
| |||
Expenses |
| |||
Management fee | 1,980,422 | |||
|
| |||
Total expenses | 1,980,422 | |||
|
| |||
Net investment income (loss) | 16,827,976 | |||
|
| |||
| Realized And Unrealized Gain (Loss) On Investments | ||||
Net realized gain (loss) on: | ||||
Investment transactions (including affiliated of $(897)) | 1,153,999 | |||
Futures transactions | 3,125 | |||
Swap agreement transactions | (5,964,975 | ) | ||
|
| |||
| (4,807,851 | ) | |||
|
| |||
Net change in unrealized appreciation (depreciation) on: | ||||
Investments (including affiliated of $(600)) | (5,836,479 | ) | ||
Futures | 198 | |||
Swap agreements | 5,905,149 | |||
|
| |||
| 68,868 | ||||
|
| |||
Net gain (loss) on investment transactions | (4,738,983 | ) | ||
|
| |||
Net Increase (Decrease) In Net Assets Resulting From Operations | $ | 12,088,993 | ||
|
| |||
See Notes to Financial Statements.
| 50 |
PGIM Ultra Short Bond ETF
Statements of Changes in Net Assets
| Year Ended August 31, | ||||||||
| 2021 | 2020 | |||||||
Increase (Decrease) in Net Assets |
| |||||||
Operations | ||||||||
Net investment income (loss) | $ | 16,827,976 | $ | 18,720,058 | ||||
Net realized gain (loss) on investments | (4,807,851 | ) | (8,313,008 | ) | ||||
Net change in unrealized appreciation (depreciation) on investments | 68,868 | 1,943,730 | ||||||
|
|
|
| |||||
Net increase (decrease) in net assets resulting from operations | 12,088,993 | 12,350,780 | ||||||
|
|
|
| |||||
Dividends and Distributions | ||||||||
Distributions from distributable earnings | (18,216,405 | ) | (19,849,756 | ) | ||||
|
|
|
| |||||
Fund share transactions | ||||||||
Net proceeds from shares sold | 934,975,118 | 901,617,907 | ||||||
Cost of shares purchased | (92,197,152 | ) | (417,220,526 | ) | ||||
|
|
|
| |||||
Net increase (decrease) in net assets from Fund share transactions | 842,777,966 | 484,397,381 | ||||||
|
|
|
| |||||
Total increase (decrease) | 836,650,554 | 476,898,405 | ||||||
| Net Assets: | ||||||||
Beginning of period | 1,039,888,170 | 562,989,765 | ||||||
|
|
|
| |||||
End of period | $ | 1,876,538,724 | $ | 1,039,888,170 | ||||
|
|
|
| |||||
See Notes to Financial Statements.
PGIM Fixed Income ETFs | 51 |
PGIM Ultra Short Bond ETF
Financial Highlights
| Year Ended August 31, | April 5, 2018(e) through August 31, | |||||||||||||||||||
| 2021 | 2020 | 2019 | 2018 | |||||||||||||||||
| Per Share Operating Performance(a): |
| |||||||||||||||||||
| Net Asset Value, Beginning of Period | $49.93 | $50.15 | $50.12 | $50.00 | ||||||||||||||||
| Income (loss) from investment operations: |
| |||||||||||||||||||
| Net investment income (loss) | 0.64 | 1.06 | 1.40 | 0.53 | ||||||||||||||||
| Net realized and unrealized gain (loss) on investments | (0.15 | ) | (0.08 | ) | (0.02 | ) | 0.01 | |||||||||||||
| Total from investment operations | 0.49 | 0.98 | 1.38 | 0.54 | ||||||||||||||||
| Less Dividends and Distributions: |
| |||||||||||||||||||
| Dividends from net investment income | (0.71 | ) | (1.20 | ) | (1.35 | ) | (0.42 | ) | ||||||||||||
| Net asset value, end of period | $49.71 | $49.93 | $50.15 | $50.12 | ||||||||||||||||
| Total Return(b): | 0.98% | 1.99% | 2.80% | 1.08% | ||||||||||||||||
| Ratios/Supplemental Data: | ||||||||||||||||||||
| Net assets, end of period (000) | $1,876,539 | $1,039,888 | $562,990 | $52,627 | ||||||||||||||||
| Average net assets (000) | $1,320,282 | $883,274 | $246,678 | $33,209 | ||||||||||||||||
| Ratios to average net assets(c): | ||||||||||||||||||||
| Expenses after waivers and/or expense reimbursement | 0.15% | 0.15% | 0.15% | 0.15% | (d) | |||||||||||||||
| Expenses before waivers and/or expense reimbursement | 0.15% | 0.15% | 0.15% | 0.15% | (d) | |||||||||||||||
| Net investment income (loss) | 1.27% | 2.12% | 2.77% | 2.58% | (d) | |||||||||||||||
| Portfolio turnover rate(f) | 10% | 47% | 7% | 145% | ||||||||||||||||
| (a) | Calculated based on average shares outstanding during the period. |
| (b) | Total return is calculated assuming a purchase of a share on the first day and a sale on the last day of the period reported and includes reinvestment of dividends and distributions, if any. Total returns may reflect adjustments to conform to generally accepted accounting principles. Total returns for periods less than one full year are not annualized. |
| (c) | Does not include expenses of the underlying funds in which the Fund invests. |
| (d) | Annualized. |
| (e) | Commencement of operations. |
| (f) | The Fund’s portfolio turnover rate is calculated in accordance with regulatory requirements, without regard to transactions involving short-term investments and certain derivatives. If such transactions were included, the Fund’s portfolio turnover rate may be higher. |
See Notes to Financial Statements.
| 52 |
PGIM Active High Yield Bond ETF
Schedule of Investments
as of August 31, 2021
| Description | Interest Rate | Maturity Date | Principal Amount (000)# | Value | ||||||||||||
| LONG-TERM INVESTMENTS 94.9% | ||||||||||||||||
| BANK LOANS 3.0% | ||||||||||||||||
| Airlines 0.4% | ||||||||||||||||
AAdvantage Loyalty IP Ltd. (American Airlines, Inc.), Initial Term Loan, 3 Month LIBOR + 4.750% | 5.500 | %(c) | 04/20/28 | 132 | $ | 135,361 | ||||||||||
United Airlines, Inc., Class B Term Loan, 3 Month | 4.500 | (c) | 04/21/28 | 195 | 194,775 | |||||||||||
|
| |||||||||||||||
| 330,136 | ||||||||||||||||
| Diversified/Conglomerate Services 0.3% | ||||||||||||||||
Intrado Corp., Initial Term B Loan, 3 Month | 5.000 | (c) | 10/10/24 | 265 | 255,877 | |||||||||||
| Electric & Gas Marketing 0.1% | ||||||||||||||||
Heritage Power LLC, Term Loan, 3 Month | 7.000 | (c) | 07/30/26 | 146 | 130,642 | |||||||||||
| Entertainment 0.1% | ||||||||||||||||
Bally’s Corp., Term B-1 Facility Loan, 3 Month | 9.000 | (c) | 05/11/26 | 50 | 52,161 | |||||||||||
Golden Nugget Online Gaming, Inc., 2020 Initial Term Loan, 3 Month LIBOR + 12.000% | 13.000 | (c) | 10/04/23 | 4 | 4,077 | |||||||||||
Scientific Games International, Inc., Initial Term B-5 Loan, 1 Month LIBOR + 2.750% | 2.835 | (c) | 08/14/24 | 73 | 72,797 | |||||||||||
|
| |||||||||||||||
| 129,035 | ||||||||||||||||
| Industrial Services 0.1% | ||||||||||||||||
Great Outdoors Group LLC, Term B-1 Loan, 3 Month LIBOR + 4.250% | 5.000 | (c) | 03/06/28 | 50 | 49,848 | |||||||||||
| Infrastructure Software 0.2% | ||||||||||||||||
McAfee LLC, Term B USD Loan, 1 Month | 3.835 | (c) | 09/30/24 | 186 | 186,099 | |||||||||||
| Insurance 0.3% | ||||||||||||||||
Asurion LLC, New B-4 Term Loan (Second Lien), 1 Month LIBOR + 5.250% | 5.335 | (c) | 01/20/29 | 225 | 223,641 | |||||||||||
| Media 0.0% | ||||||||||||||||
Diamond Sports Group LLC, Term Loan, 1 Month | 3.340 | (c) | 08/24/26 | 40 | 24,737 | |||||||||||
See Notes to Financial Statements.
PGIM Fixed Income ETFs | 53 |
PGIM Active High Yield Bond ETF
Schedule of Investments (continued)
as of August 31, 2021
| Description | Interest Rate | Maturity Date | Principal Amount (000)# | Value | ||||||||||||
| BANK LOANS (Continued) | ||||||||||||||||
| Oil & Gas 0.3% | ||||||||||||||||
Ascent Resources Utica Holdings LLC/Aru Finance Corp., Term Loan (Second Lien), 3 Month LIBOR + 9.000% | 10.000 | %(c) | 11/01/25 | 118 | $ | 128,030 | ||||||||||
CITGO Petroleum Corp., 2019 Incremental Term B Loan, 3 Month LIBOR + 6.250% | 7.250 | (c) | 03/28/24 | 67 | 66,665 | |||||||||||
EG Group Ltd., Additional Term Facility USD, | 4.750 | (c) | 03/31/26 | 30 | 29,857 | |||||||||||
|
| |||||||||||||||
| 224,552 | ||||||||||||||||
| Software 0.8% | ||||||||||||||||
Greeneden U.S. Holdings I LLC, 2020 Initial Dollar Term Loan, 1 Month LIBOR + 4.000% | 4.750 | (c) | 12/01/27 | 25 | 24,911 | |||||||||||
Informatica LLC, Initial Loan (Second Lien) | 7.125 | 02/25/25 | 25 | 25,500 | ||||||||||||
Peraton Corp., Term B Loan (First Lien), 1 Month | 4.500 | (c) | 02/01/28 | 225 | 224,503 | |||||||||||
Skillsoft Finance II, Inc., Initial Term Loan, 3 Month LIBOR + 4.750% | 5.500 | (c) | 07/14/28 | 100 | 100,125 | |||||||||||
TIBCO Software, Inc., | ||||||||||||||||
Term B-3 Loan, 1 Month LIBOR + 3.750% | 3.840 | (c) | 06/30/26 | 198 | 196,591 | |||||||||||
Term Loan (Second Lien), 1 Month LIBOR + 7.250% | 7.340 | (c) | 03/03/28 | 125 | 125,781 | |||||||||||
|
| |||||||||||||||
| 697,411 | ||||||||||||||||
| Specialty Chemicals 0.2% | ||||||||||||||||
Solenis Holdings LLC, | ||||||||||||||||
Initial Dollar Term Loan (First Lien), 1 Month | 4.085 | (c) | 06/26/25 | 97 | 97,254 | |||||||||||
Initial Term Loan (Second Lien), 1 Month | 8.585 | (c) | 06/26/26 | 100 | 99,833 | |||||||||||
|
| |||||||||||||||
| 197,087 | ||||||||||||||||
| Telecommunications 0.2% | ||||||||||||||||
Xplornet Communications, Inc., Initial Term Loan, 1 Month LIBOR + 4.750% | 4.835 | (c) | 06/10/27 | 173 | 172,772 | |||||||||||
|
| |||||||||||||||
TOTAL BANK LOANS |
| 2,621,837 | ||||||||||||||
|
| |||||||||||||||
See Notes to Financial Statements.
| 54 |
| Description | Interest Rate | Maturity Date | Principal Amount (000)# | Value | ||||||||||||
| CORPORATE BONDS 90.7% | ||||||||||||||||
| Advertising 0.7% | ||||||||||||||||
National CineMedia LLC, | ||||||||||||||||
Sr. Sec’d. Notes, 144A(a) | 5.875 | % | 04/15/28 | 50 | $ | 44,003 | ||||||||||
Sr. Unsec’d. Notes | 5.750 | 08/15/26 | 25 | 18,765 | ||||||||||||
Terrier Media Buyer, Inc., Gtd. Notes, 144A | 8.875 | 12/15/27 | 490 | 522,489 | ||||||||||||
|
| |||||||||||||||
| 585,257 | ||||||||||||||||
| Aerospace & Defense 3.4% | ||||||||||||||||
Boeing Co. (The), | ||||||||||||||||
Sr. Unsec’d. Notes | 5.150 | 05/01/30 | 125 | 148,235 | ||||||||||||
Sr. Unsec’d. Notes | 5.805 | 05/01/50 | 300 | 408,275 | ||||||||||||
Sr. Unsec’d. Notes | 5.930 | 05/01/60 | 250 | 347,237 | ||||||||||||
Bombardier, Inc. (Canada), | ||||||||||||||||
Sr. Unsec’d. Notes, 144A | 6.000 | 02/15/28 | 150 | 151,369 | ||||||||||||
Sr. Unsec’d. Notes, 144A | 7.125 | 06/15/26 | 375 | 395,982 | ||||||||||||
Sr. Unsec’d. Notes, 144A | 7.500 | 12/01/24 | 250 | 260,747 | ||||||||||||
Sr. Unsec’d. Notes, 144A | 7.500 | 03/15/25 | 350 | 359,730 | ||||||||||||
Sr. Unsec’d. Notes, 144A | 7.875 | 04/15/27 | 140 | 146,802 | ||||||||||||
Spirit AeroSystems, Inc., Sec’d. Notes, 144A | 7.500 | 04/15/25 | 125 | 132,380 | ||||||||||||
SSL Robotics LLC, Sr. Sec’d. Notes, 144A | 9.750 | 12/31/23 | 103 | 112,241 | ||||||||||||
TransDigm, Inc., | ||||||||||||||||
Gtd. Notes | 5.500 | 11/15/27 | 400 | 409,102 | ||||||||||||
Gtd. Notes, 144A | 4.625 | 01/15/29 | 50 | 49,375 | ||||||||||||
|
| |||||||||||||||
| 2,921,475 | ||||||||||||||||
| Agriculture 0.3% | ||||||||||||||||
Vector Group Ltd., | ||||||||||||||||
Gtd. Notes, 144A | 10.500 | 11/01/26 | 50 | 52,856 | ||||||||||||
Sr. Sec’d. Notes, 144A | 5.750 | 02/01/29 | 225 | 228,950 | ||||||||||||
|
| |||||||||||||||
| 281,806 | ||||||||||||||||
| Airlines 1.0% | ||||||||||||||||
American Airlines, Inc., Sr. Sec’d. Notes, 144A | 11.750 | 07/15/25 | 175 | 217,390 | ||||||||||||
American Airlines, Inc./AAdvantage Loyalty IP Ltd. (Multinational), | ||||||||||||||||
Sr. Sec’d. Notes, 144A | 5.500 | 04/20/26 | 50 | 52,596 | ||||||||||||
Sr. Sec’d. Notes, 144A | 5.750 | 04/20/29 | 125 | 134,481 | ||||||||||||
Hawaiian Brand Intellectual Property Ltd./HawaiianMiles Loyalty Ltd. (Cayman Islands), Sr. Sec’d. Notes, 144A | 5.750 | 01/20/26 | 125 | 131,623 | ||||||||||||
See Notes to Financial Statements.
PGIM Fixed Income ETFs | 55 |
PGIM Active High Yield Bond ETF
Schedule of Investments (continued)
as of August 31, 2021
| Description | Interest Rate | Maturity Date | Principal Amount (000)# | Value | ||||||||||||
| CORPORATE BONDS (Continued) | ||||||||||||||||
| Airlines (cont'd.) | ||||||||||||||||
United Airlines, Inc., | ||||||||||||||||
Sr. Sec’d. Notes, 144A | 4.375 | % | 04/15/26 | 223 | $ | 231,351 | ||||||||||
Sr. Sec’d. Notes, 144A | 4.625 | 04/15/29 | 100 | 103,760 | ||||||||||||
|
| |||||||||||||||
| 871,201 | ||||||||||||||||
| Apparel 0.3% | ||||||||||||||||
William Carter Co. (The), Gtd. Notes, 144A | 5.625 | 03/15/27 | 200 | 209,042 | ||||||||||||
Wolverine World Wide, Inc., Gtd. Notes, 144A | 4.000 | 08/15/29 | 50 | 50,762 | ||||||||||||
|
| |||||||||||||||
| 259,804 | ||||||||||||||||
| Auto Manufacturers 3.2% | ||||||||||||||||
Allison Transmission, Inc., | ||||||||||||||||
Gtd. Notes, 144A | 3.750 | 01/30/31 | 150 | 150,370 | ||||||||||||
Sr. Unsec’d. Notes, 144A | 5.875 | 06/01/29 | 75 | 82,594 | ||||||||||||
Ford Holdings LLC, Gtd. Notes | 9.300 | 03/01/30 | 100 | 136,748 | ||||||||||||
Ford Motor Co., | ||||||||||||||||
Sr. Unsec’d. Notes(a) | 4.750 | 01/15/43 | 535 | 577,045 | ||||||||||||
Sr. Unsec’d. Notes | 5.291 | 12/08/46 | 325 | 368,122 | ||||||||||||
Sr. Unsec’d. Notes | 7.400 | 11/01/46 | 75 | 102,034 | ||||||||||||
Sr. Unsec’d. Notes | 7.450 | 07/16/31 | 75 | 98,699 | ||||||||||||
Sr. Unsec’d. Notes | 9.000 | 04/22/25 | 300 | 365,563 | ||||||||||||
Sr. Unsec’d. Notes | 9.625 | 04/22/30 | 520 | 741,232 | ||||||||||||
PM General Purchaser LLC, Sr. Sec’d. Notes, 144A | 9.500 | 10/01/28 | 175 | 190,234 | ||||||||||||
|
| |||||||||||||||
| 2,812,641 | ||||||||||||||||
| Auto Parts & Equipment 1.7% | ||||||||||||||||
Adient Global Holdings Ltd. (Jersey, Channel Islands), | 4.875 | 08/15/26 | 400 | 411,052 | ||||||||||||
American Axle & Manufacturing, Inc., | ||||||||||||||||
Gtd. Notes | 5.000 | 10/01/29 | 175 | 175,167 | ||||||||||||
Gtd. Notes | 6.250 | 04/01/25 | 21 | 21,698 | ||||||||||||
Gtd. Notes | 6.250 | 03/15/26 | 100 | 103,071 | ||||||||||||
Gtd. Notes | 6.500 | 04/01/27 | 150 | 157,634 | ||||||||||||
Gtd. Notes | 6.875 | 07/01/28 | 75 | 81,000 | ||||||||||||
Cooper-Standard Automotive, Inc., Gtd. Notes, 144A | 5.625 | 11/15/26 | 50 | 42,109 | ||||||||||||
Dana, Inc., | ||||||||||||||||
Sr. Unsec’d. Notes | 4.250 | 09/01/30 | 25 | 25,981 | ||||||||||||
Sr. Unsec’d. Notes | 5.625 | 06/15/28 | 160 | 172,075 | ||||||||||||
Tenneco, Inc., | ||||||||||||||||
Sr. Sec’d. Notes, 144A | 5.125 | 04/15/29 | 150 | 155,564 | ||||||||||||
Sr. Sec’d. Notes, 144A | 7.875 | 01/15/29 | 25 | 28,213 | ||||||||||||
See Notes to Financial Statements.
| 56 |
| Description | Interest Rate | Maturity Date | Principal Amount (000)# | Value | ||||||||||
| CORPORATE BONDS (Continued) | ||||||||||||||
| Auto Parts & Equipment (cont'd.) | ||||||||||||||
Titan International, Inc., Sr. Sec’d. Notes, 144A | 7.000% | 04/30/28 | 100 | $ | 104,541 | |||||||||
|
| |||||||||||||
| 1,478,105 | ||||||||||||||
| Banks 0.2% | ||||||||||||||
Citigroup, Inc., Jr. Sub. Notes, 5 Year CMT | 3.875(c) | 2/18/2026 | 75 | 77,156 | ||||||||||
Freedom Mortgage Corp., Sr. Unsec’d. Notes, 144A | 7.625 | 05/01/26 | 75 | 75,142 | ||||||||||
|
| |||||||||||||
| 152,298 | ||||||||||||||
| Building Materials 2.1% | ||||||||||||||
Cornerstone Building Brands, Inc., Gtd. Notes, 144A | 6.125 | 01/15/29 | 125 | 133,721 | ||||||||||
Griffon Corp., Gtd. Notes | 5.750 | 03/01/28 | 275 | 292,305 | ||||||||||
Masonite International Corp. (Canada), | ||||||||||||||
Gtd. Notes, 144A | 3.500 | 02/15/30 | 50 | 50,129 | ||||||||||
Gtd. Notes, 144A | 5.375 | 02/01/28 | 100 | 106,193 | ||||||||||
Patrick Industries, Inc., | ||||||||||||||
Gtd. Notes, 144A | 7.500 | 10/15/27 | 75 | 81,378 | ||||||||||
Sr. Unsec’d. Notes, 144A | 4.750 | 05/01/29 | 75 | 76,599 | ||||||||||
SRM Escrow Issuer LLC, Sr. Sec’d. Notes, 144A | 6.000 | 11/01/28 | 250 | 265,055 | ||||||||||
Standard Industries, Inc., | ||||||||||||||
Sr. Unsec’d. Notes, 144A | 3.375 | 01/15/31 | 150 | 144,385 | ||||||||||
Sr. Unsec’d. Notes, 144A | 4.375 | 07/15/30 | 75 | 77,268 | ||||||||||
Sr. Unsec’d. Notes, 144A | 4.750 | 01/15/28 | 175 | 182,093 | ||||||||||
Sr. Unsec’d. Notes, 144A | 5.000 | 02/15/27 | 120 | 124,195 | ||||||||||
Summit Materials LLC/Summit Materials Finance Corp., | ||||||||||||||
Gtd. Notes, 144A | 5.250 | 01/15/29 | 15 | 15,869 | ||||||||||
Gtd. Notes, 144A | 6.500 | 03/15/27 | 150 | 157,875 | ||||||||||
US Concrete, Inc., Gtd. Notes, 144A | 5.125 | 03/01/29 | 125 | 136,692 | ||||||||||
|
| |||||||||||||
| 1,843,757 | ||||||||||||||
| Chemicals 2.2% | ||||||||||||||
Ashland LLC, Gtd. Notes | 6.875 | 05/15/43 | 75 | 96,348 | ||||||||||
Axalta Coating Systems LLC, Gtd. Notes, 144A | 3.375 | 02/15/29 | 150 | 147,060 | ||||||||||
Chemours Co. (The), | ||||||||||||||
Gtd. Notes, 144A | 4.625 | 11/15/29 | 50 | 49,666 | ||||||||||
Gtd. Notes, 144A | 5.750 | 11/15/28 | 200 | 211,906 | ||||||||||
Cornerstone Chemical Co., Sr. Sec’d. Notes, 144A | 6.750 | 08/15/24 | 75 | 67,257 | ||||||||||
Hexion, Inc., Gtd. Notes, 144A | 7.875 | 07/15/27 | 125 | 132,983 | ||||||||||
Rain CII Carbon LLC/CII Carbon Corp., Sec’d. | 7.250 | 04/01/25 | 150 | 155,070 | ||||||||||
SCIH Salt Holdings, Inc., Sr. Unsec’d. Notes, 144A | 6.625 | 05/01/29 | 25 | 24,574 | ||||||||||
See Notes to Financial Statements.
PGIM Fixed Income ETFs | 57 |
PGIM Active High Yield Bond ETF
Schedule of Investments (continued)
as of August 31, 2021
| Description | Interest Rate | Maturity Date | Principal Amount (000)# | Value | ||||||||||||
| CORPORATE BONDS (Continued) | ||||||||||||||||
| Chemicals (cont'd.) | ||||||||||||||||
TPC Group, Inc., | ||||||||||||||||
Sr. Sec’d. Notes, 144A | 10.500 | % | 08/01/24 | 185 | $ | 171,089 | ||||||||||
Sr. Sec’d. Notes, 144A | 10.875 | 08/01/24 | 46 | 48,658 | ||||||||||||
Tronox, Inc., Gtd. Notes, 144A | 4.625 | 03/15/29 | 150 | 152,305 | ||||||||||||
Valvoline, Inc., | ||||||||||||||||
Gtd. Notes, 144A | 4.250 | 02/15/30 | 25 | 25,949 | ||||||||||||
Sr. Unsec’d. Notes, 144A | 3.625 | 06/15/31 | 175 | 174,126 | ||||||||||||
Venator Finance Sarl/Venator Materials LLC (Multinational), | ||||||||||||||||
Gtd. Notes, 144A | 5.750 | 07/15/25 | 275 | 260,182 | ||||||||||||
Sr. Sec’d. Notes, 144A | 9.500 | 07/01/25 | 25 | 27,804 | ||||||||||||
W.R. Grace & Co.-Conn, Gtd. Notes, 144A | 4.875 | 06/15/27 | 50 | 51,876 | ||||||||||||
W.R. Grace Holdings LLC, Sr. Unsec’d. Notes, 144A | 5.625 | 08/15/29 | 75 | 78,076 | ||||||||||||
|
| |||||||||||||||
| 1,874,929 | ||||||||||||||||
| Coal 0.0% | ||||||||||||||||
Coronado Finance Pty Ltd. (Australia), Sr. Sec’d. | 10.750 | 05/15/26 | 25 | 27,467 | ||||||||||||
| Commercial Services 4.8% | ||||||||||||||||
Adtalem Global Education, Inc., Sr. Sec’d. Notes, 144A | 5.500 | 03/01/28 | 185 | 189,376 | ||||||||||||
Allied Universal Holdco LLC/Allied Universal Finance Corp., | ||||||||||||||||
Sr. Sec’d. Notes, 144A | 6.625 | 07/15/26 | 110 | 117,535 | ||||||||||||
Sr. Unsec’d. Notes, 144A | 6.000 | 06/01/29 | 400 | 399,977 | ||||||||||||
Sr. Unsec’d. Notes, 144A | 9.750 | 07/15/27 | 200 | 218,811 | ||||||||||||
Allied Universal Holdco LLC/Allied Universal Finance Corp./Atlas Luxco 4 Sarl (Multinational), Sr. Sec’d. Notes, 144A | 4.625 | 06/01/28 | 400 | 401,073 | ||||||||||||
Alta Equipment Group, Inc., Sec’d. Notes, 144A | 5.625 | 04/15/26 | 50 | 51,500 | ||||||||||||
AMN Healthcare, Inc., | ||||||||||||||||
Gtd. Notes, 144A | 4.000 | 04/15/29 | 25 | 25,794 | ||||||||||||
Gtd. Notes, 144A | 4.625 | 10/01/27 | 175 | 182,528 | ||||||||||||
Avis Budget Car Rental LLC/Avis Budget Finance, Inc., | ||||||||||||||||
Gtd. Notes, 144A | 4.750 | 04/01/28 | 175 | 180,433 | ||||||||||||
Gtd. Notes, 144A | 5.250 | 03/15/25 | 25 | 25,438 | ||||||||||||
Brink’s Co. (The), Gtd. Notes, 144A | 4.625 | 10/15/27 | 100 | 105,010 | ||||||||||||
Carriage Services, Inc., Gtd. Notes, 144A | 4.250 | 05/15/29 | 50 | 50,064 | ||||||||||||
CoreLogic, Inc., Sr. Sec’d. Notes, 144A | 4.500 | 05/01/28 | 50 | 49,913 | ||||||||||||
Gartner, Inc., Gtd. Notes, 144A | 3.625 | 06/15/29 | 50 | 51,504 | ||||||||||||
Metis Merger Sub LLC, Sr. Unsec’d. Notes, 144A | 6.500 | 05/15/29 | 225 | 225,011 | ||||||||||||
MPH Acquisition Holdings LLC, Sr. Sec’d. Notes, 144A | 5.500 | 09/01/28 | 50 | 50,802 | ||||||||||||
NESCO Holdings II, Inc., Sec’d. Notes, 144A | 5.500 | 04/15/29 | 100 | 103,793 | ||||||||||||
See Notes to Financial Statements.
| 58 |
| Description | Interest Rate | Maturity Date | Principal Amount (000)# | Value | ||||||||||||
| CORPORATE BONDS (Continued) | ||||||||||||||||
| Commercial Services (cont'd.) | ||||||||||||||||
Nielsen Finance LLC/Nielsen Finance Co., | ||||||||||||||||
Gtd. Notes, 144A | 4.500 | % | 07/15/29 | 25 | $ | 24,826 | ||||||||||
Gtd. Notes, 144A | 5.875 | 10/01/30 | 15 | 16,031 | ||||||||||||
Sr. Unsec’d. Notes, 144A | 4.750 | 07/15/31 | 25 | 24,712 | ||||||||||||
Service Corp. International, Sr. Unsec’d. Notes | 4.000 | 05/15/31 | 200 | 207,180 | ||||||||||||
United Rentals North America, Inc., | ||||||||||||||||
Gtd. Notes | 3.750 | 01/15/32 | 75 | 76,624 | ||||||||||||
Gtd. Notes | 3.875 | 02/15/31 | 600 | 621,315 | ||||||||||||
Gtd. Notes | 4.875 | 01/15/28 | 125 | 132,452 | ||||||||||||
Gtd. Notes | 5.250 | 01/15/30 | 100 | 109,838 | ||||||||||||
Verscend Escrow Corp., Sr. Unsec’d. Notes, 144A | 9.750 | 08/15/26 | 530 | 560,525 | ||||||||||||
|
| |||||||||||||||
| 4,202,065 | ||||||||||||||||
| Computers 1.1% | ||||||||||||||||
Banff Merger Sub, Inc., Sr. Unsec’d. Notes, 144A | 9.750 | 09/01/26 | 626 | 655,624 | ||||||||||||
NCR Corp., | ||||||||||||||||
Gtd. Notes, 144A | 5.000 | 10/01/28 | 225 | 232,971 | ||||||||||||
Gtd. Notes, 144A | 5.125 | 04/15/29 | 25 | 25,939 | ||||||||||||
Gtd. Notes, 144A | 5.250 | 10/01/30 | 50 | 52,463 | ||||||||||||
Tempo Acquisition LLC/Tempo Acquisition Finance Corp., Sr. Sec’d. Notes, 144A | 5.750 | 06/01/25 | 25 | 26,388 | ||||||||||||
|
| |||||||||||||||
| 993,385 | ||||||||||||||||
| Distribution/Wholesale 0.5% | ||||||||||||||||
Avient Corp., Sr. Unsec’d. Notes, 144A | 5.750 | 05/15/25 | 100 | 105,513 | ||||||||||||
H&E Equipment Services, Inc., Gtd. Notes, 144A | 3.875 | 12/15/28 | 350 | 351,167 | ||||||||||||
|
| |||||||||||||||
| 456,680 | ||||||||||||||||
| Diversified Financial Services 2.9% | ||||||||||||||||
Alliance Data Systems Corp., Gtd. Notes, 144A | 4.750 | 12/15/24 | 100 | 102,483 | ||||||||||||
goeasy Ltd. (Canada), | ||||||||||||||||
Gtd. Notes, 144A | 4.375 | 05/01/26 | 50 | 51,576 | ||||||||||||
Gtd. Notes, 144A | 5.375 | 12/01/24 | 75 | 77,396 | ||||||||||||
Home Point Capital, Inc., Gtd. Notes, 144A | 5.000 | 02/01/26 | 125 | 108,473 | ||||||||||||
Jefferies Finance LLC/JFIN Co.-Issuer Corp., | 5.000 | 08/15/28 | 200 | 204,972 | ||||||||||||
LD Holdings Group LLC, Gtd. Notes, 144A | 6.125 | 04/01/28 | 100 | 98,378 | ||||||||||||
LPL Holdings, Inc., | ||||||||||||||||
Gtd. Notes, 144A | 4.000 | 03/15/29 | 125 | 127,526 | ||||||||||||
Gtd. Notes, 144A | 4.375 | 05/15/31 | 50 | 51,944 | ||||||||||||
See Notes to Financial Statements.
PGIM Fixed Income ETFs | 59 |
PGIM Active High Yield Bond ETF
Schedule of Investments (continued)
as of August 31, 2021
| Description | Interest Rate | Maturity Date | Principal Amount (000)# | Value | ||||||||||||
| CORPORATE BONDS (Continued) | ||||||||||||||||
| Diversified Financial Services (cont'd.) | ||||||||||||||||
Nationstar Mortgage Holdings, Inc., | ||||||||||||||||
Gtd. Notes, 144A | 5.125 | % | 12/15/30 | 200 | $ | 205,012 | ||||||||||
Gtd. Notes, 144A | 6.000 | 01/15/27 | 225 | 237,248 | ||||||||||||
OneMain Finance Corp., | ||||||||||||||||
Gtd. Notes | 3.875 | 09/15/28 | 50 | 50,200 | ||||||||||||
Gtd. Notes | 4.000 | 09/15/30 | 125 | 125,193 | ||||||||||||
Gtd. Notes | 6.125 | 03/15/24 | 225 | 242,545 | ||||||||||||
Gtd. Notes | 6.875 | 03/15/25 | 350 | 396,768 | ||||||||||||
Gtd. Notes | 7.125 | 03/15/26 | 250 | 292,031 | ||||||||||||
PennyMac Financial Services, Inc., | ||||||||||||||||
Gtd. Notes, 144A | 4.250 | 02/15/29 | 50 | 48,440 | ||||||||||||
Gtd. Notes, 144A | 5.375 | 10/15/25 | 100 | 103,395 | ||||||||||||
|
| |||||||||||||||
| 2,523,580 | ||||||||||||||||
| Electric 4.4% | ||||||||||||||||
Calpine Corp., | ||||||||||||||||
Sr. Sec’d. Notes, 144A | 3.750 | 03/01/31 | 225 | 220,656 | ||||||||||||
Sr. Sec’d. Notes, 144A | 4.500 | 02/15/28 | 186 | 191,641 | ||||||||||||
Sr. Unsec’d. Notes, 144A | 4.625 | 02/01/29 | 40 | 40,156 | ||||||||||||
Sr. Unsec’d. Notes, 144A | 5.000 | 02/01/31 | 250 | 255,211 | ||||||||||||
Sr. Unsec’d. Notes, 144A | 5.125 | 03/15/28 | 659 | 672,124 | ||||||||||||
NRG Energy, Inc., | ||||||||||||||||
Gtd. Notes | 5.750 | 01/15/28 | 275 | 294,164 | ||||||||||||
Gtd. Notes | 6.625 | 01/15/27 | 70 | 72,582 | ||||||||||||
Gtd. Notes, 144A | 3.375 | 02/15/29 | 75 | 75,331 | ||||||||||||
Gtd. Notes, 144A | 3.875 | 02/15/32 | 75 | 76,051 | ||||||||||||
Gtd. Notes, 144A | 5.250 | 06/15/29 | 250 | 271,042 | ||||||||||||
PG&E Corp., | ||||||||||||||||
Sr. Sec’d. Notes(a) | 5.000 | 07/01/28 | 350 | 347,416 | ||||||||||||
Sr. Sec’d. Notes | 5.250 | 07/01/30 | 220 | 217,174 | ||||||||||||
Vistra Operations Co. LLC, | ||||||||||||||||
Gtd. Notes, 144A | 5.000 | 07/31/27 | 90 | 93,601 | ||||||||||||
Gtd. Notes, 144A | 5.500 | 09/01/26 | 50 | 51,450 | ||||||||||||
Gtd. Notes, 144A | 5.625 | 02/15/27 | 750 | 780,885 | ||||||||||||
Sr. Unsec’d. Notes, 144A | 4.375 | 05/01/29 | 150 | 152,262 | ||||||||||||
|
| |||||||||||||||
| 3,811,746 | ||||||||||||||||
| Electrical Components & Equipment 0.4% | ||||||||||||||||
Energizer Holdings, Inc., Gtd. Notes, 144A | 4.375 | 03/31/29 | 50 | 50,132 | ||||||||||||
WESCO Distribution, Inc., | ||||||||||||||||
Gtd. Notes, 144A | 7.125 | 06/15/25 | 150 | 161,320 | ||||||||||||
See Notes to Financial Statements.
| 60 |
| Description | Interest Rate | Maturity Date | Principal Amount (000)# | Value | ||||||||||||
| CORPORATE BONDS (Continued) | ||||||||||||||||
| Electrical Components & Equipment (cont'd.) | ||||||||||||||||
| WESCO Distribution, Inc., (cont'd.) | ||||||||||||||||
Gtd. Notes, 144A | 7.250 | % | 06/15/28 | 100 | $ | 111,327 | ||||||||||
|
| |||||||||||||||
| 322,779 | ||||||||||||||||
| Electronics 0.1% | ||||||||||||||||
Brightstar Escrow Corp., Sr. Sec’d. Notes, 144A | 9.750 | 10/15/25 | 100 | 107,582 | ||||||||||||
Sensata Technologies, Inc., Gtd. Notes, 144A | 3.750 | 02/15/31 | 15 | 15,158 | ||||||||||||
|
| |||||||||||||||
| 122,740 | ||||||||||||||||
| Engineering & Construction 0.2% | ||||||||||||||||
AECOM, Gtd. Notes | 5.125 | 03/15/27 | 50 | 55,879 | ||||||||||||
PowerTeam Services LLC, Sr. Sec’d. Notes, 144A | 9.033 | 12/04/25 | 50 | 54,745 | ||||||||||||
TopBuild Corp., Gtd. Notes, 144A | 3.625 | 03/15/29 | 75 | 75,063 | ||||||||||||
|
| |||||||||||||||
| 185,687 | ||||||||||||||||
| Entertainment 4.6% | ||||||||||||||||
AMC Entertainment Holdings, Inc., Sec’d. Notes, PIK 12.000% until 12/15/2021 then cash coupon 10.000% until 6/15/26; or combination of cash coupon 5.000% and PIK 6.000%, 144A | 12.000 | 06/15/26 | 82 | 73,528 | ||||||||||||
Caesars Entertainment, Inc., Sr. Sec’d. Notes, 144A | 6.250 | 07/01/25 | 290 | 306,443 | ||||||||||||
Caesars Resort Collection LLC/CRC Finco, Inc., | ||||||||||||||||
Gtd. Notes, 144A | 5.250 | 10/15/25 | 300 | 304,340 | ||||||||||||
Sr. Sec’d. Notes, 144A | 5.750 | 07/01/25 | 260 | 273,296 | ||||||||||||
CCM Merger, Inc., Sr. Unsec’d. Notes, 144A | 6.375 | 05/01/26 | 25 | 26,348 | ||||||||||||
Cedar Fair LP, Gtd. Notes | 5.250 | 07/15/29 | 25 | 25,576 | ||||||||||||
Churchill Downs, Inc., Gtd. Notes, 144A | 5.500 | 04/01/27 | 125 | 130,075 | ||||||||||||
Everi Holdings, Inc., Gtd. Notes, 144A | 5.000 | 07/15/29 | 25 | 25,584 | ||||||||||||
Golden Entertainment, Inc., Sr. Unsec’d. Notes, 144A | 7.625 | 04/15/26 | 225 | 239,190 | ||||||||||||
International Game Technology PLC (United Kingdom), | 5.250 | 01/15/29 | 500 | 534,618 | ||||||||||||
Jacobs Entertainment, Inc., Sec’d. Notes, 144A | 7.875 | 02/01/24 | 125 | 130,451 | ||||||||||||
Midwest Gaming Borrower LLC/Midwest Gaming Finance Corp., Sr. Sec’d. Notes, 144A | 4.875 | 05/01/29 | 75 | 75,948 | ||||||||||||
Motion Bondco DAC (Ireland), Gtd. Notes, 144A | 6.625 | 11/15/27 | 200 | 201,311 | ||||||||||||
Peninsula Pacific Entertainment LLC/Peninsula Pacific Entertainment Finance In, Sr. Unsec’d. Notes, 144A | 8.500 | 11/15/27 | 200 | 213,756 | ||||||||||||
Penn National Gaming, Inc., | ||||||||||||||||
Sr. Unsec’d. Notes, 144A | 4.125 | 07/01/29 | 25 | 24,959 | ||||||||||||
Sr. Unsec’d. Notes, 144A | 5.625 | 01/15/27 | 250 | 259,539 | ||||||||||||
See Notes to Financial Statements.
PGIM Fixed Income ETFs | 61 |
PGIM Active High Yield Bond ETF
Schedule of Investments (continued)
as of August 31, 2021
| Description | Interest Rate | Maturity Date | Principal Amount (000)# | Value | ||||||||||||
| CORPORATE BONDS (Continued) | ||||||||||||||||
| Entertainment (cont'd.) | ||||||||||||||||
| Premier Entertainment Sub LLC/Premier Entertainment Finance Corp., | ||||||||||||||||
Gtd. Notes, 144A | 5.625 | % | 09/01/29 | 125 | $ | 128,012 | ||||||||||
Gtd. Notes, 144A | 5.875 | 09/01/31 | 125 | 128,093 | ||||||||||||
| Scientific Games International, Inc., | ||||||||||||||||
Gtd. Notes, 144A | 8.250 | 03/15/26 | 200 | 212,838 | ||||||||||||
Gtd. Notes, 144A | 8.625 | 07/01/25 | 425 | 458,855 | ||||||||||||
Sr. Sec’d. Notes, 144A | 5.000 | 10/15/25 | 75 | 77,155 | ||||||||||||
| Wynn Resorts Finance LLC/Wynn Resorts Capital Corp., | ||||||||||||||||
Gtd. Notes, 144A | 5.125 | 10/01/29 | 155 | 161,577 | ||||||||||||
Sr. Unsec’d. Notes, 144A | 7.750 | 04/15/25 | 25 | 26,566 | ||||||||||||
|
| |||||||||||||||
| 4,038,058 | ||||||||||||||||
| Environmental Control 0.2% | ||||||||||||||||
GFL Environmental, Inc. (Canada), Gtd. Notes, 144A | 4.375 | 08/15/29 | 75 | 75,357 | ||||||||||||
| Madison IAQ LLC, | ||||||||||||||||
Sr. Sec’d. Notes, 144A | 4.125 | 06/30/28 | 25 | 25,133 | ||||||||||||
Sr. Unsec’d. Notes, 144A | 5.875 | 06/30/29 | 50 | 51,182 | ||||||||||||
|
| |||||||||||||||
| 151,672 | ||||||||||||||||
| Food 3.3% | ||||||||||||||||
Albertsons Cos., Inc./Safeway, Inc./New Albertsons LP/Albertsons LLC, | ||||||||||||||||
Gtd. Notes, 144A | 3.500 | 03/15/29 | 200 | 202,031 | ||||||||||||
Gtd. Notes, 144A | 5.875 | 02/15/28 | 25 | 26,824 | ||||||||||||
B&G Foods, Inc., | ||||||||||||||||
Gtd. Notes | 5.250 | 04/01/25 | 175 | 179,445 | ||||||||||||
Gtd. Notes | 5.250 | 09/15/27 | 275 | 285,431 | ||||||||||||
C&S Group Enterprises LLC, Gtd. Notes, 144A | 5.000 | 12/15/28 | 75 | 73,999 | ||||||||||||
Chobani LLC/Chobani Finance Corp., Inc., | ||||||||||||||||
Gtd. Notes, 144A | 7.500 | 04/15/25 | 50 | 52,034 | ||||||||||||
Sr. Sec’d. Notes, 144A | 4.625 | 11/15/28 | 50 | 51,938 | ||||||||||||
JBS USA Food Co., Gtd. Notes, 144A | 5.750 | 01/15/28 | 200 | 211,241 | ||||||||||||
JBS USA LUX SA/JBS USA Finance, Inc. (Multinational), | 6.750 | 02/15/28 | 160 | 175,346 | ||||||||||||
JBS USA LUX SA/JBS USA Food Co./JBS USA Finance, Inc. (Multinational), | ||||||||||||||||
Gtd. Notes, 144A | 3.750 | 12/01/31 | 50 | 52,752 | ||||||||||||
Gtd. Notes, 144A | 6.500 | 04/15/29 | 150 | 169,922 | ||||||||||||
See Notes to Financial Statements.
| 62 |
| Description | Interest Rate | Maturity Date | Principal Amount (000)# | Value | ||||||||||||
| CORPORATE BONDS (Continued) | ||||||||||||||||
| Food (cont'd.) | ||||||||||||||||
Kraft Heinz Foods Co., | ||||||||||||||||
Gtd. Notes | 4.375 | % | 06/01/46 | 75 | $ | 86,641 | ||||||||||
Gtd. Notes | 4.875 | 10/01/49 | 50 | 62,307 | ||||||||||||
Gtd. Notes | 5.200 | 07/15/45 | 50 | 64,014 | ||||||||||||
Gtd. Notes | 5.500 | 06/01/50 | 75 | 100,151 | ||||||||||||
Gtd. Notes | 6.500 | 02/09/40 | 50 | 72,663 | ||||||||||||
| Pilgrim’s Pride Corp., | ||||||||||||||||
Gtd. Notes, 144A | 3.500 | 03/01/32 | 50 | 51,063 | ||||||||||||
Gtd. Notes, 144A | 4.250 | 04/15/31 | 175 | 188,524 | ||||||||||||
Gtd. Notes, 144A | 5.875 | 09/30/27 | 240 | 256,359 | ||||||||||||
| Post Holdings, Inc., | ||||||||||||||||
Gtd. Notes, 144A | 4.625 | 04/15/30 | 300 | 306,597 | ||||||||||||
Sr. Unsec’d. Notes, 144A | 4.500 | 09/15/31 | 200 | 202,128 | ||||||||||||
| US Foods, Inc., Gtd. Notes, 144A | 4.750 | 02/15/29 | 25 | 25,661 | ||||||||||||
|
| |||||||||||||||
| 2,897,071 | ||||||||||||||||
| Gas 0.7% | ||||||||||||||||
| AmeriGas Partners LP/AmeriGas Finance Corp., | ||||||||||||||||
Sr. Unsec’d. Notes | 5.500 | 05/20/25 | 325 | 357,606 | ||||||||||||
Sr. Unsec’d. Notes | 5.750 | 05/20/27 | 75 | 84,448 | ||||||||||||
Sr. Unsec’d. Notes | 5.875 | 08/20/26 | 178 | 200,140 | ||||||||||||
|
| |||||||||||||||
| 642,194 | ||||||||||||||||
| Healthcare-Services 4.2% | ||||||||||||||||
Catalent Pharma Solutions, Inc., Gtd. Notes, 144A | 3.125 | 02/15/29 | 25 | 24,699 | ||||||||||||
DaVita, Inc., | ||||||||||||||||
Gtd. Notes, 144A | 3.750 | 02/15/31 | 525 | 519,017 | ||||||||||||
Gtd. Notes, 144A | 4.625 | 06/01/30 | 100 | 104,483 | ||||||||||||
HCA, Inc., | ||||||||||||||||
Gtd. Notes | 5.375 | 09/01/26 | 470 | 542,004 | ||||||||||||
Gtd. Notes | 5.875 | 02/15/26 | 250 | 290,667 | ||||||||||||
Legacy LifePoint Health LLC, Sr. Sec’d. Notes, 144A | 6.750 | 04/15/25 | 75 | 79,168 | ||||||||||||
LifePoint Health, Inc., Gtd. Notes, 144A | 5.375 | 01/15/29 | 50 | 49,172 | ||||||||||||
MEDNAX, Inc., Gtd. Notes, 144A | 6.250 | 01/15/27 | 150 | 158,111 | ||||||||||||
Prime Healthcare Services, Inc., Sr. Sec’d. Notes, 144A | 7.250 | 11/01/25 | 150 | 160,798 | ||||||||||||
RegionalCare Hospital Partners Holdings, Inc./LifePoint Health, Inc., Gtd. Notes, 144A | 9.750 | 12/01/26 | 325 | 346,256 | ||||||||||||
| Tenet Healthcare Corp., | ||||||||||||||||
Gtd. Notes, 144A | 6.125 | 10/01/28 | 350 | 370,052 | ||||||||||||
Sr. Sec’d. Notes, 144A | 4.250 | 06/01/29 | 500 | 510,751 | ||||||||||||
Sr. Sec’d. Notes, 144A | 4.875 | 01/01/26 | 309 | 320,273 | ||||||||||||
See Notes to Financial Statements.
PGIM Fixed Income ETFs | 63 |
PGIM Active High Yield Bond ETF
Schedule of Investments (continued)
as of August 31, 2021
| Description | Interest Rate | Maturity Date | Principal Amount (000)# | Value | ||||||||||||
| CORPORATE BONDS (Continued) | ||||||||||||||||
| Healthcare-Services (cont'd.) | ||||||||||||||||
| Tenet Healthcare Corp., (cont'd.) | ||||||||||||||||
Sr. Unsec’d. Notes | 6.875 | % | 11/15/31 | 125 | $ | 143,947 | ||||||||||
|
| |||||||||||||||
| 3,619,398 | ||||||||||||||||
| Home Builders 4.3% | ||||||||||||||||
Ashton Woods USA LLC/Ashton Woods Finance Co., | ||||||||||||||||
Sr. Unsec’d. Notes, 144A | 4.625 | 08/01/29 | 25 | 25,131 | ||||||||||||
Sr. Unsec’d. Notes, 144A | 9.875 | 04/01/27 | 75 | 83,392 | ||||||||||||
Beazer Homes USA, Inc., | ||||||||||||||||
Gtd. Notes | 5.875 | 10/15/27 | 75 | 79,081 | ||||||||||||
Gtd. Notes | 7.250 | 10/15/29 | 470 | 520,185 | ||||||||||||
| Brookfield Residential Properties, Inc./Brookfield Residential US LLC (Canada), | ||||||||||||||||
Gtd. Notes, 144A | 4.875 | 02/15/30 | 75 | 75,623 | ||||||||||||
Gtd. Notes, 144A | 6.250 | 09/15/27 | 270 | 285,078 | ||||||||||||
Sr. Unsec’d. Notes, 144A | 5.000 | 06/15/29 | 25 | 25,455 | ||||||||||||
| Century Communities, Inc., | ||||||||||||||||
Gtd. Notes | 6.750 | 06/01/27 | 250 | 266,944 | ||||||||||||
Gtd. Notes, 144A | 3.875 | 08/15/29 | 25 | 25,376 | ||||||||||||
| Forestar Group, Inc., | ||||||||||||||||
Gtd. Notes, 144A | 3.850 | 05/15/26 | 50 | 50,470 | ||||||||||||
Gtd. Notes, 144A | 5.000 | 03/01/28 | 75 | 77,813 | ||||||||||||
| KB Home, | ||||||||||||||||
Gtd. Notes | 4.000 | 06/15/31 | 50 | 52,329 | ||||||||||||
Gtd. Notes | 4.800 | 11/15/29 | 150 | 166,548 | ||||||||||||
Gtd. Notes | 6.875 | 06/15/27 | 50 | 59,958 | ||||||||||||
| M/I Homes, Inc., Gtd. Notes | 4.950 | 02/01/28 | 175 | 183,449 | ||||||||||||
| Mattamy Group Corp. (Canada), | ||||||||||||||||
Sr. Unsec’d. Notes, 144A | 4.625 | 03/01/30 | 175 | 179,424 | ||||||||||||
Sr. Unsec’d. Notes, 144A | 5.250 | 12/15/27 | 250 | 261,315 | ||||||||||||
| Shea Homes LP/Shea Homes Funding Corp., | ||||||||||||||||
Sr. Unsec’d. Notes, 144A | 4.750 | 02/15/28 | 175 | 180,396 | ||||||||||||
Sr. Unsec’d. Notes, 144A | 4.750 | 04/01/29 | 50 | 51,610 | ||||||||||||
| STL Holding Co. LLC, Sr. Unsec’d. Notes, 144A | 7.500 | 02/15/26 | 125 | 132,705 | ||||||||||||
| Taylor Morrison Communities, Inc., | ||||||||||||||||
Gtd. Notes, 144A | 6.625 | 07/15/27 | 100 | 106,693 | ||||||||||||
Sr. Unsec’d. Notes, 144A | 5.125 | 08/01/30 | 635 | 694,818 | ||||||||||||
| Tri Pointe Homes, Inc., | ||||||||||||||||
Gtd. Notes | 5.250 | 06/01/27 | 100 | 109,360 | ||||||||||||
Gtd. Notes | 5.700 | 06/15/28 | 15 | 16,726 | ||||||||||||
|
| |||||||||||||||
| 3,709,879 | ||||||||||||||||
See Notes to Financial Statements.
| 64 |
| Description | Interest Rate | Maturity Date | Principal Amount (000)# | Value | ||||||||||||
| CORPORATE BONDS (Continued) | ||||||||||||||||
| Home Furnishings 0.1% | ||||||||||||||||
Tempur Sealy International, Inc., Gtd. Notes, 144A | 4.000 | % | 04/15/29 | 100 | $ | 103,347 | ||||||||||
| Household Products/Wares 0.5% | ||||||||||||||||
ACCO Brands Corp., Gtd. Notes, 144A | 4.250 | 03/15/29 | 150 | 150,742 | ||||||||||||
Central Garden & Pet Co., Gtd. Notes, 144A | 4.125 | 04/30/31 | 25 | 25,396 | ||||||||||||
Kronos Acquisition Holdings, Inc./KIK Custom Products, Inc., | ||||||||||||||||
Gtd. Notes, 144A | 7.000 | 12/31/27 | 125 | 121,620 | ||||||||||||
Sr. Sec’d. Notes, 144A | 5.000 | 12/31/26 | 25 | 24,899 | ||||||||||||
Spectrum Brands, Inc., Gtd. Notes, 144A | 5.500 | 07/15/30 | 125 | 134,154 | ||||||||||||
|
| |||||||||||||||
| 456,811 | ||||||||||||||||
| Housewares 0.3% | ||||||||||||||||
| Scotts Miracle-Gro Co. (The), | ||||||||||||||||
Gtd. Notes, 144A | 4.000 | 04/01/31 | 225 | 225,461 | ||||||||||||
Gtd. Notes, 144A | 4.375 | 02/01/32 | 50 | 50,691 | ||||||||||||
|
| |||||||||||||||
| 276,152 | ||||||||||||||||
| Insurance 0.2% | ||||||||||||||||
Acrisure LLC/Acrisure Finance, Inc., Sr. Unsec’d. | 6.000 | 08/01/29 | 125 | 122,944 | ||||||||||||
AmWINS Group, Inc., Sr. Unsec’d. Notes, 144A | 4.875 | 06/30/29 | 50 | 50,854 | ||||||||||||
BroadStreet Partners, Inc., Sr. Unsec’d. Notes, 144A | 5.875 | 04/15/29 | 25 | 25,213 | ||||||||||||
|
| |||||||||||||||
| 199,011 | ||||||||||||||||
| Internet 0.1% | ||||||||||||||||
Go Daddy Operating Co. LLC/GD Finance Co., Inc., Gtd. Notes, 144A | 3.500 | 03/01/29 | 50 | 49,492 | ||||||||||||
NortonLifeLock, Inc., Sr. Unsec’d. Notes, 144A | 5.000 | 04/15/25 | 40 | 40,606 | ||||||||||||
|
| |||||||||||||||
| 90,098 | ||||||||||||||||
| Iron/Steel 0.3% | ||||||||||||||||
Big River Steel LLC/BRS Finance Corp., Sr. Sec’d. | 6.625 | 01/31/29 | 103 | 112,381 | ||||||||||||
TMS International Corp., Sr. Unsec’d. Notes, 144A | 6.250 | 04/15/29 | 25 | 26,193 | ||||||||||||
United States Steel Corp., Sr. Unsec’d. Notes | 6.875 | 03/01/29 | 145 | 158,422 | ||||||||||||
|
| |||||||||||||||
| 296,996 | ||||||||||||||||
See Notes to Financial Statements.
PGIM Fixed Income ETFs | 65 |
PGIM Active High Yield Bond ETF
Schedule of Investments (continued)
as of August 31, 2021
| Description | Interest Rate | Maturity Date | Principal Amount (000)# | Value | ||||||||||||
| CORPORATE BONDS (Continued) | ||||||||||||||||
| Leisure Time 0.2% | ||||||||||||||||
NCL Corp. Ltd. (Bermuda), Sr. Sec’d. Notes, 144A | 10.250 | % | 02/01/26 | 30 | $ | 34,637 | ||||||||||
Viking Cruises Ltd. (Bermuda), Gtd. Notes, 144A | 5.875 | 09/15/27 | 25 | 24,211 | ||||||||||||
Viking Ocean Cruises Ship VII Ltd. (Bermuda), | 5.625 | 02/15/29 | 25 | 24,956 | ||||||||||||
Vista Outdoor, Inc., Gtd. Notes, 144A | 4.500 | 03/15/29 | 50 | 50,584 | ||||||||||||
|
| |||||||||||||||
| 134,388 | ||||||||||||||||
| Lodging 2.4% | ||||||||||||||||
Boyd Gaming Corp., | ||||||||||||||||
Gtd. Notes | 4.750 | 12/01/27 | 250 | 257,813 | ||||||||||||
Gtd. Notes, 144A | 4.750 | 06/15/31 | 50 | 51,652 | ||||||||||||
Hilton Domestic Operating Co., Inc., | ||||||||||||||||
Gtd. Notes, 144A | 3.625 | 02/15/32 | 350 | 348,939 | ||||||||||||
Gtd. Notes, 144A | 4.000 | 05/01/31 | 175 | 180,442 | ||||||||||||
Gtd. Notes, 144A | 5.375 | 05/01/25 | 25 | 26,231 | ||||||||||||
Gtd. Notes, 144A | 5.750 | 05/01/28 | 25 | 27,021 | ||||||||||||
| MGM Resorts International, | ||||||||||||||||
Gtd. Notes | 4.625 | 09/01/26 | 75 | 79,122 | ||||||||||||
Gtd. Notes | 4.750 | 10/15/28 | 225 | 237,600 | ||||||||||||
Gtd. Notes | 5.500 | 04/15/27 | 150 | 163,400 | ||||||||||||
Gtd. Notes | 6.750 | 05/01/25 | 250 | 265,429 | ||||||||||||
Wynn Macau Ltd. (Cayman Islands), Sr. Unsec’d. | 5.625 | 08/26/28 | 400 | 405,360 | ||||||||||||
|
| |||||||||||||||
| 2,043,009 | ||||||||||||||||
| Machinery-Constructions & Mining 0.1% | ||||||||||||||||
Terex Corp., Gtd. Notes, 144A | 5.000 | 05/15/29 | 50 | 52,688 | ||||||||||||
| Machinery-Diversified 0.8% | ||||||||||||||||
GrafTech Finance, Inc., Sr. Sec’d. Notes, 144A | 4.625 | 12/15/28 | 140 | 142,820 | ||||||||||||
Maxim Crane Works Holdings Capital LLC, Sec’d. | 10.125 | 08/01/24 | 520 | 535,771 | ||||||||||||
|
| |||||||||||||||
| 678,591 | ||||||||||||||||
| Media 8.1% | ||||||||||||||||
| CCO Holdings LLC/CCO Holdings Capital Corp., | ||||||||||||||||
Sr. Unsec’d. Notes | 4.500 | 05/01/32 | 700 | 732,080 | ||||||||||||
Sr. Unsec’d. Notes, 144A | 4.250 | 02/01/31 | 1,375 | 1,411,316 | ||||||||||||
Sr. Unsec’d. Notes, 144A | 4.500 | 08/15/30 | 50 | 52,290 | ||||||||||||
Sr. Unsec’d. Notes, 144A | 4.500 | 06/01/33 | 75 | 77,725 | ||||||||||||
See Notes to Financial Statements.
| 66 |
| Description | Interest Rate | Maturity Date | Principal Amount (000)# | Value | ||||||||||||
| CORPORATE BONDS (Continued) | ||||||||||||||||
| Media (cont'd.) | ||||||||||||||||
| CCO Holdings LLC/CCO Holdings Capital Corp., (cont'd.) | ||||||||||||||||
Sr. Unsec’d. Notes, 144A | 4.750 | % | 03/01/30 | 150 | $ | 158,565 | ||||||||||
Sr. Unsec’d. Notes, 144A | 5.000 | 02/01/28 | 50 | 52,397 | ||||||||||||
Sr. Unsec’d. Notes, 144A | 5.375 | 06/01/29 | 125 | 136,502 | ||||||||||||
CSC Holdings LLC, | ||||||||||||||||
Gtd. Notes, 144A | 3.375 | 02/15/31 | 200 | 190,219 | ||||||||||||
Gtd. Notes, 144A | 4.125 | 12/01/30 | 200 | 200,263 | ||||||||||||
Sr. Unsec’d. Notes | 6.750 | 11/15/21 | 563 | 568,693 | ||||||||||||
Sr. Unsec’d. Notes, 144A | 4.625 | 12/01/30 | 325 | 320,007 | ||||||||||||
Diamond Sports Group LLC/Diamond Sports Finance Co., | ||||||||||||||||
Gtd. Notes, 144A | 6.625 | 08/15/27 | 711 | 305,753 | ||||||||||||
Sr. Sec’d. Notes, 144A | 5.375 | 08/15/26 | 160 | 106,193 | ||||||||||||
DISH DBS Corp., | ||||||||||||||||
Gtd. Notes | 5.875 | 11/15/24 | 50 | 54,033 | ||||||||||||
Gtd. Notes | 7.375 | 07/01/28 | 65 | 69,958 | ||||||||||||
Gtd. Notes | 7.750 | 07/01/26 | 259 | 296,552 | ||||||||||||
Gtd. Notes, 144A | 5.125 | 06/01/29 | 300 | 298,654 | ||||||||||||
| Gray Television, Inc., | ||||||||||||||||
Gtd. Notes, 144A | 4.750 | 10/15/30 | 25 | 24,769 | ||||||||||||
Gtd. Notes, 144A | 5.875 | 07/15/26 | 250 | 258,155 | ||||||||||||
Gtd. Notes, 144A | 7.000 | 05/15/27 | 175 | 187,712 | ||||||||||||
| iHeartCommunications, Inc., | ||||||||||||||||
Sr. Sec’d. Notes | 6.375 | 05/01/26 | 40 | 42,270 | ||||||||||||
Sr. Sec’d. Notes, 144A | 5.250 | 08/15/27 | 100 | 104,859 | ||||||||||||
| Midcontinent Communications/Midcontinent Finance Corp., Gtd. Notes, 144A | 5.375 | 08/15/27 | 150 | 156,404 | ||||||||||||
| News Corp., Sr. Unsec’d. Notes, 144A | 3.875 | 05/15/29 | 50 | 51,459 | ||||||||||||
| Nexstar Media, Inc., | ||||||||||||||||
Gtd. Notes, 144A | 4.750 | 11/01/28 | 50 | 52,005 | ||||||||||||
Gtd. Notes, 144A | 5.625 | 07/15/27 | 50 | 53,083 | ||||||||||||
| Radiate Holdco LLC/Radiate Finance, Inc., | ||||||||||||||||
Sr. Sec’d. Notes, 144A | 4.500 | 09/15/26 | 125 | 130,129 | ||||||||||||
Sr. Unsec’d. Notes, 144A | 6.500 | 09/15/28 | 75 | 76,860 | ||||||||||||
| Scripps Escrow II, Inc., | ||||||||||||||||
Sr. Sec’d. Notes, 144A | 3.875 | 01/15/29 | 25 | 25,125 | ||||||||||||
Sr. Unsec’d. Notes, 144A | 5.375 | 01/15/31 | 125 | 123,776 | ||||||||||||
| Scripps Escrow, Inc., Gtd. Notes, 144A | 5.875 | 07/15/27 | 20 | 20,522 | ||||||||||||
| Univision Communications, Inc., | ||||||||||||||||
Sr. Sec’d. Notes, 144A | 4.500 | 05/01/29 | 475 | 481,827 | ||||||||||||
Sr. Sec’d. Notes, 144A | 6.625 | 06/01/27 | 200 | 216,633 | ||||||||||||
| Urban One, Inc., Sr. Sec’d. Notes, 144A | 7.375 | 02/01/28 | 35 | 37,882 | ||||||||||||
|
| |||||||||||||||
| 7,074,670 | ||||||||||||||||
See Notes to Financial Statements.
PGIM Fixed Income ETFs | 67 |
PGIM Active High Yield Bond ETF
Schedule of Investments (continued)
as of August 31, 2021
| Description | Interest Rate | Maturity Date | Principal Amount (000)# | Value | ||||||||||||
| CORPORATE BONDS (Continued) | ||||||||||||||||
| Mining 2.5% | ||||||||||||||||
| Eldorado Gold Corp. (Canada), | ||||||||||||||||
Sec’d. Notes, 144A | 9.500 | % | 06/01/24 | 84 | $ | 91,691 | ||||||||||
Sr. Unsec’d. Notes, 144A | 6.250 | 09/01/29 | 200 | 203,190 | ||||||||||||
| First Quantum Minerals Ltd. (Canada), | ||||||||||||||||
Gtd. Notes, 144A | 6.500 | 03/01/24 | 315 | 320,584 | ||||||||||||
Gtd. Notes, 144A | 6.875 | 03/01/26 | 200 | 209,053 | ||||||||||||
Gtd. Notes, 144A | 7.500 | 04/01/25 | 400 | 415,051 | ||||||||||||
| Freeport-McMoRan, Inc., Gtd. Notes | 4.625 | 08/01/30 | 100 | 110,181 | ||||||||||||
| Hecla Mining Co., Gtd. Notes | 7.250 | 02/15/28 | 75 | 81,225 | ||||||||||||
| Hudbay Minerals, Inc. (Canada), | ||||||||||||||||
Gtd. Notes, 144A | 4.500 | 04/01/26 | 175 | 176,323 | ||||||||||||
Gtd. Notes, 144A | 6.125 | 04/01/29 | 110 | 118,317 | ||||||||||||
| IAMGOLD Corp. (Canada), Gtd. Notes, 144A | 5.750 | 10/15/28 | 94 | 93,996 | ||||||||||||
| New Gold, Inc. (Canada), | ||||||||||||||||
Gtd. Notes, 144A | 6.375 | 05/15/25 | 33 | 34,031 | ||||||||||||
Sr. Unsec’d. Notes, 144A | 7.500 | 07/15/27 | 220 | 232,032 | ||||||||||||
| Novelis Corp., Gtd. Notes, 144A | 4.750 | 01/30/30 | 75 | 79,869 | ||||||||||||
|
| |||||||||||||||
| 2,165,543 | ||||||||||||||||
| Miscellaneous Manufacturer 0.2% | ||||||||||||||||
| Amsted Industries, Inc., | ||||||||||||||||
Gtd. Notes, 144A | 5.625 | 07/01/27 | 25 | 26,197 | ||||||||||||
Sr. Unsec’d. Notes, 144A | 4.625 | 05/15/30 | 160 | 165,567 | ||||||||||||
|
| |||||||||||||||
| 191,764 | ||||||||||||||||
| Office & Business Equipment 0.2% | ||||||||||||||||
| CDW LLC/CDW Finance Corp., Gtd. Notes | 3.250 | 02/15/29 | 175 | 179,826 | ||||||||||||
| Oil & Gas 7.0% | ||||||||||||||||
Aethon United BR LP/Aethon United Finance Corp., | 8.250 | 02/15/26 | 75 | 81,280 | ||||||||||||
Alta Mesa Holdings LP/Alta Mesa Finance Services Corp., Sr. Unsec’d. Notes(d) | 7.875 | 12/15/24 | 310 | 387 | ||||||||||||
Antero Resources Corp., | ||||||||||||||||
Gtd. Notes | 5.000 | 03/01/25 | 50 | 51,045 | ||||||||||||
Gtd. Notes, 144A | 5.375 | 03/01/30 | 125 | 127,690 | ||||||||||||
Gtd. Notes, 144A | 7.625 | 02/01/29 | 125 | 137,521 | ||||||||||||
Gtd. Notes, 144A | 8.375 | 07/15/26 | 281 | 318,504 | ||||||||||||
Apache Corp., | ||||||||||||||||
Sr. Unsec’d. Notes | 5.100 | 09/01/40 | 25 | 27,792 | ||||||||||||
Sr. Unsec’d. Notes | 5.350 | 07/01/49 | 50 | 55,771 | ||||||||||||
See Notes to Financial Statements.
| 68 |
| Description | Interest Rate | Maturity Date | Principal Amount (000)# | Value | ||||||||||||
| CORPORATE BONDS (Continued) | ||||||||||||||||
| Oil & Gas (cont'd.) | ||||||||||||||||
Ascent Resources Utica Holdings LLC/ARU Finance Corp., | ||||||||||||||||
Gtd. Notes, 144A | 7.000 | % | 11/01/26 | 325 | $ | 331,033 | ||||||||||
Gtd. Notes, 144A | 9.000 | 11/01/27 | 62 | 82,483 | ||||||||||||
Chesapeake Energy Corp., | ||||||||||||||||
Gtd. Notes, 144A | 5.500 | 02/01/26 | 25 | 26,138 | ||||||||||||
Gtd. Notes, 144A | 5.875 | 02/01/29 | 25 | 26,661 | ||||||||||||
Citgo Holding, Inc., Sr. Sec’d. Notes, 144A | 9.250 | 08/01/24 | 125 | 125,148 | ||||||||||||
CITGO Petroleum Corp., Sr. Sec’d. Notes, 144A | 7.000 | 06/15/25 | 100 | 102,394 | ||||||||||||
CNX Resources Corp., Gtd. Notes, 144A | 7.250 | 03/14/27 | 250 | 265,000 | ||||||||||||
Comstock Resources, Inc., | ||||||||||||||||
Gtd. Notes, 144A | 5.875 | 01/15/30 | 50 | 50,067 | ||||||||||||
Gtd. Notes, 144A | 6.750 | 03/01/29 | 125 | 131,171 | ||||||||||||
CrownRock LP/CrownRock Finance, Inc., | ||||||||||||||||
Sr. Unsec’d. Notes, 144A | 5.000 | 05/01/29 | 25 | 25,661 | ||||||||||||
Sr. Unsec’d. Notes, 144A | 5.625 | 10/15/25 | 25 | 25,762 | ||||||||||||
Endeavor Energy Resources LP/EER Finance, Inc., | ||||||||||||||||
Sr. Unsec’d. Notes, 144A | 5.500 | 01/30/26 | 50 | 51,723 | ||||||||||||
Sr. Unsec’d. Notes, 144A | 5.750 | 01/30/28 | 225 | 236,792 | ||||||||||||
Sr. Unsec’d. Notes, 144A | 6.625 | 07/15/25 | 35 | 37,116 | ||||||||||||
EQT Corp., | ||||||||||||||||
Sr. Unsec’d. Notes | 3.900 | 10/01/27 | 75 | 81,045 | ||||||||||||
Sr. Unsec’d. Notes | 7.500 | 02/01/30 | 250 | 325,027 | ||||||||||||
Hilcorp Energy I LP/Hilcorp Finance Co., | ||||||||||||||||
Sr. Unsec’d. Notes, 144A | 5.750 | 10/01/25 | 250 | 252,882 | ||||||||||||
Sr. Unsec’d. Notes, 144A | 5.750 | 02/01/29 | 25 | 25,372 | ||||||||||||
Sr. Unsec’d. Notes, 144A | 6.000 | 02/01/31 | 125 | 128,366 | ||||||||||||
Sr. Unsec’d. Notes, 144A | 6.250 | 11/01/28 | 25 | 25,828 | ||||||||||||
MEG Energy Corp. (Canada), | ||||||||||||||||
Gtd. Notes, 144A | 5.875 | 02/01/29 | 50 | 51,478 | ||||||||||||
Gtd. Notes, 144A | 7.125 | 02/01/27 | 300 | 315,568 | ||||||||||||
Sec’d. Notes, 144A | 6.500 | 01/15/25 | 21 | 21,687 | ||||||||||||
Nabors Industries Ltd. (Bermuda), | ||||||||||||||||
Gtd. Notes, 144A | 7.250 | 01/15/26 | 125 | 116,491 | ||||||||||||
Gtd. Notes, 144A | 7.500 | 01/15/28 | 100 | 90,971 | ||||||||||||
Nabors Industries, Inc., Gtd. Notes | 5.750 | 02/01/25 | 150 | 127,477 | ||||||||||||
| Occidental Petroleum Corp., | ||||||||||||||||
Sr. Unsec’d. Notes | 3.500 | 08/15/29 | 75 | 77,763 | ||||||||||||
Sr. Unsec’d. Notes | 4.100 | 02/15/47 | 25 | 24,557 | ||||||||||||
Sr. Unsec’d. Notes | 4.625 | 06/15/45 | 25 | 25,849 | ||||||||||||
Sr. Unsec’d. Notes | 6.125 | 01/01/31 | 250 | 302,252 | ||||||||||||
Sr. Unsec’d. Notes | 6.450 | 09/15/36 | 200 | 250,956 | ||||||||||||
See Notes to Financial Statements.
PGIM Fixed Income ETFs | 69 |
PGIM Active High Yield Bond ETF
Schedule of Investments (continued)
as of August 31, 2021
| Description | Interest Rate | Maturity Date | Principal Amount (000)# | Value | ||||||||||||
| CORPORATE BONDS (Continued) | ||||||||||||||||
| Oil & Gas (cont'd.) | ||||||||||||||||
| Occidental Petroleum Corp., (cont'd.) | ||||||||||||||||
Sr. Unsec’d. Notes | 6.625 | % | 09/01/30 | 50 | $ | 62,342 | ||||||||||
Sr. Unsec’d. Notes | 7.150 | 05/15/28 | 50 | 58,359 | ||||||||||||
Sr. Unsec’d. Notes | 8.500 | 07/15/27 | 120 | 151,318 | ||||||||||||
Sr. Unsec’d. Notes | 8.875 | 07/15/30 | 136 | 186,583 | ||||||||||||
Parkland Corp. (Canada), Gtd. Notes, 144A | 4.500 | 10/01/29 | 75 | 76,913 | ||||||||||||
| Precision Drilling Corp. (Canada), | ||||||||||||||||
Gtd. Notes, 144A | 6.875 | 01/15/29 | 25 | 25,133 | ||||||||||||
Gtd. Notes, 144A | 7.125 | 01/15/26 | 75 | 76,659 | ||||||||||||
| Range Resources Corp., | ||||||||||||||||
Gtd. Notes | 4.875 | 05/15/25 | 50 | 52,120 | ||||||||||||
Gtd. Notes | 9.250 | 02/01/26 | 150 | 164,156 | ||||||||||||
Southwestern Energy Co., Gtd. Notes | 5.375 | 03/15/30 | 250 | 260,042 | ||||||||||||
| Sunoco LP/Sunoco Finance Corp., | ||||||||||||||||
Gtd. Notes | 4.500 | 05/15/29 | 150 | 152,336 | ||||||||||||
Gtd. Notes | 5.875 | 03/15/28 | 100 | 105,548 | ||||||||||||
| Transocean, Inc. (Cayman Islands), | ||||||||||||||||
Gtd. Notes, 144A | 7.250 | 11/01/25 | 85 | 67,473 | ||||||||||||
Gtd. Notes, 144A | 8.000 | 02/01/27 | 25 | 18,618 | ||||||||||||
Vine Energy Holdings LLC, Gtd. Notes, 144A | 6.750 | 04/15/29 | 75 | 81,076 | ||||||||||||
|
| |||||||||||||||
| 6,099,384 | ||||||||||||||||
| Packaging & Containers 0.7% | ||||||||||||||||
ARD Finance SA (Luxembourg), Sr. Sec’d. Notes, Cash coupon 6.500% or PIK 7.250%, 144A | 6.500 | 06/30/27 | 200 | 210,574 | ||||||||||||
Graham Packaging Co., Inc., Gtd. Notes, 144A | 7.125 | 08/15/28 | 10 | 10,648 | ||||||||||||
Intelligent Packaging Holdco Issuer LP (Canada), | 9.000 | 01/15/26 | 75 | 77,927 | ||||||||||||
Intelligent Packaging Ltd. Finco, Inc./Intelligent Packaging Ltd. Co.-Issuer LLC (Canada), Sr. Sec’d. Notes, 144A | 6.000 | 09/15/28 | 150 | 156,738 | ||||||||||||
| Owens-Brockway Glass Container, Inc., | ||||||||||||||||
Gtd. Notes, 144A | 6.375 | 08/15/25 | 50 | 55,785 | ||||||||||||
Gtd. Notes, 144A | 6.625 | 05/13/27 | 75 | 80,770 | ||||||||||||
|
| |||||||||||||||
| 592,442 | ||||||||||||||||
| Pharmaceuticals 3.2% | ||||||||||||||||
AdaptHealth LLC, | ||||||||||||||||
Gtd. Notes, 144A | 4.625 | 08/01/29 | 125 | 125,310 | ||||||||||||
Gtd. Notes, 144A | 5.125 | 03/01/30 | 50 | 50,628 | ||||||||||||
Gtd. Notes, 144A | 6.125 | 08/01/28 | 120 | 128,383 | ||||||||||||
See Notes to Financial Statements.
| 70 |
| Description | Interest Rate | Maturity Date | Principal Amount (000)# | Value | ||||||||||||
| CORPORATE BONDS (Continued) | ||||||||||||||||
| Pharmaceuticals (cont'd.) | ||||||||||||||||
Bausch Health Americas, Inc., Gtd. Notes, 144A | 9.250 | % | 04/01/26 | 400 | $ | 430,838 | ||||||||||
Bausch Health Cos., Inc. (Canada), | ||||||||||||||||
Gtd. Notes, 144A | 5.000 | 02/15/29 | 25 | 23,351 | ||||||||||||
Gtd. Notes, 144A | 5.250 | 01/30/30 | 675 | 633,995 | ||||||||||||
Gtd. Notes, 144A | 5.250 | 02/15/31 | 150 | 139,941 | ||||||||||||
Gtd. Notes, 144A | 6.250 | 02/15/29 | 490 | 486,377 | ||||||||||||
Gtd. Notes, 144A | 7.250 | 05/30/29 | 100 | 102,971 | ||||||||||||
Sr. Sec’d. Notes, 144A | 4.875 | 06/01/28 | 175 | 179,529 | ||||||||||||
Endo Luxembourg Finance Co. I Sarl/Endo US, Inc. (Luxembourg), Sr. Sec’d. Notes, 144A | 6.125 | 04/01/29 | 50 | 49,498 | ||||||||||||
Organon & Co./Organon Foreign Debt Co.-Issuer BV, | 5.125 | 04/30/31 | 200 | 209,772 | ||||||||||||
P&L Development LLC/PLD Finance Corp., Sr. Sec’d. Notes, 144A | 7.750 | 11/15/25 | 150 | 156,928 | ||||||||||||
Prestige Brands, Inc., Gtd. Notes, 144A | 3.750 | 04/01/31 | 25 | 24,683 | ||||||||||||
|
| |||||||||||||||
| 2,742,204 | ||||||||||||||||
| Pipelines 3.3% | ||||||||||||||||
Antero Midstream Partners LP/Antero Midstream Finance Corp., | ||||||||||||||||
Gtd. Notes, 144A | 5.375 | 06/15/29 | 175 | 179,220 | ||||||||||||
Gtd. Notes, 144A | 5.750 | 03/01/27 | 125 | 129,138 | ||||||||||||
Gtd. Notes, 144A | 5.750 | 01/15/28 | 125 | 129,906 | ||||||||||||
Cheniere Energy Partners LP, | ||||||||||||||||
Gtd. Notes | 4.500 | 10/01/29 | 100 | 107,762 | ||||||||||||
Gtd. Notes, 144A | 4.000 | 03/01/31 | 100 | 105,378 | ||||||||||||
Cheniere Energy, Inc., Sr. Sec’d. Notes | 4.625 | 10/15/28 | 375 | 395,928 | ||||||||||||
DCP Midstream Operating LP, Gtd. Notes | 5.625 | 07/15/27 | 20 | 22,698 | ||||||||||||
Energy Transfer LP, Jr. Sub. Notes, 5 Year CMT | 7.125 | (c) | 5/15/2030 | 50 | 51,418 | |||||||||||
EQM Midstream Partners LP, | ||||||||||||||||
Sr. Unsec’d. Notes | 5.500 | 07/15/28 | 25 | 27,288 | ||||||||||||
Sr. Unsec’d. Notes, 144A | 6.000 | 07/01/25 | 120 | 130,322 | ||||||||||||
Sr. Unsec’d. Notes, 144A | 6.500 | 07/01/27 | 70 | 78,067 | ||||||||||||
Global Partners LP/GLP Finance Corp., Gtd. Notes | 6.875 | 01/15/29 | 75 | 77,792 | ||||||||||||
Rockies Express Pipeline LLC, Sr. Unsec’d. Notes, 144A | 7.500 | 07/15/38 | 175 | 196,018 | ||||||||||||
| Tallgrass Energy Partners LP/Tallgrass Energy Finance Corp., | ||||||||||||||||
Gtd. Notes, 144A | 5.500 | 01/15/28 | 75 | 75,834 | ||||||||||||
Gtd. Notes, 144A | 6.000 | 03/01/27 | 134 | 138,582 | ||||||||||||
See Notes to Financial Statements.
PGIM Fixed Income ETFs | 71 |
PGIM Active High Yield Bond ETF
Schedule of Investments (continued)
as of August 31, 2021
| Description | Interest Rate | Maturity Date | Principal Amount (000)# | Value | ||||||||||||
| CORPORATE BONDS (Continued) | ||||||||||||||||
| Pipelines (cont'd.) | ||||||||||||||||
| Tallgrass Energy Partners LP/Tallgrass Energy Finance Corp., (cont'd.) | ||||||||||||||||
Gtd. Notes, 144A | 6.000 | % | 12/31/30 | 75 | $ | 76,321 | ||||||||||
Gtd. Notes, 144A | 7.500 | 10/01/25 | 100 | 107,703 | ||||||||||||
| Targa Resources Partners LP/Targa Resources Partners Finance Corp., | ||||||||||||||||
Gtd. Notes | 4.875 | 02/01/31 | 125 | 135,908 | ||||||||||||
Gtd. Notes | 5.375 | 02/01/27 | 25 | 25,913 | ||||||||||||
Gtd. Notes | 5.875 | 04/15/26 | 100 | 104,652 | ||||||||||||
Gtd. Notes | 6.500 | 07/15/27 | 200 | 216,186 | ||||||||||||
| Venture Global Calcasieu Pass LLC, | ||||||||||||||||
Sr. Sec’d. Notes, 144A | 3.875 | 08/15/29 | 40 | 41,319 | ||||||||||||
Sr. Sec’d. Notes, 144A | 4.125 | 08/15/31 | 40 | 41,946 | ||||||||||||
| Western Midstream Operating LP, | ||||||||||||||||
Sr. Unsec’d. Notes | 3.950 | 06/01/25 | 100 | 105,070 | ||||||||||||
Sr. Unsec’d. Notes | 4.000 | 07/01/22 | 100 | 101,271 | ||||||||||||
Sr. Unsec’d. Notes | 5.300 | 02/01/30 | 25 | 28,006 | ||||||||||||
|
| |||||||||||||||
| 2,829,646 | ||||||||||||||||
| Real Estate 1.3% | ||||||||||||||||
Five Point Operating Co. LP/Five Point Capital Corp., Gtd. Notes, 144A | 7.875 | 11/15/25 | 252 | 262,997 | ||||||||||||
Greystar Real Estate Partners LLC, Sr. Sec’d. Notes, 144A | 5.750 | 12/01/25 | 225 | 229,952 | ||||||||||||
| Howard Hughes Corp. (The), | ||||||||||||||||
Gtd. Notes, 144A | 4.125 | 02/01/29 | 100 | 101,061 | ||||||||||||
Gtd. Notes, 144A | 4.375 | 02/01/31 | 50 | 50,421 | ||||||||||||
Gtd. Notes, 144A | 5.375 | 08/01/28 | 180 | 191,285 | ||||||||||||
Hunt Cos., Inc., Sr. Sec’d. Notes, 144A | 5.250 | 04/15/29 | 275 | 269,581 | ||||||||||||
|
| |||||||||||||||
| 1,105,297 | ||||||||||||||||
| Real Estate Investment Trusts (REITs) 2.5% | ||||||||||||||||
Diversified Healthcare Trust, | ||||||||||||||||
Gtd. Notes | 4.375 | 03/01/31 | 200 | 196,251 | ||||||||||||
Gtd. Notes | 9.750 | 06/15/25 | 325 | 358,611 | ||||||||||||
Sr. Unsec’d. Notes | 4.750 | 02/15/28 | 100 | 101,662 | ||||||||||||
MPT Operating Partnership LP/MPT Finance Corp., | 4.625 | 08/01/29 | 200 | 214,019 | ||||||||||||
Park Intermediate Holdings LLC/PK Domestic Property LLC/PK Finance Co.-Issuer, | ||||||||||||||||
Sr. Sec’d. Notes, 144A | 5.875 | 10/01/28 | 225 | 239,753 | ||||||||||||
Sr. Sec’d. Notes, 144A | 7.500 | 06/01/25 | 130 | 139,221 | ||||||||||||
See Notes to Financial Statements.
| 72 |
| Description | Interest Rate | Maturity Date | Principal Amount (000)# | Value | ||||||||||||
| CORPORATE BONDS (Continued) | ||||||||||||||||
| Real Estate Investment Trusts (REITs) (cont'd.) | ||||||||||||||||
RHP Hotel Properties LP/RHP Finance Corp., Gtd. | 4.500 | % | 02/15/29 | 25 | $ | 25,392 | ||||||||||
Uniti Group LP/Uniti Fiber Holdings, Inc./CSL Capital LLC, Sr. Sec’d. Notes, 144A | 7.875 | 02/15/25 | 425 | 452,632 | ||||||||||||
Uniti Group LP/Uniti Group Finance, Inc./CSL Capital LLC, Sr. Sec’d. Notes, 144A | 4.750 | 04/15/28 | 50 | 51,064 | ||||||||||||
VICI Properties LP/VICI Note Co., Inc., | ||||||||||||||||
Gtd. Notes, 144A | 3.750 | 02/15/27 | 100 | 104,064 | ||||||||||||
Gtd. Notes, 144A | 4.125 | 08/15/30 | 200 | 213,526 | ||||||||||||
Gtd. Notes, 144A | 4.625 | 12/01/29 | 40 | 43,467 | ||||||||||||
|
| |||||||||||||||
| 2,139,662 | ||||||||||||||||
| Retail 3.2% | ||||||||||||||||
1011778 BC ULC/New Red Finance, Inc. (Canada), | ||||||||||||||||
Sec’d. Notes, 144A | 4.000 | 10/15/30 | 475 | 472,519 | ||||||||||||
Sr. Sec’d. Notes, 144A | 3.875 | 01/15/28 | 175 | 177,106 | ||||||||||||
Ambience Merger Sub, Inc., | ||||||||||||||||
Gtd. Notes, 144A | 7.125 | 07/15/29 | 25 | 25,064 | ||||||||||||
Sr. Sec’d. Notes, 144A | 4.875 | 07/15/28 | 50 | 50,267 | ||||||||||||
Brinker International, Inc., Sr. Unsec’d. Notes(a) | 3.875 | 05/15/23 | 150 | 154,547 | ||||||||||||
Caleres, Inc., Gtd. Notes | 6.250 | 08/15/23 | 37 | 37,119 | ||||||||||||
Carrols Restaurant Group, Inc., Gtd. Notes, 144A | 5.875 | 07/01/29 | 75 | 72,475 | ||||||||||||
eG Global Finance PLC (United Kingdom), Sr. Sec’d. | 8.500 | 10/30/25 | 200 | 209,767 | ||||||||||||
Ferrellgas Escrow LLC^ | 8.956 | 03/30/31 | 350 | 350,000 | ||||||||||||
Foundation Building Materials, Inc., Gtd. Notes, 144A | 6.000 | 03/01/29 | 100 | 98,423 | ||||||||||||
Golden Nugget, Inc., Sr. Unsec’d. Notes, 144A | 6.750 | 10/15/24 | 125 | 125,320 | ||||||||||||
LBM Acquisition LLC, Gtd. Notes, 144A | 6.250 | 01/15/29 | 130 | 130,744 | ||||||||||||
LCM Investments Holdings II LLC, Sr. Unsec’d. Notes, 144A | 4.875 | 05/01/29 | 50 | 51,400 | ||||||||||||
Park River Holdings, Inc., Gtd. Notes, 144A | 5.625 | 02/01/29 | 225 | 213,737 | ||||||||||||
Sally Holdings LLC/Sally Capital, Inc., Sec’d. Notes, 144A | 8.750 | 04/30/25 | 300 | 326,254 | ||||||||||||
Suburban Propane Partners LP/Suburban Energy Finance Corp., Sr. Unsec’d. Notes | 5.875 | 03/01/27 | 125 | 130,676 | ||||||||||||
Superior Plus LP/Superior General Partner, Inc. (Canada), Gtd. Notes, 144A | 4.500 | 03/15/29 | 75 | 77,745 | ||||||||||||
White Capital Buyer LLC, Sr. Unsec’d. Notes, 144A | 6.875 | 10/15/28 | 50 | 53,200 | ||||||||||||
|
| |||||||||||||||
| 2,756,363 | ||||||||||||||||
See Notes to Financial Statements.
PGIM Fixed Income ETFs | 73 |
PGIM Active High Yield Bond ETF
Schedule of Investments (continued)
as of August 31, 2021
| Description | Interest Rate | Maturity Date | Principal Amount (000)# | Value | ||||||||||||
| CORPORATE BONDS (Continued) | ||||||||||||||||
| Software 1.0% | ||||||||||||||||
Black Knight InfoServ LLC, Gtd. Notes, 144A | 3.625 | % | 09/01/28 | 200 | $ | 202,466 | ||||||||||
Boxer Parent Co., Inc., Sr. Sec’d. Notes, 144A | 7.125 | 10/02/25 | 150 | 160,528 | ||||||||||||
BY Crown Parent LLC/BY Bond Finance, Inc., Sr. Sec’d. Notes, 144A | 4.250 | 01/31/26 | 145 | 152,888 | ||||||||||||
Clarivate Science Holdings Corp., Sr. Unsec’d. Notes, 144A | 4.875 | 07/01/29 | 50 | 51,553 | ||||||||||||
Dun & Bradstreet Corp. (The), Sr. Sec’d. Notes, 144A | 6.875 | 08/15/26 | 275 | 289,535 | ||||||||||||
Rackspace Technology Global, Inc., Sr. Sec’d. Notes, 144A | 3.500 | 02/15/28 | 50 | 48,049 | ||||||||||||
|
| |||||||||||||||
| 905,019 | ||||||||||||||||
| Telecommunications 5.1% | ||||||||||||||||
Altice France SA (France), | ||||||||||||||||
Sr. Sec’d. Notes, 144A | 7.375 | 05/01/26 | 200 | 207,960 | ||||||||||||
Sr. Sec’d. Notes, 144A | 8.125 | 02/01/27 | 200 | 217,015 | ||||||||||||
CommScope, Inc., Sr. Sec’d. Notes, 144A | 6.000 | 03/01/26 | 250 | 262,055 | ||||||||||||
Digicel Group Holdings Ltd. (Bermuda), Sr. Sec’d. Notes, Cash coupon 8.000% and PIK 2.000% | 10.000 | 04/01/24 | 314 | 311,520 | ||||||||||||
Digicel International Finance Ltd./Digicel international Holdings Ltd. (Multinational), | ||||||||||||||||
Gtd. Notes, Cash coupon 6.000% and PIK 7.000%, 144A | 13.000 | 12/31/25 | 373 | 371,314 | ||||||||||||
Sr. Sec’d. Notes, 144A | 8.750 | 05/25/24 | 250 | 259,838 | ||||||||||||
Digicel Ltd. (Bermuda), Gtd. Notes, 144A | 6.750 | 03/01/23 | 600 | 568,853 | ||||||||||||
Intelsat Jackson Holdings SA (Luxembourg)(d), | ||||||||||||||||
Gtd. Notes | 5.500 | 08/01/23 | 65 | 34,638 | ||||||||||||
Gtd. Notes, 144A | 8.500 | 10/15/24 | 25 | 13,493 | ||||||||||||
Gtd. Notes, 144A | 9.750 | 07/15/25 | 295 | 159,544 | ||||||||||||
Sr. Sec’d. Notes, 144A | 8.000 | 02/15/24 | 50 | 51,824 | ||||||||||||
Intrado Corp., Gtd. Notes, 144A | 8.500 | 10/15/25 | 330 | 317,643 | ||||||||||||
Lumen Technologies, Inc., | ||||||||||||||||
Sr. Unsec’d. Notes | 7.600 | 09/15/39 | 77 | 85,828 | ||||||||||||
Sr. Unsec’d. Notes | 7.650 | 03/15/42 | 190 | 211,791 | ||||||||||||
Sprint Corp., | ||||||||||||||||
Gtd. Notes | 7.625 | 02/15/25 | 200 | 236,782 | ||||||||||||
Gtd. Notes | 7.625 | 03/01/26 | 250 | 308,284 | ||||||||||||
Gtd. Notes | 7.875 | 09/15/23 | 250 | 283,093 | ||||||||||||
Switch Ltd., Gtd. Notes, 144A | 4.125 | 06/15/29 | 25 | 25,826 | ||||||||||||
Viasat, Inc., | ||||||||||||||||
Sr. Sec’d. Notes, 144A | 5.625 | 04/15/27 | 80 | 83,067 | ||||||||||||
Sr. Unsec’d. Notes, 144A | 5.625 | 09/15/25 | 100 | 101,669 | ||||||||||||
Sr. Unsec’d. Notes, 144A | 6.500 | 07/15/28 | 20 | 21,135 | ||||||||||||
Windstream Escrow LLC/Windstream Escrow Finance Corp., Sr. Sec’d. Notes, 144A | 7.750 | 08/15/28 | 40 | 41,324 | ||||||||||||
See Notes to Financial Statements.
| 74 |
| Description | Interest Rate | Maturity Date | Principal Amount (000)# | Value | ||||||||||||
| CORPORATE BONDS (Continued) | ||||||||||||||||
| Telecommunications (cont'd.) | ||||||||||||||||
Zayo Group Holdings, Inc., | ||||||||||||||||
Sr. Sec’d. Notes, 144A | 4.000% | 03/01/27 | 75 | $ | 74,212 | |||||||||||
Sr. Unsec’d. Notes, 144A | 6.125 | 03/01/28 | 175 | 178,101 | ||||||||||||
|
| |||||||||||||||
| 4,426,809 | ||||||||||||||||
| Toys/Games/Hobbies 0.1% | ||||||||||||||||
Mattel, Inc., Gtd. Notes, 144A | 3.750 | 04/01/29 | 75 | 78,813 | ||||||||||||
| Transportation 0.5% | ||||||||||||||||
XPO Logistics, Inc., Gtd. Notes, 144A | 6.250 | 05/01/25 | 400 | 422,602 | ||||||||||||
| Trucking & Leasing 0.0% | ||||||||||||||||
Fortress Transportation & Infrastructure Investors LLC, Sr. Unsec’d. Notes, 144A | 5.500 | 05/01/28 | 25 | 25,445 | ||||||||||||
|
| |||||||||||||||
TOTAL CORPORATE BONDS |
| 78,852,254 | ||||||||||||||
|
| |||||||||||||||
Shares | ||||||||||||||||
| COMMON STOCKS 1.2% | ||||||||||||||||
| Oil, Gas & Consumable Fuels 1.0% | ||||||||||||||||
Chesapeake Energy Corp. | 11,790 | 658,000 | ||||||||||||||
Chesapeake Energy Corp. Backstop Commitment*^ | 68 | 3,795 | ||||||||||||||
Extraction Oil & Gas, Inc.(a)* | 4,903 | 223,234 | ||||||||||||||
|
| |||||||||||||||
| 885,029 | ||||||||||||||||
| Specialty Retail 0.2% | ||||||||||||||||
Ferrellgas Partners LP (Class B Stock)* | 728 | 179,452 | ||||||||||||||
|
| |||||||||||||||
TOTAL COMMON STOCKS | 1,064,481 | |||||||||||||||
|
| |||||||||||||||
Units | ||||||||||||||||
| WARRANT 0.0% | ||||||||||||||||
| Consumer Discretionary 0.0% | ||||||||||||||||
CEC Brands LLC expiring 12/31/25* | 2,061 | 6,904 | ||||||||||||||
|
| |||||||||||||||
TOTAL LONG-TERM INVESTMENTS | 82,545,476 | |||||||||||||||
|
| |||||||||||||||
See Notes to Financial Statements.
PGIM Fixed Income ETFs | 75 |
PGIM Active High Yield Bond ETF
Schedule of Investments (continued)
as of August 31, 2021
| Description | Units | Value | ||||||||||||
| SHORT-TERM INVESTMENTS 4.4% | ||||||||||||||
| AFFILIATED MUTUAL FUNDS 4.2% | ||||||||||||||
PGIM Core Ultra Short Bond Fund (wa) | 3,188,704 | $ | 3,188,704 | |||||||||||
PGIM Institutional Money Market Fund (cost $408,020; includes $407,995 of cash collateral for securities on loan)(b)(wa) | 408,265 | 408,020 | ||||||||||||
|
| |||||||||||||
TOTAL AFFILIATED MUTUAL FUNDS | 3,596,724 | |||||||||||||
|
| |||||||||||||
Interest | Maturity | Principal | ||||||||||||
| TIME DEPOSIT 0.2% | ||||||||||||||
Skandinaviska Enskilda Banken AB (Sweden) | 0.005% | 09/01/21 | 207 | 207,456 | ||||||||||
|
| |||||||||||||
TOTAL SHORT-TERM INVESTMENTS | 3,804,180 | |||||||||||||
|
| |||||||||||||
| TOTAL INVESTMENTS 99.3% (cost $84,430,449) | 86,349,656 | |||||||||||||
Other assets in excess of liabilities 0.7% | 626,201 | |||||||||||||
|
| |||||||||||||
| NET ASSETS 100.0% | $86,975,857 | |||||||||||||
|
| |||||||||||||
The following abbreviations are used in the annual report:
144A—Security was purchased pursuant to Rule 144A under the Securities Act of 1933 and may not be resold subject to that rule except to qualified institutional buyers.
LIBOR—London Interbank Offered Rate
PIK—Payment-in-Kind
| # | Principal or notional amount is shown in U.S. dollars unless otherwise stated. |
| ^ | Indicates a Level 3 instrument. The aggregate value of Level 3 instruments is $353,795 and 0.4% of net assets. |
| (a) | All or a portion of security is on loan. The aggregate market value of such securities, including those sold and pending settlement, is $397,899; cash collateral of $407,995 (included in liabilities) was received with which the Fund purchased highly liquid short-term investments. In the event of significant appreciation in value of securities on loan on the last business day of the reporting period, the Fund may reflect a collateral value that is less than the market value of the loaned securities and such shortfall is remedied the following business day. |
| (b) | Represents security purchased with cash collateral received for securities on loan and includes dividend reinvestment. |
| (c) | Variable rate instrument. The interest rate shown reflects the rate in effect at August 31, 2021. |
| (d) | Represents issuer in default on interest payments and/or principal repayment. Non-income producing security. Such security may be post-maturity. |
| (rr) | Perpetual security. Maturity date represents next call date. |
See Notes to Financial Statements.
| 76 |
| (wa) | PGIM Investments LLC, the manager of the Fund, also serves as manager of the PGIM Core Ultra Short Bond Fund and PGIM Institutional Money Market Fund, if applicable. |
| * | Non-income producing security. |
Futures contracts outstanding at August 31, 2021:
| Number of contracts | Type | Expiration Date | Current Notional Amount | Value / Unrealized Appreciation (Depreciation) | ||||||||||||
| Long Positions: | ||||||||||||||||
| 12 | 2 Year U.S. Treasury Notes | Dec. 2021 | $ | 2,643,938 | $ | 1,555 | ||||||||||
| 28 | 10 Year U.S. Treasury Notes | Dec. 2021 | 3,736,688 | 5,218 | ||||||||||||
| 42 | 5 Year U.S. Treasury Notes | Dec. 2021 | 5,196,188 | 8,128 | ||||||||||||
|
| |||||||||||||||
| 14,901 | ||||||||||||||||
|
| |||||||||||||||
| Short Positions: | ||||||||||||||||
| 8 | U.S. Long Bond | Dec. 2021 | 1,303,750 | 3,078 | ||||||||||||
| 6 | U.S. Ultra Bond | Dec. 2021 | 1,183,688 | 4,547 | ||||||||||||
|
| |||||||||||||||
| 7,625 | ||||||||||||||||
|
| |||||||||||||||
| $ | 22,526 | |||||||||||||||
|
| |||||||||||||||
Summary of Collateral for Centrally Cleared/Exchange-traded Derivatives:
Cash and securities segregated as collateral to cover requirements for open centrally cleared/ exchange-traded derivatives are listed by broker as follows:
Broker | Cash and/or Foreign Currency | Securities Market Value | ||||||
| Citigroup Global Markets, Inc. | $ | 150,000 | $ | — | ||||
Fair Value Measurements:
Various inputs are used in determining the value of the Fund’s investments. These inputs are summarized in the three broad levels listed below.
Level 1—unadjusted quoted prices generally in active markets for identical securities.
Level 2—quoted prices for similar securities, interest rates and yield curves, prepayment speeds, foreign currency exchange rates and other observable inputs.
Level 3—unobservable inputs for securities valued in accordance with Board approved fair valuation procedures.
See Notes to Financial Statements.
PGIM Fixed Income ETFs | 77 |
PGIM Active High Yield Bond ETF
Schedule of Investments (continued)
as of August 31, 2021
The following is a summary of the inputs used as of August 31, 2021 in valuing such portfolio securities:
| Level 1 | Level 2 | Level 3 | ||||||||||
| Investments in Securities | ||||||||||||
| Assets | ||||||||||||
| Long-Term Investments | ||||||||||||
Bank Loans | $ | — | $ | 2,621,837 | $ | — | ||||||
Corporate Bonds | — | 78,502,254 | 350,000 | |||||||||
Common Stocks | ||||||||||||
Oil, Gas & Consumable Fuels | 881,234 | — | 3,795 | |||||||||
Specialty Retail | 179,452 | — | — | |||||||||
Warrant | — | 6,904 | — | |||||||||
Short-Term Investments | ||||||||||||
Affiliated Mutual Funds | 3,596,724 | — | — | |||||||||
Time Deposit | — | 207,456 | — | |||||||||
|
|
|
|
|
| |||||||
Total | $ | 4,657,410 | $ | 81,338,451 | $ | 353,795 | ||||||
|
|
|
|
|
| |||||||
| Other Financial Instruments* | ||||||||||||
| Assets | ||||||||||||
Futures Contracts | $ | 22,526 | $ | — | $ | — | ||||||
|
|
|
|
|
| |||||||
Total | $ | 22,526 | $ | — | $ | — | ||||||
|
|
|
|
|
| |||||||
| * | Other financial instruments are derivative instruments not reflected in the Schedule of Investments, such as futures, forwards and centrally cleared swap contracts, which are recorded at the unrealized appreciation (depreciation) on the instrument, and OTC swap contracts which are recorded at fair value. |
Industry Classification:
The industry classification of investments and other assets in excess of liabilities shown as a percentage of net assets as of August 31, 2021 were follows (unaudited):
Media | 8.1 | % | ||
Oil & Gas | 7.3 | |||
Telecommunications | 5.3 | |||
Commercial Services | 4.8 | |||
Entertainment | 4.7 | |||
Electric | 4.4 | |||
Home Builders | 4.3 | |||
Healthcare-Services | 4.2 | |||
Affiliated Mutual Fund (0.5% represents investments purchased with collateral from securities on loan) | 4.2 | |||
Aerospace & Defense | 3.4 | |||
Food | 3.3 | |||
Pipelines | 3.3 | |||
Auto Manufacturers | 3.2 | |||
Pharmaceuticals | 3.2 | |||
Retail | 3.2 | |||
Diversified Financial Services | 2.9 | |||
Mining | 2.5 | |||
Real Estate Investment Trusts (REITs) | 2.5 | |||
Lodging | 2.4 | |||
Chemicals | 2.2 | |||
Building Materials | 2.1 | |||
Software | 1.8 | |||
Auto Parts & Equipment | 1.7 | |||
Airlines | 1.4 |
See Notes to Financial Statements.
| 78 |
Industry Classification (cont’d.)
Real Estate | 1.3 | % | ||
Computers | 1.1 | |||
Oil, Gas & Consumable Fuels | 1.0 | |||
Machinery-Diversified | 0.8 | |||
Gas | 0.7 | |||
Packaging & Containers | 0.7 | |||
Advertising | 0.7 | |||
Household Products/Wares | 0.5 | |||
Distribution/Wholesale | 0.5 | |||
Insurance | 0.5 | |||
Transportation | 0.5 | |||
Electrical Components & Equipment | 0.4 | |||
Iron/Steel | 0.3 | |||
Agriculture | 0.3 | |||
Housewares | 0.3 | |||
Apparel | 0.3 | |||
Diversified/Conglomerate Services | 0.3 | |||
Time Deposit | 0.2 | |||
Specialty Chemicals | 0.2 | |||
Miscellaneous Manufacturer | 0.2 | |||
Infrastructure Software | 0.2 | |||
Engineering & Construction | 0.2 | |||
Office & Business Equipment | 0.2 | |||
Banks | 0.2 | |||
Environmental Control | 0.2 | |||
Leisure Time | 0.2 | |||
Specialty Retail | 0.2 | |||
Electric & Gas Marketing | 0.1 | |||
Electronics | 0.1 | |||
Home Furnishings | 0.1 | |||
Internet | 0.1 | |||
Toys/Games/Hobbies | 0.1 | |||
Machinery-Constructions & Mining | 0.1 | |||
Industrial Services | 0.1 | |||
Coal | 0.0 | * | ||
Trucking & Leasing | 0.0 | * | ||
Consumer Discretionary | 0.0 | * | ||
|
| |||
| 99.3 | ||||
Other assets in excess of liabilities | 0.7 | |||
|
| |||
| 100.0 | % | |||
|
|
| * | Less than +/- 0.05%. |
Effects of Derivative Instruments on the Financial Statements and Primary Underlying Risk Exposure:
The Fund invested in derivative instruments during the reporting period. The primary types of risk associated with these derivative instruments are credit contracts risk and interest rate contracts risk. See the Notes to Financial Statements for additional detail regarding these derivative instruments and their risks. The effect of such derivative instruments on the Fund’s financial position and financial performance as reflected in the Statement of Assets and Liabilities and Statement of Operations is presented in the summary below.
Fair values of derivative instruments as of August 31, 2021 as presented in the Statement of Assets and Liabilities:
Derivatives not accounted | Asset Derivatives | Liability Derivatives | ||||||||||||||
| Statement of Assets and Liabilities Location | Fair Value | Statement of Assets and Liabilities Location | Fair Value | |||||||||||||
| Interest rate contracts | | Due from/to broker— variation margin futures* | $ | 22,526 | | Due from/to broker— variation margin futures* | $ | — | ||||||||
|
|
|
| |||||||||||||
| $ | 22,526 | $ | — | |||||||||||||
|
|
|
| |||||||||||||
| * | Includes cumulative appreciation (depreciation) as reported in the schedule of open futures and centrally cleared swap contracts. Only unsettled variation margin receivable (payable) is reported within the Statement of Assets and Liabilities. |
See Notes to Financial Statements.
PGIM Fixed Income ETFs | 79 |
PGIM Active High Yield Bond ETF
Schedule of Investments (continued)
as of August 31, 2021
The effects of derivative instruments on the Statement of Operations for the period ended August 31, 2021 are as follows:
Amount of Realized Gain (Loss) on Derivatives Recognized in Income | ||||||||
Derivatives not accounted for as hedging | Futures | Swaps | ||||||
Credit contracts | $ | — | $ | (274,257 | ) | |||
Interest rate contracts | 24,944 | — | ||||||
|
|
|
| |||||
Change in Unrealized Appreciation (Depreciation) on Derivatives Recognized in Income | ||||||||
Derivatives not accounted for as hedging | Futures | Swaps | ||||||
Credit contracts | $ | — | $ | 258,876 | ||||
Interest rate contracts | 15,945 | — | ||||||
|
|
|
| |||||
For the period ended August 31, 2021 the Fund’s average volume of derivative activities is as follows:
| Futures Contracts—Long Positions(1) | Futures Contracts—Short Positions(1) | Credit Default Swap Agreements(1) | ||||||||
| $6,632,394 | $1,579,781 | $1,360,760 | ||||||||
| (1) | Notional Amount in USD. |
Average volume is based on average quarter end balances as noted for the year ended August 31, 2021.
See Notes to Financial Statements.
| 80 |
Financial Instruments/Transactions—Summary of Offsetting and Netting Arrangements:
The Fund entered into financial instruments/transactions during the period that are either offset in accordance with current requirements or are subject to enforceable master netting arrangements or similar agreements that permit offsetting. The information about offsetting and related netting arrangements for financial instruments/transactions, where the legal right to set-off exists, is presented in the summary below:
Offsetting of financial instrument/transaction assets and liabilities:
Description | Gross Market Value of Recognized Assets/(Liabilities) | Collateral Pledged/(Received)(1) | Net Amount | |||||||||
Securities on Loan | $ | 397,899 | $ | (397,899 | ) | $ | — | |||||
|
|
|
|
|
| |||||||
| (1) | Collateral amount disclosed by the Fund is limited to the market value of the financial instruments/transactions. |
See Notes to Financial Statements.
PGIM Fixed Income ETFs | 81 |
PGIM Active High Yield Bond ETF
Statement of Assets & Liabilities
as of August 31, 2021
Assets | ||||
Investments at value, including securities on loan of $397,899: | ||||
Unaffiliated investments (cost $80,833,725) | $ | 82,752,932 | ||
Affiliated investments (cost $3,596,724) | 3,596,724 | |||
Interest and dividends receivable | 1,167,979 | |||
Deposit with broker for centrally cleared/exchange-traded derivatives | 150,000 | |||
Receivable for investments sold | 139,691 | |||
Due from broker—variation margin futures | 7,797 | |||
|
| |||
Total Assets | 87,815,123 | |||
|
| |||
| Liabilities | ||||
Payable to broker for collateral for securities on loan | 407,995 | |||
Payable for investments purchased | 390,496 | |||
Management fee payable | 38,390 | |||
Other liabilities | 2,385 | |||
|
| |||
Total Liabilities | 839,266 | |||
|
| |||
Net Assets | $ | 86,975,857 | ||
|
| |||
Net assets were comprised of: | ||||
Common stock, at par | $ | 2,100 | ||
Paid-in capital in excess of par | 84,540,437 | |||
Total distributable earnings (loss) | 2,433,320 | |||
|
| |||
Net assets, August 31, 2021 | $ | 86,975,857 | ||
|
| |||
Net asset value, offering price and redemption price per share, | $ | 41.42 | ||
|
| |||
See Notes to Financial Statements.
| 82 |
PGIM Active High Yield Bond ETF
Statement of Operations
Year Ended August 31, 2021
Net Investment Income (Loss) | ||||
Income | ||||
Interest income | $ | 3,070,922 | ||
Unaffiliated dividend income | 8,311 | |||
Affiliated dividend income | 2,712 | |||
Income from securities lending, net (including affiliated income of $1,073) | 1,946 | |||
|
| |||
Total income | 3,083,891 | |||
|
| |||
Expenses | ||||
Management fee | 308,831 | |||
|
| |||
Total expenses | 308,831 | |||
|
| |||
Net investment income (loss) | 2,775,060 | |||
|
| |||
| Realized And Unrealized Gain (Loss) On Investments | ||||
Net realized gain (loss) on: | ||||
Investment transactions (including affiliated of $(346)) | 861,027 | |||
Futures transactions | 24,944 | |||
Swap agreement transactions | (274,257 | ) | ||
|
| |||
| 611,714 | ||||
|
| |||
Net change in unrealized appreciation (depreciation) on: | ||||
Investments | 2,160,341 | |||
Futures | 15,945 | |||
Swap agreements | 258,876 | |||
|
| |||
| 2,435,162 | ||||
|
| |||
Net gain (loss) on investment transactions | 3,046,876 | |||
|
| |||
Net Increase (Decrease) In Net Assets Resulting From Operations | $ | 5,821,936 | ||
|
| |||
See Notes to Financial Statements.
PGIM Fixed Income ETFs | 83 |
PGIM Active High Yield Bond ETF
Statements of Changes in Net Assets
| Year Ended August 31, | ||||||||
| 2021 | 2020 | |||||||
Increase (Decrease) in Net Assets | ||||||||
Operations | ||||||||
Net investment income (loss) | $ | 2,775,060 | $ | 1,869,520 | ||||
Net realized gain (loss) on investments | 611,714 | 729,195 | ||||||
Net change in unrealized appreciation (depreciation) on investments | 2,435,162 | (645,569 | ) | |||||
|
|
|
| |||||
Net increase (decrease) in net assets resulting from operations | 5,821,936 | 1,953,146 | ||||||
|
|
|
| |||||
Dividends and Distributions | ||||||||
Distributions from distributable earnings | (3,660,138 | ) | (2,177,655 | ) | ||||
|
|
|
| |||||
Fund share transactions | ||||||||
Net proceeds from shares sold | 74,395,702 | 7,569,903 | ||||||
Cost of shares purchased | (24,576,005 | ) | — | |||||
|
|
|
| |||||
Net increase (decrease) in net assets from Fund share transactions | 49,819,697 | 7,569,903 | ||||||
|
|
|
| |||||
Total increase (decrease) | 51,981,495 | 7,345,394 | ||||||
| Net Assets: | ||||||||
Beginning of period | 34,994,362 | 27,648,968 | ||||||
|
|
|
| |||||
End of period | $ | 86,975,857 | $ | 34,994,362 | ||||
|
|
|
| |||||
See Notes to Financial Statements.
| 84 |
PGIM Active High Yield Bond ETF
Financial Highlights
| Year Ended August 31, | September 24, 2018(e) through August 31, | |||||||||||
| 2021 | 2020 | 2019 | ||||||||||
| Per Share Operating Performance(a): | ||||||||||||
| Net Asset Value, Beginning of Period | $39.99 | $40.96 | $40.00 | |||||||||
| Income (loss) from investment operations: | ||||||||||||
| Net investment income (loss) | 1.95 | 2.49 | 2.30 | |||||||||
| Net realized and unrealized gain (loss) on investments | 2.30 | (0.49 | ) | 0.85 | ||||||||
| Total from investment operations | 4.25 | 2.00 | 3.15 | |||||||||
| Less Dividends and Distributions: | ||||||||||||
| Dividends from net investment income | (2.24 | ) | (2.55 | ) | (2.19 | ) | ||||||
| Distributions from net realized gains | (0.58 | ) | (0.42 | ) | - | |||||||
| Total Dividends and Distributions | (2.82 | ) | (2.97 | ) | (2.19 | ) | ||||||
| Net asset value, end of period | $41.42 | $39.99 | $40.96 | |||||||||
| Total Return(b): | 11.00% | 5.24% | 8.20% | |||||||||
| Ratios/Supplemental Data: | ||||||||||||
| Net assets, end of period (000) | $86,976 | $34,994 | $27,649 | |||||||||
| Average net assets (000) | $58,270 | $29,367 | $26,467 | |||||||||
| Ratios to average net assets(c): | ||||||||||||
| Expenses after waivers and/or expense reimbursement | 0.53% | 0.53% | 0.52% | (d) | ||||||||
| Expenses before waivers and/or expense reimbursement | 0.53% | 0.53% | 0.53% | (d) | ||||||||
| Net investment income (loss) | 4.76% | 6.37% | 6.15% | (d) | ||||||||
| Portfolio turnover rate(f) | 85% | 57% | 55% | |||||||||
| (a) | Calculated based on average shares outstanding during the period. |
| (b) | Total return is calculated assuming a purchase of a share on the first day and a sale on the last day of the period reported and includes reinvestment of dividends and distributions, if any. Total returns may reflect adjustments to conform to generally accepted accounting principles. Total returns for periods less than one full year are not annualized. |
| (c) | Does not include expenses of the underlying funds in which the Fund invests. |
| (d) | Annualized. |
| (e) | Commencement of operations. |
| (f) | The Fund’s portfolio turnover rate is calculated in accordance with regulatory requirements, without regard to transactions involving short-term investments and certain derivatives. If such transactions were included, the Fund’s portfolio turnover rate may be higher. |
See Notes to Financial Statements.
PGIM Fixed Income ETFs | 85 |
PGIM Active Aggregate Bond ETF
Schedule of Investments
as of August 31, 2021
| Description | Interest Rate | Maturity Date | Principal Amount (000)# | Value | ||||||||||||
| LONG-TERM INVESTMENTS 99.4% | ||||||||||||||||
| ASSET-BACKED SECURITIES 8.2% | ||||||||||||||||
| Collateralized Loan Obligations 8.2% | ||||||||||||||||
AIG CLO, Ltd. (Cayman Islands), Series 2018-1A, Class A1R, 144A, 3 Month LIBOR + 1.120% | 1.254 | %(c) | 04/20/32 | 400 | $ | 399,533 | ||||||||||
Atlas Senior Loan Fund VII Ltd. (Cayman Islands), Series 2016-7A, Class A1R2, 144A, 3 Month | 1.224 | (c) | 11/27/31 | 250 | 249,465 | |||||||||||
Elevation CLO Ltd. (Cayman Islands), Series 2021-13A, Class A1, 144A, 3 Month LIBOR + 1.190% | 1.340 | (c) | 07/15/34 | 250 | 249,847 | |||||||||||
HPS Loan Management 10-2016 Ltd. (Cayman Islands), Series 10A-16, Class A1RR, 144A, 3 Month | 1.274 | (c) | 04/20/34 | 250 | 249,120 | |||||||||||
Madison Park Funding XXXIV Ltd. (Cayman Islands), Series 2019-34A, Class AR, 144A, 3 Month | 1.245 | (c) | 04/25/32 | 400 | 399,691 | |||||||||||
Northwoods Capital XV Ltd. (Cayman Islands), Series 2017-15A, Class A1R, 144A, 3 Month | 1.345 | (c) | 06/20/34 | 250 | 250,141 | |||||||||||
Romark CLO IV Ltd. (Cayman Islands), Series 2021-4A, Class A1, 144A, 3 Month LIBOR + 1.170% | 1.320 | (c) | 07/10/34 | 400 | 399,760 | |||||||||||
|
| |||||||||||||||
TOTAL ASSET-BACKED SECURITIES |
| 2,197,557 | ||||||||||||||
|
| |||||||||||||||
| COMMERCIAL MORTGAGE-BACKED SECURITIES 11.1% | ||||||||||||||||
BANK, Series 2019-BN22, Class A3 | 2.726 | 11/15/62 | 250 | 264,654 | ||||||||||||
Bellemeade Re Ltd. (Bermuda), Series 2021-2A, Class M1A, 144A, SOFR30A + 1.200% | 1.250 | (c) | 06/25/31 | 150 | 150,270 | |||||||||||
Benchmark Mortgage Trust, Series 2021-B25, Class A3 | 1.906 | 04/15/54 | 500 | 505,946 | ||||||||||||
| Freddie Mac STACR REMIC Trust, | ||||||||||||||||
Series 2021-DNA3, Class M2, SOFR30A + 2.100% | 2.150 | (c) | 10/25/33 | 50 | 51,022 | |||||||||||
Series 2021-DNA5, Class M1, SOFR30A + 0.650% | 0.700 | (c) | 01/25/34 | 24 | 24,299 | |||||||||||
Freddie Mac Structured Agency Credit Risk Debt Notes, Series 2017-DNA3, Class M1, 1 Month | 0.834 | (c) | 03/25/30 | 238 | 238,230 | |||||||||||
GS Mortgage Securities Trust, Series 2019-GC42, Class A3 | 2.749 | 09/01/52 | 250 | 264,589 | ||||||||||||
JPMCC Commercial Mortgage Securities Trust, Series 2019-COR5, Class A3 | 3.123 | 06/13/52 | 500 | 537,777 | ||||||||||||
MFA Trust, Series 2021-RPL1, Class A1, 144A | 1.131 | (cc) | 07/25/60 | 97 | 97,120 | |||||||||||
Station Place Securitization Trust, Series 2021-8, Class A, 144A, 1 Month LIBOR + 0.800% | 0.886 | (c) | 06/20/22 | 30 | 30,023 | |||||||||||
See Notes to Financial Statements.
| 86 |
| Description | Interest Rate | Maturity Date | Principal Amount (000)# | Value | ||||||||||||
| COMMERCIAL MORTGAGE-BACKED SECURITIES (Continued) | ||||||||||||||||
| Wells Fargo Commercial Mortgage Trust, | ||||||||||||||||
Series 2019-C52, Class A4 | 2.643 | % | 08/15/52 | 436 | $ | 459,112 | ||||||||||
Series 2021-C59, Class A3 | 1.958 | 04/15/54 | 350 | 354,195 | ||||||||||||
|
| |||||||||||||||
TOTAL COMMERCIAL MORTGAGE-BACKED SECURITIES |
| 2,977,237 | ||||||||||||||
|
| |||||||||||||||
| CORPORATE BONDS 30.0% | ||||||||||||||||
| Aerospace & Defense 0.7% | ||||||||||||||||
| Boeing Co. (The), | ||||||||||||||||
Sr. Unsec’d. Notes | 2.196 | 02/04/26 | 123 | 123,975 | ||||||||||||
Sr. Unsec’d. Notes | 3.750 | 02/01/50 | 34 | 35,285 | ||||||||||||
Raytheon Technologies Corp., Sr. Unsec’d. Notes | 4.125 | 11/16/28 | 13 | 14,969 | ||||||||||||
|
| |||||||||||||||
| 174,229 | ||||||||||||||||
| Agriculture 0.3% | ||||||||||||||||
| Altria Group, Inc., | ||||||||||||||||
Gtd. Notes | 3.400 | 05/06/30 | 13 | 13,932 | ||||||||||||
Gtd. Notes | 3.400 | 02/04/41 | 25 | 24,058 | ||||||||||||
BAT International Finance PLC (United Kingdom), | 1.668 | 03/25/26 | 34 | 34,229 | ||||||||||||
|
| |||||||||||||||
| 72,219 | ||||||||||||||||
| Airlines 0.2% | ||||||||||||||||
| Southwest Airlines Co., | ||||||||||||||||
Sr. Unsec’d. Notes | 4.750 | 05/04/23 | 17 | 18,157 | ||||||||||||
Sr. Unsec’d. Notes | 5.125 | 06/15/27 | 30 | 35,118 | ||||||||||||
United Airlines 2013-1 Class A Pass Through Trust, Pass-Through Certificates | 4.300 | 08/15/25 | 10 | 10,472 | ||||||||||||
|
| |||||||||||||||
| 63,747 | ||||||||||||||||
| Auto Manufacturers 0.5% | ||||||||||||||||
| General Motors Co., | ||||||||||||||||
Sr. Unsec’d. Notes | 6.250 | 10/02/43 | 21 | 28,738 | ||||||||||||
Sr. Unsec’d. Notes | 6.600 | 04/01/36 | 17 | 23,256 | ||||||||||||
| General Motors Financial Co., Inc., | ||||||||||||||||
Gtd. Notes | 3.700 | 05/09/23 | 25 | 26,134 | ||||||||||||
Sr. Unsec’d. Notes | 2.900 | 02/26/25 | 38 | 40,150 | ||||||||||||
Toyota Motor Credit Corp., Sr. Unsec’d. Notes, MTN | 0.800 | 10/16/25 | 17 | 16,891 | ||||||||||||
|
| |||||||||||||||
| 135,169 | ||||||||||||||||
See Notes to Financial Statements.
PGIM Fixed Income ETFs | 87 |
PGIM Active Aggregate Bond ETF
Schedule of Investments (continued)
as of August 31, 2021
| Description | Interest Rate | Maturity Date | Principal Amount (000)# | Value | ||||||||||||
| CORPORATE BONDS (Continued) | ||||||||||||||||
| Banks 8.6% | ||||||||||||||||
| Bank of America Corp., | ||||||||||||||||
Sr. Unsec’d. Notes, MTN | 4.125 | % | 01/22/24 | 55 | $ | 59,669 | ||||||||||
Sr. Unsec’d. Notes, MTN, 3 Month LIBOR + 1.070% | 3.970 | (c) | 03/05/29 | 175 | 197,211 | |||||||||||
Sr. Unsec’d. Notes, SOFR + 1.220% | 2.299 | (c) | 07/21/32 | 60 | 60,355 | |||||||||||
Sr. Unsec’d. Notes, SOFR + 1.320% | 2.687 | (c) | 04/22/32 | 115 | 119,661 | |||||||||||
Sub. Notes, MTN | 4.450 | 03/03/26 | 115 | 129,712 | ||||||||||||
Bank of New York Mellon Corp. (The), Sr. Unsec’d. Notes, MTN | 2.950 | 01/29/23 | 20 | 20,715 | ||||||||||||
BNP Paribas SA (France), Gtd. Notes, MTN | 3.250 | 03/03/23 | 59 | 61,704 | ||||||||||||
| Citigroup, Inc., | ||||||||||||||||
Sr. Unsec’d. Notes | 3.700 | 01/12/26 | 64 | 70,730 | ||||||||||||
Sr. Unsec’d. Notes, 3 Month LIBOR + 1.192% | 4.075 | (c) | 04/23/29 | 80 | 90,719 | |||||||||||
Sr. Unsec’d. Notes, SOFR + 1.167% | 2.561 | (c) | 05/01/32 | 21 | 21,621 | |||||||||||
Sr. Unsec’d. Notes, SOFR + 1.422% | 2.976 | (c) | 11/05/30 | 120 | 127,777 | |||||||||||
Sub. Notes | 4.400 | 06/10/25 | 55 | 61,234 | ||||||||||||
Sub. Notes | 4.450 | 09/29/27 | 21 | 24,064 | ||||||||||||
Deutsche Bank AG (Germany), Sr. Unsec’d. Notes | 3.700 | 05/30/24 | 17 | 18,188 | ||||||||||||
| Goldman Sachs Group, Inc. (The), | ||||||||||||||||
Sr. Unsec’d. Notes | 3.750 | 02/25/26 | 25 | 27,631 | ||||||||||||
Sr. Unsec’d. Notes, 3 Month LIBOR + 1.158% | 3.814 | (c) | 04/23/29 | 90 | 100,836 | |||||||||||
Sr. Unsec’d. Notes, SOFR + 1.090% | 1.992 | (c) | 01/27/32 | 25 | 24,513 | |||||||||||
Sr. Unsec’d. Notes, SOFR + 1.281% | 2.615 | (c) | 04/22/32 | 85 | 87,625 | |||||||||||
| JPMorgan Chase & Co., | ||||||||||||||||
Sr. Unsec’d. Notes | 3.200 | 06/15/26 | 106 | 115,383 | ||||||||||||
Sr. Unsec’d. Notes, 3 Month LIBOR + 0.945% | 3.509 | (c) | 01/23/29 | 150 | 165,748 | |||||||||||
Sr. Unsec’d. Notes, SOFR + 1.250% | 2.580 | (c) | 04/22/32 | 42 | 43,437 | |||||||||||
Sr. Unsec’d. Notes, SOFR + 1.510% | 2.739 | (c) | 10/15/30 | 135 | 142,192 | |||||||||||
Sub. Notes | 4.250 | 10/01/27 | 21 | 24,104 | ||||||||||||
Sub. Notes, SOFR + 2.515% | 2.956 | (c) | 05/13/31 | 21 | 22,225 | |||||||||||
| Morgan Stanley, | ||||||||||||||||
Sr. Unsec’d. Notes, GMTN | 3.750 | 02/25/23 | 34 | 35,693 | ||||||||||||
Sr. Unsec’d. Notes, GMTN | 3.875 | 01/27/26 | 76 | 84,700 | ||||||||||||
Sr. Unsec’d. Notes, GMTN, 3 Month LIBOR + 1.140% | 3.772 | (c) | 01/24/29 | 110 | 123,088 | |||||||||||
Sr. Unsec’d. Notes, MTN, SOFR + 1.020% | 1.928 | (c) | 04/28/32 | 90 | 87,989 | |||||||||||
Sr. Unsec’d. Notes, SOFR + 1.485% | 3.217 | (c) | 04/22/42 | 23 | 24,648 | |||||||||||
Wells Fargo & Co., Sr. Unsec’d. Notes, MTN, | 2.572 | (c) | 02/11/31 | 132 | 137,224 | |||||||||||
|
| |||||||||||||||
| 2,310,396 | ||||||||||||||||
See Notes to Financial Statements.
| 88 |
| Description | Interest Rate | Maturity Date | Principal Amount (000)# | Value | ||||||||||||
| CORPORATE BONDS (Continued) | ||||||||||||||||
| Beverages 0.5% | ||||||||||||||||
Anheuser-Busch Cos. LLC/Anheuser-Busch InBev Worldwide, Inc., Gtd. Notes | 4.900 | % | 02/01/46 | 72 | $ | 92,019 | ||||||||||
Constellation Brands, Inc., Sr. Unsec’d. Notes | 2.250 | 08/01/31 | 25 | 25,026 | ||||||||||||
Keurig Dr Pepper, Inc., Gtd. Notes | 2.250 | 03/15/31 | 21 | 21,296 | ||||||||||||
|
| |||||||||||||||
| 138,341 | ||||||||||||||||
| Biotechnology 0.1% | ||||||||||||||||
Amgen, Inc., Sr. Unsec’d. Notes | 4.663 | 06/15/51 | 13 | 16,861 | ||||||||||||
| Building Materials 0.5% | ||||||||||||||||
Johnson Controls International PLC (Ireland), | 6.000 | 01/15/36 | 13 | 18,462 | ||||||||||||
| Martin Marietta Materials, Inc., | ||||||||||||||||
Sr. Unsec’d. Notes | 2.400 | 07/15/31 | 21 | 21,509 | ||||||||||||
Sr. Unsec’d. Notes | 4.250 | 07/02/24 | 21 | 22,873 | ||||||||||||
| Owens Corning, | ||||||||||||||||
Sr. Unsec’d. Notes | 4.200 | 12/01/24 | 25 | 27,323 | ||||||||||||
Sr. Unsec’d. Notes | 7.000 | 12/01/36 | 25 | 36,561 | ||||||||||||
Vulcan Materials Co., Sr. Unsec’d. Notes | 3.500 | 06/01/30 | 13 | 14,464 | ||||||||||||
|
| |||||||||||||||
| 141,192 | ||||||||||||||||
| Chemicals 0.4% | ||||||||||||||||
Dow Chemical Co. (The), Sr. Unsec’d. Notes | 3.600 | 11/15/50 | 17 | 18,684 | ||||||||||||
FMC Corp., Sr. Unsec’d. Notes | 4.500 | 10/01/49 | 13 | 15,569 | ||||||||||||
| LYB International Finance III LLC, | ||||||||||||||||
Gtd. Notes | 3.375 | 05/01/30 | 34 | 37,464 | ||||||||||||
Gtd. Notes | 4.200 | 10/15/49 | 17 | 19,969 | ||||||||||||
Nutrien Ltd. (Canada), Sr. Unsec’d. Notes | 4.900 | 06/01/43 | 21 | 27,143 | ||||||||||||
|
| |||||||||||||||
| 118,829 | ||||||||||||||||
| Commercial Services 1.0% | ||||||||||||||||
California Institute of Technology, Sr. Unsec’d. Notes | 3.650 | 09/01/19 | 10 | 11,869 | ||||||||||||
Equifax, Inc., Sr. Unsec’d. Notes | 2.600 | 12/01/24 | 21 | 22,098 | ||||||||||||
ERAC USA Finance LLC, Gtd. Notes, 144A | 3.300 | 12/01/26 | 45 | 49,191 | ||||||||||||
Global Payments, Inc., Sr. Unsec’d. Notes | 1.200 | 03/01/26 | 21 | 20,876 | ||||||||||||
| Massachusetts Institute of Technology, | ||||||||||||||||
Sr. Unsec’d. Notes | 2.989 | 07/01/50 | 10 | 11,104 | ||||||||||||
Unsec’d. Notes | 4.678 | 07/01/14 | 20 | 30,350 | ||||||||||||
President & Fellows of Harvard College, Unsec’d. Notes | 2.517 | 10/15/50 | 35 | 35,564 | ||||||||||||
Trustees of Boston University, Sec’d. Notes | 4.061 | 10/01/48 | 10 | 12,559 | ||||||||||||
See Notes to Financial Statements.
PGIM Fixed Income ETFs | 89 |
PGIM Active Aggregate Bond ETF
Schedule of Investments (continued)
as of August 31, 2021
| Description | Interest Rate | Maturity Date | Principal Amount (000)# | Value | ||||||||||||
| CORPORATE BONDS (Continued) | ||||||||||||||||
| Commercial Services (cont'd.) | ||||||||||||||||
Trustees of the University of Pennsylvania (The), | 3.610 | % | 02/15/19 | 15 | $ | 17,736 | ||||||||||
University of Southern California, Unsec’d. Notes | 3.841 | 10/01/47 | 10 | 12,353 | ||||||||||||
Verisk Analytics, Inc., Sr. Unsec’d. Notes | 3.625 | 05/15/50 | 30 | 32,687 | ||||||||||||
Yale University, Unsec’d. Notes | 2.402 | 04/15/50 | 10 | 9,881 | ||||||||||||
|
| |||||||||||||||
| 266,268 | ||||||||||||||||
| Computers 0.1% | ||||||||||||||||
Apple, Inc., Sr. Unsec’d. Notes | 3.250 | 02/23/26 | 20 | 21,916 | ||||||||||||
International Business Machines Corp., | 5.875 | 11/29/32 | 8 | 10,884 | ||||||||||||
|
| |||||||||||||||
| 32,800 | ||||||||||||||||
| Diversified Financial Services 0.1% | ||||||||||||||||
Discover Financial Services, Sr. Unsec’d. Notes | 3.750 | 03/04/25 | 21 | 22,808 | ||||||||||||
| Electric 2.5% | ||||||||||||||||
| AEP Texas, Inc., | ||||||||||||||||
Sr. Unsec’d. Notes | 2.100 | 07/01/30 | 17 | 16,868 | ||||||||||||
Sr. Unsec’d. Notes | 3.450 | 05/15/51 | 13 | 13,809 | ||||||||||||
AEP Transmission Co. LLC, Sr. Unsec’d. Notes | 4.250 | 09/15/48 | 17 | 21,335 | ||||||||||||
Ameren Corp., Sr. Unsec’d. Notes | 2.500 | 09/15/24 | 21 | 22,007 | ||||||||||||
Arizona Public Service Co., Sr. Unsec’d. Notes | 2.600 | 08/15/29 | 8 | 8,430 | ||||||||||||
Consolidated Edison Co. of New York, Inc., | 4.300 | 12/01/56 | 4 | 4,858 | ||||||||||||
Dominion Energy South Carolina, Inc., First Mortgage | 4.600 | 06/15/43 | 17 | 21,933 | ||||||||||||
DTE Electric Co., General Ref. Mortgage | 4.050 | 05/15/48 | 21 | 25,804 | ||||||||||||
Duke Energy Carolinas LLC, Sr. Unsec’d. Notes | 6.100 | 06/01/37 | 21 | 29,183 | ||||||||||||
| Emera US Finance LP, | ||||||||||||||||
Gtd. Notes | 4.750 | 06/15/46 | 13 | 15,489 | ||||||||||||
Sr. Unsec’d. Notes, 144A | 2.639 | 06/15/31 | 13 | 13,239 | ||||||||||||
Entergy Louisiana LLC, Collateral Trust | 4.200 | 09/01/48 | 8 | 9,837 | ||||||||||||
Eversource Energy, Sr. Unsec’d. Notes | 4.250 | 04/01/29 | 21 | 24,459 | ||||||||||||
Exelon Generation Co. LLC, Sr. Unsec’d. Notes | 5.600 | 06/15/42 | 21 | 24,999 | ||||||||||||
Florida Power & Light Co., First Mortgage | 4.125 | 02/01/42 | 17 | 20,888 | ||||||||||||
Jersey Central Power & Light Co., | 4.700 | 04/01/24 | 17 | 18,441 | ||||||||||||
MidAmerican Energy Co., First Mortgage | 4.250 | 07/15/49 | 34 | 42,833 | ||||||||||||
Mississippi Power Co., Sr. Unsec’d. Notes | 4.250 | 03/15/42 | 13 | 15,639 | ||||||||||||
Monongahela Power Co., First Mortgage, 144A | 3.550 | 05/15/27 | 21 | 23,173 | ||||||||||||
See Notes to Financial Statements.
| 90 |
| Description | Interest Rate | Maturity Date | Principal Amount (000)# | Value | ||||||||||||
| CORPORATE BONDS (Continued) | ||||||||||||||||
| Electric (cont'd.) | ||||||||||||||||
NextEra Energy Capital Holdings, Inc., Gtd. Notes | 2.800 | % | 01/15/23 | 21 | $ | 21,650 | ||||||||||
Northern States Power Co., First Mortgage | 3.400 | 08/15/42 | 34 | 38,196 | ||||||||||||
NRG Energy, Inc., Sr. Sec’d. Notes, 144A | 3.750 | 06/15/24 | 17 | 18,126 | ||||||||||||
| Pacific Gas & Electric Co., | ||||||||||||||||
First Mortgage | 1.750 | 06/16/22 | 21 | 20,988 | ||||||||||||
First Mortgage | 3.500 | 08/01/50 | 29 | 26,174 | ||||||||||||
First Mortgage | 4.550 | 07/01/30 | 20 | 21,377 | ||||||||||||
PECO Energy Co., First Mortgage | 2.800 | 06/15/50 | 17 | 17,206 | ||||||||||||
PPL Electric Utilities Corp., First Mortgage | 3.000 | 10/01/49 | 13 | 13,711 | ||||||||||||
| Public Service Electric & Gas Co., | ||||||||||||||||
First Mortgage, MTN | 3.600 | 12/01/47 | 13 | 14,980 | ||||||||||||
First Mortgage, MTN | 3.700 | 05/01/28 | 13 | 14,785 | ||||||||||||
Puget Energy, Inc., Sr. Sec’d. Notes, 144A | 2.379 | 06/15/28 | 5 | 5,076 | ||||||||||||
San Diego Gas & Electric Co., First Mortgage | 4.150 | 05/15/48 | 15 | 18,235 | ||||||||||||
Sempra Energy, Sr. Unsec’d. Notes | 4.000 | 02/01/48 | 15 | 16,988 | ||||||||||||
Southern California Edison Co., First Ref. Mortgage | 4.000 | 04/01/47 | 30 | 31,828 | ||||||||||||
Vistra Operations Co. LLC, Sr. Sec’d. Notes, 144A | 3.550 | 07/15/24 | 17 | 17,975 | ||||||||||||
|
| |||||||||||||||
| 670,519 | ||||||||||||||||
| Engineering & Construction 0.8% | ||||||||||||||||
Mexico City Airport Trust (Mexico), Sr. Sec’d. Notes, 144A | 4.250 | 10/31/26 | 200 | 216,694 | ||||||||||||
| Food 0.2% | ||||||||||||||||
Campbell Soup Co., Sr. Unsec’d. Notes | 3.300 | 03/19/25 | 21 | 22,586 | ||||||||||||
Hormel Foods Corp., Sr. Unsec’d. Notes | 0.650 | 06/03/24 | 8 | 8,012 | ||||||||||||
Mars, Inc., Gtd. Notes, 144A | 3.600 | 04/01/34 | 10 | 11,517 | ||||||||||||
|
| |||||||||||||||
| 42,115 | ||||||||||||||||
| Forest Products & Paper 0.0% | ||||||||||||||||
International Paper Co., Sr. Unsec’d. Notes | 5.150 | 05/15/46 | 3 | 4,031 | ||||||||||||
| Gas 0.2% | ||||||||||||||||
CenterPoint Energy Resources Corp., Sr. Unsec’d. Notes | 4.100 | 09/01/47 | 21 | 24,782 | ||||||||||||
NiSource, Inc., Sr. Unsec’d. Notes | 3.490 | 05/15/27 | 13 | 14,355 | ||||||||||||
Piedmont Natural Gas Co., Inc., Sr. Unsec’d. Notes | 3.500 | 06/01/29 | 21 | 23,172 | ||||||||||||
|
| |||||||||||||||
| 62,309 | ||||||||||||||||
| Healthcare-Services 1.0% | ||||||||||||||||
Anthem, Inc., Sr. Unsec’d. Notes | 4.625 | 05/15/42 | 30 | 37,544 | ||||||||||||
Ascension Health, Sr. Unsec’d. Notes | 2.532 | 11/15/29 | 35 | 37,091 | ||||||||||||
See Notes to Financial Statements.
PGIM Fixed Income ETFs | 91 |
PGIM Active Aggregate Bond ETF
Schedule of Investments (continued)
as of August 31, 2021
| Description | Interest Rate | Maturity Date | Principal Amount (000)# | Value | ||||||||||||
| CORPORATE BONDS (Continued) | ||||||||||||||||
| Healthcare-Services (cont'd.) | ||||||||||||||||
Kaiser Foundation Hospitals, Unsec’d. Notes | 2.810 | % | 06/01/41 | 45 | $ | 46,403 | ||||||||||
Memorial Sloan-Kettering Cancer Center, Unsec’d. Notes | 2.955 | 01/01/50 | 15 | 15,609 | ||||||||||||
Methodist Hospital (The), Unsec’d. Notes | 2.705 | 12/01/50 | 10 | 10,007 | ||||||||||||
New York & Presbyterian Hospital (The), Unsec’d. Notes | 4.024 | 08/01/45 | 10 | 12,449 | ||||||||||||
Northwestern Memorial Healthcare Obligated Group, Unsec’d. Notes | 2.633 | 07/15/51 | 20 | 19,885 | ||||||||||||
Quest Diagnostics, Inc., Sr. Unsec’d. Notes | 4.700 | 03/30/45 | 8 | 10,027 | ||||||||||||
Stanford Health Care, Unsec’d. Notes | 3.027 | 08/15/51 | 20 | 21,227 | ||||||||||||
| UnitedHealth Group, Inc., | ||||||||||||||||
Sr. Unsec’d. Notes | 3.875 | 08/15/59 | 13 | 15,732 | ||||||||||||
Sr. Unsec’d. Notes | 3.950 | 10/15/42 | 30 | 35,947 | ||||||||||||
|
| |||||||||||||||
| 261,921 | ||||||||||||||||
| Insurance 0.6% | ||||||||||||||||
American International Group, Inc., Sr. Unsec’d. Notes | 4.500 | 07/16/44 | 25 | 30,962 | ||||||||||||
Chubb INA Holdings, Inc., Gtd. Notes | 2.700 | 03/13/23 | 8 | 8,292 | ||||||||||||
Everest Reinsurance Holdings, Inc., Sr. Unsec’d. Notes | 3.500 | 10/15/50 | 8 | 8,705 | ||||||||||||
Liberty Mutual Group, Inc., Gtd. Notes, 144A | 3.951 | 10/15/50 | 38 | 43,256 | ||||||||||||
Lincoln National Corp., Sr. Unsec’d. Notes | 3.050 | 01/15/30 | 8 | 8,632 | ||||||||||||
Markel Corp., | ||||||||||||||||
Sr. Unsec’d. Notes | 4.150 | 09/17/50 | 17 | 20,153 | ||||||||||||
Sr. Unsec’d. Notes | 4.900 | 07/01/22 | 21 | 21,749 | ||||||||||||
Principal Financial Group, Inc., Gtd. Notes | 4.625 | 09/15/42 | 17 | 21,415 | ||||||||||||
W.R. Berkley Corp., Sr. Unsec’d. Notes | 4.000 | 05/12/50 | 8 | 9,388 | ||||||||||||
|
| |||||||||||||||
| 172,552 | ||||||||||||||||
| Iron/Steel 0.1% | ||||||||||||||||
Steel Dynamics, Inc., Sr. Unsec’d. Notes | 3.450 | 04/15/30 | 20 | 21,915 | ||||||||||||
| Lodging 0.2% | ||||||||||||||||
Marriott International, Inc., Sr. Unsec’d. Notes | 3.125 | 06/15/26 | 38 | 40,581 | ||||||||||||
| Machinery-Constructions & Mining 0.1% | ||||||||||||||||
Caterpillar, Inc., Sr. Unsec’d. Notes | 2.600 | 09/19/29 | 13 | 13,877 | ||||||||||||
| Machinery-Diversified 0.2% | ||||||||||||||||
Westinghouse Air Brake Technologies Corp., Gtd. Notes | 3.200 | 06/15/25 | 43 | 45,835 | ||||||||||||
| Media 1.3% | ||||||||||||||||
| Charter Communications Operating LLC/Charter Communications Operating Capital, | ||||||||||||||||
Sr. Sec’d. Notes | 4.800 | 03/01/50 | 64 | 75,107 | ||||||||||||
See Notes to Financial Statements.
| 92 |
| Description | Interest Rate | Maturity Date | Principal Amount (000)# | Value | ||||||||||||
| CORPORATE BONDS (Continued) | ||||||||||||||||
| Media (cont'd.) | ||||||||||||||||
| Charter Communications Operating LLC/Charter Communications Operating Capital, (cont'd.) | ||||||||||||||||
Sr. Sec’d. Notes | 4.908 | % | 07/23/25 | 38 | $ | 43,030 | ||||||||||
Sr. Sec’d. Notes | 6.384 | 10/23/35 | 25 | 33,390 | ||||||||||||
Comcast Corp., Gtd. Notes | 3.999 | 11/01/49 | 42 | 50,019 | ||||||||||||
Cox Communications, Inc., Sr. Unsec’d. Notes, 144A | 3.150 | 08/15/24 | 13 | 13,828 | ||||||||||||
| Discovery Communications LLC, | ||||||||||||||||
Gtd. Notes | 2.950 | 03/20/23 | 25 | 25,890 | ||||||||||||
Gtd. Notes | 3.625 | 05/15/30 | 25 | 27,434 | ||||||||||||
Gtd. Notes | 5.200 | 09/20/47 | 23 | 28,938 | ||||||||||||
ViacomCBS, Inc., Sr. Unsec’d. Notes | 4.375 | 03/15/43 | 38 | 44,478 | ||||||||||||
Walt Disney Co. (The), Gtd. Notes | 3.600 | 01/13/51 | 12 | 13,873 | ||||||||||||
|
| |||||||||||||||
| 355,987 | ||||||||||||||||
| Mining 0.5% | ||||||||||||||||
Barrick North America Finance LLC, Gtd. Notes | 5.750 | 05/01/43 | 30 | 42,073 | ||||||||||||
Newmont Corp., Gtd. Notes | 2.800 | 10/01/29 | 47 | 49,425 | ||||||||||||
Southern Copper Corp., Sr. Unsec’d. Notes | 5.250 | 11/08/42 | 10 | 12,825 | ||||||||||||
Teck Resources Ltd. (Canada), Sr. Unsec’d. Notes | 6.250 | 07/15/41 | 30 | 40,017 | ||||||||||||
|
| |||||||||||||||
| 144,340 | ||||||||||||||||
| Miscellaneous Manufacturer 0.3% | ||||||||||||||||
General Electric Co., Sr. Unsec’d. Notes, GMTN | 3.450 | 05/15/24 | 34 | 36,262 | ||||||||||||
Textron, Inc., Sr. Unsec’d. Notes | 3.375 | 03/01/28 | 34 | 37,031 | ||||||||||||
|
| |||||||||||||||
| 73,293 | ||||||||||||||||
| Multi-National 0.4% | ||||||||||||||||
Corp. Andina de Fomento (Supranational), | 3.750 | 11/23/23 | 100 | 106,318 | ||||||||||||
| Oil & Gas 1.4% | ||||||||||||||||
BP Capital Markets America, Inc., Gtd. Notes | 3.790 | 02/06/24 | 25 | 26,835 | ||||||||||||
Canadian Natural Resources Ltd. (Canada), | 2.950 | 01/15/23 | 42 | 43,328 | ||||||||||||
| Cenovus Energy, Inc. (Canada), | ||||||||||||||||
Sr. Unsec’d. Notes | 4.250 | 04/15/27 | 13 | 14,446 | ||||||||||||
Sr. Unsec’d. Notes | 5.400 | 06/15/47 | 17 | 21,002 | ||||||||||||
Chevron USA, Inc., Gtd. Notes | 6.000 | 03/01/41 | 13 | 19,197 | ||||||||||||
ConocoPhillips, Gtd. Notes, 144A | 4.300 | 08/15/28 | 42 | 48,624 | ||||||||||||
Devon Energy Corp., Sr. Unsec’d. Notes | 5.600 | 07/15/41 | 21 | 26,286 | ||||||||||||
See Notes to Financial Statements.
PGIM Fixed Income ETFs | 93 |
PGIM Active Aggregate Bond ETF
Schedule of Investments (continued)
as of August 31, 2021
| Description | Interest Rate | Maturity Date | Principal Amount (000)# | Value | ||||||||||||
| CORPORATE BONDS (Continued) | ||||||||||||||||
| Oil & Gas (cont'd.) | ||||||||||||||||
| Diamondback Energy, Inc., | ||||||||||||||||
Gtd. Notes | 2.875 | % | 12/01/24 | 21 | $ | 22,058 | ||||||||||
Gtd. Notes | 3.500 | 12/01/29 | 30 | 32,334 | ||||||||||||
Ecopetrol SA (Colombia), Sr. Unsec’d. Notes | 5.375 | 06/26/26 | 10 | 11,033 | ||||||||||||
Exxon Mobil Corp., Sr. Unsec’d. Notes | 3.452 | 04/15/51 | 8 | 8,845 | ||||||||||||
Phillips 66, Gtd. Notes | 2.150 | 12/15/30 | 34 | 33,429 | ||||||||||||
Pioneer Natural Resources Co., Sr. Unsec’d. Notes | 1.125 | 01/15/26 | 42 | 41,655 | ||||||||||||
Valero Energy Corp., Sr. Unsec’d. Notes | 2.700 | 04/15/23 | 30 | 30,995 | ||||||||||||
|
| |||||||||||||||
| 380,067 | ||||||||||||||||
| Pharmaceuticals 2.3% | ||||||||||||||||
| AbbVie, Inc., | ||||||||||||||||
Sr. Unsec’d. Notes | 3.200 | 11/21/29 | 95 | 103,827 | ||||||||||||
Sr. Unsec’d. Notes | 4.250 | 11/21/49 | 15 | 18,217 | ||||||||||||
Sr. Unsec’d. Notes | 4.550 | 03/15/35 | 35 | 42,606 | ||||||||||||
AstraZeneca Finance LLC, Gtd. Notes | 2.250 | 05/28/31 | 3 | 3,093 | ||||||||||||
Becton Dickinson & Co., Sr. Unsec’d. Notes | 3.734 | 12/15/24 | 3 | 3,256 | ||||||||||||
Bristol-Myers Squibb Co., | ||||||||||||||||
Sr. Unsec’d. Notes | 3.400 | 07/26/29 | 13 | 14,608 | ||||||||||||
Sr. Unsec’d. Notes | 5.000 | 08/15/45 | 13 | 17,910 | ||||||||||||
| Cigna Corp., | ||||||||||||||||
Gtd. Notes | 4.375 | 10/15/28 | 30 | 35,019 | ||||||||||||
Sr. Unsec’d. Notes | 2.400 | 03/15/30 | 38 | 39,170 | ||||||||||||
Sr. Unsec’d. Notes | 3.400 | 03/15/50 | 21 | 22,391 | ||||||||||||
| CVS Health Corp., | ||||||||||||||||
Sr. Unsec’d. Notes | 4.300 | 03/25/28 | 20 | 23,040 | ||||||||||||
Sr. Unsec’d. Notes | 5.125 | 07/20/45 | 42 | 55,406 | ||||||||||||
Johnson & Johnson, Sr. Unsec’d. Notes | 2.450 | 09/01/60 | 8 | 7,768 | ||||||||||||
Merck & Co., Inc., Sr. Unsec’d. Notes | 3.400 | 03/07/29 | 8 | 8,998 | ||||||||||||
Mylan, Inc., Gtd. Notes | 5.200 | 04/15/48 | 30 | 37,368 | ||||||||||||
Pfizer, Inc., Sr. Unsec’d. Notes | 2.550 | 05/28/40 | 13 | 13,193 | ||||||||||||
| Shire Acquisitions Investments Ireland DAC (Ireland), | ||||||||||||||||
Gtd. Notes | 2.875 | 09/23/23 | 64 | 66,818 | ||||||||||||
Gtd. Notes | 3.200 | 09/23/26 | 59 | 64,026 | ||||||||||||
Viatris, Inc., Gtd. Notes, 144A | 3.850 | 06/22/40 | 38 | 41,156 | ||||||||||||
|
| |||||||||||||||
| 617,870 | ||||||||||||||||
| Pipelines 1.9% | ||||||||||||||||
| Energy Transfer LP, | ||||||||||||||||
Sr. Unsec’d. Notes | 4.950 | 06/15/28 | 38 | 44,023 | ||||||||||||
Sr. Unsec’d. Notes | 6.250 | 04/15/49 | 34 | 45,042 | ||||||||||||
See Notes to Financial Statements.
| 94 |
| Description | Interest Rate | Maturity Date | Principal Amount (000)# | Value | ||||||||||||
| CORPORATE BONDS (Continued) | ||||||||||||||||
| Pipelines (cont'd.) | ||||||||||||||||
| Enterprise Products Operating LLC, | ||||||||||||||||
Gtd. Notes | 3.125 | % | 07/31/29 | 30 | $ | 32,488 | ||||||||||
Gtd. Notes | 4.850 | 03/15/44 | 25 | 30,888 | ||||||||||||
| Kinder Morgan, Inc., | ||||||||||||||||
Gtd. Notes | 2.000 | 02/15/31 | 34 | 33,169 | ||||||||||||
Gtd. Notes | 3.250 | 08/01/50 | 17 | 16,754 | ||||||||||||
| MPLX LP, | ||||||||||||||||
Sr. Unsec’d. Notes | 4.500 | 04/15/38 | �� | 13 | 14,896 | |||||||||||
Sr. Unsec’d. Notes | 4.875 | 06/01/25 | 55 | 61,848 | ||||||||||||
Sr. Unsec’d. Notes | 5.500 | 02/15/49 | 17 | 21,979 | ||||||||||||
ONEOK Partners LP, Gtd. Notes | 6.125 | 02/01/41 | 25 | 32,279 | ||||||||||||
| ONEOK, Inc., | ||||||||||||||||
Gtd. Notes | 3.100 | 03/15/30 | 42 | 44,148 | ||||||||||||
Gtd. Notes | 4.950 | 07/13/47 | 21 | 24,762 | ||||||||||||
Phillips 66 Partners LP, Sr. Unsec’d. Notes | 3.550 | 10/01/26 | 17 | 18,443 | ||||||||||||
| Plains All American Pipeline LP/PAA Finance Corp., | ||||||||||||||||
Sr. Unsec’d. Notes | 4.500 | 12/15/26 | 17 | 19,080 | ||||||||||||
Sr. Unsec’d. Notes | 5.150 | 06/01/42 | 17 | 19,097 | ||||||||||||
| Transcontinental Gas Pipe Line Co. LLC, | ||||||||||||||||
Sr. Unsec’d. Notes | 3.250 | 05/15/30 | 21 | 22,718 | ||||||||||||
Sr. Unsec’d. Notes | 3.950 | 05/15/50 | 21 | 23,839 | ||||||||||||
|
| |||||||||||||||
| 505,453 | ||||||||||||||||
| Real Estate Investment Trusts (REITs) 0.8% | ||||||||||||||||
Boston Properties LP, Sr. Unsec’d. Notes | 3.850 | 02/01/23 | 13 | 13,502 | ||||||||||||
Brixmor Operating Partnership LP, Sr. Unsec’d. Notes | 3.650 | 06/15/24 | 55 | 58,981 | ||||||||||||
Realty Income Corp., Sr. Unsec’d. Notes | 3.250 | 01/15/31 | 25 | 27,614 | ||||||||||||
Simon Property Group LP, Sr. Unsec’d. Notes | 3.750 | 02/01/24 | 30 | 32,075 | ||||||||||||
Spirit Realty LP, Gtd. Notes | 2.700 | 02/15/32 | 8 | 8,071 | ||||||||||||
Ventas Realty LP, Gtd. Notes | 4.125 | 01/15/26 | 17 | 18,917 | ||||||||||||
| VEREIT Operating Partnership LP, | ||||||||||||||||
Gtd. Notes | 2.200 | 06/15/28 | 10 | 10,244 | ||||||||||||
Gtd. Notes | 3.100 | 12/15/29 | 29 | 31,215 | ||||||||||||
Weyerhaeuser Co., Sr. Unsec’d. Notes | 8.500 | 01/15/25 | 13 | 16,139 | ||||||||||||
|
| |||||||||||||||
| 216,758 | ||||||||||||||||
| Retail 0.3% | ||||||||||||||||
Alimentation Couche-Tard, Inc. (Canada), | 4.500 | 07/26/47 | 17 | 20,490 | ||||||||||||
AutoZone, Inc., Sr. Unsec’d. Notes | 3.750 | 04/18/29 | 38 | 42,708 | ||||||||||||
See Notes to Financial Statements.
PGIM Fixed Income ETFs | 95 |
PGIM Active Aggregate Bond ETF
Schedule of Investments (continued)
as of August 31, 2021
| Description | Interest Rate | Maturity Date | Principal Amount (000)# | Value | ||||||||||||
| CORPORATE BONDS (Continued) | ||||||||||||||||
| Retail (cont'd.) | ||||||||||||||||
Home Depot, Inc. (The), Sr. Unsec’d. Notes | 5.875 | % | 12/16/36 | 8 | $ | 11,478 | ||||||||||
McDonald’s Corp., Sr. Unsec’d. Notes, MTN | 4.700 | 12/09/35 | 8 | 10,015 | ||||||||||||
|
| |||||||||||||||
| 84,691 | ||||||||||||||||
| Semiconductors 0.4% | ||||||||||||||||
| Broadcom, Inc., | ||||||||||||||||
Gtd. Notes | 3.459 | 09/15/26 | 42 | 45,592 | ||||||||||||
Sr. Unsec’d. Notes, 144A | 3.419 | 04/15/33 | 55 | 58,302 | ||||||||||||
|
| |||||||||||||||
| 103,894 | ||||||||||||||||
| Software 0.2% | ||||||||||||||||
Microsoft Corp., Sr. Unsec’d. Notes | 2.525 | 06/01/50 | 38 | 37,916 | ||||||||||||
Oracle Corp., Sr. Unsec’d. Notes | 3.850 | 04/01/60 | 8 | 8,605 | ||||||||||||
|
| |||||||||||||||
| 46,521 | ||||||||||||||||
| Telecommunications 1.3% | ||||||||||||||||
| AT&T, Inc., | ||||||||||||||||
Sr. Unsec’d. Notes | 4.300 | 02/15/30 | 40 | 46,463 | ||||||||||||
Sr. Unsec’d. Notes | 4.500 | 05/15/35 | 20 | 23,696 | ||||||||||||
Sr. Unsec’d. Notes, 144A | 3.500 | 09/15/53 | 90 | 92,383 | ||||||||||||
| T-Mobile USA, Inc., | ||||||||||||||||
Sr. Sec’d. Notes | 2.050 | 02/15/28 | 21 | 21,358 | ||||||||||||
Sr. Sec’d. Notes | 3.000 | 02/15/41 | 30 | 29,748 | ||||||||||||
Sr. Sec’d. Notes | 3.300 | 02/15/51 | 13 | 13,043 | ||||||||||||
| Verizon Communications, Inc., | ||||||||||||||||
Sr. Unsec’d. Notes | 4.016 | 12/03/29 | 47 | 54,120 | ||||||||||||
Sr. Unsec’d. Notes | 4.522 | 09/15/48 | 51 | 64,248 | ||||||||||||
|
| |||||||||||||||
| 345,059 | ||||||||||||||||
| Transportation 0.0% | ||||||||||||||||
CSX Corp., Sr. Unsec’d. Notes | 6.150 | 05/01/37 | 8 | 11,359 | ||||||||||||
|
| |||||||||||||||
TOTAL CORPORATE BONDS |
| 8,036,818 | ||||||||||||||
|
| |||||||||||||||
| MUNICIPAL BONDS 0.5% | ||||||||||||||||
| New Jersey 0.1% | ||||||||||||||||
New Jersey Turnpike Authority, Taxable, Revenue Bonds, BABs, Series F | 7.414 | 01/01/40 | 10 | 16,669 | ||||||||||||
See Notes to Financial Statements.
| 96 |
| Description | Interest Rate | Maturity Date | Principal Amount (000)# | Value | ||||||||||||
| MUNICIPAL BONDS (Continued) | ||||||||||||||||
| New York 0.1% | ||||||||||||||||
New York State Dormitory Authority, Taxable, | 2.202 | % | 03/15/34 | 15 | $ | 15,216 | ||||||||||
Port Authority of New York & New Jersey, Consolidated, Revenue Bonds | 4.458 | 10/01/62 | 10 | 13,761 | ||||||||||||
|
| |||||||||||||||
| 28,977 | ||||||||||||||||
| Ohio 0.0% | ||||||||||||||||
Ohio State University (The), Taxable, Revenue Bonds, Series A | 4.800 | 06/01/11 | 10 | 14,909 | ||||||||||||
| Pennsylvania 0.2% | ||||||||||||||||
Pennsylvania Turnpike Commission, Revenue Bonds, BABs, Series B | 5.511 | 12/01/45 | 10 | 14,469 | ||||||||||||
University of Pittsburgh-of the Commonwealth System of Higher Education, Taxable, Revenue Bonds | 3.555 | 09/15/19 | 30 | 33,535 | ||||||||||||
|
| |||||||||||||||
| 48,004 | ||||||||||||||||
| Virginia 0.1% | ||||||||||||||||
University of Virginia, Taxable, Revenue Bonds, Series B | 2.584 | 11/01/51 | 25 | 25,241 | ||||||||||||
|
| |||||||||||||||
TOTAL MUNICIPAL BONDS |
| 133,800 | ||||||||||||||
|
| |||||||||||||||
| SOVEREIGN BONDS 1.6% | ||||||||||||||||
Hungary Government International Bond (Hungary), Sr. Unsec’d. Notes | 7.625 | 03/29/41 | 10 | 17,012 | ||||||||||||
Indonesia Government International Bond (Indonesia), Sr. Unsec’d. Notes | 3.500 | 01/11/28 | 200 | 220,201 | ||||||||||||
Mexico Government International Bond (Mexico), Sr. Unsec’d. Notes | 6.050 | 01/11/40 | 50 | 63,805 | ||||||||||||
Peruvian Government International Bond (Peru), Sr. Unsec’d. Notes | 4.125 | 08/25/27 | 50 | 56,263 | ||||||||||||
Romanian Government International Bond (Romania), Sr. Unsec’d. Notes, 144A | 6.125 | 01/22/44 | 40 | 54,899 | ||||||||||||
Uruguay Government International Bond (Uruguay), Sr. Unsec’d. Notes | 5.100 | 06/18/50 | 15 | 20,048 | ||||||||||||
|
| |||||||||||||||
TOTAL SOVEREIGN BONDS |
| 432,228 | ||||||||||||||
|
| |||||||||||||||
See Notes to Financial Statements.
PGIM Fixed Income ETFs | 97 |
PGIM Active Aggregate Bond ETF
Schedule of Investments (continued)
as of August 31, 2021
| Description | Interest Rate | Maturity Date | Principal Amount (000)# | Value | ||||||||||||
| U.S. GOVERNMENT AGENCY OBLIGATIONS 24.7% | ||||||||||||||||
Federal National Mortgage Assoc. | 2.000 | % | TBA | 500 | $ | 505,895 | ||||||||||
Federal National Mortgage Assoc. | 2.500 | TBA | 2,000 | 2,073,360 | ||||||||||||
Federal National Mortgage Assoc. | 3.000 | TBA | 500 | 522,945 | ||||||||||||
Federal National Mortgage Assoc. | 3.500 | TBA | 1,250 | 1,322,237 | ||||||||||||
Federal National Mortgage Assoc. | 4.000 | TBA | 250 | 267,785 | ||||||||||||
Federal National Mortgage Assoc. Pool | 1.500 | 12/01/50 | 392 | 385,881 | ||||||||||||
Federal National Mortgage Assoc. Pool | 2.000 | 05/01/36 | 485 | 502,042 | ||||||||||||
Government National Mortgage Assoc. | 2.500 | TBA | 500 | 517,410 | ||||||||||||
Government National Mortgage Assoc. | 3.000 | TBA | 500 | 521,670 | ||||||||||||
|
| |||||||||||||||
TOTAL U.S. GOVERNMENT AGENCY OBLIGATIONS |
| 6,619,225 | ||||||||||||||
|
| |||||||||||||||
| U.S. TREASURY OBLIGATIONS 23.3% | ||||||||||||||||
U.S. Treasury Bonds | 1.875 | 02/15/41 | 1,660 | 1,673,228 | ||||||||||||
U.S. Treasury Bonds | 2.250 | 05/15/41 | 120 | 128,419 | ||||||||||||
U.S. Treasury Bonds | 2.375 | 05/15/51 | 428 | 472,739 | ||||||||||||
U.S. Treasury Bonds | 2.500 | 02/15/46 | 1,090 | 1,217,564 | ||||||||||||
U.S. Treasury Notes | 0.125 | 06/30/23 | 105 | 104,918 | ||||||||||||
U.S. Treasury Notes | 0.125 | 08/31/23 | 60 | 59,902 | ||||||||||||
U.S. Treasury Notes | 0.375 | 08/15/24 | 77 | 76,940 | ||||||||||||
U.S. Treasury Notes(k) | 0.750 | 03/31/26 | 450 | 450,633 | ||||||||||||
U.S. Treasury Notes | 0.750 | 08/31/26 | 170 | 169,787 | ||||||||||||
U.S. Treasury Notes | 1.125 | 08/31/28 | 225 | 225,633 | ||||||||||||
U.S. Treasury Notes | 1.125 | 02/15/31 | 303 | 298,976 | ||||||||||||
U.S. Treasury Notes | 1.250 | 08/15/31 | 406 | 403,906 | ||||||||||||
U.S. Treasury Notes | 1.625 | 05/15/31 | 275 | 283,508 | ||||||||||||
U.S. Treasury Notes | 2.250 | 11/15/25 | 40 | 42,656 | ||||||||||||
U.S. Treasury Strips Coupon | 2.511 | (s) | 08/15/44 | 305 | 190,887 | |||||||||||
U.S. Treasury Strips Coupon | 2.526 | (s) | 02/15/46 | 450 | 273,340 | |||||||||||
U.S. Treasury Strips Coupon | 2.545 | (s) | 11/15/45 | 305 | 186,908 | |||||||||||
|
| |||||||||||||||
TOTAL U.S. TREASURY OBLIGATIONS |
| 6,259,944 | ||||||||||||||
|
| |||||||||||||||
TOTAL LONG-TERM INVESTMENTS |
| 26,656,809 | ||||||||||||||
|
| |||||||||||||||
See Notes to Financial Statements.
| 98 |
| Description | Shares | Value | ||||||||||||
| SHORT-TERM INVESTMENT 21.5% | ||||||||||||||
| AFFILIATED MUTUAL FUND 21.5% | ||||||||||||||
PGIM Core Ultra Short Bond Fund | 5,752,344 | $ | 5,752,344 | |||||||||||
|
| |||||||||||||
TOTAL INVESTMENTS 120.9% |
| 32,409,153 | ||||||||||||
Liabilities in excess of other assets (20.9)% |
| (5,599,213 | ) | |||||||||||
|
| |||||||||||||
NET ASSETS 100.0% |
| $ | 26,809,940 | |||||||||||
|
| |||||||||||||
The following abbreviations are used in the annual report:
144A—Security was purchased pursuant to Rule 144A under the Securities Act of 1933 and may not be resold subject to that rule except to qualified institutional buyers.
BABs—Build America Bonds
CLO—Collateralized Loan Obligation
GMTN—Global Medium Term Note
LIBOR—London Interbank Offered Rate
MTN—Medium Term Note
SOFR—Secured Overnight Financing Rate Data
Strips—Separate Trading of Registered Interest and Principal of Securities
TBA—To Be Announced
| # | Principal or notional amount is shown in U.S. dollars unless otherwise stated. |
| (c) | Variable rate instrument. The interest rate shown reflects the rate in effect at August 31, 2021. |
| (cc) | Variable rate instrument. The rate shown is based on the latest available information as of August 31, 2021. Certain variable rate securities are not based on a published reference rate and spread but are determined by the issuer or agent and are based on current market conditions. These securities do not indicate a reference rate and spread in their description. |
| (k) | Represents security, or a portion thereof, segregated as collateral for centrally cleared/exchange-traded derivatives. |
| (s) | Represents zero coupon bond. Rate represents yield to maturity at purchase date. |
| (wa) | PGIM Investments LLC, the manager of the Fund, also serves as manager of the PGIM Core Ultra Short Bond Fund and the PGIM Institutional Money Market Fund, if applicable. |
See Notes to Financial Statements.
PGIM Fixed Income ETFs | 99 |
PGIM Active Aggregate Bond ETF
Schedule of Investments (continued)
as of August 31, 2021
Futures contracts outstanding at August 31, 2021:
| Number of contracts | Type | Expiration Date | Current Notional Amount | Value / Unrealized Appreciation (Depreciation) | ||||||||||||
| Long Positions: | ||||||||||||||||
| 14 | 2 Year U.S. Treasury Notes | Dec. 2021 | $ | 3,084,594 | $ | 2,133 | ||||||||||
| 26 | 5 Year U.S. Treasury Notes | Dec. 2021 | 3,216,688 | 8,031 | ||||||||||||
|
| |||||||||||||||
| 10,164 | ||||||||||||||||
|
| |||||||||||||||
| Short Positions: | ||||||||||||||||
| 12 | U.S. Long Bond | Dec. 2021 | 1,955,625 | 3,023 | ||||||||||||
| 7 | U.S. Ultra 10-Year Notes | Dec. 2021 | 1,036,109 | (648 | ) | |||||||||||
| 6 | U.S. Ultra Bond | Dec. 2021 | 1,183,688 | 4,547 | ||||||||||||
|
| |||||||||||||||
| 6,922 | ||||||||||||||||
|
| |||||||||||||||
| $ | 17,086 | |||||||||||||||
|
| |||||||||||||||
Summary of Collateral for Centrally Cleared/Exchange-traded Derivatives:
Cash and securities segregated as collateral to cover requirements for open centrally cleared/ exchange-traded derivatives are listed by broker as follows:
Broker | Cash and/or Foreign Currency | Securities Market Value | ||||||
J.P. Morgan Securities LLC | $ | — | $ | 210,941 | ||||
Fair Value Measurements:
Various inputs are used in determining the value of the Fund’s investments. These inputs are summarized in the three broad levels listed below.
Level 1—unadjusted quoted prices generally in active markets for identical securities.
Level 2—quoted prices for similar securities, interest rates and yield curves, prepayment speeds, foreign currency exchange rates and other observable inputs.
Level 3—unobservable inputs for securities valued in accordance with Board approved fair valuation procedures.
See Notes to Financial Statements.
| 100 |
The following is a summary of the inputs used as of August 31, 2021 in valuing such portfolio securities:
| Level 1 | Level 2 | Level 3 | ||||||||||
| Investments in Securities | ||||||||||||
| Assets | ||||||||||||
| Long-Term Investments | ||||||||||||
| Asset-Backed Securities | ||||||||||||
Collateralized Loan Obligations | $ | — | $ | 2,197,557 | $ | — | ||||||
Commercial Mortgage-Backed Securities | — | 2,977,237 | — | |||||||||
Corporate Bonds | — | 8,036,818 | — | |||||||||
Municipal Bonds | — | 133,800 | — | |||||||||
Sovereign Bonds | — | 432,228 | — | |||||||||
U.S. Government Agency Obligations | — | 6,619,225 | — | |||||||||
U.S. Treasury Obligations | — | 6,259,944 | — | |||||||||
| Short-Term Investments | ||||||||||||
Affiliated Mutual Fund | 5,752,344 | — | — | |||||||||
|
|
|
|
|
| |||||||
Total | $ | 5,752,344 | $ | 26,656,809 | $ | — | ||||||
|
|
|
|
|
| |||||||
| Other Financial Instruments* | ||||||||||||
| Assets | ||||||||||||
Futures Contracts | $ | 17,734 | $ | — | $ | — | ||||||
|
|
|
|
|
| |||||||
Total | $ | 17,734 | $ | — | $ | — | ||||||
|
|
|
|
|
| |||||||
| Liabilities | ||||||||||||
Futures Contracts | $ | (648 | ) | $ | — | $ | — | |||||
|
|
|
|
|
| |||||||
Total | $ | (648 | ) | $ | — | $ | — | |||||
|
|
|
|
|
| |||||||
| * | Other financial instruments are derivative instruments not reflected in the Schedule of Investments, such as futures, forwards and centrally cleared swap contracts, which are recorded at the unrealized appreciation (depreciation) on the instrument, and OTC swap contracts which are recorded at fair value. |
See Notes to Financial Statements.
PGIM Fixed Income ETFs | 101 |
PGIM Active Aggregate Bond ETF
Schedule of Investments (continued)
as of August 31, 2021
Industry Classification:
The industry classification of investments and liabilities in excess of other assets shown as a percentage of net assets as of August 31, 2021 were as follows (unaudited):
U.S. Government Agency Obligations | 24.7 | % | ||
U.S. Treasury Obligations | 23.3 | |||
Affiliated Mutual Fund | 21.5 | |||
Commercial Mortgage-Backed Securities | 11.1 | |||
Banks | 8.6 | |||
Collateralized Loan Obligations | 8.2 | |||
Electric | 2.5 | |||
Pharmaceuticals | 2.3 | |||
Pipelines | 1.9 | |||
Sovereign Bonds | 1.6 | |||
Oil & Gas | 1.4 | |||
Media | 1.3 | |||
Telecommunications | 1.3 | |||
Commercial Services | 1.0 | |||
Healthcare-Services | 1.0 | |||
Real Estate Investment Trusts (REITs) | 0.8 | |||
Engineering & Construction | 0.8 | |||
Aerospace & Defense | 0.7 | |||
Insurance | 0.6 | |||
Mining | 0.5 | |||
Building Materials | 0.5 | |||
Beverages | 0.5 | |||
Auto Manufacturers | 0.5 | |||
Municipal Bonds | 0.5 | |||
Chemicals | 0.4 | |||
Multi-National | 0.4 | |||
Semiconductors | 0.4 | |||
Retail | 0.3 | |||
Miscellaneous Manufacturer | 0.3 | |||
Agriculture | 0.3 | |||
Airlines | 0.2 | |||
Gas | 0.2 | |||
Software | 0.2 | |||
Machinery-Diversified | 0.2 | |||
Food | 0.2 | |||
Lodging | 0.2 | |||
Computers | 0.1 | |||
Diversified Financial Services | 0.1 | |||
Iron/Steel | 0.1 | |||
Biotechnology | 0.1 | |||
Machinery-Constructions & Mining | 0.1 | |||
Transportation | 0.0 | * | ||
Forest Products & Paper | 0.0 | * | ||
|
| |||
| 120.9 | ||||
Liabilities in excess of other assets | (20.9 | ) | ||
|
| |||
| 100.0 | % | |||
|
|
| * | Less than +/- 0.05%. |
Effects of Derivative Instruments on the Financial Statements and Primary Underlying Risk Exposure:
The Fund invested in derivative instruments during the reporting period. The primary type of risk associated with these derivative instruments is interest rate contracts risk. See the Notes to Financial Statements for additional detail regarding these derivative instruments and their risks. The effect of such derivative instruments on the Fund’s financial position and financial performance as reflected in the Statement of Assets and Liabilities and Statement of Operations is presented in the summary below.
See Notes to Financial Statements.
| 102 |
Fair values of derivative instruments as of August 31, 2021 as presented in the Statement of Assets and Liabilities:
Derivatives not accounted for as hedging instruments, carried at fair value | Asset Derivatives | Liability Derivatives | ||||||||||
Statement of Assets and | Fair Value | Statement of Assets and Liabilities Location | Fair Value | |||||||||
| Interest rate contracts | Due from/to broker— variation margin futures* | $ | 17,734 | Due from/to broker— variation margin futures* | $ | (648 | ) | |||||
|
|
|
| |||||||||
| $ | 17,734 | $ | (648 | ) | ||||||||
|
|
|
| |||||||||
| * | Includes cumulative appreciation (depreciation) as reported in the schedule of open futures and centrally cleared swap contracts. Only unsettled variation margin receivable (payable) is reported within the Statement of Assets and Liabilities. |
The effects of derivative instruments on the Statement of Operations for the period ended August 31, 2021 are as follows:
Amount of Realized Gain (Loss) on Derivatives Recognized in Income | ||||
Derivatives not accounted for as hedging | Futures | |||
Interest rate contracts | $ | (212,192 | ) | |
|
| |||
Change in Unrealized Appreciation (Depreciation) on Derivatives Recognized in Income | ||||
Derivatives not accounted for as hedging | Futures | |||
Interest rate contracts | $ | 17,086 | ||
|
| |||
For the period ended February 28, 2021 the Fund’s average volume of derivative activities is as follows:
| Futures Contracts—Long Positions(1) | Futures Contracts—Short Positions(1) | |||||
| $5,071,711 | $3,878,063 | |||||
| (1) | Notional Amount in USD. |
Average volume is based on average quarter end balances as noted for the period ended August 31, 2021.
See Notes to Financial Statements.
PGIM Fixed Income ETFs | 103 |
PGIM Active Aggregate Bond ETF
Statement of Assets & Liabilities
as of August 31, 2021
Assets | ||||
Investments at value: | ||||
Unaffiliated investments (cost $26,199,208) | $ | 26,656,809 | ||
Affiliated investments (cost $5,752,344) | 5,752,344 | |||
Cash | 1,680 | |||
Receivable for investments sold | 4,657,922 | |||
Interest and dividends receivable | 102,701 | |||
Due from broker—variation margin futures | 13,688 | |||
|
| |||
Total Assets | 37,185,144 | |||
|
| |||
| Liabilities | ||||
Payable for investments purchased | 10,370,403 | |||
Management fee payable | 4,801 | |||
|
| |||
Total Liabilities | 10,375,204 | |||
|
| |||
Net Assets | $ | 26,809,940 | ||
|
| |||
Net assets were comprised of: | ||||
Common stock, at par | $ | 525 | ||
Paid-in capital in excess of par | 26,220,628 | |||
Total distributable earnings (loss) | 588,787 | |||
|
| |||
Net assets, August 31, 2021 | $ | 26,809,940 | ||
|
| |||
Net asset value, offering price and redemption price per share, | $ | 51.07 | ||
|
| |||
See Notes to Financial Statements.
| 104 |
PGIM Active Aggregate Bond ETF
Statement of Operations
Period Ended August 31, 2021*
Net Investment Income (Loss) | ||||
Income | ||||
Interest income | $ | 154,983 | ||
Affiliated dividend income | 3,343 | |||
|
| |||
Total income | 158,326 | |||
|
| |||
Expenses | ||||
Management fee | 20,489 | |||
|
| |||
Total expenses | 20,489 | |||
|
| |||
Net investment income (loss) | 137,837 | |||
|
| |||
| Realized And Unrealized Gain (Loss) On Investments | ||||
Net realized gain (loss) on: | ||||
Investment transactions | 318,808 | |||
Futures transactions | (212,192 | ) | ||
|
| |||
| 106,616 | ||||
|
| |||
Net change in unrealized appreciation (depreciation) on: | ||||
Investments | 457,601 | |||
Futures | 17,086 | |||
|
| |||
| 474,687 | ||||
|
| |||
Net gain (loss) on investment transactions | 581,303 | |||
|
| |||
Net Increase (Decrease) In Net Assets Resulting From Operations | $ | 719,140 | ||
|
| |||
| * | For the period from April 12, 2021 (commencement of operations) through August 31, 2021. |
See Notes to Financial Statements.
PGIM Fixed Income ETFs | 105 |
PGIM Active Aggregate Bond ETF
Statement of Changes in Net Assets
Period Ended August 31, 2021* | ||||
Increase (Decrease) in Net Assets | ||||
Operations | ||||
Net investment income (loss) | $ | 137,837 | ||
Net realized gain (loss) on investments | 106,616 | |||
Net change in unrealized appreciation (depreciation) on investments | 474,687 | |||
|
| |||
Net increase (decrease) in net assets resulting from operations | 719,140 | |||
|
| |||
Dividends and Distributions | ||||
Distributions from distributable earnings | (130,353 | ) | ||
|
| |||
Fund share transactions | ||||
Net proceeds from shares sold | 31,322,713 | |||
Cost of shares purchased | (5,101,560 | ) | ||
|
| |||
Net increase (decrease) in net assets from Fund share transactions | 26,221,153 | |||
|
| |||
Total increase (decrease) | 26,809,940 | |||
| Net Assets: | ||||
Beginning of period | — | |||
|
| |||
End of period | $ | 26,809,940 | ||
|
| |||
| * | For the period from April 12, 2021 (commencement of operations) through August 31, 2021. |
See Notes to Financial Statements.
| 106 |
PGIM Active Aggregate Bond ETF
Financial Highlights
| April 12, 2021(e) through August 31, 2021 | ||||
| Per Share Operating Performance(a): | ||||
| Net Asset Value, Beginning of Period | $50.00 | |||
| Income (loss) from investment operations: | ||||
| Net investment income (loss) | 0.25 | |||
| Net realized and unrealized gain (loss) on investments | 1.05 | |||
| Total from investment operations | 1.30 | |||
| Less Dividends and Distributions: | ||||
| Dividends from net investment income | (0.23 | ) | ||
| Net asset value, end of period | $51.07 | |||
| Total Return(b): | 2.59% | |||
| Ratios/Supplemental Data: | ||||
| Net assets, end of period (000) | $26,810 | |||
| Average net assets (000) | $27,915 | |||
| Ratios to average net assets(c): | ||||
| Expenses after waivers and/or expense reimbursement | 0.19%(d) | |||
| Expenses before waivers and/or expense reimbursement | 0.19%(d) | |||
| Net investment income (loss) | 1.28%(d) | |||
| Portfolio turnover rate(f) | 337% | |||
| (a) | Calculated based on average shares outstanding during the period. |
| (b) | Total return is calculated assuming a purchase of a share on the first day and a sale on the last day of the period reported and includes reinvestment of dividends and distributions, if any. Total returns may reflect adjustments to conform to generally accepted accounting principles. Total returns for periods less than one full year are not annualized. |
| (c) | Does not include expenses of the underlying funds in which the Fund invests. |
| (d) | Annualized. |
| (e) | Commencement of operations. |
| (f) | The Fund’s portfolio turnover rate is calculated in accordance with regulatory requirements, without regard to transactions involving short-term investments and certain derivatives. If such transactions were included, the Fund’s portfolio turnover rate may be higher. |
See Notes to Financial Statements.
PGIM Fixed Income ETFs | 107 |
Notes to Financial Statements
1. Organization
PGIM ETF Trust (the “Trust”) is an open-end management investment company registered under the Investment Company Act of 1940, as amended (“1940 Act”). The Trust was organized as a Delaware statutory trust and currently consists of seven separate series: PGIM Ultra Short Bond ETF, PGIM Active High Yield Bond ETF, PGIM Active Aggregate Bond ETF, PGIM QMA Strategic Alpha Large-Cap Core ETF, PGIM QMA Strategic Alpha Small-Cap Growth ETF, PGIM QMA Strategic Alpha Small-Cap Value ETF and PGIM QMA Strategic Alpha International Equity ETF. Each series operates as an exchange-traded fund.
These financial statements relate only to the following Funds: PGIM Ultra Short Bond ETF, PGIM Active High Yield Bond ETF and PGIM Active Aggregate Bond ETF, which commenced investment operations on April 5, 2018, September 24, 2018 and April 12, 2021, respectively (each, a “Fund” and collectively, the “Funds”). The Funds are classified as diversified funds for purposes of the 1940 Act.
The investment objective of PGIM Ultra Short Bond ETF is to seek total return through a combination of current income and capital appreciation, consistent with preservation of capital. The investment objective of PGIM Active High Yield Bond ETF and PGIM Active Aggregate Bond ETF is to seek total return through a combination of current income and capital appreciation.
2. Accounting Policies
The Funds follow the investment company accounting and reporting guidance of the Financial Accounting Standards Board (“FASB”) Accounting Standard Codification (“ASC”) Topic 946 Financial Services—Investment Companies. The following is a summary of significant accounting policies followed by the Funds in the preparation of their financial statements. The policies conform to U.S. generally accepted accounting principles (“GAAP”). The Funds consistently follow such policies in the preparation of their financial statements.
Securities Valuation: The Funds hold securities and other assets and liabilities that are fair valued as of the close of each day (generally, 4:00 PM Eastern time) the New York Stock Exchange (“NYSE”) is open for trading. As described in further detail below, the Funds’ investments are valued daily based on a number of factors, including the type of investment and whether market quotations are readily available. The Trust’s Board of Trustees (the “Board”) has adopted valuation procedures for security valuation under which fair valuation responsibilities have been delegated to PGIM Investments LLC (“PGIM Investments” or the “Manager”). Pursuant to the Board’s delegation, the Manager has established a Valuation Committee responsible for supervising the fair valuation of portfolio securities and other assets and liabilities. The valuation procedures permit each Fund to
| 108 |
utilize independent pricing vendor services, quotations from market makers, and alternative valuation methods when market quotations are either not readily available or not deemed representative of fair value. Fair value is the price that would be received to sell an asset or paid to transfer a liability in an orderly transaction between market participants on the measurement date. A record of the Valuation Committee’s actions is subject to the Board’s review at its first quarterly meeting following the quarter in which such actions take place.
For the fiscal reporting year end, securities and other assets and liabilities were fair valued at the close of the last U.S. business day. Trading in certain foreign securities may occur when the NYSE is closed (including weekends and holidays). Because such foreign securities trade in markets that are open on weekends and U.S. holidays, the values of some of the Funds’ foreign investments may change on days when investors cannot purchase or redeem Fund shares.
Various inputs determine how the Funds’ investments are valued, all of which are categorized according to the three broad levels (Level 1, 2, or 3) detailed in the Schedule of Investments and referred to herein as the “fair value hierarchy” in accordance with FASB ASC Topic 820 - Fair Value Measurements and Disclosures.
Common or preferred stocks, exchange-traded funds and derivative instruments, if applicable, that are traded on a national securities exchange are valued at the last sale price as of the close of trading on the applicable exchange where the security principally trades. Securities traded via NASDAQ are valued at the NASDAQ official closing price. To the extent these securities are valued at the last sale price or NASDAQ official closing price, they are classified as Level 1 in the fair value hierarchy. In the event that no sale or official closing price on valuation date exists, these securities are generally valued at the mean between the last reported bid and ask prices, or at the last bid price in the absence of an ask price. These securities are classified as Level 2 in the fair value hierarchy.
Investments in open-end funds (other than exchange-traded funds) are valued at their net asset values as of the close of the NYSE on the date of valuation. These securities are classified as Level 1 in the fair value hierarchy since they may be purchased or sold at their net asset values on the date of valuation.
Fixed income securities traded in the OTC market are generally classified as Level 2 in the fair value hierarchy. Such fixed income securities are typically valued using the market approach which generally involves obtaining data from an approved independent third-party vendor source. The Fund utilizes the market approach as the primary method to value securities when market prices of identical or comparable instruments are available. The third-party vendors’ valuation techniques used to derive the evaluated bid price are based on evaluating observable inputs, including but not limited to, yield curves, yield spreads, credit ratings, deal terms, tranche level attributes, default rates, cash flows, prepayment speeds, broker/dealer quotations and reported trades. Certain Level 3 securities are also valued using the market approach when obtaining a single broker quote or when utilizing transaction prices for identical securities that have been used in excess of
PGIM Fixed Income ETFs | 109 |
Notes to Financial Statements (continued)
five business days. During the reporting period, there were no changes to report with respect to the valuation approach and/or valuation techniques discussed above.
Bank loans are generally valued at prices provided by approved independent pricing vendors. The pricing vendors utilize broker/dealer quotations and provide prices based on the average of such quotations. Bank loans valued using such vendor prices are generally classified as Level 2 in the fair value hierarchy. Bank loans valued based on a single broker quote or at the original transaction price in excess of five business days are classified as Level 3 in the fair value hierarchy.
OTC and centrally cleared derivative instruments are generally classified as Level 2 in the fair value hierarchy. Such derivative instruments are typically valued using the market approach and/or income approach which generally involves obtaining data from an approved independent third-party vendor source. The Funds utilize the market approach when quoted prices in broker-dealer markets are available but also includes consideration of alternative valuation approaches, including the income approach. In the absence of reliable market quotations, the income approach is typically utilized for purposes of valuing derivatives such as interest rate swaps based on a discounted cash flow analysis whereby the value of the instrument is equal to the present value of its future cash inflows or outflows. Such analysis includes projecting future cash flows and determining the discount rate (including the present value factors that affect the discount rate) used to discount the future cash flows. In addition, the third-party vendors’ valuation techniques used to derive the evaluated derivative price is based on evaluating observable inputs, including but not limited to, underlying asset prices, indices, spreads, interest rates and exchange rates. Certain derivatives may be classified as Level 3 when valued using the market approach by obtaining a single broker quote or when utilizing unobservable inputs in the income approach. During the reporting period, there were no changes to report with respect to the valuation approach and/or valuation techniques discussed above.
Centrally cleared swaps listed or traded on a multilateral or trade facility platform, such as a registered exchange, are generally valued at the daily settlement price determined by the respective exchange. These securities are classified as Level 2 in the fair value hierarchy, as the daily settlement price is not public.
Securities and other assets that cannot be priced according to the methods described above are valued based on pricing methodologies approved by the Board. In the event that unobservable inputs are used when determining such valuations, the securities will be classified as Level 3 in the fair value hierarchy. Altering one or more unobservable inputs may result in a significant change to a Level 3 security’s fair value measurement.
When determining the fair value of securities, some of the factors influencing the valuation include: the nature of any restrictions on disposition of the securities; assessment of the
| 110 |
general liquidity of the securities; the issuer’s financial condition and the markets in which it does business; the cost of the investment; the size of the holding and the capitalization of the issuer; the prices of any recent transactions or bids/offers for such securities or any comparable securities; any available analyst media or other reports or information deemed reliable by the Manager regarding the issuer or the markets or industry in which it operates. Using fair value to price securities may result in a value that is different from a security’s most recent closing price and from the price used by other unaffiliated mutual funds to calculate their net asset values.
Financial Futures Contracts: A financial futures contract is an agreement to purchase (long) or sell (short) an agreed amount of securities at a set price for delivery on a future date. Upon entering into a financial futures contract, the Fund is required to pledge to the broker an amount of cash and/or other assets equal to a certain percentage of the contract amount. This amount is known as the “initial margin”. Subsequent payments, known as “variation margin”, are made or received by the Fund each day, depending on the daily fluctuations in the value of the underlying security. Such variation margin is recorded for financial statement purposes on a daily basis as unrealized gain (loss). When the contract expires or is closed, the gain (loss) is realized and is presented in the Statement of Operations as net realized gain (loss) on futures transactions.
The Funds may invest in financial futures contracts in order to hedge their existing portfolio securities, or securities the Funds intend to purchase, against fluctuations in value caused by changes in prevailing interest rates. Should interest rates move unexpectedly, the Funds may not achieve the anticipated benefits of the financial futures contracts and may realize a loss. The use of futures transactions involves the risk of imperfect correlation in movements in the price of futures contracts, interest rates and the underlying hedged assets. Since futures contracts are exchange- traded, there is minimal counterparty credit risk to the Funds since the exchanges’ clearinghouse acts as counterparty to all exchange-traded futures and guarantees the futures contracts against default.
Bank Loans: The Funds may invest in bank loans. Bank loans include fixed and floating rate loans that are privately negotiated between a corporate borrower and one or more financial institutions, including, but not limited to, term loans, revolvers, and other instruments issued in the bank loan market. The Fund acquire interests in loans directly (by way of assignment from the selling institution) and/or indirectly (by way of the purchase of a participation interest from the selling institution). Under a bank loan assignment, the Fund generally will succeed to all the rights and obligations of an assigning lending institution and becomes a lender under the loan agreement with the relevant borrower in connection with that loan. Under a bank loan participation, the Fund generally will have a contractual relationship only with the lender, not with the relevant borrower. As a result, the Fund generally will have the right to receive payments of principal, interest, and any fees to which it is entitled only from the lender selling the participation and only upon receipt by the lender of the payments from the relevant borrower. The Fund may not directly benefit from the collateral supporting the debt obligation in which it has purchased the participation. As a result, the Fund will assume the credit risk of both the borrower and the institution selling the participation to the Fund.
PGIM Fixed Income ETFs | 111 |
Notes to Financial Statements (continued)
Swap Agreements: The Funds may enter into certain types of swap agreements detailed in the disclosures below. A swap agreement is an agreement to exchange the return generated by one instrument for the return generated by another instrument. Swap agreements are negotiated in the OTC market and may be executed either directly with a counterparty (“OTC-traded”) or through a central clearing facility, such as a registered exchange. Swap agreements are valued daily at current market value and any change in value is included in the net unrealized appreciation (depreciation) on swap agreements. Centrally cleared swaps pay or receive an amount known as “variation margin”, based on daily changes in the valuation of the swap contract. Any upfront premiums paid and received are shown as swap premiums paid and swap premiums received in the Statement of Assets and Liabilities. Risk of loss may exceed amounts recognized on the Statement of Assets and Liabilities. Swap agreements outstanding at period end, if any, are listed on the Schedule of Investments. The cash amounts pledged for swaps contracts are considered restricted cash and are included in “Due from broker-variation margin swaps” and “Deposit with broker for centrally cleared/exchange-traded derivatives” in the Statement of Assets and Liabilities.
Interest Rate Swaps: Interest rate swaps represent an agreement between counterparties to exchange cash flows based on the difference between two interest rates, applied to a notional principal amount for a specified period. The Funds are subject to interest rate risk in the normal course of pursuing their investment objective. The Funds may use interest rate swaps to maintain their ability to generate steady cash flow by receiving a stream of fixed-rate payments and to increase exposure to prevailing market rates by receiving floating rate payments. The Funds’ maximum risk of loss from counterparty credit risk is the discounted net present value of the cash flows to be received from the counterparty over the contract’s remaining life.
Credit Default Swaps (“CDS”): CDS involve one party (the protection buyer) making a stream of payments to another party (the protection seller) in exchange for the right to receive a specified payment in the event of a default or as a result of a default (collectively a “credit event”) for the referenced entity (typically corporate issues or sovereign issues of an emerging country) on its obligation; or in the event of a write-down, principal shortfall, interest shortfall or default of all or part of the referenced entities comprising a credit index.
The Funds are subject to credit risk in the normal course of pursuing its investment objectives, and as such, has entered into CDS contracts to provide a measure of protection against defaults or to take an active long or short position with respect to the likelihood of a particular issuer’s default or the reference entity’s credit soundness. CDS contracts generally trade based on a spread which represents the cost a protection buyer has to pay the protection seller. The protection buyer is said to be short the credit as the value of the contract rises the more the credit deteriorates. The value of the CDS contract increases for
| 112 |
the protection buyer if the spread increases. The Funds’ maximum risk of loss from counterparty credit risk for purchased CDS is the inability of the counterparty to honor the contract up to the notional value due to a credit event.
As a seller of protection on credit default swap agreements, the Fund generally receive an agreed upon payment from the buyer of protection throughout the term of the swap, provided no credit event occurs. As the seller, the Funds effectively increase their investment risk because, in addition to its total net assets, the Funds may be subject to investment exposure on the notional amount of the swap.
The maximum amount of the payment that the Fund, as a seller of protection, could be required to make under a credit default swap agreement would be equal to the notional amount of the underlying security or index contract as a result of a credit event. This potential amount will be partially offset by any recovery values of the respective referenced obligations, or net amounts received from the settlement of buy protection credit default swap agreements which the Fund entered into for the same referenced entity or index. As a buyer of protection, the Fund generally receive an amount up to the notional value of the swap if a credit event occurs.
Implied credit spreads, represented in absolute terms, utilized in determining the market value of credit default swap agreements where the Fund is the seller of protection as of period end are disclosed in the footnotes to the Schedule of Investments, if applicable. These spreads serve as indicators of the current status of the payment/performance risk and represent the likelihood of default risk for the credit derivative. The implied credit spread of a particular referenced entity reflects the cost of buying/selling protection and may include upfront payments required to enter into the agreement. Wider credit spreads and increased market value in absolute terms, when compared to the notional amount of the swap, represent a deterioration of the referenced entity’s credit soundness and a greater likelihood of risk of default or other credit event occurring as defined under the terms of the agreement.
Payment-In-Kind: The Funds may invest in the open market or receive pursuant to debt restructuring, securities that pay-in-kind (PIK) the interest due on such debt instruments. The PIK interest, computed at the contractual rate specified, is added to the existing principal balance of the debt when issued bonds have same terms as the bond or recorded as a separate bond when terms are different from the existing debt, and is recorded as interest income.
Master Netting Arrangements: The Trust, on behalf of the Funds, is subject to various Master Agreements, or netting arrangements, with select counterparties. These are agreements which a subadviser may have negotiated and entered into on behalf of all or a portion of the Fund. A master netting arrangement between a Fund and the counterparty permits the Fund to offset amounts payable by the Fund to the same counterparty against amounts to be received; and by the receipt of collateral from the counterparty by the Fund to cover the Fund’s exposure to the counterparty. However, there is no assurance that such mitigating factors are easily enforceable. In addition to master netting arrangements, the
PGIM Fixed Income ETFs | 113 |
Notes to Financial Statements (continued)
right to set-off exists when all the conditions are met such that each of the parties owes the other determinable amounts, the reporting party has the right to set-off the amount owed with the amount owed by the other party, the reporting party intends to set-off and the right of set-off is enforceable by law.
Equity and Mortgage Real Estate Investment Trusts (collectively REITs): The Funds invested in REITs, which report information on the source of their distributions annually. Based on current and historical information, a portion of distributions received from REITs during the period is estimated to be dividend income, capital gain or return of capital and recorded accordingly. When material, these estimates are adjusted periodically when the actual source of distributions is disclosed by the REITs.
Securities Lending: The Funds lend their portfolio securities to banks and broker-dealers. The loans are secured by collateral at least equal to the market value of the securities loaned. Collateral pledged by each borrower is invested in an affiliated money market fund and is marked to market daily, based on the previous day’s market value, such that the value of the collateral exceeds the value of the loaned securities. In the event of significant appreciation in value of securities on loan on the last business day of the reporting period, the financial statements may reflect a collateral value that is less than the market value of the loaned securities. Such shortfall is remedied as described above. Loans are subject to termination at the option of the borrower or the Fund. Upon termination of the loan, the borrower will return to the Fund securities identical to the loaned securities. The remaining maturities of the securities lending transactions are considered overnight and continuous. Should the borrower of the securities fail financially, the Fund has the right to repurchase the securities in the open market using the collateral. The Funds recognize income, net of any rebate and securities lending agent fees, for lending their securities in the form of fees or interest on the investment of any cash received as collateral. The borrower receives all interest and dividends from the securities loaned and such payments are passed back to the lender in amounts equivalent thereto, which are reflected in interest income or unaffiliated dividend income based upon the nature of the payment on the Statement of Operations. The Funds also continue to recognize any unrealized gain (loss) in the market price of the securities loaned and on the change in the value of the collateral invested that may occur during the term of the loan. In addition, realized gain (loss) is recognized on changes in the value of the collateral invested upon liquidation of the collateral. Net earnings from securities lending are disclosed in the Statement of Operations.
Securities Transactions and Net Investment Income: Securities transactions are recorded on the trade date. Realized gains (losses) from investment and currency transactions are calculated on the specific identification method. Dividend income is recorded on the ex-date, or for certain foreign securities, when a Fund becomes aware of such dividends. Interest income, including amortization of premium and accretion of discount on debt
| 114 |
securities, as required, is recorded on the accrual basis. Expenses are recorded on an accrual basis, which may require the use of certain estimates by management that may differ from actual.
Taxes: It is the Funds’ policy to continue to meet the requirements of the Internal Revenue Code applicable to regulated investment companies and to distribute all of their taxable net investment income and capital gains, if any, to its shareholders. Therefore, no federal income tax provision is required. Withholding taxes on foreign dividends, interest and capital gains, if any, are recorded, net of reclaimable amounts, at the time the related income is earned.
Dividends and Distributions: The Funds expect to pay dividends from net investment income monthly and distributions from net realized capital and currency gains, if any, annually. Dividends and distributions to shareholders, which are determined in accordance with federal income tax regulations and which may differ from generally accepted accounting principles, are recorded on the ex-date. Permanent GAAP/tax differences relating to income and gain (loss) are reclassified between total distributable earnings (loss) and paid-in capital in excess of par, as appropriate.
Estimates: The preparation of financial statements requires management to make estimates and assumptions that affect the reported amounts and disclosures in the financial statements. Actual results could differ from those estimates.
3. Agreements
Pursuant to a management agreement with the Trust on behalf of the Funds (the Management Agreement), PGIM Investments manages each Fund’s investment operations and administers its business affairs. PGIM Investments is also responsible for supervising each Fund’s subadviser.
Pursuant to the management agreement relating to each Fund, there is a unitary fee structure for the funds whereby PGIM Investments is responsible for substantially all expenses of each Fund, except taxes, brokerage expenses, interest expenses, distribution fees or expenses, expenses incident to shareholder meetings and extraordinary expenses. Each Fund may also pay for any costs or expenses of investing in other funds. For more information on the unitary management fee structure please refer to the Funds’ Statement of Additional Information.
The unitary fee paid to the Manager is accrued daily and payable monthly, at an annual rate of each Fund’s average daily net assets specified below. The Manager has contractually agreed, beginning from each Fund’s inception date, to waive any management fees it receives from the Funds in an amount equal to the subadvisory fees paid by the Funds to the PGIM Institutional Money Market Fund due to the Funds’ investment of its excess overnight cash in the PGIM Institutional Money Market Fund. This
PGIM Fixed Income ETFs | 115 |
Notes to Financial Statements (continued)
waiver will remain in effect for as long as the Funds remain invested or intend to invest in the PGIM Institutional Money Market Fund.
Fund | Unitary fee rate | |||
PGIM Ultra Short Bond ETF | 0.15 | % | ||
PGIM Active High Yield Bond ETF | 0.53 | % | ||
PGIM Active Aggregate Bond ETF | 0.19 | % | ||
The Manager has entered into a subadvisory agreement (Subadvisory Agreement) with PGIM, Inc., which provides subadvisory services to the Funds through its business unit PGIM Fixed Income (and, for the PGIM Ultra Short Bond ETF, PGIM Limited) (collectively, the “subadviser”). The Manager pays for the services of the subadviser.
Brown Brothers Harriman & Co. (“BBH”) serves as the Custodian, Transfer Agent, Administrative Agent and Securities Lending Agent for the Trust. The Manager is responsible for compensating BBH under the Custodian and Administrative and Transfer Agency Agreements. As securities lending agent, BBH is responsible for marketing to approved borrowers available securities from the Funds’ portfolio. BBH receives as compensation for its services a portion of the amount earned by the Funds for lending securities.
In September 2021, BBH entered into an agreement with State Street Corporation (“State Street”) under which State Street will acquire BBH’s Investor Services business, which includes its custody, fund accounting and administration, transfer agency, depositary services, foreign exchange and securities lending services. The transaction is expected to be completed by the end of 2021, subject to customary closing conditions and regulatory approvals.
Prudential Investment Management Services LLC (“PIMS” or the “Distributor”), acts as the distributor of each Fund, pursuant to the terms of a distribution agreement (“Distribution Agreement”) between the Trust and the Distributor. The Distributor is a subsidiary of Prudential. Shares are continuously offered for sale by the Distributor only. Although the Distributor does not receive any fees under the Distribution Agreement, the Manager or its affiliates may pay the Distributor for certain distribution related services.
PGIM Investments, PGIM, Inc., PGIM Limited and PIMS are indirect, wholly-owned subsidiaries of Prudential Financial, Inc. (“Prudential”).
4. Other Transactions with Affiliates
Each Fund may invest its overnight sweep cash in the PGIM Core Ultra Short Bond Fund (the “Core Fund”), and its securities lending cash collateral in the PGIM Institutional Money Market Fund (the “Money Market Fund”), each a series of Prudential Investment Portfolios 2, registered under the 1940 Act and managed by PGIM Investments. PGIM Investments and/or its affiliates are paid fees or reimbursed for providing their services to the Core Fund. In addition to the realized and unrealized gains on investments in the Core Fund and Money Market Fund,
| 116 |
earnings from such investments are disclosed on the Statement of Operations as “Affiliated dividend income” and “Income from securities lending, net”, respectively.
The Funds may enter into certain securities purchase or sale transactions under Board approved Rule 17a-7 procedures. Rule 17a-7 is an exemptive rule under the 1940 Act, that subject to certain conditions, permits purchase and sale transactions among affiliated investment companies, or between an investment company and a person that is affiliated solely by reason of having a common (or affiliated) investment adviser, common directors, and/or common officers. For the period ended August 31, 2021, no 17a- 7 transactions were entered into by the Funds.
5. Portfolio Securities
The aggregate cost of purchases and proceeds from sales of portfolio securities (excluding short- term investments and U.S. Government securities) for the reporting year ended August 31, 2021, were as follows:
Fund | Cost of Purchases | Proceeds from Sales | ||||||
PGIM Ultra Short Bond ETF | $ | 1,063,360,279 | $ | 108,799,557 | ||||
PGIM Active High Yield Bond ETF | $ | 97,729,282 | $ | 46,770,869 | ||||
PGIM Active Aggregate Bond ETF | $ | 15,999,219 | $ | 2,294,463 | ||||
A summary of the cost of purchases and proceeds from sales of shares of affiliated mutual funds for the reporting year ended August 31, 2021, is presented as follows:
PGIM Ultra Short Bond ETF
Value, Beginning | Cost of Purchases | Proceeds from Sales | Change in Unrealized Gain (Loss) | Realized Gain (Loss) | Value, End of Period | Shares, End of Period | Income | |||||||||||||||||||||
| Short-Term Investments – Affiliated Mutual Funds: | ||||||||||||||||||||||||||||
| PGIM Core Ultra Short Bond Fund(1)(b)(wa) | ||||||||||||||||||||||||||||
| $91,427,244 | $ | 978,007,394 | $ | 923,710,000 | $ | — | $ | — | $ | 145,724,638 | 145,724,638 | $ | 93,169 | |||||||||||||||
| PGIM Institutional Money Market Fund(1)(b)(wa) | ||||||||||||||||||||||||||||
| — | 5,603,895 | 3,274,427 | (600) | (897) | 2,327,971 | 2,329,368 | 4,835(2) | |||||||||||||||||||||
|
|
|
|
|
|
|
|
|
|
|
|
|
|
| ||||||||||||||
| $91,427,244 | $ | 983,611,289 | $ | 926,984,427 | $ | (600) | $ | (897) | $ | 148,052,609 | 148,054,006 | $ | 98,004 | |||||||||||||||
|
|
|
|
|
|
|
|
|
|
|
|
|
|
| ||||||||||||||
PGIM Active High Yield Bond ETF
Value, Beginning | Cost of Purchases | Proceeds from Sales | Change in Unrealized Gain (Loss) | Realized Gain (Loss) | Value, End of Period | Shares, End of Period | Income | |||||||||||||||||||||
| Short-Term Investments – Affiliated Mutual Funds: | ||||||||||||||||||||||||||||
| PGIM Core Ultra Short Bond Fund(1)(b)(wa) | ||||||||||||||||||||||||||||
| $291,324 | $ | 65,143,703 | $ | 62,246,323 | $ | — | $ | — | $ | 3,188,704 | 3,188,704 | $ | 2,712 | |||||||||||||||
| PGIM Institutional Money Market Fund(1)(b)(wa) | ||||||||||||||||||||||||||||
| — | 7,537,675 | 7,129,309 | — | (346) | 408,020 | 408,265 | 1,073(2) | |||||||||||||||||||||
|
|
|
|
|
|
|
|
|
|
|
|
|
|
| ||||||||||||||
| $291,324 | $ | 72,681,378 | $ | 69,375,632 | $ | — | $ | (346) | $ | 3,596,724 | 3,596,969 | $ | 3,785 | |||||||||||||||
|
|
|
|
|
|
|
|
|
|
|
|
|
|
| ||||||||||||||
PGIM Fixed Income ETFs | 117 |
Notes to Financial Statements (continued)
PGIM Active Aggregate Bond ETF
Value, Beginning | Cost of Purchases | Proceeds from Sales | Change in Unrealized Gain (Loss) | Realized Gain (Loss) | Value, End of Period | Shares, End of Period | Income | |||||||
| Short-Term Investments – Affiliated Mutual Funds: | ||||||||||||||
| PGIM Core Ultra Short Bond Fund(1)(b)(wa) | ||||||||||||||
| $ — | $34,823,344 | $29,071,000 | $ — | $ — | $5,752,344 | 5,752,344 | $3,343 | |||||||
| (1) | The Fund did not have any capital gain distributions during the reporting period. |
| (2) | The amount, or a portion thereof, represents the affiliated securities lending income shown on the Statement of Operations. |
| (wa) | PGIM Investments LLC, the manager of the Fund, also serves as manager of the PGIM Core Ultra Short Bond Fund and PGIM Institutional Money Market Fund, if applicable. |
| (b) | Represents security purchased with cash collateral received for securities on loan and includes dividend reinvestment. |
| 6. | Distributions and Tax Information |
Distributions to shareholders, which are determined in accordance with federal income tax regulations and which may differ from GAAP, are recorded on the ex-date.
For the year ended August 31, 2021, the tax character of dividends paid as reflected in the Statement of Changes in Net Assets were as follows:
| Ordinary Income | Long-Term Capital Gains | |||||||
PGIM Ultra Short Bond ETF | $ | 18,216,405 | $ | — | ||||
PGIM Active High Yield Bond ETF | 3,547,447 | 112,691 | ||||||
PGIM Active Aggregate Bond ETF | 130,353 | — | ||||||
For the year ended August 31, 2020, the tax character of dividends paid as reflected in the Statement of Changes in Net Assets were as follows:
| Ordinary Income | Long-Term Capital Gains | |||||||
PGIM Ultra Short Bond ETF | $ | 19,849,756 | $ | — | ||||
PGIM Active High Yield Bond ETF | 2,104,785 | 72,870 | ||||||
For the year ended August 31, 2021, the Funds had the following amounts of accumulated undistributed earnings on a tax basis:
| Undistributed Ordinary Income | Undistributed Long-Term Capital Gains | |||||||
PGIM Ultra Short Bond ETF | $ | 1,874,506 | $ | — | ||||
PGIM Active High Yield Bond ETF | 882,516 | 137,306 | ||||||
PGIM Active Aggregate Bond ETF | 328,995 | — | ||||||
| 118 |
The United States federal income tax basis of the Funds’ investments and the net unrealized appreciation (depreciation) as of August 31, 2021 were as follows:
| Tax Basis | Gross Unrealized Appreciation | Gross Unrealized Depreciation | Net Unrealized Appreciation (Depreciation) | |||||||||||||
PGIM Ultra Short Bond ETF | $1,901,599,636 | $9,274,224 | $(12,420,230) | $(3,146,006) | ||||||||||||
PGIM Active High Yield Bond ETF | 84,936,157 | 2,922,247 | (1,508,748) | 1,413,499 | ||||||||||||
PGIM Active Aggregate Bond ETF | 31,988,367 | 457,518 | (36,732) | 420,786 | ||||||||||||
The difference between book and tax basis were primarily attributable to deferred losses on wash sales, swaps, straddle loss deferral, differences in the treatment of premium amortization for book and tax purposes and other cost basis adjustments.
For federal income tax purposes, the PGIM Ultra Short Bond ETF had a capital loss carryforward as of August 31, 2021 of approximately $11,217,000 which can be carried forward for an unlimited period. No capital gains distributions are expected to be paid to shareholders until net gains have been realized in excess of such losses.
The Manager has analyzed the Funds’ tax positions taken on federal, state and local income tax returns for all open tax years and has concluded that no provision for income tax is required in the Funds’ financial statements for the current reporting period. Since tax authorities can examine previously filed tax returns, each Fund’s U.S. federal and state tax returns for tax years for which the applicable statutes of limitations have not expired are subject to such review.
7. Capital and Ownership
Each Fund is an exchange-traded fund, commonly known as an “ETF”. Individual shares of the Funds may only be purchased and sold in secondary market transactions through brokers or other financial intermediaries. Shares of the Funds are listed for trading on the NYSE Arca, Inc. (the “Exchange”), and because the shares of the Funds trade at market prices rather than NAV, shares of the Funds may trade at a price greater than NAV (a premium) or less than NAV (a discount). Each Fund will issue and redeem its shares at NAV only in aggregations of a specified number of shares called a “Creation Unit”. An Authorized Participant is a member or participant of a clearing agency registered with the SEC, which has a written agreement with the Funds or one of their service providers that allows the Authorized Participant to place orders for the purchase and redemption of Creation Units.
A creation transaction, which is subject to acceptance by the Distributor and each Fund, generally takes place when an Authorized Participant deposits into each Fund a designated portfolio of securities, assets or other positions (a “creation basket”, and an amount of cash (including any cash representing the value of substituted securities, assets or other positions), if any, which together approximate the holdings of each Fund in exchange for a specified number of Creation Units. Similarly, shares can be redeemed only in Creation Units, generally for a designated portfolio of securities, assets or other propositions (the
PGIM Fixed Income ETFs | 119 |
Notes to Financial Statements (continued)
“redemption basket”) held by each Fund and an amount of cash (including any portion of such securities for which cash may be substituted). The Funds may, in certain circumstances, offer Creation Units partially or solely for cash. Except when aggregated in Creation Units, shares are not redeemable by the Funds. Creation and redemption baskets may differ and the Funds may accept “custom baskets”.
A Creation Unit consists of 25,000 shares of each Fund. Authorized Participants generally are required to pay a fixed creation transaction fee and/or a fixed redemption transaction fee, as applicable, for each transaction in a Creation Unit regardless of the number of Creation Units created or redeemed on that day. From time to time, the Funds may waive all or a portion of their applicable transaction fee(s). An additional charge or a variable charge may be applied to certain creation and redemption transactions, including non-standard orders and whole or partial cash purchases or redemptions when deemed appropriate. For the reporting period ended August 31, 2021, the following fixed transaction fees were waived by the Funds which PGIM Investments paid on behalf of the Authorized Participants:
| Amount | ||||
PGIM Ultra Short Bond ETF | $ | 37,500 | ||
PGIM Active High Yield Bond ETF | 8,250 | |||
PGIM Active Aggregate Bond ETF | 500 | |||
The Trust is authorized to issue an unlimited number of shares of beneficial interest, $0.001 par value per share.
As of August 31, 2021, Prudential, through its affiliated entities, including affiliated funds (if applicable), owned shares of the Funds as follows:
Fund | Number of Shares | Percentage of Outstanding Shares | ||
| PGIM Ultra Short Bond ETF | 2,799,808 | 7.4% | ||
| PGIM Active High Yield Bond ETF | 625,000 | 29.8% | ||
| PGIM Active Aggregate Bond ETF | 490,000 | 93.3% |
At the reporting period end, the number of shareholders holding greater than 5% of the Funds are as follows:
| Affiliated | Unaffiliated | |||||||
Fund | Number of Shareholders | Percentage of Outstanding Shares | Number of Shareholders | Percentage of Outstanding Shares | ||||
PGIM Ultra Short Bond ETF | 1 | 6.6% | 8 | 76.7% | ||||
PGIM Active High Yield Bond ETF | 1 | 27.4% | 4 | 56.0% | ||||
PGIM Active Aggregate Bond ETF | 2 | 93.3% | 0 | 0.0% | ||||
| 120 |
Transactions in shares of beneficial interest were as follows:
PGIM Ultra Short Bond ETF
Reporting period ended August 31, 2021:
| Shares | Amount | |||||||
Shares sold | 18,775,000 | $ | 934,975,118 | |||||
Shares purchased | (1,850,000 | ) | (92,197,152 | ) | ||||
|
|
|
| |||||
Net increase (decrease) in shares outstanding | 16,925,000 | $ | 842,777,966 | |||||
|
|
|
| |||||
Reporting period ended August 31, 2020:
| Shares | Amount | |||||||
Shares sold | 18,025,000 | $ | 901,617,907 | |||||
Shares purchased | (8,425,000 | ) | (417,220,526 | ) | ||||
|
|
|
| |||||
Net increase (decrease) in shares outstanding | 9,600,000 | $ | 484,397,381 | |||||
|
|
|
| |||||
PGIM Active High Yield Bond ETF
Reporting period ended August 31, 2021:
| Shares | Amount | |||||||
Shares sold | 1,825,000 | $ | 74,395,702 | |||||
Shares purchased | (600,000 | ) | (24,576,005 | ) | ||||
|
|
|
| |||||
Net increase (decrease) in shares outstanding | 1,225,000 | $ | 49,819,697 | |||||
|
|
|
| |||||
Reporting period ended August 31, 2020:
| Shares | Amount | |||||||
Shares sold | 200,000 | $ | 7,569,903 | |||||
|
|
|
| |||||
Net increase (decrease) in shares outstanding | 200,000 | $ | 7,569,903 | |||||
|
|
|
| |||||
PGIM Active Aggregate Bond ETF
Reporting period ended August 31, 2021:
| Shares | Amount | |||||||
Shares sold | 625,000 | $ | 31,322,713 | |||||
Shares purchased | (100,000 | ) | (5,101,560 | ) | ||||
|
|
|
| |||||
Net increase (decrease) in shares outstanding | 525,000 | $ | 26,221,153 | |||||
|
|
|
| |||||
8. Borrowings
The Trust, on behalf of the Funds, along with other affiliated registered investment companies (the “Participating Funds”), is a party to a Syndicated Credit Agreement
PGIM Fixed Income ETFs | 121 |
Notes to Financial Statements (continued)
(“SCA”) with a group of banks. The purpose of the SCA is to provide an alternative source of temporary funding for capital share redemptions. The table below provides details of the current SCA in effect at the reporting period-end as well as the prior SCA.
Current SCA** | Prior SCA** | |||
Term of Commitment | 10/2/2020 – 9/30/2021 | 10/3/2019 – 10/1/2020 | ||
Total Commitment | $1,200,000,000 | $1,222,500,000* | ||
Annualized Commitment Fee on the Unused Portion of the SCA | 0.15% | 0.15% | ||
Annualized Interest Rate on Borrowings | 1.30% plus the higher of (1) the effective federal funds rate, (2) the one-month LIBOR rate or (3) zero percent | 1.20% plus the higher of (1) the effective federal funds rate, (2) the one-month LIBOR rate or (3) zero percent | ||
| * | Effective March 31, 2020, the SCA’s total commitment was increased from $900,000,000 to $1,162,500,000 and subsequently, effective April 7, 2020 was increased to $1,222,500,000. |
| ** | The SCA does not include PGIM Active Aggregate Bond ETF. |
Subsequent to the reporting period end, the SCA has been renewed and effective October 1, 2021 will provide a commitment of $1,200,000,000 through September 29, 2022 and includes PGIM Active Aggregate Bond ETF. The commitment fee paid by the Participating Funds will continue to be .15% of the unused portion of the SCA. The interest on borrowings under the renewed SCA will be paid monthly and at a per annum interest rate of 1.20% plus the higher of (1) the effective federal funds rate, (2) the one-month LIBOR rate or (3) zero percent.
Certain affiliated registered investment companies that are parties to the SCA include portfolios that are subject to a predetermined mathematical formula used to manage certain benefit guarantees offered under variable annuity contracts. The formula may result in large scale asset flows into and out of these portfolios. Consequently, these portfolios may be more likely to utilize the SCA for purposes of funding redemptions. It may be possible for those portfolios to fully exhaust the committed amount of the SCA, thereby requiring the Manager to allocate available funding per a Board-approved methodology designed to treat the Participating Funds in the SCA equitably.
The Funds did not utilize the SCA during the reporting period ended August 31, 2021.
9. Risks of Investing in the Funds
The Funds’ risks include, but are not limited to, some or all of the risks discussed below. For further information on each Fund’s risks, please refer to the Funds’ Prospectus and Statement of Additional Information.
| 122 |
Active Trading Risk. High portfolio turnover caused by a Fund actively and frequently trading its portfolio securities results in higher transaction costs, which can affect the Fund’s performance and have adverse tax consequences. In addition, high portfolio turnover may also mean that a proportionately greater amount of distributions to shareholders will be taxed as ordinary income rather than long- term capital gains compared to investment companies with lower portfolio turnover.
Authorized Participant Concentration Risk: Only an Authorized Participant may engage in creation or redemption transactions directly with the Funds. The Funds have a limited number of intermediaries that act as Authorized Participants and none of these Authorized Participants is or will be obligated to engage in creation or redemption transactions. To the extent that these intermediaries exit the business or are unable to or choose not to proceed with creation and/ or redemption orders with respect to the Funds and no other Authorized Participant creates or redeems, shares of the Funds may trade at a substantial discount or premium to NAV, may trade at larger spreads and possibly face trading halts and/or delisting.
Bank Loan Risk. A Fund’s ability to receive payments of principal and interest and other amounts in connection with loans (whether through participations, assignments or otherwise) will depend primarily on the financial condition of the borrower. The failure by a Fund to receive scheduled interest or principal payments on a loan because of a default, bankruptcy or any other reason would adversely affect the income of that Fund and would likely reduce the value of its assets. Even with loans secured by collateral, there is the risk that the value of the collateral may decline, may be insufficient to meet the obligations of the borrower, or be difficult to liquidate. In the event of a default, a Fund may have difficulty collecting on any collateral and would not have the ability to collect on any collateral for an uncollateralized loan. Further, that Fund’s access to collateral, if any, may be limited by bankruptcy laws. Due to the nature of the private syndication of senior loans, including, for example, lack of publicly-available information, some senior loans are not as easily purchased or sold as publicly-traded securities. In addition, loan participations generally are subject to restrictions on transfer, and only limited opportunities may exist to sell loan participations in secondary markets. As a result, it may be difficult for a Fund to value loans or sell loans at an acceptable price when it wants to sell them. Loans trade in an over-the-counter market, and confirmation and settlement, which are effected through standardized procedures and documentation, may take significantly longer than seven days to complete. Extended trade settlement periods may, in unusual market conditions with a high volume of shareholder redemptions, present a risk to shareholders regarding that Fund’s ability to pay redemption proceeds in a timely manner. In some instances, loans and loan participations are not rated by independent credit rating agencies; in such instances, a decision by a Fund to invest in a particular loan or loan participation could depend exclusively on the subadviser’s credit analysis of the borrower, or in the case of a loan participation, of the intermediary holding the portion of the loan that the Fund has purchased. To the extent a Fund invests in loans of non-US issuers, the risks of investing in non-US issuers are applicable. Loans may not be considered to be “securities” and as a result may not benefit from the protections of the federal securities laws, including anti-fraud protections and those with respect to the use of material non-public information, so
PGIM Fixed Income ETFs | 123 |
Notes to Financial Statements (continued)
that purchasers, such as the Fund, may not have the benefit of these protections. If a Fund is in possession of material non-public information about a borrower as a result of its investment in such borrower’s loan, that Fund may not be able to enter into a transaction with respect to a publicly-traded security of the borrower when it would otherwise be advantageous to do so.
Bond Obligations Risk: As with credit risk, market risk and interest rate risk, the Funds’ holdings, share price, yield and total return may fluctuate in response to bond market movements. The value of bonds may decline for issuer-related reasons, including management performance, financial leverage and reduced demand for the issuer’s goods and services. Certain types of fixed-income obligations also may be subject to “call and redemption risk”, which is the risk that the issuer may call a bond held by the Funds for redemption before it matures and the Funds may lose income.
Cash Transactions Risk. Unlike certain ETFs, each Fund may effect creations and redemptions in cash or partially in cash. Therefore, it may be required to sell portfolio securities and subsequently recognize gains on such sales that the Fund might not have recognized if it were to distribute portfolio securities in-kind. As such, investments in shares of each Fund may be less tax-efficient than an investment in an ETF that distributes portfolio securities entirely in-kind.
Credit Risk: This is the risk that the issuer, the guarantor or the insurer of a fixed income security, or the counterparty to a contract, may be unable or unwilling to make timely principal and interest payments, or to otherwise honor its obligations. Additionally, fixed income securities could lose value due to a loss of confidence in the ability of the issuer, guarantor, insurer or counterparty to pay back debt. The longer the maturity and the lower the credit quality of a bond, the more sensitive it is to credit risk.
Derivatives Risk: Derivatives involve special risks and costs and may result in losses to the Funds. The successful use of derivatives requires sophisticated management, and, to the extent that derivatives are used, the Funds will depend on the subadviser’s ability to analyze and manage derivatives transactions. The prices of derivatives may move in unexpected ways, especially in abnormal market conditions. Some derivatives are “leveraged” and therefore may magnify or otherwise increase investment losses to the Funds. The Funds’ use of derivatives may also increase the amount of taxes payable by shareholders. Other risks arise from the potential inability to terminate or sell derivatives positions. A liquid secondary market may not always exist for the Funds’ derivatives positions. In fact, many over-the-counter derivative instruments will not have liquidity beyond the counterparty to the instrument. Over-the-counter derivative instruments also involve the risk that the other party will not meet its obligations to the Funds.
| 124 |
The US Government and foreign governments have adopted (and may adopt further) regulations governing derivatives markets, including mandatory clearing of certain derivatives, margin and reporting requirements. The ultimate impact of the regulations remains unclear. Additional regulation of derivatives may make derivatives more costly, limit their availability or utility, or otherwise adversely affect their performance or disrupt markets.
Distressed and Defaulted Securities Risk. Distressed and defaulted securities are subject to particularly high credit risk, market risk and illiquidity risk. These securities are at a high risk for default, especially during economic downturns, and they are subject to greater volatility than securities of more stable issuers. To the extent that a Fund invests in bankrupt issuers, that Fund may be subject to litigation risks and costs.
Economic and Market Events Risk. Events in the US and global financial markets, including actions taken by the US Federal Reserve or foreign central banks to stimulate or stabilize economic growth or the functioning of the securities markets, may at times result in unusually high market volatility, which could negatively impact performance. Relatively reduced liquidity in credit and fixed income markets could adversely affect issuers worldwide.
Emerging Markets Risk. The risks of foreign investments are greater for investments in or exposed to emerging markets. Emerging market countries typically have economic and political systems that are less fully developed, and can be expected to be less stable, than those of more developed countries. For example, the economies of such countries can be subject to rapid and unpredictable rates of inflation or deflation. Low trading volumes may result in a lack of liquidity and price volatility. Emerging market countries may have policies that restrict investment by non-US investors, or that prevent non-US investors from withdrawing their money at will.
The Funds may invest in some emerging markets that subject them to risks such as those associated with illiquidity, custody of assets, different settlement and clearance procedures and asserting legal title under a developing legal and regulatory regime to a greater degree than in developed markets or even in other emerging markets.
ETF Shares Trading Risk: Funds shares are listed for trading on the Exchange and the shares are bought and sold in the secondary market at market prices. The market prices of the shares of the Funds are expected to fluctuate in response to changes in the Funds’ NAVs, the intraday value of the Funds’ holdings and supply and demand for shares of the Funds. We cannot predict whether shares of the Funds will trade above, below or at their NAV. Trading on the Exchange, including trading of Funds’ shares, may be halted in certain circumstances and shareholders may not be able to sell Funds shares at the time or price desired. During periods of stressed market conditions, the market for the shares of the Funds may become less liquid in response to deteriorating liquidity in the markets for the Funds’ portfolio investments. This adverse effect on the liquidity of the Funds’ shares could lead to differences between the market price of the Funds’ shares and the NAV of those shares. There can be no assurance that the requirements of the Exchange to maintain the listing of shares of the Funds will continue to be met. At times, trading in the
PGIM Fixed Income ETFs | 125 |
Notes to Financial Statements (continued)
securities of ETFs has become volatile and unpredictable and the price of ETFs shares has diverged from market driven fundamentals.
Disruptions to creations and redemptions, the existence of significant market volatility or potential lack of an active trading market for the shares of the Fund (including through a trading halt), as well as other factors, may result in the Fund’s shares trading on the Exchange significantly above (at a premium) or below (at a discount) to NAV or to the intraday value of the Fund’s holdings. Premiums and discounts relate to differences between the market price and NAV of the Fund’s shares. During such periods, you may incur significant losses if you sell your shares of the Fund.
The securities held by the Fund may be traded in markets that close at a different time than the Exchange and may trade outside of a collateralized settlement system. Liquidity in those securities may be reduced after the applicable closing times. Accordingly, during the time when the Exchange is open but after the applicable market closing, fixing or settlement times, bid-ask spreads for the Fund’s shares on the Exchange and the corresponding premium or discount between the market price for Fund shares and their NAV may widen. Additionally, during times when the Exchange is open but after the applicable market is closed, there may be changes between the last quote from the closed foreign market and the value of such security during the Fund’s trading day on the Exchange and this may lead to differences between the market price of the Fund’s shares and the underlying value of those shares. Cost of Buying or Selling Shares. When you buy or sell shares of the Fund through a broker, you will likely incur a brokerage commission or other charges imposed by brokers. In addition, the market price of shares of the Fund, like the price of any exchange-traded security, includes a “bid-ask spread” charged by the market makers or other participants that trade the particular security. The spread of the Fund’s shares varies over time based on the Fund’s trading volume, the spread of the Fund’s underlying securities, and market liquidity and may increase if the Fund’s trading volume, the spread of the Fund’s underlying securities, or market liquidity decreases. In times of severe market disruption, including when trading of the Fund’s holdings may be halted, the bid-ask spread may increase significantly. This means that the shares may trade at a discount to the Fund’s NAV, and the discount is likely to be greatest during significant market volatility.
Foreign Securities Risk. The Funds’ investments in securities of foreign issuers or issuers with significant exposure to foreign markets involve additional risk. The securities of such issuers may trade in markets that are less liquid, less regulated and more volatile than US markets. The value of the Funds’ investments may decline because of factors affecting the particular issuer as well as foreign markets and issuers generally, such as unfavorable government actions, and political or financial instability. Lack of information may also affect the value of these securities.
| 126 |
Interest Rate Risk: The value of an investment may go down when interest rates rise. A rise in rates tends to have a greater impact on the prices of longer term or duration debt securities. When interest rates fall, the issuers of debt obligations may prepay principal more quickly than expected, and the Funds may be required to reinvest the proceeds at a lower interest rate. This is referred to as “prepayment risk”. When interest rates rise, debt obligations may be repaid more slowly than expected, and the value of the Fund’s holdings may fall sharply. This is referred to as “extension risk”. The Funds may face a heightened level of interest rate risk as a result of the U.S. Federal Reserve Board’s rate-setting policies. The Funds may lose money if short-term or long- term interest rates rise sharply or in a manner not anticipated by the subadviser.
Junk Bonds Risk: High-yield, high-risk bonds have predominantly speculative characteristics, including particularly high credit risk. Junk bonds tend to have lower market liquidity than higher-rated securities. The liquidity of particular issuers or industries within a particular investment category may shrink or disappear suddenly and without warning. The non- investment grade bond market can experience sudden and sharp price swings and become illiquid due to a variety of factors, including changes in economic forecasts, stock market activity, large sustained sales by major investors, a high profile default or a change in the market’s psychology.
LIBOR Risk: Many financial instruments use or may use a floating rate based on the London Interbank Offered Rate, or “LIBOR,” which is the offered rate for short-term Eurodollar deposits between major international banks. Over the course of the last several years, global regulators have indicated an intent to phase out the use of LIBOR and similar interbank offering rates (IBOR). On November 30, 2020, the administrator of LIBOR announced a delay in the phase out of a majority of the U.S. dollar LIBOR publications until June 30, 2023, with the remainder of LIBOR publications to still end at the end of 2021. There still remains uncertainty regarding the nature of any replacement rates for LIBOR and the other IBORs as well as around fallback approaches for instruments extending beyond the any phase-out of these reference rates. The lack of consensus around replacement rates and the uncertainty of the phase out of LIBOR and other IBORs may result in increased volatility in corporate or governmental debt, bank loans, derivatives and other instruments invested in by the Funds as well as loan facilities used by the Funds. As such, the potential impact of a transition away from LIBOR on the Funds or the financial instruments in which the Funds invests cannot yet be determined. The elimination of LIBOR or changes to other reference rates or any other changes or reforms to the determination or supervision of reference rates could have an adverse impact on the market for, or value of, any securities or payments linked to those reference rates, which may adversely affect the Funds’ performance and/or net asset value. Furthermore, the risks associated with the expected discontinuation of LIBOR and transition may be exacerbated if the work necessary to effect an orderly transition to an alternative reference rate is not completed in a timely manner. Because the usefulness of LIBOR and the other IBORs as benchmarks could deteriorate during the transition period, these effects could begin to be experienced by the end of 2021 and beyond until the anticipated discontinuance date in 2023 for the majority of the LIBOR rates.
PGIM Fixed Income ETFs | 127 |
Notes to Financial Statements (continued)
Liquidity Risk: Liquidity risk is the risk that the Fund could not meet requests to redeem shares issued by the Fund without significant dilution of remaining investors’ interests in the Fund. The Fund may invest in instruments that trade in lower volumes and are more illiquid than other investments. If the Fund is forced to sell these investments to pay redemption proceeds or for other reasons, the Fund may lose money. In addition, when there is no willing buyer and investments cannot be readily sold at the desired time or price, the Fund may have to accept a lower price or may not be able to sell the instrument at all. An inability to sell a portfolio position can adversely affect the Fund’s value or prevent the Fund from being able to take advantage of other investment opportunities.
Management Risk. The value of your investment may decrease if judgments by the subadviser about the attractiveness, value or market trends affecting a particular security, industry or sector or about market movements are incorrect.
Market Disruption and Geopolitical Risks: International wars or conflicts and geopolitical developments in foreign countries, along with instability in regions such as Asia, Eastern Europe, and the Middle East, possible terrorist attacks in the United States or around the world, public health epidemics such as the outbreak of infectious diseases like the recent outbreak of coronavirus globally or the 2014–2016 outbreak in West Africa of the Ebola virus, and other similar events could adversely affect the U.S. and foreign financial markets, including increases in market volatility, reduced liquidity in the securities markets and government intervention, and may cause further long-term economic uncertainties in the United States and worldwide generally.
The coronavirus pandemic and the related governmental and public responses have had and may continue to have an impact on the Funds’ investments and net asset value and have led and may continue to lead to increased market volatility and the potential for illiquidity in certain classes of securities and sectors of the market. Preventative or protective actions that governments may take in respect of pandemic or epidemic diseases may result in periods of business disruption, business closures, inability to obtain raw materials, supplies and component parts, and reduced or disrupted operations for the issuers in which the Funds invest. Government intervention in markets may impact interest rates, market volatility and security pricing. The occurrence, reoccurrence and pendency of such diseases could adversely affect the economies (including through changes in business activity and increased unemployment) and financial markets either in specific countries or worldwide.
Market Risk: Securities markets may be volatile and the market prices of the Funds’ securities may decline. Securities fluctuate in price based on changes in an issuer’s financial condition and overall market and economic conditions. If the market prices of the securities owned by the Funds fall, the value of your investment in the Funds will decline.
| 128 |
Money Market Instruments Risk. The value of money market instruments may be affected by changing interest rates and by changes in the credit ratings of the investments. If a significant amount of the Fund’s assets are invested in money market instruments, it will be more difficult for the Fund to achieve its investment objective.
Mortgage-Backed and Asset-Backed Securities Risks: Mortgage-backed and asset-backed securities tend to increase in value less than other debt securities when interest rates decline, but are subject to similar risk of decline in market value during periods of rising interest rates. The values of mortgage-backed and asset-backed securities become more volatile as interest rates rise. In a period of declining interest rates, the Funds may be required to reinvest more frequent prepayments on mortgage-backed and asset-backed securities in lower-yielding investments.
New/Small Fund Risk. The Funds recently commenced operations and have a limited operating history. As a new and relatively small funds, the Funds’ performance may not represent how the Funds are expected to or may perform in the long term if and when they become larger and have fully implemented their investment strategies. Investment positions may have a disproportionate impact (negative or positive) on performance in new and smaller funds. New and smaller funds may also require a period of time before they are invested in securities that meet their investment objectives and policies and achieve a representative portfolio composition. Since the Funds are new, an active secondary market for the shares of the Funds may not develop or may not continue once developed. Shareholders holding large blocks of shares of the Funds, including the Manager and its affiliates, may hold their shares for long periods of time, which may lead to reduced trading volumes, wider trading spreads and impede the development or maintenance of an active secondary trading market for Fund shares. These large shareholders may also loan or sell all or a portion of their Fund shares, which may result in increasing concentration of Fund shares in a small number of holders, and the potential for large redemptions, decreases in Fund assets and increased expenses for remaining shareholders.
Non-Money Market Fund Risk. A Fund that is not a money market fund, does not seek to maintain a stable net asset value (NAV) of $1.00 per share. The Funds’ NAV and market value will fluctuate every day and these fluctuations may be significant on certain days. Also, the Funds are not subject to the liquidity requirements and investment and credit quality restrictions applicable to money market funds. There can be no guarantee that the Funds will generate higher returns than money market funds.
Structured Products Risk. Holders of structured product securities bear risks of the underlying investments, index or reference obligation. Certain structured products may be thinly traded or have a limited trading market, and as a result may be characterized as illiquid. The possible lack of a liquid secondary market for structured securities and the resulting inability of a Fund to sell a structured security could expose the Fund to losses and could make structured securities more difficult for the Fund to value accurately, which may also result in additional costs. Structured products are subject to issuer repayment and counterparty risk; a Fund may have the right to receive payments only from the structured
PGIM Fixed Income ETFs | 129 |
Notes to Financial Statements (continued)
product, and generally may not have direct rights against the issuer or the entity that sold the assets to be securitized. Structured products are also subject to credit risk; the assets backing the structured product may be insufficient to pay interest or principal. In addition to the general risks associated with investments in fixed income, structured products carry additional risks, including, but not limited to: the possibility that distributions from collateral securities will not be adequate to make interest or other payments; the quality of the collateral may decline in value or default; and the possibility that the structured products are subordinate to other classes. Structured securities are generally privately negotiated debt obligations where the principal and/or interest or value of the structured security is determined by reference to the performance of a specific asset, benchmark asset, market or interest rate (“reference instrument”), and changes in the reference instrument or security may cause significant price fluctuations, or could cause the interest rate on the structured security to be reduced to zero. Structured products may also entail structural complexity and documentation risk and there is no guarantee that the courts or administrators will interpret the priority of principal and interest payments as expected.
US Government and Agency Securities Risk. US Government and agency securities are subject to market risk, interest rate risk and credit risk. Not all US Government securities are insured or guaranteed by the full faith and credit of the US Government; some are only insured or guaranteed by the issuing agency, which must rely on its own resources to repay the debt. Connecticut Avenue Securities issued by Fannie Mae and Structured Agency Credit Risk issued by Freddie Mac carry no guarantee whatsoever and the risk of default associated with these securities would be borne by the Fund. The maximum potential liability of the issuers of some US Government securities held by the Fund may greatly exceed their current resources, including their legal right to support from the US Treasury. It is possible that these issuers will not have the funds to meet their payment obligations in the future. In addition, the value of US Government securities may be affected by changes in the credit rating of the US Government.
Variable and Floating Rate Bonds Risk. Variable and floating rate bonds are subject to credit risk, market risk and interest rate risk. In addition, the absence of an active market for these securities could make it difficult for the Fund to dispose of them if the issuer defaults. The settlement period for such bonds can be longer than seven days.
10. Recent Accounting Pronouncement and Regulatory Developments
In March 2020, the FASB issued Accounting Standard Update (“ASU”) No. 2020-04, which provides optional guidance for applying GAAP to contract modifications, hedging relationships and other transactions affected by the reference rate reform if certain criteria are met. ASU 2020-04 is elective and is effective on March 12, 2020 through
| 130 |
December 31, 2022. At this time, management is evaluating the implications of certain provisions of the ASU and any impact on the financial statement disclosures has not yet been determined.
On December 3, 2020, the SEC announced that it voted to adopt a new rule that establishes an updated regulatory framework for fund valuation practices (the “Rule”). The Rule, in part, provides (i) a framework for determining fair value in good faith and (ii) provides for a fund Board’s assignment of its responsibility for the execution of valuation-related activities to a fund’s investment adviser. Further, the SEC is rescinding previously issued guidance on related issues. The Rule took effect on March 8, 2021, with a compliance date of September 8, 2022. Management is currently evaluating the Rule and its impact to the Funds.
PGIM Fixed Income ETFs | 131 |
Report of Independent Registered Public Accounting Firm
To the Board of Trustees of PGIM ETF Trust and Shareholders of PGIM Active High Yield Bond ETF, PGIM Ultra Short Bond ETF and PGIM Active Aggregate Bond ETF
Opinions on the Financial Statements
We have audited the accompanying statements of assets and liabilities, including the schedules of investments, of PGIM Active High Yield Bond ETF, PGIM Ultra Short Bond ETF and PGIM Active Aggregate Bond ETF (three of the funds constituting PGIM ETF Trust, hereafter collectively referred to as the “Funds”) as of August 31, 2021, and the related statements of operations and changes in net assets for each of the periods indicated in the table below, including the related notes, and the financial highlights for each of the periods indicated in the table below (collectively referred to as the “financial statements”). In our opinion, the financial statements present fairly, in all material respects, the financial position of each of the Funds as of August 31, 2021, and the results of each of their operations, changes in each of their net assets, and each of the financial highlights for each of the periods indicated in the table below, in conformity with accounting principles generally accepted in the United States of America.
Fund | Statements | |
PGIM Active High Yield Bond ETF PGIM Ultra Short Bond ETF | Statements of operations and changes in net assets, including the related notes, and the financial highlights for the year ended August 31, 2021 | |
| PGIM Active Aggregate Bond ETF | Statements of operations and changes in net assets, including the related notes, and the financial highlights for the period April 12, 2021 (commencement of operations) through August 31, 2021 | |
The financial statements of the Funds as of and for the year or period ended August 31, 2020 and the financial highlights for each of the periods ended on or prior to August 31, 2020 (not presented herein, other than the statements of changes in net assets and the financial highlights) were audited by other auditors whose report dated October 15, 2020 expressed an unqualified opinion on those financial statements and financial highlights.
Basis for Opinions
These financial statements are the responsibility of the Funds’ management. Our responsibility is to express an opinion on the Funds’ financial statements based on our audits. We are a public accounting firm registered with the Public Company Accounting Oversight Board (United States) (PCAOB) and are required to be independent with respect to the Funds in accordance with the U.S. federal securities laws and the applicable rules and regulations of the Securities and Exchange Commission and the PCAOB.
We conducted our audits of these financial statements in accordance with the standards of the PCAOB. Those standards require that we plan and perform the audit to obtain reasonable assurance about whether the financial statements are free of material misstatement, whether due to error or fraud.
Our audits included performing procedures to assess the risks of material misstatement of the financial statements, whether due to error or fraud, and performing procedures that respond to those risks. Such procedures included examining, on a test basis, evidence regarding the amounts and disclosures in the financial statements. Our audits also included evaluating the accounting principles used and significant estimates made by management, as well as evaluating the overall presentation of the financial statements. Our procedures included confirmation of securities owned as of August 31, 2021 by correspondence with the custodian, transfer agent and brokers; when replies were not received from brokers, we performed other auditing procedures. We believe that our audits provide a reasonable basis for our opinions.
/s/PricewaterhouseCoopers LLP
New York, New York
October 19, 2021
We have served as the auditor of one or more investment companies in the PGIM Retail Funds complex since 2020.
| 132 |
Fund Liquidity Risk Management Program (unaudited)
Consistent with Rule 22e-4 under the 1940 Act (the “Liquidity Rule”), each Fund has adopted and implemented a liquidity risk management program (the “LRMP”). Each Fund’s LRMP seeks to assess and manage each Fund’s liquidity risk, which is defined as the risk that each Fund is unable to meet investor redemption requests without significantly diluting the remaining investors’ interests in each Fund. The Trust’s Board of Trustees (the “Board”) has approved PGIM Investments LLC (“PGIM Investments”), each Fund’s investment manager, to serve as the administrator of each Fund’s LRMP. As part of its responsibilities as administrator, PGIM Investments has retained a third party to perform certain functions, including providing market data and liquidity classification model information.
Each Fund’s LRMP includes a number of processes designed to support the assessment and management of its liquidity risk. In particular, each Fund’s LRMP includes no less than annual assessments of factors that influence each Fund’s liquidity risk; no less than monthly classifications of each Fund’s investments into one of four liquidity classifications provided for in the Liquidity Rule; a 15% of net assets limit on the acquisition of “illiquid investments” (as defined under the Liquidity Rule); establishment of a minimum percentage of each Fund’s assets to be invested in investments classified as “highly liquid” (as defined under the Liquidity Rule) if each Fund does not invest primarily in highly liquid investments; and regular reporting to the Board.
At a meeting of the Board on March 2-5, 2021, PGIM Investments provided a written report (“LRMP Report”) to the Board addressing the operation, adequacy, and effectiveness of each Fund’s LRMP, including any material changes to the LRMP for the period from January 1, 2020 through December 31, 2020 (“Reporting Period”). The LRMP Report concluded that each Fund’s LRMP was reasonably designed to assess and manage each Fund’s liquidity risk and was adequately and effectively implemented during the Reporting Period. There were no material changes to the LRMP during the Reporting Period. The LRMP Report further concluded that each Fund’s investment strategies continue to be appropriate given each Fund’s status as an open-end fund.
There can be no assurance that the LRMP will achieve its objectives in the future. Additional information regarding risks of investing in each Fund including liquidity risks presented by each Fund’s investment portfolio, is found in each Fund’s Prospectus and Statement of Additional Information.
PGIM Fixed Income ETFs | 133 |
Tax Information (unaudited)
We are advising you that during the year ended August 31, 2021, the PGIM Active High Yield Bond ETF reports the maximum amount allowed per share, but not less than $0.06 as a capital gain distribution in accordance with Section 852(b)(3)(C) of the Internal Revenue Code.
For the year ended August 31, 2021, the following Funds reports the maximum amount allowable but not less than the following percentages as interest-related dividends in accordance with Section 871(k)(1) and 881(e)(1) of the Internal Revenue Code (IRD):
PGIM Ultra Short Bond ETF | 50.48 | % | ||
PGIM Active High Yield Bond ETF | 66.93 | % | ||
PGIM Active Aggregate Bond ETF | 69.38 | % |
In January 2022, you will be advised on IRS Form 1099-DIV or substitute 1099-DIV, as to the federal tax status of dividends received by you in calendar year 2021.
| 134 |
INFORMATION ABOUT BOARD MEMBERS AND OFFICERS (unaudited)
Information about Board Members and Officers of the Funds is set forth below. Board Members who are not deemed to be “interested persons” of the Funds, as defined in the 1940 Act, are referred to as “Independent Board Members.” Board Members who are deemed to be “interested persons” of the Funds are referred to as “Interested Board Members.” The Board Members are responsible for the overall supervision of the operations of the Funds and perform the various duties imposed on the directors of investment companies by the 1940 Act. The Board in turn elects the Officers, who are responsible for administering the day-to-day operations of the Funds.
| Independent Board Members | ||||||
Name Year of Birth Position(s) Portfolios Overseen | Principal Occupation(s) During Past Five Years | Other Directorships Held During Past Five Years | Length of Board Service | |||
Ellen S. Alberding 1958 Board Member Portfolios Overseen: 98 | President and Board Member, The Joyce Foundation (charitable foundation) (since 2002); formerly Vice Chair, City Colleges of Chicago (community college system) (2011-2015); Trustee, National Park Foundation (charitable foundation for national park system) (2009-2018); Trustee, Economic Club of Chicago (2009-2016); Trustee, Loyola University (since 2018). | None. | Since September 2013 | |||
Kevin J. Bannon 1952 Board Member Portfolios Overseen: 98 | Retired; formerly Managing Director (April 2008-May 2015) and Chief Investment Officer (October 2008-November 2013) of Highmount Capital LLC (registered investment adviser); formerly Executive Vice President and Chief Investment Officer (April 1993-August 2007) of Bank of New York Company; President (May 2003-May 2007) of BNY Hamilton Family of Mutual Funds. | Director of Urstadt Biddle Properties (equity real estate investment trust) (since September 2008). | Since July 2008 | |||
PGIM Fixed Income ETFs
Independent Board Members | ||||||
Name Year of Birth Position(s) Portfolios Overseen | Principal Occupation(s) During Past Five Years | Other Directorships Held During Past Five Years | Length of Board Service | |||
Linda W. Bynoe 1952 Board Member Portfolios Overseen: 95 | President and Chief Executive Officer (since March 1995) and formerly Chief Operating Officer (December 1989-February 1995) of Telemat Limited LLC (formerly Telemat Ltd) (management consulting); formerly Vice President (January 1985-June 1989) at Morgan Stanley & Co. (broker-dealer). | Trustee of Equity Residential (residential real estate) (since December 2009); Director of Northern Trust Corporation (financial services) (since April 2006); formerly Director of Anixter International, Inc. (communication products distributor) (January 2006-June 2020). | Since March 2005 | |||
Barry H. Evans 1960 Board Member Portfolios Overseen: 97 | Retired; formerly President (2005-2016), Global Chief Operating Officer (2014-2016), Chief Investment Officer - Global Head of Fixed Income (1998-2014), and various portfolio manager roles (1986-2006), Manulife Asset Management (asset management). | Formerly Director, Manulife Trust Company (2011-2018); formerly Director, Manulife Asset Management Limited (2015-2017); formerly Chairman of the Board of Directors of Manulife Asset Management U.S. (2005-2016); formerly Chairman of the Board, Declaration Investment Management and Research (2008-2016). | Since September 2017 | |||
Keith F. Hartstein 1956 Board Member & Independent Chair Portfolios Overseen: 98 | Retired; Executive Committee of the Independent Directors Council (IDC) Board of Governors (since October 2019); Member (since November 2014) of the Governing Council of the IDC (organization of independent mutual fund directors); formerly President and Chief Executive Officer (2005-2012), Senior Vice President (2004-2005), Senior Vice President of Sales and Marketing (1997-2004), and various executive management positions (1990-1997), John Hancock Funds, LLC (asset management); Chairman, Investment Company Institute’s Sales Force Marketing Committee (2003-2008). | None. | Since September 2013 | |||
Visit our website at pgim.com/investments
| Independent Board Members | ||||||
Name Year of Birth Position(s) Portfolios Overseen | Principal Occupation(s) During Past Five Years | Other Directorships Held During Past Five Years | Length of Board Service | |||
Laurie Simon Hodrick 1962 Board Member Portfolios Overseen: 94 | A. Barton Hepburn Professor Emerita of Economics in the Faculty of Business, Columbia Business School (since 2018); Visiting Fellow at the Hoover Institution, Stanford University (since 2015); Sole Member, ReidCourt LLC (since 2008) (a consulting firm); formerly Visiting Professor of Law, Stanford Law School (2015-2021); formerly A. Barton Hepburn Professor of Economics in the Faculty of Business, Columbia Business School (1996-2017); formerly Managing Director, Global Head of Alternative Investment Strategies, Deutsche Bank (2006-2008). | Independent Director, Roku (since December 2020) (communication services); formerly Independent Director, Synnex Corporation (2019-2021) (information technology); formerly Independent Director, Kabbage, Inc. (2018-2020) (financial services); formerly Independent Director, Corporate Capital Trust (2017-2018) (a business development company). | Since September 2017 | |||
Brian K. Reid 1961 Board Member Portfolios Overseen: 97 | Retired; formerly Chief Economist for the Investment Company Institute (ICI) (2005-2017); formerly Senior Economist and Director of Industry and Financial Analysis at the ICI (1998-2004); formerly Senior Economist, Industry and Financial Analysis at the ICI (1996-1998); formerly Staff Economist at the Federal Reserve Board (1989-1996); Director, ICI Mutual Insurance Company (2012-2017). | None. | Since March 2018 | |||
PGIM Fixed Income ETFs
| Independent Board Members | ||||||
Name Year of Birth Position(s) Portfolios Overseen | Principal Occupation(s) During Past Five Years | Other Directorships Held During Past Five Years | Length of Board Service | |||
Grace C. Torres 1959 Board Member Portfolios Overseen: 97 | Retired; formerly Treasurer and Principal Financial and Accounting Officer of the PGIM Funds, Target Funds, Advanced Series Trust, Prudential Variable Contract Accounts and The Prudential Series Fund (1998-June 2014); Assistant Treasurer (March 1999-June 2014) and Senior Vice President (September 1999-June 2014) of PGIM Investments LLC; Assistant Treasurer (May 2003-June 2014) and Vice President (June 2005-June 2014) of AST Investment Services, Inc.; Senior Vice President and Assistant Treasurer (May 2003-June 2014) of Prudential Annuities Advisory Services, Inc. | Director (since January 2018) of OceanFirst Financial Corp. and OceanFirst Bank; formerly Director (July 2015-January 2018) of Sun Bancorp, Inc. N.A. and Sun National Bank. | Since November 2014 | |||
| Interested Board Members | ||||||
Name Year of Birth Position(s) Portfolios Overseen | Principal Occupation(s) During Past Five Years | Other Directorships Held During Past Five Years | Length of Board Service | |||
Stuart S. Parker 1962 Board Member & President Portfolios Overseen: 97 | President, Chief Executive Officer, Chief Operating Officer and Officer in Charge of PGIM Investments LLC (formerly known as Prudential Investments LLC) (since January 2012); formerly Executive Vice President of Jennison Associates LLC and Head of Retail Distribution of PGIM Investments LLC (June 2005-December 2011); Investment Company Institute - Board of Governors (since May 2012). | None. | Since January 2012 | |||
Visit our website at pgim.com/investments
| Interested Board Members | ||||||
Name Year of Birth Position(s) Portfolios Overseen | Principal Occupation(s) During Past Five Years | Other Directorships Held During Past Five Years | Length of Board Service | |||
Scott E. Benjamin 1973 Board Member & Vice President Portfolios Overseen: 98 | Executive Vice President (since May 2009) of PGIM Investments LLC; Vice President (since June 2012) of Prudential Investment Management Services LLC; Executive Vice President (since September 2009) of AST Investment Services, Inc.; Senior Vice President of Product Development and Marketing, PGIM Investments (since February 2006); formerly Vice President of Product Development and Product Management, PGIM Investments LLC (2003-2006). | None. | Since March 2010 | |||
| Fund Officers(a) | ||||
Name Year of Birth Fund Position | Principal Occupation(s) During Past Five Years | Length of Service as Fund Officer | ||
Claudia DiGiacomo 1974 Chief Legal Officer | Chief Legal Officer, Executive Vice President and Secretary of PGIM Investments LLC (since August 2020); Chief Legal Officer of Prudential Mutual Fund Services LLC (since August 2020); Chief Legal Officer of PIFM Holdco, LLC (since August 2020); Vice President and Corporate Counsel (since January 2005) of Prudential; and Corporate Counsel of AST Investment Services, Inc. (since August 2020); formerly Vice President and Assistant Secretary of PGIM Investments LLC (2005-2020); formerly Associate at Sidley Austin Brown & Wood LLP (1999-2004). | Since December 2005 | ||
Dino Capasso 1974 Chief Compliance Officer | Chief Compliance Officer (July 2019-present) of PGIM Investments LLC; Chief Compliance Officer (July 2019-present) of the PGIM Funds, Target Funds, Advanced Series Trust, The Prudential Series Fund, Prudential’s Gibraltar Fund, Inc., PGIM Global High Yield Fund, Inc., PGIM High Yield Bond Fund, Inc., and PGIM Short Duration High Yield Opportunities Fund; Vice President and Deputy Chief Compliance Officer (June 2017-2019) of PGIM Investments LLC; formerly Senior Vice President and Senior Counsel (January 2016-June 2017), and Vice President and Counsel (February 2012-December 2015) of Pacific Investment Management Company LLC. | Since July 2019 | ||
PGIM Fixed Income ETFs
| Fund Officers(a) | ||||
Name Year of Birth Fund Position | Principal Occupation(s) During Past Five Years | Length of Service as Fund Officer | ||
Andrew R. French 1962 Secretary | Vice President (since December 2018 - present) of PGIM Investments LLC; formerly Vice President and Corporate Counsel (2010-2018) of Prudential; formerly Director and Corporate Counsel (2006-2010) of Prudential; Vice President and Assistant Secretary (since January 2007) of PGIM Investments LLC; Vice President and Assistant Secretary (since January 2007) of Prudential Mutual Fund Services LLC. | Since October 2006 | ||
Diana N. Huffman 1982 Assistant Secretary | Vice President and Corporate Counsel (since September 2015) of Prudential; Vice President and Assistant Secretary (since August 2020) of PGIM Investments LLC; formerly Associate at Willkie Farr & Gallagher LLP (2009-2015). | Since March 2019 | ||
Melissa Gonzalez 1980 Assistant Secretary | Vice President and Corporate Counsel (since September 2018) of Prudential; Vice President and Assistant Secretary (since August 2020) of PGIM Investments LLC; formerly Director and Corporate Counsel (March 2014-September 2018) of Prudential. | Since March 2020 | ||
Patrick E. McGuinness 1986 Assistant Secretary | Vice President and Assistant Secretary (since August 2020) of PGIM Investments LLC; Director and Corporate Counsel (since February 2017) of Prudential; and Corporate Counsel (2012-2017) of IIL, Inc. | Since June 2020 | ||
Debra Rubano 1975 Assistant Secretary | Vice President and Corporate Counsel (since November 2020) of Prudential; formerly Director and Senior Counsel of Allianz Global Investors U.S. Holdings LLC (2010-2020) and Assistant Secretary of numerous funds in the Allianz fund complex (2015-2020). | Since December 2020 | ||
Christian J. Kelly 1975 Treasurer and Principal Financial and Accounting Officer | Vice President, Head of Fund Administration of PGIM Investments LLC (since November 2018); formerly Director of Fund Administration of Lord Abbett & Co. LLC (2009-2018), Treasurer and Principal Accounting Officer of the Lord Abbett Family of Funds (2017-2018); Director of Accounting, Avenue Capital Group (2008-2009); Senior Manager, Investment Management Practice of Deloitte & Touche LLP (1998-2007). | Since January 2019 | ||
Lana Lomuti 1967 Assistant Treasurer | Vice President (since 2007) and Director (2005-2007), within PGIM Investments Fund Administration; formerly Assistant Treasurer (December 2007-February 2014) of The Greater China Fund, Inc. | Since April 2014 | ||
Russ Shupak 1973 Assistant Treasurer | Vice President (since 2017) and Director (2013-2017), within PGIM Investments Fund Administration. | Since September 2019 | ||
Deborah Conway 1969 Assistant Treasurer | Vice President (since 2017) and Director (2007-2017), within PGIM Investments Fund Administration. | Since September 2019 | ||
Visit our website at pgim.com/investments
| Fund Officers(a) | ||||
Name Year of Birth Fund Position | Principal Occupation(s) During Past Five Years | Length of Service as Fund Officer | ||
Elyse M. McLaughlin 1974 Assistant Treasurer | Vice President (since 2017) and Director (2011-2017), within PGIM Investments Fund Administration. | Since September 2019 | ||
Dana E. Cordes 1978 Anti-Money Laundering Compliance Officer | Vice President, Corporate Compliance (since June 2021) of Prudential; formerly, Director Global Financial Crimes Unit (December 2015 to June 2021) of Prudential; formerly, Director, Operational Risk Management for Prudential Real Estate Investors (January 2010 to December 2015). | Since September 2021 | ||
(a) Excludes Mr. Parker and Mr. Benjamin, interested Board Members who also serve as President and Vice President, respectively.
Explanatory Notes to Tables:
| ∎ | Board Members are deemed to be “Interested,” as defined in the 1940 Act, by reason of their affiliation with PGIM Investments LLC and/or an affiliate of PGIM Investments LLC. |
| ∎ | Unless otherwise noted, the address of all Board Members and Officers is c/o PGIM Investments LLC, 655 Broad Street, Newark, New Jersey 07102-4410. |
| ∎ | There is no set term of office for Board Members or Officers. The Board Members have adopted a retirement policy, which calls for the retirement of Board Members on December 31 of the year in which they reach the age of 75. |
| ∎ | “Other Directorships Held” includes all directorships of companies required to register or file reports with the SEC under the 1934 Act (that is, “public companies”) or other investment companies registered under the 1940 Act. |
| ∎ | “Portfolios Overseen” includes all investment companies managed by PGIM Investments LLC. The investment companies for which PGIM Investments LLC serves as manager include the PGIM Funds, Target Funds, The Prudential Variable Contract Accounts, PGIM ETF Trust, PGIM High Yield Bond Fund, Inc., PGIM Global High Yield Fund, Inc., PGIM Short Duration High Yield Opportunities Fund, The Prudential Series Fund, Prudential’s Gibraltar Fund, Inc. and the Advanced Series Trust. |
| ∎ | As used in the Fund Officers table “Prudential” means The Prudential Insurance Company of America. |
PGIM Fixed Income ETFs
Approval of Advisory Agreements (unaudited)
PGIM Ultra Short Bond ETF
The Fund’s Board of Trustees
The Board of Trustees (the “Board”) of PGIM Ultra Short Bond ETF1 (the “Fund”) consists of ten individuals, eight of whom are not “interested persons” of the Fund, as defined in the Investment Company Act of 1940, as amended (the “1940 Act”) (the “Independent Trustees”). The Board is responsible for the oversight of the Fund and its operations, and performs the various duties imposed on the Trustees of investment companies by the 1940 Act. The Independent Trustees have retained independent legal counsel to assist them in connection with their duties. The Chair of the Board is an Independent Director. The Board has established four standing committees: the Audit Committee, the Nominating and Governance Committee, and two Investment Committees. Each committee is chaired by, and composed of, Independent Trustees.
Annual Approval of the Fund’s Advisory Agreements
As required under the 1940 Act, the Board determines annually whether to renew the Fund’s management agreement with PGIM Investments LLC (“PGIM Investments”) and the Fund’s subadvisory agreement with PGIM Limited (“PGIML”) and PGIM, Inc. on behalf of its PGIM Fixed Income unit (“PGIM Fixed Income”). In considering the renewal of the agreements, the Board, including all of the Independent Trustees, met on June 7-10, 2021 and approved the renewal of the agreements through July 31, 2022, after concluding that the renewal of the agreements was in the best interests of the Fund and its shareholders.
In advance of the meetings, the Board requested and received materials relating to the agreements, and had the opportunity to ask questions and request further information in connection with its consideration. Among other things, the Board considered comparative fee information from PGIM Investments, PGIML and PGIM Fixed Income. Also, the Board considered comparisons with other mutual funds in relevant Peer Universes and Peer Groups, as is further discussed below.
In approving the agreements, the Board, including the Independent Trustees advised by independent legal counsel, considered the factors it deemed relevant, including the nature, quality and extent of services provided by PGIM Investments, the subadvisers and, as relevant, its affiliates, the performance of the Fund, the profitability of PGIM Investments and its affiliates, expenses and fees, and the potential for economies of scale that may be shared with the Fund and its shareholders as the Fund’s assets grow. In their deliberations, the Trustees did not identify any single factor which alone was responsible for the Board’s decision to approve the agreements with respect to the Fund. In connection with its deliberations, the Board considered information provided by PGIM Investments throughout the year at regular Board meetings, presentations from portfolio managers and other information, as well as information furnished at or in advance of the meetings on June 7-10, 2021.
| 1 | PGIM Ultra Short Bond ETF is a series of PGIM ETF Trust. |
| PGIM Fixed Income ETFs |
Approval of Advisory Agreements (continued)
The Trustees determined that the overall arrangements between the Fund and PGIM Investments, which serves as the Fund’s investment manager pursuant to a management agreement, and between PGIM Investments and each of PGIML and PGIM Fixed Income, which serve as the Fund’s subadvisers pursuant to the terms of a subadvisory agreement with PGIM Investments, are in the best interests of the Fund and its shareholders in light of the services performed, fees charged and such other matters as the Trustees considered relevant in the exercise of their business judgment.
The material factors and conclusions that formed the basis for the Trustees’ reaching their determinations to approve the continuance of the agreements are separately discussed below.
Nature, Quality and Extent of Services
The Board received and considered information regarding the nature, quality and extent of services provided to the Fund by PGIM Investments, PGIML and PGIM Fixed Income. The Board noted that PGIML and PGIM Fixed Income are affiliated with PGIM Investments. The Board considered the services provided by PGIM Investments, including but not limited to the oversight of the subadvisers for the Fund, as well as the provision of fund recordkeeping, compliance and other services to the Fund, and PGIM Investments’ role as administrator of the Fund’s liquidity risk management program. With respect to PGIM Investments’ oversight of the subadvisers, the Board noted that PGIM Investments’ Strategic Investment Research Group (“SIRG”), which is a business unit of PGIM Investments, is responsible for monitoring and reporting to PGIM Investments’ senior management on the performance and operations of the subadvisers. The Board also considered that PGIM Investments pays the salaries of all of the officers and interested Trustees of the Fund who are part of Fund management. The Board also considered the investment subadvisory services provided by PGIML and PGIM Fixed Income, including investment research and security selection, as well as adherence to the Fund’s investment restrictions and compliance with applicable Fund policies and procedures. The Board considered PGIM Investments’ evaluation of the subadvisers, as well as PGIM Investments’ recommendation, based on its review of the subadvisers, to renew the subadvisory agreement.
The Board considered the qualifications, backgrounds and responsibilities of PGIM Investments’ senior management responsible for the oversight of the Fund, PGIML and PGIM Fixed Income, and also considered the qualifications, backgrounds and responsibilities of the PGIML and PGIM Fixed Income portfolio managers who are responsible for the day-to-day management of the Fund’s portfolio. The Board was provided with information pertaining to PGIML’s, PGIM Investments’ and PGIM Fixed Income’s organizational structure, senior management, investment operations, and other relevant information pertaining to PGIM Investments, PGIML and PGIM Fixed Income. The Board also noted that it received favorable compliance reports from the Fund’s Chief Compliance Officer (“CCO”) as to PGIM Investments, PGIML and PGIM Fixed Income.
| Visit our website at pgim.com/investments |
The Board concluded that it was satisfied with the nature, extent and quality of the investment management services provided by PGIM Investments, and the subadvisory services provided to the Fund by PGIML and PGIM Fixed Income, and that there was a reasonable basis on which to conclude that the Fund benefits from the services provided by PGIM Investments, PGIML and PGIM Fixed Income under the management agreement and the subadvisory agreement.
Costs of Services and Profits Realized by PGIM Investments
The Board was provided with information on the profitability of PGIM Investments and its affiliates in serving as the Fund’s investment manager. The Board discussed with PGIM Investments the methodology utilized in assembling the information regarding profitability and considered its reasonableness. The Board recognized that it is difficult to make comparisons of profitability from fund management contracts because comparative information is not generally publicly available and is affected by numerous factors, including the structure of the particular adviser, the types of funds it manages, its business mix, numerous assumptions regarding allocations and the adviser’s capital structure and cost of capital. However, the Board considered that the cost of services provided by PGIM Investments exceeded the management fees received by PGIM Investments, resulting in an operating loss to PGIM Investments for the year ended December 31, 2020. Taking these factors into account, the Board concluded that the profitability of PGIM Investments and its affiliates in relation to the services rendered was not unreasonable.
Economies of Scale
The Board received and discussed information concerning economies of scale that PGIM Investments may realize as the Fund’s assets grow beyond current levels. During the course of time, the Board has considered information regarding the launch date of the Fund, the management fees of the Fund compared to those of similarly managed funds and PGIM Investments’ investment in the Fund over time. The Board noted that economies of scale can be shared with the Fund in other ways, including low management fees from inception, additional technological and personnel investments to enhance shareholder services, and maintaining existing expense structures in the face of a rising cost environment. The Board also considered PGIM Investments’ assertion that it continually evaluates the management fee schedule of the Fund and the potential to share economies of scale through breakpoints or fee waivers as asset levels increase.
The Board recognized the inherent limitations of any analysis of economies of scale, stemming largely from the Board’s understanding that most of PGIM Investments’ costs are not specific to individual funds, but rather are incurred across a variety of products and services.
Other Benefits to PGIM Investments, PGIML and PGIM Fixed Income
The Board considered potential ancillary benefits that might be received by PGIM Investments, PGIML, PGIM Fixed Income and their affiliates as a result of their relationship with the Fund. The Board concluded that potential benefits to be derived by
| PGIM Fixed Income ETFs |
Approval of Advisory Agreements (continued)
PGIM Investments included transfer agency fees received by the Fund’s transfer agent (which is affiliated with PGIM Investments), as well as benefits to its reputation or other intangible benefits resulting from PGIM Investments’ association with the Fund. The Board concluded that the potential benefits to be derived by PGIML and PGIM Fixed Income included the ability to use soft dollar credits, as well as the potential benefits consistent with those generally resulting from an increase in assets under management, specifically, potential access to additional research resources and benefits to its reputation. The Board concluded that the benefits derived by PGIM Investments, PGIML and PGIM Fixed Income were consistent with the types of benefits generally derived by investment managers and subadvisers to mutual funds.
Performance of the Fund / Fees and Expenses
The Board considered certain additional factors and made related conclusions relating to the historical performance of the Fund for the one-year period ended December 31, 2020. The Board considered that the Fund commenced operations on April 5, 2018 and that longer-term performance was not yet available.
The Board also considered the Fund’s actual management fee, as well as the Fund’s net total expense ratio, for the fiscal period ended August 31, 2020. The Board considered the management fee for the Fund as compared to the management fee charged by PGIM Investments to other funds and the fee charged by other advisers to comparable mutual funds in a Peer Group. The actual management fee represents the fee rate actually paid by Fund shareholders and includes any fee waivers or reimbursements. The net total expense ratio for the Fund represents the actual expense ratio incurred by Fund shareholders.
The mutual funds included in the Peer Universe, which was used to consider performance, and the Peer Group, which was used to consider expenses and fees, were objectively determined by Broadridge, an independent provider of mutual fund data. In certain circumstances, PGIM Investments also provided supplemental Peer Universe or Peer Group information for reasons addressed with the Board. The comparisons placed the Fund in various quartiles over various periods, with the first quartile being the best 25% of the mutual funds (for performance, the best performing mutual funds and, for expenses, the lowest cost mutual funds).
The section below summarizes key factors considered by the Board and the Board’s conclusions regarding the Fund’s performance, fees and overall expenses. The table sets forth net performance comparisons (which reflect the impact on performance of fund expenses, or any subsidies, expense caps or waivers that may be applicable) with the Peer Universe, actual management fees with the Peer Group (which reflect the impact of any subsidies or fee waivers), and net total expenses with the Peer Group, each of which were key factors considered by the Board.
| Visit our website at pgim.com/investments |
| Net Performance | 1 Year | 3 Years | 5 Years | 10 Years | ||||
| 2nd Quartile | N/A | N/A | N/A | |||||
| Actual Management Fees: 2nd Quartile | ||||||||
| Net Total Expenses: 1st Quartile | ||||||||
| ● | The Board noted that the Fund outperformed both of its benchmark indices over the one-year period ended December 31, 2020. |
| ● | The Board noted that the Fund does not yet have a three-year performance record and that, therefore, the subadvisers should have more time to develop that record. |
| ● | The Board and PGIM Investments agreed to retain the Fund’s existing contractual fee waiver, pursuant to which PGIM Investments waives any management fees it receives from the Fund in an amount equal to the subadvisory fees paid by the Fund to the PGIM Institutional Money Market Fund. |
| ● | The Board concluded that, in light of the above, it would be in the best interests of the Fund and its shareholders to continue to allow the Fund to create a longer-term performance record, and to renew the agreements. |
| ● | The Board concluded that the management fees (including subadvisory fees) and total expenses were reasonable in light of the services provided. |
PGIM Active High Yield Bond ETF
The Fund’s Board of Trustees
The Board of Trustees (the “Board”) of PGIM Active High Yield Bond ETF2 (the “Fund”) consists of ten individuals, eight of whom are not “interested persons” of the Fund, as defined in the Investment Company Act of 1940, as amended (the “1940 Act”) (the “Independent Trustees”). The Board is responsible for the oversight of the Fund and its operations, and performs the various duties imposed on the Trustees of investment companies by the 1940 Act. The Independent Trustees have retained independent legal counsel to assist them in connection with their duties. The Chair of the Board is an Independent Director. The Board has established four standing committees: the Audit Committee, the Nominating and Governance Committee, and two Investment Committees. Each committee is chaired by, and composed of, Independent Trustees.
Annual Approval of the Fund’s Advisory Agreements
As required under the 1940 Act, the Board determines annually whether to renew the Fund’s management agreement with PGIM Investments LLC (“PGIM Investments”) and the Fund’s subadvisory agreement with PGIM, Inc. (“PGIM”) on behalf of its PGIM Fixed Income unit (“PGIM Fixed Income”). In considering the renewal of the agreements, the Board, including all of the Independent Trustees, met on June 7-10, 2021 and approved the renewal of the agreements through July 31, 2022, after concluding that
| 2 | PGIM Active High Yield Bond ETF is a series of PGIM ETF Trust. |
| PGIM Fixed Income ETFs |
Approval of Advisory Agreements (continued)
the renewal of the agreements was in the best interests of the Fund and its shareholders.
In advance of the meetings, the Board requested and received materials relating to the agreements, and had the opportunity to ask questions and request further information in connection with its consideration. Among other things, the Board considered comparative fee information from PGIM Investments and PGIM. Also, the Board considered comparisons with other mutual funds in relevant Peer Universes and Peer Groups, as is further discussed below.
In approving the agreements, the Board, including the Independent Trustees advised by independent legal counsel, considered the factors it deemed relevant, including the nature, quality and extent of services provided by PGIM Investments, the subadviser and, as relevant, its affiliates, the performance of the Fund, the profitability of PGIM Investments and its affiliates, expenses and fees, and the potential for economies of scale that may be shared with the Fund and its shareholders as the Fund’s assets grow. In their deliberations, the Trustees did not identify any single factor which alone was responsible for the Board’s decision to approve the agreements with respect to the Fund. In connection with its deliberations, the Board considered information provided by PGIM Investments throughout the year at regular Board meetings, presentations from portfolio managers and other information, as well as information furnished at or in advance of the meetings on June 7-10, 2021.
The Trustees determined that the overall arrangements between the Fund and PGIM Investments, which serves as the Fund’s investment manager pursuant to a management agreement, between PGIM Investments and PGIM, which, through its PGIM Fixed Income unit, serves as the Fund’s subadviser pursuant to the terms of a subadvisory agreement with PGIM Investments are in the best interests of the Fund and its shareholders in light of the services performed, fees charged and such other matters as the Trustees considered relevant in the exercise of their business judgment.
The material factors and conclusions that formed the basis for the Trustees’ reaching their determinations to approve the continuance of the agreements are separately discussed below.
Nature, Quality and Extent of Services
The Board received and considered information regarding the nature, quality and extent of services provided to the Fund by PGIM Investments and PGIM Fixed Income. The Board noted that PGIM Fixed Income is affiliated with PGIM Investments. The Board considered the services provided by PGIM Investments, including but not limited to the oversight of the subadviser for the Fund, as well as the provision of fund recordkeeping, compliance and other services to the Fund, and PGIM Investments’ role as administrator of the Fund’s liquidity risk management program. With respect to PGIM Investments’ oversight of the subadviser, the Board noted that PGIM Investments’ Strategic Investment Research Group (“SIRG”), which is a business unit of PGIM
| Visit our website at pgim.com/investments |
Investments, is responsible for monitoring and reporting to PGIM Investments’ senior management on the performance and operations of the subadviser. The Board also considered that PGIM Investments pays the salaries of all of the officers and interested Trustees of the Fund who are part of Fund management. The Board also considered the investment subadvisory services provided by PGIM Fixed Income, including investment research and security selection, as well as adherence to the Fund’s investment restrictions and compliance with applicable Fund policies and procedures. The Board considered PGIM Investments’ evaluation of the subadviser, as well as PGIM Investments’ recommendation, based on its review of the subadviser, to renew the subadvisory agreement.
The Board considered the qualifications, backgrounds and responsibilities of PGIM Investments’ senior management responsible for the oversight of the Fund and PGIM Fixed Income, and also considered the qualifications, backgrounds and responsibilities of PGIM Fixed Income’s portfolio managers who are responsible for the day-to-day management of the Fund’s portfolio. The Board was provided with information pertaining to PGIM Investments’ and PGIM Fixed Income’s organizational structure, senior management, investment operations, and other relevant information pertaining to PGIM Investments and PGIM Fixed Income. The Board also noted that it received favorable compliance reports from the Fund’s Chief Compliance Officer (“CCO”) as to PGIM Investments and PGIM Fixed Income.
The Board concluded that it was satisfied with the nature, extent and quality of the investment management services provided by PGIM Investments, and the subadvisory services provided to the Fund by PGIM Fixed Income, and that there was a reasonable basis on which to conclude that the Fund benefits from the services provided by PGIM Investments and PGIM Fixed Income under the management, subadvisory agreement.
Costs of Services and Profits Realized by PGIM Investments
The Board was provided with information on the profitability of PGIM Investments and its affiliates in serving as the Fund’s investment manager. The Board discussed with PGIM Investments the methodology utilized in assembling the information regarding profitability and considered its reasonableness. The Board recognized that it is difficult to make comparisons of profitability from fund management contracts because comparative information is not generally publicly available and is affected by numerous factors, including the structure of the particular adviser, the types of funds it manages, its business mix, numerous assumptions regarding allocations and the adviser’s capital structure and cost of capital. Taking these factors into account, the Board concluded that the profitability of PGIM Investments and its affiliates in relation to the services rendered was not unreasonable.
Economies of Scale
The Board received and discussed information concerning economies of scale that PGIM Investments may realize as the Fund’s assets grow beyond current levels. During the course of time, the Board has considered information regarding the launch date of
| PGIM Fixed Income ETFs |
Approval of Advisory Agreements (continued)
the Fund, the management fees of the Fund compared to those of similarly managed funds and PGIM Investments’ investment in the Fund over time. The Board noted that economies of scale can be shared with the Fund in other ways, including low management fees from inception, additional technological and personnel investments to enhance shareholder services, and maintaining existing expense structures in the face of a rising cost environment. The Board also considered PGIM Investments’ assertion that it continually evaluates the management fee schedule of the Fund and the potential to share economies of scale through breakpoints or fee waivers as asset levels increase.
The Board recognized the inherent limitations of any analysis of economies of scale, stemming largely from the Board’s understanding that most of PGIM Investments’ costs are not specific to individual funds, but rather are incurred across a variety of products and services.
Other Benefits to PGIM Investments and PGIM Fixed Income
The Board considered potential ancillary benefits that might be received by PGIM Investments, PGIM Fixed Income and their affiliates as a result of their relationship with the Fund. The Board concluded that potential benefits to be derived by PGIM Investments included transfer agency fees received by the Fund’s transfer agent (which is affiliated with PGIM Investments), as well as benefits to its reputation or other intangible benefits resulting from PGIM Investments’ association with the Fund. The Board concluded that the potential benefits to be derived by PGIM Fixed Income included the ability to use soft dollar credits, as well as the potential benefits consistent with those generally resulting from an increase in assets under management, specifically, potential access to additional research resources and benefits to its reputation. The Board concluded that the benefits derived by PGIM Investments and PGIM Fixed Income were consistent with the types of benefits generally derived by investment managers and subadvisers to mutual funds.
Performance of the Fund / Fees and Expenses
The Board considered certain additional factors and made related conclusions relating to the historical performance of the Fund for the one-year period ended December 31, 2020. The Board considered that the Fund commenced operations on September 24, 2018 and that longer-term performance was not yet available.
The Board also considered the Fund’s actual management fee, as well as the Fund’s net total expense ratio, for the fiscal period ended August 31, 2020. The Board considered the management fee for the Fund as compared to the management fee charged by PGIM Investments to other funds and the fee charged by other advisers to comparable mutual funds in a Peer Group. The actual management fee represents the fee rate actually paid by Fund shareholders and includes any fee waivers or reimbursements. The net total expense ratio for the Fund represents the actual expense ratio incurred by Fund shareholders.
| Visit our website at pgim.com/investments |
The mutual funds included in the Peer Universe, which was used to consider performance, and the Peer Group, which was used to consider expenses and fees, were objectively determined by Broadridge, an independent provider of mutual fund data. In certain circumstances, PGIM Investments also provided supplemental Peer Universe or Peer Group information for reasons addressed with the Board. The comparisons placed the Fund in various quartiles over various periods, with the first quartile being the best 25% of the mutual funds (for performance, the best performing mutual funds and, for expenses, the lowest cost mutual funds).
The section below summarizes key factors considered by the Board and the Board’s conclusions regarding the Fund’s performance, fees and overall expenses. The table sets forth net performance comparisons (which reflect the impact on performance of fund expenses, or any subsidies, expense caps or waivers that may be applicable) with the Peer Universe, actual management fees with the Peer Group (which reflect the impact of any subsidies or fee waivers), and net total expenses with the Peer Group, each of which were key factors considered by the Board.
| Net Performance | 1 Year | 3 Years | 5 Years | 10 Years | ||||
| 2nd Quartile | N/A | N/A | N/A | |||||
| Actual Management Fees: 3rd Quartile | ||||||||
| Net Total Expenses: 3rd Quartile | ||||||||
| ● | The Board noted that the Fund outperformed its benchmark index over the one-year period ended December 31, 2020. |
| ● | The Board noted that the Fund does not yet have a three-year performance record and that, therefore, the subadviser should have more time to develop that record. |
| ● | The Board and PGIM Investments agreed to retain the Fund’s existing contractual fee waiver, pursuant to which PGIM Investments waives any management fees it receives from the Fund in an amount equal to the subadvisory fees paid by the Fund to the PGIM Institutional Money Market Fund. |
| ● | The Board concluded that, in light of the above, it would be in the best interests of the Fund and its shareholders to continue to allow the Fund to create a longer-term performance record, and to renew the agreements. |
| ● | The Board concluded that the management fees (including subadvisory fees) and total expenses were reasonable in light of the services provided. |
* * *
After full consideration of these factors, the Board concluded that approval of the agreements was in the best interests of the Fund and its shareholders.
| PGIM Fixed Income ETFs |
Approval of Advisory Agreements (continued)
PGIM Active Aggregate Bond ETF
Initial Approval of the Fund’s Advisory Agreements
The Board considered the proposed management agreement with PGIM Investments LLC (the Manager) and the proposed subadvisory agreement with PGIM, Inc. (PGIM), through its PGIM Fixed Income (PFI) division, to serve as the subadviser (the Subadviser) with respect to the Fund prior to the Fund’s commencement of operations. The Board, including all of the Independent Trustees, met on January 25, 2021 (the Meeting) and approved the agreements for an initial two-year period, after concluding that approval of the agreements was in the best interests of the Fund.
In advance of the Meeting, the Board requested and received materials relating to the agreements, and had the opportunity to ask questions and request further information in connection with its considerations.
In approving the agreements, the Board, including the Independent Trustees advised by independent legal counsel, considered the factors it deemed relevant, including the nature, quality and extent of services to be provided to the Fund by the Manager and the Subadviser; any relevant comparable performance information and the Subadviser’s qualifications and track record in serving other affiliated funds; and the fees proposed to be paid by the Fund to the Manager and by the Manager to the Subadviser under the agreements. In connection with its deliberations, the Board considered information provided by the Manager and the Subadviser at or in advance of the Meeting. The Board also considered information that the Trustees received throughout the year regarding the Manager and the Subadviser in their capacity as directors or trustees of other funds in the Prudential organization. In their deliberations, the Trustees did not identify any single factor which alone was responsible for the Board’s decision to approve the agreements with respect to the Fund.
The Trustees determined that the overall arrangements between the Fund and the Manager, which will serve as the Fund’s investment manager pursuant to a management agreement, and between the Manager and the Subadviser, which will serve as the Fund’s subadviser pursuant to the terms of a subadvisory agreement, are appropriate in light of the services to be performed and the fees to be charged under the agreements and such other matters as the Trustees considered relevant in the exercise of their business judgment.
A summary of certain factors and conclusions that formed the basis for the Trustees’ reaching their determinations to approve the agreements are discussed below.
Nature, quality and extent of services
With respect to the Manager, the Board noted that it had received and considered information about the Manager at the Meeting, including information relating to the approval and renewal, as applicable, of the management agreements between the Manager and the other Prudential Retail Funds, as well as information received at other
| Visit our website at pgim.com/investments |
regular meetings throughout the year of the Prudential Retail Funds, regarding the nature, quality and extent of services provided by the Manager. The Board considered the services to be provided by the Manager, including but not limited to the oversight of the Subadviser, as well as the provision of fund recordkeeping, compliance and other services to the Fund. With respect to the Manager’s oversight of the Subadviser, the Board noted that the Manager’s Strategic Investment Research Group, which is a business unit of the Manager, is responsible for monitoring and reporting to the Manager’s senior management on the performance and operations of the Subadviser. The Board also noted that the Manager pays the salaries of the officers of the Trust and Trustees of the Trust who are affiliated persons of the Manager or Subadviser. The Board reviewed the qualifications, backgrounds and responsibilities of the Manager’s senior management responsible for the oversight of the Fund and the Subadviser, and was also provided with information pertaining to the Manager’s organizational structure, senior management, investment operations and other relevant information. The Board noted that the Manager had engaged personnel and consultants with experience in the management of exchanged-traded funds. The Board further noted that it received favorable compliance reports from the Fund’s Chief Compliance Officer as to the Manager for services provided to other Prudential Retail Funds. The Board noted that it had concluded that it was satisfied with the nature, quality and extent of the services provided by the Manager to the other Prudential Retail Funds and determined that it was reasonable to conclude that the nature, quality and extent of services to be provided by the Manager under the management agreement for the Fund would be similar in nature to those provided under the other management agreements.
With respect to the Subadviser, the Board noted that it had received and considered information about the Subadviser at the Meeting, including information relating to the approval and renewal, as applicable, of subadvisory agreements between the Manager and the Subadviser with respect to other Prudential Retail Funds, as well as at other regular meetings throughout the year, regarding the nature, quality and extent of services provided by the Subadviser. The Board considered, among other things, the qualifications, background and experience of the Subadviser’s portfolio managers who will be responsible for the day-to-day management of the Fund’s portfolio, as well as information on the Subadviser’s organizational structure, senior management, investment operations and other relevant information. The Board also considered the Sub-Adviser’s experience managing other similar investment strategies. The Board further noted that it received favorable compliance reports from the Fund’s Chief Compliance Officer as to the Subadviser for services provided to other Prudential Retail Funds. The Board noted that it was satisfied with the nature, quality and extent of services provided by the Subadviser with respect to the other Prudential Retail Funds served by the Subadviser and determined that it was reasonable to conclude that the nature, quality and extent of services to be provided by the Subadviser under the subadvisory agreement for the Fund would be similar in nature to those provided under the other subadvisory agreements. The Board noted that the Subadviser is affiliated with the Manager.
| PGIM Fixed Income ETFs |
Approval of Advisory Agreements (continued)
Performance
Because the Fund had not yet commenced operations and the actual asset base of the Fund had not yet been determined, no investment performance for the Fund existed for Board review. The Board took note that the Manager will provide information relating to performance to the Board in connection with subsequent reviews of the management agreement and subadvisory agreement.
Fee Rates
The Board considered the proposed management fees of 0.19% of the average daily value of the Fund’s investable assets to be paid by the Fund to the Manager and the compensation to be paid by the Manager to the Subadviser. The Board considered the nature of the management fee as a unitary fee and that the Manager would be responsible for the Fund’s expenses except for those expenses reflected in the management agreement as remaining the responsibility of the Fund.
The Board considered information provided by the Manager comparing the Fund’s proposed management fee rate and total expenses (including the effects of leverage) to the Lipper 15(c) Peer Group. The Board noted that the Fund’s management fee was in the first quartile and anticipated total expenses were in the first quartile of the Lipper Peer Group (first quartile being the lowest fee) based upon net assets assuming outstanding leverage.
The Board concluded that the proposed management fee and total expenses were reasonable in light of the services to be provided.
Profitability
Because the Fund had not yet commenced operations and the actual asset base of the Fund had not yet been determined, the Board noted that there was no historical profitability information with respect to the Fund to be reviewed. The Board noted that it would review profitability information in connection with subsequent renewals of the management and subadvisory agreements.
Economies of Scale
Because the Fund had not yet commenced operations and the actual asset base of the Fund had not yet been determined, the Board noted that there was no historical information regarding economies of scale with respect to the Fund to be reviewed. The Board noted that it would review such information in connection with subsequent renewals of the management and subadvisory agreements.
Other Benefits to the Manager and the Subadviser
The Board considered potential “fall-out” or ancillary benefits anticipated to be received by the Manager and the Subadviser. The Board concluded that any potential benefits to be derived by the Manager were similar to benefits derived by the Manager in connection with its management of the other affiliated funds managed by the Manager, which are reviewed on an annual basis. The Board also concluded that any potential
| Visit our website at pgim.com/investments |
benefits to be derived by the Subadviser were consistent with those generally derived by subadvisers to the Prudential Retail Funds, and that those benefits are reviewed on an annual basis. The Board concluded that any potential benefits derived by the Manager and the Subadviser were consistent with the types of benefits generally derived by investment managers and subadvisers to funds.
* * *
After full consideration of these and other factors, the Board concluded that the approval of the agreements was in the best interests of the Fund.
| PGIM Fixed Income ETFs |
∎ TELEPHONE | ∎ WEBSITE | |||
655 Broad Street Newark, NJ 07102 | (800) 225-1852 | pgim.com/investments | ||
PROXY VOTING
The Board of Trustees of the Funds has delegated to the Funds’ subadvisers the responsibility for voting any proxies and maintaining proxy recordkeeping with respect to each Funds. A description of these proxy voting policies and procedures is available without charge, upon request, by calling (800) 225-1852 or by visiting the Securities and Exchange Commission’s website at sec.gov. Information regarding how each Funds voted proxies relating to portfolio securities during the most recent 12-month period ended June 30 is available on the Funds’ website and on the Securities and Exchange Commission’s website.
TRUSTEES
Ellen S. Alberding ● Kevin J. Bannon ● Scott E. Benjamin ● Linda W. Bynoe ● Barry H. Evans ● Keith F. Hartstein ● Laurie Simon Hodrick ● Stuart S. Parker ● Brian K. Reid ● Grace C. Torres
OFFICERS
Stuart S. Parker, President ● Scott E. Benjamin, Vice President ● Christian J. Kelly, Treasurer and Principal Financial and Accounting Officer ● Claudia DiGiacomo, Chief Legal Officer ● Dino Capasso, Chief Compliance Officer ● Dana E. Cordes, Anti-Money Laundering Compliance Officer ● Andrew R. French, Secretary ● Melissa Gonzalez, Assistant Secretary ● Diana N. Huffman, Assistant Secretary ● Patrick E. McGuinness, Assistant Secretary ● Debra Rubano, Assistant Secretary ● Lana Lomuti, Assistant Treasurer ● Russ Shupak, Assistant Treasurer ● Elyse M. McLaughlin, Assistant Treasurer ● Deborah Conway, Assistant Treasurer
MANAGER | PGIM Investments LLC | 655 Broad Street Newark, NJ 07102 | ||
SUBADVISERS | PGIM Fixed Income | 655 Broad Street Newark, NJ 07102 | ||
| PGIM Limited | Grand Buildings, 1-3 Strand Trafalgar Square London, WC2N 5HR United Kingdom | |||
DISTRIBUTOR | Prudential Investment Management Services LLC | 655 Broad Street Newark, NJ 07102 | ||
CUSTODIAN/TRANSFER AGENT | Brown Brothers Harriman & Co. | 50 Post Office Square Boston, MA 02110 | ||
INDEPENDENT REGISTERED PUBLIC ACCOUNTING FIRM | PricewaterhouseCoopers LLP | 300 Madison Avenue New York, NY 10017 | ||
FUND COUNSEL | Willkie Farr & Gallagher LLP | 787 Seventh Avenue New York, NY 10019 | ||
An investor should consider the investment objectives, risks, charges, and expenses of each Funds carefully before investing. The prospectus and summary prospectus contain this and other information about the Fund. An investor may obtain the prospectus and summary prospectus by visiting our website at pgiminvestments.com or by calling (800) 225-1852. The prospectus and summary prospectus should be read carefully before investing.
E-DELIVERY
To receive your fund documents online, go to pgim.com/investments/resource/edelivery and enroll. Instead of receiving printed documents by mail, you will receive notification via email when new materials are available. You can cancel your enrollment or change your email address at any time by visiting the website address above.
SHAREHOLDER COMMUNICATIONS WITH TRUSTEES
Shareholders can communicate directly with the Board of Trustees by writing to the Chair of the Board, PGIM Fixed Income ETFs, PGIM Investments, Attn: Board of Trustees, 655 Broad Street, Newark, NJ 07102. Shareholders can communicate directly with an individual Trustee by writing to that Trustee at the same address. Communications are not screened before being delivered to the addressee.
AVAILABILITY OF PORTFOLIO HOLDINGS
On each business day, before commencement of trading on the Exchange, the Fund will disclose on www.pgiminvestments.com the Fund’s portfolio holdings that will form the basis for the Fund’s calculation of NAV at the end of the business day. The Fund files its complete schedule of portfolio holdings with the Securities and Exchange Commission for the first and third quarters of each fiscal year as an exhibit to its reports on Form N-PORT. The Fund’s Form N-PORT filings are available on the Commission’s website at sec.gov.
The Fund’s Statement of Additional Information contains additional information about the Fund’s Trustees and is available without charge, upon request, by calling (800) 225-1852.
Funds:
ARE NOT INSURED BY THE FDIC OR ANY FEDERAL GOVERNMENT AGENCY | MAY LOSE VALUE | ARE NOT A DEPOSIT OF OR GUARANTEED BY ANY BANK OR ANY BANK AFFILIATE | ||
PGIM FIXED INCOME ETFS
| Fund | Ticker Symbol | |||
| PGIM Ultra Short Bond ETF | PULS | |||
| PGIM Active High Yield Bond ETF | PHYL | |||
| PGIM Active Aggregate Bond ETF | PAB | |||
ETF1000E

PGIM QMA STRATEGIC ALPHA ETFS
PGIM QMA Strategic Alpha Large-Cap Core ETF
PGIM QMA Strategic Alpha Small-Cap Growth ETF
PGIM QMA Strategic Alpha Small-Cap Value ETF
PGIM QMA Strategic Alpha International Equity ETF
ANNUAL REPORT
AUGUST 31, 2021

To enroll in e-delivery, go to pgim.com/investments/resource/edelivery
|
| 3 | ||||
| 4 | ||||
| 5 | ||||
| 7 | ||||
| 9 | ||||
| 10 | ||||
| 12 | ||||
| 14 | ||||
| 15 | ||||
| 17 | ||||
| 19 | ||||
| 20 | ||||
| 22 | ||||
| 24 | ||||
| 27 | ||||
| 27 | ||||
This report is not authorized for distribution to prospective investors unless preceded or accompanied by a current prospectus.
The views expressed in this report and information about the Fund’s portfolio holdings are for the period covered by this report and are subject to change thereafter.
Exchange-traded funds are distributed by Prudential Investment Management Services LLC, a Prudential Financial company, member SIPC. PGIM Quantitative Solutions is the primary business name of PGIM Quantitative Solutions LLC (formerly known as QMA LLC), a wholly owned subsidiary of PGIM, Inc. (PGIM), a Prudential Financial company. © 2021 Prudential Financial, Inc. and its related entities. PGIM and the PGIM logo are service marks of Prudential Financial, Inc. and its related entities, registered in many jurisdictions worldwide.
| 2 | Visit our website at pgim.com/investments |
| Dear Shareholder:
We hope you find the annual report for the PGIM QMA Strategic Alpha ETFs informative and useful. The report covers performance for the 12-month period that ended August 31, 2021.
The COVID-19 pandemic had a significant impact on the global economy and markets early in 2020, but a dramatic recovery was underway as the summer began. The Federal Reserve slashed interest rates to encourage borrowing. Congress passed stimulus bills worth several trillion dollars to help consumers and businesses. And several effective COVID-19 vaccines received regulatory approval later in the year. |

At the start of the period, stocks had recovered most of the steep losses they had suffered at the onset of the pandemic. Equities rallied as states reopened their economies but became more volatile in the fall as investors worried that a surge in COVID-19 infections would stall the recovery. However, rising corporate profits and economic growth, the resolution of the US presidential election, and the global rollout of approved vaccines lifted equity markets to record levels, helping stocks around the globe post gains for the full period.
Much of the bond market performed well during the period as investors sought safety in fixed income. Investment-grade bonds in the US declined slightly as the economy recovered, but global bonds and emerging market debt rose. While the 10-year US Treasury yield hovered near record lows early in the period after a significant rally in interest rates, rates moved higher later on as investors began to focus on stronger economic growth and the prospects of higher inflation. The Fed also took several aggressive actions to keep the bond markets running smoothly, restarting many of the relief programs that proved to be successful in helping end the global financial crisis in 2008-09.
Regarding your investments with PGIM, we believe it is important to maintain a diversified portfolio of funds consistent with your tolerance for risk, time horizon, and financial goals. Your financial advisor can help you create a diversified investment plan that may include funds covering all the basic asset classes and that reflects your personal investor profile and risk tolerance. However, diversification and asset allocation strategies do not assure a profit or protect against loss in declining markets.
At PGIM Investments, we consider it a great privilege and responsibility to help investors participate in opportunities across global markets while meeting their toughest investment challenges. PGIM is a top-10 global investment manager with more than $1 trillion in assets under management. This scale and investment expertise allow us to deliver actively managed funds and strategies to meet the needs of investors around the globe.
Thank you for choosing our family of funds.
Sincerely,

Stuart S. Parker, President
PGIM QMA Strategic Alpha ETFs
October 15, 2021
PGIM QMA Strategic Alpha ETFs | 3 |
PGIM QMA Strategic Alpha Large-Cap Core ETF
Your Fund’s Performance (unaudited)
Performance data quoted represent past performance. Past performance does not guarantee future results. The investment return and principal value of an investment will fluctuate so that an investor’s shares, when redeemed, may be worth more or less than their original cost. Current performance may be lower or higher than the past performance data quoted. An investor may obtain performance data as of the most recent month-end by visiting our website at pgim.com/investments or by calling (800) 225-1852.
| Average Annual Total Returns as of 8/31/21 | ||||
| One Year (%) | Since Inception (%) | |||
| Net Asset Value (NAV) | 38.14 | 16.86 (10/17/2018) | ||
| Market Price* | 38.09 | 16.88 (10/17/2018) | ||
| S&P 500 Index | 31.16 | 22.00 | ||
*The market price is determined using the midpoint between the highest bid and the lowest offer on the listing exchange, as of the time that the Fund’s NAV is calculated. The first day of secondary market trading is typically several days after the date on which the Fund commenced investment operations; therefore, the NAV of the Fund is used as a proxy for the period from inception of investment operations to the first day of secondary market trading to calculate the market price returns.
Since inception returns for the Index are measured from the closest month-end to the Fund’s inception date.
The returns in the table do not reflect the deduction of taxes that a shareholder would pay on Fund distributions or following the sale or redemption of Fund shares.
Market returns do not include brokerage commissions that may be payable on secondary market transactions. If brokerage commissions were included, market returns would be lower. Market and NAV returns assume that dividends and capital gain distributions, if any, have been reinvested in the Fund at market price and NAV, respectively.
| 4 | Visit our website at pgim.com/investments |
Growth of a $10,000 Investment (unaudited)
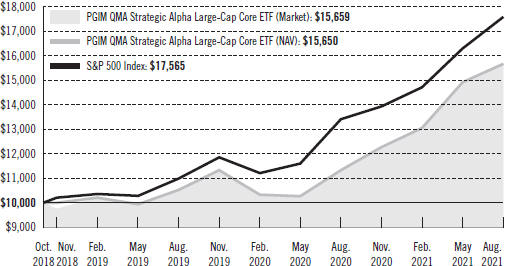
The graph compares a $10,000 investment in the Fund with a similar investment in the S&P 500 Index by portraying the initial account values at the commencement of operations (October 17, 2018) and the account values at the end of the current fiscal year (August 31, 2021), as measured on a quarterly basis. The Fund assumes an initial investment on October 17, 2018, while the benchmark and the Index assume that the initial investment occurred on October 31, 2018. For purposes of the graph, and unless otherwise indicated, it has been assumed that (a) all recurring fees (including management fees) were deducted and (b) all dividends and distributions were reinvested. Without waiver of fees and/or expense reimbursements, if any, the returns would have been lower.
Past performance does not predict future performance. Total returns and the ending account values in the graphs include changes in share price and reinvestment of dividends and capital gains distributions in a hypothetical investment for the periods shown. The Fund’s total returns do not reflect the deduction of income taxes on an individual’s investment. Taxes may reduce your actual investment returns on income or gains paid by the Fund or any gains you may realize if you sell your shares.
PGIM QMA Strategic Alpha ETFs | 5 |
PGIM QMA Strategic Alpha Large-Cap Core ETF
Your Fund’s Performance (continued)
Benchmark Definitions
S&P 500 Index*—The S&P 500 Index is an unmanaged index of over 500 stocks of large US public companies. It gives a broad look at how stock prices in the United States have performed.
*The S&P 500 Index (“Index”) is a product of S&P Dow Jones Indices LLC and/or its affiliates and has been licensed for use by PGIM, Inc. Copyright © 2021 S&P Dow Jones Indices LLC, a division of S&P Global, Inc., and/or its affiliates. All rights reserved. Redistribution or reproduction in whole or in part are prohibited without written permission of S&P Dow Jones Indices LLC. For more information on any of S&P Dow Jones Indices LLC’s indices please visit www.spdji.com. S&P® is a registered trademark of S&P Global and Dow Jones® is a registered trademark of Dow Jones Trademark Holdings LLC.
Investors cannot invest directly in an index. The returns for the Index would be lower if they included the effects of operating expenses or taxes that may be paid by an investor.
Presentation of Fund Holdings as of 8/31/21
| Ten Largest Holdings | Line of Business | % of Net Assets | ||
| Monolithic Power Systems, Inc. | Semiconductors & Semiconductor Equipment | 0.4% | ||
| Synopsys, Inc. | Software | 0.4% | ||
| West Pharmaceutical Services, Inc. | Health Care Equipment & Supplies | 0.4% | ||
| Agilent Technologies, Inc. | Life Sciences Tools & Services | 0.4% | ||
| Nucor Corp. | Metals & Mining | 0.4% | ||
| Keysight Technologies, Inc. | Electronic Equipment, Instruments & Components | 0.4% | ||
| Old Dominion Freight Line, Inc. | Road & Rail | 0.4% | ||
| Motorola Solutions, Inc. | Communications Equipment | 0.4% | ||
| Avery Dennison Corp. | Containers & Packaging | 0.4% | ||
| Pentair plc (United Kingdom) | Machinery | 0.4% | ||
| 6 | Visit our website at pgim.com/investments |
Strategy and Performance Overview (unaudited)
How did the Fund perform?
The PGIM QMA Strategic Alpha Large-Cap Core ETF (the Fund) returned 38.14% based on net asset value in the 12-month reporting period that ended August 31, 2021, outperforming the 31.16% return of the S&P 500 Index (the Index).
What were the market conditions?
US equity markets moved higher during the reporting period, driven by the introduction of effective COVID-19 vaccines and significant fiscal and monetary support. Large-cap stocks underperformed their small- and mid-cap counterparts during the period. Value stocks outperformed growth stocks across all market capitalizations by a significant margin during the period.
What worked?
| • | The Fund added value in eight of the Index’s 11 sectors during the reporting period, exhibiting strong relative performance in the information technology (IT) and consumer discretionary sectors. |
| • | An underweight position relative to the Index in IT stocks, which trailed the Index, aided the Fund’s performance, as did good stock selection in the technology hardware, storage, and peripherals sector. |
| • | In consumer discretionary, an underweight position relative to the Index in underperforming internet and direct marketing retail stocks drove outperformance in the sector. |
| • | Among individual stocks, the Fund’s top contributors to relative performance were internet and direct marketing retail company Amazon.com, Inc.; technology hardware, storage, and peripherals company Apple, Inc.; and textiles, apparel, and luxury goods company Tapestry, Inc. |
What didn’t work?
| • | The Fund’s relative performance during the reporting period was hurt most by poor performance in the communication services and energy sectors. |
| • | In communication services, the Fund’s underweight position relative to the Index in interactive media & services companies hurt results, largely due to an underweight in strong-performing Alphabet, Inc. (Class A and Class C shares). |
| • | In energy, the Fund’s relative performance was hurt by its underweight positions in oil, gas & consumable fuels stocks, which rebounded sharply from their lows early in 2020. |
| • | Among individual stocks, the Fund’s largest detractors were Alphabet, Inc. and JPMorgan Chase & Co. |
PGIM QMA Strategic Alpha ETFs | 7 |
Strategy and Performance Overview (continued)
Current outlook
| • | Domestic equity markets moved meaningfully higher during the reporting period, with value stocks staging a particularly powerful rally, especially during the first quarter of 2021. COVID-19 vaccines have shown significant effectiveness, allowing a reopening of the US economy and improvement in the fortunes of the companies most negatively affected by shutdowns and quarantines. However, as PGIM Quantitative Solutions expected, the recovery has not been linear. In June 2021, investor concerns about COVID-19 variants, lags in vaccination rates, and supply chain interruptions led to a pullback in the more-cyclical stocks that populate the value benchmark indexes and to a bounce in the “stay-at-home” stocks. In addition, Federal Reserve Chairman Jerome Powell’s comments regarding the potential for a shift to less-aggressive monetary policy drove a flattening of the yield curve and moderation in inflation expectations, which both help growth stocks relative to value stocks. |
| • | Although the market’s recent wobble gave some investors pause, PGIM Quantitative Solutions believes the value rally that began last year has significant room to run. In PGIM Quantitative Solutions’ view, COVID-19 cases likely will decline as vaccines are more widely distributed in the US, encouraging well-funded consumers to resume spending. Corporate earnings, especially among more-cyclical companies, are positioned to continue to easily beat analysts’ earnings expectations compared to a year earlier. Additionally, while vaccination rates lag in many regions outside the US, PGIM Quantitative Solutions believes the increasing availability of vaccines will drive a more expanded global economic recovery in the future. |
| 8 | Visit our website at pgim.com/investments |
PGIM QMA Strategic Alpha Small-Cap Growth ETF
Your Fund’s Performance (unaudited)
Performance data quoted represent past performance. Past performance does not guarantee future results. The investment return and principal value of an investment will fluctuate so that an investor’s shares, when redeemed, may be worth more or less than their original cost. Current performance may be lower or higher than the past performance data quoted. An investor may obtain performance data as of the most recent month-end by visiting our website at pgim.com/investments or by calling (800) 225-1852.
| Average Annual Total Returns as of 8/31/21 | ||||
| One Year (%) | Since Inception (%) | |||
| Net Asset Value (NAV) | 47.52 | 16.46 (11/13/2018) | ||
| Market Price* | 47.21 | 16.45 (11/13/2018) | ||
| Russell 2000 Growth Index | 35.61 | 19.56 | ||
*The market price is determined using the midpoint between the highest bid and the lowest offer on the listing exchange, as of the time that the Fund’s NAV is calculated. The first day of secondary market trading is typically several days after the date on which the Fund commenced investment operations; therefore, the NAV of the Fund is used as a proxy for the period from inception of investment operations to the first day of secondary market trading to calculate the market price returns.
Since inception returns for the Index are measured from the closest month-end to the Fund’s inception date.
The returns in the table do not reflect the deduction of taxes that a shareholder would pay on Fund distributions or following the sale or redemption of Fund shares.
Market returns do not include brokerage commissions that may be payable on secondary market transactions. If brokerage commissions were included, market returns would be lower. Market and NAV returns assume that dividends and capital gain distributions, if any, have been reinvested in the Fund at market price and NAV, respectively.
PGIM QMA Strategic Alpha ETFs | 9 |
PGIM QMA Strategic Alpha Small-Cap Growth ETF
Your Fund’s Performance (continued)
Growth of a $10,000 Investment (unaudited)
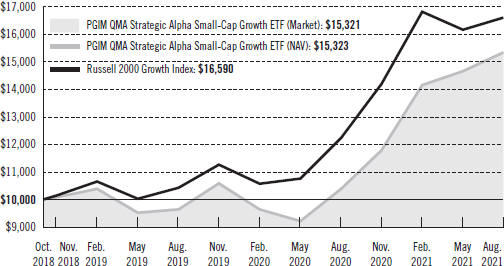
The graph compares a $10,000 investment in the Fund with a similar investment in the Russell 2000 Growth Index by portraying the initial account values at the commencement of operations (November 13, 2018) and the account values at the end of the current fiscal year (August 31, 2021), as measured on a quarterly basis. The Fund assumes an initial investment on November 13, 2018, while the benchmark and the Index assume that the initial investment occurred on October 31, 2018. For purposes of the graph, and unless otherwise indicated, it has been assumed that (a) all recurring fees (including management fees) were deducted and (b) all dividends and distributions were reinvested. Without waiver of fees and/or expense reimbursements, if any, the returns would have been lower.
Past performance does not predict future performance. Total returns and the ending account values in the graphs include changes in share price and reinvestment of dividends and capital gains distributions in a hypothetical investment for the periods shown. The Fund’s total returns do not reflect the deduction of income taxes on an individual’s investment. Taxes may reduce your actual investment returns on income or gains paid by the Fund or any gains you may realize if you sell your shares.
| 10 | Visit our website at pgim.com/investments |
Benchmark Definitions
Russell 2000 Growth Index—The Russell 2000 Growth Index is an unmanaged index which contains those securities in the Russell 2000 Index with an above-average growth orientation. Companies in this Index generally have higher price-to-book and price-to-earnings ratios.
Investors cannot invest directly in an index. The returns for the Index would be lower if they included the effects of operating expenses or taxes that may be paid by an investor.
Presentation of Fund Holdings as of 8/31/21
| Ten Largest Holdings | Line of Business | % of Net Assets | ||
| Trillium Therapeutics, Inc. (Canada) | Biotechnology | 0.5% | ||
| Ryerson Holding Corp. | Metals & Mining | 0.3% | ||
| Crinetics Pharmaceuticals, Inc. | Biotechnology | 0.2% | ||
| CytoSorbents Corp. | Health Care Equipment & Supplies | 0.2% | ||
| BlueLinx Holdings, Inc. | Trading Companies & Distributors | 0.2% | ||
| Kulicke & Soffa Industries, Inc. ( Singapore) | Semiconductors & Semiconductor Equipment | 0.2% | ||
| Cross Country Healthcare, Inc. | Health Care Providers & Services | 0.2% | ||
| Apyx Medical Corp. | Health Care Equipment & Supplies | 0.2% | ||
| STAAR Surgical Co. | Health Care Equipment & Supplies | 0.2% | ||
| Mersana Therapeutics, Inc. | Biotechnology | 0.2% | ||
PGIM QMA Strategic Alpha ETFs | 11 |
Strategy and Performance Overview (unaudited)
How did the Fund perform?
The PGIM QMA Strategic Alpha Small-Cap Growth ETF (the Fund) returned 47.52% based on net asset value in the 12-month reporting period that ended on August 31, 2021, outperforming the 35.61% return of the Russell 2000 Growth Index (the Index).
What were the market conditions?
US equity markets moved higher during the reporting period, driven by the introduction of effective COVID-19 vaccines and significant fiscal and monetary support. Large-cap stocks underperformed their small- and mid-cap counterparts during the period. Value stocks outperformed growth stocks across all market capitalizations by a significant margin during the period.
What worked?
| • | The Fund added value in each of the Index’s 11 sectors during the reporting period, benefiting from favorable security selections in the information technology (IT) and financials sectors. |
| • | In IT, the Fund’s position in IT services and communication equipment aided performance. The Fund’s focus on quality through its profitability measure also helped it avoid some of the poorer performers in this sector during the period. |
| • | In financials, the Fund’s overweight positions in strong-performing capital markets and insurance stocks drove strong relative performance in the sector. |
| • | The Fund’s top individual contributors relative to the Index were medical specialties company iRhythm Technologies, Inc., biotechnology company Lexicon Pharmaceuticals, Inc., and specialty telecommunications company IDT Corp. |
What didn’t work?
| • | There was very little that didn’t work in the Fund during the reporting period, as it meaningfully outperformed the Index in all 11 sectors and exhibited only marginal underperformance in a few industry categories. |
| • | Among individual stocks, the Fund’s largest detractors for the period were electronic components company Plug Power, Inc., pharmaceutical company MyoKardia, Inc., and hotels, restaurants & leisure company Caesars Entertainment, Inc. |
Current outlook
| • | Domestic equity markets moved meaningfully higher during the reporting period, with value stocks staging a particularly powerful rally, especially during the first quarter of 2021. COVID-19 vaccines have shown significant effectiveness, allowing a reopening of the US economy and improvement in the fortunes of the companies most negatively affected by shutdowns and quarantines. However, as PGIM Quantitative Solutions expected, the recovery has not been linear. In June 2021, investor concerns about COVID-19 variants, lags in vaccination rates, and supply chain interruptions led |
| 12 | Visit our website at pgim.com/investments |
| to a pullback in the more-cyclical stocks that populate the value benchmark indexes and to a bounce in the “stay-at-home” stocks. In addition, Federal Reserve Chairman Jerome Powell’s comments regarding the potential for a shift to less-aggressive monetary policy drove a flattening of the yield curve and moderation in inflation expectations, which both help growth stocks relative to value stocks. |
| • | Although the market’s recent wobble gave some investors pause, PGIM Quantitative Solutions believes the value rally that began last year has significant room to run. In PGIM Quantitative Solutions’ view, COVID-19 cases likely will decline as vaccines are more widely distributed in the US, encouraging well-funded consumers to resume spending. Corporate earnings, especially among more-cyclical companies, are positioned to continue to easily beat analysts’ earnings expectations compared to a year earlier. Additionally, while vaccination rates lag in many regions outside the US, PGIM Quantitative Solutions believes the increasing availability of vaccines will drive a more expanded global economic recovery in the future. |
PGIM QMA Strategic Alpha ETFs | 13 |
PGIM QMA Strategic Alpha Small-Cap Value ETF
Your Fund’s Performance (unaudited)
Performance data quoted represent past performance. Past performance does not guarantee future results. The investment return and principal value of an investment will fluctuate so that an investor’s shares, when redeemed, may be worth more or less than their original cost. Current performance may be lower or higher than the past performance data quoted. An investor may obtain performance data as of the most recent month-end by visiting our website at pgim.com/investments or by calling (800) 225-1852.
| Average Annual Total Returns as of 8/31/21 | ||||
| One Year (%) | Since Inception (%) | |||
| Net Asset Value (NAV) | 63.26 | 13.24 (11/13/2018) | ||
| Market Price* | 63.04 | 13.24 (11/13/2018) | ||
| Russell 2000 Value Index | 59.49 | 13.59 | ||
*The market price is determined using the midpoint between the highest bid and the lowest offer on the listing exchange, as of the time that the Fund’s NAV is calculated. The first day of secondary market trading is typically several days after the date on which the Fund commenced investment operations; therefore, the NAV of the Fund is used as a proxy for the period from inception of investment operations to the first day of secondary market trading to calculate the market price returns.
Since inception returns for the Index are measured from the closest month-end to the Fund’s inception date.
The returns in the table do not reflect the deduction of taxes that a shareholder would pay on Fund distributions or following the sale or redemption of Fund shares.
Market returns do not include brokerage commissions that may be payable on secondary market transactions. If brokerage commissions were included, market returns would be lower. Market and NAV returns assume that dividends and capital gain distributions, if any, have been reinvested in the Fund at market price and NAV, respectively.
| 14 | Visit our website at pgim.com/investments |
Growth of a $10,000 Investment (unaudited)
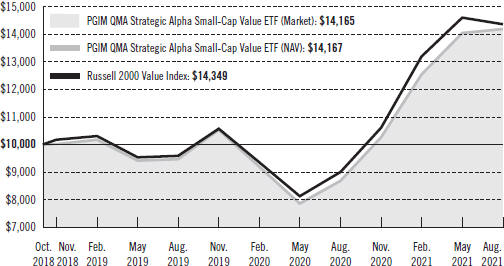
The graph compares a $10,000 investment in the Fund with a similar investment in the Russell 2000 Value Index by portraying the initial account values at the commencement of operations (November 13, 2018) and the account values at the end of the current fiscal year (August 31, 2021), as measured on a quarterly basis. The Fund assumes an initial investment on November 13, 2018, while the benchmark and the Index assume that the initial investment occurred on October 31, 2018. For purposes of the graph, and unless otherwise indicated, it has been assumed that (a) all recurring fees (including management fees) were deducted and (b) all dividends and distributions were reinvested. Without waiver of fees and/or expense reimbursements, if any, the returns would have been lower.
Past performance does not predict future performance. Total returns and the ending account values in the graphs include changes in share price and reinvestment of dividends and capital gains distributions in a hypothetical investment for the periods shown. The Fund’s total returns do not reflect the deduction of income taxes on an individual’s investment. Taxes may reduce your actual investment returns on income or gains paid by the Fund or any gains you may realize if you sell your shares.
PGIM QMA Strategic Alpha ETFs | 15 |
PGIM QMA Strategic Alpha Small-Cap Value ETF
Your Fund’s Performance (continued)
Benchmark Definitions
Russell 2000 Value Index—The Russell 2000® Value Index is an unmanaged index which contains those securities in the Russell 2000 Index with a below-average growth orientation. Companies in this Index generally have low price-to-book and price-to-earnings ratios, higher dividend yields, and lower forecasted growth rates.
Investors cannot invest directly in an index. The returns for the Index would be lower if they included the effects of operating expenses or taxes that may be paid by an investor.
Presentation of Fund Holdings as of 8/31/21
| Ten Largest Holdings | Line of Business | % of Net Assets | ||
| Fulcrum Therapeutics, Inc. | Pharmaceuticals | 0.6% | ||
| Kezar Life Sciences, Inc. | Biotechnology | 0.2% | ||
| Ryerson Holding Corp. | Metals & Mining | 0.2% | ||
Triple-S Management Corp. (Puerto Rico) (Class B Stock) | Health Care Providers & Services | 0.2% | ||
| Cardiff Oncology, Inc. | Biotechnology | 0.2% | ||
| Costamare, Inc. (Monaco) | Marine | 0.2% | ||
| Veritiv Corp. | Trading Companies & Distributors | 0.2% | ||
| Praxis Precision Medicines, Inc. | Biotechnology | 0.2% | ||
| City Office REIT, Inc. (Canada) | Equity Real Estate Investment Trusts (REITs) | 0.2% | ||
| Cross Country Healthcare, Inc. | Health Care Providers & Services | 0.2% | ||
| 16 | Visit our website at pgim.com/investments |
Strategy and Performance Overview (unaudited)
How did the Fund perform?
The PGIM QMA Strategic Alpha Small-Cap Value ETF (the Fund) returned 63.26% based on net asset value in the 12-month reporting period that ended on August 31, 2021, outperforming the 59.49% return of the Russell 2000 Value Index (the Index).
What were the market conditions?
US equity markets moved higher during the reporting period, driven by the introduction of effective COVID-19 vaccines and significant fiscal and monetary support. Large-cap stocks underperformed their small- and mid-cap counterparts during the period. Value stocks outperformed growth stocks across all market capitalizations by a significant margin during the period.
What worked?
| • | The Fund added value in six of the Index’s 11 sectors during the reporting period, benefiting from favorable positions in the financials and healthcare sectors. |
| • | In the financials sector, the Fund’s performance was aided by a significant overweight position relative to the Index and strong stock selections in the banking and diversified financial industries. In healthcare, the Fund benefited from good stock picks in the life sciences and pharmaceutical industries. |
| • | The Fund’s top individual contributors to relative performance were pharmaceutical company Fulcrum Therapeutics, Inc., biotechnology company Arena Pharmaceuticals, Inc., and media company Entravision Communications Corp. |
What didn’t work?
| • | The Fund’s relative performance during the reporting period was hurt most by poor performance in the consumer discretionary and materials sectors. |
| • | Consumer discretionary stocks outperformed the Index during the period. However, the Fund’s underweight relative position—especially in hotel, restaurant, and leisure stocks—was a damper on overall performance. |
| • | In materials, the Fund was hurt by an underweight position in the strong-performing metals & mining industry. The largest detractors at the stock level were entertainment company AMC Entertainment Holdings, Inc., specialty retail company GameStop Corp., and metals & mining company Cleveland-Cliffs, Inc. |
Current outlook
| • | Domestic equity markets moved meaningfully higher during the reporting period, with value stocks staging a particularly powerful rally, especially during the first quarter of 2021. COVID-19 vaccines have shown significant effectiveness, allowing a reopening of the US economy and improvement in the fortunes of the companies most negatively affected by shutdowns and quarantines. However, as PGIM Quantitative Solutions expected, the recovery has not been linear. In June 2021, investor concerns |
PGIM QMA Strategic Alpha ETFs | 17 |
Strategy and Performance Overview (continued)
| about COVID-19 variants, lags in vaccination rates, and supply chain interruptions led to a pullback in the more-cyclical stocks that populate the value benchmark indexes and to a bounce in the “stay-at-home” stocks. In addition, Federal Reserve Chairman Jerome Powell’s comments regarding the potential for a shift to less-aggressive monetary policy drove a flattening of the yield curve and moderation in inflation expectations, which both help growth stocks relative to value stocks. |
| • | Although the market’s recent wobble gave some investors pause, PGIM Quantitative Solutions believes the value rally that began last year has significant room to run. In PGIM Quantitative Solutions’ view, COVID-19 cases likely will decline as vaccines are more widely distributed in the US, encouraging well-funded consumers to resume spending. Corporate earnings, especially among more-cyclical companies, are positioned to continue to easily beat analysts’ earnings expectations compared to a year earlier. Additionally, while vaccination rates lag in many regions outside the US, PGIM Quantitative Solutions believes the increasing availability of vaccines will drive a more expanded global economic recovery in the future. |
| 18 | Visit our website at pgim.com/investments |
PGIM QMA Strategic Alpha International Equity ETF
Your Fund’s Performance (unaudited)
Performance data quoted represent past performance. Past performance does not guarantee future results. The investment return and principal value of an investment will fluctuate so that an investor’s shares, when redeemed, may be worth more or less than their original cost. Current performance may be lower or higher than the past performance data quoted. An investor may obtain performance data as of the most recent month-end by visiting our website at pgim.com/investments or by calling (800) 225-1852.
| Average Annual Total Returns as of 8/31/21 | ||||
| One Year (%) | Since Inception (%) | |||
| Net Asset Value (NAV) | 24.43 | 11.08 (12/04/2018) | ||
| Market Price* | 24.79 | 11.10 (12/04/2018) | ||
| MSCI EAFE Index | 26.12 | 12.92 | ||
*The market price is determined using the midpoint between the highest bid and the lowest offer on the listing exchange, as of the time that the Fund’s NAV is calculated. The first day of secondary market trading is typically several days after the date on which the Fund commenced investment operations; therefore, the NAV of the Fund is used as a proxy for the period from inception of investment operations to the first day of secondary market trading to calculate the market price returns.
Since inception returns for the Index are measured from the closest month-end to the Fund’s inception date.
The returns in the table do not reflect the deduction of taxes that a shareholder would pay on Fund distributions or following the sale or redemption of Fund shares.
Market returns do not include brokerage commissions that may be payable on secondary market transactions. If brokerage commissions were included, market returns would be lower. Market and NAV returns assume that dividends and capital gain distributions, if any, have been reinvested in the Fund at market price and NAV, respectively.
PGIM QMA Strategic Alpha ETFs | 19 |
PGIM QMA Strategic Alpha International Equity ETF
Your Fund’s Performance (continued)
Growth of a $10,000 Investment (unaudited)
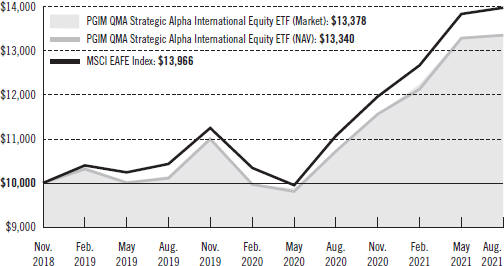
The graph compares a $10,000 investment in the Fund with a similar investment in the MSCI EAFE Index by portraying the initial account values at the commencement of operations (December 4, 2018) and the account values at the end of the current fiscal year (August 31, 2021), as measured on a quarterly basis. The Fund assumes an initial investment on December 4, 2018, while the benchmark and the Index assume that the initial investment occurred on November 30, 2018. For purposes of the graph, and unless otherwise indicated, it has been assumed that (a) all recurring fees (including management fees) were deducted and (b) all dividends and distributions were reinvested. Without waiver of fees and/or expense reimbursements, if any, the returns would have been lower.
Past performance does not predict future performance. Total returns and the ending account values in the graphs include changes in share price and reinvestment of dividends and capital gains distributions in a hypothetical investment for the periods shown. The Fund’s total returns do not reflect the deduction of income taxes on an individual’s investment. Taxes may reduce your actual investment returns on income or gains paid by the Fund or any gains you may realize if you sell your shares.
| 20 | Visit our website at pgim.com/investments |
Benchmark Definitions
MSCI EAFE Index—The MSCI EAFE Index is a free-float-adjusted market capitalization index that is designed to measure the equity performance of developed markets, excluding the US and Canada.
Investors cannot invest directly in an index. The returns for the Index would be lower if they included the effects of operating expenses or taxes that may be paid by an investor.
Presentation of Fund Holdings as of 8/31/21
| Ten Largest Holdings | Line of Business | Country | % of Net Assets | |||
| Wm Morrison Supermarkets plc | Food & Staples Retailing | United Kingdom | 0.3% | |||
| Daikin Industries Ltd. | Building Products | Japan | 0.3% | |||
| Eurofins Scientific SE | Life Sciences Tools & Services | Luxembourg | 0.3% | |||
| Shimano, Inc. | Leisure Products | Japan | 0.3% | |||
| Wolters Kluwer NV | Professional Services | Netherlands | 0.3% | |||
| Merck KGaA | Pharmaceuticals | Germany | 0.3% | |||
| Segro plc | Equity Real Estate Investment Trusts (REITs) | United Kingdom | 0.3% | |||
| Nippon Sanso Holdings Corp. | Chemicals | Japan | 0.3% | |||
| Spirax-Sarco Engineering plc | Machinery | United Kingdom | 0.3% | |||
| DiaSorin SpA | Health Care Equipment & Supplies | Italy | 0.3% | |||
PGIM QMA Strategic Alpha ETFs | 21 |
Strategy and Performance Overview (unaudited)
How did the Fund perform?
The PGIM QMA Strategic Alpha International Equity ETF (the Fund) returned 24.43% based on net asset value in the 12-month reporting period that ended on August 31, 2021, underperforming the 26.12% return of the MSCI EAFE Index (the Index).
What were the market conditions?
Developed international equity markets moved higher during the reporting period but exhibited a significant increase in volatility amid the global outbreak of COVID-19. Large-cap stocks generally outperformed their small- and mid-cap counterparts during the period. Value stocks underperformed growth stocks across all market capitalizations.
What worked?
| • | The Fund added value in four of the Index’s 11 sectors during the reporting period, benefiting from good relative performance in the healthcare and industrials sectors. |
| • | A meaningful underweight position relative to the Index in the underperforming healthcare sector, along with good security selection in the sector, aided the Fund’s performance. |
| • | The Fund’s results were also helped by its overweight relative position in industrials, one of the Index’s better-performing sectors. Holdings in marine and building products stocks performed especially well. |
| • | Among individual stocks, the Fund’s top relative contributors to performance were food products company Nestle N.A., software company SAP SE, and aerospace and marine company Nippon Yusen Kabushiki Kaisha. |
What didn’t work?
| • | The Fund’s relative performance during the reporting period was hurt most by holdings in the financials and information technology (IT) sectors. |
| • | In financials, which was among the better-performing Index sectors, the Fund performed well from a security selection standpoint. However, an underweight position in these stocks drove the Fund’s underperformance in the sector. |
| • | In IT, performance was hindered by the Fund’s underweight relative position in these generally very expensive stocks, especially those in the semiconductor & semiconductor equipment industry. |
| • | Among individual stocks, the Fund’s largest detractors were semiconductor & semiconductor equipment company ASML Holding NV, textiles, apparel & luxury goods company LVMH Moet Hennessy Louis Vuitton SE, and multi-utility company AGL Energy Limited. |
Current outlook
| • | International equity markets moved meaningfully higher during the reporting period, especially during the first quarter of 2021. COVID-19 vaccines have shown significant |
| 22 | Visit our website at pgim.com/investments |
| effectiveness, although slow distribution has hampered the economic recovery in many countries. As PGIM Quantitative Solutions expected, the recovery has not been linear. In the second quarter of 2021, investor concerns about rising infection rates due to COVID-19 variants, lags in vaccine supplies, and supply chain interruptions led to pullbacks in a number of markets. Along with the reduction of government support payments from 2020 levels, the recovery in international markets has lagged that in the US and other regions where vaccines have been more widely available and fiscal stimulus has been greater. |
| • | Although the market’s recent wobble gave some investors pause, PGIM Quantitative Solutions believes the recovery rally that began last year has significant room to run. In PGIM Quantitative Solutions’ view, COVID-19 cases likely will decline as vaccines are more widely distributed globally, allowing companies to resume more normal operations. Corporate earnings, especially among more-cyclical companies, are positioned to continue to beat analysts’ earnings expectations compared to a year earlier. Additionally, while vaccination rates lag in many regions outside the US, PGIM Quantitative Solutions believes the increasing availability of vaccines will drive a more expanded global economic recovery in the future. |
PGIM QMA Strategic Alpha ETFs | 23 |
As a shareholder of a Fund, you incur ongoing costs, including investment management fees. This example is intended to help you understand your ongoing costs (in dollars) of investing in a Fund and to compare these costs with the ongoing costs of investing in other funds.
The example is based on an investment of $1,000 held through the six-month period ended August 31, 2021. The example is for illustrative purposes only.
Actual Expenses
The first line in the tables below provides information about actual account values and actual expenses. You may use the information on this line, together with the amount you invested, to estimate the expenses that you paid over the period. Simply divide your account value by $1,000 (for example, an $8,600 account value ÷ $1,000 = 8.6), then multiply the result by the number on the first line under the heading “Expenses Paid During the Six-Month Period” to estimate the expenses you paid on your account during this period.
Hypothetical Example for Comparison Purposes
The second line in the tables below provides information about hypothetical account values and hypothetical expenses based on a Fund’s actual expense ratio and an assumed rate of return of 5% per year before expenses, which is not a Fund’s actual return. The hypothetical account values and expenses may not be used to estimate the actual ending account balance or expenses you paid for the period. You may use this information to compare the ongoing costs of investing in a Fund and other funds. To do so, compare this 5% hypothetical example with the 5% hypothetical examples that appear in the shareholder reports of the other funds.
Please note that the expenses shown in the tables are meant to highlight your ongoing costs only and do not reflect any transactional costs, brokerage commissions paid on purchases and sales of Fund shares. Therefore, the ending account values and expenses paid for the period are useful in comparing ongoing costs only and will not help you determine the relative total costs of owning different funds. In addition, if these transactional costs were included, your costs would have been higher.
PGIM QMA Strategic
| Beginning
| Ending
| Annualized Expense
| Expenses Paid
| ||||
Actual | $1,000.00 | $1,200.20 | 0.17% | $0.94 | ||||
Hypothetical
| $1,000.00
| $1,024.35
| 0.17%
| $0.87
| ||||
| 24 | Visit our website at pgim.com/investments |
PGIM QMA Strategic
| Beginning Account Value March 1, 2021
| Ending Account Value August 31, 2021
| Annualized Expense Ratio Based on the Six-Month Period
| Expenses Paid During the Six-Month Period*
| ||||
Actual | $1,000.00 | $1,082.90 | 0.29% | $1.52 | ||||
Hypothetical
| $1,000.00
| $1,023.74
| 0.29%
| $1.48
| ||||
PGIM QMA Strategic
| Beginning Account Value March 1, 2021
| Ending Account Value August 31, 2021
| Annualized Expense Ratio Based on the Six-Month Period
| Expenses Paid During the Six-Month Period*
| ||||
Actual | $1,000.00 | $1,130.80 | 0.29% | $1.56 | ||||
Hypothetical
| $1,000.00
| $1,023.74
| 0.29%
| $1.48
| ||||
PGIM QMA Strategic
| Beginning
| Ending Account Value
| Annualized Expense Ratio Based on the Six-Month Period
| Expenses Paid During the Six-Month Period*
| ||||
Actual | $1,000.00 | $1,100.70 | 0.29% | $1.54 | ||||
Hypothetical
| $1,000.00
| $1,023.74
| 0.29%
| $1.48
| ||||
*Fund expenses (net of fee waivers or subsidies, if any) are equal to the annualized expense ratio (provided in the table), multiplied by the average account value over the period, multiplied by the 184 days in the six-month period ended August 31, 2021, and divided by the 365 days in the Fund’s fiscal year ended August 31, 2021 (to reflect the six-month period). Expenses presented in the table include the expenses of any underlying portfolios in which the Fund may invest.
PGIM QMA Strategic Alpha ETFs | 25 |
PGIM QMA Strategic Alpha Large-Cap Core ETF
Schedule of Investments
as of August 31, 2021
| Description | Shares | Value | ||||||
| LONG-TERM INVESTMENTS 99.5% | ||||||||
| COMMON STOCKS 99.5% | ||||||||
| Aerospace & Defense 2.5% | ||||||||
General Dynamics Corp. | 286 | $ | 57,289 | |||||
Huntington Ingalls Industries, Inc. | 249 | 50,838 | ||||||
L3Harris Technologies, Inc. | 236 | 54,990 | ||||||
Lockheed Martin Corp. | 128 | 46,055 | ||||||
Northrop Grumman Corp. | 146 | 53,684 | ||||||
Raytheon Technologies Corp. | 599 | 50,771 | ||||||
Textron, Inc. | 757 | 55,011 | ||||||
|
| |||||||
| 368,638 | ||||||||
| Air Freight & Logistics 0.3% | ||||||||
FedEx Corp. | 170 | 45,167 | ||||||
| Auto Components 0.3% | ||||||||
BorgWarner, Inc. | 1,098 | 46,863 | ||||||
| Banks 3.4% | ||||||||
Citigroup, Inc. | 699 | 50,265 | ||||||
Citizens Financial Group, Inc. | 1,111 | 48,651 | ||||||
Comerica, Inc. | 714 | 52,772 | ||||||
Fifth Third Bancorp | 1,410 | 54,792 | ||||||
KeyCorp | 2,687 | 54,600 | ||||||
Regions Financial Corp. | 2,431 | 49,665 | ||||||
Truist Financial Corp. | 847 | 48,330 | ||||||
US Bancorp | 859 | 49,298 | ||||||
Wells Fargo & Co. | 1,130 | 51,641 | ||||||
Zions Bancorp NA | 912 | 52,805 | ||||||
|
| |||||||
| 512,819 | ||||||||
| Beverages 1.3% | ||||||||
Coca-Cola Co. (The) | 883 | 49,722 | ||||||
Molson Coors Beverage Co. (Class B Stock) | 1,040 | 49,431 | ||||||
Monster Beverage Corp.* | 546 | 53,273 | ||||||
PepsiCo, Inc. | 310 | 48,481 | ||||||
|
| |||||||
| 200,907 | ||||||||
| Biotechnology 2.5% | ||||||||
AbbVie, Inc. | 456 | 55,076 | ||||||
Amgen, Inc. | 194 | 43,753 | ||||||
Biogen, Inc.* | 156 | 52,870 | ||||||
Gilead Sciences, Inc. | 752 | 54,730 | ||||||
Incyte Corp.* | 681 | 52,090 | ||||||
See Notes to Financial Statements.
PGIM QMA Strategic Alpha ETFs | 27 |
PGIM QMA Strategic Alpha Large-Cap Core ETF
Schedule of Investments (continued)
as of August 31, 2021
| Description | Shares | Value | ||||||
| COMMON STOCKS (Continued) | ||||||||
| Biotechnology (cont'd.) | ||||||||
Regeneron Pharmaceuticals, Inc.* | 90 | $ | 60,606 | |||||
Vertex Pharmaceuticals, Inc.* | 256 | 51,274 | ||||||
|
| |||||||
| 370,399 | ||||||||
| Building Products 1.8% | ||||||||
Allegion PLC (Ireland) | 380 | 54,716 | ||||||
Carrier Global Corp. | 1,001 | 57,658 | ||||||
Fortune Brands Home & Security, Inc. | 483 | 47,030 | ||||||
Johnson Controls International PLC | 735 | 54,978 | ||||||
Trane Technologies PLC (Ireland) | 259 | 51,411 | ||||||
|
| |||||||
| 265,793 | ||||||||
| Capital Markets 2.3% | ||||||||
Bank of New York Mellon Corp. (The) | 1,070 | 59,085 | ||||||
Franklin Resources, Inc. | 1,767 | 57,322 | ||||||
Invesco Ltd. | 2,144 | 54,286 | ||||||
Moody’s Corp. | 137 | 52,166 | ||||||
State Street Corp. | 608 | 56,489 | ||||||
T Rowe Price Group, Inc. | 255 | 57,087 | ||||||
|
| |||||||
| 336,435 | ||||||||
| Chemicals 1.7% | ||||||||
Celanese Corp. (Class A Stock) | 328 | 52,021 | ||||||
Dow, Inc. | 839 | 52,773 | ||||||
DuPont de Nemours, Inc. | 644 | 47,669 | ||||||
Eastman Chemical Co. | 469 | 53,072 | ||||||
LyondellBasell Industries NV (Class A Stock) | 525 | 52,684 | ||||||
|
| |||||||
| 258,219 | ||||||||
| Commercial Services & Supplies 1.4% | ||||||||
Cintas Corp. | 131 | 51,846 | ||||||
Copart, Inc.* | 356 | 51,378 | ||||||
Republic Services, Inc. (Class A Stock) | 460 | 57,100 | ||||||
Rollins, Inc. | 1,424 | 55,422 | ||||||
|
| |||||||
| 215,746 | ||||||||
| Communications Equipment 1.5% | ||||||||
Cisco Systems, Inc. | 911 | 53,767 | ||||||
F5 Networks, Inc.* | 254 | 51,707 | ||||||
Juniper Networks, Inc. | 1,913 | 55,439 | ||||||
Motorola Solutions, Inc. | 251 | 61,299 | ||||||
|
| |||||||
| 222,212 | ||||||||
See Notes to Financial Statements.
| 28 |
| Description | Shares | Value | ||||||
| COMMON STOCKS (Continued) | ||||||||
| Construction & Engineering 0.4% | ||||||||
Quanta Services, Inc. | 556 | $ | 56,768 | |||||
| Construction Materials 0.7% | ||||||||
Martin Marietta Materials, Inc. | 140 | 53,375 | ||||||
Vulcan Materials Co. | 294 | 54,663 | ||||||
|
| |||||||
| 108,038 | ||||||||
| Consumer Finance 0.7% | ||||||||
American Express Co. | 300 | 49,788 | ||||||
Capital One Financial Corp. | 320 | 53,110 | ||||||
|
| |||||||
| 102,898 | ||||||||
| Containers & Packaging 1.9% | ||||||||
Avery Dennison Corp. | 271 | 61,081 | ||||||
International Paper Co. | 884 | 53,119 | ||||||
Packaging Corp. of America | 351 | 53,247 | ||||||
Sealed Air Corp. | 954 | 58,222 | ||||||
Westrock Co. | 1,046 | 54,434 | ||||||
|
| |||||||
| 280,103 | ||||||||
| Distributors 1.1% | ||||||||
Genuine Parts Co. | 423 | 51,686 | ||||||
LKQ Corp.* | 1,039 | 54,745 | ||||||
Pool Corp. | 118 | 58,328 | ||||||
|
| |||||||
| 164,759 | ||||||||
| Diversified Financial Services 0.4% | ||||||||
Berkshire Hathaway, Inc. (Class B Stock)* | 184 | 52,582 | ||||||
| Diversified Telecommunication Services 1.0% | ||||||||
AT&T, Inc. | 1,844 | 50,563 | ||||||
Lumen Technologies, Inc. | 3,901 | 47,982 | ||||||
Verizon Communications, Inc. | 849 | 46,695 | ||||||
|
| |||||||
| 145,240 | ||||||||
| Electric Utilities 3.2% | ||||||||
Edison International | 910 | 52,634 | ||||||
Entergy Corp. | 493 | 54,531 | ||||||
Evergy, Inc. | 784 | 53,665 | ||||||
Exelon Corp. | 1,090 | 53,432 | ||||||
FirstEnergy Corp. | 1,338 | 52,008 | ||||||
NRG Energy, Inc. | 1,264 | 57,727 | ||||||
See Notes to Financial Statements.
PGIM QMA Strategic Alpha ETFs | 29 |
PGIM QMA Strategic Alpha Large-Cap Core ETF
Schedule of Investments (continued)
as of August 31, 2021
| Description | Shares | Value | ||||||
| COMMON STOCKS (Continued) | ||||||||
| Electric Utilities (cont'd.) | ||||||||
PPL Corp. | 1,810 | $ | 53,123 | |||||
Southern Co. (The) | 764 | 50,218 | ||||||
Xcel Energy, Inc. | 703 | 48,331 | ||||||
|
| |||||||
| 475,669 | ||||||||
| Electrical Equipment 1.5% | ||||||||
AMETEK, Inc. | 368 | 50,037 | ||||||
Eaton Corp. PLC | 345 | 58,084 | ||||||
Emerson Electric Co. | 549 | 57,919 | ||||||
Rockwell Automation, Inc. | 177 | 57,605 | ||||||
|
| |||||||
| 223,645 | ||||||||
| Electronic Equipment, Instruments & Components 2.6% | ||||||||
Amphenol Corp. (Class A Stock) | 684 | 52,415 | ||||||
CDW Corp. | 272 | 54,566 | ||||||
Corning, Inc. | 1,283 | 51,307 | ||||||
Keysight Technologies, Inc.* | 345 | 61,886 | ||||||
Teledyne Technologies, Inc.* | 111 | 51,435 | ||||||
Trimble, Inc.* | 612 | 57,663 | ||||||
Zebra Technologies Corp. (Class A Stock)* | 98 | 57,543 | ||||||
|
| |||||||
| 386,815 | ||||||||
| Energy Equipment & Services 0.4% | ||||||||
Baker Hughes Co. (Class A Stock) | 2,517 | 57,337 | ||||||
| Entertainment 1.4% | ||||||||
Activision Blizzard, Inc. | 618 | 50,905 | ||||||
Electronic Arts, Inc. | 355 | 51,550 | ||||||
Netflix, Inc.* | 100 | 56,919 | ||||||
Take-Two Interactive Software, Inc.* | 279 | 44,980 | ||||||
|
| |||||||
| 204,354 | ||||||||
| Equity Real Estate Investment Trusts (REITs) 5.4% | ||||||||
American Tower Corp. | 181 | 52,883 | ||||||
AvalonBay Communities, Inc. | 228 | 52,344 | ||||||
Crown Castle International Corp. | 271 | 52,761 | ||||||
Duke Realty Corp. | 1,106 | 58,076 | ||||||
Equity Residential | 613 | 51,535 | ||||||
Essex Property Trust, Inc. | 157 | 51,926 | ||||||
Extra Space Storage, Inc. | 302 | 56,447 | ||||||
Healthpeak Properties, Inc. | 1,407 | 50,652 | ||||||
Prologis, Inc. | 430 | 57,904 | ||||||
See Notes to Financial Statements.
| 30 |
| Description | Shares | Value | ||||||
| COMMON STOCKS (Continued) | ||||||||
| Equity Real Estate Investment Trusts (REITs) (cont'd.) | ||||||||
Public Storage | 166 | $ | 53,719 | |||||
Regency Centers Corp. | 796 | 54,622 | ||||||
SBA Communications Corp. (Class A Stock) | 153 | 54,922 | ||||||
Ventas, Inc. | 866 | 48,444 | ||||||
Welltower, Inc. | 589 | 51,555 | ||||||
Weyerhaeuser Co. | 1,492 | 53,712 | ||||||
|
| |||||||
| 801,502 | ||||||||
| Food & Staples Retailing 1.1% | ||||||||
Kroger Co. (The) | 1,302 | 59,931 | ||||||
Walgreens Boots Alliance, Inc. | 1,003 | 50,902 | ||||||
Walmart, Inc. | 355 | 52,576 | ||||||
|
| |||||||
| 163,409 | ||||||||
| Food Products 3.0% | ||||||||
Archer-Daniels-Midland Co. | 883 | 52,980 | ||||||
Conagra Brands, Inc. | 1,520 | 50,342 | ||||||
General Mills, Inc. | 873 | 50,468 | ||||||
Hershey Co. (The) | 308 | 54,732 | ||||||
JM Smucker Co. (The) | 381 | 47,118 | ||||||
Kellogg Co. | 816 | 51,522 | ||||||
Kraft Heinz Co. (The) | 1,226 | 44,124 | ||||||
Mondelez International, Inc. (Class A Stock) | 770 | 47,794 | ||||||
Tyson Foods, Inc. (Class A Stock) | 656 | 51,509 | ||||||
|
| |||||||
| 450,589 | ||||||||
| Gas Utilities 0.3% | ||||||||
Atmos Energy Corp. | 483 | 47,097 | ||||||
| Health Care Equipment & Supplies 6.4% | ||||||||
Abbott Laboratories | 434 | 54,845 | ||||||
ABIOMED, Inc.* | 151 | 54,958 | ||||||
Align Technology, Inc.* | 83 | 58,847 | ||||||
Baxter International, Inc. | 633 | 48,247 | ||||||
Becton Dickinson & Co. | 192 | 48,326 | ||||||
Boston Scientific Corp.* | 1,153 | 52,058 | ||||||
Cooper Cos., Inc. (The) | 124 | 55,888 | ||||||
Danaher Corp. | 179 | 58,025 | ||||||
DENTSPLY SIRONA, Inc. | 803 | 49,545 | ||||||
Edwards Lifesciences Corp.* | 473 | 55,426 | ||||||
Hologic, Inc.* | 646 | 51,131 | ||||||
IDEXX Laboratories, Inc.* | 76 | 51,206 | ||||||
See Notes to Financial Statements.
PGIM QMA Strategic Alpha ETFs | 31 |
PGIM QMA Strategic Alpha Large-Cap Core ETF
Schedule of Investments (continued)
as of August 31, 2021
| Description | Shares | Value | ||||||
| COMMON STOCKS (Continued) | ||||||||
| Health Care Equipment & Supplies (cont'd.) | ||||||||
Intuitive Surgical, Inc.* | 54 | $ | 56,892 | |||||
Medtronic PLC (Ireland) | 393 | 52,458 | ||||||
STERIS PLC | 226 | 48,592 | ||||||
Stryker Corp. | 178 | 49,324 | ||||||
West Pharmaceutical Services, Inc. | 145 | 65,485 | ||||||
Zimmer Biomet Holdings, Inc. | 319 | 47,993 | ||||||
|
| |||||||
| 959,246 | ||||||||
| Health Care Providers & Services 3.4% | ||||||||
Anthem, Inc. | 131 | 49,142 | ||||||
Centene Corp.* | 758 | 47,739 | ||||||
Cigna Corp. | 227 | 48,045 | ||||||
CVS Health Corp. | 616 | 53,216 | ||||||
Henry Schein, Inc.* | 702 | 53,064 | ||||||
Humana, Inc. | 105 | 42,569 | ||||||
Laboratory Corp. of America Holdings* | 194 | 58,856 | ||||||
Quest Diagnostics, Inc. | 378 | 57,770 | ||||||
UnitedHealth Group, Inc. | 118 | 49,120 | ||||||
Universal Health Services, Inc. (Class B Stock) | 336 | 52,335 | ||||||
|
| |||||||
| 511,856 | ||||||||
| Health Care Technology 0.3% | ||||||||
Cerner Corp. | 664 | 50,696 | ||||||
| Hotels, Restaurants & Leisure 0.7% | ||||||||
McDonald’s Corp. | 203 | 48,204 | ||||||
Yum! Brands, Inc. | 398 | 52,150 | ||||||
|
| |||||||
| 100,354 | ||||||||
| Household Durables 2.1% | ||||||||
DR Horton, Inc. | 518 | 49,531 | ||||||
Lennar Corp. (Class A Stock) | 517 | 55,479 | ||||||
Mohawk Industries, Inc.* | 248 | 49,045 | ||||||
NVR, Inc.* | 11 | 56,979 | ||||||
PulteGroup, Inc. | 909 | 48,959 | ||||||
Whirlpool Corp. | 222 | 49,180 | ||||||
|
| |||||||
| 309,173 | ||||||||
| Independent Power & Renewable Electricity Producers 0.3% | ||||||||
AES Corp. (The) | 2,139 | 51,058 | ||||||
See Notes to Financial Statements.
| 32 |
| Description | Shares | Value | ||||||
| COMMON STOCKS (Continued) | ||||||||
| Industrial Conglomerates 1.0% | ||||||||
3M Co. | 253 | $ | 49,269 | |||||
Honeywell International, Inc. | 211 | 48,933 | ||||||
Roper Technologies, Inc. | 106 | 51,228 | ||||||
|
| |||||||
| 149,430 | ||||||||
| Insurance 3.6% | ||||||||
Allstate Corp. (The) | 367 | 49,648 | ||||||
Chubb Ltd. (Switzerland) | 307 | 56,463 | ||||||
Everest Re Group Ltd. (Bermuda) | 212 | 56,159 | ||||||
Globe Life, Inc. | 556 | 53,415 | ||||||
Hartford Financial Services Group, Inc. (The) | 840 | 56,465 | ||||||
Loews Corp. | 914 | 51,065 | ||||||
MetLife, Inc. | 900 | 55,800 | ||||||
Principal Financial Group, Inc. | 831 | 55,519 | ||||||
Travelers Cos., Inc. (The) | 348 | 55,579 | ||||||
W. R. Berkley Corp. | 700 | 52,717 | ||||||
|
| |||||||
| 542,830 | ||||||||
| Interactive Media & Services 1.1% | ||||||||
Alphabet, Inc., | ||||||||
(Class A Stock)* | 20 | 57,879 | ||||||
(Class C Stock)* | 19 | 55,275 | ||||||
Facebook, Inc. (Class A Stock)* | 141 | 53,493 | ||||||
|
| |||||||
| 166,647 | ||||||||
| Internet & Direct Marketing Retail 0.3% | ||||||||
Amazon.com, Inc.* | 15 | 52,062 | ||||||
| IT Services 4.2% | ||||||||
Accenture PLC (Ireland) (Class A Stock) | 173 | 58,225 | ||||||
Akamai Technologies, Inc.* | 469 | 53,114 | ||||||
Broadridge Financial Solutions, Inc. | 318 | 54,766 | ||||||
Cognizant Technology Solutions Corp. (Class A Stock) | 752 | 57,385 | ||||||
Fidelity National Information Services, Inc. | 344 | 43,953 | ||||||
Fiserv, Inc.* | 453 | 53,359 | ||||||
FleetCor Technologies, Inc.* | 202 | 53,182 | ||||||
International Business Machines Corp. | 372 | 52,206 | ||||||
Jack Henry & Associates, Inc. | 295 | 52,032 | ||||||
Paychex, Inc. | 459 | 52,542 | ||||||
VeriSign, Inc.* | 237 | 51,254 | ||||||
Visa, Inc. (Class A Stock) | 220 | 50,402 | ||||||
|
| |||||||
| 632,420 | ||||||||
See Notes to Financial Statements.
PGIM QMA Strategic Alpha ETFs | 33 |
PGIM QMA Strategic Alpha Large-Cap Core ETF
Schedule of Investments (continued)
as of August 31, 2021
| Description | Shares | Value | ||||||
| COMMON STOCKS (Continued) | ||||||||
| Life Sciences Tools & Services 2.7% | ||||||||
Agilent Technologies, Inc. | 363 | $ | 63,695 | |||||
Bio-Rad Laboratories, Inc. (Class A Stock)* | 74 | 59,557 | ||||||
Illumina, Inc.* | 107 | 48,916 | ||||||
Mettler-Toledo International, Inc.* | 37 | 57,455 | ||||||
PerkinElmer, Inc. | 305 | 56,364 | ||||||
Thermo Fisher Scientific, Inc. | 102 | 56,605 | ||||||
Waters Corp.* | 137 | 56,721 | ||||||
|
| |||||||
| 399,313 | ||||||||
| Machinery 5.4% | ||||||||
Caterpillar, Inc. | 247 | 52,085 | ||||||
Cummins, Inc. | 222 | 52,387 | ||||||
Dover Corp. | 317 | 55,272 | ||||||
Fortive Corp. | 756 | 55,846 | ||||||
IDEX Corp. | 226 | 50,624 | ||||||
Illinois Tool Works, Inc. | 228 | 53,092 | ||||||
Ingersoll Rand, Inc.* | 1,079 | 57,208 | ||||||
Otis Worldwide Corp. | 589 | 54,318 | ||||||
PACCAR, Inc. | 614 | 50,268 | ||||||
Parker-Hannifin Corp. | 155 | 45,984 | ||||||
Pentair PLC (United Kingdom) | 789 | 60,879 | ||||||
Snap-on, Inc. | 236 | 53,088 | ||||||
Stanley Black & Decker, Inc. | 258 | 49,864 | ||||||
Westinghouse Air Brake Technologies Corp. | 610 | 54,772 | ||||||
Xylem, Inc. | 419 | 57,114 | ||||||
|
| |||||||
| 802,801 | ||||||||
| Media 1.4% | ||||||||
Discovery, Inc. (Class C Stock)* | 1,895 | 52,283 | ||||||
Fox Corp. (Class A Stock) | 1,393 | 52,154 | ||||||
News Corp. (Class A Stock) | 2,104 | 47,277 | ||||||
ViacomCBS, Inc. (Class B Stock) | 1,291 | 53,512 | ||||||
|
| |||||||
| 205,226 | ||||||||
| Metals & Mining 0.4% | ||||||||
Nucor Corp. | 528 | 62,072 | ||||||
| Multiline Retail 0.3% | ||||||||
Target Corp. | 201 | 49,643 | ||||||
| Multi-Utilities 2.0% | ||||||||
CenterPoint Energy, Inc. | 2,025 | 50,807 | ||||||
Consolidated Edison, Inc. | 688 | 51,910 | ||||||
See Notes to Financial Statements.
| 34 |
| Description | Shares | Value | ||||||
| COMMON STOCKS (Continued) | ||||||||
| Multi-Utilities (cont'd.) | ||||||||
Dominion Energy, Inc. | 677 | $ | 52,698 | |||||
Public Service Enterprise Group, Inc. | 741 | 47,379 | ||||||
Sempra Energy | 353 | 46,723 | ||||||
WEC Energy Group, Inc. | 492 | 46,484 | ||||||
|
| |||||||
| 296,001 | ||||||||
| Oil, Gas & Consumable Fuels 1.3% | ||||||||
Chevron Corp. | 480 | 46,449 | ||||||
EOG Resources, Inc. | 695 | 46,926 | ||||||
Kinder Morgan, Inc. | 2,799 | 45,540 | ||||||
ONEOK, Inc. | 957 | 50,262 | ||||||
|
| |||||||
| 189,177 | ||||||||
| Personal Products 0.4% | ||||||||
Estee Lauder Cos., Inc. (The) (Class A Stock) | 170 | 57,883 | ||||||
| Pharmaceuticals 2.2% | ||||||||
Bristol-Myers Squibb Co. | 770 | 51,482 | ||||||
Eli Lilly & Co. | 213 | 55,016 | ||||||
Johnson & Johnson | 305 | 52,805 | ||||||
Organon & Co. | 1,786 | 60,527 | ||||||
Pfizer, Inc. | 1,185 | 54,593 | ||||||
Zoetis, Inc. (Class A Stock) | 263 | 53,799 | ||||||
|
| |||||||
| 328,222 | ||||||||
| Professional Services 1.1% | ||||||||
Equifax, Inc. | 201 | 54,724 | ||||||
Leidos Holdings, Inc. | 487 | 47,780 | ||||||
Robert Half International, Inc. | 547 | 56,560 | ||||||
|
| |||||||
| 159,064 | ||||||||
| Real Estate Management & Development 0.4% | ||||||||
CBRE Group, Inc. (Class A Stock)* | 569 | 54,795 | ||||||
| Road & Rail 1.4% | ||||||||
CSX Corp. | 1,512 | 49,185 | ||||||
Norfolk Southern Corp. | 198 | 50,201 | ||||||
Old Dominion Freight Line, Inc. | 214 | 61,786 | ||||||
Union Pacific Corp. | 238 | 51,608 | ||||||
|
| |||||||
| 212,780 | ||||||||
See Notes to Financial Statements.
PGIM QMA Strategic Alpha ETFs | 35 |
PGIM QMA Strategic Alpha Large-Cap Core ETF
Schedule of Investments (continued)
as of August 31, 2021
| Description | Shares | Value | ||||||
| COMMON STOCKS (Continued) | ||||||||
| Semiconductors & Semiconductor Equipment 4.3% | ||||||||
Analog Devices, Inc. | 319 | $ | 51,981 | |||||
Applied Materials, Inc. | 400 | 54,052 | ||||||
Broadcom, Inc. | 109 | 54,196 | ||||||
Intel Corp. | 978 | 52,871 | ||||||
KLA Corp. | 168 | 57,113 | ||||||
Monolithic Power Systems, Inc. | 134 | 66,321 | ||||||
NXP Semiconductors NV (Netherlands) | 267 | 57,440 | ||||||
Qorvo, Inc.* | 277 | 52,084 | ||||||
QUALCOMM, Inc. | 369 | 54,129 | ||||||
Skyworks Solutions, Inc. | 272 | 49,901 | ||||||
Teradyne, Inc. | 392 | 47,604 | ||||||
Texas Instruments, Inc. | 258 | 49,255 | ||||||
|
| |||||||
| 646,947 | ||||||||
| Software 3.3% | ||||||||
Adobe, Inc.* | 84 | 55,751 | ||||||
ANSYS, Inc.* | 144 | 52,612 | ||||||
Autodesk, Inc.* | 171 | 53,025 | ||||||
Cadence Design Systems, Inc.* | 363 | 59,343 | ||||||
Citrix Systems, Inc. | 453 | 46,600 | ||||||
Intuit, Inc. | 100 | 56,611 | ||||||
Microsoft Corp. | 192 | 57,961 | ||||||
salesforce.com, Inc.* | 195 | 51,728 | ||||||
Synopsys, Inc.* | 198 | 65,783 | ||||||
|
| |||||||
| 499,414 | ||||||||
| Specialty Retail 1.8% | ||||||||
AutoZone, Inc.* | 32 | 49,573 | ||||||
Best Buy Co., Inc. | 454 | 52,896 | ||||||
O’Reilly Automotive, Inc.* | 92 | 54,655 | ||||||
TJX Cos., Inc. (The) | 760 | 55,267 | ||||||
Ulta Beauty, Inc.* | 154 | 59,646 | ||||||
|
| |||||||
| 272,037 | ||||||||
| Technology Hardware, Storage & Peripherals 1.1% | ||||||||
Apple, Inc. | 354 | 53,748 | ||||||
Hewlett Packard Enterprise Co. | 3,627 | 56,074 | ||||||
NetApp, Inc. | 667 | 59,316 | ||||||
|
| |||||||
| 169,138 | ||||||||
See Notes to Financial Statements.
| 36 |
| Description | Shares | Value | ||||||||||||||
| COMMON STOCKS (Continued) | ||||||||||||||||
| Textiles, Apparel & Luxury Goods 1.4% | ||||||||||||||||
NIKE, Inc. (Class B Stock) | 316 | $ | 52,058 | |||||||||||||
PVH Corp.* | 508 | 53,233 | ||||||||||||||
Tapestry, Inc.* | 1,268 | 51,126 | ||||||||||||||
VF Corp. | 624 | 47,717 | ||||||||||||||
|
| |||||||||||||||
| 204,134 | ||||||||||||||||
| Tobacco 0.4% | ||||||||||||||||
Altria Group, Inc. | 1,088 | 54,650 | ||||||||||||||
| Trading Companies & Distributors 0.3% | ||||||||||||||||
WW Grainger, Inc. | 114 | 49,442 | ||||||||||||||
| Water Utilities 0.4% | ||||||||||||||||
American Water Works Co., Inc. | 312 | 56,862 | ||||||||||||||
|
| |||||||||||||||
| TOTAL LONG-TERM INVESTMENTS (cost $11,645,795) | 14,859,376 | |||||||||||||||
|
| |||||||||||||||
Interest | Maturity | Principal | ||||||||||||||
| SHORT-TERM INVESTMENT 0.3% | ||||||||||||||||
| TIME DEPOSIT 0.3% | ||||||||||||||||
BNP Paribas (France) (cost $48,433) | 0.005 | % | 09/01/21 | 48 | 48,433 | |||||||||||
|
| |||||||||||||||
| TOTAL INVESTMENTS 99.8% (cost $11,694,228) | 14,907,809 | |||||||||||||||
Other assets in excess of liabilities 0.2% | 24,449 | |||||||||||||||
|
| |||||||||||||||
NET ASSETS 100.0% | $ | 14,932,258 | ||||||||||||||
|
| |||||||||||||||
The following abbreviations are used in the annual report:
| # | Principal or notional amount is shown in U.S. dollars unless otherwise stated. |
| * | Non-income producing security. |
See Notes to Financial Statements.
PGIM QMA Strategic Alpha ETFs | 37 |
PGIM QMA Strategic Alpha Large-Cap Core ETF
Schedule of Investments (continued)
as of August 31, 2021
Fair Value Measurements:
Various inputs are used in determining the value of the Fund’s investments. These inputs are summarized in the three broad levels listed below.
Level 1—unadjusted quoted prices generally in active markets for identical securities.
Level 2—quoted prices for similar securities, interest rates and yield curves, prepayment speeds, foreign currency exchange rates and other observable inputs.
Level 3—unobservable inputs for securities valued in accordance with Board approved fair valuation procedures.
The following is a summary of the inputs used as of August 31, 2021 in valuing such portfolio securities:
| Level 1 | Level 2 | Level 3 | ||||||||||
| Investments in Securities | ||||||||||||
| Assets | ||||||||||||
| Long-Term Investments | ||||||||||||
| Common Stocks | ||||||||||||
Aerospace & Defense | $ | 368,638 | $ | — | $ | — | ||||||
Air Freight & Logistics | 45,167 | — | — | |||||||||
Auto Components | 46,863 | — | — | |||||||||
Banks | 512,819 | — | — | |||||||||
Beverages | 200,907 | — | — | |||||||||
Biotechnology | 370,399 | — | — | |||||||||
Building Products | 265,793 | — | — | |||||||||
Capital Markets | 336,435 | — | — | |||||||||
Chemicals | 258,219 | — | — | |||||||||
Commercial Services & Supplies | 215,746 | — | — | |||||||||
Communications Equipment | 222,212 | — | — | |||||||||
Construction & Engineering | 56,768 | — | — | |||||||||
Construction Materials | 108,038 | — | — | |||||||||
Consumer Finance | 102,898 | — | — | |||||||||
Containers & Packaging | 280,103 | — | — | |||||||||
Distributors | 164,759 | — | — | |||||||||
Diversified Financial Services | 52,582 | — | — | |||||||||
Diversified Telecommunication Services | 145,240 | — | — | |||||||||
Electric Utilities | 475,669 | — | — | |||||||||
Electrical Equipment | 223,645 | — | — | |||||||||
Electronic Equipment, Instruments & Components | 386,815 | — | — | |||||||||
Energy Equipment & Services | 57,337 | — | — | |||||||||
Entertainment | 204,354 | — | — | |||||||||
Equity Real Estate Investment Trusts (REITs) | 801,502 | — | — | |||||||||
See Notes to Financial Statements.
| 38 |
| Level 1 | Level 2 | Level 3 | ||||||||||
| Investments in Securities (continued) | ||||||||||||
| Assets (continued) | ||||||||||||
| Long-Term Investments (continued) | ||||||||||||
| Common Stocks (continued) | ||||||||||||
Food & Staples Retailing | $ | 163,409 | $ | — | $ | — | ||||||
Food Products | 450,589 | — | — | |||||||||
Gas Utilities | 47,097 | — | — | |||||||||
Health Care Equipment & Supplies | 959,246 | — | — | |||||||||
Health Care Providers & Services | 511,856 | — | — | |||||||||
Health Care Technology | 50,696 | — | — | |||||||||
Hotels, Restaurants & Leisure | 100,354 | — | — | |||||||||
Household Durables | 309,173 | — | — | |||||||||
Independent Power & Renewable Electricity Producers | 51,058 | — | — | |||||||||
Industrial Conglomerates | 149,430 | — | — | |||||||||
Insurance | 542,830 | — | — | |||||||||
Interactive Media & Services | 166,647 | — | — | |||||||||
Internet & Direct Marketing Retail | 52,062 | — | — | |||||||||
IT Services | 632,420 | — | — | |||||||||
Life Sciences Tools & Services | 399,313 | — | — | |||||||||
Machinery | 802,801 | — | — | |||||||||
Media | 205,226 | — | — | |||||||||
Metals & Mining | 62,072 | — | — | |||||||||
Multiline Retail | 49,643 | — | — | |||||||||
Multi-Utilities | 296,001 | — | — | |||||||||
Oil, Gas & Consumable Fuels | 189,177 | — | — | |||||||||
Personal Products | 57,883 | — | — | |||||||||
Pharmaceuticals | 328,222 | — | — | |||||||||
Professional Services | 159,064 | — | — | |||||||||
Real Estate Management & Development | 54,795 | — | — | |||||||||
Road & Rail | 212,780 | — | — | |||||||||
Semiconductors & Semiconductor Equipment | 646,947 | — | — | |||||||||
Software | 499,414 | — | — | |||||||||
Specialty Retail | 272,037 | — | — | |||||||||
Technology Hardware, Storage & Peripherals | 169,138 | — | — | |||||||||
Textiles, Apparel & Luxury Goods | 204,134 | — | — | |||||||||
Tobacco | 54,650 | — | — | |||||||||
Trading Companies & Distributors | 49,442 | — | — | |||||||||
Water Utilities | 56,862 | — | — | |||||||||
Short-Term Investments | ||||||||||||
Time Deposit | — | 48,433 | — | |||||||||
|
|
|
|
|
| |||||||
Total | $ | 14,859,376 | $ | 48,433 | $ | — | ||||||
|
|
|
|
|
| |||||||
See Notes to Financial Statements.
PGIM QMA Strategic Alpha ETFs | 39 |
PGIM QMA Strategic Alpha Large-Cap Core ETF
Schedule of Investments (continued)
as of August 31, 2021
Industry Classification:
The industry classification of investments and other assets in excess of liabilities shown as a percentage of net assets as of August 31, 2021 were as follows (unaudited):
Health Care Equipment & Supplies | 6.4 | % | ||
Machinery | 5.4 | |||
Equity Real Estate Investment Trusts (REITs) | 5.4 | |||
Semiconductors & Semiconductor Equipment | 4.3 | |||
IT Services | 4.2 | |||
Insurance | 3.6 | |||
Banks | 3.4 | |||
Health Care Providers & Services | 3.4 | |||
Software | 3.3 | |||
Electric Utilities | 3.2 | |||
Food Products | 3.0 | |||
Life Sciences Tools & Services | 2.7 | |||
Electronic Equipment, Instruments & Components | 2.6 | |||
Biotechnology | 2.5 | |||
Aerospace & Defense | 2.5 | |||
Capital Markets | 2.3 | |||
Pharmaceuticals | 2.2 | |||
Household Durables | 2.1 | |||
Multi-Utilities | 2.0 | |||
Containers & Packaging | 1.9 | |||
Specialty Retail | 1.8 | |||
Building Products | 1.8 | |||
Chemicals | 1.7 | |||
Electrical Equipment | 1.5 | |||
Communications Equipment | 1.5 | |||
Commercial Services & Supplies | 1.4 | |||
Road & Rail | 1.4 | |||
Media | 1.4 | |||
Entertainment | 1.4 | |||
Textiles, Apparel & Luxury Goods | 1.4 | |||
Beverages | 1.3 | |||
Oil, Gas & Consumable Fuels | 1.3 | |||
Technology Hardware, Storage & Peripherals | 1.1 | |||
Interactive Media & Services | 1.1 | |||
Distributors | 1.1 | |||
Food & Staples Retailing | 1.1 | |||
Professional Services | 1.1 | |||
Industrial Conglomerates | 1.0 | |||
Diversified Telecommunication Services | 1.0 | |||
Construction Materials | 0.7 | |||
Consumer Finance | 0.7 | |||
Hotels, Restaurants & Leisure | 0.7 | |||
Metals & Mining | 0.4 | |||
Personal Products | 0.4 | |||
Energy Equipment & Services | 0.4 | |||
Water Utilities | 0.4 | |||
Construction & Engineering | 0.4 | |||
Real Estate Management & Development | 0.4 | |||
Tobacco | 0.4 | |||
Diversified Financial Services | 0.4 | |||
Internet & Direct Marketing Retail | 0.3 | |||
Independent Power & Renewable Electricity Producers | 0.3 | |||
Health Care Technology | 0.3 | |||
Multiline Retail | 0.3 | |||
Trading Companies & Distributors | 0.3 | |||
Time Deposit | 0.3 | |||
Gas Utilities | 0.3 | |||
Auto Components | 0.3 | |||
Air Freight & Logistics | 0.3 | |||
|
| |||
| 99.8 | ||||
Other assets in excess of liabilities | 0.2 | |||
|
| |||
| 100.0 | % | |||
|
|
See Notes to Financial Statements.
| 40 |
PGIM QMA Strategic Alpha Large-Cap Core ETF
Statement of Assets & Liabilities
as of August 31, 2021
Assets | ||||
Investments at value: | ||||
Unaffiliated investments (cost $11,694,228) | $ | 14,907,809 | ||
Interest and dividends receivable | 26,710 | |||
|
| |||
Total Assets | 14,934,519 | |||
|
| |||
| Liabilities | ||||
Management fee payable | 2,127 | |||
Other liabilities | 134 | |||
|
| |||
Total Liabilities | 2,261 | |||
|
| |||
Net Assets | $ | 14,932,258 | ||
|
| |||
Net assets were comprised of: | ||||
Common stock, at par | $ | 200 | ||
Paid-in capital in excess of par | 10,206,775 | |||
Total distributable earnings (loss) | 4,725,283 | |||
|
| |||
Net assets, August 31, 2021 | $ | 14,932,258 | ||
|
| |||
Net asset value, offering price and redemption price per share, | $ | 74.66 | ||
|
| |||
See Notes to Financial Statements.
PGIM QMA Strategic Alpha ETFs | 41 |
PGIM QMA Strategic Alpha Large-Cap Core ETF
Statement of Operations
Year Ended August 31, 2021
Net Investment Income (Loss) | ||||
Income | ||||
Interest income | $ | 745 | ||
Unaffiliated dividend income (net of $718 foreign withholding tax) | 226,149 | |||
Income from securities lending, net (including affiliated income of $398) | 410 | |||
Miscellaneous Income | 49 | |||
|
| |||
Total income | 227,353 | |||
|
| |||
Expenses | ||||
Management fee | 21,824 | |||
|
| |||
Total expenses | 21,824 | |||
|
| |||
Net investment income (loss) | 205,529 | |||
|
| |||
| Realized And Unrealized Gain (Loss) On Investments | ||||
Net realized gain (loss) on: | ||||
Investment transactions (including affiliated of $(122)) | 2,121,983 | |||
Net change in unrealized appreciation (depreciation) on: | ||||
Investments (including affiliated of $62) | 1,805,598 | |||
|
| |||
Net gain (loss) on investment transactions | 3,927,581 | |||
|
| |||
Net Increase (Decrease) In Net Assets Resulting From Operations | $ | 4,133,110 | ||
|
| |||
See Notes to Financial Statements.
| 42 |
PGIM QMA Strategic Alpha Large-Cap Core ETF
Statements of Changes in Net Assets
| Year Ended August 31, | ||||||||
| 2021 | 2020 | |||||||
Increase (Decrease) in Net Assets | ||||||||
Operations | ||||||||
Net investment income (loss) | $ | 205,529 | $ | 206,373 | ||||
Net realized gain (loss) on investments | 2,121,983 | (609,299 | ) | |||||
Net change in unrealized appreciation (depreciation) on investments | 1,805,598 | 1,189,934 | ||||||
|
|
|
| |||||
Net increase (decrease) in net assets resulting from operations | 4,133,110 | 787,008 | ||||||
|
|
|
| |||||
Dividends and Distributions | ||||||||
Distributions from distributable earnings | (158,974 | ) | (208,630 | ) | ||||
|
|
|
| |||||
Total increase (decrease) | 3,974,136 | 578,378 | ||||||
| Net Assets: | ||||||||
Beginning of period | 10,958,122 | 10,379,744 | ||||||
|
|
|
| |||||
End of period | $ | 14,932,258 | $ | 10,958,122 | ||||
|
|
|
| |||||
See Notes to Financial Statements.
PGIM QMA Strategic Alpha ETFs | 43 |
PGIM QMA Strategic Alpha Large-Cap Core ETF
Financial Highlights
| Year Ended August 31, | October 17, 2018(e) through August 31, | |||||||||||||||
| 2021 | 2020 | 2019 | ||||||||||||||
| Per Share Operating Performance(a): | ||||||||||||||||
| Net Asset Value, Beginning of Period | $54.79 | $51.90 | $50.00 | |||||||||||||
| Income (loss) from investment operations: | ||||||||||||||||
| Net investment income (loss) | 1.03 | 1.03 | 0.89 | |||||||||||||
| Net realized and unrealized gain (loss) on investments | 19.63 | 2.90 | 1.67 | |||||||||||||
| Total from investment operations | 20.66 | 3.93 | 2.56 | |||||||||||||
| Less Dividends and Distributions: | ||||||||||||||||
| Dividends from net investment income | (0.79 | ) | (1.04 | ) | (0.66 | ) | ||||||||||
| Net asset value, end of period | $74.66 | $54.79 | $51.90 | |||||||||||||
| Total Return(b): | 38.14% | 7.69% | 5.20% | |||||||||||||
| Ratios/Supplemental Data: | ||||||||||||||||
| Net assets, end of period (000) | $14,932 | $10,958 | $10,380 | |||||||||||||
| Average net assets (000) | $12,838 | $10,347 | $11,164 | |||||||||||||
| Ratios to average net assets(c): | ||||||||||||||||
| Expenses after waivers and/or expense reimbursement | 0.17% | 0.17% | 0.17% | (d) | ||||||||||||
| Expenses before waivers and/or expense reimbursement | 0.17% | 0.17% | 0.17% | (d) | ||||||||||||
| Net investment income (loss) | 1.60% | 1.99% | 2.04% | (d) | ||||||||||||
| Portfolio turnover rate(f)(g) | 96% | 82% | 92% | |||||||||||||
| (a) | Calculated based on average shares outstanding during the period. |
| (b) | Total return is calculated assuming a purchase of a share on the first day and a sale on the last day of the period reported and includes reinvestment of dividends and distributions, if any. Total returns may reflect adjustments to conform to generally accepted accounting principles. Total returns for periods less than one full year are not annualized. |
| (c) | Does not include expenses of the underlying funds in which the Fund invests. |
| (d) | Annualized. |
| (e) | Commencement of operations. |
| (f) | The Fund’s portfolio turnover rate is calculated in accordance with regulatory requirements, without regard to transactions involving short-term investments and certain derivatives. If such transactions were included, the Fund’s portfolio turnover rate may be higher. |
| (g) | Portfolio turnover excludes the value of portfolio securities received or delivered as a result of in-kind fund share transactions, if any. |
See Notes to Financial Statements.
| 44 |
PGIM QMA Strategic Alpha Small-Cap Growth ETF
Schedule of Investments
as of August 31, 2021
| Description | Interest Rate | Maturity Date | Principal Amount (000)# | Value | ||||||||||||
| LONG-TERM INVESTMENTS 99.2% | ||||||||||||||||
| CORPORATE BOND 0.0% | ||||||||||||||||
| Diversified Financial Services 0.0% | ||||||||||||||||
GAMCO Investors, Inc., Sub. Notes | 4.000 | % | 06/15/23 | 2 | $ | 2,000 | ||||||||||
|
| |||||||||||||||
(cost 0$) | ||||||||||||||||
Shares | ||||||||||||||||
| COMMON STOCKS 99.2% | ||||||||||||||||
| Aerospace & Defense 0.1% | ||||||||||||||||
PAE, Inc.* |
| 3,324 | 22,238 | |||||||||||||
| Air Freight & Logistics 0.2% | ||||||||||||||||
Echo Global Logistics, Inc.* |
| 820 | 26,962 | |||||||||||||
| Airlines 0.2% | ||||||||||||||||
Allegiant Travel Co.* |
| 139 | 26,749 | |||||||||||||
| Auto Components 1.5% | ||||||||||||||||
Adient PLC* |
| 635 | 24,981 | |||||||||||||
American Axle & Manufacturing Holdings, Inc.* |
| 2,649 | 23,497 | |||||||||||||
Dana, Inc. |
| 1,097 | 25,516 | |||||||||||||
Fox Factory Holding Corp.* |
| 163 | 25,048 | |||||||||||||
Gentherm, Inc.* |
| 315 | 27,033 | |||||||||||||
LCI Industries |
| 187 | 26,490 | |||||||||||||
Modine Manufacturing Co.* |
| 1,554 | 19,332 | |||||||||||||
Patrick Industries, Inc. |
| 298 | 24,320 | |||||||||||||
XPEL, Inc.* |
| 304 | 23,098 | |||||||||||||
|
| |||||||||||||||
| 219,315 | ||||||||||||||||
| Automobiles 0.2% | ||||||||||||||||
Winnebago Industries, Inc. |
| 365 | 25,411 | |||||||||||||
| Banks 2.3% | ||||||||||||||||
Coastal Financial Corp.* |
| 909 | 26,697 | |||||||||||||
CrossFirst Bankshares, Inc.* |
| 1,894 | 25,039 | |||||||||||||
Customers Bancorp, Inc.* |
| 699 | 28,946 | |||||||||||||
Eastern Bankshares, Inc. |
| 1,318 | 26,070 | |||||||||||||
FB Financial Corp. |
| 690 | 28,421 | |||||||||||||
Glacier Bancorp, Inc. |
| 502 | 26,736 | |||||||||||||
Great Western Bancorp, Inc. |
| 836 | 25,883 | |||||||||||||
Metrocity Bankshares, Inc. |
| 1,304 | 27,006 | |||||||||||||
Origin Bancorp, Inc. | 646 | 26,583 | ||||||||||||||
See Notes to Financial Statements.
PGIM QMA Strategic Alpha ETFs | 45 |
PGIM QMA Strategic Alpha Small-Cap Growth ETF
Schedule of Investments (continued)
as of August 31, 2021
| Description | Shares | Value | ||||||
| COMMON STOCKS (Continued) | ||||||||
| Banks (cont'd.) | ||||||||
Pacific Premier Bancorp, Inc. | 679 | $ | 27,133 | |||||
Southern First Bancshares, Inc.* | 528 | 26,917 | ||||||
Veritex Holdings, Inc. | 782 | 28,097 | ||||||
West BanCorp, Inc. | 874 | 26,736 | ||||||
|
| |||||||
| 350,264 | ||||||||
| Beverages 0.5% | ||||||||
Coca-Cola Consolidated, Inc. | 67 | 27,213 | ||||||
MGP Ingredients, Inc. | 415 | 27,099 | ||||||
National Beverage Corp. | 576 | 26,813 | ||||||
|
| |||||||
| 81,125 | ||||||||
| Biotechnology 10.4% | ||||||||
Aduro Biotech, Inc.*^ | 1,571 | 0 | ||||||
Akebia Therapeutics, Inc.* | 10,195 | 29,973 | ||||||
Albireo Pharma, Inc.* | 919 | 28,075 | ||||||
Aldeyra Therapeutics, Inc.* | 2,927 | 27,777 | ||||||
Alkermes PLC (Ireland)* | 940 | 29,384 | ||||||
Allakos, Inc.* | 336 | 29,958 | ||||||
Allogene Therapeutics, Inc.* | 1,194 | 28,477 | ||||||
Amicus Therapeutics, Inc.* | 2,808 | 31,983 | ||||||
AquaBounty Technologies, Inc.* | 5,528 | 25,595 | ||||||
Arena Pharmaceuticals, Inc.* | 434 | 22,967 | ||||||
Athenex, Inc.* | 6,895 | 25,167 | ||||||
Avid Bioservices, Inc.* | 1,014 | 24,579 | ||||||
Bioxcel Therapeutics, Inc.* | 1,027 | 30,245 | ||||||
Blueprint Medicines Corp.* | 282 | 26,302 | ||||||
Coherus Biosciences, Inc.* | 1,826 | 29,180 | ||||||
Crinetics Pharmaceuticals, Inc.* | 1,479 | 34,860 | ||||||
Deciphera Pharmaceuticals, Inc.* | 887 | 27,941 | ||||||
Denali Therapeutics, Inc.* | 498 | 26,494 | ||||||
DermTech, Inc.* | 804 | 29,909 | ||||||
Eagle Pharmaceuticals, Inc.* | 546 | 29,140 | ||||||
Flexion Therapeutics, Inc.* | 4,338 | 25,941 | ||||||
Fortress Biotech, Inc.* | 8,345 | 27,455 | ||||||
G1 Therapeutics, Inc.* | 1,557 | 23,542 | ||||||
Halozyme Therapeutics, Inc.* | 650 | 27,294 | ||||||
Harpoon Therapeutics, Inc.* | 2,657 | 25,188 | ||||||
Immunovant, Inc.* | 3,737 | 32,362 | ||||||
Instil Bio, Inc.* | 1,604 | 30,235 | ||||||
Ironwood Pharmaceuticals, Inc. (Class A Stock)(a)* | 2,015 | 26,397 | ||||||
See Notes to Financial Statements.
| 46 |
| Description | Shares | Value | ||||||
| COMMON STOCKS (Continued) | ||||||||
| Biotechnology (cont'd.) | ||||||||
KalVista Pharmaceuticals, Inc.* | 1,268 | $ | 25,918 | |||||
Karuna Therapeutics, Inc.* | 242 | 28,774 | ||||||
Keros Therapeutics, Inc.* | 753 | 25,331 | ||||||
Kiniksa Pharmaceuticals Ltd. (Class A Stock)* | 1,914 | 24,078 | ||||||
Kodiak Sciences, Inc.* | 317 | 29,855 | ||||||
Kronos Bio, Inc.* | 1,291 | 26,995 | ||||||
Krystal Biotech, Inc.* | 450 | 26,073 | ||||||
Magenta Therapeutics, Inc.* | 4,139 | 26,490 | ||||||
Mersana Therapeutics, Inc.* | 2,401 | 33,446 | ||||||
MiMedx Group, Inc.* | 2,087 | 30,804 | ||||||
Molecular Templates, Inc.* | 3,727 | 24,300 | ||||||
Olema Pharmaceuticals, Inc.* | 1,087 | 32,523 | ||||||
Oncocyte Corp.* | 5,470 | 22,427 | ||||||
Organogenesis Holdings, Inc. (Class A Stock)* | 1,769 | 30,179 | ||||||
PMV Pharmaceuticals, Inc.* | 833 | 25,282 | ||||||
PTC Therapeutics, Inc.* | 680 | 29,682 | ||||||
Puma Biotechnology, Inc.* | 3,584 | 27,131 | ||||||
REGENXBIO, Inc.* | 783 | 25,291 | ||||||
Replimune Group, Inc.* | 765 | 24,296 | ||||||
Sangamo Therapeutics, Inc.* | 2,735 | 27,104 | ||||||
Shattuck Labs, Inc.* | 1,303 | 27,532 | ||||||
Stoke Therapeutics, Inc.* | 944 | 24,714 | ||||||
Taysha Gene Therapies, Inc.* | 1,456 | 28,945 | ||||||
Trevena, Inc.* | 19,266 | 25,431 | ||||||
Trillium Therapeutics, Inc. (Canada)* | 4,037 | 69,558 | ||||||
Turning Point Therapeutics, Inc.* | 409 | 31,501 | ||||||
Vericel Corp.* | 487 | 26,381 | ||||||
Xencor, Inc.* | 835 | 28,281 | ||||||
|
| |||||||
| 1,564,742 | ||||||||
| Building Products 1.2% | ||||||||
Gibraltar Industries, Inc.* | 366 | 27,325 | ||||||
JELD-WEN Holding, Inc.* | 977 | 26,907 | ||||||
Masonite International Corp.* | 209 | 25,013 | ||||||
PGT Innovations, Inc.* | 1,169 | 24,818 | ||||||
Resideo Technologies, Inc.* | 849 | 27,372 | ||||||
Simpson Manufacturing Co., Inc. | 256 | 28,966 | ||||||
UFP Industries, Inc. | 337 | 25,302 | ||||||
|
| |||||||
| 185,703 | ||||||||
See Notes to Financial Statements.
PGIM QMA Strategic Alpha ETFs | 47 |
PGIM QMA Strategic Alpha Small-Cap Growth ETF
Schedule of Investments (continued)
as of August 31, 2021
| Description | Shares | Value | ||||||
| COMMON STOCKS (Continued) | ||||||||
| Capital Markets 2.2% | ||||||||
Artisan Partners Asset Management, Inc. (Class A Stock) | 528 | $ | 27,435 | |||||
Blucora, Inc.* | 1,562 | 25,632 | ||||||
Cohen & Steers, Inc. | 311 | 27,278 | ||||||
GAMCO Investors, Inc. (Class A Stock) | 960 | 26,218 | ||||||
Greenhill & Co., Inc. | 1,788 | 26,355 | ||||||
Houlihan Lokey, Inc. (Class A Stock) | 314 | 28,323 | ||||||
Moelis & Co. (Class A Stock) | 484 | 29,984 | ||||||
PJT Partners, Inc. (Class A Stock) | 371 | 29,302 | ||||||
Pzena Investment Management, Inc. (Class A Stock) | 2,447 | 26,697 | ||||||
StoneX Group, Inc.* | 408 | 28,433 | ||||||
Virtus Investment Partners, Inc. | 93 | 29,081 | ||||||
WisdomTree Investments, Inc. | 4,062 | 25,631 | ||||||
|
| |||||||
| 330,369 | ||||||||
| Chemicals 2.5% | ||||||||
American Vanguard Corp. | 1,653 | 25,340 | ||||||
Avient Corp. | 546 | 28,441 | ||||||
Balchem Corp. | 218 | 30,612 | ||||||
Cabot Corp. | 474 | 25,312 | ||||||
Chase Corp. | 247 | 28,281 | ||||||
Hawkins, Inc. | 794 | 30,077 | ||||||
HB Fuller Co. | 395 | 26,690 | ||||||
Ingevity Corp.* | 341 | 27,413 | ||||||
Innospec, Inc. | 285 | 26,676 | ||||||
Orion Engineered Carbons SA (Luxembourg)* | 1,454 | 25,692 | ||||||
Sensient Technologies Corp. | 324 | 28,139 | ||||||
Stepan Co. | 211 | 24,805 | ||||||
Tredegar Corp. | 2,009 | 26,680 | ||||||
Trinseo SA | 484 | 25,134 | ||||||
|
| |||||||
| 379,292 | ||||||||
| Commercial Services & Supplies 1.7% | ||||||||
Brink’s Co. (The) | 338 | 26,418 | ||||||
Casella Waste Systems, Inc. (Class A Stock)* | 376 | 27,820 | ||||||
Cimpress PLC (Ireland)* | 256 | 24,315 | ||||||
Harsco Corp.(a)* | 1,297 | 23,657 | ||||||
Healthcare Services Group, Inc. | 1,005 | 26,291 | ||||||
Heritage-Crystal Clean, Inc.* | 905 | 26,734 | ||||||
HNI Corp. | 684 | 25,917 | ||||||
Interface, Inc. (Class A Stock) | 1,783 | 25,639 | ||||||
SP Plus Corp.* | 815 | 26,398 | ||||||
Tetra Tech, Inc. | 193 | 27,761 | ||||||
|
| |||||||
| 260,950 | ||||||||
See Notes to Financial Statements.
| 48 |
| Description | Shares | Value | ||||||
| COMMON STOCKS (Continued) | ||||||||
| Communications Equipment 1.5% | ||||||||
CalAmp Corp.* | 2,271 | $ | 25,753 | |||||
Calix, Inc.* | 569 | 26,515 | ||||||
Cambium Networks Corp.* | 616 | 23,082 | ||||||
Casa Systems, Inc.* | 3,466 | 24,401 | ||||||
Clearfield, Inc.* | 603 | 27,322 | ||||||
DZS, Inc.* | 1,608 | 22,206 | ||||||
Extreme Networks, Inc.* | 2,294 | 24,844 | ||||||
Harmonic, Inc.* | 2,465 | 22,777 | ||||||
Viavi Solutions, Inc.* | 1,603 | 26,113 | ||||||
|
| |||||||
| 223,013 | ||||||||
| Construction & Engineering 1.1% | ||||||||
Comfort Systems USA, Inc. | 325 | 24,693 | ||||||
EMCOR Group, Inc. | 221 | 26,852 | ||||||
IES Holdings, Inc.* | 478 | 23,374 | ||||||
MYR Group, Inc.* | 273 | 28,395 | ||||||
NV5 Global, Inc.* | 275 | 29,054 | ||||||
Sterling Construction Co., Inc.* | 1,290 | 29,747 | ||||||
|
| |||||||
| 162,115 | ||||||||
| Consumer Finance 0.9% | ||||||||
Curo Group Holdings Corp. | 1,552 | 25,406 | ||||||
FirstCash, Inc. | 324 | 27,764 | ||||||
Green Dot Corp. (Class A Stock)* | 592 | 30,926 | ||||||
PROG Holdings, Inc. | 603 | 28,534 | ||||||
Regional Management Corp. | 490 | 29,121 | ||||||
|
| |||||||
| 141,751 | ||||||||
| Containers & Packaging 0.5% | ||||||||
Greif, Inc. (Class A Stock) | 423 | 26,784 | ||||||
Myers Industries, Inc. | 1,162 | 26,494 | ||||||
O-I Glass, Inc.* | 1,705 | 25,797 | ||||||
|
| |||||||
| 79,075 | ||||||||
| Distributors 0.2% | ||||||||
Funko, Inc. (Class A Stock)* | 1,347 | 26,859 | ||||||
| Diversified Consumer Services 0.2% | ||||||||
Carriage Services, Inc. (Class A Stock) | 708 | 32,731 | ||||||
See Notes to Financial Statements.
PGIM QMA Strategic Alpha ETFs | 49 |
PGIM QMA Strategic Alpha Small-Cap Growth ETF
Schedule of Investments (continued)
as of August 31, 2021
| Description | Shares | Value | ||||||
| COMMON STOCKS (Continued) | ||||||||
| Diversified Telecommunication Services 0.7% | ||||||||
Cogent Communications Holdings, Inc. | 337 | $ | 24,460 | |||||
IDT Corp. (Class B Stock)* | 517 | 22,479 | ||||||
Iridium Communications, Inc.* | 630 | 28,041 | ||||||
Ooma, Inc.* | 1,458 | 27,702 | ||||||
|
| |||||||
| 102,682 | ||||||||
| Electric Utilities 0.2% | ||||||||
Via Renewables, Inc. (Class A Stock)(a) | 2,567 | 28,750 | ||||||
| Electrical Equipment 0.9% | ||||||||
Allied Motion Technologies, Inc. | 795 | 27,475 | ||||||
Atkore, Inc.* | 312 | 28,944 | ||||||
EnerSys | 273 | 23,093 | ||||||
GrafTech International Ltd. | 2,266 | 25,085 | ||||||
Vicor Corp.* | 222 | 27,388 | ||||||
|
| |||||||
| 131,985 | ||||||||
| Electronic Equipment, Instruments & Components 2.7% | ||||||||
Advanced Energy Industries, Inc. | 255 | 22,996 | ||||||
Arlo Technologies, Inc.* | 4,233 | 26,245 | ||||||
Badger Meter, Inc. | 257 | 27,522 | ||||||
CTS Corp. | 749 | 26,275 | ||||||
Fabrinet (Thailand)* | 292 | 30,082 | ||||||
Identiv, Inc.* | 1,601 | 28,434 | ||||||
II-VI, Inc.* | 391 | 24,625 | ||||||
Insight Enterprises, Inc.* | 260 | 26,751 | ||||||
Itron, Inc.* | 269 | 22,599 | ||||||
Napco Security Technologies, Inc.* | 742 | 29,034 | ||||||
Novanta, Inc.* | 196 | 30,031 | ||||||
OSI Systems, Inc.* | 272 | 26,912 | ||||||
Plexus Corp.* | 287 | 26,355 | ||||||
Rogers Corp.* | 134 | 28,463 | ||||||
Vishay Intertechnology, Inc. | 1,186 | 26,056 | ||||||
|
| |||||||
| 402,380 | ||||||||
| Energy Equipment & Services 0.2% | ||||||||
ChampionX Corp.* | 1,102 | 25,710 | ||||||
| Entertainment 0.3% | ||||||||
Liberty Media Corp.-Liberty Braves, | ||||||||
(Class A Stock)* | 1,000 | 26,000 | ||||||
(Class C Stock)* | 999 | 25,824 | ||||||
|
| |||||||
| 51,824 | ||||||||
See Notes to Financial Statements.
| 50 |
| Description | Shares | Value | ||||||
| COMMON STOCKS (Continued) | ||||||||
| Equity Real Estate Investment Trusts (REITs) 2.9% | ||||||||
Alexander’s, Inc. | 92 | $ | 24,500 | |||||
CatchMark Timber Trust, Inc. (Class A Stock) | 2,354 | 27,165 | ||||||
Clipper Realty, Inc. | 3,237 | 27,320 | ||||||
EastGroup Properties, Inc. | 150 | 27,039 | ||||||
Gladstone Commercial Corp. | 1,251 | 28,310 | ||||||
Indus Realty Trust, Inc. | 401 | 28,114 | ||||||
Monmouth Real Estate Investment Corp. | 1,462 | 27,749 | ||||||
National Storage Affiliates Trust | 480 | 27,480 | ||||||
NexPoint Residential Trust, Inc. | 441 | 28,572 | ||||||
Outfront Media, Inc.* | 1,129 | 27,954 | ||||||
PS Business Parks, Inc. | 160 | 25,157 | ||||||
Ryman Hospitality Properties, Inc.* | 346 | 28,742 | ||||||
Saul Centers, Inc. | 576 | 26,542 | ||||||
Tanger Factory Outlet Centers, Inc. | 1,543 | 25,799 | ||||||
UMH Properties, Inc. | 1,130 | 26,781 | ||||||
Universal Health Realty Income Trust | 439 | 26,002 | ||||||
|
| |||||||
| 433,226 | ||||||||
| Food & Staples Retailing 0.9% | ||||||||
Andersons, Inc. (The) | 976 | 29,651 | ||||||
Performance Food Group Co.* | 615 | 30,885 | ||||||
PriceSmart, Inc. | 304 | 25,721 | ||||||
Sprouts Farmers Market, Inc.* | 1,072 | 26,693 | ||||||
United Natural Foods, Inc.* | 791 | 29,109 | ||||||
|
| |||||||
| 142,059 | ||||||||
| Food Products 1.2% | ||||||||
Calavo Growers, Inc. | 466 | 21,865 | ||||||
J&J Snack Foods Corp. | 164 | 26,857 | ||||||
John B. Sanfilippo & Son, Inc.(a) | 282 | 23,967 | ||||||
Lancaster Colony Corp. | 144 | 25,523 | ||||||
Limoneira Co. | 1,515 | 24,922 | ||||||
Sanderson Farms, Inc. | 143 | 28,099 | ||||||
Simply Good Foods Co. (The)* | 710 | 25,290 | ||||||
|
| |||||||
| 176,523 | ||||||||
| Health Care Equipment & Supplies 6.3% | ||||||||
Accuray, Inc.* | 6,770 | 27,554 | ||||||
Apyx Medical Corp.* | 2,892 | 34,154 | ||||||
Atrion Corp. | 40 | 27,762 | ||||||
Bioventus, Inc. (Class A Stock)* | 1,721 | 24,972 | ||||||
See Notes to Financial Statements.
PGIM QMA Strategic Alpha ETFs | 51 |
PGIM QMA Strategic Alpha Small-Cap Growth ETF
Schedule of Investments (continued)
as of August 31, 2021
| Description | Shares | Value | ||||||
| COMMON STOCKS (Continued) | ||||||||
| Health Care Equipment & Supplies (cont'd.) | ||||||||
Cardiovascular Systems, Inc.* | 672 | $ | 24,051 | |||||
ClearPoint Neuro, Inc.* | 1,295 | 24,437 | ||||||
CONMED Corp. | 204 | 26,793 | ||||||
CryoLife, Inc.* | 971 | 25,479 | ||||||
Cutera, Inc.* | 489 | 24,323 | ||||||
CytoSorbents Corp.* | 3,609 | 34,538 | ||||||
Glaukos Corp.* | 530 | 31,604 | ||||||
Haemonetics Corp.* | 434 | 27,233 | ||||||
Heska Corp.* | 103 | 27,326 | ||||||
Inogen, Inc.* | 336 | 19,888 | ||||||
Intersect ENT, Inc.* | 1,092 | 29,713 | ||||||
iRadimed Corp.* | 771 | 26,029 | ||||||
Lantheus Holdings, Inc.* | 984 | 25,948 | ||||||
LeMaitre Vascular, Inc. | 468 | 26,498 | ||||||
LivaNova PLC (United Kingdom)* | 320 | 26,461 | ||||||
Meridian Bioscience, Inc.* | 1,220 | 24,693 | ||||||
Merit Medical Systems, Inc.* | 422 | 30,287 | ||||||
Misonix, Inc.* | 1,000 | 25,400 | ||||||
Neogen Corp.* | 605 | 26,487 | ||||||
Nevro Corp.* | 174 | 21,228 | ||||||
NuVasive, Inc.* | 435 | 27,031 | ||||||
Ortho Clinical Diagnostics Holdings PLC* | 1,211 | 24,753 | ||||||
Pulmonx Corp.* | 668 | 26,847 | ||||||
SeaSpine Holdings Corp.* | 1,663 | 27,905 | ||||||
SI-BONE, Inc.* | 1,016 | 24,801 | ||||||
Silk Road Medical, Inc.* | 488 | 28,929 | ||||||
STAAR Surgical Co.* | 220 | 33,983 | ||||||
Stereotaxis, Inc.* | 2,914 | 20,573 | ||||||
Surmodics, Inc.* | 453 | 27,212 | ||||||
Tactile Systems Technology, Inc.* | 588 | 26,154 | ||||||
Varex Imaging Corp.* | 970 | 28,295 | ||||||
|
| |||||||
| 939,341 | ||||||||
| Health Care Providers & Services 4.5% | ||||||||
Addus HomeCare Corp.* | 277 | 24,908 | ||||||
Agiliti, Inc.* | 1,371 | 29,243 | ||||||
AMN Healthcare Services, Inc.* | 254 | 28,834 | ||||||
Apria, Inc.* | 916 | 32,674 | ||||||
Aveanna Healthcare Holdings, Inc.* | 2,646 | 24,978 | ||||||
Castle Biosciences, Inc.* | 372 | 28,544 | ||||||
CorVel Corp.* | 170 | 28,018 | ||||||
Cross Country Healthcare, Inc.* | 1,571 | 34,169 | ||||||
See Notes to Financial Statements.
| 52 |
| Description | Shares | Value | ||||||
| COMMON STOCKS (Continued) | ||||||||
| Health Care Providers & Services (cont'd.) | ||||||||
Ensign Group, Inc. (The) | 323 | $ | 26,379 | |||||
Fulgent Genetics, Inc.* | 261 | 23,814 | ||||||
Hanger, Inc.* | 1,108 | 26,459 | ||||||
InfuSystem Holdings, Inc.* | 1,202 | 17,128 | ||||||
Innovage Holding Corp.* | 1,577 | 23,702 | ||||||
Joint Corp. (The)* | 305 | 31,162 | ||||||
LHC Group, Inc.* | 117 | 21,851 | ||||||
MEDNAX, Inc.* | 867 | 27,839 | ||||||
ModivCare, Inc.* | 149 | 29,392 | ||||||
National Research Corp. | 534 | 28,836 | ||||||
Patterson Cos., Inc. | 859 | 26,320 | ||||||
PetIQ, Inc. (Class A Stock)* | 742 | 19,255 | ||||||
RadNet, Inc.* | 688 | 21,610 | ||||||
Select Medical Holdings Corp. | 724 | 25,029 | ||||||
Sharps Compliance Corp.* | 2,534 | 22,781 | ||||||
Surgery Partners, Inc.* | 464 | 22,829 | ||||||
Tenet Healthcare Corp.* | 363 | 27,352 | ||||||
Tivity Health, Inc.* | 1,013 | 23,552 | ||||||
|
| |||||||
| 676,658 | ||||||||
| Health Care Technology 1.1% | ||||||||
Evolent Health, Inc. (Class A Stock)* | 1,135 | 27,876 | ||||||
Inspire Medical Systems, Inc.* | 140 | 31,298 | ||||||
OptimizeRx Corp.* | 470 | 31,105 | ||||||
Phreesia, Inc.* | 387 | 27,690 | ||||||
Schrodinger, Inc.* | 395 | 23,577 | ||||||
Tabula Rasa HealthCare, Inc.* | 622 | 19,475 | ||||||
|
| |||||||
| 161,021 | ||||||||
| Hotels, Restaurants & Leisure 2.2% | ||||||||
Accel Entertainment, Inc. (Class A Stock)* | 2,343 | 26,991 | ||||||
BJ’s Restaurants, Inc.* | 676 | 28,906 | ||||||
Century Casinos, Inc.* | 2,358 | 31,527 | ||||||
Chuy’s Holdings, Inc.* | 822 | 26,518 | ||||||
Cracker Barrel Old Country Store, Inc. | 196 | 28,142 | ||||||
Jack in the Box, Inc. | 250 | 26,490 | ||||||
Monarch Casino & Resort, Inc.* | 410 | 25,982 | ||||||
Nathan’s Famous, Inc. | 410 | 27,072 | ||||||
Papa John’s International, Inc. | 227 | 28,949 | ||||||
RCI Hospitality Holdings, Inc. | 415 | 26,813 | ||||||
Texas Roadhouse, Inc. (Class A Stock) | 294 | 27,930 | ||||||
Wingstop, Inc. | 152 | 26,133 | ||||||
|
| |||||||
| 331,453 | ||||||||
See Notes to Financial Statements.
PGIM QMA Strategic Alpha ETFs | 53 |
PGIM QMA Strategic Alpha Small-Cap Growth ETF
Schedule of Investments (continued)
as of August 31, 2021
| Description | Shares | Value | ||||||
| COMMON STOCKS (Continued) | ||||||||
| Household Durables 2.0% | ||||||||
Cavco Industries, Inc.* | 121 | $ | 30,915 | |||||
Century Communities, Inc. | 366 | 25,657 | ||||||
GoPro, Inc. (Class A Stock)* | 2,602 | 25,942 | ||||||
KB Home | 601 | 25,861 | ||||||
LGI Homes, Inc.* | 160 | 25,653 | ||||||
MDC Holdings, Inc. | 489 | 25,550 | ||||||
Meritage Homes Corp.* | 236 | 26,323 | ||||||
Skyline Champion Corp.* | 459 | 28,788 | ||||||
Sonos, Inc.* | 783 | 31,109 | ||||||
Taylor Morrison Home Corp. (Class A Stock)* | 958 | 26,910 | ||||||
TRI Pointe Homes, Inc.* | 1,067 | 25,363 | ||||||
|
| |||||||
| 298,071 | ||||||||
| Household Products 0.5% | ||||||||
Central Garden & Pet Co.* | 534 | 24,591 | ||||||
Central Garden & Pet Co. (Class A Stock)* | 593 | 24,710 | ||||||
Energizer Holdings, Inc. | 616 | 24,233 | ||||||
|
| |||||||
| 73,534 | ||||||||
| Independent Power & Renewable Electricity Producers 0.4% | ||||||||
Clearway Energy, Inc., | ||||||||
(Class A Stock) | 984 | 29,264 | ||||||
(Class C Stock) | 918 | 28,816 | ||||||
|
| |||||||
| 58,080 | ||||||||
| Insurance 0.3% | ||||||||
eHealth, Inc.* | 523 | 20,214 | ||||||
RLI Corp. | 249 | 27,198 | ||||||
|
| |||||||
| 47,412 | ||||||||
| Interactive Media & Services 0.7% | ||||||||
Cars.com, Inc.* | 2,158 | 27,450 | ||||||
EverQuote, Inc. (Class A Stock)* | 1,042 | 20,517 | ||||||
QuinStreet, Inc.* | 1,482 | 26,542 | ||||||
Yelp, Inc. (Class A Stock)* | 718 | 27,650 | ||||||
|
| |||||||
| 102,159 | ||||||||
| Internet & Direct Marketing Retail 1.1% | ||||||||
1-800-Flowers.com, Inc. (Class A Stock)* | 838 | 26,615 | ||||||
Duluth Holdings, Inc. (Class B Stock)* | 1,661 | 25,845 | ||||||
Groupon, Inc. (Class A Stock)* | 713 | 17,661 | ||||||
See Notes to Financial Statements.
| 54 |
| Description | Shares | Value | ||||||
| COMMON STOCKS (Continued) | ||||||||
| Internet & Direct Marketing Retail (cont'd.) | ||||||||
Overstock.com, Inc.* | 381 | $ | 27,489 | |||||
PetMed Express, Inc.(a) | 847 | 23,326 | ||||||
Quotient Technology, Inc.* | 2,437 | 17,693 | ||||||
Shutterstock, Inc. | 274 | 31,581 | ||||||
|
| |||||||
| 170,210 | ||||||||
| IT Services 2.4% | ||||||||
Brightcove, Inc.* | 2,256 | 25,628 | ||||||
Cantaloupe, Inc.* | 2,617 | 26,798 | ||||||
Cass Information Systems, Inc. | 629 | 28,356 | ||||||
CSG Systems International, Inc. | 568 | 27,383 | ||||||
EVERTEC, Inc. (Puerto Rico) | 616 | 28,490 | ||||||
ExlService Holdings, Inc.* | 223 | 27,460 | ||||||
Hackett Group, Inc. (The) | 1,532 | 30,027 | ||||||
IBEX Holdings Ltd.* | 1,294 | 23,266 | ||||||
International Money Express, Inc.* | 1,721 | 31,391 | ||||||
MAXIMUS, Inc. | 275 | 23,950 | ||||||
Perficient, Inc.* | 268 | 31,951 | ||||||
TTEC Holdings, Inc. | 246 | 25,943 | ||||||
Verra Mobility Corp. (Class A Stock)* | 1,721 | 26,693 | ||||||
|
| |||||||
| 357,336 | ||||||||
| Leisure Products 1.4% | ||||||||
Acushnet Holdings Corp. | 490 | 24,480 | ||||||
Clarus Corp. | 873 | 23,650 | ||||||
Johnson Outdoors, Inc. (Class A Stock) | 223 | 25,598 | ||||||
Malibu Boats, Inc. (Class A Stock)* | 313 | 22,411 | ||||||
Marine Products Corp. | 1,603 | 22,730 | ||||||
MasterCraft Boat Holdings, Inc.* | 904 | 22,546 | ||||||
Nautilus, Inc.(a)* | 1,817 | 20,714 | ||||||
Smith & Wesson Brands, Inc. | 1,038 | 25,047 | ||||||
Sturm Ruger & Co., Inc. | 341 | 26,663 | ||||||
|
| |||||||
| 213,839 | ||||||||
| Life Sciences Tools & Services 0.5% | ||||||||
Harvard Bioscience, Inc.* | 3,160 | 26,101 | ||||||
Medpace Holdings, Inc.* | 142 | 25,894 | ||||||
Quanterix Corp.* | 483 | 24,657 | ||||||
|
| |||||||
| 76,652 | ||||||||
See Notes to Financial Statements.
PGIM QMA Strategic Alpha ETFs | 55 |
PGIM QMA Strategic Alpha Small-Cap Growth ETF
Schedule of Investments (continued)
as of August 31, 2021
| Description | Shares | Value | ||||||
| COMMON STOCKS (Continued) | ||||||||
| Machinery 5.1% | ||||||||
Alamo Group, Inc. | 174 | $ | 26,972 | |||||
Albany International Corp. (Class A Stock) | 306 | 23,969 | ||||||
CIRCOR International, Inc.* | 848 | 30,316 | ||||||
Commercial Vehicle Group, Inc.* | 3,004 | 31,572 | ||||||
Douglas Dynamics, Inc. | 681 | 27,063 | ||||||
Energy Recovery, Inc.* | 1,280 | 26,150 | ||||||
Enerpac Tool Group Corp. (Class A Stock) | 999 | 25,135 | ||||||
ESCO Technologies, Inc. | 281 | 25,324 | ||||||
Federal Signal Corp. | 726 | 29,497 | ||||||
Franklin Electric Co., Inc. | 338 | 28,723 | ||||||
Gorman-Rupp Co. (The) | 786 | 27,565 | ||||||
Helios Technologies, Inc. | 325 | 26,527 | ||||||
Hillenbrand, Inc. | 585 | 27,156 | ||||||
John Bean Technologies Corp. | 190 | 27,719 | ||||||
Kadant, Inc. | 145 | 30,322 | ||||||
Lindsay Corp. | 162 | 26,690 | ||||||
Luxfer Holdings PLC (United Kingdom) | 1,276 | 27,243 | ||||||
Meritor, Inc.* | 1,092 | 25,902 | ||||||
Mueller Industries, Inc. | 610 | 27,212 | ||||||
Mueller Water Products, Inc. (Class A Stock) | 1,906 | 31,678 | ||||||
Omega Flex, Inc. | 167 | 25,384 | ||||||
Rexnord Corp. | 459 | 27,889 | ||||||
Shyft Group, Inc. (The) | 690 | 30,367 | ||||||
SPX Corp.* | 401 | 25,054 | ||||||
SPX FLOW, Inc. | 316 | 25,447 | ||||||
Tennant Co. | 352 | 26,041 | ||||||
Terex Corp. | 517 | 26,393 | ||||||
Watts Water Technologies, Inc. (Class A Stock) | 169 | 28,995 | ||||||
|
| |||||||
| 768,305 | ||||||||
| Media 0.9% | ||||||||
AMC Networks, Inc. (Class A Stock)(a)* | 546 | 25,952 | ||||||
iHeartMedia, Inc. (Class A Stock)* | 1,026 | 25,527 | ||||||
Loral Space & Communications, Inc. | 728 | 30,583 | ||||||
Thryv Holdings, Inc.* | 826 | 25,598 | ||||||
WideOpenWest, Inc.* | 1,138 | 24,148 | ||||||
|
| |||||||
| 131,808 | ||||||||
| Metals & Mining 1.3% | ||||||||
Coeur Mining, Inc.* | 3,560 | 25,098 | ||||||
Compass Minerals International, Inc. | 382 | 25,567 | ||||||
Hecla Mining Co. | 3,958 | 24,342 | ||||||
See Notes to Financial Statements.
| 56 |
| Description | Shares | Value | ||||||
| COMMON STOCKS (Continued) | ||||||||
| Metals & Mining (cont'd.) | ||||||||
Kaiser Aluminum Corp. | 214 | $ | 27,020 | |||||
Ryerson Holding Corp. | 1,664 | 38,521 | ||||||
Schnitzer Steel Industries, Inc. (Class A Stock) | 503 | 23,797 | ||||||
Warrior Met Coal, Inc. | 1,349 | 30,204 | ||||||
|
| |||||||
| 194,549 | ||||||||
| Mortgage Real Estate Investment Trusts (REITs) 0.2% | ||||||||
PennyMac Mortgage Investment Trust | 1,326 | 25,738 | ||||||
| Multiline Retail 0.2% | ||||||||
Franchise Group, Inc. | 774 | 26,881 | ||||||
| Oil, Gas & Consumable Fuels 1.5% | ||||||||
Antero Resources Corp.* | 1,945 | 26,685 | ||||||
Arch Resources, Inc.* | 395 | 29,897 | ||||||
Centennial Resource Development, Inc. (Class A Stock)* | 5,251 | 26,780 | ||||||
Dorian LPG Ltd. | 2,162 | 28,582 | ||||||
Extraction Oil & Gas, Inc.(a)* | 592 | 26,954 | ||||||
Falcon Minerals Corp. | 5,481 | 24,336 | ||||||
Magnolia Oil & Gas Corp. (Class A Stock) | 1,859 | 29,149 | ||||||
Matador Resources Co. | 883 | 25,386 | ||||||
|
| |||||||
| 217,769 | ||||||||
| Personal Products 0.8% | ||||||||
BellRing Brands, Inc. (Class A Stock)* | 811 | 27,388 | ||||||
Inter Parfums, Inc. | 336 | 24,373 | ||||||
Medifast, Inc. | 92 | 20,967 | ||||||
Nu Skin Enterprises, Inc. (Class A Stock) | 483 | 24,449 | ||||||
USANA Health Sciences, Inc.* | 259 | 25,131 | ||||||
|
| |||||||
| 122,308 | ||||||||
| Pharmaceuticals 2.4% | ||||||||
Aerie Pharmaceuticals, Inc.* | 1,718 | 25,615 | ||||||
Amneal Pharmaceuticals, Inc.* | 5,293 | 29,853 | ||||||
Amphastar Pharmaceuticals, Inc.* | 1,219 | 23,966 | ||||||
Antares Pharma, Inc.* | 5,982 | 23,569 | ||||||
BioDelivery Sciences International, Inc.* | 6,718 | 25,931 | ||||||
Collegium Pharmaceutical, Inc.* | 1,142 | 23,445 | ||||||
Corcept Therapeutics, Inc.* | 1,156 | 24,600 | ||||||
Durect Corp.* | 19,409 | 26,979 | ||||||
Innoviva, Inc.* | 1,725 | 26,323 | ||||||
See Notes to Financial Statements.
PGIM QMA Strategic Alpha ETFs | 57 |
PGIM QMA Strategic Alpha Small-Cap Growth ETF
Schedule of Investments (continued)
as of August 31, 2021
| Description | Shares | Value | ||||||
| COMMON STOCKS (Continued) | ||||||||
| Pharmaceuticals (cont'd.) | ||||||||
Intra-Cellular Therapies, Inc.* | 758 | $ | 25,166 | |||||
Phathom Pharmaceuticals, Inc.* | 736 | 26,194 | ||||||
Phibro Animal Health Corp. (Class A Stock) | 1,048 | 25,456 | ||||||
SIGA Technologies, Inc.* | 3,733 | 24,376 | ||||||
Tarsus Pharmaceuticals, Inc.* | 1,113 | 29,495 | ||||||
|
| |||||||
| 360,968 | ||||||||
| Professional Services 2.1% | ||||||||
ASGN, Inc.* | 268 | 30,067 | ||||||
CRA International, Inc. | 344 | 31,989 | ||||||
Exponent, Inc. | 250 | 29,225 | ||||||
Forrester Research, Inc.* | 582 | 27,674 | ||||||
Franklin Covey Co.* | 694 | 30,168 | ||||||
Heidrick & Struggles International, Inc. | 628 | 27,142 | ||||||
Huron Consulting Group, Inc.* | 554 | 27,351 | ||||||
Insperity, Inc. | 279 | 30,785 | ||||||
KBR, Inc. | 674 | 26,246 | ||||||
Kforce, Inc. | 415 | 24,244 | ||||||
TriNet Group, Inc.* | 303 | 27,900 | ||||||
|
| |||||||
| 312,791 | ||||||||
| Real Estate Management & Development 0.7% | ||||||||
Cushman & Wakefield PLC* | 1,545 | 28,026 | ||||||
Forestar Group, Inc.* | 1,275 | 26,507 | ||||||
Marcus & Millichap, Inc.* | 707 | 27,729 | ||||||
Newmark Group, Inc. (Class A Stock) | 2,077 | 28,289 | ||||||
|
| |||||||
| 110,551 | ||||||||
| Road & Rail 0.5% | ||||||||
Saia, Inc.* | 112 | 26,895 | ||||||
Universal Logistics Holdings, Inc. | 1,121 | 24,516 | ||||||
Werner Enterprises, Inc.(a) | 582 | 27,447 | ||||||
|
| |||||||
| 78,858 | ||||||||
| Semiconductors & Semiconductor Equipment 3.5% | ||||||||
Alpha & Omega Semiconductor Ltd.* | 1,007 | 29,253 | ||||||
Amkor Technology, Inc. | 1,009 | 27,717 | ||||||
Axcelis Technologies, Inc.* | 649 | 32,262 | ||||||
CMC Materials, Inc. | 180 | 23,872 | ||||||
Cohu, Inc.* | 738 | 26,332 | ||||||
Diodes, Inc.* | 335 | 32,438 | ||||||
See Notes to Financial Statements.
| 58 |
| Description | Shares | Value | ||||||
| COMMON STOCKS (Continued) | ||||||||
| Semiconductors & Semiconductor Equipment (cont'd.) | ||||||||
FormFactor, Inc.* | 692 | $ | 26,905 | |||||
Ichor Holdings Ltd.* | 551 | 24,415 | ||||||
Kulicke & Soffa Industries, Inc. (Singapore) | 487 | 34,182 | ||||||
Lattice Semiconductor Corp.* | 451 | 28,016 | ||||||
MACOM Technology Solutions Holdings, Inc.* | 430 | 26,105 | ||||||
MaxLinear, Inc. (Class A Stock)* | 533 | 27,839 | ||||||
NVE Corp. | 362 | 25,416 | ||||||
Onto Innovation, Inc.* | 383 | 28,392 | ||||||
Power Integrations, Inc. | 270 | 29,333 | ||||||
Semtech Corp.* | 388 | 27,129 | ||||||
SMART Global Holdings, Inc.* | 495 | 23,988 | ||||||
Synaptics, Inc.* | 176 | 33,401 | ||||||
Ultra Clean Holdings, Inc.* | 517 | 23,906 | ||||||
|
| |||||||
| 530,901 | ||||||||
| Software 7.7% | ||||||||
A10 Networks, Inc.* | 2,014 | 27,974 | ||||||
ACI Worldwide, Inc.* | 782 | 25,204 | ||||||
Agilysys, Inc.* | 470 | 26,710 | ||||||
Alarm.com Holdings, Inc.* | 295 | 24,877 | ||||||
Altair Engineering, Inc. (Class A Stock)* | 408 | 30,188 | ||||||
American Software, Inc. (Class A Stock) | 1,271 | 32,245 | ||||||
Appfolio, Inc. (Class A Stock)* | 189 | 22,321 | ||||||
Avaya Holdings Corp.* | 1,092 | 22,026 | ||||||
Benefitfocus, Inc.* | 1,851 | 22,342 | ||||||
Blackbaud, Inc.* | 390 | 27,179 | ||||||
Bottomline Technologies DE, Inc.* | 651 | 27,518 | ||||||
Cerence, Inc.* | 246 | 26,676 | ||||||
ChannelAdvisor Corp.* | 1,187 | 30,411 | ||||||
CommVault Systems, Inc.* | 342 | 27,692 | ||||||
Cornerstone OnDemand, Inc.* | 537 | 30,770 | ||||||
Digital Turbine, Inc.* | 414 | 24,198 | ||||||
Domo, Inc. (Class B Stock)* | 293 | 26,224 | ||||||
eGain Corp.* | 2,286 | 26,929 | ||||||
Envestnet, Inc.* | 361 | 28,833 | ||||||
Intelligent Systems Corp.* | 793 | 30,602 | ||||||
InterDigital, Inc.(a) | 386 | 27,834 | ||||||
J2 Global, Inc.* | 202 | 27,815 | ||||||
Mimecast Ltd.* | 452 | 31,554 | ||||||
Mitek Systems, Inc.* | 1,204 | 26,934 | ||||||
Model N, Inc.* | 829 | 28,111 | ||||||
Momentive Global, Inc.* | 1,254 | 24,591 | ||||||
See Notes to Financial Statements.
PGIM QMA Strategic Alpha ETFs | 59 |
PGIM QMA Strategic Alpha Small-Cap Growth ETF
Schedule of Investments (continued)
as of August 31, 2021
| Description | Shares | Value | ||||||
| COMMON STOCKS (Continued) | ||||||||
| Software (cont'd.) | ||||||||
OneSpan, Inc.* | 1,037 | $ | 19,983 | |||||
Progress Software Corp. | 599 | 27,889 | ||||||
PROS Holdings, Inc.* | 621 | 26,852 | ||||||
Q2 Holdings, Inc.* | 267 | 23,520 | ||||||
QAD, Inc. (Class A Stock) | 301 | 26,190 | ||||||
Qualys, Inc.* | 252 | 29,580 | ||||||
Rimini Street, Inc.* | 3,050 | 29,128 | ||||||
Sapiens International Corp. NV (Israel) | 1,044 | 29,796 | ||||||
SPS Commerce, Inc.* | 236 | 31,985 | ||||||
Upland Software, Inc.* | 748 | 29,157 | ||||||
Varonis Systems, Inc. (Class B Stock)* | 444 | 30,640 | ||||||
Vonage Holdings Corp.* | 1,806 | 25,465 | ||||||
Workiva, Inc. (Class A Stock)* | 204 | 28,615 | ||||||
Yext, Inc.* | 2,053 | 27,757 | ||||||
Zix Corp.* | 3,550 | 27,477 | ||||||
Zuora, Inc. (Class A Stock)* | 1,638 | 27,813 | ||||||
|
| |||||||
| 1,149,605 | ||||||||
| Specialty Retail 4.9% | ||||||||
Abercrombie & Fitch Co. (Class A Stock)* | 680 | 24,317 | ||||||
American Eagle Outfitters, Inc. | 762 | 23,256 | ||||||
America’s Car-Mart, Inc.* | 179 | 23,150 | ||||||
Asbury Automotive Group, Inc.* | 130 | 24,211 | ||||||
Bed Bath & Beyond, Inc.(a)* | 920 | 25,337 | ||||||
Boot Barn Holdings, Inc.* | 304 | 27,141 | ||||||
Buckle, Inc. (The) | 608 | 23,548 | ||||||
Caleres, Inc. | 1,040 | 25,574 | ||||||
Camping World Holdings, Inc. (Class A Stock) | 654 | 26,121 | ||||||
Children’s Place, Inc. (The)* | 300 | 26,052 | ||||||
Citi Trends, Inc.* | 328 | 28,254 | ||||||
Designer Brands, Inc. (Class A Stock)* | 1,777 | 25,767 | ||||||
Guess?, Inc. | 1,170 | 28,302 | ||||||
Haverty Furniture Cos., Inc. | 715 | 25,476 | ||||||
Hibbett, Inc. | 293 | 28,037 | ||||||
JOANN, Inc. | 1,634 | 22,402 | ||||||
Kirkland’s, Inc.* | 1,343 | 25,678 | ||||||
MarineMax, Inc.* | 489 | 23,775 | ||||||
Monro, Inc.(a) | 395 | 22,479 | ||||||
Murphy USA, Inc. | 174 | 27,019 | ||||||
National Vision Holdings, Inc.* | 484 | 29,030 | ||||||
OneWater Marine, Inc. (Class A Stock) | 621 | 25,144 | ||||||
Rent-A-Center, Inc. | 485 | 30,594 | ||||||
See Notes to Financial Statements.
| 60 |
| Description | Shares | Value | ||||||
| COMMON STOCKS (Continued) | ||||||||
| Specialty Retail (cont'd.) | ||||||||
Sally Beauty Holdings, Inc.* | 1,369 | $ | 25,450 | |||||
Shoe Carnival, Inc. | 776 | 29,705 | ||||||
Signet Jewelers Ltd. | 399 | 31,601 | ||||||
Urban Outfitters, Inc.* | 703 | 23,213 | ||||||
Winmark Corp. | 130 | 27,252 | ||||||
|
| |||||||
| 727,885 | ||||||||
| Technology Hardware, Storage & Peripherals 0.7% | ||||||||
3D Systems Corp.* | 985 | 29,983 | ||||||
Corsair Gaming, Inc.(a)* | 965 | 27,937 | ||||||
Diebold Nixdorf, Inc.* | 2,258 | 24,567 | ||||||
Turtle Beach Corp.* | 882 | 25,058 | ||||||
|
| |||||||
| 107,545 | ||||||||
| Textiles, Apparel & Luxury Goods 0.9% | ||||||||
Crocs, Inc.* | 191 | 27,278 | ||||||
Kontoor Brands, Inc. | 456 | 24,606 | ||||||
Oxford Industries, Inc. | 303 | 27,361 | ||||||
Steven Madden Ltd. | 604 | 24,444 | ||||||
Wolverine World Wide, Inc. | 743 | 26,644 | ||||||
|
| |||||||
| 130,333 | ||||||||
| Thrifts & Mortgage Finance 1.2% | ||||||||
Axos Financial, Inc.* | 549 | 26,616 | ||||||
Bridgewater Bancshares, Inc.* | 1,624 | 26,552 | ||||||
Columbia Financial, Inc.* | 1,455 | 26,234 | ||||||
Kearny Financial Corp. | 2,125 | 26,966 | ||||||
Meta Financial Group, Inc. | 534 | 26,268 | ||||||
NMI Holdings, Inc. (Class A Stock)* | 1,137 | 25,662 | ||||||
Walker & Dunlop, Inc. | 245 | 27,207 | ||||||
|
| |||||||
| 185,505 | ||||||||
| Tobacco 0.4% | ||||||||
Turning Point Brands, Inc. | 504 | 25,079 | ||||||
Vector Group Ltd. | 1,919 | 28,823 | ||||||
|
| |||||||
| 53,902 | ||||||||
| Trading Companies & Distributors 2.2% | ||||||||
Applied Industrial Technologies, Inc. | 281 | 24,956 | ||||||
Beacon Roofing Supply, Inc.* | 483 | 24,865 | ||||||
BlueLinx Holdings, Inc.* | 594 | 34,191 | ||||||
See Notes to Financial Statements.
PGIM QMA Strategic Alpha ETFs | 61 |
PGIM QMA Strategic Alpha Small-Cap Growth ETF
Schedule of Investments (continued)
as of August 31, 2021
| Description | Shares | Value | ||||||
| COMMON STOCKS (Continued) | ||||||||
| Trading Companies & Distributors (cont'd.) | ||||||||
Boise Cascade Co. | 504 | $ | 29,156 | |||||
Global Industrial Co. | 678 | 26,096 | ||||||
H&E Equipment Services, Inc. | 759 | 25,844 | ||||||
Herc Holdings, Inc.* | 211 | 27,736 | ||||||
Karat Packaging, Inc.* | 1,106 | 25,958 | ||||||
Lawson Products, Inc.* | 492 | 25,953 | ||||||
McGrath RentCorp | 328 | 22,888 | ||||||
Transcat, Inc.* | 419 | 28,391 | ||||||
WESCO International, Inc.* | 243 | 28,436 | ||||||
|
| |||||||
| 324,470 | ||||||||
| Transportation Infrastructure 0.2% | ||||||||
Macquarie Infrastructure Corp. | 664 | 26,460 | ||||||
| Water Utilities 0.8% | ||||||||
American States Water Co. | 318 | 29,323 | ||||||
Global Water Resources, Inc. | 1,487 | 29,740 | ||||||
Pure Cycle Corp.* | 1,670 | 24,966 | ||||||
York Water Co. (The) | 560 | 28,879 | ||||||
|
| |||||||
| 112,908 | ||||||||
| Wireless Telecommunication Services 0.2% | ||||||||
Shenandoah Telecommunications Co. | 885 | 26,400 | ||||||
|
| |||||||
TOTAL COMMON STOCKS | 14,866,009 | |||||||
|
| |||||||
TOTAL LONG-TERM INVESTMENTS | 14,868,009 | |||||||
|
| |||||||
| SHORT-TERM INVESTMENTS 2.3% | ||||||||
| AFFILIATED MUTUAL FUND 1.6% | ||||||||
PGIM Institutional Money Market Fund | 239,526 | 239,382 | ||||||
|
| |||||||
See Notes to Financial Statements.
| 62 |
| Description | Interest Rate | Maturity Date | Principal Amount (000)# | Value | ||||||||||||
| SHORT-TERM INVESTMENTS (Continued) | ||||||||||||||||
| TIME DEPOSIT 0.7% | ||||||||||||||||
Skandinaviska Enskilda Banken AB (Sweden) | 0.005 | % | 09/01/21 | 102 | $ | 102,166 | ||||||||||
|
| |||||||||||||||
TOTAL SHORT-TERM INVESTMENTS | 341,548 | |||||||||||||||
|
| |||||||||||||||
TOTAL INVESTMENTS 101.5% | 15,209,557 | |||||||||||||||
Liabilities in excess of other assets (1.5)% |
| (231,992 | ) | |||||||||||||
|
| |||||||||||||||
NET ASSETS 100.0% |
| $ | 14,977,565 | |||||||||||||
|
| |||||||||||||||
The following abbreviations are used in the annual report:
| # | Principal or notional amount is shown in U.S. dollars unless otherwise stated. |
| ^ | Indicates a Level 3 instrument. The aggregate value of Level 3 instruments is $0 and 0.0% of net assets. |
| (a) | All or a portion of security is on loan. The aggregate market value of such securities, including those sold and pending settlement, is $231,872; cash collateral of $239,284 (included in liabilities) was received with which the Fund purchased highly liquid short-term investments. In the event of significant appreciation in value of securities on loan on the last business day of the reporting period, the Fund may reflect a collateral value that is less than the market value of the loaned securities and such shortfall is remedied the following business day. |
| (b) | Represents security purchased with cash collateral received for securities on loan and includes dividend reinvestment. |
| (wa) | PGIM Investments LLC, the manager of the Fund, also serves as manager of the PGIM Core Ultra Short Bond Fund and PGIM Institutional Money Market Fund, if applicable. |
| * | Non-income producing security. |
Fair Value Measurements:
Various inputs are used in determining the value of the Fund’s investments. These inputs are summarized in the three broad levels listed below.
Level 1—unadjusted quoted prices generally in active markets for identical securities.
Level 2—quoted prices for similar securities, interest rates and yield curves, prepayment speeds, foreign currency exchange rates and other observable inputs.
Level 3—unobservable inputs for securities valued in accordance with Board approved fair valuation
See Notes to Financial Statements.
PGIM QMA Strategic Alpha ETFs | 63 |
PGIM QMA Strategic Alpha Small-Cap Growth ETF
Schedule of Investments (continued)
as of August 31, 2021
The following is a summary of the inputs used as of August 31, 2021 in valuing such portfolio securities:
| Level 1 | Level 2 | Level 3 | ||||||||||
| Investments in Securities | ||||||||||||
| Assets | ||||||||||||
| Long-Term Investments | ||||||||||||
Corporate Bond | $ | — | $ | 2,000 | $ | — | ||||||
| Common Stocks | ||||||||||||
Aerospace & Defense | 22,238 | — | — | |||||||||
Air Freight & Logistics | 26,962 | — | — | |||||||||
Airlines | 26,749 | — | — | |||||||||
Auto Components | 219,315 | — | — | |||||||||
Automobiles | 25,411 | — | — | |||||||||
Banks | 350,264 | — | — | |||||||||
Beverages | 81,125 | — | — | |||||||||
Biotechnology | 1,564,742 | — | — | |||||||||
Building Products | 185,703 | — | — | |||||||||
Capital Markets | 330,369 | — | — | |||||||||
Chemicals | 379,292 | — | — | |||||||||
Commercial Services & Supplies | 260,950 | — | — | |||||||||
Communications Equipment | 223,013 | — | — | |||||||||
Construction & Engineering | 162,115 | — | — | |||||||||
Consumer Finance | 141,751 | — | — | |||||||||
Containers & Packaging | 79,075 | — | — | |||||||||
Distributors | 26,859 | — | — | |||||||||
Diversified Consumer Services | 32,731 | — | — | |||||||||
Diversified Telecommunication Services | 102,682 | — | — | |||||||||
Electric Utilities | 28,750 | — | — | |||||||||
Electrical Equipment | 131,985 | — | — | |||||||||
Electronic Equipment, Instruments & Components | 402,380 | — | — | |||||||||
Energy Equipment & Services | 25,710 | — | — | |||||||||
Entertainment | 51,824 | — | — | |||||||||
Equity Real Estate Investment Trusts (REITs) | 433,226 | — | — | |||||||||
Food & Staples Retailing | 142,059 | — | — | |||||||||
Food Products | 176,523 | — | — | |||||||||
Health Care Equipment & Supplies | 939,341 | — | — | |||||||||
Health Care Providers & Services | 676,658 | — | — | |||||||||
Health Care Technology | 161,021 | — | — | |||||||||
Hotels, Restaurants & Leisure | 331,453 | — | — | |||||||||
Household Durables | 298,071 | — | — | |||||||||
Household Products | 73,534 | — | — | |||||||||
Independent Power & Renewable Electricity Producers | 58,080 | — | — | |||||||||
Insurance | 47,412 | — | — | |||||||||
Interactive Media & Services | 102,159 | — | — | |||||||||
See Notes to Financial Statements.
| 64 |
| Level 1 | Level 2 | Level 3 | ||||||||||
| Investments in Securities (continued) | ||||||||||||
| Assets (continued) | ||||||||||||
| Long-Term Investments (continued) | ||||||||||||
| Common stocks (continued) | ||||||||||||
Internet & Direct Marketing Retail | $ | 170,210 | $ | — | $ | — | ||||||
IT Services | 357,336 | — | — | |||||||||
Leisure Products | 213,839 | — | — | |||||||||
Life Sciences Tools & Services | 76,652 | — | — | |||||||||
Machinery | 768,305 | — | — | |||||||||
Media | 131,808 | — | — | |||||||||
Metals & Mining | 194,549 | — | — | |||||||||
Mortgage Real Estate Investment Trusts (REITs) | 25,738 | — | — | |||||||||
Multiline Retail | 26,881 | — | — | |||||||||
Oil, Gas & Consumable Fuels | 217,769 | — | — | |||||||||
Personal Products | 122,308 | — | — | |||||||||
Pharmaceuticals | 360,968 | — | — | |||||||||
Professional Services | 312,791 | — | — | |||||||||
Real Estate Management & Development | 110,551 | — | — | |||||||||
Road & Rail | 78,858 | — | — | |||||||||
Semiconductors & Semiconductor Equipment | 530,901 | — | — | |||||||||
Software | 1,149,605 | — | — | |||||||||
Specialty Retail | 727,885 | — | — | |||||||||
Technology Hardware, Storage & Peripherals | 107,545 | — | — | |||||||||
Textiles, Apparel & Luxury Goods | 130,333 | — | — | |||||||||
Thrifts & Mortgage Finance | 185,505 | — | — | |||||||||
Tobacco | 53,902 | — | — | |||||||||
Trading Companies & Distributors | 324,470 | — | — | |||||||||
Transportation Infrastructure | 26,460 | — | — | |||||||||
Water Utilities | 112,908 | — | — | |||||||||
Wireless Telecommunication Services | 26,400 | — | — | |||||||||
| Short-Term Investments | ||||||||||||
Affiliated Mutual Fund | 239,382 | — | — | |||||||||
Time Deposit | — | 102,166 | — | |||||||||
|
|
|
|
|
| |||||||
Total | $ | 15,105,391 | $ | 104,166 | $ | — | ||||||
|
|
|
|
|
| |||||||
See Notes to Financial Statements.
PGIM QMA Strategic Alpha ETFs | 65 |
PGIM QMA Strategic Alpha Small-Cap Growth ETF
Schedule of Investments (continued)
as of August 31, 2021
Industry Classification:
The industry classification of investments and liabilities in excess of other assets shown as a percentage of net assets as of August 31, 2021 were as follows (unaudited):
Biotechnology | 10.4 | % | ||
Software | 7.7 | |||
Health Care Equipment & Supplies | 6.3 | |||
Machinery | 5.1 | |||
Specialty Retail | 4.9 | |||
Health Care Providers & Services | 4.5 | |||
Semiconductors & Semiconductor Equipment | 3.5 | |||
Equity Real Estate Investment Trusts (REITs) | 2.9 | |||
Electronic Equipment, Instruments & Components | 2.7 | |||
Chemicals | 2.5 | |||
Pharmaceuticals | 2.4 | |||
IT Services | 2.4 | |||
Banks | 2.3 | |||
Hotels, Restaurants & Leisure | 2.2 | |||
Capital Markets | 2.2 | |||
Trading Companies & Distributors | 2.2 | |||
Professional Services | 2.1 | |||
Household Durables | 2.0 | |||
Commercial Services & Supplies | 1.7 | |||
Affiliated Mutual Fund (1.6% represents investments purchased with collateral from securities on loan) | 1.6 | |||
Communications Equipment | 1.5 | |||
Auto Components | 1.5 | |||
Oil, Gas & Consumable Fuels | 1.5 | |||
Leisure Products | 1.4 | |||
Metals & Mining | 1.3 | |||
Building Products | 1.2 | |||
Thrifts & Mortgage Finance | 1.2 | |||
Food Products | 1.2 | |||
Internet & Direct Marketing Retail | 1.1 | |||
Construction & Engineering | 1.1 | |||
Health Care Technology | 1.1 | |||
Food & Staples Retailing | 0.9 | |||
Consumer Finance | 0.9 | |||
Electrical Equipment | 0.9 | |||
Media | 0.9 | |||
Textiles, Apparel & Luxury Goods | 0.9 | |||
Personal Products | 0.8 | |||
Water Utilities | 0.8 | |||
Real Estate Management & Development | 0.7 | |||
Technology Hardware, Storage & Peripherals | 0.7 | |||
Diversified Telecommunication Services | 0.7 | |||
Time Deposit | 0.7 | |||
Interactive Media & Services | 0.7 | |||
Beverages | 0.5 | |||
Containers & Packaging | 0.5 | |||
Road & Rail | 0.5 | |||
Life Sciences Tools & Services | 0.5 | |||
Household Products | 0.5 | |||
Independent Power & Renewable Electricity Producers | 0.4 | |||
Tobacco | 0.4 | |||
Entertainment | 0.3 | |||
Insurance | 0.3 | |||
Diversified Consumer Services | 0.2 | |||
Electric Utilities | 0.2 | |||
Air Freight & Logistics | 0.2 | |||
Multiline Retail | 0.2 | |||
Distributors | 0.2 | |||
Airlines | 0.2 | |||
Transportation Infrastructure | 0.2 | |||
Wireless Telecommunication Services | 0.2 | |||
Mortgage Real Estate Investment Trusts (REITs) | 0.2 | |||
Energy Equipment & Services | 0.2 | |||
Automobiles | 0.2 | |||
Aerospace & Defense | 0.1 | |||
Diversified Financial Services | 0.0 | * | ||
|
| |||
| 101.5 | ||||
Liabilities in excess of other assets | (1.5 | ) | ||
|
| |||
| 100.0 | % | |||
|
|
| * | Less than +/- 0.05%. |
See Notes to Financial Statements.
| 66 |
Financial Instruments/Transactions—Summary of Offsetting and Netting Agreements:
The Fund entered into financial instruments/transactions during the period that are either offset in accordance with current requirements or are subject to enforceable master netting arrangements or similar agreements that permit offsetting. The information about offsetting and related netting arrangements for financial instruments/transactions, where the legal right to set-off exists, is presented in the summary below:
Offsetting of financial instrument/transaction assets and liabilities:
Description | Gross Market Value of Recognized Assets/(Liabilities) | Collateral Pledged/(Received)(1) | Net Amount | |||||||||
Securities on Loan | $ | 231,872 | $ | (231,872 | ) | $ | — | |||||
|
|
|
|
|
| |||||||
| (1) | Collateral amount disclosed by the Fund is limited to the market value of the financial instruments/transactions. |
See Notes to Financial Statements.
PGIM QMA Strategic Alpha ETFs | 67 |
PGIM QMA Strategic Alpha Small-Cap Growth ETF
Statement of Assets & Liabilities
as of August 31, 2021
Assets | ||||
Investments at value, including securities on loan of $231,872: | ||||
Unaffiliated investments (cost $12,587,837) | $ | 14,970,175 | ||
Affiliated investments (cost $239,296) | 239,382 | |||
Interest and dividends receivable | 11,293 | |||
|
| |||
Total Assets | 15,220,850 | |||
|
| |||
Liabilities | ||||
Payable to broker for collateral for securities on loan | 239,284 | |||
Management fee payable | 3,589 | |||
Other liabilities | 412 | |||
|
| |||
Total Liabilities | 243,285 | |||
|
| |||
Net Assets | $ | 14,977,565 | ||
|
| |||
Net assets were comprised of: | ||||
Common stock, at par | $ | 200 | ||
Paid-in capital in excess of par | 10,026,684 | |||
Total distributable earnings (loss) | 4,950,681 | |||
|
| |||
Net assets, August 31, 2021 | $ | 14,977,565 | ||
|
| |||
Net asset value, offering price and redemption price per share, | $ | 74.89 | ||
|
| |||
See Notes to Financial Statements.
| 68 |
PGIM QMA Strategic Alpha Small-Cap Growth ETF
Statement of Operations
Year Ended August 31, 2021
Net Investment Income (Loss) | ||||
Income | ||||
Interest income | $ | 33 | ||
Unaffiliated dividend income (net of $193 foreign withholding tax) | 113,196 | |||
Income from securities lending, net (including affiliated income of $628) | 2,417 | |||
Miscellaneous Income | 47 | |||
|
| |||
Total income | 115,693 | |||
|
| |||
Expenses | ||||
Management fee | 37,919 | |||
|
| |||
Total expenses | 37,919 | |||
|
| |||
Net investment income (loss) | 77,774 | |||
|
| |||
Realized And Unrealized Gain (Loss) On Investments | ||||
Net realized gain (loss) on: | ||||
Investment transactions (including affiliated of $(146)) | 3,312,267 | |||
Net change in unrealized appreciation (depreciation) on: | ||||
Investments (including affiliated of $(3)) | 1,450,000 | |||
|
| |||
Net gain (loss) on investment transactions | 4,762,267 | |||
|
| |||
Net Increase (Decrease) In Net Assets Resulting From Operations | $ | 4,840,041 | ||
|
| |||
See Notes to Financial Statements.
PGIM QMA Strategic Alpha ETFs | 69 |
PGIM QMA Strategic Alpha Small-Cap Growth ETF
Statements of Changes in Net Assets
| Year Ended August 31, | ||||||||
| 2021 | 2020 | |||||||
Increase (Decrease) in Net Assets |
| |||||||
Operations |
| |||||||
Net investment income (loss) | $ | 77,774 | $ | 72,636 | ||||
Net realized gain (loss) on investments | 3,312,267 | (637,993 | ) | |||||
Net change in unrealized appreciation (depreciation) on investments | 1,450,000 | 1,292,987 | ||||||
|
|
|
| |||||
Net increase (decrease) in net assets resulting from operations | 4,840,041 | 727,630 | ||||||
|
|
|
| |||||
Dividends and Distributions |
| |||||||
Distributions from distributable earnings | (98,108 | ) | (85,196 | ) | ||||
|
|
|
| |||||
Total increase (decrease) | 4,741,933 | 642,434 | ||||||
Net Assets: |
| |||||||
Beginning of period | 10,235,632 | 9,593,198 | ||||||
|
|
|
| |||||
End of period | $ | 14,977,565 | $ | 10,235,632 | ||||
|
|
|
| |||||
See Notes to Financial Statements.
| 70 |
PGIM QMA Strategic Alpha Small-Cap Growth ETF
Financial Highlights
| Year Ended August 31, | November 13, through | |||||||||||||||
| 2021 | 2020 | 2019 | ||||||||||||||
| Per Share Operating Performance(a): | ||||||||||||||||
| Net Asset Value, Beginning of Period | $51.18 | $47.97 | $50.00 | |||||||||||||
| Income (loss) from investment operations: | ||||||||||||||||
| Net investment income (loss) | 0.39 | 0.36 | 0.39 | |||||||||||||
| Net realized and unrealized gain (loss) on investments | 23.81 | 3.28 | (2.13 | ) | ||||||||||||
| Total from investment operations | 24.20 | 3.64 | (1.74 | ) | ||||||||||||
| Less Dividends and Distributions: | ||||||||||||||||
| Dividends from net investment income | (0.49 | ) | (0.43 | ) | (0.29 | ) | ||||||||||
| Net asset value, end of period | $74.89 | $51.18 | $47.97 | |||||||||||||
| Total Return(b): | 47.52% | 7.64% | (3.50)% | |||||||||||||
| Ratios/Supplemental Data: | ||||||||||||||||
| Net assets, end of period (000) | $14,978 | $10,236 | $9,593 | |||||||||||||
| Average net assets (000) | $13,076 | $9,621 | $10,819 | |||||||||||||
| Ratios to average net assets(c): | ||||||||||||||||
| Expenses after waivers and/or expense reimbursement | 0.29% | 0.29% | 0.29% | (d) | ||||||||||||
| Expenses before waivers and/or expense reimbursement | 0.29% | 0.29% | 0.29% | (d) | ||||||||||||
| Net investment income (loss) | 0.59% | 0.76% | 0.98% | (d) | ||||||||||||
| Portfolio turnover rate(f)(g) | 126% | 123% | 78% | |||||||||||||
| (a) | Calculated based on average shares outstanding during the period. |
| (b) | Total return is calculated assuming a purchase of a share on the first day and a sale on the last day of the period reported and includes reinvestment of dividends and distributions, if any. Total returns may reflect adjustments to conform to generally accepted accounting principles. Total returns for periods less than one full year are not annualized. |
| (c) | Does not include expenses of the underlying funds in which the Fund invests. |
| (d) | Annualized. |
| (e) | Commencement of operations. |
| (f) | The Fund’s portfolio turnover rate is calculated in accordance with regulatory requirements, without regard to transactions involving short-term investments and certain derivatives. If such transactions were included, the Fund’s portfolio turnover rate may be higher. |
| (g) | Portfolio turnover excludes the value of portfolio securities received or delivered as a result of in-kind fund share transactions, if any. |
See Notes to Financial Statements.
PGIM QMA Strategic Alpha ETFs | 71 |
PGIM QMA Strategic Alpha Small-Cap Value ETF
Schedule of Investments
as of August 31, 2021
| Description | Shares | Value | ||||||
| LONG-TERM INVESTMENTS 99.0% | ||||||||
| COMMON STOCKS 99.0% | ||||||||
| Aerospace & Defense 1.1% | ||||||||
AAR Corp.* | 521 | $ | 17,636 | |||||
Ducommun, Inc.* | 338 | 17,813 | ||||||
Kaman Corp. | 416 | 16,257 | ||||||
Moog, Inc. (Class A Stock) | 237 | 18,827 | ||||||
National Presto Industries, Inc. | 195 | 16,291 | ||||||
Park Aerospace Corp. | 1,185 | 17,277 | ||||||
Parsons Corp.* | 486 | 17,219 | ||||||
Vectrus, Inc.* | 407 | 20,476 | ||||||
|
| |||||||
| 141,796 | ||||||||
| Air Freight & Logistics 0.6% | ||||||||
Atlas Air Worldwide Holdings, Inc.* | 270 | 19,756 | ||||||
Echo Global Logistics, Inc.* | 571 | 18,774 | ||||||
Hub Group, Inc. (Class A Stock)* | 246 | 17,269 | ||||||
Radiant Logistics, Inc.* | 2,914 | 19,961 | ||||||
|
| |||||||
| 75,760 | ||||||||
| Airlines 0.4% | ||||||||
Mesa Air Group, Inc.* | 2,106 | 16,806 | ||||||
SkyWest, Inc.* | 458 | 21,365 | ||||||
Spirit Airlines, Inc.* | 681 | 16,705 | ||||||
|
| |||||||
| 54,876 | ||||||||
| Auto Components 0.5% | ||||||||
Dana, Inc. | 764 | 17,770 | ||||||
Goodyear Tire & Rubber Co. (The)* | 1,161 | 18,390 | ||||||
Modine Manufacturing Co.* | 1,079 | 13,423 | ||||||
Standard Motor Products, Inc. | 429 | 18,400 | ||||||
|
| |||||||
| 67,983 | ||||||||
| Banks 14.4% | ||||||||
1st Source Corp. | 403 | 18,941 | ||||||
Allegiance Bancshares, Inc. | 497 | 18,473 | ||||||
Amalgamated Financial Corp. | 1,180 | 18,349 | ||||||
Amerant Bancorp, Inc. (Class A Stock)* | 818 | 21,734 | ||||||
American National Bankshares, Inc. | 567 | 19,380 | ||||||
Ameris Bancorp | 335 | 16,495 | ||||||
Arrow Financial Corp. | 470 | 17,319 | ||||||
Atlantic Capital Bancshares, Inc.* | 747 | 18,100 | ||||||
Atlantic Union Bankshares Corp. | 511 | 18,907 | ||||||
See Notes to Financial Statements.
| 72 |
| Description | Shares | Value | ||||||
| COMMON STOCKS (Continued) | ||||||||
| Banks (cont'd.) | ||||||||
Banner Corp. | 345 | $ | 19,734 | |||||
Bar Harbor Bankshares | 645 | 17,673 | ||||||
Berkshire Hills Bancorp, Inc. | 654 | 16,762 | ||||||
Brookline Bancorp, Inc. | 1,244 | 18,623 | ||||||
Bryn Mawr Bank Corp. | 467 | 19,054 | ||||||
Business First Bancshares, Inc. | 696 | 16,648 | ||||||
Byline Bancorp, Inc. | 755 | 18,573 | ||||||
Cambridge Bancorp | 206 | 17,662 | ||||||
Camden National Corp. | 406 | 18,948 | ||||||
Capital Bancorp, Inc. | 769 | 18,241 | ||||||
Capstar Financial Holdings, Inc. | 924 | 19,441 | ||||||
Carter Bankshares, Inc.* | 1,601 | 19,516 | ||||||
Cathay General Bancorp | 478 | 19,015 | ||||||
Central Pacific Financial Corp. | 711 | 17,995 | ||||||
Civista Bancshares, Inc. | 717 | 16,864 | ||||||
CNB Financial Corp. | 781 | 19,197 | ||||||
Community Trust Bancorp, Inc. | 460 | 19,164 | ||||||
ConnectOne Bancorp, Inc. | 634 | 18,139 | ||||||
CrossFirst Bankshares, Inc.* | 1,195 | 15,798 | ||||||
Customers Bancorp, Inc.* | 486 | 20,125 | ||||||
Eastern Bankshares, Inc. | 998 | 19,740 | ||||||
Enterprise Bancorp, Inc. | 498 | 16,808 | ||||||
Equity Bancshares, Inc. (Class A Stock)* | 571 | 18,318 | ||||||
Farmers National Banc Corp. | 1,063 | 16,583 | ||||||
FB Financial Corp. | 480 | 19,771 | ||||||
Financial Institutions, Inc. | 599 | 19,024 | ||||||
First BanCorp (Puerto Rico) | 1,492 | 18,993 | ||||||
First Bancorp, Inc. (The) | 567 | 16,834 | ||||||
First Bancshares, Inc. (The) | 446 | 18,072 | ||||||
First Bank | 1,356 | 18,062 | ||||||
First Busey Corp. | 785 | 18,605 | ||||||
First Commonwealth Financial Corp. | 1,249 | 16,886 | ||||||
First Community Bankshares, Inc. | 564 | 17,619 | ||||||
First Financial Bancorp | 806 | 18,949 | ||||||
First Financial Corp. | 454 | 18,355 | ||||||
First Internet Bancorp | 600 | 17,832 | ||||||
First Merchants Corp. | 450 | 18,518 | ||||||
First Mid Bancshares, Inc. | 439 | 17,955 | ||||||
First Midwest Bancorp, Inc. | 1,006 | 18,842 | ||||||
First of Long Island Corp. (The) | 820 | 17,384 | ||||||
Flushing Financial Corp. | 763 | 17,496 | ||||||
Fulton Financial Corp. | 1,181 | 18,719 | ||||||
See Notes to Financial Statements.
PGIM QMA Strategic Alpha ETFs | 73 |
PGIM QMA Strategic Alpha Small-Cap Value ETF
Schedule of Investments (continued)
as of August 31, 2021
| Description | Shares | Value | ||||||
| COMMON STOCKS (Continued) | ||||||||
| Banks (cont'd.) | ||||||||
Great Southern Bancorp, Inc. | 348 | $ | 18,956 | |||||
Great Western Bancorp, Inc. | 582 | 18,019 | ||||||
Guaranty Bancshares, Inc. | 544 | 18,670 | ||||||
Hancock Whitney Corp. | 392 | 18,016 | ||||||
Hanmi Financial Corp. | 985 | 18,991 | ||||||
HarborOne Bancorp, Inc. | 1,330 | 18,793 | ||||||
HBT Financial, Inc. | 1,122 | 18,345 | ||||||
Heartland Financial USA, Inc. | 400 | 18,812 | ||||||
Heritage Financial Corp. | 751 | 19,113 | ||||||
HomeTrust Bancshares, Inc. | 631 | 17,554 | ||||||
Hope Bancorp, Inc. | 1,354 | 18,672 | ||||||
Horizon Bancorp, Inc. | 1,077 | 19,224 | ||||||
Independent Bank Corp. | 854 | 17,883 | ||||||
International Bancshares Corp. | 465 | 19,474 | ||||||
Lakeland Bancorp, Inc. | 1,009 | 17,032 | ||||||
Macatawa Bank Corp. | 2,208 | 18,128 | ||||||
Mercantile Bank Corp. | 572 | 17,846 | ||||||
Metrocity Bankshares, Inc. | 908 | 18,805 | ||||||
Mid Penn Bancorp, Inc. | 652 | 17,337 | ||||||
Midland States Bancorp, Inc. | 722 | 18,267 | ||||||
MidWestOne Financial Group, Inc. | 570 | 16,735 | ||||||
NBT Bancorp, Inc. | 509 | 18,253 | ||||||
Northrim BanCorp, Inc. | 455 | 19,096 | ||||||
OceanFirst Financial Corp. | 932 | 19,814 | ||||||
OFG Bancorp (Puerto Rico) | 711 | 16,929 | ||||||
Origin Bancorp, Inc. | 450 | 18,518 | ||||||
Orrstown Financial Services, Inc. | 797 | 19,016 | ||||||
Pacific Premier Bancorp, Inc. | 473 | 18,901 | ||||||
Peapack Gladstone Financial Corp. | 522 | 17,388 | ||||||
Peoples Bancorp, Inc. | 618 | 19,306 | ||||||
Peoples Financial Services Corp. | 418 | 19,266 | ||||||
Premier Financial Bancorp, Inc. | 1,068 | 19,235 | ||||||
Primis Financial Corp. | 1,192 | 17,868 | ||||||
QCR Holdings, Inc. | 363 | 18,858 | ||||||
RBB Bancorp | 753 | 19,382 | ||||||
Red River Bancshares, Inc. | 355 | 17,807 | ||||||
Reliant Bancorp, Inc. | 592 | 17,168 | ||||||
Republic Bancorp, Inc. (Class A Stock) | 362 | 18,147 | ||||||
S&T Bancorp, Inc. | 612 | 18,238 | ||||||
Sandy Spring Bancorp, Inc. | 434 | 18,909 | ||||||
Sierra Bancorp | 754 | 19,167 | ||||||
SmartFinancial, Inc. | 754 | 18,835 | ||||||
See Notes to Financial Statements.
| 74 |
| Description | Shares | Value | ||||||
| COMMON STOCKS (Continued) | ||||||||
| Banks (cont'd.) | ||||||||
South Plains Financial, Inc. | 740 | $ | 17,168 | |||||
South State Corp. | 261 | 17,899 | ||||||
Southern First Bancshares, Inc.* | 368 | 18,761 | ||||||
Spirit of Texas Bancshares, Inc. | 736 | 17,406 | ||||||
Summit Financial Group, Inc. | 784 | 18,769 | ||||||
Towne Bank | 579 | 17,642 | ||||||
TriCo Bancshares | 455 | 17,995 | ||||||
TriState Capital Holdings, Inc.* | 904 | 18,270 | ||||||
United Community Banks, Inc. | 626 | 18,886 | ||||||
Univest Financial Corp. | 676 | 18,306 | ||||||
Valley National Bancorp | 1,338 | 17,448 | ||||||
WesBanco, Inc. | 558 | 18,972 | ||||||
|
| |||||||
| 1,926,530 | ||||||||
| Beverages 0.1% | ||||||||
Primo Water Corp. | 1,106 | 19,643 | ||||||
| Biotechnology 6.2% | ||||||||
89bio, Inc.* | 1,078 | 19,954 | ||||||
Aeglea BioTherapeutics, Inc.* | 2,909 | 21,090 | ||||||
Agios Pharmaceuticals, Inc.* | 387 | 17,291 | ||||||
Akebia Therapeutics, Inc.* | 7,098 | 20,868 | ||||||
AnaptysBio, Inc.* | 766 | 19,617 | ||||||
AquaBounty Technologies, Inc.* | 3,848 | 17,816 | ||||||
Arcutis Biotherapeutics, Inc.* | 798 | 16,894 | ||||||
Athenex, Inc.* | 4,801 | 17,524 | ||||||
Avid Bioservices, Inc.* | 706 | 17,113 | ||||||
Blueprint Medicines Corp.* | 212 | 19,773 | ||||||
Cardiff Oncology, Inc.* | 3,549 | 26,014 | ||||||
Catalyst Pharmaceuticals, Inc.* | 3,172 | 17,478 | ||||||
Cullinan Oncology, Inc.* | 748 | 21,109 | ||||||
Dyne Therapeutics, Inc.* | 1,037 | 17,556 | ||||||
Eagle Pharmaceuticals, Inc.* | 380 | 20,281 | ||||||
Eiger BioPharmaceuticals, Inc.* | 2,318 | 18,868 | ||||||
Emergent BioSolutions, Inc.* | 288 | 18,167 | ||||||
Frequency Therapeutics, Inc.* | 2,198 | 16,969 | ||||||
Immunic, Inc.* | 2,018 | 19,877 | ||||||
Immunovant, Inc.* | 2,602 | 22,533 | ||||||
Jounce Therapeutics, Inc.* | 3,522 | 21,907 | ||||||
Kezar Life Sciences, Inc.* | 3,761 | 28,659 | ||||||
Kinnate Biopharma, Inc.* | 912 | 20,173 | ||||||
Kronos Bio, Inc.* | 899 | 18,798 | ||||||
See Notes to Financial Statements.
PGIM QMA Strategic Alpha ETFs | 75 |
PGIM QMA Strategic Alpha Small-Cap Value ETF
Schedule of Investments (continued)
as of August 31, 2021
| Description | Shares | Value | ||||||
| COMMON STOCKS (Continued) | ||||||||
| Biotechnology (cont'd.) | ||||||||
Krystal Biotech, Inc.* | 314 | $ | 18,193 | |||||
MiMedx Group, Inc.* | 1,453 | 21,446 | ||||||
Mustang Bio, Inc.* | 6,682 | 20,313 | ||||||
Myriad Genetics, Inc.* | 551 | 19,715 | ||||||
Neoleukin Therapeutics, Inc.* | 2,682 | 21,858 | ||||||
Oncternal Therapeutics, Inc.* | 4,726 | 21,361 | ||||||
OPKO Health, Inc.* | 5,053 | 19,505 | ||||||
Oyster Point Pharma, Inc.* | 1,332 | 17,556 | ||||||
Passage Bio, Inc.* | 1,530 | 18,391 | ||||||
Praxis Precision Medicines, Inc.* | 1,231 | 24,460 | ||||||
REGENXBIO, Inc.* | 569 | 18,379 | ||||||
Rhythm Pharmaceuticals, Inc.* | 1,097 | 14,272 | ||||||
Sangamo Therapeutics, Inc.* | 1,904 | 18,869 | ||||||
Solid Biosciences, Inc.* | 6,446 | 17,469 | ||||||
TCR2 Therapeutics, Inc.* | 1,399 | 23,461 | ||||||
Tonix Pharmaceuticals Holding Corp.* | 26,341 | 18,594 | ||||||
Vanda Pharmaceuticals, Inc.* | 966 | 16,171 | ||||||
Viking Therapeutics, Inc.* | 3,055 | 20,194 | ||||||
|
| |||||||
| 826,536 | ||||||||
| Building Products 1.2% | ||||||||
American Woodmark Corp.* | 244 | 17,192 | ||||||
Apogee Enterprises, Inc. | 461 | 19,814 | ||||||
Caesarstone Ltd. (Israel) | 1,287 | 16,731 | ||||||
Griffon Corp. | 799 | 19,336 | ||||||
Insteel Industries, Inc. | 464 | 17,168 | ||||||
JELD-WEN Holding, Inc.* | 680 | 18,727 | ||||||
Quanex Building Products Corp. | 738 | 17,387 | ||||||
Resideo Technologies, Inc.* | 581 | 18,731 | ||||||
UFP Industries, Inc. | 246 | 18,470 | ||||||
|
| |||||||
| 163,556 | ||||||||
| Capital Markets 1.4% | ||||||||
AssetMark Financial Holdings, Inc.* | 725 | 19,481 | ||||||
Blucora, Inc.* | 1,087 | 17,838 | ||||||
Cowen, Inc. (Class A Stock) | 465 | 16,759 | ||||||
Diamond Hill Investment Group, Inc. | 96 | 17,571 | ||||||
Donnelley Financial Solutions, Inc.* | 577 | 19,243 | ||||||
Moelis & Co. (Class A Stock) | 313 | 19,390 | ||||||
Oppenheimer Holdings, Inc. (Class A Stock) | 409 | 19,055 | ||||||
Piper Sandler Cos. | 143 | 20,437 | ||||||
See Notes to Financial Statements.
| 76 |
| Description | Shares | Value | ||||||
| COMMON STOCKS (Continued) | ||||||||
| Capital Markets (cont'd.) | ||||||||
PJT Partners, Inc. (Class A Stock) | 240 | $ | 18,955 | |||||
Sculptor Capital Management, Inc. (Class A Stock) | 746 | 21,112 | ||||||
|
| |||||||
| 189,841 | ||||||||
| Chemicals 2.1% | ||||||||
AdvanSix, Inc.* | 516 | 18,834 | ||||||
American Vanguard Corp. | 1,151 | 17,645 | ||||||
Avient Corp. | 380 | 19,794 | ||||||
Chase Corp. | 160 | 18,320 | ||||||
Ecovyst, Inc. | 1,126 | 14,649 | ||||||
GCP Applied Technologies, Inc.* | 773 | 18,428 | ||||||
Hawkins, Inc. | 488 | 18,485 | ||||||
Innospec, Inc. | 208 | 19,469 | ||||||
Koppers Holdings, Inc.* | 590 | 19,411 | ||||||
Kraton Corp.* | 460 | 19,375 | ||||||
Kronos Worldwide, Inc. | 1,323 | 17,517 | ||||||
Minerals Technologies, Inc. | 217 | 17,065 | ||||||
Sensient Technologies Corp. | 194 | 16,849 | ||||||
Stepan Co. | 153 | 17,987 | ||||||
Tronox Holdings PLC (United Kingdom) (Class A Stock) | 998 | 21,088 | ||||||
|
| |||||||
| 274,916 | ||||||||
| Commercial Services & Supplies 2.4% | ||||||||
ABM Industries, Inc. | 387 | 19,164 | ||||||
ACCO Brands Corp. | 1,911 | 17,906 | ||||||
Brady Corp. (Class A Stock) | 297 | 15,839 | ||||||
BrightView Holdings, Inc.* | 1,132 | 17,354 | ||||||
CECO Environmental Corp.* | 2,512 | 18,966 | ||||||
Deluxe Corp. | 416 | 15,954 | ||||||
Ennis, Inc. | 928 | 18,012 | ||||||
Harsco Corp.(a)* | 903 | 16,471 | ||||||
Healthcare Services Group, Inc. | 700 | 18,312 | ||||||
Heritage-Crystal Clean, Inc.* | 570 | 16,838 | ||||||
Herman Miller, Inc. | 414 | 17,400 | ||||||
HNI Corp. | 434 | 16,444 | ||||||
Interface, Inc. (Class A Stock) | 1,241 | 17,846 | ||||||
Kimball International, Inc. (Class B Stock) | 1,473 | 18,368 | ||||||
Matthews International Corp. (Class A Stock) | 536 | 19,848 | ||||||
Steelcase, Inc. (Class A Stock) | 1,310 | 18,458 | ||||||
UniFirst Corp. | 85 | 19,471 | ||||||
VSE Corp. | 369 | 18,446 | ||||||
|
| |||||||
| 321,097 | ||||||||
See Notes to Financial Statements.
PGIM QMA Strategic Alpha ETFs | 77 |
PGIM QMA Strategic Alpha Small-Cap Value ETF
Schedule of Investments (continued)
as of August 31, 2021
| Description | Shares | Value | ||||||
| COMMON STOCKS (Continued) | ||||||||
| Communications Equipment 1.2% | ||||||||
Digi International, Inc.* | 911 | $ | 20,024 | |||||
DZS, Inc.* | 1,127 | 15,564 | ||||||
EchoStar Corp. (Class A Stock)* | 755 | 20,385 | ||||||
EMCORE Corp.* | 2,143 | 16,030 | ||||||
Harmonic, Inc.* | 1,716 | 15,856 | ||||||
KVH Industries, Inc.* | 1,658 | 17,525 | ||||||
NetScout Systems, Inc.* | 646 | 17,713 | ||||||
Ribbon Communications, Inc.* | 2,659 | 17,363 | ||||||
Viavi Solutions, Inc.* | 1,095 | 17,837 | ||||||
|
| |||||||
| 158,297 | ||||||||
| Construction & Engineering 1.5% | ||||||||
Arcosa, Inc. | 339 | 17,228 | ||||||
Argan, Inc. | 403 | 18,659 | ||||||
EMCOR Group, Inc. | 149 | 18,104 | ||||||
Great Lakes Dredge & Dock Corp.* | 1,249 | 18,872 | ||||||
HC2 Holdings, Inc.* | 5,110 | 19,316 | ||||||
Matrix Service Co.* | 1,706 | 19,244 | ||||||
MYR Group, Inc.* | 190 | 19,762 | ||||||
Northwest Pipe Co.* | 647 | 16,770 | ||||||
NV5 Global, Inc.* | 176 | 18,594 | ||||||
Primoris Services Corp. | 602 | 15,471 | ||||||
Sterling Construction Co., Inc.* | 792 | 18,264 | ||||||
|
| |||||||
| 200,284 | ||||||||
| Construction Materials 0.3% | ||||||||
Summit Materials, Inc. (Class A Stock)* | 567 | 19,091 | ||||||
United States Lime & Minerals, Inc. | 114 | 16,654 | ||||||
|
| |||||||
| 35,745 | ||||||||
| Consumer Finance 1.3% | ||||||||
Encore Capital Group, Inc.* | 381 | 18,749 | ||||||
Enova International, Inc.* | 567 | 18,700 | ||||||
EZCORP, Inc. (Class A Stock)* | 3,257 | 22,441 | ||||||
FirstCash, Inc. | 226 | 19,366 | ||||||
Green Dot Corp. (Class A Stock)* | 364 | 19,015 | ||||||
Navient Corp. | 879 | 20,401 | ||||||
Nelnet, Inc. (Class A Stock) | 243 | 19,654 | ||||||
PROG Holdings, Inc. | 427 | 20,206 | ||||||
Regional Management Corp. | 341 | 20,265 | ||||||
|
| |||||||
| 178,797 | ||||||||
See Notes to Financial Statements.
| 78 |
| Description | Shares | Value | ||||||
| COMMON STOCKS (Continued) | ||||||||
| Containers & Packaging 0.6% | ||||||||
Greif, Inc., | ||||||||
(Class A Stock) | 274 | $ | 17,350 | |||||
(Class B Stock) | 295 | 18,142 | ||||||
Myers Industries, Inc. | 860 | 19,608 | ||||||
UFP Technologies, Inc.* | 281 | 19,667 | ||||||
|
| |||||||
| 74,767 | ||||||||
| Diversified Consumer Services 0.8% | ||||||||
Adtalem Global Education, Inc.* | 486 | 17,982 | ||||||
American Public Education, Inc.* | 609 | 16,017 | ||||||
Carriage Services, Inc. (Class A Stock) | 493 | 22,791 | ||||||
Graham Holdings Co. (Class B Stock) | 28 | 17,270 | ||||||
Laureate Education, Inc. (Class A Stock)* | 1,244 | 19,817 | ||||||
Perdoceo Education Corp.* | 1,514 | 16,624 | ||||||
|
| |||||||
| 110,501 | ||||||||
| Diversified Financial Services 0.4% | ||||||||
Alerus Financial Corp. | 646 | 19,290 | ||||||
A-Mark Precious Metals, Inc. | 354 | 17,173 | ||||||
Cannae Holdings, Inc.* | 557 | 17,779 | ||||||
|
| |||||||
| 54,242 | ||||||||
| Diversified Telecommunication Services 0.8% | ||||||||
ATN International, Inc. | 419 | 19,102 | ||||||
Consolidated Communications Holdings, Inc.* | 2,133 | 19,773 | ||||||
IDT Corp. (Class B Stock)* | 360 | 15,653 | ||||||
Liberty Latin America Ltd., | ||||||||
(Class A Stock)* | 1,235 | 17,611 | ||||||
(Class C Stock)* | 1,242 | 17,872 | ||||||
Ooma, Inc.* | 1,015 | 19,285 | ||||||
|
| |||||||
| 109,296 | ||||||||
| Electric Utilities 0.4% | ||||||||
ALLETE, Inc. | 228 | 15,372 | ||||||
Otter Tail Corp. | 349 | 19,149 | ||||||
Portland General Electric Co. | 363 | 18,640 | ||||||
|
| |||||||
| 53,161 | ||||||||
| Electrical Equipment 0.9% | ||||||||
AZZ, Inc. | 346 | 18,528 | ||||||
Encore Wire Corp. | 245 | 20,827 | ||||||
See Notes to Financial Statements.
PGIM QMA Strategic Alpha ETFs | 79 |
PGIM QMA Strategic Alpha Small-Cap Value ETF
Schedule of Investments (continued)
as of August 31, 2021
| Description | Shares | Value | ||||||
| COMMON STOCKS (Continued) | ||||||||
| Electrical Equipment (cont'd.) | ||||||||
EnerSys | 180 | $ | 15,226 | |||||
GrafTech International Ltd. | 1,578 | 17,469 | ||||||
Powell Industries, Inc. | 630 | 15,939 | ||||||
Preformed Line Products Co. | 263 | 18,442 | ||||||
Thermon Group Holdings, Inc.* | 1,082 | 18,069 | ||||||
|
| |||||||
| 124,500 | ||||||||
| Electronic Equipment, Instruments & Components 2.7% | ||||||||
Belden, Inc. | 381 | 21,812 | ||||||
Benchmark Electronics, Inc. | 692 | 18,705 | ||||||
CTS Corp. | 523 | 18,347 | ||||||
Daktronics, Inc.* | 2,985 | 18,179 | ||||||
ePlus, Inc.* | 197 | 21,319 | ||||||
Fabrinet (Thailand)* | 196 | 20,192 | ||||||
Insight Enterprises, Inc.* | 182 | 18,726 | ||||||
Itron, Inc.* | 187 | 15,710 | ||||||
Kimball Electronics, Inc.* | 891 | 21,535 | ||||||
Knowles Corp.* | 906 | 18,120 | ||||||
Methode Electronics, Inc. | 364 | 16,952 | ||||||
OSI Systems, Inc.* | 186 | 18,403 | ||||||
PC Connection, Inc. | 354 | 17,137 | ||||||
Plexus Corp.* | 183 | 16,805 | ||||||
Sanmina Corp.* | 478 | 18,871 | ||||||
ScanSource, Inc.* | 662 | 23,554 | ||||||
TTM Technologies, Inc.* | 1,298 | 18,172 | ||||||
Vishay Intertechnology, Inc.(a) | 826 | 18,147 | ||||||
Vishay Precision Group, Inc.* | 519 | 19,395 | ||||||
|
| |||||||
| 360,081 | ||||||||
| Energy Equipment & Services 1.4% | ||||||||
Archrock, Inc. | 2,146 | 16,481 | ||||||
ChampionX Corp.* | 767 | 17,894 | ||||||
Helix Energy Solutions Group, Inc.* | 4,323 | 16,255 | ||||||
Helmerich & Payne, Inc. | 642 | 17,283 | ||||||
National Energy Services Reunited Corp.* | 1,482 | 16,821 | ||||||
Newpark Resources, Inc.* | 5,737 | 15,031 | ||||||
Oceaneering International, Inc.* | 1,367 | 16,814 | ||||||
Oil States International, Inc.* | 3,156 | 18,494 | ||||||
RPC, Inc.* | 4,323 | 16,557 | ||||||
Tidewater, Inc.* | 1,608 | 18,492 | ||||||
US Silica Holdings, Inc.* | 1,598 | 14,030 | ||||||
|
| |||||||
| 184,152 | ||||||||
See Notes to Financial Statements.
| 80 |
| Description | Shares | Value | ||||||
| COMMON STOCKS (Continued) | ||||||||
| Entertainment 0.2% | ||||||||
Lions Gate Entertainment Corp., | ||||||||
(Class A Stock)* | 1,241 | $ | 16,034 | |||||
(Class B Stock)* | 1,385 | 16,287 | ||||||
|
| |||||||
| 32,321 | ||||||||
| Equity Real Estate Investment Trusts (REITs) 8.1% | ||||||||
Acadia Realty Trust | 793 | 16,827 | ||||||
Alexander & Baldwin, Inc. | 919 | 19,189 | ||||||
American Assets Trust, Inc. | 494 | 19,671 | ||||||
American Finance Trust, Inc. | 2,169 | 18,697 | ||||||
Apartment Investment & Management Co. (Class A Stock) | 2,686 | 19,286 | ||||||
Apple Hospitality REIT, Inc. | 1,246 | 18,416 | ||||||
Armada Hoffler Properties, Inc. | 1,284 | 17,244 | ||||||
Braemar Hotels & Resorts, Inc.* | 3,501 | 17,645 | ||||||
BRT Apartments Corp. | 1,052 | 20,430 | ||||||
CareTrust REIT, Inc. | 768 | 16,888 | ||||||
CatchMark Timber Trust, Inc. (Class A Stock) | 1,516 | 17,495 | ||||||
Centerspace | 202 | 20,438 | ||||||
Chatham Lodging Trust* | 1,591 | 19,092 | ||||||
City Office REIT, Inc. (Canada) | 1,508 | 24,083 | ||||||
Columbia Property Trust, Inc. | 1,138 | 19,027 | ||||||
CorePoint Lodging, Inc.* | 1,367 | 19,767 | ||||||
Corporate Office Properties Trust | 640 | 18,035 | ||||||
DiamondRock Hospitality Co.* | 2,166 | 19,581 | ||||||
DigitalBridge Group, Inc.* | 2,698 | 18,616 | ||||||
Diversified Healthcare Trust | 4,751 | 17,816 | ||||||
Essential Properties Realty Trust, Inc. | 617 | 19,997 | ||||||
Farmland Partners, Inc. | 1,477 | 18,093 | ||||||
Franklin Street Properties Corp. | 3,612 | 17,338 | ||||||
GEO Group, Inc. (The)(a) | 2,827 | 21,909 | ||||||
Getty Realty Corp. | 535 | 16,922 | ||||||
Gladstone Commercial Corp. | 800 | 18,104 | ||||||
Global Medical REIT, Inc. | 1,109 | 17,101 | ||||||
Global Net Lease, Inc. | 998 | 16,966 | ||||||
Hersha Hospitality Trust (Class A Stock)* | 1,998 | 18,741 | ||||||
Industrial Logistics Properties Trust | 638 | 17,500 | ||||||
iStar, Inc. | 731 | 19,335 | ||||||
Kite Realty Group Trust | 922 | 18,680 | ||||||
LTC Properties, Inc. | 495 | 17,082 | ||||||
Macerich Co. (The) | 1,109 | 18,942 | ||||||
Mack-Cali Realty Corp.* | 1,050 | 18,774 | ||||||
Monmouth Real Estate Investment Corp. | 967 | 18,354 | ||||||
See Notes to Financial Statements.
PGIM QMA Strategic Alpha ETFs | 81 |
PGIM QMA Strategic Alpha Small-Cap Value ETF
Schedule of Investments (continued)
as of August 31, 2021
| Description | Shares | Value | ||||||
| COMMON STOCKS (Continued) | ||||||||
| Equity Real Estate Investment Trusts (REITs) (cont'd.) | ||||||||
National Health Investors, Inc. | 270 | $ | 16,151 | |||||
Office Properties Income Trust | 592 | 15,706 | ||||||
Paramount Group, Inc. | 1,963 | 17,392 | ||||||
Pebblebrook Hotel Trust | 841 | 18,527 | ||||||
Piedmont Office Realty Trust, Inc. (Class A Stock) | 894 | 15,931 | ||||||
PotlatchDeltic Corp. | 350 | 18,183 | ||||||
Preferred Apartment Communities, Inc. (Class A Stock) | 1,558 | 19,444 | ||||||
PS Business Parks, Inc. | 119 | 18,710 | ||||||
Retail Opportunity Investments Corp. | 1,037 | 18,749 | ||||||
Retail Properties of America, Inc. (Class A Stock) | 1,471 | 19,447 | ||||||
Retail Value, Inc. | 751 | 18,775 | ||||||
RLJ Lodging Trust | 1,292 | 18,644 | ||||||
RPT Realty | 1,460 | 18,892 | ||||||
Sabra Health Care REIT, Inc. | 1,015 | 16,240 | ||||||
Service Properties Trust | 1,637 | 18,711 | ||||||
SITE Centers Corp. | 1,142 | 18,398 | ||||||
Summit Hotel Properties, Inc.* | 2,092 | 19,497 | ||||||
Sunstone Hotel Investors, Inc.* | 1,607 | 18,625 | ||||||
UMH Properties, Inc. | 772 | 18,296 | ||||||
Urban Edge Properties | 895 | 16,951 | ||||||
Urstadt Biddle Properties, Inc. (Class A Stock) | 896 | 17,096 | ||||||
Whitestone REIT (Class B Stock) | 2,066 | 20,267 | ||||||
Xenia Hotels & Resorts, Inc.* | 956 | 16,654 | ||||||
|
| |||||||
| 1,087,367 | ||||||||
| Food & Staples Retailing 1.1% | ||||||||
Andersons, Inc. (The) | 680 | 20,659 | ||||||
Ingles Markets, Inc. (Class A Stock)(a) | 307 | 20,842 | ||||||
Natural Grocers by Vitamin Cottage, Inc. | 1,604 | 19,392 | ||||||
PriceSmart, Inc. | 187 | 15,822 | ||||||
Sprouts Farmers Market, Inc.* | 746 | 18,575 | ||||||
United Natural Foods, Inc.* | 551 | 20,277 | ||||||
Village Super Market, Inc. (Class A Stock) | 810 | 18,136 | ||||||
Weis Markets, Inc. | 307 | 17,484 | ||||||
|
| |||||||
| 151,187 | ||||||||
| Food Products 1.4% | ||||||||
Fresh Del Monte Produce, Inc. | 605 | 19,892 | ||||||
Hostess Brands, Inc. (Class A Stock)* | 1,155 | 18,434 | ||||||
John B. Sanfilippo & Son, Inc. | 198 | 16,828 | ||||||
Lancaster Colony Corp. | 94 | 16,661 | ||||||
Landec Corp.* | 1,689 | 18,292 | ||||||
See Notes to Financial Statements.
| 82 |
| Description | Shares | Value | ||||||
| COMMON STOCKS (Continued) | ||||||||
| Food Products (cont'd.) | ||||||||
Limoneira Co. | 1,011 | $ | 16,631 | |||||
Sanderson Farms, Inc. | 99 | 19,453 | ||||||
Seneca Foods Corp. (Class A Stock)* | 329 | 16,111 | ||||||
Simply Good Foods Co. (The)* | 485 | 17,276 | ||||||
Tootsie Roll Industries, Inc. | 525 | 16,616 | ||||||
TreeHouse Foods, Inc.* | 414 | 15,513 | ||||||
|
| |||||||
| 191,707 | ||||||||
| Gas Utilities 1.0% | ||||||||
Brookfield Infrastructure Corp. (Canada) (Class A Stock) | 284 | 18,063 | ||||||
Chesapeake Utilities Corp. | 133 | 17,383 | ||||||
New Jersey Resources Corp. | 465 | 17,363 | ||||||
Northwest Natural Holding Co.(a) | 338 | 17,390 | ||||||
ONE Gas, Inc. | 244 | 17,524 | ||||||
South Jersey Industries, Inc.(a) | 710 | 17,615 | ||||||
Southwest Gas Holdings, Inc. | 242 | 17,015 | ||||||
Spire, Inc. | 250 | 16,675 | ||||||
|
| |||||||
| 139,028 | ||||||||
| Health Care Equipment & Supplies 2.1% | ||||||||
AngioDynamics, Inc.* | 679 | 19,216 | ||||||
Avanos Medical, Inc.* | 494 | 16,302 | ||||||
Haemonetics Corp.* | 302 | 18,951 | ||||||
Integer Holdings Corp.* | 175 | 17,288 | ||||||
Lantheus Holdings, Inc.* | 685 | 18,064 | ||||||
LivaNova PLC (United Kingdom)* | 197 | 16,290 | ||||||
Meridian Bioscience, Inc.* | 849 | 17,184 | ||||||
Merit Medical Systems, Inc.* | 270 | 19,378 | ||||||
Misonix, Inc.* | 696 | 17,678 | ||||||
Natus Medical, Inc.* | 688 | 18,246 | ||||||
Neogen Corp.* | 421 | 18,431 | ||||||
Orthofix Medical, Inc.* | 475 | 20,140 | ||||||
SeaSpine Holdings Corp.* | 1,158 | 19,431 | ||||||
Utah Medical Products, Inc. | 209 | 18,517 | ||||||
Varex Imaging Corp.* | 714 | 20,827 | ||||||
|
| |||||||
| 275,943 | ||||||||
| Health Care Providers & Services 2.2% | ||||||||
Addus HomeCare Corp.* | 193 | 17,355 | ||||||
Apria, Inc.* | 638 | 22,757 | ||||||
Brookdale Senior Living, Inc.* | 2,468 | 18,016 | ||||||
Covetrus, Inc.* | 739 | 16,694 | ||||||
See Notes to Financial Statements.
PGIM QMA Strategic Alpha ETFs | 83 |
PGIM QMA Strategic Alpha Small-Cap Value ETF
Schedule of Investments (continued)
as of August 31, 2021
| Description | Shares | Value | ||||||
| COMMON STOCKS (Continued) | ||||||||
| Health Care Providers & Services (cont'd.) | ||||||||
Cross Country Healthcare, Inc.* | 1,094 | $ | 23,794 | |||||
Fulgent Genetics, Inc.* | 182 | 16,606 | ||||||
MEDNAX, Inc.* | 604 | 19,394 | ||||||
ModivCare, Inc.* | 104 | 20,515 | ||||||
National HealthCare Corp. | 240 | 17,724 | ||||||
Option Care Health, Inc.* | 856 | 22,898 | ||||||
Patterson Cos., Inc. | 598 | 18,323 | ||||||
Tenet Healthcare Corp.* | 253 | 19,064 | ||||||
Tivity Health, Inc.* | 664 | 15,438 | ||||||
Triple-S Management Corp. (Puerto Rico) (Class B Stock)* | 747 | 26,518 | ||||||
Viemed Healthcare, Inc.* | 2,694 | 17,269 | ||||||
|
| |||||||
| 292,365 | ||||||||
| Health Care Technology 0.7% | ||||||||
Allscripts Healthcare Solutions, Inc.* | 1,024 | 15,729 | ||||||
American Well Corp. (Class A Stock)* | 1,613 | 17,275 | ||||||
Computer Programs & Systems, Inc.* | 537 | 19,101 | ||||||
HealthStream, Inc.* | 608 | 18,477 | ||||||
NextGen Healthcare, Inc.* | 1,126 | 17,183 | ||||||
|
| |||||||
| 87,765 | ||||||||
| Hotels, Restaurants & Leisure 0.5% | ||||||||
Biglari Holdings, Inc. (Class B Stock)* | 109 | 19,059 | ||||||
Carrols Restaurant Group, Inc. | 3,769 | 15,641 | ||||||
Del Taco Restaurants, Inc. | 2,174 | 19,131 | ||||||
El Pollo Loco Holdings, Inc.* | 919 | 16,671 | ||||||
|
| |||||||
| 70,502 | ||||||||
| Household Durables 2.1% | ||||||||
Bassett Furniture Industries, Inc. | 819 | 17,600 | ||||||
Beazer Homes USA, Inc.* | 1,034 | 19,346 | ||||||
Century Communities, Inc. | 258 | 18,086 | ||||||
Ethan Allen Interiors, Inc. | 772 | 18,544 | ||||||
Hooker Furniture Corp. | 553 | 17,232 | ||||||
KB Home | 427 | 18,374 | ||||||
La-Z-Boy, Inc. | 536 | 18,765 | ||||||
Lifetime Brands, Inc. | 1,095 | 20,093 | ||||||
M/I Homes, Inc.* | 269 | 17,321 | ||||||
MDC Holdings, Inc. | 341 | 17,817 | ||||||
Meritage Homes Corp.* | 171 | 19,073 | ||||||
Taylor Morrison Home Corp. (Class A Stock)* | 667 | 18,736 | ||||||
Tri Pointe Homes, Inc.* | 688 | 16,354 | ||||||
See Notes to Financial Statements.
| 84 |
| Description | Shares | Value | ||||||
| COMMON STOCKS (Continued) | ||||||||
| Household Durables (cont'd.) | ||||||||
Tupperware Brands Corp.* | 859 | $ | 20,504 | |||||
Universal Electronics, Inc.* | 391 | 19,753 | ||||||
|
| |||||||
| 277,598 | ||||||||
| Household Products 0.4% | ||||||||
Central Garden & Pet Co.* | 372 | 17,130 | ||||||
Central Garden & Pet Co. (Class A Stock)* | 413 | 17,210 | ||||||
Oil-Dri Corp. of America | 515 | 18,375 | ||||||
|
| |||||||
| 52,715 | ||||||||
| Independent Power & Renewable Electricity Producers 0.3% | ||||||||
Clearway Energy, Inc., | ||||||||
(Class A Stock) | 651 | 19,361 | ||||||
(Class C Stock) | 611 | 19,179 | ||||||
|
| |||||||
| 38,540 | ||||||||
| Insurance 3.3% | ||||||||
Ambac Financial Group, Inc.* | 1,247 | 17,570 | ||||||
American Equity Investment Life Holding Co. | 513 | 16,257 | ||||||
American National Group, Inc. | 112 | 21,560 | ||||||
AMERISAFE, Inc. | 320 | 18,416 | ||||||
Argo Group International Holdings Ltd. (Bermuda) | 327 | 17,298 | ||||||
CNO Financial Group, Inc. | 800 | 19,568 | ||||||
Crawford & Co. (Class A Stock) | 1,742 | 17,368 | ||||||
Donegal Group, Inc. (Class A Stock) | 1,191 | 17,936 | ||||||
Employers Holdings, Inc. | 398 | 16,386 | ||||||
Enstar Group Ltd. (Bermuda)* | 67 | 15,455 | ||||||
Greenlight Capital Re Ltd. (Cayman Islands) (Class A Stock)* | 2,097 | 17,678 | ||||||
Heritage Insurance Holdings, Inc. | 2,580 | 18,060 | ||||||
Horace Mann Educators Corp. | 469 | 19,229 | ||||||
Independence Holding Co. | 411 | 20,542 | ||||||
Investors Title Co. | 101 | 19,378 | ||||||
National Western Life Group, Inc. (Class A Stock) | 90 | 19,949 | ||||||
NI Holdings, Inc.* | 871 | 17,002 | ||||||
Safety Insurance Group, Inc. | 237 | 19,271 | ||||||
Selective Insurance Group, Inc. | 206 | 17,215 | ||||||
SiriusPoint Ltd. (Bermuda)* | 1,890 | 18,541 | ||||||
Stewart Information Services Corp. | 294 | 18,507 | ||||||
Tiptree, Inc. | 1,892 | 19,128 | ||||||
United Fire Group, Inc. | 749 | 19,444 | ||||||
United Insurance Holdings Corp. | 4,292 | 16,353 | ||||||
|
| |||||||
| 438,111 | ||||||||
See Notes to Financial Statements.
PGIM QMA Strategic Alpha ETFs | 85 |
PGIM QMA Strategic Alpha Small-Cap Value ETF
Schedule of Investments (continued)
as of August 31, 2021
| Description | Shares | Value | ||||||
| COMMON STOCKS (Continued) | ||||||||
| Interactive Media & Services 0.4% | ||||||||
Cars.com, Inc.* | 1,502 | $ | 19,106 | |||||
TrueCar, Inc.* | 3,462 | 14,540 | ||||||
Yelp, Inc. (Class A Stock)* | 500 | 19,255 | ||||||
|
| |||||||
| 52,901 | ||||||||
| Internet & Direct Marketing Retail 0.1% | ||||||||
Lands’ End, Inc.* | 452 | 15,300 | ||||||
| IT Services 0.7% | ||||||||
Cass Information Systems, Inc. | 435 | 19,610 | ||||||
Conduent, Inc.* | 2,815 | 20,549 | ||||||
CSG Systems International, Inc. | 406 | 19,573 | ||||||
Limelight Networks, Inc.* | 6,515 | 17,591 | ||||||
StarTek, Inc.* | 2,698 | 16,377 | ||||||
|
| |||||||
| 93,700 | ||||||||
| Leisure Products 0.8% | ||||||||
Acushnet Holdings Corp. | 354 | 17,686 | ||||||
American Outdoor Brands, Inc.* | 631 | 17,561 | ||||||
Johnson Outdoors, Inc. (Class A Stock) | 155 | 17,793 | ||||||
Nautilus, Inc.(a)* | 1,265 | 14,421 | ||||||
Sturm Ruger & Co., Inc. | 218 | 17,045 | ||||||
Vista Outdoor, Inc.* | 419 | 17,116 | ||||||
|
| |||||||
| 101,622 | ||||||||
| Life Sciences Tools & Services 0.1% | ||||||||
Personalis, Inc.* | 914 | 19,358 | ||||||
| Machinery 3.2% | ||||||||
Alamo Group, Inc. | 126 | 19,531 | ||||||
Albany International Corp. (Class A Stock) | 213 | 16,684 | ||||||
Altra Industrial Motion Corp. | 274 | 16,045 | ||||||
Barnes Group, Inc. | 328 | 15,636 | ||||||
Columbus McKinnon Corp. | 403 | 18,558 | ||||||
EnPro Industries, Inc. | 211 | 18,043 | ||||||
Gorman-Rupp Co. (The) | 513 | 17,991 | ||||||
Greenbrier Cos., Inc. (The) | 385 | 16,979 | ||||||
Hillenbrand, Inc. | 365 | 16,943 | ||||||
Kennametal, Inc. | 481 | 17,884 | ||||||
Lindsay Corp. | 111 | 18,287 | ||||||
Luxfer Holdings PLC (United Kingdom) | 804 | 17,165 | ||||||
Manitowoc Co., Inc. (The)* | 769 | 18,648 | ||||||
See Notes to Financial Statements.
| 86 |
| Description | Shares | Value | ||||||
| COMMON STOCKS (Continued) | ||||||||
| Machinery (cont'd.) | ||||||||
Miller Industries, Inc. | 487 | $ | 18,126 | |||||
Mueller Industries, Inc. | 425 | 18,959 | ||||||
Mueller Water Products, Inc. (Class A Stock) | 1,189 | 19,761 | ||||||
Park-Ohio Holdings Corp. | 619 | 15,958 | ||||||
REV Group, Inc. | 1,193 | 19,398 | ||||||
Rexnord Corp. | 347 | 21,084 | ||||||
SPX Corp.* | 279 | 17,432 | ||||||
Standex International Corp. | 198 | 19,650 | ||||||
TriMas Corp.* | 524 | 16,826 | ||||||
Wabash National Corp. | 1,209 | 18,788 | ||||||
Watts Water Technologies, Inc. (Class A Stock) | 118 | 20,245 | ||||||
|
| |||||||
| 434,621 | ||||||||
| Marine 0.6% | ||||||||
Costamare, Inc. (Monaco) | 1,790 | 25,740 | ||||||
Eagle Bulk Shipping, Inc.* | 410 | 20,250 | ||||||
Genco Shipping & Trading Ltd. | 1,038 | 20,231 | ||||||
Matson, Inc. | 259 | 20,505 | ||||||
|
| |||||||
| 86,726 | ||||||||
| Media 1.8% | ||||||||
AMC Networks, Inc. (Class A Stock)(a)* | 380 | 18,061 | ||||||
comScore, Inc.* | 4,893 | 18,985 | ||||||
Daily Journal Corp.* | 52 | 17,680 | ||||||
Emerald Holding, Inc.* | 4,385 | 21,837 | ||||||
Entercom Communications Corp. (Class A Stock)* | 5,365 | 19,046 | ||||||
Entravision Communications Corp. (Class A Stock) | 3,102 | 21,621 | ||||||
EW Scripps Co. (The) (Class A Stock) | 962 | 17,835 | ||||||
Fluent, Inc.* | 7,416 | 20,172 | ||||||
Gray Television, Inc. | 835 | 18,988 | ||||||
Hemisphere Media Group, Inc. (Class A Stock)* | 1,447 | 17,827 | ||||||
John Wiley & Sons, Inc. (Class A Stock) | 307 | 17,837 | ||||||
Scholastic Corp. | 494 | 16,421 | ||||||
TEGNA, Inc. | 1,042 | 18,464 | ||||||
|
| |||||||
| 244,774 | ||||||||
| Metals & Mining 1.2% | ||||||||
Arconic Corp.* | 527 | 18,176 | ||||||
Carpenter Technology Corp. | 476 | 15,875 | ||||||
Commercial Metals Co. | 567 | 18,496 | ||||||
Haynes International, Inc. | 498 | 19,546 | ||||||
Olympic Steel, Inc. | 585 | 15,947 | ||||||
See Notes to Financial Statements.
PGIM QMA Strategic Alpha ETFs | 87 |
PGIM QMA Strategic Alpha Small-Cap Value ETF
Schedule of Investments (continued)
as of August 31, 2021
| Description | Shares | Value | ||||||
| COMMON STOCKS (Continued) | ||||||||
| Metals & Mining (cont'd.) | ||||||||
Ryerson Holding Corp. | 1,159 | $ | 26,831 | |||||
Schnitzer Steel Industries, Inc. (Class A Stock) | 350 | 16,558 | ||||||
SunCoke Energy, Inc. | 2,400 | 16,680 | ||||||
Worthington Industries, Inc. | 270 | 15,647 | ||||||
|
| |||||||
| 163,756 | ||||||||
| Mortgage Real Estate Investment Trusts (REITs) 2.4% | ||||||||
Apollo Commercial Real Estate Finance, Inc. | 1,188 | 18,473 | ||||||
Ares Commercial Real Estate Corp. | 1,236 | 19,504 | ||||||
BrightSpire Capital, Inc. (Class A Stock) | 1,939 | 19,429 | ||||||
Chimera Investment Corp. | 1,250 | 19,150 | ||||||
Dynex Capital, Inc. | 1,050 | 18,648 | ||||||
Ellington Financial, Inc. | 1,002 | 18,557 | ||||||
Granite Point Mortgage Trust, Inc. | 1,286 | 17,695 | ||||||
Great Ajax Corp. | 1,388 | 19,613 | ||||||
KKR Real Estate Finance Trust, Inc. | 818 | 17,448 | ||||||
Ladder Capital Corp. (Class A Stock) | 1,670 | 19,055 | ||||||
MFA Financial, Inc. | 3,702 | 17,770 | ||||||
New York Mortgage Trust, Inc. | 4,203 | 18,577 | ||||||
PennyMac Mortgage Investment Trust | 923 | 17,915 | ||||||
Ready Capital Corp. | 1,162 | 17,790 | ||||||
Redwood Trust, Inc. | 1,613 | 20,114 | ||||||
TPG RE Finance Trust, Inc. | 1,342 | 16,909 | ||||||
Two Harbors Investment Corp. | 2,868 | 18,929 | ||||||
|
| |||||||
| 315,576 | ||||||||
| Multiline Retail 0.6% | ||||||||
Big Lots, Inc. | 321 | 15,620 | ||||||
Dillard’s, Inc. (Class A Stock) | 104 | 19,808 | ||||||
Franchise Group, Inc. | 528 | 18,337 | ||||||
Macy’s, Inc.* | 1,055 | 23,622 | ||||||
|
| |||||||
| 77,387 | ||||||||
| Multi-Utilities 0.5% | ||||||||
Avista Corp. | 412 | 17,243 | ||||||
Black Hills Corp. | 240 | 16,879 | ||||||
NorthWestern Corp. | 292 | 18,571 | ||||||
Unitil Corp. | 320 | 15,872 | ||||||
|
| |||||||
| 68,565 | ||||||||
See Notes to Financial Statements.
| 88 |
| Description | Shares | Value | ||||||
| COMMON STOCKS (Continued) | ||||||||
| Oil, Gas & Consumable Fuels 2.6% | ||||||||
Alto Ingredients, Inc.* | 3,223 | $ | 16,405 | |||||
Berry Corp. | 2,763 | 16,578 | ||||||
Bonanza Creek Energy, Inc. | 480 | 18,662 | ||||||
Centennial Resource Development, Inc. (Class A Stock)* | 3,656 | 18,646 | ||||||
Centrus Energy Corp. (Class A Stock)* | 802 | 23,186 | ||||||
Comstock Resources, Inc.* | 3,054 | 18,049 | ||||||
DHT Holdings, Inc. (Bermuda) | 3,189 | 17,635 | ||||||
Dorian LPG Ltd. | 1,279 | 16,908 | ||||||
Equitrans Midstream Corp. | 2,208 | 19,276 | ||||||
Frontline Ltd. (Norway) | 2,327 | 16,801 | ||||||
Nordic American Tankers Ltd. (Norway) | 7,211 | 17,090 | ||||||
PBF Energy, Inc. (Class A Stock)* | 1,951 | 20,290 | ||||||
REX American Resources Corp.* | 198 | 16,783 | ||||||
Scorpio Tankers, Inc. (Monaco) | 1,126 | 18,253 | ||||||
SFL Corp. Ltd. (Norway) | 2,625 | 21,079 | ||||||
SM Energy Co. | 961 | 18,355 | ||||||
Teekay Corp. (Bermuda)* | 6,205 | 18,801 | ||||||
Teekay Tankers Ltd. (Canada) (Class A Stock)* | 1,471 | 16,843 | ||||||
World Fuel Services Corp. | 539 | 17,442 | ||||||
|
| |||||||
| 347,082 | ||||||||
| Paper & Forest Products 0.3% | ||||||||
Neenah, Inc. | 364 | 18,342 | ||||||
Schweitzer-Mauduit International, Inc. | 458 | 17,528 | ||||||
|
| |||||||
| 35,870 | ||||||||
| Personal Products 0.5% | ||||||||
BellRing Brands, Inc. (Class A Stock)* | 598 | 20,195 | ||||||
Edgewell Personal Care Co. | 444 | 18,781 | ||||||
Nature’s Sunshine Products, Inc. | 1,050 | 17,976 | ||||||
Nu Skin Enterprises, Inc. (Class A Stock) | 336 | 17,008 | ||||||
|
| |||||||
| 73,960 | ||||||||
| Pharmaceuticals 1.2% | ||||||||
Amphastar Pharmaceuticals, Inc.* | 848 | 16,672 | ||||||
ANI Pharmaceuticals, Inc.* | 536 | 16,257 | ||||||
Fulcrum Therapeutics, Inc.* | 2,506 | 74,428 | ||||||
Innoviva, Inc.* | 1,201 | 18,327 | ||||||
Prestige Consumer Healthcare, Inc.* | 342 | 19,628 | ||||||
Supernus Pharmaceuticals, Inc.* | 678 | 18,665 | ||||||
|
| |||||||
| 163,977 | ||||||||
See Notes to Financial Statements.
PGIM QMA Strategic Alpha ETFs | 89 |
PGIM QMA Strategic Alpha Small-Cap Value ETF
Schedule of Investments (continued)
as of August 31, 2021
| Description | Shares | Value | ||||||
| COMMON STOCKS (Continued) | ||||||||
| Professional Services 1.6% | ||||||||
ASGN, Inc.* | 178 | $ | 19,970 | |||||
Barrett Business Services, Inc. | 252 | 19,530 | ||||||
CBIZ, Inc.* | 559 | 19,067 | ||||||
CRA International, Inc. | 211 | 19,621 | ||||||
Heidrick & Struggles International, Inc. | 458 | 19,795 | ||||||
Huron Consulting Group, Inc.* | 386 | 19,057 | ||||||
ICF International, Inc. | 207 | 19,388 | ||||||
Kelly Services, Inc. (Class A Stock) | 823 | 15,999 | ||||||
Mistras Group, Inc.* | 1,724 | 18,292 | ||||||
Resources Connection, Inc. | 1,184 | 18,707 | ||||||
TrueBlue, Inc.* | 743 | 20,306 | ||||||
|
| |||||||
| 209,732 | ||||||||
| Real Estate Management & Development 0.8% | ||||||||
Forestar Group, Inc.* | 887 | 18,441 | ||||||
FRP Holdings, Inc.* | 315 | 18,175 | ||||||
Marcus & Millichap, Inc.* | 435 | 17,061 | ||||||
RE/MAX Holdings, Inc. (Class A Stock) | 541 | 18,118 | ||||||
Realogy Holdings Corp.* | 1,094 | 19,200 | ||||||
RMR Group, Inc. (The) (Class A Stock) | 471 | 21,826 | ||||||
|
| |||||||
| 112,821 | ||||||||
| Road & Rail 0.5% | ||||||||
Covenant Logistics Group, Inc. (Class A Stock)* | 776 | 18,903 | ||||||
Heartland Express, Inc. | 1,068 | 17,921 | ||||||
Marten Transport Ltd. | 1,166 | 18,178 | ||||||
Werner Enterprises, Inc. | 397 | 18,723 | ||||||
|
| |||||||
| 73,725 | ||||||||
| Semiconductors & Semiconductor Equipment 1.2% | ||||||||
Alpha & Omega Semiconductor Ltd.* | 701 | 20,364 | ||||||
Amkor Technology, Inc. | 702 | 19,284 | ||||||
Cohu, Inc.* | 514 | 18,339 | ||||||
Diodes, Inc.* | 217 | 21,012 | ||||||
DSP Group, Inc.* | 1,081 | 23,674 | ||||||
Onto Innovation, Inc.* | 257 | 19,051 | ||||||
Photronics, Inc.* | 1,236 | 18,627 | ||||||
Rambus, Inc.* | 745 | 17,731 | ||||||
|
| |||||||
| 158,082 | ||||||||
| Software 1.7% | ||||||||
A10 Networks, Inc.* | 1,402 | 19,474 | ||||||
Agilysys, Inc.* | 327 | 18,583 | ||||||
See Notes to Financial Statements.
| 90 |
| Description | Shares | Value | ||||||
| COMMON STOCKS (Continued) | ||||||||
| Software (cont'd.) | ||||||||
Benefitfocus, Inc.* | 1,417 | $ | 17,103 | |||||
Bottomline Technologies DE, Inc.* | 453 | 19,148 | ||||||
ChannelAdvisor Corp.* | 783 | 20,061 | ||||||
eGain Corp.* | 1,672 | 19,696 | ||||||
QAD, Inc. (Class A Stock) | 210 | 18,272 | ||||||
SecureWorks Corp. (Class A Stock)* | 899 | 18,394 | ||||||
Smith Micro Software, Inc.* | 3,508 | 17,505 | ||||||
Verint Systems, Inc.* | 429 | 19,151 | ||||||
VirnetX Holding Corp.* | 4,583 | 20,578 | ||||||
Xperi Holding Corp. | 785 | 16,775 | ||||||
|
| |||||||
| 224,740 | ||||||||
| Specialty Retail 3.2% | ||||||||
Aaron’s Co., Inc. (The) | 625 | 16,575 | ||||||
Abercrombie & Fitch Co. (Class A Stock)* | 423 | 15,126 | ||||||
Academy Sports & Outdoors, Inc.* | 509 | 22,533 | ||||||
America’s Car-Mart, Inc.* | 118 | 15,261 | ||||||
Cato Corp. (The) (Class A Stock) | 1,081 | 18,658 | ||||||
Conn’s, Inc.* | 792 | 19,483 | ||||||
Container Store Group, Inc. (The)* | 1,649 | 19,128 | ||||||
Genesco, Inc.* | 318 | 19,726 | ||||||
Group 1 Automotive, Inc. | 108 | 17,867 | ||||||
Guess?, Inc. | 815 | 19,715 | ||||||
Haverty Furniture Cos., Inc. | 498 | 17,744 | ||||||
Hibbett, Inc. | 204 | 19,521 | ||||||
Lazydays Holdings, Inc.* | 900 | 22,113 | ||||||
Lumber Liquidators Holdings, Inc.* | 953 | 19,880 | ||||||
MarineMax, Inc.* | 330 | 16,045 | ||||||
ODP Corp. (The)* | 413 | 19,481 | ||||||
Signet Jewelers Ltd. | 278 | 22,018 | ||||||
Sonic Automotive, Inc. (Class A Stock) | 332 | 16,779 | ||||||
Tilly’s, Inc. (Class A Stock) | 1,190 | 18,528 | ||||||
TravelCenters of America, Inc.* | 509 | 21,363 | ||||||
Urban Outfitters, Inc.* | 454 | 14,991 | ||||||
Winmark Corp. | 82 | 17,190 | ||||||
Zumiez, Inc.* | 378 | 15,192 | ||||||
|
| |||||||
| 424,917 | ||||||||
| Technology Hardware, Storage & Peripherals 0.4% | ||||||||
Quantum Corp.* | 2,882 | 17,984 | ||||||
Super Micro Computer, Inc.* | 482 | 17,612 | ||||||
Turtle Beach Corp.* | 648 | 18,410 | ||||||
|
| |||||||
| 54,006 | ||||||||
See Notes to Financial Statements.
PGIM QMA Strategic Alpha ETFs | 91 |
PGIM QMA Strategic Alpha Small-Cap Value ETF
Schedule of Investments (continued)
as of August 31, 2021
| Description | Shares | Value | ||||||
| COMMON STOCKS (Continued) | ||||||||
| Textiles, Apparel & Luxury Goods 0.6% | ||||||||
G-III Apparel Group Ltd.* | 603 | $ | 18,651 | |||||
Oxford Industries, Inc. | 211 | 19,053 | ||||||
Unifi, Inc.* | 858 | 19,940 | ||||||
Vera Bradley, Inc.* | 1,580 | 18,107 | ||||||
|
| |||||||
| 75,751 | ||||||||
| Thrifts & Mortgage Finance 3.1% | ||||||||
Essent Group Ltd. | 404 | 19,020 | ||||||
FS Bancorp, Inc. | 494 | 16,880 | ||||||
Home Bancorp, Inc. | 517 | 19,346 | ||||||
HomeStreet, Inc. | 474 | 19,363 | ||||||
Kearny Financial Corp. | 1,466 | 18,604 | ||||||
Luther Burbank Corp. | 1,434 | 18,599 | ||||||
Merchants Bancorp | 522 | 19,142 | ||||||
Meta Financial Group, Inc. | 379 | 18,643 | ||||||
Mr Cooper Group, Inc.* | 474 | 18,429 | ||||||
NMI Holdings, Inc. (Class A Stock)* | 833 | 18,801 | ||||||
Northfield Bancorp, Inc. | 1,010 | 17,069 | ||||||
Ocwen Financial Corp.* | 675 | 19,102 | ||||||
Premier Financial Corp. | 677 | 20,581 | ||||||
Provident Financial Services, Inc. | 833 | 18,384 | ||||||
Radian Group, Inc. | 809 | 19,117 | ||||||
Southern Missouri Bancorp, Inc. | 401 | 18,093 | ||||||
TrustCo Bank Corp. | 539 | 17,296 | ||||||
Velocity Financial, Inc.* | 1,579 | 20,322 | ||||||
Walker & Dunlop, Inc. | 179 | 19,878 | ||||||
Washington Federal, Inc. | 515 | 17,149 | ||||||
Waterstone Financial, Inc. | 909 | 18,435 | ||||||
WSFS Financial Corp. | 416 | 18,891 | ||||||
|
| |||||||
| 411,144 | ||||||||
| Tobacco 0.3% | ||||||||
Universal Corp. | 351 | 17,761 | ||||||
Vector Group Ltd. | 1,357 | 20,382 | ||||||
|
| |||||||
| 38,143 | ||||||||
| Trading Companies & Distributors 1.7% | ||||||||
Alta Equipment Group, Inc.* | 1,490 | 19,758 | ||||||
Beacon Roofing Supply, Inc.* | 336 | 17,297 | ||||||
Boise Cascade Co. | 351 | 20,305 | ||||||
GMS, Inc.* | 368 | 18,183 | ||||||
McGrath RentCorp | 233 | 16,259 | ||||||
MRC Global, Inc.* | 2,106 | 17,269 | ||||||
NOW, Inc.* | 1,898 | 14,577 | ||||||
See Notes to Financial Statements.
| 92 |
| Description | Shares | Value | ||||||||||||||
| COMMON STOCKS (Continued) | ||||||||||||||||
| Trading Companies & Distributors (cont'd.) | ||||||||||||||||
Rush Enterprises, Inc., | ||||||||||||||||
(Class A Stock) | 394 | $ | 17,375 | |||||||||||||
(Class B Stock) | 421 | 17,846 | ||||||||||||||
Titan Machinery, Inc.* | 651 | 18,697 | ||||||||||||||
Veritiv Corp.* | 286 | 25,646 | ||||||||||||||
WESCO International, Inc.* | 169 | 19,776 | ||||||||||||||
|
| |||||||||||||||
| 222,988 | ||||||||||||||||
| Transportation Infrastructure 0.1% | ||||||||||||||||
Macquarie Infrastructure Corp. | 462 | 18,411 | ||||||||||||||
| Water Utilities 0.4% | ||||||||||||||||
American States Water Co. | 205 | 18,903 | ||||||||||||||
Artesian Resources Corp. (Class A Stock) | 459 | 18,089 | ||||||||||||||
York Water Co. (The) | 375 | 19,339 | ||||||||||||||
|
| |||||||||||||||
| 56,331 | ||||||||||||||||
| Wireless Telecommunication Services 0.3% | ||||||||||||||||
Telephone & Data Systems, Inc. | 900 | 18,288 | ||||||||||||||
United States Cellular Corp.* | 558 | 17,828 | ||||||||||||||
|
| |||||||||||||||
| 36,116 | ||||||||||||||||
|
| |||||||||||||||
TOTAL LONG-TERM INVESTMENTS | 13,253,588 | |||||||||||||||
|
| |||||||||||||||
| SHORT-TERM INVESTMENTS 1.7% | ||||||||||||||||
| AFFILIATED MUTUAL FUND 0.8% | ||||||||||||||||
PGIM Institutional Money Market Fund |
| 107,535 | 107,471 | |||||||||||||
|
| |||||||||||||||
Interest | Maturity | Principal | ||||||||||||||
| TIME DEPOSIT 0.9% | ||||||||||||||||
Skandinaviska Enskilda Banken AB (Sweden) | 0.005 | % | 09/01/21 | 117 | 116,790 | |||||||||||
|
| |||||||||||||||
TOTAL SHORT-TERM INVESTMENTS | 224,261 | |||||||||||||||
|
| |||||||||||||||
| TOTAL INVESTMENTS 100.7% (cost $11,303,974) | 13,477,849 | |||||||||||||||
Liabilities in excess of other assets (0.7)% | (95,810 | ) | ||||||||||||||
|
| |||||||||||||||
NET ASSETS 100.0% | $ | 13,382,039 | ||||||||||||||
|
| |||||||||||||||
See Notes to Financial Statements.
PGIM QMA Strategic Alpha ETFs | 93 |
PGIM QMA Strategic Alpha Small-Cap Value ETF
Schedule of Investments (continued)
as of August 31, 2021
The following abbreviations are used in the annual report:
| # | Principal or notional amount is shown in U.S. dollars unless otherwise stated. |
| (a) | All or a portion of security is on loan. The aggregate market value of such securities, including those sold and pending settlement, is $104,887; cash collateral of $107,407 (included in liabilities) was received with which the Fund purchased highly liquid short-term investments. In the event of significant appreciation in value of securities on loan on the last business day of the reporting period, the Fund may reflect a collateral value that is less than the market value of the loaned securities and such shortfall is remedied the following business day. |
| (b) | Represents security purchased with cash collateral received for securities on loan and includes dividend reinvestment. |
| (wa) | PGIM Investments LLC, the manager of the Fund, also serves as manager of the PGIM Core Ultra Short Bond Fund and PGIM Institutional Money Market Fund, if applicable. |
| * | Non-income producing security. |
Fair Value Measurements:
Various inputs are used in determining the value of the Fund’s investments. These inputs are summarized in the three broad levels listed below.
Level 1—unadjusted quoted prices generally in active markets for identical securities.
Level 2—quoted prices for similar securities, interest rates and yield curves, prepayment speeds, foreign currency exchange rates and other observable inputs.
Level 3—unobservable inputs for securities valued in accordance with Board approved fair valuation procedures.
The following is a summary of the inputs used as of August 31, 2021 in valuing such portfolio securities:
| Level 1 | Level 2 | Level 3 | ||||||||||
| Investments in Securities | ||||||||||||
| Assets | ||||||||||||
| Long-Term Investments | ||||||||||||
| Common Stocks | ||||||||||||
Aerospace & Defense | $ | 141,796 | $ | — | $ | — | ||||||
Air Freight & Logistics | 75,760 | — | — | |||||||||
Airlines | 54,876 | — | — | |||||||||
Auto Components | 67,983 | — | — | |||||||||
Banks | 1,926,530 | — | — | |||||||||
Beverages | 19,643 | — | — | |||||||||
Biotechnology | 826,536 | — | — | |||||||||
Building Products | 163,556 | — | — | |||||||||
Capital Markets | 189,841 | — | — | |||||||||
Chemicals | 274,916 | — | — | |||||||||
Commercial Services & Supplies | 321,097 | — | — | |||||||||
See Notes to Financial Statements.
| 94 |
| Level 1 | Level 2 | Level 3 | ||||||||||
| Investments in Securities (continued) | ||||||||||||
| Assets (continued) | ||||||||||||
| Long-Term Investments (continued) | ||||||||||||
| Common Stocks (continued) | ||||||||||||
Communications Equipment | $ | 158,297 | $ | — | $ | — | ||||||
Construction & Engineering | 200,284 | — | — | |||||||||
Construction Materials | 35,745 | — | — | |||||||||
Consumer Finance | 178,797 | — | — | |||||||||
Containers & Packaging | 74,767 | — | — | |||||||||
Diversified Consumer Services | 110,501 | — | — | |||||||||
Diversified Financial Services | 54,242 | — | — | |||||||||
Diversified Telecommunication Services | 109,296 | — | — | |||||||||
Electric Utilities | 53,161 | — | — | |||||||||
Electrical Equipment | 124,500 | — | — | |||||||||
Electronic Equipment, Instruments & Components | 360,081 | — | — | |||||||||
Energy Equipment & Services | 184,152 | — | — | |||||||||
Entertainment | 32,321 | — | — | |||||||||
Equity Real Estate Investment Trusts (REITs) | 1,087,367 | — | — | |||||||||
Food & Staples Retailing | 151,187 | — | — | |||||||||
Food Products | 191,707 | — | — | |||||||||
Gas Utilities | 139,028 | — | — | |||||||||
Health Care Equipment & Supplies | 275,943 | — | — | |||||||||
Health Care Providers & Services | 292,365 | — | — | |||||||||
Health Care Technology | 87,765 | — | — | |||||||||
Hotels, Restaurants & Leisure | 70,502 | — | — | |||||||||
Household Durables | 277,598 | — | — | |||||||||
Household Products | 52,715 | — | — | |||||||||
Independent Power & Renewable Electricity Producers | 38,540 | — | — | |||||||||
Insurance | 438,111 | — | — | |||||||||
Interactive Media & Services | 52,901 | — | — | |||||||||
Internet & Direct Marketing Retail | 15,300 | — | — | |||||||||
IT Services | 93,700 | — | — | |||||||||
Leisure Products | 101,622 | — | — | |||||||||
Life Sciences Tools & Services | 19,358 | — | — | |||||||||
Machinery | 434,621 | — | — | |||||||||
Marine | 86,726 | — | — | |||||||||
Media | 244,774 | — | — | |||||||||
Metals & Mining | 163,756 | — | — | |||||||||
Mortgage Real Estate Investment Trusts (REITs) | 315,576 | — | — | |||||||||
Multiline Retail | 77,387 | — | — | |||||||||
Multi-Utilities | 68,565 | — | — | |||||||||
Oil, Gas & Consumable Fuels | 347,082 | — | — | |||||||||
Paper & Forest Products | 35,870 | — | — | |||||||||
Personal Products | 73,960 | — | — | |||||||||
Pharmaceuticals | 163,977 | — | — | |||||||||
See Notes to Financial Statements.
PGIM QMA Strategic Alpha ETFs | 95 |
PGIM QMA Strategic Alpha Small-Cap Value ETF
Schedule of Investments (continued)
as of August 31, 2021
| Level 1 | Level 2 | Level 3 | ||||||||||
| Investments in Securities (continued) | ||||||||||||
| Assets (continued) | ||||||||||||
| Long-Term Investments (continued) | ||||||||||||
| Common Stocks (continued) | ||||||||||||
Professional Services | $ | 209,732 | $ | — | $ | — | ||||||
Real Estate Management & Development | 112,821 | — | — | |||||||||
Road & Rail | 73,725 | — | — | |||||||||
Semiconductors & Semiconductor Equipment | 158,082 | — | — | |||||||||
Software | 224,740 | — | — | |||||||||
Specialty Retail | 424,917 | — | — | |||||||||
Technology Hardware, Storage & Peripherals | 54,006 | — | — | |||||||||
Textiles, Apparel & Luxury Goods | 75,751 | — | — | |||||||||
Thrifts & Mortgage Finance | 411,144 | — | — | |||||||||
Tobacco | 38,143 | — | — | |||||||||
Trading Companies & Distributors | 222,988 | — | — | |||||||||
Transportation Infrastructure | 18,411 | — | — | |||||||||
Water Utilities | 56,331 | — | — | |||||||||
Wireless Telecommunication Services | 36,116 | — | — | |||||||||
Short-Term Investments | ||||||||||||
Affiliated Mutual Fund | 107,471 | — | — | |||||||||
Time Deposit | — | 116,790 | — | |||||||||
|
|
|
|
|
| |||||||
Total | $ | 13,361,059 | $ | 116,790 | $ | — | ||||||
|
|
|
|
|
| |||||||
Industry Classification:
The industry classification of investments and liabilities in excess of other assets shown as a percentage of net assets as of August 31, 2021 were as follows (unaudited):
Banks | 14.4 | % | ||
Equity Real Estate Investment Trusts (REITs) | 8.1 | |||
Biotechnology | 6.2 | |||
Insurance | 3.3 | |||
Machinery | 3.2 | |||
Specialty Retail | 3.2 | |||
Thrifts & Mortgage Finance | 3.1 | |||
Electronic Equipment, Instruments & Components | 2.7 | |||
Oil, Gas & Consumable Fuels | 2.6 | |||
Commercial Services & Supplies | 2.4 | |||
Mortgage Real Estate Investment Trusts (REITs) | 2.4 | |||
Health Care Providers & Services | 2.2 | |||
Household Durables | 2.1 | |||
Health Care Equipment & Supplies | 2.1 | |||
Chemicals | 2.1 | |||
Media | 1.8 | |||
Software | 1.7 | |||
Trading Companies & Distributors | 1.7 | |||
Professional Services | 1.6 | |||
Construction & Engineering | 1.5 | |||
Food Products | 1.4 | |||
Capital Markets | 1.4 | |||
Energy Equipment & Services | 1.4 | |||
Consumer Finance | 1.3 | |||
Pharmaceuticals | 1.2 | |||
Metals & Mining | 1.2 | |||
Building Products | 1.2 | |||
Communications Equipment | 1.2 | |||
Semiconductors & Semiconductor Equipment | 1.2 | |||
Food & Staples Retailing | 1.1 | |||
Aerospace & Defense | 1.1 | |||
Gas Utilities | 1.0 |
See Notes to Financial Statements.
| 96 |
| Industry Classification (cont’d.) | ||||
Electrical Equipment | 0.9 | % | ||
Time Deposit | 0.9 | |||
Real Estate Management & Development | 0.8 | |||
Diversified Consumer Services | 0.8 | |||
Diversified Telecommunication Services | 0.8 | |||
Affiliated Mutual Fund (0.8% represents investments purchased with collateral from securities on loan) | 0.8 | |||
Leisure Products | 0.8 | |||
IT Services | 0.7 | |||
Health Care Technology | 0.7 | |||
Marine | 0.6 | |||
Multiline Retail | 0.6 | |||
Air Freight & Logistics | 0.6 | |||
Textiles, Apparel & Luxury Goods | 0.6 | |||
Containers & Packaging | 0.6 | |||
Personal Products | 0.5 | |||
Road & Rail | 0.5 | |||
Hotels, Restaurants & Leisure | 0.5 | |||
Multi-Utilities | 0.5 | |||
Auto Components | 0.5 | |||
Water Utilities | 0.4 | |||
Airlines | 0.4 | |||
Diversified Financial Services | 0.4 | |||
Technology Hardware, Storage & Peripherals | 0.4 | |||
Electric Utilities | 0.4 | |||
Interactive Media & Services | 0.4 | |||
Household Products | 0.4 | |||
Independent Power & Renewable Electricity Producers | 0.3 | |||
Tobacco | 0.3 | |||
Wireless Telecommunication Services | 0.3 | |||
Paper & Forest Products | 0.3 | |||
Construction Materials | 0.3 | |||
Entertainment | 0.2 | |||
Beverages | 0.1 | |||
Life Sciences Tools & Services | 0.1 | |||
Transportation Infrastructure | 0.1 | |||
Internet & Direct Marketing Retail | 0.1 | |||
|
| |||
| 100.7 | ||||
Liabilities in excess of other assets | (0.7 | ) | ||
|
| |||
| 100.0 | % | |||
|
| |||
Financial Instruments/Transactions—Summary of Offsetting and Netting Agreements:
The Fund entered into financial instruments/transactions during the period that are either offset in accordance with current requirements or are subject to enforceable master netting arrangements or similar agreements that permit offsetting. The information about offsetting and related netting arrangements for financial instruments/transactions, where the legal right to set-off exists, is presented in the summary below:
Offsetting of financial instrument/transaction assets and liabilities:
Description | Gross Market Value of Recognized Assets/(Liabilities) | Collateral Pledged/(Received)(1) | Net Amount | |||||||||
Securities on Loan | $ | 104,887 | $ | (104,887 | ) | $ | — | |||||
|
|
|
|
|
| |||||||
| (1) | Collateral amount disclosed by the Fund is limited to the market value of the financial instruments/transactions. |
See Notes to Financial Statements.
PGIM QMA Strategic Alpha ETFs | 97 |
PGIM QMA Strategic Alpha Small-Cap Value ETF
Statement of Assets & Liabilities
as of August 31, 2021
Assets | ||||
Investments at value, including securities on loan of $104,887: | ||||
Unaffiliated investments (cost $11,196,560) | $ | 13,370,378 | ||
Affiliated investments (cost $107,414) | 107,471 | |||
Interest and dividends receivable | 13,771 | |||
Receivable for investments sold | 1,428 | |||
|
| |||
Total Assets | 13,493,048 | |||
|
| |||
| Liabilities | ||||
Payable to broker for collateral for securities on loan | 107,407 | |||
Management fee payable | 3,214 | |||
Other liabilities | 388 | |||
|
| |||
Total Liabilities | 111,009 | |||
|
| |||
Net Assets | $ | 13,382,039 | ||
|
| |||
Net assets were comprised of: | ||||
Common stock, at par | $ | 200 | ||
Paid-in capital in excess of par | 10,042,537 | |||
Total distributable earnings (loss) | 3,339,302 | |||
|
| |||
Net assets, August 31, 2021 | $ | 13,382,039 | ||
|
| |||
Net asset value, offering price and redemption price per share, | $ | 66.91 | ||
|
| |||
See Notes to Financial Statements.
| 98 |
PGIM QMA Strategic Alpha Small-Cap Value ETF
Statement of Operations
Year Ended August 31, 2021
Net Investment Income (Loss) | ||||
Income | ||||
Interest income | $ | 40 | ||
Unaffiliated dividend income (net of $215 foreign withholding tax) | 209,194 | |||
Income from securities lending, net (including affiliated income of $350) | 876 | |||
Miscellaneous Income | 132 | |||
|
| |||
Total income | 210,242 | |||
|
| |||
Expenses | ||||
Management fee | 33,043 | |||
|
| |||
Total expenses | 33,043 | |||
|
| |||
Net investment income (loss) | 177,199 | |||
|
| |||
| Realized And Unrealized Gain (Loss) On Investments | ||||
Net realized gain (loss) on: | ||||
Investment transactions (including affiliated of $(99)) | 2,419,472 | |||
Net change in unrealized appreciation (depreciation) on: | ||||
Investments (including affiliated of $5) | 2,627,259 | |||
|
| |||
Net gain (loss) on investment transactions | 5,046,731 | |||
|
| |||
Net Increase (Decrease) In Net Assets Resulting From Operations | $ | 5,223,930 | ||
|
| |||
See Notes to Financial Statements.
PGIM QMA Strategic Alpha ETFs | 99 |
PGIM QMA Strategic Alpha Small-Cap Value ETF
Statements of Changes in Net Assets
| Year Ended August 31, | ||||||||
| 2021 | 2020 | |||||||
Increase (Decrease) in Net Assets | ||||||||
Operations | ||||||||
Net investment income (loss) | $ | 177,199 | $ | 141,662 | ||||
Net realized gain (loss) on investments | 2,419,472 | (1,278,715 | ) | |||||
Net change in unrealized appreciation (depreciation) on investments | 2,627,259 | 399,673 | ||||||
|
|
|
| |||||
Net increase (decrease) in net assets resulting from operations | 5,223,930 | (737,380 | ) | |||||
|
|
|
| |||||
Dividends and Distributions | ||||||||
Distributions from distributable earnings | (177,114 | ) | (280,842 | ) | ||||
|
|
|
| |||||
Total increase (decrease) | 5,046,816 | (1,018,222 | ) | |||||
| Net Assets: | ||||||||
Beginning of period | 8,335,223 | 9,353,445 | ||||||
|
|
|
| |||||
End of period | $ | 13,382,039 | $ | 8,335,223 | ||||
|
|
|
| |||||
See Notes to Financial Statements.
| 100 |
PGIM QMA Strategic Alpha Small-Cap Value ETF
Financial Highlights
| Year Ended August 31, | November 13, through | |||||||||||||||
| 2021 | 2020 | 2019 | ||||||||||||||
| Per Share Operating Performance(a): | ||||||||||||||||
| Net Asset Value, Beginning of Period | $41.68 | $46.77 | $50.00 | |||||||||||||
| Income (loss) from investment operations: | ||||||||||||||||
| Net investment income (loss) | 0.89 | 0.71 | 0.72 | |||||||||||||
| Net realized and unrealized gain (loss) on investments | 25.23 | (4.40 | ) | (3.41 | ) | |||||||||||
| Total from investment operations | 26.12 | (3.69 | ) | (2.69 | ) | |||||||||||
| Less Dividends and Distributions: | ||||||||||||||||
| Dividends from net investment income | (0.89 | ) | (0.76 | ) | (0.54 | ) | ||||||||||
| Distributions from net realized gains | - | (0.64 | ) | - | ||||||||||||
| Total Dividends and Distributions | (0.89 | ) | (1.40 | ) | (0.54 | ) | ||||||||||
| Net asset value, end of period | $66.91 | $41.68 | $46.77 | |||||||||||||
| Total Return(b): | 63.26% | (8.28)% | (5.39)% | |||||||||||||
| Ratios/Supplemental Data: | ||||||||||||||||
| Net assets, end of period (000) | $13,382 | $8,335 | $9,353 | |||||||||||||
| Average net assets (000) | $11,394 | $8,876 | $10,627 | |||||||||||||
| Ratios to average net assets(c): | ||||||||||||||||
| Expenses after waivers and/or expense reimbursement | 0.29% | 0.29% | 0.29% | (d) | ||||||||||||
| Expenses before waivers and/or expense reimbursement | 0.29% | 0.29% | 0.29% | (d) | ||||||||||||
| Net investment income (loss) | 1.56% | 1.61% | 1.86% | (d) | ||||||||||||
| Portfolio turnover rate(f)(g) | 116% | 120% | 66% | |||||||||||||
| (a) | Calculated based on average shares outstanding during the period. |
| (b) | Total return is calculated assuming a purchase of a share on the first day and a sale on the last day of the period reported and includes reinvestment of dividends and distributions, if any. Total returns may reflect adjustments to conform to generally accepted accounting principles. Total returns for periods less than one full year are not annualized. |
| (c) | Does not include expenses of the underlying funds in which the Fund invests. |
| (d) | Annualized. |
| (e) | Commencement of operations. |
| (f) | The Fund’s portfolio turnover rate is calculated in accordance with regulatory requirements, without regard to transactions involving short-term investments and certain derivatives. If such transactions were included, the Fund’s portfolio turnover rate may be higher. |
| (g) | Portfolio turnover excludes the value of portfolio securities received or delivered as a result of in-kind fund share transactions, if any. |
See Notes to Financial Statements.
PGIM QMA Strategic Alpha ETFs | 101 |
PGIM QMA Strategic Alpha International Equity ETF
Schedule of Investments
as of August 31, 2021
| Description | Shares | Value | ||||||
| LONG-TERM INVESTMENTS 98.6% | ||||||||
| COMMON STOCKS 97.4% | ||||||||
| Australia 5.0% | ||||||||
AGL Energy Ltd. | 13,377 | $ | 63,119 | |||||
APA Group | 12,531 | 84,154 | ||||||
Aristocrat Leisure Ltd. | 3,063 | 102,335 | ||||||
Aurizon Holdings Ltd. | 29,461 | 81,467 | ||||||
Australia & New Zealand Banking Group Ltd. | 4,413 | 89,909 | ||||||
BHP Group Ltd. | 2,400 | 80,078 | ||||||
Brambles Ltd. | 11,027 | 97,689 | ||||||
Coles Group Ltd. | 7,478 | 98,907 | ||||||
Dexus/AU | 11,619 | 90,439 | ||||||
Endeavour Group Ltd.* | 2,841 | 15,172 | ||||||
Fortescue Metals Group Ltd. | 5,369 | 82,482 | ||||||
Goodman Group | 6,704 | 113,437 | ||||||
Mirvac Group | 41,977 | 95,810 | ||||||
REA Group Ltd. | 755 | 84,781 | ||||||
Reece Ltd. | 5,492 | 83,889 | ||||||
Rio Tinto Ltd. | 986 | 80,830 | ||||||
Scentre Group | 41,966 | 87,496 | ||||||
SEEK Ltd. | 3,787 | 90,148 | ||||||
Sonic Healthcare Ltd. | 3,502 | 111,186 | ||||||
Stockland | 26,028 | 87,968 | ||||||
Tabcorp Holdings Ltd. | 24,885 | 87,200 | ||||||
Telstra Corp. Ltd. | 35,246 | 99,011 | ||||||
Treasury Wine Estates Ltd. | 10,459 | 96,636 | ||||||
Wesfarmers Ltd. | 2,277 | 99,861 | ||||||
Woolworths Group Ltd. | 2,841 | 86,770 | ||||||
|
| |||||||
| 2,190,774 | ||||||||
| Austria 0.9% | ||||||||
Erste Group Bank AG | 2,355 | 94,153 | ||||||
OMV AG | 1,564 | 86,665 | ||||||
Raiffeisen Bank International AG | 4,223 | 101,422 | ||||||
voestalpine AG | 2,376 | 107,730 | ||||||
|
| |||||||
| 389,970 | ||||||||
| Belgium 1.0% | ||||||||
Ageas SA/NV | 1,642 | 82,108 | ||||||
Etablissements Franz Colruyt NV | 1,480 | 82,814 | ||||||
Proximus SADP | 4,223 | 82,798 | ||||||
Solvay SA | 706 | 92,489 | ||||||
UCB SA | 867 | 99,177 | ||||||
|
| |||||||
| 439,386 | ||||||||
See Notes to Financial Statements.
| 102 |
| Description | Shares | Value | ||||||
| COMMON STOCKS (Continued) | ||||||||
| Denmark 2.0% | ||||||||
AP Moller - Maersk A/S, | ||||||||
(Class A Stock) | 34 | $ | 92,042 | |||||
(Class B Stock) | 33 | 93,632 | ||||||
Carlsberg A/S (Class B Stock) | 518 | 90,429 | ||||||
Coloplast A/S (Class B Stock) | 596 | 103,242 | ||||||
Demant A/S* | 1,717 | 97,324 | ||||||
Genmab A/S* | 205 | 97,061 | ||||||
Novo Nordisk A/S (Class B Stock) | 1,082 | 107,836 | ||||||
Pandora A/S | 696 | 83,323 | ||||||
ROCKWOOL International A/S (Class B Stock) | 197 | 104,252 | ||||||
|
| |||||||
| 869,141 | ||||||||
| Finland 2.0% | ||||||||
Elisa OYJ | 1,479 | 94,721 | ||||||
Fortum OYJ | 3,269 | 99,276 | ||||||
Kone OYJ (Class B Stock) | 1,099 | 91,146 | ||||||
Neste OYJ | 1,361 | 82,825 | ||||||
Nokia OYJ* | 17,528 | 105,137 | ||||||
Nordea Bank Abp | 9,369 | 110,112 | ||||||
Orion OYJ (Class B Stock) | 2,087 | 85,090 | ||||||
Stora Enso OYJ (Class R Stock) | 5,262 | 102,982 | ||||||
UPM-Kymmene OYJ | 2,442 | 99,275 | ||||||
|
| |||||||
| 870,564 | ||||||||
| France 8.7% | ||||||||
Amundi SA, 144A | 1,138 | 107,697 | ||||||
Arkema SA | 732 | 97,148 | ||||||
Atos SE | 1,458 | 75,679 | ||||||
BioMerieux | 864 | 105,944 | ||||||
BNP Paribas SA | 1,406 | 89,199 | ||||||
Bouygues SA | 2,176 | 91,031 | ||||||
Bureau Veritas SA | 3,368 | 111,787 | ||||||
Capgemini SE | 531 | 119,220 | ||||||
Carrefour SA | 4,742 | 94,345 | ||||||
Cie de Saint-Gobain | 1,399 | 101,408 | ||||||
Cie Generale des Etablissements Michelin SCA | 645 | 104,375 | ||||||
CNP Assurances | 5,450 | 93,277 | ||||||
Credit Agricole SA | 6,706 | 96,680 | ||||||
Danone SA | 1,342 | 98,037 | ||||||
Dassault Systemes SE | 2,040 | 116,354 | ||||||
Eiffage SA | 872 | 90,627 | ||||||
Engie SA | 6,450 | 92,395 | ||||||
See Notes to Financial Statements.
PGIM QMA Strategic Alpha ETFs | 103 |
PGIM QMA Strategic Alpha International Equity ETF
Schedule of Investments (continued)
as of August 31, 2021
| Description | Shares | Value | ||||||
| COMMON STOCKS (Continued) | ||||||||
| France (cont'd.) | ||||||||
EssilorLuxottica SA | 534 | $ | 104,830 | |||||
Eurazeo SE | 1,078 | 110,865 | ||||||
Gecina SA | 567 | 88,071 | ||||||
Hermes International | 67 | 98,453 | ||||||
Ipsen SA | 870 | 86,988 | ||||||
Kering SA | 107 | 85,153 | ||||||
Klepierre SA | 3,180 | 77,724 | ||||||
La Francaise des Jeux SAEM, 144A | 1,610 | 83,283 | ||||||
Legrand SA | 982 | 112,378 | ||||||
L’Oreal SA | 206 | 96,394 | ||||||
LVMH Moet Hennessy Louis Vuitton SE | 118 | 87,331 | ||||||
Orange SA | 7,463 | 84,771 | ||||||
Pernod Ricard SA | 459 | 96,443 | ||||||
Publicis Groupe SA | 1,405 | 92,105 | ||||||
Sanofi | 952 | 98,491 | ||||||
Schneider Electric SE | 587 | 104,866 | ||||||
SEB SA | 498 | 78,323 | ||||||
Teleperformance | 262 | 115,823 | ||||||
Thales SA | 966 | 98,024 | ||||||
TotalEnergies SE | 1,962 | 86,515 | ||||||
Vinci SA | 880 | 94,440 | ||||||
Vivendi SE | 2,719 | 103,762 | ||||||
|
| |||||||
| 3,770,236 | ||||||||
| Germany 7.2% | ||||||||
adidas AG | 270 | 95,784 | ||||||
Allianz SE | 379 | 89,044 | ||||||
BASF SE | 1,137 | 87,961 | ||||||
Bayerische Motoren Werke AG | 837 | 79,429 | ||||||
Brenntag SE | 1,141 | 115,108 | ||||||
Covestro AG, 144A | 1,480 | 95,938 | ||||||
Daimler AG | 1,005 | 84,751 | ||||||
Deutsche Post AG | 1,395 | 98,137 | ||||||
Deutsche Telekom AG | 4,463 | 94,897 | ||||||
E.ON SE | 7,807 | 103,040 | ||||||
Evonik Industries AG | 2,656 | 89,692 | ||||||
Fresenius Medical Care AG & Co. KGaA | 1,230 | 94,459 | ||||||
Fresenius SE & Co. KGaA | 1,757 | 91,385 | ||||||
GEA Group AG | 2,493 | 115,125 | ||||||
HeidelbergCement AG | 1,151 | 100,026 | ||||||
Henkel AG & Co. KGaA | 985 | 88,624 | ||||||
KION Group AG | 884 | 94,588 | ||||||
See Notes to Financial Statements.
| 104 |
| Description | Shares | Value | ||||||
| COMMON STOCKS (Continued) | ||||||||
| Germany (cont'd.) | ||||||||
Knorr-Bremse AG | 773 | $ | 92,778 | |||||
LANXESS AG | 1,211 | 88,281 | ||||||
LEG Immobilien SE | 636 | 101,379 | ||||||
Merck KGaA | 510 | 121,159 | ||||||
Puma SE | 851 | 103,295 | ||||||
RWE AG | 2,553 | 99,748 | ||||||
SAP SE | 718 | 108,058 | ||||||
Scout24 AG, 144A | 1,184 | 99,538 | ||||||
Siemens AG | 537 | 89,301 | ||||||
Siemens Healthineers AG, 144A | 1,656 | 115,168 | ||||||
Telefonica Deutschland Holding AG | 35,034 | 98,328 | ||||||
Uniper SE | 2,586 | 102,687 | ||||||
United Internet AG | 2,297 | 99,293 | ||||||
Volkswagen AG | 267 | 89,282 | ||||||
Vonovia SE | 1,384 | 93,408 | ||||||
|
| |||||||
| 3,119,691 | ||||||||
| Hong Kong 3.9% | ||||||||
BOC Hong Kong Holdings Ltd. | 28,854 | 87,555 | ||||||
CK Asset Holdings Ltd. | 14,217 | 92,678 | ||||||
CK Hutchison Holdings Ltd. | 12,596 | 91,910 | ||||||
CK Infrastructure Holdings Ltd. | 15,058 | 91,481 | ||||||
CLP Holdings Ltd. | 9,691 | 96,880 | ||||||
Hang Lung Properties Ltd. | 37,811 | 90,815 | ||||||
Henderson Land Development Co. Ltd. | 19,683 | 89,083 | ||||||
HKT Trust & HKT Ltd. | 66,768 | 90,999 | ||||||
Hongkong Land Holdings Ltd. | 19,707 | 82,769 | ||||||
Jardine Matheson Holdings Ltd. | 1,533 | 83,273 | ||||||
Link REIT | 10,177 | 93,625 | ||||||
New World Development Co. Ltd. | 17,705 | 83,318 | ||||||
Power Assets Holdings Ltd. | 16,881 | 106,029 | ||||||
Sino Land Co. Ltd. | 60,909 | 89,749 | ||||||
Sun Hung Kai Properties Ltd. | 5,939 | 83,693 | ||||||
Swire Pacific Ltd. (Class A Stock) | 13,300 | 90,121 | ||||||
Swire Properties Ltd. | 30,550 | 82,685 | ||||||
WH Group Ltd., 144A | 107,156 | 93,000 | ||||||
Wharf Real Estate Investment Co. Ltd. | 16,529 | 81,928 | ||||||
|
| |||||||
| 1,701,591 | ||||||||
| Ireland 0.9% | ||||||||
CRH PLC | 1,857 | 98,757 | ||||||
DCC PLC | 1,094 | 92,952 | ||||||
See Notes to Financial Statements.
PGIM QMA Strategic Alpha ETFs | 105 |
PGIM QMA Strategic Alpha International Equity ETF
Schedule of Investments (continued)
as of August 31, 2021
| Description | Shares | Value | ||||||
| COMMON STOCKS (Continued) | ||||||||
| Ireland (cont'd.) | ||||||||
Kingspan Group PLC | 1,011 | $ | 115,530 | |||||
Smurfit Kappa Group PLC | 1,806 | 103,594 | ||||||
|
| |||||||
| 410,833 | ||||||||
| Israel 1.4% | ||||||||
Bank Hapoalim BM | 11,509 | 98,988 | ||||||
Bank Leumi Le-Israel BM | 12,111 | 100,050 | ||||||
Check Point Software Technologies Ltd.* | 772 | 96,986 | ||||||
Elbit Systems Ltd. | 738 | 107,325 | ||||||
Israel Discount Bank Ltd. (Class A Stock)* | 18,960 | 97,939 | ||||||
Mizrahi Tefahot Bank Ltd. | 3,069 | 102,083 | ||||||
|
| |||||||
| 603,371 | ||||||||
| Italy 2.4% | ||||||||
Assicurazioni Generali SpA | 4,914 | 100,204 | ||||||
DiaSorin SpA | 526 | 120,023 | ||||||
Enel SpA | 8,901 | 81,105 | ||||||
Intesa Sanpaolo SpA | 35,327 | 100,005 | ||||||
Mediobanca Banca di Credito Finanziario SpA* | 8,314 | 97,971 | ||||||
Moncler SpA | 1,481 | 94,779 | ||||||
Poste Italiane SpA, 144A | 6,607 | 89,597 | ||||||
Prysmian SpA | 2,713 | 102,091 | ||||||
Snam SpA | 16,932 | 100,042 | ||||||
Telecom Italia SpA | 180,369 | 81,632 | ||||||
Terna - Rete Elettrica Nazionale | 12,415 | 98,157 | ||||||
|
| |||||||
| 1,065,606 | ||||||||
| Japan 33.3% | ||||||||
Advantest Corp. | 1,003 | 86,793 | ||||||
AGC, Inc. | 2,407 | 116,395 | ||||||
Aisin Corp. | 2,178 | 83,248 | ||||||
Ajinomoto Co., Inc. | 3,938 | 116,119 | ||||||
Asahi Group Holdings Ltd. | 1,881 | 87,438 | ||||||
Asahi Kasei Corp. | 8,855 | 91,436 | ||||||
Astellas Pharma, Inc. | 5,369 | 90,626 | ||||||
Azbil Corp. | 2,381 | 103,343 | ||||||
Bridgestone Corp. | 2,231 | 102,693 | ||||||
Brother Industries Ltd. | 4,399 | 90,287 | ||||||
Canon, Inc. | 4,010 | 95,188 | ||||||
Chiba Bank Ltd. (The) | 15,477 | 96,648 | ||||||
Chubu Electric Power Co., Inc. | 7,218 | 87,195 | ||||||
Chugai Pharmaceutical Co. Ltd. | 2,387 | 93,471 | ||||||
See Notes to Financial Statements.
| 106 |
| Description | Shares | Value | ||||||
| COMMON STOCKS (Continued) | ||||||||
| Japan (cont'd.) | ||||||||
Cosmos Pharmaceutical Corp. | 668 | $ | 118,281 | |||||
Dai Nippon Printing Co. Ltd. | 4,390 | 104,388 | ||||||
Daikin Industries Ltd. | 522 | 130,031 | ||||||
Daiwa House Industry Co. Ltd. | 3,257 | 99,355 | ||||||
Daiwa Securities Group, Inc. | 17,527 | 99,173 | ||||||
Denso Corp. | 1,416 | 99,235 | ||||||
Dentsu Group, Inc. | 2,808 | 104,137 | ||||||
Disco Corp. | 304 | 88,563 | ||||||
ENEOS Holdings, Inc. | 22,596 | 87,517 | ||||||
Fuji Electric Co. Ltd. | 2,236 | 96,846 | ||||||
FUJIFILM Holdings Corp. | 1,346 | 110,944 | ||||||
Fujitsu Ltd. | 585 | 107,944 | ||||||
Hakuhodo DY Holdings, Inc. | 5,971 | 93,949 | ||||||
Hamamatsu Photonics KK | 1,556 | 90,801 | ||||||
Hikari Tsushin, Inc. | 503 | 88,104 | ||||||
Hirose Electric Co. Ltd. | 620 | 103,300 | ||||||
Hitachi Ltd. | 1,922 | 106,307 | ||||||
Honda Motor Co. Ltd. | 3,096 | 94,049 | ||||||
Hoshizaki Corp. | 1,073 | 100,751 | ||||||
Hoya Corp. | 722 | 116,686 | ||||||
Idemitsu Kosan Co. Ltd. | 3,932 | 94,284 | ||||||
Iida Group Holdings Co. Ltd. | 3,619 | 91,976 | ||||||
Inpex Corp. | 12,420 | 85,573 | ||||||
Isuzu Motors Ltd. | 6,843 | 86,583 | ||||||
ITOCHU Corp. | 3,241 | 97,541 | ||||||
Itochu Techno-Solutions Corp. | 3,132 | 96,936 | ||||||
Japan Metropolitan Fund Invest | 88 | 85,508 | ||||||
Japan Post Bank Co. Ltd.(a) | 11,457 | 100,287 | ||||||
Japan Post Holdings Co. Ltd.* | 11,645 | 99,953 | ||||||
Japan Real Estate Investment Corp. | 14 | 86,661 | ||||||
Japan Tobacco, Inc. | 4,880 | 94,593 | ||||||
Kajima Corp. | 7,177 | 92,832 | ||||||
Kansai Electric Power Co., Inc. (The) | 8,893 | 89,322 | ||||||
KAO Corp. | 1,550 | 93,635 | ||||||
KDDI Corp. | 2,783 | 85,249 | ||||||
Kirin Holdings Co. Ltd. | 4,436 | 80,402 | ||||||
Komatsu Ltd. | 3,475 | 84,099 | ||||||
Kubota Corp. | 4,679 | 96,736 | ||||||
Kyowa Kirin Co. Ltd. | 2,811 | 91,856 | ||||||
Lixil Corp. | 3,628 | 105,692 | ||||||
Makita Corp. | 1,973 | 113,342 | ||||||
Marubeni Corp. | 10,497 | 83,545 | ||||||
See Notes to Financial Statements.
PGIM QMA Strategic Alpha ETFs | 107 |
PGIM QMA Strategic Alpha International Equity ETF
Schedule of Investments (continued)
as of August 31, 2021
| Description | Shares | Value | ||||||
| COMMON STOCKS (Continued) | ||||||||
| Japan (cont'd.) | ||||||||
Mazda Motor Corp. | 11,408 | $ | 99,029 | |||||
McDonald’s Holdings Co. Japan Ltd. | 2,117 | 101,025 | ||||||
Medipal Holdings Corp. | 4,860 | 92,902 | ||||||
MEIJI Holdings Co. Ltd. | 1,545 | 94,934 | ||||||
MINEBEA MITSUMI, Inc. | 3,560 | 91,674 | ||||||
MISUMI Group, Inc. | 2,681 | 106,372 | ||||||
Mitsubishi Chemical Holdings Corp. | 12,930 | 113,510 | ||||||
Mitsubishi Corp. | 3,355 | 100,972 | ||||||
Mitsubishi Electric Corp. | 5,598 | 76,606 | ||||||
Mitsubishi Estate Co. Ltd. | 5,538 | 86,633 | ||||||
Mitsubishi Gas Chemical Co., Inc. | 4,253 | 80,216 | ||||||
Mitsubishi Heavy Industries Ltd. | 3,012 | 79,643 | ||||||
Mitsubishi UFJ Financial Group, Inc. | 18,057 | 97,560 | ||||||
Mitsui & Co. Ltd. | 4,362 | 96,308 | ||||||
Mitsui Chemicals, Inc. | 2,793 | 96,472 | ||||||
Mitsui Fudosan Co. Ltd. | 3,899 | 89,452 | ||||||
Mizuho Financial Group, Inc. | 6,543 | 91,768 | ||||||
Nabtesco Corp. | 2,266 | 89,804 | ||||||
NEC Corp. | 2,005 | 105,339 | ||||||
NGK Insulators Ltd. | 4,930 | 81,782 | ||||||
NH Foods Ltd. | 2,395 | 92,848 | ||||||
Nintendo Co. Ltd. | 162 | 77,897 | ||||||
Nippon Express Co. Ltd. | 1,214 | 82,651 | ||||||
Nippon Prologis REIT, Inc. | 30 | 108,122 | ||||||
Nippon Sanso Holdings Corp. | 4,956 | 120,279 | ||||||
Nippon Shinyaku Co. Ltd. | 1,221 | 99,110 | ||||||
Nippon Telegraph & Telephone Corp. | 3,653 | 97,489 | ||||||
Nitori Holdings Co. Ltd. | 563 | 105,318 | ||||||
Nitto Denko Corp. | 1,260 | 95,747 | ||||||
Nomura Real Estate Holdings, Inc. | 3,895 | 99,663 | ||||||
Nomura Real Estate Master Fund, Inc. | 56 | 86,381 | ||||||
Nomura Research Institute Ltd. | 2,953 | 110,991 | ||||||
NSK Ltd. | 10,399 | 72,972 | ||||||
NTT Data Corp. | 5,735 | 103,268 | ||||||
Oji Holdings Corp. | 16,262 | 85,142 | ||||||
Omron Corp. | 1,251 | 118,033 | ||||||
Ono Pharmaceutical Co. Ltd. | 4,252 | 102,189 | ||||||
Oracle Corp. Japan | 1,069 | 87,840 | ||||||
ORIX Corp. | 5,629 | 104,967 | ||||||
Orix JREIT, Inc. | 51 | 90,907 | ||||||
Osaka Gas Co. Ltd. | 4,862 | 91,172 | ||||||
Otsuka Holdings Co. Ltd. | 2,122 | 90,288 | ||||||
See Notes to Financial Statements.
| 108 |
| Description | Shares | Value | ||||||
| COMMON STOCKS (Continued) | ||||||||
| Japan (cont'd.) | ||||||||
Pan Pacific International Holdings Corp. | 4,495 | $ | 85,679 | |||||
Panasonic Corp. | 8,402 | 100,199 | ||||||
Persol Holdings Co. Ltd. | 4,404 | 102,960 | ||||||
Resona Holdings, Inc. | 23,720 | 91,784 | ||||||
Ricoh Co. Ltd. | 7,761 | 79,010 | ||||||
Rinnai Corp. | 986 | 106,025 | ||||||
Rohm Co. Ltd. | 1,050 | 101,359 | ||||||
Ryohin Keikaku Co. Ltd. | 5,041 | 108,046 | ||||||
SCSK Corp. | 1,516 | 95,771 | ||||||
Seiko Epson Corp. | 5,299 | 98,741 | ||||||
Sekisui House Ltd. | 4,501 | 89,721 | ||||||
Seven & i Holdings Co. Ltd. | 2,288 | 100,138 | ||||||
SG Holdings Co. Ltd. | 3,873 | 105,331 | ||||||
Shimadzu Corp. | 2,610 | 117,078 | ||||||
Shimano, Inc. | 438 | 128,595 | ||||||
Shin-Etsu Chemical Co. Ltd. | 559 | 92,502 | ||||||
Shionogi & Co. Ltd. | 1,843 | 116,462 | ||||||
Shizuoka Bank Ltd. (The) | 11,774 | 92,253 | ||||||
SMC Corp. | 166 | 106,392 | ||||||
SoftBank Corp. | 7,494 | 100,372 | ||||||
Sohgo Security Services Co. Ltd. | 1,893 | 85,776 | ||||||
Stanley Electric Co. Ltd. | 3,160 | 78,932 | ||||||
Subaru Corp. | 4,575 | 84,688 | ||||||
Sumitomo Chemical Co. Ltd. | 18,492 | 93,792 | ||||||
Sumitomo Corp. | 6,926 | 97,864 | ||||||
Sumitomo Dainippon Pharma Co. Ltd. | 4,575 | 82,006 | ||||||
Sumitomo Electric Industries Ltd. | 6,003 | 80,238 | ||||||
Sumitomo Mitsui Financial Group, Inc. | 2,532 | 87,480 | ||||||
Sumitomo Mitsui Trust Holdings, Inc. | 2,917 | 95,399 | ||||||
Suntory Beverage & Food Ltd. | 2,566 | 102,743 | ||||||
Suzuki Motor Corp. | 2,236 | 96,663 | ||||||
Taisei Corp. | 2,900 | 90,810 | ||||||
Takeda Pharmaceutical Co. Ltd. | 2,574 | 86,077 | ||||||
Terumo Corp. | 2,355 | 98,404 | ||||||
TIS, Inc. | 4,092 | 115,676 | ||||||
Tohoku Electric Power Co., Inc. | 11,881 | 90,931 | ||||||
Tokyo Electron Ltd. | 222 | 95,326 | ||||||
Tokyo Gas Co. Ltd. | 4,823 | 92,764 | ||||||
Toppan, Inc. | 5,583 | 95,913 | ||||||
Toray Industries, Inc. | 13,490 | 90,959 | ||||||
Toshiba Corp. | 2,219 | 96,312 | ||||||
Tosoh Corp. | 5,409 | 98,234 | ||||||
See Notes to Financial Statements.
PGIM QMA Strategic Alpha ETFs | 109 |
PGIM QMA Strategic Alpha International Equity ETF
Schedule of Investments (continued)
as of August 31, 2021
| Description | Shares | Value | ||||||
| COMMON STOCKS (Continued) | ||||||||
| Japan (cont'd.) | ||||||||
Toyo Suisan Kaisha Ltd. | 2,430 | $ | 100,610 | |||||
Toyota Industries Corp. | 1,017 | 85,879 | ||||||
Toyota Motor Corp. | 1,157 | 100,877 | ||||||
Toyota Tsusho Corp. | 1,987 | 87,868 | ||||||
Trend Micro, Inc. | 1,870 | 102,496 | ||||||
USS Co. Ltd. | 5,631 | 93,206 | ||||||
Welcia Holdings Co. Ltd. | 3,007 | 106,187 | ||||||
Yakult Honsha Co. Ltd. | 1,747 | 100,677 | ||||||
Yamada Holdings Co. Ltd. | 20,437 | 87,867 | ||||||
Yamaha Motor Co. Ltd. | 3,247 | 82,640 | ||||||
Yamato Holdings Co. Ltd. | 3,277 | 83,403 | ||||||
|
| |||||||
| 14,500,236 | ||||||||
| Jordan 0.2% | ||||||||
Hikma Pharmaceuticals PLC | 2,723 | 95,015 | ||||||
| Luxembourg 0.3% | ||||||||
Eurofins Scientific SE | 911 | 129,166 | ||||||
| Netherlands 2.5% | ||||||||
Akzo Nobel NV | 745 | 91,836 | ||||||
ING Groep NV | 7,081 | 97,823 | ||||||
Koninklijke Ahold Delhaize NV | 3,255 | 109,804 | ||||||
Koninklijke KPN NV | 29,666 | 95,066 | ||||||
Koninklijke Philips NV | 1,715 | 79,056 | ||||||
NN Group NV | 1,895 | 98,384 | ||||||
QIAGEN NV* | 2,023 | 111,956 | ||||||
Randstad NV | 1,361 | 100,116 | ||||||
Royal Dutch Shell PLC, | ||||||||
(Class A Stock) | 4,674 | 91,995 | ||||||
(Class B Stock) | 4,891 | 96,226 | ||||||
Wolters Kluwer NV | 1,069 | 122,966 | ||||||
|
| |||||||
| 1,095,228 | ||||||||
| Norway 0.8% | ||||||||
Equinor ASA | 4,161 | 88,415 | ||||||
Mowi ASA | 3,484 | 93,329 | ||||||
Orkla ASA | 9,620 | 85,951 | ||||||
Yara International ASA | 1,809 | 90,843 | ||||||
|
| |||||||
| 358,538 | ||||||||
See Notes to Financial Statements.
| 110 |
| Description | Shares | Value | ||||||
| COMMON STOCKS (Continued) | ||||||||
| Portugal 0.2% | ||||||||
Jeronimo Martins SGPS SA | 4,999 | $ | 105,951 | |||||
| Singapore 1.5% | ||||||||
Ascendas Real Estate Investment Trust | 42,984 | 97,193 | ||||||
DBS Group Holdings Ltd. | 4,304 | 95,943 | ||||||
Mapletree Logistics Trust | 61,868 | 93,415 | ||||||
Oversea-Chinese Banking Corp. Ltd. | 11,527 | 97,998 | ||||||
Singapore Technologies Engineering Ltd. | 32,818 | 92,270 | ||||||
United Overseas Bank Ltd. | 4,999 | 95,113 | ||||||
Wilmar International Ltd. | 26,763 | 82,412 | ||||||
|
| |||||||
| 654,344 | ||||||||
| Spain 2.0% | ||||||||
ACS Actividades de Construccion y Servicios SA | 3,104 | 83,783 | ||||||
CaixaBank SA | 28,312 | 87,986 | ||||||
Enagas SA | 4,327 | 98,427 | ||||||
Endesa SA | 3,431 | 82,481 | ||||||
Iberdrola SA | 7,010 | 86,868 | ||||||
Industria de Diseno Textil SA | 2,497 | 85,236 | ||||||
Naturgy Energy Group SA | 3,631 | 93,463 | ||||||
Red Electrica Corp. SA | 5,031 | 100,333 | ||||||
Repsol SA | 6,920 | 79,297 | ||||||
Telefonica SA | 19,306 | 95,320 | ||||||
|
| |||||||
| 893,194 | ||||||||
| Sweden 5.1% | ||||||||
Alfa Laval AB | 2,680 | 108,698 | ||||||
Assa Abloy AB (Class B Stock) | 3,064 | 97,926 | ||||||
Atlas Copco AB, | ||||||||
(Class A Stock) | 1,596 | 109,563 | ||||||
(Class B Stock) | 1,825 | 105,573 | ||||||
Electrolux AB (Class B Stock) | 3,643 | 92,284 | ||||||
Epiroc AB, | ||||||||
(Class A Stock) | 4,326 | 94,922 | ||||||
(Class B Stock) | 4,768 | 90,587 | ||||||
Essity AB (Class B Stock) | 2,855 | 91,578 | ||||||
Hexagon AB (Class B Stock) | 6,909 | 119,694 | ||||||
Husqvarna AB (Class B Stock) | 7,108 | 95,342 | ||||||
ICA Gruppen AB | 1,812 | 90,144 | ||||||
Investor AB (Class B Stock) | 4,092 | 97,873 | ||||||
L E Lundbergforetagen AB (Class B Stock) | 1,449 | 92,487 | ||||||
Lundin Energy AB | 2,602 | 79,482 | ||||||
See Notes to Financial Statements.
PGIM QMA Strategic Alpha ETFs | 111 |
PGIM QMA Strategic Alpha International Equity ETF
Schedule of Investments (continued)
as of August 31, 2021
| Description | Shares | Value | ||||||
| COMMON STOCKS (Continued) | ||||||||
| Sweden (cont'd.) | ||||||||
Securitas AB (Class B Stock) | 6,022 | $ | 99,966 | |||||
Skanska AB (Class B Stock) | 3,474 | 100,040 | ||||||
SKF AB (Class B Stock) | 3,472 | 88,515 | ||||||
Svenska Handelsbanken AB (Class A Stock) | 8,757 | 98,495 | ||||||
Swedish Match AB | 10,260 | 94,736 | ||||||
Tele2 AB (Class B Stock) | 6,899 | 103,412 | ||||||
Telefonaktiebolaget LM Ericsson (Class B Stock) | 6,820 | 80,849 | ||||||
Telia Co. AB | 21,421 | 91,945 | ||||||
Volvo AB (Class B Stock) | 3,798 | 85,885 | ||||||
|
| |||||||
| 2,209,996 | ||||||||
| Switzerland 5.9% | ||||||||
ABB Ltd. | 2,844 | 105,344 | ||||||
Adecco Group AG | 1,341 | 74,654 | ||||||
Barry Callebaut AG | 41 | 104,498 | ||||||
Chocoladefabriken Lindt & Spruengli AG | 10 | 117,608 | ||||||
Cie Financiere Richemont SA | 751 | 82,829 | ||||||
Coca-Cola HBC AG* | 2,835 | 102,470 | ||||||
Geberit AG | 129 | 107,792 | ||||||
Holcim Ltd.* | 1,530 | 87,214 | ||||||
Kuehne + Nagel International AG | 271 | 99,167 | ||||||
Logitech International SA | 790 | 80,781 | ||||||
Nestle SA | 808 | 102,122 | ||||||
Novartis AG | 1,003 | 92,869 | ||||||
Roche Holding AG, | ||||||||
(Genusschein) | 263 | 105,616 | ||||||
(Bearer Shares) | 236 | 105,662 | ||||||
Schindler Holding AG | 329 | 106,272 | ||||||
SGS SA | 28 | 87,998 | ||||||
Sika AG | 294 | 105,978 | ||||||
STMicroelectronics NV | 2,384 | 106,164 | ||||||
Straumann Holding AG | 62 | 119,836 | ||||||
Swatch Group AG (The) | 1,384 | 76,095 | ||||||
Swiss Life Holding AG | 180 | 93,877 | ||||||
Swiss Prime Site AG | 920 | 98,405 | ||||||
Swisscom AG | 173 | 101,524 | ||||||
Temenos AG | 574 | 91,138 | ||||||
UBS Group AG | 5,917 | 98,730 | ||||||
Zurich Insurance Group AG | 216 | 94,821 | ||||||
|
| |||||||
| 2,549,464 | ||||||||
See Notes to Financial Statements.
| 112 |
| Description | Shares | Value | ||||||
| COMMON STOCKS (Continued) | ||||||||
| United Kingdom 10.2% | ||||||||
3i Group PLC | 5,491 | $ | 100,972 | |||||
Abrdn PLC | 23,936 | 87,372 | ||||||
Ashtead Group PLC | 1,340 | 104,827 | ||||||
AstraZeneca PLC | 877 | 102,657 | ||||||
Auto Trader Group PLC, 144A | 10,317 | 89,219 | ||||||
Aviva PLC | 16,352 | 90,848 | ||||||
Barclays PLC | 37,999 | 96,597 | ||||||
Barratt Developments PLC | 9,323 | 94,723 | ||||||
British American Tobacco PLC | 2,467 | 92,561 | ||||||
Bunzl PLC | 2,819 | 102,163 | ||||||
Burberry Group PLC | 3,072 | 78,537 | ||||||
Coca-Cola Europacific Partners PLC | 1,689 | 97,523 | ||||||
Diageo PLC | 1,984 | 95,306 | ||||||
Direct Line Insurance Group PLC | 23,108 | 98,169 | ||||||
Ferguson PLC | 708 | 102,255 | ||||||
GlaxoSmithKline PLC | 5,103 | 102,572 | ||||||
Hargreaves Lansdown PLC | 4,165 | 86,380 | ||||||
Imperial Brands PLC | 4,216 | 89,351 | ||||||
Intertek Group PLC | 1,257 | 91,075 | ||||||
J Sainsbury PLC | 26,860 | 112,263 | ||||||
JD Sports Fashion PLC | 7,376 | 102,372 | ||||||
Johnson Matthey PLC | 2,214 | 89,461 | ||||||
Kingfisher PLC | 19,800 | 95,359 | ||||||
Lloyds Banking Group PLC | 142,499 | 85,762 | ||||||
Mondi PLC | 3,826 | 105,467 | ||||||
National Grid PLC | 7,534 | 97,501 | ||||||
Natwest Group PLC | 33,238 | 97,381 | ||||||
Next PLC | 844 | 91,785 | ||||||
Persimmon PLC | 2,195 | 88,723 | ||||||
Reckitt Benckiser Group PLC | 1,038 | 79,047 | ||||||
Rentokil Initial PLC | 13,909 | 110,989 | ||||||
Rio Tinto PLC | 1,044 | 77,250 | ||||||
Sage Group PLC (The) | 10,927 | 111,501 | ||||||
Schroders PLC | 1,835 | 95,364 | ||||||
Segro PLC | 6,823 | 120,447 | ||||||
Severn Trent PLC | 2,791 | 105,984 | ||||||
Smith & Nephew PLC | 4,399 | 84,369 | ||||||
Smiths Group PLC | 4,063 | 80,578 | ||||||
Spirax-Sarco Engineering PLC | 543 | 120,268 | ||||||
SSE PLC | 4,316 | 96,870 | ||||||
Standard Chartered PLC | 13,875 | 86,758 | ||||||
Tesco PLC | 27,413 | 96,163 | ||||||
Unilever PLC | 1,587 | 88,279 | ||||||
See Notes to Financial Statements.
PGIM QMA Strategic Alpha ETFs | 113 |
PGIM QMA Strategic Alpha International Equity ETF
Schedule of Investments (continued)
as of August 31, 2021
| Description | Shares | Value | ||||||||||||||
| COMMON STOCKS (Continued) | ||||||||||||||||
| United Kingdom (cont'd.) | ||||||||||||||||
United Utilities Group PLC | 6,638 | $ | 96,510 | |||||||||||||
Vodafone Group PLC | 52,837 | 88,595 | ||||||||||||||
Wm Morrison Supermarkets PLC | 37,548 | 149,706 | ||||||||||||||
|
| |||||||||||||||
| 4,457,859 | ||||||||||||||||
|
| |||||||||||||||
TOTAL COMMON STOCKS | 42,480,154 | |||||||||||||||
|
| |||||||||||||||
| PREFERRED STOCKS 1.2% | ||||||||||||||||
| Germany 1.0% | ||||||||||||||||
Bayerische Motoren Werke AG | 996 | 83,380 | ||||||||||||||
FUCHS PETROLUB SE | 1,850 | 93,623 | ||||||||||||||
Henkel AG & Co. KGaA | 876 | 85,581 | ||||||||||||||
Porsche Automobil Holding SE | 816 | 82,629 | ||||||||||||||
Volkswagen AG | 345 | 82,001 | ||||||||||||||
|
| |||||||||||||||
| 427,214 | ||||||||||||||||
| Italy 0.2% | ||||||||||||||||
Telecom Italia SpA |
| 173,716 | 83,872 | |||||||||||||
|
| |||||||||||||||
TOTAL PREFERRED STOCKS |
| 511,086 | ||||||||||||||
|
| |||||||||||||||
TOTAL LONG-TERM INVESTMENTS |
| 42,991,240 | ||||||||||||||
|
| |||||||||||||||
| SHORT-TERM INVESTMENTS 0.7% | ||||||||||||||||
| AFFILIATED MUTUAL FUND 0.2% | ||||||||||||||||
PGIM Institutional Money Market Fund |
| 95,850 | 95,793 | |||||||||||||
|
| |||||||||||||||
Interest | Maturity | Principal | ||||||||||||||
TIME DEPOSIT 0.5% | ||||||||||||||||
Skandinaviska Enskilda Banken AB (Sweden) (cost $188,686) | 0.005 | % | 09/01/21 | 189 | 188,686 | |||||||||||
|
| |||||||||||||||
TOTAL SHORT-TERM INVESTMENTS |
| 284,479 | ||||||||||||||
|
| |||||||||||||||
TOTAL INVESTMENTS 99.3% |
| 43,275,719 | ||||||||||||||
Other assets in excess of liabilities 0.7% |
| 313,591 | ||||||||||||||
|
| |||||||||||||||
NET ASSETS 100.0% | $ | 43,589,310 | ||||||||||||||
|
| |||||||||||||||
See Notes to Financial Statements.
| 114 |
The following abbreviations are used in the annual report:
144A-Security was purchased pursuant to Rule 144A under the Securities Act of 1933 and may not be resold subject to that rule except to qualified institutional buyers.
| # | Principal or notional amount is shown in U.S. dollars unless otherwise stated. |
| (a) | All or a portion of security is on loan. The aggregate market value of such securities, including those sold and pending settlement, is $91,416; cash collateral of $95,789 (included in liabilities) was received with which the Fund purchased highly liquid short-term investments. In the event of significant appreciation in value of securities on loan on the last business day of the reporting period, the Fund may reflect a collateral value that is less than the market value of the loaned securities and such shortfall is remedied the following business day. |
| (b) | Represents security purchased with cash collateral received for securities on loan and includes dividend reinvestment. |
| (wa) | PGIM Investments LLC, the manager of the Fund, also serves as manager of the PGIM Institutional Money Market Fund, if applicable. |
| * | Non-income producing security. |
Fair Value Measurements:
Various inputs are used in determining the value of the Fund’s investments. These inputs are summarized in the three broad levels listed below.
Level 1—unadjusted quoted prices generally in active markets for identical securities.
Level 2—quoted prices for similar securities, interest rates and yield curves, prepayment speeds, foreign currency exchange rates and other observable inputs.
Level 3—unobservable inputs for securities valued in accordance with Board approved fair valuation procedures.
The following is a summary of the inputs used as of August 31, 2021 in valuing such portfolio securities:
| Level 1 | Level 2 | Level 3 | ||||||||||
| Investments in Securities | ||||||||||||
| Assets | ||||||||||||
| Long-Term Investments | ||||||||||||
| Common Stocks | ||||||||||||
Australia | $ | 2,190,774 | $ | — | $ | — | ||||||
Austria | 389,970 | — | — | |||||||||
Belgium | 439,386 | — | — | |||||||||
Denmark | 869,141 | — | — | |||||||||
Finland | 870,564 | — | — | |||||||||
France | 3,770,236 | — | — | |||||||||
Germany | 3,119,691 | — | — | |||||||||
Hong Kong | 1,701,591 | — | — | |||||||||
Ireland | 410,833 | — | — | |||||||||
Israel | 603,371 | — | — | |||||||||
See Notes to Financial Statements.
PGIM QMA Strategic Alpha ETFs | 115 |
PGIM QMA Strategic Alpha International Equity ETF
Schedule of Investments (continued)
as of August 31, 2021
| Level 1 | Level 2 | Level 3 | ||||||||||
| Investments in Securities (continued) | ||||||||||||
| Assets (continued) | ||||||||||||
| Long-Term Investments (continued) | ||||||||||||
| Common Stocks (continued) | ||||||||||||
Italy | $ | 1,065,606 | $ | — | $ | — | ||||||
Japan | 14,500,236 | — | — | |||||||||
Jordan | 95,015 | — | — | |||||||||
Luxembourg | 129,166 | — | — | |||||||||
Netherlands | 1,095,228 | — | — | |||||||||
Norway | 358,538 | — | — | |||||||||
Portugal | 105,951 | — | — | |||||||||
Singapore | 654,344 | — | — | |||||||||
Spain | 893,194 | — | — | |||||||||
Sweden | 2,209,996 | — | — | |||||||||
Switzerland | 2,549,464 | — | — | |||||||||
United Kingdom | 4,457,859 | — | — | |||||||||
| Preferred Stocks | ||||||||||||
Germany | 427,214 | — | — | |||||||||
Italy | 83,872 | — | — | |||||||||
| Short-Term Investments | ||||||||||||
Affiliated Mutual Fund | 95,793 | — | — | |||||||||
Time Deposit | — | 188,686 | — | |||||||||
|
|
|
|
|
| |||||||
Total | $ | 43,087,033 | $ | 188,686 | $ | — | ||||||
|
|
|
|
|
| |||||||
Industry Classification:
The industry classification of investments and other assets in excess of liabilities shown as a percentage of net assets as of August 31, 2021 were as follows (unaudited):
Banks | 6.8 | % | ||
Machinery | 5.3 | |||
Pharmaceuticals | 4.7 | |||
Chemicals | 4.6 | |||
Real Estate Management & Development | 3.5 | |||
Equity Real Estate Investment Trusts (REITs) | 3.4 | |||
Diversified Telecommunication Services | 3.2 | |||
Food & Staples Retailing | 3.1 | |||
Food Products | 2.9 | |||
Electric Utilities | 2.8 | |||
Automobiles | 2.6 | |||
Trading Companies & Distributors | 2.5 | |||
Health Care Equipment & Supplies | 2.4 | |||
Insurance | 2.4 | |||
Textiles, Apparel & Luxury Goods | 2.3 | |||
Oil, Gas & Consumable Fuels | 2.2 | |||
IT Services | 2.1 | |||
Building Products | 2.0 | |||
Beverages | 1.9 | |||
Household Durables | 1.9 | |||
Professional Services | 1.9 | |||
Software | 1.6 | |||
Capital Markets | 1.5 | |||
Specialty Retail | 1.5 | |||
Electronic Equipment, Instruments & Components | 1.5 | |||
Construction & Engineering | 1.5 | |||
Industrial Conglomerates | 1.5 | |||
Auto Components | 1.5 | |||
Electrical Equipment | 1.4 | |||
Commercial Services & Supplies | 1.4 | |||
Gas Utilities | 1.3 | |||
Technology Hardware, Storage & Peripherals | 1.3 |
See Notes to Financial Statements.
| 116 |
| Industry Classification (cont’d.) | ||||
Semiconductors & Semiconductor Equipment | 1.1 | % | ||
Multi-Utilities | 1.0 | |||
Metals & Mining | 1.0 | |||
Diversified Financial Services | 0.9 | |||
Paper & Forest Products | 0.9 | |||
Health Care Providers & Services | 0.9 | |||
Multiline Retail | 0.9 | |||
Wireless Telecommunication Services | 0.9 | |||
Hotels, Restaurants & Leisure | 0.9 | |||
Tobacco | 0.8 | |||
Interactive Media & Services | 0.8 | |||
Household Products | 0.8 | |||
Aerospace & Defense | 0.7 | |||
Media | 0.7 | |||
Air Freight & Logistics | 0.7 | |||
Construction Materials | 0.7 | |||
Marine | 0.7 | |||
Personal Products | 0.6 | |||
Life Sciences Tools & Services | 0.6 | |||
Water Utilities | 0.5 | |||
Time Deposit | 0.4 | |||
Communications Equipment | 0.4 | |||
Entertainment | 0.4 | |||
Road & Rail | 0.4 | |||
Leisure Products | 0.3 | |||
Containers & Packaging | 0.2 | |||
Independent Power & Renewable Electricity Producers | 0.2 | |||
Biotechnology | 0.2 | |||
Affiliated Mutual Fund (0.2% represents investments purchased with collateral from securities on loan) | 0.2 | |||
|
| |||
| 99.3 | ||||
Other assets in excess of liabilities | 0.7 | |||
|
| |||
| 100.0 | % | |||
|
| |||
Financial Instruments/Transactions—Summary of Offsetting and Netting Agreements:
The Fund entered into financial instruments/transactions during the period that are either offset in accordance with current requirements or are subject to enforceable master netting arrangements or similar agreements that permit offsetting. The information about offsetting and related netting arrangements for financial instruments/transactions, where the legal right to set-off exists, is presented in the summary below:
Offsetting of financial instrument/transaction assets and liabilities:
Description | Gross Market Value of Recognized Assets/(Liabilities) | Collateral Pledged/(Received)(1) | Net Amount | |||||||||
Securities on Loan | $ | 91,416 | $ | (91,416 | ) | $ | — | |||||
|
|
|
|
|
| |||||||
| (1) | Collateral amount disclosed by the Fund is limited to the market value of the financial instruments/transactions. |
See Notes to Financial Statements.
PGIM QMA Strategic Alpha ETFs | 117 |
PGIM QMA Strategic Alpha International Equity ETF
Statement of Assets & Liabilities
as of August 31, 2021
Assets | ||||
Investments at value, including securities on loan of $91,416: | ||||
Unaffiliated investments (cost $37,136,446) | $ | 43,179,926 | ||
Affiliated investments (cost $95,793) | 95,793 | |||
Foreign currency, at value (cost $264,617) | 264,788 | |||
Interest and dividends receivable | 150,561 | |||
Other assets | 5,130 | |||
|
| |||
Total Assets | 43,696,198 | |||
|
| |||
Liabilities | ||||
Payable to broker for collateral for securities on loan | 95,789 | |||
Management fee payable | 10,691 | |||
Other liabilities | 408 | |||
|
| |||
Total Liabilities | 106,888 | |||
|
| |||
Net Assets | $ | 43,589,310 | ||
|
| |||
Net assets were comprised of: | ||||
Common stock, at par | $ | 700 | ||
Paid-in capital in excess of par | 34,905,030 | |||
Total distributable earnings (loss) | 8,683,580 | |||
|
| |||
Net assets, August 31, 2021 | $ | 43,589,310 | ||
|
| |||
Net asset value, offering price and redemption price per share, | $ | 62.27 | ||
|
| |||
See Notes to Financial Statements.
| 118 |
PGIM QMA Strategic Alpha International Equity ETF
Statement of Operations
Year Ended August 31, 2021
Net Investment Income (Loss) | ||||
Income | ||||
Unaffiliated dividend income (net of $137,919 foreign withholding tax) | $ | 1,118,153 | ||
Income from securities lending, net (including affiliated income of $397) | 4,732 | |||
Miscellaneous Income | 81 | |||
|
| |||
Total income | 1,122,966 | |||
|
| |||
Expenses | ||||
Management fee | 117,202 | |||
Miscellaneous expenses | 428 | |||
|
| |||
Total expenses | 117,630 | |||
|
| |||
Net investment income (loss) | 1,005,336 | |||
|
| |||
| Realized And Unrealized Gain (Loss) On Investments and Foreign Currency Transactions | ||||
Net realized gain (loss) on: | ||||
Investment transactions (including affiliated of $(175)) | 4,291,779 | |||
Foreign currency transactions | 23,867 | |||
|
| |||
| 4,315,646 | ||||
|
| |||
Net change in unrealized appreciation (depreciation) on: | ||||
Investments (including affiliated of $41) | 3,356,461 | |||
Foreign currencies | (8,404 | ) | ||
|
| |||
| 3,348,057 | ||||
|
| |||
Net gain (loss) on investment and foreign currency transactions | 7,663,703 | |||
|
| |||
Net Increase (Decrease) In Net Assets Resulting From Operations | $ | 8,669,039 | ||
|
| |||
See Notes to Financial Statements.
PGIM QMA Strategic Alpha ETFs | 119 |
PGIM QMA Strategic Alpha International Equity ETF
Statements of Changes in Net Assets
| Year Ended August 31, | ||||||||
| 2021 | 2020 | |||||||
Increase (Decrease) in Net Assets | ||||||||
Operations | ||||||||
Net investment income (loss) | $ | 1,005,336 | $ | 764,674 | ||||
Net realized gain (loss) on investments | 4,315,646 | (1,502,254 | ) | |||||
Net change in unrealized appreciation (depreciation) on investments and foreign currencies | 3,348,057 | 2,813,062 | ||||||
|
|
|
| |||||
Net increase (decrease) in net assets resulting from operations | 8,669,039 | 2,075,482 | ||||||
|
|
|
| |||||
Dividends and Distributions | ||||||||
Distributions from distributable earnings | (940,968 | ) | (901,215 | ) | ||||
|
|
|
| |||||
Total increase (decrease) | 7,728,071 | 1,174,267 | ||||||
| Net Assets: | ||||||||
Beginning of period | 35,861,239 | 34,686,972 | ||||||
|
|
|
| |||||
End of period | $ | 43,589,310 | $ | 35,861,239 | ||||
|
|
|
| |||||
See Notes to Financial Statements.
| 120 |
PGIM QMA Strategic Alpha International Equity ETF
Financial Highlights
| Year Ended August 31, | December 4, 2018(e) through August 31, | |||||||||||||||
| 2021 | 2020 | 2019 | ||||||||||||||
| Per Share Operating Performance(a): | ||||||||||||||||
| Net Asset Value, Beginning of Period | $51.23 | $49.55 | $50.00 | |||||||||||||
| Income (loss) from investment operations: | ||||||||||||||||
| Net investment income (loss) | 1.44 | 1.09 | 1.16 | |||||||||||||
| Net realized and unrealized gain (loss) on investments and foreign currency transactions | 10.94 | 1.88 | (0.63 | ) | ||||||||||||
| Total from investment operations | 12.38 | 2.97 | 0.53 | |||||||||||||
| Less Dividends and Distributions: | ||||||||||||||||
| Dividends from net investment income | (1.34 | ) | (1.29 | ) | (0.98 | ) | ||||||||||
| Net asset value, end of period | $62.27 | $51.23 | $49.55 | |||||||||||||
| Total Return(b): | 24.43% | 6.05% | 1.09% | |||||||||||||
| Ratios/Supplemental Data: | ||||||||||||||||
| Net assets, end of period (000) | $43,589 | $35,861 | $34,687 | |||||||||||||
| Average net assets (000) | $40,415 | $34,722 | $27,908 | |||||||||||||
| Ratios to average net assets(c): | ||||||||||||||||
| Expenses after waivers and/or expense reimbursement | 0.29% | 0.29% | 0.29% | (d) | ||||||||||||
| Expenses before waivers and/or expense reimbursement | 0.29% | 0.29% | 0.29% | (d) | ||||||||||||
| Net investment income (loss) | 2.49% | 2.20% | 3.12% | (d) | ||||||||||||
| Portfolio turnover rate(f)(g) | 79% | 92% | 63% | |||||||||||||
| (a) | Calculated based on average shares outstanding during the period. |
| (b) | Total return is calculated assuming a purchase of a share on the first day and a sale on the last day of the period reported and includes reinvestment of dividends and distributions, if any. Total returns may reflect adjustments to conform to generally accepted accounting principles. Total returns for periods less than one full year are not annualized. |
| (c) | Does not include expenses of the underlying funds in which the Fund invests. |
| (d) | Annualized. |
| (e) | Commencement of operations. |
| (f) | The Fund’s portfolio turnover rate is calculated in accordance with regulatory requirements, without regard to transactions involving short-term investments and certain derivatives. If such transactions were included, the Fund’s portfolio turnover rate may be higher. |
| (g) | Portfolio turnover excludes the value of portfolio securities received or delivered as a result of in-kind fund share transactions, if any. |
See Notes to Financial Statements.
PGIM QMA Strategic Alpha ETFs | 121 |
Notes to Financial Statements
1. Organization
PGIM ETF Trust (the “Trust”) is an open-end management investment company registered under the Investment Company Act of 1940, as amended (“1940 Act”). The Trust was organized as a Delaware statutory trust and currently consists of seven separate series: PGIM Ultra Short Bond ETF, PGIM Active High Yield Bond ETF, PGIM Active Aggregate Bond ETF, PGIM QMA Strategic Alpha Large-Cap Core ETF, PGIM QMA Strategic Alpha Small-Cap Growth ETF, PGIM QMA Strategic Alpha Small-Cap Value ETF and PGIM QMA Strategic Alpha International Equity ETF. Each series operates as an exchange-traded fund.
These financial statements relate only to the following Funds: PGIM QMA Strategic Alpha Large- Cap Core ETF, PGIM QMA Strategic Alpha Small-Cap Growth ETF, PGIM QMA Strategic Alpha Small-Cap Value ETF and PGIM QMA Strategic Alpha International Equity ETF, which commenced investment operations on October 17, 2018, November 13, 2018, November 13, 2018 and December 4, 2018, respectively (each, a “Fund” and collectively, the “Funds”). The Funds are classified as diversified funds under the 1940 Act.
The investment objective of each Fund is to seek long-term growth of capital.
2. Accounting Policies
The Funds follow the investment company accounting and reporting guidance of the Financial Accounting Standards Board (“FASB”) Accounting Standard Codification (“ASC”) Topic 946 Financial Services—Investment Companies. The following is a summary of significant accounting policies followed by the Funds in the preparation of their financial statements. The policies conform to U.S. generally accepted accounting principles (“GAAP”). The Funds consistently follow such policies in the preparation of their financial statements.
Securities Valuation: The Funds hold securities and other assets and liabilities that are fair valued as of the close of each day (generally, 4:00 PM Eastern time) the New York Stock Exchange (“NYSE”) is open for trading. As described in further detail below, the Funds’ investments are valued daily based on a number of factors, including the type of investment and whether market quotations are readily available. The Trust’s Board of Trustees (the “Board”) has adopted valuation procedures for security valuation under which fair valuation responsibilities have been delegated to PGIM Investments LLC (“PGIM Investments” or the “Manager”). Pursuant to the Board’s delegation, the Manager has established a Valuation Committee responsible for supervising the fair valuation of portfolio securities and other assets and liabilities. The valuation procedures permit each Fund to utilize independent pricing vendor services, quotations from market makers, and alternative valuation methods when market quotations are either not readily available or not deemed representative of fair value. Fair value is the price that would be received to sell an asset or
| 122 |
paid to transfer a liability in an orderly transaction between market participants on the measurement date. A record of the Valuation Committee’s actions is subject to the Board’s review at its first quarterly meeting following the quarter in which such actions take place.
For the fiscal reporting year-end, securities and other assets and liabilities were fair valued at the close of the last U.S. business day. Trading in certain foreign securities may occur when the NYSE is closed (including weekends and holidays). Because such foreign securities trade in markets that are open on weekends and U.S. holidays, the values of some of the Funds’ foreign investments may change on days when investors cannot purchase or redeem Fund shares.
Various inputs determine how the Funds’ investments are valued, all of which are categorized according to the three broad levels (Level 1, 2, or 3) detailed in the Schedule of Investments and referred to herein as the “fair value hierarchy” in accordance with FASB ASC Topic 820—Fair Value Measurements and Disclosures.
Common or preferred stocks, exchange-traded funds and derivative instruments, if applicable, that are traded on a national securities exchange are valued at the last sale price as of the close of trading on the applicable exchange where the security principally trades. Securities traded via NASDAQ are valued at the NASDAQ official closing price. To the extent these securities are valued at the last sale price or NASDAQ official closing price, they are classified as Level 1 in the fair value hierarchy. In the event that no sale or official closing price on valuation date exists, these securities are generally valued at the mean between the last reported bid and ask prices, or at the last bid price in the absence of an ask price. These securities are classified as Level 2 in the fair value hierarchy.
Investments in open-end funds (other than exchange-traded funds) are valued at their net asset values as of the close of the NYSE on the date of valuation. These securities are classified as Level 1 in the fair value hierarchy since they may be purchased or sold at their net asset values on the date of valuation.
Securities and other assets that cannot be priced according to the methods described above are valued based on pricing methodologies approved by the Board. In the event that unobservable inputs are used when determining such valuations, the securities will be classified as Level 3 in the fair value hierarchy. Altering one or more unobservable inputs may result in a significant change to a Level 3 security’s fair value measurement.
When determining the fair value of securities, some of the factors influencing the valuation include: the nature of any restrictions on disposition of the securities; assessment of the general liquidity of the securities; the issuer’s financial condition and the markets in which it does business; the cost of the investment; the size of the holding and the capitalization of the issuer; the prices of any recent transactions or bids/offers for such securities or any comparable securities; any available analyst media or other reports or information deemed reliable by the Manager regarding the issuer or the markets or industry in which it operates. Using fair value to price securities may result in a value that is different from a security’s most recent closing price and from the price used by other unaffiliated mutual funds to calculate their net asset values.
PGIM QMA Strategic Alpha ETFs | 123 |
Notes to Financial Statements (continued)
Foreign Currency Translation: The books and records of the Funds are maintained in U.S. dollars. Foreign currency amounts are translated into U.S. dollars on the following basis:
(i) market value of investment securities, other assets and liabilities—at the current rates of exchange;
(ii) purchases and sales of investment securities, income and expenses—at the rates of exchange prevailing on the respective dates of such transactions.
Although the net assets of the Funds are presented at the foreign exchange rates and market values at the close of the period, the Funds do not generally isolate that portion of the results of operations arising as a result of changes in the foreign exchange rates from the fluctuations arising from changes in the market prices of long-term portfolio securities held at the end of the period. Similarly, the Funds do not isolate the effect of changes in foreign exchange rates from the fluctuations arising from changes in the market prices of long-term portfolio securities sold during the period. Accordingly, holding period realized foreign currency gains (losses) are included in the reported net realized gains (losses) on investment transactions.
Net realized gains (losses) on foreign currency transactions (where applicable) represent net foreign exchange gains (losses) from the disposition of holdings of foreign currencies, currency gains (losses) realized between the trade and settlement dates on forward currency transactions, and the difference between the amounts of interest, dividends and foreign withholding taxes recorded on each Fund’s books and the U.S. dollar equivalent amounts actually received or paid. Net unrealized currency gains (losses) from valuing foreign currency denominated assets and liabilities (other than investments) at period end exchange rates are reflected as a component of net unrealized appreciation (depreciation) on foreign currencies (where applicable).
Rights: The Funds hold rights acquired either through a direct purchase or pursuant to corporate actions. Rights entitle the holder to buy a proportionate amount of common stock, or such other security that the issuer may specify, at a specific price and time through the expiration dates. Such rights are held as long positions by the Funds until exercised, sold or expired. Rights are valued at fair value in accordance with the Board approved fair valuation procedures.
Master Netting Arrangements: The Trust, on behalf of the Funds, is subject to various Master Agreements, or netting arrangements, with select counterparties. These are agreements which a subadviser may have negotiated and entered into on behalf of all or a portion of the Fund. A master netting arrangement between a Fund and the counterparty permits the Fund to offset amounts payable by the Fund to the same counterparty against amounts to be received; and by the receipt of collateral from the counterparty by the Fund
| 124 |
to cover the Fund’s exposure to the counterparty. However, there is no assurance that such mitigating factors are easily enforceable. In addition to master netting arrangements, the right to set-off exists when all the conditions are met such that each of the parties owes the other determinable amounts, the reporting party has the right to set-off the amount owed with the amount owed by the other party, the reporting party intends to set-off and the right of set-off is enforceable by law.
Equity and Mortgage Real Estate Investment Trusts (collectively REITs): The Funds invested in REITs, which report information on the source of their distributions annually. Based on current and historical information, a portion of distributions received from REITs during the period is estimated to be dividend income, capital gain or return of capital and recorded accordingly. When material, these estimates are adjusted periodically when the actual source of distributions is disclosed by the REITs.
Securities Lending: The Funds lend their portfolio securities to banks and broker-dealers. The loans are secured by collateral at least equal to the market value of the securities loaned. Collateral pledged by each borrower is invested in an affiliated money market fund and is marked to market daily, based on the previous day’s market value, such that the value of the collateral exceeds the value of the loaned securities. In the event of significant appreciation in value of securities on loan on the last business day of the reporting period, the financial statements may reflect a collateral value that is less than the market value of the loaned securities. Such shortfall is remedied as described above. Loans are subject to termination at the option of the borrower or the Fund. Upon termination of the loan, the borrower will return to the Fund securities identical to the loaned securities. The remaining maturities of the securities lending transactions are considered overnight and continuous. Should the borrower of the securities fail financially, the Fund has the right to repurchase the securities in the open market using the collateral.
The Funds recognize income, net of any rebate and securities lending agent fees, for lending their securities in the form of fees or interest on the investment of any cash received as collateral. The borrower receives all interest and dividends from the securities loaned and such payments are passed back to the lender in amounts equivalent thereto, which are reflected in interest income or unaffiliated dividend income based upon the nature of the payment on the Statement of Operations. The Funds also continue to recognize any unrealized gain (loss) in the market price of the securities loaned and on the change in the value of the collateral invested that may occur during the term of the loan. In addition, realized gain (loss) is recognized on changes in the value of the collateral invested upon liquidation of the collateral. Net earnings from securities lending are disclosed in the Statement of Operations.
Securities Transactions and Net Investment Income: Securities transactions are recorded on the trade date. Realized gains (losses) from investment and currency transactions are calculated on the specific identification method. Dividend income is recorded on the ex-date, or for certain foreign securities, when a Fund becomes aware of such dividends. Interest income, including amortization of premium and accretion of discount on debt
PGIM QMA Strategic Alpha ETFs | 125 |
Notes to Financial Statements (continued)
securities, as required, is recorded on the accrual basis. Expenses are recorded on an accrual basis, which may require the use of certain estimates by management that may differ from actual.
Taxes: It is the Funds’ policy to continue to meet the requirements of the Internal Revenue Code applicable to regulated investment companies and to distribute all of their taxable net investment income and capital gains, if any, to its shareholders. Therefore, no federal income tax provision is required. Withholding taxes on foreign dividends, interest and capital gains, if any, are recorded, net of reclaimable amounts, at the time the related income is earned.
Dividends and Distributions: The Funds expect to pay dividends from net investment income quarterly. Distributions of net realized capital and currency gains, if any, are declared and paid at least annually. Dividends and distributions to shareholders, which are determined in accordance with federal income tax regulations and which may differ from generally accepted accounting principles, are recorded on the ex-date. Permanent GAAP/tax differences relating to income and gain (loss) are reclassified between total distributable earnings (loss) and paid-in capital in excess of par, as appropriate.
Estimates: The preparation of financial statements requires management to make estimates and assumptions that affect the reported amounts and disclosures in the financial statements. Actual results could differ from those estimates.
3. Agreements
Pursuant to a management agreement with the Trust on behalf of the Funds (the Management Agreement), PGIM Investments manages each Fund’s investment operations and administers its business affairs. PGIM Investments is also responsible for supervising each Fund’s subadviser.
Pursuant to the management agreement relating to each Fund, there is a unitary fee structure for the funds whereby PGIM Investments is responsible for substantially all expenses of each Fund, except taxes, brokerage expenses, interest expenses, distribution fees or expenses, expenses incident to shareholder meetings and extraordinary expenses. Each Fund may also pay for any costs or expenses of investing in other funds. For more information on the unitary management fee structure please refer to the Funds’ Statement of Additional Information.
The unitary fee paid to the Manager is accrued daily and payable monthly, at an annual rate of each Fund’s average daily net assets specified below. The Manager has contractually
| 126 |
agreed, beginning from each Fund’s inception date, to waive any management fees it receives from the Funds in an amount equal to the subadvisory fees paid by the Funds to the PGIM Institutional Money Market Fund due to the Funds’ investment of its excess overnight cash in the PGIM Institutional Money Market Fund. This waiver will remain in effect for as long as the Funds remain invested or intend to invest in the PGIM Institutional Money Market Fund.
Fund | Unitary fee rate | |
| PGIM QMA Strategic Alpha Large-Cap Core ETF | 0.17% | |
| PGIM QMA Strategic Alpha Small-Cap Growth ETF | 0.29% | |
| PGIM QMA Strategic Alpha Small-Cap Value ETF | 0.29% | |
| PGIM QMA Strategic Alpha International Equity ETF | 0.29% |
The Manager has entered into a subadvisory agreement (Subadvisory Agreement) with PGIM Quantitative Solutions LLC (formerly known as QMA LLC), (“PGIM Quantitative Solutions”) (the “subadviser”). The Manager pays for the services of the subadviser.
Brown Brothers Harriman & Co. (“BBH”) serves as the Custodian, Transfer Agent, Administrative Agent and Securities Lending Agent for the Trust. The Manager is responsible for compensating BBH under the Custodian and Administrative and Transfer Agency Agreements. As securities lending agent, BBH is responsible for marketing to approved borrowers available securities from the Funds’ portfolio. BBH receives as compensation for its services a portion of the amount earned by the Funds for lending securities.
In September 2021, BBH entered into an agreement with State Street Corporation (“State Street”) under which State Street will acquire BBH’s Investor Services business, which includes its custody, fund accounting and administration, transfer agency, depositary services, foreign exchange and securities lending services. The transaction is expected to be completed by the end of 2021, subject to customary closing conditions and regulatory approvals.
Prudential Investment Management Services LLC (“PIMS” or the “Distributor”), acts as the distributor of each Fund, pursuant to the terms of a distribution agreement (“Distribution Agreement”) between the Trust and the Distributor. The Distributor is a subsidiary of Prudential. Shares are continuously offered for sale by the Distributor only. Although the Distributor does not receive any fees under the Distribution Agreement, the Manager or its affiliates may pay the Distributor for certain distribution related services.
PGIM Investments, PGIM, Inc., PIMS and PGIM Quantitative Solutions are indirect, wholly-owned subsidiaries of Prudential Financial, Inc. (“Prudential”).
4. Other Transactions with Affiliates
Each Fund may invest its overnight sweep cash in the PGIM Core Ultra Short Bond Fund (the “Core Fund”), and its securities lending cash collateral in the PGIM Institutional Money Market Fund (the “Money Market Fund”), each a series of Prudential Investment Portfolios 2,
PGIM QMA Strategic Alpha ETFs | 127 |
Notes to Financial Statements (continued)
registered under the 1940 Act and managed by PGIM Investments. PGIM Investments and/or its affiliates are paid fees or reimbursed for providing their services to the Core Fund. In addition to the realized and unrealized gains on investments in the Core Fund and Money Market Fund, earnings from such investments are disclosed on the Statement of Operations as “Affiliated dividend income” and “Income from securities lending, net”, respectively.
The Funds may enter into certain securities purchase or sale transactions under Board approved Rule 17a-7 procedures. Rule 17a-7 is an exemptive rule under the 1940 Act, that subject to certain conditions, permits purchase and sale transactions among affiliated investment companies, or between an investment company and a person that is affiliated solely by reason of having a common (or affiliated) investment adviser, common directors, and/or common officers. For the period ended August 31, 2021, no 17a-7 transactions were entered into by the Funds.
5. Portfolio Securities
The aggregate cost of purchases and proceeds from sales of portfolio securities (excluding short- term investments, U.S. Government securities and in-kind transactions) for the reporting year ended August 31, 2021, were as follows:
Fund | Cost of Purchases | Proceeds from Sales | ||
| PGIM QMA Strategic Alpha Large-Cap Core ETF | $12,000,806 | $11,904,745 | ||
| PGIM QMA Strategic Alpha Small-Cap Growth ETF | $16,249,550 | $16,063,651 | ||
| PGIM QMA Strategic Alpha Small-Cap Value ETF | $12,888,329 | $12,810,108 | ||
| PGIM QMA Strategic Alpha International Equity ETF | $30,048,206 | $29,416,074 |
A summary of the cost of purchases and proceeds from sales of shares of affiliated mutual funds for the reporting year ended August 31, 2021, is presented as follows:
PGIM QMA Strategic Alpha Large-Cap Core ETF
Value Beginning | Cost of Purchases | Proceeds from Sales | Change in Unrealized Gain (Loss) | Realized Gain (Loss) | Value, End of Period | Shares, End of Period | Income | |||||||||||||||||||||
Short-Term Investments—Affiliated Mutual Fund: |
| |||||||||||||||||||||||||||
PGIM Institutional Money Market Fund(1)(wa) |
| |||||||||||||||||||||||||||
$834,998 | $ | 4,752,345 | $ | 5,587,283 | $ | 62 | $ | (122 | ) | $ | — | — | $ | 398 | (2) | |||||||||||||
| 128 |
PGIM QMA Strategic Alpha Small-Cap Growth ETF
Value Beginning of Period | Cost of Purchases | Proceeds from Sales | Change in Unrealized Gain (Loss) | Realized Gain (Loss) | Value, End of Period | Shares, End of Period | Income | |||||||||||||||||||||
Short-Term Investments—Affiliated Mutual Fund: |
| |||||||||||||||||||||||||||
PGIM Institutional Money Market Fund(1)(b)(wa) |
| |||||||||||||||||||||||||||
$908,543 | $ | 3,430,438 | $ | 4,099,450 | $ | (3 | ) | $ | (146 | ) | $ | 239,382 | 239,526 | $ | 628 | (2) | ||||||||||||
PGIM QMA Strategic Alpha Small-Cap Value ETF
Value Beginning | Cost of Purchases | Proceeds from Sales | Change in Unrealized Gain (Loss) | Realized Gain (Loss) | Value, End of Period | Shares, End of Period | Income | |||||||||||||||||||||
Short-Term Investments—Affiliated Mutual Fund: |
| |||||||||||||||||||||||||||
PGIM Institutional Money Market Fund(1)(b)(wa) |
| |||||||||||||||||||||||||||
$438,488 | $ | 1,830,187 | $ | 2,161,110 | $ | 5 | $ | (99 | ) | $ | 107,471 | 107,535 | $ | 350 | (2) | |||||||||||||
PGIM QMA Strategic Alpha International Equity ETF
Value Beginning | Cost of Purchases | Proceeds from Sales | Change in Unrealized Gain (Loss) | Realized Gain (Loss) | Value, End of Period | Shares, End of Period | Income | |||||||||||||||||||||
Short-Term Investments—Affiliated Mutual Fund: |
| |||||||||||||||||||||||||||
PGIM Institutional Money Market Fund(1)(b)(wa) |
| |||||||||||||||||||||||||||
$417,228 | $ | 3,664,454 | $ | 3,985,755 | $ | 41 | $ | (175 | ) | $ | 95,793 | 95,850 | $ | 397 | (2) | |||||||||||||
| (1) | The Fund did not have any capital gain distributions during the reporting period. |
| (2) | The amount, or a portion thereof, represents the affiliated securities lending income shown on the Statement of Operations. |
| (wa) | PGIM Investments LLC, the manager of the Fund, also serves as manager of the PGIM Core Ultra Short Bond Fund and PGIM Institutional Money Market Fund, if applicable. |
| (b) | Represents security purchased with cash collateral received for securities on loan and includes dividend reinvestment. |
6. Distributions and Tax Information
Distributions to shareholders, which are determined in accordance with federal income tax regulations and which may differ from GAAP, are recorded on the ex-date.
For the year ended August 31, 2021, the tax character of dividends paid as reflected in the Statement of Changes in Net Assets were as follows:
| Ordinary Income | Long-Term Capital Gains | |||||||
PGIM QMA Strategic Alpha Large-Cap Core ETF | $ | 158,974 | $ | — | ||||
PGIM QMA Strategic Alpha Small-Cap Growth ETF | 98,108 | — | ||||||
PGIM QMA Strategic Alpha Small-Cap Value ETF | 177,114 | — | ||||||
PGIM QMA Strategic Alpha International Equity ETF | 940,968 | — | ||||||
PGIM QMA Strategic Alpha ETFs | 129 |
Notes to Financial Statements (continued)
For the year ended August 31, 2020, the tax character of dividends paid as reflected in the Statement of Changes in Net Assets were as follows:
| Ordinary Income | Long-Term Capital Gains | |||||||
PGIM QMA Strategic Alpha Large-Cap Core ETF | $ | 208,630 | $ | — | ||||
PGIM QMA Strategic Alpha Small-Cap Growth ETF | 85,196 | — | ||||||
PGIM QMA Strategic Alpha Small-Cap Value ETF | 274,240 | 6,602 | ||||||
PGIM QMA Strategic Alpha International Equity ETF | 901,215 | — | ||||||
For the year ended August 31, 2021, the Funds had the following amounts of accumulated undistributed earnings on a tax basis:
| Undistributed Ordinary Income | Undistributed Long-Term Capital Gains | |||||||
PGIM QMA Strategic Alpha Large-Cap Core ETF | $ | 980,350 | $ | 531,361 | ||||
PGIM QMA Strategic Alpha Small-Cap Growth ETF | 1,756,035 | 855,787 | ||||||
PGIM QMA Strategic Alpha Small-Cap Value ETF | 1,165,470 | — | ||||||
PGIM QMA Strategic Alpha International Equity ETF | 2,657,520 | 104,342 | ||||||
The United States federal income tax basis of the Funds’ investments and the net unrealized appreciation as of August 31, 2021 were as follows:
| Tax Basis | Gross Unrealized Appreciation | Gross Unrealized Depreciation | Net Unrealized Appreciation (Depreciation) | |||||||||||||
PGIM QMA Strategic Alpha Large-Cap Core ETF(a) | $ | 11,694,237 | $ | 3,307,506 | $ | (93,934 | ) | $ | 3,213,572 | |||||||
PGIM QMA Strategic Alpha Small-Cap Growth ETF(a)(b) | 12,870,697 | 2,760,207 | (421,347 | ) | 2,338,860 | |||||||||||
PGIM QMA Strategic Alpha Small-Cap Value ETF(a)(b) | 11,304,017 | 2,369,771 | (195,939 | ) | 2,173,832 | |||||||||||
PGIM QMA Strategic Alpha International Equity ETF(a)(b) | 37,356,251 | 7,449,533 | (1,530,065 | ) | 5,919,468 | |||||||||||
| (a) | The difference between book basis and tax basis was primarily attributable to deferred losses on wash sales and other book to tax adjustments. |
| (b) | The difference between book basis and tax basis was primarily attributable to investments in passive foreign investment companies and other book to tax adjustments. |
| 130 |
The following Funds utilized its capital loss carryforward to offset net taxble gains realized in the fiscal year ended August 31, 2021.
| Capital Loss Carryforward Utilized | ||||
PGIM QMA Strategic Alpha Large-Cap Core ETF | $ | 702,000 | ||
PGIM QMA Strategic Alpha Small-Cap Growth ETF | 763,000 | |||
PGIM QMA Strategic Alpha Small-Cap Value ETF | 1,287,000 | |||
PGIM QMA Strategic Alpha International Equity ETF | 1,842,000 | |||
The Manager has analyzed the Funds’ tax positions taken on federal, state and local income tax returns for all open tax years and has concluded that no provision for income tax is required in the Funds’ financial statements for the current reporting period. Since tax authorities can examine previously filed tax returns, each Funds’ U.S. federal and state tax returns for each of the three fiscal years up to the most recent fiscal year ended August 31, 2021 are subject to such review.
7. Capital and Ownership
Each Fund is an exchange-traded fund, commonly known as an “ETF”. Individual shares of the Funds may only be purchased and sold in secondary market transactions through brokers or other financial intermediaries. Shares of the Funds are listed for trading on the NYSE Arca, Inc. (the “Exchange”), and because the shares of the Funds trade at market prices rather than NAV, shares of the Funds may trade at a price greater than NAV (a premium) or less than NAV (a discount). Each Fund will issue and redeem its shares at NAV only in aggregations of a specified number of shares called a “Creation Unit”. An Authorized Participant is a member or participant of a clearing agency registered with the SEC, which has a written agreement with the Funds or one of their service providers that allows the Authorized Participant to place orders for the purchase and redemption of Creation Units.
A creation transaction, which is subject to acceptance by the Distributor and each Fund, generally takes place when an Authorized Participant deposits into each Fund a designated portfolio of securities, assets or other positions (a “creation basket”, and an amount of cash (including any cash representing the value of substituted securities, assets or other positions), if any, which together approximate the holdings of each Fund in exchange for a specified number of Creation Units. Similarly, shares can be redeemed only in Creation Units, generally for a designated portfolio of securities, assets or other propositions (the “redemption basket”) held by each Fund and an amount of cash (including any portion of such securities for which cash may be substituted). The Funds may, in certain circumstances, offer Creation Units partially or solely for cash. Except when aggregated in Creation Units, shares are not redeemable by the Funds. Creation and redemption baskets may differ and the Funds may accept “custom baskets”. A Creation Unit of PGIM QMA Strategic Alpha Large-Cap Core ETF, PGIM QMA Strategic Alpha Small-Cap Growth ETF, PGIM QMA Strategic Alpha Small-Cap Value ETF and PGIM QMA Strategic Alpha International Equity ETF consists of 50,000 shares, 50,000 shares, 50,000 shares and 100,000 shares of the Fund, respectively.
PGIM QMA Strategic Alpha ETFs | 131 |
Notes to Financial Statements (continued)
Authorized Participants generally are required to pay a fixed creation transaction fee and/or a fixed redemption transaction fee, as applicable, for each transaction in a Creation Unit regardless of the number of Creation Units created or redeemed on that day. The Funds may adjust the transaction fee from time to time. An additional charge or a variable charge may be applied to certain creation and redemption transactions, including non-standard orders and whole or partial cash purchases or redemptions when deemed appropriate.
The Trust is authorized to issue an unlimited number of shares of beneficial interest, $0.001 par value per share.
As of August 31, 2021, Prudential, through its affiliated entities, including affiliated funds (if applicable), owned shares of the Funds as follows:
| Number of Shares | Percentage of Outstanding Shares | |||||||
PGIM QMA Strategic Alpha Large-Cap Core ETF | $ | 182,000 | 91.0 | % | ||||
PGIM QMA Strategic Alpha Small-Cap Growth ETF | 195,000 | 97.5 | % | |||||
PGIM QMA Strategic Alpha Small-Cap Value ETF | 190,000 | 95.0 | % | |||||
PGIM QMA Strategic Alpha International Equity ETF | 695,000 | 99.3 | % | |||||
At the reporting period end, the number of shareholders holding greater than 5% of the Funds are as follows:
| Affiliated | Unaffiliated | |||||||
Fund | Number of Shareholders | Percentage of Outstanding Shares | Number of Shareholders | Percentage of Outstanding Shares | ||||
PGIM QMA Strategic Alpha Large- Cap Core ETF | 1 | 91.0% | 1 | 5.5% | ||||
PGIM QMA Strategic Alpha Small- Cap Growth ETF | 1 | 97.5% | 0 | 0.0% | ||||
PGIM QMA Strategic Alpha Small- Cap Value ETF | 1 | 95.0% | 0 | 0.0% | ||||
PGIM QMA Strategic Alpha International Equity ETF | 3 | 99.3% | 0 | 0.0% | ||||
There were no transactions in shares of beneficial interest for the periods ended August 31, 2021 and August 31, 2020.
| 132 |
Each Fund may make payment for Fund shares redeemed and contributed wholly or in part by distributing portfolio securities to shareholders. For the period ended August 31, 2021, the Funds had no subscriptions in-kind and redemptions in-kind.
8. Borrowings
The Trust, on behalf of the Funds, along with other affiliated registered investment companies (the “Participating Funds”), is a party to a Syndicated Credit Agreement (“SCA”) with a group of banks. The purpose of the SCA is to provide an alternative source of temporary funding for capital share redemptions. The table below provides details of the current SCA in effect at the reporting period-end as well as the prior SCA.
Current SCA | Prior SCA | |||
Term of Commitment | 10/2/2020 – 9/30/2021 | 10/3/2019 – 10/1/2020 | ||
Total Commitment | $1,200,000,000 | $1,222,500,000* | ||
Annualized Commitment Fee on the Unused Portion of the SCA | 0.15% | 0.15% | ||
Annualized Interest Rate on Borrowings | 1.30% plus the higher of (1) the effective federal funds rate, (2) the one-month LIBOR rate or (3) zero percent | 1.20% plus the higher of (1) the effective federal funds rate, (2) the one-month LIBOR rate or (3) zero percent | ||
| * | Effective March 31, 2020, the SCA’s total commitment was increased from $900,000,000 to $1,162,500,000 and subsequently, effective April 7, 2020 was increased to $1,222,500,000. |
Subsequent to the reporting period end, the SCA has been renewed and effective October 1, 2021 will provide a commitment of $1,200,000,000 through September 29, 2022. The commitment fee paid by the Participating Funds will continue to be .15% of the unused portion of the SCA. The interest on borrowings under the renewed SCA will be paid monthly and at a per annum interest rate of 1.20% plus the higher of (1) the effective federal funds rate, (2) the one-month LIBOR rate or (3) zero percent.
Certain affiliated registered investment companies that are parties to the SCA include portfolios that are subject to a predetermined mathematical formula used to manage certain benefit guarantees offered under variable annuity contracts. The formula may result in large scale asset flows into and out of these portfolios. Consequently, these portfolios may be more likely to utilize the SCA for purposes of funding redemptions. It may be possible for those portfolios to fully exhaust the committed amount of the SCA, thereby requiring the Manager to allocate available funding per a Board-approved methodology designed to treat the Participating Funds in the SCA equitably.
The Funds did not utilize the SCA during the reporting period ended August 31, 2021.
PGIM QMA Strategic Alpha ETFs | 133 |
Notes to Financial Statements (continued)
9. Risks of Investing in the Funds
The Funds’ risks include, but are not limited to, some or all of the risks discussed below. For further information on each Fund’s risks, please refer to the Funds’ Prospectus and Statement of Additional Information.
Authorized Participant Concentration Risk: Only an Authorized Participant may engage in creation or redemption transactions directly with the Funds. The Funds have a limited number of intermediaries that act as Authorized Participants and none of these Authorized Participants is or will be obligated to engage in creation or redemption transactions. To the extent that these intermediaries exit the business or are unable to or choose not to proceed with creation and/ or redemption orders with respect to the Funds and no other Authorized Participant creates or redeems, shares of the Funds may trade at a substantial discount or premium to NAV, may trade at larger spreads and possibly face trading halts and/or delisting.
Currency Risk: A Fund’s net asset value could decline as a result of changes in exchange rates, which could adversely affect the Fund’s investments in currencies, or in securities that trade in, and receive revenues related to, currencies, or in derivatives that provide exposure to currencies. Certain foreign countries may impose restrictions on the ability of issuers of foreign securities to make payment of principal and interest or dividends to investors located outside the country, due to blockage of foreign currency exchanges or otherwise.
Economic and Market Events Risk: Events in the US and global financial markets, including actions taken by the US Federal Reserve or foreign central banks to stimulate or stabilize economic growth or the functioning of the securities markets, may at times result in unusually high market volatility, which could negatively impact performance. Relatively reduced liquidity in credit and fixed income markets could adversely affect issuers worldwide.
Equity and Equity-Related Securities Risks: The value of a particular security could go down and you could lose money. In addition to an individual security losing value, the value of the equity markets or a sector in which the Funds invest could go down. Different parts of a market can react differently to adverse issuer, market, regulatory, political and economic developments.
ETF Shares Trading Risk: Funds shares are listed for trading on the Exchange and the shares are bought and sold in the secondary market at market prices. The market prices of the shares of the Funds are expected to fluctuate in response to changes in the Funds’ NAVs, the intraday value of the Funds’ holdings and supply and demand for shares of the Funds. We cannot predict whether shares of the Funds will trade above, below or at their NAV. Trading on the Exchange, including trading of Funds shares, may be halted in certain circumstances and shareholders may not be able to sell Funds shares at the time or price desired. During periods of stressed market conditions, the market for the shares of the
| 134 |
Funds may become less liquid in response to deteriorating liquidity in the markets for the Funds’ portfolio investments. This adverse effect on the liquidity of the Funds’ shares could lead to differences between the market price of the Funds’ shares and the NAV of those shares. There can be no assurance that the requirements of the Exchange to maintain the listing of shares of the Funds will continue to be met. At times, trading in the securities of ETFs has become volatile and unpredictable and the price of ETFs shares has diverged from market driven fundamentals.
Disruptions to creations and redemptions, the existence of significant market volatility or potential lack of an active trading market for the shares of the Fund (including through a trading halt), as well as other factors, may result in the Fund’s shares trading on the Exchange significantly above (at a premium) or below (at a discount) to NAV or to the intraday value of the Fund’s holdings. Premiums and discounts relate to differences between the market price and NAV of the Fund’s shares. During such periods, you may incur significant losses if you sell your shares of the Fund.
The securities held by the Fund may be traded in markets that close at a different time than the Exchange and may trade outside of a collateralized settlement system. Liquidity in those securities may be reduced after the applicable closing times. Accordingly, during the time when the Exchange is open but after the applicable market closing, fixing or settlement times, bid-ask spreads for the Fund’s shares on the Exchange and the corresponding premium or discount between the market price for Fund shares and their NAV may widen. Additionally, during times when the Exchange is open but after the applicable market is closed, there may be changes between the last quote from the closed foreign market and the value of such security during the Fund’s trading day on the Exchange and this may lead to differences between the market price of the Fund’s shares and the underlying value of those shares.
Cost of Buying or Selling Shares. When you buy or sell shares of the Fund through a broker, you will likely incur a brokerage commission or other charges imposed by brokers. In addition, the market price of shares of the Fund, like the price of any exchange-traded security, includes a “bid-ask spread” charged by the market makers or other participants that trade the particular security. The spread of the Fund’s shares varies over time based on the Fund’s trading volume, the spread of the Fund’s underlying securities, and market liquidity and may increase if the Fund’s trading volume, the spread of the Fund’s underlying securities, or market liquidity decreases. In times of severe market disruption, including when trading of the Fund’s holdings may be halted, the bid-ask spread may increase significantly. This means that the shares may trade at a discount to the Fund’s NAV, and the discount is likely to be greatest during significant market volatility.
Foreign Securities Risk: Each Fund’s investments in securities of foreign issuers or issuers with significant exposure to foreign markets involve additional risk. The securities of such issuers may trade in markets that are less liquid, less regulated and more volatile than U.S. markets. Foreign countries in which the Funds may invest may have markets that are less liquid, less regulated and more volatile than U.S. markets. The value of the Fund’s
PGIM QMA Strategic Alpha ETFs | 135 |
Notes to Financial Statements (continued)
investments may decline because of factors affecting the particular issuer as well as foreign markets and issuers generally, such as unfavorable government actions, and political or financial instability. Lack of information may also affect the value of these securities.
Geographic Concentration Risk: Each Fund’s performance may be closely tied to the market, economic, political, regulatory or other conditions in the countries or regions in which the Fund invests. This can result in more pronounced risks based upon conditions that impact one or more countries or regions more or less than other countries or regions.
Growth Style Risk: The Funds’ growth style may subject the Funds to above-average fluctuations as a result of seeking higher than average capital growth. Historically, growth stocks have performed best during later stages of economic expansion and value stocks have performed best during periods of economic recovery. Since the Funds follow a growth investment style, there is the risk that the growth investment style may be out of favor for a period of time. At times when the style is out of favor, the Funds may underperform the market in general, its benchmark and other ETFs.
Large Capitalization Company Risk: Companies with large market capitalizations go in and out of favor based on market and economic conditions. Larger companies tend to be less volatile than companies with smaller market capitalizations. In exchange for this potentially lower risk, the Funds’ value may not rise or fall as much as the value of funds that emphasize companies with smaller market capitalizations.
Large Shareholder and Large Scale Redemption Risk: Certain individuals, accounts, funds (including funds affiliated with the Manager) or institutions, including the Manager and its affiliates, may from time to time own or control a substantial amount of the Funds’ shares. There is no requirement that these entities maintain their investment in the Funds. There is a risk that such large shareholders or that the Funds’ shareholders generally may redeem all or a substantial portion of their investments in the Funds in a short period of time, which could have a significant negative impact on the Funds’ NAV, liquidity, and brokerage costs. Large redemptions could also result in tax consequences to shareholders and impact the Funds’ ability to implement its investment strategy. The Funds’ ability to pursue its investment objective after one or more large scale redemptions may be impaired and, as a result, the Funds may invest a larger portion of its assets in cash or cash equivalents.
Management Risk: The value of your investment may decrease if judgments by the subadviser about the attractiveness, value or market trends affecting a particular security, industry or sector or about market movements are incorrect.
Market Capitalization Risk: The Funds may invest in companies of any market capitalization. Generally, the stock prices of small- and mid-cap companies are less stable
| 136 |
than the prices of large-cap stocks and may present greater risks. Large capitalization companies as a group could fall out of favor with the market, causing the Funds to underperform compared to investments that focus on smaller capitalized companies.
Market Disruption and Geopolitical Risks: International wars or conflicts and geopolitical developments in foreign countries, along with instability in regions such as Asia, Eastern Europe, and the Middle East, possible terrorist attacks in the United States or around the world, public health epidemics such as the outbreak of infectious diseases like the recent outbreak of coronavirus globally or the 2014–2016 outbreak in West Africa of the Ebola virus, and other similar events could adversely affect the U.S. and foreign financial markets, including increases in market volatility, reduced liquidity in the securities markets and government intervention, and may cause further long-term economic uncertainties in the United States and worldwide generally.
The coronavirus pandemic and the related governmental and public responses have had and may continue to have an impact on the Funds’ investments and net asset value and have led and may continue to lead to increased market volatility and the potential for illiquidity in certain classes of securities and sectors of the market. Preventative or protective actions that governments may take in respect of pandemic or epidemic diseases may result in periods of business disruption, business closures, inability to obtain raw materials, supplies and component parts, and reduced or disrupted operations for the issuers in which the Funds invest. Government intervention in markets may impact interest rates, market volatility and security pricing. The occurrence, reoccurrence and pendency of such diseases could adversely affect the economies (including through changes in business activity and increased unemployment) and financial markets either in specific countries or worldwide.
Market Risk: Securities markets may be volatile and the market prices of the Funds’ securities may decline. Securities fluctuate in price based on changes in an issuer’s financial condition and overall market and economic conditions. If the market prices of the securities owned by the Funds fall, the value of your investment in the Funds will decline.
Model Design and Implementation Risk: The design of the subadviser’s underlying models may be flawed or incomplete. These models are based on historical and theoretical underpinnings that the subadviser believes are sound, but there is no guarantee that these underpinnings will correlate with security price behavior in the manner assumed by the models or that the quantitative techniques that underlie the subadviser’s portfolio construction processes will fully anticipate important risks. In addition, it is impossible to eliminate completely the risk of error in the implementation of the models that guide the subadviser’s quantitative investment processes, and it may be difficult to implement model recommendations in volatile and rapidly changing market conditions.
No Guarantee of Active Trading Market Risk: While shares of the Funds are listed on the Exchange, there can be no assurance that active trading markets for the shares will develop or be maintained by market makers or by Authorized Participants. The distributor of the Funds’ shares does not maintain a secondary market in the shares.
PGIM QMA Strategic Alpha ETFs | 137 |
Notes to Financial Statements (continued)
Real Estate Investment Trust (REIT) Risk: Investing in REITs involves certain unique risks in addition to those risks associated with investing in the real estate industry in general. Equity REITs may be affected by changes in the value of the underlying property owned by the REITs, while mortgage REITs may be affected by the quality of any credit extended. REITs are dependent upon management skills, may not be diversified geographically or by property/mortgage asset type, and are subject to heavy cash flow dependency, default by borrowers and self-liquidation. REITs may be more volatile and/or more illiquid than other types of equity securities. REITs (especially mortgage REITs) are subject to interest rate risks. REITs may incur significant amounts of leverage. Each Fund will indirectly bear a portion of the expenses, including management fees, paid by each REIT in which it invests, in addition to the expenses of the Fund.
REITs must also meet certain requirements under the Internal Revenue Code of 1986, as amended (the Code) to avoid entity level tax and be eligible to pass-through certain tax attributes of their income to shareholders. REITs are consequently subject to the risk of failing to meet these requirements for favorable tax treatment and of failing to maintain their exemptions from registration under the Investment Company Act of 1940. REITs are subject to the risks of changes in the Code affecting their tax status.
Because the Funds invest in real estate securities, including REITs, the Funds are subjects to the risks of investing in the real estate industry, such as changes in general and local economic conditions, the supply and demand for real estate and changes in zoning and tax laws. Since the Funds concentrate in the real estate industry, their holdings can vary significantly from broad market indexes. As a result, the Funds’ performance can deviate from the performance of such indexes. Because the Funds invest in stocks, there is the risk that the price of a particular stock owned by the Funds could go down or pay lower-than-expected or no dividends. In addition to an individual stock losing value, the value of the equity markets or of companies comprising the real estate industry could go down.
Value Style Risk. Since the Funds follow a value investment style, there is the risk that the value style may be out of favor for long periods of time, that the market will not recognize a security’s intrinsic value for a long time or at all, or that a stock judged to be undervalued may actually be appropriately priced or overvalued. Issuers of value stocks may have experienced adverse business developments or may be subject to special risks that have caused the stock to be out of favor. In addition, the Funds’ value investment style may go out of favor with investors, negatively affecting the Funds’ performance. If the Funds’ assessment of market conditions or a company’s value is inaccurate, the Funds could suffer losses or produce poor performance relative to other funds.
| 138 |
10. Recent Regulatory Developments
On December 3, 2020, the SEC announced that it voted to adopt a new rule that establishes an updated regulatory framework for fund valuation practices (the “Rule”). The Rule, in part, provides (i) a framework for determining fair value in good faith and (ii) provides for a fund Board’s assignment of its responsibility for the execution of valuation-related activities to a fund’s investment adviser. Further, the SEC is rescinding previously issued guidance on related issues. The Rule took effect on March 8, 2021, with a compliance date of September 8, 2022. Management is currently evaluating the Rule and its impact to the Funds.
11. Subsequent Events
On September 15, 2021 the Board of Trustees of PGIM ETF Trust approved a proposal to liquidate all of the outstanding shares of the PGIM QMA Strategic Alpha Large-Cap Core ETF, PGIM QMA Strategic Alpha Small-Cap Growth ETF and PGIM QMA Strategic Alpha Small-Cap Value ETF. The liquidation distribution was paid on October 12, 2021. Upon completion of the distributions the Funds liquidated.
Effective December 29, 2021, PGIM QMA Strategic Alpha International Equity ETF’s name will change to PGIM Quant Solutions Strategic Alpha International Equity ETF.
PGIM QMA Strategic Alpha ETFs | 139 |
Report of Independent Registered Public Accounting Firm
To the Board of Trustees of PGIM ETF Trust and Shareholders of PGIM QMA Strategic Alpha International Equity ETF, PGIM QMA Strategic Alpha Large-Cap Core ETF, PGIM QMA Strategic Alpha Small-Cap Growth ETF and PGIM QMA Strategic Alpha Small-Cap Value ETF
Opinions on the Financial Statements
We have audited the accompanying statements of assets and liabilities, including the schedules of investments, of PGIM QMA Strategic Alpha International Equity ETF, PGIM QMA Strategic Alpha Large-Cap Core ETF, PGIM QMA Strategic Alpha Small-Cap Growth ETF and PGIM QMA Strategic Alpha Small-Cap Value ETF (four of the funds constituting PGIM ETF Trust, hereafter collectively referred to as the “Funds”) as of August 31, 2021, and the related statements of operations and changes in net assets, including the related notes, and the financial highlights for the year then ended (collectively referred to as the “financial statements”). In our opinion, the financial statements present fairly, in all material respects, the financial position of each of the Funds as of August 31, 2021, and the results of each of their operations, changes in each of their net assets, and each of the financial highlights for the year then ended in conformity with accounting principles generally accepted in the United States of America.
The financial statements of the Funds as of and for the year or period ended August 31, 2020 and the financial highlights for each of the periods ended on or prior to August 31, 2020 (not presented herein, other than the statements of changes in net assets and the financial highlights) were audited by other auditors whose report dated October 15, 2020 expressed an unqualified opinion on those financial statements and financial highlights.
Basis for Opinions
These financial statements are the responsibility of the Funds’ management. Our responsibility is to express an opinion on the Funds’ financial statements based on our audits. We are a public accounting firm registered with the Public Company Accounting Oversight Board (United States) (PCAOB) and are required to be independent with respect to the Funds in accordance with the U.S. federal securities laws and the applicable rules and regulations of the Securities and Exchange Commission and the PCAOB.
We conducted our audits of these financial statements in accordance with the standards of the PCAOB. Those standards require that we plan and perform the audit to obtain reasonable assurance about whether the financial statements are free of material misstatement, whether due to error or fraud.
Our audits included performing procedures to assess the risks of material misstatement of the financial statements, whether due to error or fraud, and performing procedures that respond to those risks. Such procedures included examining, on a test basis, evidence regarding the amounts and disclosures in the financial statements. Our audits also included evaluating the accounting principles used and significant estimates made by management, as well as evaluating the overall presentation of the financial statements. Our procedures included confirmation of securities owned as of August 31, 2021 by correspondence with the custodian and transfer agent. We believe that our audits provide a reasonable basis for our opinions.
/s/PricewaterhouseCoopers LLP
New York, New York
October 19, 2021
We have served as the auditor of one or more investment companies in the PGIM Retail Funds complex since 2020.
| 140 |
Fund Liquidity Risk Management Program (unaudited)
Consistent with Rule 22e-4 under the 1940 Act (the “Liquidity Rule”), each Fund has adopted and implemented a liquidity risk management program (the “LRMP”). Each Fund’s LRMP seeks to assess and manage each Fund’s liquidity risk, which is defined as the risk that each Fund is unable to meet investor redemption requests without significantly diluting the remaining investors’ interests in each Fund. The Trust’s Board of Trustees (the “Board”) has approved PGIM Investments LLC (“PGIM Investments”), each Fund’s investment manager, to serve as the administrator of each Fund’s LRMP. As part of its responsibilities as administrator, PGIM Investments has retained a third party to perform certain functions, including providing market data and liquidity classification model information.
Each Fund’s LRMP includes a number of processes designed to support the assessment and management of its liquidity risk. In particular, each Fund’s LRMP includes no less than annual assessments of factors that influence each Fund’s liquidity risk; no less than monthly classifications of each Fund’s investments into one of four liquidity classifications provided for in the Liquidity Rule; a 15% of net assets limit on the acquisition of “illiquid investments” (as defined under the Liquidity Rule); establishment of a minimum percentage of each Fund’s assets to be invested in investments classified as “highly liquid” (as defined under the Liquidity Rule) if each Fund does not invest primarily in highly liquid investments; and regular reporting to the Board.
At a meeting of the Board on March 2-5, 2021, PGIM Investments provided a written report (“LRMP Report”) to the Board addressing the operation, adequacy, and effectiveness of each Fund’s LRMP, including any material changes to the LRMP for the period from January 1, 2020 through December 31, 2020 (“Reporting Period”). The LRMP Report concluded that each Fund’s LRMP was reasonably designed to assess and manage each Fund’s liquidity risk and was adequately and effectively implemented during the Reporting Period. There were no material changes to the LRMP during the Reporting Period. The LRMP Report further concluded that each Fund’s investment strategies continue to be appropriate given each Fund’s status as an open-end fund.
There can be no assurance that the LRMP will achieve its objectives in the future. Additional information regarding risks of investing in each Fund including liquidity risks presented by each Fund’s investment portfolio, is found in each Fund’s Prospectus and Statement of Additional Information.
PGIM QMA Strategic Alpha ETFs | 141 |
Tax Information (unaudited)
For the year ended August 31, 2021, the Funds report the maximum amount allowable under section 854 of the Internal Revenue Code, but not less than, the following percentages of the ordinary income dividends paid as 1) qualified dividend income (QDI);and 2) eligible for corporate dividends received deduction (DRD):
| QDI | DRD | |||||||
PGIM QMA Strategic Alpha Large-Cap Core ETF | 40.44% | 37.89% | ||||||
PGIM QMA Strategic Alpha Small-Cap Growth ETF | 34.82% | 34.12% | ||||||
PGIM QMA Strategic Alpha Small-Cap Value ETF | 27.66% | 27.41% | ||||||
PGIM QMA Strategic Alpha International Equity ETF | 30.24% | — | ||||||
For the year ended August 31, 2021, the PGIM QMA Strategic Alpha International Equity ETF made an election to pass through the maximum amount of the portion of the ordinary income dividends paid derived from foreign source income as well as any foreign taxes paid by the Fund in accordance with Section 853 of the Internal Revenue Code of the following amounts: $104,976 foreign tax credit from recognized foreign source income of $1,224,591.
In January 2022, you will be advised on IRS Form 1099-DIV or substitute 1099-DIV, as to the federal tax status of dividends received by you in calendar year 2021.
| 142 |
INFORMATION ABOUT BOARD MEMBERS AND OFFICERS (unaudited)
Information about Board Members and Officers of the Funds is set forth below. Board Members who are not deemed to be “interested persons” of the Funds, as defined in the 1940 Act, are referred to as “Independent Board Members.” Board Members who are deemed to be “interested persons” of the Funds are referred to as “Interested Board Members.” The Board Members are responsible for the overall supervision of the operations of the Funds and perform the various duties imposed on the directors of investment companies by the 1940 Act. The Board in turn elects the Officers, who are responsible for administering the day-to-day operations of the Funds.
| Independent Board Members | ||||||
Name Year of Birth Position(s) Portfolios Overseen | Principal Occupation(s) During Past Five Years | Other Directorships Held During Past Five Years | Length of Board Service | |||
Ellen S. Alberding 1958 Board Member Portfolios Overseen: 98 | President and Board Member, The Joyce Foundation (charitable foundation) (since 2002); formerly Vice Chair, City Colleges of Chicago (community college system) (2011-2015); Trustee, National Park Foundation (charitable foundation for national park system) (2009-2018); Trustee, Economic Club of Chicago (2009-2016); Trustee, Loyola University (since 2018). | None. | Since September 2013 | |||
Kevin J. Bannon 1952 Board Member Portfolios Overseen: 98 | Retired; formerly Managing Director (April 2008-May 2015) and Chief Investment Officer (October 2008-November 2013) of Highmount Capital LLC (registered investment adviser); formerly Executive Vice President and Chief Investment Officer (April 1993-August 2007) of Bank of New York Company; President (May 2003-May 2007) of BNY Hamilton Family of Mutual Funds. | Director of Urstadt Biddle Properties (equity real estate investment trust) (since September 2008). | Since July 2008 | |||
PGIM QMA Strategic Alpha ETFs
| Independent Board Members | ||||||
Name Year of Birth Position(s) Portfolios Overseen | Principal Occupation(s) During Past Five Years | Other Directorships Held During Past Five Years | Length of Board Service | |||
Linda W. Bynoe 1952 Board Member Portfolios Overseen: 95 | President and Chief Executive Officer (since March 1995) and formerly Chief Operating Officer (December 1989-February 1995) of Telemat Limited LLC (formerly Telemat Ltd) (management consulting); formerly Vice President (January 1985-June 1989) at Morgan Stanley & Co. (broker-dealer). | Trustee of Equity Residential (residential real estate) (since December 2009); Director of Northern Trust Corporation (financial services) (since April 2006); formerly Director of Anixter International, Inc. (communication products distributor) (January 2006-June 2020). | Since March 2005 | |||
Barry H. Evans 1960 Board Member Portfolios Overseen: 97 | Retired; formerly President (2005-2016), Global Chief Operating Officer (2014-2016), Chief Investment Officer - Global Head of Fixed Income (1998-2014), and various portfolio manager roles (1986-2006), Manulife Asset Management (asset management). | Formerly Director, Manulife Trust Company (2011-2018); formerly Director, Manulife Asset Management Limited (2015-2017); formerly Chairman of the Board of Directors of Manulife Asset Management U.S. (2005-2016); formerly Chairman of the Board, Declaration Investment Management and Research (2008-2016). | Since September 2017 | |||
Keith F. Hartstein 1956 Board Member & Independent Chair Portfolios Overseen: 98 | Retired; Executive Committee of the Independent Directors Council (IDC) Board of Governors (since October 2019); Member (since November 2014) of the Governing Council of the IDC (organization of independent mutual fund directors); formerly President and Chief Executive Officer (2005-2012), Senior Vice President (2004-2005), Senior Vice President of Sales and Marketing (1997-2004), and various executive management positions (1990-1997), John Hancock Funds, LLC (asset management); Chairman, Investment Company Institute’s Sales Force Marketing Committee (2003-2008). | None. | Since September 2013 | |||
Visit our website at pgim.com/investments
| Independent Board Members | ||||||
Name Year of Birth Position(s) Portfolios Overseen | Principal Occupation(s) During Past Five Years | Other Directorships Held During Past Five Years | Length of Board Service | |||
Laurie Simon Hodrick 1962 Board Member Portfolios Overseen: 94 | A. Barton Hepburn Professor Emerita of Economics in the Faculty of Business, Columbia Business School (since 2018); Visiting Fellow at the Hoover Institution, Stanford University (since 2015); Sole Member, ReidCourt LLC (since 2008) (a consulting firm); formerly Visiting Professor of Law, Stanford Law School (2015-2021); formerly A. Barton Hepburn Professor of Economics in the Faculty of Business, Columbia Business School (1996-2017); formerly Managing Director, Global Head of Alternative Investment Strategies, Deutsche Bank (2006-2008). | Independent Director, Roku (since December 2020) (communication services); formerly Independent Director, Synnex Corporation (2019-2021) (information technology); formerly Independent Director, Kabbage, Inc. (2018-2020) (financial services); formerly Independent Director, Corporate Capital Trust (2017-2018) (a business development company). | Since September 2017 | |||
Brian K. Reid 1961 Board Member Portfolios Overseen: 97 | Retired; formerly Chief Economist for the Investment Company Institute (ICI) (2005-2017); formerly Senior Economist and Director of Industry and Financial Analysis at the ICI (1998-2004); formerly Senior Economist, Industry and Financial Analysis at the ICI (1996-1998); formerly Staff Economist at the Federal Reserve Board (1989-1996); Director, ICI Mutual Insurance Company (2012-2017). | None. | Since March 2018 | |||
PGIM QMA Strategic Alpha ETFs
| Independent Board Members | ||||||
Name Year of Birth Position(s) Portfolios Overseen | Principal Occupation(s) During Past Five Years | Other Directorships Held During Past Five Years | Length of Board Service | |||
Grace C. Torres 1959 Board Member Portfolios Overseen: 97 | Retired; formerly Treasurer and Principal Financial and Accounting Officer of the PGIM Funds, Target Funds, Advanced Series Trust, Prudential Variable Contract Accounts and The Prudential Series Fund (1998-June 2014); Assistant Treasurer (March 1999-June 2014) and Senior Vice President (September 1999-June 2014) of PGIM Investments LLC; Assistant Treasurer (May 2003-June 2014) and Vice President (June 2005-June 2014) of AST Investment Services, Inc.; Senior Vice President and Assistant Treasurer (May 2003-June 2014) of Prudential Annuities Advisory Services, Inc. | Director (since January 2018) of OceanFirst Financial Corp. and OceanFirst Bank; formerly Director (July 2015-January 2018) of Sun Bancorp, Inc. N.A. and Sun National Bank. | Since November 2014 | |||
| Interested Board Members | ||||||
Name Year of Birth Position(s) Portfolios Overseen | Principal Occupation(s) During Past Five Years | Other Directorships Held During Past Five Years | Length of Board Service | |||
Stuart S. Parker 1962 Board Member & President Portfolios Overseen: 97 | President, Chief Executive Officer, Chief Operating Officer and Officer in Charge of PGIM Investments LLC (formerly known as Prudential Investments LLC) (since January 2012); formerly Executive Vice President of Jennison Associates LLC and Head of Retail Distribution of PGIM Investments LLC (June 2005-December 2011); Investment Company Institute - Board of Governors (since May 2012). | None. | Since January 2012 | |||
Visit our website at pgim.com/investments
| Interested Board Members | ||||||
Name Year of Birth Position(s) Portfolios Overseen | Principal Occupation(s) During Past Five Years | Other Directorships Held During Past Five Years | Length of Board Service | |||
Scott E. Benjamin 1973 Board Member & Vice President Portfolios Overseen: 98 | Executive Vice President (since May 2009) of PGIM Investments LLC; Vice President (since June 2012) of Prudential Investment Management Services LLC; Executive Vice President (since September 2009) of AST Investment Services, Inc.; Senior Vice President of Product Development and Marketing, PGIM Investments (since February 2006); formerly Vice President of Product Development and Product Management, PGIM Investments LLC (2003-2006). | None. | Since March 2010 | |||
| Fund Officers(a) | ||||
Name Year of Birth Fund Position | Principal Occupation(s) During Past Five Years | Length of Service as Fund Officer | ||
Claudia DiGiacomo 1974 Chief Legal Officer | Chief Legal Officer, Executive Vice President and Secretary of PGIM Investments LLC (since August 2020); Chief Legal Officer of Prudential Mutual Fund Services LLC (since August 2020); Chief Legal Officer of PIFM Holdco, LLC (since August 2020); Vice President and Corporate Counsel (since January 2005) of Prudential; and Corporate Counsel of AST Investment Services, Inc. (since August 2020); formerly Vice President and Assistant Secretary of PGIM Investments LLC (2005-2020); formerly Associate at Sidley Austin Brown & Wood LLP (1999-2004). | Since December 2005 | ||
Dino Capasso 1974 Chief Compliance Officer | Chief Compliance Officer (July 2019-present) of PGIM Investments LLC; Chief Compliance Officer (July 2019-present) of the PGIM Funds, Target Funds, Advanced Series Trust, The Prudential Series Fund, Prudential’s Gibraltar Fund, Inc., PGIM Global High Yield Fund, Inc., PGIM High Yield Bond Fund, Inc., and PGIM Short Duration High Yield Opportunities Fund; Vice President and Deputy Chief Compliance Officer (June 2017-2019) of PGIM Investments LLC; formerly Senior Vice President and Senior Counsel (January 2016-June 2017), and Vice President and Counsel (February 2012-December 2015) of Pacific Investment Management Company LLC. | Since July 2019 | ||
PGIM QMA Strategic Alpha ETFs
| Fund Officers(a) | ||||
Name Year of Birth Fund Position | Principal Occupation(s) During Past Five Years | Length of Service as Fund Officer | ||
Andrew R. French 1962 Secretary | Vice President (since December 2018 - present) of PGIM Investments LLC; formerly Vice President and Corporate Counsel (2010-2018) of Prudential; formerly Director and Corporate Counsel (2006-2010) of Prudential; Vice President and Assistant Secretary (since January 2007) of PGIM Investments LLC; Vice President and Assistant Secretary (since January 2007) of Prudential Mutual Fund Services LLC. | Since October 2006 | ||
Diana N. Huffman 1982 Assistant Secretary | Vice President and Corporate Counsel (since September 2015) of Prudential; Vice President and Assistant Secretary (since August 2020) of PGIM Investments LLC; formerly Associate at Willkie Farr & Gallagher LLP (2009-2015). | Since March 2019 | ||
Melissa Gonzalez 1980 Assistant Secretary | Vice President and Corporate Counsel (since September 2018) of Prudential; Vice President and Assistant Secretary (since August 2020) of PGIM Investments LLC; formerly Director and Corporate Counsel (March 2014-September 2018) of Prudential. | Since March 2020 | ||
Patrick E. McGuinness 1986 Assistant Secretary | Vice President and Assistant Secretary (since August 2020) of PGIM Investments LLC; Director and Corporate Counsel (since February 2017) of Prudential; and Corporate Counsel (2012-2017) of IIL, Inc. | Since June 2020 | ||
Debra Rubano 1975 Assistant Secretary | Vice President and Corporate Counsel (since November 2020) of Prudential; formerly Director and Senior Counsel of Allianz Global Investors U.S. Holdings LLC (2010-2020) and Assistant Secretary of numerous funds in the Allianz fund complex (2015-2020). | Since December 2020 | ||
Christian J. Kelly 1975 Treasurer and Principal Financial and Accounting Officer | Vice President, Head of Fund Administration of PGIM Investments LLC (since November 2018); formerly Director of Fund Administration of Lord Abbett & Co. LLC (2009-2018), Treasurer and Principal Accounting Officer of the Lord Abbett Family of Funds (2017-2018); Director of Accounting, Avenue Capital Group (2008-2009); Senior Manager, Investment Management Practice of Deloitte & Touche LLP (1998-2007). | Since January 2019 | ||
Lana Lomuti 1967 Assistant Treasurer | Vice President (since 2007) and Director (2005-2007), within PGIM Investments Fund Administration; formerly Assistant Treasurer (December 2007-February 2014) of The Greater China Fund, Inc. | Since April 2014 | ||
Russ Shupak 1973 Assistant Treasurer | Vice President (since 2017) and Director (2013-2017), within PGIM Investments Fund Administration. | Since September 2019 | ||
Deborah Conway 1969 Assistant Treasurer | Vice President (since 2017) and Director (2007-2017), within PGIM Investments Fund Administration. | Since September 2019 | ||
Visit our website at pgim.com/investments
| Fund Officers(a) | ||||
Name Year of Birth Fund Position | Principal Occupation(s) During Past Five Years | Length of Service as Fund Officer | ||
Elyse M. McLaughlin 1974 Assistant Treasurer | Vice President (since 2017) and Director (2011-2017), within PGIM Investments Fund Administration. | Since September 2019 | ||
Dana E. Cordes 1978 Anti-Money Laundering Compliance Officer | Vice President, Corporate Compliance (since June 2021) of Prudential; formerly, Director Global Financial Crimes Unit (December 2015 to June 2021) of Prudential; formerly, Director, Operational Risk Management for Prudential Real Estate Investors (January 2010 to December 2015). | Since September 2021 | ||
(a) Excludes Mr. Parker and Mr. Benjamin, interested Board Members who also serve as President and Vice President, respectively.
Explanatory Notes to Tables:
| ∎ | Board Members are deemed to be “Interested,” as defined in the 1940 Act, by reason of their affiliation with PGIM Investments LLC and/or an affiliate of PGIM Investments LLC. |
| ∎ | Unless otherwise noted, the address of all Board Members and Officers is c/o PGIM Investments LLC, 655 Broad Street, Newark, New Jersey 07102-4410. |
| ∎ | There is no set term of office for Board Members or Officers. The Board Members have adopted a retirement policy, which calls for the retirement of Board Members on December 31 of the year in which they reach the age of 75. |
| ∎ | “Other Directorships Held” includes all directorships of companies required to register or file reports with the SEC under the 1934 Act (that is, “public companies”) or other investment companies registered under the 1940 Act. |
| ∎ | “Portfolios Overseen” includes all investment companies managed by PGIM Investments LLC. The investment companies for which PGIM Investments LLC serves as manager include the PGIM Funds, Target Funds, The Prudential Variable Contract Accounts, PGIM ETF Trust, PGIM High Yield Bond Fund, Inc., PGIM Global High Yield Fund, Inc., PGIM Short Duration High Yield Opportunities Fund, The Prudential Series Fund, Prudential’s Gibraltar Fund, Inc. and the Advanced Series Trust. |
| ∎ | As used in the Fund Officers table “Prudential” means The Prudential Insurance Company of America. |
PGIM QMA Strategic Alpha ETFs
Approval of Advisory Agreements (unaudited)
The Funds’ Board of Trustees
The Board of Trustees (the “Board”) of PGIM QMA Strategic Alpha Large-Cap Core ETF, PGIM QMA Strategic Alpha Small-Cap Growth ETF, PGIM QMA Strategic Alpha Small-Cap Value ETF and PGIM QMA Strategic Alpha International Equity ETF (each a “Fund” and collectively the “Funds”)1 consists of ten individuals, eight of whom are not “interested persons” of the Funds, as defined in the Investment Company Act of 1940, as amended (the “1940 Act”) (the “Independent Trustees”). The Board is responsible for the oversight of each Fund and its operations, and performs the various duties imposed on the Trustees of investment companies by the 1940 Act. The Independent Trustees have retained independent legal counsel to assist them in connection with their duties. The Chair of the Board is an Independent Director. The Board has established four standing committees: the Audit Committee, the Nominating and Governance Committee, and two Investment Committees. Each committee is chaired by, and composed of, Independent Trustees.
Annual Approval of the Funds’ Advisory Agreements
As required under the 1940 Act, the Board determines annually whether to renew each Fund’s management agreement with PGIM Investments LLC (“PGIM Investments”) and each Fund’s subadvisory agreement with PGIM Quantitative Solutions LLC. In considering the renewal of the agreements, the Board, including all of the Independent Trustees, met on June 7-10, 2021 and approved the renewal of the agreements through July 31, 2022, after concluding that the renewal of the agreements was in the best interests of each Fund and its shareholders.
In advance of the meetings, the Board requested and received materials relating to the agreements, and had the opportunity to ask questions and request further information in connection with its consideration. Among other things, the Board considered comparative fee information from PGIM Investments and PGIM Quantitative Solutions. Also, the Board considered comparisons with other mutual funds in relevant Peer Universes and Peer Groups, as is further discussed below.
In approving the agreements, the Board, including the Independent Trustees advised by independent legal counsel, considered the factors it deemed relevant, including the nature, quality and extent of services provided by PGIM Investments, the subadviser and, as relevant, its affiliates, the performance of each Fund, the profitability of PGIM Investments and its affiliates, expenses and fees, and the potential for economies of scale that may be shared with each Fund and its shareholders as each Fund’s assets grow. In their deliberations, the Trustees did not identify any single factor which alone was responsible for the Board’s decision to approve the agreements with respect to each Fund. In connection with its deliberations, the Board considered information provided by PGIM Investments throughout the year at regular Board meetings, presentations from portfolio managers and other information, as well as information furnished at or in advance of the meetings on June 7-10, 2021.
| 1 | Each of the Funds is a series of PGIM ETF Trust. |
PGIM QMA Strategic Alpha ETFs |
Approval of Advisory Agreements (continued)
The Trustees determined that the overall arrangements between each Fund and PGIM Investments, which serves as each Fund’s investment manager pursuant to a management agreement, and between PGIM Investments and PGIM Quantitative Solutions, which serves as each Fund’s subadviser pursuant to the terms of a subadvisory agreement with PGIM Investments, are in the best interests of each Fund and its shareholders in light of the services performed, fees charged and such other matters as the Trustees considered relevant in the exercise of their business judgment.
The material factors and conclusions that formed the basis for the Trustees’ reaching their determinations to approve the continuance of the agreements are separately discussed below.
Nature, Quality and Extent of Services
The Board received and considered information regarding the nature, quality and extent of services provided to each Fund by PGIM Investments and, PGIM Quantitative Solutions. The Board noted that PGIM Quantitative Solutions is affiliated with PGIM Investments. The Board considered the services provided by PGIM Investments, including but not limited to the oversight of the subadviser for each Fund, as well as the provision of fund recordkeeping, compliance and other services to each Fund, and PGIM Investments’ role as administrator of the Funds’ liquidity risk management program. With respect to PGIM Investments’ oversight of the subadviser, the Board noted that PGIM Investments’ Strategic Investment Research Group (“SIRG”), which is a business unit of PGIM Investments, is responsible for monitoring and reporting to PGIM Investments’ senior management on the performance and operations of the subadviser. The Board also considered that PGIM Investments pays the salaries of all of the officers and interested Trustees of each Fund who are part of Fund management. The Board also considered the investment subadvisory services provided by PGIM Quantitative Solutions, including investment research and security selection, as well as adherence to each Fund’s investment restrictions and compliance with applicable Fund policies and procedures. The Board considered PGIM Investments’ evaluation of the subadviser, as well as PGIM Investments’ recommendation, based on its review of the subadviser, to renew the subadvisory agreement.
The Board considered the qualifications, backgrounds and responsibilities of PGIM Investments’ senior management responsible for the oversight of each Fund and PGIM Quantitative Solutions, and also considered the qualifications, backgrounds and responsibilities of PGIM Quantitative Solutions’ portfolio managers who are responsible for the day-to-day management of each Fund’s portfolio. The Board was provided with information pertaining to PGIM Investments’ and PGIM Quantitative Solutions’ organizational structure, senior management, investment operations, and other relevant information pertaining to PGIM Investments and PGIM Quantitative Solutions. The Board also noted that it received favorable compliance reports from the Funds’ Chief Compliance Officer (“CCO”) as to PGIM Investments and PGIM Quantitative Solutions.
Visit our website at pgim.com/investments |
The Board concluded that it was satisfied with the nature, extent and quality of the investment management services provided by PGIM Investments, and the subadvisory services provided to each Fund by PGIM Quantitative Solutions, and that there was a reasonable basis on which to conclude that each Fund benefits from the services provided by PGIM Investments and PGIM Quantitative Solutions under the management, subadvisory agreement.
Costs of Services and Profits Realized by PGIM Investments
The Board was provided with information on the profitability of PGIM Investments and its affiliates in serving as each Fund’s investment manager. The Board discussed with PGIM Investments the methodology utilized in assembling the information regarding profitability and considered its reasonableness. The Board recognized that it is difficult to make comparisons of profitability from fund management contracts because comparative information is not generally publicly available and is affected by numerous factors, including the structure of the particular adviser, the types of funds it manages, its business mix, numerous assumptions regarding allocations and the adviser’s capital structure and cost of capital. Taking these factors into account, the Board concluded that the profitability of PGIM Investments and its affiliates in relation to the services rendered was not unreasonable.
Economies of Scale
The Board received and discussed information concerning economies of scale that PGIM Investments may realize as each Fund’s assets grow beyond current levels. During the course of time, the Board has considered information regarding the launch date of each Fund, the management fees of each Fund compared to those of similarly managed funds and PGIM Investments’ investment in each Fund over time. The Board noted that economies of scale can be shared with each Fund in other ways, including low management fees from inception, additional technological and personnel investments to enhance shareholder services, and maintaining existing expense structures in the face of a rising cost environment. The Board also considered PGIM Investments’ assertion that it continually evaluates the management fee schedule of each Fund and the potential to share economies of scale through breakpoints or fee waivers as asset levels increase.
The Board recognized the inherent limitations of any analysis of economies of scale, stemming largely from the Board’s understanding that most of PGIM Investments’ costs are not specific to individual funds, but rather are incurred across a variety of products and services.
Other Benefits to PGIM Investments and PGIM Quantitative Solutions
The Board considered potential ancillary benefits that might be received by PGIM Investments, PGIM Quantitative Solutions and their affiliates as a result of their relationship with each Fund. The Board concluded that potential benefits to be derived by PGIM Investments included transfer agency fees received by each Fund’s transfer agent (which is affiliated with PGIM Investments), as well as benefits to its reputation or
PGIM QMA Strategic Alpha ETFs |
Approval of Advisory Agreements (continued)
other intangible benefits resulting from PGIM Investments’ association with each Fund. The Board concluded that the potential benefits to be derived by PGIM Quantitative Solutions included the ability to use soft dollar credits, as well as the potential benefits consistent with those generally resulting from an increase in assets under management, specifically, potential access to additional research resources and benefits to its reputation. The Board concluded that the benefits derived by PGIM Investments and PGIM Quantitative Solutions were consistent with the types of benefits generally derived by investment managers and subadvisers to mutual funds.
Performance of the Funds / Fees and Expenses
The Board considered certain additional factors and made related conclusions relating to the historical performance of each Fund for the one-year period ended December 31, 2020. The Board considered that each Fund commenced operations in Q4 of 2018 and that longer-term performance was not yet available.
The Board also considered each Fund’s actual management fee, as well as each Fund’s net total expense ratio, for the fiscal period ended August 31, 2020. The Board considered the management fee for each Fund as compared to the management fee charged by PGIM Investments to other funds and the fee charged by other advisers to comparable mutual funds in a Peer Group. The actual management fee represents the fee rate actually paid by Fund shareholders and includes any fee waivers or reimbursements. The net total expense ratio for each Fund represents the actual expense ratio incurred by Fund shareholders.
The mutual funds included in the Peer Universe, which was used to consider performance, and the Peer Group, which was used to consider expenses and fees, were objectively determined by Broadridge, an independent provider of mutual fund data. In certain circumstances, PGIM Investments also provided supplemental Peer Universe or Peer Group information for reasons addressed with the Board. The comparisons placed each Fund in various quartiles over various periods, with the first quartile being the best 25% of the mutual funds (for performance, the best performing mutual funds and, for expenses, the lowest cost mutual funds).
The section below summarizes key factors considered by the Board and the Board’s conclusions regarding each Fund’s performance, fees and overall expenses. The table sets forth net performance comparisons (which reflect the impact on performance of fund expenses, or any subsidies, expense caps or waivers that may be applicable) with the Peer Universe, actual management fees with the Peer Group (which reflect the impact of any subsidies or fee waivers), and net total expenses with the Peer Group, each of which were key factors considered by the Board.
Visit our website at pgim.com/investments |
PGIM QMA Strategic Alpha International Equity ETF
| Net Performance | 1 Year | 3 Years | 5 Years | 10 Years | ||||
| 3rd Quartile | N/A | N/A | N/A | |||||
| Actual Management Fees: 1st Quartile | ||||||||
| Net Total Expenses: 1st Quartile | ||||||||
| • | The Board noted that the Fund underperformed its benchmark index over the one-year period ended December 31, 2020. |
| • | The Board noted that the Fund does not yet have a three-year performance record and that, therefore, the subadviser should have more time to develop that record. |
| • | The Board and PGIM Investments agreed to retain the Fund’s existing contractual fee waiver, pursuant to which PGIM Investments waives any management fees it receives from the Fund in an amount equal to the subadvisory fees paid by the Fund to the PGIM Institutional Money Market Fund. |
| • | The Board concluded that, in light of the above, it would be in the best interests of the Fund and its shareholders to continue to allow the Fund to create a longer-term performance record, and to renew the agreements. |
| • | The Board concluded that the management fees (including subadvisory fees) and total expenses were reasonable in light of the services provided. |
PGIM QMA Strategic Alpha Large-Cap Core ETF
| Net Performance | 1 Year | 3 Years | 5 Years | 10 Years | ||||
| 4th Quartile | N/A | N/A | N/A | |||||
| Actual Management Fees: 1st Quartile | ||||||||
| Net Total Expenses: 1st Quartile | ||||||||
| • | The Board noted that the Fund underperformed its benchmark index over the one-year period ended December 31, 2020. |
| • | The Board noted that the Fund does not yet have a three-year performance record and that, therefore, the subadviser should have more time to develop that record. |
| • | The Board and PGIM Investments agreed to retain the Fund’s existing contractual fee waiver, pursuant to which PGIM Investments waives any management fees it receives from the Fund in an amount equal to the subadvisory fees paid by the Fund to the PGIM Institutional Money Market Fund. |
| • | The Board concluded that, in light of the above, it would be in the best interests of the Fund and its shareholders to continue to allow the Fund to create a longer-term performance record, and to renew the agreements. |
| • | The Board concluded that the management fees (including subadvisory fees) and total expenses were reasonable in light of the services provided. |
PGIM QMA Strategic Alpha ETFs |
Approval of Advisory Agreements (continued)
PGIM QMA Strategic Alpha Small-Cap Growth ETF
| Net Performance | 1 Year | 3 Years | 5 Years | 10 Years | ||||
| 4th Quartile | N/A | N/A | N/A | |||||
| Actual Management Fees: 1st Quartile | ||||||||
| Net Total Expenses: 1st Quartile | ||||||||
| • | The Board noted that the Fund underperformed its benchmark index over the one-year period ended December 31, 2020. |
| • | The Board noted that the Fund does not yet have a three-year performance record and that, therefore, the subadviser should have more time to develop that record. |
| • | The Board and PGIM Investments agreed to retain the Fund’s existing contractual fee waiver, pursuant to which PGIM Investments waives any management fees it receives from the Fund in an amount equal to the subadvisory fees paid by the Fund to the PGIM Institutional Money Market Fund. |
| • | The Board concluded that, in light of the above, it would be in the best interests of the Fund and its shareholders to continue to allow the Fund to create a longer-term performance record, and to renew the agreements. |
| • | The Board concluded that the management fees (including subadvisory fees) and total expenses were reasonable in light of the services provided. |
PGIM QMA Strategic Alpha Small-Cap Value ETF
| Net Performance | 1 Year | 3 Years | 5 Years | 10 Years | ||||
| 3rd Quartile | N/A | N/A | N/A | |||||
| Actual Management Fees: 1st Quartile | ||||||||
| Net Total Expenses: 1st Quartile | ||||||||
| • | The Board noted that the Fund underperformed its benchmark index over the one-year period ended December 31, 2020. |
| • | The Board noted that the Fund does not yet have a three-year performance record and that, therefore, the subadviser should have more time to develop that record. |
| • | The Board and PGIM Investments agreed to retain the Fund’s existing contractual fee waiver, pursuant to which PGIM Investments waives any management fees it receives from the Fund in an amount equal to the subadvisory fees paid by the Fund to the PGIM Institutional Money Market Fund. |
| • | The Board concluded that, in light of the above, it would be in the best interests of the Fund and its shareholders to continue to allow the Fund to create a longer-term performance record, and to renew the agreements. |
| • | The Board concluded that the management fees (including subadvisory fees) and total expenses were reasonable in light of the services provided |
Visit our website at pgim.com/investments |
* * *
After full consideration of these factors, the Board concluded that approval of the agreements was in the best interests of each Fund and its shareholders.
PGIM QMA Strategic Alpha ETFs |
| ∎ TELEPHONE | ∎ WEBSITE | |||
655 Broad Street Newark, NJ 07102 | (800) 225-1852 | pgim.com/investments | ||
| PROXY VOTING | ||||
The Board of Trustees of the Funds has delegated to the Funds’ subadviser the responsibility for voting any proxies and maintaining proxy recordkeeping with respect to each Fund. A description of these proxy voting policies and procedures is available without charge, upon request, by calling (800) 225-1852 or by visiting the Securities and Exchange Commission’s website at sec.gov. Information regarding how each Fund voted proxies relating to portfolio securities during the most recent 12-month period ended June 30 is available on the Funds’ website and on the Securities and Exchange Commission’s website. | ||||
| TRUSTEES | ||||
Ellen S. Alberding • Kevin J. Bannon • Scott E. Benjamin • Linda W. Bynoe • Barry H. Evans • Keith F. Hartstein • Laurie Simon Hodrick • Stuart S. Parker • Brian K. Reid • Grace C. Torres | ||||
| OFFICERS | ||||
Stuart S. Parker, President • Scott E. Benjamin, Vice President • Christian J. Kelly, Treasurer and Principal Financial and Accounting Officer • Claudia DiGiacomo, Chief Legal Officer • Dino Capasso, Chief Compliance Officer • Dana E. Cordes, Anti-Money Laundering Compliance Officer • Andrew R. French, Secretary • Melissa Gonzalez, Assistant Secretary • Diana N. Huffman, Assistant Secretary • Patrick E. McGuinness, Assistant Secretary • Debra Rubano, Assistant Secretary • Lana Lomuti, Assistant Treasurer • Russ Shupak, Assistant Treasurer • Elyse M. McLaughlin, Assistant Treasurer • Deborah Conway, Assistant Treasurer | ||||
| MANAGER | PGIM Investments LLC | 655 Broad Street Newark, NJ 07102 | ||
| ||||
| SUBADVISER | PGIM Quantitative Solutions LLC | Gateway Center Two 100 Mulberry Street Newark, NJ 07102 | ||
| ||||
| DISTRIBUTOR | Prudential Investment Management Services LLC | 655 Broad Street Newark, NJ 07102 | ||
| ||||
| CUSTODIAN/TRANSFER AGENT | Brown Brothers Harriman & Co. | 50 Post Office Square Boston, MA 02110 | ||
| ||||
| INDEPENDENT REGISTERED PUBLIC ACCOUNTING FIRM | PricewaterhouseCoopers LLP | 300 Madison Avenue New York, NY 10017 | ||
| ||||
| FUND COUNSEL | Willkie Farr & Gallagher LLP | 787 Seventh Avenue New York, NY 10019 | ||
| ||||
| An investor should consider the investment objectives, risks, charges, and expenses of the Funds carefully before investing. The prospectus and summary prospectus contain this and other information about the Funds. An investor may obtain the prospectus and summary prospectus for each Fund by visiting our website at pgiminvestments.com or by calling (800) 225-1852. The prospectus and summary prospectus for each Fund should be read carefully before investing. |
| E-DELIVERY |
To receive your fund documents online, go to pgim.com/investments/resource/edelivery and enroll. Instead of receiving printed documents by mail, you will receive notification via email when new materials are available. You can cancel your enrollment or change your email address at any time by visiting the website address above. |
| SHAREHOLDER COMMUNICATIONS WITH TRUSTEES |
Shareholders can communicate directly with the Board of Trustees by writing to the Chair of the Board, PGIM QMA Strategic Alpha ETFs, PGIM Investments, Attn: Board of Trustees, 655 Broad Street, Newark, NJ 07102. Shareholders can communicate directly with an individual Trustee by writing to that Trustee at the same address. Communications are not screened before being delivered to the addressee. |
| AVAILABILITY OF PORTFOLIO HOLDINGS |
On each business day, before commencement of trading on the Exchange, the Fund will disclose on www.pgiminvestments.com the Fund’s portfolio holdings that will form the basis for the Fund’s calculation of NAV at the end of the business day. The Fund files its complete schedule of portfolio holdings with the Securities and Exchange Commission for the first and third quarters of each fiscal year as an exhibit to its reports on Form N-PORT. The Fund’s Form N-PORT filings are available on the Commission’s website at sec.gov. |
| The Fund’s Statement of Additional Information contains additional information about the Fund’s Trustees and is available without charge, upon request, by calling (800) 225-1852. |
Funds:
| ARE NOT INSURED BY THE FDIC OR ANY FEDERAL GOVERNMENT AGENCY | MAY LOSE VALUE | ARE NOT A DEPOSIT OF OR GUARANTEED BY ANY BANK OR ANY BANK AFFILIATE |

PGIM QMA STRATEGIC ALPHA ETFS
| Fund | Ticker Symbol | |
| PGIM QMA Strategic Alpha Large-Cap Core ETF | PQLC | |
| PGIM QMA Strategic Alpha Small-Cap Growth ETF | PQSG | |
| PGIM QMA Strategic Alpha Small-Cap Value ETF | PQSV | |
| PGIM QMA Strategic Alpha International Equity ETF | PQIN |
ETF1002E
Item 2 – Code of Ethics — See Exhibit (a)
As of the end of the period covered by this report, the registrant has adopted a code of ethics (the “Section 406 Standards for Investment Companies – Ethical Standards for Principal Executive and Financial Officers”) that applies to the registrant’s Principal Executive Officer and Principal Financial Officer; the registrant’s Principal Financial Officer also serves as the Principal Accounting Officer.
The registrant hereby undertakes to provide any person, without charge, upon request, a copy of the code of ethics. To request a copy of the code of ethics, contact the registrant 800-225-1852, and ask for a copy of the Section 406 Standards for Investment Companies - Ethical Standards for Principal Executive and Financial Officers.
Item 3 – Audit Committee Financial Expert –
The registrant’s Board has determined that Ms. Grace C. Torres, member of the Board’s Audit Committee is an “audit committee financial expert,” and that she is “independent,” for purposes of this item.
Item 4 – Principal Accountant Fees and Services –
(a) Audit Fees
For the fiscal year ended August 31, 2021, the Registrant’s principal accountant was PricewaterhouseCoopers LLP (“PwC”). For the fiscal year ended August 31, 2021, PwC billed the Registrant $156,500 for professional services rendered for the audit of the Registrant’s annual financial statements or services that are normally provided in connection with statutory and regulatory filings.
For the fiscal year ended August 31, 2020, the Registrant’s principal accountant was KPMG LLP (“KPMG”). For the fiscal year ended August 31, 2020, KPMG billed the Registrant $137,652 for professional services rendered for the audit of the Registrant’s annual financial statements or services that are normally provided in connection with statutory and regulatory filings.
(b) Audit-Related Fees
For the fiscal year ended August 31, 2021, PwC did not bill the Registrant for audit-related services.
For the fiscal year ended August 31, 2021, fees of $796 were billed to the Registrant for services rendered by KPMG in connection with the auditor transition.
For the fiscal year ended August 31, 2020 fees of $1,087 were billed to the Registrant for services rendered by KPMG in connection with the auditor transition.
(c) Tax Fees
For the fiscal years ended August 31, 2021 and August 31, 2020: none.
(d) All Other Fees
For the fiscal years ended August 31, 2021 and August 31, 2020: none.
(e) (1) Audit Committee Pre-Approval Policies and Procedures
THE PGIM MUTUAL FUNDS
AUDIT COMMITTEE POLICY
on
Pre-Approval of Services Provided by the Independent Accountants
The Audit Committee of each PGIM Mutual Fund is charged with the responsibility to monitor the independence of the Fund’s independent accountants. As part of this responsibility, the Audit Committee must pre-approve the independent accounting firm’s engagement to render audit and/or permissible non-audit services, as required by law. In evaluating a proposed engagement of the independent accountants, the Audit Committee will assess the effect that the engagement might reasonably be expected to have on the accountant’s independence. The Committee’s evaluation will be based on:
| • | a review of the nature of the professional services expected to be provided, |
| • | a review of the safeguards put into place by the accounting firm to safeguard independence, and |
| • | periodic meetings with the accounting firm. |
Policy for Audit and Non-Audit Services Provided to the Funds
On an annual basis, the scope of audits for each Fund, audit fees and expenses, and audit-related and non-audit services (and fees proposed in respect thereof) proposed to be performed by the Fund’s independent accountants will be presented by the Treasurer and the independent accountants to the Audit Committee for review and, as appropriate, approval prior to the initiation of such services.
Such presentation shall be accompanied by confirmation by both the Treasurer and the independent accountants that the proposed
non-audit services will not adversely affect the independence of the independent accountants. Such proposed non-audit services shall be described in sufficient detail to enable the Audit Committee to assess the appropriateness of such services and fees, and the compatibility of the provision of such services with the auditor’s independence. The Committee shall receive periodic reports on the progress of the audit and other services which are approved by the Committee or by the Committee Chair pursuant to authority delegated in this Policy.
The categories of services enumerated under “Audit Services”, “Audit-related Services”, and “Tax Services” are intended to provide guidance to the Treasurer and the independent accountants as to those categories of services which the Committee believes are generally consistent with the independence of the independent accountants and which the Committee (or the Committee Chair) would expect upon the presentation of specific proposals to pre-approve. The enumerated categories are not intended as an exclusive list of audit, audit-related or tax services, which the Committee (or the Committee Chair) would consider for pre-approval.
Audit Services
The following categories of audit services are considered to be consistent with the role of the Fund’s independent accountants:
| • | Annual Fund financial statement audits |
| • | Seed audits (related to new product filings, as required) |
| • | SEC and regulatory filings and consents |
Audit-related Services
The following categories of audit-related services are considered to be consistent with the role of the Fund’s independent accountants:
| • | Accounting consultations |
| • | Fund merger support services |
| • | Agreed Upon Procedure Reports |
| • | Attestation Reports |
| • | Other Internal Control Reports |
Individual audit-related services that fall within one of these categories (except for fund merger support services) and are not presented to the Audit Committee as part of the annual pre-approval process are subject to an authorized pre-approval by the Audit Committee so long as the estimated fee for those services does not exceed $30,000. Any services provided under such pre-approval will be reported to the Audit Committee at its next regular meeting. Should the amount of such services exceed $30,000 any additional fees will be subject to pre-approval by the Committee Chair (or any other Committee member on whom this responsibility has been delegated). Fees related to fund merger support services are subject to a separate authorized pre-approval by the Audit Committee with fees determined on a per occurrence and merger complexity basis.
Tax Services
The following categories of tax services are considered to be consistent with the role of the Fund’s independent accountants:
| • | Tax compliance services related to the filing or amendment of the following: |
| • | Federal, state and local income tax compliance; and, |
| • | Sales and use tax compliance |
| • | Timely RIC qualification reviews |
| • | Tax distribution analysis and planning |
| • | Tax authority examination services |
| • | Tax appeals support services |
| • | Accounting methods studies |
| • | Fund merger support services |
| • | Tax consulting services and related projects |
Individual tax services that fall within one of these categories and are not presented to the Audit Committee as part of the annual pre-approval process are subject to an authorized pre-approval by the Audit Committee so long as the estimated fee for those services does not exceed $30,000. Any services provided under such pre-approval will be reported to the Audit Committee at its next regular meeting. Should the amount of such services exceed $30,000 any additional fees will be subject to pre-approval by the Committee Chair (or any other Committee member on whom this responsibility has been delegated).
Other Non-Audit Services
Certain non-audit services that the independent accountants are legally permitted to render will be subject to pre-approval by the Committee or by one or more Committee members to whom the Committee has delegated this authority and who will report to the full Committee any pre-approval decisions made pursuant to this Policy. Non-audit services presented for pre-approval pursuant to this paragraph will be accompanied by a confirmation from both the Treasurer and the independent accountants that the proposed services will not adversely affect the independence of the independent accountants.
Proscribed Services
The Fund’s independent accountants will not render services in the following categories of non-audit services:
| • | Bookkeeping or other services related to the accounting records or financial statements of the Fund |
| • | Financial information systems design and implementation |
| • | Appraisal or valuation services, fairness opinions, or contribution-in-kind reports |
| • | Actuarial services |
| • | Internal audit outsourcing services |
| • | Management functions or human resources |
| • | Broker or dealer, investment adviser, or investment banking services |
| • | Legal services and expert services unrelated to the audit |
| • | Any other service that the Public Company Accounting Oversight Board determines, by regulation, is impermissible. |
Pre-approval of Non-Audit Services Provided to Other Entities Within the PGIM Fund Complex
Certain non-audit services provided to PGIM Investments LLC or any of its affiliates that also provide ongoing services to the PGIM Mutual Funds will be subject to pre-approval by the Audit Committee. The only non-audit services provided to these entities that will require pre-approval are those related directly to the operations and financial reporting of the Funds. Individual projects that are not presented to the Audit Committee as part of the annual pre-approval process will be subject to pre-approval by the Committee Chair (or any other Committee member on whom this responsibility has been delegated) so long as the estimated fee for those services does not exceed $30,000. Services presented for pre-approval pursuant to this paragraph will be accompanied by a confirmation from both the Treasurer and the independent accountants that the proposed services will not adversely affect the independence of the independent accountants.
Although the Audit Committee will not pre-approve all services provided to PGIM Investments LLC and its affiliates, the Committee will receive an annual report from the Fund’s independent accounting firm showing the aggregate fees for all services provided to PGIM Investments and its affiliates.
(e) (2) Percentage of services referred to in 4(b) – 4(d) that were approved by the audit committee –
For the fiscal years ended August 31, 2021 and August 31, 2020, 100% of the services referred to in Item 4(b) was approved by the audit committee.
(f) Percentage of hours expended attributable to work performed by other than full time employees of principal accountant if greater than 50%.
The percentage of hours expended on the principal accountant’s engagement to audit the registrant’s financial statements for the most recent fiscal year that were attributed to work performed by persons other than the principal accountant’s full-time, permanent employees was 0%.
(g) Non-Audit Fees
The aggregate non-audit fees billed by the Registrant’s principal accountant for services rendered to the registrant’s investment adviser and any entity controlling, controlled by, or under common control with the investment adviser that provides ongoing services to the registrant for the fiscal years ended August 31, 2021 and August 31, 2020 was $0 and $0, respectively.
(h) Principal Accountant’s Independence
Not applicable as the Registrant’s principal accountant has not provided non-audit services to the registrant’s investment adviser and any entity controlling, controlled by, or under common control with the investment adviser that provides ongoing services to the registrant that were not pre-approved pursuant to Rule 2-01(c)(7)(ii) of Regulation S-X.
Item 5 – Audit Committee of Listed Registrants –
The registrant has a separately designated standing audit committee (the “Audit Committee”) established in accordance
with Section 3(a)(58)(A) of the Securities Exchange Act of 1934. The members of the Audit Committee are Grace C. Torres (Chair), Laurie Simon Hodrick, Brian K. Reid and Keith F. Hartstein (ex-officio).
Item 6 – Schedule of Investments – The schedule is included as part of the report to shareholders filed under Item 1 of this Form.
Item 7 – Disclosure of Proxy Voting Policies and Procedures for Closed-End Management Investment Companies – Not applicable.
Item 8 – Portfolio Managers of Closed-End Management Investment Companies – Not applicable.
| Item 9 – | Purchases of Equity Securities by Closed-End Management Investment Company and Affiliated Purchasers – Not applicable. |
Item 10 – Submission of Matters to a Vote of Security Holders – There have been no material changes to these procedures.
Item 11 – Controls and Procedures
| (a) | It is the conclusion of the registrant’s principal executive officer and principal financial officer that the effectiveness of the registrant’s current disclosure controls and procedures (such disclosure controls and procedures having been evaluated within 90 days of the date of this filing) provide reasonable assurance that the information required to be disclosed by the registrant has been recorded, processed, summarized and reported within the time period specified in the Commission’s rules and forms and that the information required to be disclosed by the registrant has been accumulated and communicated to the registrant’s principal executive officer and principal financial officer in order to allow timely decisions regarding required disclosure. |
| (b) | There has been no significant change in the registrant’s internal control over financial reporting that occurred during the registrant’s most recent fiscal quarter of the period covered by this report that has materially affected, or is likely to materially affect, the registrant’s internal control over financial reporting. |
Item 12 – Controls and Procedures - Disclosure of Securities Lending Activities for Closed-End Management Investment Companies – Not applicable.
Item 13 – Exhibits
| (3) | Any written solicitation to purchase securities under Rule 23c-1 – Not applicable. |
SIGNATURES
Pursuant to the requirements of the Securities Exchange Act of 1934 and the Investment Company Act of 1940, the registrant has duly caused this report to be signed on its behalf by the undersigned, thereunto duly authorized.
| Registrant: | PGIM ETF Trust | |
| By: | /s/ Andrew R. French | |
| Andrew R. French | ||
| Secretary | ||
| Date: | October 19, 2021 | |
Pursuant to the requirements of the Securities Exchange Act of 1934 and the Investment Company Act of 1940, this report has been signed below by the following persons on behalf of the registrant and in the capacities and on the dates indicated.
| By: | /s/ Stuart S. Parker | |
| Stuart S. Parker | ||
| President and Principal Executive Officer | ||
| Date: | October 19, 2021 | |
| By: | /s/ Christian J. Kelly | |
| Christian J. Kelly | ||
| Treasurer and Principal Financial and Accounting Officer | ||
| Date: | October 19, 2021 | |