UNITED STATES
SECURITIES AND EXCHANGE COMMISSION
Washington, D.C. 20549
FORM N-CSR
CERTIFIED SHAREHOLDER REPORT OF REGISTERED MANAGEMENT INVESTMENT COMPANIES
| | |
| Investment Company Act file number: | | 811-23324 |
| |
| Exact name of registrant as specified in charter: | | PGIM ETF Trust |
| |
| Address of principal executive offices: | | 655 Broad Street, 6th Floor |
| | | Newark, New Jersey 07102 |
| |
| Name and address of agent for service: | | Andrew R. French |
| | | 655 Broad Street, 6th Floor |
| | | Newark, New Jersey 07102 |
| |
| Registrant’s telephone number, including area code: | | 800-225-1852 |
| |
| Date of fiscal year end: | | 8/31/2023 |
| |
| Date of reporting period: | | 8/31/2023 |
Item 1 – Reports to Stockholders

PGIM FIXED INCOME ETFs
PGIM Ultra Short Bond ETF (PULS)
PGIM Active High Yield Bond ETF (PHYL)
PGIM Active Aggregate Bond ETF (PAB)
PGIM Total Return Bond ETF (PTRB)
PGIM Floating Rate Income ETF (PFRL)
PGIM AAA CLO ETF (PAAA)
PGIM Short Duration Multi-Sector Bond ETF (PSDM)
ANNUAL REPORT
AUGUST 31, 2023

To enroll in e-delivery, go to pgim.com/investments/resource/edelivery
Table of Contents
This report is not authorized for distribution to prospective investors unless preceded or accompanied by a current prospectus.
The views expressed in this report and information about the Funds’ portfolio holdings are for the period covered by this report and are subject to change thereafter.
Exchange-traded funds are distributed by Prudential Investment Management Services LLC (PIMS), member SIPC. PGIM Fixed Income is a unit of PGIM, Inc. (PGIM), a registered investment adviser. PIMS and PGIM are Prudential Financial companies. © 2023 Prudential Financial, Inc. and its related entities. PGIM and the PGIM logo are service marks of Prudential Financial, Inc. and its related entities, registered in many jurisdictions worldwide.
2 Visit our website at pgim.com/investments
Letter from the President
| | |
 | | Dear Shareholder: We hope you find the annual report for the PGIM Fixed Income ETFs informative and useful. The report covers performance for the 12-month period that ended August 31, 2023. Although central banks raised interest rates aggressively to tame surging inflation during the period, the global economy and financial markets demonstrated resilience. Employers continued to hire, consumers continued to spend, home prices rose, and recession fears receded. |
Stocks fell early in the period, bottomed in October, and then began a rally that eventually ended a bear market. Despite a banking industry crisis in March, stocks have continued to rise globally throughout 2023 as inflation cooled and the Federal Reserve slowed the pace of its rate hikes. Equities in both US and international markets posted gains during the period.
Bond market returns were mixed during the period as rising interest rates lifted yields to their highest level in two decades. US and global investment-grade bonds fell, while US high yield corporate bonds and emerging-market debt rose.
Regarding your investments with PGIM, we believe it is important to maintain a diversified portfolio of funds consistent with your tolerance for risk, time horizon, and financial goals. Your financial advisor can help you create a diversified investment plan that may include funds covering all the basic asset classes and that reflects your personal investor profile and risk tolerance. However, diversification and asset allocation strategies do not assure a profit or protect against loss in declining markets.
At PGIM Investments, we provide access to active investment strategies across the global markets in the pursuit of consistent outperformance for investors. PGIM is the world’s 14th-largest investment manager with more than $1.3 trillion in assets under management. Our scale and investment expertise allow us to deliver a diversified suite of actively managed solutions across a broad spectrum of asset classes and investment styles.
Thank you for choosing our family of funds.
Sincerely,
|
 |
Stuart S. Parker, President |
PGIM Fixed Income ETFs October 16, 2023 |
PGIM Fixed Income ETFs 3
PGIM Ultra Short Bond ETF
Your Fund’s Performance (unaudited)
Performance data quoted represent past performance. Past performance does not guarantee future results. The investment return and principal value of an investment will fluctuate so that an investor’s shares, when sold, may be worth more or less than their original cost. Current performance may be lower or higher than the past performance data quoted. An investor may obtain performance data as of the most recent month-end by visiting our website at pgim.com/investments or by calling (800) 225-1852.
| | | | | | |
| |
| | | Average Annual Total Returns as of 8/31/23 |
| | | |
| | | One Year (%) | | Five Years (%) | | Since Inception (%) |
| | | |
Net Asset Value (NAV) | | 5.31 | | 2.24 | | 2.28 (4/5/2018) |
| | | |
Market Price* | | 5.34 | | 2.24 | | 2.28 (4/5/2018) |
| | | |
ICE BofA US 3-Month Treasury Bill Index | | | | | | |
| | | |
| | | 4.25 | | 1.65 | | 1.67 |
*The market price is determined using the midpoint between the highest bid and the lowest offer on the listing exchange, as of the time that the Fund’s NAV is calculated. The first day of secondary market trading is typically several days after the date on which the Fund commenced investment operations; therefore, the NAV of the Fund is used as a proxy for the period from inception of investment operations to the first day of secondary market trading to calculate the market price returns.
The returns in the table do not reflect the deduction of taxes that a shareholder would pay on Fund distributions or following the sale of Fund shares.
Market returns do not include brokerage commissions that may be payable on secondary market transactions. If brokerage commissions were included, market returns would be lower. Market and NAV returns assume that dividends and capital gain distributions, if any, have been reinvested in the Fund at market price and NAV, respectively.
4 Visit our website at pgim.com/investments
Growth of a $10,000 Investment (unaudited)
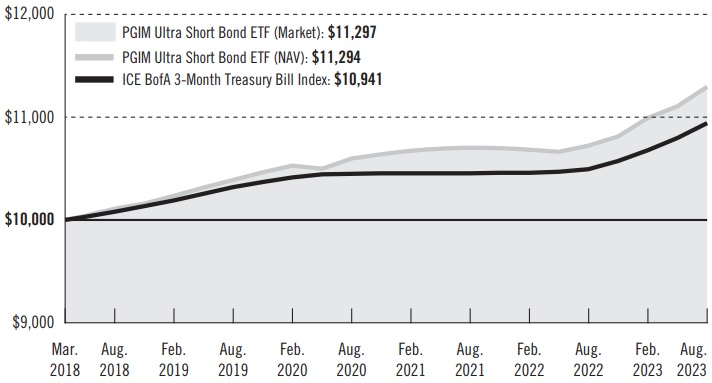
The graph compares a $10,000 investment in the Fund with a similar investment in the ICE BofA 3-Month Treasury Bill Index by portraying the initial account values at the commencement of operations (April 5, 2018) and the account values at the end of the current fiscal year (August 31, 2023) as measured on a quarterly basis. The Fund assumes an initial investment on April 5, 2018, while the Index assumes that the initial investment occurred on March 31, 2018. For purposes of the graph, and unless otherwise indicated, it has been assumed that (a) all recurring fees (including management fees) were deducted and (b) all dividends and distributions were reinvested. Without waiver of fees and/or expense reimbursements, if any, the returns would have been lower.
Past performance does not predict future performance. Total returns and the ending account values in the graphs include changes in share price and reinvestment of dividends and capital gains distributions in a hypothetical investment for the periods shown. The Fund’s total returns do not reflect the deduction of income taxes on an individual’s investment. Taxes may reduce your actual investment returns on income or gains paid by the Fund or any gains you may realize if you sell your shares.
PGIM Fixed Income ETFs 5
PGIM Ultra Short Bond ETF
Your Fund’s Performance (continued)
Benchmark Definitions
ICE BofA US 3-Month Treasury Bill Index—The ICE BofA US 3-Month Treasury Bill Index is an unmanaged index which is comprised of a single issue purchased at the beginning of the month and held for a full month. At the end of the month that issue is sold and rolled into a newly selected issue. The issue selected at each month-end rebalancing is the outstanding Treasury Bill that matures closest to, but not beyond, three months from the rebalancing date. To qualify for selection, an issue must have settled on or before the month-end rebalancing date.
ICE BOFA IS LICENSING THE BOFA INDICES “AS IS,” MAKES NO WARRANTIES REGARDING THE SAME, DOES NOT GUARANTEE THE SUITABILITY, QUALITY, ACCURACY, TIMELINESS, AND/OR COMPLETENESS OF THE ICE BOFA INDICES OR ANY DATA INCLUDED IN, RELATED TO, OR DERIVED THEREFROM, ASSUMES NO LIABILITY IN CONNECTION WITH THEIR USE, AND DOES NOT SPONSOR, ENDORSE, OR RECOMMEND THE FUND, OR ANY OF ITS PRODUCTS OR SERVICES.
Investors cannot invest directly in an index. The returns for the Indexes would be lower if they included the effects of operating expenses or taxes that may be paid by an investor.
6 Visit our website at pgim.com/investments
| | | | |
| |
Credit Quality expressed as a percentage of total investments as of 8/31/23 (%) | | | | |
| |
AAA | | | 37.0 | |
| |
AA | | | 27.4 | |
| |
A | | | 18.2 | |
| |
BBB | | | 16.1 | |
| |
Cash/Cash Equivalents | | | 1.3 | |
| | |
Total | | | 100.0 | |
Credit ratings reflect the highest rating assigned by a nationally recognized statistical rating organization (NRSRO) such as Moody’s Investors Service, Inc. (Moody’s), S&P Global Ratings (S&P), or Fitch Ratings Inc. (Fitch). Credit ratings reflect the common nomenclature used by both S&P and Fitch. Where applicable, ratings are converted to the comparable S&P/Fitch rating tier nomenclature. These rating agencies are independent and are widely used. The Not Rated category consists of securities that have not been rated by an NRSRO. Credit ratings are subject to change.
| | | | | | | | | | | | |
|
| Distributions and Yields as of 8/31/23 | |
| | | |
| | | | | | | SEC 30-Day | | | | SEC 30-Day | |
| | | Total Dividends Paid | | | | Subsidized | | | | Unsubsidized | |
| | | |
| | | for One Year ($) | | | | Yield* (%) | | | | Yield** (%) | |
| | | |
| | | 2.23 | | | | 5.30 | | | | 5.30 | |
*SEC 30-Day Subsidized Yield (%)—A standardized yield calculation created by the Securities and Exchange Commission, it reflects the income earned during a 30-day period, after the deduction of the Fund’s net expenses (net of any expense waivers or reimbursements). The investor experience is represented by the SEC 30-Day Subsidized Yield.
**SEC 30-Day Unsubsidized Yield (%)—A standardized yield calculation created by the Securities and Exchange Commission, it reflects the income earned during a 30-day period, after the deduction of the Fund’s gross expenses. The investor experience is represented by the SEC 30-Day Subsidized Yield.
PGIM Fixed Income ETFs 7
Strategy and Performance Overview*
(unaudited)
How did the Fund perform?
The PGIM Ultra Short Bond ETF returned 5.31% based on net asset value in the 12-month reporting period that ended August 31, 2023, outperforming the 4.25% return of the ICE BofA US 3-Month Treasury Bill Index (the Index).
What were the market conditions?
| ● | | While there was no shortage of fear in the bond markets during the reporting period, which was largely marked by an overhang of uncertainty and economic negatives, the interest rate volatility, COVID-19-era supply/demand imbalances, and steep losses that predominated during the first half of the reporting period showed signs of dissipating in the second half. |
| ● | | Despite a series of rolling crises—including a string of regional bank failures, the debt ceiling debate, ongoing recession concerns, and still-high inflation—the US economy avoided the worst of potential outcomes, and fixed income returns skewed largely positive over the last six months of the reporting period. |
| ● | | Against the backdrop of historic lows in unemployment and still-high inflation, the US Federal Reserve (the Fed) continued its monetary tightening path, raising interest rates by an additional 300 basis points (bps) in a succession of rate hikes over the reporting period. (One basis point equals 0.01%.) Although the Fed raised interest rates by 25 bps and indicated that its inflation fight was not yet over at the July Federal Open Market Committee (FOMC) meeting, the main signal from the meeting was that the end of the rate-hiking cycle was likely close. |
| ● | | A sharply higher federal funds rate, coupled with macroeconomic uncertainty, led to enormous volatility being priced into developed market interest rates, with sharply higher front-end rates and lower long-dated yields. From -0.30% on August 31, 2022, the 10-year/2-year US Treasury spread declined to -0.76% at the end of the reporting period, while the 2-year US Treasury yield rose by 140 bps to end the reporting period at 4.85%. |
| ● | | Just as longer-term US Treasuries saw substantial volatility throughout the reporting period, yields on short-term securities, which influence money market yields, also rose substantially. The 3-month US Treasury bill rose from 2.96% to 5.56% during the reporting period, while the Secured Overnight Financing Rate rose from 2.29% to 5.30%. |
| ● | | In the short-term credit markets, investment-grade credit spreads were relatively unchanged over the entirety of the reporting period, despite experiencing heightened intra-quarter volatility. The Bloomberg 1-3 Year Credit Index, a proxy for the short-term spread market, outperformed similar short-duration US Treasuries by 0.66% during the reporting period. |
What worked?
| ● | | During the reporting period, the Fund emphasized spread assets—including short-term, investment-grade debt of financial, consumer cyclical and non-cyclical, |
8 Visit our website at pgim.com/investments
| | and utility companies—ranging across the rating spectrum from AAA to BBB. Other spread sector assets included commercial mortgage-backed securities (CMBS) and collateralized loan obligations (CLOs). |
| ● | | Overall positioning in short-term, investment-grade corporates, CLOs, and CMBS contributed to performance during the reporting period. |
| ● | | Within credit, selections in banking, automotive, and electric utilities contributed to performance. |
| ● | | Overall yield curve positioning also contributed to performance during the period. (A yield curve is a line graph that illustrates the relationship between the yields and maturities of fixed income securities. It is created by plotting the yields of different maturities for the same type of bonds.) |
What didn’t work?
No positions materially detracted from the Fund’s performance relative to the Index during the reporting period.
Did the Fund use derivatives?
During the reporting period, the Fund used interest rate swaps and futures to help manage duration positioning and yield curve exposure. (Duration measures the sensitivity of the price—the value of principal—of a bond to a change in interest rates.) These instruments allowed the Fund to capture higher yields available farther out on the short-term portion of the yield curve and in spread-sector assets versus US Treasuries, while mitigating interest rate risk. Overall, the positions contributed to performance during the reporting period.
Current outlook
| ● | | Although the rate-hike debate continues for the Fed, the increments of its hikes are getting smaller, and it declined to raise rates at all at its June 2023 FOMC meeting—signs that most of the increases are behind us and that the hikes to come will increasingly be “fine-tuning” exercises. With the prospect of balance returning to the labor market, PGIM Fixed Income sees a path for core personal consumption expenditures to decelerate below 3.0% by the end of 2023, driven lower by core non-housing services prices. |
| ● | | Clear and sustained evidence of a downshift on inflation, coupled with below-trend growth, should be enough, in PGIM Fixed Income’s view, for the Fed to pause its rate-hike campaign at 5.5%. With the pace of central bank tightening expected to dramatically downshift in the quarters ahead, PGIM Fixed Income’s expectation is for interest rate volatility to continue to decline. |
| ● | | PGIM Fixed Income continues to emphasize well-researched, short-term credit sectors in the expectation that these assets are likely to offer the most value from a total return perspective. PGIM Fixed Income also continues to seek out investments with the best total return potential. |
PGIM Fixed Income ETFs 9
Strategy and Performance Overview* (continued)
| ● | | PGIM Fixed Income continues to find value within investment-grade corporates and structured products (CLOs, CMBS), which represent attractive value in relation to US Treasuries and agency mortgage-backed securities. |
*This strategy and performance overview, which discusses what strategies or holdings (including derivatives, if applicable) affected the Fund’s performance, is compiled based on how the Fund performed relative to the Fund’s benchmark index and is viewed for performance attribution purposes at the aggregate Fund level, which in most instances will not directly correlate to the amounts disclosed in the Statement of Operations which conform to US generally accepted accounting principles.
10 Visit our website at pgim.com/investments
PGIM Active High Yield Bond ETF
Your Fund’s Performance (unaudited)
Performance data quoted represent past performance. Past performance does not guarantee future results. The investment return and principal value of an investment will fluctuate so that an investor’s shares, when sold, may be worth more or less than their original cost. Current performance may be lower or higher than the past performance data quoted. An investor may obtain performance data as of the most recent month-end by visiting our website at pgim.com/investments or by calling (800) 225-1852.
| | | | |
| |
| | | Average Annual Total Returns as of 8/31/23 |
| | |
| | | One Year (%) | | Since Inception (%) |
| | |
Net Asset Value (NAV) | | 6.32 | | 3.69 (9/24/2018) |
| | |
Market Price* | | 6.80 | | 3.72 (9/24/2018) |
| | |
Bloomberg US High Yield Very Liquid Index | | | | |
| | |
| | | 7.20 | | 2.86 |
*The market price is determined using the midpoint between the highest bid and the lowest offer on the listing exchange, as of the time that the Fund’s NAV is calculated. The first day of secondary market trading is typically several days after the date on which the Fund commenced investment operations; therefore, the NAV of the Fund is used as a proxy for the period from inception of investment operations to the first day of secondary market trading to calculate the market price returns.
The returns in the table do not reflect the deduction of taxes that a shareholder would pay on Fund distributions or following the sale of Fund shares.
Market returns do not include brokerage commissions that may be payable on secondary market transactions. If brokerage commissions were included, market returns would be lower. Market and NAV returns assume that dividends and capital gain distributions, if any, have been reinvested in the Fund at market price and NAV, respectively.
PGIM Fixed Income ETFs 11
PGIM Active High Yield Bond ETF
Your Fund’s Performance (continued)
Growth of a $10,000 Investment (unaudited)
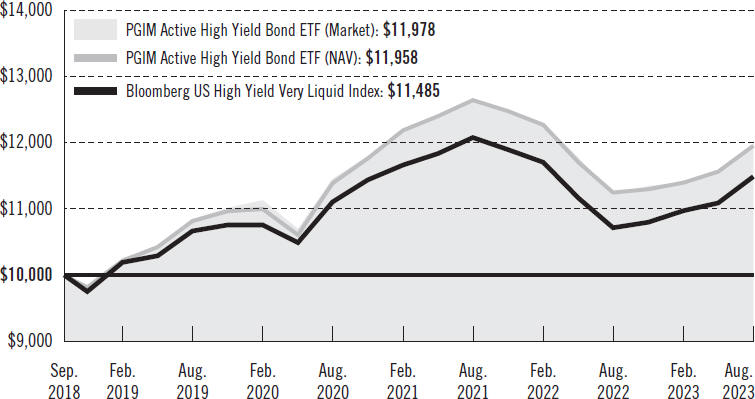
The graph compares a $10,000 investment in the Fund with a similar investment in the Bloomberg US High Yield Very Liquid Index by portraying the initial account values at the commencement of operations (September 24, 2018) and the account values at the end of the current fiscal year (August 31, 2023) as measured on a quarterly basis. The Fund assumes an initial investment on September 24, 2018, while the Index assumes that the initial investment occurred on September 30, 2018. For purposes of the graph, and unless otherwise indicated, it has been assumed that (a) all recurring fees (including management fees) were deducted and (b) all dividends and distributions were reinvested. Without waiver of fees and/or expense reimbursements, if any, the returns would have been lower.
Past performance does not predict future performance. Total returns and the ending account values in the graphs include changes in share price and reinvestment of dividends and capital gains distributions in a hypothetical investment for the periods shown. The Fund’s total returns do not reflect the deduction of income taxes on an individual’s investment. Taxes may reduce your actual investment returns on income or gains paid by the Fund or any gains you may realize if you sell your shares.
12 Visit our website at pgim.com/investments
Benchmark Definition
Bloomberg US High Yield Very Liquid Index (VLI)—The Bloomberg US High Yield Very Liquid Index is a component of the US Corporate High Yield Index that is designed to track a more liquid component of the USD-denominated, high yield, fixed rate corporate bond market. The Index uses the same eligibility criteria as the US Corporate High Yield Index, but includes only the three largest bonds from each issuer that have a minimum amount outstanding of USD500mn and less than five years from issue date. The Index also limits the exposure of each issuer to 2% of the total market value and redistributes any excess market value index-wide on a pro rata basis.
Investors cannot invest directly in an index. The returns for the Index would be lower if they included the effects of operating expenses or taxes that may be paid by an investor.
PGIM Fixed Income ETFs 13
PGIM Active High Yield Bond ETF
Your Fund’s Performance (continued)
| | | | |
| |
Credit Quality expressed as a percentage of total investments as of 8/31/23 (%) | | | | |
| |
AAA | | | 11.1 | |
| |
BBB | | | 4.8 | |
| |
BB | | | 41.6 | |
| |
B | | | 28.5 | |
| |
CCC | | | 10.0 | |
| |
CC | | | 0.1 | |
| |
D | | | 0.1 | |
| |
Not Rated | | | 1.8 | |
| |
Cash/Cash Equivalents | | | 2.0 | |
| | |
Total | | | 100.0 | |
Credit ratings reflect the highest rating assigned by a nationally recognized statistical rating organization (NRSRO) such as Moody’s Investors Service, Inc. (Moody’s), S&P Global Ratings (S&P), or Fitch Ratings Inc. (Fitch). Credit ratings reflect the common nomenclature used by both S&P and Fitch. Where applicable, ratings are converted to the comparable S&P/Fitch rating tier nomenclature. These rating agencies are independent and are widely used. The Not Rated category consists of securities that have not been rated by an NRSRO. Credit ratings are subject to change.
| | | | | | |
|
| Distributions and Yields as of 8/31/23 |
| | | |
| | Total Dividends | | SEC 30-Day | | SEC 30-Day |
| | Paid for | | Subsidized | | Unsubsidized |
| | | |
| | One Year ($) | | Yield* (%) | | Yield** (%) |
| | | |
| | | 2.53 | | 8.25 | | 8.25 |
*SEC 30-Day Subsidized Yield (%)—A standardized yield calculation created by the Securities and Exchange Commission, it reflects the income earned during a 30-day period, after the deduction of the Fund’s net expenses (net of any expense waivers or reimbursements). The investor experience is represented by the SEC 30-Day Subsidized Yield.
**SEC 30-Day Unsubsidized Yield (%)—A standardized yield calculation created by the Securities and Exchange Commission, it reflects the income earned during a 30-day period, after the deduction of the Fund’s gross expenses. The investor experience is represented by the SEC 30-Day Subsidized Yield.
14 Visit our website at pgim.com/investments
Strategy and Performance Overview*
(unaudited)
How did the Fund perform?
The PGIM Active High Yield Bond ETF returned 6.32% based on net asset value in the 12-month reporting period that ended August 31, 2023, underperforming the 7.20% return of the Bloomberg US High Yield Very Liquid Index (the Index).
What were the market conditions?
| ● | | US high yield bonds posted gains over the reporting period amid limited new issuance, resilient economic data, and an ongoing supply deficit fueled by a high volume of calls, tenders, maturities, and coupon payments. |
| ● | | Spreads on the Bloomberg US Corporate High Yield Bond Index tightened 113 basis points (bps) to 372 bps as of the end of the reporting period. (One basis point equals 0.01%.) Meanwhile, fundamentals remained solid, with leverage remaining low and coverage ratios remaining strong despite recession concerns and a series of rolling crises, including a string of regional bank failures, the debt ceiling debate, and still-high inflation. |
| ● | | After posting outflows of $47 billion during 2022, high yield bond mutual funds saw $11.7 billion of outflows during the first eight months of 2023. However, technicals remained supportive as subdued primary activity helped to offset the headwinds from negative fund flows. After totaling just $106.5 billion in 2022, high yield gross issuance totaled $111.2 billion through the first eight months of 2023, or just $40.8 billion excluding refinancing activity. |
| ● | | By quality, all credit tiers posted positive returns over the reporting period, with CCC-rated credits outperforming their B-rated and BB-rated peers. Meanwhile, the par-weighted US high yield default rate, including distressed exchanges, ended the reporting period at 2.40%, which was below its long-term historical average but 75 bps higher than the beginning of the year and 119 bps higher than a year earlier, according to J.P. Morgan. |
What worked?
| ● | | Overall sector allocation contributed to the Fund’s performance during the reporting period, with an overweight relative to the Index to building materials & home construction, along with underweights relative to the Index to media & entertainment and telecom being the largest contributors. |
| ● | | While overall security selection detracted from performance, selections in healthcare & pharmaceuticals, technology, and building materials & home construction contributed. |
| ● | | In individual security selection, positioning in Bausch Health Americas Inc. (healthcare & pharmaceuticals), Altice France Holding SA (telecom), and Lumen Technologies Inc. (telecom) were among the largest contributors to performance. |
What didn’t work?
| ● | | Overall security selection was the largest detractor from the Fund’s performance during the reporting period, with selections in media & entertainment, telecom, and upstream energy detracting the most. |
PGIM Fixed Income ETFs 15
Strategy and Performance Overview* (continued)
| ● | | While overall sector allocation contributed, underweights relative to the Index to gaming/lodging/leisure and transportation & environment services, along with an overweight to cable & satellite, detracted. |
| ● | | In individual security selection, positioning in Diamond Sports Group LLC (media & entertainment), Digicel Ltd. (telecom), and Venator Materials LLC (chemicals) detracted from results. |
| ● | | Having less beta, on average, in the Fund relative to the Index over the reporting period had a negative impact on returns. (Beta is a measure of the volatility or risk of a security or portfolio compared to the market or index.) |
Did the Fund use derivatives?
The Fund used credit index derivatives and interest rate futures to manage its overall risk profile during the reporting period, the aggregate impact of which was positive.
Current outlook
| ● | | While PGIM Fixed Income expects to see some deterioration of fundamentals, some mitigating factors will likely keep US high yield spreads from widening sharply from current levels. The market is of a higher quality than prior cycles, with BB-rated credits comprising nearly 50% of the market, net leverage remaining near all-time lows, and interest coverage near all-time highs. Meanwhile, the technical backdrop remains supportive due to a variety of factors, including lower gross new issuance and sizeable rising stars leading to a meaningful supply deficit and an overall shrinking high yield market. |
| ● | | PGIM Fixed Income does not expect defaults to be as severe as in previous downturns due to the strength of most issuers’ balance sheets and the absence of a near-term maturity wall, as many issuers have already termed out debt at low interest rates. Should the economy follow its base-case recession scenario, PGIM Fixed Income expects defaults to remain manageable, rising to 5% over the next 12 months. |
| ● | | While the short-term outlook is somewhat positive, PGIM Fixed Income forecasts a flat excess return over the next 12 months. In terms of positioning, PGIM Fixed Income remains defensive but is looking to opportunistically add higher-quality and short-duration risk on pullbacks from here. |
*This strategy and performance overview, which discusses what strategies or holdings (including derivatives, if applicable) affected the Fund’s performance, is compiled based on how the Fund performed relative to the Fund’s benchmark index and is viewed for performance attribution purposes at the aggregate Fund level, which in most instances will not directly correlate to the amounts disclosed in the Statement of Operations which conform to US generally accepted accounting principles.
16 Visit our website at pgim.com/investments
PGIM Active Aggregate Bond ETF
Your Fund’s Performance (unaudited)
Performance data quoted represent past performance. Past performance does not guarantee future results. The investment return and principal value of an investment will fluctuate so that an investor’s shares, when sold or redeemed, may be worth more or less than their original cost. Current performance may be lower or higher than the past performance data quoted. An investor may obtain performance data as of the most recent month-end by visiting our website at pgim.com/investments or by calling (800) 225-1852.
| | | | |
| |
| | | Average Annual Total Returns as of 8/31/23 |
| | |
| | | One Year (%) | | Since Inception (%) |
| | |
Net Asset Value (NAV) | | -0.92 | | -4.84 (4/12/2021) |
| | |
Market Price* | | -0.79 | | -4.78 (4/12/2021) |
| | |
Bloomberg US Aggregate Bond Index | | | | |
| | |
| | | -1.19 | | -4.33 |
*The market price is determined using the midpoint between the highest bid and the lowest offer on the listing exchange, as of the time that the Fund’s NAV is calculated. The first day of secondary market trading is typically several days after the date on which the Fund commenced investment operations; therefore, the NAV of the Fund is used as a proxy for the period from inception of investment operations to the first day of secondary market trading to calculate the market price returns.
The returns in the table do not reflect the deduction of taxes that a shareholder would pay on Fund distributions or following the sale of Fund shares.
Market returns do not include brokerage commissions that may be payable on secondary market transactions. If brokerage commissions were included, market returns would be lower. Market and NAV returns assume that dividends and capital gain distributions, if any, have been reinvested in the Fund at market price and NAV, respectively.
PGIM Fixed Income ETFs 17
PGIM Active Aggregate Bond ETF
Your Fund’s Performance (continued)
Growth of a $10,000 Investment (unaudited)
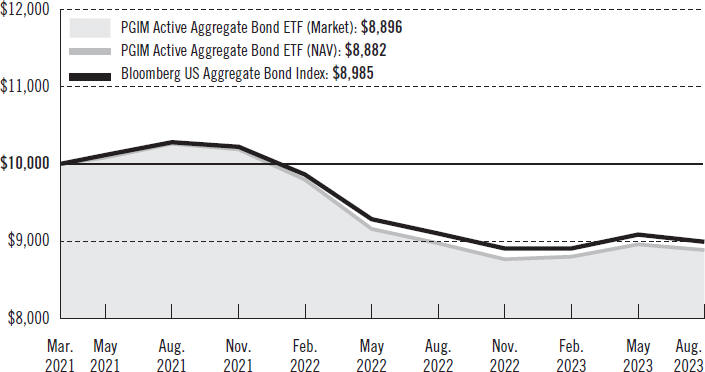
The graph compares a $10,000 investment in the Fund with a similar investment in the Bloomberg US Aggregate Bond Index by portraying the initial account values at the commencement of operations (April 12, 2021) and the account values at the end of the current fiscal year (August 31, 2023) as measured on a quarterly basis. The Fund assumes an initial investment on April 15, 2021, while the the Index assumes that the initial investment occurred on March 31, 2021. For purposes of the graph, and unless otherwise indicated, it has been assumed that (a) all recurring fees (including management fees) were deducted and (b) all dividends and distributions were reinvested. Without waiver of fees and/or expense reimbursements, if any, the returns would have been lower.
Past performance does not predict future performance. Total returns and the ending account values in the graphs include changes in share price and reinvestment of dividends and capital gains distributions in a hypothetical investment for the periods shown. The Fund’s total returns do not reflect the deduction of income taxes on an individual’s investment. Taxes may reduce your actual investment returns on income or gains paid by the Fund or any gains you may realize if you sell your shares.
18 Visit our website at pgim.com/investments
Benchmark Definition
Bloomberg US Aggregate Bond Index—The Bloomberg US Aggregate Bond Index is unmanaged and represents securities that are taxable and US dollar denominated. It covers the US investment-grade fixed rate bond market, with index components for government and corporate securities, mortgage pass-through securities, and asset-backed securities.
Investors cannot invest directly in an index. The returns for the Index would be lower if they included the effects of operating expenses or taxes that may be paid by an investor.
| | | | |
| |
Credit Quality expressed as a percentage of total investments as of 8/31/23 (%) | | | | |
| |
AAA | | | 65.5 | |
| |
AA | | | 6.2 | |
| |
A | | | 11.3 | |
| |
BBB | | | 16.2 | |
| |
Cash/Cash Equivalents | | | 0.8 | |
| | |
Total | | | 100.0 | |
Credit ratings reflect the highest rating assigned by a nationally recognized statistical rating organization (NRSRO) such as Moody’s Investors Service, Inc. (Moody’s), S&P Global Ratings (S&P), or Fitch Ratings Inc. (Fitch). Credit ratings reflect the common nomenclature used by both S&P and Fitch. Where applicable, ratings are converted to the comparable S&P/Fitch rating tier nomenclature. These rating agencies are independent and are widely used. The Not Rated category consists of securities that have not been rated by an NRSRO. Credit ratings are subject to change.
| | | | | | | | | | | | |
|
| Distributions and Yields as of 8/31/23 | |
| | | |
| | | | | | | SEC 30-Day | | | | SEC 30-Day | |
| | | Total Dividends Paid | | | | Subsidized | | | | Unsubsidized | |
| | | |
| | | for One Year ($) | | | | Yield* (%) | | | | Yield** (%) | |
| | | |
| | | 1.47 | | | | 4.69 | | | | 4.69 | |
*SEC 30-Day Subsidized Yield (%)—A standardized yield calculation created by the Securities and Exchange Commission, it reflects the income earned during a 30-day period, after the deduction of the Fund’s net expenses (net of any expense waivers or reimbursements). The investor experience is represented by the SEC 30-Day Subsidized Yield.
**SEC 30-Day Unsubsidized Yield (%)—A standardized yield calculation created by the Securities and Exchange Commission, it reflects the income earned during a 30-day period, after the deduction of the Fund’s gross expenses. The investor experience is represented by the SEC 30-Day Subsidized Yield.
PGIM Fixed Income ETFs 19
Strategy and Performance Overview*
(unaudited)
How did the Fund perform?
The PGIM Active Aggregate Bond ETF returned -0.92% based on net asset value in the 12-month reporting period that ended August 31, 2023, outperforming the -1.19% return of the Bloomberg US Aggregate Bond Index (the Index).
What were the market conditions?
| ● | | While there was no shortage of fear in the bond markets during the reporting period, which was largely marked by an overhang of uncertainty and economic negatives, the interest rate volatility, COVID-19-era supply/demand imbalances, and steep losses that predominated during the first half of the reporting period showed signs of dissipating in the second half. |
| ● | | Despite a series of rolling crises—including a string of regional bank failures, the debt ceiling debate, ongoing recession concerns, and still-high inflation—the US economy avoided the worst of potential outcomes, and fixed income returns skewed largely positive over the last six months of the reporting period. |
| ● | | Against the backdrop of historic lows in unemployment and still-high inflation, the US Federal Reserve (the Fed) continued its monetary tightening path, raising interest rates by an additional 300 basis points (bps) in a succession of rate hikes over the reporting period. (One basis point equals 0.01%.) Although the Fed raised interest rates by 25 bps and indicated that its inflation fight was not yet over at the July Federal Open Market Committee (FOMC) meeting, the main signal from the meeting was that the end of the rate-hiking cycle was likely close. |
| ● | | A sharply higher federal funds rate, coupled with macroeconomic uncertainty, led to enormous volatility being priced into developed market interest rates, with sharply higher front-end rates and lower long-dated yields. From –0.30% on August 31, 2022, the 10-year/2-year US Treasury spread declined to –0.76% at the end of the reporting period, while the 2-year US Treasury yield rose by 140 bps to end the reporting period at 4.85%. |
| ● | | Despite elevated volatility, US investment-grade corporate spreads tightened over the reporting period, as expectations for an economic hard landing moderated and fundamentals remained solid. Securitized credit spreads were mixed, with high-quality collateralized loan obligation (CLO) spreads tightening over the reporting period and commercial mortgage-backed securities (CMBS) spreads widening as the commercial real estate sector remained challenged. After posting steep losses in 2022, the emerging markets sector posted positive total returns, and spreads tightened through the first part of 2023 as headwinds turned to tailwinds. Meanwhile, agency mortgage-backed securities (MBS) underperformed versus US Treasuries over the reporting period, as elevated interest rate volatility weighed on the sector over the first half of the reporting period. |
20 Visit our website at pgim.com/investments
What worked?
| ● | | Overall security selection and sector allocation both contributed to the Fund’s performance over the reporting period. Within security selection, selections in investment-grade corporates, Treasuries, and emerging markets contributed the most. |
| ● | | Within sector allocation, overweights relative to the Index to CLOs, municipal bonds, and asset-backed securities (ABS) contributed the most. |
| ● | | Within credit, positioning in foreign non-corporates, midstream energy, and banking contributed to results. |
| ● | | In individual security selection, the Fund benefited from positioning in J.P Morgan Chase &Co. (banking), Toll Brothers Finance Corp. (building materials & home construction), and Mexico City Airport Trust (foreign non-corporates). |
What didn’t work?
| ● | | While overall security selection contributed to the Fund’s performance during the reporting period, selection in MBS and municipal bonds detracted from performance. |
| ● | | While overall sector allocation contributed, an underweight to investment-grade corporates relative to the Index detracted from performance. |
| ● | | Within credit, positioning in electric utilities was a modest detractor. |
| ● | | In individual security selection, the Fund’s positioning in Berkshire Hathaway Inc. (electric utilities), Oracle Corp. (technology), and The Republic of Indonesia detracted from performance. |
| ● | | The Fund’s yield curve and duration positioning detracted from performance during the reporting period. (A yield curve is a line graph that illustrates the relationship between the yields and maturities of fixed income securities. It is created by plotting the yields of different maturities for the same type of bonds.) (Duration measures the sensitivity of the price—the value of principal—of a bond to a change in interest rates.) |
Did the Fund use derivatives?
The Fund uses derivatives when they facilitate implementation of the overall investment approach. During the reporting period, the Fund used interest rate futures and swaps to help manage duration positioning and yield curve exposure. In aggregate, these positions contributed to performance.
Current outlook
| ● | | Although the rate-hike debate continues for the Fed, the increments of its hikes are getting smaller, and it declined to raise rates at all at its June 2023 FOMC meeting—signs that most of the increases are behind us and that the hikes to come will increasingly be “fine-tuning” exercises. With the prospect of balance returning to the labor market, PGIM Fixed Income sees a path for core personal consumption expenditures to decelerate below 3.0% by the end of 2023, driven lower by core non-housing services prices. |
PGIM Fixed Income ETFs 21
Strategy and Performance Overview* (continued)
| ● | | Clear and sustained evidence of a downshift on inflation, coupled with below-trend growth, should be enough, in PGIM Fixed Income’s view, for the Fed to pause its rate-hike campaign at 5.5%, prior to initiating a 50–75 bps fine-tuning campaign of cuts as early as the fourth quarter of 2023. |
| ● | | PGIM Fixed Income sees the US yield curve remaining solidly inverted due to only marginal repricing at the front end. Meanwhile, PGIM Fixed Income believes demand at the back end of the curve should remain consistent—particularly given the relatively high level of rates compared to past years—based on the rolling series of crises that continue to emerge but have yet to produce the more-feared outcomes. |
| ● | | With the pace of central bank tightening expected to dramatically downshift in the quarters ahead, and given PGIM Fixed Income’s expectation for interest rate volatility to continue to decline, spreads should remain range bound or, more likely, narrow in the months ahead, boosting fixed income returns. The combination of increased income and the potential for capital appreciation creates an attractive total return profile for those with longer-term time horizons, in PGIM Fixed Income’s view. |
| ● | | PGIM Fixed Income maintains its positive view of the spread sectors over the medium to long term, and the Fund is overweight investment-grade corporates and securitized products (CLOs, CMBS, ABS). The Fund continues to hold a significant underweight to US Treasuries in favor of more attractive opportunities across spread sectors. |
*This strategy and performance overview, which discusses what strategies or holdings (including derivatives, if applicable) affected the Fund’s performance, is compiled based on how the Fund performed relative to the Fund’s benchmark index and is viewed for performance attribution purposes at the aggregate Fund level, which in most instances will not directly correlate to the amounts disclosed in the Statement of Operations which conform to US generally accepted accounting principles.
22 Visit our website at pgim.com/investments
PGIM Total Return Bond ETF
Your Fund’s Performance (unaudited)
Performance data quoted represent past performance. Past performance does not guarantee future results. The investment return and principal value of an investment will fluctuate so that an investor’s shares, when sold, may be worth more or less than their original cost. Current performance may be lower or higher than the past performance data quoted. An investor may obtain performance data as of the most recent month-end by visiting our website at pgim.com/investments or by calling (800) 225-1852.
| | | | |
| |
| | | Average Annual Total Returns as of 8/31/23 |
| | |
| | | One Year (%) | | Since Inception (%) |
| | |
Net Asset Value (NAV) | | 0.27 | | -7.40 (12/2/2021) |
| | |
Market Price* | | 0.18 | | -7.37 (12/2/2021) |
| | |
Bloomberg US Aggregate Bond Index | | | | |
| | |
| | | -1.19 | | -7.07 |
*The market price is determined using the midpoint between the highest bid and the lowest offer on the listing exchange, as of the time that the Fund’s NAV is calculated. The first day of secondary market trading is typically several days after the date on which the Fund commenced investment operations; therefore, the NAV of the Fund is used as a proxy for the period from inception of investment operations to the first day of secondary market trading to calculate the market price returns.
The returns in the table do not reflect the deduction of taxes that a shareholder would pay on Fund distributions or following the sale of Fund shares.
Market returns do not include brokerage commissions that may be payable on secondary market transactions. If brokerage commissions were included, market returns would be lower. Market and NAV returns assume that dividends and capital gain distributions, if any, have been reinvested in the Fund at market price and NAV, respectively.
PGIM Fixed Income ETFs 23
PGIM Total Return Bond ETF
Your Fund’s Performance (continued)
Growth of a $10,000 Investment (unaudited)
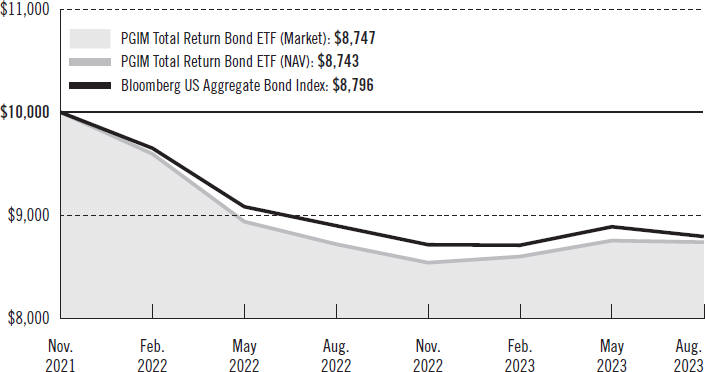
The graph compares a $10,000 investment in the Fund with a similar investment in the Bloomberg US Aggregate Bond Index by portraying the initial account values at the commencement of operations (December 2, 2021) and the account values at the end of the current fiscal year (August 31, 2023) as measured on a quarterly basis. The Fund assumes an initial investment on December 8, 2021, while the Index assumes that the initial investment occurred on November 30, 2021. For purposes of the graph, and unless otherwise indicated, it has been assumed that (a) all recurring fees (including management fees) were deducted and (b) all dividends and distributions were reinvested. Without waiver of fees and/or expense reimbursements, if any, the returns would have been lower.
Past performance does not predict future performance. Total returns and the ending account values in the graphs include changes in share price and reinvestment of dividends and capital gains distributions in a hypothetical investment for the periods shown. The Fund’s total returns do not reflect the deduction of income taxes on an individual’s investment. Taxes may reduce your actual investment returns on income or gains paid by the Fund or any gains you may realize if you sell your shares.
24 Visit our website at pgim.com/investments
Benchmark Definition
Bloomberg US Aggregate Bond Index—The Bloomberg US Aggregate Bond Index is unmanaged and represents securities that are taxable and US dollar denominated. It covers the US investment-grade fixed rate bond market, with index components for government and corporate securities, mortgage pass-through securities, and asset-backed securities.
Investors cannot invest directly in an index. The returns for the Index would be lower if they included the effects of operating expenses or taxes that may be paid by an investor.
PGIM Fixed Income ETFs 25
PGIM Total Return Bond ETF
Your Fund’s Performance (continued)
| | | | |
| |
Credit Quality expressed as a percentage of total investments as of 8/31/23 (%) | | | | |
| |
AAA | | | 53.5 | |
| |
AA | | | 6.8 | |
| |
A | | | 9.1 | |
| |
BBB | | | 20.6 | |
| |
BB | | | 6.1 | |
| |
B | | | 2.9 | |
| |
CCC | | | 0.2 | |
| |
Not Rated | | | 0.6 | |
| |
Cash/Cash Equivalents | | | 0.2 | |
| | |
Total | | | 100.0 | |
Credit ratings reflect the highest rating assigned by a nationally recognized statistical rating organization (NRSRO) such as Moody’s Investors Service, Inc. (Moody’s), S&P Global Ratings (S&P), or Fitch Ratings Inc. (Fitch). Credit ratings reflect the common nomenclature used by both S&P and Fitch. Where applicable, ratings are converted to the comparable S&P/Fitch rating tier nomenclature. These rating agencies are independent and are widely used. The Not Rated category consists of securities that have not been rated by an NRSRO. Credit ratings are subject to change.
| | | | | | | | | | | | |
|
Distributions and Yields as of 8/31/23 | |
| | | |
| | | | | | | SEC 30-Day | | | | SEC 30-Day | |
| | | Total Dividends Paid | | | | Subsidized | | | | Unsubsidized | |
| | | |
| | | for One Year ($) | | | | Yield* (%) | | | | Yield** (%) | |
| | | |
| | | 2.12 | | | | 5.33 | | | | 5.33 | |
*SEC 30-Day Subsidized Yield (%)—A standardized yield calculation created by the Securities and Exchange Commission, it reflects the income earned during a 30-day period, after the deduction of the Fund’s net expenses (net of any expense waivers or reimbursements). The investor experience is represented by the SEC 30-Day Subsidized Yield.
**SEC 30-Day Unsubsidized Yield (%)—A standardized yield calculation created by the Securities and Exchange Commission, it reflects the income earned during a 30-day period, after the deduction of the Fund’s gross expenses. The investor experience is represented by the SEC 30-Day Subsidized Yield.
26 Visit our website at pgim.com/investments
Strategy and Performance Overview*
(unaudited)
How did the Fund perform?
The PGIM Total Return Bond ETF returned 0.27% based on net asset value in the 12-month reporting period that ended August 31, 2023, outperforming the –1.19% return of the Bloomberg US Aggregate Bond Index (the Index).
What were the market conditions?
| ● | | While there was no shortage of fear in the bond markets during the reporting period, which was largely marked by an overhang of uncertainty and economic negatives, the interest rate volatility, COVID-19-era supply/demand imbalances, and steep losses that predominated during the first half of the reporting period showed signs of dissipating in the second half. |
| ● | | Despite a series of rolling crises—including a string of regional bank failures, the debt ceiling debate, ongoing recession concerns, and still-high inflation—the US economy avoided the worst of potential outcomes, and fixed income returns skewed largely positive over the last six months of the reporting period. |
| ● | | Against the backdrop of historic lows in unemployment and still-high inflation, the US Federal Reserve (the Fed) continued its monetary tightening path, raising interest rates by an additional 300 basis points (bps) in a succession of rate hikes over the reporting period. (One basis point equals 0.01%.) Although the Fed raised interest rates by 25 bps and indicated that its inflation fight was not yet over at the July Federal Open Market Committee (FOMC) meeting, the main signal from the meeting was that the end of the rate-hiking cycle was likely close. |
| ● | | A sharply higher federal funds rate, coupled with macroeconomic uncertainty, led to enormous volatility being priced into developed market interest rates, with sharply higher front-end rates and lower long-dated yields. From –0.30% on August 31, 2022, the 10-year/2-year US Treasury spread declined to –0.76% at the end of the reporting period, while the 2-year US Treasury yield rose by 140 bps to end the reporting period at 4.85%. |
| ● | | Despite elevated volatility, US investment-grade corporate spreads tightened over the reporting period, as expectations for an economic hard landing moderated, and fundamentals remained solid. US high yield bonds posted gains over the reporting period amid limited new issuance, resilient economic data, and an ongoing supply deficit. Securitized credit spreads were mixed, with high-quality collateralized loan obligation (CLO) spreads tightening over the reporting period and commercial mortgage-backed securities (CMBS) spreads widening as the commercial real estate sector remained challenged. After posting steep losses in 2022, the emerging markets sector posted positive total returns, and spreads tightened through the first part of 2023 as headwinds turned to tailwinds. Meanwhile, agency mortgage-backed securities (MBS) underperformed versus US Treasuries over the reporting period, as elevated interest rate volatility weighed on the sector over the first half of the reporting period. |
PGIM Fixed Income ETFs 27
Strategy and Performance Overview* (continued)
What worked?
| ● | | Overall sector allocation and security selection both contributed to the Fund’s performance during the reporting period. Within sector allocation, overweights relative to the Index to high yield, CLOs, and municipal bonds, along with an underweight relative to the Index to MBS, contributed the most. |
| ● | | Within security selection, selections in investment-grade corporates, CLOs, non-agency MBS, and emerging markets contributed the most. |
| ● | | Within credit, positioning in foreign non-corporates, banking, and building materials & home construction contributed to results. |
| ● | | In individual security selection, the Fund benefited from positioning in JP Morgan Chase &Co. (banking), UBS Group AG (banking), and the Republic of Serbia. |
| ● | | The Fund’s yield curve positioning, particularly in US rates, contributed to returns. (A yield curve is a line graph that illustrates the relationship between the yields and maturities of fixed income securities. It is created by plotting the yields of different maturities for the same type of bonds.) |
What didn’t work?
| ● | | While overall sector allocation contributed to the Fund’s performance during the reporting period, an underweight relative to the Index to investment-grade corporates detracted from returns. |
| ● | | While overall security selection contributed, selections in US Treasuries and MBS detracted. |
| ● | | Within credit, positioning in cable & satellite and media & entertainment detracted. |
| ● | | In individual security selection, the Fund’s positioning in CSC Holdings LLC (cable & satellite), Diamond Sports Group LLC (media & entertainment), and MPT Operating Partnership LP (REITS) detracted from performance. |
| ● | | The Fund’s duration positioning detracted from returns during the reporting period. (Duration measures the sensitivity of the price—the value of principal—of a bond to a change in interest rates.) |
Did the Fund use derivatives?
The Fund uses derivatives when they facilitate implementation of the overall investment approach. During the reporting period, the Fund used interest rate futures and swaps to help manage duration positioning and yield curve exposure. In aggregate, these positions detracted from performance. The Fund also held positions in a credit default swap index (CDX) to hedge credit risk, which also detracted from performance.
Current outlook
| ● | | Although the rate-hike debate continues for the Fed, the increments of its hikes are getting smaller, and it declined to raise rates at all at its June 2023 FOMC meeting—signs that most of the increases are behind us and that the hikes to come will increasingly be “fine-tuning” exercises. With the prospect of balance returning to the |
28 Visit our website at pgim.com/investments
| | labor market, PGIM Fixed Income sees a path for core personal consumption expenditures to decelerate below 3.0% by the end of 2023, driven lower by core non-housing services prices. |
| ● | | Clear and sustained evidence of a downshift on inflation, coupled with below-trend growth, should be enough, in PGIM Fixed Income’s view, for the Fed to pause its rate-hike campaign at 5.5%, prior to initiating a 50–75 bps fine-tuning campaign of cuts as early as the fourth quarter of 2023. |
| ● | | PGIM Fixed Income sees the US yield curve remaining solidly inverted due to only marginal repricing at the front end. Meanwhile, PGIM Fixed Income believes demand at the back end of the curve should remain consistent—particularly given the relatively high level of rates compared to past years—based on the rolling series of crises that continue to emerge but have yet to produce the more-feared outcomes. |
| ● | | With the pace of central bank tightening expected to dramatically downshift in the quarters ahead, and given PGIM Fixed Income’s expectation for interest rate volatility to continue to decline, spreads should remain range bound or, more likely, narrow in the months ahead, boosting fixed income returns. The combination of increased income and the potential for capital appreciation creates an attractive total return profile for those with longer-term time horizons, in PGIM Fixed Income’s view. |
| ● | | PGIM Fixed Income maintains its positive view of the spread sectors over the medium to long term, and the Fund is overweight investment-grade corporates, high yield, securitized products (CLOs, CMBS), and emerging markets. The Fund holds a significant underweight to MBS and US Treasuries in favor of more attractive opportunities across spread sectors. |
*This strategy and performance overview, which discusses what strategies or holdings (including derivatives, if applicable) affected the Fund’s performance, is compiled based on how the Fund performed relative to the Fund’s benchmark index and is viewed for performance attribution purposes at the aggregate Fund level, which in most instances will not directly correlate to the amounts disclosed in the Statement of Operations which conform to US generally accepted accounting principles.
PGIM Fixed Income ETFs 29
PGIM Floating Rate Income ETF
Your Fund’s Performance (unaudited)
Performance data quoted represent past performance. Past performance does not guarantee future results. The investment return and principal value of an investment will fluctuate so that an investor’s shares, when sold, may be worth more or less than their original cost. Current performance may be lower or higher than the past performance data quoted. An investor may obtain performance data as of the most recent month-end by visiting our website at pgim.com/investments or by calling (800) 225-1852.
| | | | |
| |
| | | Average Annual Total Returns as of 8/31/23 |
| | |
| | | One Year (%) | | Since Inception (%) |
| | |
Net Asset Value (NAV) | | 9.32 | | 7.87 (5/17/2022) |
| | |
Market Price* | | 9.67 | | 8.12 (5/17/2022) |
| | |
Credit Suisse Leveraged Loan Index | | | | |
| | |
| | | 9.08 | | 8.32 |
*The market price is determined using the midpoint between the highest bid and the lowest offer on the listing exchange, as of the time that the Fund’s NAV is calculated. The first day of secondary market trading is typically several days after the date on which the Fund commenced investment operations; therefore, the NAV of the Fund is used as a proxy for the period from inception of investment operations to the first day of secondary market trading to calculate the market price returns.
The returns in the table do not reflect the deduction of taxes that a shareholder would pay on Fund distributions or following the sale of Fund shares.
Market returns do not include brokerage commissions that may be payable on secondary market transactions. If brokerage commissions were included, market returns would be lower. Market and NAV returns assume that dividends and capital gain distributions, if any, have been reinvested in the Fund at market price and NAV, respectively.
30 Visit our website at pgim.com/investments
Growth of a $10,000 Investment (unaudited)
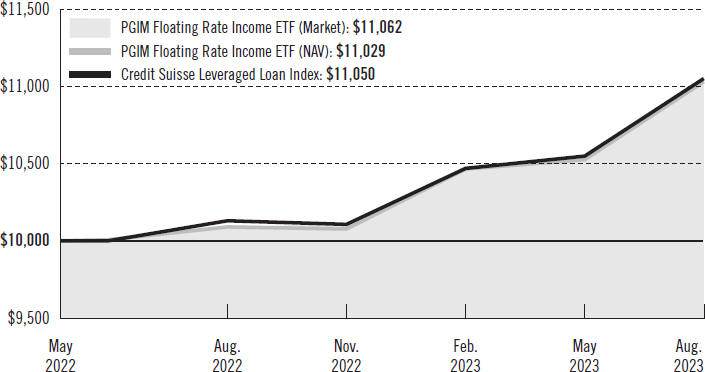
The graph compares a $10,000 investment in the Fund with a similar investment in the Credit Suisse Leveraged Loan Index by portraying the initial account values at the commencement of operations (May 17, 2022) and the account values at the end of the current fiscal year (August 31, 2023) as measured on a quarterly basis. The Fund assumes an initial investment on May 17, 2022, while the Index assumes that the initial investment occurred on May 31, 2022. For purposes of the graph, and unless otherwise indicated, it has been assumed that (a) all recurring fees (including management fees) were deducted and (b) all dividends and distributions were reinvested. Without waiver of fees and/or expense reimbursements, if any, the returns would have been lower.
Past performance does not predict future performance. Total returns and the ending account values in the graphs include changes in share price and reinvestment of dividends and capital gains distributions in a hypothetical investment for the periods shown. The Fund’s total returns do not reflect the deduction of income taxes on an individual’s investment. Taxes may reduce your actual investment returns on income or gains paid by the Fund or any gains you may realize if you sell your shares.
PGIM Fixed Income ETFs 31
PGIM Floating Rate Income ETF
Your Fund’s Performance (continued)
Benchmark Definition
Credit Suisse Leveraged Loan Index—The Credit Suisse Leveraged Loan Index is an unmanaged index that represents the investable universe of the US dollar-denominated leveraged loan market.
Investors cannot invest directly in an index. The returns for the Index would be lower if they included the effects of operating expenses or taxes that may be paid by an investor.
| | | | |
| |
Credit Quality expressed as a percentage of total investments as of 8/31/23 (%) | | | | |
| |
AAA | | | 2.2 | |
| |
AA | | | 7.1 | |
| |
A | | | 1.3 | |
| |
BBB | | | 14.5 | |
| |
BB | | | 29.4 | |
| |
B | | | 43.5 | |
| |
CCC | | | 2.0 | |
| |
Not Rated | | | 0.1 | |
| |
Cash/Cash Equivalents | | | -0.1 | |
| | |
Total | | | 100.0 | |
Credit ratings reflect the highest rating assigned by a nationally recognized statistical rating organization (NRSRO) such as Moody’s Investors Service, Inc. (Moody’s), S&P Global Ratings (S&P), or Fitch Ratings Inc. (Fitch). Credit ratings reflect the common nomenclature used by both S&P and Fitch. Where applicable, ratings are converted to the comparable S&P/Fitch rating tier nomenclature. These rating agencies are independent and are widely used. The Not Rated category consists of securities that have not been rated by an NRSRO. Credit ratings are subject to change.
| | | | | | | | | | | | |
|
Distributions and Yields as of 8/31/23 | |
| | | |
| | | | | | | SEC 30-Day | | | | SEC 30-Day | |
| | | Total Dividends Paid | | | | Subsidized | | | | Unsubsidized | |
| | | |
| | | for One Year ($) | | | | Yield* (%) | | | | Yield** (%) | |
| | | |
| | | 3.93 | | | | 8.37 | | | | 8.37 | |
*SEC 30-Day Subsidized Yield (%)—A standardized yield calculation created by the Securities and Exchange Commission, it reflects the income earned during a 30-day period, after the deduction of the Fund’s net expenses (net of any expense waivers or reimbursements). The investor experience is represented by the SEC 30-Day Subsidized Yield.
**SEC 30-Day Unsubsidized Yield (%)—A standardized yield calculation created by the Securities and Exchange Commission, it reflects the income earned during a 30-day period, after the deduction of the Fund’s gross expenses. The investor experience is represented by the SEC 30-Day Subsidized Yield.
32 Visit our website at pgim.com/investments
Strategy and Performance Overview*
(unaudited)
How did the Fund perform?
The PGIM Floating Rate Income ETF returned 9.32% based on net asset value in the 12-month reporting period that ended August 31, 2023, outperforming the 9.08% return of the Credit Suisse Leveraged Loan Index (the Index).
What were the market conditions?
| ● | | US leveraged loans posted positive total returns over the reporting period amid rising short-term interest rates, robust collateralized loan obligation (CLO) demand, negligible net new supply, and resilient economic data. |
| ● | | Most of the Index’s gains during the reporting period were driven by interest income. By quality, CCC-rated loans outperformed both B-rated loans and BB-rated loans, as investors reached down the ratings spectrum in search of yield. |
| ● | | Despite sizeable outflows from bank loan mutual funds and ETFs as well as significant intra-quarter volatility, an improved growth outlook, better-than-expected earnings, and a decline in interest rate volatility in the latter part of the reporting period drove loan prices higher. The average price of all loans in the Index began the reporting period at $94.19, declining to a 12-month low of $91.58 in the fourth quarter of 2022 before ending the reporting period at $94.54. |
| ● | | Shifting monetary policy expectations, combined with a series of crises—including a string of regional bank failures and the debt ceiling debate—resulted in sizeable outflows from bank loan mutual funds and ETFs throughout much of the reporting period. Following a stretch of 15 consecutive monthly outflows totaling $56.7 billion, loan funds saw a $215 million inflow in August 2023. Meanwhile, CLO formation in 2023 slowed from the pace in 2022 but showed signs of accelerating in August 2023. |
| ● | | While gross loan issuance remained relatively stable, net new supply declined sharply. Through the first eight months of 2023, leveraged loan issuance totaled $199.8 billion, up 1.7% from the year-earlier period, while net new supply totaled $41.9 billion, down 69.6% from the year-earlier period. |
| ● | | Meanwhile, average spreads ended the reporting period at 556 basis points (bps), down from 564 bps at the beginning of the reporting period; and average yields rose to approximately 9.9% at the end of the reporting period from approximately 9.2% at the beginning of the reporting period, as the impact of rising interest rates contributed to higher all-in coupons. (One basis point equals 0.01%.) |
| ● | | Despite broad market volatility, solid credit fundamentals and a lack of near-term maturities continued to keep default rates below the long-term average of 3.1%. The par-weighted loan default rate, including distressed exchanges, ended the reporting period at 2.92%, up 156 bps from August 2022. |
What worked?
| ● | | Overall, security selection was the largest contributor to the Fund’s performance during the reporting period, with selections in banking, technology, and telecom contributing the most. |
PGIM Fixed Income ETFs 33
Strategy and Performance Overview* (continued)
| ● | | From a single-name credit perspective, positioning in JP Morgan Chase & Co. (banking), Lumen Technologies Inc. (telecom), and Cinemark USA Inc. (gaming, lodging & leisure) added value. |
| ● | | While overall sector allocation detracted, underweights relative to the Index to healthcare & pharmaceuticals and technology, along with overweights relative to the Index to electric utilities and paper & packaging, contributed to performance. |
What didn’t work?
| ● | | Overall, sector allocation detracted from the Fund’s performance during the reporting period. Overweights relative to the Index to banking and telecom, along with an underweight relative to the Index to finance & insurance, were the largest detractors. |
| ● | | While overall security selection contributed to performance, selections in media & entertainment, electric utilities, and paper & packaging detracted. |
| ● | | US Bancorp (banking), City Brewing Company LLC (consumer non-cyclical), and Sound Inpatient Physicians Holdings LLC (healthcare & pharmaceuticals) were the largest single-name detractors from performance. |
| ● | | The average market risk of the Fund was lower than that of the Index over the reporting period, which also detracted from performance. |
Did the Fund use derivatives?
The Fund held interest rate futures and swaps to help manage the portfolio’s duration and yield curve exposure and to reduce its sensitivity to changes in the levels of interest rates. (Duration measures the sensitivity of the price—the value of principal—of a bond to a change in interest rates.) (A yield curve is a line graph that illustrates the relationship between the yields and maturities of fixed income securities. It is created by plotting the yields of different maturities for the same type of bonds.) Overall, this strategy had a positive impact on performance during the reporting period. The Fund also held positions in a high yield credit default swap index (CDX) to hedge credit risk. This strategy had a positive impact on performance.
Current outlook
| ● | | With its outlook tempered by recession risk, and against the backdrop of strong total returns so far this year, PGIM Fixed Income recently boosted its 2023 total return forecast to 8.75% from a range of 6% to 6.5%, supported by high all-in current coupons of approximately 8.9% and a yield-to-maturity of over 10%. |
| ● | | Ratings downgrades have started to pick up, and PGIM Fixed Income expects ratings agencies to downgrade credits more quickly than they upgrade them going forward. Given that the loan market is of lower quality than in prior cycles, with sponsor-owned low single-B-rated loans comprising a large portion of the overall market and the expectation that the rising cost of capital will reduce free cash flow, PGIM Fixed Income expects loan default rates to rise to a range of 4% to 4.5% by year-end 2023. |
34 Visit our website at pgim.com/investments
| ● | | Given the macroeconomic concerns, PGIM Fixed Income favors public BB-rated and high single-B-rated loans over sponsor-owned, low single-B-rated and CCC-rated loans, as those lower-quality loans are expected to be most impacted by the more challenging fundamental backdrop. Credit selection and deep, fundamental credit research/modeling is becoming increasingly important, and the avoidance of defaults is expected to be the biggest driver of alpha over the next 12 to 24 months. |
*This strategy and performance overview, which discusses what strategies or holdings (including derivatives, if applicable) affected the Fund’s performance, is compiled based on how the Fund performed relative to the Fund’s benchmark index and is viewed for performance attribution purposes at the aggregate Fund level, which in most instances will not directly correlate to the amounts disclosed in the Statement of Operations which conform to US generally accepted accounting principles.
PGIM Fixed Income ETFs 35
PGIM AAA CLO ETF
Your Fund’s Performance (unaudited)
Performance data quoted represent past performance. Past performance does not guarantee future results. The investment return and principal value of an investment will fluctuate so that an investor’s shares, when sold, may be worth more or less than their original cost. Current performance may be lower or higher than the past performance data quoted. An investor may obtain performance data as of the most recent month-end by visiting our website at pgim.com/investments or by calling (800) 225-1852.
| | |
| | | Total Returns as of 8/31/23* Since Inception (%) |
| |
Net Asset Value (NAV) | | 0.87 (7/19/2023) |
| |
Market Price** | | 0.92 (7/19/2023) |
| |
JP Morgan CLOIE AAA Index | | |
| | | 1.87 |
*Not annualized
**The market price is determined using the midpoint between the highest bid and the lowest offer on the listing exchange, as of the time that the Fund’s NAV is calculated. The first day of secondary market trading is typically several days after the date on which the Fund commenced investment operations; therefore, the NAV of the Fund is used as a proxy for the period from inception of investment operations to the first day of secondary market trading to calculate the market price returns.
The returns in the table do not reflect the deduction of taxes that a shareholder would pay on Fund distributions or following the sale of Fund shares.
Market returns do not include brokerage commissions that may be payable on secondary market transactions. If brokerage commissions were included, market returns would be lower. Market and NAV returns assume that dividends and capital gain distributions, if any, have been reinvested in the Fund at market price and NAV, respectively.
36 Visit our website at pgim.com/investments
Benchmark Definition
JP Morgan CLOIE AAA Index—The JP Morgan CLOIE AAA Index is a sub-component of the JP Morgan CLO Index (CLOIE) and covers securities in the US dollar-denominated CLO market. Index constituents consist of AAA rated floating-rate CLO securities from deals originated in post-crisis vintages, 2010 and later. The index utilizes a market-weighted methodology and is rebalanced monthly.
Investors cannot invest directly in an index. The returns for the Index would be lower if they included the effects of operating expenses or taxes that may be paid by an investor.
| | | | |
| |
Credit Quality expressed as a percentage of total investments as of 8/31/23 (%) | | | | |
| |
AAA | | | 98.7 | |
| |
Cash/Cash Equivalents | | | 1.3 | |
| | |
Total | | | 100.0 | |
Credit ratings reflect the highest rating assigned by a nationally recognized statistical rating organization (NRSRO) such as Moody’s Investors Service, Inc. (Moody’s), S&P Global Ratings (S&P), or Fitch Ratings Inc. (Fitch). Credit ratings reflect the common nomenclature used by both S&P and Fitch. Where applicable, ratings are converted to the comparable S&P/Fitch rating tier nomenclature. These rating agencies are independent and are widely used. The Not Rated category consists of securities that have not been rated by an NRSRO. Credit ratings are subject to change.
| | | | | | | | | | | | |
|
Distributions and Yields as of 8/31/23 | |
| | | |
| | | Total Dividends Paid
for One Month ($) | | | SEC 30-Day
Subsidized
Yield* (%) | | | SEC 30-Day
Unsubsidized
Yield** (%) | |
| | | |
| | | 0.00 | | | | 6.64 | | | | 6.64 | |
*SEC 30-Day Subsidized Yield (%)—A standardized yield calculation created by the Securities and Exchange Commission, it reflects the income earned during a 30-day period, after the deduction of the Fund’s net expenses (net of any expense waivers or reimbursements). The investor experience is represented by the SEC 30-Day Subsidized Yield.
**SEC 30-Day Unsubsidized Yield (%)—A standardized yield calculation created by the Securities and Exchange Commission, it reflects the income earned during a 30-day period, after the deduction of the Fund’s gross expenses. The investor experience is represented by the SEC 30-Day Subsidized Yield.
PGIM Fixed Income ETFs 37
Strategy and Performance Overview*
(unaudited)
How did the Fund perform?
The PGIM AAA CLO ETF returned 0.87% based on net asset value from its inception on July 19, 2023, through August 31, 2023 (the reporting period). Over the same period, the JP Morgan CLOIE AAA Index (the Index) returned 1.87%.
What were the market conditions?
| ● | | The overhang of uncertainty and economic negatives, interest rate volatility, and COVID-19-era supply/demand imbalances that prevailed through the first part of 2023 showed signs of dissipating during the reporting period. |
| ● | | US Treasuries sold off during the reporting period, and the yield curve steepened following a slew of encouraging economic news, including strong economic growth, a resilient labor market, and declining inflation. (A yield curve is a line graph that illustrates the relationship between the yields and maturities of fixed income securities. It is created by plotting the yields of different maturities for the same type of bonds.) US 10-year Treasury yields rose 34 basis points (bps) over the reporting period while US 2-year Treasury yields rose 11 bps, and the 2-year/10-year curve steepened to –0.76%. (One basis point equals 0.01%.) |
| ● | | Although the US Federal Reserve (the Fed) raised interest rates by 25 bps during the reporting period and indicated that its inflation fight was not yet over at the July 2023 Federal Open Market Committee (FOMC) meeting, the main signal from the meeting was that the end of the rate-hiking cycle was likely close. |
| ● | | Amid a generally more constructive tone in spread markets, PGIM Fixed Income saw a shift by investors to put money to work in floating rate products—specifically collateralized loan obligations (CLOs)—as the Fed signaled rates would remain higher for longer. Thus, CLO spreads remained resilient over the reporting period, with AAA-rated CLO spreads tightening approximately 10 bps since the Fund’s inception. |
What worked?
| ● | | Since the Fund’s inception, PGIM Fixed Income looked to capitalize on price appreciation throughout the rally. Thus, sourcing lower-dollar-priced AAA-rated tranches contributed to performance during the reporting period as prices rallied. |
| ● | | Additionally, PGIM Fixed Income looked to source a mix of assets in both the primary and secondary markets to balance the carry/convexity component of the Fund’s portfolio. (“Carry” is the coupon income received on a bond. “Convexity” measures the sensitivity of a bond’s duration to changes in yield.) |
What didn’t work?
| ● | | Ramping up of the Fund’s portfolio detracted 7 bps of excess returns over the reporting period due to wide bid/ask spreads. |
| ● | | Although the broader CLO market rallied throughout the reporting period, manager tiering (whereby the tranches of certain managers rallied more than others) was |
38 Visit our website at pgim.com/investments
| | prevalent. As the Fund ramped up, PGIM Fixed Income looked to invest in higher quality and in larger CLO managers, which had less price appreciation than smaller/lesser-known CLO managers. |
| ● | | PGIM Fixed Income opportunistically looked to cover the secondary AAA-rated short positioning in the primary market. Thus, as CLOs rallied during the Fund’s ramp-up period, those tranches marginally contributed to the Index’s performance. |
Did the Fund use derivatives?
The Fund did not use derivatives during the reporting period.
Current outlook
| ● | | Although the rate-hike debate continues for the Fed, the increments of its hikes are getting smaller—signs that most of the increases are behind us and that any hikes to come are likely to be “fine-tuning” exercises. With the prospect of balance returning to the labor market, PGIM Fixed Income sees a path for core personal consumption expenditures to decelerate below 3% by the end of 2023, driven lower by core non-housing services prices. |
| ● | | Clear and sustained evidence of a downshift in inflation, coupled with below-trend growth, should be enough, in PGIM Fixed Income’s view, for the Fed to pause its rate-hike campaign at 5.5% prior to initiating a 50 to 75 bps “fine-tuning” campaign of cuts as early as the fourth quarter of 2023. |
| ● | | PGIM Fixed Income believes senior CLO tranches remain attractive versus a variety of fixed income alternatives, including mezzanine tranches, on the basis of their high Sharpe ratios, favorable drawdown history, and robust structural protections. (A Sharpe ratio is a measure of risk-adjusted performance.) |
| ● | | Despite the general trend tighter over the past couple of months, PGIM Fixed Income remains opportunistic in the United States, as potential macroeconomic volatility still exists and deteriorating credit fundamentals on company bottom lines weigh on CLO valuations. |
| ● | | PGIM Fixed Income continues to favor high-quality bonds, which typically exhibit lower sensitivity to the underlying collateral. While underlying bank loans have been technically supported by low loan supply and strong demand, PGIM Fixed Income expects further deterioration in credit fundamentals, supporting its up-in-quality bias. |
*This strategy and performance overview, which discusses what strategies or holdings (including derivatives, if applicable) affected the Fund’s performance, is compiled based on how the Fund performed relative to the Fund’s benchmark index and is viewed for performance attribution purposes at the aggregate Fund level, which in most instances will not directly correlate to the amounts disclosed in the Statement of Operations which conform to US generally accepted accounting principles.
PGIM Fixed Income ETFs 39
PGIM Short Duration Multi-Sector Bond ETF
Your Fund’s Performance (unaudited)
Performance data quoted represent past performance. Past performance does not guarantee future results. The investment return and principal value of an investment will fluctuate so that an investor’s shares, when sold, may be worth more or less than their original cost. Current performance may be lower or higher than the past performance data quoted. An investor may obtain performance data as of the most recent month-end by visiting our website at pgim.com/investments or by calling (800) 225-1852.
| | |
| | | Total Returns as of 8/31/23* Since Inception (%) |
| |
Net Asset Value (NAV) | | 0.79 (7/19/2023) |
| |
Market Price** | | 0.88 (7/19/2023) |
| |
Bloomberg US Government/Credit 1-3 Year Index | | |
| |
| | | 0.35 |
*Not annualized
**The market price is determined using the midpoint between the highest bid and the lowest offer on the listing exchange, as of the time that the Fund’s NAV is calculated. The first day of secondary market trading is typically several days after the date on which the Fund commenced investment operations; therefore, the NAV of the Fund is used as a proxy for the period from inception of investment operations to the first day of secondary market trading to calculate the market price returns.
The returns in the table do not reflect the deduction of taxes that a shareholder would pay on Fund distributions or following the sale of Fund shares.
Market returns do not include brokerage commissions that may be payable on secondary market transactions. If brokerage commissions were included, market returns would be lower. Market and NAV returns assume that dividends and capital gain distributions, if any, have been reinvested in the Fund at market price and NAV, respectively.
40 Visit our website at pgim.com/investments
Benchmark Definition
Bloomberg US Government/Credit 1–3 Year Index—The Bloomberg US Government/Credit 1–3 Year Index is an unmanaged index considered representative of the performance of short-term US corporate bonds and US government bonds with maturities from one to three years.
Investors cannot invest directly in an index. The returns for the Index would be lower if they included the effects of operating expenses or taxes that may be paid by an investor.
| | | | |
| |
Credit Quality expressed as a percentage of total investments as of 8/31/23 (%) | | | | |
| |
AAA | | | 61.7 | |
| |
AA | | | 6.3 | |
| |
A | | | 7.5 | |
| |
BBB | | | 13.9 | |
| |
BB | | | 7.0 | |
| |
B | | | 4.0 | |
| |
CCC | | | 0.5 | |
| |
Cash/Cash Equivalents | | | -0.9 | |
| | |
Total | | | 100.0 | |
Credit ratings reflect the highest rating assigned by a nationally recognized statistical rating organization (NRSRO) such as Moody’s Investors Service, Inc. (Moody’s), S&P Global Ratings (S&P), or Fitch Ratings Inc. (Fitch). Credit ratings reflect the common nomenclature used by both S&P and Fitch. Where applicable, ratings are converted to the comparable S&P/Fitch rating tier nomenclature. These rating agencies are independent and are widely used. The Not Rated category consists of securities that have not been rated by an NRSRO. Credit ratings are subject to change.
| | | | | | | | | | | | |
|
Distributions and Yields as of 8/31/23 | |
| | | |
| | | Total Dividends Paid
for One Month ($) | | | SEC 30-Day
Subsidized
Yield* (%) | | | SEC 30-Day
Unsubsidized
Yield** (%) | |
| | | |
| | | 0.00 | | | | 5.30 | | | | 5.30 | |
*SEC 30-Day Subsidized Yield (%)—A standardized yield calculation created by the Securities and Exchange Commission, it reflects the income earned during a 30-day period, after the deduction of the Fund’s net expenses (net of any expense waivers or reimbursements). The investor experience is represented by the SEC 30-Day Subsidized Yield.
**SEC 30-Day Unsubsidized Yield (%)—A standardized yield calculation created by the Securities and Exchange Commission, it reflects the income earned during a 30-day period, after the deduction of the Fund’s gross expenses. The investor experience is represented by the SEC 30-Day Subsidized Yield.
PGIM Fixed Income ETFs 41
Strategy and Performance Overview*
(unaudited)
How did the Fund perform?
The PGIM Short Duration Multi-Sector Bond ETF returned 0.79% based on net asset value from the Fund’s inception on July 19, 2023, through August 31, 2023 (the reporting period). Over the same period, the Bloomberg US Government/Credit 1-3 Year Index (the Index) returned 0.35%.
What were the market conditions?
| ● | | The overhang of uncertainty and economic negatives, interest rate volatility, and COVID-19-era supply/demand imbalances that prevailed through the first part of 2023 showed signs of dissipating during the reporting period. |
| ● | | US Treasuries sold off during the reporting period, and the yield curve steepened following a slew of encouraging economic news, including strong economic growth, a resilient labor market, and declining inflation. (A yield curve is a line graph that illustrates the relationship between the yields and maturities of fixed income securities. It is created by plotting the yields of different maturities for the same type of bonds.) US 10-year Treasury yields rose 34 basis points (bps) over the reporting period while US 2-year Treasury yields rose 11 bps, and the 2-year/10-year curve steepened to –0.76%. (One basis point equals 0.01%.) |
| ● | | Although the US Federal Reserve (the Fed) raised interest rates by 25 bps during the reporting period and indicated that its inflation fight was not yet over at the July 2023 Federal Open Market Committee (FOMC) meeting, the main signal from the meeting was that the end of the rate-hiking cycle was likely close. |
| ● | | Amid a generally constructive tone in spread markets, US investment-grade corporate spreads tightened over the reporting period, as expectations for an economic hard landing moderated and fundamentals remained solid. Securitized credit spreads tightened, with high-quality collateralized loan obligation (CLO) and commercial mortgage-backed securities (CMBS) spreads both tightening. After posting steep losses in 2022, the emerging markets sector posted positive total returns, and spreads tightened throughout the reporting period. |
What worked?
| ● | | Overall sector allocation and security selection both contributed to the Fund’s performance over the reporting period. Within sector allocation, overweights relative to the Index to high yield, CLOs, and investment-grade corporates contributed the most. |
| ● | | Within security selection, selections in CLOs, investment-grade corporates, and CMBS contributed the most. |
| ● | | Within credit, positioning in healthcare & pharmaceuticals, cable & satellite, and midstream energy contributed to results. |
| ● | | In individual security selection, the Fund benefited from positioning in Dish Network Corp. (cable & satellite), LifePoint Health Inc. (healthcare & pharmaceuticals), and Energy Transfer LP (midstream energy). |
42 Visit our website at pgim.com/investments
| ● | | The Fund’s duration positioning was a positive contributor over the period, as US Treasury yields rose and the curve steepened. (Duration measures the sensitivity of the price—the value of principal—of a bond to a change in interest rates.) |
What didn’t work?
| ● | | While overall security selection contributed to the Fund’s performance during the reporting period, selections in high yield detracted. |
| ● | | Within credit, positioning in automotive and building materials & home construction detracted. |
| ● | | In individual security selection, the Fund’s positioning in Ford Motor Co. (automotive), Nexi S.p.A (technology), and Ziggo Bond Company BV (cable & satellite) detracted from performance. |
| ● | | The Fund’s yield curve positioning detracted from performance. |
Did the Fund use derivatives?
The Fund uses derivatives when they facilitate implementation of the overall investment approach. During the reporting period, the Fund used interest rate futures to help manage duration positioning and yield curve exposure. In aggregate, these positions contributed to performance. The Fund also held positions in a credit default swap index (CDX) to hedge credit risk, which detracted from performance.
Current outlook
| ● | | Although the rate-hike debate continues for the Fed, the increments of its hikes are getting smaller, and it declined to raise rates at all at its June 2023 FOMC meeting—signs that most of the increases are behind us and that the hikes to come will increasingly be “fine-tuning” exercises. With the prospect of balance returning to the labor market, PGIM Fixed Income sees a path for core personal consumption expenditures to decelerate below 3% by the end of 2023, driven lower by core non-housing services prices. |
| ● | | Clear and sustained evidence of a downshift in inflation, coupled with below-trend growth, should be enough, in PGIM Fixed Income’s view, for the Fed to pause its rate-hike campaign at 5.5% prior to initiating a 50 to 75 bps “fine-tuning” campaign of cuts as early as the fourth quarter of 2023. |
| ● | | PGIM Fixed Income sees the US yield curve remaining solidly inverted due to only marginal repricing at the front end. Meanwhile, it believes demand at the back end of the curve should remain consistent—particularly given the relatively high level of rates compared to past years—based on the rolling series of crises that continue to emerge but have yet to produce the more-feared outcomes. |
| ● | | With the pace of central bank tightening expected to dramatically downshift in the quarters ahead, and given PGIM Fixed Income’s expectation for interest rate volatility to continue to decline, spreads should remain range bound or, more likely, narrow in |
PGIM Fixed Income ETFs 43
Strategy and Performance Overview* (continued)
| | the months ahead, boosting fixed income returns. The combination of increased income and the potential for capital appreciation creates an attractive total return profile for those with longer-term time horizons. |
| ● | | PGIM Fixed Income maintains its positive view of spread sectors over the medium to long term. The Fund holds a significant underweight to US Treasuries in favor of more attractive opportunities across spread sectors. |
*This strategy and performance overview, which discusses what strategies or holdings (including derivatives, if applicable) affected the Fund’s performance, is compiled based on how the Fund performed relative to the Fund’s benchmark index and is viewed for performance attribution purposes at the aggregate Fund level, which in most instances will not directly correlate to the amounts disclosed in the Statement of Operations which conform to US generally accepted accounting principles.
44 Visit our website at pgim.com/investments
Fees and Expenses (unaudited)
As a shareholder of the Fund, you incur ongoing costs, including investment management fees. This example is intended to help you understand your ongoing costs (in dollars) of investing in the Fund and to compare these costs with the ongoing costs of investing in other funds.
The example is based on an investment of $1,000 held through the six-month period ended August 31, 2023. The example is for illustrative purposes only.
Actual Expenses
The first line in the tables on the following page provides information about actual account values and actual expenses. You may use the information on this line, together with the amount you invested, to estimate the expenses that you paid over the period. Simply divide your account value by $1,000 (for example, an $8,600 account value ÷ $1,000 = 8.6), then multiply the result by the number on the first line under the heading “Expenses Paid During the Six-Month Period” to estimate the expenses you paid on your account during this period.
Hypothetical Example for Comparison Purposes
The second line in the tables on the following page provides information about hypothetical account values and hypothetical expenses based on the Fund’s actual expense ratio and an assumed rate of return of 5% per year before expenses, which is not the Fund’s actual return. The hypothetical account values and expenses may not be used to estimate the actual ending account balance or expenses you paid for the period. You may use this information to compare the ongoing costs of investing in the Fund and other funds. To do so, compare this 5% hypothetical example with the 5% hypothetical examples that appear in the shareholder reports of the other funds.
Please note that the expenses shown in the tables are meant to highlight your ongoing costs only and do not reflect any transactional costs or brokerage commissions paid on purchases and sales of Fund shares. Therefore, the ending account values and expenses paid for the period are useful in comparing ongoing costs only and will not help you determine the relative total costs of owning different funds. In addition, if these transactional costs were included, your costs would have been higher.
| | | | | | | | |
| | | | | |
PGIM Ultra Short Bond
ETF | | Beginning
Account Value
March 1, 2023 | | Ending
Account Value
August 31, 2023 | | Annualized Expense
Ratio Based on the
Six-Month Period | | Expenses Paid
During the
Six-Month Period* |
| | | | | |
| Actual | | $1,000.00 | | $1,027.60 | | 0.15% | | $0.77 |
| | | | | |
| Hypothetical | | $1,000.00 | | $1,024.45 | | 0.15% | | $0.77 |
PGIM Fixed Income ETFs 45
Fees and Expenses (continued)
| | | | | | | | |
| | | | | |
PGIM Active High Yield Bond ETF | | Beginning Account Value March 1, 2023 | | Ending
Account Value
August 31, 2023 | | Annualized Expense
Ratio Based on the
Six-Month Period | | Expenses Paid
During the
Six-Month Period* |
| | | | | |
| Actual | | $1,000.00 | | $1,049.40 | | 0.53% | | $2.74 |
| | | | | |
| Hypothetical | | $1,000.00 | | $1,022.53 | | 0.53% | | $2.70 |
| | | | | | | | |
| | | | | |
PGIM Active Aggregate Bond ETF | | Beginning Account Value March 1, 2023 | | Ending
Account Value
August 31, 2023 | | Annualized Expense
Ratio Based on the
Six-Month Period | | Expenses Paid
During the
Six-Month Period* |
| | | | | |
| Actual | | $1,000.00 | | $1,010.00 | | 0.19% | | $0.96 |
| | | | | |
| Hypothetical | | $1,000.00 | | $1,024.25 | | 0.19% | | $0.97 |
| | | | | | | | |
| | | | | |
PGIM Total Return Bond ETF | | Beginning Account Value March 1, 2023 | | Ending
Account Value
August 31, 2023 | | Annualized Expense
Ratio Based on the
Six-Month Period | | Expenses Paid
During the
Six-Month Period* |
| | | | | |
| Actual | | $1,000.00 | | $1,016.10 | | 0.49% | | $2.49 |
| | | | | |
| Hypothetical | | $1,000.00 | | $1,022.74 | | 0.49% | | $2.50 |
| | | | | | | | |
| | | | | |
PGIM Floating Rate Income ETF | | Beginning Account Value March 1, 2023 | | Ending
Account Value
August 31, 2023 | | Annualized Expense
Ratio Based on the
Six-Month Period | | Expenses Paid
During the
Six-Month Period* |
| | | | | |
| Actual | | $1,000.00 | | $1,053.90 | | 0.72% | | $3.73 |
| | | | | |
| Hypothetical | | $1,000.00 | | $1,021.58 | | 0.72% | | $3.67 |
| | | | | | | | |
| | | | | |
| PGIM AAA CLO ETF | | Beginning Account Value March 1, 2023 | | Ending
Account Value
August 31, 2023 | | Annualized Expense
Ratio Based on the
Six-Month Period | | Expenses Paid
During the
Six-Month Period* |
| | | | | |
| Actual** | | $1,000.00 | | $1,008.70 | | 0.19% | | $0.22 |
| | | | | |
| Hypothetical | | $1,000.00 | | $1,024.25 | | 0.19% | | $0.97 |
| | | | | | | | |
| | | | | |
PGIM Short Duration Multi-Sector Bond ETF | | Beginning Account Value March 1, 2023 | | Ending
Account Value
August 31, 2023 | | Annualized Expense
Ratio Based on the
Six-Month Period | | Expenses Paid
During the
Six-Month Period* |
| | | | | |
| Actual** | | $1,000.00 | | $1,007.90 | | 0.40% | | $0.47 |
| | | | | |
| Hypothetical | | $1,000.00 | | $1,023.19 | | 0.40% | | $2.04 |
*Fund expenses (net of fee waivers or subsidies, if any) are equal to the annualized expense ratio (provided in the table), multiplied by the average account value over the period, multiplied by the 184 days in the six-month period ended August 31, 2023, and divided by the 365 days in the Fund’s fiscal year ended August 31, 2023 (to reflect the six-month period). Expenses presented in the table include the expenses of any underlying portfolios in which each Fund may invest.
**“Actual” expenses are calculated using 43-day period ended August 31, 2023 due to the Fund’s inception date of July 19, 2023.
46 Visit our website at pgim.com/investments
Glossary
The following abbreviations are used in the Funds’ descriptions:
EUR—Euro
GBP—British Pound
USD—US Dollar
144A—Security was purchased pursuant to Rule 144A under the Securities Act of 1933 and, pursuant to the requirements of Rule 144A, may not be resold except to qualified institutional buyers.
A—Annual payment frequency for swaps
BABs—Build America Bonds
BMO—BMO Capital Markets
BNP—BNP Paribas S.A.
BOA—Bank of America, N.A.
CDS—Credit Default Swap
CDX—Credit Derivative Index
CGM—Citigroup Global Markets, Inc.
CITI—Citibank, N.A.
CLO—Collateralized Loan Obligation
CME—Chicago Mercantile Exchange
CVR—Contingent Value Rights
DAC—Designated Activity Company
DIP—Debtor-In-Possession
EMTN—Euro Medium Term Note
EURIBOR—Euro Interbank Offered Rate
FHLMC—Federal Home Loan Mortgage Corporation
GMTN—Global Medium Term Note
GSI—Goldman Sachs International
iBoxx—Bond Market Indices
IO—Interest Only (Principal amount represents notional)
JPM—JPMorgan Chase Bank N.A.
JPS—J.P. Morgan Securities LLC
LIBOR—London Interbank Offered Rate
LP—Limited Partnership
MSI—Morgan Stanley & Co International PLC
MTN—Medium Term Note
OTC—Over-the-counter
PIK—Payment-in-Kind
Q—Quarterly payment frequency for swaps
REITs—Real Estate Investment Trust
REMIC—Real Estate Mortgage Investment Conduit
47
Glossary (continued)
S—Semiannual payment frequency for swaps
SOFR—Secured Overnight Financing Rate
SONIA—Sterling Overnight Index Average
SSB—State Street Bank & Trust Company
STRIPs—Separate Trading of Registered Interest and Principal of Securities
T—Swap payment upon termination
TBA—To Be Announced
TD—The Toronto-Dominion Bank
USOIS—United States Overnight Index Swap
48
PGIM Ultra Short Bond ETF
Schedule of Investments
as of August 31, 2023
| | | | | | | | | | | | |
| | | | |
| Description | | Interest
Rate | | Maturity
Date | | Principal
Amount
(000)# | | | Value | |
| | | | |
LONG-TERM INVESTMENTS 72.2% | | | | | | | | | | | | |
| | | | |
ASSET-BACKED SECURITIES 20.1% | | | | | | | | | | | | |
| | | | |
Automobiles 2.8% | | | | | | | | | | | | |
Americredit Automobile Receivables Trust,
Series 2023-01, Class A2A | | 5.840% | | 10/19/26 | | | 32,178 | | | $ | 32,165,825 | |
ARI Fleet Lease Trust,
Series 2022-A, Class A2, 144A | | 3.120 | | 01/15/31 | | | 1,658 | | | | 1,634,691 | |
Avis Budget Rental Car Funding AESOP LLC,
Series 2022-03A, Class A, 144A | | 4.620 | | 02/20/27 | | | 35,000 | | | | 33,966,615 | |
Donlen Fleet Lease Funding LLC,
Series 2021-02, Class A2, 144A | | 0.560 | | 12/11/34 | | | 1,747 | | | | 1,712,210 | |
Enterprise Fleet Financing LLC,
Series 2021-02, Class A2, 144A | | 0.480 | | 05/20/27 | | | 2,668 | | | | 2,583,603 | |
Series 2022-01, Class A2, 144A | | 3.030 | | 01/20/28 | | | 8,147 | | | | 7,957,658 | |
Series 2022-03, Class A2, 144A | | 4.380 | | 07/20/29 | | | 726 | | | | 712,197 | |
Series 2023-01, Class A2, 144A | | 5.510 | | 01/22/29 | | | 6,200 | | | | 6,163,001 | |
Series 2023-02, Class A2, 144A | | 5.560 | | 04/22/30 | | | 7,900 | | | | 7,864,497 | |
Ford Credit Floorplan Master Owner Trust A,
Series 2023-01, Class A1, 144A | | 4.920 | | 05/15/28 | | | 17,100 | | | | 16,897,428 | |
GM Financial Consumer Automobile Receivables Trust,
Series 2022-02, Class A2 | | 2.520 | | 05/16/25 | | | 1,490 | | | | 1,480,083 | |
Hertz Vehicle Financing III LLC,
Series 2023-03A, Class A, 144A | | 5.940 | | 02/25/28 | | | 15,100 | | | | 15,108,871 | |
OneMain Direct Auto Receivables Trust,
Series 2023-01A, Class A, 144A | | 5.410 | | 11/14/29 | | | 17,100 | | | | 16,953,892 | |
World Omni Automobile Lease Securitization Trust,
Series 2022-A, Class A2 | | 2.630 | | 10/15/24 | | | 1,149 | | | | 1,144,184 | |
| | | | | | | | | | | | |
| | | | |
| | | | | | | | | | | 146,344,755 | |
| | | | |
Collateralized Loan Obligations 16.3% | | | | | | | | | | | | |
Allegro CLO Ltd. (Cayman Islands),
Series 2016-01A, Class AR2, 144A, 3 Month SOFR + 1.212% (Cap N/A, Floor 0.950%) | | 6.520(c) | | 01/15/30 | | | 5,552 | | | | 5,505,030 | |
Anchorage Capital CLO Ltd. (Cayman Islands),
Series 2015-07A, Class AR2, 144A, 3 Month SOFR + 1.352% (Cap N/A, Floor 1.090%) | | 6.717(c) | | 01/28/31 | | | 4,665 | | | | 4,636,889 | |
Ares CLO Ltd. (Cayman Islands),
Series 2016-40A, Class A1RR, 144A, 3 Month SOFR + 1.132% (Cap N/A, Floor 0.870%) | | 6.440(c) | | 01/15/29 | | | 10,450 | | | | 10,367,422 | |
Series 2018-50A, Class AR, 144A, 3 Month SOFR + 1.312% (Cap N/A, Floor 1.050%) | | 6.620(c) | | 01/15/32 | | | 11,330 | | | | 11,273,855 | |
See Notes to Financial Statements.
PGIM Fixed Income ETFs 49
PGIM Ultra Short Bond ETF
Schedule of Investments (continued)
as of August 31, 2023
| | | | | | | | | | | | | | | | |
| | | | |
| Description | | Interest
Rate | | | Maturity
Date | | | Principal
Amount
(000)# | | | Value | |
| | | | |
ASSET-BACKED SECURITIES (Continued) | | | | | | | | | | | | | | | | |
| | | | |
Collateralized Loan Obligations (cont’d.) | | | | | | | | | | | | | | | | |
Atlas Senior Loan Fund Ltd. (Cayman Islands),
Series 2013-01A, Class AR, 144A, 3 Month SOFR + 1.092% (Cap N/A, Floor 0.000%) | | | 6.468%(c) | | | | 11/17/27 | | | | 146 | | | $ | 145,719 | |
Bain Capital Credit CLO Ltd. (Cayman Islands),
Series 2018-01A, Class A1, 144A, 3 Month LIBOR + 0.960% (Cap N/A, Floor 0.000%) | | | 6.567(c) | | | | 04/23/31 | | | | 16,392 | | | | 16,330,183 | |
Series 2019-02A, Class AR, 144A, 3 Month LIBOR + 1.100% (Cap N/A, Floor 1.100%) | | | 6.670(c) | | | | 10/17/32 | | | | 11,500 | | | | 11,419,500 | |
Series 2020-05A, Class A1, 144A, 3 Month SOFR + 1.482% (Cap N/A, Floor 1.482%) | | | 6.808(c) | | | | 01/20/32 | | | | 5,397 | | | | 5,378,110 | |
Ballyrock CLO Ltd. (Cayman Islands),
Series 2020-02A, Class A1R, 144A, 3 Month SOFR + 1.272% (Cap N/A, Floor 1.010%) | | | 6.598(c) | | | | 10/20/31 | | | | 18,000 | | | | 17,890,277 | |
Battalion CLO Ltd. (Cayman Islands),
Series 2018-12A, Class A1, 144A, 3 Month SOFR + 1.332% (Cap N/A, Floor 1.070%) | | | 6.708(c) | | | | 05/17/31 | | | | 4,938 | | | | 4,910,854 | |
Benefit Street Partners CLO Ltd. (Cayman Islands),
Series 2013-IIA, Class A1R2, 144A, 3 Month SOFR + 1.132% (Cap N/A, Floor 1.132%) | | | 6.440(c) | | | | 07/15/29 | | | | 1,060 | | | | 1,053,088 | |
Series 2017-12A, Class A1R, 144A, 3 Month SOFR + 1.212% (Cap N/A, Floor 0.950%) | | | 6.520(c) | | | | 10/15/30 | | | | 16,136 | | | | 16,041,735 | |
BlueMountain CLO Ltd. (Cayman Islands),
Series 2018-22A, Class A1, 144A, 3 Month SOFR + 1.342% (Cap N/A, Floor 0.000%) | | | 6.650(c) | | | | 07/15/31 | | | | 14,500 | | | | 14,394,250 | |
Canyon Capital CLO Ltd. (Cayman Islands),
Series 2016-01A, Class AR, 144A, 3 Month SOFR + 1.332% (Cap N/A, Floor 0.000%) | | | 6.640(c) | | | | 07/15/31 | | | | 20,000 | | | | 19,931,946 | |
Series 2017-01A, Class AR, 144A, 3 Month SOFR + 1.262% (Cap N/A, Floor 1.000%) | | | 6.570(c) | | | | 07/15/30 | | | | 14,607 | | | | 14,524,302 | |
Series 2019-01A, Class A1R, 144A, 3 Month SOFR + 1.362% (Cap N/A, Floor 1.100%) | | | 6.670(c) | | | | 04/15/32 | | | | 8,000 | | | | 7,898,880 | |
Carlyle CLO Ltd. (Cayman Islands),
Series C17A, Class A1AR, 144A, 3 Month SOFR + 1.292% (Cap N/A, Floor 0.000%) | | | 6.661(c) | | | | 04/30/31 | | | | 18,476 | | | | 18,384,303 | |
Carlyle Global Market Strategies CLO Ltd. (Cayman Islands),
Series 2014-01A, Class A1R2, 144A, 3 Month SOFR + 1.232% (Cap N/A, Floor 0.970%) | | | 6.540(c) | | | | 04/17/31 | | | | 4,967 | | | | 4,943,368 | |
Series 2015-05A, Class A1RR, 144A, 3 Month SOFR + 1.342% (Cap N/A, Floor 1.080%) | | | 6.668(c) | | | | 01/20/32 | | | | 17,935 | | | | 17,845,780 | |
See Notes to Financial Statements.
50
PGIM Ultra Short Bond ETF
Schedule of Investments (continued)
as of August 31, 2023
| | | | | | | | | | | | | | | | |
| | | | |
| Description | | Interest
Rate | | | Maturity
Date | | | Principal
Amount
(000)# | | | Value | |
| | | | |
ASSET-BACKED SECURITIES (Continued) | | | | | | | | | | | | | | | | |
| | | | |
Collateralized Loan Obligations (cont’d.) | | | | | | | | | | | | | | | | |
Carlyle US CLO Ltd. (Cayman Islands),
Series 2017-01A, Class A1R, 144A, 3 Month SOFR + 1.262% (Cap N/A, Floor 1.000%) | | | 6.588%(c) | | | | 04/20/31 | | | | 17,122 | | | $ | 17,010,645 | |
Series 2018-01A, Class A1, 144A, 3 Month SOFR + 1.282% (Cap N/A, Floor 0.000%) | | | 6.608(c) | | | | 04/20/31 | | | | 17,879 | | | | 17,728,887 | |
CarVal CLO Ltd. (Cayman Islands),
Series 2019-01A, Class ANR, 144A, 3 Month SOFR + 1.372% (Cap N/A, Floor 1.372%) | | | 6.698(c) | | | | 04/20/32 | | | | 7,222 | | | | 7,181,940 | |
CIFC Funding Ltd. (Cayman Islands),
Series 2013-03RA, Class A1, 144A, 3 Month SOFR + 1.242% (Cap N/A, Floor 0.980%) | | | 6.587(c) | | | | 04/24/31 | | | | 2,000 | | | | 1,990,000 | |
Series 2017-01A, Class AR, 144A, 3 Month SOFR + 1.272% (Cap N/A, Floor 1.010%) | | | 6.605(c) | | | | 04/23/29 | | | | 8,429 | | | | 8,409,396 | |
Series 2017-04A, Class A1R, 144A, 3 Month SOFR + 1.212% (Cap N/A, Floor 0.950%) | | | 6.557(c) | | | | 10/24/30 | | | | 28,070 | | | | 27,887,522 | |
Crestline Denali CLO Ltd. (Cayman Islands),
Series 2018-01A, Class AR, 144A, 3 Month SOFR + 1.322% (Cap N/A, Floor 1.060%) | | | 6.630(c) | | | | 10/15/31 | | | | 15,000 | | | | 14,883,703 | |
Elevation CLO Ltd. (Cayman Islands),
Series 2014-02A, Class A1R, 144A, 3 Month SOFR + 1.492% (Cap N/A, Floor 0.000%) | | | 6.800(c) | | | | 10/15/29 | | | | 13,892 | | | | 13,865,722 | |
Ellington CLO Ltd. (Cayman Islands),
Series 2019-04A, Class AR, 144A, 3 Month SOFR + 1.842% (Cap N/A, Floor 1.580%) | | | 7.150(c) | | | | 04/15/29 | | | | 1,471 | | | | 1,471,516 | |
Generate CLO Ltd. (Cayman Islands),
Series 02A, Class AR, 144A, 3 Month SOFR + 1.412% (Cap N/A, Floor 1.150%) | | | 6.757(c) | | | | 01/22/31 | | | | 10,156 | | | | 10,090,964 | |
Greywolf CLO Ltd. (Cayman Islands),
Series 2018-02A, Class A1, 144A, 3 Month SOFR + 1.440% (Cap N/A, Floor 1.440%) | | | 6.766(c) | | | | 10/20/31 | | | | 10,000 | | | | 9,936,455 | |
HPS Loan Management Ltd. (Cayman Islands),
Series 11A-17, Class AR, 144A, 3 Month SOFR + 1.282% (Cap N/A, Floor 1.020%) | | | 6.651(c) | | | | 05/06/30 | | | | 7,390 | | | | 7,353,655 | |
ICG US CLO Ltd. (Cayman Islands),
Series 2014-03A, Class A1RR, 144A, 3 Month SOFR + 1.292% (Cap N/A, Floor 0.000%) | | | 6.643(c) | | | | 04/25/31 | | | | 11,328 | | | | 11,254,598 | |
JMP Credit Advisors CLO Ltd. (Cayman Islands),
Series 2017-01A, Class AR, 144A, 3 Month SOFR + 1.542% (Cap N/A, Floor 1.280%) | | | 6.850(c) | | | | 07/17/29 | | | | 602 | | | | 602,300 | |
See Notes to Financial Statements.
PGIM Fixed Income ETFs 51
PGIM Ultra Short Bond ETF
Schedule of Investments (continued)
as of August 31, 2023
| | | | | | | | | | | | | | | | |
| | | | |
| Description | | Interest
Rate | | | Maturity
Date | | | Principal
Amount
(000)# | | | Value | |
| | | | |
ASSET-BACKED SECURITIES (Continued) | | | | | | | | | | | | | | | | |
| | | | |
Collateralized Loan Obligations (cont’d.) | | | | | | | | | | | | | | | | |
KKR CLO Ltd. (Cayman Islands),
Series 11, Class AR, 144A, 3 Month SOFR + 1.442% (Cap N/A, Floor 1.442%) | | | 6.750%(c) | | | | 01/15/31 | | | | 938 | | | $ | 932,952 | |
Series 18, Class AR, 144A, 3 Month SOFR + 1.202% (Cap N/A, Floor 0.940%) | | | 6.512(c) | | | | 07/18/30 | | | | 14,206 | | | | 14,144,924 | |
KKR CLO Ltd.,
Series 30A, Class A1R, 144A, 3 Month SOFR + 1.282% (Cap N/A, Floor 1.020%) | | | 6.590(c) | | | | 10/17/31 | | | | 14,000 | | | | 13,915,762 | |
Madison Park Funding Ltd. (Cayman Islands), Series 12A, Class AR, 144A, 3 Month SOFR + 1.092% (Cap N/A, Floor 0.000%) | | | 6.437(c) | | | | 04/22/27 | | | | 4,473 | | | | 4,455,248 | |
Series 2015-18A, Class ARR, 144A, 3 Month SOFR + 1.202% (Cap N/A, Floor 0.940%) | | | 6.535(c) | | | | 10/21/30 | | | | 23,072 | | | | 22,986,683 | |
Series 2019-34A, Class AR, 144A, 3 Month SOFR + 1.382% (Cap N/A, Floor 1.120%) | | | 6.733(c) | | | | 04/25/32 | | | | 12,115 | | | | 12,079,331 | |
Series 2021-38A, Class X, 144A, 3 Month SOFR + 1.212% (Cap N/A, Floor 1.212%) | | | 6.520(c) | | | | 07/17/34 | | | | 2,962 | | | | 2,943,571 | |
MidOcean Credit CLO (Cayman Islands),
Series 2017-07A, Class A1R, 144A, 3 Month SOFR + 1.302% (Cap N/A, Floor 0.000%) | | | 6.610(c) | | | | 07/15/29 | | | | 6,305 | | | | 6,266,906 | |
Series 2018-09A, Class A1, 144A, 3 Month SOFR + 1.412% (Cap N/A, Floor 1.150%) | | | 6.738(c) | | | | 07/20/31 | | | | 5,250 | | | | 5,236,875 | |
Mountain View CLO Ltd. (Cayman Islands),
Series 2013-01A, Class ARR, 144A, 3 Month SOFR + 1.262% (Cap N/A, Floor 1.000%) | | | 6.561(c) | | | | 10/12/30 | | | | 12,874 | | | | 12,758,573 | |
Nassau Ltd. (United Kingdom),
Series 2022-01A, Class A1, 144A, 3 Month SOFR + 2.130% (Cap N/A, Floor 2.130%) | | | 7.438(c) | | | | 01/15/31 | | | | 32,927 | | | | 33,054,165 | |
Oaktree CLO Ltd. (Cayman Islands),
Series 2019-01A, Class A1R, 144A, 3 Month SOFR + 1.372% (Cap N/A, Floor 1.110%) | | | 6.717(c) | | | | 04/22/30 | | | | 4,300 | | | | 4,270,624 | |
Ocean Trails CLO (Cayman Islands),
Series 2019-07A, Class AR, 144A, 3 Month SOFR + 1.272% (Cap N/A, Floor 1.010%) | | | 6.580(c) | | | | 04/17/30 | | | | 4,417 | | | | 4,377,414 | |
Octagon Investment Partners 49 Ltd. (Cayman Islands),
Series 2020-05A, Class A1, 144A, 3 Month SOFR + 1.482% (Cap N/A, Floor 1.220%) | | | 6.790(c) | | | | 01/15/33 | | | | 22,000 | | | | 21,926,293 | |
OZLM Ltd. (Cayman Islands),
Series 2014-06A, Class A1S, 144A, 3 Month SOFR + 1.342% (Cap N/A, Floor 0.000%) | | | 6.650(c) | | | | 04/17/31 | | | | 8,401 | | | | 8,341,609 | |
See Notes to Financial Statements.
52
PGIM Ultra Short Bond ETF
Schedule of Investments (continued)
as of August 31, 2023
| | | | | | | | | | | | | | | | |
| | | | |
| Description | | Interest
Rate | | | Maturity
Date | | | Principal
Amount
(000)# | | | Value | |
| | | | |
ASSET-BACKED SECURITIES (Continued) | | | | | | | | | | | | | | | | |
| | | | |
Collateralized Loan Obligations (cont’d.) | | | | | | | | | | | | | | | | |
OZLM Ltd. (Cayman Islands), (cont’d.)
Series 2014-09A, Class A1A3, 144A, 3 Month SOFR + 1.362% (Cap N/A, Floor 1.100%) | | | 6.688%(c) | | | | 10/20/31 | | | | 18,000 | | | $ | 17,818,027 | |
Palmer Square CLO Ltd. (Cayman Islands),
Series 2014-01A, Class A1R2, 144A, 3 Month SOFR + 1.392% (Cap N/A, Floor 1.130%) | | | 6.700(c) | | | | 01/17/31 | | | | 994 | | | | 992,182 | |
Series 2015-02A, Class A1R2, 144A, 3 Month SOFR + 1.362% (Cap N/A, Floor 0.000%) | | | 6.688(c) | | | | 07/20/30 | | | | 1,104 | | | | 1,102,130 | |
Palmer Square Loan Funding Ltd. (Cayman Islands),
Series 2021-03A, Class A1, 144A, 3 Month SOFR + 1.062% (Cap N/A, Floor 1.062%) | | | 6.388(c) | | | | 07/20/29 | | | | 13,569 | | | | 13,508,953 | |
Series 2021-04A, Class A1, 144A, 3 Month SOFR + 1.062% (Cap N/A, Floor 1.062%) | | | 6.370(c) | | | | 10/15/29 | | | | 14,666 | | | | 14,592,658 | |
Series 2022-03A, Class A1A, 144A, 3 Month SOFR + 1.820% (Cap N/A, Floor 1.820%) | | | 7.128(c) | | | | 04/15/31 | | | | 22,337 | | | | 22,429,624 | |
Park Avenue Institutional Advisers CLO Ltd. (Cayman Islands),
Series 2018-01A, Class A1AR, 144A, 3 Month SOFR + 1.262% (Cap N/A, Floor 1.000%) | | | 6.588(c) | | | | 10/20/31 | | | | 22,000 | | | | 21,830,721 | |
PPM CLO Ltd. (Cayman Islands),
Series 2018-01A, Class A, 144A, 3 Month SOFR + 1.412% (Cap N/A, Floor 0.000%) | | | 6.720(c) | | | | 07/15/31 | | | | 11,000 | | | | 10,906,416 | |
Race Point CLO Ltd. (Cayman Islands),
Series 2013-08A, Class AR2, 144A, 3 Month SOFR + 1.302% (Cap N/A, Floor 1.040%) | | | 6.681(c) | | | | 02/20/30 | | | | 15,830 | | | | 15,754,111 | |
Rockford Tower CLO Ltd. (Cayman Islands),
Series 2017-03A, Class A, 144A, 3 Month SOFR + 1.452% (Cap N/A, Floor 0.000%) | | | 6.778(c) | | | | 10/20/30 | | | | 12,450 | | | | 12,425,197 | |
Rockford Tower CLO Ltd.,
Series 2017-02A, Class AR, 144A, 3 Month SOFR + 1.282% (Cap N/A, Floor 1.020%) | | | 6.590(c) | | | | 10/15/29 | | | | 13,082 | | | | 13,025,193 | |
Romark WM-R Ltd. (Cayman Islands),
Series 2018-01A, Class A1, 144A, 3 Month SOFR + 1.292% (Cap N/A, Floor 0.000%) | | | 6.618(c) | | | | 04/20/31 | | | | 13,469 | | | | 13,374,065 | |
Shackleton CLO Ltd. (Cayman Islands),
Series 2014-05RA, Class A, 144A, 3 Month SOFR + 1.362% (Cap N/A, Floor 0.262%) | | | 6.731(c) | | | | 05/07/31 | | | | 19,869 | | | | 19,650,835 | |
Sound Point CLO Ltd. (Cayman Islands),
Series 2014-03RA, Class A1R, 144A, 3 Month SOFR + 1.332% (Cap N/A, Floor 1.070%) | | | 6.677(c) | | | | 10/23/31 | | | | 10,000 | | | | 9,911,797 | |
See Notes to Financial Statements.
PGIM Fixed Income ETFs 53
PGIM Ultra Short Bond ETF
Schedule of Investments (continued)
as of August 31, 2023
| | | | | | | | | | | | | | | | |
| | | | |
| Description | | Interest
Rate | | | Maturity
Date | | | Principal
Amount
(000)# | | | Value | |
| | | | |
ASSET-BACKED SECURITIES (Continued) | | | | | | | | | | | | | | | | |
| | | | |
Collateralized Loan Obligations (cont’d.) | | | | | | | | | | | | | | | | |
Sound Point CLO Ltd. (Cayman Islands), (cont’d.) | | | | | | | | | | | | | | | | |
Series 2017-03A, Class A1R, 144A, 3 Month SOFR + 1.242% (Cap N/A, Floor 0.980%) | | | 6.568%(c) | | | | 10/20/30 | | | | 8,687 | | | $ | 8,600,831 | |
Series 2019-01A, Class AR, 144A, 3 Month SOFR + 1.342% (Cap N/A, Floor 1.080%) | | | 6.668(c) | | | | 01/20/32 | | | | 13,000 | | | | 12,852,711 | |
Tikehau US CLO Ltd. (Bermuda), | | | | | | | | | | | | | | | | |
Series 2022-02A, Class A1, 144A, 3 Month SOFR + 2.390% (Cap N/A, Floor 2.390%) | | | 7.716(c) | | | | 01/20/32 | | | | 31,606 | | | | 31,737,768 | |
Trinitas CLO Ltd. (Cayman Islands), | | | | | | | | | | | | | | | | |
Series 2016-04A, Class A1L2, 144A, 3 Month SOFR + 1.362% (Cap N/A, Floor 1.100%) | | | 6.672(c) | | | | 10/18/31 | | | | 11,900 | | | | 11,874,407 | |
Series 2016-05A, Class ARR, 144A, 3 Month SOFR + 1.292% (Cap N/A, Floor 1.030%) | | | 6.643(c) | | | | 10/25/28 | | | | 307 | | | | 307,021 | |
Venture CLO Ltd. (Cayman Islands), | | | | | | | | | | | | | | | | |
Series 2016-24A, Class ARR, 144A, 3 Month SOFR + 1.162% (Cap N/A, Floor 0.900%) | | | 6.488(c) | | | | 10/20/28 | | | | 5,787 | | | | 5,738,581 | |
Voya CLO Ltd. (Cayman Islands), | | | | | | | | | | | | | | | | |
Series 2013-02A, Class A1R, 144A, 3 Month SOFR + 1.232% (Cap N/A, Floor 0.970%) | | | 6.583(c) | | | | 04/25/31 | | | | 3,816 | | | | 3,787,901 | |
Series 2013-03A, Class A1RR, 144A, 3 Month SOFR + 1.411% (Cap N/A, Floor 1.150%) | | | 6.721(c) | | | | 10/18/31 | | | | 19,931 | | | | 19,824,368 | |
Series 2014-01A, Class AAR2, 144A, 3 Month SOFR + 1.252% (Cap N/A, Floor 0.000%) | | | 6.562(c) | | | | 04/18/31 | | | | 1,796 | | | | 1,787,580 | |
Series 2014-02A, Class A1RR, 144A, 3 Month SOFR + 1.282% (Cap N/A, Floor 1.020%) | | | 6.590(c) | | | | 04/17/30 | | | | 1,287 | | | | 1,282,894 | |
Series 2016-01A, Class A1R, 144A, 3 Month SOFR + 1.332% (Cap N/A, Floor 1.070%) | | | 6.658(c) | | | | 01/20/31 | | | | 22,646 | | | | 22,560,657 | |
Wellfleet CLO Ltd. (Cayman Islands), | | | | | | | | | | | | | | | | |
Series 2016-02A, Class A1R, 144A, 3 Month SOFR + 1.402% (Cap N/A, Floor 1.140%) | | | 6.728(c) | | | | 10/20/28 | | | | 1,702 | | | | 1,692,337 | |
Series 2017-02A, Class A1R, 144A, 3 Month SOFR + 1.322% (Cap N/A, Floor 0.000%) | | | 6.648(c) | | | | 10/20/29 | | | | 788 | | | | 782,604 | |
Series 2018-02A, Class A1, 144A, 3 Month SOFR + 1.462% (Cap N/A, Floor 1.200%) | | | 6.788(c) | | | | 10/20/31 | | | | 10,000 | | | | 9,900,933 | |
Series 2019-01A, Class A1R, 144A, 3 Month SOFR + 1.382% (Cap N/A, Floor 1.120%) | | | 6.708(c) | | | | 07/20/32 | | | | 20,000 | | | | 19,750,482 | |
See Notes to Financial Statements.
54
PGIM Ultra Short Bond ETF
Schedule of Investments (continued)
as of August 31, 2023
| | | | | | | | | | | | | | | | |
| | | | |
| Description | | Interest
Rate | | | Maturity
Date | | | Principal
Amount
(000)# | | | Value | |
| | | | |
ASSET-BACKED SECURITIES (Continued) | | | | | | | | | | | | | | | | |
| | | | |
Collateralized Loan Obligations (cont’d.) | | | | | | | | | | | | | | | | |
Zais CLO Ltd. (Cayman Islands), | | | | | | | | | | | | | | | | |
Series 2017-02A, Class A, 144A, 3 Month SOFR + 1.552% (Cap N/A, Floor 0.000%) | | | 6.860%(c) | | | | 04/15/30 | | | | 157 | | | $ | 156,032 | |
| | | | | | | | | | | | | | | | |
| | | | |
| | | | | | | | | | | | | | | 860,192,740 | |
| | | | |
Consumer Loans 0.7% | | | | | | | | | | | | | | | | |
OneMain Financial Issuance Trust, | | | | | | | | | | | | | | | | |
Series 2023-02A, Class A1, 144A | | | 5.840 | | | | 09/15/36 | | | | 34,900 | | | | 35,040,895 | |
SoFi Consumer Loan Program Trust, | | | | | | | | | | | | | | | | |
Series 2021-01, Class A, 144A | | | 0.490 | | | | 09/25/30 | | | | 219 | | | | 216,516 | |
Series 2023-01S, Class A, 144A | | | 5.810 | | | | 05/15/31 | | | | 1,950 | | | | 1,946,238 | |
| | | | | | | | | | | | | | | | |
| | | | |
| | | | | | | | | | | | | | | 37,203,649 | |
| | | | |
Equipment 0.3% | | | | | | | | | | | | | | | | |
Kubota Credit Owner Trust, | | | | | | | | | | | | | | | | |
Series 2023-01A, Class A2, 144A | | | 5.400 | | | | 02/17/26 | | | | 12,500 | | | | 12,447,928 | |
MMAF Equipment Finance LLC, | | | | | | | | | | | | | | | | |
Series 2022-A, Class A2, 144A | | | 2.770 | | | | 02/13/25 | | | | 5,991 | | | | 5,921,201 | |
| | | | | | | | | | | | | | | | |
| | | | |
| | | | | | | | | | | | | | | 18,369,129 | |
| | | | | | | | | | | | | | | | |
| | | | |
TOTAL ASSET-BACKED SECURITIES
(cost $1,062,807,271) | | | | | | | | | | | | | | | 1,062,110,273 | |
| | | | | | | | | | | | | | | | |
| | | | |
CERTIFICATES OF DEPOSIT 2.1% | | | | | | | | | | | | | | | | |
BNP Paribas SA, SOFR + 0.650% | | | 5.950(c) | | | | 07/08/24 | | | | 39,000 | | | | 39,038,626 | |
Canadian Imperial Bank of Commerce, | | | | | | | | | | | | | | | | |
SOFR + 0.600% | | | 5.900(c) | | | | 05/10/24 | | | | 9,750 | | | | 9,762,406 | |
SOFR + 0.810% (Cap N/A, Floor 0.000%) | | | 6.110(c) | | | | 12/11/23 | | | | 15,000 | | | | 15,029,799 | |
Lloyds Bank Corporate Markets PLC, SOFR + 0.540% | | | 5.840(c) | | | | 01/31/24 | | | | 21,233 | | | | 21,232,822 | |
Toronto-Dominion Bank (The), | | | | | | | | | | | | | | | | |
SOFR + 0.650% | | | 5.950(c) | | | | 09/13/24 | | | | 10,000 | | | | 10,003,736 | |
SOFR + 0.670% | | | 5.970(c) | | | | 03/25/24 | | | | 15,000 | | | | 15,019,753 | |
| | | | | | | | | | | | | | | | |
| | | | |
TOTAL CERTIFICATES OF DEPOSIT
(cost $109,976,232) | | | | | | | | | | | | | | | 110,087,142 | |
| | | | | | | | | | | | | | | | |
See Notes to Financial Statements.
PGIM Fixed Income ETFs 55
PGIM Ultra Short Bond ETF
Schedule of Investments (continued)
as of August 31, 2023
| | | | | | | | | | | | |
| | | | |
| Description | | Interest
Rate | | Maturity
Date | | Principal
Amount
(000)# | | | Value | |
| | | | |
COMMERCIAL MORTGAGE-BACKED SECURITIES 15.1% | | | | | | | | | | | | |
Bank of America Merrill Lynch Commercial Mortgage Trust, | | | | | | | | | | | | |
Series 2016-UB10, Class A4 | | 3.170% | | 07/15/49 | | | 21,000 | | | $ | 19,416,596 | |
Barclays Commercial Mortgage Securities Trust, | | | | | | | | | | | | |
Series 2020-C07, Class A1 | | 1.079 | | 04/15/53 | | | 654 | | | | 631,798 | |
Benchmark Mortgage Trust, | | | | | | | | | | | | |
Series 2018-B02, Class A2 | | 3.662 | | 02/15/51 | | | 227 | | | | 226,227 | |
Series 2018-B03, Class A2 | | 3.848 | | 04/10/51 | | | 225 | | | | 217,955 | |
Series 2018-B05, Class A2 | | 4.077 | | 07/15/51 | | | 589 | | | | 567,773 | |
Series 2020-B18, Class A1 | | 0.875 | | 07/15/53 | | | 643 | | | | 615,449 | |
Citigroup Commercial Mortgage Trust, | | | | | | | | | | | | |
Series 2013-GC17, Class A4 | | 4.131 | | 11/10/46 | | | 36,731 | | | | 36,571,278 | |
Series 2014-GC21, Class A4 | | 3.575 | | 05/10/47 | | | 5,912 | | | | 5,853,875 | |
Series 2014-GC21, Class AAB | | 3.477 | | 05/10/47 | | | 62 | | | | 62,073 | |
Series 2014-GC23, Class A3 | | 3.356 | | 07/10/47 | | | 10,926 | | | | 10,729,703 | |
Series 2014-GC23, Class AAB | | 3.337 | | 07/10/47 | | | 212 | | | | 209,893 | |
Series 2014-GC25, Class A3 | | 3.372 | | 10/10/47 | | | 6,519 | | | | 6,369,999 | |
Series 2014-GC25, Class A4 | | 3.635 | | 10/10/47 | | | 15,760 | | | | 15,228,405 | |
Series 2015-GC29, Class A4 | | 3.192 | | 04/10/48 | | | 9,325 | | | | 8,869,414 | |
Series 2015-GC33, Class A4 | | 3.778 | | 09/10/58 | | | 2,250 | | | | 2,126,551 | |
Series 2016-P04, Class A2 | | 2.450 | | 07/10/49 | | | 3,635 | | | | 3,460,979 | |
Commercial Mortgage Trust, | | | | | | | | | | | | |
Series 2012-CR04, Class A3 | | 2.853 | | 10/15/45 | | | 90 | | | | 83,432 | |
Series 2013-CR12, Class A4 | | 4.046 | | 10/10/46 | | | 5,906 | | | | 5,877,417 | |
Series 2014-CR16, Class A3 | | 3.775 | | 04/10/47 | | | 16,856 | | | | 16,603,741 | |
Series 2014-CR16, Class A4 | | 4.051 | | 04/10/47 | | | 11,285 | | | | 11,086,436 | |
Series 2014-CR17, Class ASB | | 3.598 | | 05/10/47 | | | 64 | | | | 63,826 | |
Series 2014-CR18, Class A4 | | 3.550 | | 07/15/47 | | | 3,671 | | | | 3,596,641 | |
Series 2014-CR20, Class A3 | | 3.326 | | 11/10/47 | | | 4,491 | | | | 4,397,442 | |
Series 2014-CR21, Class A3 | | 3.528 | | 12/10/47 | | | 10,423 | | | | 10,114,906 | |
Series 2014-UBS02, Class A4 | | 3.691 | | 03/10/47 | | | 2,874 | | | | 2,852,023 | |
Series 2014-UBS02, Class A5 | | 3.961 | | 03/10/47 | | | 16,690 | | | | 16,534,691 | |
Series 2014-UBS02, Class ASB | | 3.472 | | 03/10/47 | | | 127 | | | | 126,352 | |
Series 2014-UBS03, Class A3 | | 3.546 | | 06/10/47 | | | 837 | | | | 823,964 | |
Series 2014-UBS03, Class A4 | | 3.819 | | 06/10/47 | | | 3,812 | | | | 3,731,224 | |
Series 2014-UBS04, Class A4 | | 3.420 | | 08/10/47 | | | 33,380 | | | | 32,493,474 | |
Series 2014-UBS05, Class A3 | | 3.565 | | 09/10/47 | | | 24,504 | | | | 24,109,261 | |
Series 2014-UBS06, Class A4 | | 3.378 | | 12/10/47 | | | 8,136 | | | | 7,897,870 | |
Series 2014-UBS06, Class A5 | | 3.644 | | 12/10/47 | | | 7,835 | | | | 7,532,509 | |
Series 2015-CR22, Class A3 | | 3.207 | | 03/10/48 | | | 820 | | | | 783,433 | |
Series 2015-CR22, Class A4 | | 3.048 | | 03/10/48 | | | 21,900 | | | | 21,069,031 | |
Series 2015-CR23, Class ASB | | 3.257 | | 05/10/48 | | | 690 | | | | 675,395 | |
See Notes to Financial Statements.
56
PGIM Ultra Short Bond ETF
Schedule of Investments (continued)
as of August 31, 2023
| | | | | | | | | | | | | | | | |
| | | | |
| Description | | Interest
Rate | | | Maturity
Date | | | Principal
Amount
(000)# | | | Value | |
| | | | |
COMMERCIAL MORTGAGE-BACKED SECURITIES (Continued) | | | | | | | | | | | | | | | | |
Commercial Mortgage Trust, (cont’d.) | | | | | | | | | | | | | | | | |
Series 2015-CR24, Class A4 | | | 3.432% | | | | 08/10/48 | | | | 8,262 | | | $ | 7,891,885 | |
Series 2015-CR24, Class ASB | | | 3.445 | | | | 08/10/48 | | | | 1,250 | | | | 1,227,891 | |
Series 2015-CR26, Class A4 | | | 3.630 | | | | 10/10/48 | | | | 12,465 | | | | 11,850,873 | |
Series 2015-LC19, Class A3 | | | 2.922 | | | | 02/10/48 | | | | 17,197 | | | | 16,624,470 | |
Series 2015-LC21, Class A4 | | | 3.708 | | | | 07/10/48 | | | | 11,000 | | | | 10,538,756 | |
Series 2015-PC01, Class A5 | | | 3.902 | | | | 07/10/50 | | | | 17,737 | | | | 17,051,462 | |
CSAIL Commercial Mortgage Trust, | | | | | | | | | | | | | | | | |
Series 2015-C02, Class A4 | | | 3.504 | | | | 06/15/57 | | | | 8,500 | | | | 8,125,697 | |
Series 2016-C05, Class ASB | | | 3.533 | | | | 11/15/48 | | | | 1,817 | | | | 1,757,741 | |
Series 2016-C06, Class A5 | | | 3.090 | | | | 01/15/49 | | | | 14,500 | | | | 13,433,207 | |
Series 2016-C07, Class A4 | | | 3.210 | | | | 11/15/49 | | | | 6,372 | | | | 5,963,816 | |
Deutsche Bank Commercial Mortgage Trust, | | | | | | | | | | | | | | | | |
Series 2017-C06, Class A3 | | | 3.269 | | | | 06/10/50 | | | | 3,936 | | | | 3,747,972 | |
GS Mortgage Securities Corp. Trust, | | | | | | | | | | | | | | | | |
Series 2021-RENT, Class A, 144A, 1 Month SOFR + 0.814% (Cap N/A, Floor 0.700%) | | | 6.125(c) | | | | 11/21/35 | | | | 5,369 | | | | 5,130,221 | |
GS Mortgage Securities Trust, | | | | | | | | | | | | | | | | |
Series 2014-GC18, Class A3 | | | 3.801 | | | | 01/10/47 | | | | 1,285 | | | | 1,279,022 | |
Series 2014-GC18, Class A4 | | | 4.074 | | | | 01/10/47 | | | | 7,185 | | | | 7,122,743 | |
Series 2014-GC22, Class A4 | | | 3.587 | | | | 06/10/47 | | | | 9,840 | | | | 9,676,552 | |
Series 2014-GC22, Class AAB | | | 3.467 | | | | 06/10/47 | | | | 105 | | | | 104,866 | |
Series 2014-GC24, Class A4 | | | 3.666 | | | | 09/10/47 | | | | 18,437 | | | | 18,006,968 | |
Series 2015-GC28, Class A4 | | | 3.136 | | | | 02/10/48 | | | | 17,959 | | | | 17,481,190 | |
Series 2015-GC30, Class A4 | | | 3.382 | | | | 05/10/50 | | | | 22,540 | | | | 21,449,190 | |
Series 2016-GS02, Class A4 | | | 3.050 | | | | 05/10/49 | | | | 14,962 | | | | 13,911,210 | |
JPMBB Commercial Mortgage Securities Trust, | | | | | | | | | | | | | | | | |
Series 2013-C17, Class A4 | | | 4.199 | | | | 01/15/47 | | | | 14,334 | | | | 14,229,987 | |
Series 2014-C18, Class A4A2, 144A | | | 3.794 | | | | 02/15/47 | | | | 4,343 | | | | 4,317,864 | |
Series 2014-C21, Class A4 | | | 3.493 | | | | 08/15/47 | | | | 17,071 | | | | 16,806,817 | |
Series 2014-C23, Class A5 | | | 3.934 | | | | 09/15/47 | | | | 13,955 | | | | 13,553,370 | |
Series 2014-C24, Class A5 | | | 3.639 | | | | 11/15/47 | | | | 10,830 | | | | 10,416,744 | |
Series 2014-C25, Class A4A1 | | | 3.408 | | | | 11/15/47 | | | | 1,107 | | | | 1,068,849 | |
Series 2014-C25, Class ASB | | | 3.407 | | | | 11/15/47 | | | | 1,342 | | | | 1,316,230 | |
Series 2014-C26, Class A3 | | | 3.231 | | | | 01/15/48 | | | | 17,883 | | | | 17,435,734 | |
Series 2014-C26, Class A4 | | | 3.494 | | | | 01/15/48 | | | | 13,000 | | | | 12,470,269 | |
Series 2015-C29, Class A4 | | | 3.611 | | | | 05/15/48 | | | | 30,892 | | | | 29,293,293 | |
Series 2015-C32, Class A4 | | | 3.329 | | | | 11/15/48 | | | | 19,126 | | | | 18,524,785 | |
JPMDB Commercial Mortgage Securities Trust, | | | | | | | | | | | | | | | | |
Series 2020-COR07, Class A1 | | | 1.066 | | | | 05/13/53 | | | | 2,640 | | | | 2,520,416 | |
JPMorgan Chase Commercial Mortgage Securities Trust, | | | | | | | | | | | | | | | | |
Series 2016-JP02, Class ASB | | | 2.713 | | | | 08/15/49 | | | | 4,498 | | | | 4,277,882 | |
See Notes to Financial Statements.
PGIM Fixed Income ETFs 57
PGIM Ultra Short Bond ETF
Schedule of Investments (continued)
as of August 31, 2023
| | | | | | | | | | | | | | | | |
| | | | |
| Description | | Interest
Rate | | | Maturity
Date | | | Principal
Amount
(000)# | | | Value | |
| | | | |
COMMERCIAL MORTGAGE-BACKED SECURITIES (Continued) | | | | | | | | | | | | | | | | |
Morgan Stanley Bank of America Merrill Lynch Trust, | | | | | | | | | | | | | | | | |
Series 2014-C14, Class A5 | | | 4.064% | | | | 02/15/47 | | | | 8,447 | | | $ | 8,374,804 | |
Series 2014-C15, Class A4 | | | 4.051 | | | | 04/15/47 | | | | 5,904 | | | | 5,853,069 | |
Series 2014-C16, Class A4 | | | 3.600 | | | | 06/15/47 | | | | 15,353 | | | | 15,142,433 | |
Series 2014-C17, Class A4 | | | 3.443 | | | | 08/15/47 | | | | 12,864 | | | | 12,660,063 | |
Series 2014-C19, Class A4 | | | 3.526 | | | | 12/15/47 | | | | 5,325 | | | | 5,124,961 | |
Series 2014-C19, Class ASB | | | 3.326 | | | | 12/15/47 | | | | 1,868 | | | | 1,840,947 | |
Series 2015-C21, Class A3 | | | 3.077 | | | | 03/15/48 | | | | 13,374 | | | | 12,777,948 | |
Series 2015-C21, Class A4 | | | 3.338 | | | | 03/15/48 | | | | 5,679 | | | | 5,419,370 | |
Series 2015-C23, Class A3 | | | 3.451 | | | | 07/15/50 | | | | 8,777 | | | | 8,388,668 | |
Series 2015-C23, Class ASB | | | 3.398 | | | | 07/15/50 | | | | 801 | | | | 782,542 | |
Series 2015-C26, Class A5 | | | 3.531 | | | | 10/15/48 | | | | 10,000 | | | | 9,474,118 | |
Series 2015-C27, Class A3 | | | 3.473 | | | | 12/15/47 | | | | 4,118 | | | | 3,949,136 | |
Morgan Stanley Capital I Trust, | | | | | | | | | | | | | | | | |
Series 2015-MS01, Class A4 | | | 3.779(cc) | | | | 05/15/48 | | | | 4,220 | | | | 4,031,383 | |
Series 2020-HR08, Class A1 | | | 0.932 | | | | 07/15/53 | | | | 1,502 | | | | 1,420,003 | |
One New York Plaza Trust, | | | | | | | | | | | | | | | | |
Series 2020-01NYP, Class A, 144A, 1 Month SOFR + 1.064% (Cap N/A, Floor 0.950%) | | | 6.375(c) | | | | 01/15/36 | | | | 19,065 | | | | 18,277,326 | |
Wells Fargo Commercial Mortgage Trust, | | | | | | | | | | | | | | | | |
Series 2015-LC22, Class A3 | | | 3.572 | | | | 09/15/58 | | | | 4,169 | | | | 4,019,142 | |
Series 2015-LC22, Class A4 | | | 3.839 | | | | 09/15/58 | | | | 8,000 | | | | 7,640,358 | |
Series 2015-NXS02, Class A2 | | | 3.020 | | | | 07/15/58 | | | | 64 | | | | 62,036 | |
Series 2015-NXS02, Class A4 | | | 3.498 | | | | 07/15/58 | | | | 10,300 | | | | 9,920,954 | |
Series 2016-C34, Class ASB | | | 2.911 | | | | 06/15/49 | | | | 2,854 | | | | 2,733,528 | |
Series 2016-C36, Class A3 | | | 2.807 | | | | 11/15/59 | | | | 12,385 | | | | 11,380,079 | |
Series 2016-NXS05, Class A5 | | | 3.372 | | | | 01/15/59 | | | | 4,920 | | | | 4,597,505 | |
WFRBS Commercial Mortgage Trust, | | | | | | | | | | | | | | | | |
Series 2014-LC14, Class A5 | | | 4.045 | | | | 03/15/47 | | | | 25,000 | | | | 24,787,412 | |
| | | | | | | | | | | | | | | | |
| | | | |
TOTAL COMMERCIAL MORTGAGE-BACKED SECURITIES
(cost $806,617,334) | | | | | | | | | | | | | | | 798,876,793 | |
| | | | | | | | | | | | | | | | |
| | | | |
CORPORATE BONDS 34.3% | | | | | | | | | | | | | | | | |
| | | | |
Aerospace & Defense 0.2% | | | | | | | | | | | | | | | | |
RTX Corp.,
Sr. Unsec’d. Notes | | | 5.000 | | | | 02/27/26 | | | | 8,000 | | | | 7,963,188 | |
See Notes to Financial Statements.
58
PGIM Ultra Short Bond ETF
Schedule of Investments (continued)
as of August 31, 2023
| | | | | | | | | | | | | | | | |
| | | | |
| Description | | Interest
Rate | | | Maturity
Date | | | Principal
Amount
(000)# | | | Value | |
| | | |
CORPORATE BONDS (Continued) | | | | | | | | | | | | | |
| | | | |
Agriculture 0.4% | | | | | | | | | | | | | | | | |
| | | | |
Cargill, Inc., | | | | | | | | | | | | | | | | |
Sr. Unsec’d. Notes, 144A | | | 3.500% | | | | 04/22/25 | | | | 6,750 | | | $ | 6,558,037 | |
Sr. Unsec’d. Notes, 144A | | | 4.875 | | | | 10/10/25 | | | | 14,000 | | | | 13,902,828 | |
| | | | | | | | | | | | | | | | |
| | | | |
| | | | | | | | | | | | | | | 20,460,865 | |
| | | | |
Auto Manufacturers 4.3% | | | | | | | | | | | | | | | | |
| | | | |
American Honda Finance Corp., | | | | | | | | | | | | | | | | |
Sr. Unsec’d. Notes | | | 4.750 | | | | 01/12/26 | | | | 9,750 | | | | 9,653,100 | |
Sr. Unsec’d. Notes, MTN | | | 0.750 | | | | 08/09/24 | | | | 4,500 | | | | 4,300,099 | |
| | | | |
BMW US Capital LLC (Germany), | | | | | | | | | | | | | | | | |
Gtd. Notes, 144A(a) | | | 3.250 | | | | 04/01/25 | | | | 7,000 | | | | 6,785,640 | |
Gtd. Notes, 144A, SOFR Index + 0.530% | | | 5.792(c) | | | | 04/01/24 | | | | 4,000 | | | | 4,005,128 | |
Gtd. Notes, 144A, SOFR Index + 0.620% | | | 5.955(c) | | | | 08/11/25 | | | | 20,000 | | | | 20,018,078 | |
Gtd. Notes, 144A, SOFR Index + 0.840% | | | 6.102(c) | | | | 04/01/25 | | | | 11,390 | | | | 11,451,066 | |
| | | | |
Daimler Truck Finance North America LLC (Germany), | | | | | | | | | | | | | | | | |
Gtd. Notes, 144A(a) | | | 5.150 | | | | 01/16/26 | | | | 14,000 | | | | 13,885,694 | |
| | | | |
Mercedes-Benz Finance North America LLC (Germany), | | | | | | | | | | | | | | | | |
Gtd. Notes, 144A | | | 0.750 | | | | 03/01/24 | | | | 13,500 | | | | 13,177,602 | |
Gtd. Notes, 144A | | | 4.800 | | | | 03/30/26 | | | | 35,000 | | | | 34,647,057 | |
Gtd. Notes, 144A | | | 5.375 | | | | 11/26/25 | | | | 8,500 | | | | 8,494,142 | |
| | | | |
PACCAR Financial Corp., | | | | | | | | | | | | | | | | |
Sr. Unsec’d. Notes, MTN | | | 3.550 | | | | 08/11/25 | | | | 25,000 | | | | 24,293,687 | |
Sr. Unsec’d. Notes, MTN(a) | | | 4.450 | | | | 03/30/26 | | | | 15,000 | | | | 14,869,031 | |
| | | | |
Toyota Motor Credit Corp., | | | | | | | | | | | | | | | | |
Sr. Unsec’d. Notes | | | 4.450 | | | | 05/18/26 | | | | 15,000 | | | | 14,794,309 | |
Sr. Unsec’d. Notes, MTN | | | 3.650 | | | | 08/18/25 | | | | 5,000 | | | | 4,852,597 | |
Sr. Unsec’d. Notes, MTN | | | 3.950 | | | | 06/30/25 | | | | 18,750 | | | | 18,314,513 | |
Sr. Unsec’d. Notes, MTN, SOFR + 0.750% (Cap N/A, Floor 0.000%) | | | 6.050(c) | | | | 12/11/23 | | | | 12,000 | | | | 12,016,395 | |
| | | | |
Volkswagen Group of America Finance LLC (Germany), | | | | | | | | | | | | | | | | |
Gtd. Notes, 144A | | | 3.950 | | | | 06/06/25 | | | | 13,250 | | | | 12,849,475 | |
| | | | | | | | | | | | | | | | |
| | | | |
| | | | | | | | | | | | | | | 228,407,613 | |
| | | | |
Banks 7.5% | | | | | | | | | | | | | | | | |
| | | | |
Bank of Montreal (Canada), | | | | | | | | | | | | | | | | |
Sr. Unsec’d. Notes, MTN, SOFR Index + 0.710% | | | 5.908(c) | | | | 03/08/24 | | | | 20,000 | | | | 20,026,272 | |
| | | | |
Bank of Nova Scotia (The) (Canada), | | | | | | | | | | | | | | | | |
Sr. Unsec’d. Notes, MTN, SOFR + 0.460% | | | 5.738(c) | | | | 01/10/25 | | | | 7,750 | | | | 7,719,079 | |
See Notes to Financial Statements.
PGIM Fixed Income ETFs 59
PGIM Ultra Short Bond ETF
Schedule of Investments (continued)
as of August 31, 2023
| | | | | | | | | | | | | | |
| | | | |
| Description | | Interest
Rate | | Maturity
Date | | | Principal
Amount
(000)# | | | Value | |
| | | |
CORPORATE BONDS (Continued) | | | | | | | | | | | | |
| | | | |
Banks (cont’d.) | | | | | | | | | | | | | | |
| | | | |
Bank of Nova Scotia (The) (Canada), (cont’d.) | | | | | | | | | | | | | | |
Sr. Unsec’d. Notes, MTN, SOFR Index + 0.900% | | 6.181%(c) | | | 04/11/25 | | | | 4,750 | | | $ | 4,754,594 | |
| | | | |
Banque Federative du Credit Mutuel SA (France), | | | | | | | | | | | | | | |
Sr. Unsec’d. Notes, 144A | | 0.650 | | | 02/27/24 | | | | 7,250 | | | | 7,071,243 | |
Sr. Unsec’d. Notes, 144A, SOFR Index + 0.410% | | 5.745(c) | | | 02/04/25 | | | | 20,000 | | | | 19,846,642 | |
| | | | |
Canadian Imperial Bank of Commerce (Canada), | | | | | | | | | | | | | | |
Sr. Unsec’d. Notes, SOFR Index + 0.420% | | 5.722(c) | | | 10/18/24 | | | | 10,000 | | | | 9,961,263 | |
| | | | |
Commonwealth Bank of Australia (Australia), | | | | | | | | | | | | | | |
Sr. Unsec’d. Notes | | 5.316 | | | 03/13/26 | | | | 25,000 | | | | 25,077,470 | |
Sr. Unsec’d. Notes, 144A, SOFR + 0.630% | | 5.930(c) | | | 01/10/25 | | | | 28,500 | | | | 28,512,876 | |
| | | | |
Cooperatieve Rabobank UA (Netherlands), | | | | | | | | | | | | | | |
Sr. Unsec’d. Notes, SOFR Index + 0.300% (Cap N/A, Floor 0.000%) | | 5.590(c) | | | 01/12/24 | | | | 5,500 | | | | 5,498,076 | |
| | | | |
Credit Suisse AG (Switzerland), | | | | | | | | | | | | | | |
Sr. Unsec’d. Notes, SOFR Index + 0.390% | | 5.725(c) | | | 02/02/24 | | | | 2,500 | | | | 2,489,075 | |
| | | | |
Deutsche Bank AG (Germany), | | | | | | | | | | | | | | |
Sr. Unsec’d. Notes, Series E, SOFR + 0.500% (Cap N/A, Floor 0.000%) | | 5.836(c) | | | 11/08/23 | | | | 20,000 | | | | 19,988,078 | |
| | | | |
DNB Bank ASA (Norway), | | | | | | | | | | | | | | |
Sr. Unsec’d. Notes, 144A | | 5.896(ff) | | | 10/09/26 | | | | 25,000 | | | | 25,028,510 | |
| | | | |
Federation des Caisses Desjardins du Quebec (Canada), | | | | | | | | | | | | | | |
Sr. Unsec’d. Notes, 144A(a) | | 4.400 | | | 08/23/25 | | | | 25,000 | | | | 24,301,907 | |
| | | | |
Morgan Stanley, | | | | | | | | | | | | | | |
Sr. Unsec’d. Notes, MTN | | 2.720(ff) | | | 07/22/25 | | | | 37,000 | | | | 35,906,503 | |
| | | | |
National Australia Bank Ltd. (Australia), | | | | | | | | | | | | | | |
Sr. Unsec’d. Notes | | 3.500 | | | 06/09/25 | | | | 7,250 | | | | 7,026,656 | |
Sr. Unsec’d. Notes | | 4.966 | | | 01/12/26 | | | | 32,000 | | | | 31,791,133 | |
| | | | |
NatWest Markets PLC (United Kingdom), | | | | | | | | | | | | | | |
Sr. Unsec’d. Notes, 144A, SOFR + 1.450% | | 6.687(c) | | | 03/22/25 | | | | 9,000 | | | | 9,058,586 | |
| | | | |
Nordea Bank Abp (Finland), | | | | | | | | | | | | | | |
Sr. Unsec’d. Notes, 144A | | 0.625 | | | 05/24/24 | | | | 9,500 | | | | 9,155,288 | |
Sr. Unsec’d. Notes, 144A | | 4.750 | | | 09/22/25 | | | | 10,500 | | | | 10,337,850 | |
| | | | |
Royal Bank of Canada (Canada), | | | | | | | | | | | | | | |
Sr. Unsec’d. Notes, GMTN, SOFR Index + 0.340% | | 5.616(c) | | | 10/07/24 | | | | 10,000 | | | | 9,977,482 | |
Sr. Unsec’d. Notes, GMTN, SOFR Index + 0.525% | | 5.836(c) | | | 01/20/26 | | | | 10,000 | | | | 9,849,978 | |
Sr. Unsec’d. Notes, GMTN, SOFR Index + 0.570% | | 5.900(c) | | | 04/27/26 | | | | 7,027 | | | | 6,967,798 | |
Sr. Unsec’d. Notes, MTN, SOFR Index + 0.450% | | 5.778(c) | | | 10/26/23 | | | | 2,000 | | | | 1,999,570 | |
| | | | |
Sumitomo Mitsui Trust Bank Ltd. (Japan), | | | | | | | | | | | | | | |
Sr. Unsec’d. Notes, 144A, MTN, SOFR + 0.440% | | 5.655(c) | | | 09/16/24 | | | | 7,500 | | | | 7,473,056 | |
See Notes to Financial Statements.
60
PGIM Ultra Short Bond ETF
Schedule of Investments (continued)
as of August 31, 2023
| | | | | | | | | | | | | | |
| | | | |
| Description | | Interest
Rate | | Maturity
Date | | | Principal
Amount
(000)# | | | Value | |
| | | |
CORPORATE BONDS (Continued) | | | | | | | | | | | | |
| | | | |
Banks (cont’d.) | | | | | | | | | | | | | | |
| | | | |
Toronto-Dominion Bank (The) (Canada), | | | | | | | | | | | | | | |
Sr. Unsec’d. Notes, MTN, SOFR + 0.350% | | 5.552%(c) | | | 09/10/24 | | | | 8,000 | | | $ | 7,971,241 | |
| | | | |
Truist Bank, | | | | | | | | | | | | | | |
Sr. Unsec’d. Notes, SOFR + 0.200%(a) | | 5.498(c) | | | 01/17/24 | | | | 14,850 | | | | 14,750,636 | |
| | | | |
UBS AG (Switzerland), | | | | | | | | | | | | | | |
Sr. Unsec’d. Notes, 144A, MTN | | 0.450 | | | 02/09/24 | | | | 3,000 | | | | 2,926,812 | |
Sr. Unsec’d. Notes, 144A, MTN, SOFR + 0.360% | | 5.695(c) | | | 02/09/24 | | | | 7,780 | | | | 7,775,808 | |
| | | | |
UBS Group AG (Switzerland), | | | | | | | | | | | | | | |
Sr. Unsec’d. Notes | | 4.550 | | | 04/17/26 | | | | 10,000 | | | | 9,677,262 | |
Sr. Unsec’d. Notes, 144A | | 5.711(ff) | | | 01/12/27 | | | | 15,000 | | | | 14,938,750 | |
| | | | | | | | | | | | | | |
| | | | |
| | | | | | | | | | | | | 397,859,494 | |
| | | | |
Beverages 0.8% | | | | | | | | | | | | | | |
| | | | |
Coca-Cola Europacific Partners PLC (United Kingdom), | | | | | | | | | | | | | | |
Sr. Unsec’d. Notes, 144A | | 0.800 | | | 05/03/24 | | | | 3,000 | | | | 2,904,330 | |
| | | | |
Diageo Capital PLC (United Kingdom), | | | | | | | | | | | | | | |
Gtd. Notes | | 5.200 | | | 10/24/25 | | | | 17,000 | | | | 17,000,914 | |
| | | | |
Keurig Dr. Pepper, Inc., | | | | | | | | | | | | | | |
Gtd. Notes | | 0.750 | | | 03/15/24 | | | | 25,000 | | | | 24,328,523 | |
| | | | | | | | | | | | | | |
| | | | |
| | | | | | | | | | | | | 44,233,767 | |
| | | | |
Biotechnology 0.3% | | | | | | | | | | | | | | |
| | | | |
Amgen, Inc., | | | | | | | | | | | | | | |
Sr. Unsec’d. Notes | | 5.250 | | | 03/02/25 | | | | 13,250 | | | | 13,193,819 | |
| | | | |
Chemicals 1.1% | | | | | | | | | | | | | | |
| | | | |
Air Liquide Finance SA (France), | | | | | | | | | | | | | | |
Gtd. Notes, 144A | | 2.250 | | | 09/27/23 | | | | 1,000 | | | | 997,922 | |
| | | | |
Linde, Inc., | | | | | | | | | | | | | | |
Gtd. Notes | | 4.700 | | | 12/05/25 | | | | 28,500 | | | | 28,250,646 | |
| | | | |
Nutrien Ltd. (Canada), | | | | | | | | | | | | | | |
Sr. Unsec’d. Notes | | 5.900 | | | 11/07/24 | | | | 13,270 | | | | 13,263,672 | |
Sr. Unsec’d. Notes | | 5.950 | | | 11/07/25 | | | | 7,250 | | | | 7,294,082 | |
See Notes to Financial Statements.
PGIM Fixed Income ETFs 61
PGIM Ultra Short Bond ETF
Schedule of Investments (continued)
as of August 31, 2023
| | | | | | | | | | | | | | | | |
| | | | |
| Description | | Interest
Rate | | | Maturity
Date | | | Principal
Amount
(000)# | | | Value | |
| | | | |
CORPORATE BONDS (Continued) | | | | | | | | | | | | | | | | |
| | | | |
Chemicals (cont’d.) | | | | | | | | | | | | | | | | |
| | | | |
Sherwin-Williams Co. (The), | | | | | | | | | | | | | | | | |
Sr. Unsec’d. Notes(a) | | | 4.250% | | | | 08/08/25 | | | | 5,500 | | | $ | 5,381,687 | |
| | | | |
Westlake Corp., | | | | | | | | | | | | | | | | |
Sr. Unsec’d. Notes | | | 0.875 | | | | 08/15/24 | | | | 2,750 | | | | 2,620,536 | |
| | | | | | | | | | | | | | | | |
| | | | |
| | | | | | | | | | | | | | | 57,808,545 | |
| | | | |
Commercial Services 0.2% | | | | | | | | | | | | | | | | |
| | | | |
Verisk Analytics, Inc., | | | | | | | | | | | | | | | | |
Sr. Unsec’d. Notes | | | 4.000 | | | | 06/15/25 | | | | 10,000 | | | | 9,725,849 | |
| | | | |
Computers 1.2% | | | | | | | | | | | | | | | | |
| | | | |
Apple, Inc., | | | | | | | | | | | | | | | | |
Sr. Unsec’d. Notes | | | 3.200 | | | | 05/13/25 | | | | 16,000 | | | | 15,521,830 | |
Sr. Unsec’d. Notes | | | 3.250 | | | | 02/23/26 | | | | 13,150 | | | | 12,643,409 | |
| | | | |
International Business Machines Corp., | | | | | | | | | | | | | | | | |
Sr. Unsec’d. Notes | | | 4.500 | | | | 02/06/26 | | | | 37,000 | | | | 36,398,531 | |
| | | | | | | | | | | | | | | | |
| | | | |
| | | | | | | | | | | | | | | 64,563,770 | |
| | | | |
Cosmetics/Personal Care 0.4% | | | | | | | | | | | | | | | | |
| | | | |
Colgate-Palmolive Co., | | | | | | | | | | | | | | | | |
Sr. Unsec’d. Notes | | | 3.100 | | | | 08/15/25 | | | | 6,750 | | | | 6,503,125 | |
| | | | |
Kenvue, Inc., | | | | | | | | | | | | | | | | |
Gtd. Notes, 144A | | | 5.350 | | | | 03/22/26 | | | | 12,500 | | | | 12,562,173 | |
| | | | | | | | | | | | | | | | |
| | | | |
| | | | | | | | | | | | | | | 19,065,298 | |
| | | | |
Diversified Financial Services 0.2% | | | | | | | | | | | | | | | | |
| | | | |
Citigroup Global Markets Holdings, Inc., | | | | | | | | | | | | | | | | |
Gtd. Notes, MTN | | | 0.750 | | | | 06/07/24 | | | | 13,250 | | | | 12,743,023 | |
| | | | |
Electric 3.0% | | | | | | | | | | | | | | | | |
| | | | |
CenterPoint Energy, Inc., | | | | | | | | | | | | | | | | |
Sr. Unsec’d. Notes, SOFR Index + 0.650% | | | 5.985(c) | | | | 05/13/24 | | | | 10,000 | | | | 9,994,264 | |
| | | | |
DTE Energy Co., | | | | | | | | | | | | | | | | |
Sr. Unsec’d. Notes | | | 4.220 | | | | 11/01/24 | | | | 8,250 | | | | 8,092,184 | |
| | | | |
Duke Energy Corp., | | | | | | | | | | | | | | | | |
Sr. Unsec’d. Notes | | | 5.000 | | | | 12/08/25 | | | | 13,250 | | | | 13,119,237 | |
See Notes to Financial Statements.
62
PGIM Ultra Short Bond ETF
Schedule of Investments (continued)
as of August 31, 2023
| | | | | | | | | | | | | | | | |
| | | | |
| Description | | Interest
Rate | | | Maturity
Date | | | Principal
Amount
(000)# | | | Value | |
| | | | |
CORPORATE BONDS (Continued) | | | | | | | | | | | | | | | | |
| | | | |
Electric (cont’d.) | | | | | | | | | | | | | | | | |
| | | | |
Entergy Louisiana LLC, | | | | | | | | | | | | | | | | |
First Mortgage | | | 0.620% | | | | 11/17/23 | | | | 2,569 | | | $ | 2,543,739 | |
| | | | |
Florida Power & Light Co., | | | | | | | | | | | | | | | | |
Sr. Unsec’d. Notes | | | 4.450 | | | | 05/15/26 | | | | 20,000 | | | | 19,685,442 | |
| | | | |
NextEra Energy Capital Holdings, Inc., | | | | | | | | | | | | | | | | |
Gtd. Notes | | | 2.940 | | | | 03/21/24 | | | | 15,000 | | | | 14,765,567 | |
Gtd. Notes | | | 6.051 | | | | 03/01/25 | | | | 6,750 | | | | 6,777,943 | |
| | | | |
Public Service Enterprise Group, Inc., | | | | | | | | | | | | | | | | |
Sr. Unsec’d. Notes | | | 0.841 | | | | 11/08/23 | | | | 20,300 | | | | 20,118,601 | |
| | | | |
Southern California Edison Co., | | | | | | | | | | | | | | | | |
| | | | |
First Mortgage, Series C | | | 4.200 | | | | 06/01/25 | | | | 14,250 | | | | 13,926,795 | |
| | | | |
WEC Energy Group, Inc., | | | | | | | | | | | | | | | | |
Sr. Unsec’d. Notes | | | 0.550 | | | | 09/15/23 | | | | 15,000 | | | | 14,976,490 | |
Sr. Unsec’d. Notes | | | 0.800 | | | | 03/15/24 | | | | 7,250 | | | | 7,052,205 | |
Sr. Unsec’d. Notes | | | 4.750 | | | | 01/09/26 | | | | 23,000 | | | | 22,692,767 | |
Sr. Unsec’d. Notes | | | 5.000 | | | | 09/27/25 | | | | 6,000 | | | | 5,943,844 | |
| | | | | | | | | | | | | | | | |
| | | | |
| | | | | | | | | | | | | | | 159,689,078 | |
| | | | |
Electronics 0.5% | | | | | | | | | | | | | | | | |
| | | | |
Amphenol Corp., | | | | | | | | | | | | | | | | |
Sr. Unsec’d. Notes | | | 4.750 | | | | 03/30/26 | | | | 3,750 | | | | 3,706,145 | |
| | | | |
Tyco Electronics Group SA, | | | | | | | | | | | | | | | | |
Gtd. Notes | | | 4.500 | | | | 02/13/26 | | | | 23,250 | | | | 22,860,121 | |
| | | | | | | | | | | | | | | | |
| | | | |
| | | | | | | | | | | | | | | 26,566,266 | |
| | | | |
Foods 1.0% | | | | | | | | | | | | | | | | |
| | | | |
Hormel Foods Corp., | | | | | | | | | | | | | | | | |
Sr. Unsec’d. Notes | | | 0.650 | | | | 06/03/24 | | | | 3,500 | | | | 3,370,864 | |
| | | | |
Mondelez International Holdings Netherlands BV, | | | | | | | | | | | | | | | | |
Gtd. Notes, 144A | | | 4.250 | | | | 09/15/25 | | | | 13,750 | | | | 13,438,584 | |
| | | | |
Nestle Holdings, Inc., | | | | | | | | | | | | | | | | |
Gtd. Notes, 144A(a) | | | 0.375 | | | | 01/15/24 | | | | 5,000 | | | | 4,904,136 | |
Gtd. Notes, 144A | | | 4.000 | | | | 09/12/25 | | | | 11,725 | | | | 11,488,882 | |
Gtd. Notes, 144A | | | 5.250 | | | | 03/13/26 | | | | 20,000 | | | | 20,083,255 | |
| | | | | | | | | | | | | | | | |
| | | | |
| | | | | | | | | | | | | | | 53,285,721 | |
See Notes to Financial Statements.
PGIM Fixed Income ETFs 63
PGIM Ultra Short Bond ETF
Schedule of Investments (continued)
as of August 31, 2023
| | | | | | | | | | | | | | | | |
| | | | |
| Description | | Interest
Rate | | | Maturity
Date | | | Principal
Amount
(000)# | | | Value | |
| | | | |
CORPORATE BONDS (Continued) | | | | | | | | | | | | | | | | |
| | | | |
Healthcare-Products 0.6% | | | | | | | | | | | | | | | | |
| | | | |
Baxter International, Inc., | | | | | | | | | | | | | | | | |
Sr. Unsec’d. Notes | | | 0.868% | | | | 12/01/23 | | | | 10,000 | | | $ | 9,877,383 | |
Sr. Unsec’d. Notes, SOFR Index + 0.260% | | | 5.595(c) | | | | 12/01/23 | | | | 20,000 | | | | 19,962,433 | |
| | | | |
Stryker Corp., | | | | | | | | | | | | | | | | |
Sr. Unsec’d. Notes | | | 0.600 | | | | 12/01/23 | | | | 1,250 | | | | 1,234,615 | |
| | | | | | | | | | | | | | | | |
| | | | |
| | | | | | | | | | | | | | | 31,074,431 | |
| | | | |
Healthcare-Services 0.2% | | | | | | | | | | | | | | | | |
| | | | |
UnitedHealth Group, Inc., | | | | | | | | | | | | | | | | |
Sr. Unsec’d. Notes | | | 0.550 | | | | 05/15/24 | | | | 7,250 | | | | 7,000,955 | |
Sr. Unsec’d. Notes | | | 5.150 | | | | 10/15/25 | | | | 5,750 | | | | 5,747,027 | |
| | | | | | | | | | | | | | | | |
| | | | |
| | | | | | | | | | | | | | | 12,747,982 | |
| | | | |
Household Products/Wares 0.2% | | | | | | | | | | | | | | | | |
| | | | |
Avery Dennison Corp., | | | | | | | | | | | | | | | | |
Sr. Unsec’d. Notes | | | 0.850 | | | | 08/15/24 | | | | 12,350 | | | | 11,770,238 | |
| | | | |
Insurance 2.4% | | | | | | | | | | | | | | | | |
| | | | |
Corebridge Financial, Inc., | | | | | | | | | | | | | | | | |
Sr. Unsec’d. Notes | | | 3.500 | | | | 04/04/25 | | | | 8,000 | | | | 7,695,100 | |
| | | | |
Corebridge Global Funding, | | | | | | | | | | | | | | | | |
Sr. Sec’d. Notes, 144A | | | 0.650 | | | | 06/17/24 | | | | 12,750 | | | | 12,213,749 | |
| | | | |
Equitable Financial Life Global Funding, | | | | | | | | | | | | | | | | |
Sec’d. Notes, 144A | | | 0.800 | | | | 08/12/24 | | | | 3,000 | | | | 2,854,200 | |
| | | | |
Metropolitan Life Global Funding I, | | | | | | | | | | | | | | | | |
Sec’d. Notes, 144A, MTN | | | 4.050 | | | | 08/25/25 | | | | 23,250 | | | | 22,548,236 | |
| | | | |
New York Life Global Funding, | | | | | | | | | | | | | | | | |
Sec’d. Notes, 144A | | | 2.900 | | | | 01/17/24 | | | | 4,190 | | | | 4,144,911 | |
Sec’d. Notes, 144A, MTN | | | 3.600 | | | | 08/05/25 | | | | 19,750 | | | | 19,114,247 | |
| | | | |
Pacific Life Global Funding II, | | | | | | | | | | | | | | | | |
Sr. Sec’d. Notes, 144A | | | 0.500 | | | | 09/23/23 | | | | 4,750 | | | | 4,734,735 | |
| | | | |
Principal Life Global Funding II, | | | | | | | | | | | | | | | | |
Sec’d. Notes, 144A | | | 0.500 | | | | 01/08/24 | | | | 7,250 | | | | 7,112,624 | |
Sec’d. Notes, 144A, SOFR + 0.450% | | | 5.740(c) | | | | 04/12/24 | | | | 1,250 | | | | 1,248,616 | |
Sr. Sec’d. Notes, 144A, SOFR + 0.900% (Cap N/A, Floor 0.000%) | | | 6.233(c) | | | | 08/28/25 | | | | 27,000 | | | | 26,997,972 | |
See Notes to Financial Statements.
64
PGIM Ultra Short Bond ETF
Schedule of Investments (continued)
as of August 31, 2023
| | | | | | | | | | | | | | | | |
| | | | |
| Description | | Interest
Rate | | | Maturity
Date | | | Principal
Amount
(000)# | | | Value | |
| | | | |
CORPORATE BONDS (Continued) | | | | | | | | | | | | | | | | |
| | | | |
Insurance (cont’d.) | | | | | | | | | | | | | | | | |
Protective Life Global Funding, | | | | | | | | | | | | | | | | |
Sec’d. Notes, 144A, SOFR + 1.050% (Cap N/A, Floor 0.000%) | | | 6.254%(c) | | | | 12/11/24 | | | | 20,000 | | | $ | 20,068,252 | |
| | | | | | | | | | | | | | | | |
| | | | |
| | | | | | | | | | | | | | | 128,732,642 | |
| | | | |
Internet 0.6% | | | | | | | | | | | | | | | | |
Amazon.com, Inc., | | | | | | | | | | | | | | | | |
Sr. Unsec’d. Notes | | | 4.600 | | | | 12/01/25 | | | | 32,000 | | | | 31,774,991 | |
| | | | |
Iron/Steel 0.2% | | | | | | | | | | | | | | | | |
Nucor Corp., | | | | | | | | | | | | | | | | |
Sr. Unsec’d. Notes | | | 3.950 | | | | 05/23/25 | | | | 8,000 | | | | 7,777,155 | |
| | | | |
Machinery-Construction & Mining 0.4% | | | | | | | | | | | | | | | | |
Caterpillar Financial Services Corp., | | | | | | | | | | | | | | | | |
Sr. Unsec’d. Notes | | | 4.800 | | | | 01/06/26 | | | | 15,000 | | | | 14,926,290 | |
Sr. Unsec’d. Notes, MTN, SOFR + 0.245% | | | 5.580(c) | | | | 05/17/24 | | | | 6,000 | | | | 5,993,049 | |
| | | | | | | | | | | | | | | | |
| | | | |
| | | | | | | | | | | | | | | 20,919,339 | |
| | | | |
Machinery-Diversified 0.8% | | | | | | | | | | | | | | | | |
CNH Industrial Capital LLC, | | | | | | | | | | | | | | | | |
Gtd. Notes | | | 3.950 | | | | 05/23/25 | | | | 12,500 | | | | 12,141,341 | |
John Deere Capital Corp., | | | | | | | | | | | | | | | | |
Sr. Unsec’d. Notes, MTN | | | 4.800 | | | | 01/09/26 | | | | 29,000 | | | | 28,827,585 | |
Sr. Unsec’d. Notes, MTN, SOFR + 0.200% | | | 5.471(c) | | | | 10/11/24 | | | | 2,000 | | | | 1,996,925 | |
| | | | | | | | | | | | | | | | |
| | | | |
| | | | | | | | | | | | | | | 42,965,851 | |
| | | | |
Media 0.7% | | | | | | | | | | | | | | | | |
Comcast Corp., | | | | | | | | | | | | | | | | |
Gtd. Notes | | | 5.250 | | | | 11/07/25 | | | | 7,250 | | | | 7,262,642 | |
Walt Disney Co. (The), | | | | | | | | | | | | | | | | |
Gtd. Notes | | | 3.700 | | | | 10/15/25 | | | | 30,000 | | | | 29,119,872 | |
| | | | | | | | | | | | | | | | |
| | | | |
| | | | | | | | | | | | | | | 36,382,514 | |
See Notes to Financial Statements.
PGIM Fixed Income ETFs 65
PGIM Ultra Short Bond ETF
Schedule of Investments (continued)
as of August 31, 2023
| | | | | | | | | | | | | | | | |
| | | | |
| Description | | Interest
Rate | | | Maturity
Date | | | Principal
Amount
(000)# | | | Value | |
| | | | |
CORPORATE BONDS (Continued) | | | | | | | | | | | | | | | | |
| | | | |
Mining 0.6% | | | | | | | | | | | | | | | | |
| | | | |
BHP Billiton Finance USA Ltd. (Australia), | | | | | | | | | | | | | | | | |
Gtd. Notes | | | 4.875% | | | | 02/27/26 | | | | 30,000 | | | $ | 29,782,521 | |
| | | | |
Miscellaneous Manufacturing 0.1% | | | | | | | | | | | | | | | | |
| | | | |
Carlisle Cos., Inc., | | | | | | | | | | | | | | | | |
Sr. Unsec’d. Notes | | | 0.550 | | | | 09/01/23 | | | | 3,000 | | | | 3,000,000 | |
| | | | |
Oil & Gas 0.3% | | | | | | | | | | | | | | | | |
| | | | |
Phillips 66, | | | | | | | | | | | | | | | | |
Gtd. Notes | | | 0.900 | | | | 02/15/24 | | | | 4,000 | | | | 3,912,063 | |
| | | | |
Pioneer Natural Resources Co., | | | | | | | | | | | | | | | | |
Sr. Unsec’d. Notes | | | 5.100 | | | | 03/29/26 | | | | 14,250 | | | | 14,139,293 | |
| | | | | | | | | | | | | | | | |
| | | | |
| | | | | | | | | | | | | | | 18,051,356 | |
| | | | |
Pharmaceuticals 0.2% | | | | | | | | | | | | | | | | |
| | | | |
Astrazeneca Finance LLC (United Kingdom), | | | | | | | | | | | | | | | | |
Gtd. Notes | | | 0.700 | | | | 05/28/24 | | | | 12,250 | | | | 11,825,553 | |
| | | | |
Pipelines 1.6% | | | | | | | | | | | | | | | | |
| | | | |
Enbridge, Inc. (Canada), | | | | | | | | | | | | | | | | |
Gtd. Notes | | | 0.550 | | | | 10/04/23 | | | | 8,000 | | | | 7,970,625 | |
Gtd. Notes | | | 4.000 | | | | 10/01/23 | | | | 3,700 | | | | 3,695,049 | |
| | | | |
Enterprise Products Operating LLC, | | | | | | | | | | | | | | | | |
Gtd. Notes | | | 5.050 | | | | 01/10/26 | | | | 14,750 | | | | 14,677,928 | |
| | | | |
ONEOK, Inc., | | | | | | | | | | | | | | | | |
Gtd. Notes | | | 5.550 | | | | 11/01/26 | | | | 7,000 | | | | 7,003,284 | |
| | | | |
TransCanada PipeLines Ltd. (Canada), | | | | | | | | | | | | | | | | |
Sr. Unsec’d. Notes | | | 1.000 | | | | 10/12/24 | | | | 9,750 | | | | 9,236,787 | |
| | | | |
Williams Cos., Inc. (The), | | | | | | | | | | | | | | | | |
Sr. Unsec’d. Notes | | | 5.400 | | | | 03/02/26 | | | | 40,000 | | | | 39,940,084 | |
| | | | | | | | | | | | | | | | |
| | | | |
| | | | | | | | | | | | | | | 82,523,757 | |
See Notes to Financial Statements.
66
PGIM Ultra Short Bond ETF
Schedule of Investments (continued)
as of August 31, 2023
| | | | | | | | | | | | | | | | |
| | | | |
| Description | | Interest
Rate | | | Maturity
Date | | | Principal
Amount
(000)# | | | Value | |
| | | | |
CORPORATE BONDS (Continued) | | | | | | | | | | | | | | | | |
| | | | |
Real Estate Investment Trusts (REITs) 0.9% | | | | | | | | | | | | | | | | |
| | | | |
Public Storage Operating Co., | | | | | | | | | | | | | | | | |
Sr. Unsec’d. Notes, SOFR + 0.470% | | | 5.786%(c) | | | | 04/23/24 | | | | 8,500 | | | $ | 8,498,845 | |
| | | | |
Weyerhaeuser Co., | | | | | | | | | | | | | | | | |
Sr. Unsec’d. Notes | | | 4.750 | | | | 05/15/26 | | | | 40,000 | | | | 39,364,908 | |
| | | | | | | | | | | | | | | | |
| | | | |
| | | | | | | | | | | | | | | 47,863,753 | |
| | | | |
Retail 1.0% | | | | | | | | | | | | | | | | |
| | | | |
7-Eleven, Inc., | | | | | | | | | | | | | | | | |
Sr. Unsec’d. Notes, 144A | | | 0.800 | | | | 02/10/24 | | | | 2,250 | | | | 2,199,299 | |
| | | | |
Dollar General Corp., | | | | | | | | | | | | | | | | |
Sr. Unsec’d. Notes | | | 4.250 | | | | 09/20/24 | | | | 6,750 | | | | 6,634,286 | |
| | | | |
Home Depot, Inc. (The), | | | | | | | | | | | | | | | | |
Sr. Unsec’d. Notes | | | 2.700 | | | | 04/15/25 | | | | 6,000 | | | | 5,764,296 | |
| | | | |
Lowe’s Cos., Inc., | | | | | | | | | | | | | | | | |
Sr. Unsec’d. Notes | | | 4.400 | | | | 09/08/25 | | | | 10,000 | | | | 9,826,766 | |
Sr. Unsec’d. Notes | | | 4.800 | | | | 04/01/26 | | | | 13,500 | | | | 13,339,237 | |
| | | | |
Walmart, Inc., | | | | | | | | | | | | | | | | |
Sr. Unsec’d. Notes | | | 3.900 | | | | 09/09/25 | | | | 13,750 | | | | 13,455,523 | |
| | | | | | | | | | | | | | | | |
| | | | |
| | | | | | | | | | | | | | | 51,219,407 | |
| | | | |
Semiconductors 0.8% | | | | | | | | | | | | | | | | |
| | | | |
Analog Devices, Inc., | | | | | | | | | | | | | | | | |
Sr. Unsec’d. Notes, SOFR + 0.250% | | | 5.510(c) | | | | 10/01/24 | | | | 2,000 | | | | 1,996,860 | |
| | | | |
Intel Corp., | | | | | | | | | | | | | | | | |
Sr. Unsec’d. Notes | | | 2.600 | | | | 05/19/26 | | | | 10,181 | | | | 9,592,782 | |
| | | | |
Microchip Technology, Inc., | | | | | | | | | | | | | | | | |
Sr. Unsec’d. Notes | | | 0.972 | | | | 02/15/24 | | | | 28,500 | | | | 27,849,452 | |
| | | | | | | | | | | | | | | | |
| | | | |
| | | | | | | | | | | | | | | 39,439,094 | |
| | | | |
Software 0.1% | | | | | | | | | | | | | | | | |
| | | | |
Fidelity National Information Services, Inc., | | | | | | | | | | | | | | | | |
Sr. Unsec’d. Notes | | | 0.600 | | | | 03/01/24 | | | | 5,750 | | | | 5,594,357 | |
| | | | |
Telecommunications 0.9% | | | | | | | | | | | | | | | | |
| | | | |
Cisco Systems, Inc., | | | | | | | | | | | | | | | | |
Sr. Unsec’d. Notes | | | 2.950 | | | | 02/28/26 | | | | 19,573 | | | | 18,776,429 | |
See Notes to Financial Statements.
PGIM Fixed Income ETFs 67
PGIM Ultra Short Bond ETF
Schedule of Investments (continued)
as of August 31, 2023
| | | | | | | | | | | | | | | | |
| | | | |
| Description | | Interest
Rate | | | Maturity
Date | | | Principal
Amount
(000)# | | | Value | |
| | | | |
CORPORATE BONDS (Continued) | | | | | | | | | | | | | | | | |
| | | | |
Telecommunications (cont’d.) | | | | | | | | | | | | | | | | |
| | | | |
NTT Finance Corp. (Japan), | | | | | | | | | | | | | | | | |
Gtd. Notes, 144A | | | 0.583% | | | | 03/01/24 | | | | 6,500 | | | $ | 6,336,000 | |
Sr. Unsec’d. Notes, 144A | | | 4.142 | | | | 07/26/24 | | | | 3,000 | | | | 2,957,378 | |
| | | | |
Verizon Communications, Inc., | | | | | | | | | | | | | | | | |
Sr. Unsec’d. Notes | | | 0.750 | | | | 03/22/24 | | | | 8,000 | | | | 7,781,015 | |
Sr. Unsec’d. Notes | | | 1.450 | | | | 03/20/26 | | | | 14,557 | | | | 13,202,035 | |
| | | | | | | | | | | | | | | | |
| | | | |
| | | | | | | | | | | | | | | 49,052,857 | |
| | | | |
Transportation 0.3% | | | | | | | | | | | | | | | | |
| | | | |
Union Pacific Corp., | | | | | | | | | | | | | | | | |
Sr. Unsec’d. Notes | | | 4.750 | | | | 02/21/26 | | | | 16,000 | | | | 15,911,613 | |
| | | | |
Trucking & Leasing 0.3% | | | | | | | | | | | | | | | | |
| | | | |
Penske Truck Leasing Co. LP/PTL Finance Corp., | | | | | | | | | | | | | | | | |
Sr. Unsec’d. Notes, 144A | | | 5.750 | | | | 05/24/26 | | | | 17,500 | | | | 17,367,144 | |
| | | | | | | | | | | | | | | | |
| | | | |
TOTAL CORPORATE BONDS
(cost $1,830,684,755) | | | | | | | | | | | | | | | 1,811,342,851 | |
| | | | | | | | | | | | | | | | |
| | | | |
RESIDENTIAL MORTGAGE-BACKED SECURITIES 0.6% | | | | | | | | | | | | | | | | |
| | | | |
Towd Point Mortgage Trust, | | | | | | | | | | | | | | | | |
Series 2015-06, Class M1, 144A | | | 3.750(cc) | | | | 04/25/55 | | | | 11,116 | | | | 10,826,407 | |
Series 2018-02, Class A1, 144A | | | 3.250(cc) | | | | 03/25/58 | | | | 6,119 | | | | 5,837,854 | |
Series 2018-05, Class A1A, 144A | | | 3.250(cc) | | | | 07/25/58 | | | | 6,654 | | | | 6,381,315 | |
Series 2021-SJ01, Class A1, 144A | | | 2.250(cc) | | | | 07/25/68 | | | | 8,548 | | | | 7,922,621 | |
| | | | | | | | | | | | | | | | |
| | | | |
TOTAL RESIDENTIAL MORTGAGE-BACKED SECURITIES
(cost $31,713,783) | | | | | | | | | | | | | | | 30,968,197 | |
| | | | | | | | | | | | | | | | |
| | | | |
TOTAL LONG-TERM INVESTMENTS
(cost $3,841,799,375) | | | | | | | | | | | | | | | 3,813,385,256 | |
| | | | | | | | | | | | | | | | |
| | | | |
| | | | | | | | | Shares | | | | |
| | | | |
SHORT-TERM INVESTMENTS 26.8% | | | | | | | | | | | | | | | | |
| | | | |
AFFILIATED MUTUAL FUNDS 0.9% | | | | | | | | | | | | | | | | |
| | | | |
PGIM Core Government Money Market Fund(wi) | | | | | | | | | | | 40,386,021 | | | | 40,386,021 | |
See Notes to Financial Statements.
68
PGIM Ultra Short Bond ETF
Schedule of Investments (continued)
as of August 31, 2023
| | | | | | | | | | | | | | | | |
| | | | |
| Description | | | | | | | | Shares | | | Value | |
| | | | |
AFFILIATED MUTUAL FUNDS (Continued) | | | | | | | | | | | | | | | | |
PGIM Institutional Money Market Fund | | | | | | | | | | | | | | | | |
(cost $8,251,344; includes $8,169,199 of cash collateral for securities on loan)(b)(wi) | | | | | | | | | | | 8,257,923 | | | $ | 8,252,968 | |
| | | | | | | | | | | | | | | | |
| | | | |
TOTAL AFFILIATED MUTUAL FUNDS
(cost $48,637,365) | | | | | | | | | | | | | | | 48,638,989 | |
| | | | | | | | | | | | | | | | |
| | | | |
| | | | | | | | | Principal | | | | |
| | | Interest | | | Maturity | | | Amount | | | | |
| | | Rate | | | Date | | | (000)# | | | | |
| | | | |
CERTIFICATES OF DEPOSIT 9.2% | | | | | | | | | | | | | | | | |
Banco Santander SA, SOFR + 0.800% | | | 6.135%(c) | | | | 12/05/23 | | | | 31,500 | | | | 31,539,779 | |
Bank of America NA | | | 5.930 | | | | 04/08/24 | | | | 15,000 | | | | 15,004,105 | |
Bank of Montreal | | | 5.200 | | | | 09/05/23 | | | | 5,000 | | | | 4,999,796 | |
Bank of Montreal | | | 5.380 | | | | 12/12/23 | | | | 5,000 | | | | 4,994,447 | |
Citibank NA, SOFR + 0.700% (Cap N/A, Floor 0.000%) | | | 6.000(c) | | | | 12/13/23 | | | | 11,500 | | | | 11,513,775 | |
Credit Industriel et Commercial, | | | | | | | | | | | | | | | | |
SOFR + 0.420% | | | 5.720(c) | | | | 10/18/23 | | | | 40,000 | | | | 40,015,158 | |
SOFR + 0.440% | | | 5.740(c) | | | | 01/17/24 | | | | 30,000 | | | | 30,019,261 | |
Mizuho Bank Ltd., | | | | | | | | | | | | | | | | |
SOFR + 0.410% | | | 5.710(c) | | | | 02/12/24 | | | | 20,000 | | | | 20,003,492 | |
SOFR + 0.810% | | | 6.110(c) | | | | 11/30/23 | | | | 30,350 | | | | 30,396,801 | |
MUFG Bank Ltd., SOFR + 0.450% | | | 5.750(c) | | | | 01/05/24 | | | | 40,000 | | | | 40,019,018 | |
Natixis SA | | | 5.000 | | | | 09/27/23 | | | | 15,000 | | | | 14,993,463 | |
Nordea Bank Abp, SOFR + 0.580% | | | 5.880(c) | | | | 08/05/24 | | | | 30,000 | | | | 30,015,610 | |
State Street Bank & Trust Co., | | | | | | | | | | | | | | | | |
SOFR + 0.470% | | | 5.770(c) | | | | 05/21/24 | | | | 7,500 | | | | 7,498,992 | |
SOFR + 0.520% | | | 5.820(c) | | | | 03/05/24 | | | | 20,000 | | | | 20,014,846 | |
Sumitomo Mitsui Banking Corp., | | | | | | | | | | | | | | | | |
SOFR + 0.430% | | | 5.730(c) | | | | 02/05/24 | | | | 10,000 | | | | 10,004,255 | |
SOFR + 0.850% | | | 6.150(c) | | | | 11/30/23 | | | | 31,500 | | | | 31,551,098 | |
Sumitomo Mitsui Trust Bank Ltd., SOFR + 0.400% | | | 5.700(c) | | | | 02/20/24 | | | | 15,000 | | | | 15,001,243 | |
Svenska Handelsbanken, SOFR + 0.510% (Cap N/A, Floor 0.000%) | | | 5.810(c) | | | | 03/25/24 | | | | 40,000 | | | | 40,029,649 | |
Swedbank AB, | | | | | | | | | | | | | | | | |
SOFR + 0.640% | | | 5.940(c) | | | | 07/19/24 | | | | 16,500 | | | | 16,507,815 | |
SOFR + 0.680% | | | 5.980(c) | | | | 03/20/24 | | | | 24,000 | | | | 24,040,594 | |
Toronto-Dominion Bank (The) | | | 4.800 | | | | 09/22/23 | | | | 12,500 | | | | 12,494,355 | |
Westpac Banking Corp., SOFR + 0.550% (Cap N/A, Floor 0.000%) | | | 5.850(c) | | | | 05/10/24 | | | | 35,000 | | | | 35,028,899 | |
| | | | | | | | | | | | | | | | |
| | | | |
TOTAL CERTIFICATES OF DEPOSIT
(cost $485,348,441) | | | | | | | | | | | | | | | 485,686,451 | |
| | | | | | | | | | | | | | | | |
See Notes to Financial Statements.
PGIM Fixed Income ETFs 69
PGIM Ultra Short Bond ETF
Schedule of Investments (continued)
as of August 31, 2023
| | | | | | | | | | | | |
| Description | | Interest
Rate | | Maturity
Date | | Principal
Amount
(000)# | | | Value | |
| | | | |
COMMERCIAL PAPER 16.7% | | | | | | | | | | | | |
ABN AMRO Funding USA LLC, | | | | | | | | | | | | |
144A | | 5.844%(n) | | 01/05/24 | | | 40,000 | | | $ | 39,216,551 | |
Alimentation Couche-Tard, Inc., | | | | | | | | | | | | |
144A | | 0.000 | | 09/07/23 | | | 21,000 | | | | 20,977,378 | |
144A | | 5.705(n) | | 09/21/23 | | | 29,000 | | | | 28,905,453 | |
American Honda Finance Corp. | | 5.683(n) | | 09/18/23 | | | 20,000 | | | | 19,945,320 | |
American Honda Finance Corp. | | 5.761(n) | | 09/21/23 | | | 10,000 | | | | 9,968,039 | |
AmerisourceBergen Corp., | | | | | | | | | | | | |
144A | | 5.614(n) | | 09/06/23 | | | 45,000 | | | | 44,959,275 | |
Australia & New Zealand Banking Group Ltd., | | | | | | | | | | | | |
144A, SOFR + 0.610% | | 5.765(c) | | 09/28/23 | | | 25,000 | | | | 25,008,034 | |
Bank of America Securities, Inc., | | | | | | | | | | | | |
144A, SOFR + 0.850% | | 5.230(c) | | 10/18/23 | | | 14,500 | | | | 14,511,319 | |
Bank of Montreal, | | | | | | | | | | | | |
144A, SOFR + 0.580% | | 5.901(c) | | 05/01/24 | | | 10,000 | | | | 10,007,241 | |
Bank of Nova Scotia (The), | | | | | | | | | | | | |
144A, SOFR + 0.740% | | 5.863(c) | | 12/06/23 | | | 15,000 | | | | 15,020,772 | |
Bayer Corp., | | | | | | | | | | | | |
144A | | 6.376(n) | | 08/13/24 | | | 40,000 | | | | 37,721,373 | |
BPCE SA, | | | | | | | | | | | | |
144A, SOFR + 0.590% | | 5.890(c) | | 08/05/24 | | | 40,000 | | | | 40,007,608 | |
Canadian Imperial Bank of Commerce, | | | | | | | | | | | | |
144A, SOFR + 0.440% | | 5.740(c) | | 10/10/23 | | | 20,000 | | | | 20,007,485 | |
CDP Financial, Inc., | | | | | | | | | | | | |
144A, SOFR + 0.550% | | 5.850(c) | | 08/15/24 | | | 8,000 | | | | 7,996,208 | |
144A, SOFR + 0.800% | | 6.110(c) | | 11/01/23 | | | 5,000 | | | | 5,004,938 | |
Citigroup Global Markets Holdings, Inc., | | | | | | | | | | | | |
144A, SOFR + 0.650% | | 5.851(c) | | 09/20/23 | | | 15,000 | | | | 15,004,488 | |
ERP Operating LP, | | | | | | | | | | | | |
144A | | 5.663(n) | | 09/27/23 | | | 25,000 | | | | 24,896,163 | |
Glencore Funding LLC, | | | | | | | | | | | | |
144A | | 5.829(n) | | 09/21/23 | | | 30,000 | | | | 29,901,388 | |
144A | | 5.835(n) | | 09/22/23 | | | 25,000 | | | | 24,913,833 | |
Healthpeak Properties, Inc., | | | | | | | | | | | | |
144A | | 5.662(n) | | 09/21/23 | | | 16,350 | | | | 16,297,115 | |
144A | | 5.703(n) | | 09/13/23 | | | 35,000 | | | | 34,930,322 | |
ING (U.S.) Funding LLC, | | | | | | | | | | | | |
144A, SOFR + 0.550% | | 5.850(c) | | 05/07/24 | | | 35,000 | | | | 35,014,107 | |
Intercontinental Exchange, Inc., | | | | | | | | | | | | |
144A | | 5.635(n) | | 09/15/23 | | | 15,000 | | | | 14,965,716 | |
144A | | 5.637(n) | | 09/21/23 | | | 15,000 | | | | 14,950,395 | |
See Notes to Financial Statements.
70
PGIM Ultra Short Bond ETF
Schedule of Investments (continued)
as of August 31, 2023
| | | | | | | | | | | | |
| | | | |
| Description | | Interest
Rate | | Maturity
Date | | Principal
Amount
(000)# | | | Value | |
| | | | |
COMMERCIAL PAPER (Continued) | | | | | | | | | | | | |
Intercontinental Exchange, Inc., (cont’d.)
144A | | 5.663%(n) | | 09/26/23 | | | 15,000 | | | $ | 14,938,455 | |
JPMorgan Securities LLC,
144A | | 5.310 | | 01/25/24 | | | 10,000 | | | | 9,979,592 | |
144A | | 5.913(n) | | 03/25/24 | | | 10,000 | | | | 9,676,505 | |
144A, SOFR + 0.650% | | 5.680(c) | | 08/01/24 | | | 15,000 | | | | 15,006,817 | |
LVMH Moet Hennessy Louis Vuitton SE,
144A | | 5.797(n) | | 05/14/24 | | | 10,000 | | | | 9,607,575 | |
144A | | 5.824(n) | | 06/12/24 | | | 10,000 | | | | 9,563,850 | |
144A | | 5.893(n) | | 04/15/24 | | | 10,000 | | | | 9,652,237 | |
144A | | 5.901(n) | | 03/21/24 | | | 10,000 | | | | 9,691,102 | |
144A | | 5.939(n) | | 04/08/24 | | | 13,000 | | | | 12,561,947 | |
Nutrien Ltd.,
144A | | 5.710(n) | | 09/22/23 | | | 10,000 | | | | 9,966,071 | |
144A | | 5.732(n) | | 09/08/23 | | | 10,000 | | | | 9,987,769 | |
Ontario Teachers’ Finance Trust,
144A | | 5.936(n) | | 05/24/24 | | | 22,000 | | | | 21,097,852 | |
Sempra,
144A | | 5.624(n) | | 09/14/23 | | | 9,120 | | | | 9,100,508 | |
144A | | 5.626(n) | | 09/20/23 | | | 11,000 | | | | 10,966,261 | |
144A | | 5.629(n) | | 09/25/23 | | | 10,000 | | | | 9,961,521 | |
Skandinaviska Enskilda Banken AB,
144A, SOFR + 0.500% | | 5.727(c) | | 12/22/23 | | | 10,000 | | | | 10,008,086 | |
144A, SOFR + 0.530% | | 5.830(c) | | 04/08/24 | | | 11,000 | | | | 11,008,621 | |
144A, SOFR + 0.630% | | 5.680(c) | | 07/19/24 | | | 5,000 | | | | 5,002,106 | |
144A, SOFR + 0.650% | | 5.960(c) | | 05/31/24 | | | 20,000 | | | | 20,020,632 | |
Societe Generale SA,
144A, SOFR + 0.820% | | 6.120(c) | | 12/11/23 | | | 35,000 | | | | 35,060,624 | |
Suncor Energy, Inc.,
144A | | 5.680(n) | | 09/14/23 | | | 49,000 | | | | 48,895,442 | |
TransCanada PipeLines Ltd.,
144A | | 5.746(n) | | 09/20/23 | | | 5,250 | | | | 5,233,926 | |
144A | | 5.795(n) | | 09/22/23 | | | 15,000 | | | | 14,949,409 | |
See Notes to Financial Statements.
PGIM Fixed Income ETFs 71
PGIM Ultra Short Bond ETF
Schedule of Investments (continued)
as of August 31, 2023
| | | | | | | | | | | | |
| | | | |
| Description | | Interest
Rate | | Maturity
Date | | Principal
Amount
(000)# | | | Value | |
| | | | |
COMMERCIAL PAPER (Continued) | | | | | | | | | | | | |
Western Union Co. (The),
144A | | 5.633%(n) | | 09/01/23 | | | 12,500 | | | $ | 12,498,097 | |
| | | | | | | | | | | | |
| | | | |
TOTAL COMMERCIAL PAPER
(cost $884,401,137) | | | | | | | | | | | 884,565,526 | |
| | | | | | | | | | | | |
| | | | |
TOTAL SHORT-TERM INVESTMENTS
(cost $1,418,386,943) | | | | | | | | | | | 1,418,890,966 | |
| | | | | | | | | | | | |
| | | | |
TOTAL INVESTMENTS 99.0%
(cost $5,260,186,318) | | | | | | | | | | | 5,232,276,222 | |
Other assets in excess of liabilities(z) 1.0% | | | | | | | | | | | 51,525,639 | |
| | | | | | | | | | | | |
| | | | |
NET ASSETS 100.0% | | | | | | | | | | $ | 5,283,801,861 | |
| | | | | | | | | | | | |
See the Glossary for a list of the abbreviation(s) used in the annual report.
| # | Principal or notional amount is shown in U.S. dollars unless otherwise stated. |
| (a) | All or a portion of security is on loan. The aggregate market value of such securities, including those sold and pending settlement, is $7,974,423; cash collateral of $8,169,199 (included in liabilities) was received with which the Fund purchased highly liquid short-term investments. In the event of significant appreciation in value of securities on loan on the last business day of the reporting period, the Fund may reflect a collateral value that is less than the market value of the loaned securities and such shortfall is remedied the following business day. |
| (b) | Represents security, or portion thereof, purchased with cash collateral received for securities on loan and includes dividend reinvestment. |
| (c) | Variable rate instrument. The interest rate shown reflects the rate in effect at August 31, 2023. |
| (cc) | Variable rate instrument. The rate shown is based on the latest available information as of August 31, 2023. Certain variable rate securities are not based on a published reference rate and spread but are determined by the issuer or agent and are based on current market conditions. These securities do not indicate a reference rate and spread in their description. |
| (ff) | Variable rate security. Security may be issued at a fixed coupon rate, which converts to a variable rate at a specified date. Rate shown is the rate in effect as of period end. |
| (n) | Rate shown reflects yield to maturity at purchased date. |
| (wi) | PGIM Investments LLC, the manager of the Fund, also serves as manager of the PGIM Core Government Money Market Fund and PGIM Institutional Money Market Fund, if applicable. |
| (z) | Includes net unrealized appreciation/(depreciation) and/or market value of the below holdings which are excluded from the Schedule of Investments: |
See Notes to Financial Statements.
72
PGIM Ultra Short Bond ETF
Schedule of Investments (continued)
as of August 31, 2023
Futures contracts outstanding at August 31, 2023:
| | | | | | | | | | | | | | | | | | | | | | |
Number
of
Contracts | | | | Type | | | | Expiration
Date | | | | | Current
Notional
Amount | | | | | Value /
Unrealized
Appreciation
(Depreciation) | |
Long Position: | | | | | | | | | | | | | | | | | | |
225 | | | | 1 Month SOFR | | | | | Aug. 2023 | | | | | $ | 88,786,009 | | | | | $ | (115,265 | ) |
| | | | | | | | | | | | | | | | | | | | | | |
| Short Positions: | | | | | | | | | | | |
46 | | | | 3 Month SOFR | | | | | Sep. 2023 | | | | | | 10,897,688 | | | | | | 30,228 | |
46 | | | | 3 Month SOFR | | | | | Dec. 2023 | | | | | | 10,877,563 | | | | | | 65,978 | |
34 | | | | 3 Month SOFR | | | | | Mar. 2024 | | | | | | 8,041,000 | | | | | | 72,363 | |
24 | | | | 3 Month SOFR | | | | | Jun. 2024 | | | | | | 5,688,000 | | | | | | 56,006 | |
24 | | | | 3 Month SOFR | | | | | Sep. 2024 | | | | | | 5,706,900 | | | | | | 52,218 | |
24 | | | | 3 Month SOFR | | | | | Dec. 2024 | | | | | | 5,729,100 | | | | | | 40,544 | |
16 | | | | 3 Month SOFR | | | | | Mar. 2025 | | | | | | 3,833,200 | | | | | | 20,971 | |
16 | | | | 3 Month SOFR | | | | | Jun. 2025 | | | | | | 3,844,000 | | | | | | 14,421 | |
16 | | | | 3 Month SOFR | | | | | Sep. 2025 | | | | | | 3,851,000 | | | | | | 10,383 | |
16 | | | | 3 Month SOFR | | | | | Dec. 2025 | | | | | | 3,854,600 | | | | | | 8,546 | |
| | | | | | | | | | | | | | | | | | | | | | |
| | | | | | | | | | | | | | | | | | | | | 371,658 | |
| | | | | | | | | | | | | | | | | | | | | | |
| | | | | | | | | | | | | | | | | | | | $ | 256,393 | |
| | | | | | | | | | | | | | | | | | | | | | |
Interest rate swap agreements outstanding at August 31, 2023:
| | | | | | | | | | | | | | | | | | | | | | | | | | | | | | | | |
Notional
Amount
(000)# | | | | Termination
Date | | | | | Fixed
Rate | | | | Floating Rate | | | | Value at
Trade Date | | | | | Value at
August 31,
2023 | | | | | Unrealized
Appreciation
(Depreciation) | |
Centrally Cleared Interest Rate Swap Agreements: | | | | | | | | | | | | | | | | |
11,000 | | | | | 09/06/23 | | | | | 2.114%(S) | | | | 1 Day SOFR(1)(A)/5.310% | | | | $ | 2 | | | | | $ | 257,805 | | | | | $ | 257,803 | |
4,000 | | | | | 09/11/23 | | | | | 1.423%(S) | | | | 1 Day SOFR(1)(A)/5.310% | | | | | 3 | | | | | | 123,168 | | | | | | 123,165 | |
42,500 | | | | | 09/23/23 | | | | | 4.220%(A) | | | | 1 Day SOFR(1)(A)/5.310% | | | | | 1,435 | | | | | | 165,629 | | | | | | 164,194 | |
8,000 | | | | | 10/01/23 | | | | | 0.251%(S) | | | | 1 Day SOFR(1)(A)/5.310% | | | | | 7 | | | | | | 353,412 | | | | | | 353,405 | |
30,000 | | | | | 11/09/23 | | | | | 4.210%(A) | | | | 1 Day SOFR(1)(A)/5.310% | | | | | 5,196 | | | | | | 209,990 | | | | | | 204,794 | |
10,000 | | | | | 12/01/23 | | | | | 2.634%(S) | | | | 1 Day SOFR(1)(A)/5.310% | | | | | 27 | | | | | | 237,039 | | | | | | 237,012 | |
5,000 | | | | | 12/07/23 | | | | | 0.221%(S) | | | | 1 Day USOIS(1)(A)/5.330% | | | | | 17 | | | | | | 240,718 | | | | | | 240,701 | |
7,000 | | | | | 01/03/24 | | | | | 4.276%(A) | | | | 1 Day SOFR(1)(A)/5.310% | | | | | 835 | | | | | | 34,868 | | | | | | 34,033 | |
8,750 | | | | | 02/04/24 | | | | | 0.133%(S) | | | | 1 Day USOIS(1)(A)/5.330% | | | | | 1,466 | | | | | | 445,155 | | | | | | 443,689 | |
See Notes to Financial Statements.
PGIM Fixed Income ETFs 73
PGIM Ultra Short Bond ETF
Schedule of Investments (continued)
as of August 31, 2023
Interest rate swap agreements outstanding at August 31, 2023 (continued):
| | | | | | | | | | | | | | | | | | | | | | | | | | | | | | | | |
Notional
Amount
(000)# | | | | Termination
Date | | | | | Fixed
Rate | | | | Floating Rate | | | | Value at
Trade Date | | | | | Value at
August 31,
2023 | | | | | Unrealized
Appreciation
(Depreciation) | |
Centrally Cleared Interest Rate Swap Agreements (cont’d.): | | | | | | | | | | | | | | | | |
19,500 | | | | | 03/01/24 | | | | | 0.230%(S) | | | | 1 Day USOIS(1)(A)/5.330% | | | | $ | 4,035 | | | | | $ | 982,291 | | | | | $ | 978,256 | |
28,500 | | | | | 03/01/24 | | | | | 2.478%(S) | | | | 1 Day SOFR(1)(A)/5.310% | | | | | 61 | | | | | | 799,222 | | | | | | 799,161 | |
46,000 | | | | | 03/09/24 | | | | | 1.440%(S) | | | | 1 Day SOFR(1)(A)/5.310% | | | | | 8,418 | | | | | | 1,776,339 | | | | | | 1,767,921 | |
8,000 | | | | | 03/15/24 | | | | | 0.276%(S) | | | | 1 Day USOIS(1)(A)/5.330% | | | | | 30 | | | | | | 400,410 | | | | | | 400,380 | |
23,000 | | | | | 03/15/24 | | | | | 1.658%(S) | | | | 1 Day SOFR(1)(A)/5.310% | | | | | 54 | | | | | | 836,557 | | | | | | 836,503 | |
7,000 | | | | | 03/18/24 | | | | | 0.278%(S) | | | | 1 Day USOIS(1)(A)/5.330% | | | | | 30 | | | | | | 350,577 | | | | | | 350,547 | |
12,500 | | | | | 03/25/24 | | | | | 2.055%(S) | | | | 1 Day SOFR(1)(A)/5.310% | | | | | 50 | | | | | | 408,011 | | | | | | 407,961 | |
68,000 | | | | | 03/31/24 | | | | | 2.305%(S) | | | | 1 Day SOFR(1)(A)/5.310% | | | | | 77,787 | | | | | | 2,046,389 | | | | | | 1,968,602 | |
3,000 | | | | | 04/26/24 | | | | | 0.305%(S) | | | | 1 Day USOIS(1)(A)/5.330% | | | | | 34 | | | | | | 150,474 | | | | | | 150,440 | |
13,000 | | | | | 04/26/24 | | | | | 4.637%(A) | | | | 1 Day SOFR(1)(A)/5.310% | | | | | 291 | | | | | | 96,291 | | | | | | 96,000 | |
11,250 | | | | | 05/11/24 | | | | | 0.300%(S) | | | | 1 Day SOFR(1)(A)/5.310% | | | | | (404 | ) | | | | | 566,839 | | | | | | 567,243 | |
15,000 | | | | | 05/11/24 | | | | | 2.603%(S) | | | | 1 Day SOFR(1)(A)/5.310% | | | | | (4,876) | | | | | | 416,618 | | | | | | 421,494 | |
16,750 | | | | | 05/20/24 | | | | | 0.296%(S) | | | | 1 Day USOIS(1)(A)/5.330% | | | | | 45 | | | | | | 842,622 | | | | | | 842,577 | |
10,900 | | | | | 06/07/24 | | | | | 0.318%(S) | | | | 1 Day USOIS(1)(A)/5.330% | | | | | 45 | | | | | | 544,964 | | | | | | 544,919 | |
12,750 | | | | | 06/16/24 | | | | | 0.304%(S) | | | | 1 Day USOIS(1)(A)/5.330% | | | | | 47 | | | | | | 639,926 | | | | | | 639,879 | |
15,000 | | | | | 08/05/24 | | | | | 0.261%(S) | | | | 1 Day SOFR(1)(A)/5.310% | | | | | 57 | | | | | | 747,428 | | | | | | 747,371 | |
29,000 | | | | | 08/08/24 | | | | | 2.512%(S) | | | | 1 Day SOFR(1)(A)/5.310% | | | | | 80,443 | | | | | | 810,961 | | | | | | 730,518 | |
3,000 | | | | | 08/13/24 | | | | | 0.368%(S) | | | | 1 Day SOFR(1)(A)/5.310% | | | | | 50 | | | | | | 145,908 | | | | | | 145,858 | |
5,000 | | | | | 08/17/24 | | | | | 4.498%(A) | | | | 1 Day SOFR(1)(A)/5.310% | | | | | — | | | | | | 42,836 | | | | | | 42,836 | |
8,000 | | | | | 08/31/24 | | | | | 0.399%(S) | | | | 1 Day USOIS(1)(A)/5.330% | | | | | 53 | | | | | | 383,117 | | | | | | 383,064 | |
See Notes to Financial Statements.
74
PGIM Ultra Short Bond ETF
Schedule of Investments (continued)
as of August 31, 2023
Interest rate swap agreements outstanding at August 31, 2023 (continued):
| | | | | | | | | | | | | | | | | | | | | | | | | | | | | | | | |
Notional
Amount
(000)# | | | | Termination
Date | | | | | Fixed
Rate | | | | Floating Rate | | | | Value at
Trade Date | | | | | Value at
August 31,
2023 | | | | | Unrealized
Appreciation
(Depreciation) | |
Centrally Cleared Interest Rate Swap Agreements (cont’d.): | | | | | | | | | | | | | | | | |
12,500 | | | | | 09/01/24 | | | | | 2.500%(S) | | | | 1 Day SOFR(1)(A)/5.310% | | | | $ | 1,921 | | | | | $ | 584,230 | | | | | $ | 582,309 | |
6,750 | | | | | 09/08/24 | | | | | 3.602%(A) | | | | 1 Day SOFR(1)(A)/5.310% | | | | | — | | | | | | 172,336 | | | | | | 172,336 | |
4,500 | | | | | 09/09/24 | | | | | 0.368%(S) | | | | 1 Day SOFR(1)(A)/5.310% | | | | | (5 | ) | | | | | 400,936 | | | | | | 400,941 | |
46,500 | | | | | 09/09/24 | | | | | 1.484%(S) | | | | 1 Day SOFR(1)(A)/5.310% | | | | | 30,671 | | | | | | 3,123,421 | | | | | | 3,092,750 | |
9,750 | | | | | 10/12/24 | | | | | 0.511%(S) | | | | 1 Day SOFR(1)(A)/5.310% | | | | | 64 | | | | | | 856,117 | | | | | | 856,053 | |
18,250 | | | | | 10/24/24 | | | | | 4.688%(A) | | | | 1 Day SOFR(1)(A)/5.310% | | | | | 86,382 | | | | | | 111,136 | | | | | | 24,754 | |
12,000 | | | | | 03/21/25 | | | | | 1.998%(S) | | | | 1 Day SOFR(1)(A)/5.310% | | | | | 91 | | | | | | 708,453 | | | | | | 708,362 | |
83,500 | | | | | 03/30/25 | | | | | 2.418%(S) | | | | 1 Day SOFR(1)(A)/5.310% | | | | | 210,552 | | | | | | 4,240,216 | | | | | | 4,029,664 | |
16,000 | | | | | 05/11/25 | | | | | 0.450%(S) | | | | 1 Day SOFR(1)(A)/5.310% | | | | | 8,716 | | | | | | 1,393,668 | | | | | | 1,384,952 | |
8,000 | | | | | 05/25/25 | | | | | 4.241%(A) | | | | 1 Day SOFR(1)(A)/5.310% | | | | | — | | | | | | 111,457 | | | | | | 111,457 | |
28,750 | | | | | 06/29/25 | | | | | 3.083%(S) | | | | 1 Day SOFR(1)(A)/5.310% | | | | | 152,620 | | | | | | 1,002,623 | | | | | | 850,003 | |
57,000 | | | | | 06/29/25 | | | | | 3.086%(S) | | | | 1 Day SOFR(1)(A)/5.310% | | | | | (329,604 | ) | | | | | 1,985,097 | | | | | | 2,314,701 | |
53,250 | | | | | 08/17/25 | | | | | 2.957%(S) | | | | 1 Day SOFR(1)(A)/5.310% | | | | | 76,406 | | | | | | 1,869,009 | | | | | | 1,792,603 | |
95,500 | | | | | 09/08/25 | | | | | 3.422%(A) | | | | 1 Day SOFR(1)(A)/5.310% | | | | | 356,590 | | | | | | 3,405,660 | | | | | | 3,049,070 | |
188,500 | | | | | 10/07/25 | | | | | 3.955%(A) | | | | 1 Day SOFR(1)(A)/5.310% | | | | | (107,893 | ) | | | | | 3,887,406 | | | | | | 3,995,299 | |
22,750 | | | | | 10/21/25 | | | | | 4.378%(A) | | | | 1 Day SOFR(1)(A)/5.310% | | | | | (11,881) | | | | | | 197,876 | | | | | | 209,757 | |
7,500 | | | | | 11/09/25 | | | | | 4.492%(A) | | | | 1 Day SOFR(1)(A)/5.310% | | | | | — | | | | | | 42,390 | | | | | | 42,390 | |
216,000 | | | | | 12/01/25 | | | | | 4.041%(A) | | | | 1 Day SOFR(1)(A)/5.310% | | | | | (12,750 | ) | | | | | 4,016,558 | | | | | | 4,029,308 | |
46,750 | | | | | 01/11/26 | | | | | 3.783%(A) | | | | 1 Day SOFR(1)(A)/5.310% | | | | | 4,822 | | | | | | 1,204,389 | | | | | | 1,199,567 | |
45,000 | | | | | 02/01/26 | | | | | 3.850%(A) | | | | 1 Day SOFR(1)(A)/5.310% | | | | | 65,209 | | | | | | 1,057,210 | | | | | | 992,001 | |
See Notes to Financial Statements.
PGIM Fixed Income ETFs 75
PGIM Ultra Short Bond ETF
Schedule of Investments (continued)
as of August 31, 2023
Interest rate swap agreements outstanding at August 31, 2023 (continued):
| | | | | | | | | | | | | | | | | | | | | | | | | | | | | | | | | | |
Notional
Amount
(000)# | | | | Termination
Date | | | | | Fixed
Rate | | | | | Floating Rate | | | | Value at
Trade Date | | | | | Value at
August 31,
2023 | | | | | Unrealized
Appreciation
(Depreciation) | |
Centrally Cleared Interest Rate Swap Agreements (cont’d.): | | | | | | | | | | |
| 38,000 | | | | | 02/27/26 | | | | | | 4.345%(A) | | | | | 1 Day USOIS(1)(A)/5.330% | | | | $ | — | | | | | $ | 308,188 | | | | | $ | 308,188 | |
| 105,100 | | | | | 02/28/26 | | | | | | 4.453%(A) | | | | | 1 Day SOFR(1)(A)/5.310% | | | | | 207,783 | | | | | | 560,466 | | | | | | 352,683 | |
| 75,000 | | | | | 05/17/26 | | | | | | 3.535%(A) | | | | | 1 Day SOFR(1)(A)/5.310% | | | | | — | | | | | | 2,150,919 | | | | | | 2,150,919 | |
| 35,000 | | | | | 08/18/26 | | | | | | 4.442%(A) | | | | | 1 Day SOFR(1)(A)/5.310% | | | | | — | | | | | | (43,505 | ) | | | | | (43,505 | ) |
| | | | | | | | | | | | | | | | | | | | | | | | | | | | | | | | | | |
| | | | | | | | | | | | | | | | | | | | $ | 914,932 | | | | | $ | 48,401,820 | | | | | $ | 47,486,888 | |
| | | | | | | | | | | | | | | | | | | | | | | | | | | | | | | | | | |
| (1) | The Fund pays the fixed rate and receives the floating rate. |
| (2) | The Fund pays the floating rate and receives the fixed rate. |
Summary of Collateral for Centrally Cleared/Exchange-traded Derivatives:
Cash and securities segregated as collateral, including pending settlement for closed positions, to cover requirements for centrally cleared/exchange-traded derivatives are listed by broker as follows:
| | | | | | | | | | |
Broker | | Cash and/or Foreign Currency | | Securities Market Value |
| | |
CGM | | | $ | 26,840,000 | | | | $ | — | |
| | | | | | | | | | |
Fair Value Measurements:
Various inputs are used in determining the value of the Fund’s investments. These inputs are summarized in the three broad levels listed below.
Level 1—unadjusted quoted prices generally in active markets for identical securities.
Level 2—quoted prices for similar securities, interest rates and yield curves, prepayment speeds, foreign currency exchange rates and other observable inputs.
Level 3—unobservable inputs for securities valued in accordance with Board approved fair valuation procedures.
The following is a summary of the inputs used as of August 31, 2023 in valuing such portfolio securities:
| | | | | | | | | | | | |
| | | Level 1 | | | Level 2 | | | Level 3 | |
Investments in Securities | | | | | | | | | | | | |
Assets | | | | | | | | | | | | |
Long-Term Investments | | | | | | | | | | | | |
Asset-Backed Securities
Automobiles | | $ | — | | | $ | 146,344,755 | | | $ | — | |
See Notes to Financial Statements.
76
PGIM Ultra Short Bond ETF
Schedule of Investments (continued)
as of August 31, 2023
| | | | | | | | | | | | |
| | | Level 1 | | | Level 2 | | | Level 3 | |
Investments in Securities (continued) | | | | | | | | | | | | |
Assets (continued) | | | | | | | | | | | | |
Long-Term Investments (continued) | | | | | | | | | | | | |
Asset-Backed Securities (continued) | | | | | | | | | | | | |
Collateralized Loan Obligations | | $ | — | | | $ | 860,192,740 | | | | $— | |
Consumer Loans | | | — | | | | 37,203,649 | | | | — | |
Equipment | | | — | | | | 18,369,129 | | | | — | |
Certificates of Deposit | | | — | | | | 110,087,142 | | | | — | |
Commercial Mortgage-Backed Securities | | | — | | | | 798,876,793 | | | | — | |
Corporate Bonds | | | — | | | | 1,811,342,851 | | | | — | |
Residential Mortgage-Backed Securities | | | — | | | | 30,968,197 | | | | — | |
Short-Term Investments | | | | | | | | | | | | |
Affiliated Mutual Funds | | | 48,638,989 | | | | — | | | | — | |
Certificates of Deposit | | | — | | | | 485,686,451 | | | | — | |
Commercial Paper | | | — | | | | 884,565,526 | | | | — | |
| | | | | | | | | | | | |
Total | | $ | 48,638,989 | | | $ | 5,183,637,233 | | | | $— | |
| | | | | | | | | | | | |
| | | |
Other Financial Instruments* | | | | | | | | | | | | |
Assets | | | | | | | | | | | | |
Futures Contracts | | $ | 371,658 | | | $ | — | | | | $— | |
Centrally Cleared Interest Rate Swap Agreements | | | — | | | | 47,530,393 | | | | — | |
| | | | | | | | | | | | |
Total | | $ | 371,658 | | | $ | 47,530,393 | | | | $— | |
| | | | | | | | | | | | |
| | | |
Liabilities | | | | | | | | | | | | |
Futures Contracts | | $ | (115,265 | ) | | $ | — | | | | $— | |
Centrally Cleared Interest Rate Swap Agreement | | | — | | | | (43,505 | ) | | | — | |
| | | | | | | | | | | | |
Total | | $ | (115,265 | ) | | $ | (43,505 | ) | | | $— | |
| | | | | | | | | | | | |
| * | Other financial instruments are derivative instruments not reflected in the Schedule of Investments, such as futures, forwards and centrally cleared swap contracts, which are recorded at the unrealized appreciation (depreciation) on the instrument, and OTC swap contracts which are recorded at fair value. |
Industry Classification:
The industry classification of investments and other assets in excess of liabilities shown as a percentage of net assets as of August 31, 2023 were as follows:
| | | | |
Commercial Paper | | | 16.7 | % |
Collateralized Loan Obligations | | | 16.3 | |
Commercial Mortgage-Backed Securities | | | 15.1 | |
Certificates of Deposit | | | 11.3 | |
Banks | | | 7.5 | |
| | | | |
Auto Manufacturers | | | 4.3 | % |
Electric | | | 3.0 | |
Automobiles | | | 2.8 | |
Insurance | | | 2.4 | |
Pipelines | | | 1.6 | |
See Notes to Financial Statements.
PGIM Fixed Income ETFs 77
PGIM Ultra Short Bond ETF
Schedule of Investments (continued)
as of August 31, 2023
Industry Classification (continued):
| | | | |
Computers | | | 1.2 | % |
Chemicals | | | 1.1 | |
Foods | | | 1.0 | |
Retail | | | 1.0 | |
Telecommunications | | | 0.9 | |
Affiliated Mutual Funds (0.2% represents investments purchased with collateral from securities on loan) | | | 0.9 | |
Real Estate Investment Trusts (REITs) | | | 0.9 | |
Beverages | | | 0.8 | |
Machinery-Diversified | | | 0.8 | |
Semiconductors | | | 0.8 | |
Consumer Loans | | | 0.7 | |
Media | | | 0.7 | |
Internet | | | 0.6 | |
Healthcare-Products | | | 0.6 | |
Residential Mortgage-Backed Securities | | | 0.6 | |
Mining | | | 0.6 | |
Electronics | | | 0.5 | |
Machinery-Construction & Mining | | | 0.4 | |
Agriculture | | | 0.4 | |
| | | | |
Cosmetics/Personal Care | | | 0.4 | % |
Equipment | | | 0.3 | |
Oil & Gas | | | 0.3 | |
Trucking & Leasing | | | 0.3 | |
Transportation | | | 0.3 | |
Biotechnology | | | 0.3 | |
Healthcare-Services | | | 0.2 | |
Diversified Financial Services | | | 0.2 | |
Pharmaceuticals | | | 0.2 | |
Household Products/Wares | | | 0.2 | |
Commercial Services | | | 0.2 | |
Aerospace & Defense | | | 0.2 | |
Iron/Steel | | | 0.2 | |
Software | | | 0.1 | |
Miscellaneous Manufacturing | | | 0.1 | |
| | | | |
| | | 99.0 | |
Other assets in excess of liabilities | | | 1.0 | |
| | | | |
| |
| | | 100.0 | % |
| | | | |
Effects of Derivative Instruments on the Financial Statements and Primary Underlying Risk Exposure:
The Fund invested in derivative instruments during the reporting period. The primary type of risk associated with these derivative instruments is interest rate risk. See the Notes to Financial Statements for additional detail regarding these derivative instruments and their risks. The effect of such derivative instruments on the Fund’s financial position and financial performance as reflected in the Statement of Assets and Liabilities and Statement of Operations is presented in the summary below.
Fair values of derivative instruments as of August 31, 2023 as presented in the Statement of Assets and Liabilities:
| | | | | | | | | | | | |
| | | Asset Derivatives | | | Liability Derivatives | |
| | | | |
Derivatives not accounted for
as hedging instruments,
carried at fair value | | Statement of
Assets and
Liabilities Location | | Fair
Value | | | Statement of
Assets and
Liabilities Location | | Fair
Value | |
Interest rate contracts | | Due from/to broker-variation margin futures | | $ | 371,658* | | | Due from/to broker-variation margin futures | | $ | 115,265* | |
See Notes to Financial Statements.
78
PGIM Ultra Short Bond ETF
Schedule of Investments (continued)
as of August 31, 2023
| | | | | | | | | | | | |
| | | Asset Derivatives | | | Liability Derivatives | |
| | | | |
Derivatives not accounted for
as hedging instruments,
carried at fair value | | Statement of Assets and Liabilities Location | | Fair
Value | | | Statement of Assets and Liabilities Location | | Fair
Value | |
Interest rate contracts | | Due from/to broker-variation margin swaps | | $ | 47,530,393 | * | | Due from/to broker-variation margin swaps | | $ | 43,505 | * |
| | | | | | | | | | | | |
| | | | $ | 47,902,051 | | | | | $ | 158,770 | |
| | | | | | | | | | | | |
| * | Includes cumulative appreciation (depreciation) as reported in the schedule of open futures and centrally cleared swap contracts. Only unsettled variation margin receivable (payable) is reported within the Statement of Assets and Liabilities. |
The effects of derivative instruments on the Statement of Operations for the year ended August 31, 2023 are as follows:
| | | | | | | | |
Amount of Realized Gain (Loss) on Derivatives Recognized in Income | |
Derivatives not accounted for as hedging instruments, carried at fair value | | Futures | | | Swaps | |
Interest rate contracts | | $ | 174,395 | | | $ | 11,178,915 | |
| | | | | | | | |
| | | | | | | | |
Change in Unrealized Appreciation (Depreciation) on Derivatives Recognized in Income | |
Derivatives not accounted for as hedging instruments, carried at fair value | | Futures | | | Swaps | |
Interest rate contracts | | $ | 245,300 | | | $ | 24,722,191 | |
| | | | | | | | |
For the year ended August 31, 2023, the Fund’s average volume of derivative activities is as follows:
| | | | |
| Derivative Contract Type | | Average Volume of Derivative Activities* |
Futures Contracts - Long Positions (1) | | $ 71,086,468 |
Futures Contracts - Short Positions (1) | | 63,644,289 |
Interest Rate Swap Agreements (1) | | 1,461,816,000 |
| * | Average volume is based on average quarter end balances as noted for the year ended August 31, 2023. |
| (1) | Notional Amount in USD. |
Financial Instruments/Transactions—Summary of Offsetting and Netting Arrangements:
The Fund entered into financial instruments/transactions during the reporting period that are either offset in accordance with current requirements or are subject to enforceable master netting arrangements or similar agreements that permit offsetting. The information about offsetting and related netting arrangements for financial instruments/transactions where the legal right to set-off exists is presented in the summary below.
See Notes to Financial Statements.
PGIM Fixed Income ETFs 79
PGIM Ultra Short Bond ETF
Schedule of Investments (continued)
as of August 31, 2023
Offsetting of financial instrument/transaction assets and liabilities:
| | | | | | |
| | | | |
| Description | | Gross Market
Value of
Recognized
Assets/(Liabilities) | | Collateral
Pledged/(Received)(1) | | Net
Amount |
Securities on Loan | | $7,974,423 | | $(7,974,423) | | $— |
| (1) | Collateral amount disclosed by the Fund is limited to the market value of financial instruments/transactions. |
See Notes to Financial Statements.
80
PGIM Ultra Short Bond ETF
Statement of Assets & Liabilities
as of August 31, 2023
| | | | |
Assets | | | | |
| |
Investments at value, including securities on loan of $7,974,423: | | | | |
Unaffiliated investments (cost $5,211,548,953) | | $ | 5,183,637,233 | |
Affiliated investments (cost $48,637,365) | | | 48,638,989 | |
Dividends and interest receivable | | | 33,187,093 | |
Deposit with broker for centrally cleared/exchange-traded derivatives | | | 26,840,000 | |
Receivable for Fund shares sold | | | 13,607,284 | |
Other assets | | | 14,033 | |
| | | | |
| |
Total Assets | | | 5,305,924,632 | |
| | | | |
| |
Liabilities | | | | |
| |
Payable for investments purchased | | | 12,174,402 | |
Payable to broker for collateral for securities on loan | | | 8,169,199 | |
Due to broker—variation margin swaps | | | 1,051,005 | |
Management fee payable | | | 641,133 | |
Other liabilities | | | 74,457 | |
Due to broker—variation margin futures | | | 12,575 | |
| | | | |
| |
Total Liabilities | | | 22,122,771 | |
| | | | |
| |
Net Assets | | $ | 5,283,801,861 | |
| | | | |
| | | | |
| | |
Net assets were comprised of: | | | | |
Common Stock, at par | | $ | 106,775 | |
Paid-in capital in excess of par | | | 5,287,972,068 | |
Total distributable earnings (loss) | | | (4,276,982 | ) |
| | | | |
| |
Net assets, August 31, 2023 | | $ | 5,283,801,861 | |
| | | | |
| |
Net asset value, offering price and redemption price per share, ($5,283,801,861 ÷ 106,775,000 shares of common stock issued and outstanding) | | $ | 49.49 | |
| | | | |
See Notes to Financial Statements.
PGIM Fixed Income ETFs 81
PGIM Ultra Short Bond ETF
Statement of Operations
Year Ended August 31, 2023
| | | | |
Net Investment Income (Loss) | | | | |
| |
Income | | | | |
Interest income | | $ | 166,870,719 | |
Affiliated dividend income | | | 3,461,776 | |
Unaffiliated dividend income | | | 2,966,473 | |
Income from securities lending, net (including affiliated income of $69,491) | | | 70,830 | |
| | | | |
| |
Total income | | | 173,369,798 | |
| | | | |
| |
Expenses | | | | |
Management fee | | | 5,927,270 | |
| | | | |
| |
Net investment income (loss) | | | 167,442,528 | |
| | | | |
| |
Realized And Unrealized Gain (Loss) On Investment And Foreign Currency Transactions | | | | |
| |
Net realized gain (loss) on: | | | | |
Investment transactions (including affiliated of $14,033) | | | (2,614,117 | ) |
Futures transactions | | | 174,395 | |
Swap agreement transactions | | | 11,178,915 | |
| | | | |
| |
| | | 8,739,193 | |
| | | | |
Net change in unrealized appreciation (depreciation) on: | | | | |
Investments (including affiliated of $1,624) | | | 11,309,741 | |
Futures | | | 245,300 | |
Swap agreements | | | 24,722,191 | |
Foreign currencies | | | (12 | ) |
| | | | |
| |
| | | 36,277,220 | |
| | | | |
| |
Net gain (loss) on investment and foreign currency transactions | | | 45,016,413 | |
| | | | |
| |
Net Increase (Decrease) In Net Assets Resulting From Operations | | $ | 212,458,941 | |
| | | | |
See Notes to Financial Statements.
82
PGIM Ultra Short Bond ETF
Statements of Changes in Net Assets
| | | | | | | | | | | | |
| | |
| | | Year Ended
August 31, | | | | |
| | | |
| | | 2023 | | | 2022 | | | | |
Increase (Decrease) in Net Assets | | | | | | | | | | | | |
| | | |
Operations | | | | | | | | | | | | |
Net investment income (loss) | | $ | 167,442,528 | | | $ | 28,447,959 | | | | | |
Net realized gain (loss) on investment and foreign currency transactions | | | 8,739,193 | | | | (4,472,309 | ) | | | | |
Net change in unrealized appreciation (depreciation) on investments and foreign currencies | | | 36,277,220 | | | | (17,841,462 | ) | | | | |
| | | | | | | | | | | | |
| | | |
Net increase (decrease) in net assets resulting from operations | | | 212,458,941 | | | | 6,134,188 | | | | | |
| | | | | | | | | | | | |
| | | |
Dividends and Distributions | | | | | | | | | | | | |
Distributions from distributable earnings | | | (180,412,893 | ) | | | (29,966,721 | ) | | | | |
| | | | | | | | | | | | |
| | | |
Fund share transactions | | | | | | | | | | | | |
Net proceeds from shares sold (83,825,000 and 29,900,000 shares, respectively) | | | 4,124,297,024 | | | | 1,471,938,881 | | | | | |
Cost of shares purchased (26,725,000 and 17,975,000 shares, respectively) | | | (1,314,866,665 | ) | | | (882,319,618 | ) | | | | |
| | | | | | | | | | | | |
Net increase (decrease) in net assets from Fund share transactions | | | 2,809,430,359 | | | | 589,619,263 | | | | | |
| | | | | | | | | | | | |
| | | |
Total increase (decrease) | | | 2,841,476,407 | | | | 565,786,730 | | | | | |
| | | |
Net Assets: | | | | | | | | | | | | |
| | | | |
Beginning of year | | | 2,442,325,454 | | | | 1,876,538,724 | | | | | |
| | | | | | | | | | | | |
| | | |
End of year | | $ | 5,283,801,861 | | | $ | 2,442,325,454 | | | | | |
| | | | | | | | | | | | |
See Notes to Financial Statements.
PGIM Fixed Income ETFs 83
PGIM Ultra Short Bond ETF
Financial Highlights
| | | | | | | | | | | | | | | | | | | | |
| | | | | |
| | | Year Ended August 31, | |
| | | 2023 | | | 2022 | | | 2021 | | | 2020 | | | 2019 | |
| | | | | | |
| Per Share Operating Performance(a): | | | | | | | | | | | | | | | | | | | | |
| Net Asset Value, Beginning of Year | | | $49.17 | | | | $49.71 | | | | $49.93 | | | | $50.15 | | | | $50.12 | |
| Income (loss) from investment operations: | | | | | | | | | | | | | | | | | | | | |
| Net investment income (loss) | | | 2.09 | | | | 0.62 | | | | 0.64 | | | | 1.06 | | | | 1.40 | |
| Net realized and unrealized gain (loss) on investment and foreign currency transactions | | | 0.46 | | | | (0.52 | ) | | | (0.15 | ) | | | (0.08 | ) | | | (0.02 | ) |
| Total from investment operations | | | 2.55 | | | | 0.10 | | | | 0.49 | | | | 0.98 | | | | 1.38 | |
| Less Dividends and Distributions: | | | | | | | | | | | | | | | | | | | | |
| Dividends from net investment income | | | (2.23 | ) | | | (0.64 | ) | | | (0.71 | ) | | | (1.20 | ) | | | (1.35 | ) |
| Net asset value, end of year | | | $49.49 | | | | $49.17 | | | | $49.71 | | | | $49.93 | | | | $50.15 | |
| Total Return(b): | | | 5.31 | % | | | 0.21 | % | | | 0.98 | % | | | 1.99 | % | | | 2.80 | % |
| | | | | | |
| | | | | | | | | | | | | | | | | | | | | |
| Ratios/Supplemental Data: | | | | | | | | | | | | | | | | | | | | |
| Net assets, end of year (000) | | | $5,283,802 | | | | $2,442,325 | | | | $1,876,539 | | | | $1,039,888 | | | | $562,990 | |
| Average net assets (000) | | | $3,951,487 | | | | $2,267,793 | | | | $1,320,282 | | | | $883,274 | | | | $246,678 | |
| Ratios to average net assets(c): | | | | | | | | | | | | | | | | | | | | |
| Expenses after waivers and/or expense reimbursement | | | 0.15 | % | | | 0.15 | % | | | 0.15 | % | | | 0.15 | % | | | 0.15 | % |
| Expenses before waivers and/or expense reimbursement | | | 0.15 | % | | | 0.15 | % | | | 0.15 | % | | | 0.15 | % | | | 0.15 | % |
| Net investment income (loss) | | | 4.24 | % | | | 1.25 | % | | | 1.27 | % | | | 2.12 | % | | | 2.77 | % |
| Portfolio turnover rate(d) | | | 25 | % | | | 9 | % | | | 10 | % | | | 47 | % | | | 7 | % |
| (a) | Calculated based on average shares outstanding during the year. |
| (b) | Total return is calculated assuming a purchase of a share on the first day and a sale on the last day of each year reported and includes reinvestment of dividends and distributions, if any. Total returns may reflect adjustments to conform to GAAP. |
| (c) | Does not include expenses of the underlying funds in which the Fund invests. |
| (d) | The Fund’s portfolio turnover rate is calculated in accordance with regulatory requirements, without regard to transactions involving short-term investments, certain derivatives and in-kind transactions (if any). If such transactions were included, the Fund’s portfolio turnover rate may be higher. |
See Notes to Financial Statements.
84
PGIM Active High Yield Bond ETF
Schedule of Investments
as of August 31, 2023
| | | | | | | | | | | | |
| | | | |
| Description | | Interest
Rate | | Maturity
Date | | Principal
Amount (000)# | | | Value | |
| | | | |
LONG-TERM INVESTMENTS 96.4% | | | | | | | | | | | | |
| | | | |
ASSET-BACKED SECURITIES 3.2% | | | | | | | | | | | | |
| | | | |
Collateralized Loan Obligations | | | | | | | | | | | | |
| | | | |
BlueMountain Fuji US CLO Ltd. (Cayman Islands), | | | | | | | | | | | | |
Series 2017-02A, Class A1AR, 144A, 3 Month SOFR + 1.262% (Cap N/A, Floor 0.000%) | | 6.588%(c) | | 10/20/30 | | | 706 | | | $ | 704,791 | |
Carlyle Global Market Strategies CLO Ltd. (Cayman Islands), | | | | | | | | | | | | |
Series 2015-05A, Class A1RR, 144A, 3 Month SOFR + 1.342% (Cap N/A, Floor 1.080%) | | 6.668(c) | | 01/20/32 | | | 747 | | | | 743,574 | |
Madison Park Funding Ltd. (Cayman Islands), | | | | | | | | | | | | |
Series 2019-33A, Class AR, 144A, 3 Month SOFR + 1.290% (Cap N/A, Floor 1.290%) | | 6.598(c) | | 10/15/32 | | | 1,000 | | | | 991,253 | |
Race Point CLO Ltd. (Cayman Islands), | | | | | | | | | | | | |
Series 2013-08A, Class AR2, 144A, 3 Month SOFR + 1.302% (Cap N/A, Floor 1.040%) | | 6.681(c) | | 02/20/30 | | | 582 | | | | 579,195 | |
Voya CLO Ltd. (Cayman Islands), | | | | | | | | | | | | |
Series 2014-02A, Class A1RR, 144A, 3 Month SOFR + 1.282% (Cap N/A, Floor 1.020%) | | 6.590(c) | | 04/17/30 | | | 568 | | | | 565,983 | |
| | | | | | | | | | | | |
| | | | |
TOTAL ASSET-BACKED SECURITIES
(cost $3,568,138) | | | | | | | | | | | 3,584,796 | |
| | | | | | | | | | | | |
| | | | |
CONVERTIBLE BOND 0.0% | | | | | | | | | | | | |
| | | | |
Telecommunications | | | | | | | | | | | | |
| | | | |
Digicel Group Holdings Ltd. (Jamaica), | | | | | | | | | | | | |
Sub. Notes, 144A, Cash coupon 7.000% (original cost $763; purchased
03/21/23 - 04/03/23)(f)
(cost $762) | | 7.000 | | 09/18/23(oo) | | | 5 | | | | 491 | |
| | | | | | | | | | | | |
| | | | |
CORPORATE BONDS 82.4% | | | | | | | | | | | | |
| | | | |
Advertising 0.5% | | | | | | | | | | | | |
| | | | |
CMG Media Corp., | | | | | | | | | | | | |
Gtd. Notes, 144A | | 8.875 | | 12/15/27 | | | 750 | | | | 589,429 | |
| | | | |
Aerospace & Defense 2.7% | | | | | | | | | | | | |
| | | | |
Boeing Co. (The), | | | | | | | | | | | | |
Sr. Unsec’d. Notes | | 5.805 | | 05/01/50 | | | 288 | | | | 280,302 | |
Sr. Unsec’d. Notes | | 5.930 | | 05/01/60 | | | 350 | | | | 338,109 | |
See Notes to Financial Statements.
PGIM Fixed Income ETFs 85
PGIM Active High Yield Bond ETF
Schedule of Investments (continued)
as of August 31, 2023
| | | | | | | | | | | | | | |
| | | | |
| Description | | Interest
Rate | | | Maturity
Date | | Principal
Amount (000)# | | | Value | |
| | | | |
CORPORATE BONDS (Continued) | | | | | | | | | | | | | | |
| | | | |
Aerospace & Defense (cont’d.) | | | | | | | | | | | | | | |
| | | | |
Bombardier, Inc. (Canada), | | | | | | | | | | | | | | |
Sr. Unsec’d. Notes, 144A | | | 6.000 | % | | 02/15/28 | | | 150 | | | $ | 139,734 | |
Sr. Unsec’d. Notes, 144A | | | 7.125 | | | 06/15/26 | | | 300 | | | | 294,063 | |
Sr. Unsec’d. Notes, 144A | | | 7.500 | | | 03/15/25 | | | 549 | | | | 547,930 | |
Sr. Unsec’d. Notes, 144A | | | 7.500 | | | 02/01/29 | | | 200 | | | | 196,250 | |
Sr. Unsec’d. Notes, 144A | | | 7.875 | | | 04/15/27 | | | 415 | | | | 413,963 | |
Spirit AeroSystems, Inc., | | | | | | | | | | | | | | |
Sec’d. Notes, 144A | | | 7.500 | | | 04/15/25 | | | 100 | | | | 98,749 | |
TransDigm, Inc., | | | | | | | | | | | | | | |
Gtd. Notes | | | 4.625 | | | 01/15/29 | | | 166 | | | | 148,657 | |
Gtd. Notes | | | 5.500 | | | 11/15/27 | | | 490 | | | | 465,115 | |
Sr. Sec’d. Notes, 144A | | | 6.250 | | | 03/15/26 | | | 100 | | | | 99,353 | |
| | | | | | | | | | | | | | |
| | | | |
| | | | | | | | | | | | | 3,022,225 | |
| | | | |
Agriculture 0.2% | | | | | | | | | | | | | | |
| | | | |
Vector Group Ltd., | | | | | | | | | | | | | | |
Sr. Sec’d. Notes, 144A | | | 5.750 | | | 02/01/29 | | | 260 | | | | 226,595 | |
| | | | |
Airlines 1.4% | | | | | | | | | | | | | | |
| | | | |
American Airlines, Inc., | | | | | | | | | | | | | | |
Sr. Sec’d. Notes, 144A | | | 7.250 | | | 02/15/28 | | | 50 | | | | 49,077 | |
Sr. Sec’d. Notes, 144A | | | 11.750 | | | 07/15/25 | | | 200 | | | | 219,034 | |
American Airlines, Inc./AAdvantage Loyalty IP Ltd., | | | | | | | | | | | | | | |
Sr. Sec’d. Notes, 144A | | | 5.500 | | | 04/20/26 | | | 274 | | | | 268,980 | |
Sr. Sec’d. Notes, 144A | | | 5.750 | | | 04/20/29 | | | 125 | | | | 119,506 | |
Hawaiian Brand Intellectual Property Ltd./HawaiianMiles Loyalty Ltd., | | | | | | | | | | | | | | |
Sr. Sec’d. Notes, 144A | | | 5.750 | | | 01/20/26 | | | 50 | | | | 46,188 | |
United Airlines, Inc., | | | | | | | | | | | | | | |
Sr. Sec’d. Notes, 144A | | | 4.625 | | | 04/15/29 | | | 557 | | | | 495,945 | |
VistaJet Malta Finance PLC/Vista Management Holding, Inc. (Switzerland), | | | | | | | | | | | | | | |
Sr. Unsec’d. Notes, 144A | | | 6.375 | | | 02/01/30 | | | 150 | | | | 123,000 | |
Sr. Unsec’d. Notes, 144A | | | 7.875 | | | 05/01/27 | | | 125 | | | | 112,812 | |
Sr. Unsec’d. Notes, 144A | | | 9.500 | | | 06/01/28 | | | 148 | | | | 136,530 | |
| | | | | | | | | | | | | | |
| | | | |
| | | | | | | | | | | | | 1,571,072 | |
See Notes to Financial Statements.
86
PGIM Active High Yield Bond ETF
Schedule of Investments (continued)
as of August 31, 2023
| | | | | | | | | | | | |
| | | | |
| Description | | Interest
Rate | | Maturity
Date | | Principal
Amount (000)# | | | Value | |
| | | | |
CORPORATE BONDS (Continued) | | | | | | | | | | | | |
| | | | |
Apparel 0.5% | | | | | | | | | | | | |
| | | | |
Kontoor Brands, Inc., | | | | | | | | | | | | |
Gtd. Notes, 144A | | 4.125% | | 11/15/29 | | | 50 | | | $ | 42,489 | |
William Carter Co. (The), | | | | | | | | | | | | |
Gtd. Notes, 144A | | 5.625 | | 03/15/27 | | | 125 | | | | 121,186 | |
Wolverine World Wide, Inc., | | | | | | | | | | | | |
Gtd. Notes, 144A | | 4.000 | | 08/15/29 | | | 501 | | | | 374,977 | |
| | | | | | | | | | | | |
| | | | |
| | | | | | | | | | | 538,652 | |
| | | | |
Auto Manufacturers 2.3% | | | | | | | | | | | | |
| | | | |
Allison Transmission, Inc., | | | | | | | | | | | | |
Gtd. Notes, 144A | | 3.750 | | 01/30/31 | | | 264 | | | | 220,819 | |
Ford Holdings LLC, | | | | | | | | | | | | |
Gtd. Notes | | 9.300 | | 03/01/30 | | | 108 | | | | 119,208 | |
Ford Motor Co., | | | | | | | | | | | | |
Sr. Unsec’d. Notes | | 3.250 | | 02/12/32 | | | 350 | | | | 273,127 | |
Sr. Unsec’d. Notes | | 4.750 | | 01/15/43 | | | 285 | | | | 213,119 | |
Sr. Unsec’d. Notes | | 7.400 | | 11/01/46 | | | 50 | | | | 51,026 | |
Sr. Unsec’d. Notes | | 9.625 | | 04/22/30 | | | 552 | | | | 638,071 | |
Ford Motor Credit Co. LLC, | | | | | | | | | | | | |
Sr. Unsec’d. Notes | | 4.000 | | 11/13/30 | | | 400 | | | | 338,461 | |
Sr. Unsec’d. Notes | | 5.113 | | 05/03/29 | | | 388 | | | | 356,824 | |
Sr. Unsec’d. Notes | | 6.800 | | 05/12/28 | | | 200 | | | | 199,864 | |
PM General Purchaser LLC, | | | | | | | | | | | | |
Sr. Sec’d. Notes, 144A | | 9.500 | | 10/01/28 | | | 195 | | | | 187,311 | |
| | | | | | | | | | | | |
| | | | |
| | | | | | | | | | | 2,597,830 | |
| | | | |
Auto Parts & Equipment 1.0% | | | | | | | | | | | | |
| | | | |
Adient Global Holdings Ltd., | | | | | | | | | | | | |
Gtd. Notes, 144A | | 4.875 | | 08/15/26 | | | 200 | | | | 191,500 | |
Sr. Sec’d. Notes, 144A | | 7.000 | | 04/15/28 | | | 141 | | | | 141,000 | |
American Axle & Manufacturing, Inc., | | | | | | | | | | | | |
Gtd. Notes | | 6.500 | | 04/01/27 | | | 285 | | | | 270,354 | |
Dana, Inc., | | | | | | | | | | | | |
Sr. Unsec’d. Notes | | 4.500 | | 02/15/32 | | | 165 | | | | 133,158 | |
Sr. Unsec’d. Notes | | 5.625 | | 06/15/28 | | | 35 | | | | 32,933 | |
See Notes to Financial Statements.
PGIM Fixed Income ETFs 87
PGIM Active High Yield Bond ETF
Schedule of Investments (continued)
as of August 31, 2023
| | | | | | | | | | | | |
| | | | |
| Description | | Interest
Rate | | Maturity
Date | | Principal
Amount (000)# | | | Value | |
| | | | |
CORPORATE BONDS (Continued) | | | | | | | | | | | | |
| | | | |
Auto Parts & Equipment (cont’d.) | | | | | | | | | | | | |
| | | | |
Tenneco, Inc., | | | | | | | | | | | | |
Sr. Sec’d. Notes, 144A | | 8.000% | | 11/17/28 | | | 200 | | | $ | 164,706 | |
Titan International, Inc., | | | | | | | | | | | | |
Sr. Sec’d. Notes | | 7.000 | | 04/30/28 | | | 168 | | | | 159,960 | |
| | | | | | | | | | | | |
| | | | |
| | | | | | | | | | | 1,093,611 | |
| | | | |
Banks 0.2% | | | | | | | | | | | | |
| | | | |
Citigroup, Inc., | | | | | | | | | | | | |
Jr. Sub. Notes | | 3.875(ff) | | 02/18/26(oo) | | | 83 | | | | 72,270 | |
Freedom Mortgage Corp., | | | | | | | | | | | | |
Sr. Unsec’d. Notes, 144A | | 7.625 | | 05/01/26 | | | 125 | | | | 114,992 | |
| | | | | | | | | | | | |
| | | | |
| | | | | | | | | | | 187,262 | |
| | | | |
Building Materials 1.5% | | | | | | | | | | | | |
| | | | |
Camelot Return Merger Sub, Inc., | | | | | | | | | | | | |
Sr. Sec’d. Notes, 144A | | 8.750 | | 08/01/28 | | | 100 | | | | 99,709 | |
Cornerstone Building Brands, Inc., | | | | | | | | | | | | |
Gtd. Notes, 144A | | 6.125 | | 01/15/29 | | | 175 | | | | 142,041 | |
Eco Material Technologies, Inc., | | | | | | | | | | | | |
Sr. Sec’d. Notes, 144A | | 7.875 | | 01/31/27 | | | 150 | | | | 146,820 | |
Griffon Corp., | | | | | | | | | | | | |
Gtd. Notes | | 5.750 | | 03/01/28 | | | 133 | | | | 124,024 | |
JELD-WEN, Inc., | | | | | | | | | | | | |
Gtd. Notes, 144A | | 4.625 | | 12/15/25 | | | 87 | | | | 84,274 | |
Knife River Corp., | | | | | | | | | | | | |
Sr. Unsec’d. Notes, 144A | | 7.750 | | 05/01/31 | | | 50 | | | | 51,216 | |
Masonite International Corp., | | | | | | | | | | | | |
Gtd. Notes, 144A | | 3.500 | | 02/15/30 | | | 95 | | | | 79,172 | |
Gtd. Notes, 144A | | 5.375 | | 02/01/28 | | | 25 | | | | 23,563 | |
MIWD Holdco II LLC/MIWD Finance Corp., | | | | | | | | | | | | |
Gtd. Notes, 144A | | 5.500 | | 02/01/30 | | | 175 | | | | 148,285 | |
Smyrna Ready Mix Concrete LLC, | | | | | | | | | | | | |
Sr. Sec’d. Notes, 144A | | 6.000 | | 11/01/28 | | | 323 | | | | 310,095 | |
Standard Industries, Inc., | | | | | | | | | | | | |
Sr. Unsec’d. Notes, 144A | | 3.375 | | 01/15/31 | | | 250 | | | | 199,414 | |
See Notes to Financial Statements.
88
PGIM Active High Yield Bond ETF
Schedule of Investments (continued)
as of August 31, 2023
| | | | | | | | | | | | | | |
| | | | |
| Description | | Interest
Rate | | | Maturity
Date | | Principal
Amount (000)# | | | Value | |
| | | | |
CORPORATE BONDS (Continued) | | | | | | | | | | | | | | |
| | | | |
Building Materials (cont’d.) | | | | | | | | | | | | | | |
| | | | |
Standard Industries, Inc., (cont’d.) | | | | | | | | | | | | | | |
Sr. Unsec’d. Notes, 144A | | | 4.375 | % | | 07/15/30 | | | 125 | | | $ | 107,138 | |
Sr. Unsec’d. Notes, 144A | | | 5.000 | | | 02/15/27 | | | 256 | | | | 243,169 | |
| | | | | | | | | | | | | | |
| | | | |
| | | | | | | | | | | | | 1,758,920 | |
| | | | |
Chemicals 1.7% | | | | | | | | | | | | | | |
| | | | |
Ashland, Inc., | | | | | | | | | | | | | | |
Sr. Unsec’d. Notes | | | 6.875 | | | 05/15/43 | | | 91 | | | | 89,979 | |
ASP Unifrax Holdings, Inc., | | | | | | | | | | | | | | |
Sr. Sec’d. Notes, 144A | | | 5.250 | | | 09/30/28 | | | 50 | | | | 33,745 | |
Sr. Unsec’d. Notes, 144A | | | 7.500 | | | 09/30/29 | | | 37 | | | | 19,238 | |
Avient Corp., | | | | | | | | | | | | | | |
Sr. Unsec’d. Notes, 144A | | | 5.750 | | | 05/15/25 | | | 50 | | | | 49,342 | |
Chemours Co. (The), | | | | | | | | | | | | | | |
Gtd. Notes, 144A | | | 4.625 | | | 11/15/29 | | | 181 | | | | 150,522 | |
Gtd. Notes, 144A | | | 5.750 | | | 11/15/28 | | | 36 | | | | 32,334 | |
Cornerstone Chemical Co., | | | | | | | | | | | | | | |
Sr. Sec’d. Notes, 144A, Cash coupon 8.250% and PIK 2.000% (original cost $69,750; purchased 04/09/19 - 01/12/21)(f) | | | 10.250 | | | 09/01/27 | | | 75 | | | | 64,971 | |
Iris Holding, Inc., | | | | | | | | | | | | | | |
Sr. Unsec’d. Notes, 144A | | | 10.000 | | | 12/15/28 | | | 232 | | | | 184,481 | |
Olympus Water US Holding Corp., | | | | | | | | | | | | | | |
Sr. Sec’d. Notes, 144A | | | 9.750 | | | 11/15/28 | �� | | 200 | | | | 201,644 | |
Rain Carbon, Inc., | | | | | | | | | | | | | | |
Sr. Sec’d. Notes, 144A | | | 12.250 | | | 09/01/29 | | | 175 | | | | 180,255 | |
Rain CII Carbon LLC/CII Carbon Corp., | | | | | | | | | | | | | | |
Sec’d. Notes, 144A | | | 7.250 | | | 04/01/25 | | | 3 | | | | 2,948 | |
SK Invictus Intermediate II Sarl, | | | | | | | | | | | | | | |
Sr. Sec’d. Notes, 144A | | | 5.000 | | | 10/30/29 | | | 230 | | | | 188,448 | |
SNF Group SACA (France), | | | | | | | | | | | | | | |
Sr. Unsec’d. Notes, 144A | | | 3.125 | | | 03/15/27 | | | 200 | | | | 176,558 | |
TPC Group, Inc., | | | | | | | | | | | | | | |
Sr. Sec’d. Notes, 144A | | | 13.000 | | | 12/16/27 | | | 105 | | | | 105,934 | |
Tronox, Inc., | | | | | | | | | | | | | | |
Gtd. Notes, 144A | | | 4.625 | | | 03/15/29 | | | 249 | | | | 204,113 | |
Valvoline, Inc., | | | | | | | | | | | | | | |
Sr. Unsec’d. Notes, 144A | | | 3.625 | | | 06/15/31 | | | 135 | | | | 107,768 | |
See Notes to Financial Statements.
PGIM Fixed Income ETFs 89
PGIM Active High Yield Bond ETF
Schedule of Investments (continued)
as of August 31, 2023
| | | | | | | | | | | | | | | | |
| | | | |
| Description | | Interest
Rate | | | Maturity
Date | | | Principal
Amount (000)# | | | Value | |
| | | | |
CORPORATE BONDS (Continued) | | | | | | | | | | | | | | | | |
| | | | |
Chemicals (cont’d.) | | | | | | | | | | | | | | | | |
| | | | |
Venator Finance Sarl/Venator Materials LLC, | | | | | | | | | | | | | | | | |
Gtd. Notes, 144A | | | 5.750 | % | | | 07/15/25(d) | | | | 250 | | | $ | 7,500 | |
Sr. Sec’d. Notes, 144A | | | 9.500 | | | | 07/01/25(d) | | | | 125 | | | | 97,500 | |
WR Grace Holdings LLC, | | | | | | | | | | | | | | | | |
Sr. Sec’d. Notes, 144A | | | 7.375 | | | | 03/01/31 | | | | 25 | | | | 24,698 | |
| | | | | | | | | | | | | | | | |
| | | | |
| | | | | | | | | | | | | | | 1,921,978 | |
| | | | |
Coal 0.1% | | | | | | | | | | | | | | | | |
| | | | |
Conuma Resources Ltd. (Canada), | | | | | | | | | | | | | | | | |
Sr. Sec’d. Notes, 144A | | | 13.125 | | | | 05/01/28 | | | | 138 | | | | 127,477 | |
Coronado Finance Pty Ltd. (Australia), | | | | | | | | | | | | | | | | |
Sr. Sec’d. Notes, 144A | | | 10.750 | | | | 05/15/26 | | | | 35 | | | | 36,209 | |
| | | | | | | | | | | | | | | | |
| | | | |
| | | | | | | | | | | | | | | 163,686 | |
| | | | |
Commercial Services 4.7% | | | �� | | | | | | | | | | | | | |
| | | | |
Adtalem Global Education, Inc., | | | | | | | | | | | | | | | | |
Sr. Sec’d. Notes, 144A | | | 5.500 | | | | 03/01/28 | | | | 114 | | | | 106,601 | |
Allied Universal Holdco LLC/Allied Universal Finance Corp., | | | | | | | | | | | | | | | | |
Sr. Sec’d. Notes, 144A | | | 6.625 | | | | 07/15/26 | | | | 416 | | | | 396,016 | |
Sr. Unsec’d. Notes, 144A | | | 6.000 | | | | 06/01/29 | | | | 400 | | | | 306,495 | |
Sr. Unsec’d. Notes, 144A | | | 9.750 | | | | 07/15/27 | | | | 433 | | | | 397,700 | |
Allied Universal Holdco LLC/Allied Universal Finance Corp./Atlas Luxco 4 Sarl, | | | | | | | | | | | | | | | | |
Sr. Sec’d. Notes, 144A | | | 4.625 | | | | 06/01/28 | | | | 600 | | | | 504,000 | |
Alta Equipment Group, Inc., | | | | | | | | | | | | | | | | |
Sec’d. Notes, 144A | | | 5.625 | | | | 04/15/26 | | | | 50 | | | | 46,287 | |
AMN Healthcare, Inc., | | | | | | | | | | | | | | | | |
Gtd. Notes, 144A | | | 4.000 | | | | 04/15/29 | | | | 250 | | | | 214,711 | |
APi Group DE, Inc., | | | | | | | | | | | | | | | | |
Gtd. Notes, 144A | | | 4.750 | | | | 10/15/29 | | | | 50 | | | | 45,216 | |
Avis Budget Car Rental LLC/Avis Budget Finance, Inc., | | | | | | | | | | | | | | | | |
Gtd. Notes, 144A | | | 4.750 | | | | 04/01/28 | | | | 136 | | | | 123,404 | |
Gtd. Notes, 144A | | | 5.375 | | | | 03/01/29 | | | | 165 | | | | 151,587 | |
Brink’s Co. (The), | | | | | | | | | | | | | | | | |
Gtd. Notes, 144A | | | 4.625 | | | | 10/15/27 | | | | 25 | | | | 23,259 | |
See Notes to Financial Statements.
90
PGIM Active High Yield Bond ETF
Schedule of Investments (continued)
as of August 31, 2023
| | | | | | | | | | | | | | | | |
| | | | |
| Description | | Interest
Rate | | | Maturity
Date | | | Principal
Amount (000)# | | | Value | |
| | | | |
CORPORATE BONDS (Continued) | | | | | | | | | | | | | | | | |
| | | | |
Commercial Services (cont’d.) | | | | | | | | | | | | | | | | |
| | | | |
Gartner, Inc., | | | | | | | | | | | | | | | | |
Gtd. Notes, 144A | | | 3.625% | | | | 06/15/29 | | | | 50 | | | $ | 43,918 | |
Hertz Corp. (The), | | | | | | | | | | | | | | | | |
Gtd. Notes, 144A | | | 4.625 | | | | 12/01/26 | | | | 150 | | | | 135,688 | |
Gtd. Notes, 144A | | | 5.000 | | | | 12/01/29 | | | | 50 | | | | 41,206 | |
Metis Merger Sub LLC, | | | | | | | | | | | | | | | | |
Sr. Unsec’d. Notes, 144A | | | 6.500 | | | | 05/15/29 | | | | 647 | | | | 560,725 | |
MPH Acquisition Holdings LLC, | | | | | | | | | | | | | | | | |
Sr. Sec’d. Notes, 144A | | | 5.500 | | | | 09/01/28 | | | | 561 | | | | 477,326 | |
NESCO Holdings II, Inc., | | | | | | | | | | | | | | | | |
Sec’d. Notes, 144A | | | 5.500 | | | | 04/15/29 | | | | 285 | | | | 259,518 | |
Service Corp. International, | | | | | | | | | | | | | | | | |
Sr. Unsec’d. Notes | | | 4.000 | | | | 05/15/31 | | | | 250 | | | | 211,905 | |
United Rentals North America, Inc., | | | | | | | | | | | | | | | | |
Gtd. Notes | | | 3.750 | | | | 01/15/32 | | | | 275 | | | | 230,745 | |
Gtd. Notes | | | 3.875 | | | | 02/15/31 | | | | 245 | | | | 210,022 | |
Gtd. Notes | | | 4.875 | | | | 01/15/28 | | | | 75 | | | | 71,329 | |
Gtd. Notes | | | 5.250 | | | | 01/15/30 | | | | 150 | | | | 142,611 | |
Verscend Escrow Corp., | | | | | | | | | | | | | | | | |
Sr. Unsec’d. Notes, 144A | | | 9.750 | | | | 08/15/26 | | | | 601 | | | | 598,378 | |
VT Topco, Inc., | | | | | | | | | | | | | | | | |
Sr. Sec’d. Notes, 144A | | | 8.500 | | | | 08/15/30 | | | | 75 | | | | 76,045 | |
| | | | | | | | | | | | | | | | |
| | | | |
| | | | | | | | | | | | | | | 5,374,692 | |
| | | | |
Computers 0.7% | | | | | | | | | | | | | | | | |
| | | | |
McAfee Corp., | | | | | | | | | | | | | | | | |
Sr. Unsec’d. Notes, 144A | | | 7.375 | | | | 02/15/30 | | | | 342 | | | | 299,206 | |
NCR Corp., | | | | | | | | | | | | | | | | |
Gtd. Notes, 144A | | | 5.000 | | | | 10/01/28 | | | | 275 | | | | 252,550 | |
Gtd. Notes, 144A | | | 5.125 | | | | 04/15/29 | | | | 150 | | | | 136,807 | |
Gtd. Notes, 144A | | | 5.250 | | | | 10/01/30 | | | | 50 | | | | 44,938 | |
Gtd. Notes, 144A | | | 6.125 | | | | 09/01/29 | | | | 25 | | | | 25,659 | |
| | | | | | | | | | | | | | | | |
| | | | |
| | | | | | | | | | | | | | | 759,160 | |
| | | | |
Distribution/Wholesale 0.8% | | | | | | | | | | | | | | | | |
| | | | |
H&E Equipment Services, Inc., | | | | | | | | | | | | | | | | |
Gtd. Notes, 144A | | | 3.875 | | | | 12/15/28 | | | | 741 | | | | 647,147 | |
See Notes to Financial Statements.
PGIM Fixed Income ETFs 91
PGIM Active High Yield Bond ETF
Schedule of Investments (continued)
as of August 31, 2023
| | | | | | | | | | | | | | | | |
| | | | |
| Description | | Interest
Rate | | | Maturity
Date | | | Principal
Amount (000)# | | | Value | |
| | | | |
CORPORATE BONDS (Continued) | | | | | | | | | | | | | | | | |
| | | | |
Distribution/Wholesale (cont’d.) | | | | | | | | | | | | | | | | |
| | | | |
Ritchie Bros Holdings, Inc. (Canada), | | | | | | | | | | | | | | | | |
Gtd. Notes, 144A | | | 7.750% | | | | 03/15/31 | | | | 75 | | | $ | 77,309 | |
Sr. Sec’d. Notes, 144A | | | 6.750 | | | | 03/15/28 | | | | 25 | | | | 25,213 | |
Windsor Holdings III LLC, | | | | | | | | | | | | | | | | |
Sr. Sec’d. Notes, 144A | | | 8.500 | | | | 06/15/30 | | | | 177 | | | | 177,810 | |
| | | | | | | | | | | | | | | | |
| | | | |
| | | | | | | | | | | | | | | 927,479 | |
| | | | |
Diversified Financial Services 2.9% | | | | | | | | | | | | | | | | |
| | | | |
Bread Financial Holdings, Inc., | | | | | | | | | | | | | | | | |
Gtd. Notes, 144A | | | 4.750 | | | | 12/15/24 | | | | 100 | | | | 97,555 | |
goeasy Ltd. (Canada), | | | | | | | | | | | | | | | | |
Gtd. Notes, 144A | | | 4.375 | | | | 05/01/26 | | | | 150 | | | | 138,084 | |
Jefferies Finance LLC/JFIN Co-Issuer Corp., | | | | | | | | | | | | | | | | |
Sr. Unsec’d. Notes, 144A | | | 5.000 | | | | 08/15/28 | | | | 400 | | | | 343,010 | |
LD Holdings Group LLC, | | | | | | | | | | | | | | | | |
Gtd. Notes, 144A | | | 6.125 | | | | 04/01/28 | | | | 128 | | | | 83,538 | |
LFS Topco LLC, | | | | | | | | | | | | | | | | |
Gtd. Notes, 144A | | | 5.875 | | | | 10/15/26 | | | | 133 | | | | 115,409 | |
LPL Holdings, Inc., | | | | | | | | | | | | | | | | |
Gtd. Notes, 144A | | | 4.375 | | | | 05/15/31 | | | | 50 | | | | 44,022 | |
Macquarie Airfinance Holdings Ltd. (United Kingdom), | | | | | | | | | | | | | | | | |
Sr. Unsec’d. Notes, 144A | | | 8.375 | | | | 05/01/28 | | | | 50 | | | | 50,894 | |
Nationstar Mortgage Holdings, Inc., | | | | | | | | | | | | | | | | |
Gtd. Notes, 144A | | | 5.125 | | | | 12/15/30 | | | | 432 | | | | 366,499 | |
Gtd. Notes, 144A | | | 6.000 | | | | 01/15/27 | | | | 342 | | | | 328,233 | |
Navient Corp., | | | | | | | | | | | | | | | | |
Sr. Unsec’d. Notes | | | 5.500 | | | | 03/15/29 | | | | 123 | | | | 105,408 | |
Sr. Unsec’d. Notes | | | 6.750 | | | | 06/25/25 | | | | 93 | | | | 92,578 | |
Sr. Unsec’d. Notes | | | 9.375 | | | | 07/25/30 | | | | 180 | | | | 180,863 | |
OneMain Finance Corp., | | | | | | | | | | | | | | | | |
Gtd. Notes | | | 6.625 | | | | 01/15/28 | | | | 219 | | | | 206,177 | |
Gtd. Notes | | | 7.125 | | | | 03/15/26 | | | | 361 | | | | 355,931 | |
PennyMac Financial Services, Inc., | | | | | | | | | | | | | | | | |
Gtd. Notes, 144A | | | 4.250 | | | | 02/15/29 | | | | 150 | | | | 124,442 | |
Gtd. Notes, 144A | | | 5.375 | | | | 10/15/25 | | | | 319 | | | | 308,576 | |
Rocket Mortgage LLC/Rocket Mortgage Co-Issuer, Inc., | | | | | | | | | | | | | | | | |
Gtd. Notes, 144A | | | 3.625 | | | | 03/01/29 | | | | 99 | | | | 84,268 | |
See Notes to Financial Statements.
92
PGIM Active High Yield Bond ETF
Schedule of Investments (continued)
as of August 31, 2023
| | | | | | | | | | | | | | |
| | | | |
| Description | | Interest
Rate | | | Maturity
Date | | Principal
Amount (000)# | | | Value | |
| | | | |
CORPORATE BONDS (Continued) | | | | | | | | | | | | | | |
| | | | |
Diversified Financial Services (cont’d.) | | | | | | | | | | | | | | |
| | | | |
Rocket Mortgage LLC/Rocket Mortgage Co-Issuer, Inc., (cont’d.) | | | | | | | | | | | | | | |
Gtd. Notes, 144A | | | 3.875 | % | | 03/01/31 | | | 125 | | | $ | 101,957 | |
Gtd. Notes, 144A | | | 4.000 | | | 10/15/33 | | | 166 | | | | 131,694 | |
| | | | | | | | | | | | | | |
| | | | |
| | | | | | | | | | | | | 3,259,138 | |
| | | | |
Electric 4.2% | | | | | | | | | | | | | | |
| | | | |
Calpine Corp., | | | | | | | | | | | | | | |
Sr. Sec’d. Notes, 144A | | | 3.750 | | | 03/01/31 | | | 375 | | | | 312,473 | |
Sr. Unsec’d. Notes, 144A | | | 4.625 | | | 02/01/29 | | | 515 | | | | 447,626 | |
Sr. Unsec’d. Notes, 144A | | | 5.000 | | | 02/01/31 | | | 325 | | | | 275,111 | |
Sr. Unsec’d. Notes, 144A | | | 5.125 | | | 03/15/28 | | | 734 | | | | 668,856 | |
NRG Energy, Inc., | | | | | | | | | | | | | | |
Gtd. Notes | | | 5.750 | | | 01/15/28 | | | 140 | | | | 132,441 | |
Gtd. Notes | | | 6.625 | | | 01/15/27 | | | 30 | | | | 29,622 | |
Gtd. Notes, 144A | | | 3.375 | | | 02/15/29 | | | 125 | | | | 103,034 | |
Gtd. Notes, 144A | | | 3.625 | | | 02/15/31 | | | 200 | | | | 156,446 | |
Gtd. Notes, 144A | | | 3.875 | | | 02/15/32 | | | 150 | | | | 116,032 | |
Gtd. Notes, 144A | | | 5.250 | | | 06/15/29 | | | 275 | | | | 247,594 | |
Jr. Sub. Notes, 144A | | | 10.250 | (ff) | | 03/15/28(oo) | | | 407 | | | | 397,567 | |
PG&E Corp., | | | | | | | | | | | | | | |
Sr. Sec’d. Notes | | | 5.250 | | | 07/01/30 | | | 286 | | | | 254,131 | |
Vistra Corp., | | | | | | | | | | | | | | |
Jr. Sub. Notes, 144A | | | 7.000 | (ff) | | 12/15/26(oo) | | | 233 | | | | 216,701 | |
Jr. Sub. Notes, 144A | | | 8.000 | (ff) | | 10/15/26(oo) | | | 125 | | | | 119,873 | |
Vistra Operations Co. LLC, | | | | | | | | | | | | | | |
Gtd. Notes, 144A | | | 4.375 | | | 05/01/29 | | | 300 | | | | 264,412 | |
Gtd. Notes, 144A | | | 5.000 | | | 07/31/27 | | | 290 | | | | 273,022 | |
Gtd. Notes, 144A | | | 5.500 | | | 09/01/26 | | | 50 | | | | 48,216 | |
Gtd. Notes, 144A | | | 5.625 | | | 02/15/27 | | | 750 | | | | 721,719 | |
| | | | | | | | | | | | | | |
| | | | |
| | | | | | | | | | | | | 4,784,876 | |
| | | | |
Electrical Components & Equipment 0.6% | | | | | | | | | | | | | | |
| | | | |
Energizer Holdings, Inc., | | | | | | | | | | | | | | |
Gtd. Notes, 144A | | | 4.375 | | | 03/31/29 | | | 385 | | | | 329,630 | |
WESCO Distribution, Inc., | | | | | | | | | | | | | | |
Gtd. Notes, 144A | | | 7.250 | | | 06/15/28 | | | 377 | | | | 384,236 | |
| | | | | | | | | | | | | | |
| | | | |
| | | | | | | | | | | | | 713,866 | |
See Notes to Financial Statements.
PGIM Fixed Income ETFs 93
PGIM Active High Yield Bond ETF
Schedule of Investments (continued)
as of August 31, 2023
| | | | | | | | | | | | | | | | |
| Description | | Interest
Rate | | | Maturity
Date | | | Principal
Amount (000)# | | | Value | |
| | | | |
CORPORATE BONDS (Continued) | | | | | | | | | | | | | | | | |
| | | | |
Electronics 0.2% | | | | | | | | | | | | | | | | |
| | | | |
Likewize Corp., | | | | | | | | | | | | | | | | |
Sr. Sec’d. Notes, 144A (original cost $204,088; purchased
10/08/20 - 06/21/22)(f) | | | 9.750 | % | | | 10/15/25 | | | | 200 | | | $ | 195,304 | |
Sensata Technologies, Inc., | | | | | | | | | | | | | | | | |
Gtd. Notes, 144A | | | 3.750 | | | | 02/15/31 | | | | 15 | | | | 12,542 | |
| | | | | | | | | | | | | | | | |
| | | | |
| | | | | | | | | | | | | | | 207,846 | |
| | | | |
Engineering & Construction 0.1% | | | | | | | | | | | | | | | | |
| | | | |
Brand Industrial Services, Inc., | | | | | | | | | | | | | | | | |
Sr. Sec’d. Notes, 144A | | | 10.375 | | | | 08/01/30 | | | | 75 | | | | 77,443 | |
TopBuild Corp., | | | | | | | | | | | | | | | | |
Gtd. Notes, 144A | | | 4.125 | | | | 02/15/32 | | | | 50 | | | | 41,762 | |
| | | | | | | | | | | | | | | | |
| | | | |
| | | | | | | | | | | | | | | 119,205 | |
| | | | |
Entertainment 2.8% | | | | | | | | | | | | | | | | |
| | | | |
Caesars Entertainment, Inc., | | | | | | | | | | | | | | | | |
Sr. Sec’d. Notes, 144A | | | 6.250 | | | | 07/01/25 | | | | 577 | | | | 572,911 | |
Sr. Sec’d. Notes, 144A | | | 7.000 | | | | 02/15/30 | | | | 392 | | | | 393,603 | |
Sr. Unsec’d. Notes, 144A | | | 4.625 | | | | 10/15/29 | | | | 250 | | | | 218,658 | |
CCM Merger, Inc., | | | | | | | | | | | | | | | | |
Sr. Unsec’d. Notes, 144A | | | 6.375 | | | | 05/01/26 | | | | 150 | | | | 145,547 | |
CDI Escrow Issuer, Inc., | | | | | | | | | | | | | | | | |
Sr. Unsec’d. Notes, 144A | | | 5.750 | | | | 04/01/30 | | | | 50 | | | | 46,500 | |
Churchill Downs, Inc., | | | | | | | | | | | | | | | | |
Gtd. Notes, 144A | | | 6.750 | | | | 05/01/31 | | | | 50 | | | | 48,911 | |
Everi Holdings, Inc., | | | | | | | | | | | | | | | | |
Gtd. Notes, 144A | | | 5.000 | | | | 07/15/29 | | | | 25 | | | | 22,296 | |
Golden Entertainment, Inc., | | | | | | | | | | | | | | | | |
Sr. Unsec’d. Notes, 144A | | | 7.625 | | | | 04/15/26 | | | | 225 | | | | 224,477 | |
Light & Wonder International, Inc., | | | | | | | | | | | | | | | | |
Gtd. Notes, 144A | | | 7.500 | | | | 09/01/31 | | | | 50 | | | | 50,689 | |
Midwest Gaming Borrower LLC/Midwest Gaming Finance Corp., | | | | | | | | | | | | | | | | |
Sr. Sec’d. Notes, 144A | | | 4.875 | | | | 05/01/29 | | | | 327 | | | | 284,621 | |
Penn Entertainment, Inc., | | | | | | | | | | | | | | | | |
Sr. Unsec’d. Notes, 144A | | | 4.125 | | | | 07/01/29 | | | | 75 | | | | 61,360 | |
Sr. Unsec’d. Notes, 144A | | | 5.625 | | | | 01/15/27 | | | | 528 | | | | 500,971 | |
See Notes to Financial Statements.
94
PGIM Active High Yield Bond ETF
Schedule of Investments (continued)
as of August 31, 2023
| | | | | | | | | | | | | | | | |
| Description | | Interest
Rate | | | Maturity
Date | | | Principal
Amount
(000)# | | | Value | |
| | | | |
CORPORATE BONDS (Continued) | | | | | | | | | | | | | | | | |
| | | | |
Entertainment (cont’d.) | | | | | | | | | | | | | | | | |
| | | | |
Premier Entertainment Sub LLC/Premier Entertainment Finance Corp., | | | | | | | | | | | | | | | | |
Gtd. Notes, 144A | | | 5.875% | | | | 09/01/31 | | | | 175 | | | $ | 135,088 | |
Scientific Games Holdings LP/Scientific Games US FinCo, Inc., | | | | | | | | | | | | | | | | |
Sr. Unsec’d. Notes, 144A | | | 6.625 | | | | 03/01/30 | | | | 316 | | | | 278,532 | |
Wynn Resorts Finance LLC/Wynn Resorts Capital Corp., | | | | | | | | | | | | | | | | |
Gtd. Notes, 144A | | | 5.125 | | | | 10/01/29 | | | | 265 | | | | 237,474 | |
| | | | | | | | | | | | | | | | |
| | | | |
| | | | | | | | | | | | | | | 3,221,638 | |
| | | | |
Environmental Control 0.4% | | | | | | | | | | | | | | | | |
| | | | |
Covanta Holding Corp., | | | | | | | | | | | | | | | | |
Gtd. Notes | | | 5.000 | | | | 09/01/30 | | | | 25 | | | | 21,271 | |
Gtd. Notes, 144A | | | 4.875 | | | | 12/01/29 | | | | 25 | | | | 21,620 | |
GFL Environmental, Inc. (Canada), | | | | | | | | | | | | | | | | |
Gtd. Notes, 144A | | | 4.000 | | | | 08/01/28 | | | | 25 | | | | 22,228 | |
Gtd. Notes, 144A | | | 4.375 | | | | 08/15/29 | | | | 252 | | | | 221,775 | |
Gtd. Notes, 144A | | | 4.750 | | | | 06/15/29 | | | | 167 | | | | 150,616 | |
| | | | | | | | | | | | | | | | |
| | | | |
| | | | | | | | | | | | | | | 437,510 | |
| | | | |
Foods 2.3% | | | | | | | | | | | | | | | | |
| | | | |
Albertson’s Cos., Inc./Safeway, Inc./New Albertson’s LP/Albertson’s LLC, | | | | | | | | | | | | | | | | |
Gtd. Notes, 144A | | | 3.500 | | | | 03/15/29 | | | | 200 | | | | 173,172 | |
Gtd. Notes, 144A | | | 5.875 | | | | 02/15/28 | | | | 25 | | | | 24,266 | |
B&G Foods, Inc., | | | | | | | | | | | | | | | | |
Gtd. Notes | | | 5.250 | | | | 09/15/27 | | | | 557 | | | | 493,267 | |
C&S Group Enterprises LLC, | | | | | | | | | | | | | | | | |
Gtd. Notes, 144A | | | 5.000 | | | | 12/15/28 | | | | 84 | | | | 65,105 | |
JBS USA LUX SA/JBS USA Food Co./JBS USA Finance, Inc., | | | | | | | | | | | | | | | | |
Gtd. Notes | | | 3.625 | | | | 01/15/32 | | | | 444 | | | | 364,691 | |
Sr. Unsec’d. Notes | | | 5.500 | | | | 01/15/30 | | | | 53 | | | | 51,299 | |
Kraft Heinz Foods Co., | | | | | | | | | | | | | | | | |
Gtd. Notes | | | 4.375 | | | | 06/01/46 | | | | 54 | | | | 44,664 | |
Gtd. Notes | | | 5.200 | | | | 07/15/45 | | | | 25 | | | | 22,990 | |
Gtd. Notes | | | 6.500 | | | | 02/09/40 | | | | 25 | | | | 26,430 | |
See Notes to Financial Statements.
PGIM Fixed Income ETFs 95
PGIM Active High Yield Bond ETF
Schedule of Investments (continued)
as of August 31, 2023
| | | | | | | | | | | | | | | | |
| Description | | Interest
Rate | | | Maturity
Date | | | Principal
Amount
(000)# | | | Value | |
| | | | |
CORPORATE BONDS (Continued) | | | | | | | | | | | | | | | | |
| | | | |
Foods (cont’d.) | | | | | | | | | | | | | | | | |
| | | | |
Market Bidco Finco PLC (United Kingdom), | | | | | | | | | | | | | | | | |
Sr. Sec’d. Notes, 144A | | | 5.500% | | | | 11/04/27 | | | GBP | 100 | | | $ | 98,988 | |
Pilgrim’s Pride Corp., | | | | | | | | | | | | | | | | |
Gtd. Notes | | | 3.500 | | | | 03/01/32 | | | | 154 | | | | 123,897 | |
Gtd. Notes | | | 4.250 | | | | 04/15/31 | | | | 829 | | | | 717,667 | |
Post Holdings, Inc., | | | | | | | | | | | | | | | | |
Gtd. Notes, 144A | | | 4.625 | | | | 04/15/30 | | | | 275 | | | | 243,519 | |
Gtd. Notes, 144A | | | 5.500 | | | | 12/15/29 | | | | 100 | | | | 92,476 | |
Sr. Unsec’d. Notes, 144A | | | 4.500 | | | | 09/15/31 | | | | 125 | | | | 107,731 | |
| | | | | | | | | | | | | | | | |
| | | | |
| | | | | | | | | | | | | | | 2,650,162 | |
| | | | |
Gas 0.2% | | | | | | | | | | | | | | | | |
| | | | |
AmeriGas Partners LP/AmeriGas Finance Corp., | | | | | | | | | | | | | | | | |
Sr. Unsec’d. Notes | | | 5.750 | | | | 05/20/27 | | | | 125 | | | | 115,627 | |
Sr. Unsec’d. Notes | | | 5.875 | | | | 08/20/26 | | | | 113 | | | | 107,145 | |
| | | | | | | | | | | | | | | | |
| | | | |
| | | | | | | | | | | | | | | 222,772 | |
| | | | |
Healthcare-Products 1.2% | | | | | | | | | | | | | | | | |
| | | | |
Embecta Corp., | | | | | | | | | | | | | | | | |
Sr. Sec’d. Notes, 144A | | | 5.000 | | | | 02/15/30 | | | | 265 | | | | 217,919 | |
Sr. Sec’d. Notes, 144A | | | 6.750 | | | | 02/15/30 | | | | 35 | | | | 30,920 | |
Medline Borrower LP, | | | | | | | | | | | | | | | | |
Sr. Sec’d. Notes, 144A | | | 3.875 | | | | 04/01/29 | | | | 743 | | | | 647,154 | |
Sr. Unsec’d. Notes, 144A | | | 5.250 | | | | 10/01/29 | | | | 475 | | | | 421,797 | |
| | | | | | | | | | | | | | | | |
| | | | |
| | | | | | | | | | | | | | | 1,317,790 | |
| | | | |
Healthcare-Services 3.8% | | | | | | | | | | | | | | | | |
| | | | |
DaVita, Inc., | | | | | | | | | | | | | | | | |
Gtd. Notes, 144A | | | 3.750 | | | | 02/15/31 | | | | 1,217 | | | | 969,036 | |
HCA, Inc., | | | | | | | | | | | | | | | | |
Gtd. Notes | | | 5.875 | | | | 02/15/26 | | | | 75 | | | | 75,098 | |
Gtd. Notes | | | 7.500 | | | | 11/06/33 | | | | 75 | | | | 81,007 | |
Legacy LifePoint Health LLC, | | | | | | | | | | | | | | | | |
Sr. Sec’d. Notes, 144A | | | 4.375 | | | | 02/15/27 | | | | 97 | | | | 83,928 | |
LifePoint Health, Inc., | | | | | | | | | | | | | | | | |
Gtd. Notes, 144A | | | 5.375 | | | | 01/15/29 | | | | 839 | | | | 575,234 | |
See Notes to Financial Statements.
96
PGIM Active High Yield Bond ETF
Schedule of Investments (continued)
as of August 31, 2023
| | | | | | | | | | | | | | | | |
| Description | | Interest
Rate | | | Maturity
Date | | | Principal
Amount
(000)# | | | Value | |
| | | | |
CORPORATE BONDS (Continued) | | | | | | | | | | | | | | | | |
| | | | |
Healthcare-Services (cont’d.) | | | | | | | | | | | | | | | | |
| | | | |
Prime Healthcare Services, Inc., | | | | | | | | | | | | | | | | |
Sr. Sec’d. Notes, 144A | | | 7.250% | | | | 11/01/25 | | | | 402 | | | $ | 377,215 | |
RegionalCare Hospital Partners Holdings, Inc./LifePoint Health, Inc., | | | | | | | | | | | | | | | | |
Gtd. Notes, 144A | | | 9.750 | | | | 12/01/26 | | | | 200 | | | | 187,082 | |
Tenet Healthcare Corp., | | | | | | | | | | | | | | | | |
Gtd. Notes | | | 6.125 | | | | 10/01/28 | | | | 250 | | | | 240,791 | |
Sr. Sec’d. Notes | | | 4.250 | | | | 06/01/29 | | | | 1,075 | | | | 960,101 | |
Sr. Sec’d. Notes | | | 4.375 | | | | 01/15/30 | | | | 500 | | | | 444,691 | |
Sr. Sec’d. Notes, 144A | | | 6.750 | | | | 05/15/31 | | | | 100 | | | | 99,694 | |
Sr. Unsec’d. Notes | | | 6.875 | | | | 11/15/31 | | | | 250 | | | | 250,745 | |
| | | | | | | | | | | | | | | | |
| | | | |
| | | | | | | | | | | | | | | 4,344,622 | |
| | | | |
Home Builders 3.2% | | | | | | | | | | | | | | | | |
| | | | |
Ashton Woods USA LLC/Ashton Woods Finance Co., | | | | | | | | | | | | | | | | |
Sr. Unsec’d. Notes, 144A | | | 4.625 | | | | 08/01/29 | | | | 100 | | | | 86,658 | |
Sr. Unsec’d. Notes, 144A | | | 4.625 | | | | 04/01/30 | | | | 50 | | | | 43,051 | |
Beazer Homes USA, Inc., | | | | | | | | | | | | | | | | |
Gtd. Notes | | | 5.875 | | | | 10/15/27 | | | | 340 | | | | 320,760 | |
Gtd. Notes | | | 7.250 | | | | 10/15/29 | | | | 373 | | | | 361,647 | |
Brookfield Residential Properties, Inc./Brookfield Residential US LLC (Canada), | | | | | | | | | | | | | | | | |
Gtd. Notes, 144A | | | 4.875 | | | | 02/15/30 | | | | 250 | | | | 206,875 | |
Gtd. Notes, 144A | | | 6.250 | | | | 09/15/27 | | | | 264 | | | | 241,890 | |
Century Communities, Inc., | | | | | | | | | | | | | | | | |
Gtd. Notes | | | 6.750 | | | | 06/01/27 | | | | 25 | | | | 24,932 | |
Gtd. Notes, 144A | | | 3.875 | | | | 08/15/29 | | | | 125 | | | | 107,798 | |
Forestar Group, Inc., | | | | | | | | | | | | | | | | |
Gtd. Notes, 144A | | | 3.850 | | | | 05/15/26 | | | | 100 | | | | 93,261 | |
Gtd. Notes, 144A | | | 5.000 | | | | 03/01/28 | | | | 75 | | | | 69,602 | |
KB Home, | | | | | | | | | | | | | | | | |
Gtd. Notes | | | 4.800 | | | | 11/15/29 | | | | 250 | | | | 225,519 | |
Gtd. Notes | | | 7.250 | | | | 07/15/30 | | | | 90 | | | | 90,497 | |
M/I Homes, Inc., | | | | | | | | | | | | | | | | |
Gtd. Notes | | | 3.950 | | | | 02/15/30 | | | | 150 | | | | 128,061 | |
Gtd. Notes | | | 4.950 | | | | 02/01/28 | | | | 25 | | | | 23,226 | |
Mattamy Group Corp. (Canada), | | | | | | | | | | | | | | | | |
Sr. Unsec’d. Notes, 144A | | | 4.625 | | | | 03/01/30 | | | | 200 | | | | 175,000 | |
Sr. Unsec’d. Notes, 144A | | | 5.250 | | | | 12/15/27 | | | | 386 | | | | 361,392 | |
See Notes to Financial Statements.
PGIM Fixed Income ETFs 97
PGIM Active High Yield Bond ETF
Schedule of Investments (continued)
as of August 31, 2023
| | | | | | | | | | | | | | | | |
| Description | | Interest
Rate | | | Maturity
Date | | | Principal
Amount
(000)# | | | Value | |
| | | | |
CORPORATE BONDS (Continued) | | | | | | | | | | | | | | | | |
| | | | |
Home Builders (cont’d.) | | | | | | | | | | | | | | | | |
| | | | |
Shea Homes LP/Shea Homes Funding Corp., | | | | | | | | | | | | | | | | |
Sr. Unsec’d. Notes | | | 4.750% | | | | 02/15/28 | | | | 279 | | | $ | 256,736 | |
Sr. Unsec’d. Notes | | | 4.750 | | | | 04/01/29 | | | | 74 | | | | 65,879 | |
STL Holding Co. LLC, | | | | | | | | | | | | | | | | |
Sr. Unsec’d. Notes, 144A | | | 7.500 | | | | 02/15/26 | | | | 200 | | | | 187,207 | |
Taylor Morrison Communities, Inc., | | | | | | | | | | | | | | | | |
Gtd. Notes, 144A | | | 5.875 | | | | 06/15/27 | | | | 257 | | | | 252,541 | |
Sr. Unsec’d. Notes, 144A | | | 5.125 | | | | 08/01/30 | | | | 239 | | | | 220,120 | |
Tri Pointe Homes, Inc., | | | | | | | | | | | | | | | | |
Gtd. Notes | | | 5.250 | | | | 06/01/27 | | | | 75 | | | | 71,610 | |
Gtd. Notes | | | 5.700 | | | | 06/15/28 | | | | 15 | | | | 14,216 | |
| | | | | | | | | | | | | | | | |
| | | | |
| | | | | | | | | | | | | | | 3,628,478 | |
| | | | |
Home Furnishings 0.2% | | | | | | | | | | | | | | | | |
| | | | |
Tempur Sealy International, Inc., | | | | | | | | | | | | | | | | |
Gtd. Notes, 144A | | | 4.000 | | | | 04/15/29 | | | | 297 | | | | 255,081 | |
| | | | |
Household Products/Wares 0.4% | | | | | | | | | | | | | | | | |
| | | | |
ACCO Brands Corp., | | | | | | | | | | | | | | | | |
Gtd. Notes, 144A | | | 4.250 | | | | 03/15/29 | | | | 352 | | | | 300,909 | |
Kronos Acquisition Holdings, Inc./KIK Custom Products, Inc. (Canada), | | | | | | | | | | | | | | | | |
Gtd. Notes, 144A | | | 7.000 | | | | 12/31/27 | | | | 205 | | | | 179,887 | |
Sr. Sec’d. Notes, 144A | | | 5.000 | | | | 12/31/26 | | | | 25 | | | | 23,187 | |
| | | | | | | | | | | | | | | | |
| | | | |
| | | | | | | | | | | | | | | 503,983 | |
| | | | |
Housewares 0.7% | | | | | | | | | | | | | | | | |
| | | | |
Scotts Miracle-Gro Co. (The), | | | | | | | | | | | | | | | | |
Gtd. Notes | | | 4.000 | | | | 04/01/31 | | | | 298 | | | | 234,352 | |
Gtd. Notes | | | 4.375 | | | | 02/01/32 | | | | 170 | | | | 134,144 | |
SWF Escrow Issuer Corp., | | | | | | | | | | | | | | | | |
Sr. Unsec’d. Notes, 144A | | | 6.500 | | | | 10/01/29 | | | | 657 | | | | 426,738 | |
| | | | | | | | | | | | | | | | |
| | | | |
| | | | | | | | | | | | | | | 795,234 | |
| | | | |
Insurance 0.1% | | | | | | | | | | | | | | | | |
| | | | |
BroadStreet Partners, Inc., | | | | | | | | | | | | | | | | |
Sr. Unsec’d. Notes, 144A | | | 5.875 | | | | 04/15/29 | | | | 166 | | | | 146,073 | |
See Notes to Financial Statements.
98
PGIM Active High Yield Bond ETF
Schedule of Investments (continued)
as of August 31, 2023
| | | | | | | | | | | | | | | | |
| Description | | Interest
Rate | | | Maturity
Date | | | Principal
Amount
(000)# | | | Value | |
| | | | |
CORPORATE BONDS (Continued) | | | | | | | | | | | | | | | | |
| | | | |
Internet 0.3% | | | | | | | | | | | | | | | | |
| | | | |
Gen Digital, Inc., | | | | | | | | | | | | | | | | |
Sr. Unsec’d. Notes, 144A | | | 5.000 | % | | | 04/15/25 | | | | 140 | | | $ | 137,297 | |
Go Daddy Operating Co. LLC/GD Finance Co., Inc., | | | | | | | | | | | | | | | | |
Gtd. Notes, 144A | | | 3.500 | | | | 03/01/29 | | | | 245 | | | | 210,404 | |
| | | | | | | | | | | | | | | | |
| | | | |
| | | | | | | | | | | | | | | 347,701 | |
| | | | |
Iron/Steel 0.4% | | | | | | | | | | | | | | | | |
| | | | |
ATI, Inc., | | | | | | | | | | | | | | | | |
Sr. Unsec’d. Notes | | | 7.250 | | | | 08/15/30 | | | | 50 | | | | 50,441 | |
Big River Steel LLC/BRS Finance Corp., | | | | | | | | | | | | | | | | |
Sr. Sec’d. Notes, 144A | | | 6.625 | | | | 01/31/29 | | | | 116 | | | | 115,522 | |
Cleveland-Cliffs, Inc., | | | | | | | | | | | | | | | | |
Gtd. Notes, 144A | | | 6.750 | | | | 04/15/30 | | | | 154 | | | | 146,713 | |
Commercial Metals Co., | | | | | | | | | | | | | | | | |
Sr. Unsec’d. Notes | | | 4.375 | | | | 03/15/32 | | | | 100 | | | | 85,743 | |
| | | | | | | | | | | | | | | | |
| | | | |
| | | | | | | | | | | | | | | 398,419 | |
| | | | |
Leisure Time 3.2% | | | | | | | | | | | | | | | | |
| | | | |
Carnival Corp., | | | | | | | | | | | | | | | | |
Gtd. Notes, 144A | | | 5.750 | | | | 03/01/27 | | | | 956 | | | | 899,835 | |
Gtd. Notes, 144A | | | 7.625 | | | | 03/01/26 | | | | 284 | | | | 282,344 | |
Sr. Sec’d. Notes, 144A | | | 7.000 | | | | 08/15/29 | | | | 25 | | | | 25,281 | |
Lindblad Expeditions Holdings, Inc., | | | | | | | | | | | | | | | | |
Sr. Sec’d. Notes, 144A | | | 9.000 | | | | 05/15/28 | | | | 75 | | | | 76,934 | |
NCL Corp. Ltd., | | | | | | | | | | | | | | | | |
Gtd. Notes, 144A | | | 5.875 | | | | 03/15/26 | | | | 463 | | | | 435,229 | |
Sr. Sec’d. Notes, 144A | | | 5.875 | | | | 02/15/27 | | | | 100 | | | | 96,593 | |
Sr. Sec’d. Notes, 144A | | | 8.375 | | | | 02/01/28 | | | | 136 | | | | 139,400 | |
NCL Finance Ltd., | | | | | | | | | | | | | | | | |
Gtd. Notes, 144A | | | 6.125 | | | | 03/15/28 | | | | 205 | | | | 184,244 | |
Royal Caribbean Cruises Ltd., | | | | | | | | | | | | | | | | |
Gtd. Notes, 144A | | | 7.250 | | | | 01/15/30 | | | | 75 | | | | 75,916 | |
Gtd. Notes, 144A | | | 9.250 | | | | 01/15/29 | | | | 175 | | | | 185,976 | |
Sr. Sec’d. Notes, 144A | | | 8.250 | | | | 01/15/29 | | | | 275 | | | | 286,418 | |
Sr. Unsec’d. Notes, 144A | | | 5.375 | | | | 07/15/27 | | | | 155 | | | | 145,365 | |
Sr. Unsec’d. Notes, 144A | | | 5.500 | | | | 08/31/26 | | | | 50 | | | | 47,651 | |
Sr. Unsec’d. Notes, 144A | | | 5.500 | | | | 04/01/28 | | | | 223 | | | | 208,385 | |
Sr. Unsec’d. Notes, 144A | | | 11.625 | | | | 08/15/27 | | | | 175 | | | | 190,206 | |
See Notes to Financial Statements.
PGIM Fixed Income ETFs 99
PGIM Active High Yield Bond ETF
Schedule of Investments (continued)
as of August 31, 2023
| | | | | | | | | | | | | | | | |
| Description | | Interest
Rate | | | Maturity
Date | | | Principal
Amount
(000)# | | | Value | |
| | | | |
CORPORATE BONDS (Continued) | | | | | | | | | | | | | | | | |
| | | | |
Leisure Time (cont’d.) | | | | | | | | | | | | | | | | |
| | | | |
Viking Cruises Ltd., | | | | | | | | | | | | | | | | |
Gtd. Notes, 144A | | | 5.875 | % | | | 09/15/27 | | | | 75 | | | $ | 69,750 | |
Viking Ocean Cruises Ship VII Ltd., | | | | | | | | | | | | | | | | |
Sr. Sec’d. Notes, 144A | | | 5.625 | | | | 02/15/29 | | | | 211 | | | | 195,175 | |
Vista Outdoor, Inc., | | | | | | | | | | | | | | | | |
Gtd. Notes, 144A | | | 4.500 | | | | 03/15/29 | | | | 50 | | | | 41,971 | |
VOC Escrow Ltd., | | | | | | | | | | | | | | | | |
Sr. Sec’d. Notes, 144A | | | 5.000 | | | | 02/15/28 | | | | 75 | | | | 69,555 | |
| | | | | | | | | | | | | | | | |
| | | | |
| | | | | | | | | | | | | | | 3,656,228 | |
| | | | |
Lodging 1.2% | | | | | | | | | | | | | | | | |
| | | | |
Hilton Domestic Operating Co., Inc., | | | | | | | | | | | | | | | | |
Gtd. Notes, 144A | | | 3.625 | | | | 02/15/32 | | | | 280 | | | | 232,443 | |
MGM Resorts International, | | | | | | | | | | | | | | | | |
Gtd. Notes | | | 4.625 | | | | 09/01/26 | | | | 75 | | | | 70,650 | |
Gtd. Notes | | | 4.750 | | | | 10/15/28 | | | | 416 | | | | 377,532 | |
Gtd. Notes | | | 5.500 | | | | 04/15/27 | | | | 311 | | | | 297,400 | |
Wynn Macau Ltd. (Macau), | | | | | | | | | | | | | | | | |
Sr. Unsec’d. Notes, 144A | | | 5.625 | | | | 08/26/28 | | | | 400 | | | | 350,500 | |
| | | | | | | | | | | | | | | | |
| | | | |
| | | | | | | | | | | | | | | 1,328,525 | |
| | | | |
Machinery-Construction & Mining 0.3% | | | | | | | | | | | | | | | | |
| | | | |
Terex Corp., | | | | | | | | | | | | | | | | |
Gtd. Notes, 144A | | | 5.000 | | | | 05/15/29 | | | | 352 | | | | 323,001 | |
| | | | |
Machinery-Diversified 1.2% | | | | | | | | | | | | | | | | |
| | | | |
Chart Industries, Inc., | | | | | | | | | | | | | | | | |
Gtd. Notes, 144A | | | 9.500 | | | | 01/01/31 | | | | 149 | | | | 160,761 | |
Sr. Sec’d. Notes, 144A | | | 7.500 | | | | 01/01/30 | | | | 199 | | | | 204,075 | |
GrafTech Finance, Inc., | | | | | | | | | | | | | | | | |
Sr. Sec’d. Notes, 144A | | | 4.625 | | | | 12/15/28 | | | | 190 | | | | 149,199 | |
Maxim Crane Works Holdings Capital LLC, | | | | | | | | | | | | | | | | |
Sec’d. Notes, 144A | | | 10.125 | | | | 08/01/24 | | | | 382 | | | | 382,697 | |
Sec’d. Notes, 144A | | | 11.500 | | | | 09/01/28 | | | | 175 | | | | 175,512 | |
TK Elevator US Newco, Inc. (Germany), | | | | | | | | | | | | | | | | |
Sr. Sec’d. Notes, 144A | | | 5.250 | | | | 07/15/27 | | | | 250 | | | | 233,281 | |
| | | | | | | | | | | | | | | | |
| | | | |
| | | | | | | | | | | | | | | 1,305,525 | |
See Notes to Financial Statements.
100
PGIM Active High Yield Bond ETF
Schedule of Investments (continued)
as of August 31, 2023
| | | | | | | | | | | | | | | | |
| Description | | Interest
Rate | | | Maturity
Date | | | Principal
Amount
(000)# | | | Value | |
| | | | |
CORPORATE BONDS (Continued) | | | | | | | | | | | | | | | | |
| | | | |
Media 8.1% | | | | | | | | | | | | | | | | |
| | | | |
AMC Networks, Inc., | | | | | | | | | | | | | | | | |
Gtd. Notes | | | 5.000 | % | | | 04/01/24 | | | | 375 | | | $ | 371,261 | |
CCO Holdings LLC/CCO Holdings Capital Corp., | | | | | | | | | | | | | | | | |
Sr. Unsec’d. Notes | | | 4.500 | | | | 05/01/32 | | | | 872 | | | | 706,826 | |
Sr. Unsec’d. Notes, 144A | | | 4.250 | | | | 02/01/31 | | | | 775 | | | | 635,641 | |
Sr. Unsec’d. Notes, 144A | | | 4.250 | | | | 01/15/34 | | | | 618 | | | | 473,240 | |
Sr. Unsec’d. Notes, 144A | | | 4.500 | | | | 06/01/33 | | | | 575 | | | | 454,363 | |
Sr. Unsec’d. Notes, 144A | | | 4.750 | | | | 02/01/32 | | | | 310 | | | | 257,208 | |
Sr. Unsec’d. Notes, 144A | | | 5.000 | | | | 02/01/28 | | | | 50 | | | | 46,079 | |
Sr. Unsec’d. Notes, 144A | | | 5.125 | | | | 05/01/27 | | | | 50 | | | | 47,013 | |
Sr. Unsec’d. Notes, 144A | | | 5.375 | | | | 06/01/29 | | | | 450 | | | | 409,614 | |
Sr. Unsec’d. Notes, 144A | | | 5.500 | | | | 05/01/26 | | | | 150 | | | | 146,149 | |
CSC Holdings LLC, | | | | | | | | | | | | | | | | |
Gtd. Notes, 144A | | | 3.375 | | | | 02/15/31 | | | | 200 | | | | 137,455 | |
Gtd. Notes, 144A | | | 4.125 | | | | 12/01/30 | | | | 200 | | | | 142,602 | |
Gtd. Notes, 144A | | | 4.500 | | | | 11/15/31 | | | | 200 | | | | 142,534 | |
Gtd. Notes, 144A | | | 5.375 | | | | 02/01/28 | | | | 680 | | | | 557,937 | |
Gtd. Notes, 144A | | | 5.500 | | | | 04/15/27 | | | | 200 | | | | 172,636 | |
Sr. Unsec’d. Notes, 144A | | | 5.750 | | | | 01/15/30 | | | | 500 | | | | 276,709 | |
Diamond Sports Group LLC/Diamond Sports Finance Co., | | | | | | | | | | | | | | | | |
Gtd. Notes, 144A (original cost $565,303; purchased 07/18/19 - 06/03/22)(f) | | | 6.625 | | | | 08/15/27(d) | | | | 1,251 | | | | 33,181 | |
Sec’d. Notes, 144A (original cost $507,220; purchased 07/18/19 - 08/30/22)(f) | | | 5.375 | | | | 08/15/26(d) | | | | 1,235 | | | | 36,024 | |
DISH DBS Corp., | | | | | | | | | | | | | | | | |
Gtd. Notes | | | 5.125 | | | | 06/01/29 | | | | 563 | | | | 304,079 | |
Gtd. Notes | | | 7.375 | | | | 07/01/28 | | | | 885 | | | | 553,280 | |
Gtd. Notes | | | 7.750 | | | | 07/01/26 | | | | 317 | | | | 236,866 | |
DISH Network Corp., | | | | | | | | | | | | | | | | |
Sr. Sec’d. Notes, 144A | | | 11.750 | | | | 11/15/27 | | | | 275 | | | | 279,225 | |
Gray Television, Inc., | | | | | | | | | | | | | | | | |
Gtd. Notes, 144A | | | 5.875 | | | | 07/15/26 | | | | 375 | | | | 341,988 | |
Gtd. Notes, 144A | | | 7.000 | | | | 05/15/27 | | | | 87 | | | | 77,984 | |
iHeartCommunications, Inc., | | | | | | | | | | | | | | | | |
Sr. Sec’d. Notes | | | 6.375 | | | | 05/01/26 | | | | 382 | | | | 333,276 | |
News Corp., | | | | | | | | | | | | | | | | |
Sr. Unsec’d. Notes, 144A | | | 3.875 | | | | 05/15/29 | | | | 25 | | | | 21,964 | |
Nexstar Media, Inc., | | | | | | | | | | | | | | | | |
Gtd. Notes, 144A | | | 4.750 | | | | 11/01/28 | | | | 41 | | | | 35,959 | |
See Notes to Financial Statements.
PGIM Fixed Income ETFs 101
PGIM Active High Yield Bond ETF
Schedule of Investments (continued)
as of August 31, 2023
| | | | | | | | | | | | | | | | |
| Description | | Interest
Rate | | | Maturity
Date | | | Principal
Amount
(000)# | | | Value | |
| | | | |
CORPORATE BONDS (Continued) | | | | | | | | | | | | | | | | |
| | | | |
Media (cont’d.) | | | | | | | | | | | | | | | | |
| | | | |
Nexstar Media, Inc., (cont’d.) | | | | | | | | | | | | | | | | |
Gtd. Notes, 144A | | | 5.625% | | | | 07/15/27 | | | | 175 | | | $ | 164,523 | |
Radiate Holdco LLC/Radiate Finance, Inc., | | | | | | | | | | | | | | | | |
Sr. Sec’d. Notes, 144A | | | 4.500 | | | | 09/15/26 | | | | 233 | | | | 181,491 | |
Sr. Unsec’d. Notes, 144A | | | 6.500 | | | | 09/15/28 | | | | 798 | | | | 434,416 | |
Sinclair Television Group, Inc., | | | | | | | | | | | | | | | | |
Gtd. Notes, 144A | | | 5.125 | | | | 02/15/27 | | | | 325 | | | | 266,762 | |
Univision Communications, Inc., | | | | | | | | | | | | | | | | |
Sr. Sec’d. Notes, 144A | | | 4.500 | | | | 05/01/29 | | | | 186 | | | | 160,122 | |
Sr. Sec’d. Notes, 144A | | | 5.125 | | | | 02/15/25 | | | | 151 | | | | 148,927 | |
Sr. Sec’d. Notes, 144A | | | 6.625 | | | | 06/01/27 | | | | 427 | | | | 413,409 | |
VZ Secured Financing BV (Netherlands), | | | | | | | | | | | | | | | | |
Sr. Sec’d. Notes, 144A | | | 5.000 | | | | 01/15/32 | | | | 250 | | | | 202,500 | |
| | | | | | | | | | | | | | | | |
| | | | |
| | | | | | | | | | | | | | | 9,203,243 | |
| | | | |
Mining 1.3% | | | | | | | | | | | | | | | | |
| | | | |
Arsenal AIC Parent LLC, | | | | | | | | | | | | | | | | |
Sr. Sec’d. Notes, 144A | | | 8.000 | | | | 10/01/30 | | | | 50 | | | | 51,051 | |
Eldorado Gold Corp. (Turkey), | | | | | | | | | | | | | | | | |
Sr. Unsec’d. Notes, 144A | | | 6.250 | | | | 09/01/29 | | | | 260 | | | | 221,634 | |
First Quantum Minerals Ltd. (Zambia), | | | | | | | | | | | | | | | | |
Gtd. Notes, 144A | | | 6.875 | | | | 10/15/27 | | | | 200 | | | | 193,266 | |
Gtd. Notes, 144A | | | 8.625 | | | | 06/01/31 | | | | 200 | | | | 203,058 | |
Hecla Mining Co., | | | | | | | | | | | | | | | | |
Gtd. Notes | | | 7.250 | | | | 02/15/28 | | | | 75 | | | | 73,529 | |
Hudbay Minerals, Inc. (Canada), | | | | | | | | | | | | | | | | |
Gtd. Notes, 144A | | | 4.500 | | | | 04/01/26 | | | | 113 | | | | 106,503 | |
Gtd. Notes, 144A | | | 6.125 | | | | 04/01/29 | | | | 341 | | | | 320,540 | |
New Gold, Inc. (Canada), | | | | | | | | | | | | | | | | |
Gtd. Notes, 144A | | | 7.500 | | | | 07/15/27 | | | | 255 | | | | 242,857 | |
Novelis Corp., | | | | | | | | | | | | | | | | |
Gtd. Notes, 144A | | | 3.875 | | | | 08/15/31 | | | | 100 | | | | 82,992 | |
| | | | | | | | | | | | | | | | |
| | | | |
| | | | | | | | | | | | | | | 1,495,430 | |
See Notes to Financial Statements.
102
PGIM Active High Yield Bond ETF
Schedule of Investments (continued)
as of August 31, 2023
| | | | | | | | | | | | | | | | |
| Description | | Interest
Rate | | | Maturity
Date | | | Principal
Amount
(000)# | | | Value | |
| | | | |
CORPORATE BONDS (Continued) | | | | | | | | | | | | | | | | |
| | | | |
Miscellaneous Manufacturing 0.4% | | | | | | | | | | | | | | | | |
| | | | |
Amsted Industries, Inc., | | | | | | | | | | | | | | | | |
Sr. Unsec’d. Notes, 144A | | | 4.625% | | | | 05/15/30 | | | | 337 | | | $ | 297,075 | |
Trinity Industries, Inc., | | | | | | | | | | | | | | | | |
Gtd. Notes, 144A | | | 7.750 | | | | 07/15/28 | | | | 100 | | | | 102,034 | |
| | | | | | | | | | | | | | | | |
| | | | |
| | | | | | | | | | | | | | | 399,109 | |
| | | | |
Oil & Gas 6.8% | | | | | | | | | | | | | | | | |
| | | | |
Aethon United BR LP/Aethon United Finance Corp., | | | | | | | | | | | | | | | | |
Sr. Unsec’d. Notes, 144A | | | 8.250 | | | | 02/15/26 | | | | 100 | | | | 100,473 | |
Alta Mesa Holdings LP/Alta Mesa Finance Services Corp., | | | | | | | | | | | | | | | | |
Gtd. Notes | | | 7.875 | | | | 12/15/24(d) | | | | 310 | | | | 31 | |
Antero Resources Corp., | | | | | | | | | | | | | | | | |
Gtd. Notes, 144A | | | 5.375 | | | | 03/01/30 | | | | 444 | | | | 415,559 | |
Ascent Resources Utica Holdings LLC/ARU Finance Corp., | | | | | | | | | | | | | | | | |
Gtd. Notes, 144A | | | 7.000 | | | | 11/01/26 | | | | 342 | | | | 340,018 | |
Gtd. Notes, 144A | | | 9.000 | | | | 11/01/27 | | | | 112 | | | | 140,854 | |
Sr. Unsec’d. Notes, 144A | | | 8.250 | | | | 12/31/28 | | | | 27 | | | | 27,030 | |
Athabasca Oil Corp. (Canada), | | | | | | | | | | | | | | | | |
Sec’d. Notes, 144A | | | 9.750 | | | | 11/01/26 | | | | 241 | | | | 249,134 | |
Chesapeake Energy Corp., | | | | | | | | | | | | | | | | |
Gtd. Notes, 144A | | | 5.875 | | | | 02/01/29 | | | | 581 | | | | 556,780 | |
Gtd. Notes, 144A | | | 6.750 | | | | 04/15/29 | | | | 68 | | | | 67,528 | |
CITGO Petroleum Corp., | | | | | | | | | | | | | | | | |
Sr. Sec’d. Notes, 144A | | | 7.000 | | | | 06/15/25 | | | | 377 | | | | 373,419 | |
Civitas Resources, Inc., | | | | | | | | | | | | | | | | |
Gtd. Notes, 144A | | | 8.375 | | | | 07/01/28 | | | | 100 | | | | 102,991 | |
CNX Resources Corp., | | | | | | | | | | | | | | | | |
Gtd. Notes, 144A | | | 7.250 | | | | 03/14/27 | | | | 432 | | | | 431,547 | |
Comstock Resources, Inc., | | | | | | | | | | | | | | | | |
Gtd. Notes, 144A | | | 5.875 | | | | 01/15/30 | | | | 137 | | | | 121,011 | |
Gtd. Notes, 144A | | | 6.750 | | | | 03/01/29 | | | | 125 | | | | 116,828 | |
Crescent Energy Finance LLC, | | | | | | | | | | | | | | | | |
Gtd. Notes, 144A | | | 9.250 | | | | 02/15/28 | | | | 194 | | | | 198,376 | |
CrownRock LP/CrownRock Finance, Inc., | | | | | | | | | | | | | | | | |
Sr. Unsec’d. Notes, 144A | | | 5.000 | | | | 05/01/29 | | | | 25 | | | | 23,194 | |
Sr. Unsec’d. Notes, 144A | | | 5.625 | | | | 10/15/25 | | | | 25 | | | | 24,600 | |
See Notes to Financial Statements.
PGIM Fixed Income ETFs 103
PGIM Active High Yield Bond ETF
Schedule of Investments (continued)
as of August 31, 2023
| | | | | | | | | | | | |
| | | | |
| Description | | Interest
Rate | | Maturity
Date | | Principal
Amount (000)# | | | Value | |
| | | | |
CORPORATE BONDS (Continued) | | | | | | | | | | | | |
| | | | |
Oil & Gas (cont’d.) | | | | | | | | | | | | |
Endeavor Energy Resources LP/EER Finance, Inc., | | | | | | | | | | | | |
Sr. Unsec’d. Notes, 144A | | 5.750% | | 01/30/28 | | | 287 | | | $ | 280,831 | |
Hilcorp Energy I LP/Hilcorp Finance Co., | | | | | | | | | | | | |
Sr. Unsec’d. Notes, 144A | | 5.750 | | 02/01/29 | | | 138 | | | | 129,227 | |
Sr. Unsec’d. Notes, 144A | | 6.000 | | 04/15/30 | | | 300 | | | | 278,947 | |
Sr. Unsec’d. Notes, 144A | | 6.000 | | 02/01/31 | | | 425 | | | | 390,985 | |
Sr. Unsec’d. Notes, 144A | | 6.250 | | 11/01/28 | | | 154 | | | | 148,032 | |
Sr. Unsec’d. Notes, 144A | | 6.250 | | 04/15/32 | | | 100 | | | | 91,930 | |
MEG Energy Corp. (Canada), | | | | | | | | | | | | |
Gtd. Notes, 144A | | 5.875 | | 02/01/29 | | | 250 | | | | 238,977 | |
Nabors Industries Ltd., | | | | | | | | | | | | |
Gtd. Notes, 144A | | 7.250 | | 01/15/26 | | | 125 | | | | 119,844 | |
Gtd. Notes, 144A | | 7.500 | | 01/15/28 | | | 325 | | | | 298,880 | |
Nabors Industries, Inc., | | | | | | | | | | | | |
Gtd. Notes | | 5.750 | | 02/01/25 | | | 275 | | | | 269,749 | |
Noble Finance II LLC, | | | | | | | | | | | | |
Gtd. Notes, 144A | | 8.000 | | 04/15/30 | | | 25 | | | | 25,848 | |
Parkland Corp. (Canada), | | | | | | | | | | | | |
Gtd. Notes, 144A | | 4.500 | | 10/01/29 | | | 361 | | | | 317,680 | |
Gtd. Notes, 144A | | 4.625 | | 05/01/30 | | | 200 | | | | 175,750 | |
Precision Drilling Corp. (Canada), | | | | | | | | | | | | |
Gtd. Notes, 144A | | 6.875 | | 01/15/29 | | | 49 | | | | 46,795 | |
Gtd. Notes, 144A | | 7.125 | | 01/15/26 | | | 50 | | | | 49,431 | |
Range Resources Corp., | | | | | | | | | | | | |
Gtd. Notes | | 4.875 | | 05/15/25 | | | 100 | | | | 97,515 | |
Gtd. Notes, 144A | | 4.750 | | 02/15/30 | | | 120 | | | | 108,391 | |
Southwestern Energy Co., | | | | | | | | | | | | |
Gtd. Notes | | 4.750 | | 02/01/32 | | | 762 | | | | 674,611 | |
Gtd. Notes | | 5.375 | | 02/01/29 | | | 25 | | | | 23,701 | |
Gtd. Notes | | 5.375 | | 03/15/30 | | | 125 | | | | 117,010 | |
Sunoco LP/Sunoco Finance Corp., | | | | | | | | | | | | |
Gtd. Notes | | 4.500 | | 05/15/29 | | | 200 | | | | 181,032 | |
Gtd. Notes | | 4.500 | | 04/30/30 | | | 127 | | | | 113,315 | |
Gtd. Notes | | 5.875 | | 03/15/28 | | | 170 | | | | 165,516 | |
Transocean, Inc., | | | | | | | | | | | | |
Gtd. Notes, 144A | | 7.250 | | 11/01/25 | | | 60 | | | | 59,025 | |
Valaris Ltd., | | | | | | | | | | | | |
Sec’d. Notes, 144A | | 8.375 | | 04/30/30 | | | 50 | | | | 50,927 | |
| | | | | | | | | | | | |
| | | | |
| | | | | | | | | | | 7,743,322 | |
See Notes to Financial Statements.
104
PGIM Active High Yield Bond ETF
Schedule of Investments (continued)
as of August 31, 2023
| | | | | | | | | | | | |
| | | | |
| Description | | Interest
Rate | | Maturity
Date | | Principal Amount (000)# | | | Value | |
| | | | |
CORPORATE BONDS (Continued) | | | | | | | | | | | | |
| | | | |
Packaging & Containers 1.9% | | | | | | | | | | | | |
ARD Finance SA (Luxembourg), | | | | | | | | | | | | |
Sr. Sec’d. Notes, 144A, Cash coupon 6.500% or PIK 7.250% | | 6.500% | | 06/30/27 | | | 200 | | | $ | 160,000 | |
Ardagh Metal Packaging Finance USA LLC/Ardagh Metal Packaging Finance PLC, | | | | | | | | | | | | |
Sr. Unsec’d. Notes, 144A | | 4.000 | | 09/01/29 | | | 200 | | | | 161,850 | |
Graham Packaging Co., Inc., | | | | | | | | | | | | |
Gtd. Notes, 144A | | 7.125 | | 08/15/28 | | | 85 | | | | 74,722 | |
Intelligent Packaging Holdco Issuer LP (Canada), | | | | | | | | | | | | |
Sr. Unsec’d. Notes, 144A, Cash coupon 9.000% or PIK 9.750% | | 9.000 | | 01/15/26 | | | 75 | | | | 61,125 | |
Intelligent Packaging Ltd. Finco, Inc./Intelligent Packaging Ltd. Co-Issuer LLC (Canada), | | | | | | | | | | | | |
Sr. Sec’d. Notes, 144A | | 6.000 | | 09/15/28 | | | 377 | | | | 339,300 | |
LABL, Inc., | | | | | | | | | | | | |
Sr. Sec’d. Notes, 144A | | 5.875 | | 11/01/28 | | | 175 | | | | 159,357 | |
Sr. Sec’d. Notes, 144A | | 9.500 | | 11/01/28 | | | 50 | | | | 51,549 | |
Sr. Unsec’d. Notes, 144A | | 8.250 | | 11/01/29 | | | 185 | | | | 155,045 | |
Sr. Unsec’d. Notes, 144A | | 10.500 | | 07/15/27 | | | 206 | | | | 196,680 | |
Mauser Packaging Solutions Holding Co., | | | | | | | | | | | | |
Sr. Sec’d. Notes, 144A | | 7.875 | | 08/15/26 | | | 100 | | | | 98,524 | |
OI European Group BV, | | | | | | | | | | | | |
Gtd. Notes, 144A | | 4.750 | | 02/15/30 | | | 50 | | | | 45,467 | |
Owens-Brockway Glass Container, Inc., | | | | | | | | | | | | |
Gtd. Notes, 144A | | 6.375 | | 08/15/25 | | | 60 | | | | 59,999 | |
Gtd. Notes, 144A | | 6.625 | | 05/13/27 | | | 25 | | | | 24,735 | |
Gtd. Notes, 144A | | 7.250 | | 05/15/31 | | | 100 | | | | 100,922 | |
Pactiv Evergreen Group Issuer LLC/Pactiv Evergreen Group Issuer, Inc., | | | | | | | | | | | | |
Sr. Sec’d. Notes, 144A | | 4.375 | | 10/15/28 | | | 50 | | | | 44,614 | |
Sealed Air Corp./Sealed Air Corp. US, | | | | | | | | | | | | |
Gtd. Notes, 144A | | 6.125 | | 02/01/28 | | | 25 | | | | 24,624 | |
Trident TPI Holdings, Inc., | | | | | | | | | | | | |
Gtd. Notes, 144A | | 12.750 | | 12/31/28 | | | 306 | | | | 319,074 | |
TriMas Corp., | | | | | | | | | | | | |
Gtd. Notes, 144A | | 4.125 | | 04/15/29 | | | 50 | | | | 43,670 | |
| | | | | | | | | | | | |
| | | | |
| | | | | | | | | | | 2,121,257 | |
See Notes to Financial Statements.
PGIM Fixed Income ETFs 105
PGIM Active High Yield Bond ETF
Schedule of Investments (continued)
as of August 31, 2023
| | | | | | | | | | | | |
| | | | |
| Description | | Interest
Rate | | Maturity
Date | | Principal
Amount (000)# | | | Value | |
| | | | |
CORPORATE BONDS (Continued) | | | | | | | | | | | | |
| | | | |
Pharmaceuticals 1.9% | | | | | | | | | | | | |
AdaptHealth LLC, | | | | | | | | | | | | |
Gtd. Notes, 144A | | 4.625% | | 08/01/29 | | | 195 | | | $ | 159,375 | |
Gtd. Notes, 144A | | 5.125 | | 03/01/30 | | | 299 | | | | 247,911 | |
Gtd. Notes, 144A | | 6.125 | | 08/01/28 | | | 181 | | | | 163,790 | |
Bausch Health Americas, Inc., | | | | | | | | | | | | |
Gtd. Notes, 144A | | 8.500 | | 01/31/27 | | | 400 | | | | 222,500 | |
Bausch Health Cos., Inc., | | | | | | | | | | | | |
Gtd. Notes, 144A | | 6.250 | | 02/15/29 | | | 1,465 | | | | 640,937 | |
Sr. Sec’d. Notes, 144A | | 4.875 | | 06/01/28 | | | 50 | | | | 29,625 | |
Organon & Co./Organon Foreign Debt Co-Issuer BV, | | | | | | | | | | | | |
Sr. Unsec’d. Notes, 144A | | 5.125 | | 04/30/31 | | | 600 | | | | 510,666 | |
P&L Development LLC/PLD Finance Corp., | | | | | | | | | | | | |
Sr. Sec’d. Notes, 144A | | 7.750 | | 11/15/25 | | | 210 | | | | 181,476 | |
| | | | | | | | | | | | |
| | | | |
| | | | | | | | | | | 2,156,280 | |
| | | | |
Pipelines 2.7% | | | | | | | | | | | | |
Antero Midstream Partners LP/Antero Midstream Finance Corp., | | | | | | | | | | | | |
Gtd. Notes, 144A | | 5.375 | | 06/15/29 | | | 75 | | | | 70,309 | |
Gtd. Notes, 144A | | 5.750 | | 03/01/27 | | | 285 | | | | 276,023 | |
Gtd. Notes, 144A | | 5.750 | | 01/15/28 | | | 157 | | | | 150,291 | |
Gtd. Notes, 144A | | 7.875 | | 05/15/26 | | | 172 | | | | 174,913 | |
Cheniere Energy Partners LP, | | | | | | | | | | | | |
Gtd. Notes | | 4.000 | | 03/01/31 | | | 150 | | | | 132,262 | |
Gtd. Notes | | 4.500 | | 10/01/29 | | | 25 | | | | 23,081 | |
Cheniere Energy, Inc., | | | | | | | | | | | | |
Sr. Sec’d. Notes | | 4.625 | | 10/15/28 | | | 300 | | | | 282,505 | |
CNX Midstream Partners LP, | | | | | | | | | | | | |
Gtd. Notes, 144A | | 4.750 | | 04/15/30 | | | 25 | | | | 21,599 | |
DCP Midstream Operating LP, | | | | | | | | | | | | |
Gtd. Notes | | 5.625 | | 07/15/27 | | | 20 | | | | 20,020 | |
Energy Transfer LP, | | | | | | | | | | | | |
Jr. Sub. Notes, Series G | | 7.125(ff) | | 05/15/30(oo) | | | 50 | | | | 44,319 | |
EQM Midstream Partners LP, | | | | | | | | | | | | |
Sr. Unsec’d. Notes | | 5.500 | | 07/15/28 | | | 25 | | | | 23,868 | |
Sr. Unsec’d. Notes, 144A | | 6.000 | | 07/01/25 | | | 87 | | | | 86,182 | |
Sr. Unsec’d. Notes, 144A | | 6.500 | | 07/01/27 | | | 45 | | | | 44,678 | |
Sr. Unsec’d. Notes, 144A | | 7.500 | | 06/01/27 | | | 177 | | | | 178,593 | |
Sr. Unsec’d. Notes, 144A | | 7.500 | | 06/01/30 | | | 125 | | | | 128,157 | |
See Notes to Financial Statements.
106
PGIM Active High Yield Bond ETF
Schedule of Investments (continued)
as of August 31, 2023
| | | | | | | | | | | | |
| | | | |
| Description | | Interest
Rate | | Maturity Date | | Principal Amount (000)# | | | Value | |
| | | | |
CORPORATE BONDS (Continued) | | | | | | | | | | | | |
| | | | |
Pipelines (cont’d.) | | | | | | | | | | | | |
Global Partners LP/GLP Finance Corp., | | | | | | | | | | | | |
Gtd. Notes | | 6.875% | | 01/15/29 | | | 185 | | | $ | 175,483 | |
Howard Midstream Energy Partners LLC, | | | | | | | | | | | | |
Sr. Unsec’d. Notes, 144A | | 8.875 | | 07/15/28 | | | 50 | | | | 51,667 | |
Rockies Express Pipeline LLC, | | | | | | | | | | | | |
Sr. Unsec’d. Notes, 144A | | 6.875 | | 04/15/40 | | | 75 | | | | 67,847 | |
Sr. Unsec’d. Notes, 144A | | 7.500 | | 07/15/38 | | | 186 | | | | 175,769 | |
Tallgrass Energy Partners LP/Tallgrass Energy Finance Corp., | | | | | | | | | | | | |
Gtd. Notes, 144A | | 5.500 | | 01/15/28 | | | 167 | | | | 155,081 | |
Gtd. Notes, 144A | | 6.000 | | 03/01/27 | | | 166 | | | | 159,144 | |
Gtd. Notes, 144A | | 6.000 | | 12/31/30 | | | 140 | | | | 125,844 | |
Gtd. Notes, 144A | | 6.000 | | 09/01/31 | | | 50 | | | | 44,377 | |
Gtd. Notes, 144A | | 7.500 | | 10/01/25 | | | 100 | | | | 100,407 | |
Venture Global Calcasieu Pass LLC, | | | | | | | | | | | | |
Sr. Sec’d. Notes, 144A | | 3.875 | | 08/15/29 | | | 265 | | | | 229,451 | |
Sr. Sec’d. Notes, 144A | | 4.125 | | 08/15/31 | | | 92 | | | | 78,153 | |
Sr. Sec’d. Notes, 144A | | 6.250 | | 01/15/30 | | | 74 | | | | 72,144 | |
Western Midstream Operating LP, | | | | | | | | | | | | |
Sr. Unsec’d. Notes | | 3.950 | | 06/01/25 | | | 25 | | | | 24,139 | |
| | | | | | | | | | | | |
| | | | |
| | | | | | | | | | | 3,116,306 | |
| | | | |
Real Estate 1.2% | | | | | | | | | | | | |
Five Point Operating Co. LP/Five Point Capital Corp., | | | | | | | | | | | | |
Gtd. Notes, 144A | | 7.875 | | 11/15/25 | | | 356 | | | | 333,248 | |
Greystar Real Estate Partners LLC, | | | | | | | | | | | | |
Sr. Sec’d. Notes, 144A | | 7.750 | | 09/01/30 | | | 50 | | | | 50,493 | |
Howard Hughes Corp. (The), | | | | | | | | | | | | |
Gtd. Notes, 144A | | 4.125 | | 02/01/29 | | | 150 | | | | 123,156 | |
Gtd. Notes, 144A | | 4.375 | | 02/01/31 | | | 250 | | | | 199,336 | |
Gtd. Notes, 144A | | 5.375 | | 08/01/28 | | | 216 | | | | 195,035 | |
Hunt Cos., Inc., | | | | | | | | | | | | |
Sr. Sec’d. Notes, 144A | | 5.250 | | 04/15/29 | | | 444 | | | | 340,250 | |
Realogy Group LLC/Realogy Co-Issuer Corp., | | | | | | | | | | | | |
Gtd. Notes, 144A | | 5.250 | | 04/15/30 | | | 175 | | | | 122,222 | |
Gtd. Notes, 144A | | 5.750 | | 01/15/29 | | | 50 | | | | 35,804 | |
| | | | | | | | | | | | |
| | | | |
| | | | | | | | | | | 1,399,544 | |
See Notes to Financial Statements.
PGIM Fixed Income ETFs 107
PGIM Active High Yield Bond ETF
Schedule of Investments (continued)
as of August 31, 2023
| | | | | | | | | | | | |
| | | | |
| Description | | Interest
Rate | | Maturity
Date | | Principal Amount (000)# | | | Value | |
| | | | |
CORPORATE BONDS (Continued) | | | | | | | | | | | | |
| | | | |
Real Estate Investment Trusts (REITs) 1.2% | | | | | | | | | | | | |
Diversified Healthcare Trust, | | | | | | | | | | | | |
Gtd. Notes | | 4.375% | | 03/01/31 | | | 225 | | | $ | 169,796 | |
Gtd. Notes | | 9.750 | | 06/15/25 | | | 195 | | | | 191,881 | |
Sr. Unsec’d. Notes | | 4.750 | | 05/01/24 | | | 224 | | | | 212,476 | |
Sr. Unsec’d. Notes | | 4.750 | | 02/15/28 | | | 225 | | | | 172,033 | |
MPT Operating Partnership LP/MPT Finance Corp., | | | | | | | | | | | | |
Gtd. Notes | | 3.500 | | 03/15/31 | | | 206 | | | | 133,480 | |
Gtd. Notes | | 4.625 | | 08/01/29 | | | 125 | | | | 90,342 | |
Gtd. Notes | | 5.000 | | 10/15/27 | | | 113 | | | | 89,365 | |
Park Intermediate Holdings LLC/PK Domestic Property LLC/PK Finance Co-Issuer, | | | | | | | | | | | | |
Sr. Sec’d. Notes, 144A | | 7.500 | | 06/01/25 | | | 281 | | | | 282,058 | |
RHP Hotel Properties LP/RHP Finance Corp., | | | | | | | | | | | | |
Gtd. Notes, 144A | | 4.500 | | 02/15/29 | | | 61 | | | | 53,549 | |
| | | | | | | | | | | | |
| | | | |
| | | | | | | | | | | 1,394,980 | |
| | | | |
Retail 4.8% | | | | | | | | | | | | |
1011778 BC ULC/New Red Finance, Inc. (Canada), | | | | | | | | | | | | |
Sec’d. Notes, 144A | | 4.000 | | 10/15/30 | | | 280 | | | | 235,715 | |
Sec’d. Notes, 144A | | 4.375 | | 01/15/28 | | | 100 | | | | 91,741 | |
Sr. Sec’d. Notes, 144A | | 3.875 | | 01/15/28 | | | 300 | | | | 270,750 | |
Arko Corp., | | | | | | | | | | | | |
Gtd. Notes, 144A | | 5.125 | | 11/15/29 | | | 75 | | | | 61,644 | |
At Home Group, Inc., | | | | | | | | | | | | |
Gtd. Notes, 144A | | 7.125 | | 07/15/29 | | | 126 | | | | 63,437 | |
Sr. Sec’d. Notes, 144A | | 4.875 | | 07/15/28 | | | 50 | | | | 23,898 | |
BCPE Ulysses Intermediate, Inc., | | | | | | | | | | | | |
Sr. Unsec’d. Notes, 144A, Cash coupon 7.750% or PIK 8.500% | | 7.750 | | 04/01/27 | | | 50 | | | | 46,352 | |
Beacon Roofing Supply, Inc., | | | | | | | | | | | | |
Sr. Sec’d. Notes, 144A | | 6.500 | | 08/01/30 | | | 50 | | | | 49,435 | |
Brinker International, Inc., | | | | | | | | | | | | |
Gtd. Notes, 144A | | 8.250 | | 07/15/30 | | | 275 | | | | 270,185 | |
Carrols Restaurant Group, Inc., | | | | | | | | | | | | |
Gtd. Notes, 144A | | 5.875 | | 07/01/29 | | | 140 | | | | 120,221 | |
eG Global Finance PLC (United Kingdom), | | | | | | | | | | | | |
Sr. Sec’d. Notes, 144A | | 6.750 | | 02/07/25 | | | 400 | | | | 393,000 | |
Sr. Sec’d. Notes, 144A | | 8.500 | | 10/30/25 | | | 200 | | | | 198,000 | |
See Notes to Financial Statements.
108
PGIM Active High Yield Bond ETF
Schedule of Investments (continued)
as of August 31, 2023
| | | | | | | | | | | | |
| | | | |
| Description | | Interest
Rate | | Maturity
Date | | Principal Amount (000)# | | | Value | |
| | | | |
CORPORATE BONDS (Continued) | | | | | | | | | | | | |
| | | | |
Retail (cont’d.) | | | | | | | | | | | | |
Ferrellgas LP/Ferrellgas Finance Corp., | | | | | | | | | | | | |
Sr. Unsec’d. Notes, 144A (original cost $ 23,188; purchased 08/04/22)(f) | | 5.375% | | 04/01/26 | | | 25 | | | $ | 23,527 | |
Sr. Unsec’d. Notes, 144A (original cost $ 66,625; purchased 08/02/22 - 08/15/22)(f) | | 5.875 | | 04/01/29 | | | 75 | | | | 66,175 | |
Fertitta Entertainment LLC/Fertitta Entertainment Finance Co., Inc., | | | | | | | | | | | | |
Gtd. Notes, 144A | | 6.750 | | 01/15/30 | | | 459 | | | | 379,200 | |
Sr. Sec’d. Notes, 144A | | 4.625 | | 01/15/29 | | | 244 | | | | 211,154 | |
Foundation Building Materials, Inc., | | | | | | | | | | | | |
Gtd. Notes, 144A | | 6.000 | | 03/01/29 | | | 200 | | | | 169,504 | |
Gap, Inc. (The), | | | | | | | | | | | | |
Gtd. Notes, 144A | | 3.625 | | 10/01/29 | | | 235 | | | | 178,809 | |
Gtd. Notes, 144A | | 3.875 | | 10/01/31 | | | 325 | | | | 235,558 | |
LBM Acquisition LLC, | | | | | | | | | | | | |
Gtd. Notes, 144A | | 6.250 | | 01/15/29 | | | 266 | | | | 234,159 | |
LCM Investments Holdings II LLC, | | | | | | | | | | | | |
Sr. Unsec’d. Notes, 144A | | 4.875 | | 05/01/29 | | | 305 | | | | 264,999 | |
Sr. Unsec’d. Notes, 144A | | 8.250 | | 08/01/31 | | | 99 | | | | 99,143 | |
Park River Holdings, Inc., | | | | | | | | | | | | |
Gtd. Notes, 144A | | 5.625 | | 02/01/29 | | | 150 | | | | 117,403 | |
Sr. Unsec’d. Notes, 144A | | 6.750 | | 08/01/29 | | | 144 | | | | 116,267 | |
Patrick Industries, Inc., | | | | | | | | | | | | |
Gtd. Notes, 144A | | 4.750 | | 05/01/29 | | | 75 | | | | 64,210 | |
Gtd. Notes, 144A | | 7.500 | | 10/15/27 | | | 75 | | | | 73,244 | |
SRS Distribution, Inc., | | | | | | | | | | | | |
Gtd. Notes, 144A | | 6.000 | | 12/01/29 | | | 265 | | | | 228,054 | |
Suburban Propane Partners LP/Suburban Energy Finance Corp., | | | | | | | | | | | | |
Sr. Unsec’d. Notes | | 5.875 | | 03/01/27 | | | 181 | | | | 177,968 | |
Sr. Unsec’d. Notes, 144A | | 5.000 | | 06/01/31 | | | 472 | | | | 405,875 | |
Superior Plus LP/Superior General Partner, Inc. (Canada), | | | | | | | | | | | | |
Gtd. Notes, 144A | | 4.500 | | 03/15/29 | | | 444 | | | | 388,931 | |
White Cap Buyer LLC, | | | | | | | | | | | | |
Sr. Unsec’d. Notes, 144A | | 6.875 | | 10/15/28 | | | 250 | | | | 228,890 | |
| | | | | | | | | | | | |
| | | | |
| | | | | | | | | | | 5,487,448 | |
See Notes to Financial Statements.
PGIM Fixed Income ETFs 109
PGIM Active High Yield Bond ETF
Schedule of Investments (continued)
as of August 31, 2023
| | | | | | | | | | | | |
| | | | |
| Description | | Interest
Rate | | Maturity
Date | | Principal
Amount (000)# | | | Value | |
| | | | |
CORPORATE BONDS (Continued) | | | | | | | | | | | | |
| | | | |
Software 0.7% | | | | | | | | | | | | |
Black Knight InfoServ LLC, | | | | | | | | | | | | |
Gtd. Notes, 144A | | 3.625% | | 09/01/28 | | | 528 | | | $ | 487,123 | |
Boxer Parent Co., Inc., | | | | | | | | | | | | |
Sr. Sec’d. Notes, 144A | | 7.125 | | 10/02/25 | | | 50 | | | | 50,051 | |
Camelot Finance SA, | | | | | | | | | | | | |
Sr. Sec’d. Notes, 144A | | 4.500 | | 11/01/26 | | | 150 | | | | 140,813 | |
Clarivate Science Holdings Corp., | | | | | | | | | | | | |
Gtd. Notes, 144A | | 4.875 | | 07/01/29 | | | 160 | | | | 139,084 | |
| | | | | | | | | | | | |
| | | | |
| | | | | | | | | | | 817,071 | |
| | | | |
Telecommunications 3.1% | | | | | | | | | | | | |
Altice France SA (France), | | | | | | | | | | | | |
Sr. Sec’d. Notes, 144A | | 8.125 | | 02/01/27 | | | 600 | | | | 507,060 | |
Digicel Group Holdings Ltd. (Jamaica), | | | | | | | | | | | | |
Sr. Unsec’d. Notes, 144A, Cash coupon 5.000% and PIK 3.000% (original cost $142,656; purchased 01/04/22 - 10/03/22)(f) | | 8.000 | | 04/01/25(d) | | | 153 | | | | 35,111 | |
Digicel International Finance Ltd./Digicel International Holdings Ltd. (Jamaica), | | | | | | | | | | | | |
Gtd. Notes, 144A (original cost $192,000; purchased 10/13/21)(f) | | 8.000 | | 12/31/26(d) | | | 200 | | | | 9,750 | |
Gtd. Notes, 144A, Cash coupon 6.000% and PIK 7.000% (original cost $237,438; purchased 10/28/22 - 03/17/23)(f) | | 13.000 | | 12/31/25(d) | | | 372 | | | | 263,491 | |
Sr. Sec’d. Notes, 144A (original cost $254,375; purchased 11/09/20)(f) | | 8.750 | | 05/25/24 | | | 250 | | | | 227,173 | |
Digicel Ltd. (Jamaica), | | | | | | | | | | | | |
Gtd. Notes, 144A (original cost $417,938; purchased 07/09/21 - 10/25/22)(f) | | 6.750 | | 12/31/23(d) | | | 525 | | | | 25,594 | |
Iliad Holding SASU (France), | | | | | | | | | | | | |
Sr. Sec’d. Notes, 144A | | 7.000 | | 10/15/28 | | | 400 | | | | 371,000 | |
Intelsat Jackson Holdings SA (Luxembourg), | | | | | | | | | | | | |
Gtd. Notes^ | | 5.500 | | 08/01/23(d) | | | 490 | | | | — | |
Gtd. Notes, 144A^ | | 8.500 | | 10/15/24(d) | | | 25 | | | | — | |
Gtd. Notes, 144A^ | | 9.750 | | 07/15/25(d) | | | 295 | | | | — | |
Sr. Sec’d. Notes, 144A | | 6.500 | | 03/15/30 | | | 469 | | | | 429,136 | |
Level 3 Financing, Inc., | | | | | | | | | | | | |
Gtd. Notes, 144A | | 4.250 | | 07/01/28 | | | 787 | | | | 515,421 | |
See Notes to Financial Statements.
110
PGIM Active High Yield Bond ETF
Schedule of Investments (continued)
as of August 31, 2023
| | | | | | | | | | | | | | | | |
| | | | |
| Description | | Interest
Rate | | | Maturity
Date | | | Principal
Amount (000)# | | | Value | |
| | | | |
CORPORATE BONDS (Continued) | | | | | | | | | | | | | | | | |
| | | | |
Telecommunications (cont’d.) | | | | | | | | | | | | | | | | |
Sprint Capital Corp., | | | | | | | | | | | | | | | | |
Gtd. Notes | | | 8.750% | | | | 03/15/32 | | | | 125 | | | $ | 148,941 | |
Sprint LLC, | | | | | | | | | | | | | | | | |
Gtd. Notes | | | 7.625 | | | | 03/01/26 | | | | 250 | | | | 259,226 | |
Viasat, Inc., | | | | | | | | | | | | | | | | |
Sr. Unsec’d. Notes, 144A | | | 5.625 | | | | 09/15/25 | | | | 458 | | | | 433,406 | |
Zayo Group Holdings, Inc., | | | | | | | | | | | | | | | | |
Sr. Sec’d. Notes, 144A | | | 4.000 | | | | 03/01/27 | | | | 244 | | | | 182,707 | |
Sr. Unsec’d. Notes, 144A | | | 6.125 | | | | 03/01/28 | | | | 150 | | | | 98,004 | |
| | | | | | | | | | | | | | | | |
| | | | |
| | | | | | | | | | | | | | | 3,506,020 | |
| | | | |
Transportation 0.0% | | | | | | | | | | | | | | | | |
XPO Escrow Sub LLC, | | | | | | | | | | | | | | | | |
Gtd. Notes, 144A | | | 7.500 | | | | 11/15/27 | | | | 25 | | | | 25,535 | |
XPO, Inc., | | | | | | | | | | | | | | | | |
Gtd. Notes, 144A | | | 7.125 | | | | 06/01/31 | | | | 25 | | | | 25,167 | |
| | | | | | | | | | | | | | | | |
| | | | |
| | | | | | | | | | | | | | | 50,702 | |
| | | | |
Trucking & Leasing 0.1% | | | | | | | | | | | | | | | | |
Fortress Transportation & Infrastructure Investors LLC, | | | | | | | | | | | | | | | | |
Gtd. Notes, 144A | | | 5.500 | | | | 05/01/28 | | | | 125 | | | | 116,030 | |
| | | | | | | | | | | | | | | | |
| | | | |
TOTAL CORPORATE BONDS
(cost $104,484,868) | | | | | | | | | | | | | | | 93,707,006 | |
| | | | | | | | | | | | | | | | |
| | | | |
FLOATING RATE AND OTHER LOANS 1.7% | | | | | | | | | | | | | | | | |
| | | | |
Airlines 0.1% | | | | | | | | | | | | | | | | |
United Airlines, Inc., | | | | | | | | | | | | | | | | |
Class B Term Loan, 3 Month LIBOR + 3.750% | | | 9.292(c) | | | | 04/21/28 | | | | 120 | | | | 120,412 | |
| | | | |
Chemicals 0.2% | | | | | | | | | | | | | | | | |
Venator Materials LLC, | | | | | | | | | | | | | | | | |
DIP Loan, 3 Month SOFR + 10.000%^ | | | 15.314(c) | | | | 12/31/23 | | | | 174 | | | | 177,184 | |
Initial Term Loan | | | 12.250 | | | | 08/08/24 | | | | 135 | | | | 63,788 | |
| | | | | | | | | | | | | | | | |
| | | | |
| | | | | | | | | | | | | | | 240,972 | |
See Notes to Financial Statements.
PGIM Fixed Income ETFs 111
PGIM Active High Yield Bond ETF
Schedule of Investments (continued)
as of August 31, 2023
| | | | | | | | | | | | |
| | | | |
| Description | | Interest
Rate | | Maturity Date | | Principal
Amount (000)# | | | Value | |
| | | | |
FLOATING RATE AND OTHER LOANS (Continued) | | | | | | | | | | | | |
| | | | |
Electric 0.0% | | | | | | | | | | | | |
Heritage Power LLC, | | | | | | | | | | | | |
Term Loan B, 3 Month LIBOR + 6.000% | | 11.110%(c) | | 07/30/26(d) | | | 140 | | | $ | 28,778 | |
| | | | |
Insurance 0.2% | | | | | | | | | | | | |
Acrisure LLC, | | | | | | | | | | | | |
2021-1 Additional Term Loan, 1 Month LIBOR + 3.750% | | 9.196(c) | | 02/15/27 | | | 100 | | | | 97,701 | |
Asurion LLC, | | | | | | | | | | | | |
New B-4 Term Loan, 1 Month SOFR + 5.364% | | 10.696(c) | | 01/20/29 | | | 165 | | | | 144,552 | |
| | | | | | | | | | | | |
| | | | |
| | | | | | | | | | | 242,253 | |
| | | | |
Media 0.2% | | | | | | | | | | | | |
Diamond Sports Group LLC, | | | | | | | | | | | | |
First Lien Term Loan, 1 Month SOFR + 8.100% | | 12.775(c) | | 05/25/26 | | | 139 | | | | 88,985 | |
Second Lien Term Loan | | 10.662 | | 08/24/26 | | | 437 | | | | 11,296 | |
Radiate Holdco LLC, | | | | | | | | | | | | |
Amendment No. 6 Term Loan, 1 Month SOFR + 3.250% | | 8.696(c) | | 09/25/26 | | | 89 | | | | 72,783 | |
| | | | | | | | | | | | |
| | | | |
| | | | | | | | | | | 173,064 | |
| | | | |
Retail 0.1% | | | | | | | | | | | | |
EG America LLC (United Kingdom), | | | | | | | | | | | | |
New Term Loan B, 1 Month SOFR + 4.500%^ | | 9.647(c) | | 03/12/26 | | | 23 | | | | 22,518 | |
Great Outdoors Group LLC, | | | | | | | | | | | | |
Term B-2 Loan, 1 Month SOFR + 3.864% | | 9.196(c) | | 03/06/28 | | | 49 | | | | 48,553 | |
| | | | | | | | | | | | |
| | | | |
| | | | | | | | | | | 71,071 | |
| | | | |
Software 0.5% | | | | | | | | | | | | |
Boxer Parent Co., Inc., | | | | | | | | | | | | |
Second Lien Incremental Term Loan, 1 Month SOFR + 5.614% | | 10.946(c) | | 02/27/26 | | | 50 | | | | 49,250 | |
See Notes to Financial Statements.
112
PGIM Active High Yield Bond ETF
Schedule of Investments (continued)
as of August 31, 2023
| | | | | | | | | | | | | | | | |
| | | | |
| Description | | Interest
Rate | | | Maturity
Date | | | Principal
Amount (000)# | | | Value | |
| | | | |
FLOATING RATE AND OTHER LOANS (Continued) | | | | | | | | | | | | | | | | |
| | | | |
Software (cont’d.) | | | | | | | | | | | | | | | | |
Finastra USA, Inc., | | | | | | | | | | | | | | | | |
First Lien Dollar Term Loan, 6 Month LIBOR + 3.500% | | | 9.231%(c) | | | | 06/13/24 | | | | 361 | | | $ | 359,861 | |
Skillsoft Finance II, Inc., | | | | | | | | | | | | | | | | |
Initial Term Loan, 1 Month SOFR + 5.364% | | | 10.677(c) | | | | 07/14/28 | | | | 193 | | | | 177,286 | |
| | | | | | | | | | | | | | | | |
| | | | |
| | | | | | | | | | | | | | | 586,397 | |
| | | | |
Telecommunications 0.4% | | | | | | | | | | | | | | | | |
Digicel International Finance Ltd. (Jamaica), | | | | | | | | | | | | | | | | |
First Lien Initial Term B Loan, 3 Month LIBOR + 3.250% | | | 8.981(c) | | | | 05/27/24 | | | | 20 | | | | 18,092 | |
Xplornet Communications, Inc. (Canada), | | | | | | | | | | | | | | | | |
First Lien Refinancing Term Loan, 1 Month SOFR + 4.000% | | | 9.446(c) | | | | 10/02/28 | | | | 420 | | | | 335,935 | |
Initial Term Loan- Second Lien, 1 Month SOFR + 7.114% | | | 12.446(c) | | | | 10/01/29 | | | | 150 | | | | 71,437 | |
| | | | | | | | | | | | | | | | |
| | | | |
| | | | | | | | | | | | | | | 425,464 | |
| | | | | | | | | | | | | | | | |
| | | | |
TOTAL FLOATING RATE AND OTHER LOANS
(cost $2,182,618) | | | | | | | | | | | | | | | 1,888,411 | |
| | | | | | | | | | | | | | | | |
| | | | |
U.S. TREASURY OBLIGATIONS 7.9% | | | | | | | | | | | | | | | | |
U.S. Treasury Notes(k) | | | 2.500 | | | | 03/31/27 | | | | 475 | | | | 445,053 | |
U.S. Treasury Notes(k) | | | 2.625 | | | | 05/31/27 | | | | 165 | | | | 154,881 | |
U.S. Treasury Notes | | | 3.000 | | | | 07/31/24 | | | | 1,200 | | | | 1,174,172 | |
U.S. Treasury Notes(k) | | | 4.125 | | | | 07/31/28 | | | | 4,700 | | | | 4,672,828 | |
U.S. Treasury Notes | | | 4.750 | | | | 07/31/25 | | | | 2,500 | | | | 2,493,164 | |
| | | | | | | | | | | | | | | | |
| | | | |
TOTAL U.S. TREASURY OBLIGATIONS
(cost $8,965,858) | | | | | | | | | | | | | | | 8,940,098 | |
| | | | | | | | | | | | | | | | |
| | | | |
| | | | | | | | | Shares | | | | |
| | | | |
COMMON STOCKS 0.7% | | | | | | | | | | | | | | | | |
| | | | |
Chemicals 0.1% | | | | | | | | | | | | | | | | |
TPC Group, Inc.*^ | | | | | | | | | | | 6,118 | | | | 152,950 | |
See Notes to Financial Statements.
PGIM Fixed Income ETFs 113
PGIM Active High Yield Bond ETF
Schedule of Investments (continued)
as of August 31, 2023
| | | | | | | | | | | | | | |
| | | | |
| Description | | | | | | | Shares | | Value | |
| | | | |
COMMON STOCKS (Continued) | | | | | | | | | | | | | | |
| | | | |
Gas Utilities 0.1% | | | | | | | | | | | | | | |
Ferrellgas Partners LP (Class B Stock) (original cost $102,501; purchased 09/24/18 - 09/26/19)(f) | | | | | | | | | | 728 | | $ | 103,183 | |
| | | | |
Oil, Gas & Consumable Fuels 0.3% | | | | | | | | | | | | | | |
Chesapeake Energy Corp. | | | | | | | | | | 4,472 | | | 394,475 | |
| | | | |
Wireless Telecommunication Services 0.2% | | | | | | | | | | | | | | |
Intelsat Emergence SA (Luxembourg)* | | | | | | | | | | 7,641 | | | 172,305 | |
| | | | | | | | | | | | | | |
| | | | |
TOTAL COMMON STOCKS
(cost $674,307) | | | | | | | | | | | | | 822,913 | |
| | | | | | | | | | | | | | |
| | | | |
PREFERRED STOCK 0.5% | | | | | | | | | | | | | | |
| | | | |
Electronic Equipment, Instruments & Components | | | | | | | | | | | | | | |
Ferrellgas Escrow LLC, 8.956%, Maturing 03/30/31 (original cost $590,708; purchased 05/15/21 - 02/09/22)^(f)
(cost $591,605) | | | | | | | | | | 600 | | | 600,000 | |
| | | | | | | | | | | | | | |
| | | | |
| | | | | | | | Units | | | |
| | | | |
RIGHTS* 0.0% | | | | | | | | | | | | | | |
| | | | |
Wireless Telecommunication Services | | | | | | | | | | | | | | |
Intelsat Jackson Holdings SA, Series A (Luxembourg), CVR, expiring 12/05/25^ | | | | | | | | | | 798 | | | 4,987 | |
Intelsat Jackson Holdings SA, Series B (Luxembourg), CVR, expiring 12/05/25^ | | | | | | | | | | 798 | | | 3,192 | |
| | | | | | | | | | | | | | |
| | | | |
TOTAL RIGHTS
(cost $11) | | | | | | | | | | | | | 8,179 | |
| | | | | | | | | | | | | | |
| | | | |
TOTAL LONG-TERM INVESTMENTS
(cost $120,468,167) | | | | | | | | | | | | | 109,551,894 | |
| | | | | | | | | | | | | | |
See Notes to Financial Statements.
114
PGIM Active High Yield Bond ETF
Schedule of Investments (continued)
as of August 31, 2023
| | | | | | | | | | | | | | |
| | | | |
| Description | | | | | | | Shares | | Value | |
| | | | |
SHORT-TERM INVESTMENT 1.8% | | | | | | | | | | | | | | |
| | | | |
AFFILIATED MUTUAL FUND | | | | | | | | | | | | | | |
PGIM Core Government Money Market Fund | | | | | | | | | | | | | | |
(cost $2,094,768)(wi) | | | | | | | | | | 2,094,768 | | $ | 2,094,768 | |
| | | | | | | | | | | | | | |
| | | | |
TOTAL INVESTMENTS 98.2%
(cost $122,562,935) | | | | | | | | | | | | | 111,646,662 | |
Other assets in excess of liabilities(z) 1.8% | | | | | | | | | | | | | 2,003,287 | |
| | | | | | | | | | | | | | |
| | | | |
NET ASSETS 100.0% | | | | | | | | | | | | $ | 113,649,949 | |
| | | | | | | | | | | | | | |
See the Glossary for a list of the abbreviation(s) used in the annual report.
| * | Non-income producing security. |
| # | Principal or notional amount is shown in U.S. dollars unless otherwise stated. |
| ^ | Indicates a Level 3 instrument. The aggregate value of Level 3 instruments is $960,831 and 0.8% of net assets. |
| (c) | Variable rate instrument. The interest rate shown reflects the rate in effect at August 31, 2023. |
| (d) | Represents issuer in default on interest payments and/or principal repayment. Non-income producing security. Such securities may be post-maturity. |
| (f) | Indicates a restricted security that is acquired in unregistered, private sales from the issuing company or from an affiliate of the issuer and is considered restricted as to disposition under federal securities law; the aggregate original cost of such securities is $3,374,553. The aggregate value of $1,683,975 is 1.5% of net assets. |
| (ff) | Variable rate security. Security may be issued at a fixed coupon rate, which converts to a variable rate at a specified date. Rate shown is the rate in effect as of period end. |
| (k) | Represents security, or a portion thereof, segregated as collateral for centrally cleared/exchange-traded derivatives. |
| (oo) | Perpetual security. Maturity date represents next call date. |
| (wi) | PGIM Investments LLC, the manager of the Fund, also serves as manager of the PGIM Core Government Money Market Fund and PGIM Institutional Money Market Fund, if applicable. |
| (z) | Includes net unrealized appreciation/(depreciation) and/or market value of the below holdings which are excluded from the Schedule of Investments: |
Futures contracts outstanding at August 31, 2023:
| | | | | | | | | | | | | | | | | | | |
Number of Contracts | | | | Type | | Expiration
Date | | Current
Notional
Amount | | Value /
Unrealized
Appreciation
(Depreciation) |
| | |
Long Positions: | | | | | | | | | | |
8 | | | | 2 Year U.S. Treasury Notes | | | | Dec. 2023 | | | | $ | 1,630,438 | | | | $ | 4,554 | |
47 | | | | 5 Year U.S. Treasury Notes | | | | Dec. 2023 | | | | | 5,025,328 | | | | | 22,006 | |
7 | | | | 10 Year U.S. Treasury Notes | | | | Dec. 2023 | | | | | 777,219 | | | | | 4,461 | |
| | | | | | | | | | | | | | | | | | | |
| | | | | | | | | | | | | | | | | | 31,021 | |
| | | | | | | | | | | | | | | | | | | |
See Notes to Financial Statements.
PGIM Fixed Income ETFs 115
PGIM Active High Yield Bond ETF
Schedule of Investments (continued)
as of August 31, 2023
Futures contracts outstanding at August 31, 2023 (continued):
| | | | | | | | | | | | | | | | | | | | | | | | | | | | | |
Number of Contracts | | | | Type | | Expiration
Date | | Current
Notional
Amount | | Value /
Unrealized
Appreciation (Depreciation) |
| | | | | | | | | | | | | | | | | | | |
| | |
Short Positions: | | | | | | | | | | | |
3 | | | | 20 Year U.S. Treasury Bonds | | | | Dec. 2023 | | | | | $ 365,062 | | | | | | | | | $ | (4,067 | ) | | | | | |
1 | | | | 30 Year U.S. Ultra Treasury Bonds | | | | Dec. 2023 | | | | | 129,469 | | | | | | | | | | (1,595 | ) | | | | | |
| | | | | | | | | | | | | | | | | | | | | | | | | | | | | |
| | | | | | | | | | | | | | | | | | | | | | | (5,662 | ) | | | | | |
| | | | | | | | | | | | | | | | | | | | | | | | | | | | | |
| | | | | | | | | | | | | | | | | | | | | | $ | 25,359 | | | | | | |
| | | | | | | | | | | | | | | | | | | | | | | | | | | | | |
Forward foreign currency exchange contracts outstanding at August 31, 2023:
| | | | | | | | | | | | | | | | | | | | | | | | | | | | | | | | |
Purchase Contracts | | Counterparty | | Notional
Amount
(000) | | Value at
Settlement
Date | | Current
Value | | Unrealized
Appreciation | | Unrealized
Depreciation |
| | | | | |
OTC Forward Foreign Currency Exchange Contracts: | | | | | | | | | | | | | | | | | | | | | | | | | |
British Pound, | | | | | | | | | | | | | | | | | | | | | | | | | | | |
Expiring 09/05/23 | | JPM | | | | GBP | | | | | 89 | | | | $ | 112,328 | | | | $ | 112,747 | | | | | $419 | | | | | $— | |
| | | | | | | | | | | | | | | | | | | | | | | | | | | | | | | | |
| | | | | | |
Sale Contracts | | Counterparty | | Notional
Amount
(000) | | Value at
Settlement
Date | | Current
Value | | Unrealized
Appreciation | | Unrealized
Depreciation |
| | | | | |
OTC Forward Foreign Currency Exchange Contracts: | | | | | | | | | | | | | | | | | | | | | | | | | |
British Pound, | | | | | | | | | | | | | | | | | | | | | | | | | | | |
Expiring 09/05/23 | | BNP | | | | GBP | | | | | 89 | | | | $ | 114,406 | | | | $ | 112,748 | | | | | $1,658 | | | | | $ — | |
Expiring 10/03/23 | | JPM | | | | GBP | | | | | 89 | | | | | 112,344 | | | | | 112,761 | | | | | — | | | | | (417 | ) |
| | | | | | | | | | | | | | | | | | | | | | | | | | | | | | | | |
| | | | | | | |
| | | | | | | | | | | | | | | $ | 226,750 | | | | $ | 225,509 | | | | | 1,658 | | | | | (417 | ) |
| | | | | | | | | | | | | | | | | | | | | | | | | | | | | | | | |
| | | | | | | |
| | | | | | | | | | | | | | | | | | | | | | | | | | $2,077 | | | | | $(417) | |
| | | | | | | | | | | | | | | | | | | | | | | | | | | | | | | | |
Credit default swap agreements outstanding at August 31, 2023:
| | | | | | | | | | | | | | | | | | | | | | | | | | | | | | | | | | | | | | | | | | | | | | | | | | | | | | | | |
Reference Entity/ Obligation | | Termination
Date | | Fixed Rate | | Notional
Amount
(000)#(3) | | | Value at
Trade Date | | | Value at
August 31,
2023 | | | Unrealized Appreciation
(Depreciation) | |
| | | | | | | | | | | | | | | | | | | | |
Centrally Cleared Credit Default Swap Agreement on credit indices - Buy Protection(1): | | | | | | | | | | | | | | | | | |
CDX.NA.IG.40.V1 | | | | 06/20/28 | | | | 1.000%(Q) | | | | | | | 3,400 | | | | | | | | | | | $ | (44,068 | ) | | | | | | | | | | $ | (59,564 | ) | | | | | | | | | | $ | (15,496 | ) | | | | |
| | | | | | | | | | | | | | | | | | | | | | | | | | | | | | | | | | | | | | | | | | | | | | | | | | | | | | | | |
See Notes to Financial Statements.
116
PGIM Active High Yield Bond ETF
Schedule of Investments (continued)
as of August 31, 2023
Credit default swap agreements outstanding at August 31, 2023 (continued):
| | | | | | | | | | | | | | | | | | | | | | | | | | | | | | | | | | | | | | | | | | | | | | | | | | | | | | | | | | | | | | | | | | | | |
Reference Entity/ Obligation | | Termination
Date | | Fixed Rate | | Notional
Amount
(000)#(3) | | | Implied Credit
Spread at
August 31,
2023(4) | | | Value at
Trade Date | | | Value at
August 31,
2023 | | | | | | Unrealized
Appreciation
(Depreciation) | | | | |
| | | | | | | | | | | | | | | | | | | | | | | | |
Centrally Cleared Credit Default Swap Agreement on credit indices - Sell Protection(2): | | | | | | | | | | | | | | | | | | | | | |
CDX.NA.HY.40.V1 | | | | 06/20/28 | | | | 5.000%(Q) | | | | | | | 6,275 | | | | | | | | | | | | 4.257% | | | | | | | | | | | $ | 119,352 | | | | | | | | | | | $ | 240,906 | | | | | | | | | | | $ | 121,554 | | | | | |
| | | | | | | | | | | | | | | | | | | | | | | | | | | | | | | | | | | | | | | | | | | | | | | | | | | | | | | | | | | | | | | | | | | | |
The Fund entered into credit default swaps (“CDS”) to provide a measure of protection against defaults or to take an active long or short position with respect to the likelihood of a particular issuer’s default or the reference entity’s credit soundness. CDS contracts generally trade based on a spread which represents the cost a protection buyer has to pay the protection seller. The protection buyer is said to be short the credit as the value of the contract rises the more the credit deteriorates. The value of the CDS contract increases for the protection buyer if the spread increases.
| (1) | If the Fund is a buyer of protection, it pays the fixed rate. When a credit event occurs, as defined under the terms of that particular swap agreement, the Fund will either (i) receive from the seller of protection an amount equal to the notional amount of the swap and make delivery of the referenced obligation or underlying securities comprising the referenced index or (ii) receive a net settlement amount in the form of cash or securities equal to the notional amount of the swap less the recovery value of the referenced obligation or underlying securities comprising the referenced index. |
| (2) | If the Fund is a seller of protection, it receives the fixed rate. When a credit event occurs, as defined under the terms of that particular swap agreement, the Fund will either (i) pay to the buyer of protection an amount equal to the notional amount of the swap and take delivery of the referenced obligation or underlying securities comprising the referenced index or (ii) pay a net settlement amount in the form of cash or securities equal to the notional amount of the swap less the recovery value of the referenced obligation or underlying securities comprising the referenced index. |
| (3) | Notional amount represents the maximum potential amount the Fund could be required to pay as a seller of credit protection or receive as a buyer of credit protection if a credit event occurs as defined under the terms of that particular swap agreement. |
| (4) | Implied credit spreads, represented in absolute terms, utilized in determining the fair value of credit default swap agreements where the Fund is the seller of protection as of the reporting date serve as an indicator of the current status of the payment/ performance risk and represent the likelihood of risk of default for the credit derivative. The implied credit spread of a particular referenced entity reflects the cost of buying/selling protection and may include up-front payments required to be made to enter into the agreement. Wider credit spreads represent a deterioration of the referenced entity’s credit soundness and a greater likelihood of risk of default or other credit event occurring as defined under the terms of the agreement. |
See Notes to Financial Statements.
PGIM Fixed Income ETFs 117
PGIM Active High Yield Bond ETF
Schedule of Investments (continued)
as of August 31, 2023
Total return swap agreement outstanding at August 31, 2023:
| | | | | | | | | | | | | | | | | | | | | | | | | | | | | | | | | | | |
Reference Entity | | Financing
Rate | | Counterparty | | Termination
Date | | Long
(Short)
Notional
Amount
(000)#(1) | | Fair
Value | | Upfront
Premiums
Paid
(Received) | | Unrealized
Appreciation
(Depreciation)(2) |
OTC Total Return Swap Agreement: | | | | | | | | | | | | | | | | | | | | | | | | | | | | | | | | |
iBoxx US Dollar Liquid Investment Grade Index(T) | | 1 Day
SOFR(Q)/
5.310% | | | | BNP | | | | | 12/20/23 | | | | | (1,472 | ) | | | $ | 42,982 | | | | $ | 4,493 | | | | $ | 38,489 | |
| | | | | | | | | | | | | | | | | | | | | | | | | | | | | | | | |
| (1) | On a long total return swap, the Fund receives payments for any positive return on the reference entity (makes payments for any negative return) and pays the financing rate. On a short total return swap, the Fund makes payments for any positive return on the reference entity (receives payments for any negative return) and receives the financing rate. |
| (2) | Upfront/recurring fees or commissions, as applicable, are included in the net unrealized appreciation (depreciation). |
Balances Reported in the Statement of Assets and Liabilities for OTC Swap Agreements:
| | | | | | | | | | | | | | | | | | | | |
| | | Premiums Paid | | Premiums Received | | Unrealized
Appreciation | | Unrealized
Depreciation |
| | | | |
OTC Swap Agreements | | | $ | 4,493 | | | | $ | — | | | | $ | 38,489 | | | | $ | — | |
Summary of Collateral for Centrally Cleared/Exchange-traded Derivatives:
Cash and securities segregated as collateral, including pending settlement for closed positions, to cover requirements for centrally cleared/exchange-traded derivatives are listed by broker as follows:
| | | | | | | | | | |
Broker | | Cash and/or Foreign Currency | | Securities Market Value |
| | |
CGM | | | $ | 150,000 | | | | $ | 790,879 | |
| | | | | | | | | | |
Fair Value Measurements:
Various inputs are used in determining the value of the Fund’s investments. These inputs are summarized in the three broad levels listed below.
Level 1—unadjusted quoted prices generally in active markets for identical securities.
Level 2—quoted prices for similar securities, interest rates and yield curves, prepayment speeds, foreign currency exchange rates and other observable inputs.
Level 3—unobservable inputs for securities valued in accordance with Board approved fair valuation procedures.
See Notes to Financial Statements.
118
PGIM Active High Yield Bond ETF
Schedule of Investments (continued)
as of August 31, 2023
The following is a summary of the inputs used as of August 31, 2023 in valuing such portfolio securities:
| | | | | | | | | | | | | | | |
| | | Level 1 | | Level 2 | | Level 3 |
Investments in Securities | | | | | | | | | | | | | | | |
Assets | | | | | | | | | | | | | | | |
Long-Term Investments | | | | | | | | | | | | | | | |
Asset-Backed Securities | | | | | | | | | | | | | | | |
Collateralized Loan Obligations | | | $ | — | | | | $ | 3,584,796 | | | | $ | — | |
Convertible Bond | | | | — | | | | | 491 | | | | | — | |
Corporate Bonds | | | | — | | | | | 93,707,006 | | | | | —** | |
Floating Rate and Other Loans | | | | — | | | | | 1,688,709 | | | | | 199,702 | |
U.S. Treasury Obligations | | | | — | | | | | 8,940,098 | | | | | — | |
Common Stocks | | | | 394,475 | | | | | 275,488 | | | | | 152,950 | |
Preferred Stock | | | | — | | | | | — | | | | | 600,000 | |
Rights | | | | — | | | | | — | | | | | 8,179 | |
Short-Term Investment | | | | | | | | | | | | | | | |
Affiliated Mutual Fund | | | | 2,094,768 | | | | | — | | | | | — | |
| | | | | | | | | | | | | | | |
| | | |
Total | | | $ | 2,489,243 | | | | $ | 108,196,588 | | | | $ | 960,831 | |
| | | | | | | | | | | | | | | |
| | | |
Other Financial Instruments* | | | | | | | | | | | | | | | |
Assets | | | | | | | | | | | | | | | |
Futures Contracts | | | $ | 31,021 | | | | $ | — | | | | $ | — | |
OTC Forward Foreign Currency Exchange Contracts | | | | — | | | | | 2,077 | | | | | — | |
Centrally Cleared Credit Default Swap Agreement | | | | — | | | | | 121,554 | | | | | — | |
OTC Total Return Swap Agreement | | | | — | | | | | 42,982 | | | | | — | |
| | | | | | | | | | | | | | | |
| | | |
Total | | | $ | 31,021 | | | | $ | 166,613 | | | | $ | — | |
| | | | | | | | | | | | | | | |
| | | |
Liabilities | | | | | | | | | | | | | | | |
Futures Contracts | | | $ | (5,662 | ) | | | $ | — | | | | $ | — | |
OTC Forward Foreign Currency Exchange Contract | | | | — | | | | | (417 | ) | | | | — | |
Centrally Cleared Credit Default Swap Agreement | | | | — | | | | | (15,496 | ) | | | | — | |
| | | | | | | | | | | | | | | |
| | | |
Total | | | $ | (5,662 | ) | | | $ | (15,913 | ) | | | $ | — | |
| | | | | | | | | | | | | | | |
| * | Other financial instruments are derivative instruments not reflected in the Schedule of Investments, such as futures, forwards and centrally cleared swap contracts, which are recorded at the unrealized appreciation (depreciation) on the instrument, and OTC swap contracts which are recorded at fair value. |
| ** | Includes Level 3 investments with an aggregate value of $0. |
Industry Classification:
The industry classification of investments and other assets in excess of liabilities shown as a percentage of net assets as of August 31, 2023 were as follows:
| | | | |
Media | | | 8.3 | % |
U.S. Treasury Obligations | | | 7.9 | |
Oil & Gas | | | 6.8 | |
| | | | |
Retail | | | 4.9 | % |
Commercial Services | | | 4.7 | |
Electric | | | 4.2 | |
See Notes to Financial Statements.
PGIM Fixed Income ETFs 119
PGIM Active High Yield Bond ETF
Schedule of Investments (continued)
as of August 31, 2023
Industry Classification (continued):
| | | | |
Healthcare-Services | | | 3.8 | % |
Telecommunications | | | 3.5 | |
Leisure Time | | | 3.2 | |
Home Builders | | | 3.2 | |
Collateralized Loan Obligations | | | 3.2 | |
Diversified Financial Services | | | 2.9 | |
Entertainment | | | 2.8 | |
Pipelines | | | 2.7 | |
Aerospace & Defense | | | 2.7 | |
Foods | | | 2.3 | |
Auto Manufacturers | | | 2.3 | |
Chemicals | | | 2.0 | |
Pharmaceuticals | | | 1.9 | |
Packaging & Containers | | | 1.9 | |
Affiliated Mutual Fund | | | 1.8 | |
Building Materials | | | 1.5 | |
Airlines | | | 1.5 | |
Mining | | | 1.3 | |
Software | | | 1.2 | |
Real Estate | | | 1.2 | |
Real Estate Investment Trusts (REITs) | | | 1.2 | |
Lodging | | | 1.2 | |
Healthcare-Products | | | 1.2 | |
Machinery-Diversified | | | 1.2 | |
Auto Parts & Equipment | | | 1.0 | |
Distribution/Wholesale | | | 0.8 | |
Housewares | | | 0.7 | |
Computers | | | 0.7 | |
Electrical Components & Equipment | | | 0.6 | |
Electronic Equipment, Instruments & Components | | | 0.5 | |
| | | | |
Advertising | | | 0.5 | % |
Apparel | | | 0.5 | |
Household Products/Wares | | | 0.4 | |
Environmental Control | | | 0.4 | |
Miscellaneous Manufacturing | | | 0.4 | |
Iron/Steel | | | 0.4 | |
Oil, Gas & Consumable Fuels | | | 0.3 | |
Insurance | | | 0.3 | |
Internet | | | 0.3 | |
Machinery-Construction & Mining | | | 0.3 | |
Home Furnishings | | | 0.2 | |
Agriculture | | | 0.2 | |
Gas | | | 0.2 | |
Electronics | | | 0.2 | |
Banks | | | 0.2 | |
Wireless Telecommunication Services | | | 0.2 | |
Coal | | | 0.1 | |
Engineering & Construction | | | 0.1 | |
Trucking & Leasing | | | 0.1 | |
Gas Utilities | | | 0.1 | |
Transportation | | | 0.0 | * |
| | | | |
| | | 98.2 | |
Other assets in excess of liabilities | | | 1.8 | |
| | | | |
| |
| | | 100.0 | % |
| | | | |
* Less than 0.05%
Effects of Derivative Instruments on the Financial Statements and Primary Underlying Risk Exposure:
The Fund invested in derivative instruments during the reporting period. The primary types of risk associated with these derivative instruments are credit risk, foreign exchange risk and interest rate risk. See the Notes to Financial Statements for additional detail regarding these derivative instruments and their risks. The effect of such derivative instruments on the Fund’s financial position and financial performance as reflected in the Statement of Assets and Liabilities and Statement of Operations is presented in the summary below.
Fair values of derivative instruments as of August 31, 2023 as presented in the Statement of Assets and Liabilities:
See Notes to Financial Statements.
120
PGIM Active High Yield Bond ETF
Schedule of Investments (continued)
as of August 31, 2023
| | | | | | | | | | | | |
| | | Asset Derivatives | | | Liability Derivatives | |
Derivatives not accounted for
as hedging instruments,
carried at fair value | | Statement of Assets and Liabilities Location | | Fair
Value | | | Statement of Assets and Liabilities Location | | Fair
Value | |
Credit contracts | | Due from/to broker-variation margin swaps | | $ | 121,554 | * | | Due from/to broker-variation margin swaps | | $ | 15,496 | * |
Foreign exchange contracts | | Unrealized appreciation on OTC forward foreign currency exchange contracts | | | 2,077 | | | Unrealized depreciation on OTC forward foreign currency exchange contracts | | | 417 | |
Interest rate contracts | | Due from/to broker-variation margin futures | | | 31,021 | * | | Due from/to broker-variation margin futures | | | 5,662 | * |
Interest rate contracts | | Premiums paid for OTC swap agreements | | | 4,493 | | | — | | | — | |
Interest rate contracts | | Unrealized appreciation on OTC swap agreements | | | 38,489 | | | — | | | — | |
| | | | | | | | | | | | |
| | | | $ | 197,634 | | | | | $ | 21,575 | |
| | | | | | | | | | | | |
| * | Includes cumulative appreciation (depreciation) as reported in the schedule of open futures and centrally cleared swap contracts. Only unsettled variation margin receivable (payable) is reported within the Statement of Assets and Liabilities. |
The effects of derivative instruments on the Statement of Operations for the year ended August 31, 2023 are as follows:
| | | | | | | | | | | | | | | |
| Amount of Realized Gain (Loss) on Derivatives Recognized in Income |
| | | |
Derivatives not accounted for as hedging instruments, carried at fair value | | Futures | | Forward
Currency
Exchange
Contracts | | Swaps |
| | | |
Credit contracts | | | $ | — | | | | $ | — | | | | $ | 300,151 | |
Foreign exchange contracts | | | | — | | | | | (6,086 | ) | | | | — | |
Interest rate contracts | | | | (504,106 | ) | | | | — | | | | | 65,689 | |
| | | | | | | | | | | | | | | |
| | | |
Total | | | $ | (504,106 | ) | | | $ | (6,086 | ) | | | $ | 365,840 | |
| | | | | | | | | | | | | | | |
|
| Change in Unrealized Appreciation (Depreciation) on Derivatives Recognized in Income |
| | | |
Derivatives not accounted for as hedging instruments, carried at fair value | | Futures | | Forward
Currency
Exchange
Contracts | | Swaps |
| | | |
Credit contracts | | | $ | — | | | | $ | — | | | | $ | (2,304 | ) |
See Notes to Financial Statements.
PGIM Fixed Income ETFs 121
PGIM Active High Yield Bond ETF
Schedule of Investments (continued)
as of August 31, 2023
| | | | | | | | | | | | | | | |
| Change in Unrealized Appreciation (Depreciation) on Derivatives Recognized in Income |
| | | |
Derivatives not accounted for as hedging instruments, carried at fair value | | Futures | | Forward
Currency
Exchange
Contracts | | Swaps |
Foreign exchange contracts | | | $ | — | | | | $ | (2,465 | ) | | | $ | — | |
Interest rate contracts | | | | 51,252 | | | | | — | | | | | 38,170 | |
| | | | | | | | | | | | | | | |
| | | |
Total | | | $ | 51,252 | | | | $ | (2,465 | ) | | | $ | 35,866 | |
| | | | | | | | | | | | | | | |
For the year ended August 31, 2023, the Fund’s average volume of derivative activities is as follows:
| | | | |
| Derivative Contract Type | | Average Volume of Derivative Activities* | |
| |
Futures Contracts - Long Positions (1) | | | $9,080,108 | |
Futures Contracts - Short Positions (1) | | | 557,906 | |
Forward Foreign Currency Exchange Contracts - Purchased (2) | | | 108,313 | |
Forward Foreign Currency Exchange Contracts - Sold (2) | | | 217,074 | |
Credit Default Swap Agreements - Buy Protection (1) | | | 1,786,468 | |
Credit Default Swap Agreements - Sell Protection (1) | | | 3,615,160 | |
Total Return Swap Agreements (1) | | | 1,478,400 | |
| * | Average volume is based on average quarter end balances as noted for the year ended August 31, 2023. |
| (1) | Notional Amount in USD. |
| (2) | Value at Settlement Date. |
Financial Instruments/Transactions—Summary of Offsetting and Netting Arrangements:
The Fund invested in OTC derivatives during the reporting period that are either offset in accordance with current requirements or are subject to enforceable master netting arrangements or similar agreements that permit offsetting. The information about offsetting and related netting arrangements for OTC derivatives where the legal right to set-off exists is presented in the summary below.
Offsetting of OTC derivative assets and liabilities:
| | | | | | | | | | | | | | | | | | | | | | | | | |
Counterparty | | Gross Amounts of
Recognized
Assets(1) | | Gross Amounts of
Recognized
Liabilities(1) | | Net Amounts of
Recognized
Assets/(Liabilities) | | Collateral
Pledged/(Received)(2) | | Net Amount |
BNP | | | $ | 44,640 | | | | $ | — | | | | $ | 44,640 | | | | $ | — | | | | $ | 44,640 | |
JPM | | | | 419 | | | | | (417 | ) | | | | 2 | | | | | — | | | | | 2 | |
| | | | | | | | | | | | | | | | | | | | | | | | | |
| | | $ | 45,059 | | | | $ | (417 | ) | | | $ | 44,642 | | | | $ | — | | | | $ | 44,642 | |
| | | | | | | | | | | | | | | | | | | | | | | | | |
| (1) | Includes unrealized appreciation/(depreciation) on swaps and forwards, premiums paid/(received) on swap agreements and market value of purchased and written options, as represented on the Statement of Assets and Liabilities. |
See Notes to Financial Statements.
122
PGIM Active High Yield Bond ETF
Schedule of Investments (continued)
as of August 31, 2023
| (2) | Collateral amount disclosed by the Fund is limited to the market value of financial instruments/transactions and the Fund’s OTC derivative exposure by counterparty. |
See Notes to Financial Statements.
PGIM Fixed Income ETFs 123
PGIM Active High Yield Bond ETF
Statement of Assets & Liabilities
as of August 31, 2023
| | | | |
Assets | | | | |
| |
Investments at value: | | | | |
Unaffiliated investments (cost $120,468,167) | | $ | 109,551,894 | |
Affiliated investments (cost $2,094,768) | | | 2,094,768 | |
Cash | | | 1,175 | |
Foreign currency, at value (cost $6,759) | | | 7,043 | |
Dividends and interest receivable | | | 1,712,074 | |
Deposit with broker for centrally cleared/exchange-traded derivatives | | | 150,000 | |
Receivable for investments sold | | | 86,148 | |
Unrealized appreciation on OTC swap agreements | | | 38,489 | |
Due from broker—variation margin futures | | | 4,562 | |
Premiums paid for OTC swap agreements | | | 4,493 | |
Unrealized appreciation on OTC forward foreign currency exchange contracts | | | 2,077 | |
Other assets | | | 55,759 | |
| | | | |
Total Assets | | | 113,708,482 | |
| | | | |
| |
| Liabilities | | | |
| |
Management fee payable | | | 49,005 | |
Due to broker | | | 9,111 | |
Unrealized depreciation on OTC forward foreign currency exchange contracts | | | 417 | |
| | | | |
Total Liabilities | | | 58,533 | |
| | | | |
| |
Net Assets | | $ | 113,649,949 | |
| | | | |
| |
| | | | | |
| |
Net assets were comprised of: | | | | |
Common stock, at par | | $ | 3,325 | |
Paid-in capital in excess of par | | | 129,001,262 | |
Total distributable earnings (loss) | | | (15,354,638 | ) |
| | | | |
| |
Net assets, August 31, 2023 | | $ | 113,649,949 | |
| | | | |
| |
Net asset value, offering price and redemption price per share.
($113,649,949 ÷ 3,325,000 shares of common stock issued and outstanding) | | $ | 34.18 | |
| | | | |
See Notes to Financial Statements.
124
PGIM Active High Yield Bond ETF
Statement of Operations
Year Ended August 31, 2023
| | | | |
Net Investment Income (Loss) | | | | |
| |
Income | | | | |
Interest income | | $ | 6,781,403 | |
Unaffiliated dividend income | | | 86,153 | |
Affiliated dividend income | | | 52,330 | |
Income from securities lending, net (including affiliated income of $3,077) | | | 3,289 | |
| | | | |
Total income | | | 6,923,175 | |
| | | | |
| |
Expenses | | | | |
Management fee | | | 483,137 | |
| | | | |
Net investment income (loss) | | | 6,440,038 | |
| | | | |
| Realized And Unrealized Gain (Loss) On Investment And Foreign Currency Transactions | | | |
| |
Net realized gain (loss) on: | | | | |
Investment transactions (including affiliated of $110) | | | (2,119,085 | ) |
Futures transactions | | | (504,106 | ) |
Forward currency contract transactions | | | (6,086 | ) |
Swap agreement transactions | | | 365,840 | |
Foreign currency transactions | | | 70 | |
| | | | |
| | | (2,263,367 | ) |
| | | | |
Net change in unrealized appreciation (depreciation) on: | | | | |
Investments (including affiliated of $(24)) | | | 1,321,005 | |
Futures | | | 51,252 | |
Forward currency contracts | | | (2,465 | ) |
Swap agreements | | | 35,866 | |
Foreign currencies | | | 371 | |
| | | | |
| | | 1,406,029 | |
| | | | |
Net gain (loss) on investment and foreign currency transactions | | | (857,338 | ) |
| | | | |
| |
Net Increase (Decrease) In Net Assets Resulting From Operations | | $ | 5,582,700 | |
| | | | |
See Notes to Financial Statements.
PGIM Fixed Income ETFs 125
PGIM Active High Yield Bond ETF
Statements of Changes in Net Assets
| | | | | | | | |
| |
| | | Year Ended August 31, | |
| | | | |
| | |
| | | 2023 | | | 2022 | |
| | |
Increase (Decrease) in Net Assets | | | | | | | | |
| | |
Operations | | | | | | | | |
Net investment income (loss) | | $ | 6,440,038 | | | $ | 4,174,246 | |
Net realized gain (loss) on investment, in-kind redemptions and foreign currency transactions | | | (2,263,367 | ) | | | (1,049,256 | ) |
Net change in unrealized appreciation (depreciation) on investments and foreign currencies | | | 1,406,029 | | | | (14,092,188 | ) |
| | | | | | | | |
Net increase (decrease) in net assets resulting from operations | | | 5,582,700 | | | | (10,967,198 | ) |
| | | | | | | | |
| | |
Dividends and Distributions | | | | | | | | |
Distributions from distributable earnings | | | (6,738,650 | ) | | | (5,220,879 | ) |
| | | | | | | | |
| | |
Fund share transactions | | | | | | | | |
Net proceeds from shares sold (500,000 and 1,225,000 shares, respectively) | | | 17,014,419 | | | | 47,478,094 | |
Shares sold in-kind (425,000 and 0 shares, respectively) | | | 14,435,556 | | | | — | |
Shares redeemed in-kind (0 and 475,000 shares, respectively) | | | — | | | | (19,479,038 | ) |
Cost of shares purchased (325,000 and 125,000 shares, respectively) | | | (11,039,936 | ) | | | (4,390,976 | ) |
| | | | | | | | |
Net increase (decrease) in net assets from Fund share transactions | | | 20,410,039 | | | | 23,608,080 | |
| | | | | | | | |
Total increase (decrease) | | | 19,254,089 | | | | 7,420,003 | |
| | |
| Net Assets: | | | | | | |
| | |
Beginning of year | | | 94,395,860 | | | | 86,975,857 | |
| | | | | | | | |
End of year | | $ | 113,649,949 | | | $ | 94,395,860 | |
| | | | | | | | |
See Notes to Financial Statements.
126
PGIM Active High Yield Bond ETF
Financial Highlights
| | | | | | | | | | | | | | | | | | | | | | | | | | | | |
| | | | | |
| | | Year Ended August 31, | | | September 24, 2018(a)
through August 31, 2019 | |
| | | 2023 | | | 2022 | | | 2021 | | | 2020 | |
| | | | | | | | |
| Per Share Operating Performance(b): | | | | | | | | | | | | | | | | | | | | | | | | | | | | |
| Net Asset Value, Beginning of Period | | | $34.64 | | | | $41.42 | | | | $39.99 | | | | $40.96 | | | | | | | | $40.00 | | | | | |
| Income (loss) from investment operations: | | | | | | | | | | | | | | | | | | | | | | | | | | | | |
| Net investment income (loss) | | | 2.39 | | | | 1.85 | | | | 1.95 | | | | 2.49 | | | | | | | | 2.30 | | | | | |
| Net realized and unrealized gain (loss) on investment and foreign currency transactions | | | (0.32 | ) | | | (6.23 | ) | | | 2.30 | | | | (0.49 | ) | | | | | | | 0.85 | | | | | |
| Total from investment operations | | | 2.07 | | | | (4.38 | ) | | | 4.25 | | | | 2.00 | | | | | | | | 3.15 | | | | | |
| Less Dividends and Distributions: | | | | | | | | | | | | | | | | | | | | | | | | | | | | |
| Dividends from net investment income | | | (2.53 | ) | | | (1.92 | ) | | | (2.24 | ) | | | (2.55 | ) | | | | | | | (2.19 | ) | | | | |
| Distributions from net realized gains | | | - | | | | (0.48 | ) | | | (0.58 | ) | | | (0.42 | ) | | | | | | | - | | | | | |
| Total dividends and distributions | | | (2.53 | ) | | | (2.40 | ) | | | (2.82 | ) | | | (2.97 | ) | | | | | | | (2.19 | ) | | | | |
| Net asset value, end of period | | | $34.18 | | | | $34.64 | | | | $41.42 | | | | $39.99 | | | | | | | | $40.96 | | | | | |
| Total Return(c): | | | 6.32 | % | | | (11.01 | )% | | | 11.00 | % | | | 5.24 | % | | | | | | | 8.20 | % | | | | |
| | | | | | | | |
| | | | | | | | | | | | | | | | | | | | | | | | | | | | | |
| | | | | | | | |
| Ratios/Supplemental Data: | | | | | | | | | | | | | | | | | | | | | | | | | | | | |
| Net assets, end of period (000) | | | $113,650 | | | | $94,396 | | | | $86,976 | | | | $34,994 | | | | | | | | $27,649 | | | | | |
| Average net assets (000) | | | $91,165 | | | | $85,683 | | | | $58,270 | | | | $29,367 | | | | | | | | $26,467 | | | | | |
| Ratios to average net assets(d): | | | | | | | | | | | | | | | | | | | | | | | | | | | | |
| Expenses after waivers and/or expense reimbursement | | | 0.53 | % | | | 0.53 | % | | | 0.53 | % | | | 0.53 | % | | | | | | | 0.52 | %(e) | | | | |
| Expenses before waivers and/or expense reimbursement | | | 0.53 | % | | | 0.53 | % | | | 0.53 | % | | | 0.53 | % | | | | | | | 0.53 | %(e) | | | | |
| Net investment income (loss) | | | 7.06 | % | | | 4.87 | % | | | 4.76 | % | | | 6.37 | % | | | | | | | 6.15 | %(e) | | | | |
| Portfolio turnover rate(f) | | | 35 | % | | | 31 | % | | | 85 | % | | | 57 | % | | | | | | | 55 | % | | | | |
| (a) | Commencement of operations. |
| (b) | Calculated based on average shares outstanding during the period. |
| (c) | Total return is calculated assuming a purchase of a share on the first day and a sale on the last day of each period reported and includes reinvestment of dividends and distributions, if any. Total returns may reflect adjustments to conform to GAAP. Total returns for periods less than one full year are not annualized. |
| (d) | Does not include expenses of the underlying funds in which the Fund invests. |
| (f) | The Fund’s portfolio turnover rate is calculated in accordance with regulatory requirements, without regard to transactions involving short-term investments, certain derivatives and in-kind transactions (if any). If such transactions were included, the Fund’s portfolio turnover rate may be higher. |
See Notes to Financial Statements.
PGIM Fixed Income ETFs 127
PGIM Active Aggregate Bond ETF
Schedule of Investments
as of August 31, 2023
| | | | | | | | | | | | |
| | | | |
| Description | | Interest
Rate | | Maturity
Date | | Principal Amount (000)# | | | Value | |
| | | | |
LONG-TERM INVESTMENTS 99.6% | | | | | | | | | | | | |
| | | | |
ASSET-BACKED SECURITIES 14.1% | | | | | | | | | | | | |
| | | | |
Automobiles 4.3% | | | | | | | | | | | | |
| | | | |
Americredit Automobile Receivables Trust, | | | | | | | | | | | | |
Series 2023-01, Class C | | 5.800% | | 12/18/28 | | | 100 | | | $ | 99,364 | |
Avis Budget Rental Car Funding AESOP LLC, | | | | | | | | | | | | |
Series 2022-01A, Class A, 144A | | 3.830 | | 08/21/28 | | | 100 | | | | 93,249 | |
Series 2023-03A, Class A, 144A | | 5.440 | | 02/22/28 | | | 200 | | | | 197,960 | |
BOF VII AL Funding Trust I, | | | | | | | | | | | | |
Series 2023-CAR03, Class A2, 144A | | 6.291 | | 07/26/32 | | | 186 | | | | 181,117 | |
CarMax Auto Owner Trust, | | | | | | | | | | | | |
Series 2022-01, Class D | | 2.470 | | 07/17/28 | | | 100 | | | | 90,775 | |
Enterprise Fleet Financing LLC, | | | | | | | | | | | | |
Series 2023-02, Class A2, 144A | | 5.560 | | 04/22/30 | | | 100 | | | | 99,551 | |
Ford Credit Auto Owner Trust, | | | | | | | | | | | | |
Series 2023-01, Class A, 144A | | 4.850 | | 08/15/35 | | | 100 | | | | 98,572 | |
Series 2023-02, Class A, 144A | | 5.280 | | 02/15/36 | | | 100 | | | | 100,375 | |
Ford Credit Floorplan Master Owner Trust A, | | | | | | | | | | | | |
Series 2023-01, Class A1, 144A | | 4.920 | | 05/15/28 | | | 100 | | | | 98,815 | |
Hertz Vehicle Financing III LLC, | | | | | | | | | | | | |
Series 2023-01A, Class A, 144A | | 5.490 | | 06/25/27 | | | 100 | | | | 98,859 | |
Series 2023-03A, Class A, 144A | | 5.940 | | 02/25/28 | | | 100 | | | | 100,059 | |
Hertz Vehicle Financing LLC, | | | | | | | | | | | | |
Series 2022-02A, Class A, 144A | | 2.330 | | 06/26/28 | | | 100 | | | | 88,900 | |
OneMain Direct Auto Receivables Trust, | | | | | | | | | | | | |
Series 2023-01A, Class A, 144A | | 5.410 | | 11/14/29 | | | 200 | | | | 198,291 | |
Santander Drive Auto Receivables Trust, | | | | | | | | | | | | |
Series 2023-03, Class C | | 5.770 | | 11/15/30 | | | 100 | | | | 99,470 | |
Series 2023-04, Class C | | 6.040 | | 12/15/31 | | | 100 | | | | 100,521 | |
Wheels Fleet Lease Funding LLC, | | | | | | | | | | | | |
Series 2023-01A, Class A, 144A | | 5.800 | | 04/18/38 | | | 100 | | | | 99,652 | |
| | | | | | | | | | | | |
| | | | |
| | | | | | | | | | | 1,845,530 | |
| | | | |
Collateralized Loan Obligations 9.2% | | | | | | | | | | | | |
| | | | |
AIG CLO LLC, | | | | | | | | | | | | |
Series 2018-01A, Class A1R, 144A, 3 Month SOFR + 1.382% (Cap N/A, Floor 1.382%) | | 6.708(c) | | 04/20/32 | | | 400 | | | | 398,500 | |
Anchorage Capital CLO Ltd. (Cayman Islands), | | | | | | | | | | | | |
Series 2022-25A, Class A1, 144A, 3 Month SOFR + 1.390% (Cap N/A, Floor 1.390%) | | 6.716(c) | | 04/20/35 | | | 250 | | | | 245,625 | |
See Notes to Financial Statements.
128
PGIM Active Aggregate Bond ETF
Schedule of Investments (continued)
as of August 31, 2023
| | | | | | | | | | | | |
| | | | |
| Description | | Interest
Rate | | Maturity
Date | | Principal Amount (000)# | | | Value | |
| | | | |
ASSET-BACKED SECURITIES (Continued) | | | | | | | | | | | | |
| | | | |
Collateralized Loan Obligations (cont’d.) | | | | | | | | | | | | |
| | | | |
Atlas Senior Loan Fund Ltd. (Cayman Islands), | | | | | | | | | | | | |
Series 2016-07A, Class A1R2, 144A, 3 Month SOFR + 1.362% (Cap N/A, Floor 1.100%) | | 6.750%(c) | | 11/27/31 | | | 249 | | | $ | 247,106 | |
Bain Capital Credit CLO Ltd. (Cayman Islands), | | | | | | | | | | | | |
Series 2022-01A, Class A1, 144A, 3 Month SOFR + 1.320% (Cap N/A, Floor 1.320%) | | 6.630(c) | | 04/18/35 | | | 250 | | | | 246,637 | |
Balboa Bay Loan Funding Ltd. (Cayman Islands), | | | | | | | | | | | | |
Series 2020-01A, Class AR, 144A, 3 Month SOFR + 1.382% (Cap N/A, Floor 1.120%) | | 6.715(c) | | 01/20/32 | | | 250 | | | | 248,898 | |
Crown City CLO (Cayman Islands), | | | | | | | | | | | | |
Series 2020-02A, Class A1AR, 144A, 3 Month SOFR + 1.340% (Cap N/A, Floor 1.340%) | | 6.666(c) | | 04/20/35 | | | 250 | | | | 246,339 | |
Elevation CLO Ltd. (Cayman Islands), | | | | | | | | | | | | |
Series 2021-13A, Class A1, 144A, 3 Month SOFR + 1.452% (Cap N/A, Floor 1.190%) | | 6.760(c) | | 07/15/34 | | | 250 | | | | 245,346 | |
HPS Loan Management Ltd. (Cayman Islands), | | | | | | | | | | | | |
Series 10A-16, Class A1RR, 144A, 3 Month SOFR + 1.402% (Cap N/A, Floor 1.140%) | | 6.728(c) | | 04/20/34 | | | 250 | | | | 247,500 | |
ICG US CLO Ltd. (Cayman Islands), | | | | | | | | | | | | |
Series 2015-02RA, Class A1, 144A, 3 Month SOFR + 1.632% (Cap N/A, Floor 1.370%) | | 6.940(c) | | 01/16/33 | | | 250 | | | | 249,606 | |
Madison Park Funding Ltd. (Cayman Islands), | | | | | | | | | | | | |
Series 2019-33A, Class AR, 144A, 3 Month SOFR + 1.290% (Cap N/A, Floor 1.290%) | | 6.598(c) | | 10/15/32 | | | 250 | | | | 247,813 | |
Northwoods Capital Ltd. (Cayman Islands), | | | | | | | | | | | | |
Series 2017-15A, Class A1R, 144A, 3 Month LIBOR + 1.210% (Cap N/A, Floor 1.210%) | | 6.720(c) | | 06/20/34 | | | 250 | | | | 247,249 | |
Romark CLO Ltd. (Cayman Islands), | | | | | | | | | | | | |
Series 2021-04A, Class A1, 144A, 3 Month SOFR + 1.432% (Cap N/A, Floor 1.170%) | | 6.713(c) | | 07/10/34 | | | 400 | | | | 395,713 | |
TCW CLO Ltd. (Cayman Islands), | | | | | | | | | | | | |
Series 2019-02A, Class A1R, 144A, 3 Month SOFR + 1.280% (Cap N/A, Floor 1.280%) | | 6.606(c) | | 10/20/32 | | | 250 | | | | 247,058 | |
Whitebox CLO Ltd. (Cayman Islands), | | | | | | | | | | | | |
Series 2019-01A, Class ANAR, 144A, 3 Month SOFR + 1.392% (Cap N/A, Floor 1.130%) | | 6.737(c) | | 07/24/32 | | | 500 | | | | 496,544 | |
| | | | | | | | | | | | |
| | | | |
| | | | | | | | | | | 4,009,934 | |
See Notes to Financial Statements.
PGIM Fixed Income ETFs 129
PGIM Active Aggregate Bond ETF
Schedule of Investments (continued)
as of August 31, 2023
| | | | | | | | | | | | | | | | |
| | | | |
| Description | | Interest
Rate | | | Maturity
Date | | | Principal Amount (000)# | | | Value | |
| | | | |
ASSET-BACKED SECURITIES (Continued) | | | | | | | | | | | | | | | | |
| | | | |
Consumer Loans 0.6% | | | | | | | | | | | | | | | | |
| | | | |
OneMain Financial Issuance Trust, | | | | | | | | | | | | | | | | |
Series 2020-02A, Class A, 144A | | | 1.750% | | | | 09/14/35 | | | | 200 | | | $ | 180,243 | |
Series 2023-02A, Class A1, 144A | | | 5.840 | | | | 09/15/36 | | | | 100 | | | | 100,403 | |
| | | | | | | | | | | | | | | | |
| | | | |
| | | | | | | | | | | | | | | 280,646 | |
| | | | | | | | | | | | | | | | |
| | | | |
TOTAL ASSET-BACKED SECURITIES
(cost $6,230,725) | | | | | | | | | | | | | | | 6,136,110 | |
| | | | | | | | | | | | | | | | |
| | | | |
COMMERCIAL MORTGAGE-BACKED SECURITIES 11.4% | | | | | | | | | | | | | | | | |
| | | | |
BANK, | | | | | | | | | | | | | | | | |
Series 2019-BN22, Class A3 | | | 2.726 | | | | 11/15/62 | | | | 250 | | | | 213,729 | |
Series 2021-BN38, Class A4 | | | 2.275 | | | | 12/15/64 | | | | 100 | | | | 79,101 | |
Barclays Commercial Mortgage Securities Trust, | | | | | | | | | | | | | | | | |
Series 2021-C12, Class A4 | | | 2.421 | | | | 11/15/54 | | | | 250 | | | | 204,634 | |
Benchmark Mortgage Trust, | | | | | | | | | | | | | | | | |
Series 2021-B25, Class A3 | | | 1.906 | | | | 04/15/54 | | | | 500 | | | | 409,882 | |
Series 2021-B31, Class A4 | | | 2.420 | | | | 12/15/54 | | | | 100 | | | | 80,219 | |
CD Mortgage Trust, | | | | | | | | | | | | | | | | |
Series 2019-CD08, Class A3 | | | 2.657 | | | | 08/15/57 | | | | 500 | | | | 420,506 | |
Commercial Mortgage Trust, | | | | | | | | | | | | | | | | |
Series 2014-UBS04, Class A4 | | | 3.420 | | | | 08/10/47 | | | | 500 | | | | 486,721 | |
Series 2015-DC01, Class A5 | | | 3.350 | | | | 02/10/48 | | | | 500 | | | | 478,372 | |
GS Mortgage Securities Trust, | | | | | | | | | | | | | | | | |
Series 2019-GC42, Class A3 | | | 2.749 | | | | 09/10/52 | | | | 250 | | | | 215,229 | |
JPMCC Commercial Mortgage Securities Trust, | | | | | | | | | | | | | | | | |
Series 2019-COR05, Class A3 | | | 3.123 | | | | 06/13/52 | | | | 500 | | | | 429,827 | |
Wells Fargo Commercial Mortgage Trust, | | | | | | | | | | | | | | | | |
Series 2017-C39, Class A4 | | | 3.157 | | | | 09/15/50 | | | | 500 | | | | 456,958 | |
Series 2019-C52, Class A4 | | | 2.643 | | | | 08/15/52 | | | | 436 | | | | 376,937 | |
Series 2020-C56, Class A1 | | | 1.341 | | | | 06/15/53 | | | | 397 | | | | 389,649 | |
Series 2020-C56, Class A4 | | | 2.194 | | | | 06/15/53 | | | | 500 | | | | 409,214 | |
Series 2021-C59, Class A3 | | | 1.958 | | | | 04/15/54 | | | | 350 | | | | 293,964 | |
| | | | | | | | | | | | | | | | |
| | | | |
TOTAL COMMERCIAL MORTGAGE-BACKED SECURITIES
(cost $5,671,147) | | | | | | | | | | | | | | | 4,944,942 | |
| | | | | | | | | | | | | | | | |
See Notes to Financial Statements.
130
PGIM Active Aggregate Bond ETF
Schedule of Investments (continued)
as of August 31, 2023
| | | | | | | | | | | | | | | | |
| | | | |
| Description | | Interest
Rate | | | Maturity
Date | | | Principal Amount (000)# | | | Value | |
| | | | |
CORPORATE BONDS 31.4% | | | | | | | | | | | | | | | | |
| | | | |
Aerospace & Defense 0.8% | | | | | | | | | | | | | | | | |
| | | | |
Boeing Co. (The), | | | | | | | | | | | | | | | | |
Sr. Unsec’d. Notes | | | 2.196% | | | | 02/04/26 | | | | 253 | | | $ | 233,430 | |
Sr. Unsec’d. Notes | | | 2.950 | | | | 02/01/30 | | | | 50 | | | | 43,277 | |
Sr. Unsec’d. Notes | | | 3.625 | | | | 03/01/48 | | | | 35 | | | | 24,423 | |
Sr. Unsec’d. Notes | | | 5.930 | | | | 05/01/60 | | | | 20 | | | | 19,320 | |
RTX Corp., | | | | | | | | | | | | | | | | |
Sr. Unsec’d. Notes | | | 2.375 | | | | 03/15/32 | | | | 25 | | | | 20,099 | |
Sr. Unsec’d. Notes | | | 4.125 | | | | 11/16/28 | | | | 13 | | | | 12,403 | |
| | | | | | | | | | | | | | | | |
| | | | |
| | | | | | | | | | | | | | | 352,952 | |
| | | | |
Agriculture 0.4% | | | | | | | | | | | | | | | | |
| | | | |
Altria Group, Inc., | | | | | | | | | | | | | | | | |
Gtd. Notes | | | 3.400 | | | | 05/06/30 | | | | 48 | | | | 42,213 | |
Gtd. Notes | | | 3.400 | | | | 02/04/41 | | | | 50 | | | | 34,021 | |
BAT Capital Corp. (United Kingdom), | | | | | | | | | | | | | | | | |
Gtd. Notes | | | 3.557 | | | | 08/15/27 | | | | 23 | | | | 21,305 | |
Philip Morris International, Inc., | | | | | | | | | | | | | | | | |
Sr. Unsec’d. Notes | | | 5.125 | | | | 02/15/30 | | | | 35 | | | | 34,599 | |
Sr. Unsec’d. Notes | | | 5.375 | | | | 02/15/33 | | | | 10 | | | | 9,873 | |
Sr. Unsec’d. Notes | | | 5.625 | | | | 11/17/29 | | | | 15 | | | | 15,136 | |
| | | | | | | | | | | | | | | | |
| | | | |
| | | | | | | | | | | | | | | 157,147 | |
| | | | |
Airlines 0.1% | | | | | | | | | | | | | | | | |
| | | | |
Southwest Airlines Co., | | | | | | | | | | | | | | | | |
Sr. Unsec’d. Notes | | | 5.125 | | | | 06/15/27 | | | | 50 | | | | 49,374 | |
United Airlines 2013-1 Class A Pass-Through Trust, | | | | | | | | | | | | | | | | |
Pass-Through Certificates | | | 4.300 | | | | 02/15/27 | | | | 8 | | | | 7,953 | |
| | | | | | | | | | | | | | | | |
| | | | |
| | | | | | | | | | | | | | | 57,327 | |
| | | | |
Auto Manufacturers 0.5% | | | | | | | | | | | | | | | | |
| | | | |
Daimler Truck Finance North America LLC (Germany), | | | | | | | | | | | | | | | | |
Gtd. Notes, 144A | | | 1.625 | | | | 12/13/24 | | | | 150 | | | | 142,256 | |
General Motors Co., | | | | | | | | | | | | | | | | |
Sr. Unsec’d. Notes | | | 6.250 | | | | 10/02/43 | | | | 51 | | | | 47,941 | |
Sr. Unsec’d. Notes | | | 6.600 | | | | 04/01/36 | | | | 17 | | | | 17,112 | |
See Notes to Financial Statements.
PGIM Fixed Income ETFs 131
PGIM Active Aggregate Bond ETF
Schedule of Investments (continued)
as of August 31, 2023
| | | | | | | | | | | | | | | | |
| | | | |
| Description | | Interest
Rate | | | Maturity
Date | | | Principal Amount (000)# | | | Value | |
| | | | |
CORPORATE BONDS (Continued) | | | | | | | | | | | | | | | | |
| | | | |
Auto Manufacturers (cont’d.) | | | | | | | | | | | | | | | | |
| | | | |
Toyota Motor Credit Corp., | | | | | | | | | | | | | | | | |
Sr. Unsec’d. Notes, MTN | | | 0.800% | | | | 10/16/25 | | | | 17 | | | $ | 15,504 | |
| | | | | | | | | | | | | | | | |
| | | | |
| | | | | | | | | | | | | | | 222,813 | |
| | | | |
Banks 8.7% | | | | | | | | | | | | | | | | |
| | | | |
Bank of America Corp., | | | | | | | | | | | | | | | | |
Sr. Unsec’d. Notes | | | 2.299(ff) | | | | 07/21/32 | | | | 60 | | | | 47,312 | |
Sr. Unsec’d. Notes | | | 2.687(ff) | | | | 04/22/32 | | | | 165 | | | | 134,859 | |
Sr. Unsec’d. Notes, MTN | | | 2.496(ff) | | | | 02/13/31 | | | | 375 | | | | 311,650 | |
Sr. Unsec’d. Notes, MTN | | | 3.970(ff) | | | | 03/05/29 | | | | 175 | | | | 163,267 | |
Sr. Unsec’d. Notes, Series N | | | 1.658(ff) | | | | 03/11/27 | | | | 30 | | | | 27,098 | |
Sub. Notes, MTN | | | 4.450 | | | | 03/03/26 | | | | 115 | | | | 111,804 | |
Barclays PLC (United Kingdom), | | | | | | | | | | | | | | | | |
Sr. Unsec’d. Notes | | | 5.829(ff) | | | | 05/09/27 | | | | 200 | | | | 198,050 | |
Citigroup, Inc., | | | | | | | | | | | | | | | | |
Sr. Unsec’d. Notes | | | 2.666(ff) | | | | 01/29/31 | | | | 210 | | | | 175,805 | |
Sr. Unsec’d. Notes | | | 2.976(ff) | | | | 11/05/30 | | | | 120 | | | | 103,175 | |
Sr. Unsec’d. Notes | | | 3.700 | | | | 01/12/26 | | | | 64 | | | | 61,359 | |
Sub. Notes | | | 4.400 | | | | 06/10/25 | | | | 55 | | | | 53,630 | |
Deutsche Bank AG (Germany), | | | | | | | | | | | | | | | | |
Sr. Unsec’d. Notes, MTN | | | 3.700 | | | | 05/30/24 | | | | 62 | | | | 60,835 | |
Fifth Third Bancorp, | | | | | | | | | | | | | | | | |
Sr. Unsec’d. Notes | | | 6.339(ff) | | | | 07/27/29 | | | | 15 | | | | 15,176 | |
Goldman Sachs Group, Inc. (The), | | | | | | | | | | | | | | | | |
Sr. Unsec’d. Notes | | | 1.992(ff) | | | | 01/27/32 | | | | 165 | | | | 128,511 | |
Sr. Unsec’d. Notes | | | 2.615(ff) | | | | 04/22/32 | | | | 85 | | | | 68,808 | |
Sr. Unsec’d. Notes | | | 3.750 | | | | 02/25/26 | | | | 25 | | | | 23,966 | |
Sr. Unsec’d. Notes | | | 3.814(ff) | | | | 04/23/29 | | | | 80 | | | | 74,001 | |
Huntington Bancshares, Inc., | | | | | | | | | | | | | | | | |
Sr. Unsec’d. Notes | | | 6.208(ff) | | | | 08/21/29 | | | | 10 | | | | 10,065 | |
JPMorgan Chase & Co., | | | | | | | | | | | | | | | | |
Sr. Unsec’d. Notes | | | 1.578(ff) | | | | 04/22/27 | | | | 100 | | | | 89,801 | |
Sr. Unsec’d. Notes | | | 1.953(ff) | | | | 02/04/32 | | | | 130 | | | | 102,441 | |
Sr. Unsec’d. Notes | | | 2.522(ff) | | | | 04/22/31 | | | | 370 | | | | 310,129 | |
Sr. Unsec’d. Notes | | | 2.545(ff) | | | | 11/08/32 | | | | 5 | | | | 4,032 | |
Sr. Unsec’d. Notes | | | 2.580(ff) | | | | 04/22/32 | | | | 42 | | | | 34,367 | |
Sr. Unsec’d. Notes | | | 2.739(ff) | | | | 10/15/30 | | | | 150 | | | | 128,556 | |
Sr. Unsec’d. Notes | | | 3.509(ff) | | | | 01/23/29 | | | | 100 | | | | 92,169 | |
Sub. Notes | | | 2.956(ff) | | | | 05/13/31 | | | | 21 | | | | 17,832 | |
See Notes to Financial Statements.
132
PGIM Active Aggregate Bond ETF
Schedule of Investments (continued)
as of August 31, 2023
| | | | | | | | | | | | | | | | |
| | | | |
| Description | | Interest
Rate | | | Maturity
Date | | | Principal Amount (000)# | | | Value | |
| | | | |
CORPORATE BONDS (Continued) | | | | | | | | | | | | | | | | |
| | | | |
Banks (cont’d.) | | | | | | | | | | | | | | | | |
| | | | |
JPMorgan Chase & Co., (cont’d.) | | | | | | | | | | | | | | | | |
Sub. Notes | | | 4.250% | | | | 10/01/27 | | | | 21 | | | $ | 20,308 | |
Morgan Stanley, | | | | | | | | | | | | | | | | |
Sr. Unsec’d. Notes, GMTN | | | 1.512(ff) | | | | 07/20/27 | | | | 270 | | | | 239,684 | |
Sr. Unsec’d. Notes, GMTN | | | 2.239(ff) | | | | 07/21/32 | | | | 40 | | | | 31,382 | |
Sr. Unsec’d. Notes, GMTN | | | 2.699(ff) | | | | 01/22/31 | | | | 255 | | | | 214,759 | |
Sr. Unsec’d. Notes, GMTN | | | 3.772(ff) | | | | 01/24/29 | | | | 110 | | | | 101,986 | |
Sr. Unsec’d. Notes, GMTN | | | 3.875 | | | | 01/27/26 | | | | 76 | | | | 73,138 | |
Sr. Unsec’d. Notes, MTN | | | 1.928(ff) | | | | 04/28/32 | | | | 165 | | | | 127,198 | |
PNC Financial Services Group, Inc. (The), | | | | | | | | | | | | | | | | |
Sr. Unsec’d. Notes | | | 5.582(ff) | | | | 06/12/29 | | | | 25 | | | | 24,790 | |
Sr. Unsec’d. Notes | | | 5.812(ff) | | | | 06/12/26 | | | | 105 | | | | 104,890 | |
Truist Financial Corp., | | | | | | | | | | | | | | | | |
Sr. Unsec’d. Notes, MTN | | | 5.867(ff) | | | | 06/08/34 | | | | 15 | | | | 14,873 | |
U.S. Bancorp, | | | | | | | | | | | | | | | | |
Sr. Unsec’d. Notes | | | 5.836(ff) | | | | 06/12/34 | | | | 20 | | | | 19,951 | |
Wells Fargo & Co., | | | | | | | | | | | | | | | | |
Sr. Unsec’d. Notes, MTN | | | 2.572(ff) | | | | 02/11/31 | | | | 282 | | | | 235,413 | |
| | | | | | | | | | | | | | | | |
| | | | |
| | | | | | | | | | | | | | | 3,757,070 | |
| | | | |
Beverages 0.4% | | | | | | | | | | | | | | | | |
| | | | |
Bacardi Ltd. (Bermuda), | | | | | | | | | | | | | | | | |
Gtd. Notes, 144A | | | 4.450 | | | | 05/15/25 | | | | 110 | | | | 106,996 | |
Constellation Brands, Inc., | | | | | | | | | | | | | | | | |
Sr. Unsec’d. Notes | | | 2.250 | | | | 08/01/31 | | | | 80 | | | | 64,296 | |
| | | | | | | | | | | | | | | | |
| | | | |
| | | | | | | | | | | | | | | 171,292 | |
| | | | |
Biotechnology 0.3% | | | | | | | | | | | | | | | | |
| | | | |
Amgen, Inc., | | | | | | | | | | | | | | | | |
Sr. Unsec’d. Notes | | | 2.800 | | | | 08/15/41 | | | | 45 | | | | 31,025 | |
Sr. Unsec’d. Notes | | | 5.250 | | | | 03/02/30 | | | | 80 | | | | 80,040 | |
| | | | | | | | | | | | | | | | |
| | | | |
| | | | | | | | | | | | | | | 111,065 | |
| | | | |
Building Materials 0.1% | | | | | | | | | | | | | | | | |
| | | | |
Martin Marietta Materials, Inc., | | | | | | | | | | | | | | | | |
Sr. Unsec’d. Notes | | | 2.400 | | | | 07/15/31 | | | | 11 | | | | 8,892 | |
Sr. Unsec’d. Notes | | | 4.250 | | | | 07/02/24 | | | | 21 | | | | 20,725 | |
See Notes to Financial Statements.
PGIM Fixed Income ETFs 133
PGIM Active Aggregate Bond ETF
Schedule of Investments (continued)
as of August 31, 2023
| | | | | | | | | | | | | | | | |
| | | | |
| Description | | Interest
Rate | | | Maturity
Date | | | Principal Amount (000)# | | | Value | |
| | | | |
CORPORATE BONDS (Continued) | | | | | | | | | | | | | | | | |
| | | | |
Building Materials (cont’d.) | | | | | | | | | | | | | | | | |
| | | | |
Owens Corning, | | | | | | | | | | | | | | | | |
Sr. Unsec’d. Notes | | | 3.400% | | | | 08/15/26 | | | | 25 | | | $ | 23,615 | |
Vulcan Materials Co., | | | | | | | | | | | | | | | | |
Sr. Unsec’d. Notes | | | 3.500 | | | | 06/01/30 | | | | 13 | | | | 11,647 | |
| | | | | | | | | | | | | | | | |
| | | | |
| | | | | | | | | | | | | | | 64,879 | |
| | | | |
Chemicals 0.3% | | | | | | | | | | | | | | | | |
| | | | |
Dow Chemical Co. (The), | | | | | | | | | | | | | | | | |
Sr. Unsec’d. Notes | | | 3.600 | | | | 11/15/50 | | | | 17 | | | | 12,132 | |
FMC Corp., | | | | | | | | | | | | | | | | |
Sr. Unsec’d. Notes | | | 3.450 | | | | 10/01/29 | | | | 90 | | | | 78,442 | |
Sr. Unsec’d. Notes | | | 4.500 | | | | 10/01/49 | | | | 13 | | | | 9,689 | |
LYB International Finance III LLC, | | | | | | | | | | | | | | | | |
Gtd. Notes | | | 4.200 | | | | 10/15/49 | | | | 17 | | | | 12,647 | |
Nutrien Ltd. (Canada), | | | | | | | | | | | | | | | | |
Sr. Unsec’d. Notes | | | 4.900 | | | | 03/27/28 | | | | 15 | | | | 14,660 | |
Sr. Unsec’d. Notes | | | 4.900 | | | | 06/01/43 | | | | 21 | | | | 18,367 | |
| | | | | | | | | | | | | | | | |
| | | | |
| | | | | | | | | | | | | | | 145,937 | |
| | | | |
Commercial Services 1.1% | | | | | | | | | | | | | | | | |
| | | | |
California Institute of Technology, | | | | | | | | | | | | | | | | |
Sr. Unsec’d. Notes | | | 3.650 | | | | 09/01/2119 | | | | 20 | | | | 12,920 | |
Equifax, Inc., | | | | | | | | | | | | | | | | |
Sr. Unsec’d. Notes | | | 2.350 | | | | 09/15/31 | | | | 20 | | | | 15,689 | |
Sr. Unsec’d. Notes | | | 2.600 | | | | 12/01/24 | | | | 101 | | | | 97,068 | |
ERAC USA Finance LLC, | | | | | | | | | | | | | | | | |
Gtd. Notes, 144A | | | 3.300 | | | | 12/01/26 | | | | 45 | | | | 41,977 | |
Global Payments, Inc., | | | | | | | | | | | | | | | | |
Sr. Unsec’d. Notes | | | 1.200 | | | | 03/01/26 | | | | 21 | | | | 18,771 | |
Johns Hopkins University, | | | | | | | | | | | | | | | | |
Unsec’d. Notes, Series A | | | 4.705 | | | | 07/01/32 | | | | 20 | | | | 19,861 | |
Massachusetts Institute of Technology, | | | | | | | | | | | | | | | | |
Sr. Unsec’d. Notes, Series F | | | 2.989 | | | | 07/01/50 | | | | 10 | | | | 7,204 | |
Unsec’d. Notes | | | 4.678 | | | | 07/01/2114 | | | | 30 | | | | 27,026 | |
President & Fellows of Harvard College, | | | | | | | | | | | | | | | | |
Unsec’d. Notes | | | 2.517 | | | | 10/15/50 | | | | 35 | | | | 22,685 | |
Unsec’d. Notes | | | 3.150 | | | | 07/15/46 | | | | 35 | | | | 25,913 | |
See Notes to Financial Statements.
134
PGIM Active Aggregate Bond ETF
Schedule of Investments (continued)
as of August 31, 2023
| | | | | | | | | | | | | | | | |
| | | | |
| Description | | Interest
Rate | | | Maturity
Date | | | Principal
Amount (000)# | | | Value | |
| | | | |
CORPORATE BONDS (Continued) | | | | | | | | | | | | | | | | |
| | | | |
Commercial Services (cont’d.) | | | | | | | | | | | | | | | | |
| | | | |
Thomas Jefferson University, | | | | | | | | | | | | | | | | |
Sec’d. Notes | | | 3.847% | | | | 11/01/57 | | | | 45 | | | $ | 31,618 | |
Trustees of Boston University, | | | | | | | | | | | | | | | | |
Sec’d. Notes, Series CC | | | 4.061 | | | | 10/01/48 | | | | 20 | | | | 16,825 | |
Trustees of the University of Pennsylvania (The), | | | | | | | | | | | | | | | | |
Sr. Unsec’d. Notes | | | 3.610 | | | | 02/15/2119 | | | | 25 | | | | 17,355 | |
University of Southern California, | | | | | | | | | | | | | | | | |
Sr. Unsec’d. Notes | | | 4.976 | | | | 10/01/53 | | | | 32 | | | | 31,344 | |
Unsec’d. Notes, Series 2017 | | | 3.841 | | | | 10/01/47 | | | | 10 | | | | 8,295 | |
Washington University (The), | | | | | | | | | | | | | | | | |
Sr. Unsec’d. Notes, Series 2022 | | | 3.524 | | | | 04/15/54 | | | | 80 | | | | 61,942 | |
Yale University, | | | | | | | | | | | | | | | | |
Unsec’d. Notes, Series 2020 | | | 2.402 | | | | 04/15/50 | | | | 20 | | | | 12,625 | |
| | | | | | | | | | | | | | | | |
| | | | |
| | | | | | | | | | | | | | | 469,118 | |
| | | | |
Computers 0.1% | | | | | | | | | | | | | | | | |
| | | | |
Apple, Inc., | | | | | | | | | | | | | | | | |
Sr. Unsec’d. Notes | | | 3.250 | | | | 02/23/26 | | | | 40 | | | | 38,459 | |
International Business Machines Corp., | | | | | | | | | | | | | | | | |
Sr. Unsec’d. Notes | | | 5.875 | | | | 11/29/32 | | | | 8 | | | | 8,486 | |
| | | | | | | | | | | | | | | | |
| | | | |
| | | | | | | | | | | | | | | 46,945 | |
| | | | |
Diversified Financial Services 0.2% | | | | | | | | | | | | | | | | |
| | | | |
Discover Financial Services, | | | | | | | | | | | | | | | | |
Sr. Unsec’d. Notes | | | 3.750 | | | | 03/04/25 | | | | 21 | | | | 20,132 | |
Jefferies Financial Group, Inc., | | | | | | | | | | | | | | | | |
Sr. Unsec’d. Notes | | | 2.625 | | | | 10/15/31 | | | | 25 | | | | 19,497 | |
Sr. Unsec’d. Notes | | | 5.875 | | | | 07/21/28 | | | | 55 | | | | 54,401 | |
| | | | | | | | | | | | | | | | |
| | | | |
| | | | | | | | | | | | | | | 94,030 | |
| | | | |
Electric 3.4% | | | | | | | | | | | | | | | | |
| | | | |
AEP Texas, Inc., | | | | | | | | | | | | | | | | |
Sr. Unsec’d. Notes | | | 3.450 | | | | 05/15/51 | | | | 13 | | | | 8,851 | |
Sr. Unsec’d. Notes | | | 5.400 | | | | 06/01/33 | | | | 15 | | | | 14,836 | |
Sr. Unsec’d. Notes, Series I | | | 2.100 | | | | 07/01/30 | | | | 62 | | | | 50,252 | |
AEP Transmission Co. LLC, | | | | | | | | | | | | | | | | |
Sr. Unsec’d. Notes | | | 4.250 | | | | 09/15/48 | | | | 17 | | | | 14,105 | |
See Notes to Financial Statements.
PGIM Fixed Income ETFs 135
PGIM Active Aggregate Bond ETF
Schedule of Investments (continued)
as of August 31, 2023
| | | | | | | | | | | | |
| | | | |
| Description | | Interest
Rate | | Maturity
Date | | Principal
Amount
(000)# | | | Value | |
| | | | |
CORPORATE BONDS (Continued) | | | | | | | | | | | | |
| | | | |
Electric (cont’d.) | | | | | | | | | | | | |
| | | | |
Ameren Corp., | | | | | | | | | | | | |
Sr. Unsec’d. Notes | | 2.500% | | 09/15/24 | | | 21 | | | $ | 20,258 | |
Arizona Public Service Co., | | | | | | | | | | | | |
Sr. Unsec’d. Notes | | 2.600 | | 08/15/29 | | | 8 | | | | 6,939 | |
Sr. Unsec’d. Notes | | 3.500 | | 12/01/49 | | | 25 | | | | 16,944 | |
Sr. Unsec’d. Notes | | 6.350 | | 12/15/32 | | | 20 | | | | 21,063 | |
Commonwealth Edison Co., | | | | | | | | | | | | |
First Mortgage | | 4.900 | | 02/01/33 | | | 45 | | | | 44,231 | |
Connecticut Light & Power Co. (The), | | | | | | | | | | | | |
First Mortgage | | 5.250 | | 01/15/53 | | | 15 | | | | 14,651 | |
Consolidated Edison Co. of New York, Inc., | | | | | | | | | | | | |
Sr. Unsec’d. Notes, Series C | | 4.300 | | 12/01/56 | | | 4 | | | | 3,155 | |
Dominion Energy South Carolina, Inc., | | | | | | | | | | | | |
First Mortgage | | 4.600 | | 06/15/43 | | | 32 | | | | 28,212 | |
DTE Electric Co., | | | | | | | | | | | | |
General Ref. Mortgage, Series A | | 4.050 | | 05/15/48 | | | 21 | | | | 17,005 | |
Duke Energy Carolinas LLC, | | | | | | | | | | | | |
Sr. Unsec’d. Notes | | 6.100 | | 06/01/37 | | | 21 | | | | 21,620 | |
Duke Energy Florida LLC, | | | | | | | | | | | | |
First Mortgage | | 2.400 | | 12/15/31 | | | 95 | | | | 77,441 | |
Eversource Energy, | | | | | | | | | | | | |
Sr. Unsec’d. Notes, Series O | | 4.250 | | 04/01/29 | | | 41 | | | | 38,935 | |
Florida Power & Light Co., | | | | | | | | | | | | |
First Mortgage | | 4.050 | | 06/01/42 | | | 15 | | | | 12,642 | |
Jersey Central Power & Light Co., | | | | | | | | | | | | |
Sr. Unsec’d. Notes, 144A | | 4.700 | | 04/01/24 | | | 17 | | | | 16,843 | |
MidAmerican Energy Co., | | | | | | | | | | | | |
First Mortgage | | 4.250 | | 07/15/49 | | | 34 | | | | 27,960 | |
Mississippi Power Co., | | | | | | | | | | | | |
Sr. Unsec’d. Notes, Series 12-A | | 4.250 | | 03/15/42 | | | 33 | | | | 26,960 | |
Monongahela Power Co., | | | | | | | | | | | | |
First Mortgage, 144A | | 3.550 | | 05/15/27 | | | 96 | | | | 89,932 | |
NextEra Energy Capital Holdings, Inc., | | | | | | | | | | | | |
Gtd. Notes | | 6.051 | | 03/01/25 | | | 145 | | | | 145,600 | |
Northern States Power Co., | | | | | | | | | | | | |
First Mortgage | | 3.400 | | 08/15/42 | | | 34 | | | | 25,848 | |
NRG Energy, Inc., | | | | | | | | | | | | |
Sr. Sec’d. Notes, 144A | | 3.750 | | 06/15/24 | | | 17 | | | | 16,579 | |
Pacific Gas & Electric Co., | | | | | | | | | | | | |
First Mortgage | | 4.500 | | 07/01/40 | | | 30 | | | | 23,144 | |
See Notes to Financial Statements.
136
PGIM Active Aggregate Bond ETF
Schedule of Investments (continued)
as of August 31, 2023
| | | | | | | | | | | | |
| | | | |
| Description | | Interest
Rate | | Maturity
Date | | Principal
Amount (000)# | | | Value | |
| | | | |
CORPORATE BONDS (Continued) | | | | | | | | | | | | |
| | | | |
Electric (cont’d.) | | | | | | | | | | | | |
| | | | |
Pacific Gas & Electric Co., (cont’d.) | | | | | | | | | | | | |
First Mortgage | | 4.550% | | 07/01/30 | | | 20 | | | $ | 17,972 | |
First Mortgage | | 4.750 | | 02/15/44 | | | 45 | | | | 34,476 | |
PacifiCorp, | | | | | | | | | | | | |
First Mortgage | | 5.350 | | 12/01/53 | | | 40 | | | | 34,523 | |
PECO Energy Co., | | | | | | | | | | | | |
First Mortgage | | 2.800 | | 06/15/50 | | | 32 | | | | 20,247 | |
First Mortgage | | 4.900 | | 06/15/33 | | | 50 | | | | 49,162 | |
PPL Electric Utilities Corp., | | | | | | | | | | | | |
First Mortgage | | 3.000 | | 10/01/49 | | | 13 | | | | 8,802 | |
First Mortgage | | 5.250 | | 05/15/53 | | | 15 | | | | 14,580 | |
Public Service Co. of Colorado, | | | | | | | | | | | | |
First Mortgage | | 5.250 | | 04/01/53 | | | 25 | | | | 23,069 | |
Public Service Electric & Gas Co., | | | | | | | | | | | | |
First Mortgage, MTN | | 3.600 | | 12/01/47 | | | 13 | | | | 9,922 | |
First Mortgage, MTN | | 3.700 | | 05/01/28 | | | 38 | | | | 36,071 | |
Sec’d. Notes, MTN | | 4.650 | | 03/15/33 | | | 75 | | | | 72,628 | |
Puget Energy, Inc., | | | | | | | | | | | | |
Sr. Sec’d. Notes | | 2.379 | | 06/15/28 | | | 5 | | | | 4,316 | |
Sr. Sec’d. Notes | | 4.100 | | 06/15/30 | | | 75 | | | | 67,021 | |
San Diego Gas & Electric Co., | | | | | | | | | | | | |
First Mortgage | | 4.150 | | 05/15/48 | | | 15 | | | | 12,149 | |
First Mortgage | | 5.350 | | 04/01/53 | | | 25 | | | | 24,208 | |
Sempra, | | | | | | | | | | | | |
Sr. Unsec’d. Notes | | 3.300 | | 04/01/25 | | | 35 | | | | 33,722 | |
Sr. Unsec’d. Notes | | 4.000 | | 02/01/48 | | | 15 | | | | 11,475 | |
Southern California Edison Co., | | | | | | | | | | | | |
First Mortgage | | 4.900 | | 06/01/26 | | | 90 | | | | 89,473 | |
First Ref. Mortgage | | 4.000 | | 04/01/47 | | | 55 | | | | 42,573 | |
System Energy Resources, Inc., | | | | | | | | | | | | |
First Mortgage | | 6.000 | | 04/15/28 | | | 15 | | | | 14,732 | |
Tucson Electric Power Co., | | | | | | | | | | | | |
Sr. Unsec’d. Notes | | 3.250 | | 05/15/32 | | | 30 | | | | 25,745 | |
Vistra Operations Co. LLC, | | | | | | | | | | | | |
Sr. Sec’d. Notes, 144A | | 3.550 | | 07/15/24 | | | 47 | | | | 45,730 | |
Xcel Energy, Inc., | | | | | | | | | | | | |
Sr. Unsec’d. Notes | | 1.750 | | 03/15/27 | | | 10 | | | | 8,866 | |
| | | | | | | | | | | | |
| | | | |
| | | | | | | | | | | 1,485,468 | |
See Notes to Financial Statements.
PGIM Fixed Income ETFs 137
PGIM Active Aggregate Bond ETF
Schedule of Investments (continued)
as of August 31, 2023
| | | | | | | | | | | | |
| | | | |
| Description | | Interest
Rate | | Maturity
Date | | Principal
Amount (000)# | | | Value | |
| | | | |
CORPORATE BONDS (Continued) | | | | | | | | | | | | |
| | | | |
Engineering & Construction 0.4% | | | | | | | | | | | | |
| | | | |
Mexico City Airport Trust (Mexico), | | | | | | | | | | | | |
Sr. Sec’d. Notes, 144A | | 4.250% | | 10/31/26 | | | 200 | | | $ | 190,165 | |
| | | | |
Entertainment 0.2% | | | | | | | | | | | | |
| | | | |
Warnermedia Holdings, Inc., | | | | | | | | | | | | |
Gtd. Notes | | 4.279 | | 03/15/32 | | | 20 | | | | 17,646 | |
Gtd. Notes | | 5.141 | | 03/15/52 | | | 70 | | | | 55,767 | |
| | | | | | | | | | | | |
| | | | |
| | | | | | | | | | | 73,413 | |
| | | | |
Foods 0.3% | | | | | | | | | | | | |
| | | | |
Campbell Soup Co., | | | | | | | | | | | | |
Sr. Unsec’d. Notes | | 3.300 | | 03/19/25 | | | 51 | | | | 49,171 | |
JBS USA LUX SA/JBS USA Food Co./JBS USA Finance, Inc., | | | | | | | | | | | | |
Gtd. Notes | | 3.000 | | 02/02/29 | | | 100 | | | | 85,887 | |
Mars, Inc., | | | | | | | | | | | | |
Gtd. Notes, 144A | | 3.600 | | 04/01/34 | | | 10 | | | | 8,775 | |
| | | | | | | | | | | | |
| | | | |
| | | | | | | | | | | 143,833 | |
| | | | |
Gas 0.3% | | | | | | | | | | | | |
| | | | |
CenterPoint Energy Resources Corp., | | | | | | | | | | | | |
Sr. Unsec’d. Notes | | 4.100 | | 09/01/47 | | | 21 | | | | 16,554 | |
Sr. Unsec’d. Notes | | 5.250 | | 03/01/28 | | | 65 | | | | 64,896 | |
NiSource, Inc., | | | | | | | | | | | | |
Sr. Unsec’d. Notes | | 3.490 | | 05/15/27 | | | 13 | | | | 12,200 | |
Piedmont Natural Gas Co., Inc., | | | | | | | | | | | | |
Sr. Unsec’d. Notes | | 3.500 | | 06/01/29 | | | 21 | | | | 19,043 | |
Southern California Gas Co., | | | | | | | | | | | | |
First Mortgage | | 3.750 | | 09/15/42 | | | 30 | | | | 22,722 | |
| | | | | | | | | | | | |
| | | | |
| | | | | | | | | | | 135,415 | |
| | | | |
Healthcare-Services 1.0% | | | | | | | | | | | | |
| | | | |
Ascension Health, | | | | | | | | | | | | |
Sr. Unsec’d. Notes, Series B | | 2.532 | | 11/15/29 | | | 35 | | | | 30,209 | |
Elevance Health, Inc., | | | | | | | | | | | | |
Sr. Unsec’d. Notes | | 4.625 | | 05/15/42 | | | 50 | | | | 44,393 | |
See Notes to Financial Statements.
138
PGIM Active Aggregate Bond ETF
Schedule of Investments (continued)
as of August 31, 2023
| | | | | | | | | | | | |
| | | | |
| Description | | Interest
Rate | | Maturity
Date | | Principal
Amount (000)# | | | Value | |
| | | | |
CORPORATE BONDS (Continued) | | | | | | | | | | | | |
| | | | |
Healthcare-Services (cont’d.) | | | | | | | | | | | | |
| | | | |
Kaiser Foundation Hospitals, | | | | | | | | | | | | |
Unsec’d. Notes, Series 2021 | | 2.810% | | 06/01/41 | | | 70 | | | $ | 49,685 | |
Unsec’d. Notes, Series 2021 | | 3.002 | | 06/01/51 | | | 10 | | | | 6,777 | |
Memorial Sloan-Kettering Cancer Center, | | | | | | | | | | | | |
Unsec’d. Notes, Series 2020 | | 2.955 | | 01/01/50 | | | 15 | | | | 10,098 | |
Methodist Hospital (The), | | | | | | | | | | | | |
Unsec’d. Notes, Series 20A | | 2.705 | | 12/01/50 | | | 10 | | | | 6,279 | |
New York & Presbyterian Hospital (The), | | | | | | | | | | | | |
Unsec’d. Notes | | 4.024 | | 08/01/45 | | | 20 | | | | 16,339 | |
Northwestern Memorial Healthcare Obligated Group, | | | | | | | | | | | | |
Unsec’d. Notes, Series 2021 | | 2.633 | | 07/15/51 | | | 20 | | | | 12,604 | |
OhioHealth Corp., | | | | | | | | | | | | |
Sec’d. Notes | | 2.297 | | 11/15/31 | | | 30 | | | | 24,428 | |
Piedmont Healthcare, Inc., | | | | | | | | | | | | |
Sec’d. Notes, Series 2042 | | 2.719 | | 01/01/42 | | | 15 | | | | 9,945 | |
Sentara Healthcare, | | | | | | | | | | | | |
Sr. Unsec’d. Notes, Series 2021 | | 2.927 | | 11/01/51 | | | 65 | | | | 41,927 | |
Stanford Health Care, | | | | | | | | | | | | |
Unsec’d. Notes | | 3.027 | | 08/15/51 | | | 35 | | | | 23,586 | |
UnitedHealth Group, Inc., | | | | | | | | | | | | |
Sr. Unsec’d. Notes | | 2.300 | | 05/15/31 | | | 45 | | | | 37,569 | |
Sr. Unsec’d. Notes | | 3.950 | | 10/15/42 | | | 60 | | | | 50,070 | |
Sr. Unsec’d. Notes | | 4.500 | | 04/15/33 | | | 25 | | | | 24,075 | |
Sr. Unsec’d. Notes | | 4.950 | | 05/15/62 | | | 10 | | | | 9,195 | |
Sr. Unsec’d. Notes | | 5.050 | | 04/15/53 | | | 22 | | | | 20,998 | |
UPMC, | | | | | | | | | | | | |
Sec’d. Notes | | 5.035 | | 05/15/33 | | | 25 | | | | 24,528 | |
| | | | | | | | | | | | |
| | | | |
| | | | | | | | | | | 442,705 | |
| | | | |
Home Builders 0.5% | | | | | | | | | | | | |
| | | | |
Toll Brothers Finance Corp., | | | | | | | | | | | | |
Gtd. Notes | | 4.875 | | 03/15/27 | | | 220 | | | | 213,738 | |
| | | | |
Insurance 0.4% | | | | | | | | | | | | |
| | | | |
Corebridge Financial, Inc., | | | | | | | | | | | | |
Sr. Unsec’d. Notes | | 3.900 | | 04/05/32 | | | 45 | | | | 39,315 | |
Everest Reinsurance Holdings, Inc., | | | | | | | | | | | | |
Sr. Unsec’d. Notes | | 3.500 | | 10/15/50 | | | 8 | | | | 5,479 | |
Sr. Unsec’d. Notes | | 4.868 | | 06/01/44 | | | 30 | | | | 26,157 | |
See Notes to Financial Statements.
PGIM Fixed Income ETFs 139
PGIM Active Aggregate Bond ETF
Schedule of Investments (continued)
as of August 31, 2023
| | | | | | | | | | | | |
| | | | |
| Description | | Interest
Rate | | Maturity
Date | | Principal
Amount (000)# | | | Value | |
| | | | |
CORPORATE BONDS (Continued) | | | | | | | | | | | | |
| | | | |
Insurance (cont’d.) | | | | | | | | | | | | |
| | | | |
Fairfax Financial Holdings Ltd. (Canada), | | | | | | | | | | | | |
Sr. Unsec’d. Notes | | 5.625% | | 08/16/32 | | | 15 | | | $ | 14,442 | |
Liberty Mutual Group, Inc., | | | | | | | | | | | | |
Gtd. Notes, 144A | | 3.951 | | 10/15/50 | | | 38 | | | | 27,174 | |
Lincoln National Corp., | | | | | | | | | | | | |
Sr. Unsec’d. Notes | | 3.050 | | 01/15/30 | | | 8 | | | | 6,728 | |
Markel Group, Inc., | | | | | | | | | | | | |
Sr. Unsec’d. Notes | | 4.150 | | 09/17/50 | | | 17 | | | | 12,828 | |
Principal Financial Group, Inc., | | | | | | | | | | | | |
Gtd. Notes | | 4.625 | | 09/15/42 | | | 32 | | | | 26,786 | |
W.R. Berkley Corp., | | | | | | | | | | | | |
Sr. Unsec’d. Notes | | 4.000 | | 05/12/50 | | | 8 | | | | 6,080 | |
| | | | | | | | | | | | |
| | | | |
| | | | | | | | | | | 164,989 | |
| | | | |
Iron/Steel 0.2% | | | | | | | | | | | | |
| | | | |
Nucor Corp., | | | | | | | | | | | | |
Sr. Unsec’d. Notes | | 4.300 | | 05/23/27 | | | 25 | | | | 24,245 | |
Steel Dynamics, Inc., | | | | | | | | | | | | |
Sr. Unsec’d. Notes | | 3.450 | | 04/15/30 | | | 60 | | | | 53,252 | |
| | | | | | | | | | | | |
| | | | |
| | | | | | | | | | | 77,497 | |
| | | | |
Lodging 0.2% | | | | | | | | | | | | |
| | | | |
Marriott International, Inc., | | | | | | | | | | | | |
Sr. Unsec’d. Notes, Series R | | 3.125 | | 06/15/26 | | | 83 | | | | 77,961 | |
| | | | |
Machinery-Construction & Mining 0.0% | | | | | | | | | | | | |
| | | | |
Caterpillar, Inc., | | | | | | | | | | | | |
Sr. Unsec’d. Notes | | 2.600 | | 09/19/29 | | | 13 | | | | 11,628 | |
| | | | |
Machinery-Diversified 0.2% | | | | | | | | | | | | |
| | | | |
Flowserve Corp., | | | | | | | | | | | | |
Sr. Unsec’d. Notes | | 2.800 | | 01/15/32 | | | 5 | | | | 3,967 | |
Westinghouse Air Brake Technologies Corp., | | | | | | | | | | | | |
Gtd. Notes | | 3.200 | | 06/15/25 | | | 88 | | | | 83,940 | |
| | | | | | | | | | | | |
| | | | |
| | | | | | | | | | | 87,907 | |
See Notes to Financial Statements.
140
PGIM Active Aggregate Bond ETF
Schedule of Investments (continued)
as of August 31, 2023
| | | | | | | | | | | | |
| | | | |
| Description | | Interest
Rate | | Maturity
Date | | Principal
Amount (000)# | | | Value | |
| | | | |
CORPORATE BONDS (Continued) | | | | | | | | | | | | |
| | | | |
Media 1.2% | | | | | | | | | | | | |
| | | | |
Charter Communications Operating LLC/Charter Communications Operating Capital, | | | | | | | | | | | | |
Sr. Sec’d. Notes | | 4.800% | | 03/01/50 | | | 64 | | | $ | 47,232 | |
Sr. Sec’d. Notes | | 4.908 | | 07/23/25 | | | 93 | | | | 91,336 | |
Sr. Sec’d. Notes | | 6.384 | | 10/23/35 | | | 120 | | | | 116,350 | |
Comcast Corp., | | | | | | | | | | | | |
Gtd. Notes | | 3.999 | | 11/01/49 | | | 42 | | | | 33,448 | |
Gtd. Notes | | 4.250 | | 10/15/30 | | | 30 | | | | 28,532 | |
Gtd. Notes | | 5.500 | | 05/15/64 | | | 30 | | | | 29,230 | |
Cox Communications, Inc., | | | | | | | | | | | | |
Gtd. Notes, 144A | | 5.450 | | 09/15/28 | | | 110 | | | | 109,481 | |
Sr. Unsec’d. Notes, 144A | | 3.150 | | 08/15/24 | | | 43 | | | | 41,868 | |
Discovery Communications LLC, | | | | | | | | | | | | |
Gtd. Notes | | 5.200 | | 09/20/47 | | | 23 | | | | 18,610 | |
Walt Disney Co. (The), | | | | | | | | | | | | |
Gtd. Notes | | 3.600 | | 01/13/51 | | | 12 | | | | 9,003 | |
| | | | | | | | | | | | |
| | | | |
| | | | | | | | | | | 525,090 | |
| | | | |
Mining 1.1% | | | | | | | | | | | | |
| | | | |
Barrick North America Finance LLC (Canada), | | | | | | | | | | | | |
Gtd. Notes | | 5.750 | | 05/01/43 | | | 55 | | | | 54,860 | |
Freeport-McMoRan, Inc., | | | | | | | | | | | | |
Gtd. Notes | | 4.125 | | 03/01/28 | | | 25 | | | | 23,229 | |
Gtd. Notes | | 4.375 | | 08/01/28 | | | 50 | | | | 46,446 | |
Indonesia Asahan Aluminium PT/Mineral Industri Indonesia Persero PT (Indonesia), | | | | | | | | | | | | |
Sr. Unsec’d. Notes, 144A | | 6.530 | | 11/15/28 | | | 200 | | | | 203,376 | |
Kinross Gold Corp. (Canada), | | | | | | | | | | | | |
Sr. Unsec’d. Notes, 144A | | 6.250 | | 07/15/33 | | | 60 | | | | 59,226 | |
Newmont Corp., | | | | | | | | | | | | |
Gtd. Notes | | 2.250 | | 10/01/30 | | | 5 | | | | 4,062 | |
Gtd. Notes | | 2.800 | | 10/01/29 | | | 122 | | | | 105,253 | |
| | | | | | | | | | | | |
| | | | |
| | | | | | | | | | | 496,452 | |
See Notes to Financial Statements.
PGIM Fixed Income ETFs 141
PGIM Active Aggregate Bond ETF
Schedule of Investments (continued)
as of August 31, 2023
| | | | | | | | | | | | |
| | | | |
| Description | | Interest
Rate | | Maturity
Date | | Principal
Amount (000)# | | | Value | |
| | | | |
CORPORATE BONDS (Continued) | | | | | | | | | | | | |
| | | | |
Miscellaneous Manufacturing 0.2% | | | | | | | | | | | | |
| | | | |
Carlisle Cos., Inc., | | | | | | | | | | | | |
Sr. Unsec’d. Notes | | 2.200% | | 03/01/32 | | | 30 | | | $ | 23,609 | |
Textron, Inc., | | | | | | | | | | | | |
Sr. Unsec’d. Notes | | 3.375 | | 03/01/28 | | | 84 | | | | 76,819 | |
| | | | | | | | | | | | |
| | | | |
| | | | | | | | | | | 100,428 | |
| | | | |
Multi-National 0.2% | | | | | | | | | | | | |
| | | | |
Corp. Andina de Fomento (Supranational Bank), | | | | | | | | | | | | |
Sr. Unsec’d. Notes | | 3.750 | | 11/23/23 | | | 100 | | | | 99,613 | |
| | | | |
Oil & Gas 1.3% | | | | | | | | | | | | |
| | | | |
BP Capital Markets America, Inc., | | | | | | | | | | | | |
Gtd. Notes | | 4.893 | | 09/11/33 | | | 40 | | | | 38,936 | |
Cenovus Energy, Inc. (Canada), | | | | | | | | | | | | |
Sr. Unsec’d. Notes | | 3.750 | | 02/15/52 | | | 5 | | | | 3,499 | |
Sr. Unsec’d. Notes | | 5.400 | | 06/15/47 | | | 57 | | | | 51,225 | |
Continental Resources, Inc., | | | | | | | | | | | | |
Gtd. Notes, 144A | | 2.268 | | 11/15/26 | | | 15 | | | | 13,397 | |
Devon Energy Corp., | | | | | | | | | | | | |
Sr. Unsec’d. Notes | | 5.600 | | 07/15/41 | | | 36 | | | | 33,398 | |
Ecopetrol SA (Colombia), | | | | | | | | | | | | |
Sr. Unsec’d. Notes | | 5.375 | | 06/26/26 | | | 40 | | | | 38,610 | |
Sr. Unsec’d. Notes | | 8.625 | | 01/19/29 | | | 35 | | | | 35,613 | |
Sr. Unsec’d. Notes | | 8.875 | | 01/13/33 | | | 40 | | | | 40,441 | |
Exxon Mobil Corp., | | | | | | | | | | | | |
Sr. Unsec’d. Notes | | 3.452 | | 04/15/51 | | | 8 | | | | 5,950 | |
Helmerich & Payne, Inc., | | | | | | | | | | | | |
Sr. Unsec’d. Notes | | 2.900 | | 09/29/31 | | | 30 | | | | 24,381 | |
Ovintiv, Inc., | | | | | | | | | | | | |
Gtd. Notes | | 5.650 | | 05/15/25 | | | 155 | | | | 154,731 | |
Phillips 66, | | | | | | | | | | | | |
Gtd. Notes | | 2.150 | | 12/15/30 | | | 84 | | | | 68,050 | |
Phillips 66 Co., | | | | | | | | | | | | |
Gtd. Notes | | 3.550 | | 10/01/26 | | | 17 | | | | 16,084 | |
Pioneer Natural Resources Co., | | | | | | | | | | | | |
Sr. Unsec’d. Notes | | 1.125 | | 01/15/26 | | | 50 | | | | 45,309 | |
| | | | | | | | | | | | |
| | | | |
| | | | | | | | | | | 569,624 | |
See Notes to Financial Statements.
142
PGIM Active Aggregate Bond ETF
Schedule of Investments (continued)
as of August 31, 2023
| | | | | | | | | | | | |
| | | | |
| Description | | Interest
Rate | | Maturity
Date | | Principal
Amount (000)# | | | Value | |
| | | | |
CORPORATE BONDS (Continued) | | | | | | | | | | | | |
| | | | |
Pharmaceuticals 1.4% | | | | | | | | | | | | |
| | | | |
AbbVie, Inc., | | | | | | | | | | | | |
Sr. Unsec’d. Notes | | 3.200% | | 11/21/29 | | | 100 | | | $ | 90,146 | |
Sr. Unsec’d. Notes | | 4.050 | | 11/21/39 | | | 15 | | | | 12,861 | |
Sr. Unsec’d. Notes | | 4.550 | | 03/15/35 | | | 60 | | | | 56,703 | |
Sr. Unsec’d. Notes | | 4.625 | | 10/01/42 | | | 15 | | | | 13,308 | |
Astrazeneca Finance LLC (United Kingdom), | | | | | | | | | | | | |
Gtd. Notes | | 2.250 | | 05/28/31 | | | 3 | | | | 2,495 | |
Bristol-Myers Squibb Co., | | | | | | | | | | | | |
Sr. Unsec’d. Notes | | 3.400 | | 07/26/29 | | | 5 | | | | 4,628 | |
Cigna Group (The), | | | | | | | | | | | | |
Gtd. Notes | | 4.375 | | 10/15/28 | | | 30 | | | | 28,866 | |
Sr. Unsec’d. Notes | | 2.400 | | 03/15/30 | | | 40 | | | | 33,650 | |
CVS Health Corp., | | | | | | | | | | | | |
Sr. Unsec’d. Notes | | 5.125 | | 02/21/30 | | | 15 | | | | 14,767 | |
Sr. Unsec’d. Notes | | 5.125 | | 07/20/45 | | | 82 | | | | 73,010 | |
Johnson & Johnson, | | | | | | | | | | | | |
Sr. Unsec’d. Notes | | 2.100 | | 09/01/40 | | | 10 | | | | 6,838 | |
Merck & Co., Inc., | | | | | | | | | | | | |
Sr. Unsec’d. Notes | | 3.400 | | 03/07/29 | | | 8 | | | | 7,447 | |
Mylan, Inc., | | | | | | | | | | | | |
Gtd. Notes | | 5.200 | | 04/15/48 | | | 15 | | | | 11,671 | |
Shire Acquisitions Investments Ireland DAC, | | | | | | | | | | | | |
Gtd. Notes | | 2.875 | | 09/23/23 | | | 26 | | | | 25,954 | |
Gtd. Notes | | 3.200 | | 09/23/26 | | | 144 | | | | 135,005 | |
Viatris, Inc., | | | | | | | | | | | | |
Gtd. Notes | | 3.850 | | 06/22/40 | | | 98 | | | | 68,546 | |
| | | | | | | | | | | | |
| | | | |
| | | | | | | | | | | 585,895 | |
| | | | |
Pipelines 2.3% | | | | | | | | | | | | |
| | | | |
DCP Midstream Operating LP, | | | | | | | | | | | | |
Gtd. Notes | | 5.125 | | 05/15/29 | | | 65 | | | | 63,475 | |
Energy Transfer LP, | | | | | | | | | | | | |
Sr. Unsec’d. Notes | | 4.950 | | 06/15/28 | | | 133 | | | | 128,787 | |
Sr. Unsec’d. Notes | | 6.250 | | 04/15/49 | | | 34 | | | | 32,499 | |
Sr. Unsec’d. Notes, Series 20Y | | 5.800 | | 06/15/38 | | | 50 | | | | 47,267 | |
Enterprise Products Operating LLC, | | | | | | | | | | | | |
Gtd. Notes | | 3.125 | | 07/31/29 | | | 20 | | | | 17,914 | |
Gtd. Notes | | 4.850 | | 03/15/44 | | | 15 | | | | 13,387 | |
See Notes to Financial Statements.
PGIM Fixed Income ETFs 143
PGIM Active Aggregate Bond ETF
Schedule of Investments (continued)
as of August 31, 2023
| | | | | | | | | | | | |
| | | | |
| Description | | Interest
Rate | | Maturity
Date | | Principal
Amount (000)# | | | Value | |
| | | | |
CORPORATE BONDS (Continued) | | | | | | | | | | | | |
| | | | |
Pipelines (cont’d.) | | | | | | | | | | | | |
| | | | |
Kinder Morgan, Inc., | | | | | | | | | | | | |
Gtd. Notes | | 2.000% | | 02/15/31 | | | 34 | | | $ | 26,722 | |
Gtd. Notes | | 3.250 | | 08/01/50 | | | 17 | | | | 10,706 | |
MPLX LP, | | | | | | | | | | | | |
Sr. Unsec’d. Notes | | 2.650 | | 08/15/30 | | | 75 | | | | 62,232 | |
Sr. Unsec’d. Notes | | 4.500 | | 04/15/38 | | | 63 | | | | 53,372 | |
Sr. Unsec’d. Notes | | 4.875 | | 06/01/25 | | | 55 | | | | 54,138 | |
Sr. Unsec’d. Notes | | 5.500 | | 02/15/49 | | | 17 | | | | 15,140 | |
ONEOK Partners LP, | | | | | | | | | | | | |
Gtd. Notes | | 6.125 | | 02/01/41 | | | 25 | | | | 24,139 | |
ONEOK, Inc., | | | | | | | | | | | | |
Gtd. Notes | | 3.100 | | 03/15/30 | | | 57 | | | | 48,929 | |
Gtd. Notes | | 3.400 | | 09/01/29 | | | 15 | | | | 13,238 | |
Gtd. Notes | | 4.950 | | 07/13/47 | | | 21 | | | | 17,263 | |
Gtd. Notes | | 6.050 | | 09/01/33 | | | 105 | | | | 105,833 | |
Plains All American Pipeline LP/PAA Finance Corp., | | | | | | | | | | | | |
Sr. Unsec’d. Notes | | 4.500 | | 12/15/26 | | | 17 | | | | 16,444 | |
Targa Resources Corp., | | | | | | | | | | | | |
Gtd. Notes | | 4.200 | | 02/01/33 | | | 10 | | | | 8,813 | |
Gtd. Notes | | 5.200 | | 07/01/27 | | | 55 | | | | 54,455 | |
Gtd. Notes | | 6.125 | | 03/15/33 | | | 80 | | | | 81,337 | |
Transcontinental Gas Pipe Line Co. LLC, | | | | | | | | | | | | |
Sr. Unsec’d. Notes | | 3.250 | | 05/15/30 | | | 66 | | | | 58,239 | |
Sr. Unsec’d. Notes | | 3.950 | | 05/15/50 | | | 31 | | | | 23,256 | |
| | | | | | | | | | | | |
| | | | |
| | | | | | | | | | | 977,585 | |
| | | | |
Real Estate Investment Trusts (REITs) 1.4% | | | | | | | | | | | | |
| | | | |
Brixmor Operating Partnership LP, | | | | | | | | | | | | |
Sr. Unsec’d. Notes | | 3.650 | | 06/15/24 | | | 130 | | | | 126,940 | |
CubeSmart LP, | | | | | | | | | | | | |
Gtd. Notes | | 2.250 | | 12/15/28 | | | 15 | | | | 12,729 | |
GLP Capital LP/GLP Financing II, Inc., | | | | | | | | | | | | |
Gtd. Notes | | 3.250 | | 01/15/32 | | | 5 | | | | 4,030 | |
Host Hotels & Resorts LP, | | | | | | | | | | | | |
Sr. Unsec’d. Notes, Series J | | 2.900 | | 12/15/31 | | | 5 | | | | 3,941 | |
Kimco Realty OP LLC, | | | | | | | | | | | | |
Gtd. Notes | | 1.900 | | 03/01/28 | | | 55 | | | | 46,588 | |
Gtd. Notes | | 3.200 | | 04/01/32 | | | 25 | | | | 20,724 | |
See Notes to Financial Statements.
144
PGIM Active Aggregate Bond ETF
Schedule of Investments (continued)
as of August 31, 2023
| | | | | | | | | | | | |
| | | | |
| Description | | Interest
Rate | | Maturity
Date | | Principal
Amount (000)# | | | Value | |
| | | | |
CORPORATE BONDS (Continued) | | | | | | | | | | | | |
| | | | |
Real Estate Investment Trusts (REITs) (cont’d.) | | | | | | | | | | | | |
| | | | |
Realty Income Corp., | | | | | | | | | | | | |
Sr. Unsec’d. Notes | | 2.200% | | 06/15/28 | | | 80 | | | $ | 69,444 | |
Sr. Unsec’d. Notes | | 3.100 | | 12/15/29 | | | 29 | | | | 25,632 | |
Sr. Unsec’d. Notes | | 3.250 | | 01/15/31 | | | 25 | | | | 21,588 | |
Simon Property Group LP, | | | | | | | | | | | | |
Sr. Unsec’d. Notes | | 1.750 | | 02/01/28 | | | 90 | | | | 77,305 | |
Spirit Realty LP, | | | | | | | | | | | | |
Gtd. Notes | | 2.700 | | 02/15/32 | | | 33 | | | | 25,815 | |
Sun Communities Operating LP, | | | | | | | | | | | | |
Gtd. Notes | | 5.700 | | 01/15/33 | | | 35 | | | | 34,162 | |
Ventas Realty LP, | | | | | | | | | | | | |
Gtd. Notes | | 4.125 | | 01/15/26 | | | 127 | | | | 122,213 | |
VICI Properties LP, | | | | | | | | | | | | |
Sr. Unsec’d. Notes | | 4.750 | | 02/15/28 | | | 20 | | | | 19,037 | |
| | | | | | | | | | | | |
| | | | |
| | | | | | | | | | | 610,148 | |
| | | | |
Retail 0.2% | | | | | | | | | | | | |
| | | | |
Alimentation Couche-Tard, Inc. (Canada), | | | | | | | | | | | | |
Gtd. Notes, 144A | | 4.500 | | 07/26/47 | | | 27 | | | | 20,896 | |
AutoZone, Inc., | | | | | | | | | | | | |
Sr. Unsec’d. Notes | | 3.750 | | 04/18/29 | | | 28 | | | | 25,788 | |
Home Depot, Inc. (The), | | | | | | | | | | | | |
Sr. Unsec’d. Notes | | 5.875 | | 12/16/36 | | | 8 | | | | 8,583 | |
McDonald’s Corp., | | | | | | | | | | | | |
Sr. Unsec’d. Notes, MTN | | 4.700 | | 12/09/35 | | | 18 | | | | 17,191 | |
| | | | | | | | | | | | |
| | | | |
| | | | | | | | | | | 72,458 | |
| | | | |
Semiconductors 0.5% | | | | | | | | | | | | |
| | | | |
Broadcom Corp./Broadcom Cayman Finance Ltd., | | | | | | | | | | | | |
Gtd. Notes | | 3.500 | | 01/15/28 | | | 45 | | | | 41,555 | |
Broadcom, Inc., | | | | | | | | | | | | |
Sr. Unsec’d. Notes, 144A | | 3.137 | | 11/15/35 | | | 42 | | | | 32,018 | |
Sr. Unsec’d. Notes, 144A | | 3.419 | | 04/15/33 | | | 120 | | | | 99,258 | |
Sr. Unsec’d. Notes, 144A | | 4.000 | | 04/15/29 | | | 25 | | | | 23,065 | |
Intel Corp., | | | | | | | | | | | | |
Sr. Unsec’d. Notes | | 5.625 | | 02/10/43 | | | 5 | | | | 4,984 | |
See Notes to Financial Statements.
PGIM Fixed Income ETFs 145
PGIM Active Aggregate Bond ETF
Schedule of Investments (continued)
as of August 31, 2023
| | | | | | | | | | | | |
| | | | |
| Description | | Interest
Rate | | Maturity
Date | | Principal
Amount (000)# | | | Value | |
| | | | |
CORPORATE BONDS (Continued) | | | | | | | | | | | | |
| | | | |
Semiconductors (cont’d.) | | | | | | | | | | | | |
| | | | |
Intel Corp., (cont’d.) | | | | | | | | | | | | |
Sr. Unsec’d. Notes | | 5.700% | | 02/10/53 | | | 15 | | | $ | 14,847 | |
Sr. Unsec’d. Notes | | 5.900 | | 02/10/63 | | | 20 | | | | 20,040 | |
| | | | | | | | | | | | |
| | | | |
| | | | | | | | | | | 235,767 | |
| | | | |
Software 0.3% | | | | | | | | | | | | |
| | | | |
Microsoft Corp., | | | | | | | | | | | | |
Sr. Unsec’d. Notes | | 2.525 | | 06/01/50 | | | 63 | | | | 41,640 | |
Oracle Corp., | | | | | | | | | | | | |
Sr. Unsec’d. Notes | | 3.600 | | 04/01/50 | | | 15 | | | | 10,327 | |
Sr. Unsec’d. Notes | | 3.850 | | 04/01/60 | | | 8 | | | | 5,422 | |
Sr. Unsec’d. Notes | | 5.550 | | 02/06/53 | | | 20 | | | | 18,587 | |
Sr. Unsec’d. Notes | | 6.900 | | 11/09/52 | | | 30 | | | | 32,659 | |
Workday, Inc., | | | | | | | | | | | | |
Sr. Unsec’d. Notes | | 3.700 | | 04/01/29 | | | 20 | | | | 18,474 | |
| | | | | | | | | | | | |
| | | | |
| | | | | | | | | | | 127,109 | |
| | | | |
Telecommunications 0.8% | | | | | | | | | | | | |
| | | | |
AT&T, Inc., | | | | | | | | | | | | |
Sr. Unsec’d. Notes | | 2.550 | | 12/01/33 | | | 50 | | | | 38,143 | |
Sr. Unsec’d. Notes | | 3.500 | | 09/15/53 | | | 85 | | | | 55,939 | |
Sr. Unsec’d. Notes | | 4.500 | | 05/15/35 | | | 65 | | | | 57,700 | |
Sprint LLC, | | | | | | | | | | | | |
Gtd. Notes | | 7.625 | | 03/01/26 | | | 110 | | | | 114,059 | |
T-Mobile USA, Inc., | | | | | | | | | | | | |
Gtd. Notes | | 3.000 | | 02/15/41 | | | 40 | | | | 28,197 | |
Gtd. Notes | | 3.875 | | 04/15/30 | | | 30 | | | | 27,323 | |
Verizon Communications, Inc., | | | | | | | | | | | | |
Sr. Unsec’d. Notes | | 2.355 | | 03/15/32 | | | 26 | | | | 20,562 | |
Sr. Unsec’d. Notes | | 4.016 | | 12/03/29 | | | 7 | | | | 6,501 | |
| | | | | | | | | | | | |
| | | | |
| | | | | | | | | | | 348,424 | |
| | | | |
Transportation 0.1% | | | | | | | | | | | | |
| | | | |
CSX Corp., | | | | | | | | | | | | |
Sr. Unsec’d. Notes | | 6.150 | | 05/01/37 | | | 33 | | | | 35,190 | |
See Notes to Financial Statements.
146
PGIM Active Aggregate Bond ETF
Schedule of Investments (continued)
as of August 31, 2023
| | | | | | | | | | | | | | | | |
| | | | |
| Description | | Interest
Rate | | | Maturity
Date | | | Principal
Amount (000)# | | | Value | |
| | | | |
CORPORATE BONDS (Continued) | | | | | | | | | | | | | | | | |
| | | | |
Trucking & Leasing 0.3% | | | | | | | | | | | | | | | | |
| | | | |
Penske Truck Leasing Co. LP/PTL Finance Corp., | | | | | | | | | | | | | | | | |
Sr. Unsec’d. Notes, 144A | | | 5.750% | | | | 05/24/26 | | | | 110 | | | $ | 109,165 | |
| | | | | | | | | | | | | | | | |
| | | | |
TOTAL CORPORATE BONDS
(cost $15,673,250) | | | | | | | | | | | | | | | 13,648,242 | |
| | | | | | | | | | | | | | | | |
| | | | |
MUNICIPAL BONDS 0.3% | | | | | | | | | | | | | | | | |
| | | | |
Michigan 0.1% | | | | | | | | | | | | | | | | |
| | | | |
University of Michigan, | | | | | | | | | | | | | | | | |
Taxable, Revenue Bonds, Series B | | | 3.504 | | | | 04/01/52 | | | | 35 | | | | 26,935 | |
| | | | |
New Jersey 0.0% | | | | | | | | | | | | | | | | |
| | | | |
New Jersey Turnpike Authority, | | | | | | | | | | | | | | | | |
Taxable, Revenue Bonds, BABs, Series F | | | 7.414 | | | | 01/01/40 | | | | 10 | | | | 12,248 | |
| | | | |
New York 0.1% | | | | | | | | | | | | | | | | |
| | | | |
New York State Dormitory Authority, | | | | | | | | | | | | | | | | |
Taxable, Revenue Bonds, Series C | | | 2.202 | | | | 03/15/34 | | | | 15 | | | | 11,772 | |
Port Authority of New York & New Jersey, | | | | | | | | | | | | | | | | |
Consolidated, Taxable, Revenue Bonds, Series 174 | | | 4.458 | | | | 10/01/62 | | | | 10 | | | | 8,861 | |
| | | | | | | | | | | | | | | | |
| | | | |
| | | | | | | | | | | | | | | 20,633 | |
| | | | |
Ohio 0.0% | | | | | | | | | | | | | | | | |
| | | | |
Ohio State University (The), | | | | | | | | | | | | | | | | |
Taxable, Revenue Bonds, Series A | | | 4.800 | | | | 06/01/2111 | | | | 10 | | | | 8,772 | |
| | | | |
Pennsylvania 0.0% | | | | | | | | | | | | | | | | |
| | | | |
Pennsylvania Turnpike Commission, | | | | | | | | | | | | | | | | |
Revenue Bonds, BABs, Series B | | | 5.511 | | | | 12/01/45 | | | | 10 | | | | 10,070 | |
| | | | |
Texas 0.1% | | | | | | | | | | | | | | | | |
| | | | |
Dallas Fort Worth International Airport, | | | | | | | | | | | | | | | | |
Taxable, Revenue Bonds, Series A | | | 4.087 | | | | 11/01/51 | | | | 20 | | | | 16,792 | |
See Notes to Financial Statements.
PGIM Fixed Income ETFs 147
PGIM Active Aggregate Bond ETF
Schedule of Investments (continued)
as of August 31, 2023
| | | | | | | | | | | | | | | | |
| | | | |
| Description | | Interest
Rate | | | Maturity
Date | | | Principal
Amount (000)# | | | Value | |
| | | | |
MUNICIPAL BONDS (Continued) | | | | | | | | | | | | | | | | |
| | | | |
Virginia 0.0% | | | | | | | | | | | | | | | | |
| | | | |
University of Virginia, | | | | | | | | | | | | | | | | |
Taxable, Revenue Bonds, Series B | | | 2.584% | | | | 11/01/51 | | | | 25 | | | $ | 16,291 | |
| | | | | | | | | | | | | | | | |
| | | | |
TOTAL MUNICIPAL BONDS
(cost $150,641) | | | | | | | | | | | | | | | 111,741 | |
| | | | | | | | | | | | | | | | |
| | | | |
RESIDENTIAL MORTGAGE-BACKED SECURITIES 0.4% | | | | | | | | | | | | | | | | |
Bellemeade Re Ltd., | | | | | | | | | | | | | | | | |
Series 2021-02A, Class M1A, 144A, 30 Day Average SOFR + 1.200% (Cap N/A, Floor 1.200%) | | | 6.488(c) | | | | 06/25/31 | | | | 52 | | | | 52,100 | |
FHLMC Structured Agency Credit Risk REMIC Trust, | | | | | | | | | | | | | | | | |
Series 2021-DNA03, Class M2, 144A, 30 Day Average SOFR + 2.100% (Cap N/A, Floor 0.000%) | | | 7.388(c) | | | | 10/25/33 | | | | 50 | | | | 49,500 | |
Series 2022-DNA03, Class M1B, 144A, 30 Day Average SOFR + 2.900% (Cap N/A, Floor 0.000%) | | | 8.188(c) | | | | 04/25/42 | | | | 30 | | | | 30,512 | |
MFA Trust, | | | | | | | | | | | | | | | | |
Series 2021-RPL01, Class A1, 144A | | | 1.131(cc) | | | | 07/25/60 | | | | 60 | | | | 51,908 | |
| | | | | | | | | | | | | | | | |
| | | | |
TOTAL RESIDENTIAL MORTGAGE-BACKED SECURITIES
(cost $191,968) | | | | | | | | | | | | | | | 184,020 | |
| | | | | | | | | | | | | | | | |
| | | | |
SOVEREIGN BONDS 0.8% | | | | | | | | | | | | | | | | |
Indonesia Government International Bond (Indonesia), | | | | | | | | | | | | | | | | |
Sr. Unsec’d. Notes | | | 3.500 | | | | 01/11/28 | | | | 200 | | | | 186,464 | |
Mexico Government International Bond (Mexico), | | | | | | | | | | | | | | | | |
Sr. Unsec’d. Notes, MTN | | | 6.050 | | | | 01/11/40 | | | | 50 | | | | 49,878 | |
Peruvian Government International Bond (Peru), | | | | | | | | | | | | | | | | |
Sr. Unsec’d. Notes | | | 4.125 | | | | 08/25/27 | | | | 50 | | | | 48,327 | |
Romanian Government International Bond (Romania), | | | | | | | | | | | | | | | | |
Unsec’d. Notes, 144A, MTN | | | 6.000 | | | | 05/25/34 | | | | 86 | | | | 83,694 | |
| | | | | | | | | | | | | | | | |
| | | | |
TOTAL SOVEREIGN BONDS
(cost $412,924) | | | | | | | | | | | | | | | 368,363 | |
| | | | | | | | | | | | | | | | |
| | | | |
U.S. GOVERNMENT AGENCY OBLIGATIONS 27.4% | | | | | | | | | | | | | | | | |
Federal Home Loan Mortgage Corp. | | | 1.500 | | | | 04/01/51 | | | | 422 | | | | 318,690 | |
Federal Home Loan Mortgage Corp. | | | 2.000 | | | | 02/01/51 | | | | 879 | | | | 702,878 | |
Federal Home Loan Mortgage Corp. | | | 2.000 | | | | 07/01/51 | | | | 475 | | | | 378,346 | |
Federal Home Loan Mortgage Corp. | | | 2.500 | | | | 04/01/51 | | | | 680 | | | | 567,719 | |
Federal Home Loan Mortgage Corp. | | | 3.500 | | | | 01/01/52 | | | | 234 | | | | 209,065 | |
Federal Home Loan Mortgage Corp. | | | 4.000 | | | | 11/01/39 | | | | 162 | | | | 153,939 | |
See Notes to Financial Statements.
148
PGIM Active Aggregate Bond ETF
Schedule of Investments (continued)
as of August 31, 2023
| | | | | | | | | | | | | | | | |
| | | | |
| Description | | Interest
Rate | | | Maturity
Date | | | Principal
Amount (000)# | | | Value | |
| | | | |
U.S. GOVERNMENT AGENCY OBLIGATIONS (Continued) | | | | | | | | | | | | | | | | |
Federal Home Loan Mortgage Corp. | | | 4.000% | | | | 12/01/40 | | | | 110 | | | $ | 104,268 | |
Federal Home Loan Mortgage Corp. | | | 5.000 | | | | 12/01/52 | | | | 341 | | | | 330,486 | |
Federal Home Loan Mortgage Corp. | | | 6.000 | | | | 11/01/52 | | | | 205 | | | | 205,275 | |
Federal National Mortgage Assoc. | | | 1.500 | | | | 12/01/50 | | | | 337 | | | | 254,404 | |
Federal National Mortgage Assoc. | | | 2.000 | | | | 05/01/36 | | | | 367 | | | | 321,837 | |
Federal National Mortgage Assoc. | | | 2.000 | | | | 05/01/51 | | | | 705 | | | | 561,834 | |
Federal National Mortgage Assoc. | | | 2.500 | | | | TBA | | | | 250 | | | | 207,373 | |
Federal National Mortgage Assoc.(k) | | | 2.500 | | | | 04/01/51 | | | | 1,302 | | | | 1,082,663 | |
Federal National Mortgage Assoc. | | | 2.500 | | | | 05/01/52 | | | | 456 | | | | 381,393 | |
Federal National Mortgage Assoc. | | | 3.000 | | | | 11/01/46 | | | | 242 | | | | 213,925 | |
Federal National Mortgage Assoc. | | | 3.000 | | | | 02/01/52 | | | | 448 | | | | 386,592 | |
Federal National Mortgage Assoc. | | | 3.000 | | | | 03/01/52 | | | | 432 | | | | 376,458 | |
Federal National Mortgage Assoc. | | | 3.000 | | | | 05/01/52 | | | | 427 | | | | 374,114 | |
Federal National Mortgage Assoc. | | | 3.500 | | | | 06/01/47 | | | | 335 | | | | 304,400 | |
Federal National Mortgage Assoc. | | | 3.500 | | | | 02/01/52 | | | | 232 | | | | 207,360 | |
Federal National Mortgage Assoc. | | | 4.000 | | | | 02/01/41 | | | | 137 | | | | 129,725 | |
Federal National Mortgage Assoc. | | | 4.000 | | | | 02/01/45 | | | | 116 | | | | 109,756 | |
Federal National Mortgage Assoc. | | | 4.000 | | | | 03/01/49 | | | | 371 | | | | 347,813 | |
Federal National Mortgage Assoc. | | | 4.000 | | | | 05/01/52 | | | | 235 | | | | 217,077 | |
Federal National Mortgage Assoc. | | | 4.500 | | | | 05/01/52 | | | | 299 | | | | 284,751 | |
Federal National Mortgage Assoc. | | | 4.500 | | | | 06/01/52 | | | | 226 | | | | 213,855 | |
Federal National Mortgage Assoc. | | | 5.000 | | | | 07/01/52 | | | | 481 | | | | 466,519 | |
Federal National Mortgage Assoc. | | | 5.500 | | | | 10/01/52 | | | | 238 | | | | 234,981 | |
Federal National Mortgage Assoc. | | | 5.500 | | | | 11/01/52 | | | | 472 | | | | 466,523 | |
Government National Mortgage Assoc. | | | 2.000 | | | | 03/20/51 | | | | 401 | | | | 332,221 | |
Government National Mortgage Assoc. | | | 3.000 | | | | 01/20/51 | | | | 570 | | | | 504,899 | |
Government National Mortgage Assoc. | | | 4.500 | | | | 05/20/52 | | | | 961 | | | | 915,842 | |
Tennessee Valley Authority, Sr. Unsec’d. Notes | | | 1.500 | | | | 09/15/31 | | | | 15 | | | | 11,861 | |
| | | | | | | | | | | | | | | | |
| | | | |
TOTAL U.S. GOVERNMENT AGENCY OBLIGATIONS
(cost $13,177,431) | | | | | | | | | | | | | | | 11,878,842 | |
| | | | | | | | | | | | | | | | |
| | | | |
U.S. TREASURY OBLIGATIONS 13.8% | | | | | | | | | | | | | | | | |
U.S. Treasury Bonds | | | 1.250 | | | | 05/15/50 | | | | 210 | | | | 109,758 | |
U.S. Treasury Bonds | | | 1.625 | | | | 11/15/50 | | | | 50 | | | | 28,906 | |
U.S. Treasury Bonds | | | 1.750 | | | | 08/15/41 | | | | 21 | | | | 14,106 | |
U.S. Treasury Bonds | | | 1.875 | | | | 02/15/41 | | | | 915 | | | | 634,638 | |
U.S. Treasury Bonds | | | 2.000 | | | | 11/15/41 | | | | 895 | | | | 626,220 | |
U.S. Treasury Bonds | | | 2.000 | | | | 02/15/50 | | | | 285 | | | | 182,445 | |
U.S. Treasury Bonds | | | 2.250 | | | | 05/15/41 | | | | 345 | | | | 254,114 | |
U.S. Treasury Bonds | | | 2.250 | | | | 08/15/49 | | | | 275 | | | | 187,043 | |
U.S. Treasury Bonds | | | 2.250 | | | | 02/15/52 | | | | 30 | | | | 20,241 | |
See Notes to Financial Statements.
PGIM Fixed Income ETFs 149
PGIM Active Aggregate Bond ETF
Schedule of Investments (continued)
as of August 31, 2023
| | | | | | | | | | | | | | | | |
| | | | |
| Description | | Interest
Rate | | | Maturity
Date | | | Principal
Amount (000)# | | | Value | |
| | | | |
U.S. TREASURY OBLIGATIONS (Continued) | | | | | | | | | | | | | | | | |
U.S. Treasury Bonds(k) | | | 2.375% | | | | 02/15/42 | | | | 1,170 | | | $ | 870,187 | |
U.S. Treasury Bonds | | | 2.375 | | | | 05/15/51 | | | | 365 | | | | 253,675 | |
U.S. Treasury Bonds | �� | | 2.750 | | | | 08/15/47 | | | | 1,030 | | | | 780,386 | |
U.S. Treasury Bonds | | | 2.875 | | | | 05/15/52 | | | | 135 | | | | 104,794 | |
U.S. Treasury Bonds | | | 3.250 | | | | 05/15/42 | | | | 155 | | | | 132,331 | |
U.S. Treasury Bonds | | | 3.375 | | | | 08/15/42 | | | | 10 | | | | 8,677 | |
U.S. Treasury Bonds | | | 3.375 | | | | 11/15/48 | | | | 345 | | | | 293,142 | |
U.S. Treasury Bonds | | | 3.625 | | | | 05/15/53 | | | | 45 | | | | 40,584 | |
U.S. Treasury Bonds | | | 4.000 | | | | 11/15/42 | | | | 60 | | | | 56,916 | |
U.S. Treasury Notes | | | 3.250 | | | | 06/30/29 | | | | 290 | | | | 274,979 | |
U.S. Treasury Notes | | | 3.875 | | | | 08/15/33 | | | | 25 | | | | 24,547 | |
U.S. Treasury Notes | | | 4.125 | | | | 07/31/28 | | | | 80 | | | | 79,537 | |
U.S. Treasury Notes | | | 4.750 | | | | 07/31/25 | | | | 85 | | | | 84,768 | |
U.S. Treasury Strips Coupon | | | 2.221(s) | | | | 02/15/42 | | | | 1,395 | | | | 600,994 | |
U.S. Treasury Strips Coupon | | | 2.527(s) | | | | 08/15/44 | | | | 305 | | | | 117,699 | |
U.S. Treasury Strips Coupon | | | 2.542(s) | | | | 02/15/46 | | | | 450 | | | | 162,984 | |
U.S. Treasury Strips Coupon | | | 2.561(s) | | | | 11/15/45 | | | | 80 | | | | 29,272 | |
| | | | | | | | | | | | | | | | |
| | | | |
TOTAL U.S. TREASURY OBLIGATIONS
(cost $7,369,317) | | | | | | | | | | | | | | | 5,972,943 | |
| | | | | | | | | | | | | | | | |
| | | | |
TOTAL LONG-TERM INVESTMENTS
(cost $48,877,403) | | | | | | | | | | | | | | | 43,245,203 | |
| | | | | | | | | | | | | | | | |
| | | | |
| | | | | | | | | Shares | | | | |
| | | | |
SHORT-TERM INVESTMENT 1.3% | | | | | | | | | | | | | | | | |
| | | | |
AFFILIATED MUTUAL FUND | | | | | | | | | | | | | | | | |
PGIM Core Government Money Market Fund
(cost $556,512)(wj) | | | | | | | | | | | 556,512 | | | | 556,512 | |
| | | | | | | | | | | | | | | | |
| | | | |
TOTAL INVESTMENTS 100.9%
(cost $49,433,915) | | | | | | | | | | | | | | | 43,801,715 | |
Liabilities in excess of other assets(z) (0.9)% | | | | | | | | | | | | | | | (407,529 | ) |
| | | | | | | | | | | | | | | | |
| | | | |
NET ASSETS 100.0% | | | | | | | | | | | | | | $ | 43,394,186 | |
| | | | | | | | | | | | | | | | |
See the Glossary for a list of the abbreviation(s) used in the annual report.
| # | Principal or notional amount is shown in U.S. dollars unless otherwise stated. |
| (c) | Variable rate instrument. The interest rate shown reflects the rate in effect at August 31, 2023. |
See Notes to Financial Statements.
150
PGIM Active Aggregate Bond ETF
Schedule of Investments (continued)
as of August 31, 2023
| (cc) | Variable rate instrument. The rate shown is based on the latest available information as of August 31, 2023. Certain variable rate securities are not based on a published reference rate and spread but are determined by the issuer or agent and are based on current market conditions. These securities do not indicate a reference rate and spread in their description. |
| (ff) | Variable rate security. Security may be issued at a fixed coupon rate, which converts to a variable rate at a specified date. Rate shown is the rate in effect as of period end. |
| (k) | Represents security, or a portion thereof, segregated as collateral for centrally cleared/exchange-traded derivatives. |
| (s) | Represents zero coupon bond or principal only security. Rate represents yield to maturity at purchase date. |
| (wj) | PGIM Investments LLC, the manager of the Fund, also serves as manager of the PGIM Core Government Money Market Fund. |
| (z) | Includes net unrealized appreciation/(depreciation) and/or market value of the below holdings which are excluded from the Schedule of Investments: |
Forward Commitment Contract:
| | | | | | | | | | | | | | | | | | |
U.S. Government Agency Obligation | | Interest
Rate | | | Maturity
Date | | Settlement
Date | | | Principal
Amount
(000)# | | | Value | |
Federal National Mortgage Assoc.
(proceeds receivable $493,906) | | | 5.500 | % | | TBA | | | 10/12/23 | | | | $(500) | | | $ | (493,516 | ) |
| | | | | | | | | | | | | | | | | | |
Futures contracts outstanding at August 31, 2023:
| | | | | | | | | | | | | | | | | | | | | | | | | |
Number
of
Contracts | | | | Type | | | | Expiration
Date | | | | Current
Notional
Amount | | | | Value /
Unrealized
Appreciation
(Depreciation) |
Long Positions: | | | | | | | | | | | | | | | | | | | | | |
13 | | | | 2 Year U.S. Treasury Notes | | | | | | Dec. 2023 | | | | | | $ | 2,649,461 | | | | | | $ | 5,970 | |
8 | | | | 5 Year U.S. Treasury Notes | | | | | | Dec. 2023 | | | | | | | 855,375 | | | | | | | 1,277 | |
47 | | | | 10 Year U.S. Treasury Notes | | | | | | Dec. 2023 | | | | | | | 5,218,469 | | | | | | | 46,671 | |
3 | | | | 30 Year U.S. Ultra Treasury Bonds | | | | | | Dec. 2023 | | | | | | | 388,406 | | | | | | | 6,914 | |
| | | | | | | | | | | | | | | | | | | | | | | | | |
| | | | | | | | | | | | | | | | | | | | | | | | 60,832 | |
| | | | | | | | | | | | | | | | | | | | | | | | | |
Short Positions: | | | | | | | | | | | | | | | | | | | | | |
18 | | | | 10 Year U.S. Ultra Treasury Notes | | | | | | Dec. 2023 | | | | | | | 2,089,969 | | | | | | | (22,857 | ) |
21 | | | | 20 Year U.S. Treasury Bonds | | | | | | Dec. 2023 | | | | | | | 2,555,437 | | | | | | | (44,063 | ) |
| | | | | | | | | | | | | | | | | | | | | | | | | |
| | | | | | | | | | | | | | | | | | | | | | | | (66,920 | ) |
| | | | | | | | | | | | | | | | | | | | | | | | | |
| | | | | | | | | | | | | | | | | | | | | | | $ | (6,088 | ) |
| | | | | | | | | | | | | | | | | | | | | | | | | |
See Notes to Financial Statements.
PGIM Fixed Income ETFs 151
PGIM Active Aggregate Bond ETF
Schedule of Investments (continued)
as of August 31, 2023
Credit default swap agreement outstanding at August 31, 2023:
| | | | | | | | | | | | | | | | | | | | | | | | | | | | | | | | |
Reference Entity/ Obligation | | Termination
Date | | Fixed
Rate | | | Notional
Amount
(000)#(3) | | | Implied Credit
Spread at
August 31,
2023(4) | | Value at Trade Date | | Value at
August 31,
2023 | | Unrealized Appreciation (Depreciation) | |
| | | | | | | | | | | | | | | | | | | | | | | | | | | | | | |
Centrally Cleared Credit Default Swap Agreement on credit indices - Sell Protection(2): | |
CDX.NA.IG.40.V1 | | 06/20/28 | | | 1.000%(Q) | | | | 1,070 | | | 0.637% | | | | $16,029 | | | | | | $18,745 | | | | | | $2,716 | | | | |
| | | | | | | | | | | | | | | | | | | | | | | | | | | | | | | | |
The Fund entered into credit default swaps (“CDS”) to provide a measure of protection against defaults or to take an active long or short position with respect to the likelihood of a particular issuer’s default or the reference entity’s credit soundness. CDS contracts generally trade based on a spread which represents the cost a protection buyer has to pay the protection seller. The protection buyer is said to be short the credit as the value of the contract rises the more the credit deteriorates. The value of the CDS contract increases for the protection buyer if the spread increases.
| (1) | If the Fund is a buyer of protection, it pays the fixed rate. When a credit event occurs, as defined under the terms of that particular swap agreement, the Fund will either (i) receive from the seller of protection an amount equal to the notional amount of the swap and make delivery of the referenced obligation or underlying securities comprising the referenced index or (ii) receive a net settlement amount in the form of cash or securities equal to the notional amount of the swap less the recovery value of the referenced obligation or underlying securities comprising the referenced index. |
| (2) | If the Fund is a seller of protection, it receives the fixed rate. When a credit event occurs, as defined under the terms of that particular swap agreement, the Fund will either (i) pay to the buyer of protection an amount equal to the notional amount of the swap and take delivery of the referenced obligation or underlying securities comprising the referenced index or (ii) pay a net settlement amount in the form of cash or securities equal to the notional amount of the swap less the recovery value of the referenced obligation or underlying securities comprising the referenced index. |
| (3) | Notional amount represents the maximum potential amount the Fund could be required to pay as a seller of credit protection or receive as a buyer of credit protection if a credit event occurs as defined under the terms of that particular swap agreement. |
| (4) | Implied credit spreads, represented in absolute terms, utilized in determining the fair value of credit default swap agreements where the Fund is the seller of protection as of the reporting date serve as an indicator of the current status of the payment/ performance risk and represent the likelihood of risk of default for the credit derivative. The implied credit spread of a particular referenced entity reflects the cost of buying/selling protection and may include up-front payments required to be made to enter into the agreement. Wider credit spreads represent a deterioration of the referenced entity’s credit soundness and a greater likelihood of risk of default or other credit event occurring as defined under the terms of the agreement. |
See Notes to Financial Statements.
152
PGIM Active Aggregate Bond ETF
Schedule of Investments (continued)
as of August 31, 2023
Interest rate swap agreements outstanding at August 31, 2023:
| | | | | | | | | | | | | | | | | | | | | | | | | | | | | | | | | | | | | | | | | | | | |
Notional
Amount
(000)# | | | | Termination
Date | | | | Fixed
Rate | | | | Floating Rate | | | | Value at
Trade Date | | | | Value at
August 31,
2023 | | | | Unrealized
Appreciation
(Depreciation) | | |
| | | | | | | | | | | | | | | | | | | | | | | | | | | | | | | | | | | | | | | | | | | | |
Centrally Cleared Interest Rate Swap Agreements: | | | | | | | | | | | | | | | | | | | | | | | | |
1,865 | | | | | | 08/31/24 | | | | | | | 5.384%(T) | | | | | 1 Day SOFR(2)(T)/ 5.310% | | | | | $ | — | | | | | | $ | 451 | | | | | | $ | 451 | | | | | | |
| 424 | | | | | | 03/08/25 | | | | | | | 4.946%(A) | | | | | 1 Day SOFR(2)(A)/ 5.310% | | | | | | — | | | | | | | (917 | ) | | | | | | (917 | ) | | | | | |
| 424 | | | | | | 03/09/25 | | | | | | | 5.110%(A) | | | | | 1 Day SOFR(2)(A)/ 5.310% | | | | | | — | | | | | | | 421 | | | | | | | 421 | | | | | | |
| 852 | | | | | | 03/10/25 | | | | | | | 5.088%(A) | | | | | 1 Day SOFR(2)(A)/ 5.310% | | | | | | — | | | | | | | 474 | | | | | | | 474 | | | | | | |
| 965 | | | | | | 08/31/25 | | | | | | | 4.805%(A) | | | | | 1 Day SOFR(1)(A)/ 5.310% | | | | | | — | | | | | | | (486 | ) | | | | | | (486 | ) | | | | | |
| | | | | | | | | | | | | | | | | | | | | | | | | | | | | | | | | | | | | | | | | | | | |
| | | | | | | | | | | | | | | | | | | | | | | $ | — | | | | | | $ | (57 | ) | | | | | $ | (57 | ) | | | | | |
| | | | | | | | | | | | | | | | | | | | | | | | | | | | | | | | | | | | | | | | | | | | |
| (1) | The Fund pays the fixed rate and receives the floating rate. |
| (2) | The Fund pays the floating rate and receives the fixed rate. |
Total return swap agreement outstanding at August 31, 2023:
| | | | | | | | | | | | | | | | | | | | | | | | | | | | | | | | |
Reference Entity | | Financing
Rate | | Counterparty | | Termination
Date | | Long
(Short)
Notional
Amount
(000)#(1) | | Fair
Value | | Upfront
Premiums
Paid
(Received) | | Unrealized
Appreciation
(Depreciation)(2) |
OTC Total Return Swap Agreement: | | | | | | | | | | | | | | | | | | | | | | | | | | | | | | |
Total Return Benchmark Bond Index(T) | | 1 Day USOIS
-54 bps(T)/
4.790% | | | | JPM | | | | | 09/20/23 | | | | | (250 | ) | | | $ | 9,287 | | | | $ | — | | | | $ | 9,287 | |
| | | | | | | | | | | | | | | | | | | | | | | | | | | | | | | | |
| (1) | On a long total return swap, the Fund receives payments for any positive return on the reference entity (makes payments for any negative return) and pays the financing rate. On a short total return swap, the Fund makes payments for any positive return on the reference entity (receives payments for any negative return) and receives the financing rate. |
| (2) | Upfront/recurring fees or commissions, as applicable, are included in the net unrealized appreciation (depreciation). |
Balances Reported in the Statement of Assets and Liabilities for OTC Swap Agreements:
| | | | | | | | | | | | | | | | | | | | |
| | | Premiums Paid | | Premiums Received | | Unrealized
Appreciation | | Unrealized
Depreciation |
OTC Swap Agreements | | $— | | $— | | $9,287 | | $— |
See Notes to Financial Statements.
PGIM Fixed Income ETFs 153
PGIM Active Aggregate Bond ETF
Schedule of Investments (continued)
as of August 31, 2023
Summary of Collateral for Centrally Cleared/Exchange-traded Derivatives:
Cash and securities segregated as collateral, including pending settlement for closed positions, to cover requirements for centrally cleared/exchange-traded derivatives are listed by broker as follows:
| | | | | | | | | | |
Broker | | Cash and/or Foreign Currency | | Securities Market Value |
CGM | | | $ | — | | | | $ | 166,515 | |
JPS | | | | — | | | | | 188,912 | |
| | | | | | | | | | |
Total | | | $ | — | | | | $ | 355,427 | |
| | | | | | | | | | |
Fair Value Measurements:
Various inputs are used in determining the value of the Fund’s investments. These inputs are summarized in the three broad levels listed below.
Level 1—unadjusted quoted prices generally in active markets for identical securities.
Level 2—quoted prices for similar securities, interest rates and yield curves, prepayment speeds, foreign currency exchange rates and other observable inputs.
Level 3—unobservable inputs for securities valued in accordance with Board approved fair valuation procedures.
The following is a summary of the inputs used as of August 31, 2023 in valuing such portfolio securities:
| | | | | | | | | | | | | | | |
| | | Level 1 | | Level 2 | | Level 3 |
Investments in Securities | | | | | | | | | | | | | | | |
Assets | | | | | | | | | | | | | | | |
Long-Term Investments | | | | | | | | | | | | | | | |
Asset-Backed Securities | | | | | | | | | | | | | | | |
Automobiles | | | $ | — | | | | $ | 1,845,530 | | | | $ | — | |
Collateralized Loan Obligations | | | | — | | | | | 4,009,934 | | | | | — | |
Consumer Loans | | | | — | | | | | 280,646 | | | | | — | |
Commercial Mortgage-Backed Securities | | | | — | | | | | 4,944,942 | | | | | — | |
Corporate Bonds | | | | — | | | | | 13,648,242 | | | | | — | |
Municipal Bonds | | | | — | | | | | 111,741 | | | | | — | |
Residential Mortgage-Backed Securities. | | | | — | | | | | 184,020 | | | | | — | |
Sovereign Bonds | | | | — | | | | | 368,363 | | | | | — | |
U.S. Government Agency Obligations | | | | — | | | | | 11,878,842 | | | | | — | |
U.S. Treasury Obligations | | | | — | | | | | 5,972,943 | | | | | — | |
Short-Term Investment | | | | | | | | | | | | | | | |
Affiliated Mutual Fund | | | | 556,512 | | | | | — | | | | | — | |
| | | | | | | | | | | | | | | |
Total | | | $ | 556,512 | | | | $ | 43,245,203 | | | | $ | — | |
| | | | | | | | | | | | | | | |
| | | |
Other Financial Instruments* | | | | | | | | | | | | | | | |
Assets | | | | | | | | | | | | | | | |
Futures Contracts | | | $ | 60,832 | | | | $ | — | | | | $ | — | |
See Notes to Financial Statements.
154
PGIM Active Aggregate Bond ETF
Schedule of Investments (continued)
as of August 31, 2023
| | | | | | | | | | | | | | | |
| | | Level 1 | | Level 2 | | Level 3 |
| | | |
Other Financial Instruments* (continued) | | | | | | | | | | | | | | | |
Assets (continued) | | | | | | | | | | | | | | | |
Centrally Cleared Credit Default Swap Agreement | | | $ | — | | | | $ | 2,716 | | | | $ | — | |
Centrally Cleared Interest Rate Swap Agreements | | | | — | | | | | 1,346 | | | | | — | |
OTC Total Return Swap Agreement | | | | — | | | | | 9,287 | | | | | — | |
| | | | | | | | | | | | | | | |
| | | |
Total | | | $ | 60,832 | | | | $ | 13,349 | | | | $ | — | |
| | | | | | | | | | | | | | | |
| | | |
Liabilities | | | | | | | | | | | | | | | |
Forward Commitment Contract | | | $ | — | | | | $ | (493,516 | ) | | | $ | — | |
Futures Contracts | | | | (66,920 | ) | | | | — | | | | | — | |
Centrally Cleared Interest Rate Swap Agreements | | | | — | | | | | (1,403 | ) | | | | — | |
| | | | | | | | | | | | | | | |
| | | |
Total | | | $ | (66,920 | ) | | | $ | (494,919 | ) | | | $ | — | |
| | | | | | | | | | | | | | | |
| * | Other financial instruments are derivative instruments, with the exception of forward commitment contracts, and are not reflected in the Schedule of Investments. Futures, forwards and centrally cleared swap contracts are recorded at net unrealized appreciation (depreciation) and OTC swap contracts are recorded at fair value. Forward commitment contracts are recorded at market value. |
Industry Classification:
The industry classification of investments and other assets in excess of liabilities shown as a percentage of net assets as of August 31, 2023 were as follows:
| | | | |
U.S. Government Agency Obligations | | | 27.4 | % |
U.S. Treasury Obligations | | | 13.8 | |
Commercial Mortgage-Backed Securities | | | 11.4 | |
Collateralized Loan Obligations | | | 9.2 | |
Banks | | | 8.7 | |
Automobiles | | | 4.3 | |
Electric | | | 3.4 | |
Pipelines | | | 2.3 | |
Real Estate Investment Trusts (REITs) | | | 1.4 | |
Pharmaceuticals | | | 1.4 | |
Oil & Gas | | | 1.3 | |
Affiliated Mutual Fund | | | 1.3 | |
Media | | | 1.2 | |
Mining | | | 1.1 | |
Commercial Services | | | 1.1 | |
Healthcare-Services | | | 1.0 | |
Sovereign Bonds | | | 0.8 | |
Aerospace & Defense | | | 0.8 | |
Telecommunications | | | 0.8 | |
Consumer Loans | | | 0.6 | |
| | | | |
Semiconductors | | | 0.5 | % |
Auto Manufacturers | | | 0.5 | |
Home Builders | | | 0.5 | |
Engineering & Construction | | | 0.4 | |
Residential Mortgage-Backed Securities | | | 0.4 | |
Beverages | | | 0.4 | |
Insurance | | | 0.4 | |
Agriculture | | | 0.4 | |
Chemicals | | | 0.3 | |
Foods | | | 0.3 | |
Gas | | | 0.3 | |
Software | | | 0.3 | |
Municipal Bonds | | | 0.3 | |
Biotechnology | | | 0.3 | |
Trucking & Leasing | | | 0.3 | |
Miscellaneous Manufacturing | | | 0.2 | |
Multi-National | | | 0.2 | |
Diversified Financial Services | | | 0.2 | |
Machinery-Diversified | | | 0.2 | |
Lodging | | | 0.2 | |
See Notes to Financial Statements.
PGIM Fixed Income ETFs 155
PGIM Active Aggregate Bond ETF
Schedule of Investments (continued)
as of August 31, 2023
Industry Classification (continued):
| | | | |
Iron/Steel | | | 0.2 | % |
Entertainment | | | 0.2 | |
Retail | | | 0.2 | |
Building Materials | | | 0.1 | |
Airlines | | | 0.1 | |
Computers | | | 0.1 | |
Transportation | | | 0.1 | |
Machinery-Construction & Mining | | | 0.0 | * |
| | | | |
| | | 100.9 | |
Liabilities in excess of other assets | | | (0.9 | ) |
| | | | |
| |
| | | 100.0 | % |
| | | | |
Effects of Derivative Instruments on the Financial Statements and Primary Underlying Risk Exposure:
The Fund invested in derivative instruments during the reporting period. The primary types of risk associated with these derivative instruments are credit risk and interest rate risk. See the Notes to Financial Statements for additional detail regarding these derivative instruments and their risks. The effect of such derivative instruments on the Fund’s financial position and financial performance as reflected in the Statement of Assets and Liabilities and Statement of Operations is presented in the summary below.
Fair values of derivative instruments as of August 31, 2023 as presented in the Statement of Assets and Liabilities:
| | | | | | | | | | | | |
| | | Asset Derivatives | | | Liability Derivatives | |
Derivatives not accounted for as
hedging instruments, carried at
fair value | | Statement of Assets and Liabilities Location | | Fair
Value | | | Statement of Assets and Liabilities Location | | Fair
Value | |
Credit contracts | | Due from/to broker-variation margin swaps | | $ | 2,716 | * | | — | | $ | — | |
Interest rate contracts | | Due from/to broker-variation margin futures | | | 60,832 | * | | Due from/to broker-variation margin futures | | | 66,920 | * |
Interest rate contracts | | Due from/to broker-variation margin swaps | | | 1,346 | * | | Due from/to broker-variation margin swaps | | | 1,403 | * |
See Notes to Financial Statements.
156
PGIM Active Aggregate Bond ETF
Schedule of Investments (continued)
as of August 31, 2023
| | | | | | | | | | | | |
| | | Asset Derivatives | | | Liability Derivatives | |
Derivatives not accounted for as
hedging instruments, carried at
fair value | | Statement of Assets and Liabilities Location | | Fair
Value | | | Statement of Assets and Liabilities Location | | Fair
Value | |
Interest rate contracts | | Unrealized appreciation on OTC swap agreements | | $ | 9,287 | | | — | | $ | — | |
| | | | | | | | | | | | |
| | | | $ | 74,181 | | | | | $ | 68,323 | |
| | | | | | | | | | | | |
| * | Includes cumulative appreciation (depreciation) as reported in the schedule of open futures and centrally cleared swap contracts. Only unsettled variation margin receivable (payable) is reported within the Statement of Assets and Liabilities. |
The effects of derivative instruments on the Statement of Operations for the year ended August 31, 2023 are as follows:
| | | | | | | | | | |
| Amount of Realized Gain (Loss) on Derivatives Recognized in Income |
| | |
Derivatives not accounted for as hedging instruments, carried at fair value | | Futures | | Swaps |
Credit contracts | | | $ | — | | | | $ | (25,350 | ) |
Interest rate contracts | | | | (70,928 | ) | | | | (24,771 | ) |
| | | | | | | | | | |
| | |
Total | | | $ | (70,928 | ) | | | $ | (50,121 | ) |
| | | | | | | | | | |
|
| Change in Unrealized Appreciation (Depreciation) on Derivatives Recognized in Income |
| | |
Derivatives not accounted for as hedging instruments, carried at fair value | | Futures | | Swaps |
Credit contracts | | | $ | — | | | | $ | (2,654 | ) |
Interest rate contracts | | | | (9,394 | ) | | | | 9,230 | |
| | | | | | | | | | |
| | |
Total | | | $ | (9,394 | ) | | | $ | 6,576 | |
| | | | | | | | | | |
For the year ended August 31, 2023, the Fund’s average volume of derivative activities is as follows:
| | | | |
| Derivative Contract Type | | Average Volume of Derivative Activities* | |
| |
Futures Contracts - Long Positions (1) | | | $9,409,361 | |
Futures Contracts - Short Positions (1) | | | 5,315,231 | |
Interest Rate Swap Agreements (1) | | | 1,246,000 | |
Credit Default Swap Agreements - Buy Protection (1) | | | 632,000 | |
Credit Default Swap Agreements - Sell Protection (1) | | | 214,000 | |
Total Return Swap Agreements (1) | | | 190,822 | |
| * | Average volume is based on average quarter end balances as noted for the year ended August 31, 2023. |
| (1) | Notional Amount in USD. |
See Notes to Financial Statements.
PGIM Fixed Income ETFs 157
PGIM Active Aggregate Bond ETF
Schedule of Investments (continued)
as of August 31, 2023
Financial Instruments/Transactions—Summary of Offsetting and Netting Arrangements:
The Fund invested in OTC derivatives during the reporting period that are either offset in accordance with current requirements or are subject to enforceable master netting arrangements or similar agreements that permit offsetting. The information about offsetting and related netting arrangements for OTC derivatives where the legal right to set-off exists is presented in the summary below.
Offsetting of OTC derivative assets and liabilities:
| | | | | | | | | | | | | | | | | | | | | | | | | |
Counterparty | | Gross Amounts of
Recognized
Assets(1) | | Gross Amounts of
Recognized
Liabilities(1) | | Net Amounts of
Recognized
Assets/(Liabilities) | | Collateral
Pledged/(Received)(2) | | Net Amount |
JPM | | | $ | 9,287 | | | | $ | — | | | | $ | 9,287 | | | | $ | — | | | | $ | 9,287 | |
| | | | | | | | | | | | | | | | | | | | | | | | | |
| (1) | Includes unrealized appreciation/(depreciation) on swaps and forwards, premiums paid/(received) on swap agreements and market value of purchased and written options, as represented on the Statement of Assets and Liabilities. |
| (2) | Collateral amount disclosed by the Fund is limited to the market value of financial instruments/transactions and the Fund’s OTC derivative exposure by counterparty. |
See Notes to Financial Statements.
158
PGIM Active Aggregate Bond ETF
Statement of Assets & Liabilities
as of August 31, 2023
| | | | |
Assets | | | | |
| |
Investments at value: | | | | |
Unaffiliated investments (cost $48,877,403) | | $ | 43,245,203 | |
Affiliated investments (cost $556,512) | | | 556,512 | |
Receivable for investments sold | | | 1,695,753 | |
Dividends and interest receivable | | | 273,705 | |
Unrealized appreciation on OTC swap agreements | | | 9,287 | |
Due from broker—variation margin swaps | | | 637 | |
| | | | |
Total Assets | | | 45,781,097 | |
| | | | |
| |
| Liabilities | | | |
| |
Payable for investments purchased | | | 1,884,956 | |
Forward commitment contracts, at value (proceeds receivable $493,906) | | | 493,516 | |
Management fee payable | | | 6,964 | |
Due to broker—variation margin futures | | | 1,475 | |
| | | | |
Total Liabilities | | | 2,386,911 | |
| | | | |
| |
Net Assets | | $ | 43,394,186 | |
| | | | |
| |
| | | | | |
| |
Net assets were comprised of: | | | | |
Shares of beneficial interest, at par | | $ | 1,050 | |
Paid-in capital in excess of par | | | 51,602,483 | |
Total distributable earnings (loss) | | | (8,209,347 | ) |
| | | | |
| |
Net assets, August 31, 2023 | | $ | 43,394,186 | |
| | | | |
| |
Net asset value, offering price and redemption price per share.
($43,394,186 ÷ 1,050,000 shares of common stock issued and outstanding) | | $ | 41.33 | |
| | | | |
See Notes to Financial Statements.
PGIM Fixed Income ETFs 159
PGIM Active Aggregate Bond ETF
Statement of Operations
Year Ended August 31, 2023
| | | | |
Net Investment Income (Loss) | | | | |
| |
Income | | | | |
Interest income | | $ | 1,506,887 | |
Unaffiliated dividend income | | | 21,012 | |
Affiliated dividend income | | | 11,866 | |
| | | | |
Total income | | | 1,539,765 | |
| | | | |
| |
Expenses | | | | |
Management fee | | | 80,651 | |
| | | | |
Net investment income (loss) | | | 1,459,114 | |
| | | | |
| Realized And Unrealized Gain (Loss) On Investments | | | |
| |
Net realized gain (loss) on: | | | | |
Investment transactions | | | (1,219,233 | ) |
Futures transactions | | | (70,928 | ) |
Swap agreement transactions | | | (50,121 | ) |
| | | | |
| | | (1,340,282 | ) |
| | | | |
Net change in unrealized appreciation (depreciation) on: | | | | |
Investments | | | (523,379 | ) |
Futures | | | (9,394 | ) |
Swap agreements | | | 6,576 | |
| | | | |
| | | (526,197 | ) |
| | | | |
Net gain (loss) on investment transactions | | | (1,866,479 | ) |
| | | | |
| |
Net Increase (Decrease) In Net Assets Resulting From Operations | | $ | (407,365 | ) |
| | | | |
See Notes to Financial Statements.
160
PGIM Active Aggregate Bond ETF
Statements of Changes in Net Assets
| | | | | | | | |
| |
| | | Year Ended August 31, | |
| | | | |
| | |
| | | 2023 | | | 2022 | |
| | |
Increase (Decrease) in Net Assets | | | | | | | | |
| | |
Operations | | | | | | | | |
Net investment income (loss) | | $ | 1,459,114 | | | $ | 774,120 | |
Net realized gain (loss) on investment transactions | | | (1,340,282 | ) | | | (985,486 | ) |
Net change in unrealized appreciation (depreciation) on investments | | | (526,197 | ) | | | (5,574,442 | ) |
| | | | | | | | |
Net increase (decrease) in net assets resulting from operations | | | (407,365 | ) | | | (5,785,808 | ) |
| | | | | | | | |
| | |
Dividends and Distributions | | | | | | | | |
Distributions from distributable earnings | | | (1,491,727 | ) | | | (1,113,234 | ) |
| | | | | | | | |
| | |
Fund share transactions | | | | | | | | |
Net proceeds from shares sold (50,000 and 475,000 shares, respectively) | | | 2,107,680 | | | | 23,274,700 | |
| | | | | | | | |
Total increase (decrease) | | | 208,588 | | | | 16,375,658 | |
| | |
| Net Assets: | | | | | | |
| | |
Beginning of year | | | 43,185,598 | | | | 26,809,940 | |
| | | | | | | | |
End of year | | $ | 43,394,186 | | | $ | 43,185,598 | |
| | | | | | | | |
See Notes to Financial Statements.
PGIM Fixed Income ETFs 161
PGIM Active Aggregate Bond ETF
Financial Highlights
| | | | | | | | | | | | | | | | | | | | |
| | | | | |
| | | | | | | | | | | | | | | | | | | | |
| | | Year Ended August 31, | | April 12, 2021(a)
through August 31,
2021 | | |
| | | | | | |
| | | 2023 | | 2022 | | |
| | | | | |
Per Share Operating Performance(b): | | | | | | | | | | | | | | | | | | | | |
| | | | | |
Net Asset Value, Beginning of Period | | | | $43.19 | | | | | $51.07 | | | | | $50.00 | | | | | | |
| | | | | |
Income (loss) from investment operations: | | | | | | | | | | | | | | | | | | | | |
| | | | | |
Net investment income (loss) | | | | 1.44 | | | | | 0.95 | | | | | 0.25 | | | | | | |
| | | | | |
Net realized and unrealized gain (loss) on investment transactions | | | | (1.83 | ) | | | | (7.27 | ) | | | | 1.05 | | | | | | |
| | | | | |
Total from investment operations | | | | (0.39 | ) | | | | (6.32 | ) | | | | 1.30 | | | | | | |
| | | | | |
Less Dividends and Distributions: | | | | | | | | | | | | | | | | | | | | |
| | | | | |
Dividends from net investment income | | | | (1.47 | ) | | | | (1.02 | ) | | | | (0.23 | ) | | | | | |
| | | | | |
Distributions from net realized gains | | | | - | | | | | (0.54 | ) | | | | - | | | | | | |
| | | | | |
Total dividends and distributions | | | | (1.47 | ) | | | | (1.56 | ) | | | | (0.23 | ) | | | | | |
| | | | | |
Net asset value, end of period | | | | $41.33 | | | | | $43.19 | | | | | $51.07 | | | | | | |
| | | | | |
Total Return(c): | | | | (0.92 | )% | | | | (12.62 | )% | | | | 2.59 | % | | | | | |
| | | | | |
| | | | | | | | | | | | | | | | | | | | |
| | | | | |
Ratios/Supplemental Data: | | | | | | | | | | | | | | | | | | | | |
| | | | | |
Net assets, end of period (000) | | | | $43,394 | | | | | $43,186 | | | | | $26,810 | | | | | | |
| | | | | |
Average net assets (000) | | | | $42,451 | | | | | $38,280 | | | | | $27,915 | | | | | | |
| | | | | |
Ratios to average net assets(d): | | | | | | | | | | | | | | | | | | | | |
| | | | | |
Expenses after waivers and/or expense reimbursement | | | | 0.19 | % | | | | 0.19 | % | | | | 0.19 | %(e) | | | | | |
| | | | | |
Expenses before waivers and/or expense reimbursement | | | | 0.19 | % | | | | 0.19 | % | | | | 0.19 | %(e) | | | | | |
| | | | | |
Net investment income (loss) | | | | 3.44 | % | | | | 2.02 | % | | | | 1.28 | %(e) | | | | | |
| | | | | |
Portfolio turnover rate(f) | | | | 142 | % | | | | 409 | % | | | | 337 | % | | | | | |
| (a) | Commencement of operations. |
| (b) | Calculated based on average shares outstanding during the period. |
| (c) | Total return is calculated assuming a purchase of a share on the first day and a sale on the last day of each period reported and includes reinvestment of dividends and distributions, if any. Total returns may reflect adjustments to conform to GAAP. Total returns for periods less than one full year are not annualized. |
| (d) | Does not include expenses of the underlying funds in which the Fund invests. |
| (f) | The Fund’s portfolio turnover rate is calculated in accordance with regulatory requirements, without regard to transactions involving short-term investments, certain derivatives and in-kind transactions (if any). If such transactions were included, the Fund’s portfolio turnover rate may be higher. |
See Notes to Financial Statements.
162
PGIM Total Return Bond ETF
Schedule of Investments
as of August 31, 2023
| | | | | | | | | | | | | | | | | | |
| | | | | |
| Description | | Interest
Rate | | | Maturity
Date | | | | | Principal
Amount
(000)# | | | Value | |
| | | | | |
LONG-TERM INVESTMENTS 99.2% | | | | | | | | | | | | | | | | | | |
| | | | | |
ASSET-BACKED SECURITIES 22.9% | | | | | | | | | | | | | | | | | | |
| | | | | |
Automobiles 0.6% | | | | | | | | | | | | | | | | | | |
| | | | | |
Ford Credit Auto Owner Trust, | | | | | | | | | | | | | | | | | | |
Series 2023-01, Class C, 144A | | | 5.580% | | | | 08/15/35 | | | | | | 100 | | | $ | 98,376 | |
Hertz Vehicle Financing III LLC, | | | | | | | | | | | | | | | | | | |
Series 2022-01A, Class C, 144A | | | 2.630 | | | | 06/25/26 | | | | | | 100 | | | | 92,411 | |
Series 2023-01A, Class B, 144A | | | 6.220 | | | | 06/25/27 | | | | | | 100 | | | | 99,297 | |
OneMain Direct Auto Receivables Trust, | | | | | | | | | | | | | | | | | | |
Series 2023-01A, Class B, 144A | | | 5.810 | | | | 02/14/31 | | | | | | 200 | | | | 196,808 | |
Series 2023-01A, Class C, 144A | | | 6.140 | | | | 02/14/31 | | | | | | 100 | | | | 98,604 | |
| | | | | | | | | | | | | | | | | | |
| | | | | |
| | | | | | | | | | | | | | | | | 585,496 | |
| | | | | |
Collateralized Loan Obligations 21.4% | | | | | | | | | | | | | | | | | | |
| | | | | |
AGL CLO Ltd. (Cayman Islands), | | | | | | | | | | | | | | | | | | |
Series 2021-14A, Class A, 144A, 3 Month SOFR + 1.412% (Cap N/A, Floor 1.150%) | | | 6.745(c) | | | | 12/02/34 | | | | | | 1,000 | | | | 992,960 | |
AlbaCore Euro CLO (Ireland), | | | | | | | | | | | | | | | | | | |
Series 04A, Class B1, 144A, 3 Month EURIBOR + 2.600% (Cap N/A, Floor 2.600%) | | | 6.263(c) | | | | 07/15/35 | | | EUR | | | 500 | | | | 537,715 | |
Anchorage Capital CLO Ltd. (Cayman Islands), | | | | | | | | | | | | | | | | | | |
Series 2022-25A, Class A1, 144A, 3 Month SOFR + 1.390% (Cap N/A, Floor 1.390%) | | | 6.716(c) | | | | 04/20/35 | | | | | | 500 | | | | 491,250 | |
Apidos CLO Ltd. (United Kingdom), | | | | | | | | | | | | | | | | | | |
Series 2023-44A, Class A1, 144A, 3 Month SOFR + 2.000% (Cap N/A, Floor 2.000%) | | | 7.057(c) | | | | 04/26/35 | | | | | | 750 | | | | 754,954 | |
Atlas Senior Loan Fund Ltd. (Cayman Islands), | | | | | | | | | | | | | | | | | | |
Series 2019-14A, Class AR, 144A, 3 Month SOFR + 1.422% (Cap N/A, Floor 1.160%) | | | 6.748(c) | | | | 07/20/32 | | | | | | 500 | | | | 495,048 | |
Avoca Capital CLO Ltd. (Ireland), | | | | | | | | | | | | | | | | | | |
Series 10A, Class B1, 144A, 3 Month EURIBOR + 1.350% (Cap N/A, Floor 1.350%) | | | 5.013(c) | | | | 04/15/35 | | | EUR | | | 250 | | | | 260,028 | |
Bain Capital Credit CLO Ltd. (Cayman Islands), | | | | | | | | | | | | | | | | | | |
Series 2022-01A, Class A1, 144A, 3 Month SOFR + 1.320% (Cap N/A, Floor 1.320%) | | | 6.630(c) | | | | 04/18/35 | | | | | | 250 | | | | 246,637 | |
Balboa Bay Loan Funding Ltd. (Cayman Islands), | | | | | | | | | | | | | | | | | | |
Series 2021-02A, Class A1, 144A, 3 Month SOFR + 1.432% (Cap N/A, Floor 1.170%) | | | 6.765(c) | | | | 01/20/35 | | | | | | 500 | | | | 495,000 | |
Ballyrock CLO Ltd. (Cayman Islands), | | | | | | | | | | | | | | | | | | |
Series 2020-02A, Class A1R, 144A, 3 Month SOFR + 1.272% (Cap N/A, Floor 1.010%) | | | 6.598(c) | | | | 10/20/31 | | | | | | 250 | | | | 248,476 | |
See Notes to Financial Statements.
PGIM Fixed Income ETFs 163
PGIM Total Return Bond ETF
Schedule of Investments (continued)
as of August 31, 2023
| | | | | | | | | | | | | | | | | | |
| Description | | Interest
Rate | | | Maturity
Date | | | | | Principal
Amount
(000)# | | | Value | |
| | | | | |
ASSET-BACKED SECURITIES (Continued) | | | | | | | | | | | | | | | | | | |
| | | | | |
Collateralized Loan Obligations (cont’d.) | | | | | | | | | | | | | | | | | | |
| | | | | |
Barings CLO Ltd. (Cayman Islands), | | | | | | | | | | | | | | | | | | |
Series 2020-02A, Class AR, 144A, 3 Month SOFR + 1.272% (Cap N/A, Floor 1.010%) | | | 6.580 | %(c) | | | 10/15/33 | | | | | | 250 | | | $ | 248,375 | |
Battalion CLO Ltd. (Cayman Islands), | | | | | | | | | | | | | | | | | | |
Series 2016-10A, Class A1R2, 144A, 3 Month SOFR + 1.432% (Cap N/A, Floor 1.170%) | | | 6.777 | (c) | | | 01/25/35 | | | | | | 750 | | | | 741,187 | |
Series 2018-12A, Class A1, 144A, 3 Month SOFR + 1.332% (Cap N/A, Floor 1.070%) | | | 6.708 | (c) | | | 05/17/31 | | | | | | 489 | | | | 486,175 | |
Benefit Street Partners CLO Ltd. (Cayman Islands), | | | | | | | | | | | | | | | | | | |
Series 2013-03A, Class A1R2, 144A, 3 Month SOFR + 1.262% (Cap N/A, Floor 1.000%) | | | 6.588 | (c) | | | 07/20/29 | | | | | | 56 | | | | 55,301 | |
Series 2018-16A, Class A1R, 144A, 3 Month SOFR + 1.292% (Cap N/A, Floor 1.030%) | | | 6.600 | (c) | | | 01/17/32 | | | | | | 500 | | | | 497,500 | |
BlueMountain CLO Ltd. (Cayman Islands), | | | | | | | | | | | | | | | | | | |
Series 2019-24A, Class AR, 144A, 3 Month SOFR + 1.362% (Cap N/A, Floor 1.100%) | | | 6.688 | (c) | | | 04/20/34 | | | | | | 500 | | | | 494,248 | |
Canyon Capital CLO Ltd. (Cayman Islands), | | | | | | | | | | | | | | | | | | |
Series 2022-01A, Class A, 144A, 3 Month SOFR + 1.330% (Cap N/A, Floor 1.330%) | | | 6.640 | (c) | | | 04/15/35 | | | | | | 292 | | | | 287,326 | |
Carlyle CLO Ltd. (Cayman Islands), | | | | | | | | | | | | | | | | | | |
Series C17A, Class A1AR, 144A, 3 Month SOFR + 1.292% (Cap N/A, Floor 0.000%) | | | 6.661 | (c) | | | 04/30/31 | | | | | | 250 | | | | 248,437 | |
Carlyle Global Market Strategies CLO Ltd. (Cayman Islands), | | | | | | | | | | | | | | | | | | |
Series 2014-01A, Class A1R2, 144A, 3 Month SOFR + 1.232% (Cap N/A, Floor 0.970%) | | | 6.540 | (c) | | | 04/17/31 | | | | | | 248 | | | | 247,168 | |
Carlyle US CLO Ltd. (Cayman Islands), | | | | | | | | | | | | | | | | | | |
Series 2021-11A, Class A, 144A, 3 Month SOFR + 1.357% (Cap N/A, Floor 1.095%) | | | 6.708 | (c) | | | 01/25/33 | | | | | | 500 | | | | 496,250 | |
CarVal CLO Ltd. (United Kingdom), | | | | | | | | | | | | | | | | | | |
Series 2023-01A, Class A1, 144A, 3 Month SOFR + 2.200% (Cap N/A, Floor 2.200%) | | | 7.526 | (c) | | | 01/20/35 | | | | | | 500 | | | | 502,634 | |
Clover CLO Ltd. (Cayman Islands), | | | | | | | | | | | | | | | | | | |
Series 2019-02A, Class AR, 144A, 3 Month SOFR + 1.362% (Cap N/A, Floor 1.362%) | | | 6.713 | (c) | | | 10/25/33 | | | | | | 750 | | | | 742,927 | |
Cordatus CLO PLC (Ireland), | | | | | | | | | | | | | | | | | | |
Series 23A, Class B1, 144A, 3 Month EURIBOR + 2.300% (Cap N/A, Floor 2.300%) | | | 6.021 | (c) | | | 04/25/36 | | | EUR | | | 250 | | | | 268,008 | |
See Notes to Financial Statements.
164
PGIM Total Return Bond ETF
Schedule of Investments (continued)
as of August 31, 2023
| | | | | | | | | | | | | | | | | | |
| Description | | Interest
Rate | | | Maturity
Date | | | | | Principal
Amount
(000)# | | | Value | |
| | | | | |
ASSET-BACKED SECURITIES (Continued) | | | | | | | | | | | | | | | | | | |
| | | | | |
Collateralized Loan Obligations (cont’d.) | | | | | | | | | | | | | | | | | | |
| | | | | |
Crown City CLO (Cayman Islands), | | | | | | | | | | | | | | | | | | |
Series 2020-02A, Class A1AR, 144A, 3 Month SOFR + 1.340% (Cap N/A, Floor 1.340%) | | | 6.666 | %(c) | | | 04/20/35 | | | | | | 250 | | | $ | 246,339 | |
Crown Point CLO Ltd. (Cayman Islands), | | | | | | | | | | | | | | | | | | |
Series 2021-11A, Class A, 144A, 3 Month SOFR + 1.382% (Cap N/A, Floor 1.120%) | | | 6.690 | (c) | | | 01/17/34 | | | | | | 500 | | | | 492,982 | |
Elevation CLO Ltd. (Cayman Islands), | | | | | | | | | | | | | | | | | | |
Series 2018-03A, Class A1R, 144A, 3 Month SOFR + 1.472% (Cap N/A, Floor 1.210%) | | | 6.823 | (c) | | | 01/25/35 | | | | | | 500 | | | | 491,466 | |
Generate CLO Ltd. (Cayman Islands), | | | | | | | | | | | | | | | | | | |
Series 4A, Class A1R, 144A, 3 Month SOFR + 1.352% (Cap N/A, Floor 0.000%) | | | 6.678 | (c) | | | 04/20/32 | | | | | | 244 | | | | 241,939 | |
Greenwood Park CLO Ltd. (Cayman Islands), | | | | | | | | | | | | | | | | | | |
Series 2018-01A, Class A2, 144A, 3 Month SOFR + 1.272% (Cap N/A, Floor 0.000%) | | | 6.580 | (c) | | | 04/15/31 | | | | | | 250 | | | | 248,750 | |
Greywolf CLO Ltd. (Cayman Islands), | | | | | | | | | | | | | | | | | | |
Series 2018-01A, Class A1, 144A, 3 Month SOFR + 1.290% (Cap N/A, Floor 0.000%) | | | 6.641 | (c) | | | 04/26/31 | | | | | | 330 | | | | 327,597 | |
Grosvenor Place CLO DAC (Ireland), | | | | | | | | | | | | | | | | | | |
Series 22-1A, Class A, 144A, 3 Month EURIBOR + 2.000% (Cap N/A, Floor 2.000%) | | | 5.808 | (c) | | | 11/24/35 | | | EUR | | | 750 | | | | 812,830 | |
HPS Loan Management Ltd. (Cayman Islands), | | | | | | | | | | | | | | | | | | |
Series 10A-16, Class A1RR, 144A, 3 Month SOFR + 1.402% (Cap N/A, Floor 1.140%) | | | 6.728 | (c) | | | 04/20/34 | | | | | | 300 | | | | 297,000 | |
ICG US CLO Ltd. (Cayman Islands), | | | | | | | | | | | | | | | | | | |
Series 2014-03A, Class A1RR, 144A, 3 Month SOFR + 1.292% (Cap N/A, Floor 0.000%) | | | 6.643 | (c) | | | 04/25/31 | | | | | | 221 | | | | 219,666 | |
Series 2015-02RA, Class A1, 144A, 3 Month SOFR + 1.632% (Cap N/A, Floor 1.370%) | | | 6.940 | (c) | | | 01/16/33 | | | | | | 250 | | | | 249,606 | |
KKR CLO Ltd. (Cayman Islands), | | | | | | | | | | | | | | | | | | |
Series 11, Class AR, 144A, 3 Month SOFR + 1.442% (Cap N/A, Floor 1.442%) | | | 6.750 | (c) | | | 01/15/31 | | | | | | 235 | | | | 233,238 | |
Series 33A, Class A, 144A, 3 Month SOFR + 1.432% (Cap N/A, Floor 1.170%) | | | 6.758 | (c) | | | 07/20/34 | | | | | | 500 | | | | 497,639 | |
Madison Park Euro Funding (Ireland), | | | | | | | | | | | | | | | | | | |
Series 14A, Class A1R, 144A, 3 Month EURIBOR + 0.800% (Cap N/A, Floor 0.800%) | | | 4.463 | (c) | | | 07/15/32 | | | EUR | | | 250 | | | | 265,258 | |
Madison Park Funding Ltd. (Cayman Islands), | | | | | | | | | | | | | | | | | | |
Series 2021-38A, Class A, 144A, 3 Month SOFR + 1.382% (Cap N/A, Floor 1.382%) | | | 6.690 | (c) | | | 07/17/34 | | | | | | 250 | | | | 247,904 | |
See Notes to Financial Statements.
PGIM Fixed Income ETFs 165
PGIM Total Return Bond ETF
Schedule of Investments (continued)
as of August 31, 2023
| | | | | | | | | | | | | | | | |
| | | | |
| Description | | Interest
Rate | | | Maturity
Date | | | Principal
Amount
(000)# | | | Value | |
| | | | |
ASSET-BACKED SECURITIES (Continued) | | | | | | | | | | | | | | | | |
| | | | |
Collateralized Loan Obligations (cont’d.) | | | | | | | | | | | | | | | | |
| | | | |
OCP CLO Ltd. (Cayman Islands),
Series 2015-09A, Class A1R2, 144A, 3 Month SOFR + 1.250% (Cap N/A, Floor 1.250%) | | | 6.558%(c) | | | | 01/15/33 | | | | 250 | | | $ | 247,000 | |
OFSI BSL Ltd. (Cayman Islands),
Series 2022-11A, Class A1, 144A, 3 Month SOFR + 2.100% (Cap N/A, Floor 2.100%) | | | 7.410(c) | | | | 07/18/31 | | | | 500 | | | | 501,029 | |
OZLM Ltd. (Cayman Islands),
Series 2018-18A, Class A, 144A, 3 Month SOFR + 1.282% (Cap N/A, Floor 1.020%) | | | 6.590(c) | | | | 04/15/31 | | | | 235 | | | | 232,633 | |
Palmer Square CLO Ltd. (Cayman Islands),
Series 2015-01A, Class A2R4, 144A, 3 Month SOFR + 1.962% (Cap N/A, Floor 1.962%) | | | 7.341(c) | | | | 05/21/34 | | | | 465 | | | | 458,805 | |
Series 2018-02A, Class A1A, 144A, 3 Month SOFR + 1.362% (Cap N/A, Floor 0.000%) | | | 6.670(c) | | | | 07/16/31 | | | | 500 | | | | 498,671 | |
Palmer Square European CLO DAC (Ireland),
Series 22-2A, Class A1, 144A, 3 Month EURIBOR + 2.200% (Cap N/A, Floor 2.200%) | | | 5.863(c) | | | | 01/15/36 | | | | EUR 250 | | | | 271,462 | |
Park Avenue Institutional Advisers CLO Ltd.
(Cayman Islands),
Series 2018-01A, Class A1AR, 144A, 3 Month SOFR + 1.262% (Cap N/A, Floor 1.000%) | | | 6.588(c) | | | | 10/20/31 | | | | 250 | | | | 248,076 | |
Series 2019-02A, Class A1R, 144A, 3 Month SOFR + 1.442% (Cap N/A, Floor 1.180%) | | | 6.750(c) | | | | 10/15/34 | | | | 500 | | | | 491,098 | |
Regatta Funding Ltd. (Cayman Islands),
Series 2021-04A, Class A1, 144A, 3 Month SOFR + 1.412% (Cap N/A, Floor 1.150%) | | | 6.738(c) | | | | 01/20/35 | | | | 750 | | | | 745,121 | |
Rockford Tower CLO Ltd.,
Series 2022-02A, Class A1, 144A, 3 Month SOFR + 2.000% (Cap N/A, Floor 2.000%) | | | 7.326(c) | | | | 07/20/33 | | | | 750 | | | | 753,287 | |
TCW CLO Ltd. (Cayman Islands),
Series 2019-02A, Class A1R, 144A, 3 Month SOFR + 1.280% (Cap N/A, Floor 1.280%) | | | 6.606(c) | | | | 10/20/32 | | | | 250 | | | | 247,058 | |
THL Credit Wind River CLO Ltd. (Cayman Islands),
Series 2019-01A, Class AR, 144A, 3 Month SOFR + 1.422% (Cap N/A, Floor 1.160%) | | | 6.748(c) | | | | 07/20/34 | | | | 750 | | | | 739,298 | |
Tikehau US CLO Ltd. (Bermuda),
Series 2023-01A, Class A1, 144A, 3 Month SOFR + 2.200% (Cap N/A, Floor 2.200%) | | | 7.466(c) | | | | 07/15/34 | | | | 750 | | | | 754,022 | |
See Notes to Financial Statements.
166
PGIM Total Return Bond ETF
Schedule of Investments (continued)
as of August 31, 2023
| | | | | | | | | | | | | | | | |
| | | | |
| Description | | Interest
Rate | | | Maturity
Date | | | Principal
Amount
(000)# | | | Value | |
| | | | |
ASSET-BACKED SECURITIES (Continued) | | | | | | | | | | | | | | | | |
| | | | |
Collateralized Loan Obligations (cont’d.) | | | | | | | | | | | | | | | | |
| | | | |
Trinitas CLO Ltd. (Cayman Islands), | | | | | | | | | | | | | | | | |
Series 2016-05A, Class ARR, 144A, 3 Month SOFR + 1.292% (Cap N/A, Floor 1.030%) | | | 6.643%(c) | | | | 10/25/28 | | | | 8 | | | $ | 8,122 | |
Trinitas Euro CLO (Ireland), | | | | | | | | | | | | | | | | |
Series 02A, Class CR, 144A, 3 Month EURIBOR + 3.750% (Cap N/A, Floor 3.750%) | | | 7.413(c) | | | | 04/15/35 | | | | EUR 500 | | | | 543,292 | |
TSTAT Ltd., | | | | | | | | | | | | | | | | |
Series 2022-01A, Class A1, 144A, 3 Month SOFR + 2.300% (Cap N/A, Floor 2.300%) | | | 7.626(c) | | | | 07/20/31 | | | | 450 | | | | 452,037 | |
Venture CLO Ltd. (Cayman Islands), | | | | | | | | | | | | | | | | |
Series 2021-43A, Class A1, 144A, 3 Month SOFR + 1.502% (Cap N/A, Floor 1.240%) | | | 6.810(c) | | | | 04/15/34 | | | | 250 | | | | 246,791 | |
| | | | | | | | | | | | | | | | |
| | | | |
| | | | | | | | | | | | | | | 22,147,620 | |
| | | | |
Consumer Loans 0.9% | | | | | | | | | | | | | | | | |
| | | | |
Mariner Finance Issuance Trust, | | | | | | | | | | | | | | | | |
Series 2020-AA, Class A, 144A | | | 2.190 | | | | 08/21/34 | | | | 148 | | | | 143,326 | |
OneMain Financial Issuance Trust, | | | | | | | | | | | | | | | | |
Series 2023-01A, Class A, 144A | | | 5.500 | | | | 06/14/38 | | | | 400 | | | | 397,098 | |
Series 2023-02A, Class C, 144A | | | 6.740 | | | | 09/15/36 | | | | 100 | | | | 100,498 | |
Series 2023-02A, Class D, 144A | | | 7.520 | | | | 09/15/36 | | | | 100 | | | | 100,825 | |
Oportun Issuance Trust, | | | | | | | | | | | | | | | | |
Series 2022-02, Class A, 144A | | | 5.940 | | | | 10/09/29 | | | | 57 | | | | 56,364 | |
Regional Management Issuance Trust, | | | | | | | | | | | | | | | | |
Series 2022-01, Class A, 144A | | | 3.070 | | | | 03/15/32 | | | | 100 | | | | 93,368 | |
| | | | | | | | | | | | | | | | |
| | | | |
| | | | | | | | | | | | | | | 891,479 | |
| | | | | | | | | | | | | | | | |
| | | | |
TOTAL ASSET-BACKED SECURITIES
(cost $23,524,558) | | | | | | | | | | | | | | | 23,624,595 | |
| | | | | | | | | | | | | | | | |
| | | | |
COMMERCIAL MORTGAGE-BACKED SECURITIES 11.3%
| | | | | | | | | | | | | | | | |
| | | | |
Arbor Multifamily Mortgage Securities Trust, | | | | | | | | | | | | | | | | |
Series 2021-MF03, Class A1, 144A | | | 1.075 | | | | 10/15/54 | | | | 327 | | | | 297,123 | |
BANK, | | | | | | | | | | | | | | | | |
Series 2021-BN35, Class A4 | | | 2.031 | | | | 06/15/64 | | | | 500 | | | | 395,364 | |
Series 2021-BN38, Class A4 | | | 2.275 | | | | 12/15/64 | | | | 250 | | | | 197,753 | |
See Notes to Financial Statements.
PGIM Fixed Income ETFs 167
PGIM Total Return Bond ETF
Schedule of Investments (continued)
as of August 31, 2023
| | | | | | | | | | | | | | | | |
| | | | |
| Description | | Interest
Rate | | | Maturity
Date | | | Principal
Amount
(000)# | | | Value | |
| | | | |
COMMERCIAL MORTGAGE-BACKED SECURITIES (Continued) | | | | | | | | | | | | | | | | |
Bank of America Merrill Lynch Commercial Mortgage Trust, | | | | | | | | | | | | | | | | |
Series 2017-BNK03, Class XB, IO | | | 0.735%(cc) | | | | 02/15/50 | | | | 8,410 | | | $ | 152,615 | |
Barclays Commercial Mortgage Securities Trust, | | | | | | | | | | | | | | | | |
Series 2020-C07, Class XB, IO | | | 1.099(cc) | | | | 04/15/53 | | | | 1,019 | | | | 56,950 | |
Benchmark Mortgage Trust, | | | | | | | | | | | | | | | | |
Series 2020-B19, Class A1 | | | 0.628 | | | | 09/15/53 | | | | 274 | | | | 261,226 | |
Series 2021-B28, Class A1 | | | 0.597 | | | | 08/15/54 | | | | 621 | | | | 569,915 | |
Series 2023-V02, Class A3 | | | 5.812(cc) | | | | 05/15/55 | | | | 500 | | | | 499,930 | |
BMO Mortgage Trust, | | | | | | | | | | | | | | | | |
Series 2023-C06, Class XB, IO | | | 0.348(cc) | | | | 09/15/56 | | | | 25,500 | | | | 422,367 | |
BX Commercial Mortgage Trust, | | | | | | | | | | | | | | | | |
Series 2019-XL, Class F, 144A, 1 Month SOFR + | | | | | | | | | | | | | | | | |
2.114% (Cap N/A, Floor 2.000%) | | | 7.425(c) | | | | 10/15/36 | | | | 255 | | | | 252,097 | |
Series 2019-XL, Class J, 144A, 1 Month SOFR + | | | | | | | | | | | | | | | | |
2.764% (Cap N/A, Floor 2.650%) | | | 8.075(c) | | | | 10/15/36 | | | | 340 | | | | 329,868 | |
Series 2021-CIP, Class E, 144A, 1 Month SOFR + | | | | | | | | | | | | | | | | |
2.934% (Cap N/A, Floor 2.820%) | | | 8.244(c) | | | | 12/15/38 | | | | 150 | | | | 143,603 | |
BXP Trust, | | | | | | | | | | | | | | | | |
Series 2021-601L, Class A, 144A | | | 2.618 | | | | 01/15/44 | | | | 250 | | | | 191,774 | |
CCUBS Commercial Mortgage Trust, | | | | | | | | | | | | | | | | |
Series 2017-C01, Class A3 | | | 3.283(cc) | | | | 11/15/50 | | | | 1,200 | | | | 1,088,251 | |
CENT Trust, | | | | | | | | | | | | | | | | |
Series 2023-CITY, Class A, 144A, 1 Month SOFR | | | | | | | | | | | | | | | | |
+ 2.620% (Cap N/A, Floor 2.620%) | | | 7.870(c) | | | | 09/15/28 | | | | 200 | | | | 200,439 | |
Citigroup Commercial Mortgage Trust, | | | | | | | | | | | | | | | | |
Series 2019-GC43, Class A3 | | | 2.782 | | | | 11/10/52 | | | | 500 | | | | 424,405 | |
Commercial Mortgage Trust, | | | | | | | | | | | | | | | | |
Series 2014-UBS04, Class A5 | | | 3.694 | | | | 08/10/47 | | | | 1,000 | | | | 969,648 | |
Credit Suisse Mortgage Trust, | | | | | | | | | | | | | | | | |
Series 2014-USA, Class A2, 144A | | | 3.953 | | | | 09/15/37 | | | | 250 | | | | 217,588 | |
CSAIL Commercial Mortgage Trust, | | | | | | | | | | | | | | | | |
Series 2019-C16, Class A2 | | | 3.067 | | | | 06/15/52 | | | | 232 | | | | 206,556 | |
GS Mortgage Securities Corp. Trust, | | | | | | | | | | | | | | | | |
Series 2021-IP, Class E, 144A, 1 Month SOFR + | | | | | | | | | | | | | | | | |
3.664% (Cap N/A, Floor 3.550%) | | | 8.975(c) | | | | 10/15/36 | | | | 180 | | | | 164,631 | |
GS Mortgage Securities Trust, | | | | | | | | | | | | | | | | |
Series 2021-GSA03, Class A4 | | | 2.369 | | | | 12/15/54 | | | | 200 | | | | 157,588 | |
Series 2021-GSA03, Class XB, IO | | | 0.746(cc) | | | | 12/15/54 | | | | 2,000 | | | | 85,277 | |
JPMDB Commercial Mortgage Securities Trust, | | | | | | | | | | | | | | | | |
Series 2020-COR07, Class ASB | | | 2.051 | | | | 05/13/53 | | | | 1,100 | | | | 943,157 | |
See Notes to Financial Statements.
168
PGIM Total Return Bond ETF
Schedule of Investments (continued)
as of August 31, 2023
| | | | | | | | | | | | | | | | |
| | | | |
| Description | | Interest
Rate | | | Maturity
Date | | | Principal
Amount
(000)# | | | Value | |
| | | | |
COMMERCIAL MORTGAGE-BACKED SECURITIES (Continued) | | | | | | | | | | | | | | | | |
JPMorgan Chase Commercial Mortgage Securities Trust, | | | | | | | | | | | | | | | | |
Series 2021-NYAH, Class F, 144A, 1 Month SOFR | | | | | | | | | | | | | | | | |
+ 2.304% (Cap N/A, Floor 2.190%) | | | 7.615%(c) | | | | 06/15/38 | | | | 374 | | | $ | 319,880 | |
MHC Commercial Mortgage Trust, | | | | | | | | | | | | | | | | |
Series 2021-MHC, Class F, 144A, 1 Month SOFR | | | | | | | | | | | | | | | | |
+ 2.715% (Cap N/A, Floor 2.601%) | | | 8.025(c) | | | | 04/15/38 | | | | 369 | | | | 358,739 | |
Morgan Stanley Capital I Trust, | | | | | | | | | | | | | | | | |
Series 2016-BNK02, Class A3 | | | 2.791 | | | | 11/15/49 | | | | 1,000 | | | | 907,383 | |
Series 2019-L02, Class A3 | | | 3.806 | | | | 03/15/52 | | | | 325 | | | | 298,639 | |
Series 2020-HR08, Class A3 | | | 1.790 | | | | 07/15/53 | | | | 365 | | | | 288,695 | |
MSWF Commercial Mortgage Trust, | | | | | | | | | | | | | | | | |
Series 2023-01, Class A2 | | | 6.451 | | | | 05/15/56 | | | | 500 | | | | 507,632 | |
ONE Mortgage Trust, | | | | | | | | | | | | | | | | |
Series 2021-PARK, Class E, 144A, 1 Month SOFR | | | | | | | | | | | | | | | | |
+ 1.864% (Cap N/A, Floor 1.750%) | | | 7.174(c) | | | | 03/15/36 | | | | 120 | | | | 109,007 | |
One New York Plaza Trust, | | | | | | | | | | | | | | | | |
Series 2020-01NYP, Class A, 144A, 1 Month SOFR + 1.064% (Cap N/A, Floor 0.950%) | | | 6.375(c) | | | | 01/15/36 | | | | 240 | | | | 230,084 | |
Series 2020-01NYP, Class AJ, 144A, 1 Month SOFR + 1.364% (Cap N/A, Floor 1.250%) | | | 6.675(c) | | | | 01/15/36 | | | | 310 | | | | 288,983 | |
Series 2020-01NYP, Class B, 144A, 1 Month SOFR + 1.614% (Cap N/A, Floor 1.500%) | | | 6.925(c) | | | | 01/15/36 | | | | 175 | | | | 160,573 | |
| | | | | | | | | | | | | | | | |
| | | | |
TOTAL COMMERCIAL MORTGAGE-BACKED SECURITIES
(cost $12,227,176) | | | | | | | | | | | | | | | 11,697,740 | |
| | | | | | | | | | | | | | | | |
| | | | |
CORPORATE BONDS 36.5% | | | | | | | | | | | | | | | | |
| | | | |
Aerospace & Defense 0.5% | | | | | | | | | | | | | | | | |
| | | | |
Boeing Co. (The), | | | | | | | | | | | | | | | | |
Sr. Unsec’d. Notes | | | 3.300 | | | | 03/01/35 | | | | 190 | | | | 149,032 | |
Sr. Unsec’d. Notes | | | 3.600 | | | | 05/01/34 | | | | 165 | | | | 139,800 | |
Sr. Unsec’d. Notes | | | 3.900 | | | | 05/01/49 | | | | 180 | | | | 134,691 | |
Bombardier, Inc. (Canada), | | | | | | | | | | | | | | | | |
Sr. Unsec’d. Notes, 144A | | | 7.875 | | | | 04/15/27 | | | | 75 | | | | 74,813 | |
| | | | | | | | | | | | | | | | |
| | | | |
| | | | | | | | | | | | | | | 498,336 | |
| | | | |
Agriculture 0.8% | | | | | | | | | | | | | | | | |
| | | | |
Altria Group, Inc., | | | | | | | | | | | | | | | | |
Gtd. Notes | | | 2.450 | | | | 02/04/32 | | | | 245 | | | | 191,175 | |
See Notes to Financial Statements.
PGIM Fixed Income ETFs 169
PGIM Total Return Bond ETF
Schedule of Investments (continued)
as of August 31, 2023
| | | | | | | | | | | | | | | | |
| | | | |
| Description | | Interest
Rate | | | Maturity
Date | | | Principal
Amount
(000)# | | | Value | |
| | | | |
CORPORATE BONDS (Continued) | | | | | | | | | | | | | | | | |
| | | | |
Agriculture (cont’d.) | | | | | | | | | | | | | | | | |
| | | | |
BAT Capital Corp. (United Kingdom), | | | | | | | | | | | | | | | | |
Gtd. Notes | | | 6.343% | | | | 08/02/30 | | | | 75 | | | $ | 75,415 | |
BAT International Finance PLC (United Kingdom), | | | | | | | | | | | | | | | | |
Gtd. Notes | | | 4.448 | | | | 03/16/28 | | | | 120 | | | | 113,603 | |
Gtd. Notes | | | 5.931 | | | | 02/02/29 | | | | 25 | | | | 24,851 | |
Philip Morris International, Inc., | | | | | | | | | | | | | | | | |
Sr. Unsec’d. Notes | | | 5.125 | | | | 02/15/30 | | | | 450 | | | | 444,838 | |
| | | | | | | | | | | | | | | | |
| | | | |
| | | | | | | | | | | | | | | 849,882 | |
| | | | |
Airlines 0.4% | | | | | | | | | | | | | | | | |
| | | | |
Delta Air Lines, Inc./SkyMiles IP Ltd., | | | | | | | | | | | | | | | | |
Sr. Sec’d. Notes, 144A | | | 4.750 | | | | 10/20/28 | | | | 300 | | | | 287,625 | |
Southwest Airlines Co., | | | | | | | | | | | | | | | | |
Sr. Unsec’d. Notes | | | 5.125 | | | | 06/15/27 | | | | 140 | | | | 138,247 | |
| | | | | | | | | | | | | | | | |
| | | | |
| | | | | | | | | | | | | | | 425,872 | |
| | | | |
Apparel 0.1% | | | | | | | | | | | | | | | | |
| | | | |
Kontoor Brands, Inc., | | | | | | | | | | | | | | | | |
Gtd. Notes, 144A | | | 4.125 | | | | 11/15/29 | | | | 50 | | | | 42,489 | |
Wolverine World Wide, Inc., | | | | | | | | | | | | | | | | |
Gtd. Notes, 144A | | | 4.000 | | | | 08/15/29 | | | | 50 | | | | 37,423 | |
| | | | | | | | | | | | | | | | |
| | | | |
| | | | | | | | | | | | | | | 79,912 | |
| | | | |
Auto Manufacturers 1.0% | | | | | | | | | | | | | | | | |
| | | | |
Ford Motor Co., | | | | | | | | | | | | | | | | |
Sr. Unsec’d. Notes | | | 4.750 | | | | 01/15/43 | | | | 50 | | | | 37,389 | |
Ford Motor Credit Co. LLC, | | | | | | | | | | | | | | | | |
Sr. Unsec’d. Notes | | | 4.271 | | | | 01/09/27 | | | | 200 | | | | 184,992 | |
Sr. Unsec’d. Notes | | | 7.200 | | | | 06/10/30 | | | | 255 | | | | 258,838 | |
General Motors Co., | | | | | | | | | | | | | | | | |
Sr. Unsec’d. Notes | | | 6.250 | | | | 10/02/43 | | | | 150 | | | | 141,003 | |
General Motors Financial Co., Inc., | | | | | | | | | | | | | | | | |
Sr. Unsec’d. Notes | | | 5.000 | | | | 04/09/27 | | | | 180 | | | | 175,308 | |
Sr. Unsec’d. Notes | | | 5.800 | | | | 06/23/28 | | | | 225 | | | | 223,114 | |
| | | | | | | | | | | | | | | | |
| | | | |
| | | | | | | | | | | | | | | 1,020,644 | |
See Notes to Financial Statements.
170
PGIM Total Return Bond ETF
Schedule of Investments (continued)
as of August 31, 2023
| | | | | | | | | | | | | | | | |
| | | | |
| Description | | Interest
Rate | | | Maturity
Date | | | Principal
Amount
(000)# | | | Value | |
| | | | |
CORPORATE BONDS (Continued) | | | | | | | | | | | | | | | | |
| | | | |
Auto Parts & Equipment 0.3% | | | | | | | | | | | | | | | | |
| | | | |
BorgWarner, Inc., | | | | | | | | | | | | | | | | |
Sr. Unsec’d. Notes, 144A | | | 5.000% | | | | 10/01/25 | | | | 260 | | | $ | 255,647 | |
Tenneco, Inc., | | | | | | | | | | | | | | | | |
Sr. Sec’d. Notes, 144A | | | 8.000 | | | | 11/17/28 | | | | 50 | | | | 41,176 | |
| | | | | | | | | | | | | | | | |
| | | | |
| | | | | | | | | | | | | | | 296,823 | |
| | | | |
Banks 8.9% | | | | | | | | | | | | | | | | |
| | | | |
Bank Gospodarstwa Krajowego (Poland), | | | | | | | | | | | | | | | | |
Gov’t. Gtd. Notes, 144A, MTN | | | 5.375 | | | | 05/22/33 | | | | 200 | | | | 195,500 | |
Bank of America Corp., | | | | | | | | | | | | | | | | |
Sr. Unsec’d. Notes | | | 5.288(ff) | | | | 04/25/34 | | | | 235 | | | | 229,363 | |
Sr. Unsec’d. Notes, Series N | | | 2.651(ff) | | | | 03/11/32 | | | | 1,120 | | | | 918,158 | |
Barclays PLC (United Kingdom), | | | | | | | | | | | | | | | | |
Sr. Unsec’d. Notes | | | 5.829(ff) | | | | 05/09/27 | | | | 340 | | | | 336,685 | |
Sub. Notes | | | 7.119(ff) | | | | 06/27/34 | | | | 310 | | | | 309,590 | |
BNP Paribas SA (France), | | | | | | | | | | | | | | | | |
Sr. Unsec’d. Notes, 144A | | | 1.323(ff) | | | | 01/13/27 | | | | 415 | | | | 372,742 | |
Citigroup, Inc., | | | | | | | | | | | | | | | | |
Jr. Sub. Notes | | | 3.875(ff) | | | | 02/18/26(oo) | | | | 40 | | | | 34,829 | |
Sr. Unsec’d. Notes | | | 2.666(ff) | | | | 01/29/31 | | | | 990 | | | | 828,796 | |
Sub. Notes | | | 6.174(ff) | | | | 05/25/34 | | | | 70 | | | | 69,843 | |
Deutsche Bank AG (Germany), | | | | | | | | | | | | | | | | |
Sr. Unsec’d. Notes | | | 2.311(ff) | | | | 11/16/27 | | | | 310 | | | | 271,642 | |
Fifth Third Bancorp, | | | | | | | | | | | | | | | | |
Sr. Unsec’d. Notes | | | 6.339(ff) | | | | 07/27/29 | | | | 85 | | | | 86,000 | |
Goldman Sachs Group, Inc. (The), | | | | | | | | | | | | | | | | |
Jr. Sub. Notes, Series V | | | 4.125(ff) | | | | 11/10/26(oo) | | | | 55 | | | | 46,281 | |
Sr. Unsec’d. Notes | | | 4.223(ff) | | | | 05/01/29 | | | | 735 | | | | 691,834 | |
Huntington Bancshares, Inc., | | | | | | | | | | | | | | | | |
Sr. Unsec’d. Notes | | | 6.208(ff) | | | | 08/21/29 | | | | 40 | | | | 40,261 | |
JPMorgan Chase & Co., | | | | | | | | | | | | | | | | |
Jr. Sub. Notes, Series HH | | | 4.600(ff) | | | | 02/01/25(oo) | | | | 125 | | | | 117,404 | |
Sr. Unsec’d. Notes | | | 1.953(ff) | | | | 02/04/32 | | | | 500 | | | | 394,003 | |
Sr. Unsec’d. Notes | | | 2.739(ff) | | | | 10/15/30 | | | | 1,210 | | | | 1,037,017 | |
Morgan Stanley, | | | | | | | | | | | | | | | | |
Sr. Unsec’d. Notes | | | 5.449(ff) | | | | 07/20/29 | | | | 95 | | | | 94,433 | |
Sr. Unsec’d. Notes | | | 6.342(ff) | | | | 10/18/33 | | | | 25 | | | | 26,192 | |
Sr. Unsec’d. Notes, GMTN | | | 2.699(ff) | | | | 01/22/31 | | | | 520 | | | | 437,939 | |
Sr. Unsec’d. Notes, MTN | | | 2.943(ff) | | | | 01/21/33 | | | | 450 | | | | 369,022 | |
See Notes to Financial Statements.
PGIM Fixed Income ETFs 171
PGIM Total Return Bond ETF
Schedule of Investments (continued)
as of August 31, 2023
| | | | | | | | | | | | | | | | |
| | | | |
| Description | | Interest
Rate | | | Maturity
Date | | | Principal
Amount
(000)# | | | Value | |
| | | | |
CORPORATE BONDS (Continued) | | | | | | | | | | | | | | | | |
| | | | |
Banks (cont’d.) | | | | | | | | | | | | | | | | |
| | | | |
Morgan Stanley, (cont’d.) | | | | | | | | | | | | | | | | |
Sub. Notes, GMTN | | | 4.350% | | | | 09/08/26 | | | | 195 | | | $ | 187,779 | |
Societe Generale SA (France), | | | | | | | | | | | | | | | | |
Sr. Unsec’d. Notes, 144A | | | 2.797(ff) | | | | 01/19/28 | | | | 195 | | | | 174,763 | |
Toronto-Dominion Bank (The) (Canada), | | | | | | | | | | | | | | | | |
Sr. Unsec’d. Notes, MTN | | | 5.532 | | | | 07/17/26 | | | | 590 | | | | 590,802 | |
Truist Financial Corp., | | | | | | | | | | | | | | | | |
Sr. Unsec’d. Notes, MTN | | | 5.867(ff) | | | | 06/08/34 | | | | 45 | | | | 44,621 | |
U.S. Bancorp, | | | | | | | | | | | | | | | | |
Sr. Unsec’d. Notes | | | 5.836(ff) | | | | 06/12/34 | | | | 45 | | | | 44,889 | |
UBS Group AG (Switzerland), | | | | | | | | | | | | | | | | |
Sr. Unsec’d. Notes, 144A | | | 6.537(ff) | | | | 08/12/33 | | | | 270 | | | | 279,560 | |
Sr. Unsec’d. Notes, 144A, SOFR + 1.580% | | | 6.915(c) | | | | 05/12/26 | | | | 200 | | | | 201,619 | |
Wells Fargo & Co., | | | | | | | | | | | | | | | | |
Sr. Unsec’d. Notes | | | 5.389(ff) | | | | 04/24/34 | | | | 125 | | | | 121,774 | |
Sr. Unsec’d. Notes, MTN | | | 2.879(ff) | | | | 10/30/30 | | | | 260 | | | | 222,435 | |
Sr. Unsec’d. Notes, MTN | | | 4.808(ff) | | | | 07/25/28 | | | | 295 | | | | 286,222 | |
Sr. Unsec’d. Notes, MTN | | | 5.574(ff) | | | | 07/25/29 | | | | 160 | | | | 159,286 | |
| | | | | | | | | | | | | | | | |
| | | | |
| | | | | | | | | | | | | | | 9,221,284 | |
| | | | |
Beverages 0.0% | | | | | | | | | | | | | | | | |
| | | | |
Anheuser-Busch Cos. LLC/Anheuser-Busch InBev | | | | | | | | | | | | | | | | |
Worldwide, Inc. (Belgium), | | | | | | | | | | | | | | | | |
Gtd. Notes | | | 4.900 | | | | 02/01/46 | | | | 40 | | | | 37,218 | |
| | | | |
Biotechnology 0.3% | | | | | | | | | | | | | | | | |
| | | | |
Amgen, Inc., | | | | | | | | | | | | | | | | |
Sr. Unsec’d. Notes | | | 5.600 | | | | 03/02/43 | | | | 290 | | | | 284,648 | |
| | | | |
Building Materials 0.5% | | | | | | | | | | | | | | | | |
| | | | |
Fortune Brands Innovations, Inc., | | | | | | | | | | | | | | | | |
Sr. Unsec’d. Notes | | | 3.250 | | | | 09/15/29 | | | | 175 | | | | 154,149 | |
Griffon Corp., | | | | | | | | | | | | | | | | |
Gtd. Notes | | | 5.750 | | | | 03/01/28 | | | | 23 | | | | 21,448 | |
JELD-WEN, Inc., | | | | | | | | | | | | | | | | |
Gtd. Notes, 144A | | | 4.625 | | | | 12/15/25 | | | | 25 | | | | 24,217 | |
Masco Corp., | | | | | | | | | | | | | | | | |
Sr. Unsec’d. Notes | | | 3.500 | | | | 11/15/27 | | | | 230 | | | | 213,806 | |
See Notes to Financial Statements.
172
PGIM Total Return Bond ETF
Schedule of Investments (continued)
as of August 31, 2023
| | | | | | | | | | | | | | | | |
| | | | |
| Description | | Interest
Rate | | | Maturity
Date | | | Principal
Amount
(000)# | | | Value | |
| | | | |
CORPORATE BONDS (Continued) | | | | | | | | | | | | | | | | |
| | | | |
Building Materials (cont’d.) | | | | | | | | | | | | | | | | |
| | | | |
Smyrna Ready Mix Concrete LLC, | | | | | | | | | | | | | | | | |
Sr. Sec’d. Notes, 144A | | | 6.000 | % | | | 11/01/28 | | | | 75 | | | $ | 72,003 | |
Standard Industries, Inc., | | | | | | | | | | | | | | | | |
Sr. Unsec’d. Notes, 144A | | | 4.375 | | | | 07/15/30 | | | | 75 | | | | 64,283 | |
| | | | | | | | | | | | | | | | |
| | | | |
| | | | | | | | | | | | | | | 549,906 | |
| | | | |
Chemicals 0.6% | | | | | | | | | | | | | | | | |
| | | | |
CF Industries, Inc., | | | | | | | | | | | | | | | | |
Gtd. Notes | | | 5.150 | | | | 03/15/34 | | | | 130 | | | | 122,721 | |
Chemours Co. (The), | | | | | | | | | | | | | | | | |
Gtd. Notes | | | 5.375 | | | | 05/15/27 | | | | 50 | | | | 47,076 | |
FMC Corp., | | | | | | | | | | | | | | | | |
Sr. Unsec’d. Notes | | | 5.150 | | | | 05/18/26 | | | | 140 | | | | 138,727 | |
Nutrien Ltd. (Canada), | | | | | | | | | | | | | | | | |
Sr. Unsec’d. Notes | | | 4.900 | | | | 03/27/28 | | | | 55 | | | | 53,754 | |
Rain Carbon, Inc., | | | | | | | | | | | | | | | | |
Sr. Sec’d. Notes, 144A | | | 12.250 | | | | 09/01/29 | | | | 50 | | | | 51,501 | |
RPM International, Inc., | | | | | | | | | | | | | | | | |
Sr. Unsec’d. Notes | | | 2.950 | | | | 01/15/32 | | | | 20 | | | | 16,041 | |
Sasol Financing USA LLC (South Africa), | | | | | | | | | | | | | | | | |
Gtd. Notes | | | 5.875 | | | | 03/27/24 | | | | 200 | | | | 197,288 | |
| | | | | | | | | | | | | | | | |
| | | | |
| | | | | | | | | | | | | | | 627,108 | |
| | | | |
Commercial Services 1.3% | | | | | | | | | | | | | | | | |
| | | | |
Allied Universal Holdco LLC/Allied Universal Finance Corp., | | | | | | | | | | | | | | | | |
Sr. Sec’d. Notes, 144A | | | 6.625 | | | | 07/15/26 | | | | 125 | | | | 118,995 | |
ERAC USA Finance LLC, | | | | | | | | | | | | | | | | |
Gtd. Notes, 144A | | | 3.300 | | | | 12/01/26 | | | | 160 | | | | 149,250 | |
Gtd. Notes, 144A | | | 4.900 | | | | 05/01/33 | | | | 355 | | | | 346,478 | |
Herc Holdings, Inc., | | | | | | | | | | | | | | | | |
Gtd. Notes, 144A | | | 5.500 | | | | 07/15/27 | | | | 75 | | | | 72,079 | |
Metis Merger Sub LLC, | | | | | | | | | | | | | | | | |
Sr. Unsec’d. Notes, 144A | | | 6.500 | | | | 05/15/29 | | | | 75 | | | | 64,999 | |
Nexi SpA (Italy), | | | | | | | | | | | | | | | | |
Sr. Unsec’d. Notes | | | 2.125 | | | | 04/30/29 | | | | EUR 252 | | | | 232,155 | |
RELX Capital, Inc. (United Kingdom), | | | | | | | | | | | | | | | | |
Gtd. Notes | | | 4.750 | | | | 05/20/32 | | | | 30 | | | | 28,792 | |
See Notes to Financial Statements.
PGIM Fixed Income ETFs 173
PGIM Total Return Bond ETF
Schedule of Investments (continued)
as of August 31, 2023
| | | | | | | | | | | | | | | | |
| | | | |
| Description | | Interest
Rate | | | Maturity
Date | | | Principal
Amount
(000)# | | | Value | |
| | | | |
CORPORATE BONDS (Continued) | | | | | | | | | | | | | | | | |
| | | | |
Commercial Services (cont’d.) | | | | | | | | | | | | | | | | |
| | | | |
Thomas Jefferson University, | | | | | | | | | | | | | | | | |
Sec’d. Notes | | | 3.847% | | | | 11/01/57 | | | | 25 | | | $ | 17,566 | |
United Rentals North America, Inc., | | | | | | | | | | | | | | | | |
Gtd. Notes | | | 3.750 | | | | 01/15/32 | | | | 50 | | | | 41,954 | |
University of Southern California, | | | | | | | | | | | | | | | | |
Sr. Unsec’d. Notes | | | 4.976 | | | | 10/01/53 | | | | 212 | | | | 207,655 | |
Washington University (The), | | | | | | | | | | | | | | | | |
Sr. Unsec’d. Notes | | | 4.349 | | | | 04/15/2122 | | | | 80 | | | | 64,756 | |
| | | | | | | | | | | | | | | | |
| | | | |
| | | | | | | | | | | | | | | 1,344,679 | |
| | | | |
Computers 0.7% | | | | | | | | | | | | | | | | |
| | | | |
Booz Allen Hamilton, Inc., | | | | | | | | | | | | | | | | |
Gtd. Notes | | | 5.950 | | | | 08/04/33 | | | | 200 | | | | 202,219 | |
Leidos, Inc., | | | | | | | | | | | | | | | | |
Gtd. Notes | | | 4.375 | | | | 05/15/30 | | | | 500 | | | | 461,224 | |
NCR Corp., | | | | | | | | | | | | | | | | |
Gtd. Notes, 144A | | | 6.125 | | | | 09/01/29 | | | | 50 | | | | 51,319 | |
| | | | | | | | | | | | | | | | |
| | | | |
| | | | | | | | | | | | | | | 714,762 | |
| | | | |
Distribution/Wholesale 0.1% | | | | | | | | | | | | | | | | |
| | | | |
H&E Equipment Services, Inc., | | | | | | | | | | | | | | | | |
Gtd. Notes, 144A | | | 3.875 | | | | 12/15/28 | | | | 100 | | | | 87,334 | |
| | | | |
Diversified Financial Services 0.5% | | | | | | | | | | | | | | | | |
| | | | |
Cantor Fitzgerald LP, | | | | | | | | | | | | | | | | |
Sr. Unsec’d. Notes, 144A | | | 4.875 | | | | 05/01/24 | | | | 165 | | | | 162,310 | |
Jefferies Financial Group, Inc., | | | | | | | | | | | | | | | | |
Sr. Unsec’d. Notes | | | 2.625 | | | | 10/15/31 | | | | 120 | | | | 93,587 | |
LFS Topco LLC, | | | | | | | | | | | | | | | | |
Gtd. Notes, 144A | | | 5.875 | | | | 10/15/26 | | | | 25 | | | | 21,693 | |
OneMain Finance Corp., | | | | | | | | | | | | | | | | |
Gtd. Notes | | | 6.875 | | | | 03/15/25 | | | | 25 | | | | 24,875 | |
Power Finance Corp. Ltd. (India), | | | | | | | | | | | | | | | | |
Sr. Unsec’d. Notes, 144A, MTN | | | 6.150 | | | | 12/06/28 | | | | 200 | | | | 202,116 | |
| | | | | | | | | | | | | | | | |
| | | | |
| | | | | | | | | | | | | | | 504,581 | |
See Notes to Financial Statements.
174
PGIM Total Return Bond ETF
Schedule of Investments (continued)
as of August 31, 2023
| | | | | | | | | | | | | | | | |
| | | | |
| Description | | Interest
Rate | | | Maturity
Date | | | Principal
Amount
(000)# | | | Value | |
| | | | |
CORPORATE BONDS (Continued) | | | | | | | | | | | | | | | | |
| | | | |
Electric 1.2% | | | | | | | | | | | | | | | | |
| | | | |
AEP Texas, Inc., | | | | | | | | | | | | | | | | |
Sr. Unsec’d. Notes | | | 5.400% | | | | 06/01/33 | | | | 225 | | | $ | 222,537 | |
Calpine Corp., | | | | | | | | | | | | | | | | |
Sr. Sec’d. Notes, 144A | | | 3.750 | | | | 03/01/31 | | | | 75 | | | | 62,495 | |
Sr. Unsec’d. Notes, 144A | | | 5.000 | | | | 02/01/31 | | | | 50 | | | | 42,325 | |
Comision Federal de Electricidad (Mexico), | | | | | | | | | | | | | | | | |
Gtd. Notes, 144A | | | 4.688 | | | | 05/15/29 | | | | 200 | | | | 181,362 | |
Edison International, | | | | | | | | | | | | | | | | |
Sr. Unsec’d. Notes | | | 5.250 | | | | 11/15/28 | | | | 130 | | | | 127,059 | |
NRG Energy, Inc., | | | | | | | | | | | | | | | | |
Gtd. Notes, 144A | | | 3.375 | | | | 02/15/29 | | | | 50 | | | | 41,214 | |
Gtd. Notes, 144A | | | 3.875 | | | | 02/15/32 | | | | 50 | | | | 38,677 | |
Pacific Gas & Electric Co., | | | | | | | | | | | | | | | | |
First Mortgage | | | 4.500 | | | | 07/01/40 | | | | 110 | | | | 84,861 | |
First Mortgage | | | 4.950 | | | | 07/01/50 | | | | 15 | | | | 11,608 | |
Puget Energy, Inc., | | | | | | | | | | | | | | | | |
Sr. Sec’d. Notes | | | 4.224 | | | | 03/15/32 | | | | 145 | | | | 127,858 | |
Sempra, | | | | | | | | | | | | | | | | |
Jr. Sub. Notes | | | 4.125(ff) | | | | 04/01/52 | | | | 120 | | | | 97,155 | |
Southern California Edison Co., | | | | | | | | | | | | | | | | |
First Mortgage | | | 3.450 | | | | 02/01/52 | | | | 30 | | | | 20,498 | |
First Mortgage | | | 5.300 | | | | 03/01/28 | | | | 110 | | | | 110,475 | |
Southern Co. (The), | | | | | | | | | | | | | | | | |
Jr. Sub. Notes | | | 5.113 | | | | 08/01/27 | | | | 40 | | | | 39,735 | |
Vistra Corp., | | | | | | | | | | | | | | | | |
Jr. Sub. Notes, 144A | | | 7.000(ff) | | | | 12/15/26(oo) | | | | 25 | | | | 23,251 | |
Vistra Operations Co. LLC, | | | | | | | | | | | | | | | | |
Gtd. Notes, 144A | | | 4.375 | | | | 05/01/29 | | | | 50 | | | | 44,069 | |
| | | | | | | | | | | | | | | | |
| | | | |
| | | | | | | | | | | | | | | 1,275,179 | |
| | | | |
Electronics 0.0% | | | | | | | | | | | | | | | | |
| | | | |
Likewize Corp., | | | | | | | | | | | | | | | | |
Sr. Sec’d. Notes, 144A (original cost $50,125; purchased 04/12/22)(f) | | | 9.750 | | | | 10/15/25 | | | | 50 | | | | 48,826 | |
See Notes to Financial Statements.
PGIM Fixed Income ETFs 175
PGIM Total Return Bond ETF
Schedule of Investments (continued)
as of August 31, 2023
| | | | | | | | | | | | |
| | | | |
| Description | | Interest Rate | | Maturity Date | | Principal Amount (000)# | | | Value | |
| | | | |
CORPORATE BONDS (Continued) | | | | | | | | | | | | |
| | | | |
Engineering & Construction 0.4% | | | | | | | | | | | | |
| | | | |
Jacobs Engineering Group, Inc., | | | | | | | | | | | | |
Gtd. Notes | | 6.350% | | 08/18/28 | | | 265 | | | $ | 269,531 | |
Mexico City Airport Trust (Mexico), | | | | | | | | | | | | |
Sr. Sec’d. Notes, 144A | | 4.250 | | 10/31/26 | | | 200 | | | | 190,165 | |
| | | | | | | | | | | | |
| | | | |
| | | | | | | | | | | 459,696 | |
| | | | |
Entertainment 0.4% | | | | | | | | | | | | |
| | | | |
Caesars Entertainment, Inc., | | | | | | | | | | | | |
Sr. Sec’d. Notes, 144A | | 7.000 | | 02/15/30 | | | 75 | | | | 75,307 | |
CCM Merger, Inc., | | | | | | | | | | | | |
Sr. Unsec’d. Notes, 144A | | 6.375 | | 05/01/26 | | | 50 | | | | 48,515 | |
Golden Entertainment, Inc., | | | | | | | | | | | | |
Sr. Unsec’d. Notes, 144A | | 7.625 | | 04/15/26 | | | 50 | | | | 49,884 | |
Penn Entertainment, Inc., | | | | | | | | | | | | |
Sr. Unsec’d. Notes, 144A | | 4.125 | | 07/01/29 | | | 50 | | | | 40,906 | |
Warnermedia Holdings, Inc., | | | | | | | | | | | | |
Gtd. Notes | | 5.050 | | 03/15/42 | | | 95 | | | | 78,141 | |
Gtd. Notes | | 5.141 | | 03/15/52 | | | 155 | | | | 123,484 | |
| | | | | | | | | | | | |
| | | | |
| | | | | | | | | | | 416,237 | |
| | | | |
Foods 0.6% | | | | | | | | | | | | |
| | | | |
B&G Foods, Inc., | | | | | | | | | | | | |
Gtd. Notes | | 5.250 | | 04/01/25 | | | 50 | | | | 48,827 | |
Bellis Finco PLC (United Kingdom), | | | | | | | | | | | | |
Gtd. Notes | | 4.000 | | 02/16/27 | | GBP | 218 | | | | 212,776 | |
Chobani LLC/Chobani Finance Corp., Inc., | | | | | | | | | | | | |
Gtd. Notes, 144A | | 7.500 | | 04/15/25 | | | 25 | | | | 24,978 | |
JBS USA LUX SA/JBS USA Food Co./JBS USA Finance, Inc., | | | | | | | | | | | | |
Gtd. Notes | | 5.125 | | 02/01/28 | | | 45 | | | | 43,732 | |
Lamb Weston Holdings, Inc., | | | | | | | | | | | | |
Gtd. Notes, 144A | | 4.125 | | 01/31/30 | | | 25 | | | | 22,004 | |
Gtd. Notes, 144A | | 4.375 | | 01/31/32 | | | 25 | | | | 21,704 | |
Market Bidco Finco PLC (United Kingdom), | | | | | | | | | | | | |
Sr. Sec’d. Notes, 144A | | 5.500 | | 11/04/27 | | GBP | 100 | | | | 98,988 | |
See Notes to Financial Statements.
176
PGIM Total Return Bond ETF
Schedule of Investments (continued)
as of August 31, 2023
| | | | | | | | | | | | |
| | | | |
| Description | | Interest Rate | | Maturity Date | | Principal
Amount
(000)# | | | Value��� | |
| | | | |
CORPORATE BONDS (Continued) | | | | | | | | | | | | |
| | | | |
Foods (cont’d.) | | | | | | | | | | | | |
| | | | |
Pilgrim’s Pride Corp., | | | | | | | | | | | | |
Gtd. Notes | | 3.500% | | 03/01/32 | | | 50 | | | $ | 40,226 | |
Post Holdings, Inc., | | | | | | | | | | | | |
Sr. Unsec’d. Notes, 144A | | 4.500 | | 09/15/31 | | | 75 | | | | 64,638 | |
| | | | | | | | | | | | |
| | | | |
| | | | | | | | | | | 577,873 | |
| | | | |
Gas 0.1% | | | | | | | | | | | | |
| | | | |
NiSource, Inc., | | | | | | | | | | | | |
Sr. Unsec’d. Notes | | 5.250 | | 03/30/28 | | | 40 | | | | 39,850 | |
Piedmont Natural Gas Co., Inc., | | | | | | | | | | | | |
Sr. Unsec’d. Notes | | 5.050 | | 05/15/52 | | | 75 | | | | 66,091 | |
| | | | | | | | | | | | |
| | | | |
| | | | | | | | | | | 105,941 | |
| | | | |
Healthcare-Products 0.2% | | | | | | | | | | | | |
| | | | |
Avantor Funding, Inc., | | | | | | | | | | | | |
Gtd. Notes | | 3.875 | | 07/15/28 | | EUR | 192 | | | | 191,642 | |
Medline Borrower LP, | | | | | | | | | | | | |
Sr. Sec’d. Notes, 144A | | 3.875 | | 04/01/29 | | | 25 | | | | 21,775 | |
Sr. Unsec’d. Notes, 144A | | 5.250 | | 10/01/29 | | | 25 | | | | 22,200 | |
| | | | | | | | | | | | |
| | | | |
| | | | | | | | | | | 235,617 | |
| | | | |
Healthcare-Services 1.4% | | | | | | | | | | | | |
| | | | |
DaVita, Inc., | | | | | | | | | | | | |
Gtd. Notes, 144A | | 4.625 | | 06/01/30 | | | 150 | | | | 128,671 | |
Inova Health System Foundation, | | | | | | | | | | | | |
Unsec’d. Notes | | 4.068 | | 05/15/52 | | | 250 | | | | 208,452 | |
Legacy LifePoint Health LLC, | | | | | | | | | | | | |
Sr. Sec’d. Notes, 144A | | 4.375 | | 02/15/27 | | | 75 | | | | 64,893 | |
Nationwide Children’s Hospital, Inc., | | | | | | | | | | | | |
Unsec’d. Notes | | 4.556 | | 11/01/52 | | | 220 | | | | 199,197 | |
Presbyterian Healthcare Services, | | | | | | | | | | | | |
Unsec’d. Notes | | 4.875 | | 08/01/52 | | | 150 | | | | 141,828 | |
Queen’s Health Systems (The), | | | | | | | | | | | | |
Sec’d. Notes | | 4.810 | | 07/01/52 | | | 90 | | | | 82,486 | |
Tenet Healthcare Corp., | | | | | | | | | | | | |
Gtd. Notes | | 6.125 | | 10/01/28 | | | 25 | | | | 24,079 | |
Sr. Sec’d. Notes, 144A | | 6.750 | | 05/15/31 | | | 125 | | | | 124,617 | |
See Notes to Financial Statements.
PGIM Fixed Income ETFs 177
PGIM Total Return Bond ETF
Schedule of Investments (continued)
as of August 31, 2023
| | | | | | | | | | | | |
| | | | |
| Description | | Interest Rate | | Maturity Date | | Principal
Amount
(000)# | | | Value | |
| | | | |
CORPORATE BONDS (Continued) | | | | | | | | | | | | |
| | | | |
Healthcare-Services (cont’d.) | | | | | | | | | | | | |
| | | | |
UnitedHealth Group, Inc., | | | | | | | | | | | | |
Sr. Unsec’d. Notes | | 5.200% | | 04/15/63 | | | 455 | | | $ | 435,340 | |
| | | | | | | | | | | | |
| | | | |
| | | | | | | | | | | 1,409,563 | |
| | | | |
Home Builders 0.4% | | | | | | | | | | | | |
| | | | |
Ashton Woods USA LLC/Ashton Woods Finance Co., | | | | | | | | | | | | |
Sr. Unsec’d. Notes, 144A | | 4.625 | | 08/01/29 | | | 50 | | | | 43,329 | |
Beazer Homes USA, Inc., | | | | | | | | | | | | |
Gtd. Notes | | 7.250 | | 10/15/29 | | | 75 | | | | 72,717 | |
Brookfield Residential Properties, Inc./Brookfield
Residential US LLC (Canada), | | | | | | | | | | | | |
Gtd. Notes, 144A | | 4.875 | | 02/15/30 | | | 75 | | | | 62,062 | |
Century Communities, Inc., | | | | | | | | | | | | |
Gtd. Notes | | 6.750 | | 06/01/27 | | | 50 | | | | 49,863 | |
Empire Communities Corp. (Canada), | | | | | | | | | | | | |
Sr. Unsec’d. Notes, 144A | | 7.000 | | 12/15/25 | | | 50 | | | | 48,313 | |
Forestar Group, Inc., | | | | | | | | | | | | |
Gtd. Notes, 144A | | 3.850 | | 05/15/26 | | | 50 | | | | 46,630 | |
Shea Homes LP/Shea Homes Funding Corp., | | | | | | | | | | | | |
Sr. Unsec’d. Notes | | 4.750 | | 04/01/29 | | | 50 | | | | 44,513 | |
| | | | | | | | | | | | |
| | | | |
| | | | | | | | | | | 367,427 | |
| | | | |
Housewares 0.0% | | | | | | | | | | | | |
| | | | |
Scotts Miracle-Gro Co. (The), | | | | | | | | | | | | |
Gtd. Notes | | 4.000 | | 04/01/31 | | | 50 | | | | 39,321 | |
| | | | |
Insurance 0.5% | | | | | | | | | | | | |
| | | | |
Corebridge Financial, Inc., | | | | | | | | | | | | |
Sr. Unsec’d. Notes | | 4.400 | | 04/05/52 | | | 100 | | | | 77,243 | |
Fairfax Financial Holdings Ltd. (Canada), | | | | | | | | | | | | |
Sr. Unsec’d. Notes | | 3.375 | | 03/03/31 | | | 115 | | | | 96,047 | |
Sr. Unsec’d. Notes | | 5.625 | | 08/16/32 | | | 135 | | | | 129,979 | |
Liberty Mutual Group, Inc., | | | | | | | | | | | | |
Gtd. Notes, 144A | | 4.569 | | 02/01/29 | | | 165 | | | | 159,189 | |
| | | | | | | | | | | | |
| | | | |
| | | | | | | | | | | 462,458 | |
See Notes to Financial Statements.
178
PGIM Total Return Bond ETF
Schedule of Investments (continued)
as of August 31, 2023
| | | | | | | | | | | | | | |
| | | | |
| Description | | Interest Rate | | | Maturity Date | | Principal
Amount
(000)# | | | Value | |
| | | | |
CORPORATE BONDS (Continued) | | | | | | | | | | | | | | |
| | | | |
Internet 0.1% | | | | | | | | | | | | | | |
| | | | |
Gen Digital, Inc., | | | | | | | | | | | | | | |
Sr. Unsec’d. Notes, 144A | | | 5.000 | % | | 04/15/25 | | | 125 | | | $ | 122,587 | |
| | | | |
Iron/Steel 0.1% | | | | | | | | | | | | | | |
| | | | |
Steel Dynamics, Inc., | | | | | | | | | | | | | | |
Sr. Unsec’d. Notes | | | 3.450 | | | 04/15/30 | | | 120 | | | | 106,503 | |
| | | | |
Leisure Time 0.2% | | | | | | | | | | | | | | |
| | | | |
Carnival Corp., | | | | | | | | | | | | | | |
Gtd. Notes, 144A | | | 5.750 | | | 03/01/27 | | | 50 | | | | 47,063 | |
NCL Corp. Ltd., | | | | | | | | | | | | | | |
Gtd. Notes, 144A | | | 5.875 | | | 03/15/26 | | | 50 | | | | 47,001 | |
Royal Caribbean Cruises Ltd., | | | | | | | | | | | | | | |
Gtd. Notes, 144A | | | 7.250 | | | 01/15/30 | | | 25 | | | | 25,305 | |
Viking Cruises Ltd., | | | | | | | | | | | | | | |
Gtd. Notes, 144A | | | 5.875 | | | 09/15/27 | | | 50 | | | | 46,500 | |
| | | | | | | | | | | | | | |
| | | | |
| | | | | | | | | | | | | 165,869 | |
| | | | |
Lodging 0.1% | | | | | | | | | | | | | | |
| | | | |
Marriott International, Inc., | | | | | | | | | | | | | | |
Sr. Unsec’d. Notes | | | 4.900 | | | 04/15/29 | | | 30 | | | | 29,192 | |
MGM Resorts International, | | | | | | | | | | | | | | |
Gtd. Notes | | | 4.750 | | | 10/15/28 | | | 75 | | | | 68,065 | |
| | | | | | | | | | | | | | |
| | | | |
| | | | | | | | | | | | | 97,257 | |
| | | | |
Machinery-Diversified 0.3% | | | | | | | | | | | | | | |
| | | | |
Chart Industries, Inc., | | | | | | | | | | | | | | |
Sr. Sec’d. Notes, 144A | | | 7.500 | | | 01/01/30 | | | 50 | | | | 51,275 | |
Ingersoll Rand, Inc., | | | | | | | | | | | | | | |
Sr. Unsec’d. Notes | | | 5.700 | | | 08/14/33 | | | 120 | | | | 121,642 | |
Maxim Crane Works Holdings Capital LLC, | | | | | | | | | | | | | | |
Sec’d. Notes, 144A | | | 11.500 | | | 09/01/28 | | | 25 | | | | 25,073 | |
Westinghouse Air Brake Technologies Corp., | | | | | | | | | | | | | | |
Gtd. Notes | | | 4.950 | (cc) | | 09/15/28 | | | 140 | | | | 135,017 | |
| | | | | | | | | | | | | | |
| | | | |
| | | | | | | | | | | | | 333,007 | |
See Notes to Financial Statements.
PGIM Fixed Income ETFs 179
PGIM Total Return Bond ETF
Schedule of Investments (continued)
as of August 31, 2023
| | | | | | | | | | | | | | |
| | | | |
| Description | | Interest Rate | | | Maturity Date | | Principal
Amount
(000)# | | | Value | |
| | | | |
CORPORATE BONDS (Continued) | | | | | | | | | | | | | | |
| | | | |
Media 1.2% | | | | | | | | | | | | | | |
| | | | |
AMC Networks, Inc., | | | | | | | | | | | | | | |
Gtd. Notes | | | 5.000 | % | | 04/01/24 | | | 50 | | | $ | 49,502 | |
CCO Holdings LLC/CCO Holdings Capital Corp., | | | | | | | | | | | | | | |
Sr. Unsec’d. Notes | | | 4.500 | | | 05/01/32 | | | 50 | | | | 40,529 | |
Sr. Unsec’d. Notes, 144A | | | 4.250 | | | 01/15/34 | | | 25 | | | | 19,144 | |
Sr. Unsec’d. Notes, 144A | | | 4.500 | | | 06/01/33 | | | 100 | | | | 79,020 | |
Charter Communications Operating LLC/Charter
Communications Operating Capital, | | | | | | | | | | | | | | |
Sr. Sec’d. Notes | | | 3.900 | | | 06/01/52 | | | 400 | | | | 255,328 | |
Cox Communications, Inc., | | | | | | | | | | | | | | |
Gtd. Notes, 144A | | | 5.450 | | | 09/15/28 | | | 140 | | | | 139,339 | |
CSC Holdings LLC, | | | | | | | | | | | | | | |
Gtd. Notes, 144A | | | 6.500 | | | 02/01/29 | | | 400 | | | | 330,716 | |
Diamond Sports Group LLC/Diamond Sports Finance Co., | | | | | | | | | | | | | | |
Sec’d. Notes, 144A (original cost $39,000; purchased 08/30/2022)(f) | | | 5.375 | | | 08/15/26(d) | | | 200 | | | | 5,834 | |
DISH DBS Corp., | | | | | | | | | | | | | | |
Gtd. Notes | | | 5.125 | | | 06/01/29 | | | 50 | | | | 27,005 | |
DISH Network Corp., | | | | | | | | | | | | | | |
Sr. Sec’d. Notes, 144A | | | 11.750 | | | 11/15/27 | | | 75 | | | | 76,152 | |
Gray Television, Inc., | | | | | | | | | | | | | | |
Gtd. Notes, 144A | | | 5.875 | | | 07/15/26 | | | 25 | | | | 22,799 | |
Virgin Media Secured Finance PLC (United Kingdom), | | | | | | | | | | | | | | |
Sr. Sec’d. Notes | | | 4.250 | | | 01/15/30 | | GBP | 206 | | | | 206,961 | |
| | | | | | | | | | | | | | |
| | | | |
| | | | | | | | | | | | | 1,252,329 | |
| | | | |
Mining 0.8% | | | | | | | | | | | | | | |
| | | | |
Freeport-McMoRan, Inc., | | | | | | | | | | | | | | |
Gtd. Notes | | | 5.400 | | | 11/14/34 | | | 135 | | | | 127,847 | |
Hecla Mining Co., | | | | | | | | | | | | | | |
Gtd. Notes | | | 7.250 | | | 02/15/28 | | | 25 | | | | 24,510 | |
Indonesia Asahan Aluminium PT/Mineral Industri
Indonesia Persero PT (Indonesia), | | | | | | | | | | | | | | |
Sr. Unsec’d. Notes | | | 4.750 | | | 05/15/25 | | | 200 | | | | 196,168 | |
Kinross Gold Corp. (Canada), | | | | | | | | | | | | | | |
Gtd. Notes | | | 4.500 | | | 07/15/27 | | | 150 | | | | 144,548 | |
See Notes to Financial Statements.
180
PGIM Total Return Bond ETF
Schedule of Investments (continued)
as of August 31, 2023
| | | | | | | | | | | | |
| | | | |
| Description | | Interest Rate | | Maturity Date | | Principal
Amount
(000)# | | | Value | |
| | | | |
CORPORATE BONDS (Continued) | | | | | | | | | | | | |
| | | | |
Mining (cont’d.) | | | | | | | | | | | | |
| | | | |
Newmont Corp., | | | | | | | | | | | | |
Gtd. Notes | | 2.250% | | 10/01/30 | | | 160 | | | $ | 129,991 | |
Gtd. Notes | | 2.600 | | 07/15/32 | | | 265 | | | | 212,965 | |
| | | | | | | | | | | | |
| | | | |
| | | | | | | | | | | 836,029 | |
| | | | |
Miscellaneous Manufacturing 0.1% | | | | | | | | | | | | |
| | | | |
Teledyne Technologies, Inc., | | | | | | | | | | | | |
Gtd. Notes | | 2.750 | | 04/01/31 | | | 115 | | | | 95,875 | |
| | | | |
Office/Business Equipment 0.1% | | | | | | | | | | | | |
| | | | |
CDW LLC/CDW Finance Corp., | | | | | | | | | | | | |
Gtd. Notes | | 2.670 | | 12/01/26 | | | 140 | | | | 127,280 | |
| | | | |
Oil & Gas 3.0% | | | | | | | | | | | | |
| | | | |
Aker BP ASA (Norway), | | | | | | | | | | | | |
Gtd. Notes, 144A | | 3.100 | | 07/15/31 | | | 200 | | | | 164,780 | |
Sr. Unsec’d. Notes, 144A | | 6.000 | | 06/13/33 | | | 250 | | | | 250,146 | |
BP Capital Markets America, Inc., | | | | | | | | | | | | |
Gtd. Notes | | 4.812 | | 02/13/33 | | | 300 | | | | 290,314 | |
Canadian Natural Resources Ltd. (Canada), | | | | | | | | | | | | |
Sr. Unsec’d. Notes | | 5.850 | | 02/01/35 | | | 250 | | | | 242,844 | |
Cenovus Energy, Inc. (Canada), | | | | | | | | | | | | |
Sr. Unsec’d. Notes | | 3.750 | | 02/15/52 | | | 100 | | | | 69,988 | |
Chesapeake Energy Corp., | | | | | | | | | | | | |
Gtd. Notes, 144A | | 5.875 | | 02/01/29 | | | 50 | | | | 47,916 | |
CITGO Petroleum Corp., | | | | | | | | | | | | |
Sr. Sec’d. Notes, 144A | | 7.000 | | 06/15/25 | | | 75 | | | | 74,288 | |
Civitas Resources, Inc., | | | | | | | | | | | | |
Gtd. Notes, 144A | | 8.375 | | 07/01/28 | | | 25 | | | | 25,748 | |
CNX Resources Corp., | | | | | | | | | | | | |
Gtd. Notes, 144A | | 7.250 | | 03/14/27 | | | 50 | | | | 49,948 | |
ConocoPhillips Co., | | | | | | | | | | | | |
Gtd. Notes | | 5.300 | | 05/15/53 | | | 115 | | | | 112,350 | |
Devon Energy Corp., | | | | | | | | | | | | |
Sr. Unsec’d. Notes | | 5.875 | | 06/15/28 | | | 95 | | | | 95,084 | |
Diamondback Energy, Inc., | | | | | | | | | | | | |
Gtd. Notes | | 6.250 | | 03/15/33 | | | 275 | | | | 284,224 | |
Ecopetrol SA (Colombia), | | | | | | | | | | | | |
Sr. Unsec’d. Notes | | 6.875 | | 04/29/30 | | | 30 | | | | 27,937 | |
See Notes to Financial Statements.
PGIM Fixed Income ETFs 181
PGIM Total Return Bond ETF
Schedule of Investments (continued)
as of August 31, 2023
| | | | | | | | | | | | |
| | | | |
| Description | | Interest Rate | | Maturity Date | | Principal
Amount
(000)# | | | Value | |
| | | | |
CORPORATE BONDS (Continued) | | | | | | | | | | | | |
| | | | |
Oil & Gas (cont’d.) | | | | | | | | | | | | |
| | | | |
Ecopetrol SA (Colombia), (cont’d.) | | | | | | | | | | | | |
Sr. Unsec’d. Notes | | 8.625% | | 01/19/29 | | | 130 | | | $ | 132,275 | |
Sr. Unsec’d. Notes | | 8.875 | | 01/13/33 | | | 100 | | | | 101,102 | |
Endeavor Energy Resources LP/EER Finance, Inc., | | | | | | | | | | | | |
Sr. Unsec’d. Notes, 144A | | 5.750 | | 01/30/28 | | | 75 | | | | 73,388 | |
Energian Israel Finance Ltd. (Israel), | | | | | | | | | | | | |
Sr. Sec’d. Notes, 144A | | 4.500 | | 03/30/24 | | | 30 | | | | 29,669 | |
Sr. Sec’d. Notes, 144A | | 4.875 | | 03/30/26 | | | 90 | | | | 84,221 | |
Sr. Sec’d. Notes, 144A | | 5.375 | | 03/30/28 | | | 51 | | | | 46,348 | |
Helmerich & Payne, Inc., | | | | | | | | | | | | |
Sr. Unsec’d. Notes | | 2.900 | | 09/29/31 | | | 65 | | | | 52,826 | |
Hilcorp Energy I LP/Hilcorp Finance Co., | | | | | | | | | | | | |
Sr. Unsec’d. Notes, 144A | | 6.000 | | 04/15/30 | | | 25 | | | | 23,246 | |
Sr. Unsec’d. Notes, 144A | | 6.250 | | 04/15/32 | | | 75 | | | | 68,947 | |
Petroleos Mexicanos (Mexico), | | | | | | | | | | | | |
Gtd. Notes | | 4.750 | | 02/26/29 | | EUR | 100 | | | | 81,624 | |
Gtd. Notes | | 5.350 | | 02/12/28 | | | 100 | | | | 79,972 | |
Gtd. Notes | | 6.500 | | 03/13/27 | | | 100 | | | | 87,307 | |
Gtd. Notes | | 6.500 | | 01/23/29 | | | 100 | | | | 81,024 | |
Gtd. Notes, EMTN | | 4.875 | | 02/21/28 | | EUR | 130 | | | | 112,193 | |
Pioneer Natural Resources Co., | | | | | | | | | | | | |
Sr. Unsec’d. Notes | | 2.150 | | 01/15/31 | | | 125 | | | | 101,242 | |
Southwestern Energy Co., | | | | | | | | | | | | |
Gtd. Notes | | 4.750 | | 02/01/32 | | | 25 | | | | 22,133 | |
Var Energi ASA (Norway), | | | | | | | | | | | | |
Sr. Unsec’d. Notes, 144A | | 5.000 | | 05/18/27 | | | 200 | | | | 191,722 | |
| | | | | | | | | | | | |
| | | | |
| | | | | | | | | | | 3,104,806 | |
| | | | |
Packaging & Containers 0.5% | | | | | | | | | | | | |
| | | | |
AptarGroup, Inc., | | | | | | | | | | | | |
Sr. Unsec’d. Notes | | 3.600 | | 03/15/32 | | | 140 | | | | 119,216 | |
Ball Corp., | | | | | | | | | | | | |
Gtd. Notes | | 6.000 | | 06/15/29 | | | 50 | | | | 49,300 | |
See Notes to Financial Statements.
182
PGIM Total Return Bond ETF
Schedule of Investments (continued)
as of August 31, 2023
| | | | | | | | | | | | |
| | | | |
| Description | | Interest Rate | | Maturity Date | | Principal
Amount
(000)# | | | Value | |
| | | | |
CORPORATE BONDS (Continued) | | | | | | | | | | | | |
| | | | |
Packaging & Containers (cont’d.) | | | | | | | | | | | | |
| | | | |
Berry Global, Inc., | | | | | | | | | | | | |
Sr. Sec’d. Notes, 144A | | 5.500% | | 04/15/28 | | | 240 | | | $ | 235,772 | |
Pactiv Evergreen Group Issuer LLC/Pactiv Evergreen | | | | | | | | | | | | |
Group Issuer, Inc., | | | | | | | | | | | | |
Sr. Sec’d. Notes, 144A | | 4.375 | | 10/15/28 | | | 100 | | | | 89,229 | |
| | | | | | | | | | | | |
| | | | |
| | | | | | | | | | | 493,517 | |
| | | | |
Pharmaceuticals 1.0% | | | | | | | | | | | | |
| | | | |
AbbVie, Inc., | | | | | | | | | | | | |
Sr. Unsec’d. Notes | | 4.050 | | 11/21/39 | | | 265 | | | | 227,212 | |
Bausch Health Cos., Inc., | | | | | | | | | | | | |
Gtd. Notes, 144A | | 6.250 | | 02/15/29 | | | 50 | | | | 21,875 | |
Cigna Group (The), | | | | | | | | | | | | |
Sr. Unsec’d. Notes | | 3.200 | | 03/15/40 | | | 235 | | | | 174,747 | |
CVS Health Corp., | | | | | | | | | | | | |
Sr. Unsec’d. Notes | | 2.700 | | 08/21/40 | | | 130 | | | | 86,967 | |
Sr. Unsec’d. Notes | | 3.250 | | 08/15/29 | | | 225 | | | | 200,944 | |
Merck & Co., Inc., | | | | | | | | | | | | |
Sr. Unsec’d. Notes | | 2.900 | | 12/10/61 | | | 55 | | | | 34,501 | |
Shire Acquisitions Investments Ireland DAC, | | | | | | | | | | | | |
Gtd. Notes | | 3.200 | | 09/23/26 | | | 225 | | | | 210,945 | |
Viatris, Inc., | | | | | | | | | | | | |
Gtd. Notes | | 3.850 | | 06/22/40 | | | 125 | | | | 87,431 | |
| | | | | | | | | | | | |
| | | | |
| | | | | | | | | | | 1,044,622 | |
| | | | |
Pipelines 3.0% | | | | | | | | | | | | |
| | | | |
Antero Midstream Partners LP/Antero Midstream | | | | | | | | | | | | |
Finance Corp., | | | | | | | | | | | | |
Gtd. Notes, 144A | | 7.875 | | 05/15/26 | | | 75 | | | | 76,270 | |
Columbia Pipelines Operating Co. LLC, | | | | | | | | | | | | |
Sr. Unsec’d. Notes, 144A | | 6.036 | | 11/15/33 | | | 90 | | | | 90,958 | |
DCP Midstream Operating LP, | | | | | | | | | | | | |
Gtd. Notes | | 5.625 | | 07/15/27 | | | 540 | | | | 540,548 | |
Energy Transfer LP, | | | | | | | | | | | | |
Jr. Sub. Notes, Series G | | 7.125(ff) | | 05/15/30(oo) | | | 85 | | | | 75,342 | |
Sr. Unsec’d. Notes | | 5.400 | | 10/01/47 | | | 285 | | | | 245,439 | |
EQM Midstream Partners LP, | | | | | | | | | | | | |
Sr. Unsec’d. Notes, 144A | | 7.500 | | 06/01/27 | | | 25 | | | | 25,225 | |
See Notes to Financial Statements.
PGIM Fixed Income ETFs 183
PGIM Total Return Bond ETF
Schedule of Investments (continued)
as of August 31, 2023
| | | | | | | | | | | | |
| | | | |
| Description | | Interest Rate | | Maturity Date | | Principal
Amount
(000)# | | | Value | |
| | | | |
CORPORATE BONDS (Continued) | | | | | | | | | | | | |
| | | | |
Pipelines (cont’d.) | | | | | | | | | | | | |
| | | | |
EQM Midstream Partners LP, (cont’d.) | | | | | | | | | | | | |
Sr. Unsec’d. Notes, 144A | | 7.500% | | 06/01/30 | | | 25 | | | $ | 25,631 | |
Kinder Morgan, Inc., | | | | | | | | | | | | |
Gtd. Notes | | 5.450 | | 08/01/52 | | | 135 | | | | 120,580 | |
MPLX LP, | | | | | | | | | | | | |
Sr. Unsec’d. Notes | | 1.750 | | 03/01/26 | | | 360 | | | | 327,905 | |
Sr. Unsec’d. Notes | | 4.950 | | 03/14/52 | | | 55 | | | | 45,304 | |
Sr. Unsec’d. Notes | | 5.200 | | 03/01/47 | | | 105 | | | | 90,487 | |
Sr. Unsec’d. Notes | | 5.650 | | 03/01/53 | | | 50 | | | | 45,324 | |
ONEOK, Inc., | | | | | | | | | | | | |
Gtd. Notes | | 4.450 | | 09/01/49 | | | 150 | | | | 112,485 | |
Gtd. Notes | | 5.200 | | 07/15/48 | | | 65 | | | | 55,590 | |
Gtd. Notes | | 6.050 | | 09/01/33 | | | 130 | | | | 131,032 | |
Tallgrass Energy Partners LP/Tallgrass Energy Finance Corp., | | | | | | | | | | | | |
Gtd. Notes, 144A | | 5.500 | | 01/15/28 | | | 75 | | | | 69,647 | |
Targa Resources Corp., | | | | | | | | | | | | |
Gtd. Notes | | 4.200 | | 02/01/33 | | | 40 | | | | 35,252 | |
Gtd. Notes | | 6.500 | | 02/15/53 | | | 150 | | | | 149,988 | |
Western Midstream Operating LP, | | | | | | | | | | | | |
Sr. Unsec’d. Notes | | 4.650 | | 07/01/26 | | | 150 | | | | 145,311 | |
Sr. Unsec’d. Notes | | 6.150 | | 04/01/33 | | | 50 | | | | 49,747 | |
Williams Cos., Inc. (The), | | | | | | | | | | | | |
Sr. Unsec’d. Notes | | 2.600 | | 03/15/31 | | | 465 | | | | 381,443 | |
Sr. Unsec’d. Notes | | 5.300 | | 08/15/52 | | | 145 | | | | 130,673 | |
Sr. Unsec’d. Notes | | 5.400 | | 03/02/26 | | | 95 | | | | 94,858 | |
| | | | | | | | | | | | |
| | | | |
| | | | | | | | | | | 3,065,039 | |
| | | | |
Real Estate 0.0% | | | | | | | | | | | | |
| | | | |
Howard Hughes Corp. (The), | | | | | | | | | | | | |
Gtd. Notes, 144A | | 4.375 | | 02/01/31 | | | 50 | | | | 39,867 | |
| | | | |
Real Estate Investment Trusts (REITs) 2.1% | | | | | | | | | | | | |
| | | | |
Alexandria Real Estate Equities, Inc., | | | | | | | | | | | | |
Gtd. Notes | | 4.750 | | 04/15/35 | | | 30 | | | | 27,727 | |
Brixmor Operating Partnership LP, | | | | | | | | | | | | |
Sr. Unsec’d. Notes | | 4.050 | | 07/01/30 | | | 145 | | | | 131,123 | |
Corporate Office Properties LP, | | | | | | | | | | | | |
Gtd. Notes | | 2.750 | | 04/15/31 | | | 115 | | | | 88,630 | |
See Notes to Financial Statements.
184
PGIM Total Return Bond ETF
Schedule of Investments (continued)
as of August 31, 2023
| | | | | | | | | | | | |
| | | | |
| Description | | Interest Rate | | Maturity Date | | Principal
Amount
(000)# | | | Value | |
| | | | |
CORPORATE BONDS (Continued) | | | | | | | | | | | | |
| | | | |
Real Estate Investment Trusts (REITs) (cont’d.) | | | | | | | | | | | | |
| | | | |
Crown Castle, Inc., | | | | | | | | | | | | |
Sr. Unsec’d. Notes | | 4.800% | | 09/01/28 | | | 255 | | | $ | 247,570 | |
Diversified Healthcare Trust, | | | | | | | | | | | | |
Gtd. Notes | | 4.375 | | 03/01/31 | | | 75 | | | | 56,599 | |
Extra Space Storage LP, | | | | | | | | | | | | |
Gtd. Notes | | 3.900 | | 04/01/29 | | | 135 | | | | 123,578 | |
GLP Capital LP/GLP Financing II, Inc., | | | | | | | | | | | | |
Gtd. Notes | | 3.250 | | 01/15/32 | | | 55 | | | | 44,332 | |
Gtd. Notes | | 5.250 | | 06/01/25 | | | 160 | | | | 157,182 | |
Invitation Homes Operating Partnership LP, | | | | | | | | | | | | |
Gtd. Notes | | 5.450 | | 08/15/30 | | | 280 | | | | 274,235 | |
Kimco Realty OP LLC, | | | | | | | | | | | | |
Gtd. Notes | | 4.600 | | 02/01/33 | | | 90 | | | | 82,608 | |
MPT Operating Partnership LP/MPT Finance Corp., | | | | | | | | | | | | |
Gtd. Notes | | 5.000 | | 10/15/27 | | | 150 | | | | 118,626 | |
Realty Income Corp., | | | | | | | | | | | | |
Sr. Unsec’d. Notes | | 4.700 | | 12/15/28 | | | 270 | | | | 261,963 | |
Spirit Realty LP, | | | | | | | | | | | | |
Gtd. Notes | | 2.700 | | 02/15/32 | | | 135 | | | | 105,607 | |
Sun Communities Operating LP, | | | | | | | | | | | | |
Gtd. Notes | | 2.300 | | 11/01/28 | | | 155 | | | | 130,409 | |
Gtd. Notes | | 4.200 | | 04/15/32 | | | 80 | | | | 70,328 | |
Gtd. Notes | | 5.700 | | 01/15/33 | | | 45 | | | | 43,922 | |
VICI Properties LP, | | | | | | | | | | | | |
Sr. Unsec’d. Notes | | 4.750 | | 02/15/28 | | | 60 | | | | 57,112 | |
Welltower OP LLC, | | | | | | | | | | | | |
Gtd. Notes | | 4.250 | | 04/15/28 | | | 175 | | | | 165,564 | |
| | | | | | | | | | | | |
| | | | |
| | | | | | | | | | | 2,187,115 | |
| | | | |
Retail 0.6% | | | | | | | | | | | | |
| | | | |
1011778 BC ULC/New Red Finance, Inc. (Canada), | | | | | | | | | | | | |
Sr. Sec’d. Notes, 144A | | 3.500 | | 02/15/29 | | | 25 | | | | 21,750 | |
Brinker International, Inc., | | | | | | | | | | | | |
Gtd. Notes, 144A | | 8.250 | | 07/15/30 | | | 75 | | | | 73,687 | |
eG Global Finance PLC (United Kingdom), | | | | | | | | | | | | |
Sr. Sec’d. Notes | | 6.250 | | 10/30/25 | | EUR | 214 | | | | 225,171 | |
Fertitta Entertainment LLC/Fertitta Entertainment Finance Co., Inc., | | | | | | | | | | | | |
Sr. Sec’d. Notes, 144A | | 4.625 | | 01/15/29 | | | 75 | | | | 64,904 | |
See Notes to Financial Statements.
PGIM Fixed Income ETFs 185
PGIM Total Return Bond ETF
Schedule of Investments (continued)
as of August 31, 2023
| | | | | | | | | | | | |
| | | | |
| Description | | Interest Rate | | Maturity Date | | Principal
Amount
(000)# | | | Value | |
| | | | |
CORPORATE BONDS (Continued) | | | | | | | | | | | | |
| | | | |
Retail (cont’d.) | | | | | | | | | | | | |
Gap, Inc. (The), | | | | | | | | | | | | |
Gtd. Notes, 144A | | 3.875% | | 10/01/31 | | | 50 | | | $ | 36,240 | |
O’Reilly Automotive, Inc., | | | | | | | | | | | | |
Sr. Unsec’d. Notes | | 4.200 | | 04/01/30 | | | 35 | | | | 32,819 | |
Sally Holdings LLC/Sally Capital, Inc., | | | | | | | | | | | | |
Gtd. Notes | | 5.625 | | 12/01/25 | | | 75 | | | | 74,466 | |
Suburban Propane Partners LP/Suburban Energy Finance Corp., | | | | | | | | | | | | |
Sr. Unsec’d. Notes, 144A | | 5.000 | | 06/01/31 | | | 50 | | | | 42,995 | |
| | | | | | | | | | | | |
| | | | |
| | | | | | | | | | | 572,032 | |
| | | | |
Semiconductors 0.2% | | | | | | | | | | | | |
Broadcom, Inc., | | | | | | | | | | | | |
Sr. Unsec’d. Notes, 144A | | 3.137 | | 11/15/35 | | | 205 | | | | 156,276 | |
Intel Corp., | | | | | | | | | | | | |
Sr. Unsec’d. Notes | | 5.900 | | 02/10/63 | | | 45 | | | | 45,090 | |
| | | | | | | | | | | | |
| | | | |
| | | | | | | | | | | 201,366 | |
| | | | |
Software 0.4% | | | | | | | | | | | | |
Fiserv, Inc., | | | | | | | | | | | | |
Sr. Unsec’d. Notes | | 5.375 | | 08/21/28 | | | 130 | | | | 130,362 | |
Sr. Unsec’d. Notes | | 5.450 | | 03/02/28 | | | 140 | | | | 140,788 | |
Oracle Corp., | | | | | | | | | | | | |
Sr. Unsec’d. Notes | | 3.600 | | 04/01/50 | | | 180 | | | | 123,922 | |
Sr. Unsec’d. Notes | | 5.550 | | 02/06/53 | | | 50 | | | | 46,468 | |
| | | | | | | | | | | | |
| | | | |
| | | | | | | | | | | 441,540 | |
| | | | |
Telecommunications 1.1% | | | | | | | | | | | | |
AT&T, Inc., | | | | | | | | | | | | |
Sr. Unsec’d. Notes | | 3.550 | | 09/15/55 | | | 275 | | | | 179,455 | |
Sr. Unsec’d. Notes | | 5.400 | | 02/15/34 | | | 260 | | | | 252,456 | |
Level 3 Financing, Inc., | | | | | | | | | | | | |
Sr. Sec’d. Notes, 144A | | 3.400 | | 03/01/27 | | | 50 | | | | 46,123 | |
T-Mobile USA, Inc., | | | | | | | | | | | | |
Gtd. Notes | | 2.550 | | 02/15/31 | | | 450 | | | | 370,668 | |
Gtd. Notes | | 3.750 | | 04/15/27 | | | 45 | | | | 42,615 | |
See Notes to Financial Statements.
186
PGIM Total Return Bond ETF
Schedule of Investments (continued)
as of August 31, 2023
| | | | | | | | | | | | | | | | |
| | | | |
| Description | | Interest Rate | | | Maturity
Date | | | Principal
Amount
(000)# | | | Value | |
| | | | |
CORPORATE BONDS (Continued) | | | | | | | | | | | | | | | | |
| | | | |
Telecommunications (cont’d.) | | | | | | | | | | | | | | | | |
| | | | |
Verizon Communications, Inc., | | | | | | | | | | | | | | | | |
Sr. Unsec’d. Notes | | | 4.016% | | | | 12/03/29 | | | | 235 | | | $ | 218,241 | |
| | | | | | | | | | | | | | | | |
| | | | |
| | | | | | | | | | | | | | | 1,109,558 | |
| | | | |
Transportation 0.1% | | | | | | | | | | | | | | | | |
| | | | |
XPO, Inc., | | | | | | | | | | | | | | | | |
Sr. Sec’d. Notes, 144A | | | 6.250 | | | | 06/01/28 | | | | 100 | | | | 97,998 | |
| | | | |
Trucking & Leasing 0.3% | | | | | | | | | | | | | | | | |
| | | | |
Penske Truck Leasing Co. LP/PTL Finance Corp., | | | | | | | | | | | | | | | | |
Sr. Unsec’d. Notes, 144A | | | 5.750 | | | | 05/24/26 | | | | 300 | | | | 297,723 | |
| | | | | | | | | | | | | | | | |
| | | | |
TOTAL CORPORATE BONDS
(cost $40,681,473) | | | | | | | | | | | | | | | 37,733,046 | |
| | | | | | | | | | | | | | | | |
| | | | |
MUNICIPAL BONDS 0.2% | | | | | | | | | | | | | | | | |
| | | | |
Michigan 0.1% | | | | | | | | | | | | | | | | |
| | | | |
Michigan State University, | | | | | | | | | | | | | | | | |
Taxable, Revenue Bonds, Series A | | | 4.165 | | | | 08/15/2122 | | | | 45 | | | | 33,539 | |
University of Michigan, | | | | | | | | | | | | | | | | |
Taxable, Revenue Bonds, Series A | | | 4.454 | | | | 04/01/2122 | | | | 100 | | | | 82,845 | |
| | | | | | | | | | | | | | | | |
| | | | |
| | | | | | | | | | | | | | | 116,384 | |
| | | | |
Minnesota 0.1% | | | | | | | | | | | | | | | | |
| | | | |
University of Minnesota, | | | | | | | | | | | | | | | | |
Taxable, Revenue Bonds | | | 4.048 | | | | 04/01/52 | | | | 95 | | | | 82,198 | |
| | | | | | | | | | | | | | | | |
| | | | |
TOTAL MUNICIPAL BONDS
(cost $240,000) | | | | | | | | | | | | | | | 198,582 | |
| | | | | | | | | | | | | | | | |
| | | | |
RESIDENTIAL MORTGAGE-BACKED SECURITIES 3.2% | | | | | | | | | | | | | | | | |
Bellemeade Re Ltd., | | | | | | | | | | | | | | | | |
Series 2019-02A, Class M2, 144A, 1 Month
LIBOR + 3.100% (Cap N/A, Floor 3.100%) | | | 8.529(c) | | | | 04/25/29 | | | | 200 | | | | 203,577 | |
Citigroup Mortgage Loan Trust, | | | | | | | | | | | | | | | | |
Series 2022-A, Class A1, 144A | | | 6.170 | | | | 09/25/62 | | | | 92 | | | | 91,835 | |
See Notes to Financial Statements.
PGIM Fixed Income ETFs 187
PGIM Total Return Bond ETF
Schedule of Investments (continued)
as of August 31, 2023
| | | | | | | | | | | | | | |
| Description | | Interest Rate | | | Maturity Date | | Principal
Amount
(000)# | | | Value | |
| | | | |
RESIDENTIAL MORTGAGE-BACKED SECURITIES (Continued) | | | | | | | | | | | | | | |
Connecticut Avenue Securities Trust, | | | | | | | | | | | | | | |
Series 2022-R03, Class 1B1, 144A, 30 Day | | | | | | | | | | | | | | |
Average SOFR + 6.250% (Cap N/A, Floor 0.000%) | | | 11.538 | %(c) | | 03/25/42 | | | 15 | | | $ | 16,366 | |
Series 2022-R04, Class 1B1, 144A, 30 Day Average SOFR + 5.250% (Cap N/A, Floor 0.000%) | | | 10.538 | (c) | | 03/25/42 | | | 20 | | | | 21,178 | |
Series 2023-R05, Class 1M2, 144A, 30 Day Average SOFR + 3.100% (Cap N/A, Floor 3.100%) | | | 8.396 | (c) | | 06/25/43 | | | 100 | | | | 101,750 | |
Series 2023-R06, Class 1M2, 144A, 30 Day Average SOFR + 2.700% (Cap N/A, Floor 0.000%) | | | 7.988 | (c) | | 07/25/43 | | | 100 | | | | 100,563 | |
Credit Suisse Mortgage Trust, | | | | | | | | | | | | | | |
Series 2022-RPL04, Class A1, 144A | | | 3.904 | (cc) | | 04/25/62 | | | 91 | | | | 84,381 | |
FHLMC Structured Agency Credit Risk REMIC Trust, | | | | | | | | | | | | | | |
Series 2021-DNA01, Class B1, 144A, 30 Day | | | | | | | | | | | | | | |
Average SOFR + 2.650% (Cap N/A, Floor 0.000%) | | | 7.938 | (c) | | 01/25/51 | | | 500 | | | | 485,155 | |
Series 2021-DNA06, Class M2, 144A, 30 Day | | | | | | | | | | | | | | |
Average SOFR + 1.500% (Cap N/A, Floor 0.000%) | | | 6.788 | (c) | | 10/25/41 | | | 200 | | | | 195,853 | |
Series 2022-DNA01, Class M1B, 144A, 30 Day | | | | | | | | | | | | | | |
Average SOFR + 1.850% (Cap N/A, Floor 0.000%) | | | 7.138 | (c) | | 01/25/42 | | | 300 | | | | 294,564 | |
Series 2022-DNA02, Class M1B, 144A, 30 Day | | | | | | | | | | | | | | |
Average SOFR + 2.400% (Cap N/A, Floor 0.000%) | | | 7.688 | (c) | | 02/25/42 | | | 100 | | | | 99,625 | |
Series 2022-DNA03, Class M1B, 144A, 30 Day | | | | | | | | | | | | | | |
Average SOFR + 2.900% (Cap N/A, Floor 0.000%) | | | 8.188 | (c) | | 04/25/42 | | | 310 | | | | 315,287 | |
Series 2022-DNA06, Class M1B, 144A, 30 Day | | | | | | | | | | | | | | |
Average SOFR + 3.700% (Cap N/A, Floor 0.000%) | | | 8.988 | (c) | | 09/25/42 | | | 600 | | | | 625,500 | |
PMT Credit Risk Transfer Trust, | | | | | | | | | | | | | | |
Series 2019-02R, Class A, 144A, 1 Month SOFR + | | | | | | | | | | | | | | |
3.864% (Cap N/A, Floor 2.750%) | | | 9.193 | (c) | | 05/30/25 | | | 263 | | | | 262,916 | |
Series 2023-1R, Class A, 144A, 30 Day Average | | | | | | | | | | | | | | |
SOFR + 4.400% (Cap N/A, Floor 0.000%) | | | 9.704 | (c) | | 03/27/25 | | | 191 | | | | 190,694 | |
See Notes to Financial Statements.
188
PGIM Total Return Bond ETF
Schedule of Investments (continued)
as of August 31, 2023
| | | | | | | | | | | | | | | | |
| | | | |
| Description | | Interest
Rate | | | Maturity
Date | | | Principal
Amount
(000)# | | | Value | |
| | | | |
RESIDENTIAL MORTGAGE-BACKED SECURITIES (Continued) | | | | | | | | | | | | | | | | |
| | | | |
Radnor Re Ltd., | | | | | | | | | | | | | | | | |
Series 2023-01, Class M1A, 144A, 30 Day Average SOFR + 2.700% (Cap N/A, Floor 2.700%) | | | 7.988%(c) | | | | 07/25/33 | | | | 150 | | | $ | 150,547 | |
| | | | | | | | | | | | | | | | |
| | | | |
TOTAL RESIDENTIAL MORTGAGE-BACKED SECURITIES
(cost $3,163,530) | | | | | | | | | | | | | | | 3,239,791 | |
| | | | | | | | | | | | | | | | |
| | | | |
SOVEREIGN BONDS 1.1% | | | | | | | | | | | | | | | | |
| | | | |
Brazil Minas SPE via State of Minas Gerais (Brazil), Gov’t. Gtd. Notes | | | 5.333 | | | | 02/15/28 | | | | 100 | | | | 97,884 | |
Dominican Republic International Bond (Dominican Republic), | | | | | | | | | | | | | | | | |
Sr. Unsec’d. Notes, 144A | | | 5.500 | | | | 02/22/29 | | | | 150 | | | | 140,074 | |
Indonesia Government International Bond (Indonesia), | | | | | | | | | | | | | | | | |
Sr. Unsec’d. Notes | | | 0.900 | | | | 02/14/27 | | | EUR | 150 | | | | 144,845 | |
Sr. Unsec’d. Notes | | | 1.100 | | | | 03/12/33 | | | EUR | 100 | | | | 78,887 | |
Romanian Government International Bond (Romania), | | | | | | | | | | | | | | | | |
Sr. Unsec’d. Notes, EMTN | | | 1.750 | | | | 07/13/30 | | | EUR | 160 | | | | 133,481 | |
Serbia International Bond (Serbia), | | | | | | | | | | | | | | | | |
Sr. Unsec’d. Notes | | | 3.125 | | | | 05/15/27 | | | EUR | 300 | | | | 296,490 | |
Sr. Unsec’d. Notes, 144A | | | 6.250 | | | | 05/26/28 | | | | 200 | | | | 198,618 | |
Ukraine Government International Bond (Ukraine), | | | | | | | | | | | | | | | | |
Sr. Unsec’d. Notes | | | 7.750 | | | | 09/01/26(d) | | | | 100 | | | | 28,750 | |
| | | | | | | | | | | | | | | | |
| | | | |
TOTAL SOVEREIGN BONDS
(cost $1,297,360) | | | | | | | | | | | | | | | 1,119,029 | |
| | | | | | | | | | | | | | | | |
| | | | |
U.S. GOVERNMENT AGENCY OBLIGATIONS 17.2% | | | | | | | | | | | | | | | | |
| | | | |
Federal Home Loan Mortgage Corp. | | | 2.500 | | | | 03/01/51 | | | | 577 | | | | 482,314 | |
Federal Home Loan Mortgage Corp. | | | 2.500 | | | | 04/01/51 | | | | 477 | | | | 398,665 | |
Federal Home Loan Mortgage Corp. | | | 3.000 | | | | 01/01/52 | | | | 456 | | | | 394,321 | |
Federal Home Loan Mortgage Corp. | | | 3.000 | | | | 02/01/52 | | | | 452 | | | | 389,758 | |
Federal Home Loan Mortgage Corp. | | | 3.500 | | | | 09/01/52 | | | | 996 | | | | 890,106 | |
Federal Home Loan Mortgage Corp. | | | 6.000 | | | | 08/01/52 | | | | 118 | | | | 118,294 | |
Federal National Mortgage Assoc. | | | 1.500 | | | | 02/01/51 | | | | 757 | | | | 572,967 | |
Federal National Mortgage Assoc. | | | 2.000 | | | | 11/01/50 | | | | 415 | | | | 332,711 | |
Federal National Mortgage Assoc. | | | 2.000 | | | | 10/01/51 | | | | 980 | | | | 781,531 | |
Federal National Mortgage Assoc. | | | 3.000 | | | | 12/01/51 | | | | 445 | | | | 385,022 | |
Federal National Mortgage Assoc. | | | 3.000 | | | | 01/01/52 | | | | 212 | | | | 183,817 | |
See Notes to Financial Statements.
PGIM Fixed Income ETFs 189
PGIM Total Return Bond ETF
Schedule of Investments (continued)
as of August 31, 2023
| | | | | | | | | | | | | | | | |
| | | | |
| Description | | Interest
Rate | | | Maturity
Date | | | Principal
Amount
(000)# | | | Value | |
| | | | |
U.S. GOVERNMENT AGENCY OBLIGATIONS (Continued) | | | | | | | | | | | | | | | | |
| | | | |
Federal National Mortgage Assoc. | | | 3.000% | | | | 03/01/52 | | | | 456 | | | $ | 393,056 | |
Federal National Mortgage Assoc. | | | 3.500 | | | | 02/01/52 | | | | 880 | | | | 787,215 | |
Federal National Mortgage Assoc. | | | 4.000 | | | | 05/01/52 | | | | 1,147 | | | | 1,058,948 | |
Federal National Mortgage Assoc. | | | 4.000 | | | | 06/01/52 | | | | 1,584 | | | | 1,462,319 | |
Federal National Mortgage Assoc. | | | 4.500 | | | | 06/01/52 | | | | 1,415 | | | | 1,341,714 | |
Federal National Mortgage Assoc. | | | 4.500 | | | | 09/01/52 | | | | 987 | | | | 935,908 | |
Federal National Mortgage Assoc. | | | 5.000 | | | | 06/01/52 | | | | 227 | | | | 219,810 | |
Federal National Mortgage Assoc. | | | 5.000 | | | | 07/01/52 | | | | 710 | | | | 688,292 | |
Federal National Mortgage Assoc. | | | 5.500 | | | | 11/01/52 | | | | 948 | | | | 936,943 | |
Federal National Mortgage Assoc. | | | 6.000 | | | | 11/01/52 | | | | 101 | | | | 101,265 | |
Federal National Mortgage Assoc. | | | 6.000 | | | | 12/01/52 | | | | 415 | | | | 416,109 | |
Federal National Mortgage Assoc. | | | 6.500 | | | | 06/01/53 | | | | 108 | | | | 109,821 | |
Government National Mortgage Assoc. | | | 2.500 | | | | 09/20/51 | | | | 1,001 | | | | 852,303 | |
Government National Mortgage Assoc. | | | 3.000 | | | | 08/20/51 | | | | 1,172 | | | | 1,032,838 | |
Government National Mortgage Assoc. | | | 3.500 | | | | 12/20/51 | | | | 460 | | | | 418,604 | |
Government National Mortgage Assoc. | | | 3.500 | | | | 03/20/52 | | | | 460 | | | | 418,013 | |
Government National Mortgage Assoc. | | | 5.000 | | | | 09/20/52 | | | | 497 | | | | 484,182 | |
Government National Mortgage Assoc. | | | 5.000 | | | | 12/20/52 | | | | 508 | | | | 494,514 | |
Government National Mortgage Assoc. | | | 5.500 | | | | 09/20/52 | | | | 229 | | | | 226,430 | |
Government National Mortgage Assoc. | | | 5.500 | | | | 11/20/52 | | | | 492 | | | | 486,559 | |
| | | | | | | | | | | | | | | | |
| | | | |
TOTAL U.S. GOVERNMENT AGENCY OBLIGATIONS
(cost $18,505,319) | | | | | | | | | | | | | | | 17,794,349 | |
| | | | | | | | | | | | | | | | |
| | | | |
U.S. TREASURY OBLIGATIONS 6.8% | | | | | | | | | | | | | | | | |
| | | | |
U.S. Treasury Bonds(k) | | | 2.000 | | | | 11/15/41 | | | | 4,210 | | | | 2,945,684 | |
U.S. Treasury Bonds | | | 2.250 | | | | 05/15/41 | | | | 575 | | | | 423,523 | |
U.S. Treasury Bonds | | | 2.375 | | | | 02/15/42 | | | | 3,700 | | | | 2,751,875 | |
U.S. Treasury Strips Coupon(k) | | | 2.391(s) | | | | 11/15/41 | | | | 1,880 | | | | 820,297 | |
U.S. Treasury Strips Coupon | | | 3.799(s) | | | | 02/15/39 | | | | 170 | | | | 85,691 | |
| | | | | | | | | | | | | | | | |
| | | | |
TOTAL U.S. TREASURY OBLIGATIONS
(cost $8,890,212) | | | | | | | | | | | | | | | 7,027,070 | |
| | | | | | | | | | | | | | | | |
| | | | |
TOTAL LONG-TERM INVESTMENTS
(cost $108,529,628) | | | | | | | | | | | | | | | 102,434,202 | |
| | | | | | | | | | | | | | | | |
See Notes to Financial Statements.
190
PGIM Total Return Bond ETF
Schedule of Investments (continued)
as of August 31, 2023
| | | | | | | | | | | | | | |
| | | | |
| Description | | | | | | | Shares | | Value | |
| | | | |
SHORT-TERM INVESTMENT 0.3% | | | | | | | | | | | | | | |
| | | | |
AFFILIATED MUTUAL FUND | | | | | | | | | | | | | | |
PGIM Core Government Money Market Fund | | | | | | | | | | | | | | |
(cost $370,989)(wi) | | | | | | | | | | 370,989 | | $ | 370,989 | |
| | | | | | | | | | | | | | |
| | | | |
TOTAL INVESTMENTS 99.5%
(cost $108,900,617) | | | | | | | | | | | | | 102,805,191 | |
Other assets in excess of liabilities(z) 0.5% | | | | | | | | | | | | | 489,504 | |
| | | | | | | | | | | | | | |
| | | | |
NET ASSETS 100.0% | | | | | | | | | | | | $ | 103,294,695 | |
| | | | | | | | | | | | | | |
See the Glossary for a list of the abbreviation(s) used in the annual report.
| # | Principal or notional amount is shown in U.S. dollars unless otherwise stated. |
| (c) | Variable rate instrument. The interest rate shown reflects the rate in effect at August 31, 2023. |
| (cc) | Variable rate instrument. The rate shown is based on the latest available information as of August 31, 2023. Certain variable rate securities are not based on a published reference rate and spread but are determined by the issuer or agent and are based on current market conditions. These securities do not indicate a reference rate and spread in their description. |
| (d) | Represents issuer in default on interest payments and/or principal repayment. Non-income producing security. Such securities may be post-maturity. |
| (f) | Indicates a restricted security that is acquired in unregistered, private sales from the issuing company or from an affiliate of the issuer and is considered restricted as to disposition under federal securities law; the aggregate original cost of such securities is $89,125. The aggregate value of $54,660 is 0.1% of net assets. |
| (ff) | Variable rate security. Security may be issued at a fixed coupon rate, which converts to a variable rate at a specified date. Rate shown is the rate in effect as of period end. |
| (k) | Represents security, or a portion thereof, segregated as collateral for centrally cleared/exchange-traded derivatives. |
| (oo) | Perpetual security. Maturity date represents next call date. |
| (s) | Represents zero coupon bond or principal only security. Rate represents yield to maturity at purchase date. |
| (wi) | PGIM Investments LLC, the manager of the Fund, also serves as manager of the PGIM Core Government Money Market Fund and PGIM Institutional Money Market Fund, if applicable. |
| (z) | Includes net unrealized appreciation/(depreciation) and/or market value of the below holdings which are excluded from the Schedule of Investments: |
Forward Commitment Contract:
| | | | | | | | | | | | | | | | | | | | |
U.S. Government Agency Obligation | | Interest
Rate | | | Maturity
Date | | | Settlement
Date | | | Principal
Amount
(000)# | | | Value | |
Federal National Mortgage Assoc.
(proceeds receivable $487,451) | | | 5.500 | % | | | TBA | | | | 10/15/53 | | | $ | (500 | ) | | $ | (493,515 | ) |
| | | | | | | | | | | | | | | | | | | | |
See Notes to Financial Statements.
PGIM Fixed Income ETFs 191
PGIM Total Return Bond ETF
Schedule of Investments (continued)
as of August 31, 2023
Futures contracts outstanding at August 31, 2023:
| | | | | | | | | | | | | | | | | | | | | | |
Number
of
Contracts | | | | Type | | | | Expiration
Date | | | | | Current
Notional
Amount | | | | | Value /
Unrealized
Appreciation
(Depreciation) | |
Long Positions: | | | | | | | | | | | | | | | | | | |
39 | | | | 3 Month CME SOFR | | | | | Mar. 2024 | | | | | $ | 9,223,500 | | | | | $ | (951 | ) |
38 | | | | 2 Year U.S. Treasury Notes | | | | | Dec. 2023 | | | | | | 7,744,578 | | | | | | 16,768 | |
16 | | | | 5 Year U.S. Treasury Notes | | | | | Dec. 2023 | | | | | | 1,710,750 | | | | | | 8,873 | |
44 | | | | 10 Year U.S. Treasury Notes | | | | | Dec. 2023 | | | | | | 4,885,375 | | | | | | 43,167 | |
42 | | | | 30 Year U.S. Ultra Treasury Bonds | | | | | Dec. 2023 | | | | | | 5,437,688 | | | | | | 95,361 | |
| | | | | | | | | | | | | | | | | | | | | | |
| | | | | | | | | | | | | | | | | | | | | 163,218 | |
| | | | | | | | | | | | | | | | | | | | | | |
Short Positions: | | | | | | | | | | | | | | | | | | |
5 | | | | 5 Year Euro-Bobl | | | | | Sep. 2023 | | | | | | 629,520 | | | | | | 6,265 | |
1 | | | | 10 Year Euro-Bund | | | | | Sep. 2023 | | | | | | 144,425 | | | | | | 2,132 | |
2 | | | | 10 Year Euro-Bund | | | | | Dec. 2023 | | | | | | 287,635 | | | | | | (2,875 | ) |
7 | | | | 20 Year U.S. Treasury Bonds | | | | | Dec. 2023 | | | | | | 851,812 | | | | | | (15,347 | ) |
| | | | | | | | | | | | | | | | | | | | | | |
| | | | | | | | | | | | | | | | | | | | | (9,825 | ) |
| | | | | | | | | | | | | | | | | | | | | | |
| | | | | | | | | | | | | | | | | | | | $ | 153,393 | |
| | | | | | | | | | | | | | | | | | | | | | |
Forward foreign currency exchange contracts outstanding at August 31, 2023:
| | | | | | | | | | | | | | | | | | | | | | | | | | | | | | | | |
Purchase Contracts | | Counterparty | | Notional
Amount
(000) | | Value at
Settlement
Date | | Current
Value | | Unrealized
Appreciation | | Unrealized
Depreciation |
| | | | | |
OTC Forward Foreign Currency Exchange Contracts: | | | | | | | | | | | | | | | | | | | | | | | | | |
Australian Dollar, | | | | | | | | | | | | | | | | | | | | | | | | | | | |
Expiring 10/19/23 | | MSI | | | | AUD | | | | | 48 | | | | $ | 31,000 | | | | $ | 30,944 | | | | $ | — | | | | $ | (56 | ) |
Brazilian Real, | | | | | | | | | | | | | | | | | | | | | | | | | | | | | | | | |
Expiring 09/05/23 | | CITI | | | | BRL | | | | | 438 | | | | | 91,240 | | | | | 88,376 | | | | | — | | | | | (2,864 | ) |
Expiring 09/05/23 | | JPM | | | | BRL | | | | | 255 | | | | | 51,977 | | | | | 51,412 | | | | | — | | | | | (565 | ) |
British Pound, | | | | | | | | | | | | | | | | | | | | | | | | | | | |
Expiring 09/05/23 | | MSI | | | | GBP | | | | | 467 | | | | | 591,278 | | | | | 591,241 | | | | | — | | | | | (37 | ) |
Chilean Peso, | | | | | | | | | | | | | | | | | | | | | | | | | | | |
Expiring 09/20/23 | | BNP | | | | CLP | | | | | 54,845 | | | | | 64,000 | | | | | 64,182 | | | | | 182 | | | | | — | |
Chinese Renminbi, | | | | | | | | | | | | | | | | | | | | | | | | | | | |
Expiring 11/16/23 | | BOA | | | | CNH | | | | | 1,367 | | | | | 188,000 | | | | | 188,721 | | | | | 721 | | | | | — | |
Expiring 11/16/23 | | CITI | | | | CNH | | | | | 450 | | | | | 62,000 | | | | | 62,157 | | | | | 157 | | | | | — | |
Colombian Peso, | | | | | | | | | | | | | | | | | | | | | | | | | | | |
Expiring 09/20/23 | | CITI | | | | COP | | | | | 1,826,043 | | | | | 447,794 | | | | | 443,328 | | | | | — | | | | | (4,466 | ) |
Expiring 09/20/23 | | CITI | | | | COP | | | | | 239,627 | | | | | 58,000 | | | | | 58,177 | | | | | 177 | | | | | — | |
Expiring 12/20/23 | | CITI | | | | COP | | | | | 718,027 | | | | | 169,556 | | | | | 170,445 | | | | | 889 | | | | | — | |
Euro, | | | | | | | | | | | | | | | | | | | | | | | | | | | |
Expiring 10/19/23 | | CITI | | | | EUR | | | | | 57 | | | | | 62,000 | | | | | 61,912 | | | | | — | | | | | (88 | ) |
See Notes to Financial Statements.
192
PGIM Total Return Bond ETF
Schedule of Investments (continued)
as of August 31, 2023
Forward foreign currency exchange contracts outstanding at August 31, 2023 (continued):
| | | | | | | | | | | | | | | | | | | | | | | | | | | | | | | | |
Purchase Contracts | | Counterparty | | Notional
Amount
(000) | | Value at
Settlement
Date | | Current
Value | | Unrealized
Appreciation | | Unrealized
Depreciation |
| | | | | |
OTC Forward Foreign Currency Exchange Contracts (cont’d.): | | | | | | | | | | | | | | | | | | | | | | | | | |
Euro (cont’d.), | | | | | | | | | | | | | | | | | | | | | | | | | | | |
Expiring 10/19/23 | | MSI | | | | EUR | | | | | 333 | | | | $ | 366,986 | | | | $ | 361,949 | | | | $ | — | | | | $ | (5,037 | ) |
Indian Rupee, | | | | | | | | | | | | | | | | | | | | | | | | | | | |
Expiring 09/20/23 | | BOA | | | | INR | | | | | 16,475 | | | | | 199,000 | | | | | 199,093 | | | | | 93 | | | | | — | |
Indonesian Rupiah, | | | | | | | | | | | | | | | | | | | | | | | | | | | |
Expiring 09/20/23 | | TD | | | | IDR | | | | | 2,929,209 | | | | | 193,194 | | | | | 192,297 | | | | | — | | | | | (897 | ) |
Israeli Shekel, | | | | | | | | | | | | | | | | | | | | | | | | | | | |
Expiring 09/20/23 | | MSI | | | | ILS | | | | | 150 | | | | | 41,281 | | | | | 39,427 | | | | | — | | | | | (1,854 | ) |
Japanese Yen, | | | | | | | | | | | | | | | | | | | | | | | | | | | |
Expiring 10/19/23 | | CITI | | | | JPY | | | | | 4,383 | | | | | 31,000 | | | | | 30,365 | | | | | — | | | | | (635 | ) |
Expiring 10/19/23 | | MSI | | | | JPY | | | | | 8,715 | | | | | 61,567 | | | | | 60,383 | | | | | — | | | | | (1,184 | ) |
New Taiwanese Dollar, | | | | | | | | | | | | | | | | | | | | | | | | | | | |
Expiring 09/20/23 | | CITI | | | | TWD | | | | | 1,963 | | | | | 62,000 | | | | | 61,662 | | | | | — | | | | | (338 | ) |
Expiring 09/20/23 | | MSI | | | | TWD | | | | | 3,578 | | | | | 112,000 | | | | | 112,396 | | | | | 396 | | | | | — | |
Peruvian Nuevo Sol, | | | | | | | | | | | | | | | | | | | | | | | | | | | |
Expiring 09/20/23 | | CITI | | | | PEN | | | | | 1,032 | | | | | 282,837 | | | | | 278,735 | | | | | — | | | | | (4,102 | ) |
Philippine Peso, | | | | | | | | | | | | | | | | | | | | | | | | | | | |
Expiring 09/20/23 | | CITI | | | | PHP | | | | | 1,712 | | | | | 30,500 | | | | | 30,231 | | | | | — | | | | | (269 | ) |
South African Rand, | | | | | | | | | | | | | | | | | | | | | | | | | | | |
Expiring 09/20/23 | | MSI | | | | ZAR | | | | | 4,000 | | | | | 218,857 | | | | | 211,428 | | | | | — | | | | | (7,429 | ) |
South Korean Won, | | | | | | | | | | | | | | | | | | | | | | | | | | | |
Expiring 09/20/23 | | BOA | | | | KRW | | | | | 82,717 | | | | | 62,000 | | | | | 62,541 | | | | | 541 | | | | | — | |
| | | | | | | | | | | | | | | | | | | | | | | | | | | | | | | | |
| | | | | | | |
| | | | | | | | | | | | | | | $ | 3,478,067 | | | | $ | 3,451,402 | | | | | 3,156 | | | | | (29,821 | ) |
| | | | | | | | | | | | | | | | | | | | | | | | | | | | | | | | |
| | | | | | |
Sale Contracts | | Counterparty | | Notional
Amount
(000) | | Value at
Settlement
Date | | Current
Value | | Unrealized
Appreciation | | Unrealized
Depreciation |
| | | | | |
OTC Forward Foreign Currency Exchange Contracts: | | | | | | | | | | | | | | | | | | | | | | | | | |
Australian Dollar, | | | | | | | | | | | | | | | | | | | | | | | | | | | |
Expiring 10/19/23 | | CITI | | | | AUD | | | | | 48 | | | | $ | 31,000 | | | | $ | 30,857 | | | | $ | 143 | | | | $ | — | |
Expiring 10/19/23 | | MSI | | | | AUD | | | | | 182 | | | | | 120,856 | | | | | 118,175 | | | | | 2,681 | | | | | — | |
Brazilian Real, | | | | | | | | | | | | | | | | | | | | | | | | | | | |
Expiring 09/05/23 | | BNP | | | | BRL | | | | | 363 | | | | | 73,000 | | | | | 73,227 | | | | | — | | | | | (227 | ) |
Expiring 09/05/23 | | TD | | | | BRL | | | | | 330 | | | | | 66,000 | | | | | 66,562 | | | | | — | | | | | (562 | ) |
Expiring 10/03/23 | | JPM | | | | BRL | | | | | 255 | | | | | 51,749 | | | | | 51,184 | | | | | 565 | | | | | — | |
British Pound, | | | | | | | | | | | | | | | | | | | | | | | | | | | |
Expiring 09/05/23 | | GSI | | | | GBP | | | | | 33 | | | | | 42,414 | | | | | 42,101 | | | | | 313 | | | | | — | |
Expiring 09/05/23 | | SSB | | | | GBP | | | | | 433 | | | | | 557,247 | | | | | 549,149 | | | | | 8,098 | | | | | — | |
Expiring 10/19/23 | | MSI | | | | GBP | | | | | 467 | | | | | 591,370 | | | | | 591,319 | | | | | 51 | | | | | — | |
See Notes to Financial Statements.
PGIM Fixed Income ETFs 193
PGIM Total Return Bond ETF
Schedule of Investments (continued)
as of August 31, 2023
Forward foreign currency exchange contracts outstanding at August 31, 2023 (continued):
| | | | | | | | | | | | | | | | | | | | | | | | | | | | | | | | |
| | | | | | |
Sale Contracts | | Counterparty | | Notional
Amount
(000) | | Value at
Settlement
Date | | Current
Value | | Unrealized
Appreciation | | Unrealized
Depreciation |
| | | | | |
OTC Forward Foreign Currency Exchange Contracts (cont’d.): | | | | | | | | | | | | | | | | | | | | | | | | | |
Chilean Peso, | | | | | | | | | | | | | | | | | | | | | | | | | | | |
Expiring 09/20/23 | | CITI | | | | CLP | | | | | 240,313 | | | | $ | 282,907 | | | | $ | 281,226 | | | | $ | 1,681 | | | | $ | — | |
Chinese Renminbi, | | | | | | | | | | | | | | | | | | | | | | | | | | | |
Expiring 11/16/23 | | MSI | | | | CNH | | | | | 3,863 | | | | | 529,882 | | | | | 533,201 | | | | | — | | | | | (3,319 | ) |
Colombian Peso, | | | | | | | | | | | | | | | | | | | | | | | | | | | |
Expiring 09/20/23 | | BOA | | | | COP | | | | | 279,337 | | | | | 68,000 | | | | | 67,818 | | | | | 182 | | | | | — | |
Expiring 09/20/23 | | CITI | | | | COP | | | | | 718,027 | | | | | 173,520 | | | | | 174,323 | | | | | — | | | | | (803 | ) |
Expiring 09/20/23 | | CITI | | | | COP | | | | | 264,954 | | | | | 64,000 | | | | | 64,326 | | | | | — | | | | | (326 | ) |
Czech Koruna, | | | | | | | | | | | | | | | | | | | | | | | | | | | |
Expiring 10/19/23 | | BNP | | | | CZK | | | | | 2,910 | | | | | 131,000 | | | | | 130,867 | | | | | 133 | | | | | — | |
Expiring 10/19/23 | | GSI | | | | CZK | | | | | 1,992 | | | | | 91,042 | | | | | 89,579 | | | | | 1,463 | | | | | — | |
Euro, | | | | | | | | | | | | | | | | | | | | | | | | | | | |
Expiring 09/05/23 | | BOA | | | | EUR | | | | | 240 | | | | | 264,310 | | | | | 260,781 | | | | | 3,529 | | | | | — | |
Expiring 09/05/23 | | GSI | | | | EUR | | | | | 4,280 | | | | | 4,733,772 | | | | | 4,641,980 | | | | | 91,792 | | | | | — | |
Expiring 10/19/23 | | BOA | | | | EUR | | | | | 56 | | | | | 62,000 | | | | | 61,273 | | | | | 727 | | | | | — | |
Expiring 10/19/23 | | TD | | | | EUR | | | | | 28 | | | | | 31,000 | | | | | 30,694 | | | | | 306 | | | | | — | |
Hungarian Forint, | | | | | | | | | | | | | | | | | | | | | | | | | | | |
Expiring 10/19/23 | | BOA | | | | HUF | | | | | 22,445 | | | | | 63,000 | | | | | 63,202 | | | | | — | | | | | (202 | ) |
Expiring 10/19/23 | | GSI | | | | HUF | | | | | 23,517 | | | | | 65,000 | | | | | 66,219 | | | | | — | | | | | (1,219 | ) |
Expiring 10/19/23 | | GSI | | | | HUF | | | | | 22,619 | | | | | 63,000 | | | | | 63,690 | | | | | — | | | | | (690 | ) |
Expiring 10/19/23 | | MSI | | | | HUF | | | | | 25,124 | | | | | 69,762 | | | | | 70,745 | | | | | — | | | | | (983 | ) |
Indian Rupee, | | | | | | | | | | | | | | | | | | | | | | | | | | | |
Expiring 09/20/23 | | JPM | | | | INR | | | | | 5,151 | | | | | 62,000 | | | | | 62,250 | | | | | — | | | | | (250 | ) |
Expiring 09/20/23 | | TD | | | | INR | | | | | 4,204 | | | | | 50,992 | | | | | 50,807 | | | | | 185 | | | | | — | |
Israeli Shekel, | | | | | | | | | | | | | | | | | | | | | | | | | | | |
Expiring 09/20/23 | | CITI | | | | ILS | | | | | 118 | | | | | 31,000 | | | | | 30,953 | | | | | 47 | | | | | — | |
Mexican Peso, | | | | | | | | | | | | | | �� | | | | | | | | | | | | | |
Expiring 09/20/23 | | BOA | | | | MXN | | | | | 1,223 | | | | | 71,000 | | | | | 71,448 | | | | | — | | | | | (448 | ) |
Expiring 09/20/23 | | CITI | | | | MXN | | | | | 1,597 | | | | | 92,000 | | | | | 93,332 | | | | | — | | | | | (1,332 | ) |
Expiring 09/20/23 | | MSI | | | | MXN | | | | | 1,537 | | | | | 90,688 | | | | | 89,815 | | | | | 873 | | | | | — | |
New Taiwanese Dollar, | | | | | | |
Expiring 09/20/23 | | TD | | | | TWD | | | | | 23,131 | | | | | 733,383 | | | | | 726,713 | | | | | 6,670 | | | | | — | |
Philippine Peso, | | | | | | | | | | | | | | | | | | | | | | | | | | | |
Expiring 09/20/23 | | CITI | | | | PHP | | | | | 10,603 | | | | | 187,000 | | | | | 187,281 | | | | | — | | | | | (281 | ) |
Expiring 09/20/23 | | TD | | | | PHP | | | | | 9,543 | | | | | 173,833 | | | | | 168,567 | | | | | 5,266 | | | | | — | |
Polish Zloty, | | | | | | | | | | | | | | | | | | | | | | | | | | | |
Expiring 10/19/23 | | BNP | | | | PLN | | | | | 556 | | | | | 136,000 | | | | | 134,356 | | | | | 1,644 | | | | | — | |
Expiring 10/19/23 | | GSI | | | | PLN | | | | | 127 | | | | | 31,000 | | | | | 30,743 | | | | | 257 | | | | | — | |
Singapore Dollar, | | | | | | | | | | | | | | | | | | | | | | | | | | | |
Expiring 09/20/23 | | GSI | | | | SGD | | | | | 42 | | | | | 31,000 | | | | | 30,738 | | | | | 262 | | | | | — | |
See Notes to Financial Statements.
194
PGIM Total Return Bond ETF
Schedule of Investments (continued)
as of August 31, 2023
Forward foreign currency exchange contracts outstanding at August 31, 2023 (continued):
| | | | | | | | | | | | | | | | | | | | | | | | | | | | | | | | |
| | | | | | |
Sale Contracts | | Counterparty | | Notional
Amount
(000) | | Value at
Settlement
Date | | Current
Value | | Unrealized
Appreciation | | Unrealized
Depreciation |
| | | | | | |
OTC Forward Foreign Currency Exchange Contracts (cont’d.): | | | | | | | | | | | | | | | | | | | | | | | | | | | | | | |
Singapore Dollar (cont’d.), | | | | | | | | | | | | | | | | | | | | | | | | | | | |
Expiring 09/20/23 | | JPM | | | | SGD | | | | | 1,004 | | | | $ | 753,551 | | | | $ | 743,908 | | | | $ | 9,643 | | | | $ | — | |
Expiring 09/20/23 | | MSI | | | | SGD | | | | | 82 | | | | | 61,000 | | | | | 60,856 | | | | | 144 | | | | | — | |
Expiring 09/20/23 | | SSB | | | | SGD | | | | | 42 | | | | | 31,000 | | | | | 31,156 | | | | | — | | | | | (156 | ) |
South African Rand, | | | | | | | | | | | | | | | | | | | | | | | | | | | |
Expiring 09/20/23 | | JPM | | | | ZAR | | | | | 1,429 | | | | | 76,000 | | | | | 75,548 | | | | | 452 | | | | | — | |
South Korean Won, | | | | | | | | | | | | | | | | | | | | | | | | | | | |
Expiring 09/20/23 | | BOA | | | | KRW | | | | | 188,145 | | | | | 141,000 | | | | | 142,253 | | | | | — | | | | | (1,253 | ) |
Expiring 09/20/23 | | CITI | | | | KRW | | | | | 39,006 | | | | | 30,000 | | | | | 29,492 | | | | | 508 | | | | | — | |
Expiring 09/20/23 | | TD | | | | KRW | | | | | 599,395 | | | | | 465,658 | | | | | 453,194 | | | | | 12,464 | | | | | — | |
Thai Baht, | | | | | | | | | | | | | | | | | | | | | | | | | | | |
Expiring 09/20/23 | | CITI | | | | THB | | | | | 2,086 | | | | | 60,000 | | | | | 59,686 | | | | | 314 | | | | | — | |
Expiring 09/20/23 | | JPM | | | | THB | | | | | 2,801 | | | | | 81,766 | | | | | 80,138 | | | | | 1,628 | | | | | — | |
| | | | | | | | | | | | | | | | | | | | | | | | | | | | | | | | |
| | | | | | | |
| | | | | | | | | | | | | | | $ | 11,615,702 | | | | $ | 11,475,732 | | | | | 152,021 | | | | | (12,051 | ) |
| | | | | | | | | | | | | | | | | | | | | | | | | | | | | | | | |
| | | | | | | |
| | | | | | | | | | | | | | | | | | | | | | | | | $ | 155,177 | | | | $ | (41,872 | ) |
| | | | | | | | | | | | | | | | | | | | | | | | | | | | | | | | |
Credit default swap agreements outstanding at August 31, 2023:
| | | | | | | | | | | | | | | | | | | | | | | | | | | | | | | | | | | | | | | | | | | | | | | | | | | | | | | | | | | | | | | | | | | | |
Reference Entity/ Obligation | | Termination
Date | | Fixed
Rate | | Notional
Amount
(000)#(3) | | | Implied Credit
Spread at
August 31,
2023(4) | | | Value at
Trade Date | | | Value at
August 31,
2023 | | | | | | Unrealized
Appreciation
(Depreciation) | | | | |
Centrally Cleared Credit Default Swap Agreement on credit indices - Sell Protection(2): | | | | | | | | | | | | | | | | | | | | | | | | | | | | | |
CDX.NA.HY.40.V1 | | | | 06/20/28 | | | | 5.000%(Q) | | | | | | | 6,250 | | | | | | | | | | | | 4.257% | | | | | | | | | | | $ | 201,589 | | | | | | | | | | | $ | 239,947 | | | | | | | | | | | $ | 38,358 | | | | | |
| | | | | | | | | | | | | | | | | | | | | | | | | | | | | | | | | | | | | | | | | | | | | | | | | | | | | | | | | | | | | | | | | | | | |
The Fund entered into credit default swaps (“CDS”) to provide a measure of protection against defaults or to take an active long or short position with respect to the likelihood of a particular issuer’s default or the reference entity’s credit soundness. CDS contracts generally trade based on a spread which represents the cost a protection buyer has to pay the protection seller. The protection buyer is said to be short the credit as the value of the contract rises the more the credit deteriorates. The value of the CDS contract increases for the protection buyer if the spread increases.
| (1) | If the Fund is a buyer of protection, it pays the fixed rate. When a credit event occurs, as defined under the terms of that particular swap agreement, the Fund will either (i) receive from the seller of protection an amount equal to the notional amount of the swap and make delivery of the referenced obligation or underlying securities comprising the referenced index or (ii) receive a net settlement amount in the form of cash or securities equal to the notional amount of the swap less the recovery value of the referenced obligation or underlying securities comprising the referenced index. |
See Notes to Financial Statements.
PGIM Fixed Income ETFs 195
PGIM Total Return Bond ETF
Schedule of Investments (continued)
as of August 31, 2023
| (2) | If the Fund is a seller of protection, it receives the fixed rate. When a credit event occurs, as defined under the terms of that particular swap agreement, the Fund will either (i) pay to the buyer of protection an amount equal to the notional amount of the swap and take delivery of the referenced obligation or underlying securities comprising the referenced index or (ii) pay a net settlement amount in the form of cash or securities equal to the notional amount of the swap less the recovery value of the referenced obligation or underlying securities comprising the referenced index. |
| (3) | Notional amount represents the maximum potential amount the Fund could be required to pay as a seller of credit protection or receive as a buyer of credit protection if a credit event occurs as defined under the terms of that particular swap agreement. |
| (4) | Implied credit spreads, represented in absolute terms, utilized in determining the fair value of credit default swap agreements where the Fund is the seller of protection as of the reporting date serve as an indicator of the current status of the payment/ performance risk and represent the likelihood of risk of default for the credit derivative. The implied credit spread of a particular referenced entity reflects the cost of buying/selling protection and may include up-front payments required to be made to enter into the agreement. Wider credit spreads represent a deterioration of the referenced entity’s credit soundness and a greater likelihood of risk of default or other credit event occurring as defined under the terms of the agreement. |
Interest rate swap agreements outstanding at August 31, 2023:
| | | | | | | | | | | | | | | | | | | | | | | | | | | | | | |
Notional
Amount
(000)# | | | | Termination
Date | | | | | Fixed
Rate | | | | | Floating Rate | | | | Value at
Trade Date | | | | Value at
August 31,
2023 | | | | Unrealized
Appreciation
(Depreciation) |
Centrally Cleared Interest Rate Swap Agreements: |
GBP | | 140 | | | | | 05/08/27 | | | | | | 1.050%(A) | | | | | 1 Day SONIA(1)(A)/5.185% | | | | $(1,135) | | | | $25,255 | | | | $26,390 |
GBP | | 120 | | | | | 05/08/32 | | | | | | 1.150%(A) | | | | | 1 Day SONIA(1)(A)/5.185% | | | | 6,840 | | | | 36,141 | | | | 29,301 |
| | 9,300 | | | | | 08/31/24 | | | | | | 5.384%(T) | | | | | 1 Day SOFR(2)(T)/5.310% | | | | — | | | | 2,249 | | | | 2,249 |
| | 1,272 | | | | | 03/08/25 | | | | | | 4.946%(A) | | | | | 1 Day SOFR(2)(A)/5.310% | | | | — | | | | (2,751) | | | | (2,751) |
| | 1,696 | | | | | 03/09/25 | | | | | | 5.110%(A) | | | | | 1 Day SOFR(2)(A)/5.310% | | | | — | | | | 1,684 | | | | 1,684 |
| | 4,795 | | | | | 08/31/25 | | | | | | 4.805%(A) | | | | | 1 Day SOFR(1)(A)/5.310% | | | | — | | | | (2,416) | | | | (2,416) |
| | | | | | | | | | | | | | | | | | | | | | | | | | | | | | |
| | | | | | | | | | | | | | | | | | | | | | $ 5,705 | | | | $60,162 | | | | $54,457 |
| | | | | | | | | | | | | | | | | | | | | | | | | | | | | | |
| (1) | The Fund pays the fixed rate and receives the floating rate. |
| (2) | The Fund pays the floating rate and receives the fixed rate. |
See Notes to Financial Statements.
196
PGIM Total Return Bond ETF
Schedule of Investments (continued)
as of August 31, 2023
Total return swap agreements outstanding at August 31, 2023:
| | | | | | | | | | | | | | | | | | | | | | | | | | | | | | | | | | | |
Reference Entity | | Financing
Rate | | Counterparty | | Termination
Date | | Long
(Short)
Notional
Amount
(000)#(1) | | Fair
Value | | Upfront
Premiums
Paid
(Received) | | Unrealized
Appreciation
(Depreciation)(2) |
OTC Total Return Swap Agreements: | | | | | | | | | | | | | | | | | | | | | | | | | | | | | | | | | | | |
Total Return Benchmark Bond Index(T)†† | | |
| 1 Day USOIS
-54bps(T)/
4.790% |
| | | | JPM | | | | | 09/20/23 | | | | | (1,775 | ) | | | $ | 66,018 | | | | $ | — | | | | $ | 66,018 | |
U.S. Treasury Bond(T) | | |
| 1 Day USOIS
+18bps(T)/
5.510% |
| | | | JPM | | | | | 02/05/24 | | | | | 1,185 | | | | | (24,135 | ) | | | | (5,960 | ) | | | | (18,175 | ) |
U.S. Treasury Bond(T) | | |
| 1 Day USOIS
+18bps(T)/
5.510% |
| | | | JPM | | | | | 02/12/24 | | | | | 2,325 | | | | | (4,894 | ) | | | | (14,560 | ) | | | | 9,666 | |
| | | | | | | | | | | | | | | | | | | | | | | | | | | | | | | | | | | |
| | | | | | | | | | | | | | | | | | | | | | | $ | 36,989 | | | | $ | (20,520 | ) | | | $ | 57,509 | |
| | | | | | | | | | | | | | | | | | | | | | | | | | | | | | | | | | | |
| (1) | On a long total return swap, the Fund receives payments for any positive return on the reference entity (makes payments for any negative return) and pays the financing rate. On a short total return swap, the Fund makes payments for any positive return on the reference entity (receives payments for any negative return) and receives the financing rate. |
| (2) | Upfront/recurring fees or commissions, as applicable, are included in the net unrealized appreciation (depreciation). |
| †† | See the table below for the swap constituents. To the extent that any swap is composed of greater than 50 constituents, the Fund is only required to disclose the top 50. |
The following table represents the top 50 individual positions and related values of underlying securities of Total Return Benchmark Bond Index total return swap with JPM, as of August 31, 2023, termination date 09/20/2023:
Corporate Bond
| | | | | | | | | | |
Reference Entity | | Shares | | | Market
Value | | | % of Total
Index Value |
Sysco Corp. | | | 4,000,000 | | | $ | 4,427,864 | | | 1.56% |
United Parcel Service, Inc. | | | 4,000,000 | | | | 4,046,049 | | | 1.43% |
Morgan Stanley | | | 4,000,000 | | | | 4,023,272 | | | 1.42% |
Northrop Grumman Corp. | | | 4,000,000 | | | | 3,901,715 | | | 1.38% |
FedEx Corp. | | | 4,000,000 | | | | 3,705,428 | | | 1.31% |
Keurig Dr Pepper, Inc. | | | 4,000,000 | | | | 3,658,600 | | | 1.29% |
The Walt Disney Co. | | | 4,000,000 | | | | 3,616,675 | | | 1.28% |
Conagra Brands, Inc. | | | 4,000,000 | | | | 3,616,208 | | | 1.28% |
Wells Fargo & Co. | | | 4,000,000 | | | | 3,601,123 | | | 1.27% |
Intel Corp. | | | 4,000,000 | | | | 3,546,970 | | | 1.25% |
TransCanada PipeLines Ltd. | | | 4,000,000 | | | | 3,538,031 | | | 1.25% |
Cigna Corp. | | | 4,000,000 | | | | 3,532,706 | | | 1.25% |
Telefonica Emisiones, S.A.U. | | | 4,000,000 | | | | 3,519,159 | | | 1.24% |
Fox Corp. | | | 4,000,000 | | | | 3,481,613 | | | 1.23% |
See Notes to Financial Statements.
PGIM Fixed Income ETFs 197
PGIM Total Return Bond ETF
Schedule of Investments (continued)
as of August 31, 2023
Corporate Bond (continued)
| | | | | | | | | | | | |
Reference Entity | | Shares | | | Market
Value | | | % of Total
Index Value | |
ExxonMobil Corp. | | | 4,000,000 | | | $ | 3,465,733 | | | | 1.22% | |
HCA, Inc. | | | 4,000,000 | | | | 3,457,864 | | | | 1.22% | |
Eli Lilly and Co. | | | 4,000,000 | | | | 3,432,793 | | | | 1.21% | |
Bristol-Myers Squibb Co. | | | 4,000,000 | | | | 3,418,766 | | | | 1.21% | |
Deere & Co. | | | 4,000,000 | | | | 3,370,948 | | | | 1.19% | |
Thermo Fisher Scientific, Inc. | | | 4,000,000 | | | | 3,354,810 | | | | 1.18% | |
Johnson & Johnson | | | 4,000,000 | | | | 3,354,042 | | | | 1.18% | |
McDonald’s Corp. | | | 4,000,000 | | | | 3,311,738 | | | | 1.17% | |
T-Mobile USA, Inc. | | | 4,000,000 | | | | 3,298,352 | | | | 1.16% | |
Mastercard, Inc. | | | 4,000,000 | | | | 3,292,978 | | | | 1.16% | |
Fiserv, Inc. | | | 4,000,000 | | | | 3,221,122 | | | | 1.14% | |
Progressive Corp. | | | 4,000,000 | | | | 3,215,007 | | | | 1.13% | |
Bank of America Corp. | | | 4,000,000 | | | | 3,191,350 | | | | 1.13% | |
Enterprise Products Operating LLC | | | 4,000,000 | | | | 3,135,979 | | | | 1.11% | |
Union Electric Co. | | | 4,000,000 | | | | 3,119,750 | | | | 1.10% | |
NVIDIA Corp. | | | 4,000,000 | | | | 3,112,561 | | | | 1.10% | |
Vodafone Group PLC | | | 4,000,000 | | | | 3,078,044 | | | | 1.09% | |
Equinor ASA | | | 4,000,000 | | | | 3,075,800 | | | | 1.08% | |
Nike, Inc. | | | 4,000,000 | | | | 3,062,345 | | | | 1.08% | |
Becton, Dickinson & Co. | | | 4,000,000 | | | | 3,061,886 | | | | 1.08% | |
Humana, Inc. | | | 4,000,000 | | | | 3,039,569 | | | | 1.07% | |
Caterpillar, Inc. | | | 4,000,000 | | | | 3,002,323 | | | | 1.06% | |
Dollar General Corp. | | | 4,000,000 | | | | 2,947,698 | | | | 1.04% | |
Oracle Corp. | | | 4,000,000 | | | | 2,923,590 | | | | 1.03% | |
Carrier Global Corp. | | | 4,000,000 | | | | 2,872,304 | | | | 1.01% | |
The Coca-Cola Co. | | | 4,000,000 | | | | 2,870,199 | | | | 1.01% | |
Global Payments, Inc. | | | 4,000,000 | | | | 2,867,588 | | | | 1.01% | |
Paramount Global | | | 4,000,000 | | | | 2,867,176 | | | | 1.01% | |
Starbucks Corp. | | | 4,000,000 | | | | 2,860,829 | | | | 1.01% | |
Suncor Energy, Inc | | | 4,000,000 | | | | 2,852,857 | | | | 1.01% | |
Dow Chemical Co. | | | 4,000,000 | | | | 2,844,917 | | | | 1.00% | |
Southern California Edison Co. | | | 4,000,000 | | | | 2,832,574 | | | | 1.00% | |
eBay, Inc. | | | 4,000,000 | | | | 2,828,999 | | | | 1.00% | |
Union Pacific Corp. | | | 4,000,000 | | | | 2,814,140 | | | | 0.99% | |
Amazon.com, Inc. | | | 4,000,000 | | | | 2,806,642 | | | | 0.99% | |
Verizon Communications, Inc. | | | 4,000,000 | | | | 2,805,749 | | | | 0.99% | |
| | | | | | | | | | | | |
| | | | | | $ | 163,284,435 | | | | | |
| | | | | | | | | | | | |
See Notes to Financial Statements.
198
PGIM Total Return Bond ETF
Schedule of Investments (continued)
as of August 31, 2023
Balances Reported in the Statement of Assets and Liabilities for OTC Swap Agreements:
| | | | | | | | | | | | | | | | | | | | |
| | | Premiums Paid | | Premiums Received | | Unrealized
Appreciation | | Unrealized
Depreciation |
| | | | |
OTC Swap Agreements | | | $ | — | | | | $ | (20,520 | ) | | | $ | 75,684 | | | | $ | (18,175 | ) |
Summary of Collateral for Centrally Cleared/Exchange-traded Derivatives:
Cash and securities segregated as collateral, including pending settlement for closed positions, to cover requirements for centrally cleared/exchange-traded derivatives are listed by broker as follows:
| | | | | | | | | | |
Broker | | Cash and/or Foreign Currency | | Securities Market Value |
| | |
CGM | | | $ | — | | | | $ | 687,217 | |
JPS | | | | — | | | | | 623,421 | |
| | | | | | | | | | |
Total | | | $ | — | | | | $ | 1,310,638 | |
| | | | | | | | | | |
Fair Value Measurements:
Various inputs are used in determining the value of the Fund’s investments. These inputs are summarized in the three broad levels listed below.
Level 1—unadjusted quoted prices generally in active markets for identical securities.
Level 2—quoted prices for similar securities, interest rates and yield curves, prepayment speeds, foreign currency exchange rates and other observable inputs.
Level 3—unobservable inputs for securities valued in accordance with Board approved fair valuation procedures.
The following is a summary of the inputs used as of August 31, 2023 in valuing such portfolio securities:
| | | | | | | | | | | | | | | |
| | | Level 1 | | Level 2 | | Level 3 |
Investments in Securities | | | | | | | | | | | | | | | |
Assets | | | | | | | | | | | | | | | |
Long-Term Investments | | | | | | | | | | | | | | | |
Asset-Backed Securities | | | | | | | | | | | | | | | |
Automobiles | | | $ | — | | | | $ | 585,496 | | | | $ | — | |
Collateralized Loan Obligations | | | | — | | | | | 22,147,620 | | | | | — | |
Consumer Loans | | | | — | | | | | 891,479 | | | | | — | |
Commercial Mortgage-Backed Securities | | | | — | | | | | 11,697,740 | | | | | — | |
Corporate Bonds | | | | — | | | | | 37,733,046 | | | | | — | |
Municipal Bonds | | | | — | | | | | 198,582 | | | | | — | |
Residential Mortgage-Backed Securities | | | | — | | | | | 3,239,791 | | | | | — | |
Sovereign Bonds | | | | — | | | | | 1,119,029 | | | | | — | |
U.S. Government Agency Obligations | | | | — | | | | | 17,794,349 | | | | | — | |
U.S. Treasury Obligations | | | | — | | | | | 7,027,070 | | | | | — | |
See Notes to Financial Statements.
PGIM Fixed Income ETFs 199
PGIM Total Return Bond ETF
Schedule of Investments (continued)
as of August 31, 2023
| | | | | | | | | | | | | | | |
| | | Level 1 | | Level 2 | | Level 3 |
Investments in Securities (continued) | | | | | | | | | | | | | | | |
Assets (continued) | | | | | | | | | | | | | | | |
Short-Term Investment | | | | | | | | | | | | | | | |
Affiliated Mutual Fund | | | $ | 370,989 | | | | $ | — | | | | $ | — | |
| | | | | | | | | | | | | | | |
| | | |
Total | | | $ | 370,989 | | | | $ | 102,434,202 | | | | $ | — | |
| | | | | | | | | | | | | | | |
| | | |
Other Financial Instruments* | | | | | | | | | | | | | | | |
Assets | | | | | | | | | | | | | | | |
Futures Contracts | | | $ | 172,566 | | | | $ | — | | | | $ | — | |
OTC Forward Foreign Currency Exchange Contracts | | | | — | | | | | 155,177 | | | | | — | |
Centrally Cleared Credit Default Swap Agreement | | | | — | | | | | 38,358 | | | | | — | |
Centrally Cleared Interest Rate Swap Agreements | | | | — | | | | | 59,624 | | | | | — | |
OTC Total Return Swap Agreement | | | | — | | | | | 66,018 | | | | | — | |
| | | | | | | | | | | | | | | |
| | | |
Total | | | $ | 172,566 | | | | $ | 319,177 | | | | $ | — | |
| | | | | | | | | | | | | | | |
| | | |
Liabilities | | | | | | | | | | | | | | | |
Forward Commitment Contract | | | $ | — | | | | $ | (493,515 | ) | | | $ | — | |
Futures Contracts | | | | (19,173 | ) | | | | — | | | | | — | |
OTC Forward Foreign Currency Exchange Contracts | | | | — | | | | | (41,872 | ) | | | | — | |
Centrally Cleared Interest Rate Swap Agreements | | | | — | | | | | (5,167 | ) | | | | — | |
OTC Total Return Swap Agreements | | | | — | | | | | (29,029 | ) | | | | — | |
| | | | | | | | | | | | | | | |
| | | |
Total | | | $ | (19,173 | ) | | | $ | (569,583 | ) | | | $ | — | |
| | | | | | | | | | | | | | | |
| * | Other financial instruments are derivative instruments, with the exception of forward commitment contracts, and are not reflected in the Schedule of Investments. Futures, forwards and centrally cleared swap contracts are recorded at net unrealized appreciation (depreciation) and OTC swap contracts are recorded at fair value. Forward commitment contracts are recorded at market value. |
Industry Classification:
The industry classification of investments and other assets in excess of liabilities shown as a percentage of net assets as of August 31, 2023 were as follows:
| | | | |
Collateralized Loan Obligations | | | 21.4 | % |
U.S. Government Agency Obligations | | | 17.2 | |
Commercial Mortgage-Backed Securities | | | 11.3 | |
Banks | | | 8.9 | |
U.S. Treasury Obligations | | | 6.8 | |
Residential Mortgage-Backed Securities | | | 3.2 | |
Oil & Gas | | | 3.0 | |
Pipelines | | | 3.0 | |
Real Estate Investment Trusts (REITs) | | | 2.1 | |
| | | | |
Healthcare-Services | | | 1.4 | % |
Commercial Services | | | 1.3 | |
Electric | | | 1.2 | |
Media | | | 1.2 | |
Sovereign Bonds | | | 1.1 | |
Telecommunications | | | 1.1 | |
Pharmaceuticals | | | 1.0 | |
Auto Manufacturers | | | 1.0 | |
Consumer Loans | | | 0.9 | |
See Notes to Financial Statements.
200
PGIM Total Return Bond ETF
Schedule of Investments (continued)
as of August 31, 2023
Industry Classification (continued):
| | | | |
Agriculture | | | 0.8 | % |
Mining | | | 0.8 | |
Computers | | | 0.7 | |
Chemicals | | | 0.6 | |
Automobiles | | | 0.6 | |
Foods | | | 0.6 | |
Retail | | | 0.6 | |
Building Materials | | | 0.5 | |
Diversified Financial Services | | | 0.5 | |
Aerospace & Defense | | | 0.5 | |
Packaging & Containers | | | 0.5 | |
Insurance | | | 0.5 | |
Engineering & Construction | | | 0.4 | |
Software | | | 0.4 | |
Airlines | | | 0.4 | |
Entertainment | | | 0.4 | |
Home Builders | | | 0.4 | |
Affiliated Mutual Fund | | | 0.3 | |
Machinery-Diversified | | | 0.3 | |
Trucking & Leasing | | | 0.3 | |
Auto Parts & Equipment | | | 0.3 | |
Biotechnology | | | 0.3 | |
Healthcare-Products | | | 0.2 | |
Semiconductors | | | 0.2 | |
| | | | |
Municipal Bonds | | | 0.2 | % |
Leisure Time | | | 0.2 | |
Office/Business Equipment | | | 0.1 | |
Internet | | | 0.1 | |
Iron/Steel | | | 0.1 | |
Gas | | | 0.1 | |
Transportation | | | 0.1 | |
Lodging | | | 0.1 | |
Miscellaneous Manufacturing | | | 0.1 | |
Distribution/Wholesale | | | 0.1 | |
Apparel | | | 0.1 | |
Electronics | | | 0.0 | * |
Real Estate | | | 0.0 | * |
Housewares | | | 0.0 | * |
Beverages | | | 0.0 | * |
| | | | |
| | | 99.5 | |
Other assets in excess of liabilities | | | 0.5 | |
| | | | |
| |
| | | 100.0 | % |
| | | | |
Effects of Derivative Instruments on the Financial Statements and Primary Underlying Risk Exposure:
The Fund invested in derivative instruments during the reporting period. The primary types of risk associated with these derivative instruments are credit risk, foreign exchange risk and interest rate risk. See the Notes to Financial Statements for additional detail regarding these derivative instruments and their risks. The effect of such derivative instruments on the Fund’s financial position and financial performance as reflected in the Statement of Assets and Liabilities and Statement of Operations is presented in the summary below.
Fair values of derivative instruments as of August 31, 2023 as presented in the Statement of Assets and Liabilities:
| | | | | | | | | | | | |
| | | Asset Derivatives | | | Liability Derivatives | |
| | | | |
Derivatives not accounted for as
hedging instruments, carried at fair value | | Statement of
Assets and
Liabilities Location | | Fair
Value | | | Statement of
Assets and
Liabilities Location | | Fair
Value | |
Credit contracts | | Due from/to broker-variation margin swaps | | $ | 38,358* | | | — | | $ | — | |
See Notes to Financial Statements.
PGIM Fixed Income ETFs 201
PGIM Total Return Bond ETF
Schedule of Investments (continued)
as of August 31, 2023
| | | | | | | | | | | | |
| | | Asset Derivatives | | | Liability Derivatives | |
| | | | |
Derivatives not accounted for as
hedging instruments, carried at
fair value | | Statement of
Assets and
Liabilities Location | | Fair
Value | | | Statement of
Assets and
Liabilities Location | | Fair
Value | |
Foreign exchange contracts | | Unrealized appreciation on OTC forward foreign currency exchange contracts | | $ | 155,177 | | | Unrealized depreciation on OTC forward foreign currency exchange contracts | | $ | 41,872 | |
Interest rate contracts | | Due from/to broker-variation margin futures | | | 172,566 | * | | Due from/to broker-variation margin futures | | | 19,173 | * |
Interest rate contracts | | Due from/to broker-variation margin swaps | | | 59,624 | * | | Due from/to broker-variation margin swaps | | | 5,167 | * |
Interest rate contracts | | — | | | — | | | Premiums received for OTC swap agreements | | | 20,520 | |
Interest rate contracts | | Unrealized appreciation on OTC swap agreements | | | 75,684 | | | Unrealized depreciation on OTC swap agreements | | | 18,175 | |
| | | | | | | | | | | | |
| | | | $ | 501,409 | | | | | $ | 104,907 | |
| | | | | | | | | | | | |
| * | Includes cumulative appreciation (depreciation) as reported in the schedule of open futures and centrally cleared swap contracts. Only unsettled variation margin receivable (payable) is reported within the Statement of Assets and Liabilities. |
The effects of derivative instruments on the Statement of Operations for the year ended August 31, 2023 are as follows:
| | | | | | | | | | | | |
Amount of Realized Gain (Loss) on Derivatives Recognized in Income | |
Derivatives not accounted for as hedging instruments, carried at fair value | | Futures | | | Forward
Currency
Exchange
Contracts | | | Swaps | |
Credit contracts | | $ | — | | | $ | — | | | $ | (106,127 | ) |
Foreign exchange contracts | | | — | | | | (255,360 | ) | | | — | |
Interest rate contracts | | | (1,851,612 | ) | | | — | | | | (150,925 | ) |
| | | | | | | | | | | | |
Total | | $ | (1,851,612 | ) | | $ | (255,360 | ) | | $ | (257,052 | ) |
| | | | | | | | | | | | |
| | | | | | | | | | | | |
Change in Unrealized Appreciation (Depreciation) on Derivatives Recognized in Income | |
Derivatives not accounted for
as hedging instruments, carried at fair value | | Futures | | | Forward
Currency
Exchange
Contracts | | | Swaps | |
Credit contracts | | $ | — | | | $ | — | | | $ | 78,961 | |
See Notes to Financial Statements.
202
PGIM Total Return Bond ETF
Schedule of Investments (continued)
as of August 31, 2023
| | | | | | | | | | | | |
Change in Unrealized Appreciation (Depreciation) on Derivatives Recognized in Income | |
Derivatives not accounted for
as hedging instruments, carried at fair value | | Futures | | | Forward
Currency
Exchange
Contracts | | | Swaps | |
Foreign exchange contracts | | $ | — | | | $ | 25,637 | | | $ | — | |
Interest rate contracts | | | 210,520 | | | | — | | | | 80,572 | |
| | | | | | | | | | | | |
Total | | $ | 210,520 | | | $ | 25,637 | | | $ | 159,533 | |
| | | | | | | | | | | | |
For the year ended August 31, 2023, the Fund’s average volume of derivative activities is as follows:
| | | | |
| Derivative Contract Type | | Average Volume of Derivative Activities* |
Futures Contracts - Long Positions (1) | | $23,531,052 |
Futures Contracts - Short Positions (1) | | 2,817,092 |
Forward Foreign Currency Exchange Contracts - Purchased (2) | | 4,425,655 |
Forward Foreign Currency Exchange Contracts - Sold (2) | | 9,920,787 |
Interest Rate Swap Agreements (1) | | 4,322,389 |
Credit Default Swap Agreements - Sell Protection (1) | | 1,844,000 |
Total Return Swap Agreements (1) | | 4,164,378 |
| * | Average volume is based on average quarter end balances as noted for the year ended August 31, 2023. |
| (1) | Notional Amount in USD. |
| (2) | Value at Settlement Date. |
Financial Instruments/Transactions—Summary of Offsetting and Netting Arrangements:
The Fund invested in OTC derivatives during the reporting period that are either offset in accordance with current requirements or are subject to enforceable master netting arrangements or similar agreements that permit offsetting. The information about offsetting and related netting arrangements for OTC derivatives where the legal right to set-off exists is presented in the summary below.
Offsetting of OTC derivative assets and liabilities:
| | | | | | | | | | | | | | | | | | | | | | | | | |
Counterparty | | Gross Amounts of
Recognized
Assets(1) | | Gross Amounts of
Recognized
Liabilities(1) | | Net Amounts of
Recognized
Assets/(Liabilities) | | Collateral
Pledged/(Received)(2) | | Net Amount |
BNP | | | $ | 1,959 | | | | $ | (227 | ) | | | $ | 1,732 | | | | $ | — | | | | $ | 1,732 | |
BOA | | | | 5,793 | | | | | (1,903 | ) | | | | 3,890 | | | | | — | | | | | 3,890 | |
CITI | | | | 3,916 | | | | | (15,504 | ) | | | | (11,588 | ) | | | | — | | | | | (11,588 | ) |
GSI | | | | 94,087 | | | | | (1,909 | ) | | | | 92,178 | | | | | — | | | | | 92,178 | |
JPM | | | | 87,972 | | | | | (39,510 | ) | | | | 48,462 | | | | | — | | | | | 48,462 | |
MSI | | | | 4,145 | | | | | (19,899 | ) | | | | (15,754 | ) | | | | — | | | | | (15,754 | ) |
See Notes to Financial Statements.
PGIM Fixed Income ETFs 203
PGIM Total Return Bond ETF
Schedule of Investments (continued)
as of August 31, 2023
| | | | | | | | | | | | | | | | | | | | | | | | | |
Counterparty | | Gross Amounts of
Recognized
Assets(1) | | Gross Amounts of
Recognized
Liabilities(1) | | Net Amounts of
Recognized
Assets/(Liabilities) | | Collateral
Pledged/(Received)(2) | | Net Amount |
SSB | | | $ | 8,098 | | | | $ | | (156) | | | $ | 7,942 | | | | $ | — | | | | $ | 7,942 | |
TD | | | | 24,891 | | | | | (1,459 | ) | | | | 23,432 | | | | | — | | | | | 23,432 | |
| | | | | | | | | | | | | | | | | | | | | | | | | |
| | | $ | 230,861 | | | | $ | (80,567 | ) | | | $ | 150,294 | | | | $ | — | | | | $ | 150,294 | |
| | | | | | | | | | | | | | | | | | | | | | | | | |
| (1) | Includes unrealized appreciation/(depreciation) on swaps and forwards, premiums paid/(received) on swap agreements and market value of purchased and written options, as represented on the Statement of Assets and Liabilities. |
| (2) | Collateral amount disclosed by the Fund is limited to the market value of financial instruments/transactions and the Fund’s OTC derivative exposure by counterparty. |
See Notes to Financial Statements.
204
PGIM Total Return Bond ETF
Statement of Assets & Liabilities
as of August 31, 2023
| | | | |
Assets | | | | |
| |
Investments at value: | | | | |
Unaffiliated investments (cost $108,529,628) | | $ | 102,434,202 | |
Affiliated investments (cost $370,989) | | | 370,989 | |
Foreign currency, at value (cost $19,977) | | | 20,046 | |
Receivable for investments sold | | | 1,748,052 | |
Dividends and interest receivable | | | 834,141 | |
Unrealized appreciation on OTC forward foreign currency exchange contracts | | | 155,177 | |
Unrealized appreciation on OTC swap agreements | | | 75,684 | |
Due from broker—variation margin futures | | | 30,144 | |
Tax reclaim receivable | | | 3,512 | |
| | | | |
| |
Total Assets | | | 105,671,947 | |
| | | | |
| |
Liabilities | | | | |
| |
Payable for investments purchased | | | 1,749,621 | |
Forward commitment contracts, at value (proceeds receivable $487,451) | | | 493,515 | |
Management fee payable | | | 42,389 | |
Unrealized depreciation on OTC forward foreign currency exchange contracts | | | 41,872 | |
Premiums received for OTC swap agreements | | | 20,520 | |
Unrealized depreciation on OTC swap agreements | | | 18,175 | |
Due to broker—variation margin swaps | | | 11,160 | |
| | | | |
| |
Total Liabilities | | | 2,377,252 | |
| | | | |
| |
Net Assets | | $ | 103,294,695 | |
| | | | |
| | | | |
| | |
Net assets were comprised of: | | | | |
Common stock, at par | | $ | 2,525 | |
Paid-in capital in excess of par | | | 118,643,457 | |
Total distributable earnings (loss) | | | (15,351,287 | ) |
| | | | |
| |
Net assets, August 31, 2023 | | $ | 103,294,695 | |
| | | | |
| |
Net asset value, offering price and redemption price per share. ($103,294,695 ÷ 2,525,000 shares of common stock issued and outstanding) | | $ | 40.91 | |
| | | | |
See Notes to Financial Statements.
PGIM Fixed Income ETFs 205
PGIM Total Return Bond ETF
Statement of Operations
Year Ended August 31, 2023
| | | | |
Net Investment Income (Loss) | | | | |
| |
Income | | | | |
Interest income (net of $1,474 foreign withholding tax) | | $ | 4,165,631 | |
Unaffiliated dividend income | | | 75,353 | |
Affiliated dividend income | | | 36,448 | |
Affiliated income from securities lending, net | | | 63 | |
| | | | |
| |
Total income | | | 4,277,495 | |
| | | | |
| |
Expenses | | | | |
Management fee | | | 430,757 | |
| | | | |
| |
Net investment income (loss) | | | 3,846,738 | |
| | | | |
| |
Realized And Unrealized Gain (Loss) On Investment And Foreign Currency Transactions | | | | |
Net realized gain (loss) on: | | | | |
Investment transactions (including affiliated of $(10)) | | | (4,202,523 | ) |
Futures transactions | | | (1,851,612 | ) |
Forward currency contract transactions | | | (255,360 | ) |
Swap agreement transactions | | | (257,052 | ) |
Foreign currency transactions | | | (30,173 | ) |
| | | | |
| |
| | | (6,596,720 | ) |
| | | | |
Net change in unrealized appreciation (depreciation) on: | | | | |
Investments | | | 1,428,744 | |
Futures | | | 210,520 | |
Forward currency contracts | | | 25,637 | |
Swap agreements | | | 159,533 | |
Foreign currencies | | | 2,880 | |
| | | | |
| |
| | | 1,827,314 | |
| | | | |
| |
Net gain (loss) on investment and foreign currency transactions | | | (4,769,406 | ) |
| | | | |
| |
Net Increase (Decrease) In Net Assets Resulting From Operations | | $ | (922,668 | ) |
| | | | |
See Notes to Financial Statements.
206
PGIM Total Return Bond ETF
Statements of Changes in Net Assets
| | | | | | | | | | | | | | | |
| | | |
| | | Year Ended
August 31, 2023 | | December 02, 2021*
through
August 31, 2022 | | |
Increase (Decrease) in Net Assets | | | | | | | | | | | | | | | |
| | | |
Operations | | | | | | | | | | | | | | | |
Net investment income (loss) | | | $ | 3,846,738 | | | | $ | 1,276,913 | | | | | | |
Net realized gain (loss) on investment and foreign currency transactions | | | | (6,596,720 | ) | | | | (2,712,903 | ) | | | | | |
Net change in unrealized appreciation (depreciation) on investments and foreign currencies | | | | 1,827,314 | | | | | (7,510,541 | ) | | | | | |
| | | | | | | | | | | | | | | |
| | | |
Net increase (decrease) in net assets resulting from operations | | | | (922,668 | ) | | | | (8,946,531 | ) | | | | | |
| | | | | | | | | | | | | | | |
| | | |
Dividends and Distributions | | | | | | | | | | | | | | | |
Distributions from distributable earnings | | | | (4,335,305 | ) | | | | (1,146,783 | ) | | | | | |
| | | | | | | | | | | | | | | |
| | | |
Fund share transactions | | | | | | | | | | | | | | | |
Net proceeds from shares sold (1,100,000 and 2,225,000 shares, respectively) | | | | 45,669,945 | | | | | 105,632,739 | | | | | | |
Cost of shares purchased (800,000 and 0 shares, respectively) | | | | (32,656,702 | ) | | | | — | | | | | | |
| | | | | | | | | | | | | | | |
Net increase (decrease) in net assets from Fund share transactions | | | | 13,013,243 | | | | | 105,632,739 | | | | | | |
| | | | | | | | | | | | | | | |
| | | |
Total increase (decrease) | | | | 7,755,270 | | | | | 95,539,425 | | | | | | |
| | | |
Net Assets: | | | | | | | | | | | | | | | |
Beginning of period | | | | 95,539,425 | | | | | — | | | | | | |
| | | | | | | | | | | | | | | |
| | | |
End of period | | | $ | 103,294,695 | | | | $ | 95,539,425 | | | | | | |
| | | | | | | | | | | | | | | |
| * | Commencement of operations. |
See Notes to Financial Statements.
PGIM Fixed Income ETFs 207
PGIM Total Return Bond ETF
Financial Highlights
| | | | | | | | | | | | | | | |
| | | | | | | | | | | |
| | | Year Ended August 31,
2023 | | December 02, 2021(a)
through August 31,
2022 | | |
| | | | |
| Per Share Operating Performance(b): | | | | | | | | | | | | | | | |
| Net Asset Value, Beginning of Period | | | | $42.94 | | | | | $50.00 | | | | | | |
| Income (loss) from investment operations: | | | | | | | | | | | | | | | |
| Net investment income (loss) | | | | 1.81 | | | | | 0.86 | | | | | | |
| Net realized and unrealized gain (loss) on investment and foreign currency transactions | | | | (1.72 | )(c) | | | | (7.23 | ) | | | | | |
| Total from investment operations | | | | 0.09 | | | | | (6.37 | ) | | | | | |
| Less Dividends and Distributions: | | | | | | | | | | | | | | | |
| Dividends from net investment income | | | | (2.12 | ) | | | | (0.69 | ) | | | | | |
| Net asset value, end of period | | | | $40.91 | | | | | $42.94 | | | | | | |
| Total Return(d): | | | | 0.27 | % | | | | (12.81 | )% | | | | | |
| | | | |
| | | | | | | | | | | | | | | | |
| Ratios/Supplemental Data: | | | | | | | | | | | | | | | |
| Net assets, end of period (000) | | | | $103,295 | | | | | $95,539 | | | | | | |
| Average net assets (000) | | | | $87,917 | | | | | $67,327 | | | | | | |
| Ratios to average net assets(e): | | | | | | | | | | | | | | | |
| Expenses after waivers and/or expense reimbursement | | | | 0.49 | % | | | | 0.49 | %(f) | | | | | |
| Expenses before waivers and/or expense reimbursement | | | | 0.49 | % | | | | 0.49 | %(f) | | | | | |
| Net investment income (loss) | | | | 4.38 | % | | | | 2.54 | %(f) | | | | | |
| Portfolio turnover rate(g) | | | | 194 | % | | | | 150 | % | | | | | |
| (a) | Commencement of operations. |
| (b) | Calculated based on average shares outstanding during the period. |
| (c) | The per share amount of realized and unrealized gain (loss) on investments does not directly correlate to the amounts reported in the Statement of Operations due to the timing of portfolio share transactions in relation to fluctuating market values. |
| (d) | Total return is calculated assuming a purchase of a share on the first day and a sale on the last day of each period reported and includes reinvestment of dividends and distributions, if any. Total returns may reflect adjustments to conform to GAAP. Total returns for periods less than one full year are not annualized. |
| (e) | Does not include expenses of the underlying funds in which the Fund invests. |
| (g) | The Fund’s portfolio turnover rate is calculated in accordance with regulatory requirements, without regard to transactions involving short-term investments, certain derivatives and in-kind transactions (if any). If such transactions were included, the Fund’s portfolio turnover rate may be higher. |
See Notes to Financial Statements.
208
PGIM Floating Rate Income ETF
Schedule of Investments
as of August 31, 2023
| | | | | | | | | | | | |
| | | | |
| Description | | Interest Rate | | Maturity Date | | Principal
Amount
(000)# | | | Value | |
| | | | |
LONG-TERM INVESTMENTS 99.4% | | | | | | | | | | | | |
| | | | |
ASSET-BACKED SECURITIES 9.8% | | | | | | | | | | | | |
| | | | |
Collateralized Loan Obligations | | | | | | | | | | | | |
| | | | |
Atlas Senior Loan Fund Ltd. (United Kingdom), | | | | | | | | | | | | |
Series 2023-21A, Class B, 144A, 3 Month SOFR + 3.000% (Cap N/A, Floor 3.000%) | | 8.326%(c) | | 07/20/35 | | | 275 | | | $ | 275,456 | |
| | | | |
Bain Capital Credit CLO Ltd. (United Kingdom), | | | | | | | | | | | | |
Series 2023-03A, Class B, 144A, 3 Month SOFR + 2.700% (Cap N/A, Floor 2.700%) | | 8.071(c) | | 07/24/36 | | | 625 | | | | 628,765 | |
| | | | |
Balboa Bay Loan Funding Ltd. (Cayman Islands), | | | | | | | | | | | | |
Series 2023-01A, Class B, 144A, 3 Month SOFR + 2.550% (Cap N/A, Floor 2.550%) | | 7.429(c) | | 04/20/35 | | | 250 | | | | 249,303 | |
Series 2023-01A, Class D, 144A, 3 Month SOFR + 5.500% (Cap N/A, Floor 5.500%) | | 10.379(c) | | 04/20/35 | | | 200 | | | | 197,670 | |
| | | | |
Barrow Hanley CLO Ltd. (Cayman Islands), | | | | | | | | | | | | |
Series 2023-02A, Class B, 144A, 3 Month SOFR + 3.000% (Cap N/A, Floor 3.000%) | | 8.339(c) | | 10/20/35 | | | 150 | | | | 150,013 | |
| | | | |
CarVal CLO Ltd. (United Kingdom), | | | | | | | | | | | | |
Series 2023-01A, Class A2, 144A, 3 Month SOFR + 2.350% (Cap N/A, Floor 2.350%) | | 7.676(c) | | 01/20/35 | | | 150 | | | | 149,214 | |
Series 2023-01A, Class B1, 144A, 3 Month SOFR + 2.750% (Cap N/A, Floor 2.750%) | | 8.076(c) | | 01/20/35 | | | 150 | | | | 149,135 | |
| | | | |
Golub Capital Partners CLO Ltd. (United Kingdom), | | | | | | | | | | | | |
Series 2023-68A, Class B, 144A, 3 Month SOFR + 2.800% (Cap N/A, Floor 2.800%) | | 8.197(c) | | 07/25/36 | | | 150 | | | | 150,918 | |
| | | | |
HPS Loan Management Ltd. (Cayman Islands), | | | | | | | | | | | | |
Series 2023-18A, Class B, 144A, 3 Month SOFR + 2.950% (Cap N/A, Floor 2.950%) | | 8.212(c) | | 07/20/36 | | | 100 | | | | 100,624 | |
| | | | |
ICG US CLO Ltd. (United Kingdom), | | | | | | | | | | | | |
Series 2023-01A, Class B, 144A | | 0.000(cc) | | 07/18/36 | | | 500 | | | | 500,084 | |
| | | | |
Logan CLO Ltd. (Cayman Islands), | | | | | | | | | | | | |
Series 2021-02A, Class B, 144A, 3 Month SOFR + 1.962% (Cap N/A, Floor 1.700%) | | 7.288(c) | | 01/20/35 | | | 250 | | | | 247,862 | |
| | | | |
MidOcean Credit CLO (Cayman Islands), | | | | | | | | | | | | |
Series 2017-07A, Class A1R, 144A, 3 Month SOFR + 1.302% (Cap N/A, Floor 0.000%) | | 6.610(c) | | 07/15/29 | | | 221 | | | | 219,342 | |
| | | | |
Mountain View CLO Ltd. (Cayman Islands), | | | | | | | | | | | | |
Series 2015-09A, Class A2R, 144A, 3 Month SOFR + 2.042% (Cap N/A, Floor 0.000%) | | 7.350(c) | | 07/15/31 | | | 250 | | | | 245,142 | |
Series 2023-01A, Class B, 144A, 3 Month SOFR + 3.000% (Cap N/A, Floor 3.000%) | | 0.000(c) | | 09/14/36 | | | 200 | | | | 200,000 | |
See Notes to Financial Statements.
PGIM Fixed Income ETFs 209
PGIM Floating Rate Income ETF
Schedule of Investments (continued)
as of August 31, 2023
| | | | | | | | | | | | | | |
| | | | |
| Description | | Interest Rate | | | Maturity
Date | | Principal
Amount (000)# | | | Value | |
| | | | |
ASSET-BACKED SECURITIES (Continued) | | | | | | | | | | | | | | |
| | | | |
Collateralized Loan Obligations (cont’d.) | | | | | | | | | | | | | | |
| | | | |
Nassau Ltd. (United Kingdom), | | | | | | | | | | | | | | |
Series 2022-01A, Class B, 144A, 3 Month SOFR + 3.620% (Cap N/A, Floor 3.620%) | | | 8.928%(c) | | | 01/15/31 | | | 250 | | | $ | 250,241 | |
OFSI BSL Ltd. (Cayman Islands), | | | | | | | | | | | | | | |
Series 2023-12A, Class AJ, 144A, 3 Month SOFR + 2.900% (Cap N/A, Floor 2.900%) | | | 7.855(c) | | | 01/20/35 | | | 250 | | | | 250,251 | |
Series 2023-12A, Class B, 144A, 3 Month SOFR + 3.150% (Cap N/A, Floor 3.150%) | | | 8.105(c) | | | 01/20/35 | | | 250 | | | | 249,977 | |
Palmer Square CLO Ltd. (Cayman Islands), | | | | | | | | | | | | | | |
Series 2015-01A, Class A2R4, 144A, 3 Month SOFR + 1.962% (Cap N/A, Floor 1.962%) | | | 7.341(c) | | | 05/21/34 | | | 250 | | | | 246,670 | |
Palmer Square Loan Funding Ltd. (Cayman Islands), | | | | | | | | | | | | | | |
Series 2022-03A, Class A2, 144A, 3 Month SOFR + 3.000% (Cap N/A, Floor 3.000%) | | | 8.308(c) | | | 04/15/31 | | | 100 | | | | 100,058 | |
Sound Point CLO Ltd. (United Kingdom), | | | | | | | | | | | | | | |
Series 2022-35A, Class B, 144A, 3 Month SOFR + 3.100% (Cap N/A, Floor 3.100%) | | | 8.451(c) | | | 01/26/36 | | | 300 | | | | 301,800 | |
Sound Point CLO Ltd., | | | | | | | | | | | | | | |
Series 2020-02A, Class DR, 144A, 3 Month SOFR + 3.612% (Cap N/A, Floor 3.350%) | | | 8.963(c) | | | 10/25/34 | | | 250 | | | | 230,675 | |
Symphony CLO Ltd. (Cayman Islands), | | | | | | | | | | | | | | |
Series 2016-18A, Class A1RR, 144A, 3 Month SOFR + 1.362% (Cap N/A, Floor 1.100%) | | | 6.707(c) | | | 07/23/33 | | | 250 | | | | 247,838 | |
Tikehau US CLO Ltd. (Bermuda), | | | | | | | | | | | | | | |
Series 2022-02A, Class B, 144A, 3 Month SOFR + 3.560% (Cap N/A, Floor 3.560%) | | | 8.886(c) | | | 01/20/32 | | | 250 | | | | 250,389 | |
Trinitas CLO Ltd. (Cayman Islands), | | | | | | | | | | | | | | |
Series 2021-15A, Class B1, 144A, 3 Month SOFR + 1.962% (Cap N/A, Floor 1.700%) | | | 7.307(c) | | | 04/22/34 | | | 250 | | | | 243,483 | |
Voya CLO Ltd. (Cayman Islands), | | | | | | | | | | | | | | |
Series 2013-02A, Class A1R, 144A, 3 Month SOFR + 1.232% (Cap N/A, Floor 0.970%) | | | 6.583(c) | | | 04/25/31 | | | 238 | | | | 236,744 | |
Series 2019-03A, Class BR, 144A, 3 Month SOFR + 1.912% (Cap N/A, Floor 1.650%) | | | 7.220(c) | | | 10/17/32 | | | 250 | | | | 246,938 | |
Wellfleet CLO Ltd. (Cayman Islands), | | | | | | | | | | | | | | |
Series 2018-03A, Class A1A, 144A, 3 Month SOFR + 1.512% (Cap N/A, Floor 1.250%) | | | 6.838(c) | | | 01/20/32 | | | 400 | | | | 398,024 | |
| | | | | | | | | | | | | | |
| | | | |
TOTAL ASSET-BACKED SECURITIES
(cost $6,652,066) | | | | | | | | | | | | | 6,716,616 | |
| | | | | | | | | | | | | | |
See Notes to Financial Statements.
210
PGIM Floating Rate Income ETF
Schedule of Investments (continued)
as of August 31, 2023
| | | | | | | | | | | | | | | | |
| | | | |
| Description | | Interest
Rate | | | Maturity
Date | | | Principal
Amount
(000)# | | | Value | |
| | | | |
CONVERTIBLE BOND 0.0% | | | | | | | | | | | | | | | | |
| | | | |
Telecommunications | | | | | | | | | | | | | | | | |
| | | | |
Digicel Group Holdings Ltd. (Jamaica), | | | | | | | | | | | | | | | | |
Sub. Notes, 144A, Cash coupon 7.000% (original cost $763; purchased 03/21/23 - 04/03/23)(f) (cost $762) | | | 7.000% | | | | 09/18/23(oo) | | | | 5 | | | $ | 492 | |
| | | | | | | | | | | | | | | | |
| | | | |
CORPORATE BONDS 11.9% | | | | | | | | | | | | | | | | |
| | | | |
Aerospace & Defense 0.2% | | | | | | | | | | | | | | | | |
| | | | |
Bombardier, Inc. (Canada), | | | | | | | | | | | | | | | | |
Sr. Unsec’d. Notes, 144A | | | 7.875 | | | | 04/15/27 | | | | 125 | | | | 124,687 | |
| | | | |
Airlines 0.1% | | | | | | | | | | | | | | | | |
| | | | |
VistaJet Malta Finance PLC/Vista Management Holding, | | | | | | | | | | | | | | | | |
Inc. (Switzerland), | | | | | | | | | | | | | | | | |
Sr. Unsec’d. Notes, 144A | | | 7.875 | | | | 05/01/27 | | | | 75 | | | | 67,688 | |
| | | | |
Auto Manufacturers 0.1% | | | | | | | | | | | | | | | | |
| | | | |
General Motors Co., | | | | | | | | | | | | | | | | |
Sr. Unsec’d. Notes | | | 5.600 | | | | 10/15/32 | | | | 105 | | | | 101,313 | |
| | | | |
Banks 8.7% | | | | | | | | | | | | | | | | |
| | | | |
Bank of America Corp., | | | | | | | | | | | | | | | | |
Jr. Sub. Notes, Series MM | | | 4.300(ff) | | | | 01/28/25(oo) | | | | 450 | | | | 407,880 | |
Citigroup, Inc., | | | | | | | | | | | | | | | | |
Jr. Sub. Notes | | | 3.875(ff) | | | | 02/18/26(oo) | | | | 400 | | | | 348,287 | |
Jr. Sub. Notes | | | 7.375(ff) | | | | 05/15/28(oo) | | | | 275 | | | | 277,041 | |
Jr. Sub. Notes, Series U | | | 5.000(ff) | | | | 09/12/24(oo) | | | | 500 | | | | 478,435 | |
Jr. Sub. Notes, Series V | | | 4.700(ff) | | | | 01/30/25(oo) | | | | 400 | | | | 359,892 | |
Goldman Sachs Group, Inc. (The), | | | | | | | | | | | | | | | | |
Jr. Sub. Notes, Series U | | | 3.650(ff) | | | | 08/10/26(oo) | | | | 450 | | | | 367,668 | |
Jr. Sub. Notes, Series V | | | 4.125(ff) | | | | 11/10/26(oo) | | | | 600 | | | | 504,883 | |
JPMorgan Chase & Co., | | | | | | | | | | | | | | | | |
Jr. Sub. Notes, Series HH | | | 4.600(ff) | | | | 02/01/25(oo) | | | | 2,350 | | | | 2,207,187 | |
Jr. Sub. Notes, Series II | | | 4.000(ff) | | | | 04/01/25(oo) | | | | 100 | | | | 91,821 | |
U.S. Bancorp, | | | | | | | | | | | | | | | | |
Jr. Sub. Notes | | | 3.700(ff) | | | | 01/15/27(oo) | | | | 500 | | | | 376,065 | |
Wells Fargo & Co., | | | | | | | | | | | | | | | | |
Jr. Sub. Notes, Series BB | | | 3.900(ff) | | | | 03/15/26(oo) | | | | 575 | | | | 509,506 | |
| | | | | | | | | | | | | | | | |
| | | | |
| | | | | | | | | | | | | | | 5,928,665 | |
See Notes to Financial Statements.
PGIM Fixed Income ETFs 211
PGIM Floating Rate Income ETF
Schedule of Investments (continued)
as of August 31, 2023
| | | | | | | | | | | | | | | | |
| | | | |
| Description | | Interest
Rate | | | Maturity
Date | | | Principal
Amount
(000)# | | | Value | |
| | | | |
CORPORATE BONDS (Continued) | | | | | | | | | | | | | | | | |
| | | | |
Building Materials 0.1% | | | | | | | | | | | | | | | | |
| | | | |
Smyrna Ready Mix Concrete LLC, | | | | | | | | | | | | | | | | |
Sr. Sec’d. Notes, 144A | | | 6.000% | | | | 11/01/28 | | | | 70 | | | $ | 67,203 | |
| | | | |
Commercial Services 0.4% | | | | | | | | | | | | | | | | |
| | | | |
Adtalem Global Education, Inc., | | | | | | | | | | | | | | | | |
Sr. Sec’d. Notes, 144A | | | 5.500 | | | | 03/01/28 | | | | 325 | | | | 303,906 | |
| | | | |
Electric 0.8% | | | | | | | | | | | | | | | | |
| | | | |
Calpine Corp., | | | | | | | | | | | | | | | | |
Sr. Unsec’d. Notes, 144A | | | 4.625 | | | | 02/01/29 | | | | 100 | | | | 86,918 | |
Sr. Unsec’d. Notes, 144A | | | 5.000 | | | | 02/01/31 | | | | 150 | | | | 126,975 | |
Vistra Corp., | | | | | | | | | | | | | | | | |
Jr. Sub. Notes, 144A | | | 7.000(ff) | | | | 12/15/26(oo) | | | | 225 | | | | 209,260 | |
Jr. Sub. Notes, 144A | | | 8.000(ff) | | | | 10/15/26(oo) | | | | 100 | | | | 95,898 | |
| | | | | | | | | | | | | | | | |
| | | | |
| | | | | | | | | | | | | | | 519,051 | |
| | | | |
Healthcare-Products 0.1% | | | | | | | | | | | | | | | | |
| | | | |
Medline Borrower LP, | | | | | | | | | | | | | | | | |
Sr. Sec’d. Notes, 144A | | | 3.875 | | | | 04/01/29 | | | | 70 | | | | 60,970 | |
| | | | |
Home Builders 0.0% | | | | | | | | | | | | | | | | |
| | | | |
Ashton Woods USA LLC/Ashton Woods Finance Co., | | | | | | | | | | | | | | | | |
Sr. Unsec’d. Notes, 144A | | | 4.625 | | | | 04/01/30 | | | | 38 | | | | 32,719 | |
| | | | |
Machinery-Diversified 0.1% | | | | | | | | | | | | | | | | |
| | | | |
Chart Industries, Inc., | | | | | | | | | | | | | | | | |
Sr. Sec’d. Notes, 144A | | | 7.500 | | | | 01/01/30 | | | | 80 | | | | 82,040 | |
| | | | |
Media 0.2% | | | | | | | | | | | | | | | | |
| | | | |
Charter Communications Operating LLC/Charter | | | | | | | | | | | | | | | | |
Communications Operating Capital, | | | | | | | | | | | | | | | | |
Sr. Sec’d. Notes | | | 4.400 | | | | 04/01/33 | | | | 75 | | | | 66,014 | |
DISH Network Corp., | | | | | | | | | | | | | | | | |
Sr. Sec’d. Notes, 144A | | | 11.750 | | | | 11/15/27 | | | | 50 | | | | 50,768 | |
| | | | | | | | | | | | | | | | |
| | | | |
| | | | | | | | | | | | | | | 116,782 | |
See Notes to Financial Statements.
212
PGIM Floating Rate Income ETF
Schedule of Investments (continued)
as of August 31, 2023
| | | | | | | | | | | | | | | | |
| | | | |
| Description | | Interest
Rate | | | Maturity
Date | | | Principal
Amount
(000)# | | | Value | |
| | | | |
CORPORATE BONDS (Continued) | | | | | | | | | | | | | | | | |
| | | | |
Oil & Gas 0.2% | | | | | | | | | | | | | | | | |
| | | | |
Hilcorp Energy I LP/Hilcorp Finance Co., | | | | | | | | | | | | | | | | |
Sr. Unsec’d. Notes, 144A | | | 6.250% | | | | 04/15/32 | | | | 100 | | | $ | 91,930 | |
Nabors Industries, Inc., | | | | | | | | | | | | | | | | |
Gtd. Notes, 144A | | | 7.375 | | | | 05/15/27 | | | | 75 | | | | 73,162 | |
| | | | | | | | | | | | | | | | |
| | | | |
| | | | | | | | | | | | | | | 165,092 | |
| | | | |
Packaging & Containers 0.1% | | | | | | | | | | | | | | | | |
| | | | |
Sealed Air Corp., | | | | | | | | | | | | | | | | |
Gtd. Notes, 144A | | | 5.000 | | | | 04/15/29 | | | | 50 | | | | 46,373 | |
Sealed Air Corp./Sealed Air Corp. US, | | | | | | | | | | | | | | | | |
Gtd. Notes, 144A | | | 6.125 | | | | 02/01/28 | | | | 25 | | | | 24,624 | |
| | | | | | | | | | | | | | | | |
| | | | |
| | | | | | | | | | | | | | | 70,997 | |
| | | | |
Pipelines 0.2% | | | | | | | | | | | | | | | | |
| | | | |
Energy Transfer LP, | | | | | | | | | | | | | | | | |
Sr. Unsec’d. Notes | | | 3.750 | | | | 05/15/30 | | | | 75 | | | | 67,031 | |
Targa Resources Corp., | | | | | | | | | | | | | | | | |
Gtd. Notes | | | 4.200 | | | | 02/01/33 | | | | 75 | | | | 66,098 | |
| | | | | | | | | | | | | | | | |
| | | | |
| | | | | | | | | | | | | | | 133,129 | |
| | | | |
Real Estate Investment Trusts (REITs) 0.1% | | | | | | | | | | | | | | | | |
| | | | |
Diversified Healthcare Trust, | | | | | | | | | | | | | | | | |
Gtd. Notes | | | 4.375 | | | | 03/01/31 | | | | 60 | | | | 45,279 | |
| | | | |
Retail 0.1% | | | | | | | | | | | | | | | | |
| | | | |
Gap, Inc. (The), | | | | | | | | | | | | | | | | |
Gtd. Notes, 144A | | | 3.875 | | | | 10/01/31 | | | | 75 | | | | 54,359 | |
| | | | |
Telecommunications 0.4% | | | | | | | | | | | | | | | | |
| | | | |
Digicel Group Holdings Ltd. (Jamaica), | | | | | | | | | | | | | | | | |
Sr. Unsec’d. Notes, 144A, Cash coupon 5.000% and PIK 3.000% (original cost $2,908; purchased 03/21/23 - 03/22/23)(f) | | | 8.000 | | | | 04/01/25(d) | | | | 7 | | | | 1,704 | |
Digicel International Finance Ltd./Digicel International | | | | | | | | | | | | | | | | |
Holdings Ltd. (Jamaica),
Gtd. Notes, 144A (original cost $16,800; purchased 03/15/23)(f) | | | 8.000 | | | | 12/31/26(d) | | | | 80 | | | | 3,900 | |
See Notes to Financial Statements.
PGIM Fixed Income ETFs 213
PGIM Floating Rate Income ETF
Schedule of Investments (continued)
as of August 31, 2023
| | | | | | | | | | | | | | | | |
| | | | |
| Description | | Interest
Rate | | | Maturity
Date | | | Principal
Amount
(000)# | | | Value | |
| | | | |
CORPORATE BONDS (Continued) | | | | | | | | | | | | | | | | |
| | | | |
Telecommunications (cont’d.) | | | | | | | | | | | | | | | | |
|
Digicel International Finance Ltd./Digicel International Holdings Ltd. (Jamaica), (cont’d.) | |
Gtd. Notes, 144A, Cash coupon 6.000% and PIK 7.000% (original cost $63,500; purchased 03/29/23)(f) | | | 13.000% | | | | 12/31/25(d) | | | | 100 | | | $ | 70,750 | |
Sr. Sec’d. Notes, 144A (original cost $184,500; purchased 03/15/23)(f) | | | 8.750 | | | | 05/25/24 | | | | 200 | | | | 181,738 | |
Digicel Ltd. (Jamaica), | | | | | | | | | | | | | | | | |
Gtd. Notes, 144A (original cost $42,000; purchased 03/17/23)(f) | | | 6.750 | | | | 12/31/23(d) | | | | 200 | | | | 9,750 | |
| | | | | | | | | | | | | | | | |
| | | | |
| | | | | | | | | | | | | | | 267,842 | |
| | | | | | | | | | | | | | | | |
| | | | |
TOTAL CORPORATE BONDS
(cost $8,176,089) | | | | | | | | | | | | | | | 8,141,722 | |
| | | | | | | | | | | | | | | | |
| | | | |
FLOATING RATE AND OTHER LOANS 76.9% | | | | | | | | | | | | | | | | |
| | | | |
Advertising 0.4% | | | | | | | | | | | | | | | | |
| | | | |
Terrier Media Buyer, Inc., | | | | | | | | | | | | | | | | |
2021 Refinancing Term B Loans, 3 Month SOFR + 3.600% | | | 8.842(c) | | | | 12/17/26 | | | | 283 | | | | 262,204 | |
| | | | |
Aerospace & Defense 0.9% | | | | | | | | | | | | | | | | |
| | | | |
Barnes Group, Inc., | | | | | | | | | | | | | | | | |
Term Loan | | | — (p) | | | | 08/30/30 | | | | 100 | | | | 100,083 | |
Cobham Ultra U.S. Co-Borrower LLC, | | | | | | | | | | | | | | | | |
Term Loan, 6 Month SOFR + 3.500% | | | 9.363(c) | | | | 08/06/29 | | | | 124 | | | | 123,445 | |
Dynasty Acquisition Co., Inc., 2023 Specified Refinancing Term B-1 Loans, 1 Month SOFR + 4.000% | | | 9.315(c) | | | | 04/06/26 | | | | 96 | | | | 96,216 | |
2023 Specified Refinancing Term B-2 Loan, 1 Month SOFR + 4.000% | | | 9.315(c) | | | | 04/06/26 | | | | 52 | | | | 51,729 | |
TransDigm, Inc., | | | | | | | | | | | | | | | | |
Tranche I Term Loan, 3 Month SOFR + 3.250% | | | 8.492(c) | | | | 08/24/28 | | | | 244 | | | | 244,542 | |
| | | | | | | | | | | | | | | | |
| | | | |
| | | | | | | | | | | | | | | 616,015 | |
See Notes to Financial Statements.
214
PGIM Floating Rate Income ETF
Schedule of Investments (continued)
as of August 31, 2023
| | | | | | | | | | | | | | | | |
| | | | |
| Description | | Interest
Rate | | | Maturity
Date | | | Principal
Amount
(000)# | | | Value | |
| | | | |
FLOATING RATE AND OTHER LOANS (Continued) | | | | | | | | | | | | | | | | |
| | | | |
Agriculture 0.4% | | | | | | | | | | | | | | | | |
| | | | |
Alltech, Inc., | | | | | | | | | | | | | | | | |
Term B Loan, 1 Month SOFR + 4.114%^ | | | 9.446%(c) | | | | 10/13/28 | | | | 150 | | | $ | 146,630 | |
Term Loan, 1 Month SOFR + 3.250% (Cap N/A, Floor 0.000%)^ | | | 3.250(c) | | | | 10/15/26 | | | | 100 | | | | 94,000 | |
| | | | | | | | | | | | | | | | |
| | | | |
| | | | | | | | | | | | | | | 240,630 | |
| | | | |
Airlines 1.8% | | | | | | | | | | | | | | | | |
| | | | |
Air Canada (Canada), | | | | | | | | | | | | | | | | |
Term Loan, 3 Month SOFR + 3.762% | | | 9.128(c) | | | | 08/11/28 | | | | 149 | | | | 148,531 | |
American Airlines, Inc., | | | | | | | | | | | | | | | | |
Initial Term Loan, 3 Month SOFR + 5.012% | | | 10.338(c) | | | | 04/20/28 | | | | 404 | | | | 418,890 | |
Seventh Amendment Extended Term Loan, 3 Month | | | | | | | | | | | | | | | | |
SOFR + 3.178% | | | 8.543(c) | | | | 02/15/28 | | | | 124 | | | | 122,991 | |
Mileage Plus Holdings LLC, | | | | | | | | | | | | | | | | |
Initial Term Loan, 3 Month LIBOR + 5.250% | | | 10.764(c) | | | | 06/21/27 | | | | 160 | | | | 166,660 | |
United Airlines, Inc., | | | | | | | | | | | | | | | | |
Class B Term Loan, 3 Month LIBOR + 3.750% | | | 9.292(c) | | | | 04/21/28 | | | | 395 | | | | 395,633 | |
| | | | | | | | | | | | | | | | |
| | | | |
| | | | | | | | | | | | | | | 1,252,705 | |
| | | | |
Apparel 0.4% | | | | | | | | | | | | | | | | |
| | | | |
Fanatics Commerce Intermediate Holdco LLC, | | | | | | | | | | | | | | | | |
Initial Term Loan, 3 Month SOFR + 3.364% | | | 8.606(c) | | | | 11/24/28 | | | | 298 | | | | 296,990 | |
| | | | |
Auto Manufacturers 0.2% | | | | | | | | | | | | | | | | |
| | | | |
Novae LLC, | | | | | | | | | | | | | | | | |
Tranche B Term Loan, 6 Month SOFR + 5.000% | | | 10.338(c) | | | | 12/22/28 | | | | 125 | | | | 115,333 | |
| | | | |
Auto Parts & Equipment 1.9% | | | | | | | | | | | | | | | | |
| | | | |
Adient US LLC, | | | | | | | | | | | | | | | | |
Term B-1 Loan, 1 Month SOFR + 3.364% | | | 8.696(c) | | | | 04/10/28 | | | | 123 | | | | 123,289 | |
Dexko Global, Inc.,
2023 Incremental Term Loans, 2 Month SOFR + 4.250% | | | 9.601(c) | | | | 10/04/28 | | | | 200 | | | | 195,000 | |
First Lien Closing Date Dollar Term Loan, 3 Month SOFR + 3.750% | | | 9.253(c) | | | | 10/04/28 | | | | 74 | | | | 71,722 | |
First Brands Group LLC,
2022-Ii Incremental Termloan, 6 Month SOFR + 5.000% | | | 10.881(c) | | | | 03/30/27 | | | | 174 | | | | 171,636 | |
See Notes to Financial Statements.
PGIM Fixed Income ETFs 215
PGIM Floating Rate Income ETF
Schedule of Investments (continued)
as of August 31, 2023
| | | | | | | | | | | | | | | | |
| | | | |
| Description | | Interest
Rate | | | Maturity
Date | | | Principal
Amount
(000)# | | | Value | |
| | | | |
FLOATING RATE AND OTHER LOANS (Continued) | | | | | | | | | | | | | | | | |
| | | | |
Auto Parts & Equipment (cont’d.) | | | | | | | | | | | | | | | | |
| | | | |
First Brands Group LLC, (cont’d.) | | | | | | | | | | | | | | | | |
First Lien 2021 Term Loan, 6 Month SOFR + 5.000% | | | 10.881%(c) | | | | 03/30/27 | | | | 99 | | | $ | 97,503 | |
Power Solutions,
2023 Term Loans, 1 Month SOFR + 3.750% | | | 9.081(c) | | | | 05/06/30 | | | | 275 | | | | 274,312 | |
Tenneco, Inc., | | | | | | | | | | | | | | | | |
Term B Loans, 1 Month SOFR + 5.100% | | | 10.445(c) | | | | 11/17/28 | | | | 325 | | | | 275,844 | |
Truck Hero, Inc., | | | | | | | | | | | | | | | | |
Initial Term Loan, 1 Month SOFR + 3.750% | | | 9.196(c) | | | | 01/31/28 | | | | 99 | | | | 95,549 | |
| | | | | | | | | | | | | | | | |
| | | | |
| | | | | | | | | | | | | | | 1,304,855 | |
| | | | |
Banks 0.1% | | | | | | | | | | | | | | | | |
| | | | |
Walker & Dunlop, Inc., | | | | | | | | | | | | | | | | |
Incremental Term B Loan, 1 Month SOFR + 3.100%^ | | | 8.431(c) | | | | 12/16/28 | | | | 50 | | | | 49,875 | |
| | | | |
Beverages 0.4% | | | | | | | | | | | | | | | | |
| | | | |
City Brewing Co. LLC, | | | | | | | | | | | | | | | | |
First Lien Closing Date Term Loan, 3 Month SOFR + 3.762% | | | 9.070(c) | | | | 04/05/28 | | | | 198 | | | | 128,529 | |
Pegasus Bidco BV (Netherlands), | | | | | | | | | | | | | | | | |
Facility Term Loan B2, 3 Month SOFR + 4.250% | | | 9.615(c) | | | | 07/12/29 | | | | 149 | | | | 148,970 | |
| | | | | | | | | | | | | | | | |
| | | | |
| | | | | | | | | | | | | | | 277,499 | |
| | | | |
Building Materials 2.5% | | | | | | | | | | | | | | | | |
| | | | |
Cornerstone Building Brands, Inc., | | | | | | | | | | | | | | | | |
Term Loan, 1 Month SOFR + 5.625% | | | 10.935(c) | | | | 08/01/28 | | | | 323 | | | | 321,596 | |
CP Atlas Buyer, Inc., | | | | | | | | | | | | | | | | |
Term B Loan, 1 Month SOFR + 3.750% | | | 9.181(c) | | | | 11/23/27 | | | | 199 | | | | 190,417 | |
Emerald Borrower LP, | | | | | | | | | | | | | | | | |
Initial Term B Loan, 1 Month SOFR + 3.000% | | | 8.331(c) | | | | 05/31/30 | | | | 475 | | | | 475,000 | |
Hunter Douglas, Inc. (Netherlands), | | | | | | | | | | | | | | | | |
Tranche B-1 Term Loans, 3 Month SOFR + 3.500% | | | 8.891(c) | | | | 02/26/29 | | | | 223 | | | | 215,658 | |
Janus International Group LLC, | | | | | | | | | | | | | | | | |
Amendment No. 6 Refinancing Term Loan, 1 Month SOFR + 3.250% | | | 8.668(c) | | | | 07/25/30 | | | | 125 | | | | 124,844 | |
See Notes to Financial Statements.
216
PGIM Floating Rate Income ETF
Schedule of Investments (continued)
as of August 31, 2023
| | | | | | | | | | | | | | | | |
| | | | |
| Description | | Interest
Rate | | | Maturity
Date | | | Principal
Amount
(000)# | | | Value | |
| | | | |
FLOATING RATE AND OTHER LOANS (Continued) | | | | | | | | | | | | | | | | |
| | | | |
Building Materials (cont’d.) | | | | | | | | | | | | | | | | |
| | | | |
Smyrna Ready Mix Concrete LLC, | | | | | | | | | | | | | | | | |
Initial Term Loan, 1 Month SOFR + 4.350%^ | | | 9.419%(c) | | | | 04/02/29 | | | | 99 | | | $ | 99,247 | |
Vector WP HoldCo, Inc., | | | | | | | | | | | | | | | | |
Initial Term B Loan, 1 Month SOFR + 5.000% | | | 10.435(c) | | | | 10/12/28 | | | | 250 | | | | 246,875 | |
| | | | | | | | | | | | | | | | |
| | | | |
| | | | | | | | | | | | | | | 1,673,637 | |
| | | | |
Chemicals 3.5% | | | | | | | | | | | | | | | | |
| | | | |
Ascend Performance Materials Operations LLC, 2021 Refinancing Term Loan, 6 Month SOFR + 4.850% | | | 9.715(c) | | | | 08/27/26 | | | | 362 | | | | 353,140 | |
Chemours Company (The), | | | | | | | | | | | | | | | | |
Tanche B-3 USD Term Loans, 1 Month SOFR + 3.500% | | | 8.831(c) | | | | 08/18/28 | | | | 73 | | | | 71,322 | |
Cyanco Intermediate 2 Corp., | | | | | | | | | | | | | | | | |
Term Loan B, 1 Month SOFR + 4.750% | | | 10.081(c) | | | | 07/10/28 | | | | 200 | | | | 200,250 | |
DuBois Chemicals Group, Inc., | | | | | | | | | | | | | | | | |
First Lien Initial Term Loan, 1 Month SOFR + 4.600% | | | 9.931(c) | | | | 09/30/26 | | | | 198 | | | | 195,129 | |
Geon Performance Solutions LLC, | | | | | | | | | | | | | | | | |
Initial Term Loan, 3 Month LIBOR + 4.500% | | | 10.038(c) | | | | 08/18/28 | | | | 298 | | | | 294,880 | |
Ineos Finance PLC (Luxembourg),
2030 Dollar Term Loans, 1 Month SOFR + 3.600% | | | 8.931(c) | | | | 02/18/30 | | | | 75 | | | | 74,456 | |
Ineos US Petrochem LLC,
2026 Tranche B Dollar Term Loan, 1 Month SOFR + 2.864% | | | 8.196(c) | | | | 01/29/26 | | | | 49 | | | | 49,000 | |
2030 Tranche B Dollar Term Loan, 1 Month SOFR + 3.850%^ | | | 9.181(c) | | | | 03/14/30 | | | | 75 | | | | 74,250 | |
Iris Holdings Ltd., | | | | | | | | | | | | | | | | |
Initial Term Loan, 3 Month SOFR + 4.750% | | | 10.219(c) | | | | 06/28/28 | | | | 129 | | | | 115,827 | |
Kraton Corp., | | | | | | | | | | | | | | | | |
Initial Dollar Term Loan, 3 Month SOFR + 3.250% | | | 8.766(c) | | | | 03/15/29 | | | | 100 | | | | 97,771 | |
LSF11 A5 HoldCo, LLC, | | | | | | | | | | | | | | | | |
Incremental Term Loan, 1 Month SOFR + 4.350% | | | 9.681(c) | | | | 10/15/28 | | | | 65 | | | | 64,724 | |
Term Loans, 1 Month SOFR + 3.614% | | | 8.946(c) | | | | 10/15/28 | | | | 114 | | | | 112,498 | |
Nouryon Finance BV, 2023 Term Loan, 3 Month SOFR + 4.100% | | | 9.347(c) | | | | 04/03/28 | | | | 100 | | | | 99,687 | |
Extended Dollar Term Loan, 3 Month SOFR + 4.100% | | | 9.318(c) | | | | 04/03/28 | | | | 49 | | | | 49,082 | |
Olympus Water US Holding Corp., 2022 Incremental Term Loan, 3 Month SOFR + 4.600% | | | 9.842(c) | | | | 11/09/28 | | | | 98 | | | | 96,762 | |
See Notes to Financial Statements.
PGIM Fixed Income ETFs 217
PGIM Floating Rate Income ETF
Schedule of Investments (continued)
as of August 31, 2023
| | | | | | | | | | | | | | | | |
| | | | |
| Description | | Interest
Rate | | | Maturity
Date | | | Principal
Amount
(000)# | | | Value | |
| | | | |
FLOATING RATE AND OTHER LOANS (Continued) | | | | | | | | | | | | | | | | |
| | | | |
Chemicals (cont’d.) | | | | | | | | | | | | | | | | |
| | | | |
Olympus Water US Holding Corp., (cont’d.) | | | | | | | | | | | | | | | | |
Initial Dollar Term Loan, 3 Month SOFR + 4.012% | | | 9.253%(c) | | | | 11/09/28 | | | | 99 | | | $ | 97,238 | |
Tronox Finance LLC, | | | | | | | | | | | | | | | | |
First Lien 2022 Incremental Term Loan, 3 Month | | | | | | | | | | | | | | | | |
SOFR + 3.250% | | | 8.492(c) | | | | 04/04/29 | | | | 74 | | | | 72,989 | |
First Lien Term Loan B, 1 Month SOFR + 2.614% | | | 7.946(c) | | | | 03/10/28 | | | | 166 | | | | 162,888 | |
Vantage Specialty Chemicals, Inc., | | | | | | | | | | | | | | | | |
First Lien 2023 Other Term Loan, 1 Month SOFR + 4.750% | | | 10.064(c) | | | | 10/26/26 | | | | 100 | | | | 96,266 | |
| | | | | | | | | | | | | | | | |
| | | | |
| | | | | | | | | | | | | | | 2,378,159 | |
| | | | |
Commercial Services 8.1% | | | | | | | | | | | | | | | | |
| | | | |
AG Group Holdings, Inc., | | | | | | | | | | | | | | | | |
Initial Term Loan, 1 Month SOFR + 4.000%^ | | | 9.331(c) | | | | 12/29/28 | | | | 74 | | | | 71,609 | |
Albion Financing SARL, 2023 Incremental US Dollar Term Loans, 3 Month | | | | | | | | | | | | | | | | |
SOFR + 5.500%^ | | | 10.883(c) | | | | 08/17/26 | | | | 75 | | | | 74,719 | |
AlixPartners LLP, | | | | | | | | | | | | | | | | |
Initial Dollar Term Loan, 1 Month SOFR + 2.864% | | | 8.196(c) | | | | 02/04/28 | | | | 200 | | | | 199,639 | |
Allied Universal Holdco LLC, | | | | | | | | | | | | | | | | |
Amendment No.3 Term Loans, 3 Month SOFR + 4.750% | | | 9.881(c) | | | | 05/12/28 | | | | 200 | | | | 197,667 | |
Term Loan USD, 1 Month SOFR + 3.850% | | | 9.181(c) | | | | 05/12/28 | | | | 75 | | | | 72,673 | |
Amentum Government Services Holdings LLC, | | | | | | | | | | | | | | | | |
Tranche 3 Term Loan, 1 Month SOFR + 4.000% | | | 9.314(c) | | | | 02/15/29 | | | | 223 | | | | 217,795 | |
ArchKey Holdings, Inc., | | | | | | | | | | | | | | | | |
First Lien Initial Term Loan, 3 Month LIBOR + 5.250% | | | 10.834(c) | | | | 06/29/28 | | | | 99 | | | | 98,001 | |
ASGN, Inc., | | | | | | | | | | | | | | | | |
Term Loan | | | — (p) | | | | 08/15/30 | | | | 50 | | | | 50,125 | |
Avis Budget Car Rental LLC, | | | | | | | | | | | | | | | | |
New Tranche B Term Loan, 1 Month SOFR + 1.864% | | | 7.196(c) | | | | 08/06/27 | | | | 297 | | | | 295,294 | |
Belron Finance US LLC (Luxembourg), | | | | | | | | | | | | | | | | |
Dollar Fourth Incremental Loan, 3 Month SOFR + 2.850% | | | 8.160(c) | | | | 04/18/29 | | | | 100 | | | | 99,950 | |
CCRR Parent, Inc., | | | | | | | | | | | | | | | | |
First Lien Initial Term Loan, 1 Month SOFR + 3.750% | | | 9.196(c) | | | | 03/06/28 | | | | 174 | | | | 167,363 | |
CHG Healthcare Services, Inc., | | | | | | | | | | | | | | | | |
Term Loan, 1 Month SOFR + 3.750% | | | 4.250(c) | | | | 09/29/28 | | | | 75 | | | | 74,813 | |
See Notes to Financial Statements.
218
PGIM Floating Rate Income ETF
Schedule of Investments (continued)
as of August 31, 2023
| | | | | | | | | | | | | | | | |
| | | | |
| Description | | Interest
Rate | | | Maturity
Date | | | Principal
Amount
(000)# | | | Value | |
| | | | |
FLOATING RATE AND OTHER LOANS (Continued) | | | | | | | | | | | | | | | | |
| | | | |
Commercial Services (cont’d.) | | | | | | | | | | | | | | | | |
| | | | |
Cimpress PLC, | | | | | | | | | | | | | | | | |
Tranche B-1 Term Loan, 1 Month SOFR + 3.614% | | | 8.946%(c) | | | | 05/17/28 | | | | 249 | | | $ | 245,561 | |
CoreLogic, Inc., | | | | | | | | | | | | | | | | |
First Lien Initial Term Loan, 1 Month SOFR + 3.614% | | | 8.946(c) | | | | 06/02/28 | | | | 352 | | | | 327,403 | |
Electro Rent Corp., | | | | | | | | | | | | | | | | |
Extended Term Loan, 3 Month SOFR + 5.500% | | | 10.830(c) | | | | 11/01/24 | | | | 99 | | | | 95,236 | |
Fly Funding II Sarl (Luxembourg), | | | | | | | | | | | | | | | | |
Term Loan B, 3 Month LIBOR + 1.750% | | | 7.380(c) | | | | 08/11/25 | | | | 537 | | | | 504,893 | |
Indy US Holdco LLC, | | | | | | | | | | | | | | | | |
Fifth Amendment Incremental Term Loan, 1 Month SOFR + 6.250%^ | | | 11.581(c) | | | | 03/06/28 | | | | 355 | | | | 338,137 | |
Kingpin Intermediate Holdings LLC, | | | | | | | | | | | | | | | | |
Amendment No. 8 Term Loan, 1 Month SOFR + 3.500% | | | 8.831(c) | | | | 02/08/28 | | | | 224 | | | | 222,718 | |
Kuehg Corp., | | | | | | | | | | | | | | | | |
Initial Term Loan, 3 Month SOFR + 5.000% | | | 10.242(c) | | | | 06/12/30 | | | | 175 | | | | 174,945 | |
Latham Pool Products, Inc., | | | | | | | | | | | | | | | | |
Initial Term Loans, 3 Month SOFR + 4.150% | | | 9.527(c) | | | | 02/23/29 | | | | 217 | | | | 209,312 | |
Learning Care Group (US) No. 2, Inc., | | | | | | | | | | | | | | | | |
Initial Term Loans, 2 Month SOFR + 4.750% | | | 10.130(c) | | | | 08/11/28 | | | | 150 | | | | 149,719 | |
Mavis Tire Express Services TopCo LP, | | | | | | | | | | | | | | | | |
First Lien Initial Term Loan, 1 Month SOFR + 4.000% | | | 9.446(c) | | | | 05/04/28 | | | | 198 | | | | 197,253 | |
MPH Acquisition Holdings LLC, | | | | | | | | | | | | | | | | |
Initial Term Loan, 3 Month SOFR + 4.512% | | | 9.916(c) | | | | 09/01/28 | | | | 173 | | | | 162,604 | |
NAB Holdings LLC, | | | | | | | | | | | | | | | | |
First Lien Term Loan, 3 Month SOFR + 3.150% | | | 8.392(c) | | | | 11/23/28 | | | | 149 | | | | 148,246 | |
NorthRiver Midstream Finance LP (Canada), | | | | | | | | | | | | | | | | |
Initial Term B Loan, 3 Month SOFR + 3.250% | | | 8.780(c) | | | | 10/01/25 | | | | 200 | | | | 199,571 | |
Omnia Partners, LLC, | | | | | | | | | | | | | | | | |
Initial Term Loan, 3 Month SOFR + 4.250% | | | 9.601(c) | | | | 07/25/30 | | | | 183 | | | | 183,283 | |
Spectrum Group Buyer, Inc., | | | | | | | | | | | | | | | | |
Term Loan B, 6 Month SOFR + 6.500% | | | 11.953(c) | | | | 05/19/28 | | | | 147 | | | | 137,804 | |
Trans Union LLC,
2021 Incremental Term B-6 Loan, 1 Month SOFR + 2.250% | | | 7.696(c) | | | | 12/01/28 | | | | 114 | | | | 113,925 | |
TruGreen LP, | | | | | | | | | | | | | | | | |
Second Refinancing Term Loan (First Lien), 1 Month SOFR + 4.100% | | | 9.431(c) | | | | 11/02/27 | | | | 150 | | | | 142,425 | |
University Support Services LLC (Canada), | | | | | | | | | | | | | | | | |
Initial Term Loans, 1 Month SOFR + 3.350% | | | 8.681(c) | | | | 02/10/29 | | | | 123 | | | | 122,319 | |
See Notes to Financial Statements.
PGIM Fixed Income ETFs 219
PGIM Floating Rate Income ETF
Schedule of Investments (continued)
as of August 31, 2023
| | | | | | | | | | | | | | | | |
| | | | |
| Description | | Interest
Rate | | | Maturity
Date | | | Principal
Amount
(000)# | | | Value | |
| | | | |
FLOATING RATE AND OTHER LOANS (Continued) | | | | | | | | | | | | | | | | |
| | | | |
Commercial Services (cont’d.) | | | | | | | | | | | | | | | | |
| | | | |
VT Topco, Inc., | | | | | | | | | | | | | | | | |
Initial Term Loan, 1 Month SOFR + 4.250% | | | 9.562%(c) | | | | 08/09/30 | | | | 75 | | | $ | 75,250 | |
WMB Holdings, Inc., | | | | | | | | | | | | | | | | |
Tranche B USD Term Loans, 1 Month SOFR + 3.350% | | | 8.681(c) | | | | 11/02/29 | | | | 163 | | | | 163,305 | |
| | | | | | | | | | | | | | | | |
| | | | |
| | | | | | | | | | | | | | | 5,533,557 | |
| | | | |
Computers 2.5% | | | | | | | | | | | | | | | | |
| | | | |
ConvergeOne Holdings Corp., | | | | | | | | | | | | | | | | |
First Lien Initial Term Loan, 6 Month LIBOR + 5.000% | | | 10.372(c) | | | | 01/04/26 | | | | 198 | | | | 119,273 | |
Everi Payments, Inc., | | | | | | | | | | | | | | | | |
Term B Loan, 1 Month SOFR + 2.500% | | | 7.946(c) | | | | 08/03/28 | | | | 123 | | | | 123,237 | |
McAfee Corp., | | | | | | | | | | | | | | | | |
Tranche B-1 Term Loan, 1 Month SOFR + 3.850% | | | 9.168(c) | | | | 03/01/29 | | | | 497 | | | | 485,564 | |
Peraton Corp., | | | | | | | | | | | | | | | | |
First Lien Term B Loan, 1 Month SOFR + 3.850% | | | 9.181(c) | | | | 02/01/28 | | | | 297 | | | | 293,547 | |
Procera Networks, Inc. (Canada), | | | | | | | | | | | | | | | | |
Initial Term Loan (First Lien), 1 Month SOFR + 4.500% | | | 9.946(c) | | | | 10/31/25 | | | | 123 | | | | 104,817 | |
Redstone Holdco LP, | | | | | | | | | | | | | | | | |
First Lien Initial Term Loan, 1 Month SOFR + 4.864% | | | 10.179(c) | | | | 04/27/28 | | | | 61 | | | | 47,478 | |
SonicWall US Holdings, Inc., | | | | | | | | | | | | | | | | |
Term Loan, 1 Month SOFR + 5.000% (Cap N/A, Floor 0.000%) | | | 10.429(c) | | | | 05/16/28 | | | | 175 | | | | 170,844 | |
Tempo Acquisition LLC, | | | | | | | | | | | | | | | | |
Additional Initial Term B-1 Loan, 1 Month SOFR + 3.000% | | | 8.331(c) | | | | 08/31/28 | | | | 25 | | | | 24,900 | |
VeriFone Systems, Inc., | | | | | | | | | | | | | | | | |
First Lien Initial Term Loan, 3 Month SOFR + 4.262% | | | 9.653(c) | | | | 08/20/25 | | | | 347 | | | | 319,780 | |
| | | | | | | | | | | | | | | | |
| | | | |
| | | | | | | | | | | | | | | 1,689,440 | |
| | | | |
Distribution/Wholesale 0.3% | | | | | | | | | | | | | | | | |
| | | | |
AIP RD Buyer Corp.,
2023 Incremental Term Loan, 1 Month SOFR + 5.000%^ | | | 10.331(c) | | | | 12/22/28 | | | | 50 | | | | 49,688 | |
See Notes to Financial Statements.
220
PGIM Floating Rate Income ETF
Schedule of Investments (continued)
as of August 31, 2023
| | | | | | | | | | | | | | | | |
| | | | |
| Description | | Interest
Rate | | | Maturity
Date | | | Principal
Amount
(000)# | | | Value | |
| | | | |
FLOATING RATE AND OTHER LOANS (Continued) | | | | | | | | | | | | | | | | |
| | | | |
Distribution/Wholesale (cont’d.) | | | | | | | | | | | | | | | | |
| | | | |
Gloves Buyer, Inc., | | | | | | | | | | | | | | | | |
Amendment No. 5 First Lien Incremental Term Loans, 1 Month
SOFR + 5.114% | | | 10.446%(c) | | | | 12/29/27 | | | | 45 | | | $ | 43,256 | |
Windsor Holdings III LLC, | | | | | | | | | | | | | | | | |
Dollar Term B Loan, 1 Month SOFR + 4.500% | | | 9.818(c) | | | | 08/01/30 | | | | 140 | | | | 139,358 | |
| | | | | | | | | | | | | | | | |
| | | | |
| | | | | | | | | | | | | | | 232,302 | |
| | | | |
Diversified Financial Services 1.7% | | | | | | | | | | | | | | | | |
| | | | |
Avolon TLB Borrower 1 (US) LLC (Ireland), | | | | | | | | | | | | | | | | |
Term Loan B6, 1 Month SOFR + 2.500% | | | 7.814(c) | | | | 06/22/28 | | | | 103 | | | | 103,013 | |
Castlelake Aviation One DAC, | | | | | | | | | | | | | | | | |
Initial Term Loan, 3 Month LIBOR + 2.750% | | | 8.302(c) | | | | 10/22/26 | | | | 133 | | | | 133,026 | |
Eisner Advisory Group LLC,
2022 Incremental Term Facility, 1 Month SOFR + 5.250% | | | 10.696(c) | | | | 07/28/28 | | | | 125 | | | | 124,312 | |
Hudson River Trading LLC, | | | | | | | | | | | | | | | | |
Term Loan, 3 Month SOFR + 3.262% | | | 8.631(c) | | | | 03/20/28 | | | | 397 | | | | 390,965 | |
LHS Borrower LLC, | | | | | | | | | | | | | | | | |
Initial Term Loan, 1 Month SOFR + 4.850% | | | 10.181(c) | | | | 02/16/29 | | | | 174 | | | | 153,172 | |
VFH Parent LLC, | | | | | | | | | | | | | | | | |
Initial Term Loan, 1 Month SOFR + 3.100% | | | 8.420(c) | | | | 01/13/29 | | | | 242 | | | | 240,114 | |
| | | | | | | | | | | | | | | | |
| | | | |
| | | | | | | | | | | | | | | 1,144,602 | |
| | | | |
Electric 1.0% | | | | | | | | | | | | | | | | |
| | | | |
Generation Bridge Northeast LLC, | | | | | | | | | | | | | | | | |
Term B Loans, 1 Month SOFR + 4.250% | | | 9.564(c) | | | | 08/22/29 | | | | 175 | | | | 174,562 | |
Lightstone HoldCo LLC, | | | | | | | | | | | | | | | | |
Extended Term Loan B, 1 Month SOFR + 5.750% | | | 11.081(c) | | | | 01/29/27 | | | | 353 | | | | 319,679 | |
Extended Term Loan C, 1 Month SOFR + 5.750% | | | 11.081(c) | | | | 01/29/27 | | | | 20 | | | | 18,082 | |
Pike Corp.,
2028-B Term Loans, 1 Month SOFR + 3.500% | | | 8.831(c) | | | | 01/21/28 | | | | 50 | | | | 49,625 | |
Vistra Operations Co. LLC,
2018 Incremental Term Loan, 1 Month SOFR + 1.750% | | | 7.196(c) | | | | 12/31/25 | | | | 99 | | | | 98,444 | |
| | | | | | | | | | | | | | | | |
| | | | |
| | | | | | | | | | | | | | | 660,392 | |
See Notes to Financial Statements.
PGIM Fixed Income ETFs 221
PGIM Floating Rate Income ETF
Schedule of Investments (continued)
as of August 31, 2023
| | | | | | | | | | | | | | | | |
| | | | |
| Description | | Interest
Rate | | | Maturity
Date | | | Principal
Amount
(000)# | | | Value | |
| | | | |
FLOATING RATE AND OTHER LOANS (Continued) | | | | | | | | | | | | | | | | |
| | | | |
Electronics 0.8% | | | | | | | | | | | | | | | | |
| | | | |
II-VI, Inc., | | | | | | | | | | | | | | | | |
Term Loan B, 1 Month SOFR + 2.864% | | | 8.196%(c) | | | | 07/02/29 | | | | 275 | | | $ | 274,033 | |
Ingram Micro, Inc., | | | | | | | | | | | | | | | | |
Initial Term Loan, 3 Month LIBOR + 3.500% | | | 9.038(c) | | | | 06/30/28 | | | | 180 | | | | 179,505 | |
TTM Technologies, Inc., | | | | | | | | | | | | | | | | |
New Term B Loan, 1 Month SOFR + 2.750%^ | | | 8.068(c) | | | | 05/30/30 | | | | 100 | | | | 100,000 | |
| | | | | | | | | | | | | | | | |
| | | | |
| | | | | | | | | | | | | | | 553,538 | |
| | | | |
Energy-Alternate Sources 0.2% | | | | | | | | | | | | | | | | |
| | | | |
WIN Waste Innovations Holdings, Inc., | | | | | | | | | | | | | | | | |
Initial Term Loan, 1 Month SOFR + 2.750% | | | 8.196(c) | | | | 03/24/28 | | | | 123 | | | | 105,838 | |
| | | | |
Engineering & Construction 0.4% | | | | | | | | | | | | | | | | |
| | | | |
Brand Industrial Services, Inc., | | | | | | | | | | | | | | | | |
Tranche B Term Loan, 3 Month SOFR + 5.500% | | | 10.872(c) | | | | 08/01/30 | | | | 75 | | | | 72,356 | |
Brown Group Holding LLC, | | | | | | | | | | | | | | | | |
Incremental Term B-2 Facility, 3 Month SOFR + 3.750% | | | 9.124(c) | | | | 07/02/29 | | | | 150 | | | | 149,789 | |
Rockwood Service Corp., | | | | | | | | | | | | | | | | |
Initial Term Loan, 1 Month LIBOR + 4.000% | | | 9.446(c) | | | | 01/23/27 | | | | 75 | | | | 75,000 | |
| | | | | | | | | | | | | | | | |
| | | | |
| | | | | | | | | | | | | | | 297,145 | |
| | | | |
Entertainment 3.5% | | | | | | | | | | | | | | | | |
| | | | |
Allen Media LLC, | | | | | | | | | | | | | | | | |
Term B Loan, 3 Month SOFR + 5.650% | | | 10.892(c) | | | | 02/10/27 | | | | 362 | | | | 314,070 | |
AP Gaming I LLC, | | | | | | | | | | | | | | | | |
Term B Loans, 3 Month SOFR + 4.000% | | | 9.392(c) | | | | 02/15/29 | | | | 199 | | | | 197,629 | |
Caesars Entertainment, Inc., | | | | | | | | | | | | | | | | |
Term B Loan, 1 Month SOFR + 3.350% | | | 8.681(c) | | | | 02/06/30 | | | | 299 | | | | 299,157 | |
Cinemark USA, Inc., | | | | | | | | | | | | | | | | |
Term Loan, 3 Month SOFR + 3.750% | | | 9.059(c) | | | | 05/24/30 | | | | 225 | | | | 224,133 | |
ECL Entertainment LLC, | | | | | | | | | | | | | | | | |
Term Loan, 1 Month LIBOR + 4.750% | | | 10.081(c) | | | | 08/16/30 | | | | 50 | | | | 50,000 | |
Entain Holdings Gibraltar Ltd., | | | | | | | | | | | | | | | | |
Facility B2, 6 Month SOFR + 3.600% | | | 8.549(c) | | | | 10/31/29 | | | | 249 | | | | 249,311 | |
Golden Entertainment, Inc., | | | | | | | | | | | | | | | | |
Term B1 Facility Term Loan, 1 Month SOFR + 2.850% | | | 8.170(c) | | | | 05/28/30 | | | | 133 | | | | 133,000 | |
See Notes to Financial Statements.
222
PGIM Floating Rate Income ETF
Schedule of Investments (continued)
as of August 31, 2023
| | | | | | | | | | | | | | | | |
| | | | |
| Description | | Interest
Rate | | | Maturity
Date | | | Principal
Amount
(000)# | | | Value | |
| | | | |
FLOATING RATE AND OTHER LOANS (Continued) | | | | | | | | | | | | | | | | |
| | | | |
Entertainment (cont’d.) | | | | | | | | | | | | | | | | |
| | | | |
J&J Ventures Gaming LLC, | | | | | | | | | | | | | | | | |
Initial Term Loan, 3 Month LIBOR + 4.000% | | | 9.538%(c) | | | | 04/26/28 | | | | 98 | | | $ | 93,581 | |
Term Loan | | | — (p) | | | | 04/26/28 | | | | 54 | | | | 50,893 | |
Term Loan | | | — (p) | | | | 04/26/28 | | | | 96 | | | | 91,607 | |
Maverick Gaming LLC, | | | | | | | | | | | | | | | | |
Term Loan B, 3 Month SOFR + 7.500% | | | 13.184(c) | | | | 09/03/26 | | | | 74 | | | | 56,235 | |
Ontario Gaming Gta Ltd. Partnership (Canada), | | | | | | | | | | | | | | | | |
Term B Loan, 2 Month SOFR + 4.250% | | | 9.622(c) | | | | 08/01/30 | | | | 175 | | | | 175,329 | |
Raptor Acquisition Corp., | | | | | | | | | | | | | | | | |
Term B Loan, 3 Month LIBOR + 4.000% | | | 9.520(c) | | | | 11/01/26 | | | | 322 | | | | 322,908 | |
Scientific Games Holdings LP, | | | | | | | | | | | | | | | | |
Initial Dollor Term Loan, 3 Month SOFR + 3.500% | | | 8.768(c) | | | | 04/04/29 | | | | 98 | | | | 97,401 | |
| | | | | | | | | | | | | | | | |
| | | | |
| | | | | | | | | | | | | | | 2,355,254 | |
| | | | |
Environmental Control 1.2% | | | | | | | | | | | | | | | | |
| | | | |
Covanta Holding Corp.,
2023 Incremental Term B Loan, 1 Month SOFR + 3.000% | | | 8.312(c) | | | | 11/30/28 | | | | 116 | | | | 115,358 | |
2023 Incremental Term C Loan, 1 Month SOFR + 3.000% | | | 8.312(c) | | | | 11/30/28 | | | | 9 | | | | 8,652 | |
Filtration Group Corp.,
2023 Extended Dollar Term Loan, 1 Month SOFR + 4.364% | | | 9.696(c) | | | | 10/21/28 | | | | 178 | | | | 176,817 | |
GFL Environmental, Inc. (Canada),
2023 Refinancing Term Loan, 3 Month SOFR + 3.100% | | | 8.469(c) | | | | 05/31/27 | | | | 198 | | | | 198,180 | |
Madison IAQ LLC, | | | | | | | | | | | | | | | | |
Initial Term Loan, 6 Month LIBOR + 3.250% | | | 8.302(c) | | | | 06/21/28 | | | | 302 | | | | 299,599 | |
| | | | | | | | | | | | | | | | |
| | | | |
| | | | | | | | | | | | | | | 798,606 | |
| | | | |
Food Service 0.2% | | | | | | | | | | | | | | | | |
| | | | |
Aramark Services, Inc., | | | | | | | | | | | | | | | | |
US Term B-6 Loan, 1 Month SOFR + 2.614% | | | 7.946(c) | | | | 06/22/30 | | | | 125 | | | | 124,687 | |
See Notes to Financial Statements.
PGIM Fixed Income ETFs 223
PGIM Floating Rate Income ETF
Schedule of Investments (continued)
as of August 31, 2023
| | | | | | | | | | | | | | | | |
| | | | |
| Description | | Interest
Rate | | | Maturity
Date | | | Principal
Amount
(000)# | | | Value | |
| | | | |
FLOATING RATE AND OTHER LOANS (Continued) | | | | | | | | | | | | | | | | |
| | | | |
Foods 0.4% | | | | | | | | | | | | | | | | |
| | | | |
BCPE North Star U.S. Holdco, Inc., | | | | | | | | | | | | | | | | |
First Lien Initial Term Loan, 3 Month SOFR + 4.000% | | | 9.538%(c) | | | | 06/09/28 | | | | 274 | | | $ | 239,828 | |
CHG PPC Parent LLC,
2021-1 US Term Loan, 1 Month SOFR + 3.114%^ | | | 8.446(c) | | | | 12/08/28 | | | | 49 | | | | 48,941 | |
| | | | | | | | | | | | | | | | |
| | | | |
| | | | | | | | | | | | | | | 288,769 | |
| | | | |
Forest Products & Paper 0.3% | | | | | | | | | | | | | | | | |
| | | | |
Domtar Corp., | | | | | | | | | | | | | | | | |
Initial Term Loan, 1 Month SOFR + 5.614% | | | 10.928(c) | | | | 11/30/28 | | | | 196 | | | | 195,217 | |
| | | | |
Hand/Machine Tools 0.1% | | | | | | | | | | | | | | | | |
| | | | |
Alliance Laundry Systems LLC, | | | | | | | | | | | | | | | | |
Initial Term B Loan, 1 Month SOFR + 3.600% | | | 8.907(c) | | | | 10/08/27 | | | | 74 | | | | 74,076 | |
| | | | |
Healthcare-Products 1.0% | | | | | | | | | | | | | | | | |
| | | | |
Bausch & Lomb Corp., | | | | | | | | | | | | | | | | |
Initial Term Loan, 3 Month SOFR + 3.350% | | | 8.592(c) | | | | 05/10/27 | | | | 208 | | | | 203,170 | |
ICU Medical, Inc., | | | | | | | | | | | | | | | | |
Tranche B Term Loan, 3 Month SOFR + 2.650% | | | 7.892(c) | | | | 01/08/29 | | | | 198 | | | | 197,996 | |
Mozart Borrower LP, | | | | | | | | | | | | | | | | |
Initial Dollar Term Loan, 1 Month SOFR + 3.364% | | | 8.696(c) | | | | 10/23/28 | | | | 258 | | | | 257,685 | |
| | | | | | | | | | | | | | | | |
| | | | |
| | | | | | | | | | | | | | | 658,851 | |
| | | | |
Healthcare-Services 3.0% | | | | | | | | | | | | | | | | |
| | | | |
Accelerated Health Systems LLC, | | | | | | | | | | | | | | | | |
Initial Term B Loan, 3 Month SOFR + 4.400% | | | 9.642(c) | | | | 02/15/29 | | | | 333 | | | | 271,449 | |
Charlotte Buyer, | | | | | | | | | | | | | | | | |
Initial Term B Loan, 1 Month SOFR + 5.250% | | | 10.562(c) | | | | 02/11/28 | | | | 267 | | | | 262,739 | |
DaVita, Inc., | | | | | | | | | | | | | | | | |
Tranche B-1 Term Loan, 1 Month SOFR + 1.750% | | | 7.196(c) | | | | 08/12/26 | | | | 147 | | | | 145,402 | |
eResearch Technology, Inc., | | | | | | | | | | | | | | | | |
First Lien Initial Term Loan, 1 Month SOFR + 4.614% | | | 9.946(c) | | | | 02/04/27 | | | | 123 | | | | 120,262 | |
LifePoint Health, Inc., | | | | | | | | | | | | | | | | |
First Lien Term B Loan, 3 Month SOFR + 4.012% | | | 9.377(c) | | | | 11/16/25 | | | | 117 | | | | 115,992 | |
Mamba Purchaser, Inc., | | | | | | | | | | | | | | | | |
Term Loan, 1 Month SOFR + 3.500% | | | 8.946(c) | | | | 10/16/28 | | | | 49 | | | | 49,221 | |
Phoenix Guarantor, Inc., | | | | | | | | | | | | | | | | |
Tranche B-1 Term Loan, 1 Month SOFR + 3.364% | | | 8.696(c) | | | | 03/05/26 | | | | 124 | | | | 122,879 | |
See Notes to Financial Statements.
224
PGIM Floating Rate Income ETF
Schedule of Investments (continued)
as of August 31, 2023
| | | | | | | | | | | | | | | | |
| | | | |
| Description | | Interest
Rate | | | Maturity
Date | | | Principal
Amount
(000)# | | | Value | |
| | | | |
FLOATING RATE AND OTHER LOANS (Continued) | | | | | | | | | | | | | | | | |
| | | | |
Healthcare-Services (cont’d.) | | | | | | | | | | | | | | | | |
| | | | |
Phoenix Guarantor, Inc., (cont’d.) | | | | | | | | | | | | | | | | |
Tranche B3 Term Loan, 1 Month SOFR + 3.614% | | | 8.946%(c) | | | | 03/05/26 | | | | 250 | | | $ | 248,304 | |
Radnet Management, Inc., | | | | | | | | | | | | | | | | |
First Lien Initial Term Loan, 1 Month SOFR + 3.114% | | | 8.446(c) | | | | 04/23/28 | | | | 263 | | | | 262,669 | |
Select Medical Corp., | | | | | | | | | | | | | | | | |
Tranche B-1 Term loan, 1 Month SOFR + 3.000% | | | 8.331(c) | | | | 03/08/27 | | | | 342 | | | | 341,466 | |
Sound Inpatient Physicians, Inc., | | | | | | | | | | | | | | | | |
First Lien Initial Term Loan, 3 Month SOFR + 3.262% | | | 8.631(c) | | | | 06/27/25 | | | | 248 | | | | 132,702 | |
| | | | | | | | | | | | | | | | |
| | | | |
| | | | | | | | | | | | | | | 2,073,085 | |
| | | | |
Holding Companies-Diversified 0.1% | | | | | | | | | | | | | | | | |
| | | | |
Belfor Holdings, Inc., | | | | | | | | | | | | | | | | |
First Lien Tranche B-2 Term Loan, 1 Month SOFR + 4.250%^ | | | 9.581(c) | | | | 04/06/26 | | | | 100 | | | | 99,873 | |
| | | | |
Home Furnishings 0.6% | | | | | | | | | | | | | | | | |
| | | | |
Osmosis Buyer Limited, | | | | | | | | | | | | | | | | |
Initial Term B Loans, 1 Month SOFR + 3.750% | | | 9.062(c) | | | | 07/31/28 | | | | 74 | | | | 74,010 | |
Snap One Holdings Corp., | | | | | | | | | | | | | | | | |
Initial Term Loan, 3 Month SOFR + 4.650% | | | 9.892(c) | | | | 12/08/28 | | | | 199 | | | | 191,029 | |
Weber-Stephen Products LLC, | | | | | | | | | | | | | | | | |
Initial Term B Loan, 1 Month SOFR + 3.364% | | | 8.696(c) | | | | 10/30/27 | | | | 150 | | | | 134,606 | |
| | | | | | | | | | | | | | | | |
| | | | |
| | | | | | | | | | | | | | | 399,645 | |
| | | | |
Household Products/Wares 0.3% | | | | | | | | | | | | | | | | |
| | | | |
Kronos Acquisition Holdings, Inc. (Canada), | | | | | | | | | | | | | | | | |
Tranche B-1 Term Loan, 3 Month SOFR + 4.012% | | | 9.253(c) | | | | 12/22/26 | | | | 209 | | | | 205,862 | |
| | | | |
Housewares 0.3% | | | | | | | | | | | | | | | | |
| | | | |
Lifetime Brands, Inc., | | | | | | | | | | | | | | | | |
Tranche B Term Loan, 1 Month SOFR + 3.614% | | | 8.946(c) | | | | 02/28/25 | | | | 75 | | | | 71,062 | |
SWF Holdings I Corp., | | | | | | | | | | | | | | | | |
Initial Term Loan, 1 Month SOFR + 4.114% | | | 9.446(c) | | | | 10/06/28 | | | | 198 | | | | 164,293 | |
| | | | | | | | | | | | | | | | |
| | | | |
| | | | | | | | | | | | | | | 235,355 | |
See Notes to Financial Statements.
PGIM Fixed Income ETFs 225
PGIM Floating Rate Income ETF
Schedule of Investments (continued)
as of August 31, 2023
| | | | | | | | | | | | | | | | |
| | | | |
| Description | | Interest
Rate | | | Maturity
Date | | | Principal
Amount
(000)# | | | Value | |
| | | | |
FLOATING RATE AND OTHER LOANS (Continued) | | | | | | | | | | | | | | | | |
| | | | |
Insurance 2.2% | | | | | | | | | | | | | | | | |
| | | | |
Acrisure LLC,
2021-1 Additional Term Loan, 1 Month LIBOR + 3.750% | | | 9.196%(c) | | | | 02/15/27 | | | | 347 | | | $ | 339,738 | |
First Lien 2021-2 Additional Term Loan, 1 Month | | | | | | | | | | | | | | | | |
LIBOR + 4.250% | | | 9.696(c) | | | | 02/15/27 | | | | 50 | | | | 49,593 | |
Term Loan B 2020, 1 Month LIBOR + 3.500% | | | 8.946(c) | | | | 02/15/27 | | | | 124 | | | | 121,767 | |
Amwins Group, Inc., | | | | | | | | | | | | | | | | |
February 2023 Incremental Term Loan, 1 Month
SOFR + 2.864% | | | 8.196(c) | | | | 02/19/28 | | | | 80 | | | | 79,500 | |
AmWINS Group, Inc., | | | | | | | | | | | | | | | | |
Term Loan, 1 Month SOFR + 2.364% | | | 7.696(c) | | | | 02/19/28 | | | | 89 | | | | 88,488 | |
Asurion LLC, | | | | | | | | | | | | | | | | |
New B-04 Term Loan, 1 Month SOFR + 5.364% | | | 10.696(c) | | | | 01/20/29 | | | | 200 | | | | 175,214 | |
New B-09 Term Loan, 3 Month LIBOR + 3.250% | | | 8.788(c) | | | | 07/31/27 | | | | 294 | | | | 282,622 | |
New B-10 Term Loan, 1 Month SOFR + 4.100% | | | 9.431(c) | | | | 08/19/28 | | | | 115 | | | | 110,621 | |
New B-11 Term Loan, 1 Month SOFR + 4.350% | | | 9.681(c) | | | | 08/21/28 | | | | 75 | | | | 72,116 | |
Second Lien Term Loan B3, 1 Month SOFR + 5.364% | | | 10.696(c) | | | | 01/31/28 | | | | 50 | | | | 44,600 | |
BroadStreet Partners, Inc., | | | | | | | | | | | | | | | | |
Tranche B-2 Term Loan, 1 Month SOFR + 3.364% | | | 8.696(c) | | | | 01/27/27 | | | | 148 | | | | 147,156 | |
| | | | | | | | | | | | | | | | |
| | | | |
| | | | | | | | | | | | | | | 1,511,415 | |
| | | | |
Internet 1.0% | | | | | | | | | | | | | | | | |
| | | | |
MH Sub I LLC,
2023 May New Term Loans, 1 Month SOFR + 4.250% | | | 9.581(c) | | | | 05/03/28 | | | | 348 | | | | 334,042 | |
NortonLifeLock, Inc., | | | | | | | | | | | | | | | | |
Tranche B Term Loan, 1 Month SOFR + 2.100% | | | 7.431(c) | | | | 09/12/29 | | | | 222 | | | | 221,157 | |
Uber Technologies, Inc.,
2023 Refinancing Term Loan, 3 Month SOFR + 2.750% | | | 8.008(c) | | | | 03/03/30 | | | | 149 | | | | 149,381 | |
| | | | | | | | | | | | | | | | |
| | | | |
| | | | | | | | | | | | | | | 704,580 | |
| | | | |
Investment Companies 0.4% | | | | | | | | | | | | | | | | |
| | | | |
EIG Management Co. LLC, | | | | | | | | | | | | | | | | |
Initial Term Loan, 1 Month SOFR + 3.850% | | | 9.181(c) | | | | 02/24/25 | | | | 123 | | | | 122,910 | |
LSF11 Trinity Bidco, Inc., | | | | | | | | | | | | | | | | |
Initial Term Loan, 1 Month SOFR + 4.500%^ | | | 9.813(c) | | | | 06/14/30 | | | | 150 | | | | 150,000 | |
| | | | | | | | | | | | | | | | |
| | | | |
| | | | | | | | | | | | | | | 272,910 | |
See Notes to Financial Statements.
226
PGIM Floating Rate Income ETF
Schedule of Investments (continued)
as of August 31, 2023
| | | | | | | | | | | | | | | | |
| | | | |
| Description | | Interest
Rate | | | Maturity
Date | | | Principal
Amount
(000)# | | | Value | |
| | | | |
FLOATING RATE AND OTHER LOANS (Continued) | | | | | | | | | | | | | | | | |
| | | | |
Leisure Time 1.8% | | | | | | | | | | | | | | | | |
| | | | |
Alterra Mountain Co., | | | | | | | | | | | | | | | | |
Series B-3 Term Loan, 1 Month SOFR + 3.850% | | | 9.181%(c) | | | | 05/31/30 | | | | 125 | | | $ | 125,000 | |
Arcis Golf LLC, | | | | | | | | | | | | | | | | |
Initial Term Loan, 1 Month SOFR + 4.250% | | | 9.696(c) | | | | 11/24/28 | | | | 60 | | | | 59,886 | |
Term Loan^ | | | —(p) | | | | 11/24/28 | | | | 15 | | | | 14,962 | |
Bombardier Recreational Products, Inc. (Canada),
2020 Replacement Term Loan, 1 Month SOFR + 2.000% | | | 7.431(c) | | | | 05/24/27 | | | | 99 | | | | 98,714 | |
2022-2 Incremental Loan, 1 Month SOFR + 3.500% | | | 8.831(c) | | | | 12/13/29 | | | | 422 | | | | 422,434 | |
Carnival Corp., | | | | | | | | | | | | | | | | |
Initial Advance, 1 Month SOFR + 3.000% | | | 8.317(c) | | | | 08/09/27 | | | | 100 | | | | 99,625 | |
Fender Musical Instruments Corp., | | | | | | | | | | | | | | | | |
Initial Term Loan, 1 Month SOFR + 4.100%^ | | | 9.414(c) | | | | 12/01/28 | | | | 74 | | | | 71,523 | |
Recess Holdings, Inc., | | | | | | | | | | | | | | | | |
New Term Loan, 3 Month SOFR + 4.000%^ | | | 9.383(c) | | | | 03/31/27 | | | | 70 | | | | 69,825 | |
Topgolf Callaway Brands Corp., | | | | | | | | | | | | | | | | |
Initial Term Loan, 1 Month SOFR + 3.600% | | | 8.931(c) | | | | 03/15/30 | | | | 250 | | | | 249,358 | |
| | | | | | | | | | | | | | | | |
| | | | |
| | | | | | | | | | | | | | | 1,211,327 | |
| | | | |
Lodging 0.3% | | | | | | | | | | | | | | | | |
| | | | |
Fertitta Entertainment LLC, | | | | | | | | | | | | | | | | |
Initial B Term Loan, 1 Month SOFR + 4.000% | | | 9.331(c) | | | | 01/26/29 | | | | 74 | | | | 73,316 | |
Travel + Leisure Co.,
2022 Incremental Term Loan, 3 Month SOFR + 4.100% | | | 9.354(c) | | | | 12/14/29 | | | | 150 | | | | 149,750 | |
| | | | | | | | | | | | | | | | |
| | | | |
| | | | | | | | | | | | | | | 223,066 | |
| | | | |
Machinery-Diversified 1.7% | | | | | | | | | | | | | | | | |
| | | | |
Chart Industries, Inc., | | | | | | | | | | | | | | | | |
Amendment No. 3 Term Loan, 1 Month SOFR + 3.850% | | | 9.164(c) | | | | 03/15/30 | | | | 275 | | | | 273,938 | |
Clark Equipment Co. (South Korea), | | | | | | | | | | | | | | | | |
Tranche B Term Loan, 3 Month SOFR + 2.500% | | | 7.742(c) | | | | 04/20/29 | | | | 247 | | | | 247,309 | |
Columbus McKinnon Corp., | | | | | | | | | | | | | | | | |
Initial Term Loan, 3 Month SOFR + 3.012% | | | 8.885(c) | | | | 05/12/28 | | | | 68 | | | | 67,704 | |
CPM Holdings, Inc., | | | | | | | | | | | | | | | | |
First Lien Initial Term Loan, 1 Month SOFR + 3.614% | | | 8.933(c) | | | | 11/17/25 | | | | 74 | | | | 74,031 | |
See Notes to Financial Statements.
PGIM Fixed Income ETFs 227
PGIM Floating Rate Income ETF
Schedule of Investments (continued)
as of August 31, 2023
| | | | | | | | | | | | | | | | |
| | | | |
| Description | | Interest
Rate | | | Maturity
Date | | | Principal
Amount
(000)# | | | Value | |
| | | | |
FLOATING RATE AND OTHER LOANS (Continued) | | | | | | | | | | | | | | | | |
| | | | |
Machinery-Diversified (cont’d.) | | | | | | | | | | | | | | | | |
| | | | |
DXP Enterprises, Inc., | | | | | | | | | | | | | | | | |
Initial Term Loan, 6 Month SOFR + 5.250% | | | 10.444%(c) | | | | 12/23/27 | | | | 50 | | | $ | 49,412 | |
Engineered Machinery Holdings, Inc., | | | | | | | | | | | | | | | | |
Incremental Usd 1St Lien Term Loan, 3 Month LIBOR + 3.750% | | | 9.288(c) | | | | 05/19/28 | | | | 50 | | | | 49,463 | |
Gardner Denver, Inc., | | | | | | | | | | | | | | | | |
New Tranche B-1 Dollar Term Loan, 1 Month SOFR + 1.850% | | | 7.181(c) | | | | 03/01/27 | | | | 74 | | | | 74,011 | |
Hyster-Yale Group, Inc., | | | | | | | | | | | | | | | | |
Term loan B Facility, 1 Month SOFR + 3.614% | | | 8.946(c) | | | | 05/26/28 | | | | 99 | | | | 94,899 | |
Pro Mach Group, Inc., | | | | | | | | | | | | | | | | |
Amendment No. 1 Incremental Term Loan (First Lien),
1 Month SOFR + 5.100%^ | | | 10.431(c) | | | | 08/31/28 | | | | 25 | | | | 25,063 | |
Initial Term Loan, 1 Month SOFR + 4.114% | | | 9.446(c) | | | | 08/31/28 | | | | 64 | | | | 64,258 | |
Project Castle, Inc., | | | | | | | | | | | | | | | | |
Intial Term Loan, 3 Month SOFR + 5.500% | | | 10.566(c) | | | | 06/01/29 | | | | 74 | | | | 64,388 | |
Vertical Midco Gmbh (Germany), | | | | | | | | | | | | | | | | |
Term Loan B, 6 Month SOFR + 3.928% | | | 9.381(c) | | | | 07/31/27 | | | | 99 | | | | 98,523 | |
| | | | | | | | | | | | | | | | |
| | | | |
| | | | | | | | | | | | | | | 1,182,999 | |
| | | | |
Media 4.3% | | | | | | | | | | | | | | | | |
| | | | |
Altice Financing SA (Luxembourg),
2022 Dollar Loan, 3 Month SOFR + 5.000% | | | 10.308(c) | | | | 10/29/27 | | | | 125 | | | | 118,125 | |
Charter Communications Operating LLC, | | | | | | | | | | | | | | | | |
Term Loan B2, 1 Month SOFR + 1.750% | | | 7.104(c) | | | | 02/01/27 | | | | 871 | | | | 866,043 | |
CSC Holdings LLC,
2022 Refinancing Term Loan, 1 Month SOFR + 4.500% | | | 9.810(c) | | | | 01/18/28 | | | | 298 | | | | 280,487 | |
Diamond Sports Group LLC, | | | | | | | | | | | | | | | | |
Second Lien Term Loan | | | 8.025 | | | | 08/24/26 | | | | 397 | | | | 10,255 | |
Entercom Media Corp., | | | | | | | | | | | | | | | | |
Term Loan B-2, 3 Month SOFR + 2.762% | | | 8.131(c) | | | | 11/18/24 | | | | 75 | | | | 33,141 | |
iHeartCommunications, Inc., | | | | | | | | | | | | | | | | |
Incremental B Term Loan, 1 Month LIBOR + 3.250% | | | 8.696(c) | | | | 05/01/26 | | | | 280 | | | | 249,200 | |
Radiate Holdco LLC, | | | | | | | | | | | | | | | | |
Amendment No. 6 Term Loan, 1 Month SOFR + 3.250% | | | 8.696(c) | | | | 09/25/26 | | | | 367 | | | | 300,980 | |
Sinclair Television Group, Inc., | | | | | | | | | | | | | | | | |
Term B-3 Loan, 1 Month SOFR + 3.114% | | | 8.446(c) | | | | 04/01/28 | | | | 198 | | | | 148,591 | |
See Notes to Financial Statements.
228
PGIM Floating Rate Income ETF
Schedule of Investments (continued)
as of August 31, 2023
| | | | | | | | | | | | | | | | |
| | | | |
| Description | | Interest
Rate | | | Maturity
Date | | | Principal
Amount
(000)# | | | Value | |
| | | | |
FLOATING RATE AND OTHER LOANS (Continued) | | | | | | | | | | | | | | | | |
| | | | |
Media (cont’d.) | | | | | | | | | | | | | | | | |
| | | | |
Sinclair Television Group, Inc., (cont’d.) | | | | | | | | | | | | | | | | |
Term Loan B-4, 1 Month SOFR + 3.850% | | | 9.181%(c) | | | | 04/21/29 | | | | 149 | | | $ | 107,374 | |
Univision Communications, Inc.,
2022 Incremental First-Lien Term Loan, 3 Month | | | | | | | | | | | | | | | | |
SOFR + 4.250% | | | 9.492(c) | | | | 06/24/29 | | | | 50 | | | | 49,273 | |
Initial First Lien Term Loan, 1 Month SOFR + 3.364% | | | 8.696(c) | | | | 01/31/29 | | | | 443 | | | | 436,994 | |
Virgin Media Bristol LLC, | | | | | | | | | | | | | | | | |
Facility Y, 6 Month SOFR + 3.350% | | | 8.311(c) | | | | 03/31/31 | | | | 120 | | | | 118,500 | |
WideOpenWest Finance LLC, | | | | | | | | | | | | | | | | |
Term B Loan, 3 Month SOFR + 3.000% | | | 8.242(c) | | | | 12/20/28 | | | | 197 | | | | 194,860 | |
| | | | | | | | | | | | | | | | |
| | | | |
| | | | | | | | | | | | | | | 2,913,823 | |
| | | | |
Metal Fabricate/Hardware 1.6% | | | | | | | | | | | | | | | | |
| | | | |
AZZ, Inc., | | | | | | | | | | | | | | | | |
Initial Term Loan, 1 Month SOFR + 3.750% | | | 9.081(c) | | | | 05/11/29 | | | | 348 | | | | 348,537 | |
Crosby U.S. Acquisition Corp., | | | | | | | | | | | | | | | | |
First Lien Initial Term Loan, 1 Month SOFR + 4.850% | | | 10.164(c) | | | | 06/26/26 | | | | 99 | | | | 98,550 | |
Grinding Media, Inc., | | | | | | | | | | | | | | | | |
First Lien Initial Term Loan, 3 Month SOFR + 4.262% | | | 9.530(c) | | | | 10/12/28 | | | | 486 | | | | 474,837 | |
Tank Holding Corp.,
2023 Incremental Term Loan, 1 Month SOFR + 6.100% | | | 11.415(c) | | | | 03/31/28 | | | | 49 | | | | 47,656 | |
WireCo WorldGroup, Inc., | | | | | | | | | | | | | | | | |
Initial Term Loan, 1 Month SOFR + 4.364% | | | 9.678(c) | | | | 11/13/28 | | | | 136 | | | | 135,267 | |
| | | | | | | | | | | | | | | | |
| | | | |
| | | | | | | | | | | | | | | 1,104,847 | |
| | | | |
Mining 0.4% | | | | | | | | | | | | | | | | |
| | | | |
Arsenal Aic Parent LLC, | | | | | | | | | | | | | | | | |
Term B Loans, 1 Month SOFR + 4.500% | | | 9.879(c) | | | | 08/19/30 | | | | 300 | | | | 299,925 | |
| | | | |
Miscellaneous Manufacturing 0.5% | | | | | | | | | | | | | | | | |
| | | | |
Gates Global LLC, | | | | | | | | | | | | | | | | |
Initial B-4 Dollar Term Loan, 1 Month SOFR + 3.500% | | | 8.831(c) | | | | 11/16/29 | | | | 248 | | | | 248,210 | |
Momentive Performance Materials, Inc., | | | | | | | | | | | | | | | | |
Initial Term Loan, 1 Month SOFR + 4.500% | | | 9.831(c) | | | | 03/29/28 | | | | 120 | | | | 118,403 | |
| | | | | | | | | | | | | | | | |
| | | | |
| | | | | | | | | | | | | | | 366,613 | |
See Notes to Financial Statements.
PGIM Fixed Income ETFs 229
PGIM Floating Rate Income ETF
Schedule of Investments (continued)
as of August 31, 2023
| | | | | | | | | | | | | | | | |
| | | | |
| Description | | Interest
Rate | | | Maturity
Date | | | Principal
Amount
(000)# | | | Value | |
| | | |
FLOATING RATE AND OTHER LOANS (Continued) | | | | | | | | | | | | | |
| | | | |
Oil & Gas 0.3% | | | | | | | | | | | | | | | | |
| | | | |
Apro LLC, | | | | | | | | | | | | | | | | |
Replacement Term Loan, 3 Month LIBOR + 3.750% | | | 9.246%(c) | | | | 11/14/26 | | | | 173 | | | $ | 172,902 | |
| | | | |
Packaging & Containers 1.4% | | | | | | | | | | | | | | | | |
| | | | |
Charter Next Generation, Inc., | | | | | | | | | | | | | | | | |
Refinancing 2021 Term Loan, 1 Month SOFR + 3.750% | | | 9.196(c) | | | | 12/01/27 | | | | 99 | | | | 97,930 | |
| | | | |
Clydesdale Acquisition Holdings, Inc., | | | | | | | | | | | | | | | | |
Term B Loan, 1 Month SOFR + 4.175% | | | 9.606(c) | | | | 04/13/29 | | | | 139 | | | | 137,462 | |
| | | | |
Graham Packaging Co., Inc., | | | | | | | | | | | | | | | | |
New Term Loan, 1 Month SOFR + 3.000% | | | 8.446(c) | | | | 08/04/27 | | | | 98 | | | | 97,557 | |
| | | | |
LABL, Inc., | | | | | | | | | | | | | | | | |
Initial Dollar Term Loan, 1 Month SOFR + 5.100% | | | 10.431(c) | | | | 10/27/28 | | | | 74 | | | | 73,958 | |
| | | | |
Pactiv Evergreen Group Holdings, Inc., | | | | | | | | | | | | | | | | |
Tranche B-3 U.S. Term Loans, 1 Month SOFR + 3.250% | | | 8.521(c) | | | | 09/25/28 | | | | 99 | | | | 98,641 | |
| | | | |
Pregis TopCo LLC, | | | | | | | | | | | | | | | | |
Facility Incremental Amendment No. 3, 1 Month SOFR + 3.750% | | | 9.196(c) | | | | 07/31/26 | | | | 74 | | | | 74,106 | |
| | | | |
Pretium PKG Holdings, Inc., | | | | | | | | | | | | | | | | |
First Lien Initial Term Loan, 3 Month LIBOR + 4.000% | | | 9.522(c) | | | | 10/02/28 | | | | 172 | | | | 103,915 | |
| | | | |
Proampac PG Borrower LLC,
2020-1 Term Loan, 3 Month LIBOR + 3.750% | | | 9.181(c) | | | | 11/03/25 | | | | 99 | | | | 98,745 | |
| | | | |
Trident TPI Holdings, Inc., | | | | | | | | | | | | | | | | |
First Lien Tranche B-3 Initial Term Loan, 3 Month LIBOR + 4.000% | | | 9.538(c) | | | | 09/15/28 | | | | 99 | | | | 98,198 | |
Tranche B-5 Initial Term Loan, 3 Month SOFR + 4.500% | | | 9.742(c) | | | | 09/15/28 | | | | 99 | | | | 98,778 | |
| | | | | | | | | | | | | | | | |
| | | | |
| | | | | | | | | | | | | | | 979,290 | |
| | | | |
Pharmaceuticals 0.6% | | | | | | | | | | | | | | | | |
| | | | |
Gainwell Acquisition Corp., | | | | | | | | | | | | | | | | |
Term B Loan, 3 Month SOFR + 4.100% | | | 9.342(c) | | | | 10/01/27 | | | | 247 | | | | 242,906 | |
| | | | |
Sharp Midco LLC, | | | | | | | | | | | | | | | | |
Term Loan, 1 Month SOFR + 4.500%^ | | | 9.818(c) | | | | 12/03/28 | | | | 150 | | | | 149,250 | |
| | | | | | | | | | | | | | | | |
| | | | |
| | | | | | | | | | | | | | | 392,156 | |
See Notes to Financial Statements.
230
PGIM Floating Rate Income ETF
Schedule of Investments (continued)
as of August 31, 2023
| | | | | | | | | | | | | | | | |
| | | | |
| Description | | Interest
Rate | | | Maturity
Date | | | Principal
Amount
(000)# | | | Value | |
| | | | |
FLOATING RATE AND OTHER LOANS (Continued) | | | | | | | | | | | | | | | | |
| | | | |
Pipelines 0.7% | | | | | | | | | | | | | | | | |
| | | | |
AL GCX Holdings LLC, | | | | | | | | | | | | | | | | |
Initial Term Loans, 3 Month SOFR + 3.650% | | | 8.931%(c) | | | | 05/17/29 | | | | 189 | | | $ | 188,858 | |
AL NGPL Holdings LLC, | | | | | | | | | | | | | | | | |
Third Amendment Incremental Term Loan, 3 Month SOFR + 3.864% | | | 9.145(c) | | | | 04/13/28 | | | | 50 | | | | 50,000 | |
Prairie ECI Acquiror, LP, | | | | | | | | | | | | | | | | |
Initial Term Loan, 1 Month SOFR + 4.750% | | | 10.181(c) | | | | 03/11/26 | | | | 250 | | | | 249,219 | |
| | | | | | | | | | | | | | | | |
| | | | |
| | | | | | | | | | | | | | | 488,077 | |
| | | | |
Private Equity 0.4% | | | | | | | | | | | | | | | | |
| | | | |
Harbourvest Partners LP, | | | | | | | | | | | | | | | | |
Initial Term Loan, 3 Month SOFR + 3.000% | | | 8.242(c) | | | | 04/22/30 | | | | 250 | | | | 249,687 | |
| | | | |
Real Estate 1.3% | | | | | | | | | | | | | | | | |
| | | | |
Brookfield Property REIT, Inc., | | | | | | | | | | | | | | | | |
Initial Term B Loan, 1 Month SOFR + 2.500% | | | 7.931(c) | | | | 08/27/25 | | | | 493 | | | | 490,192 | |
Cushman & Wakefield US Borrower LLC,
2023-1 Refinancing Term Loan, 1 Month SOFR + 3.350%^ | | | 8.681(c) | | | | 01/31/30 | | | | 106 | | | | 104,195 | |
2023-2 Refinancing Term Loans, 1 Month SOFR + 4.000% | | | 9.331(c) | | | | 01/31/30 | | | | 150 | | | | 148,875 | |
Replacement Term Loan, 1 Month SOFR + 2.864% | | | 8.196(c) | | | | 08/21/25 | | | | 10 | | | | 10,318 | |
Greystar Real Estate Partners, LLC, | | | | | | | | | | | | | | | | |
Term Loan, 1 Month SOFR + 3.750%^ | | | 9.064(c) | | | | 08/21/30 | | | | 150 | | | | 149,625 | |
| | | | | | | | | | | | | | | | |
| | | | |
| | | | | | | | | | | | | | | 903,205 | |
| | | | |
Real Estate Investment Trusts (REITs) 1.4% | | | | | | | | | | | | | | | | |
| | | | |
Blackstone Mortgage Trust, Inc., | | | | | | | | | | | | | | | | |
New Term Loan B, 1 Month SOFR + 2.864% | | | 8.196(c) | | | | 04/23/26 | | | | 99 | | | | 97,008 | |
Term B-4 Loan, 1 Month SOFR + 3.500% | | | 8.831(c) | | | | 05/09/29 | | | | 502 | | | | 493,111 | |
StarWood Property Mortgage LLC, | | | | | | | | | | | | | | | | |
Initial Term Loan, 1 Month SOFR + 2.600% | | | 7.931(c) | | | | 07/26/26 | | | | 347 | | | | 344,689 | |
| | | | | | | | | | | | | | | | |
| | | | |
| | | | | | | | | | | | | | | 934,808 | |
| | | | |
Retail 4.6% | | | | | | | | | | | | | | | | |
| | | | |
Dave & Buster’s, Inc., | | | | | | | | | | | | | | | | |
Cov-Lite Term Loan, 1 Month SOFR + 3.750% | | | 9.188(c) | | | | 06/29/29 | | | | 199 | | | | 198,582 | |
See Notes to Financial Statements.
PGIM Fixed Income ETFs 231
PGIM Floating Rate Income ETF
Schedule of Investments (continued)
as of August 31, 2023
| | | | | | | | | | | | | | | | |
| | | | |
| Description | | Interest
Rate | | | Maturity
Date | | | Principal
Amount
(000)# | | | Value | |
| | | | |
FLOATING RATE AND OTHER LOANS (Continued) | | | | | | | | | | | | | | | | |
| | | | |
Retail (cont’d.) | | | | | | | | | | | | | | | | |
| | | | |
EG America LLC (United Kingdom), | | | | | | | | | | | | | | | | |
New Term Loan B, 1 Month SOFR + 4.250%^ | | | 9.414%(c) | | | | 03/31/26 | | | | 382 | | | $ | 380,973 | |
New Term Loan C, SOFR + 4.364%^ | | | 9.414(c) | | | | 03/31/26 | | | | 99 | | | | 94,490 | |
Term loan tranche C, SOFR + 4.114%^ | | | 9.164(c) | | | | 02/07/25 | | | | 99 | | | | 93,764 | |
Empire Today LLC, | | | | | | | | | | | | | | | | |
Closing Date Term Loan, 1 Month SOFR + 5.114% | | | 10.428(c) | | | | 04/03/28 | | | | 124 | | | | 101,208 | |
Great Outdoors Group LLC, | | | | | | | | | | | | | | | | |
Term B-2 Loan, 1 Month SOFR + 3.864% | | | 9.196(c) | | | | 03/06/28 | | | | 397 | | | | 395,198 | |
Harbor Freight Tools USA, Inc.,
2021 Refinancing Loans, 1 Month SOFR + 2.864% | | | 8.196(c) | | | | 10/19/27 | | | | 199 | | | | 198,033 | |
IRB Holding Corp.,
2022 Replacement Term B Loan, 1 Month SOFR + 3.100% | | | 8.431(c) | | | | 12/15/27 | | | | 74 | | | | 74,031 | |
LBM Acquisition LLC, | | | | | | | | | | | | | | | | |
First Lien Initial Term Loan, 1 Month SOFR + 3.850% | | | 9.181(c) | | | | 12/17/27 | | | | 198 | | | | 192,015 | |
LSF12 Badger Bidco, LLC (United Kingdom), | | | | | | | | | | | | | | | | |
Term Loan^ | | | —(p) | | | | 08/30/30 | | | | 150 | | | | 146,625 | |
Pacific Bells LLC, | | | | | | | | | | | | | | | | |
Initial Term Loan, 3 Month SOFR + 4.500% | | | 10.003(c) | | | | 11/10/28 | | | | 199 | | | | 195,068 | |
Petco Health & Wellness Co., Inc., | | | | | | | | | | | | | | | | |
First Lien Initial Term Loan, 3 Month SOFR + 3.512% | | | 8.753(c) | | | | 03/03/28 | | | | 285 | | | | 283,537 | |
Pilot Travel Centers LLC, | | | | | | | | | | | | | | | | |
Initital Tranche B Term Loan, 1 Month SOFR + 2.100% | | | 7.431(c) | | | | 08/04/28 | | | | 500 | | | | 499,125 | |
Sally Holdings LLC, | | | | | | | | | | | | | | | | |
Term Loan B, 1 Month SOFR + 2.500% | | | 7.831(c) | | | | 02/28/30 | | | | 125 | | | | 124,750 | |
SRS Distribution, Inc.,
2021 Refinancing Term Loan, 1 Month SOFR + 3.614% | | | 8.946(c) | | | | 06/02/28 | | | | 99 | | | | 97,273 | |
White Cap Buyer LLC, | | | | | | | | | | | | | | | | |
Initial Closing Date Term Loan, 1 Month SOFR + 3.750% | | | 9.081(c) | | | | 10/19/27 | | | | 99 | | | | 98,567 | |
| | | | | | | | | | | | | | | | |
| | | | |
| | | | | | | | | | | | | | | 3,173,239 | |
| | | | |
Semiconductors 0.6% | | | | | | | | | | | | | | | | |
| | | | |
Altar Bidco, Inc., | | | | | | | | | | | | | | | | |
Initial Term Loan, 6 Month SOFR + 3.100% | | | 7.542(c) | | | | 02/01/29 | | | | 223 | | | | 221,852 | |
See Notes to Financial Statements.
232
PGIM Floating Rate Income ETF
Schedule of Investments (continued)
as of August 31, 2023
| | | | | | | | | | | | | | | | |
| | | | |
| Description | | Interest
Rate | | | Maturity
Date | | | Principal
Amount
(000)# | | | Value | |
| | | | |
FLOATING RATE AND OTHER LOANS (Continued) | | | | | | | | | | | | | | | | |
| | | | |
Semiconductors (cont’d.) | | | | | | | | | | | | | | | | |
| | | | |
Entegris, Inc., | | | | | | | | | | | | | | | | |
Tranche B Term Loan, 3 Month SOFR + 2.750% | | | 8.036%(c) | | | | 07/06/29 | | | | 72 | | | $ | 71,512 | |
Natel Engineering Co., Inc., | | | | | | | | | | | | | | | | |
Initial Term Loan, 1 Month SOFR + 6.364% | | | 11.573(c) | | | | 04/30/26 | | | | 149 | | | | 115,482 | |
| | | | | | | | | | | | | | | | |
| | | | |
| | | | | | | | | | | | | | | 408,846 | |
| | | | |
Software 5.4% | | | | | | | | | | | | | | | | |
| | | | |
Applovin Corp., | | | | | | | | | | | | | | | | |
Initial Term Loan, 1 Month SOFR + 3.100% | | | 8.412(c) | | | | 08/14/30 | | | | 150 | | | | 149,571 | |
athenahealth, Inc., | | | | | | | | | | | | | | | | |
Initial Term Loan, 1 Month SOFR + 3.500% | | | 8.820(c) | | | | 02/15/29 | | | | 478 | | | | 469,927 | |
Boxer Parent Co., Inc.,
2021 Replacement Dollar Term Loan, 1 Month SOFR + 3.750% | | | 9.196(c) | | | | 10/02/25 | | | | 98 | | | | 98,325 | |
Second Lien Incremental Term Loan, 1 Month SOFR + 5.614% | | | 10.946(c) | | | | 02/27/26 | | | | 125 | | | | 123,125 | |
Bracket Intermediate Holding Corp.,
2023 Refinancing Term Loans, 1 Month SOFR + 5.000% | | | 10.417(c) | | | | 05/08/28 | | | | 149 | | | | 148,131 | |
Cloudera, Inc., | | | | | | | | | | | | | | | | |
Term Loan, 1 Month SOFR + 3.850% | | | 9.181(c) | | | | 10/08/28 | | | | 212 | | | | 205,829 | |
Cornerstone OnDemand, Inc., | | | | | | | | | | | | | | | | |
Initial Term Loan, 3 Month SOFR + 4.012% | | | 9.253(c) | | | | 10/16/28 | | | | 198 | | | | 188,095 | |
CT Technologies Intermediate Holdings, Inc., | | | | | | | | | | | | | | | | |
Term Loan 2021 Reprice, 1 Month SOFR + 4.250% | | | 9.696(c) | | | | 12/16/25 | | | | 149 | | | | 140,030 | |
Dun & Bradstreet Corp.,
2022 Incremental Term B-2 Loans, 1 Month SOFR + 3.000% | | | 8.320(c) | | | | 01/18/29 | | | | 247 | | | | 246,963 | |
EagleView Technology Corp., | | | | | | | | | | | | | | | | |
First Lien Term Loan, 3 Month LIBOR + 3.500% | | | 9.038(c) | | | | 08/14/25 | | | | 99 | | | | 87,850 | |
Finastra USA, Inc., | | | | | | | | | | | | | | | | |
Dollar Term Loan (Second Lien), 6 Month LIBOR + 7.250% | | | 12.981(c) | | | | 06/13/25 | | | | 325 | | | | 324,594 | |
First Lien Dollar Term Loan, 6 Month LIBOR + 3.500% | | | 9.231(c) | | | | 06/13/24 | | | | 444 | | | | 443,116 | |
Greeneden U.S. Holdings II LLC, | | | | | | | | | | | | | | | | |
B-4 Dollar Term Loan, 1 Month SOFR + 4.114% | | | 9.446(c) | | | | 12/01/27 | | | | 74 | | | | 73,993 | |
Indicor LLC, | | | | | | | | | | | | | | | | |
Initial Dollar Term Loan, 3 Month SOFR + 4.500% | | | 9.742(c) | | | | 11/22/29 | | | | 50 | | | | 49,893 | |
See Notes to Financial Statements.
PGIM Fixed Income ETFs 233
PGIM Floating Rate Income ETF
Schedule of Investments (continued)
as of August 31, 2023
| | | | | | | | | | | | | | | | |
| | | | |
| Description | | Interest
Rate | | | Maturity
Date | | | Principal
Amount
(000)# | | | Value | |
| | | | |
FLOATING RATE AND OTHER LOANS (Continued) | | | | | | | | | | | | | | | | |
| | | | |
Software (cont’d.) | | | | | | | | | | | | | | | | |
| | | | |
Polaris Newco LLC, | | | | | | | | | | | | | | | | |
First Lien Dollar Term Loan, 3 Month LIBOR + 4.000% | | | 9.538%(c) | | | | 06/02/28 | | | | 258 | | | $ | 249,511 | |
Red Planet Borrower LLC, | | | | | | | | | | | | | | | | |
First Lien Initial Term Loan, 1 Month SOFR + 3.850% | | | 9.181(c) | | | | 10/02/28 | | | | 224 | | | | 210,785 | |
Renaissance Holding Corp.,
2023 Term Loan, 1 Month SOFR + 4.750% | | | 9.992(c) | | | | 04/05/30 | | | | 225 | | | | 225,106 | |
Skillsoft Finance II, Inc., | | | | | | | | | | | | | | | | |
Initial Term Loan, 1 Month SOFR + 5.364% | | | 10.677(c) | | | | 07/14/28 | | | | 188 | | | | 172,739 | |
Software AG (Germany), | | | | | | | | | | | | | | | | |
Term Loan^ | | | — (p) | | | | 02/28/33 | | | | 50 | | | | 49,875 | |
| | | | | | | | | | | | | | | | |
| | | | |
| | | | | | | | | | | | | | | 3,657,458 | |
| | | | |
Telecommunications 5.9% | | | | | | | | | | | | | | | | |
| | | | |
CCI Buyer, Inc., | | | | | | | | | | | | | | | | |
First Lien Initial Term Loan, 3 Month SOFR + 4.000% | | | 9.242(c) | | | | 12/17/27 | | | | 183 | | | | 180,450 | |
CenturyLink, Inc., | | | | | | | | | | | | | | | | |
Term B Loan, 1 Month SOFR + 2.364% | | | 7.696(c) | | | | 03/15/27 | | | | 143 | | | | 92,694 | |
CommScope, Inc., | | | | | | | | | | | | | | | | |
Initial Term Loan, 1 Month SOFR + 3.364% | | | 8.696(c) | | | | 04/06/26 | | | | 199 | | | | 182,569 | |
Connect Finco Sarl (United Kingdom), | | | | | | | | | | | | | | | | |
Amendment No. 1 Refinancing Term Loan, 1 Month SOFR + 3.500% | | | 8.831(c) | | | | 12/11/26 | | | | 178 | | | | 177,189 | |
Crown Subsea Communications Holding, Inc., | | | | | | | | | | | | | | | | |
Initial Term Loan, 1 Month SOFR + 5.114% | | | 10.433(c) | | | | 04/27/27 | | | | 250 | | | | 250,208 | |
Digicel International Finance Ltd. (Jamaica), | | | | | | | | | | | | | | | | |
First Lien Initial Term B Loan, 3 Month LIBOR + 3.250% | | | 8.981(c) | | | | 05/27/24 | | | | 277 | | | | 252,001 | |
Global Tel Link Corp., | | | | | | | | | | | | | | | | |
First Lien Term Loan, 3 Month SOFR + 4.250% | | | 9.769(c) | | | | 11/29/25 | | | | 173 | | | | 162,810 | |
Intelsat Jackson Holdings SA (Luxembourg), | | | | | | | | | | | | | | | | |
Term B Loan, 3 Month SOFR + 4.400% | | | 9.772(c) | | | | 02/01/29 | | | | 637 | | | | 636,377 | |
Intrado Corp., | | | | | | | | | | | | | | | | |
Initial Term Loan, 2 Month SOFR + 4.000% | | | 9.343(c) | | | | 01/31/30 | | | | 175 | | | | 174,891 | |
Iridium Satellite LLC, | | | | | | | | | | | | | | | | |
Term B-2 Loan, 1 Month SOFR + 2.500% | | | 7.931(c) | | | | 11/04/26 | | | | 93 | | | | 92,573 | |
MLN US HoldCo LLC,
3L Term B Loans, 3 Month SOFR + 9.250%^ | | | 14.660(c) | | | | 10/18/27 | | | | 4 | | | | 600 | |
Initial Term Loan, 3 Month SOFR + 6.440% | | | 11.850(c) | | | | 10/18/27 | | | | 22 | | | | 15,942 | |
See Notes to Financial Statements.
234
PGIM Floating Rate Income ETF
Schedule of Investments (continued)
as of August 31, 2023
| | | | | | | | | | | | | | | | |
| | | | |
| Description | | Interest
Rate | | | Maturity
Date | | | Principal
Amount
(000)# | | | Value | |
| | | | |
FLOATING RATE AND OTHER LOANS (Continued) | | | | | | | | | | | | | | | | |
| | | | |
Telecommunications (cont’d.) | | | | | | | | | | | | | | | | |
| | | | |
MLN US HoldCo LLC, (cont’d.) | | | | | | | | | | | | | | | | |
Initial Term Loan (Second Out (First Lien Roll-Up)), 3 Month SOFR + 6.700% | | | 12.110%(c) | | | | 10/18/27 | | | | 50 | | | $ | 16,139 | |
Numericable US LLC (France), | | | | | | | | | | | | | | | | |
USD TLB-12 Term Loan, 3 Month LIBOR + 3.688% | | | 9.257(c) | | | | 01/31/26 | | | | 125 | | | | 117,656 | |
Orbcomm, Inc., | | | | | | | | | | | | | | | | |
Closing Date Term Loans, 1 Month SOFR + 4.250% | | | 9.815(c) | | | | 09/01/28 | | | | 198 | | | | 170,664 | |
Patagonia Holdco LLC, | | | | | | | | | | | | | | | | |
Initial Term Loan, 3 Month SOFR + 5.750% | | | 11.117(c) | | | | 08/01/29 | | | | 338 | | | | 290,852 | |
Securus Technologies Holdings, Inc., | | | | | | | | | | | | | | | | |
Initial Term Loan (First Lien), 3 Month LIBOR + 4.500% | | | 10.038(c) | | | | 11/01/24 | | | | 99 | | | | 86,234 | |
Viasat, Inc., | | | | | | | | | | | | | | | | |
Initial Term Loan, 1 Month SOFR + 4.500% | | | 9.831(c) | | | | 03/02/29 | | | | 322 | | | | 314,774 | |
Xplornet Communications, Inc. (Canada), | | | | | | | | | | | | | | | | |
First Lien Refinancing Term Loan, 1 Month SOFR + 4.000% | | | 9.446(c) | | | | 10/02/28 | | | | 422 | | | | 337,677 | |
Zacapa Sarl (Luxembourg), | | | | | | | | | | | | | | | | |
Initial Term Loans 2022, 3 Month SOFR + 4.000% | | | 9.242(c) | | | | 03/22/29 | | | | 247 | | | | 246,195 | |
Zayo Group Holdings, Inc., | | | | | | | | | | | | | | | | |
Initial Dollar Term Loan, 1 Month SOFR + 3.000% | | | 8.446(c) | | | | 03/09/27 | | | | 310 | | | | 247,941 | |
| | | | | | | | | | | | | | | | |
| | | | |
| | | | | | | | | | | | | | | 4,046,436 | |
| | | | |
Textiles 0.2% | | | | | | | | | | | | | | | | |
| | | | |
ASP Unifrax Holdings, Inc., | | | | | | | | | | | | | | | | |
USD Term Loan (First Lien), 3 Month SOFR + 3.900% | | | 9.142(c) | | | | 12/12/25 | | | | 148 | | | | 136,340 | |
| | | | |
Transportation 1.4% | | | | | | | | | | | | | | | | |
| | | | |
Daseke Cos., Inc., | | | | | | | | | | | | | | | | |
Term Loan, 1 Month SOFR + 4.114% | | | 9.446(c) | | | | 03/09/28 | | | | 162 | | | | 159,643 | |
Einstein Merger Sub, Inc., | | | | | | | | | | | | | | | | |
Initial Term Loans, 1 Month SOFR + 3.500% | | | 8.931(c) | | | | 11/23/28 | | | | 200 | | | | 194,459 | |
First Student Bidco, Inc., | | | | | | | | | | | | | | | | |
Incremental Term Loan B, 3 Month SOFR + 4.000% | | | 9.342(c) | | | | 07/21/28 | | | | 163 | | | | 159,961 | |
Incremental Term Loan C, 3 Month SOFR + 4.100% | | | 9.342(c) | | | | 07/21/28 | | | | 11 | | | | 11,165 | |
Initial Term B Loan, 3 Month SOFR + 3.262% | | | 8.501(c) | | | | 07/21/28 | | | | 98 | | | | 95,168 | |
Initial Term C Loan, 3 Month SOFR + 3.262% | | | 8.501(c) | | | | 07/21/28 | | | | 37 | | | | 35,672 | |
Kenan Advantage Group, Inc., | | | | | | | | | | | | | | | | |
Term B-2 Loan, 6 Month SOFR + 4.428% | | | 9.727(c) | | | | 03/24/26 | | | | 32 | | | | 31,680 | |
See Notes to Financial Statements.
PGIM Fixed Income ETFs 235
PGIM Floating Rate Income ETF
Schedule of Investments (continued)
as of August 31, 2023
| | | | | | | | | | | | | | | | |
| | | | |
| Description | | Interest
Rate | | | Maturity
Date | | | Principal
Amount
(000)# | | | Value | |
| | | | |
FLOATING RATE AND OTHER LOANS (Continued) | | | | | | | | | | | | | | | | |
| | | | |
Transportation (cont’d.) | | | | | | | | | | | | | | | | |
| | | | |
Odyssey Logistics & Technology Corp., | | | | | | | | | | | | | | | | |
Initial Term Loan, 3 Month SOFR + 4.500% | | | 9.922%(c) | | | | 10/12/27 | | | | 50 | | | $ | 49,625 | |
Pods LLC, | | | | | | | | | | | | | | | | |
Term Loan, 1 Month SOFR + 3.114% | | | 8.446(c) | | | | 03/31/28 | | | | 74 | | | | 71,720 | |
Savage Enterprises LLC, | | | | | | | | | | | | | | | | |
Term Loan B, 1 Month SOFR + 3.364% | | | 8.696(c) | | | | 09/15/28 | | | | 173 | | | | 172,795 | |
| | | | | | | | | | | | | | | | |
| | | | |
| | | | | | | | | | | | | | | 981,888 | |
| | | | | | | | | | | | | | | | |
| | | | |
TOTAL FLOATING RATE AND OTHER LOANS
(cost $52,297,109) | | | | | | | | | | | | | | | 52,509,833 | |
| | | | | | | | | | | | | | | | |
| | | | |
RESIDENTIAL MORTGAGE-BACKED SECURITIES 0.8% | | | | | | | | | | | | | | | | |
| | | | |
Connecticut Avenue Securities Trust, | | | | | | | | | | | | | | | | |
Series 2022-R01, Class 1M2, 144A, 30 Day Average | | | | | | | | | | | | | | | | |
SOFR + 1.900% (Cap N/A, Floor 0.000%) | | | 7.188(c) | | | | 12/25/41 | | | | 290 | | | | 284,567 | |
FHLMC Structured Agency Credit Risk Debt Notes, | | | | | | | | | | | | | | | | |
Series 2021-DNA02, Class B1, 144A, 30 Day Average | | | | | | | | | | | | | | | | |
SOFR + 3.400% (Cap N/A, Floor 0.000%) | | | 8.688(c) | | | | 08/25/33 | | | | 250 | | | | 256,518 | |
| | | | | | | | | | | | | | | | |
| | | | |
TOTAL RESIDENTIAL MORTGAGE-BACKED SECURITIES
(cost $520,423) | | | | | | | | | | | | | | | 541,085 | |
| | | | | | | | | | | | | | | | |
| | | | |
| | | | | | | | | Shares | | | | |
| | | | |
COMMON STOCK 0.0% | | | | | | | | | | | | | | | | |
| | | | |
Textiles, Apparel & Luxury Goods | | | | | | | | | | | | | | | | |
| | | | |
International Textile Group, Inc. (original cost $0; purchased 06/21/23)*(f) | | | | | | | | | | | | | | | | |
(cost $0) | | | | | | | | | | | 2,040 | | | | 7,395 | |
| | | | | | | | | | | | | | | | |
| | | | |
TOTAL LONG-TERM INVESTMENTS
(cost $67,646,449) | | | | | | | | | | | | | | | 67,917,143 | |
| | | | | | | | | | | | | | | | |
See Notes to Financial Statements.
236
PGIM Floating Rate Income ETF
Schedule of Investments (continued)
as of August 31, 2023
| | | | | | | | | | | | | | |
| | | | |
| Description | | | | | | | Shares | | Value | |
| | | | |
SHORT-TERM INVESTMENT 5.7% | | | | | | | | | | | | | | |
| | | | |
AFFILIATED MUTUAL FUND | | | | | | | | | | | | | | |
PGIM Core Government Money Market Fund | | | | | | | | | | | | | | |
(cost $3,882,660)(wj) | | | | | | | | | | 3,882,660 | | $ | 3,882,660 | |
| | | | | | | | | | | | | | |
| | | | |
TOTAL INVESTMENTS 105.1%
(cost $71,529,109) | | | | | | | | | | | | | 71,799,803 | |
Liabilities in excess of other assets(z) (5.1)% | | | | | | | | | | | | | (3,481,463 | ) |
| | | | | | | | | | | | | | |
| | | | |
NET ASSETS 100.0% | | | | | | | | | | | | $ | 68,318,340 | |
| | | | | | | | | | | | | | |
See the Glossary for a list of the abbreviation(s) used in the annual report.
| * | Non-income producing security. |
| # | Principal or notional amount is shown in U.S. dollars unless otherwise stated. |
| ^ | Indicates a Level 3 instrument. The aggregate value of Level 3 instruments is $2,747,739 and 4.0% of net assets. |
| (c) | Variable rate instrument. The interest rate shown reflects the rate in effect at August 31, 2023. |
| (cc) | Variable rate instrument. The rate shown is based on the latest available information as of August 31, 2023. Certain variable rate securities are not based on a published reference rate and spread but are determined by the issuer or agent and are based on current market conditions. These securities do not indicate a reference rate and spread in their description. |
| (d) | Represents issuer in default on interest payments and/or principal repayment. Non-income producing security. Such securities may be post-maturity. |
| (f) | Indicates a restricted security that is acquired in unregistered, private sales from the issuing company or from an affiliate of the issuer and is considered restricted as to disposition under federal securities law; the aggregate original cost of such securities is $310,471. The aggregate value of $275,729 is 0.4% of net assets. |
| (ff) | Variable rate security. Security may be issued at a fixed coupon rate, which converts to a variable rate at a specified date. Rate shown is the rate in effect as of period end. |
| (oo) | Perpetual security. Maturity date represents next call date. |
| (p) | Represents a security with a delayed settlement and therefore the interest rate is not available until settlement which is after the period end. |
| (wj) | PGIM Investments LLC, the manager of the Fund, also serves as manager of the PGIM Core Government Money Market Fund. |
| (z) | Includes net unrealized appreciation/(depreciation) and/or market value of the below holdings which are excluded from the Schedule of Investments: |
See Notes to Financial Statements.
PGIM Fixed Income ETFs 237
PGIM Floating Rate Income ETF
Schedule of Investments (continued)
as of August 31, 2023
Unfunded loan commitments outstanding at August 31, 2023:
| | | | | | | | | | | | | | | | | | | | |
Borrower | | Principal
Amount
(000)# | | Current
Value | | Unrealized
Appreciation | | Unrealized
Depreciation |
Omnia Partners, LLC, Delayed Draw Term Loan, 1 Month SOFR + 4.250% (Cap N/A, Floor 0.000%), 4.250%(c), Maturity Date 07/25/30 (cost $17,132) | | | | 17 | | | | $ | 17,218 | | | | $ | 86 | | | | $ | — | |
Tank Holding Corp., Delayed Draw Term Commitment, —%(p), Maturity Date 03/31/28
(cost $21,000) | | | | 21 | | | | | 20,475 | | | | | — | | | | | (525 | ) |
| | | | | | | | | | | | | | | | | | | | |
| | | | | | | | $ | 37,693 | | | | $ | 86 | | | | $ | (525 | ) |
| | | | | | | | | | | | | | | | | | | | |
Futures contracts outstanding at August 31, 2023:
| | | | | | | | | | | | | | | | | | | | | | | | | |
Number
of
Contracts | | | | Type | | | | Expiration
Date | | | | Current
Notional
Amount | | | | Value /
Unrealized
Appreciation
(Depreciation) |
Long Positions: | | | | | | | | | | | | | | | | | | | | | |
2 | | | | 20 Year U.S. Treasury Bonds | | | | | | Dec. 2023 | | | | | | $ | 243,375 | | | | | | $ | 2,544 | |
2 | | | | 30 Year U.S. Ultra Treasury Bonds | | | | | | Dec. 2023 | | | | | | | 258,938 | | | | | | | 6,304 | |
| | | | | | | | | | | | | | | | | | | | | | | | | |
| | | | | | | | | | | | | | | | | | | | | | | | 8,848 | |
| | | | | | | | | | | | | | | | | | | | | | | | | |
Short Positions: | | | | | | | | | | | | | | | | | | | | | |
11 | | | | 2 Year U.S. Treasury Notes | | | | | | Dec. 2023 | | | | | | | 2,241,852 | | | | | | | (5,001 | ) |
25 | | | | 5 Year U.S. Treasury Notes | | | | | | Dec. 2023 | | | | | | | 2,673,047 | | | | | | | (18,781 | ) |
14 | | | | 10 Year U.S. Treasury Notes | | | | | | Dec. 2023 | | | | | | | 1,554,438 | | | | | | | (12,957 | ) |
| | | | | | | | | | | | | | | | | | | | | | | | | |
| | | | | | | | | | | | | | | | | | | | | | | | (36,739 | ) |
| | | | | | | | | | | | | | | | | | | | | | | | | |
| | | | | | | | | | | | | | | | | | | | | | | $ | (27,891 | ) |
| | | | | | | | | | | | | | | | | | | | | | | | | |
Credit default swap agreements outstanding at August 31, 2023:
| | | | | | | | | | | | | | | | | | | | | | | | | | | | | | | | | | | | | | | | |
Reference Entity/ Obligation | | Termination
Date | | Fixed
Rate | | Notional
Amount
(000)#(3) | | Implied Credit
Spread at
August 31,
2023(4) | | Value at
Trade Date | | Value at
August 31,
2023 | | Unrealized
Appreciation
(Depreciation) |
Centrally Cleared Credit Default Swap Agreement on credit indices - Sell Protection(2): | | | | | | |
CDX.NA.HY.40.V1 | | 06/20/28 | | 5.000%(Q) | | | | 5,955 | | | | | 4.257% | | | | $ | 60,415 | | | | $ | 228,622 | | | | $ | 168,207 | | | | | | |
| | | | | | | | | | | | | | | | | | | | | | | | | | | | | | | | | | |
The Fund entered into credit default swaps (“CDS”) to provide a measure of protection against defaults or to take an active long or short position with respect to the likelihood of a particular issuer’s default or the reference entity’s credit soundness. CDS contracts generally trade based on a spread which represents the cost a protection buyer has to pay the protection seller. The protection buyer is said to be short the credit as the value of the contract rises the more the credit deteriorates. The value of the CDS contract increases for the protection buyer if the spread increases.
| (1) | If the Fund is a buyer of protection, it pays the fixed rate. When a credit event occurs, as defined under the terms of that |
See Notes to Financial Statements.
238
PGIM Floating Rate Income ETF
Schedule of Investments (continued)
as of August 31, 2023
| | particular swap agreement, the Fund will either (i) receive from the seller of protection an amount equal to the notional amount of the swap and make delivery of the referenced obligation or underlying securities comprising the referenced index or (ii) receive a net settlement amount in the form of cash or securities equal to the notional amount of the swap less the recovery value of the referenced obligation or underlying securities comprising the referenced index. |
| (2) | If the Fund is a seller of protection, it receives the fixed rate. When a credit event occurs, as defined under the terms of that particular swap agreement, the Fund will either (i) pay to the buyer of protection an amount equal to the notional amount of the swap and take delivery of the referenced obligation or underlying securities comprising the referenced index or (ii) pay a net settlement amount in the form of cash or securities equal to the notional amount of the swap less the recovery value of the referenced obligation or underlying securities comprising the referenced index. |
| (3) | Notional amount represents the maximum potential amount the Fund could be required to pay as a seller of credit protection or receive as a buyer of credit protection if a credit event occurs as defined under the terms of that particular swap agreement. |
| (4) | Implied credit spreads, represented in absolute terms, utilized in determining the fair value of credit default swap agreements where the Fund is the seller of protection as of the reporting date serve as an indicator of the current status of the payment/ performance risk and represent the likelihood of risk of default for the credit derivative. The implied credit spread of a particular referenced entity reflects the cost of buying/selling protection and may include up-front payments required to be made to enter into the agreement. Wider credit spreads represent a deterioration of the referenced entity’s credit soundness and a greater likelihood of risk of default or other credit event occurring as defined under the terms of the agreement. |
Summary of Collateral for Centrally Cleared/Exchange-traded Derivatives:
Cash and securities segregated as collateral, including pending settlement for closed positions, to cover requirements for centrally cleared/exchange-traded derivatives are listed by broker as follows:
| | | | | | | | | | | | | | | | | | | | | | | | | | | | | | | | | | | | | | | | | | | | | | | |
Broker | | | | Cash and/or Foreign Currency | | | | Securities Market Value |
| | | | | | | | | | |
CGM | | | | | | | | | | | | | | | $ | 530,000 | | | | | | | | | | | | | | | | | | | | | | | | $ | — | | | | | | |
| | | | | | | | | | |
JPS | | | | | | | | | | | | | | | | 150,000 | | | | | | | | | | | | | | | | | | | | | | | | | — | | | | | | |
| | | | | | | | | | | | | | | | | | | | | | | | | | | | | | | | | | | | | | | | | | | | | | | |
Total | | | | | | | | | | | | | | | $ | 680,000 | | | | | | | | | | | | | | | | | | | | | | | | $ | — | | | | | | |
| | | | | | | | | | | | | | | | | | | | | | | | | | | | | | | | | | | | | | | | | | | | | | | |
Fair Value Measurements:
Various inputs are used in determining the value of the Fund’s investments. These inputs are summarized in the three broad levels listed below.
Level 1—unadjusted quoted prices generally in active markets for identical securities.
Level 2—quoted prices for similar securities, interest rates and yield curves, prepayment speeds, foreign currency exchange rates and other observable inputs.
Level 3—unobservable inputs for securities valued in accordance with Board approved fair valuation procedures.
See Notes to Financial Statements.
PGIM Fixed Income ETFs 239
PGIM Floating Rate Income ETF
Schedule of Investments (continued)
as of August 31, 2023
The following is a summary of the inputs used as of August 31, 2023 in valuing such portfolio securities:
| | | | | | | | | | | | | | | |
| | | Level 1 | | Level 2 | | Level 3 |
Investments in Securities | | | | | | | | | | | | | | | |
Assets | | | | | | | | | | | | | | | |
Long-Term Investments | | | | | | | | | | | | | | | |
Asset-Backed Securities | | | | | | | | | | | | | | | |
Collateralized Loan Obligations | | | $ | — | | | | $ | 6,716,616 | | | | $ | — | |
Common Stock | | | | — | | | | | 7,395 | | | | | — | |
Convertible Bond | | | | — | | | | | 492 | | | | | — | |
Corporate Bonds | | | | — | | | | | 8,141,722 | | | | | — | |
Floating Rate and Other Loans | | | | — | | | | | 49,762,094 | | | | | 2,747,739 | |
Residential Mortgage-Backed Securities | | | | — | | | | | 541,085 | | | | | — | |
Short-Term Investment | | | | | | | | | | | | | | | |
Affiliated Mutual Fund | | | | 3,882,660 | | | | | — | | | | | — | |
| | | | | | | | | | | | | | | |
| | | |
Total | | | $ | 3,882,660 | | | | $ | 65,169,404 | | | | $ | 2,747,739 | |
| | | | | | | | | | | | | | | |
| | | |
Other Financial Instruments* | | | | | | | | | | | | | | | |
Assets | | | | | | | | | | | | | | | |
Unfunded Loan Commitment | | | $ | — | | | | $ | 86 | | | | $ | — | |
Futures Contracts | | | | 8,848 | | | | | — | | | | | — | |
Centrally Cleared Credit Default Swap Agreement | | | | — | | | | | 168,207 | | | | | — | |
| | | | | | | | | | | | | | | |
| | | |
Total | | | $ | 8,848 | | | | $ | 168,293 | | | | $ | — | |
| | | | | | | | | | | | | | | |
| | | |
Liabilities | | | | | | | | | | | | | | | |
Unfunded Loan Commitment | | | $ | — | | | | $ | (525 | ) | | | $ | — | |
Futures Contracts | | | | (36,739 | ) | | | | — | | | | | — | |
| | | | | | | | | | | | | | | |
| | | |
Total | | | $ | (36,739 | ) | | | $ | (525 | ) | | | $ | — | |
| | | | | | | | | | | | | | | |
| * | Other financial instruments are derivative instruments, with the exception of unfunded loan commitments, and are not reflected in the Schedule of Investments. Futures, forwards, centrally cleared swap contracts and unfunded loan commitments are recorded at net unrealized appreciation (depreciation) and OTC swap contracts are recorded at fair value. |
The following is a reconciliation of assets in which unobservable inputs (Level 3) were used in determining fair value:
| | | | | | | | | | |
| | | Floating Rate
and
Other Loans | | Unfunded
Loan
Commitments |
Balance as of 08/31/22 | | | $ | 2,321,742 | | | | $ | 17 | |
Realized gain (loss) | | | | (2,547 | ) | | | | — | |
Change in unrealized appreciation (depreciation) | | | | 38,933 | | | | | — | |
Purchases/Exchanges/Issuances | | | | 3,591,309 | | | | | — | |
See Notes to Financial Statements.
240
PGIM Floating Rate Income ETF
Schedule of Investments (continued)
as of August 31, 2023
| | | | | | | | | | |
| | | Floating Rate
and
Other Loans | | Unfunded
Loan
Commitments |
Sales/Paydowns | | | $ | (1,923,906 | ) | | | $ | (17 | ) |
Accrued discount/premium | | | | 7,891 | | | | | — | |
Transfers into Level 3* | | | | 73,223 | | | | | — | |
Transfers out of Level 3* | | | | (1,358,906 | ) | | | | — | |
| | | | | | | | | | |
Balance as of 08/31/23 | | | $ | 2,747,739 | | | | $ | — | |
| | | | | | | | | | |
| | |
Change in unrealized appreciation (depreciation) relating to securities still held at reporting period end | | | $ | 31,927 | | | | $ | — | |
| | | | | | | | | | |
| * | It is the Fund’s policy to recognize transfers in and transfers out at the securities’ fair values as of the beginning of period. Securities transferred between Level 2 and Level 3 are due to changes in the method utilized in valuing the investments. Transfers from Level 2 to Level 3 are typically a result of a change from the use of methods used by independent pricing services (Level 2) to the use of a single broker quote or valuation technique which utilizes significant unobservable inputs due to an absence of current or reliable market quotations (Level 3). Transfers from Level 3 to Level 2 are a result of the availability of current and reliable market data provided by independent pricing services or other valuation techniques which utilize observable inputs. In accordance with the requirements of ASC 820, the amounts of transfers into and out of Level 3, if material, are disclosed in the Notes to the Schedule of Investments of the Fund. |
As of August 31, 2023, the aggregate value of Level 3 securities and/or derivatives that are valued by independent pricing vendors or brokers was $2,747,739. The unobservable inputs for these investments were not developed by the Fund and are not readily available (e.g. single broker quotes).
Industry Classification:
The industry classification of investments and liabilities in excess of other assets shown as a percentage of net assets as of August 31, 2023 were as follows:
| | | | |
Collateralized Loan Obligations | | | 9.8 | % |
Banks | | | 8.8 | |
Commercial Services | | | 8.5 | |
Telecommunications | | | 6.3 | |
Affiliated Mutual Fund | | | 5.7 | |
Software | | | 5.4 | |
Retail | | | 4.7 | |
Media | | | 4.5 | |
Chemicals | | | 3.5 | |
Entertainment | | | 3.5 | |
Healthcare-Services | | | 3.0 | |
Building Materials | | | 2.6 | |
Computers | | | 2.5 | |
Insurance | | | 2.2 | |
| | | | |
Airlines | | | 1.9 | % |
Auto Parts & Equipment | | | 1.9 | |
Machinery-Diversified | | | 1.8 | |
Leisure Time | | | 1.8 | |
Electric | | | 1.8 | |
Diversified Financial Services | | | 1.7 | |
Metal Fabricate/Hardware | | | 1.6 | |
Packaging & Containers | | | 1.5 | |
Real Estate Investment Trusts (REITs) | | | 1.5 | |
Transportation | | | 1.4 | |
Real Estate | | | 1.3 | |
Environmental Control | | | 1.2 | |
Aerospace & Defense | | | 1.1 | |
Healthcare-Products | | | 1.1 | |
See Notes to Financial Statements.
PGIM Fixed Income ETFs 241
PGIM Floating Rate Income ETF
Schedule of Investments (continued)
as of August 31, 2023
Industry Classification (continued):
| | | | |
Internet | | | 1.0 | % |
Pipelines | | | 0.9 | |
Electronics | | | 0.8 | |
Residential Mortgage-Backed Securities | | | 0.8 | |
Semiconductors | | | 0.6 | |
Home Furnishings | | | 0.6 | |
Pharmaceuticals | | | 0.6 | |
Miscellaneous Manufacturing | | | 0.5 | |
Oil & Gas | | | 0.5 | |
Mining | | | 0.4 | |
Engineering & Construction | | | 0.4 | |
Apparel | | | 0.4 | |
Foods | | | 0.4 | |
Beverages | | | 0.4 | |
Investment Companies | | | 0.4 | |
Advertising | | | 0.4 | |
Private Equity | | | 0.4 | |
Agriculture | | | 0.4 | |
Housewares | | | 0.3 | |
Distribution/Wholesale | | | 0.3 | |
| | | | |
Lodging | | | 0.3 | % |
Auto Manufacturers | | | 0.3 | |
Household Products/Wares | | | 0.3 | |
Forest Products & Paper | | | 0.3 | |
Textiles | | | 0.2 | |
Food Service | | | 0.2 | |
Energy-Alternate Sources | | | 0.2 | |
Holding Companies-Diversified | | | 0.1 | |
Hand/Machine Tools | | | 0.1 | |
Home Builders | | | 0.0 | * |
Textiles, Apparel & Luxury Goods | | | 0.0 | * |
| | | | |
| | | 105.1 | |
Liabilities in excess of other assets | | | (5.1 | ) |
| | | | |
| |
| | | 100.0 | % |
| | | | |
Effects of Derivative Instruments on the Financial Statements and Primary Underlying Risk Exposure:
The Fund invested in derivative instruments during the reporting period. The primary types of risk associated with these derivative instruments are credit risk and interest rate risk. See the Notes to Financial Statements for additional detail regarding these derivative instruments and their risks. The effect of such derivative instruments on the Fund’s financial position and financial performance as reflected in the Statement of Assets and Liabilities and Statement of Operations is presented in the summary below.
Fair values of derivative instruments as of August 31, 2023 as presented in the Statement of Assets and Liabilities:
| | | | | | | | | | | | |
| | | Asset Derivatives | | | Liability Derivatives | |
| | | | |
Derivatives not accounted for as
hedging instruments, carried at
fair value | | Statement of Assets and Liabilities Location | | Fair
Value | | | Statement of Assets and Liabilities Location | | Fair
Value | |
Credit contracts | | Due from/to broker-variation margin swaps | | $ | 168,207* | | | — | | $ | — | |
See Notes to Financial Statements.
242
PGIM Floating Rate Income ETF
Schedule of Investments (continued)
as of August 31, 2023
| | | | | | | | | | | | |
| | | Asset Derivatives | | | Liability Derivatives | |
| | | | |
Derivatives not accounted for as
hedging instruments, carried at fair value | | Statement of Assets and Liabilities Location | | Fair
Value | | | Statement of Assets and Liabilities Location | | Fair
Value | |
Interest rate contracts | | Due from/to broker-variation margin futures | | $ | 8,848 | * | | Due from/to broker-variation margin futures | | $ | 36,739 | * |
| | | | | | | | | | | | |
| | | | $ | 177,055 | | | | | $ | 36,739 | |
| | | | | | | | | | | | |
| * | Includes cumulative appreciation (depreciation) as reported in the schedule of open futures and centrally cleared swap contracts. Only unsettled variation margin receivable (payable) is reported within the Statement of Assets and Liabilities. |
The effects of derivative instruments on the Statement of Operations for the year ended August 31, 2023 are as follows:
| | | | | | | | |
Amount of Realized Gain (Loss) on Derivatives Recognized in Income | |
Derivatives not accounted for as hedging instruments, carried at fair value | | Futures | | | Swaps | |
Credit contracts | | $ | — | | | $ | (12,529 | ) |
Interest rate contracts | | | 199,638 | | | | — | |
| | | | | | | | |
Total | | $ | 199,638 | | | $ | (12,529 | ) |
| | | | | | | | |
|
Change in Unrealized Appreciation (Depreciation) on Derivatives Recognized in Income | |
Derivatives not accounted for as hedging instruments, carried at fair value | | Futures | | | Swaps | |
Credit contracts | | $ | — | | | $ | 167,838 | |
Interest rate contracts | | | (33,266 | ) | | | — | |
| | | | | | | | |
Total | | $ | (33,266 | ) | | $ | 167,838 | |
| | | | | | | | |
For the year ended August 31, 2023, the Fund’s average volume of derivative activities is as follows:
| | | | |
| Derivative Contract Type | | Average Volume of Derivative Activities* |
Futures Contracts - Long Positions (1) | | $ 206,550 |
Futures Contracts - Short Positions (1) | | 4,018,502 |
Credit Default Swap Agreements - Sell Protection (1) | | 2,366,600 |
| * | Average volume is based on average quarter end balances as noted for the year ended August 31, 2023. |
| (1) | Notional Amount in USD. |
See Notes to Financial Statements.
PGIM Fixed Income ETFs 243
PGIM Floating Rate Income ETF
Statement of Assets & Liabilities
as of August 31, 2023
| | | | |
Assets | | | | |
| |
Investments at value: | | | | |
Unaffiliated investments (cost $67,646,449) | | $ | 67,917,143 | |
Affiliated investments (cost $3,882,660) | | | 3,882,660 | |
Cash | | | 27,108 | |
Receivable for investments sold | | | 2,815,077 | |
Deposit with broker for centrally cleared/exchange-traded derivatives | | | 680,000 | |
Dividends and interest receivable | | | 550,319 | |
Unrealized appreciation on unfunded loan commitment | | | 86 | |
| | | | |
| |
Total Assets | | | 75,872,393 | |
| | | | |
| |
Liabilities | | | | |
| |
Payable for investments purchased | | | 7,497,873 | |
Management fee payable | | | 41,359 | |
Due to broker—variation margin swaps | | | 10,140 | |
Due to broker—variation margin futures | | | 4,156 | |
Unrealized depreciation on unfunded loan commitments | | | 525 | |
| | | | |
| |
Total Liabilities | | | 7,554,053 | |
| | | | |
| |
Net Assets | | $ | 68,318,340 | |
| | | | |
| | | | |
| | |
Net assets were comprised of: | | | | |
Common stock, at par | | $ | 1,350 | |
Paid-in capital in excess of par | | | 67,252,822 | |
Total distributable earnings (loss) | | | 1,064,168 | |
| | | | |
| |
Net assets, August 31, 2023 | | $ | 68,318,340 | |
| | | | |
| |
Net asset value, offering price and redemption price per share. ($68,318,340 ÷ 1,350,000 shares of common stock issued and outstanding) | | $ | 50.61 | |
| | | | |
See Notes to Financial Statements.
244
PGIM Floating Rate Income ETF
Statement of Operations
Year Ended August 31, 2023
| | | | |
Net Investment Income (Loss) | | | | |
| |
Income | | | | |
Interest income | | $ | 4,675,079 | |
Unaffiliated dividend income | | | 150,054 | |
Affiliated dividend income | | | 77,119 | |
| | | | |
| |
Total income | | | 4,902,252 | |
| | | | |
| |
Expenses | | | | |
Management fee | | | 378,501 | |
| | | | |
| |
Net investment income (loss) | | | 4,523,751 | |
| | | | |
| |
Realized And Unrealized Gain (Loss) On Investments | | | | |
| |
Net realized gain (loss) on: | | | | |
Investment transactions | | | (112,176 | ) |
Futures transactions | | | 199,638 | |
Swap agreement transactions | | | (12,529 | ) |
| | | | |
| |
| | | 74,933 | |
| | | | |
Net change in unrealized appreciation (depreciation) on: | | | | |
Investments | | | 538,448 | |
Futures | | | (33,266 | ) |
Swap agreements | | | 167,838 | |
Unfunded loan commitments | | | (273 | ) |
| | | | |
| |
| | | 672,747 | |
| | | | |
| |
Net gain (loss) on investment transactions | | | 747,680 | |
| | | | |
| |
Net Increase (Decrease) In Net Assets Resulting From Operations | | $ | 5,271,431 | |
| | | | |
See Notes to Financial Statements.
PGIM Fixed Income ETFs 245
PGIM Floating Rate Income ETF
Statements of Changes in Net Assets
| | | | | | | | | | | | | | | |
| | | |
| | | Year Ended
August 31, 2023 | | May 17, 2022*
through
August 31, 2022 | | |
Increase (Decrease) in Net Assets | | | | | | | | | | | | | | | |
| | | |
Operations | | | | | | | | | | | | | | | |
Net investment income (loss) | | | $ | 4,523,751 | | | | $ | 331,778 | | | | | | |
Net realized gain (loss) on investment transactions | | | | 74,933 | | | | | 27,041 | | | | | | |
Net change in unrealized appreciation (depreciation) on investments | | | | 672,747 | | | | | (262,176 | ) | | | | | |
| | | | | | | | | | | | | | | |
| | | |
Net increase (decrease) in net assets resulting from operations | | | | 5,271,431 | | | | | 96,643 | | | | | | |
| | | | | | | | | | | | | | | |
| | | |
Dividends and Distributions | | | | | | | | | | | | | | | |
Distributions from distributable earnings | | | | (4,140,051 | ) | | | | (163,855 | ) | | | | | |
| | | | | | | | | | | | | | | |
| | | |
Fund share transactions | | | | | | | | | | | | | | | |
Net proceeds from shares sold (675,000 and 675,000 shares, respectively) | | | | 33,359,380 | | | | | 33,894,792 | | | | | | |
| | | | | | | | | | | | | | | |
Total increase (decrease) | | | | 34,490,760 | | | | | 33,827,580 | | | | | | |
| | | |
Net Assets: | | | | | | | | | | | | | | | |
| | | |
Beginning of period | | | | 33,827,580 | | | | | — | | | | | | |
| | | | | | | | | | | | | | | |
| | | |
End of period | | | $ | 68,318,340 | | | | $ | 33,827,580 | | | | | | |
| | | | | | | | | | | | | | | |
| * | Commencement of operations. |
See Notes to Financial Statements.
246
PGIM Floating Rate Income ETF
Financial Highlights
| | | | | | | | | | | | | | | |
| | | | | | | | | | | |
| | | Year Ended August 31,
2023 | | May 17, 2022(a)
through August 31,
2022 | | |
| | | | |
| Per Share Operating Performance(b): | | | | | | | | | | | | | | | |
| Net Asset Value, Beginning of Period | | | | $50.11 | | | | | $50.00 | | | | | | |
| Income (loss) from investment operations: | | | | | | | | | | | | | | | |
| Net investment income (loss) | | | | 4.27 | | | | | 0.62 | | | | | | |
| Net realized and unrealized gain (loss) on investment and foreign currency transactions | | | | 0.16 | | | | | (0.18 | ) | | | | | |
| Total from investment operations | | | | 4.43 | | | | | 0.44 | | | | | | |
| Less Dividends and Distributions: | | | | | | | | | | | | | | | |
| Dividends from net investment income | | | | (3.88 | ) | | | | (0.33 | ) | | | | | |
| Distributions from net realized gains | | | | (0.05 | ) | | | | - | | | | | | |
| Total dividends and distributions | | | | (3.93 | ) | | | | (0.33 | ) | | | | | |
| Net asset value, end of period | | | | $50.61 | | | | | $50.11 | | | | | | |
| Total Return(c): | | | | 9.32 | % | | | | 0.89 | % | | | | | |
| | | | |
| | | | | | | | | | | | | | | | |
| Ratios/Supplemental Data: | | | | | | | | | | | | | | | |
| Net assets, end of period (000) | | | | $68,318 | | | | | $33,828 | | | | | | |
| Average net assets (000) | | | | $52,571 | | | | | $26,460 | | | | | | |
| Ratios to average net assets(d): | | | | | | | | | | | | | | | |
| Expenses after waivers and/or expense reimbursement | | | | 0.72 | % | | | | 0.72 | %(e) | | | | | |
| Expenses before waivers and/or expense reimbursement | | | | 0.72 | % | | | | 0.72 | %(e) | | | | | |
| Net investment income (loss) | | | | 8.61 | % | | | | 4.32 | %(e) | | | | | |
| Portfolio turnover rate(f) | | | | 182 | % | | | | 9 | % | | | | | |
| (a) | Commencement of operations. |
| (b) | Calculated based on average shares outstanding during the period. |
| (c) | Total return is calculated assuming a purchase of a share on the first day and a sale on the last day of each period reported and includes reinvestment of dividends and distributions, if any. Total returns may reflect adjustments to conform to GAAP. Total returns for periods less than one full year are not annualized. |
| (d) | Does not include expenses of the underlying funds in which the Fund invests. |
| (f) | The Fund’s portfolio turnover rate is calculated in accordance with regulatory requirements, without regard to transactions involving short-term investments, certain derivatives and in-kind transactions (if any). If such transactions were included, the Fund’s portfolio turnover rate may be higher. |
See Notes to Financial Statements.
PGIM Fixed Income ETFs 247
PGIM AAA CLO ETF
Schedule of Investments
as of August 31, 2023
| | | | | | | | | | | | |
| | | | |
| Description | | Interest
Rate | | Maturity
Date | | Principal
Amount
(000)# | | | Value | |
| | | | |
LONG-TERM INVESTMENTS 97.9% | | | | | | | | | | | | |
| | | | |
ASSET-BACKED SECURITIES | | | | | | | | | | | | |
| | | | |
Collateralized Loan Obligations | | | | | | | | | | | | |
| | | | |
AGL CLO Ltd. (Cayman Islands), | | | | | | | | | | | | |
Series 2020-05A, Class A1R, 144A, 3 Month SOFR + 1.422% (Cap N/A, Floor 1.160%) | | 6.748%(c) | | 07/20/34 | | | 3,000 | | | $ | 2,983,170 | |
Series 2021-14A, Class A, 144A, 3 Month SOFR + 1.412% (Cap N/A, Floor 1.150%) | | 6.745(c) | | 12/02/34 | | | 1,750 | | | | 1,737,680 | |
AGL Core CLO Ltd. (Cayman Islands), | | | | | | | | | | | | |
Series 2021-15A, Class A1, 144A, 3 Month SOFR + 1.412% (Cap N/A, Floor 1.150%) | | 6.738(c) | | 01/20/35 | | | 537 | | | | 532,973 | |
Allegro CLO Ltd. (Cayman Islands), | | | | | | | | | | | | |
Series 2019-01A, Class AR, 144A, 3 Month SOFR + 1.412% (Cap N/A, Floor 1.150%) | | 6.738(c) | | 07/20/32 | | | 3,000 | | | | 2,976,475 | |
Ares CLO Ltd. (Cayman Islands), | | | | | | | | | | | | |
Series 2018-50A, Class AR, 144A, 3 Month SOFR + 1.312% (Cap N/A, Floor 1.050%) | | 6.620(c) | | 01/15/32 | | | 3,000 | | | | 2,985,134 | |
Series 2020-56A, Class AR, 144A, 3 Month SOFR + 1.422% (Cap N/A, Floor 1.422%) | | 6.773(c) | | 10/25/34 | | | 350 | | | | 347,393 | |
Series 2021-60A, Class A, 144A, 3 Month SOFR + 1.382% (Cap N/A, Floor 1.120%) | | 6.692(c) | | 07/18/34 | | | 460 | | | | 455,905 | |
Series 2021-61A, Class A, 144A, 3 Month SOFR + 1.412% (Cap N/A, Floor 1.150%) | | 6.738(c) | | 10/20/34 | | | 2,500 | | | | 2,480,000 | |
Bain Capital Credit CLO Ltd. (Cayman Islands), | | | | | | | | | | | | |
Series 2021-06A, Class A1, 144A, 3 Month SOFR + 1.412% (Cap N/A, Floor 1.412%) | | 6.745(c) | | 10/21/34 | | | 1,000 | | | | 994,262 | |
Series 2022-01A, Class A1, 144A, 3 Month SOFR + 1.320% (Cap N/A, Floor 1.320%) | | 6.630(c) | | 04/18/35 | | | 3,750 | | | | 3,699,552 | |
Balboa Bay Loan Funding Ltd. (Cayman Islands), | | | | | | | | | | | | |
Series 2021-02A, Class A1, 144A, 3 Month SOFR + 1.432% (Cap N/A, Floor 1.170%) | | 6.765(c) | | 01/20/35 | | | 3,000 | | | | 2,970,000 | |
Ballyrock CLO Ltd. (Cayman Islands), | | | | | | | | | | | | |
Series 2021-16A, Class A1, 144A, 3 Month SOFR + 1.392% (Cap N/A, Floor 1.130%) | | 6.718(c) | | 07/20/34 | | | 3,000 | | | | 2,977,789 | |
Barings CLO Ltd. (Cayman Islands), | | | | | | | | | | | | |
Series 2020-02A, Class AR, 144A, 3 Month SOFR + 1.272% (Cap N/A, Floor 1.010%) | | 6.580(c) | | 10/15/33 | | | 1,000 | | | | 993,500 | |
Barrow Hanley CLO Ltd. (Cayman Islands), | | | | | | | | | | | | |
Series 2023-02A, Class A1, 144A, 3 Month SOFR + 2.050% (Cap N/A, Floor 2.050%) | | 7.389(c) | | 10/20/35 | | | 1,000 | | | | 1,000,088 | |
Series 2023-02A, Class A2, 144A, 3 Month SOFR + 2.550% (Cap N/A, Floor 2.550%) | | 7.889(c) | | 10/20/35 | | | 1,000 | | | | 1,000,088 | |
See Notes to Financial Statements.
248
PGIM AAA CLO ETF
Schedule of Investments (continued)
as of August 31, 2023
| | | | | | | | | | | | | | | | |
| | | | |
| Description | | Interest
Rate | | | Maturity
Date | | | Principal
Amount
(000)# | | | Value | |
| | | | |
ASSET-BACKED SECURITIES (Continued) | | | | | | | | | | | | | | | | |
| | | | |
Collateralized Loan Obligations (cont’d.) | | | | | | | | | | | | | | | | |
| | | | |
Battalion CLO Ltd. (Cayman Islands), | | | | | | | | | | | | | | | | |
Series 2018-12A, Class A1, 144A, 3 Month SOFR + 1.332% (Cap N/A, Floor 1.070%) | | | 6.708%(c) | | | | 05/17/31 | | | | 988 | | | $ | 982,171 | |
Series 2019-14A, Class AR, 144A, 3 Month SOFR + 1.452% (Cap N/A, Floor 1.190%) | | | 6.778(c) | | | | 01/20/35 | | | | 2,500 | | | | 2,464,697 | |
Benefit Street Partners CLO Ltd. (Cayman Islands), | | | | | | | | | | | | | | | | |
Series 2015-06BR, Class A, 144A, 3 Month SOFR + 1.452% (Cap N/A, Floor 1.190%) | | | 6.778(c) | | | | 07/20/34 | | | | 1,000 | | | | 992,000 | |
Series 2021-23A, Class A1, 144A, 3 Month SOFR + 1.342% (Cap N/A, Floor 1.080%) | | | 6.693(c) | | | | 04/25/34 | | | | 2,500 | | | | 2,475,000 | |
BlueMountain CLO Ltd. (Cayman Islands), | | | | | | | | | | | | | | | | |
Series 2019-24A, Class AR, 144A, 3 Month SOFR + 1.362% (Cap N/A, Floor 1.100%) | | | 6.688(c) | | | | 04/20/34 | | | | 3,000 | | | | 2,965,486 | |
Broad River BSL Funding CLO Ltd. (Cayman Islands), | | | | | | | | | | | | | | | | |
Series 2020-01A, Class AR, 144A, 3 Month SOFR + 1.432% (Cap N/A, Floor 1.170%) | | | 6.758(c) | | | | 07/20/34 | | | | 1,500 | | | | 1,485,000 | |
Canyon Capital CLO Ltd. (Cayman Islands), | | | | | | | | | | | | | | | | |
Series 2022-01A, Class A, 144A, 3 Month SOFR + 1.330% (Cap N/A, Floor 1.330%) | | | 6.640(c) | | | | 04/15/35 | | | | 2,041 | | | | 2,008,327 | |
CBAM Ltd. (Cayman Islands), | | | | | | | | | | | | | | | | |
Series 2020-12A, Class AR, 144A, 3 Month SOFR + 1.442% (Cap N/A, Floor 1.442%) | | | 6.768(c) | | | | 07/20/34 | | | | 3,500 | | | | 3,460,928 | |
CIFC Funding Ltd. (Cayman Islands), | | | | | | | | | | | | | | | | |
Series 2015-04A, Class A1A2, 144A, 3 Month SOFR + 1.332% (Cap N/A, Floor 1.332%) | | | 6.658(c) | | | | 04/20/34 | | | | 3,000 | | | | 2,974,886 | |
Series 2019-05A, Class A1R1, 144A, 3 Month SOFR + 1.402% (Cap N/A, Floor 1.140%) | | | 6.710(c) | | | | 01/15/35 | | | | 800 | | | | 792,452 | |
Series 2021-05A, Class A, 144A, 3 Month SOFR + 1.402% (Cap N/A, Floor 1.402%) | | | 6.710(c) | | | | 07/15/34 | | | | 2,000 | | | | 1,981,112 | |
Columbia Cent CLO Ltd. (Cayman Islands), | | | | | | | | | | | | | | | | |
Series 2021-31A, Class A1, 144A, 3 Month SOFR + 1.462% (Cap N/A, Floor 1.200%) | | | 6.788(c) | | | | 04/20/34 | | | | 2,750 | | | | 2,718,727 | |
Crown City CLO (Cayman Islands), | | | | | | | | | | | | | | | | |
Series 2021-01A, Class A1A, 144A, 3 Month SOFR + 1.432% (Cap N/A, Floor 1.170%) | | | 6.758(c) | | | | 07/20/34 | | | | 1,500 | | | | 1,483,187 | |
Elevation CLO Ltd. (Cayman Islands), | | | | | | | | | | | | | | | | |
Series 2021-13A, Class A1, 144A, 3 Month SOFR + 1.452% (Cap N/A, Floor 1.190%) | | | 6.760(c) | | | | 07/15/34 | | | | 2,000 | | | | 1,962,765 | |
See Notes to Financial Statements.
PGIM Fixed Income ETFs 249
PGIM AAA CLO ETF
Schedule of Investments (continued)
as of August 31, 2023
| | | | | | | | | | | | |
| | | | |
| Description | | Interest
Rate | | Maturity
Date | | Principal
Amount
(000)# | | | Value | |
| | | | |
ASSET-BACKED SECURITIES (Continued) | | | | | | | | | | | | |
| | | | |
Collateralized Loan Obligations (cont’d.) | | | | | | | | | | | | |
| | | | |
Elmwood CLO Ltd. (Cayman Islands), | | | | | | | | | | | | |
Series 2020-02A, Class AR, 144A, 3 Month SOFR + 1.412% (Cap N/A, Floor 1.150%) | | 6.738%(c) | | 10/20/34 | | | 1,000 | | | $ | 992,856 | |
Gallatin CLO Ltd. (Bermuda), | | | | | | | | | | | | |
Series 2023-01A, Class A1, 144A, 3 Month SOFR + 2.100% (Cap N/A, Floor 2.100%) | | 7.435(c) | | 10/14/35 | | | 1,000 | | | | 1,000,089 | |
Series 2023-01A, Class AJ, 144A, 3 Month SOFR + 2.550% (Cap N/A, Floor 2.550%) | | 7.885(c) | | 10/14/35 | | | 1,000 | | | | 1,000,089 | |
Greywolf CLO Ltd. (Cayman Islands), | | | | | | | | | | | | |
Series 2018-02A, Class A1, 144A, 3 Month SOFR + 1.440% (Cap N/A, Floor 1.440%) | | 6.766(c) | | 10/20/31 | | | 1,000 | | | | 993,646 | |
HPS Loan Management Ltd. (Cayman Islands), | | | | | | | | | | | | |
Series 10A-16, Class A1RR, 144A, 3 Month SOFR + 1.402% (Cap N/A, Floor 1.140%) | | 6.728(c) | | 04/20/34 | | | 4,000 | | | | 3,960,000 | |
LCM Ltd. (Cayman Islands), | | | | | | | | | | | | |
Series 34A, Class A1, 144A, 3 Month SOFR + 1.432% (Cap N/A, Floor 1.170%) | | 6.758(c) | | 10/20/34 | | | 3,500 | | | | 3,467,520 | |
Madison Park Funding Ltd. (Cayman Islands), | | | | | | | | | | | | |
Series 2019-33A, Class AR, 144A, 3 Month SOFR + 1.290% (Cap N/A, Floor 1.290%) | | 6.598(c) | | 10/15/32 | | | 1,250 | | | | 1,239,066 | |
Series 2019-34A, Class AR, 144A, 3 Month SOFR + 1.382% (Cap N/A, Floor 1.120%) | | 6.733(c) | | 04/25/32 | | | 4,100 | | | | 4,087,929 | |
Series 2021-38A, Class A, 144A, 3 Month SOFR + 1.382% (Cap N/A, Floor 1.382%) | | 6.690(c) | | 07/17/34 | | | 900 | | | | 892,454 | |
Neuberger Berman CLO Ltd. (Cayman Islands), | | | | | | | | | | | | |
Series 2017-16SA, Class AR, 144A, 3 Month SOFR + 1.302% (Cap N/A, Floor 1.040%) | | 6.610(c) | | 04/15/34 | | | 3,500 | | | | 3,473,520 | |
Oaktree CLO Ltd. (Cayman Islands), | | | | | | | | | | | | |
Series 2019-01A, Class A1R, 144A, 3 Month SOFR + 1.372% (Cap N/A, Floor 1.110%) | | 6.717(c) | | 04/22/30 | | | 1,600 | | | | 1,589,069 | |
Series 2020-01A, Class AR, 144A, 3 Month SOFR + 1.412% (Cap N/A, Floor 1.150%) | | 6.720(c) | | 07/15/34 | | | 960 | | | | 953,814 | |
Series 2021-01A, Class A1, 144A, 3 Month SOFR + 1.422% (Cap N/A, Floor 1.160%) | | 6.730(c) | | 07/15/34 | | | 1,875 | | | | 1,857,750 | |
Octagon Investment Partners 51 Ltd. (Cayman Islands), | | | | | | | | | | | | |
Series 2021-01A, Class A, 144A, 3 Month SOFR + 1.412% (Cap N/A, Floor 1.150%) | | 6.738(c) | | 07/20/34 | | | 3,000 | | | | 2,970,338 | |
See Notes to Financial Statements.
250
PGIM AAA CLO ETF
Schedule of Investments (continued)
as of August 31, 2023
| | | | | | | | | | | | |
| | | | |
| Description | | Interest
Rate | | Maturity
Date | | Principal
Amount
(000)# | | | Value | |
| | | | |
ASSET-BACKED SECURITIES (Continued) | | | | | | | | | | | | |
| | | | |
Collateralized Loan Obligations (cont’d.) | | | | | | | | | | | | |
| | | | |
OZLM Ltd. (Cayman Islands), | | | | | | | | | | | | |
Series 2014-09A, Class A1A3, 144A, 3 Month SOFR + 1.362% (Cap N/A, Floor 1.100%) | | 6.688%(c) | | 10/20/31 | | | 1,000 | | | $ | 989,890 | |
Pikes Peak CLO (Cayman Islands), | | | | | | | | | | | | |
Series 2020-06A, Class AR2, 144A, 3 Month SOFR + 1.432% (Cap N/A, Floor 1.170%) | | 6.811(c) | | 05/18/34 | | | 3,500 | | | | 3,472,692 | |
PPM CLO Ltd. (Cayman Islands), | | | | | | | | | | | | |
Series 2021-05A, Class A, 144A, 3 Month SOFR + 1.462% (Cap N/A, Floor 1.200%) | | 6.772(c) | | 10/18/34 | | | 3,500 | | | | 3,459,646 | |
Rad CLO Ltd. (Cayman Islands), | | | | | | | | | | | | |
Series 2020-07A, Class A1, 144A, 3 Month SOFR + 1.462% (Cap N/A, Floor 1.200%) | �� | 6.770(c) | | 04/17/33 | | | 1,250 | | | | 1,239,970 | |
Series 2021-12A, Class A, 144A, 3 Month SOFR + 1.432% (Cap N/A, Floor 1.170%) | | 6.801(c) | | 10/30/34 | | | 3,000 | | | | 2,965,785 | |
Series 2021-14A, Class A, 144A, 3 Month SOFR + 1.432% (Cap N/A, Floor 1.170%) | | 6.740(c) | | 01/15/35 | | | 1,500 | | | | 1,480,235 | |
Regatta Funding Ltd. (Cayman Islands), | | | | | | | | | | | | |
Series 2016-01A, Class A1R2, 144A, 3 Month LIBOR + 1.150% (Cap N/A, Floor 1.150%) | | 6.660(c) | | 06/20/34 | | | 2,000 | | | | 1,982,000 | |
Series 2021-04A, Class A1, 144A, 3 Month SOFR + 1.412% (Cap N/A, Floor 1.150%) | | 6.738(c) | | 01/20/35 | | | 1,000 | | | | 993,494 | |
Romark WM-R Ltd. (Cayman Islands), | | | | | | | | | | | | |
Series 2018-01A, Class A1, 144A, 3 Month SOFR + 1.292% (Cap N/A, Floor 0.000%) | | 6.618(c) | | 04/20/31 | | | 980 | | | | 972,659 | |
Signal Peak CLO Ltd. (Cayman Islands), | | | | | | | | | | | | |
Series 2020-08A, Class A, 144A, 3 Month SOFR + 1.532% (Cap N/A, Floor 1.270%) | | 6.858(c) | | 04/20/33 | | | 1,000 | | | | 993,794 | |
Sixth Street CLO Ltd. (Cayman Islands), | | | | | | | | | | | | |
Series 2021-19A, Class A, 144A, 3 Month SOFR + 1.362% (Cap N/A, Floor 1.100%) | | 6.688(c) | | 07/20/34 | | | 3,750 | | | | 3,708,583 | |
Sound Point CLO Ltd. (Cayman Islands), | | | | | | | | | | | | |
Series 2019-01A, Class AR, 144A, 3 Month SOFR + 1.342% (Cap N/A, Floor 1.080%) | | 6.668(c) | | 01/20/32 | | | 1,000 | | | | 988,670 | |
Symphony CLO Ltd. (Cayman Islands), | | | | | | | | | | | | |
Series 2016-18A, Class A1RR, 144A, 3 Month SOFR + 1.362% (Cap N/A, Floor 1.100%) | | 6.707(c) | | 07/23/33 | | | 3,500 | | | | 3,469,732 | |
TCW CLO Ltd. (Cayman Islands), | | | | | | | | | | | | |
Series 2021-01A, Class A, 144A, 3 Month SOFR + 1.432% (Cap N/A, Floor 1.170%) | | 6.758(c) | | 03/18/34 | | | 3,000 | | | | 2,964,274 | |
See Notes to Financial Statements.
PGIM Fixed Income ETFs 251
PGIM AAA CLO ETF
Schedule of Investments (continued)
as of August 31, 2023
| | | | | | | | | | | | | | | | |
| | | | |
| Description | | Interest
Rate | | | Maturity
Date | | | Principal
Amount
(000)# | | | Value | |
| | | | |
ASSET-BACKED SECURITIES (Continued) | | | | | | | | | | | | | | | | |
| | | | |
Collateralized Loan Obligations (cont’d.) | | | | | | | | | | | | | | | | |
| | | | |
Trinitas CLO Ltd. (Cayman Islands), | | | | | | | | | | | | | | | | |
Series 2022-20A, Class A1, 144A, 3 Month SOFR + 1.530% (Cap N/A, Floor 1.530%) | | | 6.856%(c) | | | | 07/20/35 | | | | 1,500 | | | $ | 1,479,145 | |
Trinitas CLO Ltd. (Bermuda), | | | | | | | | | | | | | | | | |
Series 2023-22A, Class A1, 144A, 3 Month SOFR + 1.850% (Cap N/A, Floor 1.850%) | | | 6.923(c) | | | | 07/20/36 | | | | 2,000 | | | | 1,995,128 | |
Venture CLO Ltd. (Cayman Islands), | | | | | | | | | | | | | | | | |
Series 2019-36A, Class A1AR, 144A, 3 Month SOFR + 1.392% (Cap N/A, Floor 1.130%) | | | 6.718(c) | | | | 04/20/32 | | | | 2,500 | | | | 2,482,013 | |
Wellfleet CLO Ltd. (Cayman Islands), | | | | | | | | | | | | | | | | |
Series 2020-02A, Class AR, 144A, 3 Month SOFR + 1.482% (Cap N/A, Floor 1.220%) | | | 6.790(c) | | | | 07/15/34 | | | | 2,500 | | | | 2,472,500 | |
| | | | | | | | | | | | | | | | |
| | | | |
TOTAL LONG-TERM INVESTMENTS
(cost $123,290,831) | | | | | | | | | | | | | | | 123,469,097 | |
| | | | | | | | | | | | | | | | |
| | | | |
| | | | | | | | | Shares | | | | |
| | | | |
SHORT-TERM INVESTMENT 4.5% | | | | | | | | | | | | | | | | |
| | | | |
AFFILIATED MUTUAL FUND | | | | | | | | | | | | | | | | |
PGIM Core Government Money Market Fund
(cost $5,633,877)(wj) | | | | | | | | | | | 5,633,877 | | | | 5,633,877 | |
| | | | | | | | | | | | | | | | |
| | | | |
TOTAL INVESTMENTS 102.4%
(cost $128,924,708) | | | | | | | | | | | | | | | 129,102,974 | |
Liabilities in excess of other assets (2.4)% | | | | | | | | | | | | | | | (3,018,647 | ) |
| | | | | | | | | | | | | | | | |
| | | | |
NET ASSETS 100.0% | | | | | | | | | | | | | | $ | 126,084,327 | |
| | | | | | | | | | | | | | | | |
See the Glossary for a list of the abbreviation(s) used in the annual report.
| # | Principal amount is shown in U.S. dollars unless otherwise stated. |
| (c) | Variable rate instrument. The interest rate shown reflects the rate in effect at August 31, 2023. |
| (wj) | PGIM Investments LLC, the manager of the Fund, also serves as manager of the PGIM Core Government Money Market Fund. |
See Notes to Financial Statements.
252
PGIM AAA CLO ETF
Schedule of Investments (continued)
as of August 31, 2023
Fair Value Measurements:
Various inputs are used in determining the value of the Fund’s investments. These inputs are summarized in the three broad levels listed below.
Level 1—unadjusted quoted prices generally in active markets for identical securities.
Level 2—quoted prices for similar securities, interest rates and yield curves, prepayment speeds, foreign currency exchange rates and other observable inputs.
Level 3—unobservable inputs for securities valued in accordance with Board approved fair valuation procedures.
The following is a summary of the inputs used as of August 31, 2023 in valuing such portfolio securities:
| | | | | | | | | | | | | | | | | | | | |
| | | Level 1 | | | Level 2 | | | Level 3 | |
Investments in Securities | | | | | | | | | | | | | | | | | | | | |
Assets | | | | | | | | | | | | | | | | | | | | |
Long-Term Investments | | | | | | | | | | | | | | | | | | | | |
Asset-Backed Securities | | | | | | | | | | | | | | | | | | | | |
Collateralized Loan Obligations | | $ | — | | | $ | 123,469,097 | | | | | | | | $— | | | | | |
Short-Term Investment | | | | | | | | | | | | | | | | | | | | |
Affiliated Mutual Fund | | | 5,633,877 | | | | — | | | | | | | | — | | | | | |
| | | | | | | | | | | | | | | | | | | | |
Total | | $ | 5,633,877 | | | $ | 123,469,097 | | | | | | | | $— | | | | | |
| | | | | | | | | | | | |
Sector Allocations:
The sector allocations of investments and liabilities in excess of other assets shown as a percentage of net assets as of August 31, 2023 were as follows:
| | | | |
Collateralized Loan Obligations | | | 97.9 | % |
Affiliated Mutual Fund | | | 4.5 | |
| | | | |
| | | 102.4 | |
Liabilities in excess of other assets | | | (2.4 | ) |
| | | | |
| | | 100.0 | % |
| | | | |
See Notes to Financial Statements.
PGIM Fixed Income ETFs 253
PGIM AAA CLO ETF
Statement of Assets & Liabilities
as of August 31, 2023
| | | | |
Assets | | | | |
| | |
Investments at value: | | | | |
Unaffiliated investments (cost $123,290,831) | | $ | 123,469,097 | |
Affiliated investments (cost $5,633,877) | | | 5,633,877 | |
Dividends and interest receivable | | | 999,220 | |
| | | | |
| |
Total Assets | | | 130,102,194 | |
| | | | |
| |
Liabilities | | | | |
| |
Payable for investments purchased | | | 4,000,000 | |
Management fee payable | | | 17,867 | |
| | | | |
| |
Total Liabilities | | | 4,017,867 | |
| | | | |
| |
Net Assets | | $ | 126,084,327 | |
| | | | |
| |
| | | | |
| | |
Net assets were comprised of: | | | | |
Common stock, at par | | $ | 2,500 | |
Paid-in capital in excess of par | | | 125,139,842 | |
Total distributable earnings (loss) | | | 941,985 | |
| | | | |
| |
Net assets, August 31, 2023 | | $ | 126,084,327 | |
| | | | |
| |
Net asset value, offering price and redemption price per share. ($126,084,327 ÷ 2,500,000 shares of common stock issued and outstanding) | | $ | 50.43 | |
| | | | |
See Notes to Financial Statements.
254
PGIM AAA CLO ETF
Statement of Operations
For the Period July 19, 2023* through August 31, 2023
| | | | |
Net Investment Income (Loss) | | | | |
| |
Income | | | | |
Interest income | | $ | 742,367 | |
Affiliated dividend income | | | 38,899 | |
| | | | |
| |
Total income | | | 781,266 | |
| | | | |
| |
Expenses | | | | |
Management fee | | | 22,240 | |
| | | | |
| |
Net investment income (loss) | | | 759,026 | |
| | | | |
| |
Realized And Unrealized Gain (Loss) On Investments | | | | |
Net realized gain (loss) on investment transactions | | | 4,693 | |
Net change in unrealized appreciation (depreciation) on investments | | | 178,266 | |
| | | | |
| |
Net gain (loss) on investment transactions | | | 182,959 | |
| | | | |
| |
Net Increase (Decrease) In Net Assets Resulting From Operations | | $ | 941,985 | |
| | | | |
| * | Commencement of operations. |
See Notes to Financial Statements.
PGIM Fixed Income ETFs 255
PGIM AAA CLO ETF
Statement of Changes in Net Assets
| | | | | | | |
| | | July 19, 2023* through
August 31, 2023 | | |
Increase (Decrease) in Net Assets | | | | | | | |
| | |
Operations | | | | | | | |
Net investment income (loss) | | | $ | 759,026 | | | |
Net realized gain (loss) on investment transactions | | | | 4,693 | | | |
Net change in unrealized appreciation (depreciation) on investments | | | | 178,266 | | | |
| | | | | | | |
| | |
Net increase (decrease) in net assets resulting from operations | | | | 941,985 | | | |
| | | | | | | |
| | |
Fund share transactions | | | | | | | |
Net proceeds from shares sold (2,500,000 shares) | | | | 125,142,342 | | | |
| | | | | | | |
Total increase (decrease) | | | | 126,084,327 | | | |
| | |
Net Assets: | | | | | | | |
| | |
Beginning of period | | | | — | | | |
| | | | | | | |
| | |
End of period | | | $ | 126,084,327 | | | |
| | | | | | | |
| * | Commencement of operations. |
See Notes to Financial Statements.
256
PGIM AAA CLO ETF
Financial Highlights
| | | | | | | |
| | | | | | | | |
| | | July 19, 2023(a)
through August 31,
2023 | | |
| | | |
| Per Share Operating Performance(b): | | | | | | | |
| Net Asset Value, Beginning of Period | | | | $50.00 | | | |
| Income (loss) from investment operations: | | | | | | | |
| Net investment income (loss) | | | | 0.39 | | | |
| Net realized and unrealized gain (loss) on investment transactions | | | | 0.04 | | | |
| Total from investment operations | | | | 0.43 | | | |
| Net asset value, end of period | | | | $50.43 | | | |
| Total Return(c): | | | | 0.87 | % | | |
| | | | | | | | |
| | | |
| Ratios/Supplemental Data: | | | | | | | |
| Net assets, end of period (000) | | | | $126,084 | | | |
| Average net assets (000) | | | | $99,359 | | | |
| Ratios to average net assets(d): | | | | | | | |
| Expenses after waivers and/or expense reimbursement | | | | 0.19 | %(e) | | |
| Expenses before waivers and/or expense reimbursement | | | | 0.19 | %(e) | | |
| Net investment income (loss) | | | | 6.48 | %(e) | | |
| Portfolio turnover rate(f) | | | | 4 | % | | |
| (a) | Commencement of operations. |
| (b) | Calculated based on average shares outstanding during the period. |
| (c) | Total return is calculated assuming a purchase of a share on the first day and a sale on the last day of each period reported and includes reinvestment of dividends and distributions, if any. Total returns may reflect adjustments to conform to GAAP. Total returns for periods less than one full year are not annualized. |
| (d) | Does not include expenses of the underlying funds in which the Fund invests. |
| (f) | The Fund’s portfolio turnover rate is calculated in accordance with regulatory requirements, without regard to transactions involving short-term investments, certain derivatives and in-kind transactions (if any). If such transactions were included, the Fund’s portfolio turnover rate may be higher. |
See Notes to Financial Statements.
PGIM Fixed Income ETFs 257
PGIM Short Duration Multi-Sector Bond ETF
Schedule of Investments
as of August 31, 2023
| | | | | | | | | | | | | | |
| | | | |
| Description | | Interest Rate | | Maturity Date | | Principal
Amount (000)# | | | Value | |
| | | | | |
LONG-TERM INVESTMENTS 100.0% | | | | | | | | | | | | | | |
| | | | | |
ASSET-BACKED SECURITIES 20.9% | | | | | | | | | | | | | | |
| | | | | |
Collateralized Loan Obligations | | | | | | | | | | | | | | |
AGL CLO Ltd. (Cayman Islands), | | | | | | | | | | | | | | |
Series 2021-14A, Class A, 144A, 3 Month SOFR + 1.412% (Cap N/A, Floor 1.150%) | | 6.745%(c) | | 12/02/34 | | | | | 250 | | | $ | 248,240 | |
Allegro CLO Ltd. (Cayman Islands), | | | | | | | | | | | | | | |
Series 2019-01A, Class AR, 144A, 3 Month SOFR + 1.412% (Cap N/A, Floor 1.150%) | | 6.738(c) | | 07/20/32 | | | | | 250 | | | | 248,040 | |
Barings Euro CLO DAC (Ireland), | | | | | | | | | | | | | | |
Series 2019-01A, Class AR, 144A, 3 Month EURIBOR + 0.960% (Cap N/A, Floor 0.960%) | | 4.623(c) | | 04/15/36 | | EUR | | | 250 | | | | 264,015 | |
Barrow Hanley CLO Ltd. (Cayman Islands), | | | | | | | | | | | | | | |
Series 2023-02A, Class A1, 144A, 3 Month SOFR + 2.050% (Cap N/A, Floor 2.050%) | | 7.389(c) | | 10/20/35 | | | | | 250 | | | | 250,022 | |
Benefit Street Partners CLO Ltd. (Cayman Islands), | | | | | | | | | | | | | | |
Series 2015-06BR, Class A, 144A, 3 Month SOFR + 1.452% (Cap N/A, Floor 1.190%) | | 6.778(c) | | 07/20/34 | | | | | 250 | | | | 248,000 | |
BlueMountain Fuji Eur CLO DAC (Ireland), | | | | | | | | | | | | | | |
Series 05A, Class B, 144A, 3 Month EURIBOR + 1.550% (Cap N/A, Floor 1.550%) | | 5.213(c) | | 01/15/33 | | EUR | | | 250 | | | | 262,394 | |
Broad River BSL Funding CLO Ltd. (Cayman Islands), | | | | | | | | | | | | | | |
Series 2020-01A, Class AR, 144A, 3 Month SOFR + 1.432% (Cap N/A, Floor 1.170%) | | 6.758(c) | | 07/20/34 | | | | | 250 | | | | 247,500 | |
Carlyle US CLO Ltd. (Cayman Islands), | | | | | | | | | | | | | | |
Series 2017-01A, Class A1R, 144A, 3 Month SOFR + 1.262% (Cap N/A, Floor 1.000%) | | 6.588(c) | | 04/20/31 | | | | | 249 | | | | 247,248 | |
Greywolf CLO Ltd. (Cayman Islands), | | | | | | | | | | | | | | |
Series 2018-02A, Class A1, 144A, 3 Month SOFR + 1.440% (Cap N/A, Floor 1.440%) | | 6.766(c) | | 10/20/31 | | | | | 250 | | | | 248,411 | |
LCM Ltd. (Cayman Islands), | | | | | | | | | | | | | | |
Series 34A, Class A1, 144A, 3 Month SOFR + 1.432% (Cap N/A, Floor 1.170%) | | 6.758(c) | | 10/20/34 | | | | | 250 | | | | 247,680 | |
Madison Park Funding Ltd. (Cayman Islands), | | | | | | | | | | | | | | |
Series 2021-38A, Class A, 144A, 3 Month SOFR + 1.382% (Cap N/A, Floor 1.382%) | | 6.690(c) | | 07/17/34 | | | | | 290 | | | | 287,568 | |
Mountain View CLO Ltd. (Cayman Islands), | | | | | | | | | | | | | | |
Series 2023-01A, Class B, 144A, 3 Month SOFR + 3.000% (Cap N/A, Floor 3.000%) | | 0.000(c) | | 09/14/36 | | | | | 250 | | | | 250,000 | |
Neuberger Berman CLO Ltd. (Cayman Islands), | | | | | | | | | | | | | | |
Series 2017-16SA, Class AR, 144A, 3 Month SOFR + 1.302% (Cap N/A, Floor 1.040%) | | 6.610(c) | | 04/15/34 | | | | | 250 | | | | 248,109 | |
See Notes to Financial Statements.
258
PGIM Short Duration Multi-Sector Bond ETF
Schedule of Investments (continued)
as of August 31, 2023
| | | | | | | | | | | | | | | | | | |
| | | | |
| Description | | Interest
Rate | | | Maturity
Date | | | Principal Amount (000)# | | | Value | |
| | | | | |
ASSET-BACKED SECURITIES (Continued) | | | | | | | | | | | | | | | | | | |
| | | | | |
Collateralized Loan Obligations (cont’d.) | | | | | | | | | | | | | | | | | | |
Oaktree CLO Ltd. (Cayman Islands), | | | | | | | | | | | | | | | | | | |
Series 2020-01A, Class AR, 144A, 3 Month SOFR + 1.412% (Cap N/A, Floor 1.150%) | | | 6.720%(c) | | | | 07/15/34 | | | | | | 250 | | | $ | 248,389 | |
OZLM Ltd. (Cayman Islands), | | | | | | | | | | | | | | | | | | |
Series 2014-09A, Class A1A3, 144A, 3 Month SOFR + 1.362% (Cap N/A, Floor 1.100%) | | | 6.688(c) | | | | 10/20/31 | | | | | | 250 | | | | 247,473 | |
PPM CLO Ltd. (Cayman Islands), | | | | | | | | | | | | | | | | | | |
Series 2021-05A, Class A, 144A, 3 Month SOFR + 1.462% (Cap N/A, Floor 1.200%) | | | 6.772(c) | | | | 10/18/34 | | | | | | 250 | | | | 247,118 | |
Romark WM-R Ltd. (Cayman Islands), | | | | | | | | | | | | | | | | | | |
Series 2018-01A, Class A1, 144A, 3 Month SOFR + 1.292% (Cap N/A, Floor 0.000%) | | | 6.618(c) | | | | 04/20/31 | | | | | | 245 | | | | 243,165 | |
Signal Peak CLO Ltd. (Cayman Islands), | | | | | | | | | | | | | | | | | | |
Series 2020-08A, Class A, 144A, 3 Month SOFR + 1.532% (Cap N/A, Floor 1.270%) | | | 6.858(c) | | | | 04/20/33 | | | | | | 250 | | | | 248,449 | |
Sound Point CLO Ltd. (Cayman Islands), | | | | | | | | | | | | | | | | | | |
Series 2019-01A, Class AR, 144A, 3 Month SOFR + 1.342% (Cap N/A, Floor 1.080%) | | | 6.668(c) | | | | 01/20/32 | | | | | | 250 | | | | 247,167 | |
Trinitas CLO Ltd. (Cayman Islands), | | | | | | | | | | | | | | | | | | |
Series 2022-20A, Class A1, 144A, 3 Month SOFR + 1.530% (Cap N/A, Floor 1.530%) | | | 6.856(c) | | | | 07/20/35 | | | | | | 250 | | | | 246,524 | |
Venture CLO Ltd. (Cayman Islands), | | | | | | | | | | | | | | | | | | |
Series 2019-36A, Class A1AR, 144A, 3 Month SOFR + 1.392% (Cap N/A, Floor 1.130%) | | | 6.718(c) | | | | 04/20/32 | | | | | | 250 | | | | 248,201 | |
| | | | | | | | | | | | | | | | | | |
| | | | | |
TOTAL ASSET-BACKED SECURITIES | | | | | | | | | | | | | | | | | | |
(cost $5,268,067) | | | | | | | | | | | | | | | | | 5,273,713 | |
| | | | | | | | | | | | | | | | | | |
| | | | | |
COMMERCIAL MORTGAGE-BACKED SECURITIES 13.9% | | | | | | | | | | | | | | | | | | |
BANK, | | | | | | | | | | | | | | | | | | |
Series 2023-BNK46, Class A21 | | | 6.950(cc) | | | | 08/15/56 | | | | | | 200 | | | | 205,492 | |
Benchmark Mortgage Trust, | | | | | | | | | | | | | | | | | | |
Series 2022-B33, Class A1 | | | 2.306 | | | | 03/15/55 | | | | | | 417 | | | | 389,868 | |
BMO Mortgage Trust, | | | | | | | | | | | | | | | | | | |
Series 2023-5C1, Class A3 | | | 6.534(cc) | | | | 08/15/56 | | | | | | 150 | | | | 154,425 | |
Series 2023-C06, Class A2 | | | 6.869(cc) | | | | 09/15/56 | | | | | | 200 | | | | 206,048 | |
Series 2023-C06, Class XB, IO | | | 0.348(cc) | | | | 09/15/56 | | | | | | 6,200 | | | | 102,693 | |
CENT Trust, | | | | | | | | | | | | | | | | | | |
Series 2023-CITY, Class A, 144A, 1 Month SOFR + 2.620% (Cap N/A, Floor 2.620%) | | | 7.870(c) | | | | 09/15/28 | | | | | | 50 | | | | 50,110 | |
See Notes to Financial Statements.
PGIM Fixed Income ETFs 259
PGIM Short Duration Multi-Sector Bond ETF
Schedule of Investments (continued)
as of August 31, 2023
| | | | | | | | | | | | | | | | | | |
| | | | |
| Description | | Interest
Rate | | | Maturity
Date | | | Principal Amount (000)# | | | Value | |
| | | | | |
COMMERCIAL MORTGAGE-BACKED SECURITIES (Continued) | | | | | | | | | | | | | | | | | | |
CGMS Commercial Mortgage Trust, | | | | | | | | | | | | | | | | | | |
Series 2017-B01, Class A3 | | | 3.197% | | | | 08/15/50 | | | | | | 194 | | | $ | 177,003 | |
Commercial Mortgage Trust, | | | | | | | | | | | | | | | | | | |
Series 2015-DC01, Class A5 | | | 3.350 | | | | 02/10/48 | | | | | | 250 | | | | 239,186 | |
Series 2016-COR01, Class A4 | | | 3.091 | | | | 10/10/49 | | | | | | 250 | | | | 228,528 | |
GS Mortgage Securities Trust, | | | | | | | | | | | | | | | | | | |
Series 2014-GC22, Class A4 | | | 3.587 | | | | 06/10/47 | | | | | | 220 | | | | 216,339 | |
Series 2019-GC40, Class A2 | | | 2.971 | | | | 07/10/52 | | | | | | 250 | | | | 242,586 | |
JPMCC Commercial Mortgage Securities Trust, | | | | | | | | | | | | | | | | | | |
Series 2019-COR04, Class A5 | | | 4.029 | | | | 03/10/52 | | | | | | 250 | | | | 224,281 | |
Morgan Stanley Bank of America Merrill Lynch Trust, | | | | | | | | | | | | | | | | | | |
Series 2015-C20, Class A4 | | | 3.249 | | | | 02/15/48 | | | | | | 300 | | | | 287,548 | |
Morgan Stanley Capital I Trust, | | | | | | | | | | | | | | | | | | |
Series 2015-UBS08, Class A4 | | | 3.809 | | | | 12/15/48 | | | | | | 250 | | | | 235,984 | |
UBS Commercial Mortgage Trust, | | | | | | | | | | | | | | | | | | |
Series 2017-C04, Class A3 | | | 3.301 | | | | 10/15/50 | | | | | | 273 | | | | 250,572 | |
Wells Fargo Commercial Mortgage Trust, | | | | | | | | | | | | | | | | | | |
Series 2020-C56, Class A1 | | | 1.341 | | | | 06/15/53 | | | | | | 305 | | | | 300,030 | |
| | | | | | | | | | | | | | | | | | |
| | | | | |
TOTAL COMMERCIAL MORTGAGE-BACKED SECURITIES | | | | | | | | | | | | | | | | | | |
(cost $3,505,628) | | | | | | | | | | | | | | | | | 3,510,693 | |
| | | | | | | | | | | | | | | | | | |
| | | | | |
CORPORATE BONDS 34.0% | | | | | | | | | | | | | | | | | | |
| | | | | |
Aerospace & Defense 1.0% | | | | | | | | | | | | | | | | | | |
Boeing Co. (The), | | | | | | | | | | | | | | | | | | |
Sr. Unsec’d. Notes | | | 2.196 | | | | 02/04/26 | | | | | | 150 | | | | 138,397 | |
Bombardier, Inc. (Canada), | | | | | | | | | | | | | | | | | | |
Sr. Unsec’d. Notes, 144A | | | 7.875 | | | | 04/15/27 | | | | | | 125 | | | | 124,688 | |
| | | | | | | | | | | | | | | | | | |
| | | | | |
| | | | | | | | | | | | | | | | | 263,085 | |
| | | | | |
Agriculture 0.4% | | | | | | | | | | | | | | | | | | |
BAT Capital Corp. (United Kingdom), | | | | | | | | | | | | | | | | | | |
Gtd. Notes | | | 2.259 | | | | 03/25/28 | | | | | | 115 | | | | 98,869 | |
See Notes to Financial Statements.
260
PGIM Short Duration Multi-Sector Bond ETF
Schedule of Investments (continued)
as of August 31, 2023
| | | | | | | | | | | | | | | | | | |
| | | | |
| Description | | Interest
Rate | | | Maturity
Date | | | Principal Amount (000)# | | | Value | |
| | | | | |
CORPORATE BONDS (Continued) | | | | | | | | | | | | | | | | | | |
| | | | | |
Airlines 0.4% | | | | | | | | | | | | | | | | | | |
Delta Air Lines, Inc./SkyMiles IP Ltd., | | | | | | | | | | | | | | | | | | |
Sr. Sec’d. Notes, 144A | | | 4.750% | | | | 10/20/28 | | | | | | 75 | | | $ | 71,906 | |
United Airlines, Inc., | | | | | | | | | | | | | | | | | | |
Sr. Sec’d. Notes, 144A | | | 4.375 | | | | 04/15/26 | | | | | | 25 | | | | 23,574 | |
| | | | | | | | | | | | | | | | | | |
| | | | | |
| | | | | | | | | | | | | | | | | 95,480 | |
| | | | | |
Apparel 0.1% | | | | | | | | | | | | | | | | | | |
Hanesbrands, Inc., | | | | | | | | | | | | | | | | | | |
Gtd. Notes, 144A | | | 4.875 | | | | 05/15/26 | | | | | | 25 | | | | 23,373 | |
| | | | | |
Auto Manufacturers 1.4% | | | | | | | | | | | | | | | | | | |
Ford Motor Credit Co. LLC, | | | | | | | | | | | | | | | | | | |
Sr. Unsec’d. Notes | | | 6.800 | | | | 05/12/28 | | | | | | 200 | | | | 199,864 | |
General Motors Financial Co., Inc., | | | | | | | | | | | | | | | | | | |
Sr. Unsec’d. Notes | | | 1.250 | | | | 01/08/26 | | | | | | 180 | | | | 161,682 | |
| | | | | | | | | | | | | | | | | | |
| | | | | |
| | | | | | | | | | | | | | | | | 361,546 | |
| | | | | |
Auto Parts & Equipment 0.4% | | | | | | | | | | | | | | | | | | |
BorgWarner, Inc., | | | | | | | | | | | | | | | | | | |
Sr. Unsec’d. Notes, 144A | | | 5.000 | | | | 10/01/25 | | | | | | 80 | | | | 78,661 | |
Dana, Inc., | | | | | | | | | | | | | | | | | | |
Sr. Unsec’d. Notes | | | 5.625 | | | | 06/15/28 | | | | | | 25 | | | | 23,523 | |
| | | | | | | | | | | | | | | | | | |
| | | | | |
| | | | | | | | | | | | | | | | | 102,184 | |
| | | | | |
Banks 9.7% | | | | | | | | | | | | | | | | | | |
Bank of America Corp., | | | | | | | | | | | | | | | | | | |
Sr. Unsec’d. Notes | | | 5.202(ff) | | | | 04/25/29 | | | | | | 315 | | | | 310,066 | |
Barclays PLC (United Kingdom), | | | | | | | | | | | | | | | | | | |
Sr. Unsec’d. Notes | | | 5.829(ff) | | | | 05/09/27 | | | | | | 200 | | | | 198,050 | |
Citigroup, Inc., | | | | | | | | | | | | | | | | | | |
Sub. Notes | | | 4.450 | | | | 09/29/27 | | | | | | 195 | | | | 186,402 | |
Deutsche Bank AG (Germany), | | | | | | | | | | | | | | | | | | |
Sr. Unsec’d. Notes | | | 7.146(ff) | | | | 07/13/27 | | | | | | 150 | | | | 152,423 | |
Fifth Third Bancorp, | | | | | | | | | | | | | | | | | | |
Sr. Unsec’d. Notes | | | 6.339(ff) | | | | 07/27/29 | | | | | | 20 | | | | 20,235 | |
Goldman Sachs Group, Inc. (The), | | | | | | | | | | | | | | | | | | |
Sr. Unsec’d. Notes | | | 1.542(ff) | | | | 09/10/27 | | | | | | 140 | | | | 123,538 | |
See Notes to Financial Statements.
PGIM Fixed Income ETFs 261
PGIM Short Duration Multi-Sector Bond ETF
Schedule of Investments (continued)
as of August 31, 2023
| | | | | | | | | | | | | | | | | | |
| | | | |
| Description | | Interest
Rate | | | Maturity
Date | | | Principal Amount (000)# | | | Value | |
| | | | | |
CORPORATE BONDS (Continued) | | | | | | | | | | | | | | | | | | |
| | | | | |
Banks (cont’d.) | | | | | | | | | | | | | | | | | | |
Goldman Sachs Group, Inc. (The), (cont’d.) | | | | | | | | | | | | | | | | | | |
Sr. Unsec’d. Notes | | | 5.798%(ff) | | | | 08/10/26 | | | | | | 180 | | | $ | 179,388 | |
Huntington Bancshares, Inc., | | | | | | | | | | | | | | | | | | |
Sr. Unsec’d. Notes | | | 6.208(ff) | | | | 08/21/29 | | | | | | 10 | | | | 10,065 | |
JPMorgan Chase & Co., | | | | | | | | | | | | | | | | | | |
Sr. Unsec’d. Notes | | | 5.299(ff) | | | | 07/24/29 | | | | | | 500 | | | | 497,144 | |
Morgan Stanley, | | | | | | | | | | | | | | | | | | |
Sr. Unsec’d. Notes | | | 5.449(ff) | | | | 07/20/29 | | | | | | 300 | | | | 298,211 | |
PNC Financial Services Group, Inc. (The), | | | | | | | | | | | | | | | | | | |
Sr. Unsec’d. Notes | | | 5.812(ff) | | | | 06/12/26 | | | | | | 85 | | | | 84,911 | |
Truist Financial Corp., | | | | | | | | | | | | | | | | | | |
Sr. Unsec’d. Notes, MTN | | | 6.047(ff) | | | | 06/08/27 | | | | | | 125 | | | | 124,923 | |
Wells Fargo & Co., | | | | | | | | | | | | | | | | | | |
Sr. Unsec’d. Notes, MTN | | | 5.574(ff) | | | | 07/25/29 | | | | | | 250 | | | | 248,885 | |
| | | | | | | | | | | | | | | | | | |
| | | | | |
| | | | | | | | | | | | | | | | | 2,434,241 | |
| | | | | |
Building Materials 0.2% | | | | | | | | | | | | | | | | | | |
JELD-WEN, Inc., | | | | | | | | | | | | | | | | | | |
Gtd. Notes, 144A | | | 4.875 | | | | 12/15/27 | | | | | | 25 | | | | 22,294 | |
Standard Industries, Inc., | | | | | | | | | | | | | | | | | | |
Sr. Unsec’d. Notes, 144A | | | 4.750 | | | | 01/15/28 | | | | | | 25 | | | | 23,013 | |
| | | | | | | | | | | | | | | | | | |
| | | | | |
| | | | | | | | | | | | | | | | | 45,307 | |
| | | | | |
Commercial Services 0.7% | | | | | | | | | | | | | | | | | | |
Allied Universal Holdco LLC/Allied Universal Finance Corp., | | | | | | | | | | | | | | | | | | |
Sr. Sec’d. Notes, 144A | | | 6.625 | | | | 07/15/26 | | | | | | 25 | | | | 23,799 | |
Sr. Unsec’d. Notes, 144A | | | 9.750 | | | | 07/15/27 | | | | | | 50 | | | | 45,924 | |
Brink’s Co. (The), | | | | | | | | | | | | | | | | | | |
Gtd. Notes, 144A | | | 4.625 | | | | 10/15/27 | | | | | | 25 | | | | 23,259 | |
Nexi SpA (Italy), | | | | | | | | | | | | | | | | | | |
Sr. Unsec’d. Notes | | | 2.125 | | | | 04/30/29 | | | EUR | | | 100 | | | | 92,125 | |
| | | | | | | | | | | | | | | | | | |
| | | | | |
| | | | | | | | | | | | | | | | | 185,107 | |
| | | | | |
Computers 0.3% | | | | | | | | | | | | | | | | | | |
Leidos, Inc., | | | | | | | | | | | | | | | | | | |
Gtd. Notes | | | 3.625 | | | | 05/15/25 | | | | | | 80 | | | | 77,081 | |
See Notes to Financial Statements.
262
PGIM Short Duration Multi-Sector Bond ETF
Schedule of Investments (continued)
as of August 31, 2023
| | | | | | | | | | | | | | |
| | | | |
| Description | | Interest
Rate | | Maturity
Date | | Principal Amount (000)# | | | Value | |
| | | | | |
CORPORATE BONDS (Continued) | | | | | | | | | | | | | | |
| | | | | |
Distribution/Wholesale 0.2% | | | | | | | | | | | | | | |
H&E Equipment Services, Inc., | | | | | | | | | | | | | | |
Gtd. Notes, 144A | | 3.875% | | 12/15/28 | | | | | 50 | | | $ | 43,667 | |
| | | | | |
Diversified Financial Services 0.5% | | | | | | | | | | | | | | |
Jefferies Financial Group, Inc., | | | | | | | | | | | | | | |
Sr. Unsec’d. Notes | | 5.875 | | 07/21/28 | | | | | 85 | | | | 84,074 | |
Nationstar Mortgage Holdings, Inc., | | | | | | | | | | | | | | |
Gtd. Notes, 144A | | 6.000 | | 01/15/27 | | | | | 25 | | | | 23,994 | |
OneMain Finance Corp., | | | | | | | | | | | | | | |
Gtd. Notes | | 3.875 | | 09/15/28 | | | | | 25 | | | | 20,497 | |
| | | | | | | | | | | | | | |
| | | | | |
| | | | | | | | | | | | | 128,565 | |
| | | | | |
Electric 2.4% | | | | | | | | | | | | | | |
American Electric Power Co., Inc., | | | | | | | | | | | | | | |
Jr. Sub. Notes | | 5.699 | | 08/15/25 | | | | | 75 | | | | 75,048 | |
Calpine Corp., | | | | | | | | | | | | | | |
Sr. Unsec’d. Notes, 144A | | 4.625 | | 02/01/29 | | | | | 50 | | | | 43,459 | |
NextEra Energy Capital Holdings, Inc., | | | | | | | | | | | | | | |
Gtd. Notes | | 5.749 | | 09/01/25 | | | | | 130 | | | | 130,375 | |
NRG Energy, Inc., | | | | | | | | | | | | | | |
Gtd. Notes | | 5.750 | | 01/15/28 | | | | | 50 | | | | 47,300 | |
Pennsylvania Electric Co., | | | | | | | | | | | | | | |
Sr. Unsec’d. Notes, 144A | | 5.150 | | 03/30/26 | | | | | 60 | | | | 59,057 | |
Southern California Edison Co., | | | | | | | | | | | | | | |
First Mortgage | | 4.900 | | 06/01/26 | | | | | 125 | | | | 124,268 | |
Vistra Corp., | | | | | | | | | | | | | | |
Jr. Sub. Notes, 144A | | 8.000(ff) | | 10/15/26(oo) | | | | | 50 | | | | 47,949 | |
Vistra Operations Co. LLC, | | | | | | | | | | | | | | |
Gtd. Notes, 144A | | 4.375 | | 05/01/29 | | | | | 25 | | | | 22,034 | |
Gtd. Notes, 144A | | 5.000 | | 07/31/27 | | | | | 50 | | | | 47,073 | |
| | | | | | | | | | | | | | |
| | | | | |
| | | | | | | | | | | | | 596,563 | |
See Notes to Financial Statements.
PGIM Fixed Income ETFs 263
PGIM Short Duration Multi-Sector Bond ETF
Schedule of Investments (continued)
as of August 31, 2023
| | | | | | | | | | | | | | | | | | |
| | | | |
| Description | | Interest
Rate | | | Maturity
Date | | | Principal Amount (000)# | | | Value | |
| | | | | |
CORPORATE BONDS (Continued) | | | | | | | | | | | | | | | | | | |
| | | | | |
Engineering & Construction 1.0% | | | | | | | | | | | | | | | | | | |
Jacobs Engineering Group, Inc., | | | | | | | | | | | | | | | | | | |
Gtd. Notes | | | 6.350% | | | | 08/18/28 | | | | | | 65 | | | $ | 66,111 | |
Mexico City Airport Trust (Mexico), | | | | | | | | | | | | | | | | | | |
Sr. Sec’d. Notes, 144A | | | 4.250 | | | | 10/31/26 | | | | | | 200 | | | | 190,165 | |
| | | | | | | | | | | | | | | | | | |
| | | | | |
| | | | | | | | | | | | | | | | | 256,276 | |
| | | | | |
Entertainment 0.9% | | | | | | | | | | | | | | | | | | |
Caesars Entertainment, Inc., | | | | | | | | | | | | | | | | | | |
Sr. Unsec’d. Notes, 144A | | | 4.625 | | | | 10/15/29 | | | | | | 75 | | | | 65,597 | |
Penn Entertainment, Inc., | | | | | | | | | | | | | | | | | | |
Sr. Unsec’d. Notes, 144A | | | 5.625 | | | | 01/15/27 | | | | | | 25 | | | | 23,720 | |
Warnermedia Holdings, Inc., | | | | | | | | | | | | | | | | | | |
Gtd. Notes | | | 3.755 | | | | 03/15/27 | | | | | | 160 | | | | 149,980 | |
| | | | | | | | | | | | | | | | | | |
| | | | | |
| | | | | | | | | | | | | | | | | 239,297 | |
| | | | | |
Foods 0.9% | | | | | | | | | | | | | | | | | | |
Albertson’s Cos., Inc./Safeway, Inc./New Albertson’s | | | | | | | | | | | | | | | | | | |
LP/Albertson’s LLC, | | | | | | | | | | | | | | | | | | |
Gtd. Notes, 144A | | | 6.500 | | | | 02/15/28 | | | | | | 25 | | | | 24,878 | |
B&G Foods, Inc., | | | | | | | | | | | | | | | | | | |
Gtd. Notes | | | 5.250 | | | | 04/01/25 | | | | | | 25 | | | | 24,413 | |
Gtd. Notes | | | 5.250 | | | | 09/15/27 | | | | | | 25 | | | | 22,139 | |
Bellis Finco PLC (United Kingdom), | | | | | | | | | | | | | | | | | | |
Gtd. Notes | | | 4.000 | | | | 02/16/27 | | | GBP | | | 100 | | | | 97,604 | |
Chobani LLC/Chobani Finance Corp., Inc., | | | | | | | | | | | | | | | | | | |
Gtd. Notes, 144A | | | 7.500 | | | | 04/15/25 | | | | | | 25 | | | | 24,978 | |
US Foods, Inc., | | | | | | | | | | | | | | | | | | |
Sr. Sec’d. Notes, 144A | | | 6.250 | | | | 04/15/25 | | | | | | 25 | | | | 25,070 | |
| | | | | | | | | | | | | | | | | | |
| | | | | |
| | | | | | | | | | | | | | | | | 219,082 | |
| | | | | |
Gas 0.1% | | | | | | | | | | | | | | | | | | |
AmeriGas Partners LP/AmeriGas Finance Corp., | | | | | | | | | | | | | | | | | | |
Sr. Unsec’d. Notes | | | 5.875 | | | | 08/20/26 | | | | | | 25 | | | | 23,705 | |
See Notes to Financial Statements.
264
PGIM Short Duration Multi-Sector Bond ETF
Schedule of Investments (continued)
as of August 31, 2023
| | | | | | | | | | | | | | | | | | |
| | | | |
| Description | | Interest
Rate | | | Maturity
Date | | | Principal Amount (000)# | | | Value | |
| | | | | |
CORPORATE BONDS (Continued) | | | | | | | | | | | | | | | | | | |
| | | | | |
Healthcare-Services 0.3% | | | | | | | | | | | | | | | | | | |
Legacy LifePoint Health LLC, | | | | | | | | | | | | | | | | | | |
Sr. Sec’d. Notes, 144A | | | 4.375% | | | | 02/15/27 | | | | | | 50 | | | $ | 43,262 | |
Tenet Healthcare Corp., | | | | | | | | | | | | | | | | | | |
Gtd. Notes | | | 6.125 | | | | 10/01/28 | | | | | | 25 | | | | 24,079 | |
| | | | | | | | | | | | | | | | | | |
| | | | | |
| | | | | | | | | | | | | | | | | 67,341 | |
| | | | | |
Home Builders 0.7% | | | | | | | | | | | | | | | | | | |
Beazer Homes USA, Inc., | | | | | | | | | | | | | | | | | | |
Gtd. Notes | | | 7.250 | | | | 10/15/29 | | | | | | 25 | | | | 24,239 | |
Empire Communities Corp. (Canada), | | | | | | | | | | | | | | | | | | |
Sr. Unsec’d. Notes, 144A | | | 7.000 | | | | 12/15/25 | | | | | | 50 | | | | 48,313 | |
M/I Homes, Inc., | | | | | | | | | | | | | | | | | | |
Gtd. Notes | | | 4.950 | | | | 02/01/28 | | | | | | 25 | | | | 23,226 | |
Mattamy Group Corp. (Canada), | | | | | | | | | | | | | | | | | | |
Sr. Unsec’d. Notes, 144A | | | 5.250 | | | | 12/15/27 | | | | | | 25 | | | | 23,406 | |
Taylor Morrison Communities, Inc., | | | | | | | | | | | | | | | | | | |
Gtd. Notes, 144A | | | 5.875 | | | | 06/15/27 | | | | | | 25 | | | | 24,566 | |
Tri Pointe Homes, Inc., | | | | | | | | | | | | | | | | | | |
Gtd. Notes | | | 5.250 | | | | 06/01/27 | | | | | | 25 | | | | 23,870 | |
| | | | | | | | | | | | | | | | | | |
| | | | | |
| | | | | | | | | | | | | | | | | 167,620 | |
| | | | | |
Leisure Time 0.3% | | | | | | | | | | | | | | | | | | |
NCL Corp. Ltd., | | | | | | | | | | | | | | | | | | |
Gtd. Notes, 144A | | | 5.875 | | | | 03/15/26 | | | | | | 50 | | | | 47,001 | |
Viking Cruises Ltd., | | | | | | | | | | | | | | | | | | |
Gtd. Notes, 144A | | | 5.875 | | | | 09/15/27 | | | | | | 25 | | | | 23,250 | |
| | | | | | | | | | | | | | | | | | |
| | | | | |
| | | | | | | | | | | | | | | | | 70,251 | |
| | | | | |
Lodging 0.6% | | | | | | | | | | | | | | | | | | |
Hyatt Hotels Corp., | | | | | | | | | | | | | | | | | | |
Sr. Unsec’d. Notes | | | 5.750 | | | | 01/30/27 | | | | | | 75 | | | | 75,164 | |
MGM Resorts International, | | | | | | | | | | | | | | | | | | |
Gtd. Notes | | | 6.750 | | | | 05/01/25 | | | | | | 75 | | | | 75,119 | |
| | | | | | | | | | | | | | | | | | |
| | | | | |
| | | | | | | | | | | | | | | | | 150,283 | |
See Notes to Financial Statements.
PGIM Fixed Income ETFs 265
PGIM Short Duration Multi-Sector Bond ETF
Schedule of Investments (continued)
as of August 31, 2023
| | | | | | | | | | | | | | | | | | |
| | | | |
| Description | | Interest
Rate | | | Maturity
Date | | | Principal Amount (000)# | | | Value | |
| | | | | |
CORPORATE BONDS (Continued) | | | | | | | | | | | | | | | | | | |
| | | | | |
Machinery-Diversified 0.1% | | | | | | | | | | | | | | | | | | |
| | | | | |
Otis Worldwide Corp., | | | | | | | | | | | | | | | | | | |
Sr. Unsec’d. Notes | | | 5.250% | | | | 08/16/28 | | | | | | 35 | | | $ | 35,238 | |
| | | | | |
Media 1.3% | | | | | | | | | | | | | | | | | | |
| | | | | |
CCO Holdings LLC/CCO Holdings Capital Corp., | | | | | | | | | | | | | | | | | | |
Sr. Unsec’d. Notes, 144A | | | 5.125 | | | | 05/01/27 | | | | | | 50 | | | | 47,013 | |
Cox Communications, Inc., | | | | | | | | | | | | | | | | | | |
Sr. Unsec’d. Notes, 144A | | | 3.350 | | | | 09/15/26 | | | | | | 80 | | | | 75,133 | |
DISH DBS Corp., | | | | | | | | | | | | | | | | | | |
Gtd. Notes | | | 7.750 | | | | 07/01/26 | | | | | | 25 | | | | 18,680 | |
DISH Network Corp., | | | | | | | | | | | | | | | | | | |
Sr. Sec’d. Notes, 144A | | | 11.750 | | | | 11/15/27 | | | | | | 25 | | | | 25,384 | |
Gray Television, Inc., | | | | | | | | | | | | | | | | | | |
Gtd. Notes, 144A | | | 5.875 | | | | 07/15/26 | | | | | | 25 | | | | 22,799 | |
Univision Communications, Inc., | | | | | | | | | | | | | | | | | | |
Sr. Sec’d. Notes, 144A | | | 6.625 | | | | 06/01/27 | | | | | | 50 | | | | 48,409 | |
Ziggo Bond Co. BV (Netherlands), | | | | | | | | | | | | | | | | | | |
Gtd. Notes | | | 3.375 | | | | 02/28/30 | | | EUR | | | 100 | | | | 81,170 | |
| | | | | | | | | | | | | | | | | | |
| | | | | |
| | | | | | | | | | | | | | | | | 318,588 | |
| | | | | |
Mining 0.1% | | | | | | | | | | | | | | | | | | |
| | | | | |
Novelis Corp., | | | | | | | | | | | | | | | | | | |
Gtd. Notes, 144A | | | 3.250 | | | | 11/15/26 | | | | | | 25 | | | | 22,641 | |
| | | | | |
Oil & Gas 2.3% | | | | | | | | | | | | | | | | | | |
| | | | | |
Aker BP ASA (Norway), | | | | | | | | | | | | | | | | | | |
Sr. Unsec’d. Notes, 144A | | | 5.600 | | | | 06/13/28 | | | | | | 150 | | | | 148,646 | |
BP Capital Markets PLC (United Kingdom), | | | | | | | | | | | | | | | | | | |
Gtd. Notes | | | 4.375(ff) | | | | 06/22/25(oo) | | | | | | 75 | | | | 71,437 | |
Chesapeake Energy Corp., | | | | | | | | | | | | | | | | | | |
Gtd. Notes, 144A | | | 5.500 | | | | 02/01/26 | | | | | | 25 | | | | 24,449 | |
Endeavor Energy Resources LP/EER Finance, Inc., | | | | | | | | | | | | | | | | | | |
Sr. Unsec’d. Notes, 144A | | | 5.750 | | | | 01/30/28 | | | | | | 25 | | | | 24,463 | |
Energian Israel Finance Ltd. (Israel), | | | | | | | | | | | | | | | | | | |
Sr. Sec’d. Notes, 144A | | | 4.875 | | | | 03/30/26 | | | | | | 30 | | | | 28,074 | |
Sr. Sec’d. Notes, 144A | | | 5.375 | | | | 03/30/28 | | | | | | 30 | | | | 27,263 | |
MEG Energy Corp. (Canada), | | | | | | | | | | | | | | | | | | |
Gtd. Notes, 144A | | | 5.875 | | | | 02/01/29 | | | | | | 25 | | | | 23,898 | |
See Notes to Financial Statements.
266
PGIM Short Duration Multi-Sector Bond ETF
Schedule of Investments (continued)
as of August 31, 2023
| | | | | | | | | | | | | | | | | | |
| | | | |
| Description | | Interest Rate | | | Maturity Date | | | Principal Amount (000)# | | | Value | |
| | | | | |
CORPORATE BONDS (Continued) | | | | | | | | | | | | | | | | | | |
| | | | | |
Oil & Gas (cont’d.) | | | | | | | | | | | | | | | | | | |
| | | | | |
Ovintiv, Inc., | | | | | | | | | | | | | | | | | | |
Gtd. Notes | | | 5.650% | | | | 05/15/28 | | | | | | 90 | | | $ | 89,443 | |
Parkland Corp. (Canada), | | | | | | | | | | | | | | | | | | |
Gtd. Notes, 144A | | | 5.875 | | | | 07/15/27 | | | | | | 50 | | | | 48,125 | |
Petroleos Mexicanos (Mexico), | | | | | | | | | | | | | | | | | | |
Gtd. Notes, EMTN | | | 4.875 | | | | 02/21/28 | | | EUR | | | 100 | | | | 86,302 | |
| | | | | | | | | | | | | | | | | | |
| | | | | |
| | | | | | | | | | | | | | | | | 572,100 | |
| | | | | |
Packaging & Containers 0.4% | | | | | | | | | | | | | | | | | | |
| | | | | |
Berry Global, Inc., | | | | | | | | | | | | | | | | | | |
Sr. Sec’d. Notes, 144A | | | 5.500 | | | | 04/15/28 | | | | | | 60 | | | | 58,943 | |
Pactiv Evergreen Group Issuer LLC/Pactiv Evergreen Group Issuer, Inc., | | | | | | | | | | | | | | | | | | |
Sr. Sec’d. Notes, 144A | | | 4.375 | | | | 10/15/28 | | | | | | 25 | | | | 22,307 | |
Sealed Air Corp./Sealed Air Corp. US, | | | | | | | | | | | | | | | | | | |
Gtd. Notes, 144A | | | 6.125 | | | | 02/01/28 | | | | | | 25 | | | | 24,624 | |
| | | | | | | | | | | | | | | | | | |
| | | | | |
| | | | | | | | | | | | | | | | | 105,874 | |
| | | | | |
Pipelines 2.9% | | | | | | | | | | | | | | | | | | |
| | | | | |
Antero Midstream Partners LP/Antero Midstream Finance Corp., | | | | | | | | | | | | | | | | | | |
Gtd. Notes, 144A | | | 5.750 | | | | 01/15/28 | | | | | | 50 | | | | 47,863 | |
Columbia Pipelines Operating Co. LLC, | | | | | | | | | | | | | | | | | | |
Sr. Unsec’d. Notes, 144A | | | 5.927 | | | | 08/15/30 | | | | | | 15 | | | | 15,130 | |
Energy Transfer LP, | | | | | | | | | | | | | | | | | | |
Jr. Sub. Notes, Series G | | | 7.125(ff) | | | | 05/15/30(oo) | | | | | | 70 | | | | 62,047 | |
MPLX LP, | | | | | | | | | | | | | | | | | | |
Sr. Unsec’d. Notes | | | 1.750 | | | | 03/01/26 | | | | | | 160 | | | | 145,736 | |
ONEOK, Inc., | | | | | | | | | | | | | | | | | | |
Gtd. Notes | | | 4.550 | | | | 07/15/28 | | | | | | 100 | | | | 95,354 | |
Gtd. Notes | | | 5.650 | | | | 11/01/28 | | | | | | 35 | | | | 35,059 | |
Tallgrass Energy Partners LP/Tallgrass Energy Finance Corp., | | | | | | | | | | | | | | | | | | |
Gtd. Notes, 144A | | | 7.500 | | | | 10/01/25 | | | | | | 25 | | | | 25,102 | |
Targa Resources Corp., | | | | | | | | | | | | | | | | | | |
Gtd. Notes | | | 5.200 | | | | 07/01/27 | | | | | | 125 | | | | 123,762 | |
See Notes to Financial Statements.
PGIM Fixed Income ETFs 267
PGIM Short Duration Multi-Sector Bond ETF
Schedule of Investments (continued)
as of August 31, 2023
| | | | | | | | | | | | | | |
| | | | |
| Description | | Interest Rate | | Maturity Date | | Principal Amount (000)# | | | Value | |
| | | | | |
CORPORATE BONDS (Continued) | | | | | | | | | | | | | | |
| | | | | |
Pipelines (cont’d.) | | | | | | | | | | | | | | |
| | | | | |
Western Midstream Operating LP, | | | | | | | | | | | | | | |
Sr. Unsec’d. Notes | | 4.650% | | 07/01/26 | | | | | 130 | | | $ | 125,936 | |
Williams Cos., Inc. (The), | | | | | | | | | | | | | | |
Sr. Unsec’d. Notes | | 5.400 | | 03/02/26 | | | | | 70 | | | | 69,895 | |
| | | | | | | | | | | | | | |
| | | | | |
| | | | | | | | | | | | | 745,884 | |
| | | | | |
Real Estate Investment Trusts (REITs) 2.3% | | | | | | | | | | | | | | |
| | | | | |
American Tower Corp., | | | | | | | | | | | | | | |
Sr. Unsec’d. Notes | | 3.600 | | 01/15/28 | | | | | 70 | | | | 64,570 | |
Brixmor Operating Partnership LP, | | | | | | | | | | | | | | |
Sr. Unsec’d. Notes | | 3.900 | | 03/15/27 | | | | | 95 | | | | 88,291 | |
Crown Castle, Inc., | | | | | | | | | | | | | | |
Sr. Unsec’d. Notes | | 4.800 | | 09/01/28 | | | | | 90 | | | | 87,378 | |
Diversified Healthcare Trust, | | | | | | | | | | | | | | |
Gtd. Notes | | 9.750 | | 06/15/25 | | | | | 25 | | | | 24,600 | |
GLP Capital LP/GLP Financing II, Inc., | | | | | | | | | | | | | | |
Gtd. Notes | | 5.250 | | 06/01/25 | | | | | 65 | | | | 63,855 | |
Park Intermediate Holdings LLC/PK Domestic
Property LLC/PK Finance Co-Issuer, | | | | | | | | | | | | | | |
Sr. Sec’d. Notes, 144A | | 7.500 | | 06/01/25 | | | | | 25 | | | | 25,094 | |
Public Storage Operating Co., | | | | | | | | | | | | | | |
Sr. Unsec’d. Notes | | 5.125 | | 01/15/29 | | | | | 65 | | | | 64,893 | |
Realty Income Corp., | | | | | | | | | | | | | | |
Sr. Unsec’d. Notes | | 4.700 | | 12/15/28 | | | | | 75 | | | | 72,768 | |
Starwood Property Trust, Inc., | | | | | | | | | | | | | | |
Sr. Unsec’d. Notes, 144A | | 3.625 | | 07/15/26 | | | | | 25 | | | | 22,370 | |
Sun Communities Operating LP, | | | | | | | | | | | | | | |
Gtd. Notes | | 2.300 | | 11/01/28 | | | | | 75 | | | | 63,101 | |
| | | | | | | | | | | | | | |
| | | | | |
| | | | | | | | | | | | | 576,920 | |
| | | | | |
Retail 0.7% | | | | | | | | | | | | | | |
| | | | | |
1011778 BC ULC/New Red Finance, Inc. (Canada), | | | | | | | | | | | | | | |
Sr. Sec’d. Notes, 144A | | 3.875 | | 01/15/28 | | | | | 25 | | | | 22,563 | |
eG Global Finance PLC (United Kingdom), | | | | | | | | | | | | | | |
Sr. Sec’d. Notes | | 6.250 | | 10/30/25 | | EUR | | | 92 | | | | 97,477 | |
See Notes to Financial Statements.
268
PGIM Short Duration Multi-Sector Bond ETF
Schedule of Investments (continued)
as of August 31, 2023
| | | | | | | | | | | | | | | | | | |
| | | | |
| Description | | Interest Rate | | | Maturity Date | | | Principal
Amount
(000)# | | | Value | |
| | | | | |
CORPORATE BONDS (Continued) | | | | | | | | | | | | | | | | | | |
| | | | | |
Retail (cont’d.) | | | | | | | | | | | | | | | | | | |
| | | | | |
Sally Holdings LLC/Sally Capital, Inc., | | | | | | | | | | | | | | | | | | |
Gtd. Notes | | | 5.625% | | | | 12/01/25 | | | | | | 25 | | | $ | 24,822 | |
Suburban Propane Partners LP/Suburban Energy Finance Corp., | | | | | | | | | | | | | | | | | | |
Sr. Unsec’d. Notes | | | 5.875 | | | | 03/01/27 | | | | | | 25 | | | | 24,581 | |
| | | | | | | | | | | | | | | | | | |
| | | | | |
| | | | | | | | | | | | | | | | | 169,443 | |
| | | | | |
Software 0.2% | | | | | | | | | | | | | | | | | | |
| | | | | |
Fiserv, Inc., | | | | | | | | | | | | | | | | | | |
Sr. Unsec’d. Notes | | | 5.375 | | | | 08/21/28 | | | | | | 60 | | | | 60,167 | |
| | | | | |
Telecommunications 0.9% | | | | | | | | | | | | | | | | | | |
| | | | | |
T-Mobile USA, Inc., | | | | | | | | | | | | | | | | | | |
Gtd. Notes | | | 3.750 | | | | 04/15/27 | | | | | | 115 | | | | 108,905 | |
Vmed O2 UK Financing I PLC (United Kingdom), | | | | | | | | | | | | | | | | | | |
Sr. Sec’d. Notes | | | 4.000 | | | | 01/31/29 | | | GBP | | | 100 | | | | 101,049 | |
Zayo Group Holdings, Inc., | | | | | | | | | | | | | | | | | | |
Sr. Sec’d. Notes, 144A | | | 4.000 | | | | 03/01/27 | | | | | | 25 | | | | 18,720 | |
| | | | | | | | | | | | | | | | | | |
| | | | | |
| | | | | | | | | | | | | | | | | 228,674 | |
| | | | | |
Trucking & Leasing 0.3% | | | | | | | | | | | | | | | | | | |
| | | | | |
Penske Truck Leasing Co. LP/PTL Finance Corp., | | | | | | | | | | | | | | | | | | |
Sr. Unsec’d. Notes, 144A | | | 5.750 | | | | 05/24/26 | | | | | | 75 | | | | 74,431 | |
| | | | | | | | | | | | | | | | | | |
| | | | | |
TOTAL CORPORATE BONDS
(cost $8,627,264) | | | | | | | | | | | | | | | | | 8,558,883 | |
| | | | | | | | | | | | | | | | | | |
| | | | | |
RESIDENTIAL MORTGAGE-BACKED SECURITIES 1.6% | | | | | | | | | | | | | | | | | | |
| | | | | |
Connecticut Avenue Securities Trust, | | | | | | | | | | | | | | | | | | |
Series 2022-R04, Class 1M2, 144A, 30 Day Average SOFR + 3.100% (Cap N/A, Floor 0.000%) | | | 8.388(c) | | | | 03/25/42 | | | | | | 100 | | | | 101,438 | |
Series 2022-R07, Class 1B1, 144A, 30 Day Average SOFR + 6.800% (Cap N/A, Floor 0.000%) | | | 12.096(c) | | | | 06/25/42 | | | | | | 100 | | | | 110,636 | |
Series 2023-R01, Class 1M1, 144A, 30 Day Average SOFR + 2.400% (Cap N/A, Floor 0.000%) | | | 7.696(c) | | | | 12/25/42 | | | | | | 91 | | | | 92,087 | |
See Notes to Financial Statements.
PGIM Fixed Income ETFs 269
PGIM Short Duration Multi-Sector Bond ETF
Schedule of Investments (continued)
as of August 31, 2023
| | | | | | | | | | | | | | | | | | |
| | | | |
| Description | | Interest Rate | | | Maturity Date | | | Principal
Amount (000)# | | | Value | |
| | | | | |
RESIDENTIAL MORTGAGE-BACKED SECURITIES (Continued) | | | | | | | | | | | | | | | | | | |
| | | | | |
FHLMC Structured Agency Credit Risk REMIC Trust, | | | | | | | | | | | | | | | | | | |
Series 2022-DNA02, Class M1B, 144A, 30 Day Average SOFR + 2.400% (Cap N/A, Floor 0.000%) | | | 7.688%(c) | | | | 02/25/42 | | | | | | 100 | | | $ | 99,625 | |
| | | | | | | | | | | | | | | | | | |
| | | | | |
TOTAL RESIDENTIAL MORTGAGE-BACKED SECURITIES
(cost $404,116) | | | | | | | | | | | | | | | | | 403,786 | |
| | | | | | | | | | | | | | | | | | |
| | | | | |
SOVEREIGN BONDS 0.8% | | | | | | | | | | | | | | | | | | |
| | | | | |
Romanian Government International Bond (Romania), | | | | | | | | | | | | | | | | | | |
Sr. Unsec’d. Notes, 144A, MTN | | | 5.000 | | | | 09/27/26 | | | EUR | | | 100 | | | | 109,108 | |
| | | | | |
Serbia International Bond (Serbia), | | | | | | | | | | | | | | | | | | |
Sr. Unsec’d. Notes | | | 3.125 | | | | 05/15/27 | | | EUR | | | 100 | | | | 98,830 | |
| | | | | | | | | | | | | | | | | | |
| | | | | |
TOTAL SOVEREIGN BONDS
(cost $215,980) | | | | | | | | | | | | | | | | | 207,938 | |
| | | | | | | | | | | | | | | | | | |
| | | | | |
U.S. TREASURY OBLIGATIONS 28.8% | | | | | | | | | | | | | | | | | | |
U.S. Treasury Notes | | | 1.250 | | | | 12/31/26 | | | | | | 1,800 | | | | 1,623,375 | |
U.S. Treasury Notes | | | 3.000 | | | | 07/31/24 | | | | | | 845 | | | | 826,813 | |
U.S. Treasury Notes | | | 4.125 | | | | 01/31/25 | | | | | | 2,490 | | | | 2,454,888 | |
U.S. Treasury Notes(k) | | | 4.625 | | | | 06/30/25 | | | | | | 2,365 | | | | 2,351,789 | |
| | | | | | | | | | | | | | | | | | |
| | | | | |
TOTAL U.S. TREASURY OBLIGATIONS
(cost $7,260,059) | | | | | | | | | | | | | | | | | 7,256,865 | |
| | | | | | | | | | | | | | | | | | |
| | | | | |
TOTAL LONG-TERM INVESTMENTS
(cost $25,281,114) | | | | | | | | | | | | | | | | | 25,211,878 | |
| | | | | | | | | | | | | | | | | | |
| | | | | |
| | | | | | | | | | | Shares | | | | |
| | | | | |
SHORT-TERM INVESTMENT 1.4% | | | | | | | | | | | | | | | | | | |
| | | | | |
AFFILIATED MUTUAL FUND | | | | | | | | | | | | | | | | | | |
PGIM Core Government Money Market Fund
(cost $348,680)(wj) | | | | | | | | | | | | | 348,680 | | | | 348,680 | |
| | | | | | | | | | | | | | | | | | |
| | | | | |
TOTAL INVESTMENTS 101.4%
(cost $25,629,794) | | | | | | | | | | | | | | | | | 25,560,558 | |
Liabilities in excess of other assets(z) (1.4)% | | | | | | | | | | | | | | | | | (362,818 | ) |
| | | | | | | | | | | | | | | | | | |
| | | | | |
NET ASSETS 100.0% | | | | | | | | | | | | | | | | $ | 25,197,740 | |
| | | | | | | | | | | | | | | | | | |
See Notes to Financial Statements.
270
PGIM Short Duration Multi-Sector Bond ETF
Schedule of Investments (continued)
as of August 31, 2023
See the Glossary for a list of the abbreviation(s) used in the annual report.
| # | Principal or notional amount is shown in U.S. dollars unless otherwise stated. |
| (c) | Variable rate instrument. The interest rate shown reflects the rate in effect at August 31, 2023. |
| (cc) | Variable rate instrument. The rate shown is based on the latest available information as of August 31, 2023. Certain variable rate securities are not based on a published reference rate and spread but are determined by the issuer or agent and are based on current market conditions. These securities do not indicate a reference rate and spread in their description. |
| (ff) | Variable rate security. Security may be issued at a fixed coupon rate, which converts to a variable rate at a specified date. Rate shown is the rate in effect as of period end. |
| (k) | Represents security, or a portion thereof, segregated as collateral for centrally cleared/exchange-traded derivatives. |
| (oo) | Perpetual security. Maturity date represents next call date. |
| (wj) | PGIM Investments LLC, the manager of the Fund, also serves as manager of the PGIM Core Government Money Market Fund. |
| (z) | Includes net unrealized appreciation/(depreciation) and/or market value of the below holdings which are excluded from the Schedule of Investments: |
Futures contracts outstanding at August 31, 2023:
| | | | | | | | | | | | | | | | | | | | | | | | | | | | | | | |
Number of Contracts | | | | Type | | | | Expiration
Date | | | | Current
Notional
Amount | | | | Value /
Unrealized
Appreciation
(Depreciation) |
Long Positions: | | | | | | | | | | | | | | | | | | | | | | | | | | | |
16 | | | | 3 Month SOFR | | | | | | Mar. 2024 | | | | | | | | | $ | 3,784,000 | | | | | | | | | $ | (1,026 | ) |
44 | | | | 2 Year U.S. Treasury Notes | | | | | | Dec. 2023 | | | | | | | | | | 8,967,406 | | | | | | | | | | 18,615 | |
1 | | | | 10 Year U.S. Treasury Notes | | | | | | Dec. 2023 | | | | | | | | | | 111,031 | | | | | | | | | | 195 | |
2 | | | | 20 Year U.S. Treasury Bonds | | | | | | Dec. 2023 | | | | | | | | | | 243,375 | | | | | | | | | | 2,544 | |
| | | | | | | | | | | | | | | | | | | | | | | | | | | | | | | |
| | | | | | | | | | | | | | | | | | | | | | | | | | | | | | 20,328 | |
| | | | | | | | | | | | | | | | | | | | | | | | | | | | | | | |
Short Positions: | | | | | | | | | | | | | | | | | | | | | | | | | | | |
3 | | | | 5 Year Euro-Bobl | | | | | | Sep. 2023 | | | | | | | | | | 377,712 | | | | | | | | | | (187 | ) |
52 | | | | 5 Year U.S. Treasury Notes | | | | | | Dec. 2023 | | | | | | | | | | 5,559,937 | | | | | | | | | | (30,732 | ) |
1 | | | | 10 Year U.K. Gilt | | | | | | Dec. 2023 | | | | | | | | | | 121,068 | | | | | | | | | | (4,240 | ) |
4 | | | | 10 Year U.S. Ultra Treasury Notes | | | | | | Dec. 2023 | | | | | | | | | | 464,438 | | | | | | | | | | (4,973 | ) |
1 | | | | Euro Schatz Index | | | | | | Sep. 2023 | | | | | | | | | | 113,987 | | | | | | | | | | (79 | ) |
| | | | | | | | | | | | | | | | | | | | | | | | | | | | | | | |
| | | | | | | | | | | | | | | | | | | | | | | | | | | | | | (40,211 | ) |
| | | | | | | | | | | | | | | | | | | | | | | | | | | | | | | |
| | | | | | | | | | | | | | | | | | | | | | | | | | | | | $ | (19,883 | ) |
| | | | | | | | | | | | | | | | | | | | | | | | | | | | | | | |
See Notes to Financial Statements.
PGIM Fixed Income ETFs 271
PGIM Short Duration Multi-Sector Bond ETF
Schedule of Investments (continued)
as of August 31, 2023
Forward foreign currency exchange contracts outstanding at August 31, 2023:
| | | | | | | | | | | | | | | | | | | | | | | | | | | | | | | | |
Purchase Contracts | | Counterparty | | Notional
Amount
(000) | | Value at
Settlement
Date | | Current
Value | | Unrealized
Appreciation | | Unrealized
Depreciation |
| | | | | |
OTC Forward Foreign Currency Exchange Contracts: | | | | | | | | | | | | | | | | | | | | | | | | | |
British Pound, | | | | | | | | | | | | | | | | | | | | | | | | | | | |
Expiring 09/05/23 | | JPM | | | | GBP | | | | | 159 | | | | $ | 201,330 | | | | $ | 201,301 | | | | $ | — | | | | $ | (29 | ) |
| | | | | | | | | | | | | | | | | | | | | | | | | | | | | | | | |
| | | | | | | | | | | | | | | | | | | | | | | | | | | | | | | | |
| | | | | | |
Sale Contracts | | Counterparty | | Notional
Amount
(000) | | Value at
Settlement
Date | | Current
Value | | Unrealized
Appreciation | | Unrealized
Depreciation |
| | | | | |
OTC Forward Foreign Currency Exchange Contracts: | | | | | | | | | | | | | | | | | | | | | | | | | |
British Pound, | | | | | | | | | | | | | | | | | | | | | | | | | | | |
Expiring 09/05/23 | | GSI | | | | GBP | | | | | 159 | | | | $ | 205,455 | | | | $ | 201,310 | | | | $ | 4,145 | | | | $ | — | |
Expiring 10/03/23 | | JPM | | | | GBP | | | | | 159 | | | | | 201,357 | | | | | 201,326 | | | | | 31 | | | | | — | |
Euro, | | | | | | | | | | | | | | | | | | | | | | | | | | | |
Expiring 09/05/23 | | GSI | | | | EUR | | | | | 532 | | | | | 597,053 | | | | | 576,803 | | | | | 20,250 | | | | | — | |
Expiring 09/05/23 | | JPM | | | | EUR | | | | | 240 | | | | | 265,049 | | | | | 260,601 | | | | | 4,448 | | | | | — | |
Expiring 09/05/23 | | MSI | | | | EUR | | | | | 243 | | | | | 266,434 | | | | | 263,040 | | | | | 3,394 | | | | | — | |
| | | | | | | | | | | | | | | | | | | | | | | | | | | | | | | | |
| | | | | | | |
| | | | | | | | | | | | | | | $ | 1,535,348 | | | | $ | 1,503,080 | | | | | 32,268 | | | | | — | |
| | | | | | | | | | | | | | | | | | | | | | | | | | | | | | | | |
| | | | | | | |
| | | | | | | | | | | | | | | | | | | | | | | | | $ | 32,268 | | | | $ | (29 | ) |
| | | | | | | | | | | | | | | | | | | | | | | | | | | | | | | | |
Credit default swap agreement outstanding at August 31, 2023:
| | | | | | | | | | | | | | | | | | | | | | | | | | | | | | | | | | | | | | | | | | | | | | | | | | | | | | | | | | | | | | | | | | | | | | | | | | | | | | | | | | | | | |
Reference Entity/ Obligation | | Termination
Date | | Fixed Rate | | Notional
Amount
(000)#(3) | | | | Implied Credit
Spread at
August 31,
2023(4) | | | | Value at
Trade Date | | Value at
August 31,
2023 | | Unrealized Appreciation
(Depreciation) |
| | | | | | | | | | | | | | | | | | | | | | | | | | | | | | | | | | | | | | | | | | | | | | | | | | | | | | | | | | | | | | | | | | | | | | | | | | | | | | | | | | | | | |
| | | | | | | | | | | | | | | | | | | | | | | | | | | | | | | | | | | | | | | | | | | | | |
Centrally Cleared Credit Default Swap Agreement on credit indices - Sell Protection(2): | | | | | | | | | | | | | | | | | | | | | |
CDX.NA.HY.40.V1 | | | | | | | | | 06/20/28 | | | | | | | | | | 5.000%(Q) | | | | | 760 | | | | | | | | | | 4.257% | | | | | | | | | | | | | | $ | 27,295 | | | | | | | | | | | | | | $ | 29,177 | | | | | | | | | | | | | | $ | 1,882 | | | | | | |
| | | | | | | | | | | | | | | | | | | | | | | | | | | | | | | | | | | | | | | | | | | | | | | | | | | | | | | | | | | | | | | | | | | | | | | | | | | | | | | | | | | | | |
The Fund entered into credit default swaps (“CDS”) to provide a measure of protection against defaults or to take an active long or short position with respect to the likelihood of a particular issuer’s default or the reference entity’s credit soundness. CDS contracts generally trade based on a spread which represents the cost a protection buyer has to pay the protection seller. The protection buyer is said to be short the credit as the value of the contract rises the more the credit deteriorates. The value of the CDS contract increases for the protection buyer if the spread increases.
| (1) | If the Fund is a buyer of protection, it pays the fixed rate. When a credit event occurs, as defined under the terms of that particular swap agreement, the Fund will either (i) receive from the seller of protection an amount equal to the notional amount of the swap and make delivery of the referenced obligation or underlying securities comprising the referenced index or (ii) receive a net settlement amount in the form of cash or securities equal to the notional amount of the swap less the recovery value of the referenced obligation or underlying securities comprising the referenced index. |
See Notes to Financial Statements.
272
PGIM Short Duration Multi-Sector Bond ETF
Schedule of Investments (continued)
as of August 31, 2023
| (2) | If the Fund is a seller of protection, it receives the fixed rate. When a credit event occurs, as defined under the terms of that particular swap agreement, the Fund will either (i) pay to the buyer of protection an amount equal to the notional amount of the swap and take delivery of the referenced obligation or underlying securities comprising the referenced index or (ii) pay a net settlement amount in the form of cash or securities equal to the notional amount of the swap less the recovery value of the referenced obligation or underlying securities comprising the referenced index. |
| (3) | Notional amount represents the maximum potential amount the Fund could be required to pay as a seller of credit protection or receive as a buyer of credit protection if a credit event occurs as defined under the terms of that particular swap agreement. |
| (4) | Implied credit spreads, represented in absolute terms, utilized in determining the fair value of credit default swap agreements where the Fund is the seller of protection as of the reporting date serve as an indicator of the current status of the payment/ performance risk and represent the likelihood of risk of default for the credit derivative. The implied credit spread of a particular referenced entity reflects the cost of buying/selling protection and may include up-front payments required to be made to enter into the agreement. Wider credit spreads represent a deterioration of the referenced entity’s credit soundness and a greater likelihood of risk of default or other credit event occurring as defined under the terms of the agreement. |
Interest rate swap agreements outstanding at August 31, 2023:
| | | | | | | | | | | | | | | | | | | | | | | | | | | | | | | | | | | | | | | | | | | | |
Notional
Amount
(000)# | | | | Termination
Date | | | | Fixed
Rate | | | | Floating Rate | | | | Value at
Trade Date | | | | Value at
August 31,
2023 | | | | Unrealized
Appreciation
(Depreciation) | | |
Centrally Cleared Interest Rate Swap Agreements: | | | | | | |
4,305 | | | | | | 08/31/24 | | | | | | | 5.384%(T) | | | | | 1 Day SOFR(2)(T)/ 5.310% | | | | | $ | — | | | | | | $ | 1,041 | | | | | | $ | 1,041 | | | | | | |
2,220 | | | | | | 08/31/25 | | | | | | | 4.805%(A) | | | | | 1 Day SOFR(1)(A)/ 5.310% | | | | | | — | | | | | | | (1,118 | ) | | | | | | (1,118 | ) | | | | | |
| | | | | | | | | | | | | | | | | | | | | | | | | | | | | | | | | | | | | | | | | | | | |
| | | | | | | | | | | | | | | | | | | | | | | $ | — | | | | | | $ | (77 | ) | | | | | $ | (77 | ) | | | | | |
| | | | | | | | | | | | | | | | | | | | | | | | | | | | | | | | | | | | | | | | | | | | |
| (1) | The Fund pays the fixed rate and receives the floating rate. |
| (2) | The Fund pays the floating rate and receives the fixed rate. |
Summary of Collateral for Centrally Cleared/Exchange-traded Derivatives:
Cash and securities segregated as collateral, including pending settlement for closed positions, to cover requirements for centrally cleared/exchange-traded derivatives are listed by broker as follows:
| | | | | | | | | | |
Broker | | Cash and/or Foreign Currency | | Securities Market Value |
CGM | | | $ | — | | | | $ | 201,866 | |
JPS | | | | 220,000 | | | | | — | |
| | | | | | | | | | |
Total | | | $ | 220,000 | | | | $ | 201,866 | |
| | | | | | | | | | |
See Notes to Financial Statements.
PGIM Fixed Income ETFs 273
PGIM Short Duration Multi-Sector Bond ETF
Schedule of Investments (continued)
as of August 31, 2023
Fair Value Measurements:
Various inputs are used in determining the value of the Fund’s investments. These inputs are summarized in the three broad levels listed below.
Level 1—unadjusted quoted prices generally in active markets for identical securities.
Level 2—quoted prices for similar securities, interest rates and yield curves, prepayment speeds, foreign currency exchange rates and other observable inputs.
Level 3—unobservable inputs for securities valued in accordance with Board approved fair valuation procedures.
The following is a summary of the inputs used as of August 31, 2023 in valuing such portfolio securities:
| | | | | | | | | | | | | | | |
| | | Level 1 | | Level 2 | | Level 3 |
Investments in Securities | | | | | | | | | | | | | | | |
Assets | | | | | | | | | | | | | | | |
Long-Term Investments | | | | | | | | | | | | | | | |
Asset-Backed Securities | | | | | | | | | | | | | | | |
Collateralized Loan Obligations | | | $ | — | | | | $ | 5,273,713 | | | | $ | — | |
Commercial Mortgage-Backed Securities | | | | — | | | | | 3,510,693 | | | | | — | |
Corporate Bonds | | | | — | | | | | 8,558,883 | | | | | — | |
Residential Mortgage-Backed Securities | | | | — | | | | | 403,786 | | | | | — | |
Sovereign Bonds | | | | — | | | | | 207,938 | | | | | — | |
U.S. Treasury Obligations | | | | — | | | | | 7,256,865 | | | | | — | |
Short-Term Investment | | | | | | | | | | | | | | | |
Affiliated Mutual Fund | | | | 348,680 | | | | | — | | | | | — | |
| | | | | | | | | | | | | | | |
Total | | | $ | 348,680 | | | | $ | 25,211,878 | | | | $ | — | |
| | | | | | | | | | | | | | | |
| | | |
Other Financial Instruments* | | | | | | | | | | | | | | | |
Assets | | | | | | | | | | | | | | | |
Futures Contracts | | | $ | 21,354 | | | | $ | — | | | | $ | — | |
OTC Forward Foreign Currency Exchange Contracts | | | | — | | | | | 32,268 | | | | | — | |
Centrally Cleared Credit Default Swap Agreement | | | | — | | | | | 1,882 | | | | | — | |
Centrally Cleared Interest Rate Swap Agreement | | | | — | | | | | 1,041 | | | | | — | |
| | | | | | | | | | | | | | | |
Total | | | $ | 21,354 | | | | $ | 35,191 | | | | $ | — | |
| | | | | | | | | | | | | | | |
| | | |
Liabilities | | | | | | | | | | | | | | | |
Futures Contracts | | | $ | (41,237 | ) | | | $ | — | | | | $ | — | |
OTC Forward Foreign Currency Exchange Contract | | | | — | | | | | (29 | ) | | | | — | |
Centrally Cleared Interest Rate Swap Agreement | | | | — | | | | | (1,118 | ) | | | | — | |
| | | | | | | | | | | | | | | |
Total | | | $ | (41,237 | ) | | | $ | (1,147 | ) | | | $ | — | |
| | | | | | | | | | | | | | | |
See Notes to Financial Statements.
274
PGIM Short Duration Multi-Sector Bond ETF
Schedule of Investments (continued)
as of August 31, 2023
| * | Other financial instruments are derivative instruments not reflected in the Schedule of Investments, such as futures, forwards and centrally cleared swap contracts, which are recorded at the unrealized appreciation (depreciation) on the instrument, and OTC swap contracts which are recorded at fair value. |
Industry Allocation:
The industry allocation of portfolio holdings and liabilities in excess of other assets shown as a percentage of net assets as of August 31, 2023 were as follows:
| | | | |
U.S. Treasury Obligations | | | 28.8 | % |
Collateralized Loan Obligations | | | 20.9 | |
Commercial Mortgage-Backed Securities | | | 13.9 | |
Banks | | | 9.7 | |
Pipelines | | | 2.9 | |
Electric | | | 2.4 | |
Real Estate Investment Trusts (REITs) | | | 2.3 | |
Oil & Gas | | | 2.3 | |
Residential Mortgage-Backed Securities | | | 1.6 | |
Auto Manufacturers | | | 1.4 | |
Affiliated Mutual Fund | | | 1.4 | |
Media | | | 1.3 | |
Aerospace & Defense | | | 1.0 | |
Engineering & Construction | | | 1.0 | |
Entertainment | | | 0.9 | |
Telecommunications | | | 0.9 | |
Foods | | | 0.9 | |
Sovereign Bonds | | | 0.8 | |
Commercial Services | | | 0.7 | |
Retail | | | 0.7 | |
Home Builders | | | 0.7 | |
Lodging | | | 0.6 | |
| | | | |
Diversified Financial Services | | | 0.5 | % |
Packaging & Containers | | | 0.4 | |
Auto Parts & Equipment | | | 0.4 | |
Agriculture | | | 0.4 | |
Airlines | | | 0.4 | |
Computers | | | 0.3 | |
Trucking & Leasing | | | 0.3 | |
Leisure Time | | | 0.3 | |
Healthcare-Services | | | 0.3 | |
Software | | | 0.2 | |
Building Materials | | | 0.2 | |
Distribution/Wholesale | | | 0.2 | |
Machinery-Diversified | | | 0.1 | |
Gas | | | 0.1 | |
Apparel | | | 0.1 | |
Mining | | | 0.1 | |
| | | | |
| | | 101.4 | |
Liabilities in excess of other assets | | | (1.4 | ) |
| | | | |
| |
| | | 100.0 | % |
| | | | |
Effects of Derivative Instruments on the Financial Statements and Primary Underlying Risk Exposure:
The Fund invested in derivative instruments during the reporting period. The primary types of risk associated with these derivative instruments are credit risk, foreign exchange risk and interest rate risk. See the Notes to Financial Statements for additional detail regarding these derivative instruments and their risks. The effect of such derivative instruments on the Fund’s financial position and financial performance as reflected in the Statement of Assets and Liabilities and Statement of Operations is presented in the summary below.
Fair values of derivative instruments as of August 31, 2023 as presented in the Statement of Assets and Liabilities:
See Notes to Financial Statements.
PGIM Fixed Income ETFs 275
PGIM Short Duration Multi-Sector Bond ETF
Schedule of Investments (continued)
as of August 31, 2023
| | | | | | | | | | | | |
| | | Asset Derivatives | | | Liability Derivatives | |
Derivatives not accounted for as hedging instruments, carried at fair value | | Statement of Assets and Liabilities Location | | Fair
Value | | | Statement of Assets and Liabilities Location | | Fair
Value | |
Credit contracts | | Due from/to broker-variation margin swaps | | $ | 1,882* | | | — | | $ | — | |
Foreign exchange contracts | | Unrealized appreciation on OTC forward foreign currency exchange contracts | | | 32,268 | | | Unrealized depreciation on OTC forward foreign currency exchange contracts | | | 29 | |
Interest rate contracts | | Due from/to broker-variation margin futures | | | 21,354 | * | | Due from/to broker-variation margin futures | | | 41,237 | * |
Interest rate contracts | | Due from/to broker-variation margin swaps | | | 1,041 | * | | Due from/to broker-variation margin swaps | | | 1,118 | * |
| | | | | | | | | | | | |
| | | | $ | 56,545 | | | | | $ | 42,384 | |
| | | | | | | | | | | | |
| * | Includes cumulative appreciation (depreciation) as reported in the schedule of open futures and centrally cleared swap contracts. Only unsettled variation margin receivable (payable) is reported within the Statement of Assets and Liabilities. |
The effects of derivative instruments on the Statement of Operations for the period ended August 31, 2023 are as follows:
| | | | | | | | | | | | | | | | | | | | | | | | | |
| Amount of Realized Gain (Loss) on Derivatives Recognized in Income |
| | | | | | | | | | | | | | | | | | | | | | | | | |
Derivatives not accounted for as hedging
instruments, carried at fair value | | | | | | Futures | | | | Swaps |
Credit contracts | | | | | | | | | | | | | $ | — | | | | | | | | | $ | (7,251 | ) |
Interest rate contracts | | | | | | | | | | | | | | 55,885 | | | | | | | | | | — | |
| | | | | | | | | | | | | | | | | | | | | | | | | |
Total | | | | | | | | | | | | | $ | 55,885 | | | | | | | | | $ | (7,251 | ) |
| | | | | | | | | | | | | | | | | | | | | | | | | |
| | | | | | | | | | | | | | | | | | | | | | | | | |
|
| Change in Unrealized Appreciation (Depreciation) on Derivatives Recognized in Income |
| | | | | | | | | | | | | | | | | | | | | | | | | |
Derivatives not accounted for as hedging instruments, carried at fair value | | Futures | | | | Forward
Currency
Exchange
Contracts | | | | Swaps |
Credit contracts | �� | | $ | — | | | | | | | | | $ | — | | | | | | | | | $ | 1,882 | |
Foreign exchange contracts | | | | — | | | | | | | | | | 32,239 | | | | | | | | | | — | |
Interest rate contracts | | | | (19,883 | ) | | | | | | | | | — | | | | | | | | | | (77 | ) |
| | | | | | | | | | | | | | | | | | | | | | | | | |
Total | | | $ | (19,883 | ) | | | | | | | | $ | 32,239 | | | | | | | | | $ | 1,805 | |
| | | | | | | | | | | | | | | | | | | | | | | | | |
The derivative instruments outstanding as of period-end serve as indicators of the volume of derivative activities for the
See Notes to Financial Statements.
276
PGIM Short Duration Multi-Sector Bond ETF
Schedule of Investments (continued)
as of August 31, 2023
Fund.
Financial Instruments/Transactions—Summary of Offsetting and Netting Arrangements:
The Fund invested in OTC derivatives during the reporting period that are either offset in accordance with current requirements or are subject to enforceable master netting arrangements or similar agreements that permit offsetting. The information about offsetting and related netting arrangements for OTC derivatives where the legal right to set-off exists is presented in the summary below.
Offsetting of OTC derivative assets and liabilities:
| | | | | | | | | | | | | | | | | | | | | | | | | |
Counterparty | | Gross Amounts of Recognized Assets(1) | | Gross Amounts of Recognized Liabilities(1) | | Net Amounts of Recognized Assets/(Liabilities) | | Collateral Pledged/(Received)(2) | | Net Amount |
GSI | | | $ | 24,395 | | | | $ | — | | | | $ | 24,395 | | | | $ | — | | | | $ | 24,395 | |
JPM | | | | 4,479 | | | | | (29 | ) | | | | 4,450 | | | | | — | | | | | 4,450 | |
MSI | | | | 3,394 | | | | | — | | | | | 3,394 | | | | | — | | | | | 3,394 | |
| | | | | | | | | | | | | | | | | | | | | | | | | |
| | | $ | 32,268 | | | | $ | (29 | ) | | | $ | 32,239 | | | | $ | — | | | | $ | 32,239 | |
| | | | | | | | | | | | | | | | | | | | | | | | | |
| (1) | Includes unrealized appreciation/(depreciation) on swaps and forwards, premiums paid/(received) on swap agreements and market value of purchased and written options, as represented on the Statement of Assets and Liabilities. |
| (2) | Collateral amount disclosed by the Fund is limited to the market value of financial instruments/transactions and the Fund’s OTC derivative exposure by counterparty. |
See Notes to Financial Statements.
PGIM Fixed Income ETFs 277
PGIM Short Duration Multi-Sector Bond ETF
Statement of Assets & Liabilities
as of August 31, 2023
| | | | |
Assets | | | | |
Investments at value: | | | | |
Unaffiliated investments (cost $25,281,114) | | $ | 25,211,878 | |
Affiliated investments (cost $348,680) | | | 348,680 | |
Foreign currency, at value (cost $48) | | | 48 | |
Deposit with broker for centrally cleared/exchange-traded derivatives | | | 220,000 | |
Interest receivable | | | 203,061 | |
Receivable for investments sold | | | 88,329 | |
Unrealized appreciation on OTC forward foreign currency exchange contracts | | | 32,268 | |
| | | | |
Total Assets | | | 26,104,264 | |
| | | | |
| |
| Liabilities | | | |
Payable for investments purchased | | | 891,775 | |
Management fee payable | | | 8,528 | |
Due to broker—variation margin futures | | | 5,095 | |
Due to broker—variation margin swaps | | | 1,097 | |
Unrealized depreciation on OTC forward foreign currency exchange contracts | | | 29 | |
| | | | |
Total Liabilities | | | 906,524 | |
| | | | |
| |
Net Assets | | $ | 25,197,740 | |
| | | | |
| | | | |
Net assets were comprised of: | | | | |
Common stock, at par | | $ | 500 | |
Paid-in capital in excess of par | | | 25,087,634 | |
Total distributable earnings (loss) | | | 109,606 | |
| | | | |
| |
Net assets, August 31, 2023 | | $ | 25,197,740 | |
| | | | |
| |
Net asset value, offering price and redemption price per share. | | | | |
($25,197,740 ÷ 500,000 shares of common stock issued and outstanding) | | $ | 50.40 | |
| | | | |
See Notes to Financial Statements.
278
PGIM Short Duration Multi-Sector Bond ETF
Statement of Operations
For the Period July 19, 2023* through August 31, 2023
| | | | |
Net Investment Income (Loss) | | | | |
Income | | | | |
Interest income | | $ | 167,824 | |
Affiliated dividend income | | | 6,367 | |
| | | | |
| |
Total income | | | 174,191 | |
| | | | |
| |
Expenses | | | | |
Management fee | | | 11,822 | |
| | | | |
Net investment income (loss) | | | 162,369 | |
| | | | |
Realized And Unrealized Gain (Loss) On Investment And Foreign Currency Transactions | | | | |
Net realized gain (loss) on: | | | | |
Investment transactions | | | (47,379 | ) |
Futures transactions | | | 55,885 | |
Swap agreement transactions | | | (7,251 | ) |
Foreign currency transactions | | | 2,112 | |
| | | | |
| | | 3,367 | |
| | | | |
Net change in unrealized appreciation (depreciation) on: | | | | |
Investments | | | (69,236 | ) |
Futures | | | (19,883 | ) |
Forward currency contracts | | | 32,239 | |
Swap agreements | | | 1,805 | |
Foreign currencies | | | (421 | ) |
| | | | |
| | | (55,496 | ) |
| | | | |
Net gain (loss) on investment and foreign currency transactions | | | (52,129 | ) |
| | | | |
Net Increase (Decrease) In Net Assets Resulting From Operations | | $ | 110,240 | |
| | | | |
| * | Commencement of operations. |
See Notes to Financial Statements.
PGIM Fixed Income ETFs 279
PGIM Short Duration Multi-Sector Bond ETF
Statement of Changes in Net Assets
| | | | | | | |
| | | July 19, 2023*
through
August 31, 2023 | | |
Increase (Decrease) in Net Assets | | | | | | | |
Operations | | | | | | | |
Net investment income (loss) | | | $ | 162,369 | | | |
Net realized gain (loss) on investment and foreign currency transactions | | | | 3,367 | | | |
Net change in unrealized appreciation (depreciation) on investments and foreign currencies | | | | (55,496 | ) | | |
| | | | | | | |
Net increase (decrease) in net assets resulting from operations | | | | 110,240 | | | |
| | | | | | | |
Fund share transactions | | | | | | | |
Net proceeds from shares sold (500,000 shares) | | | | 25,087,500 | | | |
| | | | | | | |
Total increase (decrease) | | | | 25,197,740 | | | |
| | |
Net Assets: | | | | | | | |
Beginning of period | | | | — | | | |
| | | | | | | |
End of period | | | $ | 25,197,740 | | | |
| | | | | | | |
| * | Commencement of operations. |
See Notes to Financial Statements.
280
PGIM Short Duration Multi-Sector Bond ETF
Financial Highlights
| | | | | | | |
| | | | | | | | |
| | | July 19, 2023(a)
through August 31,
2023 | | |
| | | |
| Per Share Operating Performance(b): | | | | | | | |
| Net Asset Value, Beginning of Period | | | | $50.00 | | | |
| Income (loss) from investment operations: | | | | | | | |
| Net investment income (loss) | | | | 0.32 | | | |
| Net realized and unrealized gain (loss) on investment and foreign currency transactions | | | | 0.08 | (c) | | |
| Total from investment operations | | | | 0.40 | | | |
| Net asset value, end of period | | | | $50.40 | | | |
| Total Return(d): | | | | 0.79 | % | | |
| | | | | | | | |
| | | |
| Ratios/Supplemental Data: | | | | | | | |
| Net assets, end of period (000) | | | | $25,198 | | | |
| Average net assets (000) | | | | $25,087 | | | |
| Ratios to average net assets(e): | | | | | | | |
| Expenses after waivers and/or expense reimbursement | | | | 0.40 | %(f) | | |
| Expenses before waivers and/or expense reimbursement | | | | 0.40 | %(f) | | |
| Net investment income (loss) | | | | 5.49 | %(f) | | |
| Portfolio turnover rate(g) | | | | 78 | % | | |
| (a) | Commencement of operations. |
| (b) | Calculated based on average shares outstanding during the period. |
| (c) | The per share amount of realized and unrealized gain (loss) on investments does not directly correlate to the amounts reported in the Statement of Operations due to the timing of portfolio share transactions in relation to fluctuating market values. |
| (d) | Total return is calculated assuming a purchase of a share on the first day and a sale on the last day of each period reported and includes reinvestment of dividends and distributions, if any. Total returns may reflect adjustments to conform to GAAP. Total returns for periods less than one full year are not annualized. |
| (e) | Does not include expenses of the underlying funds in which the Fund invests. |
| (g) | The Fund’s portfolio turnover rate is calculated in accordance with regulatory requirements, without regard to transactions involving short-term investments, certain derivatives and in-kind transactions (if any). If such transactions were included, the Fund’s portfolio turnover rate may be higher. |
See Notes to Financial Statements.
PGIM Fixed Income ETFs 281
Notes to Financial Statements
PGIM ETF Trust (the “Registered Investment Company” or “RIC”) is registered under the Investment Company Act of 1940, as amended (“1940 Act”), as an open-end management investment company. The RIC is organized as a Delaware Statutory Trust. These financial statements relate only to the following series of the RIC: PGIM Ultra Short Bond ETF, PGIM Active High Yield Bond ETF, PGIM Active Aggregate Bond ETF, PGIM Total Return Bond ETF, PGIM Floating Rate Income ETF, PGIM AAA CLO ETF, and PGIM Short Duration Multi-Sector Bond ETF (each a “Fund” and collectively, the “Funds”). All the Funds are classified as diversified funds with the exception of PGIM AAA CLO ETF which is classified as non-diversified for purposes of the 1940 Act. Each Fund operates as an exchange-traded fund.
The Funds have the following investment objectives:
| | | | |
Fund | | | | Investment Objective(s) |
PGIM Ultra Short Bond ETF | | | | Seeks total return through a combination of current income and capital appreciation, consistent with preservation of capital. |
PGIM Active High Yield Bond ETF | | | | Seeks total return through a combination of current income and capital appreciation. |
PGIM Active Aggregate Bond ETF | | | | Seeks total return through a combination of current income and capital appreciation. |
PGIM Total Return Bond ETF | | | | Seeks total return. |
PGIM Floating Rate Income ETF | | | | Seeks to maximize current income with a secondary objective of capital appreciation. |
PGIM AAA CLO ETF | | | | Seeks to maximize total return, through a combination of current income and capital appreciation. |
PGIM Short Duration Multi-Sector Bond ETF | | | | Seeks to provide total return. |
The Funds follow the investment company accounting and reporting guidance of the Financial Accounting Standards Board (“FASB”) Accounting Standard Codification (“ASC”) Topic 946 Financial Services — Investment Companies. The following is a summary of
282
significant accounting policies followed by the Funds in the preparation of its financial statements. The policies conform to U.S. generally accepted accounting principles (“GAAP”). The Funds consistently follow such policies in the preparation of their financial statements.
Securities Valuation: The Funds hold securities and other assets and liabilities that are fair valued as of the close of each day (generally, 4:00 PM Eastern time) the New York Stock Exchange (“NYSE”) is open for trading. As described in further detail below, the Funds’ investments are valued daily based on a number of factors, including the type of investment and whether market quotations are readily available. The RIC’s Board of Trustees (the “Board”) has approved the Funds’ valuation policies and procedures for security valuation and designated PGIM Investments LLC (“PGIM Investments” or the “Manager”) as the “Valuation Designee,” as defined by Rule 2a-5(b) under the 1940 Act, to perform the fair value determination relating to all Funds investments. Pursuant to the Board’s oversight, the Valuation Designee has established a Valuation Committee to perform the duties and responsibilities as Valuation Designee under Rule 2a-5. The valuation procedures permit the Funds to utilize independent pricing vendor services, quotations from market makers, and alternative valuation methods when market quotations are either not readily available or not deemed representative of fair value. Fair value is the estimated price that would be received to sell an asset or paid to transfer a liability in an orderly transaction between market participants on the measurement date.
For the fiscal reporting year-end, securities and other assets and liabilities were fair valued at the close of the last U.S. business day. Trading in certain foreign securities may occur when the NYSE is closed (including weekends and holidays). Because such foreign securities trade in markets that are open on weekends and U.S. holidays, the values of some of the Funds’ foreign investments may change on days when investors cannot purchase or redeem Fund shares.
Various inputs determine how the Funds’ investments are valued, all of which are categorized according to the three broad levels (Level 1, 2, or 3) detailed in the Schedule of Investments and referred to herein as the “fair value hierarchy” in accordance with FASB ASC Topic 820 — Fair Value Measurement.
Common or preferred stocks, exchange-traded funds (ETFs) and derivative instruments, if applicable, that are traded on a national securities exchange are valued at the last sale price as of the close of trading on the applicable exchange where the security principally trades. Securities traded via NASDAQ are valued at the NASDAQ official closing price. To the extent these securities are valued at the last sale price or NASDAQ official closing price, they are classified as Level 1 in the fair value hierarchy. In the event that no sale or official closing price on a valuation date exists, these securities are generally valued at the mean between the last reported bid and ask prices, or at the last bid price in the absence of an ask price. These securities are classified as Level 2 in the fair value hierarchy.
PGIM Fixed Income ETFs 283
Notes to Financial Statements (continued)
Investments in open-end funds (other than ETFs) are valued at their net asset values as of the close of the NYSE on the date of valuation. These securities are classified as Level 1 in the fair value hierarchy since they may be purchased or sold at their net asset values on the date of valuation.
Fixed income securities traded in the OTC market are generally classified as Level 2 in the fair value hierarchy. Such fixed income securities are typically valued using the market approach which generally involves obtaining data from an approved independent third-party vendor source. The Funds utilize the market approach as the primary method to value securities when market prices of identical or comparable instruments are available. The third-party vendors’ valuation techniques used to derive the evaluated bid price are based on evaluating observable inputs, including but not limited to, yield curves, yield spreads, credit ratings, deal terms, tranche level attributes, default rates, cash flows, prepayment speeds, broker/dealer quotations and reported trades. Certain Level 3 securities are also valued using the market approach when obtaining a single broker quote or when utilizing transaction prices for identical securities that have been used in excess of five business days. During the reporting period, there were no changes to report with respect to the valuation approach and/or valuation techniques discussed above.
Floating rate and other loans are generally valued at prices provided by approved independent pricing vendors. The pricing vendors utilize broker/dealer quotations and provide prices based on the average of such quotations. Floating rate and other loans valued using such vendor prices are generally classified as Level 2 in the fair value hierarchy. Floating rate and other loans valued based on a single broker quote or at the original transaction price in excess of five business days are classified as Level 3 in the fair value hierarchy.
OTC and centrally cleared derivative instruments are generally classified as Level 2 in the fair value hierarchy. Such derivative instruments are typically valued using the market approach and/or income approach which generally involves obtaining data from an approved independent third-party vendor source. The Funds utilize the market approach when quoted prices in broker-dealer markets are available but also include consideration of alternative valuation approaches, including the income approach. In the absence of reliable market quotations, the income approach is typically utilized for purposes of valuing derivatives such as interest rate swaps based on a discounted cash flow analysis whereby the value of the instrument is equal to the present value of its future cash inflows or outflows. Such analysis includes projecting future cash flows and determining the discount rate (including the present value factors that affect the discount rate) used to discount the future cash flows. In addition, the third-party vendors’ valuation techniques used to derive the evaluated derivative price is based on evaluating observable inputs, including but not limited to, underlying asset prices, indices, spreads, interest rates and exchange rates. Certain
284
derivatives may be classified as Level 3 when valued using the market approach by obtaining a single broker quote or when utilizing unobservable inputs in the income approach. During the reporting period, there were no changes to report with respect to the valuation approach and/or valuation techniques discussed above.
Securities and other assets that cannot be priced according to the methods described above are valued based on policies and procedures approved by the Board. In the event that unobservable inputs are used when determining such valuations, the securities will be classified as Level 3 in the fair value hierarchy. Altering one or more unobservable inputs may result in a significant change to a Level 3 security’s fair value measurement.
When determining the fair value of securities, some of the factors influencing the valuation include: the nature of any restrictions on disposition of the securities; assessment of the general liquidity of the securities; the issuer’s financial condition and the markets in which it does business; the cost of the investment; the size of the holding and the capitalization of the issuer; the prices of any recent transactions or bids/offers for such securities or any comparable securities; and any available analyst media or other reports or information deemed reliable by the Valuation Designee regarding the issuer or the markets or industry in which it operates. Using fair value to price securities may result in a value that is different from a security’s most recent closing price and from the price used by other unaffiliated mutual funds to calculate their net asset values.
Foreign Currency Translation: The books and records of the Funds are maintained in U.S. dollars. Foreign currency amounts are translated into U.S. dollars on the following basis:
(i) market value of investment securities, other assets and liabilities — at the exchange rate as of the valuation date;
(ii) purchases and sales of investment securities, income and expenses — at the rates of exchange prevailing on the respective dates of such transactions.
Although the net assets of the Funds are presented at the foreign exchange rates and market values at the close of the period, the Funds do not generally isolate that portion of the results of operations arising as a result of changes in the foreign exchange rates from the fluctuations arising from changes in the market prices of long-term portfolio securities held at the end of the period. Similarly, the Funds do not isolate the effect of changes in foreign exchange rates from the fluctuations arising from changes in the market prices of long-term portfolio securities sold during the period. Accordingly, holding period unrealized and realized foreign currency gains (losses) are included in the reported net change in unrealized appreciation (depreciation) on investments and net realized gains (losses) on investment transactions on the Statements of Operations.
Additionally, net realized gains (losses) on foreign currency transactions represent net foreign exchange gains (losses) from the disposition of holdings of foreign currencies, currency gains (losses) realized between the trade and settlement dates on investment
PGIM Fixed Income ETFs 285
Notes to Financial Statements (continued)
transactions, and the difference between the amounts of interest, dividends and foreign withholding taxes recorded on the Funds’ books and the U.S. dollar equivalent amounts actually received or paid. Net unrealized currency gains (losses) arise from valuing foreign currency denominated assets and liabilities (other than investments) at period end exchange rates.
Forward and Cross Currency Contracts: A forward currency contract is a commitment to purchase or sell a foreign currency at a future date at a negotiated forward rate. Certain Funds enter into forward currency contracts, as defined in the prospectus, in order to hedge its exposure to changes in foreign currency exchange rates on its foreign portfolio holdings or on specific receivables and payables denominated in a foreign currency and to gain exposure to certain currencies. The contracts are valued daily at current forward exchange rates and any unrealized gain (loss) is included in net unrealized appreciation or depreciation on forward and cross currency contracts. Gain (loss) is realized on the settlement date of the contract equal to the difference between the settlement value of the original and negotiated forward contracts. This gain (loss), if any, is included in net realized gain (loss) on forward and cross currency contract transactions. Risks may arise upon entering into these contracts from the potential inability of the counterparties to meet the terms of their contracts. Forward currency contracts involve risks from currency exchange rate and credit risk in excess of the amounts reflected on the Statement of Assets and Liabilities. The Funds’ maximum risk of loss from counterparty credit risk is the net value of the cash flows to be received from the counterparty at the end of the contract’s life. A cross currency contract is a forward contract where a specified amount of one foreign currency will be exchanged for a specified amount of another foreign currency.
Financial Futures Contracts: A financial futures contract is an agreement to purchase (long) or sell (short) an agreed amount of securities at a set price for delivery on a future date. Upon entering into a financial futures contract, the Funds are required to pledge to the broker an amount of cash and/or other assets equal to a certain percentage of the contract amount. This amount is known as the “initial margin.” Subsequent payments, known as “variation margin,” are made or received by the Funds each day, depending on the daily fluctuations in the value of the underlying security. Such variation margin is recorded for financial statement purposes on a daily basis as unrealized gain (loss). When the contract expires or is closed, the gain (loss) is realized and is presented in the Statement of Operations as net realized gain (loss) on futures transactions.
The Funds invested in financial futures contracts in order to hedge their existing portfolio securities, or securities the Funds intend to purchase, against fluctuations in value caused by changes in prevailing interest rates. Should interest rates move unexpectedly, the Funds may not achieve the anticipated benefits of the financial futures contracts and may realize a loss. The use of futures transactions involves the risk of imperfect correlation in movements
286
in the price of futures contracts, interest rates and the underlying hedged assets. Since futures contracts are exchange-traded, there is minimal counterparty credit risk to the Funds since the exchanges’ clearinghouse acts as counterparty to all exchange-traded futures and guarantees the futures contracts against default.
Swap Agreements: Certain Funds entered into certain types of swap agreements detailed in the disclosures below. A swap agreement is an agreement to exchange the return generated by one instrument for the return generated by another instrument. Swap agreements are negotiated in the OTC market and may be executed either directly with a counterparty (“OTC-traded”) or through a central clearing facility, such as a registered exchange. Swap agreements are valued daily at current market value and any change in value is included in the net unrealized appreciation or depreciation on swap agreements. Centrally cleared swaps pay or receive an amount known as “variation margin”, based on daily changes in the valuation of the swap contract. For OTC-traded, upfront premiums paid and received are shown as swap premiums paid and swap premiums received in the Statement of Assets and Liabilities. Risk of loss may exceed amounts recognized on the Statement of Assets and Liabilities. Swap agreements outstanding at period end, if any, are listed on the Schedule of Investments.
Interest Rate Swaps: Interest rate swaps represent an agreement between counterparties to exchange cash flows based on the difference between two interest rates, applied to a notional principal amount for a specified period. The Funds are subject to interest rate risk exposure in the normal course of pursuing their investment objective. The Funds used interest rate swaps to maintain their ability to generate steady cash flow by receiving a stream of fixed rate payments or to increase exposure to prevailing market rates by receiving floating rate payments. The Funds’ maximum risk of loss from counterparty credit risk is the discounted net present value of the cash flows to be received from the counterparty over the contract’s remaining life.
Credit Default Swaps (“CDS”): CDS involve one party (the protection buyer) making a stream of payments to another party (the protection seller) in exchange for the right to receive a specified payment in the event of a default or as a result of a default (collectively a “credit event”) for the referenced entity (typically corporate issues or sovereign issues of an emerging country) on its obligation; or in the event of a write-down, principal shortfall, interest shortfall or default of all or part of the referenced entities comprising a credit index.
The Funds are subject to credit risk in the normal course of pursuing their investment objectives, and as such, have entered into CDS contracts to provide a measure of protection against defaults or to take an active long or short position with respect to the likelihood of a particular issuer’s default or the reference entity’s credit soundness. CDS contracts generally trade based on a spread which represents the cost a protection buyer has to pay the protection seller. The protection buyer is said to be “short the credit” because the higher the contract value rises, the more the credit deteriorates. The value of the CDS contract increases for the protection buyer if the spread increases. A Fund’s maximum risk of loss
PGIM Fixed Income ETFs 287
Notes to Financial Statements (continued)
from counterparty credit risk for purchased CDS is the inability of the counterparty to honor the contract up to the notional value due to a credit event.
As a seller of protection on credit default swap agreements, the Fund generally receives an agreed upon payment from the buyer of protection throughout the term of the swap, provided no credit event occurs. As the seller, the Fund effectively increases its investment risk because, in addition to its total net assets, the Fund may be subject to investment exposure on the notional amount of the swap.
The maximum amount of the payment that the Fund, as a seller of protection, could be required to make under a credit default swap agreement would be equal to the notional amount of the underlying security or index contract as a result of a credit event. This potential amount will be partially offset by any recovery values of the respective referenced obligations or net amounts received from the settlement of buy protection credit default swap agreements which the Fund entered into for the same referenced entity or index. As a buyer of protection, the Fund generally receives an amount up to the notional value of the swap if a credit event occurs.
Implied credit spreads, represented in absolute terms, utilized in determining the market value of credit default swap agreements where the Fund is the seller of protection as of period end are disclosed in the footnotes to the Schedule of Investments, if applicable. These spreads serve as indicators of the current status of the payment/performance risk and represent the likelihood of default risk for the credit derivative. The implied credit spread of a particular referenced entity reflects the cost of buying/selling protection and may include upfront payments required to enter into the agreement. Wider credit spreads and increased market value in absolute terms, when compared to the notional amount of the swap, represent a deterioration of the referenced entity’s credit soundness and a greater likelihood of risk of default or other credit event occurring as defined under the terms of the agreement.
Total Return Swaps: In a total return swap, one party receives payments based on the market value of the security or the commodity involved, or total return of a specific referenced asset, such as an equity, index or bond, and in return pays a defined amount. The Funds are subject to risk exposures associated with the referenced asset in the normal course of pursuing their investment objectives. The Funds entered into total return swaps to manage their exposure to a security or an index. The Funds’ maximum risk of loss from counterparty credit risk is the change in the value of the security, in the Fund’s favor, from the point of entering into the contract.
Floating Rate and Other Loans: Certain Funds invested in floating rate and other loans. Floating rate and other loans include loans that are privately negotiated between a corporate
288
borrower and one or more financial institutions, including, but not limited to, term loans, revolvers, and other instruments issued in the floating rate and other loans market. The Funds acquire interests in loans directly (by way of assignment from the selling institution) and/or indirectly (by way of the purchase of a participation interest from the selling institution). Under a floating rate and other loans assignment, the Funds generally will succeed to all the rights and obligations of an assigning lending institution and become a lender under the loan agreement with the relevant borrower in connection with that loan. Under a floating rate and other loans participation, the Funds generally will have a contractual relationship only with the lender, not with the relevant borrower. As a result, the Funds generally will have the right to receive payments of principal, interest, and any fees to which they are entitled only from the lender selling the participation and only upon receipt by the lender of the payments from the relevant borrower. The Funds may not directly benefit from the collateral supporting the debt obligation in which they have purchased the participation. As a result, the Funds will assume the credit risk of both the borrower and the institution selling the participation to the Funds.
Mortgage-Backed and Asset-Backed Securities: Mortgage-backed securities are pass-through securities, meaning that principal and interest payments made by the borrower on the underlying mortgages are passed through to the Fund. Asset-backed securities directly or indirectly represent a participation interest in, or are secured by and payable from, a stream of payments generated by particular assets such as motor vehicle or credit card receivables. Asset-backed securities may be classified as pass-through certificates or collateralized obligations, such as collateralized bond obligations, collateralized loan obligations and other similarly structured securities. The value of mortgage-backed and asset-backed securities varies with changes in interest rates and may be affected by changes in credit quality or value of the mortgage loans or other assets that support the securities.
Stripped mortgage-backed securities are usually structured with two classes that receive different proportions of the interest (“IO”) and principal (“PO”) distributions on a pool of mortgage assets. Payments received for IOs are included in interest income on the Statements of Operations. Because no principal will be received at the maturity of an IO, adjustments are made to the cost of the security on a monthly basis until maturity. These adjustments are included in interest income on the Statements of Operations. Payments received for POs are treated as reductions to the cost and par value of the securities.
Master Netting Arrangements: The RIC, on behalf of the Funds, is subject to various Master Agreements, or netting arrangements, with select counterparties. These are agreements which a subadviser may have negotiated and entered into on behalf of all or a portion of a Fund. A master netting arrangement between the Fund and the counterparty permits the Fund to offset amounts payable by the Fund to the same counterparty against amounts to be received and by the receipt of collateral from the counterparty by the Funds to cover the Funds’ exposure to the counterparty. However, there is no assurance that such mitigating factors are easily enforceable. In addition to master netting arrangements, the right to set-off exists when all the conditions are met such that each of the parties owes the
PGIM Fixed Income ETFs 289
Notes to Financial Statements (continued)
other determinable amounts, the reporting party has the right to set-off the amount owed with the amount owed by the other party, the reporting party intends to set-off and the right of set-off is enforceable by law.
The RIC, on behalf of the Funds, is a party to International Swaps and Derivatives Association, Inc. (“ISDA”) Master Agreements with certain counterparties that govern OTC derivative and foreign exchange contracts entered into from time to time. The Master Agreements may contain provisions regarding, among other things, the parties’ general obligations, representations, agreements, collateral requirements, events of default and early termination. With respect to certain counterparties, in accordance with the terms of the Master Agreements, collateral posted to the Fund is held in a segregated account by the Fund’s custodian and with respect to those amounts which can be sold or re-pledged, is presented in the Schedule of Investments. Collateral pledged by the Fund is segregated by the Fund’s custodian and identified in the Schedule of Investments. Collateral can be in the form of cash or debt securities issued by the U.S. Government or related agencies or other securities as agreed to by the Fund and the applicable counterparty. Collateral requirements are determined based on the Fund’s net position with each counterparty. Termination events applicable to the Fund may occur upon a decline in the Fund’s net assets below a specified threshold over a certain period of time. Termination events applicable to counterparties may occur upon a decline in the counterparty’s long-term and short-term credit ratings below a specified level. In each case, upon occurrence, the other party may elect to terminate early and cause settlement of all derivative and foreign exchange contracts outstanding, including the payment of any losses and costs resulting from such early termination, as reasonably determined by the terminating party. Any decision by one or more of the Fund’s counterparties to elect early termination could impact the Fund’s future derivative activity.
In addition to each instrument’s primary underlying risk exposure (e.g. interest rate, credit, equity or foreign exchange, etc.), swap agreements involve, to varying degrees, elements of credit, market and documentation risk. Such risks involve the possibility that no liquid market for these agreements will exist, the counterparty to the agreement may default on its obligation to perform or disagree on the contractual terms of the agreement, and changes in net interest rates will be unfavorable. In connection with these agreements, securities in the portfolio may be identified or received as collateral from the counterparty in accordance with the terms of the respective swap agreements to provide or receive assets of value and to serve as recourse in the event of default or bankruptcy/insolvency of either party. Such OTC derivative agreements include conditions which, when materialized, give the counterparty the right to cause an early termination of the transactions under those agreements. Any election by the counterparty for early termination of the contract(s) may impact the amounts reported on financial statements.
290
Short sales and OTC contracts, including forward foreign currency exchange contracts, swaps, forward rate agreements and written options involve elements of both market and credit risk in excess of the amounts reflected on the Statement of Assets and Liabilities, if applicable. Such risks may be mitigated by engaging in master netting arrangements.
Rights: The Funds held rights acquired either through a direct purchase or pursuant to corporate actions. Rights entitle the holder to buy a proportionate amount of common stock, or such other security that the issuer may specify, at a specific price and time through the expiration dates. Such rights are held as long positions by the Funds until exercised, sold or expired. Rights are valued at fair value in accordance with the Board approved fair valuation procedures.
Payment-In-Kind: The Funds invested in the open market or received pursuant to debt restructuring securities that pay-in-kind (PIK) the interest due on such debt instruments. The PIK interest, computed at the contractual rate specified, is added to the existing principal balance of the debt when issued bonds have the same terms as the bond or recorded as a separate bond when terms are different from the existing debt, and is recorded as interest income.
Delayed-Delivery Transactions: The Fund purchased or sold securities on a when-issued or delayed-delivery and forward commitment basis, including TBA securities. These transactions involve a commitment by the Funds to purchase or sell securities for a predetermined price or yield, with payment and delivery taking place beyond the customary settlement period. When delayed-delivery purchases are outstanding, the Funds will set aside and maintain an amount of liquid assets sufficient to meet the purchase price in a segregated account until the settlement date. When purchasing a security on a delayed-delivery basis, the Funds assume the rights and risks of ownership of the security, including the risk of price and yield fluctuations, and takes such fluctuations into account when determining its net asset value. The Funds may dispose of or renegotiate a delayed-delivery transaction subsequent to establishment, and may sell when-issued securities before they are delivered, which may result in a realized gain (loss). When selling a security on a delayed-delivery basis, the Funds forfeit their eligibility to realize future gains (losses) with respect to the security.
Securities Lending: Certain Funds lend their portfolio securities to banks and broker-dealers. The loans are secured by collateral at least equal to the market value of the securities loaned. Collateral pledged by each borrower is invested in an affiliated money market fund and is marked to market daily, based on the previous day’s market value, such that the value of the collateral exceeds the value of the loaned securities. In the event of significant appreciation in value of the securities on loan on the last business day of the reporting period, the financial statements may reflect a collateral value that is less than the market value of the loaned securities. Such shortfall is remedied as described above. Loans are subject to termination at the option of the borrower or the Fund. Upon termination of the loan, the borrower will return to the Fund securities identical to the loaned securities. The remaining open loans of the securities lending transactions are considered overnight and
PGIM Fixed Income ETFs 291
Notes to Financial Statements (continued)
continuous. Should the borrower of the securities fail financially, the Fund has the right to repurchase the securities in the open market using the collateral.
The Fund recognizes income, net of any rebate and securities lending agent fees, for lending its securities in the form of fees or interest on the investment of any cash received as collateral. The borrower receives all interest and dividends from the securities loaned and such payments are passed back to the lender in amounts equivalent thereto, which are reflected in interest income or unaffiliated dividend income based on the nature of the payment on the Statement of Operations. The Fund also continues to recognize any unrealized gain (loss) in the market price of the securities loaned and on the change in the value of the collateral invested that may occur during the term of the loan. In addition, realized gain (loss) is recognized on changes in the value of the collateral invested upon liquidation of the collateral. Net earnings from securities lending are disclosed in the Statement of Operations.
Equity and Mortgage Real Estate Investment Trusts (collectively REITs): The Funds invested in REITs, which report information on the source of their distributions annually. Based on current and historical information, a portion of distributions received from REITs during the period is estimated to be dividend income, capital gain or return of capital and recorded accordingly. When material, these estimates are adjusted periodically when the actual source of distributions is disclosed by the REITs.
Securities Transactions and Net Investment Income: Securities transactions are recorded on the trade date. Realized gains (losses) from investment and currency transactions are calculated on the specific identification method. Dividend income is recorded on the ex-date, or for certain foreign securities, when the Funds become aware of such dividends. Interest income, including amortization of premium and accretion of discount on debt securities, as required, is recorded on the accrual basis. Expenses are recorded on an accrual basis, which may require the use of certain estimates by management that may differ from actual expense amounts.
Taxes: It is each Fund’s policy to continue to meet the requirements of the Internal Revenue Code applicable to regulated investment companies and to distribute all of its taxable net investment income and capital gains, if any, to its shareholders. Therefore, no federal income tax provision is required. Withholding taxes on foreign dividends, interest and capital gains, if any, are recorded, net of reclaimable amounts, at the time the related income is earned.
Dividends and Distributions: Dividends and distributions to shareholders, which are determined in accordance with federal income tax regulations and which may differ from GAAP, are recorded on the ex-date. Permanent book/tax differences relating to income and
292
gain (loss) are reclassified between total distributable earnings (loss) and paid-in capital in excess of par, as appropriate. The chart below sets forth the expected frequency of dividend and capital gains distributions to shareholders. Various factors may impact the frequency of dividend distributions to shareholders, including but not limited to adverse market conditions or portfolio holding-specific events.
| | | | |
| | |
| Expected Distribution Schedule to Shareholders* | | Frequency |
Net Investment Income | | | Monthly | |
| |
Short-Term Capital Gains | | | Annually | |
| |
Long-Term Capital Gains | | | Annually | |
| * | Under certain circumstances, each Fund may make more than one distribution of short-term and/or long-term capital gains during a fiscal year. |
Estimates: The preparation of financial statements requires management to make estimates and assumptions that affect the reported amounts and disclosures in the financial statements. Actual results could differ from those estimates.
Pursuant to a management agreement with the RIC on behalf of the Funds (the Management Agreement), PGIM Investments manages each Fund’s investment operations and administers its business affairs. PGIM Investments is also responsible for supervising each Fund’s subadviser.
Pursuant to the management agreement relating to each Fund, there is a unitary fee structure for the funds whereby PGIM Investments is responsible for substantially all expenses of each Fund, except taxes, brokerage expenses, interest expenses, distribution fees or expenses, expenses incident to shareholder meetings and extraordinary expenses. Each Fund may also pay for any costs or expenses of investing in other funds. For more information on the unitary management fee structure please refer to the Funds’ Statement of Additional Information.
The unitary fee paid to the Manager is accrued daily and payable monthly, at an annual rate of each Fund’s average daily net assets specified below. The Manager has contractually agreed, beginning from each Fund’s inception date, to waive any management fees it receives from the Funds (with the exception of PGIM Floating Rate Income ETF, PGIM AAA CLO ETF and PGIM Short Duration Multi-Sector Bond ETF) in an amount equal to the subadvisory fees paid by the Funds to the PGIM Institutional Money Market Fund due to the Funds’ investment of their excess overnight cash in the PGIM Institutional Money Market Fund. This waiver will remain in effect for as long as the Funds remain invested or intend to invest in the PGIM Institutional Money Market Fund.
| | | | |
| | |
| Fund | | Unitary
Fee Rate |
PGIM Ultra Short Bond ETF | | | 0.15 | % |
| |
PGIM Active High Yield Bond ETF | | | 0.53 | % |
PGIM Fixed Income ETFs 293
Notes to Financial Statements (continued)
| | | | |
| | |
| Fund | | Unitary
Fee Rate |
PGIM Active Aggregate Bond ETF | | | 0.19 | % |
| |
PGIM Total Return Bond ETF | | | 0.49 | % |
| |
PGIM Floating Rate Income ETF | | | 0.72 | % |
| |
PGIM AAA CLO ETF | | | 0.19 | % |
| |
PGIM Short Duration Multi-Sector Bond ETF | | | 0.40 | % |
The Manager has entered into a subadvisory agreement (Subadvisory Agreement) with PGIM, Inc., which provides subadvisory services to the Funds through its business unit PGIM Fixed Income (and, for the PGIM Ultra Short Bond ETF, PGIM Total Return Bond ETF, PGIM Floating Rate Income ETF, PGIM AAA CLO ETF, and PGIM Short Duration Multi-Sector Bond ETF, PGIM Limited) (the “subadviser”). The Manager pays for the services of the subadviser.
The Bank of New York Mellon (“BNY”) serves as the Custodian, Transfer Agent and Administrative Agent for the Trust. BNY receives compensation from the Manager and is reimbursed for expenses, including custodian, transfer agency and administration fees and certain out-of-pocket expenses including, but not limited to, postage, stationery, printing, allocable communication expenses and other costs. The Manager is responsible for compensating BNY under the Custodian, Transfer Agency and Service and Administration and Accounting Agreements.
Prudential Investment Management Services LLC (“PIMS” or the “Distributor”), acts as the distributor of each Fund, pursuant to the terms of a distribution agreement (“Distribution Agreement”) between the RIC and the Distributor. The Distributor is a subsidiary of Prudential. Shares are continuously offered for sale by the Distributor only. Although the Distributor does not receive any fees under the Distribution Agreement, the Manager or its affiliates may pay the Distributor for certain distribution related services.
PGIM Investments, PGIM, Inc., PGIM Limited and PIMS are indirect, wholly-owned subsidiaries of Prudential Financial, Inc. (“Prudential”).
| 4. | Other Transactions with Affiliates |
The Funds may invest their overnight sweep cash in the PGIM Core Government Money Market Fund (the “Core Government Fund”), a series of the Prudential Government Money Market Fund, Inc., and its securities lending cash collateral in the PGIM Institutional Money Market Fund (the “Money Market Fund”), a series of Prudential Investment Portfolios 2, each registered under the 1940 Act and managed by PGIM Investments. PGIM Investments and/or its affiliates are paid fees or reimbursed for providing their services to the Core Government Fund and the Money Market Fund. In addition to the realized and unrealized
294
gains on investments in the Core Government Fund and the Money Market Fund, earnings from such investments are disclosed on the Statement of Operations as “Affiliated dividend income” and “Income from securities lending, net”, respectively.
The Funds may enter into certain securities purchase or sale transactions under Board approved Rule 17a-7 procedures. Rule 17a-7 is an exemptive rule under the 1940 Act that, subject to certain conditions, permits purchase and sale transactions among affiliated investment companies, or between an investment company and a person that is affiliated solely by reason of having a common (or affiliated) investment adviser, common directors/trustees, and/or common officers. For the year ended August 31, 2023, no Rule 17a-7 transactions were entered into by the Funds.
The aggregate cost of purchases and proceeds from sales of portfolio securities (excluding short-term investments, in-kind transactions and U.S. Government securities) for the year ended August 31, 2023, were as follows:
| | | | | | | | |
| | | |
| Fund | | Cost of
Purchases | | | Proceeds
from Sales | |
PGIM Ultra Short Bond ETF | | $ | 2,762,519,560 | | | $ | 714,254,913 | |
PGIM Active High Yield Bond ETF | | | 28,259,779 | | | | 24,845,701 | |
PGIM Active Aggregate Bond ETF | | | 53,337,972 | | | | 49,115,811 | |
PGIM Total Return Bond ETF | | | 142,068,146 | | | | 120,310,020 | |
PGIM Floating Rate Income ETF | | | 127,251,491 | | | | 94,007,175 | |
PGIM AAA CLO ETF | | | 127,233,722 | | | | 3,955,383 | |
| | |
PGIM Short Duration Multi-Sector Bond ETF | | | 18,012,348 | | | | 9,409 | |
A summary of the cost of purchases and proceeds from sales of shares of affiliated mutual funds for the year ended August 31, 2023, is presented as follows:
PGIM Ultra Short Bond ETF
| | | | | | | | | | | | | | | | | | | | | | | | | | | | | | | | | | |
| | | | | | | | | | | | | |
Value,
Beginning
of Year | | Cost of
Purchases | | Proceeds
from Sales | | | | Change in
Unrealized
Gain (Loss) | | | | | Realized Gain (Loss) | | | | | Value,
End of Year | | | | | Shares, End of Year | | | | | Income | |
| | | | | | | |
Short-Term Investments - Affiliated Mutual Funds: | | | | | | | | | | | | | | | | | | | | | | |
| | | | | | | |
PGIM Core Government Money Market Fund(1)(wi) | | | | | | | | | | | | | | | | | | | | | | |
$— | | $2,401,949,977 | | $2,361,563,956 | | | | | $ — | | | | | | $ — | | | | | | $40,386,021 | | | | | | 40,386,021 | | | | | | $3,461,776 | |
| | | | | | | |
PGIM Institutional Money Market Fund(1)(b)(wi) | | | | | | | | | | | | | | | | | | | | | | |
— | | 255,885,131 | | 247,647,820 | | | | | 1,624 | | | | | | 14,033 | | | | | | 8,252,968 | | | | | | 8,257,923 | | | | | | 69,491 | (2) |
$— | | $2,657,835,108 | | $2,609,211,776 | | | | | $1,624 | | | | | | $14,033 | | | | | | $48,638,989 | | | | | | | | | | | | $3,531,267 | |
PGIM Fixed Income ETFs 295
Notes to Financial Statements (continued)
PGIM Active High Yield Bond ETF
| | | | | | | | | | | | | | | | | | | | | | | | | | | | | | | | | | | |
| | | | | | | | |
Value,
Beginning
of Year | | Cost of Purchases | | Proceeds from Sales | | Change in
Unrealized
Gain (Loss) | | Realized Gain (Loss) | | Value,
End of Year | | Shares, End of Year | | Income |
| | | |
Short-Term Investments - Affiliated Mutual Funds: | | | | | | | | | | | | | | | | |
| | |
PGIM Core Government Money Market Fund(1)(wi) | | | | | | | | | | | |
$ — | | | $ | 15,180,117 | | | | $ | 13,085,349 | | | | $ | — | | | | $ | — | | | | $ | 2,094,768 | | | | | 2,094,768 | | | | | $52,330 | |
| | | |
PGIM Institutional Money Market Fund(1)(b)(wi) | | | | | | | | | | | | | | | | |
121,485 | | | | 902,657 | | | | | 1,024,228 | | | | | (24 | ) | | | | 110 | | | | | — | | | | | — | | | | | 3,077 | (2) |
$121,485 | | | $ | 16,082,774 | | | | $ | 14,109,577 | | | | $ | (24 | ) | | | $ | 110 | | | | $ | 2,094,768 | | | | | | | | | | $55,407 | |
PGIM Active Aggregate Bond ETF
| | | | | | | | | | | | | | | | | | | | | | | | | | | | | | | | | | | |
| | | | | | | | |
Value,
Beginning
of Year | | Cost of
Purchases | | Proceeds
from Sales | | Change in
Unrealized
Gain (Loss) | | Realized Gain (Loss) | | Value,
End of Year | | Shares, End of Year | | Income |
| | | |
Short-Term Investments - Affiliated Mutual Fund: | | | | | | | | | | | | | | | | |
| | | | |
PGIM Core Government Money Market Fund(1)(wj) | | | | | | | | | | | | | | | | | | | | | |
$��� | | | $ | 6,528,973 | | | | $ | 5,972,461 | | | | $ | — | | | | $ | — | | | | $ | 556,512 | | | | | 556,512 | | | | | $11,866 | |
PGIM Total Return Bond ETF
| | | | | | | | | | | | | | | | | | | | | | | | | | | | | | | | | | | |
| | | | | | | | |
Value,
Beginning
of Year | | Cost of
Purchases | | Proceeds
from Sales | | Change in
Unrealized
Gain (Loss) | | Realized Gain (Loss) | | Value,
End of Year | | Shares, End of Year | | Income |
| | | |
Short-Term Investments - Affiliated Mutual Funds: | | | | | | | | | | | | | | | | |
| | | | |
PGIM Core Government Money Market Fund(1)(wi) | | | | | | | | | | | | | | | | | | | | | |
$— | | | | $23,626,898 | | | | | $23,255,909 | | | | $ | — | | | | | $— | | | | | $370,989 | | | | | 370,989 | | | | | $36,448 | |
| | | | |
PGIM Institutional Money Market Fund(1)(b)(wi) | | | | | | | | | | | | | | | | | | | | | |
— | | | | 347,986 | | | | | 347,976 | | | | | — | | | | | (10 | ) | | | | — | | | | | — | | | | | 63 | (2) |
$— | | | | $23,974,884 | | | | | $23,603,885 | | | | $ | — | | | | | $(10 | ) | | | | $370,989 | | | | | | | | | | $36,511 | |
296
PGIM Floating Rate Income ETF
| | | | | | | | | | | | | | | | |
| | | | | | | | |
Value,
Beginning
of Year | | Cost of
Purchases | | Proceeds
from Sales | | Change in
Unrealized
Gain (Loss) | | Realized Gain (Loss) | | Value,
End of Year | | Shares, End of Year | | Income | |
| | | |
Short-Term Investments - Affiliated Mutual Fund: | | | | | | | | |
| | | | | |
PGIM Core Government Money Market Fund(1)(wj) | | | | | | | | | | | | |
$— | | $21,091,847 | | $17,209,187 | | $— | | $— | | $3,882,660 | | 3,882,660 | | | $77,119 | |
PGIM AAA CLO ETF
| | | | | | | | | | | | | | | | |
| | | | | | | | |
Value,
Beginning
of Period | | Cost of
Purchases | | Proceeds
from Sales | | Change in
Unrealized
Gain (Loss) | | Realized Gain (Loss) | | Value,
End of Period | | Shares, End of Period | | Income | |
| | | |
Short-Term Investments - Affiliated Mutual Fund: | | | | | | | | |
| | | | | |
PGIM Core Government Money Market Fund(1)(wj) | | | | | | | | | | | | |
$— | | $50,974,173 | | $45,340,296 | | $— | | $— | | $5,633,877 | | 5,633,877 | | | $38,899 | |
PGIM Short Duration Multi-Sector Bond ETF
| | | | | | | | | | | | | | | | |
| | | | | | | | |
Value,
Beginning
of Period | | Cost of
Purchases | | Proceeds
from Sales | | Change in
Unrealized
Gain (Loss) | | Realized Gain (Loss) | | Value,
End of Period | | Shares, End of Period | | Income | |
| | | |
Short-Term Investments - Affiliated Mutual Fund: | | | | | | | | |
| | | | | |
PGIM Core Government Money Market Fund(1)(wj) | | | | | | | | | | | | |
$— | | $28,505,257 | | $28,156,577 | | $— | | $— | | $348,680 | | 348,680 | | | $6,367 | |
| (1) | The Fund did not have any capital gain distributions during the reporting period. |
| (2) | The amount, or a portion thereof, represents the affiliated securities lending income shown on the Statement of Operations. |
| (b) | Represents security, or portion thereof, purchased with cash collateral received for securities on loan and includes dividend reinvestment. |
| (wi) | PGIM Investments LLC, the manager of the Fund, also serves as manager of the PGIM Core Government Money Market Fund and PGIM Institutional Money Market Fund, if applicable. |
| (wj) | PGIM Investments LLC, the manager of the Fund, also serves as manager of the PGIM Core Government Money Market Fund. |
| 6. | Distributions and Tax Information |
Distributions to shareholders, which are determined in accordance with federal income tax regulations and which may differ from GAAP, are recorded on the ex-date. In order to present total distributable earnings (loss) and paid-in capital on the Statement of Assets and Liabilities that more closely represent their tax character, certain adjustments have been made to total distributable earnings (loss) and paid-in capital for the Funds indicated below.
PGIM Fixed Income ETFs 297
Notes to Financial Statements (continued)
For the year ended August 31, 2023, the adjustments were as follows:
| | | | | | |
| Fund | | Total Distributable
Earnings (Loss) | | Paid-in
Capital |
PGIM Short Duration Multi-Sector Bond ETF (a) | | $(634) | | | $634 | |
For the year ended August 31, 2023, the tax character of dividends paid as reflected in the Statement of Changes in Net Assets were as follows:
| | | | | | | | | | | | | | | | | | | | |
| | | | | |
| Fund | | Ordinary
Income | | Long-Term
Capital Gains | | Tax Return
of Capital | | Total Dividends
and Distributions |
| | | | |
PGIM Ultra Short Bond ETF | | | | $180,412,893 | | | | | $ — | | | | $ | — | | | | | $180,412,893 | |
| | | | |
PGIM Active High Yield Bond ETF | | | | 6,738,650 | | | | | — | | | | | — | | | | | 6,738,650 | |
| | | | |
PGIM Active Aggregate Bond ETF | | | | 1,491,727 | | | | | — | | | | | — | | | | | 1,491,727 | |
| | | | |
PGIM Total Return Bond ETF | | | | 4,335,305 | | | | | — | | | | | — | | | | | 4,335,305 | |
| | | | |
PGIM Floating Rate Income ETF | | | | 4,108,983 | | | | | 31,068 | | | | | — | | | | | 4,140,051 | |
| | | | |
PGIM AAA CLO ETF | | | | — | | | | | — | | | | | — | | | | | — | |
| | | | |
PGIM Short Duration Multi-Sector Bond ETF | | | | — | | | | | — | | | | | — | | | | | — | |
For the year ended August 31, 2022, the tax character of dividends paid as reflected in the Statement of Changes in Net Assets were as follows:
| | | | | | | | | | | | | | | | | | | | |
| | | | | |
| Fund | | Ordinary
Income | | Long-Term
Capital Gains | | Tax Return
of Capital | | Total Dividends
and Distributions |
| | | | |
PGIM Ultra Short Bond ETF | | | | $29,966,721 | | | | | $ — | | | | $ | — | | | | | $29,966,721 | |
| | | | |
PGIM Active High Yield Bond ETF | | | | 5,040,362 | | | | | 180,517 | | | | | — | | | | | 5,220,879 | |
| | | | |
PGIM Active Aggregate Bond ETF | | | | 1,113,234 | | | | | — | | | | | — | | | | | 1,113,234 | |
| | | | |
PGIM Total Return Bond ETF | | | | 1,146,783 | | | | | — | | | | | — | | | | | 1,146,783 | |
| | | | |
PGIM Floating Rate Income ETF | | | | 163,855 | | | | | — | | | | | — | | | | | 163,855 | |
| | | | |
PGIM AAA CLO ETF | | | | — | | | | | — | | | | | — | | | | | — | |
| | | | |
PGIM Short Duration Multi-Sector Bond ETF | | | | — | | | | | — | | | | | — | | | | | — | |
For the year ended August 31, 2023, the Funds indicated below had the following amounts of accumulated undistributed earnings on a tax basis:
| | | | | | | | | | |
| Fund | | Undistributed
Ordinary
Income | | Undistributed
Long-Term
Capital Gains |
PGIM Ultra Short Bond ETF | | | | $24,661,043 | | | | | $— | |
PGIM Active High Yield Bond ETF | | | | 990,852 | | | | | — | |
PGIM Active Aggregate Bond ETF | | | | 182,595 | | | | | — | |
PGIM Total Return Bond ETF | | | | 160,240 | | | | | — | |
PGIM Floating Rate Income ETF | | | | 810,697 | | | | | — | |
PGIM AAA CLO ETF | | | | 763,719 | | | | | — | |
PGIM Short Duration Multi-Sector Bond ETF | | | | 200,572 | | | | | — | |
298
The United States federal income tax basis of the Funds’ investments and the net unrealized appreciation (depreciation) as of August 31, 2023 were as follows:
| | | | | | | | | | | | | | | | | | | | | | | | | | | | | | | | | | | |
| Fund | | Tax Basis | | | | Gross
Unrealized
Appreciation | | | | Gross
Unrealized
Depreciation | | | | Net
Unrealized
Appreciation
(Depreciation) |
PGIM Ultra Short Bond ETF | | | $ | 5,260,380,102 | | | | | | | | | $ | 53,842,879 | | | | | | | | | $ | (48,969,293) | | | | | | | | | $ | 4,873,586 | |
PGIM Active High Yield Bond ETF | | | | 123,322,948 | | | | | | | | | | 164,953 | | | | | | | | | | (11,646,177) | | | | | | | | | | (11,481,224) | |
PGIM Active Aggregate Bond ETF | | | | 49,638,256 | | | | | | | | | | 36,310 | | | | | | | | | | (5,872,395) | | | | | | | | | | (5,836,085) | |
PGIM Total Return Bond ETF | | | | 109,152,128 | | | | | | | | | | 150,324 | | | | | | | | | | (6,343,659) | | | | | | | | | | (6,193,335) | |
PGIM Floating Rate Income ETF | | | | 71,575,432 | | | | | | | | | | 379,028 | | | | | | | | | | (46,848) | | | | | | | | | | 332,180 | |
PGIM AAA CLO ETF | | | | 128,924,708 | | | | | | | | | | 178,266 | | | | | | | | | | — | | | | | | | | | | 178,266 | |
PGIM Short Duration Multi-Sector Bond ETF | | | | 25,630,322 | | | | | | | | | | 2,923 | | | | | | | | | | (78,628 | ) | | | | | | | | | (75,705 | ) |
The difference between GAAP and tax basis was primarily attributable to deferred losses on wash sales, straddle loss deferral, amortization of premiums, mark-to-market of futures and forwards contracts, and other GAAP to tax differences.
For federal income tax purposes, the following Funds had an approximated capital loss carryforward as of August 31, 2023 which can be carried forward for an unlimited period. No capital gains distributions are expected to be paid to shareholders until net gains have been realized in excess of such losses.
| | | | | | | | | | |
| Fund | | Capital Loss
Carryforward | | Capital Loss Carryforward Utilized |
PGIM Ultra Short Bond ETF | | | | $33,810,000 | | | | | $— | |
PGIM Active High Yield Bond ETF | | | | 4,635,000 | | | | | — | |
PGIM Active Aggregate Bond ETF | | | | 2,556,000 | | | | | — | |
PGIM Total Return Bond ETF | | | | 9,295,000 | | | | | — | |
PGIM Short Duration Multi-Sector Bond ETF | | | | 14,000 | | | | | — | |
The Funds indicated below elected to treat the below approximated losses as having been incurred in the following fiscal year (August 31, 2024).
| | | | | | | | | | |
| Fund | | Qualified Late-Year Losses | | Post-October Capital Losses |
PGIM Floating Rate Income ETF | | | | $— | | | | | $79,000 | |
The Manager has analyzed the Funds’ tax positions taken on federal, state and local income tax returns for all open tax years and has concluded that no provision for income tax is required in the Funds’ financial statements for the current reporting period. Since tax authorities can examine previously filed tax returns, the Funds’ U.S. federal and state tax returns for each of the four fiscal years up to the most recent fiscal year ended August 31, 2023 are subject to such review.
PGIM Fixed Income ETFs 299
Notes to Financial Statements (continued)
Each Fund is an exchange-traded fund, commonly known as an “ETF”. Individual shares of the Funds may only be purchased and sold in secondary market transactions through brokers or other financial intermediaries. Shares of the Funds are listed for trading on the NYSE Arca, Inc. except for the PGIM Short Duration Multi-Sector Bond ETF, which lists its shares on the Cboe BZX Exchange, Inc. (together with NYSE Arca, Inc., the “Exchanges”), and since the shares of the Funds trade at market prices rather than NAV, shares of the Funds may trade at a price greater than NAV (a premium) or less than NAV (a discount). Each Fund will issue and redeem its shares at NAV only in aggregations of a specified number of shares called a “Creation Unit”. An Authorized Participant is a member or participant of a clearing agency registered with the SEC, which has a written agreement with the Funds or one of their service providers that allows the Authorized Participant to place orders for the purchase and redemption of Creation Units.
A creation transaction, which is subject to acceptance by the Distributor and each Fund, generally takes place when an Authorized Participant deposits into each Fund a designated portfolio of securities, assets or other positions (a “creation basket”), and an amount of cash (including any cash representing the value of substituted securities, assets or other positions), if any, which together approximate the holdings of each Fund in exchange for a specified number of Creation Units. Similarly, shares can be redeemed only in Creation Units, generally for a designated portfolio of securities, assets or other propositions (the “redemption basket”) held by each Fund and an amount of cash (including any portion of such securities for which cash may be substituted). The Funds may, in certain circumstances, offer Creation Units partially or solely for cash. Except when aggregated in Creation Units, shares are not redeemable by the Funds. Creation and redemption baskets may differ and the Funds may accept “custom baskets”. A Creation Unit consists of 25,000 shares of each Fund.
Authorized Participants may be required to pay a fixed creation transaction fee and/or a fixed redemption transaction fee, as applicable, for each transaction in a Creation Unit regardless of the number of Creation Units created or redeemed on that day. These fees, if charged, are paid to the Custodian to offset costs associated with processing creation and redemption transactions. Authorized Participants transacting in creation units for cash may pay an additional variable fee to compensate the Funds for transaction costs and market impact expenses relating to purchases or sales of portfolio securities. Such variable fees, if any, are included in “Net proceeds from shares sold” and/or “Cost of shares purchased”, as applicable, in the Statements of Changes in Net Assets.
The RIC is authorized to issue an unlimited number of shares of beneficial interest, $0.001 par value per share.
300
As of August 31, 2023, Prudential, through its affiliated entities, including affiliated funds (if applicable), owned shares of the Funds as follows:
| | | | | | | | | | |
| | | |
| Fund | | Number of Shares | | Percentage of Outstanding Shares |
PGIM Ultra Short Bond ETF | | | | 2,624,330 | | | | | 2.5 | % |
PGIM Active High Yield Bond ETF | | | | 1,526,600 | | | | | 45.9 | |
PGIM Active Aggregate Bond ETF | | | | 977,500 | | | | | 93.1 | |
PGIM Total Return Bond ETF | | | | 470,000 | | | | | 18.6 | |
PGIM Floating Rate Income ETF | | | | 483,500 | | | | | 35.8 | |
PGIM AAA CLO ETF | | | | 500,040 | | | | | 20.0 | |
PGIM Short Duration Multi-Sector Bond ETF | | | | 495,000 | | | | | 99.0 | |
At the reporting period end, the number of shareholders holding greater than 5% of the Fund are as follows:
| | | | | | | | | | |
| | | |
| Fund | | Number of Shareholders | | Percentage of Outstanding Shares |
Affiliated: | | | | | | | | | | |
PGIM Ultra Short Bond ETF | | | | — | | | | | — | % |
PGIM Active High Yield Bond ETF | | | | 1 | | | | | 45.9 | |
PGIM Active Aggregate Bond ETF | | | | 1 | | | | | 93.1 | |
PGIM Total Return Bond ETF | | | | 1 | | | | | 18.6 | |
PGIM Floating Rate Income ETF | | | | 1 | | | | | 35.8 | |
PGIM AAA CLO ETF | | | | 1 | | | | | 20.0 | |
PGIM Short Duration Multi-Sector Bond ETF | | | | 1 | | | | | 99.0 | |
Unaffiliated: | | | | | | | | | | |
PGIM Ultra Short Bond ETF | | | | 6 | | | | | 62.4 | |
PGIM Active High Yield Bond ETF | | | | 3 | | | | | 31.9 | |
PGIM Active Aggregate Bond ETF | | | | — | | | | | — | |
PGIM Total Return Bond ETF | | | | 3 | | | | | 63.4 | |
PGIM Floating Rate Income ETF | | | | 3 | | | | | 58.1 | |
PGIM AAA CLO ETF | | | | 6 | | | | | 66.3 | |
PGIM Short Duration Multi-Sector Bond ETF | | | | — | | | | | — | |
The Funds may make payment for Fund shares redeemed and contributed wholly or in part by distributing portfolio securities to shareholders. For the year ended August 31, 2023, the PGIM Active High Yield Bond ETF had subscriptions in-kind and no redemptions in-kind with total proceeds in the amounts presented on the Statements of Changes in Net Assets.
The RIC, on behalf of the Funds, along with other affiliated registered investment companies (the “Participating Funds”), is a party to a Syndicated Credit Agreement (“SCA”) with a group of banks. The purpose of the SCA is to provide an alternative source of temporary
PGIM Fixed Income ETFs 301
Notes to Financial Statements (continued)
funding for capital share redemptions. The table below provides details of the current SCA in effect at the reporting period-end as well as the prior SCA.
| | | | | | |
| | | | |
| | | | | Current SCA* | | Prior SCA** |
| | | |
Term of Commitment | | | | 9/30/2022 – 9/28/2023 | | 10/1/2021 – 9/29/2022 |
Total Commitment | | | | Tranche A: $1,200,000,000 Tranche B: $125,000,000*** | | $ 1,200,000,000 |
Annualized Commitment Fee on the Unused Portion of the SCA | | | | 0.15% | | 0.15% |
Annualized Interest Rate on Borrowings | | | | 1.00% plus the higher of (1) the effective federal funds rate, (2) the daily SOFR rate plus 0.10% or (3) zero percent | | 1.20% plus the higher of (1) the effective federal funds rate, (2) the one-month LIBOR rate or (3) zero percent |
| * | The Current SCA did not include PGIM AAA CLO ETF and PGIM Short Duration Multi-Sector Bond ETF. |
| ** | The Prior SCA did not include PGIM AAA CLO ETF, PGIM Short Duration Multi-Sector Bond ETF, PGIM Total Return Bond ETF and PGIM Floating Rate Income ETF. |
| *** | Only PGIM Floating Rate Income ETF and one other fund are party to, and are allocated commitment fees related to, Tranche B of the SCA, in addition to Tranche A. The other Participating Funds are only party to Tranche A of the SCA. |
Subsequent to the reporting period end, the SCA has been renewed and effective September 29, 2023 through September 26, 2024 will provide a commitment of $1,325,000,000, of which $1,200,000,000 (“Tranche A”) will be available for all Participating Funds, and of which $125,000,000 (“Tranche B”) will be solely available to the PGIM Floating Rate Income ETF and one other fund (the “Floating Rate Funds”). The commitment fee allocated to the Participating Funds will continue to be 0.15% of the unused portion of the Tranche A SCA and the commitment fee allocated to the Floating Rate Funds will be 0.15% of the unused portion of the Tranche B SCA. The interest on borrowings under the renewed SCA will be paid monthly and at a per annum interest rate of 1.00% plus the higher of (1) the effective federal funds rate, (2) the daily SOFR rate plus 0.10% or (3) zero percent.
Certain affiliated registered investment companies that are parties to the SCA include portfolios that are subject to a predetermined mathematical formula used to manage certain benefit guarantees offered under variable annuity contracts. The formula may result in large scale asset flows into and out of these portfolios. Consequently, these portfolios may be more likely to utilize the SCA for purposes of funding redemptions. It may be possible for those portfolios to fully exhaust the committed amount of the SCA, thereby requiring the Manager to allocate available funding per a Board-approved methodology designed to treat the Participating Funds in the SCA equitably.
The Funds did not utilize the SCA during the year ended August 31, 2023.
302
| 9. | Risks of Investing in the Funds |
Each Fund’s risks include, but are not limited to, some or all of the risks discussed below. For further information on the risks applicable to any given Fund, please refer to the Prospectus and Statement of Additional Information of that Fund.
| | | | | | | | | | |
| | | | | | |
| Risks | | PGIM Ultra Short Bond ETF | | PGIM Active High Yield Bond ETF | | PGIM Active Aggregate Bond ETF | | PGIM Total Return Bond ETF | | PGIM Floating Rate Income ETF |
Active Trading | | – | | – | | X | | X | | X |
Adjustable and Floating Rate Securities | | – | | – | | – | | – | | X |
Authorized Participant Concentration | | X | | X | | X | | X | | X |
Cash Transactions | | X | | X | | X | | X | | X |
CLO Manager | | – | | – | | – | | – | | – |
Collateralized Loan Obligations | | X | | – | | – | | X | | – |
Covenant-Lite | | – | | X | | – | | X | | X |
Credit | | X | | X | | X | | X | | X |
Currency | | – | | – | | – | | X | | – |
Debt Obligations | | X | | X | | X | | X | | X |
Derivatives | | X | | X | | X | | X | | X |
Distressed and Defaulted Securities | | – | | X | | – | | – | | – |
Economic and Market Events | | X | | X | | X | | X | | X |
Emerging Markets | | – | | X | | X | | X | | X |
ETF Shares Trading | | X | | X | | X | | X | | X |
Foreign Securities | | X | | X | | X | | X | | X |
Floating Rate and Other Loans | | – | | X | | – | | X | | X |
Interest Rate | | X | | X | | X | | X | | X |
Junk Bonds | | – | | X | | – | | X | | X |
Large Shareholder and Large Scale Redemption | | X | | X | | X | | X | | X |
Liquidity | | – | | X | | X | | X | | X |
Loan Liquidity and Settlement | | – | | – | | – | | – | | X |
Management | | X | | X | | X | | X | | X |
Market Disruption and Geopolitical | | X | | X | | X | | X | | X |
Market | | X | | X | | X | | X | | X |
Money Market Instruments | | X | | – | | – | | – | | – |
Mortgage-Backed and Asset-Backed Securities | | X | | X | | X | | X | | – |
New/Small Fund | | – | | – | | X | | X | | X |
Non-Diversified Investment Company Risk | | – | | – | | – | | – | | – |
Non-Money Market Fund | | X | | – | | – | | – | | – |
Prepayment | | X | | – | | – | | – | | – |
Reference Rate | | X | | – | | – | | X | | X |
Small Fund | | – | | X | | – | | – | | – |
Structured Products | | – | | – | | X | | – | | – |
U.S. Government and Agency Securities | | X | | – | | X | | X | | – |
PGIM Fixed Income ETFs 303
Notes to Financial Statements (continued)
| | | | | | | | | | | | | | | | |
| | | | | | |
| Risks | | PGIM Ultra Short Bond ETF | | | PGIM Active High Yield Bond ETF | | | PGIM Active Aggregate Bond ETF | | | PGIM Total Return Bond ETF | | PGIM Floating Rate Income ETF |
Variable and Floating Rate Bonds | | | X | | | | – | | | | – | | | – | | – |
| | | | | |
| | | | | | | | | | | | | | | | |
| | | | | | |
| Risks | | | | | | | | | | | PGIM AAA CLO ETF | | PGIM Short Duration Multi-Sector Bond ETF |
Active Trading | | | | | | | | | | | | | | X | | X |
Adjustable and Floating Rate Securities | | | | | | | | | | | | | | – | | – |
Authorized Participant Concentration | | | | | | | | | | | | | | X | | X |
Cash Transactions | | | | | | | | | | | | | | X | | X |
CLO Manager | | | | | | | | | | | | | | X | | – |
Collateralized Loan Obligations | | | | | | | | | | | | | | X | | – |
Covenant-Lite | | | | | | | | | | | | | | X | | X |
Credit | | | | | | | | | | | | | | X | | X |
Currency | | | | | | | | | | | | | | – | | X |
Debt Obligations | | | | | | | | | | | | | | X | | X |
Derivatives | | | | | | | | | | | | | | X | | X |
Distressed and Defaulted Securities | | | | | | | | | | | | | | – | | – |
Economic and Market Events | | | | | | | | | | | | | | X | | X |
Emerging Markets | | | | | | | | | | | | | | X | | – |
ETF Shares Trading | | | | | | | | | | | | | | X | | X |
Foreign Securities | | | | | | | | | | | | | | X | | X |
Floating Rate and Other Loans | | | | | | | | | | | | | | – | | X |
Interest Rate | | | | | | | | | | | | | | X | | X |
Junk Bonds | | | | | | | | | | | | | | – | | X |
Large Shareholder and Large Scale Redemption | | | | | | | | | | | | | | X | | X |
Liquidity | | | | | | | | | | | | | | X | | X |
Loan Liquidity and Settlement | | | | | | | | | | | | | | – | | – |
Management | | | | | | | | | | | | | | X | | X |
Market Disruption and Geopolitical | | | | | | | | | | | | | | X | | X |
Market | | | | | | | | | | | | | | X | | X |
Money Market Instruments | | | | | | | | | | | | | | – | | – |
Mortgage-Backed and Asset-Backed Securities | | | | | | | | | | | | | | – | | X |
New/Small Fund | | | | | | | | | | | | | | X | | X |
Non-Diversified Investment Company Risk | | | | | | | | | | | | | | X | | – |
Non-Money Market Fund | | | | | | | | | | | | | | – | | – |
Prepayment | | | | | | | | | | | | | | – | | – |
Reference Rate | | | | | | | | | | | | | | X | | X |
Small Fund | | | | | | | | | | | | | | – | | – |
Structured Products | | | | | | | | | | | | | | – | | – |
U.S. Government and Agency Securities | | | | | | | | | | | | | | – | | X |
304
| | | | | | | | | | | | |
| | | | | | |
| Risks | | | | | | | | | PGIM AAA CLO ETF | | PGIM Short Duration Multi-Sector Bond ETF |
Variable and Floating Rate Bonds | | | | | | | | | | – | | – |
Active Trading Risk: The Fund actively and frequently trades its portfolio securities. High portfolio turnover results in higher transaction costs, which can affect the Fund’s performance and have adverse tax consequences. In addition, high portfolio turnover may also mean that a proportionately greater amount of distributions to shareholders will be taxed as ordinary income rather than long-term capital gains compared to investment companies with lower portfolio turnover.
Adjustable and Floating Rate Securities Risk: The value of adjustable and floating rate securities may lag behind the value of fixed rate securities when interest rates change. Such securities may be subject to extended settlement periods (longer than seven days) and in unusual market conditions, with a high volume of shareholder redemptions, may present a risk of loss to the Fund or may impair the Fund’s ability satisfy shareholder redemption requests.
Authorized Participant Concentration Risk: Only an Authorized Participant (as defined in “How to Buy and Sell Shares of the Fund” in the Fund’s Prospectus) may engage in creation or redemption transactions directly with the Fund. The Fund has a limited number of intermediaries that act as Authorized Participants and none of these Authorized Participants is or will be obligated to engage in creation or redemption transactions. To the extent that these Authorized Participants exit the business or are unable to or choose not to proceed with creation and/or redemption orders with respect to the Fund and no other Authorized Participant creates or redeems, shares of the Fund may trade at a substantial discount or premium to net asset value (“NAV”), may trade at larger spreads, and possibly face trading halts and/or delisting.
Cash Transactions Risk: Unlike certain ETFs that engage almost exclusively in creations and redemptions in exchange for a basket of portfolio securities (an“in-kind” transaction), the Fund may effect creations and redemptions in cash or partially in cash. Therefore, it may be required to sell portfolio securities and subsequently recognize gains on such sales that the Fund might not have recognized if it were to distribute portfolio securities in-kind. As such, investments in shares of the Fund may be less tax-efficient than an investment in an ETF that distributes portfolio securities entirely in-kind.
CLO Manager Risk: CLO managers may have limited operating histories and may be subject to conflicts of interest, including managing the assets of other clients and other investment vehicles or holding a significant amount of the equity tranches of a CLO or otherwise receiving fees that may incentivize maximizing the yield, and indirectly the risk, of a CLO. Adverse developments with respect to a CLO manager, such as personnel and resource constraints, regulatory issues or other developments that may impact the ability and/or
PGIM Fixed Income ETFs 305
Notes to Financial Statements (continued)
performance of the CLO manager, may adversely impact the performance of the CLOs in which the Fund invests.
Collateralized Loan Obligations (“CLOs”) Risk: CLOs are subject to credit, interest rate, valuation, and prepayment and extension risks. These securities also are subject to risk of default on the underlying asset, particularly during periods of economic downturn. The market value of CLOs may be affected by, among other things, changes in the market value of the underlying assets held by the CLO, changes in the distributions on the underlying assets, defaults and recoveries on the underlying assets, capital gains and losses on the underlying assets, prepayments on underlying assets and the availability, prices and interest rate of underlying assets.
“Covenant-Lite” Risk: Some of the loans or debt obligations in which the Fund may invest or get exposure to may be “covenant-lite”, which means the loans or obligations contain fewer financial maintenance covenants than other loans or obligations (in some cases, none) and do not include terms which allow the lender to monitor the borrower’s performance and declare a default if certain criteria are breached. An investment by the Fund in a covenant-lite loan may potentially hinder the ability to reprice credit risk associated with the issuer and reduce the ability to restructure a problematic loan and mitigate potential loss. The Fund may also experience difficulty, expenses or delays in enforcing its rights on its holdings of covenant-lite loans or obligations. As a result of these risks, the Fund’s exposure to losses may be increased, which could result in an adverse impact on the Fund’s net income and NAV.
Credit Risk: This is the risk that the issuer, the guarantor or the insurer of a fixed income security, or the counterparty to a contract, may be unable or unwilling to make timely principal and interest payments, or to otherwise honor its obligations. Additionally, fixed income securities could lose value due to a loss of confidence in the ability of the issuer, guarantor, insurer or counterparty to pay back debt. The lower the credit quality of a bond, the more sensitive it is to credit risk.
Currency Risk: The Fund’s net asset value could decline as a result of changes in exchange rates, which could adversely affect the Fund’s investments in currencies, or in securities that trade in, and receive revenues related to, currencies, or in derivatives that provide exposure to currencies. Certain foreign countries may impose restrictions on the ability of issuers of foreign securities to make payment of principal and interest or dividends to investors located outside the country, due to blockage of foreign currency exchanges or otherwise.
Debt Obligations Risk: Debt obligations are subject to credit risk, market risk and interest rate risk. The Fund’s holdings, share price, yield and total return may also fluctuate in response to bond market movements. The value of bonds may decline for issuer-related
306
reasons, including management performance, financial leverage and reduced demand for the issuer’s goods and services. Certain types of fixed income obligations also may be subject to “call and redemption risk,” which is the risk that the issuer may call a bond held by the Fund for redemption before it matures and the Fund may not be able to reinvest at the same rate of interest and therefore would earn less income.
Derivatives Risk: Derivatives involve special risks and costs and may result in losses to the Fund. The successful use of derivatives requires sophisticated management, and, to the extent that derivatives are used, the Fund will depend on the subadviser’s ability to analyze and manage derivatives transactions. The prices of derivatives may move in unexpected ways, especially in abnormal market conditions. Some derivatives are “leveraged” or may create economic leverage for the Fund. and therefore may magnify or otherwise increase investment losses to the Fund. The Fund’s use of derivatives may also increase the amount of taxes payable by shareholders.
Other risks arise from the potential inability to terminate or sell derivatives positions. A liquid secondary market may not always exist for the Fund’s derivatives positions. In fact, many over-the-counter derivative instruments will not have liquidity beyond the counterparty to the instrument. Over-the-counter derivative instruments also involve the risk that the other party will not meet its obligations to the Fund. The use of derivatives also exposes the Fund to operational issues, such as documentation and settlement issues, systems failures, inadequate control and human error.
Derivatives may also involve legal risks, such as insufficient documentation, the lack of capacity or authority of a counterparty to execute or settle a transaction, and the legality and enforceability of derivatives contracts. The U.S. Government and foreign governments have adopted (and may adopt further) regulations governing derivatives markets, including mandatory clearing of certain derivatives, margin and reporting requirements and risk exposure limitations. Regulation of derivatives may make derivatives more costly, limit their availability or utility to the Fund, or otherwise adversely affect their performance or disrupt markets.
Distressed and Defaulted Securities Risk: Distressed and defaulted securities are subject to particularly high credit risk, market risk and illiquidity risk. These securities are at a high risk for default, especially during economic downturns, and they are subject to greater volatility than securities of more stable issuers. To the extent that the Fund invests in bankrupt issuers, the Fund may be subject to litigation risks and costs.
Economic and Market Events Risk: Events in the U.S. and global financial markets, including actions taken by the U.S. Federal Reserve or foreign central banks to stimulate or stabilize economic growth or the functioning of the securities markets, or otherwise reduce inflation, may at times result in unusually high market volatility, which could negatively impact performance. Governmental efforts to curb inflation often have negative effects on the level of economic activity. Relatively reduced liquidity in credit and fixed income markets could adversely affect issuers worldwide.
PGIM Fixed Income ETFs 307
Notes to Financial Statements (continued)
Emerging Markets Risk: The risks of foreign investments are greater for investments in or exposed to emerging markets. Emerging market countries typically have economic and political systems that are less fully developed, and can be expected to be less stable, than those of more developed countries. For example, the economies of such countries can be subject to rapid and unpredictable rates of inflation or deflation. Low trading volumes may result in a lack of liquidity and price volatility. Emerging market countries may have policies that restrict investment by non-U.S. investors, or that prevent non-U.S. investors from withdrawing their money at will.
The Fund may invest in some emerging markets that subject it to risks such as those associated with illiquidity, custody of assets, different settlement and clearance procedures and asserting legal title under a developing legal and regulatory regime to a greater degree than in developed markets or even in other emerging markets.
ETF Shares Trading Risk: Fund shares are listed for trading on an exchange (the “Exchange”) and the shares are bought and sold in the secondary market at market prices. The market prices of the shares of the Fund are expected to fluctuate in response to changes in the Fund’s NAV, the intraday value of the Fund’s holdings and supply and demand for shares of the Fund. During periods of stressed market conditions, the market for the shares of the Fund may become less liquid in response to deteriorating liquidity in the markets for the Fund’s portfolio investments.
Disruptions to creations and redemptions, the existence of significant market volatility or potential lack of an active trading market for the shares of the Fund (including through a trading halt), as well as other factors, may result in the Fund’s shares trading on the Exchange significantly above (at a premium) or below (at a discount) to NAV or to the intraday value of the Fund’s holdings.
Cost of Buying or Selling Shares: When you buy or sell shares of the Fund through a broker, you will likely incur a brokerage commission or other charges imposed by brokers. In addition, the market price of shares of the Fund, like the price of any exchange-traded security, includes a “bid-ask spread” charged by the market makers or other participants that trade the particular security. The spread of the Fund’s shares varies over time based on the Fund’s trading volume, the spread of the Fund’s underlying securities, and market liquidity and may increase if the Fund’s trading volume or market liquidity decreases, or if the spread on the Fund’s underlying securities increases.
No Guarantee of Active Trading Market Risk: While shares of the Fund are listed on the Exchange, there can be no assurance that active trading markets for the shares will
308
develop or be maintained by market makers or by Authorized Participants. The distributor of the Fund’s shares does not maintain a secondary market in the shares.
Floating Rate and Other Loans Risk: The Fund’s ability to receive payments of principal and interest and other amounts in connection with loans (whether through participations, assignments or otherwise) will depend primarily on the financial condition of the borrower. The failure by the Fund to receive scheduled interest or principal payments on a loan because of a default, bankruptcy or any other reason would adversely affect the income of the Fund and would likely reduce the value of its assets. Even with loans secured by collateral, there is the risk that the value of the collateral may decline, may be insufficient to meet the obligations of the borrower, or be difficult to liquidate. In the event of a default, the Fund may have difficulty collecting on any collateral and would not have the ability to collect on any collateral for an uncollateralized loan. Further, the Fund’s access to collateral, if any, may be limited by bankruptcy laws. Due to the nature of the private syndication of senior loans, including, for example, lack of publicly-available information, some senior loans are not as easily purchased or sold as publicly-traded securities. In addition, loan participations generally are subject to restrictions on transfer, and only limited opportunities may exist to sell loan participations in secondary markets. As a result, it may be difficult for the Fund to value loans or sell loans at an acceptable price when it wants to sell them. Loans trade in an over-the-counter market, and confirmation and settlement, which are effected through standardized procedures and documentation, may take significantly longer than seven days to complete. Extended trade settlement periods may, in unusual market conditions with a high volume of shareholder redemptions, present a risk to shareholders regarding the Fund’s ability to pay redemption proceeds in a timely manner. In some instances, loans and loan participations are not rated by independent credit rating agencies; in such instances, a decision by the Fund to invest in a particular loan or loan participation could depend exclusively on the subadviser’s credit analysis of the borrower, or in the case of a loan participation, of the intermediary holding the portion of the loan that the Fund has purchased. To the extent the Fund invests in loans of non-U.S. issuers, the risks of investing in non-U.S. issuers are applicable. Loans may not be considered to be “securities” and as a result may not benefit from the protections of the federal securities laws, including anti-fraud protections and those with respect to the use of material non-public information, so that purchasers, such as the Fund, may not have the benefit of these protections. If the Fund is in possession of material non-public information about a borrower as a result of its investment in such borrower’s loan, the Fund may not be able to enter into a transaction with respect to a publicly-traded security of the borrower when it would otherwise be advantageous to do so.
Foreign Securities Risk: Investments in securities of non-U.S. issuers (including those denominated in U.S. dollars) may involve more risk than investing in securities of U.S. issuers. Foreign political, economic and legal systems, especially those in developing and emerging market countries, may be less stable and more volatile than in the United States. Foreign legal systems generally have fewer regulatory requirements than the U.S. legal system, particularly those of emerging markets. In general, less information is publicly available with respect to non-U.S. companies than U.S. companies. Non-U.S. companies
PGIM Fixed Income ETFs 309
Notes to Financial Statements (continued)
generally are not subject to the same accounting, auditing, and financial reporting standards as are U.S. companies. Additionally, the changing value of foreign currencies and changes in exchange rates could also affect the value of the assets the Fund holds and the Fund’s performance. Certain foreign countries may impose restrictions on the ability of issuers of foreign securities to make payment of principal and interest or dividends to investors located outside the country, due to blockage of foreign currency exchanges or otherwise. Investments in emerging markets are subject to greater volatility and price declines.
In addition, the Fund’s investments in non-U.S. securities may be subject to the risks of nationalization or expropriation of assets, imposition of currency exchange controls or restrictions on the repatriation of non-U.S. currency, confiscatory taxation and adverse diplomatic developments. Special U.S. tax considerations may apply.
Interest Rate Risk: The value of your investment may go down when interest rates rise. A rise in rates tends to have a greater impact on the prices of longer term or duration debt securities. Similarly, a rise in interest rates may also have a greater negative impact on the value of equity securities whose issuers expect earnings further out in the future. For example, a fixed income security with a duration of three years is expected to decrease in value by approximately 3% if interest rates increase by 1%. This is referred to as “duration risk.” When interest rates fall, the issuers of debt obligations may prepay principal more quickly than expected, and the Fund may be required to reinvest the proceeds at a lower interest rate. This is referred to as “prepayment risk.” For premium bonds (bonds acquired at prices that exceed their par or principal value) purchased by the Fund, prepayment risk may be enhanced. When interest rates rise, debt obligations may be repaid more slowly than expected, and the value of the Fund’s holdings may fall sharply. This is referred to as “extension risk.” The Fund may lose money if short-term or long-term interest rates rise sharply or in a manner not anticipated by the subadviser.
Junk Bonds Risk: High-yield, high-risk bonds have predominantly speculative characteristics, including particularly high credit risk. Junk bonds tend to have lower market liquidity than higher-rated securities. The liquidity of particular issuers or industries within a particular investment category may shrink or disappear suddenly and without warning. The non-investment grade bond market can experience sudden and sharp price swings and become illiquid due to a variety of factors, including changes in economic forecasts, stock market activity, large sustained sales by major investors, a high profile default or a change in the market’s psychology.
Large Shareholder and Large Scale Redemption Risk: Certain individuals, accounts, funds (including funds affiliated with the Manager) or institutions, including the Manager and its affiliates, may from time to time own or control a substantial amount of the Fund’s shares. There is no requirement that these entities maintain their investment in the Fund. There is a
310
risk that such large shareholders or that the Fund’s shareholders generally may redeem all or a substantial portion of their investments in the Fund in a short period of time, which could have a significant negative impact on the Fund’s NAV, liquidity, and brokerage costs. Large redemptions could also result in tax consequences to shareholders and impact the Fund’s ability to implement its investment strategy. The Fund’s ability to pursue its investment objective after one or more large scale redemptions may be impaired and, as a result, the Fund may invest a larger portion of its assets in cash or cash equivalents.
Leverage Risk: Certain transactions in which the Fund may engage may give rise to leverage. The use of leverage exaggerates the effect of any increase or decrease in the value of the Fund’s holdings, and makes any change in the Fund’s net asset value (“NAV”) greater than it would be without the use of leverage. This could result in increased volatility of investment return.
Liquidity Risk: The Fund may invest in instruments that trade in lower volumes and are more illiquid than other investments. If the Fund is forced to sell these investments to pay redemption proceeds or for other reasons, the Fund may lose money. In addition, when there is no willing buyer and investments cannot be readily sold at the desired time or price, the Fund may have to accept a lower price or may not be able to sell the instrument at all. An inability to sell a portfolio position can adversely affect the Fund’s value or prevent the Fund from being able to take advantage of other investment opportunities.
Loan Liquidity and Settlement Risk: The Fund’s investments in loans may subject it to additional illiquidity risks. Loans generally are subject to legal or contractual restrictions on resale. The liquidity of loans, including the volume and frequency of secondary market trading in such loans, varies significantly over time and among individual loans. For example, if the credit quality of a loan unexpectedly declines significantly, secondary market trading in that loan can also decline for a period of time. During periods of infrequent trading, valuing a loan can be more difficult and buying and selling a loan at an acceptable price can be more difficult and delayed. Difficulty in selling a loan can result in a loss. Certain of the Fund’s assets may be invested in assets that are considerably less liquid than debt instruments traded on national exchanges. Market quotations for such assets may be volatile and/or subject to large spreads between bid and ask prices. Loans trade in an over-the-counter market, and confirmation and settlement may take significantly longer than seven days to complete. Extended trade settlement periods may, in unusual market conditions with a high volume of shareholder redemptions, present a risk to shareholders regarding the Fund’s ability to pay redemption proceeds within the allowable time periods stated in the Fund’s Prospectus. To the extent the extended loan settlement process gives rise to short-term liquidity needs, such as the need to satisfy redemption requests, the Fund may hold cash, sell investments or borrow from banks.
The Fund may borrow to meet redemptions and may choose to keep such borrowings outstanding until loans or other portfolio transactions settle or for other extended periods. During the period when borrowings are outstanding, the Fund will incur interest expense. The Fund’s portfolio may also be subject to greater volatility during periods of borrowing,
PGIM Fixed Income ETFs 311
Notes to Financial Statements (continued)
which can have an adverse impact on the Fund’s net asset value. The Fund will be required to maintain specified asset coverage by applicable federal securities laws and the terms of its credit facility with the lender with respect to its borrowings. The Fund may be required to dispose of portfolio investments on unfavorable terms if market fluctuations or other factors cause the Fund to fail to meet its asset coverage requirements.
Management Risk: Actively managed funds are subject to management risk. The subadviser will apply investment techniques and risk analyses in making investment decisions for the Fund, but the subadviser’s judgments about the attractiveness, value or market trends affecting a particular security, industry or sector or about market movements may be incorrect. Additionally, the investments selected for the Fund may underperform the markets in general, the Fund’s benchmark and other funds with similar investment objectives.
Market Disruption and Geopolitical Risks: Market disruption can be caused by economic, financial or political events and factors, including but not limited to, international wars or conflicts (including Russia’s military invasion of Ukraine), geopolitical developments (including trading and tariff arrangements, sanctions and cybersecurity attacks), instability in regions such as Asia, Eastern Europe and the Middle East, terrorism, natural disasters and public health epidemics (including the outbreak of COVID-19 globally).
The extent and duration of such events and resulting market disruptions cannot be predicted, but could be substantial and could magnify the impact of other risks to the Fund. These and other similar events could adversely affect the U.S. and foreign financial markets and lead to increased market volatility, reduced liquidity in the securities markets, significant negative impacts on issuers and the markets for certain securities and commodities and/or government intervention. They may also cause short- or long-term economic uncertainties in the United States and worldwide. As a result, whether or not the Fund invests in securities of issuers located in or with significant exposure to the countries directly affected, the value and liquidity of the Fund’s investments may be negatively impacted. Further, due to closures of certain markets and restrictions on trading certain securities, the value of certain securities held by the Fund could be significantly impacted, which could lead to such securities being valued at zero.
COVID-19 and the related governmental and public responses have had, and future public health epidemics may have an impact on the Fund’s investments and net asset value, and have led and may lead to increased market volatility and the potential for illiquidity in certain classes of securities and sectors of the market. Future public health epidemics may result in periods of business disruption, business closures, inability to obtain raw materials, supplies and component parts, and reduced or disrupted operations for the issuers in which the
312
Fund invests. The occurrence, reoccurrence and pendency of public health epidemics could adversely affect the economies and financial markets either in specific countries or worldwide.
Market Risk: Securities markets may be volatile and the market prices of the Fund’s securities may decline. Securities fluctuate in price based on changes in an issuer’s financial condition and overall market and economic conditions. If the market prices of the securities owned by the Fund fall, the value of your investment in the Fund will decline.
Money Market Instruments Risk: The value of money market instruments may be affected by changing interest rates and by changes in the credit ratings of those instruments. If a significant amount of the Fund’s assets are invested in money market instruments, it will be more difficult for the Fund to achieve its investment objective.
Mortgage-Backed and Asset-Backed Securities Risk: Mortgage-backed and asset-backed securities tend to increase in value less than other debt securities when interest rates decline, but are subject to similar risk of decline in market value during periods of rising interest rates. The values of mortgage-backed and asset-backed securities become more volatile as interest rates rise. In a period of declining interest rates, the Fund may be required to reinvest more frequent prepayments on mortgage-backed and asset-backed securities in lower-yielding investments.
New/Small Fund Risk: The Fund recently commenced operations and has a limited operating history. As a new and relatively small fund, the Fund’s performance may not represent how the Fund is expected to or may perform in the long term if and when it becomes larger and has fully implemented its investment strategies. Investment positions may have a disproportionate impact (negative or positive) on performance in new and smaller funds. New and smaller funds may also require a period of time before they are invested in securities that meet their investment objectives and policies and achieve a representative portfolio composition. Since the Fund is new, an active secondary market for the shares of the Fund may not develop or may not continue once developed. Shareholders holding large blocks of shares of the Fund, including the Manager and its affiliates, may hold their shares for long periods of time, which may lead to reduced trading volumes, wider trading spreads and impede the development or maintenance of an active secondary trading market for Fund shares. These large shareholders may also loan or sell all or a portion of their Fund shares, which may result in increasing concentration of Fund shares in a small number of holders, and the potential for large redemptions, decreases in Fund assets and increased expenses for remaining shareholders.
Non-Diversified Investment Company Risk: The Fund is non-diversified for purposes of the 1940 Act. This means that the Fund may invest a greater percentage of its assets in the securities of a single company or other issuer than a diversified fund. Investing in a non-diversified fund involves greater risk than investing in a diversified fund because a loss resulting from the decline in value of any one security may represent a greater portion of the total assets of a non-diversified fund.
PGIM Fixed Income ETFs 313
Notes to Financial Statements (continued)
Non-Money Market Fund Risk: The Fund is not a money market fund. The Fund does not seek to maintain a stable net asset value (NAV) of $1.00 per share. The Fund’s NAV and market value will fluctuate every day and these fluctuations may be significant on certain days. Also, the Fund is not subject to the liquidity requirements and investment and credit quality restrictions applicable to money market funds. There can be no guarantee that the Fund will generate higher returns than money market funds.
Prepayment Risk: The Fund may invest in mortgage-related securities and asset-backed securities, which are subject to prepayment risk. If these securities are prepaid, the Fund may have to replace them with lower-yielding securities. Stripped mortgage-backed securities are generally more sensitive to changes in prepayment and interest rates than other mortgage-related securities. Unlike mortgage-related securities, asset-backed securities are usually not collateralized. If the issuer of a non-collateralized debt security defaults on the obligation, there is no collateral that the security holder may sell to satisfy the debt.
Reference Rate Risk: The Fund may be exposed to financial instruments that recently transitioned from using or continue to use the London Interbank Offered Rate (“LIBOR”) or synthetic version thereof to determine payment obligations, financing terms, hedging strategies or investment value.
The United Kingdom’s Financial Conduct Authority (the “FCA”) announced a phase out of LIBOR such that after June 30, 2023, the overnight, 1-month, 3-month, 6-month and 12-month U.S. dollar LIBOR settings ceased to be published or are no longer representative. All other LIBOR settings and certain other interbank offered rates, such as the Euro Overnight Index Average (“EONIA”), ceased to be published after December 31, 2021. On December 16, 2022, the Federal Reserve Board adopted regulations implementing the Adjustable Interest Rate Act by identifying benchmark rates based on the Secured Overnight Financing Rate that replaced LIBOR in different categories of financial contracts after June 30, 2023. These regulations apply only to contracts governed by U.S. law, among other limitations. The FCA will permit the use of synthetic U.S. dollar LIBOR rates for non-U.S. contracts through September 30, 2024, but any such rates would be considered non-representative of the underlying market.
Neither the effect of the LIBOR transition process nor its ultimate success can yet be known. Not all existing LIBOR-based instruments may have alternative rate-setting provisions and there remains uncertainty regarding the willingness and ability of issuers to add alternative rate-setting provisions in certain existing instruments. Parties to contracts, securities or other instruments using LIBOR may disagree on transition rates or the application of applicable transition regulation, potentially resulting in uncertainty of performance and the possibility of
314
litigation. The Fund may have instruments linked to other interbank offered rates that may also cease to be published in the future.
Small Fund Risk: When the Fund’s size is small, the Fund may experience low trading volume and wide bid/ask spreads. The Fund may face the risk of being delisted if it does not meet certain conditions of the listing exchange due to small size. Any resulting liquidation of the Fund could cause the Fund to incur elevated transaction costs for the Fund and negative tax consequences for its shareholders.
Structured Products Risk: Holders of structured product securities bear risks of the underlying investments, index or reference obligation. Certain structured products may be thinly traded or have a limited trading market, and as a result may be characterized as illiquid. The possible lack of a liquid secondary market for structured securities and the resulting inability of the Fund to sell a structured security could expose the Fund to losses and could make structured securities more difficult for the Fund to value accurately, which may also result in additional costs. Structured products are also subject to credit risk; the assets backing the structured product may be insufficient to pay interest or principal. In addition to the general risks associated with investments in fixed income, structured products carry additional risks, including, but not limited to: the possibility that distributions from collateral securities will not be adequate to make interest or other payments; the quality of the collateral may decline in value or default; and the possibility that the structured products are subordinate to other classes. Structured securities are generally privately negotiated debt obligations where the principal and/or interest or value of the structured security is determined by reference to the performance of a specific asset, benchmark asset, market or interest rate (“reference instrument”), and changes in the reference instrument or security may cause significant price fluctuations, or could cause the interest rate on the structured security to be reduced to zero. Holders of structured products indirectly bear risks associated with the reference instrument, are subject to counterparty risk and typically do not have direct rights against the reference instrument. Structured products may also entail structural complexity and documentation risk and there is no guarantee that the courts or administrators will interpret the priority of principal and interest payments as expected.
U.S. Government and Agency Securities Risk: U.S. Treasury obligations are backed by the “full faith and credit” of the U.S. Government. Securities issued or guaranteed by federal agencies or authorities and U.S. Government-sponsored instrumentalities or enterprises may or may not be backed by the full faith and credit of the U.S. Government. For example, securities issued by the Federal Home Loan Mortgage Corporation, the Federal National Mortgage Association and the Federal Home Loan Banks are neither insured nor guaranteed by the U.S. Government. These securities may be supported by the ability to borrow from the U.S. Treasury or only by the credit of the issuing agency, authority, instrumentality or enterprise and, as a result, are subject to greater credit risk than securities issued or guaranteed by the U.S. Treasury. Further, the U.S. Government and its agencies, authorities, instrumentalities and enterprises do not guarantee the market value of their securities; consequently, the value of such securities will fluctuate. This may be the case
PGIM Fixed Income ETFs 315
Notes to Financial Statements (continued)
especially when there is any controversy or ongoing uncertainty regarding the status of negotiations in the U.S. Congress to increase the statutory debt ceiling. Such controversy or uncertainty could, among other things, result in the credit quality rating of the U.S. Government being downgraded and reduced prices of U.S. Treasury securities. If the U.S. Congress is unable to negotiate an adjustment to the statutory debt ceiling, there is also the risk that the U.S. Government may default on payments on certain U.S. Government securities, including those held by the Fund, which could have a negative impact on the Fund. An increase in demand for U.S. Government securities resulting from an increase in demand for government money market funds may lead to lower yields on such securities.
Variable and Floating Rate Bonds Risk: Variable and floating rate bonds are subject to credit risk, market risk and interest rate risk. In addition, the absence of an active market for these securities could make it difficult for the Fund to dispose of them if the issuer defaults. The settlement period for such bonds can be longer than seven days.
| 10. | Recent Regulatory Developments |
Effective January 24, 2023, the SEC adopted rule and form amendments to require mutual funds and ETFs to transmit concise and visually engaging streamlined annual and semiannual reports to shareholders that highlight key information deemed important for retail investors to assess and monitor their fund investments (the “Rule”). Other information, including financial statements, will no longer appear in the funds’ streamlined shareholder reports but must be available online, delivered free of charge upon request, and filed on a semiannual basis on Form N-CSR. The Rule and form amendments have a compliance date of July 24, 2024. At this time, management is evaluating the Rule and its impact to the Funds.
316
Report of Independent Registered Public Accounting Firm
To the Board of Trustees of PGIM ETF Trust and Shareholders of PGIM Ultra Short Bond ETF, PGIM Active High Yield Bond ETF, PGIM Active Aggregate Bond ETF, PGIM Total Return Bond ETF, PGIM Floating Rate Income ETF, PGIM AAA CLO ETF, and PGIM Short Duration Multi-Sector Bond ETF
Opinions on the Financial Statements
We have audited the accompanying statements of assets and liabilities, including the schedules of investments, of PGIM Ultra Short Bond ETF, PGIM Active High Yield Bond ETF, PGIM Active Aggregate Bond ETF, PGIM Total Return Bond ETF, PGIM Floating Rate Income ETF, PGIM AAA CLO ETF, and PGIM Short Duration Multi-Sector Bond ETF (seven of the funds constituting PGIM ETF Trust, hereafter collectively referred to as the “Funds”) as of August 31, 2023, the related statements of operations and of changes in net assets for each of the periods indicated in the table below, including the related notes, and the financial highlights for each of the periods indicated therein ended on or subsequent to August 31, 2021 (collectively referred to as the “financial statements”). In our opinion, the financial statements present fairly, in all material respects, the financial position of each of the Funds as of August 31, 2023, the results of each of their operations and the changes in each of their net assets for each of the periods indicated in the table below and each of the financial highlights for each of the periods indicated therein ended on or subsequent to August 31, 2021 in conformity with accounting principles generally accepted in the United States of America.
| | |
Fund | | Statements |
PGIM Ultra Short Bond ETF PGIM Active High Yield Bond ETF PGIM Active Aggregate Bond ETF | | Statements of operations for the year ended August 31, 2023 and statements of changes in net assets for each of the two years in the period ended August 31, 2023 |
| |
| PGIM Total Return Bond ETF | | Statement of operations for the year ended August 31, 2023 and statement of changes in net assets for the year ended August 31, 2023 and the period December 2, 2021 (commencement of operations) through August 31, 2022 |
| |
| PGIM Floating Rate Income ETF | | Statement of operations for the year ended August 31, 2023 and statement of changes in net assets for the year ended August 31, 2023 and the period May 17, 2022 (commencement of operations) through August 31, 2022 |
| |
PGIM AAA CLO ETF PGIM Short Duration Multi-Sector Bond ETF | | Statements of operations and changes in net assets for the period July 19, 2023 (commencement of operations) through August 31, 2023 |
The financial statements of PGIM Ultra Short Bond ETF and PGIM Active High Yield Bond ETF as of and for the year ended August 31, 2020 and the financial highlights for each of the periods ended on or prior to August 31, 2020 (not presented herein, other than the financial highlights) were audited by other auditors whose report dated October 15, 2020 expressed an unqualified opinion on those financial statements and financial highlights.
PGIM Fixed Income ETFs 317
Report of Independent Registered Public Accounting Firm (continued)
Basis for Opinions
These financial statements are the responsibility of the Funds’ management. Our responsibility is to express an opinion on the Funds’ financial statements based on our audits. We are a public accounting firm registered with the Public Company Accounting Oversight Board (United States) (PCAOB) and are required to be independent with respect to the Funds in accordance with the U.S. federal securities laws and the applicable rules and regulations of the Securities and Exchange Commission and the PCAOB.
We conducted our audits of these financial statements in accordance with the standards of the PCAOB. Those standards require that we plan and perform the audit to obtain reasonable assurance about whether the financial statements are free of material misstatement, whether due to error or fraud.
Our audits included performing procedures to assess the risks of material misstatement of the financial statements, whether due to error or fraud, and performing procedures that respond to those risks. Such procedures included examining, on a test basis, evidence regarding the amounts and disclosures in the financial statements. Our audits also included evaluating the accounting principles used and significant estimates made by management, as well as evaluating the overall presentation of the financial statements. Our procedures included confirmation of securities owned as of August 31, 2023 by correspondence with the custodian, transfer agent and brokers; when replies were not received from brokers, we performed other auditing procedures. We believe that our audits provide a reasonable basis for our opinion.
/s/PricewaterhouseCoopers LLP
October 19, 2023
We have served as the auditor of one or more investment companies in the PGIM Retail Funds complex since 2020.
318
Tax Information (unaudited)
We are advising you that during the fiscal year ended August 31, 2023, the Fund reported the maximum amount allowed per share as a capital gain distribution in accordance with Section 852(b)(3)(C) of the Internal Revenue Code.
| | |
| | |
| | | Capital Gain Distributions |
PGIM Floating Rate Income ETF | | $0.03 |
For the year ended August 31, 2023, the following Funds report the maximum amount allowable but not less than the following percentages as interest-related dividends in accordance with Section 871(k)(1) and 881(e)(1) of the Internal Revenue Code (IRD):
| | | | |
| | |
| | | IRD |
PGIM Ultra Short Bond ETF | | | 85.74 | % |
PGIM Active High Yield Bond ETF | | | 71.72 | % |
PGIM Active Aggregate Bond ETF | | | 89.99 | % |
PGIM Total Return Bond ETF | | | 82.69 | % |
PGIM Floating Rate Income ETF | | | 89.84 | % |
For the year ended August 31, 2023, the following Funds report the maximum amount allowable but not less than the following percentages of interest dividends that are eligible to be treated as interest income in accordance with Section 163(j) of the Internal Revenue Code.
| | | | |
| | |
| | | 163(j) |
PGIM Ultra Short Bond ETF | | | 73.75 | % |
PGIM Active High Yield Bond ETF | | | 76.98 | % |
PGIM Active Aggregate Bond ETF | | | 93.14 | % |
PGIM Total Return Bond ETF | | | 5.27 | % |
PGIM Floating Rate Income ETF | | | 85.48 | % |
In January 2024, you will be advised on IRS Form 1099-DIV or substitute 1099-DIV as to the federal tax status of the distributions received by you in calendar year 2023.
We are required by Massachusetts, Missouri and Oregon to inform you that dividends which have been derived from interest on federal obligations are not taxable to shareholders providing the Mutual Fund meets certain requirements mandated by the respective state’s taxing authorities. We are pleased to report that the three below funds qualifies for such deduction.
| | |
| | |
| | | Federal Obligations Interest |
PGIM Active High Yield Bond ETF | | 1.58% |
PGIM Active Aggregate Bond ETF | | 14.49% |
PGIM Total Return Bond ETF | | 19.51% |
For more detailed information regarding your state and local taxes, you should contact your tax adviser or the state/local taxing authorities.
PGIM Fixed Income ETFs 319
Liquidity Risk Management Program (unaudited)
Consistent with Rule 22e-4 under the 1940 Act (the “Liquidity Rule”), each Fund has adopted and implemented a liquidity risk management program (the “LRMP”). Each Fund’s LRMP seeks to assess and manage each Fund’s liquidity risk, which is defined as the risk that each Fund is unable to meet investor redemption requests without significantly diluting the remaining investors’ interests in each Fund. The Board has approved PGIM Investments, each Fund’s investment manager, to serve as the administrator of each Fund’s LRMP. As part of its responsibilities as administrator, PGIM Investments has retained a third party to perform certain functions, including providing market data and liquidity classification model information.
Each Fund’s LRMP includes a number of processes designed to support the assessment and management of its liquidity risk. In particular, each Fund’s LRMP includes no less than annual assessments of factors that influence each Fund’s liquidity risk; no less than monthly classifications of each Fund’s investments into one of four liquidity classifications provided for in the Liquidity Rule; a 15% of net assets limit on the acquisition of “illiquid investments” (as defined under the Liquidity Rule); establishment of a minimum percentage of each Fund’s assets to be invested in investments classified as “highly liquid” (as defined under the Liquidity Rule) if each Fund does not invest primarily in highly liquid investments; and regular reporting to the Board.
At a meeting of the Board on March 7-9, 2023, PGIM Investments provided a written report (“LRMP Report”) to the Board addressing the operation, adequacy, and effectiveness of each Fund’s LRMP, including any material changes to the LRMP for the period from January 1, 2022 through December 31, 2022 (“Reporting Period”). The LRMP Report concluded that each Fund’s LRMP was reasonably designed to assess and manage each Fund’s liquidity risk and was adequately and effectively implemented during the Reporting Period. There were no material changes to the LRMP during the Reporting Period. The LRMP Report further concluded that each Fund’s investment strategies continue to be appropriate given each Fund’s status as an open-end fund.
The LRMP Report also noted that given the PGIM Floating Rate Income ETF’s portfolio of investments (that is, more than 50% of the Fund’s assets were classified as less than highly liquid), the Fund maintained a Highly Liquid Investment Minimum (“HLIM”) throughout the Reporting Period.
There can be no assurance that the LRMP will achieve its objectives in the future. Additional information regarding risks of investing in each Fund including liquidity risks presented by each Fund’s investment portfolio, is found in each Fund’s Prospectus and Statement of Additional Information.
320
INFORMATION ABOUT BOARD MEMBERS AND OFFICERS (unaudited)
Information about Board Members and Officers of the Funds is set forth below. Board Members who are not deemed to be “interested persons” of the Funds, as defined in the 1940 Act, are referred to as “Independent Board Members.” Board Members who are deemed to be “interested persons” of the Funds are referred to as “Interested Board Members.” The Board Members are responsible for the overall supervision of the operations of the Funds and perform the various duties imposed on the directors of investment companies by the 1940 Act. The Board in turn elects the Officers, who are responsible for administering the day-to-day operations of the Funds.
| | | | | | |
| | | |
| Independent Board Members | | | | |
| | | | |
Name Year of Birth Position(s) Portfolios Overseen | | Principal Occupation(s) During Past Five Years | | Other Directorships Held During Past Five Years | | Length of Board Service |
| | | | |
Ellen S. Alberding 1958 Board Member Portfolios Overseen: 99 | | Chief Executive Officer (“CEO”) and President, The Joyce Foundation (charitable foundation) (since 2002); formerly Vice Chair, City Colleges of Chicago (community college system) (2011-2015); formerly Trustee, National Park Foundation (charitable foundation for national park system) (2009-2018); formerly Trustee, Economic Club of Chicago (2009-2016); Trustee, Loyola University (since 2018). | | None. | | Since December 2017 |
| | | | |
Kevin J. Bannon 1952 Board Member Portfolios Overseen: 100 | | Retired; formerly Managing Director (April 2008-May 2015) and Chief Investment Officer (October 2008-November 2013) of Highmount Capital LLC (registered investment adviser); formerly Executive Vice President and Chief Investment Officer (April 1993-August 2007) of Bank of New York Company; formerly President (May 2003-May 2007) of BNY Hamilton Family of Mutual Funds. | | Director of Urstadt Biddle Properties (equity real estate investment trust) (since September 2008). | | Since December 2017 |
PGIM Fixed Income ETFs
| | | | | | |
| | | |
| Independent Board Members | | | | |
| | | | |
Name Year of Birth Position(s) Portfolios Overseen | | Principal Occupation(s) During Past Five Years | | Other Directorships Held During Past Five Years | | Length of Board Service |
| | | | |
Linda W. Bynoe 1952 Board Member Portfolios Overseen: 97 | | President and Chief Executive Officer (since March 1995) and formerly Chief Operating Officer (December 1989-February 1995) of Telemat Limited LLC (formerly Telemat Ltd) (management consulting); formerly Vice President (January 1985-June 1989) at Morgan Stanley & Co. (broker-dealer). | | Trustee of Equity Residential (residential real estate) (since December 2009); Director of Northern Trust Corporation (financial services) (since April 2006); formerly Director of Anixter International, Inc. (communication products distributor) (January 2006-June 2020). | | Since December 2017 |
| | | | |
Barry H. Evans 1960 Board Member Portfolios Overseen: 100 | | Retired; formerly President (2005-2016), Global Chief Operating Officer (2014-2016), Chief Investment Officer - Global Head of Fixed Income (1998-2014), and various portfolio manager roles (1986-2006), Manulife Asset Management (asset management). | | Formerly Director, Manulife Trust Company (2011-2018); formerly Director, Manulife Asset Management Limited (2015-2017); formerly Chairman of the Board of Directors of Manulife Asset Management U.S. (2005-2016); formerly Chairman of the Board, Declaration Investment Management and Research (2008-2016). | | Since December 2017 |
| | | | |
Keith F. Hartstein 1956 Board Member & Independent Chair Portfolios Overseen: 100 | | Retired; formerly Member (November 2014- September 2022) of the Governing Council of the Independent Directors Council (IDC) (organization of independent mutual fund directors); formerly Executive Committee of the IDC Board of Governors (October 2019-December 2021); formerly President and Chief Executive Officer (2005-2012), Senior Vice President (2004-2005), Senior Vice President of Sales and Marketing (1997-2004), and various executive management positions (1990-1997), John Hancock Funds, LLC (asset management); formerly Chairman, Investment Company Institute’s Sales Force Marketing Committee (2003-2008). | | None. | | Since December 2017 |
Visit our website at pgim.com/investments
| | | | | | |
| | | |
| Independent Board Members | | | | |
| | | | |
Name Year of Birth Position(s) Portfolios Overseen | | Principal Occupation(s) During Past Five Years | | Other Directorships Held During Past Five Years | | Length of Board Service |
| | | | |
Laurie Simon Hodrick 1962 Board Member Portfolios Overseen: 97 | | A. Barton Hepburn Professor Emerita of Economics in the Faculty of Business, Columbia Business School (since 2018); Visiting Fellow at the Hoover Institution, Stanford University (since 2015); Sole Member, ReidCourt LLC (since 2008) (a consulting firm); formerly Visiting Professor of Law, Stanford Law School (2015-2021); formerly A. Barton Hepburn Professor of Economics in the Faculty of Business, Columbia Business School (1996-2017); formerly Managing Director, Global Head of Alternative Investment Strategies, Deutsche Bank (2006-2008). | | Independent Director, Andela (since January 2022) (global talent network); Independent Director, Roku (since December 2020) (communication services); formerly Independent Director, Synnex Corporation (2019-2021) (information technology); formerly Independent Director, Kabbage, Inc. (2018-2020) (financial services); formerly Independent Director, Corporate Capital Trust (2017-2018) (a business development company). | | Since December 2017 |
| | | | |
Brian K. Reid 1961 Board Member Portfolios Overseen: 100 | | Retired; formerly Chief Economist for the Investment Company Institute (ICI) (2005-2017); formerly Senior Economist and Director of Industry and Financial Analysis at the ICI (1998-2004); formerly Senior Economist, Industry and Financial Analysis at the ICI (1996-1998); formerly Staff Economist at the Federal Reserve Board (1989-1996); formerly Director, ICI Mutual Insurance Company (2012-2017). | | None. | | Since March 2018 |
PGIM Fixed Income ETFs
| | | | | | |
| | | |
| Independent Board Members | | | | |
| | | | |
Name Year of Birth Position(s) Portfolios Overseen | | Principal Occupation(s) During Past Five Years | | Other Directorships Held During Past Five Years | | Length of Board Service |
| | | | |
Grace C. Torres 1959 Board Member Portfolios Overseen: 100 | | Retired; formerly Treasurer and Principal Financial and Accounting Officer of the PGIM Funds, Target Funds, Advanced Series Trust, Prudential Variable Contract Accounts and The Prudential Series Fund (1998-June 2014); Assistant Treasurer (March 1999-June 2014) and Senior Vice President (September 1999-June 2014) of PGIM Investments LLC; Assistant Treasurer (May 2003-June 2014) and Vice President (June 2005-June 2014) of AST Investment Services, Inc.; Senior Vice President and Assistant Treasurer (May 2003-June 2014) of Prudential Annuities Advisory Services, Inc. | | Director (since January 2018) of OceanFirst Financial Corp. and OceanFirst Bank; formerly Director (July 2015-January 2018) of Sun Bancorp, Inc. N.A. and Sun National Bank. | | Since December 2017 |
Visit our website at pgim.com/investments
| | | | | | |
| | | |
| Interested Board Members | | | | |
| | | | |
Name Year of Birth Position(s) Portfolios Overseen | | Principal Occupation(s) During Past Five Years | | Other Directorships Held During Past Five Years | | Length of Board Service |
| | | | |
Stuart S. Parker 1962 Board Member & President Portfolios Overseen: 100 | | President, Chief Executive Officer, Chief Operating Officer and Officer in Charge of PGIM Investments LLC (formerly known as Prudential Investments LLC) (since January 2012); President and PEO (since September 2022) of the PGIM Private Credit Fund, President and Principal Executive Officer (“PEO”) (since March 2022) of the PGIM Private Real Estate Fund, Inc.; formerly Executive Vice President of Jennison Associates LLC and Head of Retail Distribution of PGIM Investments LLC (June 2005-December 2011); Investment Company Institute - Board of Governors (since May 2012). | | None. | | Since December 2017 |
| | | | |
Scott E. Benjamin 1973 Board Member & Vice President Portfolios Overseen: 100 | | Executive Vice President (since May 2009) of PGIM Investments LLC; Vice President (since June 2012) of Prudential Investment Management Services LLC; Executive Vice President (since September 2009) of AST Investment Services, Inc.; Senior Vice President of Product Development and Marketing, PGIM Investments (since February 2006); Vice President (since September 2022) of the PGIM Private Credit Fund, Vice President (since March 2022) of the PGIM Private Real Estate Fund, Inc.; formerly Vice President of Product Development and Product Management, PGIM Investments LLC (2003-2006). | | None. | | Since December 2017 |
PGIM Fixed Income ETFs
| | | | |
| | | |
| Fund Officers(a) | | | | |
| | | |
Name Year of Birth Fund Position | | Principal Occupation(s) During Past Five Years | | Length of Service as Fund Officer |
| | | |
Claudia DiGiacomo 1974 Chief Legal Officer | | Chief Legal Officer (since September 2022) of the PGIM Private Credit Fund; Chief Legal Officer (since July 2022) of the PGIM Private Real Estate Fund, Inc.; Chief Legal Officer, Executive Vice President and Secretary of PGIM Investments LLC (since August 2020); Chief Legal Officer of Prudential Mutual Fund Services LLC (since August 2020); Chief Legal Officer of PIFM Holdco, LLC (since August 2020); Vice President and Corporate Counsel (since January 2005) of Prudential; and Corporate Counsel of AST Investment Services, Inc. (since August 2020); formerly Vice President and Assistant Secretary of PGIM Investments LLC (2005-2020); formerly Associate at Sidley Austin Brown & Wood LLP (1999-2004). | | Since December 2017 |
| | | |
Andrew Donohue 1972 Chief Compliance Officer | | Chief Compliance Officer (since May 2023) of the PGIM Funds, Target Funds, PGIM ETF Trust, PGIM Global High Yield Fund, Inc., PGIM High Yield Bond Fund, Inc., PGIM Short Duration High Yield Opportunities Fund, Advanced Series Trust, The Prudential Series Fund, Prudential’s Gibraltar Fund, Inc., PGIM Private Credit Fund, PGIM Private Real Estate Fund, Inc.; Vice President, Chief Compliance Officer of PGIM Investments LLC (since September 2022); Chief Compliance Officer of AST Investment Services, Inc. (since October 2022); formerly various senior compliance roles within Principal Global Investors, LLC., global asset management for Principal Financial (2011-2022), most recently as Global Chief Compliance Officer (2016-2022). | | Since May 2023 |
| | | |
Andrew R. French 1962 Secretary | | Vice President (since December 2018) of PGIM Investments LLC; formerly Vice President and Corporate Counsel (2010-2018) of Prudential; Secretary (since September 2022) of the PGIM Private Credit Fund, Secretary (since March 2022) of the PGIM Private Real Estate Fund, Inc.; formerly Director and Corporate Counsel (2006-2010) of Prudential; Vice President and Assistant Secretary (since January 2007) of PGIM Investments LLC; Vice President and Assistant Secretary (since January 2007) of Prudential Mutual Fund Services LLC. | | Since December 2017 |
| | | |
Melissa Gonzalez 1980 Assistant Secretary | | Vice President and Corporate Counsel (since September 2018) of Prudential; Vice President and Assistant Secretary (since August 2020) of PGIM Investments LLC; Assistant Secretary (since September 2022) of the PGIM Private Credit Fund, Assistant Secretary (since March 2022) of the PGIM Private Real Estate Fund, Inc.; formerly Director and Corporate Counsel (March 2014-September 2018) of Prudential. | | Since March 2020 |
Visit our website at pgim.com/investments
| | | | |
| | | |
| Fund Officers(a) | | | | |
| | | |
Name Year of Birth Fund Position | | Principal Occupation(s) During Past Five Years | | Length of Service as Fund Officer |
| | | |
Patrick E. McGuinness 1986 Assistant Secretary | | Vice President and Assistant Secretary (since August 2020) of PGIM Investments LLC; Director and Corporate Counsel (since February 2017) of Prudential; Assistant Secretary (since September 2022) of the PGIM Private Credit Fund, Assistant Secretary (since March 2022) of the PGIM Private Real Estate Fund, Inc. | | Since June 2020 |
| | | |
Debra Rubano 1975 Assistant Secretary | | Vice President and Corporate Counsel (since November 2020) of Prudential; Assistant Secretary (since March 2022) of the PGIM Private Real Estate Fund, Inc; Assistant Secretary (since September 2022) of the PGIM Private Credit Fund; formerly Director and Senior Counsel of Allianz Global Investors U.S. Holdings LLC (2010-2020) and Assistant Secretary of numerous funds in the Allianz fund complex (2015-2020). | | Since December 2020 |
| | | |
Christian J. Kelly 1975 Chief Financial Officer | | Vice President, Global Head of Fund Administration of PGIM Investments LLC (since November 2018); Chief Financial Officer (since March 2023) of PGIM Investments mutual funds, closed end funds and ETFs, Advanced Series Trust Portfolios, Prudential Series Funds and Prudential Gibraltar Fund; Chief Financial Officer of PGIM Private Credit Fund (since September 2022); Chief Financial Officer of PGIM Private Real Estate Fund, Inc. (since July 2022); formerly Treasurer and Principal Financial Officer (January 2019- March 2023) of PGIM Investments mutual funds, closed end funds and ETFs, Advanced Series Trust Portfolios, Prudential Series Funds and Prudential Gibraltar Fund; formerly Treasurer and Principal Financial Officer (March 2022 – July 2022) of the PGIM Private Real Estate Fund, Inc.; formerly Director of Fund Administration of Lord Abbett & Co. LLC (2009-2018), Treasurer and Principal Accounting Officer of the Lord Abbett Family of Funds (2017-2018); Director of Accounting, Avenue Capital Group (2008-2009); Senior Manager, Investment Management Practice of Deloitte & Touche LLP (1998-2007). | | Since January 2019 |
| | | |
Lana Lomuti 1967 Assistant Treasurer | | Vice President (since 2007) within PGIM Investments Fund Administration; formerly Assistant Treasurer (December 2007-February 2014) of The Greater China Fund, Inc.; formerly Director (2005-2007) within PGIM Investments Fund Administration. | | Since December 2017 |
PGIM Fixed Income ETFs
| | | | |
| | | |
| Fund Officers(a) | | | | |
| | | |
Name Year of Birth Fund Position | | Principal Occupation(s) During Past Five Years | | Length of Service as Fund Officer |
| | | |
Russ Shupak 1973 Treasurer and Principal Accounting Officer | | Vice President (since 2017) within PGIM Investments Fund Administration; Treasurer and Principal Accounting Officer of PGIM Investments mutual funds, closed end funds and ETFs (since March 2023); Treasurer and Principal Accounting Officer (since July 2022) of the PGIM Private Real Estate Fund, Inc.; Assistant Treasurer (since September 2022) of the PGIM Private Credit Fund; formerly Assistant Treasurer (March 2022 – July 2022) of the PGIM Private Real Estate Fund, Inc.; Assistant Treasurer of Advanced Series Trust Portfolios, Prudential Series Funds and Prudential Gibraltar Fund (since October 2019); formerly Director (2013-2017) within PGIM Investments Fund Administration. | | Since October 2019 |
| | | |
Deborah Conway 1969 Assistant Treasurer | | Vice President (since 2017) within PGIM Investments Fund Administration; Assistant Treasurer (since September 2022) of the PGIM Private Credit Fund; Assistant Treasurer (since March 2022) of the PGIM Private Real Estate Fund, Inc.; formerly Director (2007-2017) within PGIM Investments Fund Administration. | | Since October 2019 |
| | | |
Elyse M. McLaughlin 1974 Assistant Treasurer | | Vice President (since 2017) within PGIM Investments Fund Administration; Treasurer and Principal Accounting Officer of the Advanced Series Trust, the Prudential Series Fund and the Prudential Gibraltar Fund (since March 2023); Treasurer and Principal Accounting Officer (since September 2022) of the PGIM Private Credit Fund; Assistant Treasurer (since March 2022) of the PGIM Private Real Estate Fund, Inc.; Assistant Treasurer of PGIM Investments mutual funds, closed end funds and ETFs (since October 2019); formerly Director (2011-2017) within PGIM Investments Fund Administration. | | Since October 2019 |
| | | |
Robert W. McCormack 1973 Assistant Treasurer | | Vice President (since 2019) within PGIM Investments Fund Administration; Assistant Treasurer (Since March 2023) of PGIM Investments mutual funds, closed end funds, ETFs, Advanced Series Trust Portfolios, Prudential Series Funds and Prudential Gibraltar Fund; Assistant Treasurer (since September 2022) of the PGIM Private Credit Fund; Assistant Treasurer (since March 2022) of the PGIM Private Real Estate Fund, Inc.; formerly Director (2016-2019) within PGIM Investments Fund Administration; formerly Vice President within Goldman, Sachs & Co. Investment Management Controllers (2008- 2016), Assistant Treasurer of Goldman Sachs Family of Funds (2015-2016). | | Since March 2023 |
Visit our website at pgim.com/investments
| | | | |
| | | |
| Fund Officers(a) | | | | |
| | | |
Name Year of Birth Fund Position | | Principal Occupation(s) During Past Five Years | | Length of Service as Fund Officer |
| | | |
Kelly Florio 1978 Anti-Money Laundering Compliance Officer | | Vice President, Corporate Compliance, Global Compliance Programs and Compliance Risk Management (since December 2021) of Prudential; formerly, Head of Fraud Risk Management (October 2019 to December 2021) at New York Life Insurance Company; formerly, Head of Key Risk Area Operations (November 2018 to October 2019), Director of the US Anti-Money Laundering Compliance Unit (2009-2018) and Bank Loss Prevention Associate (2006 -2009) at MetLife. | | Since June 2022 |
(a) Excludes Mr. Parker and Mr. Benjamin, interested Board Members who also serve as President and Vice President, respectively.
Explanatory Notes to Tables:
| ∎ | | Board Members are deemed to be “Interested,” as defined in the 1940 Act, by reason of their affiliation with PGIM Investments LLC and/or an affiliate of PGIM Investments LLC. |
| ∎ | | Unless otherwise noted, the address of all Board Members and Officers is c/o PGIM Investments LLC, 655 Broad Street, Newark, New Jersey 07102-4410. |
| ∎ | | There is no set term of office for Board Members or Officers. The Board Members have adopted a retirement policy, which calls for the retirement of Board Members on December 31 of the year in which they reach the age of 75. |
| ∎ | | “Other Directorships Held” includes all directorships of companies required to register or file reports with the SEC under the 1934 Act (that is, “public companies”) or other investment companies registered under the 1940 Act. |
| ∎ | | “Portfolios Overseen” includes such applicable investment companies managed by PGIM Investments LLC and overseen by the trustee/director. The investment companies for which PGIM Investments LLC serves as manager include the PGIM Mutual Funds, Target Funds, PGIM ETF Trust, PGIM Private Real Estate Fund, Inc., PGIM Private Credit Fund, PGIM High Yield Bond Fund, Inc., PGIM Global High Yield Fund, Inc., PGIM Short Duration High Yield Opportunities Fund, The Prudential Series Fund, Prudential’s Gibraltar Fund, Inc. and the Advanced Series Trust. |
| ∎ | | As used in the Fund Officers table “Prudential” means The Prudential Insurance Company of America. |
PGIM Fixed Income ETFs
Approval of Advisory Agreements (unaudited)
PGIM Ultra Short Bond ETF
The Fund’s Board of Trustees
The Board of Trustees (the “Board”) of PGIM Ultra Short Bond ETF1 (the “Fund”) consists of ten individuals, eight of whom are not “interested persons” of the Fund, as defined in the Investment Company Act of 1940, as amended (the “1940 Act”) (the “Independent Trustees”). The Board is responsible for the oversight of the Fund and its operations, and performs the various duties imposed on the Trustees of investment companies by the 1940 Act. The Independent Trustees have retained independent legal counsel to assist them in connection with their duties. The Chair of the Board is an Independent Director. The Board has established five standing committees: the Audit Committee, the Nominating and Governance Committee, the Compliance Committee and two Investment Committees. Each committee is chaired by, and composed of, Independent Trustees.
Annual Approval of the Fund’s Advisory Agreements
As required under the 1940 Act, the Board determines annually whether to renew the Fund’s management agreement with PGIM Investments LLC (“PGIM Investments”) and the Fund’s subadvisory agreement with PGIM Limited (“PGIML”) and PGIM, Inc. on behalf of its PGIM Fixed Income unit (“PGIM Fixed Income”). In considering the renewal of the agreements, the Board, including all of the Independent Trustees, met on May 25 and June 6-8, 2023 (the “Board Meeting”) and approved the renewal of the agreements through July 31, 2024, after concluding that the renewal of the agreements was in the best interests of the Fund and its shareholders.
In advance of the meetings, the Board requested and received materials relating to the agreements, and had the opportunity to ask questions and request further information in connection with its consideration. Among other things, the Board considered comparative fee information from PGIM Investments, PGIML and PGIM Fixed Income. Also, the Board considered comparisons with other mutual funds in relevant Peer Universes and Peer Groups, as is further discussed below.
In approving the agreements, the Board, including the Independent Trustees advised by independent legal counsel, considered the factors it deemed relevant, including the nature, quality and extent of services provided by PGIM Investments, the subadvisers and, as relevant, its affiliates, the performance of the Fund, the profitability of PGIM Investments and its affiliates, expenses and fees, and the potential for economies of scale that may be shared with the Fund and its shareholders as the Fund’s assets grow. In their deliberations, the Trustees did not identify any single factor which alone was responsible for the Board’s decision to approve the agreements with respect to the Fund. In connection with its deliberations, the Board considered information provided by PGIM Investments throughout the year at regular Board meetings, presentations from portfolio managers and other information, as well as information furnished at or in advance of the Board Meeting.
1PGIM Ultra Short Bond ETF is a series of PGIM ETF Trust.
PGIM Fixed Income ETFs
Approval of Advisory Agreements (continued)
The Trustees determined that the overall arrangements between the Fund and PGIM Investments, which serves as the Fund’s investment manager pursuant to a management agreement, and between PGIM Investments and each of PGIML and PGIM Fixed Income, which serve as the Fund’s subadvisers pursuant to the terms of a subadvisory agreement with PGIM Investments, are in the best interests of the Fund and its shareholders in light of the services performed, fees charged and such other matters as the Trustees considered relevant in the exercise of their business judgment.
The material factors and conclusions that formed the basis for the Trustees’ reaching their determinations to approve the continuance of the agreements are separately discussed below.
Nature, Quality and Extent of Services
The Board received and considered information regarding the nature, quality and extent of services provided to the Fund by PGIM Investments, PGIML and PGIM Fixed Income. The Board noted that PGIML and PGIM Fixed Income are affiliated with PGIM Investments. The Board considered the services provided by PGIM Investments, including but not limited to the oversight of the subadvisers for the Fund, as well as the provision of fund recordkeeping, compliance and other services to the Fund, and PGIM Investments’ role as administrator of the Fund’s liquidity risk management program. With respect to PGIM Investments’ oversight of the subadvisers, the Board noted that PGIM Investments’ Strategic Investment Research Group (“SIRG”), which is a business unit of PGIM Investments, is responsible for monitoring and reporting to PGIM Investments’ senior management on the performance and operations of the subadvisers. The Board also considered that PGIM Investments pays the salaries of all of the officers and interested Trustees of the Fund who are part of Fund management. The Board also considered the investment subadvisory services provided by PGIML and PGIM Fixed Income, including investment research and security selection, as well as adherence to the Fund’s investment restrictions and compliance with applicable Fund policies and procedures. The Board considered PGIM Investments’ evaluation of the subadvisers, as well as PGIM Investments’ recommendation, based on its review of the subadvisers, to renew the subadvisory agreement.
The Board considered the qualifications, backgrounds and responsibilities of PGIM Investments’ senior management responsible for the oversight of the Fund, PGIML and PGIM Fixed Income, and also considered the qualifications, backgrounds and responsibilities of the PGIML and PGIM Fixed Income portfolio managers who are responsible for the day-to-day management of the Fund’s portfolio. The Board was provided with information pertaining to PGIML’s, PGIM Investments’ and PGIM Fixed Income’s organizational structure, senior management, investment operations, and other relevant information pertaining to PGIM Investments, PGIML and PGIM Fixed Income. The Board also noted that it received favorable compliance reports from the Fund’s Chief Compliance Officer (“CCO”) as to PGIM Investments, PGIML and PGIM Fixed Income.
Visit our website at pgim.com/investments
The Board concluded that it was satisfied with the nature, extent and quality of the investment management services provided by PGIM Investments, and the subadvisory services provided to the Fund by PGIML and PGIM Fixed Income, and that there was a reasonable basis on which to conclude that the Fund benefits from the services provided by PGIM Investments, PGIML and PGIM Fixed Income under the management agreement and the subadvisory agreement.
Costs of Services and Profits Realized by PGIM Investments
The Board was provided with information on the profitability of PGIM Investments and its affiliates in serving as the Fund’s investment manager. The Board discussed with PGIM Investments the methodology utilized in assembling the information regarding profitability and considered its reasonableness. The Board recognized that it is difficult to make comparisons of profitability from fund management contracts because comparative information is not generally publicly available and is affected by numerous factors, including the structure of the particular adviser, the types of funds it manages, its business mix, numerous assumptions regarding allocations and the adviser’s capital structure and cost of capital. However, the Board considered that the cost of services provided by PGIM Investments exceeded the management fees received by PGIM Investments, resulting in an operating loss to PGIM Investments for the year ended December 31, 2022. Taking these factors into account, the Board concluded that the profitability of PGIM Investments and its affiliates in relation to the services rendered was not unreasonable.
Economies of Scale
The Board received and discussed information concerning economies of scale that PGIM Investments may realize as the Fund’s assets grow beyond current levels. During the course of time, the Board has considered information regarding the launch date of the Fund, the management fees of the Fund compared to those of similarly managed funds and PGIM Investments’ investment in the Fund over time. The Board noted that economies of scale can be shared with the Fund in other ways, including low management fees from inception, additional technological and personnel investments to enhance shareholder services, and maintaining existing expense structures in the face of a rising cost environment. The Board also considered PGIM Investments’ assertion that it continually evaluates the management fee schedule of the Fund and the potential to share economies of scale through breakpoints or fee waivers as asset levels increase.
The Board recognized the inherent limitations of any analysis of economies of scale, stemming largely from the Board’s understanding that most of PGIM Investments’ costs are not specific to individual funds, but rather are incurred across a variety of products and services.
Other Benefits to PGIM Investments, PGIML and PGIM Fixed Income
The Board considered potential ancillary benefits that might be received by PGIM Investments, PGIML, PGIM Fixed Income and their affiliates as a result of their relationship with the Fund. The Board concluded that potential benefits to be derived by PGIM Investments included transfer agency fees received by the Fund’s transfer agent
PGIM Fixed Income ETFs
Approval of Advisory Agreements (continued)
(which is affiliated with PGIM Investments), as well as benefits to its reputation or other intangible benefits resulting from PGIM Investments’ association with the Fund. The Board concluded that the potential benefits to be derived by PGIML and PGIM Fixed Income included the ability to use soft dollar credits, as well as the potential benefits consistent with those generally resulting from an increase in assets under management, specifically, potential access to additional research resources and benefits to its reputation. The Board concluded that the benefits derived by PGIM Investments, PGIML and PGIM Fixed Income were consistent with the types of benefits generally derived by investment managers and subadvisers to mutual funds.
Performance of the Fund / Fees and Expenses
The Board considered certain additional factors and made related conclusions relating to the historical performance of the Fund for the one-year period ended December 31, 2022. The Board considered that the Fund commenced operations on April 5, 2018 and that longer-term performance was not yet available.
The Board also considered the Fund’s actual management fee, as well as the Fund’s net total expense ratio, for the fiscal period ended August 31, 2022. The Board considered the management fee for the Fund as compared to the management fee charged by PGIM Investments to other funds and the fee charged by other advisers to comparable mutual funds in a Peer Group. The actual management fee represents the fee rate actually paid by Fund shareholders and includes any fee waivers or reimbursements. The net total expense ratio for the Fund represents the actual expense ratio incurred by Fund shareholders.
The mutual funds included in the Peer Universe, which was used to consider performance, and the Peer Group, which was used to consider expenses and fees, were objectively determined by Broadridge, an independent provider of mutual fund data. In certain circumstances, PGIM Investments also provided supplemental Peer Universe or Peer Group information for reasons addressed with the Board. The comparisons placed the Fund in various quartiles over various periods, with the first quartile being the best 25% of the mutual funds (for performance, the best performing mutual funds and, for expenses, the lowest cost mutual funds).
The section below summarizes key factors considered by the Board and the Board’s conclusions regarding the Fund’s performance, fees and overall expenses. The table sets forth net performance comparisons (which reflect the impact on performance of fund expenses, or any subsidies, expense caps or waivers that may be applicable) with the Peer Universe, actual management fees with the Peer Group (which reflect the impact of any subsidies or fee waivers), and net total expenses with the Peer Group, each of which were key factors considered by the Board.
Visit our website at pgim.com/investments
| | | | | | | | |
Net Performance | | 1 Year | | 3 Years | | 5 Years | | 10 Years |
| | | 1st Quartile | | 1st Quartile | | N/A | | N/A |
Actual Management Fees: 1st Quartile |
Net Total Expenses: 1st Quartile |
| | ● | The Board noted that the Fund outperformed its benchmark index over the one-year and three-year periods. |
| | ● | The Board noted that the Fund does not yet have a five-year performance record and that, therefore, the subadvisers should have more time to develop that record. |
| | ● | The Board and PGIM Investments agreed to retain the Fund’s existing contractual fee waiver, pursuant to which PGIM Investments waives any management fees it receives from the Fund in an amount equal to the subadvisory fees paid by the Fund to the PGIM Institutional Money Market Fund. |
| | ● | The Board concluded that, in light of the above, it would be in the best interests of the Fund and its shareholders to continue to allow the Fund to create a longer-term performance record, and to renew the agreements. |
| | ● | The Board concluded that the management fees (including subadvisory fees) and total expenses were reasonable in light of the services provided. |
* * *
After full consideration of these factors, the Board concluded that approval of the agreements was in the best interests of the Fund and its shareholders.
PGIM Active High Yield Bond ETF
The Fund’s Board of Trustees
The Board of Trustees (the “Board”) of PGIM Active High Yield Bond ETF2 (the “Fund”) consists of ten individuals, eight of whom are not “interested persons” of the Fund, as defined in the Investment Company Act of 1940, as amended (the “1940 Act”) (the “Independent Trustees”). The Board is responsible for the oversight of the Fund and its operations, and performs the various duties imposed on the Trustees of investment companies by the 1940 Act. The Independent Trustees have retained independent legal counsel to assist them in connection with their duties. The Chair of the Board is an Independent Director. The Board has established five standing committees: the Audit Committee, the Nominating and Governance Committee, the Compliance Committee and two Investment Committees. Each committee is chaired by, and composed of, Independent Trustees.
PGIM Fixed Income ETFs
Approval of Advisory Agreements (continued)
Annual Approval of the Fund’s Advisory Agreements
As required under the 1940 Act, the Board determines annually whether to renew the Fund’s management agreement with PGIM Investments LLC (“PGIM Investments”) and the Fund’s subadvisory agreement with PGIM, Inc. (“PGIM”) on behalf of its PGIM Fixed Income unit (“PGIM Fixed Income”). In considering the renewal of the agreements, the Board, including all of the Independent Trustees, met on May 25 and June 6-8, 2023 (the “Board Meeting”) and approved the renewal of the agreements through July 31, 2024, after concluding that the renewal of the agreements was in the best interests of the Fund and its shareholders.
In advance of the meetings, the Board requested and received materials relating to the agreements, and had the opportunity to ask questions and request further information in connection with its consideration. Among other things, the Board considered comparative fee information from PGIM Investments and PGIM. Also, the Board considered comparisons with other mutual funds in relevant Peer Universes and Peer Groups, as is further discussed below.
In approving the agreements, the Board, including the Independent Trustees advised by independent legal counsel, considered the factors it deemed relevant, including the nature, quality and extent of services provided by PGIM Investments, the subadviser and, as relevant, its affiliates, the performance of the Fund, the profitability of PGIM Investments and its affiliates, expenses and fees, and the potential for economies of scale that may be shared with the Fund and its shareholders as the Fund’s assets grow. In their deliberations, the Trustees did not identify any single factor which alone was responsible for the Board’s decision to approve the agreements with respect to the Fund. In connection with its deliberations, the Board considered information provided by PGIM Investments throughout the year at regular Board meetings, presentations from portfolio managers and other information, as well as information furnished at or in advance of the Board Meeting.
The Trustees determined that the overall arrangements between the Fund and PGIM Investments, which serves as the Fund’s investment manager pursuant to a management agreement, between PGIM Investments and PGIM, which, through its PGIM Fixed Income unit, serves as the Fund’s subadviser pursuant to the terms of a subadvisory agreement with PGIM Investments are in the best interests of the Fund and its shareholders in light of the services performed, fees charged and such other matters as the Trustees considered relevant in the exercise of their business judgment.
The material factors and conclusions that formed the basis for the Trustees’ reaching their determinations to approve the continuance of the agreements are separately discussed below.
2PGIM Active High Yield Bond ETF is a series of PGIM ETF Trust.
Visit our website at pgim.com/investments
Nature, Quality and Extent of Services
The Board received and considered information regarding the nature, quality and extent of services provided to the Fund by PGIM Investments and, PGIM Fixed Income. The Board noted that PGIM Fixed Income is affiliated with PGIM Investments. The Board considered the services provided by PGIM Investments, including but not limited to the oversight of the subadviser for the Fund, as well as the provision of fund recordkeeping, compliance and other services to the Fund, and PGIM Investments’ role as administrator of the Fund’s liquidity risk management program. With respect to PGIM Investments’ oversight of the subadviser, the Board noted that PGIM Investments’ Strategic Investment Research Group (“SIRG”), which is a business unit of PGIM Investments, is responsible for monitoring and reporting to PGIM Investments’ senior management on the performance and operations of the subadviser. The Board also considered that PGIM Investments pays the salaries of all of the officers and interested Trustees of the Fund who are part of Fund management. The Board also considered the investment subadvisory services provided by PGIM Fixed Income, including investment research and security selection, as well as adherence to the Fund’s investment restrictions and compliance with applicable Fund policies and procedures. The Board considered PGIM Investments’ evaluation of the subadviser, as well as PGIM Investments’ recommendation, based on its review of the subadviser, to renew the subadvisory agreement.
The Board considered the qualifications, backgrounds and responsibilities of PGIM Investments’ senior management responsible for the oversight of the Fund and PGIM Fixed Income, and also considered the qualifications, backgrounds and responsibilities of PGIM Fixed Income’s portfolio managers who are responsible for the day-to-day management of the Fund’s portfolio. The Board was provided with information pertaining to PGIM Investments’ and PGIM Fixed Income’s organizational structure, senior management, investment operations, and other relevant information pertaining to PGIM Investments and PGIM Fixed Income. The Board also noted that it received favorable compliance reports from the Fund’s Chief Compliance Officer (“CCO”) as to PGIM Investments and PGIM Fixed Income.
The Board concluded that it was satisfied with the nature, extent and quality of the investment management services provided by PGIM Investments, and the subadvisory services provided to the Fund by PGIM Fixed Income, and that there was a reasonable basis on which to conclude that the Fund benefits from the services provided by PGIM Investments and PGIM Fixed Income under the management, subadvisory agreement.
Costs of Services and Profits Realized by PGIM Investments
The Board was provided with information on the profitability of PGIM Investments and its affiliates in serving as the Fund’s investment manager. The Board discussed with PGIM Investments the methodology utilized in assembling the information regarding profitability and considered its reasonableness. The Board recognized that it is difficult to make comparisons of profitability from fund management contracts because comparative information is not generally publicly available and is affected by numerous factors, including the structure of the particular adviser, the types of funds it manages,
PGIM Fixed Income ETFs
Approval of Advisory Agreements (continued)
its business mix, numerous assumptions regarding allocations and the adviser’s capital structure and cost of capital. However, the Board considered that the cost of services provided by PGIM Investments for the year ended December 31, 2022 exceeded the management fees received by PGIM Investments, resulting in an operating loss to PGIM Investments. Taking these factors into account, the Board concluded that the profitability of PGIM Investments and its affiliates in relation to the services rendered was not unreasonable.
Economies of Scale
The Board received and discussed information concerning economies of scale that PGIM Investments may realize as the Fund’s assets grow beyond current levels. During the course of time, the Board has considered information regarding the launch date of the Fund, the management fees of the Fund compared to those of similarly managed funds and PGIM Investments’ investment in the Fund over time. The Board noted that economies of scale can be shared with the Fund in other ways, including low management fees from inception, additional technological and personnel investments to enhance shareholder services, and maintaining existing expense structures in the face of a rising cost environment. The Board also considered PGIM Investments’ assertion that it continually evaluates the management fee schedule of the Fund and the potential to share economies of scale through breakpoints or fee waivers as asset levels increase.
The Board recognized the inherent limitations of any analysis of economies of scale, stemming largely from the Board’s understanding that most of PGIM Investments’ costs are not specific to individual funds, but rather are incurred across a variety of products and services.
Other Benefits to PGIM Investments, and PGIM Fixed Income
The Board considered potential ancillary benefits that might be received by PGIM Investments, PGIM Fixed Income and their affiliates as a result of their relationship with the Fund. The Board concluded that potential benefits to be derived by PGIM Investments included transfer agency fees received by the Fund’s transfer agent (which is affiliated with PGIM Investments), as well as benefits to its reputation or other intangible benefits resulting from PGIM Investments’ association with the Fund. The Board concluded that the potential benefits to be derived by PGIM Fixed Income included the ability to use soft dollar credits, as well as the potential benefits consistent with those generally resulting from an increase in assets under management, specifically, potential access to additional research resources and benefits to its reputation. The Board concluded that the benefits derived by PGIM Investments and PGIM Fixed Income were consistent with the types of benefits generally derived by investment managers and subadvisers to mutual funds.
Performance of the Fund / Fees and Expenses
The Board considered certain additional factors and made related conclusions relating to the historical performance of the Fund for the one-year period ended December 31, 2022. The Board considered that the Fund commenced operations on September 24, 2018 and that longer-term performance was not yet available.
Visit our website at pgim.com/investments
The Board also considered the Fund’s actual management fee, as well as the Fund’s net total expense ratio, for the fiscal period ended August 31, 2022. The Board considered the management fee for the Fund as compared to the management fee charged by PGIM Investments to other funds and the fee charged by other advisers to comparable mutual funds in a Peer Group. The actual management fee represents the fee rate actually paid by Fund shareholders and includes any fee waivers or reimbursements. The net total expense ratio for the Fund represents the actual expense ratio incurred by Fund shareholders.
The mutual funds included in the Peer Universe, which was used to consider performance, and the Peer Group, which was used to consider expenses and fees, were objectively determined by Broadridge, an independent provider of mutual fund data. In certain circumstances, PGIM Investments also provided supplemental Peer Universe or Peer Group information for reasons addressed with the Board. The comparisons placed the Fund in various quartiles over various periods, with the first quartile being the best 25% of the mutual funds (for performance, the best performing mutual funds and, for expenses, the lowest cost mutual funds).
The section below summarizes key factors considered by the Board and the Board’s conclusions regarding the Fund’s performance, fees and overall expenses. The table sets forth net performance comparisons (which reflect the impact on performance of fund expenses, or any subsidies, expense caps or waivers that may be applicable) with the Peer Universe, actual management fees with the Peer Group (which reflect the impact of any subsidies or fee waivers), and net total expenses with the Peer Group, each of which were key factors considered by the Board.
| | | | | | | | |
Net Performance | | 1 Year | | 3 Years | | 5 Years | | 10 Years |
| | | 4th Quartile | | 2nd Quartile | | N/A | | N/A |
Actual Management Fees: 3rd Quartile |
Net Total Expenses: 3rd Quartile |
| | ● | The Board noted that the Fund outperformed its benchmark index over the three-year period and underperformed its benchmark index over the one-year period. |
| | ● | The Board noted that the Fund does not yet have a five-year performance record and that, therefore, the subadviser should have more time to develop that record. |
| | ● | The Board and PGIM Investments agreed to retain the Fund’s existing contractual fee waiver, pursuant to which PGIM Investments waives any management fees it receives from the Fund in an amount equal to the subadvisory fees paid by the Fund to the PGIM Institutional Money Market Fund. |
| | ● | The Board concluded that, in light of the above, it would be in the best interests of the Fund and its shareholders to continue to allow the Fund to create a longer-term performance record, and to renew the agreements. |
PGIM Fixed Income ETFs
Approval of Advisory Agreements (continued)
| | ● | The Board concluded that the management fees (including subadvisory fees) and total expenses were reasonable in light of the services provided. |
* * *
After full consideration of these factors, the Board concluded that approval of the agreements was in the best interests of the Fund and its shareholders.
PGIM Active Aggregate Bond ETF
The Fund’s Board of Trustees
The Board of Trustees (the “Board”) of PGIM Active Aggregate Bond ETF3 (the “Fund”) consists of ten individuals, eight of whom are not “interested persons” of the Fund, as defined in the Investment Company Act of 1940, as amended (the “1940 Act”) (the “Independent Trustees”). The Board is responsible for the oversight of the Fund and its operations, and performs the various duties imposed on the Trustees of investment companies by the 1940 Act. The Independent Trustees have retained independent legal counsel to assist them in connection with their duties. The Chair of the Board is an Independent Director. The Board has established five standing committees: the Audit Committee, the Nominating and Governance Committee, the Compliance Committee and two Investment Committees. Each committee is chaired by, and composed of, Independent Trustees.
Annual Approval of the Fund’s Advisory Agreements
As required under the 1940 Act, the Board determines annually whether to renew the Fund’s management agreement with PGIM Investments LLC (“PGIM Investments”) and the Fund’s subadvisory agreement with PGIM, Inc. (“PGIM”) on behalf of its PGIM Fixed Income unit (“PGIM Fixed Income”). In considering the renewal of the agreements, the Board, including all of the Independent Trustees, met on May 25 and June 6-8, 2023 (the “Board Meeting”) and approved the renewal of the agreements through July 31, 2024, after concluding that the renewal of the agreements was in the best interests of the Fund and its shareholders.
In advance of the meetings, the Board requested and received materials relating to the agreements, and had the opportunity to ask questions and request further information in connection with its consideration. Among other things, the Board considered comparative fee information from PGIM Investments and PGIM. Also, the Board considered comparisons with other mutual funds in relevant Peer Universes and Peer Groups, as is further discussed below.
In approving the agreements, the Board, including the Independent Trustees advised by independent legal counsel, considered the factors it deemed relevant, including the nature, quality and extent of services provided by PGIM Investments, the subadviser and, as relevant, its affiliates, the performance of the Fund, the profitability of PGIM
3PGIM Active Aggregate Bond ETF is a series of PGIM ETF Trust.
Visit our website at pgim.com/investments
Investments and its affiliates, expenses and fees, and the potential for economies of scale that may be shared with the Fund and its shareholders as the Fund’s assets grow. In their deliberations, the Trustees did not identify any single factor which alone was responsible for the Board’s decision to approve the agreements with respect to the Fund. In connection with its deliberations, the Board considered information provided by PGIM Investments throughout the year at regular Board meetings, presentations from portfolio managers and other information, as well as information furnished at or in advance of the Board Meeting.
The Trustees determined that the overall arrangements between the Fund and PGIM Investments, which serves as the Fund’s investment manager pursuant to a management agreement, between PGIM Investments and PGIM, which, through its PGIM Fixed Income unit, serves as the Fund’s subadviser pursuant to the terms of a subadvisory agreement with PGIM Investments are in the best interests of the Fund and its shareholders in light of the services performed, fees charged and such other matters as the Trustees considered relevant in the exercise of their business judgment.
The material factors and conclusions that formed the basis for the Trustees’ reaching their determinations to approve the continuance of the agreements are separately discussed below.
Nature, Quality and Extent of Services
The Board received and considered information regarding the nature, quality and extent of services provided to the Fund by PGIM Investments and, PGIM Fixed Income. The Board noted that PGIM Fixed Income is affiliated with PGIM Investments. The Board considered the services provided by PGIM Investments, including but not limited to the oversight of the subadviser for the Fund, as well as the provision of fund recordkeeping, compliance and other services to the Fund, and PGIM Investments’ role as administrator of the Fund’s liquidity risk management program. With respect to PGIM Investments’ oversight of the subadviser, the Board noted that PGIM Investments’ Strategic Investment Research Group (“SIRG”), which is a business unit of PGIM Investments, is responsible for monitoring and reporting to PGIM Investments’ senior management on the performance and operations of the subadviser. The Board also considered that PGIM Investments pays the salaries of all of the officers and interested Trustees of the Fund who are part of Fund management. The Board also considered the investment subadvisory services provided by PGIM Fixed Income, including investment research and security selection, as well as adherence to the Fund’s investment restrictions and compliance with applicable Fund policies and procedures. The Board considered PGIM Investments’ evaluation of the subadviser, as well as PGIM Investments’ recommendation, based on its review of the subadviser, to renew the subadvisory agreement.
The Board considered the qualifications, backgrounds and responsibilities of PGIM Investments’ senior management responsible for the oversight of the Fund and PGIM Fixed Income, and also considered the qualifications, backgrounds and responsibilities of PGIM Fixed Income’s portfolio managers who are responsible for the day-to-day
PGIM Fixed Income ETFs
Approval of Advisory Agreements (continued)
management of the Fund’s portfolio. The Board was provided with information pertaining to PGIM Investments’ and PGIM Fixed Income’s organizational structure, senior management, investment operations, and other relevant information pertaining to PGIM Investments and PGIM Fixed Income. The Board also noted that it received favorable compliance reports from the Fund’s Chief Compliance Officer (“CCO”) as to PGIM Investments and PGIM Fixed Income.
The Board concluded that it was satisfied with the nature, extent and quality of the investment management services provided by PGIM Investments, and the subadvisory services provided to the Fund by PGIM Fixed Income, and that there was a reasonable basis on which to conclude that the Fund benefits from the services provided by PGIM Investments and PGIM Fixed Income under the management, subadvisory agreement.
Costs of Services and Profits Realized by PGIM Investments
The Board was provided with information on the profitability of PGIM Investments and its affiliates in serving as the Fund’s investment manager. The Board discussed with PGIM Investments the methodology utilized in assembling the information regarding profitability and considered its reasonableness. The Board recognized that it is difficult to make comparisons of profitability from fund management contracts because comparative information is not generally publicly available and is affected by numerous factors, including the structure of the particular adviser, the types of funds it manages, its business mix, numerous assumptions regarding allocations and the adviser’s capital structure and cost of capital. However, the Board considered that the cost of services provided by PGIM Investments for the year ended December 31, 2022 exceeded the management fees received by PGIM Investments, resulting in an operating loss to PGIM Investments. Taking these factors into account, the Board concluded that the profitability of PGIM Investments and its affiliates in relation to the services rendered was not unreasonable.
Economies of Scale
The Board received and discussed information concerning economies of scale that PGIM Investments may realize as the Fund’s assets grow beyond current levels. During the course of time, the Board has considered information regarding the launch date of the Fund, the management fees of the Fund compared to those of similarly managed funds and PGIM Investments’ investment in the Fund over time. The Board noted that economies of scale can be shared with the Fund in other ways, including low management fees from inception, additional technological and personnel investments to enhance shareholder services, and maintaining existing expense structures in the face of a rising cost environment. The Board also considered PGIM Investments’ assertion that it continually evaluates the management fee schedule of the Fund and the potential to share economies of scale through breakpoints or fee waivers as asset levels increase.
The Board recognized the inherent limitations of any analysis of economies of scale, stemming largely from the Board’s understanding that most of PGIM Investments’ costs are not specific to individual funds, but rather are incurred across a variety of products and services.
Visit our website at pgim.com/investments
Other Benefits to PGIM Investments, and PGIM Fixed Income
The Board considered potential ancillary benefits that might be received by PGIM Investments, PGIM Fixed Income and their affiliates as a result of their relationship with the Fund. The Board concluded that potential benefits to be derived by PGIM Investments included transfer agency fees received by the Fund’s transfer agent (which is affiliated with PGIM Investments), as well as benefits to its reputation or other intangible benefits resulting from PGIM Investments’ association with the Fund. The Board concluded that the potential benefits to be derived by PGIM Fixed Income included the ability to use soft dollar credits, as well as the potential benefits consistent with those generally resulting from an increase in assets under management, specifically, potential access to additional research resources and benefits to its reputation. The Board concluded that the benefits derived by PGIM Investments and PGIM Fixed Income were consistent with the types of benefits generally derived by investment managers and subadvisers to mutual funds.
Performance of the Fund / Fees and Expenses
The Board considered certain additional factors and made related conclusions relating to the historical performance of the Fund for the three-month period ended December 31, 2022. The Board considered that the Fund commenced operations on April 12, 2021 and that longer-term performance was not yet available.
The Board also considered the Fund’s actual management fee, as well as the Fund’s net total expense ratio, for the fiscal period ended August 31, 2022. The Board considered the management fee for the Fund as compared to the management fee charged by PGIM Investments to other funds and the fee charged by other advisers to comparable mutual funds in a Peer Group. The actual management fee represents the fee rate actually paid by Fund shareholders and includes any fee waivers or reimbursements. The net total expense ratio for the Fund represents the actual expense ratio incurred by Fund shareholders.
The mutual funds included in the Peer Universe, which was used to consider performance, and the Peer Group, which was used to consider expenses and fees, were objectively determined by Broadridge, an independent provider of mutual fund data. In certain circumstances, PGIM Investments also provided supplemental Peer Universe or Peer Group information for reasons addressed with the Board. The comparisons placed the Fund in various quartiles over various periods, with the first quartile being the best 25% of the mutual funds (for performance, the best performing mutual funds and, for expenses, the lowest cost mutual funds).
The section below summarizes key factors considered by the Board and the Board’s conclusions regarding the Fund’s performance, fees and overall expenses. The table sets forth net performance comparisons (which reflect the impact on performance of fund expenses, or any subsidies, expense caps or waivers that may be applicable) with the Peer Universe, actual management fees with the Peer Group (which reflect the
PGIM Fixed Income ETFs
Approval of Advisory Agreements (continued)
impact of any subsidies or fee waivers), and net total expenses with the Peer Group, each of which were key factors considered by the Board.
| | | | | | | | |
Net Performance | | 1 Year | | 3 Years | | 5 Years | | 10 Years |
| | | 3rd Quartile | | N/A | | N/A | | N/A |
| | | Actual Management Fees: 1st Quartile |
| | | Net Total Expenses: 1st Quartile |
| | ● | The Board noted that the Fund underperformed its benchmark index over the one-year period. |
| | ● | The Board also noted that the Fund outperformed its peer group average and benchmark index in the first quarter of 2023. |
| | ● | The Board noted that the Fund does not yet have a three-year performance record and that, therefore, the subadviser should have more time to develop that record. |
| | ● | The Board and PGIM Investments agreed to a contractual fee waiver, pursuant to which PGIM Investments waives any management fees it receives from the Fund in an amount equal to the subadvisory fees paid by the Fund to the PGIM Institutional Money Market Fund. |
| | ● | The Board concluded that, in light of the above, it would be in the best interests of the Fund and its shareholders to continue to allow the Fund to create a longer-term performance record, and to renew the agreements. |
| | ● | The Board concluded that the management fees (including subadvisory fees) and total expenses were reasonable in light of the services provided. |
* * *
After full consideration of these factors, the Board concluded that approval of the agreements was in the best interests of the Fund and its shareholders.
PGIM Total Return Bond ETF
The Fund’s Board of Trustees
The Board of Trustees (the “Board”) of PGIM Total Return Bond ETF4 (the “Fund”) consists of ten individuals, eight of whom are not “interested persons” of the Fund, as defined in the Investment Company Act of 1940, as amended (the “1940 Act”) (the “Independent Trustees”). The Board is responsible for the oversight of the Fund and its operations, and performs the various duties imposed on the Trustees of investment companies by the 1940 Act. The Independent Trustees have retained independent legal counsel to assist them in connection with their duties. The Chair of the Board is an Independent Director. The Board has established five standing committees: the Audit Committee, the Nominating and Governance Committee, the Compliance Committee and two Investment Committees. Each committee is chaired by, and composed of, Independent Trustees.
Visit our website at pgim.com/investments
Annual Approval of the Fund’s Advisory Agreements
As required under the 1940 Act, the Board determines annually whether to renew the Fund’s management agreement with PGIM Investments LLC (“PGIM Investments”) and the Fund’s subadvisory agreement with PGIM Limited (“PGIML”) and PGIM, Inc. (“PGIM”) on behalf of its PGIM Fixed Income unit (“PGIM Fixed Income”). In considering the renewal of the agreements, the Board, including all of the Independent Directors, met on May 25 and June 6-8, 2023 (the “Board Meeting”) and approved the renewal of the agreements through July 31, 2024, after concluding that the renewal of the agreements was in the best interests of the Fund and its shareholders.
In advance of the meetings, the Board requested and received materials relating to the agreements, and had the opportunity to ask questions and request further information in connection with its consideration. Among other things, the Board considered comparative fee information from PGIM Investments, PGIML and PGIM Fixed Income. Also, the Board considered comparisons with other mutual funds in relevant Peer Universes and Peer Groups, as is further discussed below.
In approving the agreements, the Board, including the Independent Directors advised by independent legal counsel, considered the factors it deemed relevant, including the nature, quality and extent of services provided by PGIM Investments and the subadvisers, the performance of the Fund, the profitability of PGIM Investments and its affiliates, expenses and fees, and the potential for economies of scale that may be shared with the Fund and its shareholders as the Fund’s assets grow. In their deliberations, the Directors did not identify any single factor which alone was responsible for the Board’s decision to approve the agreements with respect to the Fund. In connection with its deliberations, the Board considered information provided by PGIM Investments throughout the year at regular Board meetings, presentations from portfolio managers and other information, as well as information furnished at or in advance of the Board Meeting.
The Directors determined that the overall arrangements between the Fund and PGIM Investments, which serves as the Fund’s investment manager pursuant to a management agreement, and between PGIM Investments, PGIML and PGIM Fixed Income, which serve as the Fund’s subadvisers pursuant to the terms of a subadvisory agreement with PGIM Investments, are in the best interests of the Fund and its shareholders in light of the services performed, fees charged and such other matters as the Directors considered relevant in the exercise of their business judgment.
The material factors and conclusions that formed the basis for the Directors’ reaching their determinations to approve the continuance of the agreements are separately discussed below.
4PGIM Total Return Bond ETF is a series of PGIM ETF Trust.
PGIM Fixed Income ETFs
Approval of Advisory Agreements (continued)
Nature, Quality and Extent of Services
The Board received and considered information regarding the nature, quality and extent of services provided to the Fund by PGIM Investments, PGIML and PGIM Fixed Income. The Board noted that PGIML and PGIM Fixed Income are affiliated with PGIM Investments. The Board considered the services provided by PGIM Investments, including but not limited to the oversight of the subadvisers for the Fund, as well as the provision of fund recordkeeping, compliance and other services to the Fund, and PGIM Investments’ role as administrator for the Fund’s liquidity risk management program. With respect to PGIM Investments’ oversight of the subadvisers, the Board noted that PGIM Investments’ Strategic Investment Research Group (“SIRG”), which is a business unit of PGIM Investments, is responsible for monitoring and reporting to PGIM Investments’ senior management on the performance and operations of the subadvisers. The Board also considered that PGIM Investments pays the salaries of all of the officers and interested Directors of the Fund who are part of Fund management. The Board also considered the investment subadvisory services provided by PGIML and PGIM Fixed Income, including investment research and security selection, as well as adherence to the Fund’s investment restrictions and compliance with applicable Fund policies and procedures. The Board considered PGIM Investments’ evaluation of the subadvisers, as well as PGIM Investments’ recommendation, based on its review of the subadvisers, to renew the subadvisory agreement.
The Board considered the qualifications, backgrounds and responsibilities of PGIM Investments’ senior management responsible for the oversight of the Fund, PGIML and PGIM Fixed Income, and also considered the qualifications, backgrounds and responsibilities of the PGIML and PGIM Fixed Income portfolio managers who are responsible for the day-to-day management of the Fund’s portfolio. The Board was provided with information pertaining to PGIML’s, PGIM Investments’ and PGIM Fixed Income’s organizational structure, senior management, investment operations, and other relevant information pertaining to PGIM Investments, PGIML and PGIM Fixed Income. The Board also noted that it received favorable compliance reports from the Fund’s Chief Compliance Officer (“CCO”) as to each of PGIM Investments, PGIML and PGIM Fixed Income.
The Board concluded that it was satisfied with the nature, extent and quality of the investment management services provided by PGIM Investments and the subadvisory services provided to the Fund by PGIML and PGIM Fixed Income, and that there was a reasonable basis on which to conclude that the Fund benefits from the services provided by PGIM Investments, PGIML and PGIM Fixed Income under the management and subadvisory agreement.
Costs of Services and Profits Realized by PGIM Investments
The Board was provided with information on the profitability of PGIM Investments and its affiliates in serving as the Fund’s investment manager. The Board discussed with PGIM Investments the methodology utilized in assembling the information regarding profitability and considered its reasonableness. The Board recognized that it is difficult to make comparisons of profitability from fund management contracts because
Visit our website at pgim.com/investments
comparative information is not generally publicly available and is affected by numerous factors, including the structure of the particular adviser, the types of funds it manages, its business mix, numerous assumptions regarding allocations and the adviser’s capital structure and cost of capital. However, the Board considered that the cost of services provided by PGIM Investments for the year ended December 31, 2022 exceeded the management fees received by PGIM Investments, resulting in an operating loss to PGIM Investments. Taking these factors into account, the Board concluded that the profitability of PGIM Investments and its affiliates in relation to the services rendered was not unreasonable.
Economies of Scale
The Board received and discussed information concerning economies of scale that PGIM Investments may realize as the Fund’s assets grow beyond current levels. During the course of time, the Board has considered information regarding the launch date of the Fund, the management fees of the Fund compared to those of similarly managed funds and PGIM Investments’ investment in the Fund over time. The Board noted that economies of scale can be shared with the Fund in other ways, including low management fees from inception, additional technological and personnel investments to enhance shareholder services, and maintaining existing expense structures in the face of a rising cost environment. The Board also considered PGIM Investments’ assertion that it continually evaluates the management fee schedule of the Fund and the potential to share economies of scale through breakpoints or fee waivers as asset levels increase.
The Board recognized the inherent limitations of any analysis of economies of scale, stemming largely from the Board’s understanding that most of PGIM Investments’ costs are not specific to individual funds, but rather are incurred across a variety of products and services.
Other Benefits to PGIM Investments, PGIM Fixed Income and PGIML
The Board considered potential ancillary benefits that might be received by PGIM Investments, PGIML, PGIM Fixed Income and their affiliates as a result of their relationship with the Fund. The Board concluded that potential benefits to be derived by PGIM Investments included transfer agency fees received by the Fund’s transfer agent (which is affiliated with PGIM Investments), as well as benefits to its reputation or other intangible benefits resulting from PGIM Investments association with the Fund. The Board concluded that the potential benefits to be derived by PGIML and PGIM Fixed Income included the ability to use soft dollar credits, as well as the potential benefits consistent with those generally resulting from an increase in assets under management, specifically, potential access to additional research resources and benefits to its reputation. The Board concluded that the benefits derived by PGIM Investments, PGIML and PGIM Fixed Income were consistent with the types of benefits generally derived by investment managers and subadvisers to mutual funds.
PGIM Fixed Income ETFs
Approval of Advisory Agreements (continued)
Performance of the Fund / Fees and Expenses
The Board considered certain additional factors and made related conclusions relating to the historical performance of the Fund for the three-month period ended December 31, 2022. The Board considered that the Fund commenced operations on December 2, 2021 and that longer-term performance was not yet available.
The Board also considered the Fund’s actual management fee, as well as the Fund’s net total expense ratio, for the fiscal period ended August 31, 2022. The Board considered the management fee for the Fund as compared to the management fee charged by PGIM Investments to other funds and the fee charged by other advisers to comparable mutual funds in a Peer Group. The actual management fee represents the fee rate actually paid by Fund shareholders and includes any fee waivers or reimbursements. The net total expense ratio for the Fund represents the actual expense ratio incurred by Fund shareholders.
The mutual funds included in the Peer Universe, which was used to consider performance, and the Peer Group, which was used to consider expenses and fees, were objectively determined by Broadridge, an independent provider of mutual fund data. In certain circumstances, PGIM Investments also provided supplemental Peer Universe or Peer Group information for reasons addressed with the Board. The comparisons placed the Fund in various quartiles over various periods, with the first quartile being the best 25% of the mutual funds (for performance, the best performing mutual funds and, for expenses, the lowest cost mutual funds).
The section below summarizes key factors considered by the Board and the Board’s conclusions regarding the Fund’s performance, fees and overall expenses. The table sets forth net performance comparisons (which reflect the impact on performance of fund expenses, or any subsidies, expense caps or waivers that may be applicable) with the Peer Universe, actual management fees with the Peer Group (which reflect the impact of any subsidies or fee waivers), and net total expenses with the Peer Group, each of which were key factors considered by the Board.
| | | | | | | | |
Net Performance | | 1 Year | | 3 Years | | 5 Years | | 10 Years |
| | | 3rd Quartile | | N/A | | N/A | | N/A |
| | | Actual Management Fees: 4th Quartile |
| | | Net Total Expenses: 4th Quartile |
| | ● | The Board noted that the Fund underperformed its benchmark index over the one-year period. |
| | ● | The Board also considered that the Fund outperformed its peer group average and benchmark index in the first quarter of 2023. |
| | ● | The Board noted that the Fund does not yet have a three-year performance record and that, therefore, the subadviser should have more time to develop that record. |
Visit our website at pgim.com/investments
| | ● | The Board and PGIM Investments agreed to a contractual fee waiver, pursuant to which PGIM Investments waives any management fees it receives from the Fund in an amount equal to the subadvisory fees paid by the Fund to the PGIM Institutional Money Market Fund. |
| | ● | The Board concluded that, in light of the above, it would be in the best interests of the Fund and its shareholders to continue to allow the Fund to create a longer-term performance record, and to renew the agreements. |
| | ● | The Board concluded that the management fees (including subadvisory fees) and total expenses were reasonable in light of the services provided. |
* * *
After full consideration of these factors, the Board concluded that approval of the agreements was in the best interests of the Fund and its shareholders.
PGIM Floating Rate Income ETF
The Fund’s Board of Trustees
The Board of Trustees (the “Board”) of PGIM Floating Rate Income ETF5 (the “Fund”) consists of ten individuals, eight of whom are not “interested persons” of the Fund, as defined in the Investment Company Act of 1940, as amended (the “1940 Act”) (the “Independent Trustees”). The Board is responsible for the oversight of the Fund and its operations, and performs the various duties imposed on the Trustees of investment companies by the 1940 Act. The Independent Trustees have retained independent legal counsel to assist them in connection with their duties. The Chair of the Board is an Independent Director. The Board has established five standing committees: the Audit Committee, the Nominating and Governance Committee, the Compliance Committee and two Investment Committees. Each committee is chaired by, and composed of, Independent Trustees.
Annual Approval of the Fund’s Advisory Agreements
As required under the 1940 Act, the Board determines annually whether to renew the Fund’s management agreement with PGIM Investments LLC (“PGIM Investments”) and the Fund’s subadvisory agreement with PGIM Limited (“PGIML”) and PGIM, Inc. (“PGIM”) on behalf of its PGIM Fixed Income unit (“PGIM Fixed Income”). In considering the renewal of the agreements, the Board, including all of the Independent Directors, met on May 25 and June 6-8, 2023 (the “Board Meeting”) and approved the renewal of the agreements through July 31, 2024, after concluding that the renewal of the agreements was in the best interests of the Fund and its shareholders.
In advance of the meetings, the Board requested and received materials relating to the agreements, and had the opportunity to ask questions and request further information in connection with its consideration. Among other things, the Board considered
5 PGIM Floating Rate Income ETF is a series of PGIM ETF Trust.
PGIM Fixed Income ETFs
Approval of Advisory Agreements (continued)
comparative fee information from PGIM Investments, PGIML and PGIM Fixed Income. Also, the Board considered comparisons with other mutual funds in relevant Peer Universes and Peer Groups, as is further discussed below.
In approving the agreements, the Board, including the Independent Directors advised by independent legal counsel, considered the factors it deemed relevant, including the nature, quality and extent of services provided by PGIM Investments and the subadvisers, the performance of the Fund, the profitability of PGIM Investments and its affiliates, expenses and fees, and the potential for economies of scale that may be shared with the Fund and its shareholders as the Fund’s assets grow. In their deliberations, the Directors did not identify any single factor which alone was responsible for the Board’s decision to approve the agreements with respect to the Fund. In connection with its deliberations, the Board considered information provided by PGIM Investments throughout the year at regular Board meetings, presentations from portfolio managers and other information, as well as information furnished at or in advance of the Board Meeting.
The Directors determined that the overall arrangements between the Fund and PGIM Investments, which serves as the Fund’s investment manager pursuant to a management agreement, and between PGIM Investments, PGIML and PGIM Fixed Income, which serve as the Fund’s subadvisers pursuant to the terms of a subadvisory agreement with PGIM Investments, are in the best interests of the Fund and its shareholders in light of the services performed, fees charged and such other matters as the Directors considered relevant in the exercise of their business judgment.
The material factors and conclusions that formed the basis for the Directors’ reaching their determinations to approve the continuance of the agreements are separately discussed below.
Nature, Quality and Extent of Services
The Board received and considered information regarding the nature, quality and extent of services provided to the Fund by PGIM Investments, PGIML and PGIM Fixed Income. The Board noted that PGIML and PGIM Fixed Income are affiliated with PGIM Investments. The Board considered the services provided by PGIM Investments, including but not limited to the oversight of the subadvisers for the Fund, as well as the provision of fund recordkeeping, compliance and other services to the Fund, and PGIM Investments’ role as administrator for the Fund’s liquidity risk management program. With respect to PGIM Investments’ oversight of the subadvisers, the Board noted that PGIM Investments’ Strategic Investment Research Group (“SIRG”), which is a business unit of PGIM Investments, is responsible for monitoring and reporting to PGIM Investments’ senior management on the performance and operations of the subadvisers. The Board also considered that PGIM Investments pays the salaries of all of the officers and interested Directors of the Fund who are part of Fund management. The Board also considered the investment subadvisory services provided by PGIML and PGIM Fixed Income, including investment research and security selection, as well as adherence to the Fund’s investment restrictions and compliance with applicable Fund
Visit our website at pgim.com/investments
policies and procedures. The Board considered PGIM Investments’ evaluation of the subadvisers, as well as PGIM Investments’ recommendation, based on its review of the subadvisers, to renew the subadvisory agreement.
The Board considered the qualifications, backgrounds and responsibilities of PGIM Investments’ senior management responsible for the oversight of the Fund, PGIML and PGIM Fixed Income, and also considered the qualifications, backgrounds and responsibilities of the PGIML and PGIM Fixed Income portfolio managers who are responsible for the day-to-day management of the Fund’s portfolio. The Board was provided with information pertaining to PGIML’s, PGIM Investments’ and PGIM Fixed Income’s organizational structure, senior management, investment operations, and other relevant information pertaining to PGIM Investments, PGIML and PGIM Fixed Income. The Board also noted that it received favorable compliance reports from the Fund’s Chief Compliance Officer (“CCO”) as to each of PGIM Investments, PGIML and PGIM Fixed Income.
The Board concluded that it was satisfied with the nature, extent and quality of the investment management services provided by PGIM Investments and the subadvisory services provided to the Fund by PGIML and PGIM Fixed Income, and that there was a reasonable basis on which to conclude that the Fund benefits from the services provided by PGIM Investments, PGIML and PGIM Fixed Income under the management and subadvisory agreement.
Costs of Services and Profits Realized by PGIM Investments
The Board was provided with information on the profitability of PGIM Investments and its affiliates in serving as the Fund’s investment manager. The Board discussed with PGIM Investments the methodology utilized in assembling the information regarding profitability and considered its reasonableness. The Board recognized that it is difficult to make comparisons of profitability from fund management contracts because comparative information is not generally publicly available and is affected by numerous factors, including the structure of the particular adviser, the types of funds it manages, its business mix, numerous assumptions regarding allocations and the adviser’s capital structure and cost of capital. However, the Board considered that the cost of services provided by PGIM Investments for the year ended December 31, 2022 exceeded the management fees received by PGIM Investments, resulting in an operating loss to PGIM Investments. Taking these factors into account, the Board concluded that the profitability of PGIM Investments and its affiliates in relation to the services rendered was not unreasonable.
Economies of Scale
The Board received and discussed information concerning economies of scale that PGIM Investments may realize as the Fund’s assets grow beyond current levels. During the course of time, the Board has considered information regarding the launch date of the Fund, the management fees of the Fund compared to those of similarly managed funds and PGIM Investments’ investment in the Fund over time. The Board noted that economies of scale can be shared with the Fund in other ways, including low
PGIM Fixed Income ETFs
Approval of Advisory Agreements (continued)
management fees from inception, additional technological and personnel investments to enhance shareholder services, and maintaining existing expense structures in the face of a rising cost environment. The Board also considered PGIM Investments’ assertion that it continually evaluates the management fee schedule of the Fund and the potential to share economies of scale through breakpoints or fee waivers as asset levels increase.
The Board recognized the inherent limitations of any analysis of economies of scale, stemming largely from the Board’s understanding that most of PGIM Investments’ costs are not specific to individual funds, but rather are incurred across a variety of products and services.
Other Benefits to PGIM Investments, PGIM Fixed Income, and PGIML
The Board considered potential ancillary benefits that might be received by PGIM Investments, PGIML, PGIM Fixed Income and their affiliates as a result of their relationship with the Fund. The Board concluded that potential benefits to be derived by PGIM Investments included transfer agency fees received by the Fund’s transfer agent (which is affiliated with PGIM Investments), as well as benefits to its reputation or other intangible benefits resulting from PGIM Investments association with the Fund. The Board concluded that the potential benefits to be derived by PGIML and PGIM Fixed Income included the ability to use soft dollar credits, as well as the potential benefits consistent with those generally resulting from an increase in assets under management, specifically, potential access to additional research resources and benefits to its reputation. The Board concluded that the benefits derived by PGIM Investments, PGIML and PGIM Fixed Income were consistent with the types of benefits generally derived by investment managers and subadvisers to mutual funds.
Performance of the Fund / Fees and Expenses
The Board considered certain additional factors and made related conclusions relating to the historical performance of the Fund for the three-month period ended December 31, 2022. The Board considered that the Fund commenced operations on May 17, 2022 and that longer-term performance was not yet available.
The Board also considered the Fund’s actual management fee, as well as the Fund’s net total expense ratio, for the fiscal period ended August 31, 2022. The Board considered the management fee for the Fund as compared to the management fee charged by PGIM Investments to other funds and the fee charged by other advisers to comparable mutual funds in a Peer Group. The actual management fee represents the fee rate actually paid by Fund shareholders and includes any fee waivers or reimbursements. The net total expense ratio for the Fund represents the actual expense ratio incurred by Fund shareholders.
The mutual funds included in the Peer Universe, which was used to consider performance, and the Peer Group, which was used to consider expenses and fees, were objectively determined by Broadridge, an independent provider of mutual fund data. In certain circumstances, PGIM Investments also provided supplemental Peer Universe or Peer Group information for reasons addressed with the Board. The comparisons placed
Visit our website at pgim.com/investments
the Fund in various quartiles over various periods, with the first quartile being the best 25% of the mutual funds (for performance, the best performing mutual funds and, for expenses, the lowest cost mutual funds).
The section below summarizes key factors considered by the Board and the Board’s conclusions regarding the Fund’s performance, fees and overall expenses. The table sets forth net performance comparisons (which reflect the impact on performance of fund expenses, or any subsidies, expense caps or waivers that may be applicable) with the Peer Universe, actual management fees with the Peer Group (which reflect the impact of any subsidies or fee waivers), and net total expenses with the Peer Group, each of which were key factors considered by the Board.
| | | | | | | | | | |
Net Performance | | Latest Quarter | | 1 Year | | 3 Years | | 5 Years | | 10 Years |
| | | 2nd Quartile | | N/A | | N/A | | N/A | | N/A |
| | | Actual Management Fees: 3rd Quartile |
| | | Net Total Expenses: 3rd Quartile |
| | ● | The Board noted that the Fund outperformed its benchmark index over the three-month period ended December 31, 2022. |
| | ● | The Board noted that the Fund does not yet have a one-year performance record and that, therefore, the subadviser should have more time to develop that record. |
| | ● | The Board concluded that, in light of the above, it would be in the best interests of the Fund and its shareholders to continue to allow the Fund to create a longer-term performance record, and to renew the agreements. |
| | ● | The Board concluded that the management fees (including subadvisory fees) and total expenses were reasonable in light of the services provided. |
* * *
After full consideration of these factors, the Board concluded that approval of the agreements was in the best interests of the Fund and its shareholders.
PGIM AAA CLO ETF
Initial Approval of the Fund’s Advisory Agreements
As required by the Investment Company Act of 1940 (the 1940 Act), the Board considered the proposed management agreement with PGIM Investments LLC (the Manager) and the proposed subadvisory agreement between the Manager and PGIM Inc. (PGIM), through its PGIM Fixed Income division, together with PGIM Limited, an indirect wholly-owned subsidiary of PGIM, to serve as the subadviser (together, the Subadviser) with respect to the PGIM AAA CLO ETF (the Fund). The Board, including all of the Independent Trustees, met on April 27, 2023 (the Meeting) and approved the agreements for an initial two-year period, after concluding that approval of the agreements was in the best interests of the Fund.
PGIM Fixed Income ETFs
Approval of Advisory Agreements (continued)
In advance of the Meeting, the Board requested and received materials relating to the agreements and had the opportunity to ask questions and request further information in connection with its considerations.
In approving the agreements, the Board, including the Independent Trustees advised by independent legal counsel, considered the factors it deemed relevant, including the nature, quality and extent of services to be provided to the Fund by the Manager and the Subadviser; any relevant comparable performance information and the Subadviser’s qualifications and track record in serving other affiliated funds; and the fees proposed to be paid by the Fund to the Manager and by the Manager to the Subadviser under the agreements. In connection with its deliberations, the Board considered information provided by the Manager and the Subadviser at or in advance of the Meeting. The Board also considered information that the Trustees received throughout the year regarding the Manager and the Subadviser in their capacity as directors or trustees of other funds in the Prudential organization (PGIM Retail Funds). In their deliberations, the Trustees did not identify any single factor which alone was responsible for the Board’s decision to approve the agreements with respect to the Fund.
The Trustees determined that the overall arrangements between the Fund and the Manager, which will serve as the Fund’s investment manager pursuant to a management agreement, and between the Manager and the Subadviser, which will serve as the Fund’s subadviser pursuant to the terms of a subadvisory agreement, are appropriate in light of the services to be performed and the fees to be charged under the agreements and such other matters as the Trustees considered relevant in the exercise of their business judgment.
A summary of certain factors and conclusions that formed the basis for the Trustees’ reaching their determinations to approve the agreements are discussed below.
Nature, quality and extent of services
With respect to the Manager, the Board noted that it had received and considered information about the Manager at the Meeting, including information relating to the approval and renewal, as applicable, of the management agreements between the Manager and the other PGIM Retail Funds, as well as information received at other regular meetings throughout the year of the PGIM Retail Funds, regarding the nature, quality and extent of services provided by the Manager. The Board considered the services to be provided by the Manager, including but not limited to the oversight of the Subadviser, as well as the provision of fund recordkeeping, compliance and other services to the Fund. With respect to the Manager’s oversight of the Subadviser, the Board noted that the Manager’s Strategic Investment Research Group, which is a business unit of the Manager, is responsible for monitoring and reporting to the Manager’s senior management on the performance and operations of the Subadviser. The Board also noted that the Manager pays the salaries of the officers of the Trust and Trustees of the Trust who are affiliated persons of the Manager or Subadviser.
Visit our website at pgim.com/investments
The Board reviewed the qualifications, backgrounds and responsibilities of the Manager’s senior management responsible for the oversight of the Fund and the Subadviser and was also provided with information pertaining to the Manager’s organizational structure, senior management, investment operations and other relevant information. The Board noted that the Manager had personnel with experience in the management of exchanged-traded funds. The Board further noted that it received favorable compliance reports from the Fund’s Chief Compliance Officer as to the Manager for services provided to other PGIM Retail Funds. The Board noted that it had concluded that it was satisfied with the nature, quality and extent of the services provided by the Manager to the other PGIM Retail Funds and determined that it was reasonable to conclude that the nature, quality and extent of services to be provided by the Manager under the management agreement for the Fund would be similar in nature to those provided under the other management agreements.
With respect to the Subadviser, the Board noted that it had received and considered information about the Subadviser at the Meeting, including information relating to the approval and renewal, as applicable, of subadvisory agreements between the Manager and the Subadviser with respect to other PGIM Retail Funds, as well as at other regular meetings throughout the year, regarding the nature, quality and extent of services provided by the Subadviser. The Board considered, among other things, the qualifications, background and experience of the Subadviser’s portfolio managers who will be responsible for the day-to-day management of the Fund’s portfolio, as well as information on the Subadviser’s organizational structure, senior management, investment operations and other relevant information. The Board also considered the Subadviser’s experience managing other similar investment strategies. The Board further noted that it received favorable compliance reports from the Fund’s Chief Compliance Officer as to the Subadviser for services provided to other PGIM Retail Funds. The Board noted that the Subadviser is affiliated with the Manager. The Board noted that it was satisfied with the nature, quality and extent of services provided by the Subadviser with respect to the other PGIM Retail Funds served by the Subadviser and determined that it was reasonable to conclude that the nature, quality and extent of services to be provided by the Subadviser under the subadvisory agreement for the Fund would be similar in nature to those provided under the other subadvisory agreements.
Performance
Because the Fund had not yet commenced operations, no investment performance for the Fund existed for Board review. The Board noted that sleeves of funds and separately managed accounts were managed by the Subadviser that utilize a substantially similar investment strategy. The Board considered the background and professional experience of the proposed portfolio management team for the Fund. The Board took note that the Manager will provide information relating to performance to the Board in connection with future annual reviews of the management agreement and subadvisory agreement.
PGIM Fixed Income ETFs
Approval of Advisory Agreements (continued)
Fee Rates
The Board considered the proposed management fees to be paid by the Fund to the Manager and the compensation to be paid by the Manager to the Subadviser. The Board considered the nature of the management fee as a unitary fee and that the Manager would be responsible for the Fund’s expenses except for those expenses reflected in the management agreement as remaining the responsibility of the Fund.
The Board considered information provided by the Manager comparing the Fund’s proposed unitary management fee rate (i.e, total expense ratio) to the Lipper 15(c) Peer Group. The Board noted that the Fund’s management fee was in the first quartile. The Board also considered the Manager’s assertion that it expected to incur a subsidy cost to support the unitary fee.
The Board concluded that the proposed management fee and total expenses were reasonable in light of the services to be provided.
Profitability
Because the Fund had not yet commenced operations and the actual asset base of the Fund had not yet been determined, the Board noted that there was no historical profitability information with respect to the Fund to be reviewed. The Board noted that it would review profitability information in connection with future annual renewals of the management and subadvisory agreements.
Economies of Scale
Because the Fund had not yet commenced operations and the actual asset base of the Fund had not yet been determined, the Board noted that there was no historical information regarding economies of scale with respect to the Fund to be reviewed. The Board noted that it would review such information in connection with future annual renewals of the management and subadvisory agreements.
Other Benefits to the Manager and the Subadviser
The Board considered potential “fall-out” or ancillary benefits anticipated to be received by the Manager, the Subadviser and their affiliates as a result of their relationship with the Fund. The Board concluded that any potential benefits to be derived by the Manager were similar to benefits derived by the Manager in connection with its management of the other affiliated funds managed by the Manager, which are reviewed on an annual basis. The Board also concluded that any potential benefits to be derived by the Subadviser were consistent with those generally derived by subadvisers to the PGIM Retail Funds, and that those benefits are reviewed on an annual basis. The Board concluded that any potential benefits derived by the Manager and the Subadviser were consistent with the types of benefits generally derived by investment managers and subadvisers to funds.
* * *
Visit our website at pgim.com/investments
After consideration of these and other factors, the Board concluded that the approval of the agreements was in the best interests of the Fund.
PGIM Short Duration Multi-Sector Bond ETF
Initial Approval of the Fund’s Advisory Agreements
As required by the Investment Company Act of 1940 (the 1940 Act), the Board considered the proposed management agreement with PGIM Investments LLC (the Manager) and the proposed subadvisory agreement between the Manager and PGIM Inc. (PGIM), through its PGIM Fixed Income division, together with PGIM Limited, an indirect wholly-owned subsidiary of PGIM, to serve as the subadviser (together, the Subadviser) with respect to the PGIM Short Duration Multi-Sector Bond ETF (the Fund). The Board, including all of the Independent Trustees, met on April 27, 2023 (the Meeting) and approved the agreements for an initial two-year period, after concluding that approval of the agreements was in the best interests of the Fund.
In advance of the Meeting, the Board requested and received materials relating to the agreements and had the opportunity to ask questions and request further information in connection with its considerations.
In approving the agreements, the Board, including the Independent Trustees advised by independent legal counsel, considered the factors it deemed relevant, including the nature, quality and extent of services to be provided to the Fund by the Manager and the Subadviser; any relevant comparable performance information and the Subadviser’s qualifications and track record in serving other affiliated funds; and the fees proposed to be paid by the Fund to the Manager and by the Manager to the Subadviser under the agreements. In connection with its deliberations, the Board considered information provided by the Manager and the Subadviser at or in advance of the Meeting. The Board also considered information that the Trustees received throughout the year regarding the Manager and the Subadviser in their capacity as directors or trustees of other funds in the Prudential organization (PGIM Retail Funds). In their deliberations, the Trustees did not identify any single factor which alone was responsible for the Board’s decision to approve the agreements with respect to the Fund.
The Trustees determined that the overall arrangements between the Fund and the Manager, which will serve as the Fund’s investment manager pursuant to a management agreement, and between the Manager and the Subadviser, which will serve as the Fund’s subadviser pursuant to the terms of a subadvisory agreement, are appropriate in light of the services to be performed and the fees to be charged under the agreements and such other matters as the Trustees considered relevant in the exercise of their business judgment.
A summary of certain factors and conclusions that formed the basis for the Trustees’ reaching their determinations to approve the agreements are discussed below.
PGIM Fixed Income ETFs
Approval of Advisory Agreements (continued)
Nature, quality and extent of services
With respect to the Manager, the Board noted that it had received and considered information about the Manager at the Meeting, including information relating to the approval and renewal, as applicable, of the management agreements between the Manager and the other PGIM Retail Funds, as well as information received at other regular meetings throughout the year of the PGIM Retail Funds, regarding the nature, quality and extent of services provided by the Manager. The Board considered the services to be provided by the Manager, including but not limited to the oversight of the Subadviser, as well as the provision of fund recordkeeping, compliance and other services to the Fund. With respect to the Manager’s oversight of the Subadviser, the Board noted that the Manager’s Strategic Investment Research Group, which is a business unit of the Manager, is responsible for monitoring and reporting to the Manager’s senior management on the performance and operations of the Subadviser. The Board also noted that the Manager pays the salaries of the officers of the Trust and Trustees of the Trust who are affiliated persons of the Manager or Subadviser.
The Board reviewed the qualifications, backgrounds and responsibilities of the Manager’s senior management responsible for the oversight of the Fund and the Subadviser and was also provided with information pertaining to the Manager’s organizational structure, senior management, investment operations and other relevant information. The Board noted that the Manager had personnel with experience in the management of exchanged-traded funds. The Board further noted that it received favorable compliance reports from the Fund’s Chief Compliance Officer as to the Manager for services provided to other PGIM Retail Funds. The Board noted that it had concluded that it was satisfied with the nature, quality and extent of the services provided by the Manager to the other PGIM Retail Funds and determined that it was reasonable to conclude that the nature, quality and extent of services to be provided by the Manager under the management agreement for the Fund would be similar in nature to those provided under the other management agreements.
With respect to the Subadviser, the Board noted that it had received and considered information about the Subadviser at the Meeting, including information relating to the approval and renewal, as applicable, of subadvisory agreements between the Manager and the Subadviser with respect to other PGIM Retail Funds, as well as at other regular meetings throughout the year, regarding the nature, quality and extent of services provided by the Subadviser. The Board considered, among other things, the qualifications, background and experience of the Subadviser’s portfolio managers who will be responsible for the day-to-day management of the Fund’s portfolio, as well as information on the Subadviser’s organizational structure, senior management, investment operations and other relevant information. The Board also considered the Subadviser’s experience managing other similar investment strategies. The Board further noted that it received favorable compliance reports from the Fund’s Chief Compliance Officer as to the Subadviser for services provided to other PGIM Retail Funds. The Board noted that the Subadviser is affiliated with the Manager. The Board noted that it was satisfied with the nature, quality and extent of services provided by the
Visit our website at pgim.com/investments
Subadviser with respect to the other PGIM Retail Funds served by the Subadviser and determined that it was reasonable to conclude that the nature, quality and extent of services to be provided by the Subadviser under the subadvisory agreement for the Fund would be similar in nature to those provided under the other subadvisory agreements.
Performance
Because the Fund had not yet commenced operations, no investment performance for the Fund existed for Board review. The Board reviewed the performance information of a mutual fund advised by the Manager and subadvised by the Subadviser that utilizes the same investment strategy. The Board considered the background and professional experience of the proposed portfolio management team for the Fund. The Board took note that the Manager will provide information relating to performance to the Board in connection with future annual reviews of the management agreement and subadvisory agreement.
Fee Rates
The Board considered the proposed management fees to be paid by the Fund to the Manager and the compensation to be paid by the Manager to the Subadviser. The Board considered the nature of the management fee as a unitary fee and that the Manager would be responsible for the Fund’s expenses except for those expenses reflected in the management agreement as remaining the responsibility of the Fund.
The Board considered information provided by the Manager comparing the Fund’s proposed unitary management fee rate (i.e., total expense ratio) to the Lipper 15(c) Peer Group. The Board noted that the Fund’s management fee was in the third quartile. The Board discussed the potential differences in strategies of the funds comprising the Lipper 15(c) Peer Group and the comparative value of such peers. The Board also considered the Manager’s assertion that it expected to incur a subsidy cost to support the unitary fee.
The Board concluded that the proposed management fee and total expenses were reasonable in light of the services to be provided.
Profitability
Because the Fund had not yet commenced operations and the actual asset base of the Fund had not yet been determined, the Board noted that there was no historical profitability information with respect to the Fund to be reviewed. The Board noted that it would review profitability information in connection with future annual renewals of the management and subadvisory agreements.
Economies of Scale
Because the Fund had not yet commenced operations and the actual asset base of the Fund had not yet been determined, the Board noted that there was no historical information regarding economies of scale with respect to the Fund to be reviewed. The
PGIM Fixed Income ETFs
Approval of Advisory Agreements (continued)
Board noted that it would review such information in connection with future annual renewals of the management and subadvisory agreements.
Other Benefits to the Manager and the Subadviser
The Board considered potential “fall-out” or ancillary benefits anticipated to be received by the Manager, the Subadviser and their affiliates as a result of their relationship with the Fund. The Board concluded that any potential benefits to be derived by the Manager were similar to benefits derived by the Manager in connection with its management of the other affiliated funds managed by the Manager, which are reviewed on an annual basis. The Board also concluded that any potential benefits to be derived by the Subadviser were consistent with those generally derived by subadvisers to the PGIM Retail Funds, and that those benefits are reviewed on an annual basis. The Board concluded that any potential benefits derived by the Manager and the Subadviser were consistent with the types of benefits generally derived by investment managers and subadvisers to funds.
***
After consideration of these and other factors, the Board concluded that the approval of the agreements was in the best interests of the Fund.
Visit our website at pgim.com/investments
| | | | |
∎ MAIL 655 Broad Street Newark, NJ 07102 | | ∎ TELEPHONE (800) 225-1852 | | ∎ WEBSITE pgim.com/investments |
|
PROXY VOTING |
The Board of Trustees delegated to the Funds’ subadvisers the responsibility for voting any proxies and maintaining proxy recordkeeping with respect to each Funds. A description of these proxy voting policies and procedures is available without charge, upon request, by calling (800) 225-1852 or by visiting the Securities and Exchange Commission’s website at sec.gov. Information regarding how each Funds voted proxies relating to portfolio securities during the most recent 12-month period ended June 30 is available on the Funds’ website and on the Securities and Exchange Commission’s website. |
|
TRUSTEES |
Ellen S. Alberding ● Kevin J. Bannon ● Scott E. Benjamin ● Linda W. Bynoe ● Barry H. Evans ● Keith F. Hartstein ● Laurie Simon Hodrick ● Stuart S. Parker ● Brian K. Reid ● Grace C. Torres |
|
OFFICERS |
Stuart S. Parker, President ● Scott E. Benjamin, Vice President ● Christian J. Kelly, Chief Financial Officer ● Claudia DiGiacomo, Chief Legal Officer ● Andrew Donohue, Chief Compliance Officer ● Russ Shupak, Treasurer and Principal Accounting Officer ● Kelly Florio, Anti-Money Laundering Compliance Officer ● Andrew R. French, Secretary ● Melissa Gonzalez, Assistant Secretary ● Kelly A. Coyne, Assistant Secretary ● Patrick E. McGuinness, Assistant Secretary ● Debra Rubano, Assistant Secretary ● Lana Lomuti, Assistant Treasurer ● Elyse M. McLaughlin, Assistant Treasurer ● Deborah Conway, Assistant Treasurer ● Robert W. McCormack, Assistant Treasurer |
| | | | |
MANAGER | | PGIM Investments LLC | | 655 Broad Street Newark, NJ 07102 |
SUBADVISERS | | PGIM Fixed Income | | 655 Broad Street Newark, NJ 07102 |
| | | PGIM Limited | | Grand Buildings, 1-3 Strand Trafalgar Square London, WC2N 5HR United Kingdom |
DISTRIBUTOR | | Prudential Investment Management Services LLC | | 655 Broad Street Newark, NJ 07102 |
CUSTODIAN/TRANSFER AGENT | | The Bank of New York Mellon | | 240 Greenwich Street New York, NY 10286 |
INDEPENDENT REGISTERED PUBLIC ACCOUNTING FIRM | | PricewaterhouseCoopers LLP | | 300 Madison Avenue New York, NY 10017 |
FUND COUNSEL | | Willkie Farr & Gallagher LLP | | 787 Seventh Avenue New York, NY 10019 |
|
An investor should consider the investment objectives, risks, charges, and expenses of each Funds carefully before investing. The prospectus and summary prospectus contain this and other information about the Fund. An investor may obtain the prospectus and summary prospectus by visiting our website at pgim.com/investments or by calling (800) 225-1852. The prospectus and summary prospectus should be read carefully before investing. |
|
E-DELIVERY |
To receive your fund documents online, go to pgim.com/investments/resource/edelivery and enroll. Instead of receiving printed documents by mail, you will receive notification via email when new materials are available. You can cancel your enrollment or change your email address at any time by visiting the website address above. |
|
SHAREHOLDER COMMUNICATIONS WITH TRUSTEES |
Shareholders can communicate directly with the Board of Trustees by writing to the Chair of the Board, PGIM Fixed Income ETFs, PGIM Investments, Attn: Board of Trustees, 655 Broad Street, Newark, NJ 07102. Shareholders can communicate directly with an individual Trustee by writing to that Trustee at the same address. Communications are not screened before being delivered to the addressee. |
|
AVAILABILITY OF PORTFOLIO HOLDINGS |
On each business day, before commencement of trading on the Exchange, the Fund will disclose on www.pgiminvestments.com the Fund’s portfolio holdings that will form the basis for the Fund’s calculation of NAV at the end of the business day. The Fund files its complete schedule of portfolio holdings with the Securities and Exchange Commission for the first and third quarters of each fiscal year as an exhibit to its reports on Form N-PORT. The Fund’s Form N-PORT filings are available on the Commission’s website at sec.gov. |
|
The Fund’s Statement of Additional Information contains additional information about the Fund’s Trustees and is available without charge, upon request, by calling (800) 225-1852. |
Funds:
| | | | |
ARE NOT INSURED BY THE FDIC OR ANY FEDERAL GOVERNMENT AGENCY | | MAY LOSE VALUE | | ARE NOT A DEPOSIT OF OR GUARANTEED BY ANY BANK OR ANY BANK AFFILIATE |

PGIM FIXED INCOME ETFS
| | | | | | | | |
| | | | |
| Fund | | Ticker Symbol | | | | | | |
| | | | |
PGIM Ultra Short Bond ETF | | PULS | | | | | | |
| | | | |
PGIM Active High Yield Bond ETF | | PHYL | | | | | | |
| | | | |
PGIM Active Aggregate Bond ETF | | PAB | | | | | | |
| | | | |
PGIM Total Return Bond ETF | | PTRB | | | | | | |
| | | | |
PGIM Floating Rate Income ETF | | PFRL | | | | | | |
| | | | |
PGIM AAA CLO ETF | | PAAA | | | | | | |
| | | | |
PGIM Short Duration Multi-Sector Bond ETF | | PSDM | | | | | | |
ETF1000E

PGIM JENNISON ETFs
PGIM Jennison Focused Growth ETF (PJFG)
PGIM Jennison Focused Value ETF (PJFV)
ANNUAL REPORT
AUGUST 31, 2023

To enroll in e-delivery, go to pgim.com/investments/resource/edelivery
Table of Contents
This report is not authorized for distribution to prospective investors unless preceded or accompanied by a current prospectus.
The views expressed in this report and information about the Funds’ portfolio holdings are for the period covered by this report and are subject to change thereafter.
Exchange-traded funds are distributed by Prudential Investment Management Services LLC, member SIPC. Jennison Associates LLC is a registered investment adviser. Both are Prudential Financial companies. © 2023 Prudential Financial, Inc. and its related entities. Jennison Associates, Jennison, PGIM, and the PGIM logo are service marks of Prudential Financial, Inc. and its related entities, registered in many jurisdictions worldwide.
| | |
| 2 Visit our website at pgim.com/investments | | |
Letter from the President
| | |
 | | Dear Shareholder: We hope you find the annual report for the PGIM Jennison ETFs informative and useful. The report covers performance for the period from the Fund’s inception on December 12, 2022 through August 31, 2023. Although central banks raised interest rates aggressively to tame surging inflation during the period, the global economy and financial markets demonstrated resilience. Employers continued to hire, consumers continued to spend, home prices rose, and recession fears receded. |
|
Stocks fell early in the period, bottomed in October, and then began a rally that eventually ended a bear market. Despite a banking industry crisis in March, stocks have continued to rise globally throughout 2023 as inflation cooled and the Federal Reserve slowed the pace of its rate hikes. Equities in both US and international markets posted gains during the period.
Bond market returns were mixed during the period as rising interest rates lifted yields to their highest level in two decades. US and global investment-grade bonds fell, while US high yield corporate bonds and emerging-market debt rose.
Regarding your investments with PGIM, we believe it is important to maintain a diversified portfolio of funds consistent with your tolerance for risk, time horizon, and financial goals. Your financial advisor can help you create a diversified investment plan that may include funds covering all the basic asset classes and that reflects your personal investor profile and risk tolerance. However, diversification and asset allocation strategies do not assure a profit or protect against loss in declining markets.
At PGIM Investments, we provide access to active investment strategies across the global markets in the pursuit of consistent outperformance for investors. PGIM is the world’s 14th-largest investment manager with more than $1.3 trillion in assets under management. Our scale and investment expertise allow us to deliver a diversified suite of actively managed solutions across a broad spectrum of asset classes and investment styles.
Thank you for choosing our family of funds.
Sincerely,

Stuart S. Parker, President
PGIM Jennison ETFs
October 16, 2023
PGIM Jennison Focused Growth ETF
Your Fund’s Performance (unaudited)
Performance data quoted represent past performance. Past performance does not guarantee future results. The investment return and principal value of an investment will fluctuate so that an investor’s shares, when sold, may be worth more or less than their original cost. Current performance may be lower or higher than the past performance data quoted. An investor may obtain performance data as of the most recent month-end by visiting our website at pgim.com/investments or by calling (800) 225-1852.
| | |
| |
| | | Total Returns as of 8/31/23* Since Inception (%) |
| |
Net Asset Value (NAV) | | 31.38 (12/12/2022) |
| |
Market Price** | | 31.40 (12/12/2022) |
| |
Russell 1000® Growth Index | | |
| | | 22.05 |
*Not annualized
**The market price is determined using the midpoint between the highest bid and the lowest offer on the listing exchange, as of the time that the Fund’s NAV is calculated. The first day of secondary market trading is typically several days after the date on which the Fund commenced investment operations; therefore, the NAV of the Fund is used as a proxy for the period from inception of investment operations to the first day of secondary market trading to calculate the market price returns. Since Inception returns are provided since the Fund has less than 10 fiscal years of returns. Since Inception returns for the Index are measured from the closest month-end to the Fund’s inception date.
The returns in the table do not reflect the deduction of taxes that a shareholder would pay on Fund distributions or following the sale of Fund shares.
Market returns do not include brokerage commissions that may be payable on secondary market transactions. If brokerage commissions were included, market returns would be lower. Market and NAV returns assume that dividends and capital gain distributions, if any, have been reinvested in the Fund at market price and NAV, respectively.
| | |
| 4 Visit our website at pgim.com/investments | | |
Growth of a $10,000 Investment (unaudited)
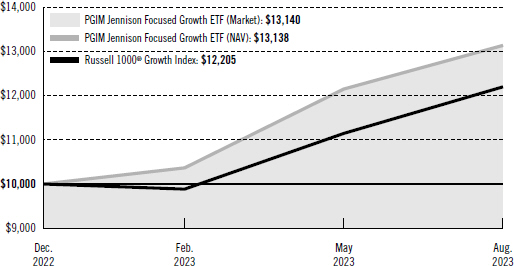
The graph compares a $10,000 investment in the Fund with a similar investment in the Russell 1000 Growth Index by portraying the initial account values at the commencement of operations (December 12, 2022) and the account values at the end of the current fiscal year (August 31, 2023) as measured on a quarterly basis. The Fund assumes an initial investment on December 12, 2022, while the Index assumes that the initial investment occurred on November 30, 2022. For purposes of the graph, and unless otherwise indicated, it has been assumed that (a) all recurring fees (including management fees) were deducted and (b) all dividends and distributions were reinvested. Without waiver of fees and/or expense reimbursements, if any, the returns would have been lower.
Past performance does not predict future performance. Total returns and the ending account values in the graphs include changes in share price and reinvestment of dividends and capital gains distributions in a hypothetical investment for the periods shown. The Fund’s total returns do not reflect the deduction of income taxes on an individual’s investment. Taxes may reduce your actual investment returns on income or gains paid by the Fund or any gains you may realize if you sell your shares.
PGIM Jennison Focused Growth ETF
Your Fund’s Performance (continued)
Benchmark Definition
Russell 1000 Growth Index—The Russell 1000 Growth Index is an unmanaged index which contains those securities in the Russell 1000 Index with an above-average growth orientation. Companies in this Index tend to exhibit higher price-to-book and price-to-earnings ratios, lower dividend yields and higher forecasted growth rates.
Investors cannot invest directly in an index. The returns for the Index would be lower if they included the effects of operating expenses or taxes that may be paid by an investor.
Presentation of Fund Holdings as of 8/31/23
| | | | |
| | |
Ten Largest Holdings | | Line of Business | | % of Net Assets |
| | |
| NVIDIA Corp. | | Semiconductors & Semiconductor Equipment | | 10.9% |
| | |
| Microsoft Corp. | | Software | | 9.1% |
| | |
| Amazon.com, Inc. | | Broadline Retail | | 7.9% |
| | |
| Apple, Inc. | | Technology Hardware, Storage & Peripherals | | 6.2% |
| | |
| Mastercard, Inc. (Class A Stock) | | Financial Services | | 5.3% |
| | |
| Tesla, Inc. | | Automobiles | | 4.9% |
| | |
| Alphabet, Inc. (Class A Stock) | | Interactive Media & Services | | 4.6% |
| | |
| Eli Lilly & Co. | | Pharmaceuticals | | 4.2% |
| | |
| MercadoLibre, Inc. (Brazil) | | Broadline Retail | | 3.9% |
| | |
| Meta Platforms, Inc. (Class A Stock) | | Interactive Media & Services | | 3.9% |
Holdings reflect only long-term investments and are subject to change.
| | |
| 6 Visit our website at pgim.com/investments | | |
Strategy and Performance Overview*
(unaudited)
How did the Fund perform?
The PGIM Jennison Focused Growth ETF (the Fund) returned 31.38%, based on net asset value (NAV), in the reporting period from the Fund’s inception on December 12, 2022, through August 31, 2023, outperforming the 22.05% return of the Russell 1000 Growth Index (the Index).
What were the market conditions?
| · | | At the start of the period, investors remained uncertain about inflationary pressures and US Federal Reserve (Fed) policy, heightened geopolitical tension, war in Ukraine, and expectations that US economic growth would slow and could enter a recession. Companies took aggressive steps to rationalize costs, expecting a more challenging environment ahead. |
| · | | In the first eight months of 2023, however, the economy delivered better-than-feared results, with continued—albeit moderating—growth led by resilient consumer spending amid ongoing labor market strength. As inflationary pressures eased, the Fed slowed the pace of monetary tightening, which encouraged investors, as did stronger-than-expected earnings reports. Investors appeared to be surprised that many companies were able to effectively cut their costs and reduce their head counts, enabling them to exceed Wall Street expectations. Growth companies, led by technology, rose sharply. |
| · | | Interest in artificial intelligence (AI)—catalyzed by the launch of ChatGPT in late November 2022—continued to grow through the first half of 2023. Investors expressed the greatest enthusiasm for companies supplying the foundational components to design, build, and run AI and machine-learning capabilities. While AI offers the potential for transformative technological change, investors remained divided about who has the most to gain—and lose—from the application of these new technologies across companies and industries. |
What worked?
| · | | Both security selection and sector weightings added value relative to the Index during the reporting period. Stock selection in information technology, healthcare, and consumer staples contributed the most to relative performance. |
| · | | Individual positions within information technology were especially strong contributors to the Fund’s absolute performance, as select companies posted robust gains in 2023 following a rough second half of 2022. The rebound reflected both the depressed nature of valuations when 2023 began and the first signs of upgrades to near-and medium-term revenue and profit expectations from company managements. Top technology performers included Nvidia Corp., Microsoft Inc., and Apple Inc. |
| | · | | Nvidia shares rose on the company’s growth opportunity as a leader in advanced computer chips that support AI development. As the period progressed, Nvidia enjoyed tremendous demand for accelerated computing and generative AI equipment. In Jennison’s view, supply should sustain revenue growth well into 2024. |
Strategy and Performance Overview* (continued)
| | · | | Enterprise software company Microsoft continued to gain share across multiple product lines, while having the advantage of being very well positioned for the AI wave, given the company’s plans to incorporate AI into existing products, thereby increasing revenue potential. |
| | · | | Apple shares rose as the company continued to demonstrate the power of its ecosystem, which includes 2 billion iPhones. |
| · | | Other top performers included consumer discretionary holdings Amazon.com Inc. and MercadoLibre Inc. |
| | · | | Online retailer and services provider Amazon continued to produce strong financial results due to stable e-commerce demand and robust growth in advertising. In addition, Jennison believes there are signs that Amazon Web Services (AWS) growth should reaccelerate into the latter part of 2023, with longer-term opportunities presented by generative AI. |
| | · | | Shares in MercadoLibre, the leader in online commerce and payments ecosystems in Latin America, benefited from the company’s strong competitive position, opportunities for margin expansion, and excellent management team focused on delivering sustainable and profitable growth. The company continues to gain market share, which supports strong top-line growth, as does the breadth of its product line and impressive level of customer engagement. |
What didn’t work?
| · | | From a sector perspective, stock selection within the communication services sector, along with an overweight in healthcare and underweight in information technology (due to less-than-Index exposure to Apple and Microsoft) were the most significant detractors from relative results. |
| · | | Three of the most significant individual detractors during the period included healthcare holdings UnitedHealth Group Inc., Thermo Fisher Scientific Inc., and DexCom Inc. |
| | · | | Shares in UnitedHealth Group declined in part due to the market rotation out of healthcare, and in part because of Medicare audit and reimbursement rate announcements that were slightly less favorable than expected. |
| | · | | Thermo Fisher Scientific provides analytical instruments, equipment, consumables, software, and services to the life sciences, healthcare, and industrial, environmental, and safety industries. The position was eliminated on concerns of a slowing macro economic environment, which is causing the company to reduce costs. |
| | · | | DexCom makes continuous glucose monitoring (CGM) systems that eliminate the need for people with diabetes to test their blood glucose levels through finger sticks. The company’s valuation was pressured by concerns that recently launched drugs from major pharmaceutical companies have the potential to limit future demand for glucose monitoring. |
| | |
| 8 Visit our website at pgim.com/investments | | |
| · | | Other significant detractors included Adyen N.V. (financials) and SBA Communications Corp. (real estate). |
| | · | | Shares in payments platform operator Adyen declined as the company saw dramatic deceleration in revenue growth, mostly concentrated in its US online channel. While e-commerce is growing globally, it is increasingly difficult to know who the ultimate winners will be. Accordingly, the position was eliminated near the end of the reporting period. |
| | · | | Shares of telecommunication real estate investment trust (REIT) SBA Communications fell due in part to a market rotation away from the more defensive stocks within the secular growth ecosystem. Jennison sold the Fund’s position during the reporting period in favor of more attractive valuation opportunities within the faster-growing areas of technology disruption and innovation, especially among companies with longer-duration business models. |
Current outlook
| · | | As of August 31, 2023, the Fund’s largest sector overweight relative to the Index was in consumer discretionary, and its largest underweights were in industrials and information technology. |
| · | | The US economy stands in better shape than Jennison anticipated when 2023 began. Robust employment has sustained consumer spending at a solid pace. Consumer confidence currently reflects optimism in the near term despite announced work force reductions, interest rates at the highest levels in over a decade, and reduced credit availability in the financial system. It therefore seems likely that the slope of the economy’s slowing trajectory will remain shallower than previously feared while employment remains healthy. |
| · | | Inflationary pressures, while still evident, will likely continue to moderate. |
| · | | Trends in technology spending, which weakened earlier last year, have begun to stabilize. A combination of easing year-over-year comparisons and the priority of digital transformation, with an emerging impetus from AI, increasingly suggest a rebound in spending and a return to longer-term investment trends moving toward the end of 2023. The strong rebound in the prices of select technology shares year-to-date reflects both the depressed nature of valuations when 2023 began, and the first signs of upgrades to near- and medium-term revenue and profit expectations from company managements—a trend Jennison believes will gather pace in the coming quarters. |
| · | | Jennison expects to see generative AI use cases and applications spread from technology providers and developers to a wide variety of industries and companies that use these tools to increase competitive positioning through improved time to market, streamlined customer service, and accelerated efforts to harness data in increasingly sophisticated ways. |
Strategy and Performance Overview* (continued)
| · | | Jennison continues to invest in a broadly diversified portfolio of companies that appear positioned to outpace the market averages in growing revenue and earnings over the investment time horizon. |
*This strategy and performance overview, which discusses what strategies or holdings (including derivatives, if applicable) affected the Fund’s performance, is compiled based on how the Fund performed relative to the Fund’s benchmark index and is viewed for performance attribution purposes at the aggregate Fund level, which in most instances will not directly correlate to the amounts disclosed in the Statement of Operations which conform to US generally accepted accounting principles.
| | |
| 10 Visit our website at pgim.com/investments | | |
PGIM Jennison Focused Value ETF
Your Fund’s Performance (unaudited)
Performance data quoted represent past performance. Past performance does not guarantee future results. The investment return and principal value of an investment will fluctuate so that an investor’s shares, when sold, may be worth more or less than their original cost. Current performance may be lower or higher than the past performance data quoted. An investor may obtain performance data as of the most recent month-end by visiting our website at pgim.com/investments or by calling (800) 225-1852.
| | |
| |
| | | Total Returns as of 8/31/23* Since Inception (%) |
| |
Net Asset Value (NAV) | | 7.64 (12/12/2022) |
| |
Market Price** | | 7.65 (12/12/2022) |
| |
Russell 1000 Value Index | | |
| |
| | | 1.61 |
*Not annualized
**The market price is determined using the midpoint between the highest bid and the lowest offer on the listing exchange, as of the time that the Fund’s NAV is calculated. The first day of secondary market trading is typically several days after the date on which the Fund commenced investment operations; therefore, the NAV of the Fund is used as a proxy for the period from inception of investment operations to the first day of secondary market trading to calculate the market price returns.
Since Inception returns are provided since the Fund has less than 10 fiscal years of returns. Since Inception returns for the Index are measured from the closest month-end to the Fund’s inception date.
The returns in the table do not reflect the deduction of taxes that a shareholder would pay on Fund distributions or following the sale of Fund shares.
Market returns do not include brokerage commissions that may be payable on secondary market transactions. If brokerage commissions were included, market returns would be lower. Market and NAV returns assume that dividends and capital gain distributions, if any, have been reinvested in the Fund at market price and NAV, respectively.
PGIM Jennison Focused Value ETF
Your Fund’s Performance (continued)
Growth of a $10,000 Investment (unaudited)
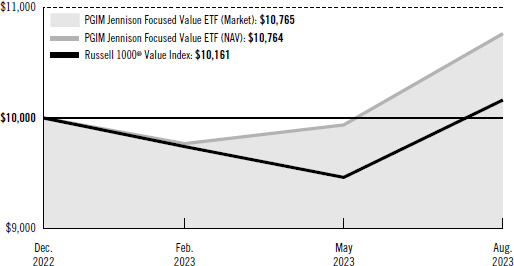
The graph compares a $10,000 investment in the Fund with a similar investment in the Russell 1000 Value Index by portraying the initial account values at the commencement of operations (December 12, 2022) and the account values at the end of the current fiscal year (August 31, 2023) as measured on a quarterly basis. The Fund assumes an initial investment on December 12, 2022, while the Index assumes that the initial investment occurred on November 30, 2022. For purposes of the graph, and unless otherwise indicated, it has been assumed that (a) all recurring fees (including management fees) were deducted and (b) all dividends and distributions were reinvested. Without waiver of fees and/or expense reimbursements, if any, the returns would have been lower.
Past performance does not predict future performance. Total returns and the ending account values in the graphs include changes in share price and reinvestment of dividends and capital gains distributions in a hypothetical investment for the periods shown. The Fund’s total returns do not reflect the deduction of income taxes on an individual’s investment. Taxes may reduce your actual investment returns on income or gains paid by the Fund or any gains you may realize if you sell your shares.
| | |
| 12 Visit our website at pgim.com/investments | | |
Benchmark Definition
Russell 1000 Value Index—The Russell 1000 Value Index is an unmanaged index comprising those securities in the Russell 1000 Index with a less-than-average growth orientation. Companies in this index generally have low price-to-book and price-to-earnings ratios, higher dividend yields, and lower forecasted growth values.
Investors cannot invest directly in an index. The returns for the Index would be lower if they included the effects of operating expenses or taxes that may be paid by an investor.
Presentation of Fund Holdings as of 8/31/23
| | | | |
| | |
Ten Largest Holdings | | Line of Business | | % of Net Assets |
| | |
| Walmart, Inc. | | Consumer Staples Distribution & Retail | | 5.9% |
| | |
| Hess Corp. | | Oil, Gas & Consumable Fuels | | 5.6% |
| | |
| Eli Lilly & Co. | | Pharmaceuticals | | 4.9% |
| | |
| Chubb Ltd. | | Insurance | | 4.2% |
| | |
| AstraZeneca plc (United Kingdom), ADR | | Pharmaceuticals | | 4.2% |
| | |
| Linde plc | | Chemicals | | 4.1% |
| | |
| Microsoft Corp. | | Software | | 4.1% |
| | |
| JPMorgan Chase &Co. | | Banks | | 3.8% |
| | |
| Schlumberger NV | | Energy Equipment & Services | | 3.6% |
| | |
| Union Pacific Corp. | | Ground Transportation | | 3.6% |
Holdings reflect only long-term investments and are subject to change.
Strategy and Performance Overview*
(unaudited)
How did the Fund perform?
The PGIM Jennison Focused Value ETF returned 7.64%, based on net asset value, in the reporting period from the Fund’s inception on December 12, 2022, through August 31, 2023, outperforming the 1.61% return of the Russell 1000 Value Index (the Index).
What were the market conditions?
| · | | In June 2022, prior to the start of the reporting period, inflation rose above 9%, the highest level in four decades. Between March 2022 and July 2023, the US Federal Reserve (Fed) raised the federal funds rate 11 times, from near zero to a range of 5.25–5.50%, reflecting the Fed’s urgency in reestablishing price stability. |
| · | | The investment backdrop for stocks during the period can be divided into two sections. In the last four months of 2022, investors remained uncertain about inflationary pressures and Fed policy, heightened geopolitical tension, war in Ukraine, and expectations that US economic growth would slow and could enter a recession. Companies took aggressive steps to rationalize costs, expecting a more challenging environment ahead. In this environment, stocks generally continued to underperform as they had earlier in 2022. |
| · | | In the first eight months of 2023, however, the economy delivered better-than-feared results, with continued—albeit moderating—growth led by resilient consumer spending amid ongoing labor market strength. As inflationary pressures eased, the Fed slowed the pace of monetary tightening, which encouraged investors, as did stronger-than-expected earnings reports. Investors appeared to be surprised that many companies were able to effectively cut their costs and stabilize profit margins, enabling them to exceed Wall Street expectations. Value stocks generally advanced, but significantly underperformed growth stocks, which rose sharply, largely due to the rebound of technology stocks. |
| · | | Interest in artificial intelligence (AI)—catalyzed by the launch of ChatGPT in late November 2022—continued to grow through the first half of 2023. Investors expressed the greatest enthusiasm for mega-cap technology companies, such as Alphabet Inc., Meta Platforms Inc., and Microsoft Corp., supplying the foundational components to design, build, and run AI and machine-learning capabilities. While AI offers the potential for transformative technological change, investors remained divided about who has the most to gain—and lose—from the application of these new technologies across companies and industries. |
| · | | Within the Index, the communication services, information technology, industrials, and energy sectors saw the largest gains during the period. The consumer discretionary, materials, financials, and real estate sectors also advanced, but underperformed the Index, while the utilities, health care, and consumer staples sectors lost ground. |
What worked?
| · | | In aggregate, both security selection and sector weightings contributed positively to relative performance during the period. |
| | |
| 14 Visit our website at pgim.com/investments | | |
| · | | Stock selection within the information technology, health care, consumer staples, communication services, and materials sectors bolstered relative results. |
| · | | An overweight in information technology and an underweight in real estate, each relative to the Index, also benefited relative performance. |
| · | | Key positive portfolio contributors included Eli Lilly and Co., Meta Platforms, Microsoft, Broadcom Inc., and Salesforce Inc. |
| | · | | Shares of Eli Lilly rose on the strong performance of diabetes/obesity treatments Mounjaro and Trulicity, which remain tremendous opportunities for the company. As of August 31, 2023, the Mounjaro launch is the strongest for any diabetes drug ever. While Alzheimer’s disease has been a tough market for drug developers, Lilly has received breakthrough designation from the US Food and Drug Administration for donanemab and is one of four companies with Phase 3 clinical data expected over the next 12 months. Lilly has also established franchises in dermatology, immunology, and oncology that are starting to add meaningfully to growth. Given the company’s proven history of strong commercial execution and one of the highest research and development success rates in the industry, Jennison sees opportunity for continued success. |
| | · | | Social media company Meta Platforms’ results improved in the second half of the period, as advertising revenues proved better than expected, and the company’s cost rationalization (mainly headcount) and focus on better profitability metrics and free cash flows appeared to bear fruit. The business model continues to post solid profit margins and free cash flow metrics. |
| | · | | Enterprise software and cloud computing services provider Microsoft continued to gain share across multiple product lines while having the advantage of being very well positioned for the AI wave as concept transitions into recognized revenue. |
| | · | | Broadcom shares recovered after hitting a low point in October 2022. The company has exhibited consistent earnings growth in the mid-teens, with some key business lines—including semiconductors, networking, and storage—seeing growth exceeding 25% of late. Jennison regards Broadcom as a high-quality, global technology leader. The company provides a dividend yield of 2.8%, which is expected to approach 4% by 2024. |
| · | | One of the largest technology companies in the world. Salesforce is a leader in cloud-based software and other related applications, providing customer relationship management (CRM) software and applications focused on sales, customer service, marketing automation, analytics, and application development. The company reported solid results during the period, indicating strong customer demand for its products. Jennison believes the company will continue to execute on a solid business foundation. |
Strategy and Performance Overview* (continued)
What didn’t work?
| · | | Stock selection within the financials, industrials, and consumer discretionary sectors detracted notably from relative return. |
| · | | An underweight in communication services relative to the Index also detracted. |
| · | | Key negative contributors to relative performance included Bristol-Myers Squibb Co., MetLife Inc., PNC Financial Services Group Inc., Truist Financial Corp., and Chubb Ltd. |
| | · | | Bristol-Myers Squibb is a leader in the development of immuno-oncology, an approach that leverages a patient’s own immune system to attack tumors. The stock declined in the period as investors rotated away from defensive, large pharmaceutical companies lacking significant diabetes/weight loss franchises. Jennison continues to hold the Fund’s position given the company’s attractive earnings trajectory and valuation. |
| | · | | Insurer MetLife (Met) is a recognized global leader in protection planning and retirement and savings solutions, with a presence in more than 40 markets established through organic growth, acquisitions, joint ventures, and other partnerships. Its scale makes it one of the most profitable companies in the insurance space. The company regularly reports solid, high-single-digit earnings growth. While the stock underperformed during the period on concerns regarding the quality of private equity and real estate assets on Met’s books, Jennison does not believe these concerns reflect the long-term quality of the business and its fundamentals. |
| | · | | One of the largest diversified financial services company in the US, PNC Financial Services Group is a well-managed commercial and retail bank with solid capitalization, diversified funding sources, and well-regarded senior leadership and risk management infrastructure. Despite these strengths, shares in the the bank sold off during the period due to industry-wide concerns related to the failures of a few regional banks in March and April 2023. Jennison believes that the sell-off was not merited, as PNC does not have a liquidity issue and mostly gained deposits as depositors left smaller banks. As of the end of the period, the deposit and liquidity concerns have subsided. |
| | · | | Truist Financial, the sixth largest US bank by assets, operates as a financial holding company. Its traditional banking business serves individuals, businesses, and municipalities within several Southeastern and Mid-Atlantic markets. The company also operates nationally through its insurance brokerage, investment banking, mortgage banking, specialty finance, and digital lending verticals. Truist shares were negatively impacted by the regional bank failures mentioned above. In Jennison’s view, the resulting negative sentiment did not reflect Truist’s liquidity and solid fundamentals. Jennison has maintained the Fund’s position. |
| | · | | The largest publicly traded property and casualty company in the world, Chubb provides insurance products in 55 countries, covering property and casualty, accident and health, reinsurance, and life insurance. The company regularly |
| | |
| 16 Visit our website at pgim.com/investments | | |
| | reports earnings growth in the 10% range, and holds over $4 billion in cash on the balance sheet, with dividend increases and ongoing stock buybacks expected over the course of the next year. Pricing trends remain solid, and Chubb’s scale make it one of the highest-quality companies in the space. While the stock gave up earlier gains in the latter part of the period on concerns regarding the quality of private equity and real estate assets on Chubb’s books, Jennison does not believe these concerns reflect the long-term quality of the business and its fundamentals. |
| · | | The most significant positions eliminated from the Fund during the period included oil and gas exploration and production company ConocoPhillips, electric utility Ameren Corp., and clean energy utility NextEra Energy Inc. |
Current outlook
| · | | The US economy stands in better shape than the consensus anticipated when 2023 began. Robust employment has sustained consumer spending at a solid pace. Consumer confidence currently reflects optimism in the near term despite announced workforce reductions, interest rates at the highest levels in over a decade, and reduced credit availability in the financial system. It therefore seems likely that the slope of the economy’s slowing trajectory will remain shallower than previously feared while employment remains healthy. |
| · | | Inflationary pressures, while still evident, will likely continue to moderate. Jennison expects further increases in interest rates, though evidence leans toward the bulk of the rate increases being behind the US for this cycle. |
| · | | Trends in technology spending, which weakened earlier last year, have begun to stabilize. A combination of easing year-over-year comparisons and the priority of digital transformation, with an emerging impetus from AI, increasingly suggest a rebound in spending and a return to longer-term investment trends moving toward year end. The strong rebound in the prices of select technology shares year-to-date reflects both the depressed nature of valuations when 2023 began and the first signs of upgrades to near-and medium-term revenue and profit expectations from company managements—a trend Jennison believes will gather pace in the coming quarters. |
| · | | Jennison expects to see generative AI use cases and applications spread from technology providers and developers to a wide variety of industries and companies that use these tools to increase competitive positioning through improved time to market, streamlined customer service, and accelerated efforts to harness data in increasingly sophisticated ways. |
| · | | Jennison continues to invest in a broadly diversified portfolio of companies that appear best positioned to outpace the market averages in growing revenue, free cash flows, and earnings over the long term. As of August 31, 2023, the Fund’s largest overweight position relative to the Index was in information technology and its largest underweight was in real estate. |
Strategy and Performance Overview* (continued)
*This strategy and performance overview, which discusses what strategies or holdings (including derivatives, if applicable) affected the Fund’s performance, is compiled based on how the Fund performed relative to the Fund’s benchmark index and is viewed for performance attribution purposes at the aggregate Fund level, which in most instances will not directly correlate to the amounts disclosed in the Statement of Operations which conform to US generally accepted accounting principles.
| | |
| 18 Visit our website at pgim.com/investments | | |
Fees and Expenses (unaudited)
As a shareholder of the Fund, you incur ongoing costs, including investment management fees. This example is intended to help you understand your ongoing costs (in dollars) of investing in the Fund and to compare these costs with the ongoing costs of investing in other funds.
The example is based on an investment of $1,000 held through the six-month period ended August 31, 2023. The example is for illustrative purposes only.
Actual Expenses
The first line in the tables on the following page provides information about actual account values and actual expenses. You may use the information on this line, together with the amount you invested, to estimate the expenses that you paid over the period. Simply divide your account value by $1,000 (for example, an $8,600 account value ÷ $1,000 =8.6), then multiply the result by the number on the first line under the heading “Expenses Paid During the Six-Month Period” to estimate the expenses you paid on your account during this period.
Hypothetical Example for Comparison Purposes
The second line in the tables on the following page provides information about hypothetical account values and hypothetical expenses based on the Fund’s actual expense ratio and an assumed rate of return of 5% per year before expenses, which is not the Fund’s actual return. The hypothetical account values and expenses may not be used to estimate the actual ending account balance or expenses you paid for the period. You may use this information to compare the ongoing costs of investing in the Fund and other funds. To do so, compare this 5% hypothetical example with the 5% hypothetical examples that appear in the shareholder reports of the other funds.
Please note that the expenses shown in the tables are meant to highlight your ongoing costs only and do not reflect any transactional costs or brokerage commissions paid on purchases and sales of Fund shares. Therefore, the ending account values and expenses paid for the period are useful in comparing ongoing costs only and will not help you determine the relative total costs of owning different funds. In addition, if these transactional costs were included, your costs would have been higher.
Fees and Expenses (continued)
| | | | | | | | | | | | | | |
| | | | |
PGIM Jennison Focused Growth ETF | | Beginning Account Value March 1, 2023 | | Ending Account Value August 31, 2023 | | | Annualized Expense Ratio Based on the Six-Month Period | | | Expenses Paid
During the Six-Month Period* | |
| | | | |
| Actual | | $1,000.00 | | | $1,267.40 | | | | 0.75% | | | | $4.29 | |
| | | | |
| Hypothetical | | $1,000.00 | | | $1,021.42 | | | | 0.75% | | | | $3.82 | |
| | | | | | | | | | | | | | |
| | | | |
PGIM Jennison Focused Value ETF | | Beginning Account Value March 1, 2023 | | Ending Account Value August 31, 2023 | | | Annualized Expense Ratio Based on the Six-Month Period | | | Expenses Paid
During the Six-Month Period* | |
| | | | |
| Actual | | $1,000.00 | | | $1,102.30 | | | | 0.75% | | | | $3.97 | |
| | | | |
| Hypothetical | | $1,000.00 | | | $1,021.42 | | | | 0.75% | | | | $3.82 | |
*Fund expenses (net of fee waivers or subsidies, if any) are equal to the annualized expense ratio (provided in the table), multiplied by the average account value over the period, multiplied by the 184 days in the six-month period ended August 31, 2023, and divided by the 365 days in the Fund’s fiscal year ended August 31, 2023 (to reflect the six-month period). Expenses presented in the table include the expenses of any underlying portfolios in which each Fund may invest.
| | |
| 20 Visit our website at pgim.com/investments | | |
Glossary
The following abbreviations are used in the Funds’ descriptions:
ADR—American Depositary Receipt
PGIM Jennison Focused Growth ETF
Schedule of Investments
as of August 31, 2023
| | | | | | | | |
| | |
| Description | | Shares | | | Value | |
| | |
LONG-TERM INVESTMENTS 97.8% | | | | | | | | |
| | |
COMMON STOCKS | | | | | | | | |
| | |
Automobile Components 1.1% | | | | | | | | |
Mobileye Global, Inc. (Israel) (Class A Stock)*(a) | | | 17,753 | | | $ | 630,409 | |
| | |
Automobiles 4.9% | | | | | | | | |
Tesla, Inc.* | | | 10,795 | | | | 2,785,974 | |
| | |
Biotechnology 1.3% | | | | | | | | |
Vertex Pharmaceuticals, Inc.* | | | 2,234 | | | | 778,192 | |
| | |
Broadline Retail 11.8% | | | | | | | | |
Amazon.com, Inc.* | | | 32,537 | | | | 4,490,431 | |
MercadoLibre, Inc. (Brazil)* | | | 1,638 | | | | 2,247,926 | |
| | | | | | | | |
| | |
| | | | | | | 6,738,357 | |
| | |
Consumer Staples Distribution & Retail 3.5% | | | | | | | | |
Costco Wholesale Corp. | | | 3,676 | | | | 2,019,153 | |
| | |
Entertainment 2.0% | | | | | | | | |
Netflix, Inc.* | | | 2,637 | | | | 1,143,614 | |
| | |
Financial Services 5.3% | | | | | | | | |
Mastercard, Inc. (Class A Stock) | | | 7,359 | | | | 3,036,618 | |
| | |
Health Care Equipment & Supplies 1.7% | | | | | | | | |
Dexcom, Inc.* | | | 3,972 | | | | 401,092 | |
Intuitive Surgical, Inc.* | | | 1,948 | | | | 609,101 | |
| | | | | | | | |
| | |
| | | | | | | 1,010,193 | |
| | |
Health Care Providers & Services 1.0% | | | | | | | | |
UnitedHealth Group, Inc. | | | 1,193 | | | | 568,560 | |
| | |
Hotels, Restaurants & Leisure 1.6% | | | | | | | | |
Airbnb, Inc. (Class A Stock)* | | | 6,835 | | | | 899,144 | |
| | |
Interactive Media & Services 8.5% | | | | | | | | |
Alphabet, Inc. (Class A Stock)* | | | 19,316 | | | | 2,630,260 | |
Meta Platforms, Inc. (Class A Stock)* | | | 7,498 | | | | 2,218,583 | |
| | | | | | | | |
| | |
| | | | | | | 4,848,843 | |
| | |
| See Notes to Financial Statements. | | |
22 | | |
PGIM Jennison Focused Growth ETF
Schedule of Investments (continued)
as of August 31, 2023
| | | | | | | | |
| | |
| Description | | Shares | | | Value | |
| | |
COMMON STOCKS (Continued) | | | | | | | | |
| | |
IT Services 2.2% | | | | | | | | |
MongoDB, Inc.* | | | 1,360 | | | $ | 518,568 | |
Snowflake, Inc. (Class A Stock)* | | | 4,733 | | | | 742,371 | |
| | | | | | | | |
| | |
| | | | | | | 1,260,939 | |
| | |
Personal Care Products 2.1% | | | | | | | | |
L’Oreal SA (France), ADR | | | 13,535 | | | | 1,189,185 | |
| | |
Pharmaceuticals 8.1% | | | | | | | | |
AstraZeneca PLC (United Kingdom), ADR | | | 11,433 | | | | 775,386 | |
Eli Lilly & Co. | | | 4,333 | | | | 2,401,349 | |
Novo Nordisk A/S (Denmark), ADR | | | 7,726 | | | | 1,434,100 | |
| | | | | | | | |
| | |
| | | | | | | 4,610,835 | |
| | |
Semiconductors & Semiconductor Equipment 16.5% | | | | | | | | |
Advanced Micro Devices, Inc.* | | | 19,123 | | | | 2,021,683 | |
ASML Holding NV (Netherlands) | | | 1,756 | | | | 1,159,891 | |
NVIDIA Corp. | | | 12,642 | | | | 6,239,459 | |
| | | | | | | | |
| | |
| | | | | | | 9,421,033 | |
| | |
Software 13.2% | | | | | | | | |
Cadence Design Systems, Inc.* | | | 5,501 | | | | 1,322,660 | |
Crowdstrike Holdings, Inc. (Class A Stock)* | | | 2,333 | | | | 380,349 | |
Microsoft Corp. | | | 15,894 | | | | 5,209,418 | |
Palo Alto Networks, Inc.* | | | 2,670 | | | | 649,611 | |
| | | | | | | | |
| | |
| | | | | | | 7,562,038 | |
| | |
Technology Hardware, Storage & Peripherals 6.2% | | | | | | | | |
Apple, Inc. | | | 18,768 | | | | 3,525,944 | |
| | |
Textiles, Apparel & Luxury Goods 6.8% | | | | | | | | |
Lululemon Athletica, Inc.* | | | 3,887 | | | | 1,481,958 | |
See Notes to Financial Statements.
PGIM Jennison ETFs 23
PGIM Jennison Focused Growth ETF
Schedule of Investments (continued)
as of August 31, 2023
| | | | | | | | |
| | |
| Description | | Shares | | | Value | |
| | |
COMMON STOCKS (Continued) | | | | | | | | |
| | |
Textiles, Apparel & Luxury Goods (cont’d.) | | | | | | | | |
LVMH Moet Hennessy Louis Vuitton SE (France), ADR | | | 11,139 | | | $ | 1,885,610 | |
NIKE, Inc. (Class B Stock) | | | 5,047 | | | | 513,330 | |
| | | | | | | | |
| | |
| | | | | | | 3,880,898 | |
| | | | | | | | |
| | |
TOTAL LONG-TERM INVESTMENTS
(cost $42,570,206) | | | | | | | 55,909,929 | |
| | | | | | | | |
| | |
SHORT-TERM INVESTMENTS 2.8% | | | | | | | | |
| | |
AFFILIATED MUTUAL FUNDS | | | | | | | | |
PGIM Core Government Money Market Fund(wi) | | | 1,218,101 | | | | 1,218,101 | |
PGIM Institutional Money Market Fund
(cost $343,553; includes $341,864 of cash collateral for securities on loan)(b)(wi) | | | 343,766 | | | | 343,559 | |
| | | | | | | | |
| | |
TOTAL SHORT-TERM INVESTMENTS
(cost $1,561,654) | | | | | | | 1,561,660 | |
| | | | | | | | |
| | |
TOTAL INVESTMENTS 100.6%
(cost $44,131,860) | | | | | | | 57,471,589 | |
Liabilities in excess of other assets (0.6)% | | | | | | | (321,953 | ) |
| | | | | | | | |
| | |
NET ASSETS 100.0% | | | | | | $ | 57,149,636 | |
| | | | | | | | |
See the Glossary for a list of the abbreviation(s) used in the annual report.
| * | Non-income producing security. |
| (a) | All or a portion of security is on loan. The aggregate market value of such securities, including those sold and pending settlement, is $342,139; cash collateral of $341,864 (included in liabilities) was received with which the Fund purchased highly liquid short-term investments. In the event of significant appreciation in value of securities on loan on the last business day of the reporting period, the Fund may reflect a collateral value that is less than the market value of the loaned securities and such shortfall is remedied the following business day. |
| (b) | Represents security, or portion thereof, purchased with cash collateral received for securities on loan and includes dividend reinvestment. |
| (wi) | PGIM Investments LLC, the manager of the Fund, also serves as manager of the PGIM Core Government Money Market Fund and PGIM Institutional Money Market Fund, if applicable. |
| | |
| See Notes to Financial Statements. | | |
24 | | |
PGIM Jennison Focused Growth ETF
Schedule of Investments (continued)
as of August 31, 2023
Fair Value Measurements:
Various inputs are used in determining the value of the Fund’s investments. These inputs are summarized in the three broad levels listed below.
Level 1—unadjusted quoted prices generally in active markets for identical securities.
Level 2—quoted prices for similar securities, interest rates and yield curves, prepayment speeds, foreign currency exchange rates and other observable inputs.
Level 3—unobservable inputs for securities valued in accordance with Board approved fair valuation procedures.
The following is a summary of the inputs used as of August 31, 2023 in valuing such portfolio securities:
| | | | | | | | | | | | | | | | | | | | | | | | | | | | | | | | | | | |
| | | Level 1 | | Level 2 | | Level 3 |
Investments in Securities | | | | | | | | | | | | | | | | | | | | | | | | | | | | | | | | | | | |
Assets | | | | | | | | | | | | | | | | | | | | | | | | | | | | | | | | | | | |
Long-Term Investments | | | | | | | | | | | | | | | | | | | | | | | | | | | | | | | | | | | |
Common Stocks | | | | | | | | | | | | | | | | | | | | | | | | | | | | | | | | | | | |
Automobile Components | | | $ | 630,409 | | | | | | | | | $ | — | | | | | | | | | | | | | | $ | — | | | | | | |
Automobiles | | | | 2,785,974 | | | | | | | �� | | | — | | | | | | | | | | | | | | | — | | | | | | |
Biotechnology | | | | 778,192 | | | | | | | | | | — | | | | | | | | | | | | | | | — | | | | | | |
Broadline Retail | | | | 6,738,357 | | | | | | | | | | — | | | | | | | | | | | | | | | — | | | | | | |
Consumer Staples Distribution & Retail | | | | 2,019,153 | | | | | | | | | | — | | | | | | | | | | | | | | | — | | | | | | |
Entertainment | | | | 1,143,614 | | | | | | | | | | — | | | | | | | | | | | | | | | — | | | | | | |
Financial Services | | | | 3,036,618 | | | | | | | | | | — | | | | | | | | | | | | | | | — | | | | | | |
Health Care Equipment & Supplies | | | | 1,010,193 | | | | | | | | | | — | | | | | | | | | | | | | | | — | | | | | | |
Health Care Providers & Services | | | | 568,560 | | | | | | | | | | — | | | | | | | | | | | | | | | — | | | | | | |
Hotels, Restaurants & Leisure | | | | 899,144 | | | | | | | | | | — | | | | | | | | | | | | | | | — | | | | | | |
Interactive Media & Services | | | | 4,848,843 | | | | | | | | | | — | | | | | | | | | | | | | | | — | | | | | | |
IT Services | | | | 1,260,939 | | | | | | | | | | — | | | | | | | | | | | | | | | — | | | | | | |
Personal Care Products | | | | 1,189,185 | | | | | | | | | | — | | | | | | | | | | | | | | | — | | | | | | |
Pharmaceuticals | | | | 4,610,835 | | | | | | | | | | — | | | | | | | | | | | | | | | — | | | | | | |
Semiconductors & Semiconductor Equipment | | | | 9,421,033 | | | | | | | | | | — | | | | | | | | | | | | | | | — | | | | | | |
Software | | | | 7,562,038 | | | | | | | | | | — | | | | | | | | | | | | | | | — | | | | | | |
Technology Hardware, Storage & Peripherals | | | | 3,525,944 | | | | | | | | | | — | | | | | | | | | | | | | | | — | | | | | | |
Textiles, Apparel & Luxury Goods | | | | 3,880,898 | | | | | | | | | | — | | | | | | | | | | | | | | | — | | | | | | |
Short-Term Investments | | | | | | | | | | | | | | | | | | | | | | | | | | | | | | | | | | | |
Affiliated Mutual Funds | | | | 1,561,660 | | | | | | | | | | — | | | | | | | | | | | | | | | — | | | | | | |
| | | | | | | | | | | | | | | | | | | | | | | | | | | | | | | | | | | |
Total | | | $ | 57,471,589 | | | | | | | | | $ | — | | | | | | | | | | | | | | $ | — | | | | | | |
| | | | | | | | | | | | | | | |
See Notes to Financial Statements.
PGIM Jennison ETFs 25
PGIM Jennison Focused Growth ETF
Schedule of Investments (continued)
as of August 31, 2023
Industry Classification:
The industry classification of investments and liabilities in excess of other assets shown as a percentage of net assets as of August 31, 2023 were as follows:
| | | | |
Semiconductors & Semiconductor Equipment | | | 16.5 | % |
Software | | | 13.2 | |
Broadline Retail | | | 11.8 | |
Interactive Media & Services | | | 8.5 | |
Pharmaceuticals | | | 8.1 | |
Textiles, Apparel & Luxury Goods | | | 6.8 | |
Technology Hardware, Storage & Peripherals | | | 6.2 | |
Financial Services | | | 5.3 | |
Automobiles | | | 4.9 | |
Consumer Staples Distribution & Retail | | | 3.5 | |
Affiliated Mutual Funds (0.6% represents investments purchased with collateral from securities on loan) | | | 2.8 | |
IT Services | | | 2.2 | |
| | | | |
Personal Care Products | | | 2.1 | % |
Entertainment | | | 2.0 | |
Health Care Equipment & Supplies | | | 1.7 | |
Hotels, Restaurants & Leisure | | | 1.6 | |
Biotechnology | | | 1.3 | |
Automobile Components | | | 1.1 | |
Health Care Providers & Services | | | 1.0 | |
| | | | |
| | | 100.6 | |
Liabilities in excess of other assets | | | (0.6 | ) |
| | | | |
| |
| | | 100.0 | % |
| | | | |
Financial Instruments/Transactions—Summary of Offsetting and Netting Arrangements:
The Fund entered into financial instruments/transactions during the reporting period that are either offset in accordance with current requirements or are subject to enforceable master netting arrangements or similar agreements that permit offsetting. The information about offsetting and related netting arrangements for financial instruments/transactions where the legal right to set-off exists is presented in the summary below.
Offsetting of financial instrument/transaction assets and liabilities:
| | | | | | |
| Description | | Gross Market Value of Recognized Assets/(Liabilities) | | Collateral Pledged/(Received)(1) | | Net Amount |
Securities on Loan | | $342,139 | | $(341,864) | | $275 |
| (1) | Collateral amount disclosed by the Fund is limited to the market value of financial instruments/transactions. |
| | |
| See Notes to Financial Statements. | | |
26 | | |
PGIM Jennison Focused Growth ETF
Statement of Assets & Liabilities
as of August 31, 2023
| | | | | | |
| |
Assets | | | |
| | |
Investments at value, including securities on loan of $342,139: | | | | | | |
Unaffiliated investments (cost $42,570,206) | | $ | 55,909,929 | | | |
Affiliated investments (cost $1,561,654) | | | 1,561,660 | | | |
| | |
Dividends receivable | | | 30,100 | | | |
Receivable for investments sold | | | 20,601 | | | |
Tax reclaim receivable | | | 6,459 | | | |
| | | | | | |
| | |
Total Assets | | | 57,528,749 | | | |
| | | | | | |
| |
Liabilities | | | |
Payable to broker for collateral for securities on loan | | | 341,864 | | | |
Management fee payable | | | 35,445 | | | |
Other liabilities | | | 1,804 | | | |
| | | | | | |
| | |
Total Liabilities | | | 379,113 | | | |
| | | | | | |
| | |
Net Assets | | $ | 57,149,636 | | | |
| | | | | | |
| | |
| | | | | | | |
| | |
Net assets were comprised of: | | | | | | |
Common stock, at par | | $ | 870 | | | |
Paid-in capital in excess of par | | | 44,415,501 | | | |
Total distributable earnings (loss) | | | 12,733,265 | | | |
| | | | | | |
| | |
Net assets, August 31, 2023 | | $ | 57,149,636 | | | |
| | | | | | |
| | |
Net asset value, offering price and redemption price per share.
($57,149,636 ÷ 870,000 shares of common stock issued and outstanding) | | $ | 65.69 | | | |
| | | | | | |
See Notes to Financial Statements.
PGIM Jennison ETFs 27
PGIM Jennison Focused Growth ETF
Statement of Operations
For the Period December 12, 2022* through August 31, 2023
| | | | |
Net Investment Income (Loss) | | | | |
Income | | | | |
Unaffiliated dividend income (net of $10,800 foreign withholding tax) | | $ | 167,583 | |
Affiliated dividend income | | | 16,708 | |
Income from securities lending, net (including affiliated income of $5,633) | | | 6,826 | |
| | | | |
Total income | | | 191,117 | |
| | | | |
| |
Expenses | | | | |
Management fee | | | 238,614 | |
| | | | |
Net investment income (loss) | | | (47,497 | ) |
| | | | |
| |
Realized And Unrealized Gain (Loss) On Investments | | | | |
Net realized gain (loss) on: | | | | |
Investment transactions (including affiliated of $(179)) | | | (561,315 | ) |
In-kind redemptions | | | 763,711 | |
| | | | |
| | | 202,396 | |
| | | | |
Net change in unrealized appreciation (depreciation) on investments (including affiliated of $6) | | | 13,339,729 | |
| | | | |
Net gain (loss) on investment transactions | | | 13,542,125 | |
| | | | |
Net Increase (Decrease) In Net Assets Resulting From Operations | | $ | 13,494,628 | |
| | | | |
| * | Commencement of operations. |
| | |
| See Notes to Financial Statements. | | |
28 | | |
PGIM Jennison Focused Growth ETF
Statement of Changes in Net Assets
| | | | | | | | | | | | |
| |
| | | December 12, 2022*
through
August 31, 2023 | |
| | | |
Increase (Decrease) in Net Assets | | | | | | | | | | | | |
Operations | | | | | | | | | | | | |
Net investment income (loss) | | | | | | $ | (47,497 | ) | | | | |
Net realized gain (loss) on investment and in-kind redemptions transactions | | | | | | | 202,396 | | | | | |
Net change in unrealized appreciation (depreciation) on investments | | | | | | | 13,339,729 | | | | | |
| | | | | | | | | | | | |
Net increase (decrease) in net assets resulting from operations | | | | | | | 13,494,628 | | | | | |
| | | | | | | | | | | | |
| | | |
Fund share transactions | | | | | | | | | | | | |
Net proceeds from shares sold (200,000 shares) | | | | | | | 10,005,000 | | | | | |
Shares sold in-kind (750,000 shares) | | | | | | | 38,676,326 | | | | | |
Shares redeemed in-kind (80,000 shares) | | | | | | | (5,026,318 | ) | | | | |
| | | | | | | | | | | | |
| | | |
Net increase (decrease) in net assets from Fund share transactions | | | | | | | 43,655,008 | | | | | |
| | | | | | | | | | | | |
Total increase (decrease) | | | | | | | 57,149,636 | | | | | |
| | | |
Net Assets: | | | | | | | | | | | | |
Beginning of period | | | | | | | — | | | | | |
| | | | | | | | | | | | |
End of period | | | | | | $ | 57,149,636 | | | | | |
| | | | | | | | | | | | |
| * | Commencement of operations. |
See Notes to Financial Statements.
PGIM Jennison ETFs 29
PGIM Jennison Focused Growth ETF
Financial Highlights
| | | | | | | | |
| | | |
| | | | | | | |
| | | December 12, 2022(a) | | | | |
| | | through August 31, | | | | |
| | | 2023 | | | | |
| | | |
| Per Share Operating Performance(b): | | | | | | | | |
| Net Asset Value, Beginning of Period | | | $50.00 | | | | | |
| Income (loss) from investment operations: | | | | | | | | |
| Net investment income (loss) | | | (0.06) | | | | | |
| Net realized and unrealized gain (loss) on investment transactions | | | 15.75 | | | | | |
| Total from investment operations | | | 15.69 | | | | | |
| Net asset value, end of period | | | $65.69 | | | | | |
| Total Return(c): | | | 31.38% | | | | | |
| | | | | | | | | |
| Ratios/Supplemental Data: | | | | | | | | |
| Net assets, end of period (000) | | | $57,150 | | | | | |
| Average net assets (000) | | | $44,323 | | | | | |
| Ratios to average net assets(d): | | | | | | | | |
| Expenses after waivers and/or expense reimbursement | | | 0.75%(e) | | | | | |
| Expenses before waivers and/or expense reimbursement | | | 0.75%(e) | | | | | |
| Net investment income (loss) | | | (0.15)%(e) | | | | | |
| Portfolio turnover rate(f) | | | 32% | | | | | |
| (a) | Commencement of operations. |
| (b) | Calculated based on average shares outstanding during the period. |
| (c) | Total return is calculated assuming a purchase of a share on the first day and a sale on the last day of each period reported and includes reinvestment of dividends and distributions, if any. Total returns may reflect adjustments to conform to GAAP. Total returns for periods less than one full year are not annualized. |
| (d) | Does not include expenses of the underlying funds in which the Fund invests. |
| (f) | The Fund’s portfolio turnover rate is calculated in accordance with regulatory requirements, without regard to transactions involving short-term investments, certain derivatives and in-kind transactions (if any). If such transactions were included, the Fund’s portfolio turnover rate may be higher. |
| | |
| See Notes to Financial Statements. | | |
30 | | |
PGIM Jennison Focused Value ETF
Schedule of Investments
as of August 31, 2023
| | | | | | | | |
| | |
| Description | | Shares | | | Value | |
| | |
LONG-TERM INVESTMENTS 97.8% | | | | | | | | |
| | |
COMMON STOCKS | | | | | | | | |
| | |
Aerospace & Defense 3.1% | | | | | | | | |
Airbus SE (France), ADR | | | 9,619 | | | $ | 352,729 | |
| | |
Automobile Components 1.6% | | | | | | | | |
Aptiv PLC* | | | 1,741 | | | | 176,624 | |
| | |
Automobiles 1.6% | | | | | | | | |
General Motors Co. | | | 5,458 | | | | 182,898 | |
| | |
Banks 9.5% | | | | | | | | |
Bank of America Corp. | | | 8,670 | | | | 248,569 | |
JPMorgan Chase & Co. | | | 2,916 | | | | 426,698 | |
PNC Financial Services Group, Inc. (The) | | | 1,556 | | | | 187,856 | |
Truist Financial Corp. | | | 6,710 | | | | 204,991 | |
| | | | | | | | |
| | |
| | | | | | | 1,068,114 | |
| | |
Biotechnology 2.6% | | | | | | | | |
AbbVie, Inc. | | | 1,962 | | | | 288,336 | |
| | |
Building Products 2.5% | | | | | | | | |
Johnson Controls International PLC | | | 4,708 | | | | 278,054 | |
| | |
Capital Markets 4.4% | | | | | | | | |
Blackstone, Inc. | | | 1,710 | | | | 181,893 | |
Goldman Sachs Group, Inc. (The) | | | 965 | | | | 316,240 | |
| | | | | | | | |
| | |
| | | | | | | 498,133 | |
| | |
Chemicals 4.1% | | | | | | | | |
Linde PLC | | | 1,208 | | | | 467,544 | |
| | |
Consumer Staples Distribution & Retail 5.9% | | | | | | | | |
Walmart, Inc. | | | 4,074 | | | | 662,473 | |
| | |
Electric Utilities 2.0% | | | | | | | | |
PG&E Corp.* | | | 13,499 | | | | 220,034 | |
| | |
Energy Equipment & Services 3.6% | | | | | | | | |
Schlumberger NV | | | 6,966 | | | | 410,715 | |
See Notes to Financial Statements.
PGIM Jennison ETFs 31
PGIM Jennison Focused Value ETF
Schedule of Investments (continued)
as of August 31, 2023
| | | | | | | | |
| | |
| Description | | Shares | | | Value | |
| | |
COMMON STOCKS (Continued) | | | | | | | | |
| | |
Ground Transportation 3.6% | | | | | | | | |
Union Pacific Corp. | | | 1,834 | | | $ | 404,525 | |
| | |
Hotels, Restaurants & Leisure 2.7% | | | | | | | | |
McDonald’s Corp. | | | 1,066 | | | | 299,706 | |
| | |
Industrial Conglomerates 1.5% | | | | | | | | |
General Electric Co. | | | 1,522 | | | | 174,208 | |
| | |
Insurance 7.7% | | | | | | | | |
Chubb Ltd. | | | 2,372 | | | | 476,464 | |
MetLife, Inc. | | | 6,275 | | | | 397,458 | |
| | | | | | | | |
| | |
| | | | | | | 873,922 | |
| | |
Interactive Media & Services 4.8% | | | | | | | | |
Alphabet, Inc. (Class A Stock)* | | | 1,340 | | | | 182,468 | |
Meta Platforms, Inc. (Class A Stock)* | | | 1,227 | | | | 363,057 | |
| | | | | | | | |
| | |
| | | | | | | 545,525 | |
| | |
Machinery 0.7% | | | | | | | | |
Deere & Co. | | | 198 | | | | 81,366 | |
| | |
Multi-Utilities 1.7% | | | | | | | | |
CenterPoint Energy, Inc. | | | 6,914 | | | | 192,831 | |
| | |
Oil, Gas & Consumable Fuels 5.6% | | | | | | | | |
Hess Corp. | | | 4,094 | | | | 632,523 | |
| | |
Pharmaceuticals 12.0% | | | | | | | | |
AstraZeneca PLC (United Kingdom), ADR | | | 7,024 | | | | 476,368 | |
Bristol-Myers Squibb Co. | | | 5,214 | | | | 321,443 | |
Eli Lilly & Co. | | | 1,004 | | | | 556,417 | |
| | | | | | | | |
| | |
| | | | | | | 1,354,228 | |
| | |
Semiconductors & Semiconductor Equipment 8.0% | | | | | | | | |
Advanced Micro Devices, Inc.* | | | 1,633 | | | | 172,641 | |
Broadcom, Inc. | | | 336 | | | | 310,091 | |
| | |
| See Notes to Financial Statements. | | |
32 | | |
PGIM Jennison Focused Value ETF
Schedule of Investments (continued)
as of August 31, 2023
| | | | | | | | |
| | |
| Description | | Shares | | | Value | |
| | |
COMMON STOCKS (Continued) | | | | | | | | |
| | |
Semiconductors & Semiconductor Equipment (cont’d.) | | | | | | | | |
Lam Research Corp. | | | 301 | | | $ | 211,422 | |
NXP Semiconductors NV (China) | | | 998 | | | | 205,309 | |
| | | | | | | | |
| | |
| | | | | | | 899,463 | |
| | |
Software 6.4% | | | | | | | | |
Microsoft Corp. | | | 1,405 | | | | 460,503 | |
Salesforce, Inc.* | | | 1,201 | | | | 265,973 | |
| | | | | | | | |
| | |
| | | | | | | 726,476 | |
| | |
Technology Hardware, Storage & Peripherals 2.2% | | | | | | | | |
Dell Technologies, Inc. (Class C Stock) | | | 4,459 | | | | 250,774 | |
| | | | | | | | |
| | |
TOTAL LONG-TERM INVESTMENTS
(cost $10,313,278) | | | | | | | 11,041,201 | |
| | | | | | | | |
| | |
SHORT-TERM INVESTMENT 2.0% | | | | | | | | |
| | |
AFFILIATED MUTUAL FUND | | | | | | | | |
PGIM Core Government Money Market Fund
(cost $229,067)(wj) | | | 229,067 | | | | 229,067 | |
| | | | | | | | |
| | |
TOTAL INVESTMENTS 99.8%
(cost $10,542,345) | | | | | | | 11,270,268 | |
Other assets in excess of liabilities 0.2% | | | | | | | 18,496 | |
| | | | | | | | |
| | |
NET ASSETS 100.0% | | | | | | $ | 11,288,764 | |
| | | | | | | | |
See the Glossary for a list of the abbreviation(s) used in the annual report.
| * | Non-income producing security. |
| (wj) | PGIM Investments LLC, the manager of the Fund, also serves as manager of the PGIM Core Government Money Market Fund. |
Fair Value Measurements:
Various inputs are used in determining the value of the Fund’s investments. These inputs are summarized in the three broad levels listed below.
Level 1—unadjusted quoted prices generally in active markets for identical securities.
Level 2—quoted prices for similar securities, interest rates and yield curves, prepayment speeds, foreign currency exchange rates and other observable inputs.
| | |
| | See Notes to Financial Statements. |
| | PGIM Jennison ETFs 33 |
PGIM Jennison Focused Value ETF
Schedule of Investments (continued)
as of August 31, 2023
Level 3—unobservable inputs for securities valued in accordance with Board approved fair valuation procedures.
The following is a summary of the inputs used as of August 31, 2023 in valuing such portfolio securities:
| | | | | | | | | | | | | | | | | | | | | | | | | | | | |
| | | Level 1 | | | Level 2 | | | Level 3 | |
Investments in Securities | | | | | | | | | | | | | | | | | | | | | | | | | | | | |
Assets | | | | | | | | | | | | | | | | | | | | | | | | | | | | |
Long-Term Investments | | | | | | | | | | | | | | | | | | | | | | | | | | | | |
Common Stocks | | | | | | | | | | | | | | | | | | | | | | | | | | | | |
Aerospace & Defense | | $ | 352,729 | | | | | | | $ | — | | | | | | | | | | | $ | — | | | | | |
Automobile Components | | | 176,624 | | | | | | | | — | | | | | | | | | | | | — | | | | | |
Automobiles | | | 182,898 | | | | | | | | — | | | | | | | | | | | | — | | | | | |
Banks | | | 1,068,114 | | | | | | | | — | | | | | | | | | | | | — | | | | | |
Biotechnology | | | 288,336 | | | | | | | | — | | | | | | | | | | | | — | | | | | |
Building Products | | | 278,054 | | | | | | | | — | | | | | | | | | | | | — | | | | | |
Capital Markets | | | 498,133 | | | | | | | | — | | | | | | | | | | | | — | | | | | |
Chemicals | | | 467,544 | | | | | | | | — | | | | | | | | | | | | — | | | | | |
Consumer Staples Distribution & Retail | | | 662,473 | | | | | | | | — | | | | | | | | | | | | — | | | | | |
Electric Utilities | | | 220,034 | | | | | | | | — | | | | | | | | | | | | — | | | | | |
Energy Equipment & Services | | | 410,715 | | | | | | | | — | | | | | | | | | | | | — | | | | | |
Ground Transportation | | | 404,525 | | | | | | | | — | | | | | | | | | | | | — | | | | | |
Hotels, Restaurants & Leisure | | | 299,706 | | | | | | | | — | | | | | | | | | | | | — | | | | | |
Industrial Conglomerates | | | 174,208 | | | | | | | | — | | | | | | | | | | | | — | | | | | |
Insurance | | | 873,922 | | | | | | | | — | | | | | | | | | | | | — | | | | | |
Interactive Media & Services | | | 545,525 | | | | | | | | — | | | | | | | | | | | | — | | | | | |
Machinery | | | 81,366 | | | | | | | | — | | | | | | | | | | | | — | | | | | |
Multi-Utilities. | | | 192,831 | | | | | | | | — | | | | | | | | | | | | — | | | | | |
Oil, Gas & Consumable Fuels | | | 632,523 | | | | | | | | — | | | | | | | | | | | | — | | | | | |
Pharmaceuticals | | | 1,354,228 | | | | | | | | — | | | | | | | | | | | | — | | | | | |
Semiconductors & Semiconductor Equipment | | | 899,463 | | | | | | | | — | | | | | | | | | | | | — | | | | | |
Software | | | 726,476 | | | | | | | | — | | | | | | | | | | | | — | | | | | |
Technology Hardware, Storage & Peripherals | | | 250,774 | | | | | | | | — | | | | | | | | | | | | — | | | | | |
Short-Term Investment | | | | | | | | | | | | | | | | | | | | | | | | | | | | |
Affiliated Mutual Fund | | | 229,067 | | | | | | | | — | | | | | | | | | | | | — | | | | | |
| | | | | | | | | | | | | | | | | | | | | | | | | | | | |
Total | | $ | 11,270,268 | | | | | | | $ | — | | | | | | | | | | | $ | — | | | | | |
| | | | | | | | | | | | |
Industry Classification:
The industry classification of investments and other assets in excess of liabilities shown as a percentage of net assets as of August 31, 2023 were as follows:
| | | | |
Pharmaceuticals | | | 12.0 | % |
Banks | | | 9.5 | |
Semiconductors & Semiconductor Equipment | | | 8.0 | |
Insurance | | | 7.7 | |
Software | | | 6.4 | |
| | | | |
Consumer Staples Distribution & Retail | | | 5.9 | % |
Oil, Gas & Consumable Fuels | | | 5.6 | |
Interactive Media & Services | | | 4.8 | |
Capital Markets | | | 4.4 | |
Chemicals | | | 4.1 | |
| | |
| See Notes to Financial Statements. | | |
34 | | |
PGIM Jennison Focused Value ETF
Schedule of Investments (continued)
as of August 31, 2023
Industry Classification (continued):
| | | | |
Energy Equipment & Services | | | 3.6 | % |
Ground Transportation | | | 3.6 | |
Aerospace & Defense | | | 3.1 | |
Hotels, Restaurants & Leisure | | | 2.7 | |
Biotechnology | | | 2.6 | |
Building Products | | | 2.5 | |
Technology Hardware, Storage & Peripherals | | | 2.2 | |
Affiliated Mutual Fund | | | 2.0 | |
Electric Utilities | | | 2.0 | |
Multi-Utilities | | | 1.7 | |
| | | | |
Automobiles | | | 1.6 | % |
Automobile Components | | | 1.6 | |
Industrial Conglomerates | | | 1.5 | |
Machinery | | | 0.7 | |
| | | | |
| | | 99.8 | |
Other assets in excess of liabilities | | | 0.2 | |
| | | | |
| |
| | | 100.0 | % |
| | | | |
| | |
| | See Notes to Financial Statements. |
| | PGIM Jennison ETFs 35 |
PGIM Jennison Focused Value ETF
Statement of Assets & Liabilities
as of August 31, 2023
| | | | | | |
| | |
Assets | | | | | | |
| | |
Investments at value: | | | | | | |
Unaffiliated investments (cost $10,313,278) | | $ | 11,041,201 | | | |
Affiliated investments (cost $229,067) | | | 229,067 | | | |
Dividends receivable | | | 25,664 | | | |
| | | | | | |
| | |
Total Assets | | | 11,295,932 | | | |
| | | | | | |
| | |
Liabilities | | | | | | |
| | |
Management fee payable | | | 7,168 | | | |
| | | | | | |
| | |
Net Assets | | $ | 11,288,764 | | | |
| | | | | | |
| | |
| | | | | | | |
| | |
Net assets were comprised of: | | | | | | |
Common stock, at par | | $ | 210 | | | |
Paid-in capital in excess of par | | | 10,578,364 | | | |
Total distributable earnings (loss) | | | 710,190 | | | |
| | | | | | |
| | |
Net assets, August 31, 2023 | | $ | 11,288,764 | | | |
| | | | | | |
| | |
Net asset value, offering price and redemption price per share, ($11,288,764 ÷ 210,000 shares of common stock issued and outstanding) | | $ | 53.76 | | | |
| | | | | | |
| | |
| See Notes to Financial Statements. | | |
36 | | |
PGIM Jennison Focused Value ETF
Statement of Operations
For the Period December 12, 2022* through August 31, 2023
| | | | |
Net Investment Income (Loss) | | | | |
Income | | | | |
Unaffiliated dividend income (net of $ 1,175 foreign withholding tax) | | $ | 170,146 | |
Affiliated dividend income | | | 5,334 | |
| | | | |
Total income | | | 175,480 | |
| | | | |
| |
Expenses | | | | |
Management fee | | | 56,993 | |
| | | | |
Net investment income (loss) | | | 118,487 | |
| | | | |
| |
Realized And Unrealized Gain (Loss) On Investments | | | | |
Net realized gain (loss) on: | | | | |
Investment transactions | | | (123,811 | ) |
In-kind redemptions | | | 93,221 | |
| | | | |
| | | (30,590 | ) |
| | | | |
Net change in unrealized appreciation (depreciation) on investments | | | 727,923 | |
| | | | |
Net gain (loss) on investment transactions | | | 697,333 | |
| | | | |
Net Increase (Decrease) In Net Assets Resulting From Operations | | $ | 815,820 | |
| | | | |
| * | Commencement of operations. |
| | |
| | See Notes to Financial Statements. |
| | PGIM Jennison ETFs 37 |
PGIM Jennison Focused Value ETF
Statement of Changes in Net Assets
| | | | | |
| |
| | | December 12, 2022*
through
August 31, 2023 |
| |
Increase (Decrease) in Net Assets | | | | | |
Operations | | | | | |
| |
Net investment income (loss) | | | $ | 118,487 | |
Net realized gain (loss) on investment and in-kind redemptions transactions | | | | (30,590 | ) |
Net change in unrealized appreciation (depreciation) on investments | | | | 727,923 | |
| | | | | |
Net increase (decrease) in net assets resulting from operations | | | | 815,820 | |
| | | | | |
| |
Dividends and Distributions | | | | | |
Distributions from distributable earnings | | | | (12,409 | ) |
| | | | | |
| |
Fund share transactions | | | | | |
Net proceeds from shares sold (200,000 shares) | | | | 10,005,000 | |
Shares sold in-kind (20,000 shares) | | | | 995,683 | |
Shares redeemed in-kind (10,000 shares) | | | | (515,330 | ) |
| | | | | |
Net increase (decrease) in net assets from Fund share transactions | | | | 10,485,353 | |
| | | | | |
Total increase (decrease) | | | | 11,288,764 | |
| |
Net Assets: | | | | | |
Beginning of period | | | | — | |
| | | | | |
End of period | | | $ | 11,288,764 | |
| | | | | |
| * | Commencement of operations. |
| | |
| See Notes to Financial Statements. | | |
38 | | |
PGIM Jennison Focused Value ETF
Financial Highlights
| | | | | | | |
| | | |
| | | | | |
| | | December 12, 2022(a)
through August 31,
2023 | | |
| | | |
Per Share Operating Performance(b): | | | | | | | |
Net Asset Value, Beginning of Period | | | | $50.00 | | | |
Income (loss) from investment operations: | | | | | | | |
Net investment income (loss) | | | | 0.56 | | | |
Net realized and unrealized gain (loss) on investment transactions | | | | 3.26 | | | |
Total from investment operations | | | | 3.82 | | | |
Less Dividends and Distributions: | | | | | | | |
Dividends from net investment income | | | | (0.06 | ) | | |
Net asset value, end of period | | | | $53.76 | | | |
Total Return(c): | | | | 7.64 | % | | |
| | | | | | | |
Ratios/Supplemental Data: | | | | | | | |
Net assets, end of period (000) | | | | $11,289 | | | |
Average net assets (000) | | | | $10,586 | | | |
Ratios to average net assets(d): | | | | | | | |
Expenses after waivers and/or expense reimbursement | | | | 0.75 | %(e) | | |
Expenses before waivers and/or expense reimbursement | | | | 0.75 | %(e) | | |
Net investment income (loss) | | | | 1.56 | %(e) | | |
Portfolio turnover rate(f) | | | | 38 | % | | |
| (a) | Commencement of operations. |
| (b) | Calculated based on average shares outstanding during the period. |
| (c) | Total return is calculated assuming a purchase of a share on the first day and a sale on the last day of each period reported and includes reinvestment of dividends and distributions, if any. Total returns may reflect adjustments to conform to GAAP. Total returns for periods less than one full year are not annualized. |
| (d) | Does not include expenses of the underlying funds in which the Fund invests. |
| (f) | The Fund’s portfolio turnover rate is calculated in accordance with regulatory requirements, without regard to transactions involving short-term investments, certain derivatives and in-kind transactions (if any). If such transactions were included, the Fund’s portfolio turnover rate may be higher. |
| | |
| | See Notes to Financial Statements. |
| | PGIM Jennison ETFs 39 |
Notes to Financial Statements
PGIM ETF Trust (the “Registered Investment Company” or “RIC”) is registered under the Investment Company Act of 1940, as amended (“1940 Act”), as an open-end management investment company. The RIC is organized as a Delaware Statutory Trust. These financial statements relate only to the following series of the RIC: PGIM Jennison Focused Growth ETF and PGIM Jennison Focused Value ETF (each a “Fund” and collectively, the “Funds”). PGIM Jennison Focused Value ETF is a diversified fund for purposes of the 1940 Act, and PGIM Jennison Focused Growth ETF is a non-diversified fund for purposes of the 1940 Act. Each Fund operates as an exchange-traded fund.
The Funds have the following investment objectives:
| | |
| | |
| Fund | | Investment Objective(s) |
| |
PGIM Jennison Focused Growth ETF | | Long-term growth of capital. |
| |
PGIM Jennison Focused Value ETF | | Long-term growth of capital. |
The Funds follow the investment company accounting and reporting guidance of the Financial Accounting Standards Board (“FASB”) Accounting Standard Codification (“ASC”) Topic 946 Financial Services — Investment Companies. The following is a summary of significant accounting policies followed by the Funds in the preparation of its financial statements. The policies conform to U.S. generally accepted accounting principles (“GAAP”). The Funds consistently follow such policies in the preparation of their financial statements.
Securities Valuation: The Funds hold securities and other assets and liabilities that are fair valued as of the close of each day (generally, 4:00 PM Eastern time) the New York Stock Exchange (“NYSE”) is open for trading. As described in further detail below, the Funds’ investments are valued daily based on a number of factors, including the type of investment and whether market quotations are readily available. The RIC’s Board of Trustees (the “Board”) has approved the Funds’ valuation policies and procedures for security valuation and designated PGIM Investments LLC (“PGIM Investments” or the “Manager”) as the “Valuation Designee,” as defined by Rule 2a-5(b) under the 1940 Act, to perform the fair value determination relating to all Funds investments. Pursuant to the Board’s oversight, the Valuation Designee has established a Valuation Committee to perform the duties and responsibilities as Valuation Designee under Rule 2a-5. The valuation procedures permit the Funds to utilize independent pricing vendor services, quotations from market makers, and alternative valuation methods when market quotations are either not readily available or not deemed representative of fair value. Fair value is the estimated price that would be received
to sell an asset or paid to transfer a liability in an orderly transaction between market participants on the measurement date.
For the fiscal reporting period-end, securities and other assets and liabilities were fair valued at the close of the last U.S. business day. Trading in certain foreign securities may occur when the NYSE is closed (including weekends and holidays). Because such foreign securities trade in markets that are open on weekends and U.S. holidays, the values of some of the Funds’ foreign investments may change on days when investors cannot purchase or redeem Fund shares.
Various inputs determine how the Funds’ investments are valued, all of which are categorized according to the three broad levels (Level 1, 2, or 3) detailed in the Schedule of Investments and referred to herein as the “fair value hierarchy” in accordance with FASB ASC Topic 820 — Fair Value Measurement.
Common or preferred stocks, exchange-traded funds (ETFs) and derivative instruments, if applicable, that are traded on a national securities exchange are valued at the last sale price as of the close of trading on the applicable exchange where the security principally trades. Securities traded via NASDAQ are valued at the NASDAQ official closing price. To the extent these securities are valued at the last sale price or NASDAQ official closing price, they are classified as Level 1 in the fair value hierarchy. In the event that no sale or official closing price on a valuation date exists, these securities are generally valued at the mean between the last reported bid and ask prices, or at the last bid price in the absence of an ask price. These securities are classified as Level 2 in the fair value hierarchy.
Foreign equities traded on foreign securities exchanges are generally valued using pricing vendor services that provide model prices derived using adjustment factors based on information such as local closing price, relevant general and sector indices, currency fluctuations, depositary receipts, and futures, as applicable. Securities valued using such model prices are classified as Level 2 in the fair value hierarchy. The models generate an evaluated adjustment factor for each security, which is applied to the local closing price to adjust it for post closing market movements up to the time the Funds is valued. Utilizing that evaluated adjustment factor, the vendor provides an evaluated price for each security. If the vendor does not provide an evaluated price, securities are valued in accordance with exchange-traded common and preferred stock valuation policies discussed above.
Investments in open-end funds (other than ETFs) are valued at their net asset values as of the close of the NYSE on the date of valuation. These securities are classified as Level 1 in the fair value hierarchy since they may be purchased or sold at their net asset values on the date of valuation.
Securities and other assets that cannot be priced according to the methods described above are valued based on policies and procedures approved by the Board. In the event that unobservable inputs are used when determining such valuations, the securities will be
Notes to Financial Statements (continued)
classified as Level 3 in the fair value hierarchy. Altering one or more unobservable inputs may result in a significant change to a Level 3 security’s fair value measurement.
When determining the fair value of securities, some of the factors influencing the valuation include: the nature of any restrictions on disposition of the securities; assessment of the general liquidity of the securities; the issuer’s financial condition and the markets in which it does business; the cost of the investment; the size of the holding and the capitalization of the issuer; the prices of any recent transactions or bids/offers for such securities or any comparable securities; and any available analyst media or other reports or information deemed reliable by the Valuation Designee regarding the issuer or the markets or industry in which it operates. Using fair value to price securities may result in a value that is different from a security’s most recent closing price and from the price used by other unaffiliated mutual funds to calculate their net asset values.
Master Netting Arrangements: The Fund is subject to various Master Agreements, or netting arrangements, with select counterparties. These are agreements which a subadviser may have negotiated and entered into on behalf of all or a portion of a Funds. A master netting arrangement between the Funds and the counterparty permits the Funds to offset amounts payable by the Fund to the same counterparty against amounts to be received and by the receipt of collateral from the counterparty by the Fund to cover the Funds’ exposure to the counterparty. However, there is no assurance that such mitigating factors are easily enforceable. In addition to master netting arrangements, the right to set-off exists when all the conditions are met such that each of the parties owes the other determinable amounts, the reporting party has the right to set-off the amount owed with the amount owed by the other party, the reporting party intends to set-off and the right of set-off is enforceable by law.
Securities Lending: The Funds lend their portfolio securities to banks and broker-dealers. The loans are secured by collateral at least equal to the market value of the securities loaned. Collateral pledged by each borrower is invested in an affiliated money market fund and is marked to market daily, based on the previous day’s market value, such that the value of the collateral exceeds the value of the loaned securities. In the event of significant appreciation in value of the securities on loan on the last business day of the reporting period, the financial statements may reflect a collateral value that is less than the market value of the loaned securities. Such shortfall is remedied as described above. Loans are subject to termination at the option of the borrower or the Funds. Upon termination of the loan, the borrower will return to the Funds securities identical to the loaned securities. The remaining open loans of the securities lending transactions are considered overnight and continuous. Should the borrower of the securities fail financially, the Funds has the right to repurchase the securities in the open market using the collateral.
The Funds recognizes income, net of any rebate and securities lending agent fees, for lending its securities in the form of fees or interest on the investment of any cash received as collateral. The borrower receives all interest and dividends from the securities loaned and such payments are passed back to the lender in amounts equivalent thereto, which are reflected in interest income or unaffiliated dividend income based on the nature of the payment on the Statement of Operations. The Funds also continues to recognize any unrealized gain (loss) in the market price of the securities loaned and on the change in the value of the collateral invested that may occur during the term of the loan. In addition, realized gain (loss) is recognized on changes in the value of the collateral invested upon liquidation of the collateral. Net earnings from securities lending are disclosed in the Statement of Operations.
Securities Transactions and Net Investment Income: Securities transactions are recorded on the trade date. Realized gains (losses) from investment and currency transactions are calculated on the specific identification method. Dividend income is recorded on the ex-date, or for certain foreign securities, when the Funds become aware of such dividends. Expenses are recorded on an accrual basis, which may require the use of certain estimates by management that may differ from actual expense amounts.
Taxes: It is each Fund’s policy to meet the requirements of the Internal Revenue Code applicable to regulated investment companies and to distribute all of its taxable net investment income and capital gains, if any, to its shareholders. Therefore, no federal income tax provision is required. Withholding taxes on foreign dividends, interest and capital gains, if any, are recorded, net of reclaimable amounts, at the time the related income is earned.
Dividends and Distributions: Dividends and distributions to shareholders, which are determined in accordance with federal income tax regulations and which may differ from GAAP, are recorded on the ex-date. Permanent book/tax differences relating to income and gain (loss) are reclassified between total distributable earnings (loss) and paid-in capital in excess of par, as appropriate. The chart below sets forth the expected frequency of dividend and capital gains distributions to shareholders. Various factors may impact the frequency of dividend distributions to shareholders, including but not limited to adverse market conditions or portfolio holding-specific events.
| | | | |
| | |
| Expected Distribution Schedule to Shareholders* | | Frequency | |
| |
Net Investment Income | | | Annually | |
| |
Short-Term Capital Gains | | | Annually | |
| |
Long-Term Capital Gains | | | Annually | |
| * | Under certain circumstances, each Fund may make more than one distribution of short-term and/or long-term capital gains during a fiscal year. |
Estimates: The preparation of financial statements requires management to make estimates and assumptions that affect the reported amounts and disclosures in the financial statements. Actual results could differ from those estimates.
Notes to Financial Statements (continued)
Pursuant to a management agreement with the RIC on behalf of the Funds (the Management Agreement), PGIM Investments manages each Fund’s investment operations and administers its business affairs. PGIM Investments is also responsible for supervising each Fund’s subadviser.
Pursuant to the management agreement relating to each Fund, there is a unitary fee structure for the funds whereby PGIM Investments is responsible for substantially all expenses of each Fund, except taxes, brokerage expenses, interest expenses, distribution fees or expenses, expenses incident to shareholder meetings and extraordinary expenses. Each Fund may also pay for any costs or expenses of investing in other funds. For more information on the unitary management fee structure please refer to the Funds’ Statement of Additional Information.
The unitary fee paid to the Manager is accrued daily and payable monthly, at an annual rate of each Fund’s average daily net assets specified below.
| | |
| | |
| Fund | | Unitary Fee Rate |
| |
PGIM Jennison Focused Growth ETF | | 0.75% |
| |
PGIM Jennison Focused Value ETF | | 0.75% |
The Manager has entered into a subadvisory agreement (Subadvisory Agreement) with Jennison Associates LLC (“Jennison” or the “subadviser”). The Manager pays for the services of the subadviser.
The Bank of New York Mellon (“BNY”) serves as the Custodian, Transfer Agent and Administrative Agent for the Trust. BNY receives compensation from the Manager and is reimbursed for expenses, including custodian, transfer agency and administration fees and certain out-of-pocket expenses including, but not limited to, postage, stationery, printing, allocable communication expenses and other costs. The Manager is responsible for compensating BNY under the Custodian, Transfer Agency and Service and Administration and Accounting Agreements.
Prudential Investment Management Services LLC (“PIMS” or the “Distributor”), acts as the distributor of each Fund, pursuant to the terms of a distribution agreement (“Distribution Agreement”) between the RIC and the Distributor. The Distributor is a subsidiary of Prudential. Shares are continuously offered for sale by the Distributor only. Although the Distributor does not receive any fees under the Distribution Agreement, the Manager or its affiliates may pay the Distributor for certain distribution related services.
PGIM Investments, PIMS and Jennison are indirect, wholly-owned subsidiaries of Prudential
Financial, Inc. (“Prudential”).
| 4. | Other Transactions with Affiliates |
The Funds may invest their overnight sweep cash in the PGIM Core Government Money Market Fund (the “Core Government Fund”), a series of the Prudential Government Money Market Fund, Inc., and their securities lending cash collateral in the PGIM Institutional Money Market Fund (the “Money Market Fund”), a series of Prudential Investment Portfolios 2, each registered under the 1940 Act and managed by PGIM Investments. PGIM Investments and/or its affiliates are paid fees or reimbursed for providing their services to the Core Government Fund and the Money Market Fund. In addition to the realized and unrealized gains on investments in the Core Government Fund and the Money Market Fund, earnings from such investments are disclosed on the Statement of Operations as “Affiliated dividend income” and “Income from securities lending, net”, respectively.
The Funds may enter into certain securities purchase or sale transactions under Board approved Rule 17a-7 procedures. Rule 17a-7 is an exemptive rule under the 1940 Act that, subject to certain conditions, permits purchase and sale transactions among affiliated investment companies, or between an investment company and a person that is affiliated solely by reason of having a common (or affiliated) investment adviser, common directors/trustees, and/or common officers. For the reporting period ended August 31, 2023, no Rule 17a-7 transactions were entered into by the Funds.
The aggregate cost of purchases and proceeds from sales of portfolio securities (excluding short-term investments, in-kind transactions and U.S. Government securities) for the year ended August 31, 2023, were as follows:
| | | | | | | | |
| Fund | | Cost of Purchases | | | Proceeds from Sales | |
PGIM Jennison Focused Growth ETF | | $ | 22,444,271 | | | $ | 13,448,735 | |
PGIM Jennison Focused Value ETF | | | 13,559,914 | | | | 3,933,505 | |
A summary of the cost of purchases and proceeds from sales of shares of affiliated mutual funds for the year ended August 31, 2023, is presented as follows:
PGIM Jennison Focused Growth ETF
| | | | | | | | | | | | | | |
| | | | | | | | |
Value, Beginning of Period | | Cost of Purchases | | Proceeds from Sales | | Change in Unrealized Gain (Loss) | | Realized Gain (Loss) | | Value,
End of Period | | Shares, End of Period | | Income |
|
Short-Term Investments - Affiliated Mutual Funds: |
|
PGIM Core Government Money Market Fund(1)(wi) |
| $— | | $1,949,948 | | $731,847 | | $— | | $ — | | $1,218,101 | | 1,218,101 | | $16,708 |
Notes to Financial Statements (continued)
| | | | | | | | | | | | | | | | | | | | | | | | |
| | | | | | | | |
Value, Beginning of Period | | Cost of Purchases | | | Proceeds from Sales | | | Change in Unrealized Gain (Loss) | | Realized Gain (Loss) | | Value, End of Period | | | Shares, End of Period | | | Income | |
|
PGIM Institutional Money Market Fund(1)(b)(wi) | |
| | | | | | | |
| $— | | $ | 932,463 | | | $ | 588,731 | | | $ 6 | | $(179) | | $ | 343,559 | | | | 343,766 | | | $ | 5,633 | (2) |
| $— | | $ | 2,882,411 | | | $ | 1,320,578 | | | $ 6 | | $(179) | | $ | 1,561,660 | | | | | | | $ | 22,341 | |
PGIM Jennison Focused Value ETF
| | | | | | | | | | | | | | | | | | | | | | | | |
| | | | | | | | |
Value, Beginning of Period | | Cost of Purchases | | | Proceeds from Sales | | | Change in Unrealized Gain (Loss) | | Realized Gain (Loss) | | Value, End of Period | | | Shares, End of Period | | | Income | |
|
Short-Term Investments - Affiliated Mutual Fund: | |
|
PGIM Core Government Money Market Fund(1)(wj) | |
| $— | | $ | 660,596 | | | $ | 431,529 | | | $— | | $— | | $ | 229,067 | | | | 229,067 | | | $ | 5,334 | |
| (1) | The Fund did not have any capital gain distributions during the reporting period. |
| (2) | The amount, or a portion thereof, represents the affiliated securities lending income shown on the Statement of Operations. |
| (b) | Represents security, or portion thereof, purchased with cash collateral received for securities on loan and includes dividend reinvestment. |
| (wi) | PGIM Investments LLC, the manager of the Fund, also serves as manager of the PGIM Core Government Money Market Fund and PGIM Institutional Money Market Fund, if applicable. |
| (wj) | PGIM Investments LLC, the manager of the Fund, also serves as manager of the PGIM Core Government Money Market Fund. |
| 6. | Distributions and Tax Information |
Distributions to shareholders, which are determined in accordance with federal income tax regulations and which may differ from GAAP, are recorded on the ex-date. In order to present total distributable earnings (loss) and paid-in capital in excess of par on the Statement of Assets and Liabilities that more closely represent their tax character, certain adjustments have been made to total distributable earnings (loss) and paid-in capital in excess of par for the Funds indicated below.
For the period ended August 31, 2023, the adjustments were as follows:
| | | | | | | | | | |
| Fund | | Total Distributable Earnings (Loss) | | Paid-in Capital in Excess of Par |
PGIM Jennison Focused Growth ETF (a)(b) | | | $ | (761,363 | ) | | | $ | 761,363 | |
PGIM Jennison Focused Value ETF (b) | | | | (93,221 | ) | | | | 93,221 | |
| (b) | Redemptions In Kind Adjustments |
For the period ended August 31, 2023, the tax character of dividends paid as reflected in the Statement of Changes in Net Assets were as follows:
| | | | | | | | | | | | | | | | | | | | |
| Fund | | Ordinary Income | | Long-Term Capital Gains | | Tax Return of Capital | | Total Dividends and Distributions |
PGIM Jennison Focused Growth ETF | | | $ | — | | | | $ | — | | | | $ | — | | | | $ | — | |
PGIM Jennison Focused Value ETF | | | | 12,409 | | | | | — | | | | | — | | | | | 12,409 | |
For the period ended August 31, 2023, the Funds indicated below had the following amounts of accumulated undistributed earnings on a tax basis:
| | | | | | | | | | |
| Fund | | Undistributed Ordinary Income | | Undistributed Long-Term Capital Gains |
PGIM Jennison Focused Growth ETF | | | $ | — | | | | $ | — | |
PGIM Jennison Focused Value ETF | | | | 106,078 | | | | | — | |
The United States federal income tax basis of the investments and the net unrealized appreciation as of August 31, 2023 were as follows:
| | | | | | | | | | | | | | | | | | | | |
| Fund | | Tax Basis | | Gross Unrealized Appreciation | | Gross Unrealized Depreciation | | Net Unrealized Appreciation |
PGIM Jennison Focused Growth ETF | | | $ | 44,157,026 | | | | $ | 13,714,796 | | | | $ | (400,233 | ) | | | $ | 13,314,563 | |
PGIM Jennison Focused Value ETF | | | | 10,550,081 | | | | | 727,923 | | | | | (7,736 | ) | | | | 720,187 | |
The difference between GAAP and tax basis was primarily attributable to deferred losses on wash sales.
For federal income tax purposes, the following Funds had an approximated capital loss carryforward as of August 31, 2023 which can be carried forward for an unlimited period. No capital gains distributions are expected to be paid to shareholders until net gains have been realized in excess of such losses.
| | | | | | | | | | |
| Fund | | Capital Loss Carryforward | | Capital Loss Carryforward Utilized |
PGIM Jennison Focused Growth ETF | | | $ | 536,000 | | | | $ | — | |
PGIM Jennison Focused Value ETF | | | | 116,000 | | | | | — | |
The Fund indicated below elected to treat the below approximated losses as having been incurred in the following fiscal year (August 31, 2024).
| | | | | | | | | | |
| Fund | | Qualified Late-Year Losses | | Post-October Capital Losses |
PGIM Jennison Focused Growth ETF | | | $ | 45,000 | | | | $ | — | |
The Manager has analyzed the Funds’ tax positions and has concluded that no provision for income tax is required in the Funds’ financial statements for the current reporting period.
Notes to Financial Statements (continued)
Each Fund is an exchange-traded fund, commonly known as an “ETF”. Individual shares of the Funds may only be purchased and sold in secondary market transactions through brokers or other financial intermediaries. Shares of the Funds are listed for trading on the NYSE Arca, Inc. (the “Exchange”), and because the shares of the Funds trade at market prices rather than NAV, shares of the Funds may trade at a price greater than NAV (a premium) or less than NAV (a discount). Each Fund will issue and redeem its shares at NAV only in aggregations of a specified number of shares called a “Creation Unit”. An Authorized Participant is a member or participant of a clearing agency registered with the SEC, which has a written agreement with the Funds or one of their service providers that allows the Authorized Participant to place orders for the purchase and redemption of Creation Units.
A creation transaction, which is subject to acceptance by the Distributor and each Fund, generally takes place when an Authorized Participant deposits into each Fund a designated portfolio of securities, assets or other positions (a “creation basket”), and an amount of cash (including any cash representing the value of substituted securities, assets or other positions), if any, which together approximate the holdings of each Fund in exchange for a specified number of Creation Units. Similarly, shares can be redeemed only in Creation Units, generally for a designated portfolio of securities, assets or other propositions (the “redemption basket”) held by each Fund and an amount of cash (including any portion of such securities for which cash may be substituted). The Funds may, in certain circumstances, offer Creation Units partially or solely for cash. Except when aggregated in Creation Units, shares are not redeemable by the Funds. Creation and redemption baskets may differ and the Funds may accept “custom baskets”. A Creation Unit consists of 10,000 shares of each Fund.
Authorized Participants may be required to pay a fixed creation transaction fee and/or a fixed redemption transaction fee, as applicable, for each transaction in a Creation Unit regardless of the number of Creation Units created or redeemed on that day. These fees, if charged, are paid to the Custodian to offset costs associated with processing creation and redemption transactions. Authorized Participants transacting in creation units for cash may pay an additional variable fee to compensate the Funds for transaction costs and market impact expenses relating to purchases or sales of portfolio securities. Such variable fees, if any, are included in “Net proceeds from shares sold” and/or “Cost of shares purchased”, as applicable, in the Statements of Changes in Net Assets.
The RIC is authorized to issue an unlimited number of shares of beneficial interest, $0.001 par value per share.
As of August 31, 2023, Prudential, through its affiliated entities, including affiliated funds (if
applicable), owned shares of the Funds as follows:
| | | | | | | | | | |
| | | |
| Fund | | Number of Shares | | Percentage of Outstanding Shares |
PGIM Jennison Focused Growth ETF | | | | 194,007 | | | | | 22.3 | % |
PGIM Jennison Focused Value ETF | | | | 200,000 | | | | | 95.2 | |
At the reporting period end, the number of shareholders holding greater than 5% of the Fund are as follows:
| | | | | | | | | | |
| | | |
| Fund | | Number of Shareholders | | Percentage of Outstanding Shares |
Affiliated: | | | | | | | | | | |
PGIM Jennison Focused Growth ETF | | | | 1 | | | | | 20.7 | % |
PGIM Jennison Focused Value ETF | | | | 1 | | | | | 95.2 | |
Unaffiliated: | | | | | | | | | | |
PGIM Jennison Focused Growth ETF | | | | 1 | | | | | 75.6 | |
PGIM Jennison Focused Value ETF | | | | — | | | | | — | |
The Fund may make payment for Fund shares redeemed and contributed wholly or in part by distributing portfolio securities to shareholders. For the reporting period ended August 31, 2023, the Funds had subscriptions in-kind and had redemptions in-kind with total proceeds in the amounts presented on the Statements of Changes in Net Assets.
| 8. | Risks of Investing in the Funds |
Each Fund’s risks include, but are not limited to, some or all of the risks discussed below. For further information on the risks applicable to any given Fund, please refer to the Prospectus and Statement of Additional Information of that Fund.
| | | | |
| | | |
| Risks | | PGIM Jennison Focused Growth ETF | | PGIM Jennison Focused Value ETF |
Authorized Participant Concentration | | X | | X |
Cash Transactions | | X | | X |
Convertible Securities | | X | | – |
Economic and Market Events | | X | | X |
Equity and Equity-Related Securities | | X | | X |
ETF Shares Trading | | X | | X |
Foreign Securities | | X | | X |
Growth Style | | X | | – |
Initial Public Offerings | | X | | – |
Large Capitalization Company | | X | | X |
Large Shareholder and Large Scale Redemption | | X | | X |
Management | | X | | X |
Market Disruption and Geopolitical | | X | | X |
Market | | X | | X |
New/Small Fund | | X | | X |
Non-Diversified Investment Company | | X | | – |
Preferred Securities | | X | | – |
Notes to Financial Statements (continued)
| | | | |
| | | |
| Risks | | PGIM Jennison Focused Growth ETF | | PGIM Jennison Focused Value ETF |
Value Style | | – | | X |
Authorized Participant Concentration Risk: Only an Authorized Participant (as defined in “How to Buy and Sell Shares of the Fund” in the Fund’s Prospectus) may engage in creation or redemption transactions directly with the Fund. The Fund has a limited number of intermediaries that act as Authorized Participants and none of these Authorized Participants is or will be obligated to engage in creation or redemption transactions. To the extent that these Authorized Participants exit the business or are unable to or choose not to proceed with creation and/or redemption orders with respect to the Fund and no other Authorized Participant creates or redeems, shares of the Fund may trade at a substantial discount or premium to net asset value (“NAV”), may trade at larger spreads, and possibly face trading halts and/or delisting.
Cash Transactions Risk: Unlike ETFs that engage almost exclusively in creations and redemptions in exchange for a basket of portfolio securities (an “in-kind” transaction), the Fund may effect creations and redemptions in cash or partially in cash. Therefore, it may be required to sell portfolio securities and subsequently recognize gains on such sales that the Fund might not have recognized if it were to distribute portfolio securities in-kind. Investments in shares of the Fund may be less tax-efficient than an investment in an ETF that distributes portfolio securities entirely in-kind.
Convertible Securities Risk: The market value of a convertible security performs like that of a regular debt security; that is, if market interest rates rise, the value of a convertible security usually falls. In addition, convertible securities are subject to the risk that the issuer will not be able to pay interest or dividends when due, and their market value may change based on changes in the issuer’s credit rating or the market’s perception of the issuer’s creditworthiness. Since it derives a portion of its value from the common stock into which it may be converted, a convertible security is also subject to the same types of market and issuer risks that apply to the underlying common stock.
Economic and Market Events Risk: Events in the U.S. and global financial markets, including actions taken by the U.S. Federal Reserve or foreign central banks to stimulate or stabilize economic growth or the functioning of the securities markets, or otherwise reduce inflation, may at times result in unusually high market volatility, which could negatively impact performance. Governmental efforts to curb inflation often have negative effects on the level of economic activity. Relatively reduced liquidity in credit and fixed income markets could adversely affect issuers worldwide.
Equity and Equity-Related Securities Risk: Equity and equity-related securities may be subject to changes in value, and their values may be more volatile than those of other asset classes. In addition to an individual security losing value, the value of the equity markets or a sector in which the Fund invests could go down. Different parts of a market can react differently to adverse issuer, market, regulatory, political and economic developments.
ETF Shares Trading Risk: Fund shares are listed for trading on an exchange (the “Exchange”) and the shares are bought and sold in the secondary market at market prices. The market prices of the shares of the Fund are expected to fluctuate in response to changes in the Fund’s NAV, the intraday value of the Fund’s holdings and supply and demand for shares of the Fund. During periods of stressed market conditions, the market for the shares of the Fund may become less liquid in response to deteriorating liquidity in the markets for the Fund’s portfolio investments.
Disruptions to creations and redemptions, the existence of significant market volatility or potential lack of an active trading market for the shares of the Fund (including through a trading halt), as well as other factors, may result in the Fund’s shares trading on the Exchange significantly above (at a premium) or below (at a discount) to NAV or to the intraday value of the Fund’s holdings.
Cost of Buying or Selling Shares: When you buy or sell shares of the Fund through a broker, you will likely incur a brokerage commission or other charges imposed by brokers. In addition, the market price of shares of the Fund, like the price of any exchange-traded security, includes a “bid-ask spread” charged by the market makers or other participants that trade the particular security. The spread of the Fund’s shares varies over time based on the Fund’s trading volume, the spread of the Fund’s underlying securities, and market liquidity and may increase if the Fund’s trading volume or market liquidity decreases, or if the spread on the Fund’s underlying securities increases.
No Guarantee of Active Trading Market Risk: While shares of the Fund are listed on the Exchange, there can be no assurance that active trading markets for the shares will develop or be maintained by market makers or by Authorized Participants. The distributor of the Fund’s shares does not maintain a secondary market in the shares.
Foreign Securities Risk: Investments in securities of non-U.S. issuers (including those denominated in U.S. dollars) may involve more risk than investing in securities of U.S. issuers. Foreign political, economic and legal systems, especially those in developing and emerging market countries, may be less stable and more volatile than in the United States. Foreign legal systems generally have fewer regulatory requirements than the U.S. legal system, particularly those of emerging markets. In general, less information is publicly available with respect to non-U.S. companies than U.S. companies. Non-U.S. companies generally are not subject to the same accounting, auditing, and financial reporting standards as are U.S. companies. Additionally, the changing value of foreign currencies and changes in exchange rates could also affect the value of the assets the Fund holds and the Fund’s
Notes to Financial Statements (continued)
performance. Certain foreign countries may impose restrictions on the ability of issuers of foreign securities to make payment of principal and interest or dividends to investors located outside the country, due to blockage of foreign currency exchanges or otherwise. Investments in emerging markets are subject to greater volatility and price declines.
In addition, the Fund’s investments in non-U.S. securities may be subject to the risks of nationalization or expropriation of assets, imposition of currency exchange controls or restrictions on the repatriation of non-U.S. currency, confiscatory taxation and adverse diplomatic developments. Special U.S. tax considerations may apply.
Growth Style Risk: The Fund’s growth style may subject the Fund to above-average fluctuations as a result of seeking higher than average capital growth. Historically, growth stocks have performed best during later stages of economic expansion and value stocks have performed best during periods of economic recovery. Since the Fund follows a growth investment style, there is the risk that the growth investment style may be out of favor for a period of time. At times when the style is out of favor, the Fund may underperform the market in general, its benchmark and other ETFs.
Initial Public Offerings Risk: The volume of IPOs and the levels at which the newly issued stocks trade in the secondary market are affected by the performance of the stock market overall. If IPOs are brought to the market, availability may be limited and if the Fund desires to acquire shares in such an offering, it may not be able to buy any shares at the offering price, or if it is able to buy shares, it may not be able to buy as many shares at the offering price as it would like. The prices of securities involved in IPOs are often subject to greater and more unpredictable price changes than more established stocks. Such unpredictability can have a dramatic impact on the Fund’s performance (higher or lower) and any assumptions by investors based on the affected performance may be unwarranted. In addition, as Fund assets grow, the impact of IPO investments on performance will decline, which could reduce total returns.
Large Capitalization Company Risk: Companies with large market capitalizations go in and out of favor based on market and economic conditions. Larger companies tend to be less volatile than companies with smaller market capitalizations. In exchange for this potentially lower risk, the Fund’s value may not rise or fall as much as the value of funds that emphasize companies with smaller market capitalizations.
Large Shareholder and Large Scale Redemption Risk: Certain individuals, accounts, funds (including funds affiliated with the Manager) or institutions, including the Manager and its affiliates, may from time to time own or control a substantial amount of the Fund’s shares. There is no requirement that these entities maintain their investment in the Fund. There is a risk that such large shareholders or that the Fund’s shareholders generally may redeem all
or a substantial portion of their investments in the Fund in a short period of time, which could have a significant negative impact on the Fund’s NAV, liquidity, and brokerage costs. Large redemptions could also result in tax consequences to shareholders and impact the Fund’s ability to implement its investment strategy. The Fund’s ability to pursue its investment objective after one or more large scale redemptions may be impaired and, as a result, the Fund may invest a larger portion of its assets in cash or cash equivalents.
Management Risk: Actively managed funds are subject to management risk. The subadviser will apply investment techniques and risk analyses in making investment decisions for the Fund, but the subadviser’s judgments about the attractiveness, value or market trends affecting a particular security, industry or sector or about market movements may be incorrect. Additionally, the investments selected for the Fund may underperform the markets in general, the Fund’s benchmark and other funds with similar investment objectives.
Market Disruption and Geopolitical Risks: Market disruption can be caused by economic, financial or political events and factors, including but not limited to, international wars or conflicts (including Russia’s military invasion of Ukraine), geopolitical developments (including trading and tariff arrangements, sanctions and cybersecurity attacks), instability in regions such as Asia, Eastern Europe and the Middle East, terrorism, natural disasters and public health epidemics (including the outbreak of COVID-19 globally).
The extent and duration of such events and resulting market disruptions cannot be predicted, but could be substantial and could magnify the impact of other risks to the Fund. These and other similar events could adversely affect the U.S. and foreign financial markets and lead to increased market volatility, reduced liquidity in the securities markets, significant negative impacts on issuers and the markets for certain securities and commodities and/or government intervention. They may also cause short- or long-term economic uncertainties in the United States and worldwide. As a result, whether or not the Fund invests in securities of issuers located in or with significant exposure to the countries directly affected, the value and liquidity of the Fund’s investments may be negatively impacted. Further, due to closures of certain markets and restrictions on trading certain securities, the value of certain securities held by the Fund could be significantly impacted, which could lead to such securities being valued at zero.
COVID-19 and the related governmental and public responses have had, and future public health epidemics may have an impact on the Fund’s investments and net asset value, and have led and may lead to increased market volatility and the potential for illiquidity in certain classes of securities and sectors of the market. Future public health epidemics may result in periods of business disruption, business closures, inability to obtain raw materials, supplies and component parts, and reduced or disrupted operations for the issuers in which the Fund invests. The occurrence, reoccurrence and pendency of public health epidemics could adversely affect the economies and financial markets either in specific countries or worldwide.
Notes to Financial Statements (continued)
Market Risk: Securities markets may be volatile and the market prices of the Fund’s securities may decline. Securities fluctuate in price based on changes in an issuer’s financial condition and overall market and economic conditions. If the market prices of the securities owned by the Fund fall, the value of your investment in the Fund will decline.
New/Small Fund Risk: The Fund recently commenced operations and has a limited operating history. As a new and relatively small fund, the Fund’s performance may not represent how the Fund is expected to or may perform in the long term if and when it becomes larger and has fully implemented its investment strategies. Investment positions may have a disproportionate impact (negative or positive) on performance in new and smaller funds. New and smaller funds may also require a period of time before they are invested in securities that meet their investment objectives and policies and achieve a representative portfolio composition. Since the Fund is new, an active secondary market for the shares of the Fund may not develop or may not continue once developed. Shareholders holding large blocks of shares of the Fund, including the Manager and its affiliates, may hold their shares for long periods of time, which may lead to reduced trading volumes, wider trading spreads and impede the development or maintenance of an active secondary trading market for Fund shares. These large shareholders may also loan or sell all or a portion of their Fund shares, which may result in increasing concentration of Fund shares in a small number of holders, and the potential for large redemptions, decreases in Fund assets and increased expenses for remaining shareholders.
Non-Diversified Investment Company Risk: The Fund is non-diversified for purposes of the 1940 Act. This means that the Fund may invest a greater percentage of its assets in the securities of a single company or other issuer than a diversified fund. Investing in a non-diversified fund involves greater risk than investing in a diversified fund because a loss resulting from the decline in value of any one security may represent a greater portion of the total assets of a non-diversified fund.
Preferred Securities Risk: Preferred stock can experience sharp declines in value over short or extended periods of time, regardless of the success or failure of a company’s operations. A redemption by the issuer may negatively impact the return of the security held by the Fund. Preferred stockholders’ liquidation rights are subordinate to the company’s debt holders and creditors. If interest rates rise, the fixed dividend on preferred stocks may be less attractive and the price of preferred stocks may decline. Preferred stock usually does not require the issuer to pay dividends and may permit the issuer to defer dividend payments. Deferred dividend payments could have adverse tax consequences for the Fund and may cause the preferred security to lose substantial value. Preferred securities also may have substantially lower trading volumes and less market depth than many other securities, such as common stock or U.S. Government securities.
Value Style Risk: Since the Fund follows a value investment style, there is the risk that the value style may be out of favor for long periods of time, that the market will not recognize a security’s intrinsic value for a long time or at all, or that a stock judged to be undervalued may actually be appropriately priced or overvalued. Issuers of value stocks may have experienced adverse business developments or may be subject to special risks that have caused the stock to be out of favor. In addition, the Fund’s value investment style may go out of favor with investors, negatively affecting the Fund’s performance. If the Fund’s assessment of market conditions or a company’s value is inaccurate, the Fund could suffer losses or produce poor performance relative to other funds.
| 9. | Recent Regulatory Developments |
Effective January 24, 2023, the SEC adopted rule and form amendments to require mutual funds and ETFs to transmit concise and visually engaging streamlined annual and semiannual reports to shareholders that highlight key information deemed important for retail investors to assess and monitor their fund investments (the “Rule”). Other information, including financial statements, will no longer appear in the funds’ streamlined shareholder reports but must be available online, delivered free of charge upon request, and filed on a semiannual basis on Form N-CSR. The Rule and form amendments have a compliance date of July 24, 2024. At this time, management is evaluating the Rule and its impact to the Funds.
Report of Independent Registered Public Accounting Firm
To the Board of Trustees of PGIM ETF Trust and Shareholders of PGIM Jennison Focused Growth ETF and PGIM Jennison Focused Value ETF
Opinions on the Financial Statements
We have audited the accompanying statements of assets and liabilities, including the schedules of investments, of PGIM Jennison Focused Growth ETF and PGIM Jennison Focused Value ETF (two of the funds constituting PGIM ETF Trust, hereafter collectively referred to as the “Funds”) as of August 31, 2023, the related statements of operations and changes in net assets, including the related notes, and the financial highlights for the period December 12, 2022 (commencement of operations) through August 31, 2023 (collectively referred to as the “financial statements”). In our opinion, the financial statements present fairly, in all material respects, the financial position of each of the Funds as of August 31, 2023, the results of each of their operations, changes in each of their net assets and each of the financial highlights for the period December 12, 2022 (commencement of operations) through August 31, 2023 in conformity with accounting principles generally accepted in the United States of America.
Basis for Opinions
These financial statements are the responsibility of the Funds’ management. Our responsibility is to express an opinion on the Funds’ financial statements based on our audits. We are a public accounting firm registered with the Public Company Accounting Oversight Board (United States) (PCAOB) and are required to be independent with respect to the Funds in accordance with the U.S. federal securities laws and the applicable rules and regulations of the Securities and Exchange Commission and the PCAOB.
We conducted our audits of these financial statements in accordance with the standards of the PCAOB. Those standards require that we plan and perform the audit to obtain reasonable assurance about whether the financial statements are free of material misstatement, whether due to error or fraud.
Our audits included performing procedures to assess the risks of material misstatement of the financial statements, whether due to error or fraud, and performing procedures that respond to those risks. Such procedures included examining, on a test basis, evidence regarding the amounts and disclosures in the financial statements. Our audits also included evaluating the accounting principles used and significant estimates made by management, as well as evaluating the overall presentation of the financial statements. Our procedures included confirmation of securities owned as of August 31, 2023 by correspondence with the custodian, transfer agent and brokers; when replies were not received from brokers, we performed other auditing procedures. We believe that our audits provide a reasonable basis for our opinion.
/s/PricewaterhouseCoopers LLP
October 19, 2023
We have served as the auditor of one or more investment companies in the PGIM Retail Funds complex since 2020.
Tax Information (unaudited)
For the period ended August 31, 2023, the Fund reports the maximum amount allowable under Section 854 of the Internal Revenue Code, but not less than, the following percentages of the ordinary income dividends paid as: 1) qualified dividend income (QDI); and 2) eligible for corporate dividends received deduction (DRD):
| | | | | | | | |
| | | |
| Fund | | QDI | | | DRD | |
| | |
PGIM Jennison Focused Growth ETF | | | — | | | | — | |
| | |
PGIM Jennison Focused Value ETF | | | 100.00% | | | | 100.00% | |
In January 2024, you will be advised on IRS Form 1099-DIV or substitute 1099-DIV as to the federal tax status of the distributions received by you in calendar year 2023.
INFORMATION ABOUT BOARD MEMBERS AND OFFICERS (unaudited)
Information about Board Members and Officers of the Funds is set forth below. Board Members who are not deemed to be “interested persons” of the Funds, as defined in the 1940 Act, are referred to as “Independent Board Members.” Board Members who are deemed to be “interested persons” of the Funds are referred to as “Interested Board Members.” The Board Members are responsible for the overall supervision of the operations of the Funds and perform the various duties imposed on the directors of investment companies by the 1940 Act. The Board in turn elects the Officers, who are responsible for administering the day-to-day operations of the Funds.
| | | | | | |
| |
| Independent Board Members |
| | | | |
Name Year of Birth Position(s) Portfolios Overseen | | Principal Occupation(s) During Past Five Years | | Other Directorships Held During Past Five Years | | Length of Board Service |
| | | | |
Ellen S. Alberding 1958 Board Member Portfolios Overseen: 99 | | Chief Executive Officer (“CEO”) and President, The Joyce Foundation (charitable foundation) (since 2002); formerly Vice Chair, City Colleges of Chicago (community college system) (2011-2015); formerly Trustee, National Park Foundation (charitable foundation for national park system) (2009-2018); formerly Trustee, Economic Club of Chicago (2009-2016); Trustee, Loyola University (since 2018). | | None. | | Since December 2017 |
| | | | |
Kevin J. Bannon 1952 Board Member Portfolios Overseen: 100 | | Retired; formerly Managing Director (April 2008-May 2015) and Chief Investment Officer (October 2008-November 2013) of Highmount Capital LLC (registered investment adviser); formerly Executive Vice President and Chief Investment Officer (April 1993-August 2007) of Bank of New York Company; formerly President (May 2003-May 2007) of BNY Hamilton Family of Mutual Funds. | | Director of Urstadt Biddle Properties (equity real estate investment trust) (since September 2008). | | Since December 2017 |
| | | | | | |
| |
| Independent Board Members |
| | | | |
Name Year of Birth
Position(s) Portfolios Overseen | | Principal Occupation(s) During Past Five Years | | Other Directorships Held During Past Five Years | | Length of Board Service |
| | | | |
Linda W. Bynoe 1952 Board Member Portfolios Overseen: 97 | | President and Chief Executive Officer (since March 1995) and formerly Chief Operating Officer (December 1989-February 1995) of Telemat Limited LLC (formerly Telemat Ltd) (management consulting); formerly Vice President (January 1985-June 1989) at Morgan Stanley & Co. (broker-dealer). | | Trustee of Equity Residential (residential real estate) (since December 2009); Director of Northern Trust Corporation (financial services) (since April 2006); formerly Director of Anixter International, Inc. (communication products distributor) (January 2006-June 2020). | | Since December 2017 |
| | | | |
Barry H. Evans 1960 Board Member Portfolios Overseen: 100 | | Retired; formerly President (2005-2016), Global Chief Operating Officer (2014-2016), Chief Investment Officer - Global Head of Fixed Income (1998-2014), and various portfolio manager roles (1986-2006), Manulife Asset Management (asset management). | | Formerly Director, Manulife Trust Company (2011-2018); formerly Director, Manulife Asset Management Limited (2015-2017); formerly Chairman of the Board of Directors of Manulife Asset Management U.S. (2005-2016); formerly Chairman of the Board, Declaration Investment Management and Research (2008-2016). | | Since December 2017 |
| | | | |
Keith F. Hartstein 1956 Board Member & Independent Chair Portfolios Overseen: 100 | | Retired; formerly Member (November 2014- September 2022) of the Governing Council of the Independent Directors Council (IDC) (organization of independent mutual fund directors); formerly Executive Committee of the IDC Board of Governors (October 2019-December 2021); formerly President and Chief Executive Officer (2005-2012), Senior Vice President (2004-2005), Senior Vice President of Sales and Marketing (1997-2004), and various executive management positions (1990-1997), John Hancock Funds, LLC (asset management); formerly Chairman, Investment Company Institute’s Sales Force Marketing Committee (2003-2008). | | None. | | Since December 2017 |
| | |
| Visit our website at pgim.com/investments | | |
| | | | | | |
| |
| Independent Board Members |
| | | | |
Name Year of Birth
Position(s) Portfolios Overseen | | Principal Occupation(s) During Past Five Years | | Other Directorships Held During Past Five Years | | Length of Board Service |
| | | | |
Laurie Simon Hodrick 1962 Board Member Portfolios Overseen: 97 | | A. Barton Hepburn Professor Emerita of Economics in the Faculty of Business, Columbia Business School (since 2018); Visiting Fellow at the Hoover Institution, Stanford University (since 2015); Sole Member, ReidCourt LLC (since 2008) (a consulting firm); formerly Visiting Professor of Law, Stanford Law School (2015-2021); formerly A. Barton Hepburn Professor of Economics in the Faculty of Business, Columbia Business School (1996-2017); formerly Managing Director, Global Head of Alternative Investment Strategies, Deutsche Bank (2006-2008). | | Independent Director, Andela (since January 2022) (global talent network); Independent Director, Roku (since December 2020) (communication services); formerly Independent Director, Synnex Corporation (2019-2021) (information technology); formerly Independent Director, Kabbage, Inc. (2018-2020) (financial services); formerly Independent Director, Corporate Capital Trust (2017-2018) (a business development company). | | Since December 2017 |
| | | | |
Brian K. Reid 1961 Board Member Portfolios Overseen: 100 | | Retired; formerly Chief Economist for the Investment Company Institute (ICI) (2005-2017); formerly Senior Economist and Director of Industry and Financial Analysis at the ICI (1998-2004); formerly Senior Economist, Industry and Financial Analysis at the ICI (1996-1998); formerly Staff Economist at the Federal Reserve Board (1989-1996); formerly Director, ICI Mutual Insurance Company (2012-2017). | | None. | | Since March 2018 |
| | | | | | |
| |
| Independent Board Members |
| | | | |
Name Year of Birth Position(s) Portfolios Overseen | | Principal Occupation(s) During Past Five Years | | Other Directorships Held During Past Five Years | | Length of Board Service |
| | | | |
Grace C. Torres 1959 Board Member Portfolios Overseen: 100 | | Retired; formerly Treasurer and Principal Financial and Accounting Officer of the PGIM Funds, Target Funds, Advanced Series Trust, Prudential Variable Contract Accounts and The Prudential Series Fund (1998-June 2014); Assistant Treasurer (March 1999-June 2014) and Senior Vice President (September 1999-June 2014) of PGIM Investments LLC; Assistant Treasurer (May 2003-June 2014) and Vice President (June 2005-June 2014) of AST Investment Services, Inc.; Senior Vice President and Assistant Treasurer (May 2003-June 2014) of Prudential Annuities Advisory Services, Inc. | | Director (since January 2018) of OceanFirst Financial Corp. and OceanFirst Bank; formerly Director (July 2015-January 2018) of Sun Bancorp, Inc. N.A. and Sun National Bank. | | Since December 2017 |
| | |
| Visit our website at pgim.com/investments | | |
| | | | | | |
| |
| Interested Board Members |
| | | | |
Name Year of Birth Position(s) Portfolios Overseen | | Principal Occupation(s) During Past Five Years | | Other Directorships Held During Past Five Years | | Length of Board Service |
| | | | |
Stuart S. Parker 1962 Board Member & President Portfolios Overseen: 100 | | President, Chief Executive Officer, Chief Operating Officer and Officer in Charge of PGIM Investments LLC (formerly known as Prudential Investments LLC) (since January 2012); President and PEO (since September 2022) of the PGIM Private Credit Fund, President and Principal Executive Officer (“PEO”) (since March 2022) of the PGIM Private Real Estate Fund, Inc.; formerly Executive Vice President of Jennison Associates LLC and Head of Retail Distribution of PGIM Investments LLC (June 2005-December 2011); Investment Company Institute - Board of Governors (since May 2012). | | None. | | Since December 2017 |
| | | | |
Scott E. Benjamin 1973 Board Member & Vice President Portfolios Overseen: 100 | | Executive Vice President (since May 2009) of PGIM Investments LLC; Vice President (since June 2012) of Prudential Investment Management Services LLC; Executive Vice President (since September 2009) of AST Investment Services, Inc.; Senior Vice President of Product Development and Marketing, PGIM Investments (since February 2006); Vice President (since September 2022) of the PGIM Private Credit Fund, Vice President (since March 2022) of the PGIM Private Real Estate Fund, Inc.; formerly Vice President of Product Development and Product Management, PGIM Investments LLC (2003-2006). | | None. | | Since December 2017 |
| | | | |
| |
| Fund Officers(a) |
| | | |
Name Year of Birth Fund Position | | Principal Occupation(s) During Past Five Years | | Length of
Service as Fund
Officer |
| | | |
Claudia DiGiacomo 1974 Chief Legal Officer | | Chief Legal Officer (since September 2022) of the PGIM Private Credit Fund; Chief Legal Officer (since July 2022) of the PGIM Private Real Estate Fund, Inc.; Chief Legal Officer, Executive Vice President and Secretary of PGIM Investments LLC (since August 2020); Chief Legal Officer of Prudential Mutual Fund Services LLC (since August 2020); Chief Legal Officer of PIFM Holdco, LLC (since August 2020); Vice President and Corporate Counsel (since January 2005) of Prudential; and Corporate Counsel of AST Investment Services, Inc. (since August 2020); formerly Vice President and Assistant Secretary of PGIM Investments LLC (2005-2020); formerly Associate at Sidley Austin Brown & Wood LLP (1999-2004). | | Since December 2017 |
| | | |
Andrew Donohue 1972 Chief Compliance Officer | | Chief Compliance Officer (since May 2023) of the PGIM Funds, Target Funds, PGIM ETF Trust, PGIM Global High Yield Fund, Inc., PGIM High Yield Bond Fund, Inc., PGIM Short Duration High Yield Opportunities Fund, Advanced Series Trust, The Prudential Series Fund, Prudential’s Gibraltar Fund, Inc., PGIM Private Credit Fund, PGIM Private Real Estate Fund, Inc.; Vice President, Chief Compliance Officer of PGIM Investments LLC (since September 2022); Chief Compliance Officer of AST Investment Services, Inc. (since October 2022); formerly various senior compliance roles within Principal Global Investors, LLC., global asset management for Principal Financial (2011-2022), most recently as Global Chief Compliance Officer (2016-2022). | | Since May 2023 |
| | | |
Andrew R. French 1962 Secretary | | Vice President (since December 2018) of PGIM Investments LLC; formerly Vice President and Corporate Counsel (2010-2018) of Prudential; Secretary (since September 2022) of the PGIM Private Credit Fund, Secretary (since March 2022) of the PGIM Private Real Estate Fund, Inc.; formerly Director and Corporate Counsel (2006-2010) of Prudential; Vice President and Assistant Secretary (since January 2007) of PGIM Investments LLC; Vice President and Assistant Secretary (since January 2007) of Prudential Mutual Fund Services LLC. | | Since December 2017 |
| | | |
Melissa Gonzalez 1980 Assistant Secretary | | Vice President and Corporate Counsel (since September 2018) of Prudential; Vice President and Assistant Secretary (since August 2020) of PGIM Investments LLC; Assistant Secretary (since September 2022) of the PGIM Private Credit Fund, Assistant Secretary (since March 2022) of the PGIM Private Real Estate Fund, Inc.; formerly Director and Corporate Counsel (March 2014-September 2018) of Prudential. | | Since March 2020 |
| | |
| Visit our website at pgim.com/investments | | |
| | | | |
| |
| Fund Officers(a) |
| | | |
Name Year of Birth Fund Position | | Principal Occupation(s) During Past Five Years | | Length of Service as Fund Officer |
| | | |
Patrick E. McGuinness 1986 Assistant Secretary | | Vice President and Assistant Secretary (since August 2020) of PGIM Investments LLC; Director and Corporate Counsel (since February 2017) of Prudential; Assistant Secretary (since September 2022) of the PGIM Private Credit Fund, Assistant Secretary (since March 2022) of the PGIM Private Real Estate Fund, Inc. | | Since June 2020 |
| | | |
Debra Rubano 1975 Assistant Secretary | | Vice President and Corporate Counsel (since November 2020) of Prudential; Assistant Secretary (since March 2022) of the PGIM Private Real Estate Fund, Inc; Assistant Secretary (since September 2022) of the PGIM Private Credit Fund; formerly Director and Senior Counsel of Allianz Global Investors U.S. Holdings LLC (2010-2020) and Assistant Secretary of numerous funds in the Allianz fund complex (2015-2020). | | Since December 2020 |
| | | |
Christian J. Kelly 1975 Chief Financial Officer | | Vice President, Global Head of Fund Administration of PGIM Investments LLC (since November 2018); Chief Financial Officer (since March 2023) of PGIM Investments mutual funds, closed end funds and ETFs, Advanced Series Trust Portfolios, Prudential Series Funds and Prudential Gibraltar Fund; Chief Financial Officer of PGIM Private Credit Fund (since September 2022); Chief Financial Officer of PGIM Private Real Estate Fund, Inc. (since July 2022); formerly Treasurer and Principal Financial Officer (January 2019- March 2023) of PGIM Investments mutual funds, closed end funds and ETFs, Advanced Series Trust Portfolios, Prudential Series Funds and Prudential Gibraltar Fund; formerly Treasurer and Principal Financial Officer (March 2022 – July 2022) of the PGIM Private Real Estate Fund, Inc.; formerly Director of Fund Administration of Lord Abbett & Co. LLC (2009-2018), Treasurer and Principal Accounting Officer of the Lord Abbett Family of Funds (2017-2018); Director of Accounting, Avenue Capital Group (2008-2009); Senior Manager, Investment Management Practice of Deloitte & Touche LLP (1998-2007). | | Since January 2019 |
| | | |
Lana Lomuti 1967 Assistant Treasurer | | Vice President (since 2007) within PGIM Investments Fund Administration; formerly Assistant Treasurer (December 2007-February 2014) of The Greater China Fund, Inc.; formerly Director (2005-2007) within PGIM Investments Fund Administration. | | Since December 2017 |
| | | | |
| |
| Fund Officers(a) |
| | | |
Name Year of Birth Fund Position | | Principal Occupation(s) During Past Five Years | | Length of Service as Fund
Officer |
| | | |
Russ Shupak 1973 Treasurer and Principal Accounting Officer | | Vice President (since 2017) within PGIM Investments Fund Administration; Treasurer and Principal Accounting Officer of PGIM Investments mutual funds, closed end funds and ETFs (since March 2023); Treasurer and Principal Accounting Officer (since July 2022) of the PGIM Private Real Estate Fund, Inc.; Assistant Treasurer (since September 2022) of the PGIM Private Credit Fund; formerly Assistant Treasurer (March 2022 – July 2022) of the PGIM Private Real Estate Fund, Inc.; Assistant Treasurer of Advanced Series Trust Portfolios, Prudential Series Funds and Prudential Gibraltar Fund (since October 2019); formerly Director (2013-2017) within PGIM Investments Fund Administration. | | Since October 2019 |
| | | |
Deborah Conway 1969 Assistant Treasurer | | Vice President (since 2017) within PGIM Investments Fund Administration; Assistant Treasurer (since September 2022) of the PGIM Private Credit Fund; Assistant Treasurer (since March 2022) of the PGIM Private Real Estate Fund, Inc.; formerly Director (2007-2017) within PGIM Investments Fund Administration. | | Since October 2019 |
| | | |
Elyse M. McLaughlin 1974 Assistant Treasurer | | Vice President (since 2017) within PGIM Investments Fund Administration; Treasurer and Principal Accounting Officer of the Advanced Series Trust, the Prudential Series Fund and the Prudential Gibraltar Fund (since March 2023); Treasurer and Principal Accounting Officer (since September 2022) of the PGIM Private Credit Fund; Assistant Treasurer (since March 2022) of the PGIM Private Real Estate Fund, Inc.; Assistant Treasurer of PGIM Investments mutual funds, closed end funds and ETFs (since October 2019); formerly Director (2011-2017) within PGIM Investments Fund Administration. | | Since October 2019 |
| | | |
Robert W. McCormack 1973 Assistant Treasurer | | Vice President (since 2019) within PGIM Investments Fund Administration; Assistant Treasurer (Since March 2023) of PGIM Investments mutual funds, closed end funds, ETFs, Advanced Series Trust Portfolios, Prudential Series Funds and Prudential Gibraltar Fund; Assistant Treasurer (since September 2022) of the PGIM Private Credit Fund; Assistant Treasurer (since March 2022) of the PGIM Private Real Estate Fund, Inc.; formerly Director (2016-2019) within PGIM Investments Fund Administration; formerly Vice President within Goldman, Sachs & Co. Investment Management Controllers (2008- 2016), Assistant Treasurer of Goldman Sachs Family of Funds (2015-2016). | | Since March 2023 |
| | |
| Visit our website at pgim.com/investments | | |
| | | | |
| |
| Fund Officers(a) |
| | | |
Name Year of Birth Fund Position | | Principal Occupation(s) During Past Five Years | | Length of Service as Fund Officer |
| | | |
Kelly Florio 1978 Anti-Money Laundering Compliance Officer | | Vice President, Corporate Compliance, Global Compliance Programs and Compliance Risk Management (since December 2021) of Prudential; formerly, Head of Fraud Risk Management (October 2019 to December 2021) at New York Life Insurance Company; formerly, Head of Key Risk Area Operations (November 2018 to October 2019), Director of the US Anti-Money Laundering Compliance Unit (2009-2018) and Bank Loss Prevention Associate (2006 -2009) at MetLife. | | Since June 2022 |
(a) Excludes Mr. Parker and Mr. Benjamin, interested Board Members who also serve as President and Vice President, respectively.
Explanatory Notes to Tables:
| ∎ | | Board Members are deemed to be “Interested,” as defined in the 1940 Act, by reason of their affiliation with PGIM Investments LLC and/or an affiliate of PGIM Investments LLC. |
| ∎ | | Unless otherwise noted, the address of all Board Members and Officers is c/o PGIM Investments LLC, 655 Broad Street, Newark, New Jersey 07102-4410. |
| ∎ | | There is no set term of office for Board Members or Officers. The Board Members have adopted a retirement policy, which calls for the retirement of Board Members on December 31 of the year in which they reach the age of 75. |
| ∎ | | “Other Directorships Held” includes all directorships of companies required to register or file reports with the SEC under the 1934 Act (that is, “public companies”) or other investment companies registered under the 1940 Act. |
| ∎ | | “Portfolios Overseen” includes such applicable investment companies managed by PGIM Investments LLC and overseen by the trustee/director. The investment companies for which PGIM Investments LLC serves as manager include the PGIM Mutual Funds, Target Funds, PGIM ETF Trust, PGIM Private Real Estate Fund, Inc., PGIM Private Credit Fund, PGIM High Yield Bond Fund, Inc., PGIM Global High Yield Fund, Inc., PGIM Short Duration High Yield Opportunities Fund, The Prudential Series Fund, Prudential’s Gibraltar Fund, Inc. and the Advanced Series Trust. |
| ∎ | | As used in the Fund Officers table “Prudential” means The Prudential Insurance Company of America. |
| | | | |
| | | |
⬛ MAIL 655 Broad Street Newark, NJ 07102 | | ⬛ TELEPHONE (800) 225-1852 | | ⬛ WEBSITE pgim.com/investments |
|
| |
PROXY VOTING The Board of Trustees delegated to the Funds’ subadviser the responsibility for voting any proxies and maintaining proxy recordkeeping with respect to each Fund. A description of these proxy voting policies and procedures is available without charge, upon request, by calling (800) 225-1852 or by visiting the Securities and Exchange Commission’s website at sec.gov. Information regarding how each Fund voted proxies relating to portfolio securities during the most recent 12-month period ended June 30 is available on the Funds’ website and on the Securities and Exchange Commission’s website. |
|
| |
TRUSTEES Ellen S. Alberding · Kevin J. Bannon · Scott E. Benjamin · Linda W. Bynoe · Barry H. Evans · Keith F. Hartstein · Laurie Simon Hodrick · Stuart S. Parker · Brian K. Reid · Grace C. Torres |
|
| |
OFFICERS Stuart S. Parker, President · Scott E. Benjamin, Vice President · Christian J. Kelly, Chief Financial Officer · Claudia DiGiacomo, Chief Legal Officer ·
Andrew Donohue, Chief Compliance Officer · Russ Shupak, Treasurer and Principal Accounting Officer · Kelly Florio, Anti-Money Laundering
Compliance Officer · Andrew R. French, Secretary · Melissa Gonzalez, Assistant Secretary · Kelly A. Coyne, Assistant Secretary · Patrick E.
McGuinness, Assistant Secretary · Debra Rubano, Assistant Secretary · Lana Lomuti, Assistant Treasurer · Elyse M. McLaughlin, Assistant Treasurer ·
Deborah Conway, Assistant Treasurer · Robert W. McCormack, Assistant Treasurer |
| | | | |
| MANAGER | | PGIM Investments LLC | | 655 Broad Street Newark, NJ 07102 |
| | |
| SUBADVISER | | Jennison Associates LLC | | 466 Lexington Avenue New York, NY 10017 |
| | |
| DISTRIBUTOR | | Prudential Investment Management Services LLC | | 655 Broad Street Newark, NJ 07102 |
| | |
| CUSTODIAN/TRANSFER AGENT | | The Bank of New York Mellon | | 240 Greenwich Street New York, NY 10286 |
| | |
| INDEPENDENT REGISTERED PUBLIC ACCOUNTING FIRM | | PricewaterhouseCoopers LLP | | 300 Madison Avenue New York, NY 10017 |
| | |
| FUND COUNSEL | | Willkie Farr & Gallagher LLP | | 787 Seventh Avenue New York, NY 10019 |
|
An investor should consider the investment objectives, risks, charges, and expenses of each Funds carefully before investing. The prospectus and summary prospectus contain this and other information about the Fund. An investor may obtain the prospectus and summary prospectus by visiting our website at pgim.com/investments or by calling (800) 225-1852. The prospectus and summary prospectus should be read carefully before investing. |
|
E-DELIVERY To receive your fund documents online, go to pgim.com/investments/resource/edelivery and enroll. Instead of receiving printed documents by mail, you will receive notification via email when new materials are available. You can cancel your enrollment or change your email address at any time by visiting the website address above. |
|
SHAREHOLDER COMMUNICATIONS WITH TRUSTEES Shareholders can communicate directly with the Board of Trustees by writing to the Chair of the Board, PGIM Jennison ETFs, PGIM Investments, Attn: Board of Trustees, 655 Broad Street, Newark, NJ 07102. Shareholders can communicate directly with an individual Trustee by writing to that Trustee at the same address. Communications are not screened before being delivered to the addressee. |
|
AVAILABILITY OF PORTFOLIO HOLDINGS On each business day, before commencement of trading on the Exchange, the Fund will disclose on www.pgiminvestments.com the Fund’s portfolio holdings that will form the basis for the Fund’s calculation of NAV at the end of the business day. The Fund files its complete schedule of portfolio holdings with the Securities and Exchange Commission for the first and third quarters of each fiscal year as an exhibit to its reports on Form N-PORT. The Fund’s Form N-PORT filings are available on the Commission’s website at sec.gov. |
|
The Fund’s Statement of Additional Information contains additional information about the Fund’s Trustees and is available without charge, upon request, by calling (800) 225-1852. |
Funds:
| | | | |
| | | |
ARE NOT INSURED BY THE FDIC OR ANY FEDERAL GOVERNMENT AGENCY | | MAY LOSE VALUE | | ARE NOT A DEPOSIT OF OR GUARANTEED BY ANY BANK OR ANY BANK AFFILIATE |

PGIM JENNISON ETFs
| | |
| |
| Fund | | Ticker Symbol |
| |
PGIM Jennison Focused Growth ETF | | PJFG |
| |
PGIM Jennison Focused Value ETF | | PJFV |
ETF1009E

PGIM PORTFOLIO BALLAST ETF
(PBL)
ANNUAL REPORT
AUGUST 31, 2023

To enroll in e-delivery, go to pgim.com/investments/resource/edelivery
Table of Contents
This report is not authorized for distribution to prospective investors unless preceded or accompanied by a current prospectus.
The views expressed in this report and information about the Fund’s portfolio holdings are for the period covered by this report and are subject to change thereafter.
Exchange-traded funds are distributed by Prudential Investment Management Services LLC, a Prudential Financial company, member SIPC. PGIM Quantitative Solutions LLC, a wholly owned subsidiary of PGIM, Inc. (PGIM), is a registered investment adviser and Prudential Financial company. © 2023 Prudential Financial, Inc. and its related entities. PGIM and the PGIM logo are service marks of Prudential Financial, Inc. and its related entities, registered in many jurisdictions worldwide.
2 Visit our website at pgim.com/investments
Letter from the President
| | |

| | Dear Shareholder: We hope you find the annual report for the PGIM Portfolio Ballast ETF informative and useful. The report covers performance for the period from the Fund’s inception on December 12, 2022 through August 31, 2023. Although central banks raised interest rates aggressively to tame surging inflation during the period, the global economy and financial markets demonstrated resilience. Employers continued to hire, consumers continued to spend, home prices rose, and recession fears receded. |
Stocks fell early in the period, bottomed in October, and then began a rally that eventually ended a bear market. Despite a banking industry crisis in March, stocks have continued to rise globally throughout 2023 as inflation cooled and the Federal Reserve slowed the pace of its rate hikes. Equities in both US and international markets posted gains during the period.
Bond market returns were mixed during the period as rising interest rates lifted yields to their highest level in two decades. US and global investment-grade bonds fell, while US high yield corporate bonds and emerging-market debt rose.
Regarding your investments with PGIM, we believe it is important to maintain a diversified portfolio of funds consistent with your tolerance for risk, time horizon, and financial goals. Your financial advisor can help you create a diversified investment plan that may include funds covering all the basic asset classes and that reflects your personal investor profile and risk tolerance. However, diversification and asset allocation strategies do not assure a profit or protect against loss in declining markets.
At PGIM Investments, we provide access to active investment strategies across the global markets in the pursuit of consistent outperformance for investors. PGIM is the world’s 14th-largest investment manager with more than $1.3 trillion in assets under management. Our scale and investment expertise allow us to deliver a diversified suite of actively managed solutions across a broad spectrum of asset classes and investment styles.
Thank you for choosing our family of funds.
Sincerely,

Stuart S. Parker, President
PGIM Portfolio Ballast ETF
October 16, 2023
PGIM Portfolio Ballast ETF 3
Your Fund’s Performance (unaudited)
Performance data quoted represent past performance. Past performance does not guarantee future results. The investment return and principal value of an investment will fluctuate so that an investor’s shares, when sold, may be worth more or less than their original cost. Current performance may be lower or higher than the past performance data quoted. An investor may obtain performance data as of the most recent month-end by visiting our website at pgim.com/investments or by calling (800) 225-1852.
| | |
| |
| | | Total Returns as of 8/31/23*
Since Inception (%) |
| |
Net Asset Value (NAV) | | 7.02 (12/12/2022) |
| |
Market Price** | | 6.73 (12/12/2022) |
| |
S&P 500 Index | | |
| |
| | | 11.89 |
*Not annualized
**The market price is determined using the midpoint between the highest bid and the lowest offer on the listing exchange, as of the time that the Fund’s NAV is calculated. The first day of secondary market trading is typically several days after the date on which the Fund commenced investment operations; therefore, the NAV of the Fund is used as a proxy for the period from inception of investment operations to the first day of secondary market trading to calculate the market price returns. Since Inception returns are provided since the Fund has less than 10 fiscal years of returns.
Since Inception returns for the Index are measured from the closest month-end to the Fund’s inception date.
The returns in the table do not reflect the deduction of taxes that a shareholder would pay on Fund distributions or following the sale of Fund shares.
Market returns do not include brokerage commissions that may be payable on secondary market transactions. If brokerage commissions were included, market returns would be lower. Market and NAV returns assume that dividends and capital gain distributions, if any, have been reinvested in the Fund at market price and NAV, respectively.
4 Visit our website at pgim.com/investments
Growth of a $10,000 Investment (unaudited)
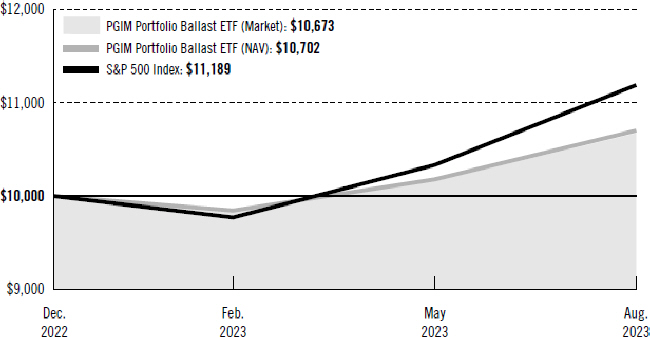
The graph compares a $10,000 investment in the Fund with a similar investment in the S&P 500 Index by portraying the initial account values at the commencement of operations (December 12, 2022) and the account values at the end of the current fiscal year (August 31, 2023) as measured on a quarterly basis. The Fund assumes an initial investment on December 12, 2022, while the Index assume that the initial investment occurred on November 30, 2022. For purposes of the graph, and unless otherwise indicated, it has been assumed that (a) all recurring fees (including management fees) were deducted and (b) all dividends and distributions were reinvested. Without waiver of fees and/or expense reimbursements, if any, the returns would have been lower.
Past performance does not predict future performance. Total returns and the ending account values in the graphs include changes in share price and reinvestment of dividends and capital gains distributions in a hypothetical investment for the periods shown. The Fund’s total returns do not reflect the deduction of income taxes on an individual’s investment. Taxes may reduce your actual investment returns on income or gains paid by the Fund or any gains you may realize if you sell your shares.
PGIM Portfolio Ballast ETF 5
Your Fund’s Performance (continued)
Benchmark Definition
S&P 500 Index*—The S&P 500 Index is an unmanaged index of over 500 stocks of large US public companies. It gives a broad look at how stock prices in the United States have performed.
*The S&P 500 Index is a product of S&P Dow Jones Indices LLC and/or its affiliates and has been licensed for use by PGIM, Inc. and/or its affiliates. Copyright © 2023 S&P Dow Jones Indices LLC, a division of S&P Global, Inc., and/or its affiliates. All rights reserved. Redistribution or reproduction in whole or in part are prohibited without written permission of S&P Dow Jones Indices LLC. For more information on any of S&P Dow Jones Indices LLC’s indices please visit www.spdji.com. S&P® is a registered trademark of S&P Global and Dow Jones® is a registered trademark of Dow Jones Trademark Holdings LLC.
Investors cannot invest directly in an index. The returns for the Index would be lower if they included the effects of operating expenses or taxes that may be paid by an investor.
Presentation of Fund Holdings as of 8/31/23
| | |
| |
| Top Future and Option Holdings | | % of Net Assets |
| |
5-Year U.S. Treasury Notes | | 48.0% |
| |
2-Year U.S. Treasury Notes | | 9.4% |
| |
S&P 500 E-Mini Index | | 3.2% |
| |
10-Year U.S. Treasury Notes | | 0.8% |
| |
S&P 500 Index (FLEX) | | 0.1% |
6 Visit our website at pgim.com/investments
Strategy and Performance Overview*
(unaudited)
How did the Fund perform?
The PGIM Portfolio Ballast ETF returned 7.02%, based on net asset value, in the reporting period from the Fund’s inception on December 12, 2022, through August 31, 2023. The Fund underperformed the 11.89% return of the S&P 500 Index (the Index) from November 30, 2022 through August 31, 2023.
What were the market conditions?
| ● | | Global markets were off to the races in 2023, with broad-based gains across equities, despite a slight pullback in August. However, uncertainty regarding inflation and US Federal Reserve (Fed) policy led to a tug of war between risk-on and risk-off market sentiment. |
| ● | | On the inflation front, the Fed signaled that it may not be done hiking interest rates, and the economy remained resilient. Strong, underlying price pressures suggested that core inflation could remain elevated, supporting the odds that interest rates would stay high. US growth surprised to the upside, with a “soft landing” scenario becoming the market consensus. |
What worked?
| ● | | The Fund benefited from equity exposure in line with its expected 60% average allocation over a market cycle. In terms of interest rate exposure, shorter duration than the expected average fixed income exposure over a market cycle added value. These exposures were effected through the use of derivatives (futures and options). |
What didn’t work?
| ● | | Declining implied volatility and time decay of our options positions detracted from Fund performance. |
Current outlook
| ● | | PGIM Quantitative Solutions sees the current mosaic of macroeconomic and market data as historically consistent with recessions and lackluster risk-asset returns. Despite the positive performance of risk assets so far in 2023, it appears more prudent to err on the side of caution, waiting for evidence that supports the continuation of the risk-on rally. A still-hawkish Fed, stricter bank lending, negative business surveys, and high valuations are all reasons to favor quality and safety. |
| ● | | PGIM Quantitative Solutions remains skeptical that markets have somehow skipped the end of the business cycle; markets rarely bottom before a recession. At the same time, sustained economic strength at the end of the cycle could keep investor optimism higher for longer. |
| ● | | The Fund is positioned to participate in any more equity upside, and to provide downside protection in case of a downturn. |
*This strategy and performance overview, which discusses what strategies or holdings (including derivatives, if applicable) affected the Fund’s performance, is compiled based on how the Fund performed relative to the Fund’s benchmark index and is viewed for performance attribution purposes at the aggregate Fund level, which in most instances will not directly correlate to the amounts disclosed in the Statement of Operations which conform to US generally accepted accounting principles.
PGIM Portfolio Ballast ETF 7
Fees and Expenses (unaudited)
As a shareholder of a Fund, you incur ongoing costs, including investment management fees. This example is intended to help you understand your ongoing costs (in dollars) of investing in a Fund and to compare these costs with the ongoing costs of investing in other funds.
The example is based on an investment of $1,000 held through the six-month period ended August 31, 2023. The example is for illustrative purposes only.
Actual Expenses
The first line in the table below provides information about actual account values and actual expenses. You may use the information on this line, together with the amount you invested, to estimate the expenses that you paid over the period. Simply divide your account value by $1,000 (for example, an $8,600 account value ÷ $1,000 = 8.6), then multiply the result by the number on the first line under the heading “Expenses Paid During the Six-Month Period” to estimate the expenses you paid on your account during this period.
Hypothetical Example for Comparison Purposes
The second line in the table below provides information about hypothetical account values and hypothetical expenses based on a Fund’s actual expense ratio and an assumed rate of return of 5% per year before expenses, which is not a Fund’s actual return. The hypothetical account values and expenses may not be used to estimate the actual ending account balance or expenses you paid for the period. You may use this information to compare the ongoing costs of investing in a Fund and other funds. To do so, compare this 5% hypothetical example with the 5% hypothetical examples that appear in the shareholder reports of the other funds.
Please note that the expenses shown in the table are meant to highlight your ongoing costs only and do not reflect any transactional costs or brokerage commissions paid on purchases and sales of Fund shares. Therefore, the ending account values and expenses paid for the period are useful in comparing ongoing costs only and will not help you determine the relative total costs of owning different funds. In addition, if these transactional costs were included, your costs would have been higher.
| | | | | | | | |
| | | | |
PGIM Portfolio Ballast
ETF | | Beginning Account Value March 1, 2023 | | Ending Account Value August 31, 2023 | | Annualized Expense
Ratio Based on the Six-Month Period | | Expenses Paid During the Six-Month Period* |
| | | | |
| Actual | | $1,000.00 | | $1,087.20 | | 0.45% | | $2.37 |
| | | | |
Hypothetical | | $1,000.00 | | $1,022.94 | | 0.45% | | $2.29 |
*Fund expenses (net of fee waivers or subsidies, if any) are equal to the annualized expense ratio (provided in the table), multiplied by the average account value over the period, multiplied by the 184 days in the six-month period ended August 31, 2023, and divided by the 365 days in the Fund’s fiscal year ended August 31, 2023 (to reflect the six-month period). Expenses presented in the table include the expenses of any underlying portfolios in which the Fund may invest.
8 Visit our website at pgim.com/investments
Schedule of Investments
as of August 31, 2023
| | | | | | | | | | | | | | | | |
| | | | |
| Description | | | | | | | | Shares | | | Value | |
| | |
SHORT-TERM INVESTMENTS 100.0% | | | | | | | | | |
| | |
AFFILIATED MUTUAL FUND 5.7% | | | | | | | | | |
PGIM Core Government Money Market Fund
(cost $1,615,814)(wj) | | | | | | | | | | | 1,615,814 | | | $ | 1,615,814 | |
| | | | | | | | | | | | | | | | |
| | | | |
| | | Interest Rate | | | Maturity Date | | | Principal Amount (000)# | | | | |
| | | | |
U.S. TREASURY OBLIGATIONS(n) 71.1% | | | | | | | | | | | | | | | | |
U.S. Treasury Bills | | | 4.988% | | | | 10/26/23 | | | | 10,000 | | | | 9,919,174 | |
U.S. Treasury Bills(k) | | | 5.480 | | | | 02/08/24 | | | | 10,450 | | | | 10,204,823 | |
| | | | | | | | | | | | | | | | |
| | | | |
TOTAL U.S. TREASURY OBLIGATIONS | | | | | | | | | | | | | | | | |
(cost $20,130,264) | | | | | | | | | | | | | | | 20,123,997 | |
| | | | | | | | | | | | | | | | |
| | | | |
OPTION PURCHASED*~ 23.2% | | | | | | | | | | | | | | | | |
(cost $4,969,014) | | | | | | | | | | | | | | | 6,565,219 | |
| | | | |
TOTAL INVESTMENTS 100.0% | | | | | | | | | | | | | | | | |
(cost $26,715,092) | | | | | | | | | | | | | | | 28,305,030 | |
Other assets in excess of liabilities(z) 0.0% | | | | | | | | | | | | | | | 10,895 | |
| | | | | | | | | | | | | | | | |
| | | | |
NET ASSETS 100.0% | | | | | | | | | | | | | | $ | 28,315,925 | |
| | | | | | | | | | | | | | | | |
Below is a list of the abbreviation(s) used in the annual report:
USD—US Dollar
OTC—Over-the-counter
S&P—Standard & Poor’s
SGA—SG Americas Securities, LLC
| * | Non-income producing security. |
| # | Principal or notional amount is shown in U.S. dollars unless otherwise stated. |
| ~ | See tables subsequent to the Schedule of Investments for options detail. Options with maturity dates greater than one year from date of acquisition would be considered long-term investments. |
| (k) | Represents security, or a portion thereof, segregated as collateral for centrally cleared/exchange-traded derivatives. |
| (n) | Rate shown reflects yield to maturity at purchased date. |
| (wj) | PGIM Investments LLC, the manager of the Fund, also serves as manager of the PGIM Core Government Money Market Fund. |
| (z) | Includes net unrealized appreciation/(depreciation) and/or market value of the below holdings which are excluded from the Schedule of Investments: |
See Notes to Financial Statements.
PGIM Portfolio Ballast ETF 9
Schedule of Investments (continued)
as of August 31, 2023
Options Purchased:
Exchange Traded
| | | | | | | | | | | | | | | | | | | | | | |
Description | | Call/
Put | | Expiration
Date | | | Strike | | | Contracts | | | Notional
Amount
(000)# | | | Value | |
S&P 500 Index (FLEX) | | Call | | | 12/07/27 | | | $ | 3,970.00 | | | | 50 | | | | 5 | | | $ | 6,565,219 | |
| | | | | | | | | | | | | | | | | | | | | | |
(cost $4,969,014) | | | | | | | | | | | | | | | | | | | | | | |
Futures contracts outstanding at August 31, 2023:
| | | | | | | | | | | | | | | | | | | | |
Number
of
Contracts | | Type | | Expiration
Date | | | Current
Notional
Amount | | | Value / Unrealized
Appreciation
(Depreciation) |
| | | | |
Long Positions: | | | | | | | | | | | | | | | |
13 | | 2 Year U.S. Treasury Notes | | | Dec. 2023 | | | $ | 2,649,461 | | | | | | | $ | 8,616 | | | |
127 | | 5 Year U.S. Treasury Notes | | | Dec. 2023 | | | | 13,579,078 | | | | | | | | 89,447 | | | |
2 | | 10 Year U.S. Treasury Notes | | | Dec. 2023 | | | | 222,063 | | | | | | | | 1,953 | | | |
4 | | S&P 500 E-Mini Index | | | Sep. 2023 | | | | 903,200 | | | | | | | | 16,457 | | | |
| | | | | | | | | | | | | | | | | | | | |
| | | | | | |
| | | | | | | | | | | | | | | | $ | 116,473 | | | |
| | | | | | | | | | | | | | | | | | | | |
Summary of Collateral for Centrally Cleared/Exchange-traded Derivatives:
Cash and securities segregated as collateral, including pending settlement for closed positions, to cover requirements for centrally cleared/exchange-traded derivatives are listed by broker as follows:
| | | | | | | | | | |
Broker | | Cash and/or Foreign Currency | | Securities Market Value |
| | |
SGA | | | $ | — | | | | $ | 429,677 | |
| | | | | | | | | | |
Fair Value Measurements:
Various inputs are used in determining the value of the Fund’s investments. These inputs are summarized in the three broad levels listed below.
Level 1—unadjusted quoted prices generally in active markets for identical securities.
Level 2—quoted prices for similar securities, interest rates and yield curves, prepayment speeds, foreign currency exchange rates and other observable inputs.
Level 3—unobservable inputs for securities valued in accordance with Board approved fair valuation procedures.
The following is a summary of the inputs used as of August 31, 2023 in valuing such portfolio securities:
| | | | | | | | | | | | |
| | | Level 1 | | | Level 2 | | | Level 3 | |
Short-Term Investments | | | | | | | | | | | | |
Affiliated Mutual Fund | | $ | 1,615,814 | | | $ | — | | | | $— | |
See Notes to Financial Statements.
10
| | | | | | | | | | | | |
| | | Level 1 | | | Level 2 | | | Level 3 | |
Short-Term Investments (continued) | | | | | | | | | | | | |
U.S. Treasury Obligations | | $ | — | | | $ | 20,123,997 | | | | $— | |
Option Purchased | | | — | | | | 6,565,219 | | | | — | |
| | | | | | | | | | | | |
Total | | $ | 1,615,814 | | | $ | 26,689,216 | | | | $— | |
| | | | | | | | | | | | |
| | | |
Other Financial Instruments* | | | | | | | | | | | | |
Assets | | | | | | | | | | | | |
Futures Contracts | | $ | 116,473 | | | $ | — | | | | $— | |
| | | | | | | | | | | | |
| * | Other financial instruments are derivative instruments not reflected in the Schedule of Investments, such as futures, forwards and centrally cleared swap contracts, which are recorded at the unrealized appreciation (depreciation) on the instrument, and OTC swap contracts which are recorded at fair value. |
Industry Classification:
The industry classification of investments and other assets in excess of liabilities shown as a percentage of net assets as of August 31, 2023 were as follows:
| | | | |
U.S. Treasury Obligations | | | 71.1 | % |
Option Purchased | | | 23.2 | |
Affiliated Mutual Fund | | | 5.7 | |
| | | | |
| | | 100.0 | |
Other assets in excess of liabilities | | | 0.0 | * |
| | | | |
| | | 100.0 | % |
| | | | |
Effects of Derivative Instruments on the Financial Statements and Primary Underlying Risk Exposure:
The Fund invested in derivative instruments during the reporting period. The primary types of risk associated with these derivative instruments are equity risk and interest rate risk. See the Notes to Financial Statements for additional detail regarding these derivative instruments and their risks. The effect of such derivative instruments on the Fund’s financial position and financial performance as reflected in the Statement of Assets and Liabilities and Statement of Operations is presented in the summary below.
Fair values of derivative instruments as of August 31, 2023 as presented in the Statement of Assets and Liabilities:
See Notes to Financial Statements.
PGIM Portfolio Ballast ETF 11
Schedule of Investments (continued)
as of August 31, 2023
| | | | | | | | | | | | |
| | | Asset Derivatives | | | Liability Derivatives | |
| | | | |
Derivatives not accounted for as hedging instruments, carried at fair value | | Statement of Assets and Liabilities Location | | Fair
Value | | | Statement of Assets and Liabilities Location | | Fair
Value | |
Equity contracts | | Due from/to
broker-variation margin
futures | | $ | 16,457 | * | | — | | | $— | |
Equity contracts | | Unaffiliated investments | | | 6,565,219 | | | — | | | — | |
Interest rate contracts | | Due from/to broker-variation margin futures | | | 100,016 | * | | — | | | — | |
| | | | | | | | | | | | |
| | | | |
| | | | $ | 6,681,692 | | | | | | $— | |
| | | | | | | | | | | | |
| * | Includes cumulative appreciation (depreciation) as reported in the schedule of open futures and centrally cleared swap contracts. Only unsettled variation margin receivable (payable) is reported within the Statement of Assets and Liabilities. |
The effects of derivative instruments on the Statement of Operations for the period ended August 31, 2023 are as follows:
| | | | | | | | | | |
Amount of Realized Gain (Loss) on Derivatives Recognized in Income |
Derivatives not accounted for as hedging instruments, carried at fair value | | | | Futures |
| | |
Equity contracts | | | | | | | | $ | 81,140 | |
Interest rate contracts | | | | | | | | | (614,855 | ) |
| | | | | | | | | | |
Total | | | | | | | | $ | (533,715 | ) |
| | | | | | | | | | |
|
Change in Unrealized Appreciation (Depreciation) on Derivatives Recognized in Income |
Derivatives not accounted for as hedging instruments, carried at fair value | | Options
Purchased(1) | | Futures |
Equity contracts | | | $ | 1,596,205 | | | | $ | 16,457 | |
Interest rate contracts | | | | — | | | | | 100,016 | |
| | | | | | | | | | |
| | |
Total | | | $ | 1,596,205 | | | | $ | 116,473 | |
| | | | | | | | | | |
| (1) | Included in net change in unrealized appreciation (depreciation) on investments in the Statement of Operations. |
For the period ended August 31, 2023, the Fund’s average volume of derivative activities is as follows:
| | |
| Derivative Contract Type | | Average Volume of Derivative Activities* |
Options Purchased (1) | | $ 4,969,014 |
Futures Contracts - Long Positions (2) | | 16,508,016 |
| * | Average volume is based on average quarter end balances as noted for the period ended August 31, 2023. |
| (2) | Notional Amount in USD. |
See Notes to Financial Statements.
12
Statement of Assets and Liabilities
as of August 31, 2023
| | | | |
| |
Assets | | | | |
| |
Investments at value: | | | | |
| |
Unaffiliated investments (cost $25,099,278) | | $ | 26,689,216 | |
| |
Affiliated investments (cost $1,615,814) | | | 1,615,814 | |
| |
Due from broker—variation margin futures | | | 14,319 | |
| |
Dividends receivable | | | 7,318 | |
| | | | |
| |
Total Assets | | | 28,326,667 | |
| | | | |
| |
Liabilities | | | | |
Management fee payable | | | 10,742 | |
| | | | |
| |
Net Assets | | $ | 28,315,925 | |
| | | | |
| |
| | | | | |
| |
Net assets were comprised of: | | | | |
Common stock, at par | | $ | 1,060 | |
Paid-in capital in excess of par | | | 26,546,778 | |
Total distributable earnings (loss) | | | 1,768,087 | |
| | | | |
| |
Net assets, August 31, 2023 | | $ | 28,315,925 | |
| | | | |
| |
Net asset value, offering price and redemption price per share,
($28,315,925 ÷ 1,060,000 shares of common stock issued and outstanding) | | $ | 26.71 | |
| | | | |
See Notes to Financial Statements.
PGIM Portfolio Ballast ETF 13
Statement of Operations
For the Period December 12, 2022* through August 31, 2023
| | | | |
Net Investment Income (Loss) | | | | |
| |
Income | | | | |
Interest income | | $ | 647,327 | |
Affiliated dividend income | | | 38,730 | |
Unaffiliated dividend income | | | 33,058 | |
| | | | |
| |
Total income | | | 719,115 | |
| | | | |
| |
Expenses | | | | |
Management fee | | | 84,994 | |
| | | | |
| |
Net investment income (loss) | | | 634,121 | |
| | | | |
| |
Realized And Unrealized Gain (Loss) On Investments | | | | |
| |
Net realized gain (loss) on: | | | | |
Investment transactions | | | (1 | ) |
Futures transactions | | | (533,715 | ) |
| | | | |
| |
| | | (533,716 | ) |
| | | | |
| |
Net change in unrealized appreciation (depreciation) on: | | | | |
Investments | | | 1,589,938 | |
Futures | | | 116,473 | |
| | | | |
| |
| | | 1,706,411 | |
| | | | |
| |
Net gain (loss) on investment transactions | | | 1,172,695 | |
| | | | |
| |
Net Increase (Decrease) In Net Assets Resulting From Operations | | $ | 1,806,816 | |
| | | | |
| * | Commencement of operations. |
See Notes to Financial Statements.
14
Statement of Changes in Net Assets
| | | | | |
| |
| | | December 12, 2022* through
August 31, 2023 |
| |
Increase (Decrease) in Net Assets | | | | | |
| |
Operations | | | | | |
Net investment income (loss) | | | $ | 634,121 | |
Net realized gain (loss) on investment transactions | | | | (533,716 | ) |
Net change in unrealized appreciation (depreciation) on investments | | | | 1,706,411 | |
| | | | | |
| |
Net increase (decrease) in net assets resulting from operations | | | | 1,806,816 | |
| | | | | |
| |
Dividends and Distributions | | | | | |
Distributions from distributable earnings | | | | (38,729 | ) |
| | | | | |
| |
Fund share transactions | | | | | |
Net proceeds from shares sold (1,060,000 shares) | | | | 26,547,838 | |
| | | | | |
| |
Total increase (decrease) | | | | 28,315,925 | |
| |
Net Assets: | | | | | |
| |
Beginning of period | | | | — | |
| | | | | |
| |
End of period | | | $ | 28,315,925 | |
| | | | | |
| * | Commencement of operations. |
See Notes to Financial Statements.
PGIM Portfolio Ballast ETF 15
Financial Highlights
| | | | | | | | | | |
| | | |
| | | | | | | | | | |
| | | December 12, 2022(a)
through August 31, 2023 | | |
Per Share Operating Performance(b): | | | | | | | | | | |
Net Asset Value, Beginning of Period | | | | $25.00 | | | | | | |
Income (loss) from investment operations: | | | | | | | | | | |
Net investment income (loss) | | | | 0.61 | | | | | | |
| Net realized and unrealized gain (loss) on investment transactions | | | | 1.14 | | | | | | |
Total from investment operations | | | | 1.75 | | | | | | |
Less Dividends and Distributions: | | | | | | | | | | |
Dividends from net investment income | | | | (0.04 | ) | | | | | |
Net asset value, end of period | | | | $26.71 | | | | | | |
Total Return(c): | | | | 7.02 | % | | | | | |
| | | | | | | | | | |
| | | |
Ratios/Supplemental Data: | | | | | | | | | | |
Net assets, end of period (000) | | | | $28,316 | | | | | | |
Average net assets (000) | | | | $26,311 | | | | | | |
Ratios to average net assets(d): | | | | | | | | | | |
Expenses after waivers and/or expense reimbursement | | | | 0.45 | %(e) | | | | | |
Expenses before waivers and/or expense reimbursement | | | | 0.45 | %(e) | | | | | |
Net investment income (loss) | | | | 3.36 | %(e) | | | | | |
Portfolio turnover rate(f) | | | | 0 | % | | | | | |
| (a) | Commencement of operations. |
| (b) | Calculated based on average shares outstanding during the period. |
| (c) | Total return is calculated assuming a purchase of a share on the first day and a sale on the last day of each period reported and includes reinvestment of dividends and distributions, if any. Total returns may reflect adjustments to conform to GAAP. Total returns for periods less than one full year are not annualized. |
| (d) | Does not include expenses of the underlying funds in which the Fund invests. |
| (f) | The Fund’s portfolio turnover rate is calculated in accordance with regulatory requirements, without regard to transactions involving short-term investments, certain derivatives and in-kind transactions (if any). If such transactions were included, the Fund’s portfolio turnover rate may be higher. |
See Notes to Financial Statements.
16
Notes to Financial Statements
PGIM ETF Trust (the “Registered Investment Company” or “RIC”) is registered under the Investment Company Act of 1940, as amended (“1940 Act”), as an open-end management investment company. The RIC is organized as a Delaware Statutory Trust. These financial statements relate only to the PGIM Portfolio Ballast ETF (the “Fund”), a series of the RIC. The Fund is classified as a non-diversified fund for purposes of the 1940 Act.
The investment objective of the Fund is to seek to provide long-term capital growth with reduced volatility compared to the equity market.
The Fund follows the investment company accounting and reporting guidance of the Financial Accounting Standards Board (“FASB”) Accounting Standard Codification (“ASC”) Topic 946 Financial Services — Investment Companies. The following is a summary of significant accounting policies followed by the Fund in the preparation of its financial statements. The policies conform to U.S. generally accepted accounting principles (“GAAP”). The Fund consistently follows such policies in the preparation of its financial statements.
Securities Valuation: The Fund holds securities and other assets and liabilities that are fair valued as of the close of each day (generally, 4:00 PM Eastern time) the New York Stock Exchange (“NYSE”) is open for trading. As described in further detail below, the Fund’s investments are valued daily based on a number of factors, including the type of investment and whether market quotations are readily available. The RIC’s Board of Trustees (the “Board”) has approved the Fund’s valuation policies and procedures for security valuation and designated PGIM Investments LLC (“PGIM Investments” or the “Manager”) as the “Valuation Designee,” as defined by Rule 2a-5(b) under the 1940 Act, to perform the fair value determination relating to all Fund investments. Pursuant to the Board’s oversight, the Valuation Designee has established a Valuation Committee to perform the duties and responsibilities as Valuation Designee under Rule 2a-5. The valuation procedures permit the Fund to utilize independent pricing vendor services, quotations from market makers, and alternative valuation methods when market quotations are either not readily available or not deemed representative of fair value. Fair value is the estimated price that would be received to sell an asset or paid to transfer a liability in an orderly transaction between market participants on the measurement date.
For the fiscal reporting period-end, securities and other assets and liabilities were fair valued at the close of the last U.S. business day. Trading in certain foreign securities may occur when the NYSE is closed (including weekends and holidays). Because such foreign securities trade in markets that are open on weekends and U.S. holidays, the values of some
PGIM Portfolio Ballast ETF 17
Notes to Financial Statements (continued)
of the Fund’s foreign investments may change on days when investors cannot purchase or redeem Fund shares.
Various inputs determine how the Fund’s investments are valued, all of which are categorized according to the three broad levels (Level 1, 2, or 3) detailed in the Schedule of Investments and referred to herein as the “fair value hierarchy” in accordance with FASB ASC Topic 820 — Fair Value Measurement.
Common or preferred stocks, exchange-traded funds (ETFs) and derivative instruments, if applicable, that are traded on a national securities exchange are valued at the last sale price as of the close of trading on the applicable exchange where the security principally trades. Securities traded via NASDAQ are valued at the NASDAQ official closing price. To the extent these securities are valued at the last sale price or NASDAQ official closing price, they are classified as Level 1 in the fair value hierarchy. In the event that no sale or official closing price on a valuation date exists, these securities are generally valued at the mean between the last reported bid and ask prices, or at the last bid price in the absence of an ask price. These securities are classified as Level 2 in the fair value hierarchy.
Investments in open-end funds (other than ETFs) are valued at their net asset values as of the close of the NYSE on the date of valuation. These securities are classified as Level 1 in the fair value hierarchy since they may be purchased or sold at their net asset values on the date of valuation.
Fixed income securities traded in the OTC market are generally classified as Level 2 in the fair value hierarchy. Such fixed income securities are typically valued using the market approach which generally involves obtaining data from an approved independent third-party vendor source. The Fund utilizes the market approach as the primary method to value securities when market prices of identical or comparable instruments are available. The third-party vendors’ valuation techniques used to derive the evaluated bid price are based on evaluating observable inputs, including but not limited to, yield curves, yield spreads, credit ratings, deal terms, tranche level attributes, default rates, cash flows, prepayment speeds, broker/dealer quotations and reported trades. Certain Level 3 securities are also valued using the market approach when obtaining a single broker quote or when utilizing transaction prices for identical securities that have been used in excess of five business days. During the reporting period, there were no changes to report with respect to the valuation approach and/or valuation techniques discussed above.
OTC and centrally cleared derivative instruments are generally classified as Level 2 in the fair value hierarchy. Such derivative instruments are typically valued using the market approach and/or income approach which generally involves obtaining data from an approved independent third-party vendor source. The Fund utilizes the market approach
18
when quoted prices in broker-dealer markets are available but also includes consideration of alternative valuation approaches, including the income approach. In the absence of reliable market quotations, the income approach is typically utilized for purposes of valuing derivatives such as interest rate swaps based on a discounted cash flow analysis whereby the value of the instrument is equal to the present value of its future cash inflows or outflows. Such analysis includes projecting future cash flows and determining the discount rate (including the present value factors that affect the discount rate) used to discount the future cash flows. In addition, the third-party vendors’ valuation techniques used to derive the evaluated derivative price is based on evaluating observable inputs, including but not limited to, underlying asset prices, indices, spreads, interest rates and exchange rates. Certain derivatives may be classified as Level 3 when valued using the market approach by obtaining a single broker quote or when utilizing unobservable inputs in the income approach. During the reporting period, there were no changes to report with respect to the valuation approach and/or valuation techniques discussed above.
Securities and other assets that cannot be priced according to the methods described above are valued based on policies and procedures approved by the Board. In the event that unobservable inputs are used when determining such valuations, the securities will be classified as Level 3 in the fair value hierarchy. Altering one or more unobservable inputs may result in a significant change to a Level 3 security’s fair value measurement.
When determining the fair value of securities, some of the factors influencing the valuation include: the nature of any restrictions on disposition of the securities; assessment of the general liquidity of the securities; the issuer’s financial condition and the markets in which it does business; the cost of the investment; the size of the holding and the capitalization of the issuer; the prices of any recent transactions or bids/offers for such securities or any comparable securities; and any available analyst media or other reports or information deemed reliable by the Valuation Designee regarding the issuer or the markets or industry in which it operates. Using fair value to price securities may result in a value that is different from a security’s most recent closing price and from the price used by other unaffiliated mutual funds to calculate their net asset values.
Options: The Fund purchased and/or wrote options in order to hedge against adverse market movements or fluctuations in value caused by changes in prevailing interest rates, value of equities or foreign currency exchange rates with respect to securities or financial instruments which the Fund currently owns or intends to purchase. The Fund may also use options to gain additional market exposure. The Fund’s principal reason for writing options is to realize, through receipt of premiums, a greater current return than would be realized on the underlying security alone. When the Fund purchases an option, it pays a premium and an amount equal to that premium is recorded as an asset. When the Fund writes an option, it receives a premium and an amount equal to that premium is recorded as a liability. The asset or liability is adjusted daily to reflect the current market value of the option. If an option expires unexercised, the Fund realizes a gain (loss) to the extent of the premium received or paid. If an option is exercised, the premium received or paid is recorded as an adjustment to the proceeds from the sale or the cost of the purchase in determining whether the Fund has
PGIM Portfolio Ballast ETF 19
Notes to Financial Statements (continued)
realized a gain (loss). The difference between the premium and the amount received or paid at the closing of a purchase or sale transaction is also treated as a realized gain (loss). Gain (loss) on purchased options is included in net realized gain (loss) on investment transactions. Gain (loss) on written options is presented separately as net realized gain (loss) on options written transactions.
The Fund, as writer of an option, may have no control over whether the underlying securities or financial instruments may be sold (called) or purchased (put). As a result, the Fund bears the market risk of an unfavorable change in the price of the security or financial instrument underlying the written option. The Fund, as purchaser of an OTC option, bears the risk of the potential inability of the counterparties to meet the terms of their contracts. With exchange-traded options contracts, there is minimal counterparty credit risk to the Fund since the exchanges’ clearinghouse acts as counterparty to all exchange-traded options and guarantees the options contracts against default.
When the Fund writes an option on a swap, an amount equal to any premium received by the Fund is recorded as a liability and is subsequently adjusted to the current market value of the written option on the swap. If a call option on a swap is exercised, the Fund becomes obligated to pay a fixed interest rate (noted as the strike price) and receive a variable interest rate on a notional amount. If a put option on a swap is exercised, the Fund becomes obligated to pay a variable interest rate and receive a fixed interest rate (noted as the strike price) on a notional amount. Premiums received from writing options on swaps that expire or are exercised are treated as realized gains upon the expiration or exercise of such options on swaps. The risk associated with writing put and call options on swaps is that the Fund will be obligated to be party to a swap agreement if an option on a swap is exercised.
Financial Futures Contracts: A financial futures contract is an agreement to purchase (long) or sell (short) an agreed amount of securities at a set price for delivery on a future date. Upon entering into a financial futures contract, the Fund is required to pledge to the broker an amount of cash and/or other assets equal to a certain percentage of the contract amount. This amount is known as the “initial margin.” Subsequent payments, known as “variation margin,” are made or received by the Fund each day, depending on the daily fluctuations in the value of the underlying security. Such variation margin is recorded for financial statement purposes on a daily basis as unrealized gain (loss). When the contract expires or is closed, the gain (loss) is realized and is presented in the Statement of Operations as net realized gain (loss) on futures transactions.
The Fund invested in financial futures contracts in order to gain exposure to equities and fixed income. The use of futures transactions involves the risk of imperfect correlation in movements in the price of futures contracts, interest rates and the underlying hedged assets. Since futures contracts are exchange-traded, there is minimal counterparty credit
20
risk to the Fund since the exchanges’ clearinghouse acts as counterparty to all exchange-traded futures and guarantees the futures contracts against default.
Securities Transactions and Net Investment Income: Securities transactions are recorded on the trade date. Realized gains (losses) from investment and currency transactions are calculated on the specific identification method. Dividend income is recorded on the ex-date, or for certain foreign securities, when the Fund becomes aware of such dividends. Expenses are recorded on an accrual basis, which may require the use of certain estimates by management that may differ from actual expense amounts. Net investment income or loss (other than class specific expenses and waivers, which are allocated as noted below) and unrealized and realized gains (losses) are allocated daily to each class of shares based upon the relative proportion of adjusted net assets of each class at the beginning of the day. Class specific expenses and waivers, where applicable, are charged to the respective share classes. Such class specific expenses and waivers include distribution fees and distribution fee waivers, shareholder servicing fees, transfer agent’s fees and expenses, registration fees and fee waivers and/or expense reimbursements, as applicable.
Taxes: It is the Fund’s policy to meet the requirements of the Internal Revenue Code applicable to regulated investment companies and to distribute all of its taxable net investment income and capital gains, if any, to its shareholders. Therefore, no federal income tax provision is required. Withholding taxes on foreign dividends, interest and capital gains, if any, are recorded, net of reclaimable amounts, at the time the related income is earned.
Dividends and Distributions: Dividends and distributions to shareholders, which are determined in accordance with federal income tax regulations and which may differ from GAAP, are recorded on the ex-date. Permanent book/tax differences relating to income and gain (loss) are reclassified between total distributable earnings (loss) and paid-in capital in excess of par, as appropriate. The chart below sets forth the expected frequency of dividend and capital gains distributions to shareholders. Various factors may impact the frequency of dividend distributions to shareholders, including but not limited to adverse market conditions or portfolio holding-specific events.
| | | | |
| | |
| Expected Distribution Schedule to Shareholders* | | Frequency | |
Net Investment Income | | | Annually | |
Short-Term Capital Gains | | | Annually | |
Long-Term Capital Gains | | | Annually | |
| * | Under certain circumstances, the Fund may make more than one distribution of short-term and/or long-term capital gains during a fiscal year. |
Estimates: The preparation of financial statements requires management to make estimates and assumptions that affect the reported amounts and disclosures in the financial statements. Actual results could differ from those estimates.
PGIM Portfolio Ballast ETF 21
Notes to Financial Statements (continued)
Pursuant to a management agreement with the RIC on behalf of the Fund (the Management Agreement), PGIM Investments manages the Fund’s investment operations and administers its business affairs. PGIM Investments is also responsible for supervising the Fund’s subadviser.
Pursuant to the management agreement relating to the Fund, there is a unitary fee structure for the fund whereby PGIM Investments is responsible for substantially all expenses of the Fund, except taxes, brokerage expenses, interest expenses, distribution fees or expenses, expenses incident to shareholder meetings and extraordinary expenses. The Fund may also pay for any costs or expenses of investing in other funds. For more information on the unitary management fee structure please refer to the Fund’s Statement of Additional Information.
The unitary fee paid to the Manager is accrued daily and payable monthly, at an annual rate of the Fund’s average daily net assets specified below.
| | | | |
| Fund | | Unitary
Fee Rate | |
PGIM Portfolio Ballast ETF | | | 0.45% | |
The Manager has entered into a subadvisory agreement (Subadvisory Agreement) with PGIM Quantitative Solutions LLC (“PGIM Quantitative Solutions” or the “subadviser”). The Manager pays for the services of the subadviser.
The Bank of New York Mellon (“BNY”) serves as the Custodian, Transfer Agent and Administrative Agent for the Trust. BNY receives compensation from the Manager and is reimbursed for expenses, including custodian, transfer agency and administration fees and certain out-of-pocket expenses including, but not limited to, postage, stationery, printing, allocable communication expenses and other costs. The Manager is responsible for compensating BNY under the Custodian, Transfer Agency and Service and Administration and Accounting Agreements.
Prudential Investment Management Services LLC (“PIMS” or the “Distributor”), acts as the distributor of the Fund, pursuant to the terms of a distribution agreement (“Distribution Agreement”) between the RIC and the Distributor. The Distributor is a subsidiary of Prudential. Shares are continuously offered for sale by the Distributor only. Although the Distributor does not receive any fees under the Distribution Agreement, the Manager or its affiliates may pay the Distributor for certain distribution related services.
PGIM Investments, PIMS and PGIM Quantitative Solutions are indirect, wholly-owned subsidiaries of Prudential Financial, Inc. (“Prudential”).
22
| 4. | Other Transactions with Affiliates |
The Fund may invest its overnight sweep cash in the PGIM Core Government Money Market Fund (the “Core Government Fund”), a series of the Prudential Government Money Market Fund, Inc., registered under the 1940 Act and managed by PGIM Investments. PGIM Investments and/or its affiliates are paid fees or reimbursed for providing their services to the Core Government Fund. In addition to the realized and unrealized gains on investments in the Core Government Fund, earnings from such investments are disclosed on the Statement of Operations as “Affiliated dividend income”
The Fund may enter into certain securities purchase or sale transactions under Board approved Rule 17a-7 procedures. Rule 17a-7 is an exemptive rule under the 1940 Act that, subject to certain conditions, permits purchase and sale transactions among affiliated investment companies, or between an investment company and a person that is affiliated solely by reason of having a common (or affiliated) investment adviser, common directors/trustees, and/or common officers. For the reporting period ended August 31, 2023, no Rule 17a-7 transactions were entered into by the Fund.
The aggregate cost of purchases and proceeds from sales of portfolio securities (excluding short-term investments and U.S. Government securities) for the reporting period ended August 31, 2023, were as follows:
| | |
| | |
| Cost of Purchases | | Proceeds from Sales |
$4,969,014 | | $— |
A summary of the cost of purchases and proceeds from sales of shares of an affiliated mutual fund for the period ended August 31, 2023, is presented as follows:
| | | | | | | | | | | | | | | | | | | | | | | | | | |
Value,
Beginning
of Period | | Cost of
Purchases | | | Proceeds
from Sales | | | Change in
Unrealized
Gain
(Loss) | | | Realized
Gain
(Loss) | | | Value,
End of
Period | | | Shares,
End of Period | | | Income |
| | | | |
Short-Term Investments - Affiliated Mutual Fund: | | | | | | | | | | | | | | | |
| | | | |
PGIM Core Government Money Market Fund(1)(wj) | | | | | | | | | | | | | | | |
$— | | $ | 15,827,316 | | | $ | 14,211,502 | | | | $— | | | | $— | | | $ | 1,615,814 | | | | 1,615,814 | | | $38,730 |
| (1) | The Fund did not have any capital gain distributions during the reporting period. |
| (wj) | PGIM Investments LLC, the manager of the Fund, also serves as manager of the PGIM Core Government Money Market Fund. |
| 6. | Distributions and Tax Information |
Distributions to shareholders, which are determined in accordance with federal income tax regulations and which may differ from GAAP, are recorded on the ex-date.
PGIM Portfolio Ballast ETF 23
Notes to Financial Statements (continued)
For the period ended August 31, 2023, the tax character of dividends paid as reflected in the Statement of Changes in Net Assets were as follows:
| | | | | | |
| | | | |
Ordinary Income | | Long-Term Capital Gains | | Tax Return of Capital | | Total Dividends and Distributions |
$38,729 | | $— | | $— | | $38,729 |
For the period ended August 31, 2023, the Fund had the following amounts of accumulated undistributed earnings on a tax basis:
| | |
| | |
Undistributed Ordinary Income | | Undistributed Long-Term Capital Gains |
$1,066,976 | | $707,378 |
The United States federal income tax basis of the Fund’s investments and the net unrealized depreciation as of August 31, 2023 were as follows:
| | | | | | |
| | | | |
| Tax Basis | | Gross Unrealized Appreciation | | Gross Unrealized Depreciation | | Net Unrealized Depreciation |
$21,746,078 | | $— | | $(6,267) | | $(6,267) |
The difference between GAAP and tax was primarily attributable to mark-to-market futures and options contracts
The Manager has analyzed the Fund’s tax positions and has concluded that no provision for income tax is required in the Fund’s financial statements for the current reporting period.
The Fund is an exchange-traded fund, commonly known as an “ETF”. Individual shares of the Fund may only be purchased and sold in secondary market transactions through brokers or other financial intermediaries. Shares of the Fund are listed for trading on the Cboe BZX Exchange, Inc. (the “Exchange”), and because the shares of the Fund trade at market prices rather than NAV, shares of the Fund may trade at a price greater than NAV (a premium) or less than NAV (a discount). The Fund will issue and redeem its shares at NAV only in aggregations of a specified number of shares called a “Creation Unit”. An Authorized Participant is a member or participant of a clearing agency registered with the SEC, which has a written agreement with the Fund or one of their service providers that allows the Authorized Participant to place orders for the purchase and redemption of Creation Units.
A creation transaction, which is subject to acceptance by the Distributor and the Fund, generally takes place when an Authorized Participant deposits into the Fund a designated
24
portfolio of securities, assets or other positions (a “creation basket”), and an amount of cash (including any cash representing the value of substituted securities, assets or other positions), if any, which together approximate the holdings of the Fund in exchange for a specified number of Creation Units. Similarly, shares can be redeemed only in Creation Units, generally for a designated portfolio of securities, assets or other propositions (the “redemption basket”) held by the Fund and an amount of cash (including any portion of such securities for which cash may be substituted). The Fund may, in certain circumstances, offer Creation Units partially or solely for cash. Except when aggregated in Creation Units, shares are not redeemable by the Fund. Creation and redemption baskets may differ and the Fund may accept “custom baskets”. A Creation Unit of PGIM Portfolio Ballast ETF consists of 20,000 shares of the Fund.
Authorized Participants may be required to pay a fixed creation transaction fee and/or a fixed redemption transaction fee, as applicable, for each transaction in a Creation Unit regardless of the number of Creation Units created or redeemed on that day. These fees, if charged, are paid to the Custodian to offset costs associated with processing creation and redemption transactions. Authorized Participants transacting in creation units for cash may pay an additional variable fee to compensate the Funds for transaction costs and market impact expenses relating to purchases or sales of portfolio securities. Such variable fees, if any, are included in “Net proceeds from shares sold” and/or “Cost of shares purchased”, as applicable, in the Statements of Changes in Net Assets.
The RIC is authorized to issue an unlimited number of shares of beneficial interest, $0.001 par value per share.
As of August 31, 2023, Prudential, through its affiliated entities, including affiliated funds (if applicable), owned shares of the Fund as follows:
| | | | |
| | | |
| Fund | | Number of Shares | | Percentage of
Outstanding Shares |
PGIM Portfolio Ballast ETF | | 1,000,000 | | 94.3% |
At the reporting period end, the number of shareholders holding greater than 5% of the Fund are as follows:
| | | | |
| | | |
| | | Number of Shareholders | | Percentage of Outstanding Shares |
Affiliated | | 1 | | 94.3% |
Unaffiliated | | — | | — |
The Fund may make payment for Fund shares redeemed and contributed wholly or in part by distributing portfolio securities to shareholders. For the reporting period ended August 31, 2023, the Fund had no subscriptions in-kind and no redemptions in-kind.
PGIM Portfolio Ballast ETF 25
Notes to Financial Statements (continued)
| 8. | Risks of Investing in the Fund |
The Fund’s risks include, but are not limited to, some or all of the risks discussed below. For further information on the Fund’s risks, please refer to the Fund’s Prospectus and Statement of Additional Information.
Active Trading Risk: The Fund actively and frequently trades its portfolio securities. High portfolio turnover results in higher transaction costs, which can affect the Fund’s performance and have adverse tax consequences. In addition, high portfolio turnover may also mean that a proportionately greater amount of distributions to shareholders will be taxed as ordinary income rather than long-term capital gains compared to investment companies with lower portfolio turnover.
Authorized Participant Concentration Risk: Only an Authorized Participant (as defined in “How to Buy and Sell Shares of the Fund” in the Fund’s Prospectus) may engage in creation or redemption transactions directly with the Fund. The Fund has a limited number of intermediaries that act as Authorized Participants and none of these Authorized Participants is or will be obligated to engage in creation or redemption transactions. To the extent that these Authorized Participants exit the business or are unable to or choose not to proceed with creation and/or redemption orders with respect to the Fund and no other Authorized Participant creates or redeems, shares of the Fund may trade at a substantial discount or premium to net asset value (“NAV”), may trade at larger spreads, and possibly face trading halts and/or delisting.
Debt Obligations Risk: Debt obligations are subject to credit risk, market risk and interest rate risk. The Fund’s holdings, share price, yield and total return may also fluctuate in response to bond market movements. The value of bonds may decline for issuer-related reasons, including management performance, financial leverage and reduced demand for the issuer’s goods and services. Certain types of fixed income obligations also may be subject to “call and redemption risk,” which is the risk that the issuer may call a bond held by the Fund for redemption before it matures and the Fund may not be able to reinvest at the same rate of interest and therefore would earn less income.
Derivatives Risk: Derivatives involve special risks and costs and may result in losses to the Fund. The successful use of derivatives requires sophisticated management, and, to the extent that derivatives are used, the Fund will depend on the subadviser’s ability to analyze and manage derivatives transactions. The prices of derivatives may move in unexpected ways, especially in abnormal market conditions. Some derivatives are “leveraged” or may create economic leverage for the Fund and therefore may magnify or otherwise increase investment losses to the Fund. The Fund’s use of derivatives may also increase the amount of taxes payable by shareholders.
26
Other risks arise from the potential inability to terminate or sell derivatives positions. A liquid secondary market may not always exist for the Fund’s derivatives positions. In fact, many over-the-counter derivative instruments will not have liquidity beyond the counterparty to the instrument. Over-the-counter derivative instruments also involve the risk that the other party will not meet its obligations to the Fund. The use of derivatives also exposes the Fund to operational issues, such as documentation and settlement issues, systems failures, inadequate control and human error.
Derivatives may also involve legal risks, such as insufficient documentation, the lack of capacity or authority of a counterparty to execute or settle a transaction, and the legality and enforceability of derivatives contracts. The U.S. Government and foreign governments have adopted (and may adopt further) regulations governing derivatives markets, including mandatory clearing of certain derivatives, margin and reporting requirements and risk exposure limitations. Regulation of derivatives may make derivatives more costly, limit their availability or utility to the Fund, or otherwise adversely affect their performance or disrupt markets.
Economic and Market Events Risk: Events in the U.S. and global financial markets, including actions taken by the U.S. Federal Reserve or foreign central banks to stimulate or stabilize economic growth or the functioning of the securities markets, or otherwise reduce inflation, may at times result in unusually high market volatility, which could negatively impact performance. Governmental efforts to curb inflation often have negative effects on the level of economic activity. Relatively reduced liquidity in credit and fixed income markets could adversely affect issuers worldwide.
Equity and Equity-Related Securities Risk: Equity and equity-related securities may be subject to changes in value, and their values may be more volatile than those of other asset classes. In addition to an individual security losing value, the value of the equity markets or a sector in which the Fund invests could go down. Different parts of a market can react differently to adverse issuer, market, regulatory, political and economic developments.
ETF Shares Trading Risk: Fund shares are listed for trading on an exchange (the “Exchange”) and the shares are bought and sold in the secondary market at market prices. The market prices of the shares of the Fund are expected to fluctuate in response to changes in the Fund’s NAV, the intraday value of the Fund’s holdings and supply and demand for shares of the Fund. During periods of stressed market conditions, the market for the shares of the Fund may become less liquid in response to deteriorating liquidity in the markets for the Fund’s portfolio investments.
Disruptions to creations and redemptions, the existence of significant market volatility or potential lack of an active trading market for the shares of the Fund (including through a trading halt), as well as other factors, may result in the Fund’s shares trading on the Exchange significantly above (at a premium) or below (at a discount) to NAV or to the intraday value of the Fund’s holdings. Actively managed ETFs that use derivatives or other instruments as part of their investment strategy, such as the Fund, may experience wider
PGIM Portfolio Ballast ETF 27
Notes to Financial Statements (continued)
premiums or discounts between the market price for their shares and their NAVs than other types of ETFs, including index-tracking ETFs, that invest directly in securities or other more liquid instruments. As such, an investment in the Fund may be more volatile than a typical ETF.
Cost of Buying or Selling Shares: When you buy or sell shares of the Fund through a broker, you will likely incur a brokerage commission or other charges imposed by brokers. In addition, the market price of shares of the Fund, like the price of any exchange-traded security, includes a “bid-ask spread” charged by the market makers or other participants that trade the particular security. The spread of the Fund’s shares varies over time based on the Fund’s trading volume, the spread of the Fund’s underlying securities, and market liquidity and may increase if the Fund’s trading volume or market liquidity decreases, or if the spread on the Fund’s underlying securities increases.
No Guarantee of Active Trading Market Risk: While shares of the Fund are listed on the Exchange, there can be no assurance that active trading markets for the shares will develop or be maintained by market makers or by Authorized Participants. The distributor of the Fund’s shares does not maintain a secondary market in the shares.
Futures and Forward Contracts Risk: The primary risks associated with the use of futures or forward contracts are (a) the imperfect correlation between the change in market value of the instruments held by the Fund and the price of the futures or forward contract; (b) possible lack of a liquid secondary market for a futures or forward contract and the resulting inability to close a futures or forward contract when desired; (c) losses caused by unanticipated market movements, which are potentially unlimited; (d) the failure to predict correctly the direction of securities or commodities prices, interest rates, currency exchange rates and other economic factors; and (e) the possibility that the counterparty to the futures or forward contract will default in the performance of its obligations. Additionally, not all forward contracts require a counterparty to post collateral, which may expose the Fund to greater losses in the event of a default by a counterparty.
Investment Program Risk: In pursuing its investment program, the Fund seeks to reduce volatility over a full market cycle, including by limiting Fund losses relative to the broader market. The subadviser may not be successful in limiting volatility and there is a risk that the Fund will experience losses consistent with, or greater than, the equity market during a market downturn. In addition, the Fund’s strategy of using options to capture market upside will limit the returns of the Fund during periods in which the market is rising, particularly during periods of rapid appreciation, and the Fund may not experience investment gains comparable to the broader market. The Fund may not be able to enter into, or close out, options transactions at times or in quantities the subadviser believes necessary to
28
accomplish the Fund’s investment strategy. Because the Fund’s strategy to limit volatility involves buying and selling options on one or more broad market indexes or financial instruments that seek to replicate or approximate the return of such an index, the Fund will incur additional costs in the form of options premiums that an investor would not incur investing directly in the securities of an index or in a fund that tracks the index directly, which costs will reduce the Fund’s returns. In addition, the Fund will forgo the opportunity to benefit fully from potential increases in value if the value of the instrument underlying an option rises above its strike price. Moreover, if the strike price of a purchased option is higher than the value of the underlying instrument at expiration, the option will expire worthless and the Fund will lose the premium paid for the option without a corresponding benefit.
Large Shareholder and Large Scale Redemption Risk: Certain individuals, accounts, funds (including funds affiliated with the Manager) or institutions, including the Manager and its affiliates, may from time to time own or control a substantial amount of the Fund’s shares. There is no requirement that these entities maintain their investment in the Fund. There is a risk that such large shareholders or that the Fund’s shareholders generally may redeem all or a substantial portion of their investments in the Fund in a short period of time, which could have a significant negative impact on the Fund’s NAV, liquidity, and brokerage costs. Large redemptions could also result in tax consequences to shareholders and impact the Fund’s ability to implement its investment strategy. The Fund’s ability to pursue its investment objective after one or more large scale redemptions may be impaired and, as a result, the Fund may invest a larger portion of its assets in cash or cash equivalents.
Management Risk: Actively managed funds are subject to management risk. The subadviser will apply investment techniques and risk analyses in making investment decisions for the Fund, but the subadviser’s judgments about the attractiveness, value or market trends affecting a particular security, industry or sector or about market movements may be incorrect. Additionally, the investments selected for the Fund may underperform the markets in general, the Fund’s benchmark and other funds with similar investment objectives.
Market Disruption and Geopolitical Risks: Market disruption can be caused by economic, financial or political events and factors, including but not limited to, international wars or conflicts (including Russia’s military invasion of Ukraine), geopolitical developments (including trading and tariff arrangements, sanctions and cybersecurity attacks), instability in regions such as Asia, Eastern Europe and the Middle East, terrorism, natural disasters and public health epidemics (including the outbreak of COVID-19 globally).
The extent and duration of such events and resulting market disruptions cannot be predicted, but could be substantial and could magnify the impact of other risks to the Fund. These and other similar events could adversely affect the U.S. and foreign financial markets and lead to increased market volatility, reduced liquidity in the securities markets, significant negative impacts on issuers and the markets for certain securities and commodities and/or government intervention. They may also cause short- or long-term economic uncertainties in
PGIM Portfolio Ballast ETF 29
Notes to Financial Statements (continued)
the United States and worldwide. As a result, whether or not the Fund invests in securities of issuers located in or with significant exposure to the countries directly affected, the value and liquidity of the Fund’s investments may be negatively impacted. Further, due to closures of certain markets and restrictions on trading certain securities, the value of certain securities held by the Fund could be significantly impacted, which could lead to such securities being valued at zero.
COVID-19 and the related governmental and public responses have had, and future public health epidemics may have an impact on the Fund’s investments and net asset value, and have led and may lead to increased market volatility and the potential for illiquidity in certain classes of securities and sectors of the market. Future public health epidemics may result in periods of business disruption, business closures, inability to obtain raw materials, supplies and component parts, and reduced or disrupted operations for the issuers in which the Fund invests. The occurrence, reoccurrence and pendency of public health epidemics could adversely affect the economies and financial markets either in specific countries or worldwide.
Market Risk: Securities markets may be volatile and the market prices of the Fund’s securities may decline. Securities fluctuate in price based on changes in an issuer’s financial condition and overall market and economic conditions. If the market prices of the securities owned by the Fund fall, the value of your investment in the Fund will decline.
Model Design Risk: The subadviser uses certain quantitative models to help guide its investment decisions. The design of the underlying models may be flawed or incomplete. The investment models the subadviser uses are based on historical and theoretical underpinnings that it believes are sound. There can be no guarantee, however, that these underpinnings will correlate with security price behavior in the manner assumed by the subadviser’s models. Additionally, the quantitative techniques that underlie the subadviser’s portfolio construction processes may fail to fully anticipate important risks.
Model Implementation Risk: While the subadviser strives to mitigate the likelihood of material implementation errors, it is impossible to completely eliminate the risk of error in the implementation of the computer models that guide the subadviser’s quantitative investment processes. Additionally, it may be difficult to implement model recommendations in volatile and rapidly changing market conditions.
New/Small Fund Risk: The Fund recently commenced operations and has a limited operating history. As a new and relatively small fund, the Fund’s performance may not represent how the Fund is expected to or may perform in the long term if and when it becomes larger and has fully implemented its investment strategies. Investment positions may have a disproportionate impact (negative or positive) on performance in new and
30
smaller funds. New and smaller funds may also require a period of time before they are invested in securities that meet their investment objectives and policies and achieve a representative portfolio composition. Since the Fund is new, an active secondary market for the shares of the Fund may not develop or may not continue once developed. Shareholders holding large blocks of shares of the Fund, including the Manager and its affiliates, may hold their shares for long periods of time, which may lead to reduced trading volumes, wider trading spreads and impede the development or maintenance of an active secondary trading market for Fund shares. These large shareholders may also loan or sell all or a portion of their Fund shares, which may result in increasing concentration of Fund shares in a small number of holders, and the potential for large redemptions, decreases in Fund assets and increased expenses for remaining shareholders.
Non-Diversified Investment Company Risk: The Fund is non-diversified for purposes of the 1940 Act. This means that the Fund may invest a greater percentage of its assets in the securities of a single company or other issuer than a diversified fund. Investing in a non-diversified fund involves greater risk than investing in a diversified fund because a loss resulting from the decline in value of any one security may represent a greater portion of the total assets of a non-diversified fund.
| 9. | Recent Regulatory Developments |
Effective January 24, 2023, the SEC adopted rule and form amendments to require mutual funds and ETFs to transmit concise and visually engaging streamlined annual and semiannual reports to shareholders that highlight key information deemed important for retail investors to assess and monitor their fund investments (the “Rule”). Other information, including financial statements, will no longer appear in the funds’ streamlined shareholder reports but must be available online, delivered free of charge upon request, and filed on a semiannual basis on Form N-CSR. The Rule and form amendments have a compliance date of July 24, 2024. At this time, management is evaluating the Rule and its impact to the Fund.
PGIM Portfolio Ballast ETF 31
Report of Independent Registered Public Accounting Firm
To the Board of Trustees of PGIM ETF Trust and Shareholders of PGIM Portfolio Ballast ETF
Opinion on the Financial Statements
We have audited the accompanying statement of assets and liabilities, including the schedule of investments, of PGIM Portfolio Ballast ETF (one of the funds constituting PGIM ETF Trust, hereafter referred to as the “Fund”) as of August 31, 2023, and the related statements of operations and changes in net assets, including the related notes, and the financial highlights for the period December 12, 2022 (commencement of operations) through August 31, 2023 (collectively referred to as the “financial statements”). In our opinion, the financial statements present fairly, in all material respects, the financial position of the Fund as of August 31, 2023, and the results of its operations, changes in its net assets and the financial highlights for the period December 12, 2022 (commencement of operations) through August 31, 2023 in conformity with accounting principles generally accepted in the United States of America.
Basis for Opinion
These financial statements are the responsibility of the Fund’s management. Our responsibility is to express an opinion on the Fund’s financial statements based on our audit. We are a public accounting firm registered with the Public Company Accounting Oversight Board (United States) (PCAOB) and are required to be independent with respect to the Fund in accordance with the U.S. federal securities laws and the applicable rules and regulations of the Securities and Exchange Commission and the PCAOB.
We conducted our audit of these financial statements in accordance with the standards of the PCAOB. Those standards require that we plan and perform the audit to obtain reasonable assurance about whether the financial statements are free of material misstatement, whether due to error or fraud.
Our audit included performing procedures to assess the risks of material misstatement of the financial statements, whether due to error or fraud, and performing procedures that respond to those risks. Such procedures included examining, on a test basis, evidence regarding the amounts and disclosures in the financial statements. Our audit also included evaluating the accounting principles used and significant estimates made by management, as well as evaluating the overall presentation of the financial statements. Our procedures included confirmation of securities owned as of August 31, 2023 by correspondence with the custodian, transfer agent and brokers; when replies were not received from brokers, we performed other auditing procedures. We believe that our audit provides a reasonable basis for our opinion.
/s/PricewaterhouseCoopers LLP
October 19, 2023
We have served as the auditor of one or more investment companies in the PGIM Retail Funds complex since 2020.
32
Tax Information (unaudited)
For the period ended August 31, 2023, the Fund reports the maximum amount allowable but not less than 100.00% as interest-related dividends in accordance with Sections 871(k)(1) and 881(e)(1) of the Internal Revenue Code.
For the period ended August 31, 2023, the Fund reports the maximum amount allowable but not less than 54.39% of interest dividends that are eligible to be treated as interest income in accordance with Section 163(j) of the Internal Revenue Code.
In January 2024, you will be advised on IRS Form 1099-DIV or substitute 1099-DIV as to the federal tax status of the distributions received by you in calendar year 2023.
We are required by Massachusetts, Missouri and Oregon to inform you that dividends which have been derived from interest on federal obligations are not taxable to shareholders provided the Fund meets certain requirements mandated by the respective state’s taxing authorities. We are pleased to report that 54.39% of the dividends paid by the Fund qualify for such deduction.
For more detailed information regarding your state and local taxes, you should contact your tax adviser or the state/local taxing authorities.
PGIM Portfolio Ballast ETF 33
Liquidity Risk Management Program (unaudited)
Consistent with Rule 22e-4 under the 1940 Act (the “Liquidity Rule”), the Fund has adopted and implemented a liquidity risk management program (the “LRMP”). The Fund’s LRMP seeks to assess and manage the Fund’s liquidity risk, which is defined as the risk that the Fund is unable to meet investor redemption requests without significantly diluting the remaining investors’ interests in the Fund. The Board has approved PGIM Investments, the Fund’s investment manager, to serve as the administrator of the Fund’s LRMP. As part of its responsibilities as administrator, PGIM Investments has retained a third party to perform certain functions, including providing market data and liquidity classification model information.
The Fund’s LRMP includes a number of processes designed to support the assessment and management of its liquidity risk. In particular, the Fund’s LRMP includes no less than annual assessments of factors that influence the Fund’s liquidity risk; no less than monthly classifications of the Fund’s investments into one of four liquidity classifications provided for in the Liquidity Rule; a 15% of net assets limit on the acquisition of “illiquid investments” (as defined under the Liquidity Rule); establishment of a minimum percentage of the Fund’s assets to be invested in investments classified as “highly liquid” (as defined under the Liquidity Rule) if the Fund does not invest primarily in highly liquid investments; and regular reporting to the Board.
At a meeting of the Board on March 7-9, 2023, PGIM Investments provided a written report (“LRMP Report”) to the Board addressing the operation, adequacy, and effectiveness of the Fund’s LRMP, including any material changes to the LRMP for the period from January 1, 2022 through December 31, 2022 (“Reporting Period”). The LRMP Report concluded that the Fund’s LRMP was reasonably designed to assess and manage the Fund’s liquidity risk and was adequately and effectively implemented during the Reporting Period. There were no material changes to the LRMP during the Reporting Period. The LRMP Report further concluded that the Fund’s investment strategies continue to be appropriate given the Fund’s status as an open-end fund.
There can be no assurance that the LRMP will achieve its objectives in the future. Additional information regarding risks of investing in the Fund, including liquidity risks presented by the Fund’s investment portfolio, is found in the Fund’s Prospectus and Statement of Additional Information.
34
INFORMATION ABOUT BOARD MEMBERS AND OFFICERS (unaudited)
Information about Board Members and Officers of the Funds is set forth below. Board Members who are not deemed to be “interested persons” of the Funds, as defined in the 1940 Act, are referred to as “Independent Board Members.” Board Members who are deemed to be “interested persons” of the Funds are referred to as “Interested Board Members.” The Board Members are responsible for the overall supervision of the operations of the Funds and perform the various duties imposed on the directors of investment companies by the 1940 Act. The Board in turn elects the Officers, who are responsible for administering the day-to-day operations of the Funds.
| | | | | | |
| |
Independent Board Members |
| | | | |
Name Year of Birth Position(s) Portfolios Overseen | | Principal Occupation(s) During Past Five Years | | Other Directorships Held During Past Five Years | | Length of Board Service |
| | | | |
Ellen S. Alberding 1958 Board Member Portfolios Overseen: 99 | | Chief Executive Officer (“CEO”) and President, The Joyce Foundation (charitable foundation) (since 2002); formerly Vice Chair, City Colleges of Chicago (community college system) (2011-2015); formerly Trustee, National Park Foundation (charitable foundation for national park system) (2009-2018); formerly Trustee, Economic Club of Chicago (2009-2016); Trustee, Loyola University (since 2018). | | None. | | Since December 2017 |
| | | | |
Kevin J. Bannon 1952 Board Member Portfolios Overseen: 100 | | Retired; formerly Managing Director (April 2008-May 2015) and Chief Investment Officer (October 2008-November 2013) of Highmount Capital LLC (registered investment adviser); formerly Executive Vice President and Chief Investment Officer (April 1993-August 2007) of Bank of New York Company; formerly President (May 2003-May 2007) of BNY Hamilton Family of Mutual Funds. | | Director of Urstadt Biddle Properties (equity real estate investment trust) (since September 2008). | | Since December 2017 |
PGIM Portfolio Ballast ETF
| | | | | | |
| |
Independent Board Members |
| | | | |
Name Year of Birth Position(s) Portfolios Overseen | | Principal Occupation(s) During Past Five Years | | Other Directorships Held During Past Five Years | | Length of Board Service |
| | | | |
Linda W. Bynoe 1952 Board Member Portfolios Overseen: 97 | | President and Chief Executive Officer (since March 1995) and formerly Chief Operating Officer (December 1989-February 1995) of Telemat Limited LLC (formerly Telemat Ltd) (management consulting); formerly Vice President (January 1985-June 1989) at Morgan Stanley & Co. (broker-dealer). | | Trustee of Equity Residential (residential real estate) (since December 2009); Director of Northern Trust Corporation (financial services) (since April 2006); formerly Director of Anixter International, Inc. (communication products distributor) (January 2006-June 2020). | | Since December 2017 |
| | | | |
Barry H. Evans 1960 Board Member Portfolios Overseen: 100 | | Retired; formerly President (2005-2016), Global Chief Operating Officer (2014-2016), Chief Investment Officer - Global Head of Fixed Income (1998-2014), and various portfolio manager roles (1986-2006), Manulife Asset Management (asset management). | | Formerly Director, Manulife Trust Company (2011-2018); formerly Director, Manulife Asset Management Limited (2015-2017); formerly Chairman of the Board of Directors of Manulife Asset Management U.S. (2005-2016); formerly Chairman of the Board, Declaration Investment Management and Research (2008-2016). | | Since December 2017 |
| | | | |
Keith F. Hartstein 1956 Board Member & Independent Chair Portfolios Overseen: 100 | | Retired; formerly Member (November 2014- September 2022) of the Governing Council of the Independent Directors Council (IDC) (organization of independent mutual fund directors); formerly Executive Committee of the IDC Board of Governors (October 2019-December 2021); formerly President and Chief Executive Officer (2005-2012), Senior Vice President (2004-2005), Senior Vice President of Sales and Marketing (1997-2004), and various executive management positions (1990-1997), John Hancock Funds, LLC (asset management); formerly Chairman, Investment Company Institute’s Sales Force Marketing Committee (2003-2008). | | None. | | Since December 2017 |
Visit our website at pgim.com/investments
| | | | | | |
| |
Independent Board Members |
| | | | |
Name Year of Birth Position(s) Portfolios Overseen | | Principal Occupation(s) During Past Five Years | | Other Directorships Held During Past Five Years | | Length of Board Service |
| | | | |
Laurie Simon Hodrick 1962 Board Member Portfolios Overseen: 97 | | A. Barton Hepburn Professor Emerita of Economics in the Faculty of Business, Columbia Business School (since 2018); Visiting Fellow at the Hoover Institution, Stanford University (since 2015); Sole Member, ReidCourt LLC (since 2008) (a consulting firm); formerly Visiting Professor of Law, Stanford Law School (2015-2021); formerly A. Barton Hepburn Professor of Economics in the Faculty of Business, Columbia Business School (1996-2017); formerly Managing Director, Global Head of Alternative Investment Strategies, Deutsche Bank (2006-2008). | | Independent Director, Andela (since January 2022) (global talent network); Independent Director, Roku (since December 2020) (communication services); formerly Independent Director, Synnex Corporation (2019-2021) (information technology); formerly Independent Director, Kabbage, Inc. (2018-2020) (financial services); formerly Independent Director, Corporate Capital Trust (2017-2018) (a business development company). | | Since December 2017 |
| | | | |
Brian K. Reid 1961 Board Member Portfolios Overseen: 100 | | Retired; formerly Chief Economist for the Investment Company Institute (ICI) (2005-2017); formerly Senior Economist and Director of Industry and Financial Analysis at the ICI (1998-2004); formerly Senior Economist, Industry and Financial Analysis at the ICI (1996-1998); formerly Staff Economist at the Federal Reserve Board (1989-1996); formerly Director, ICI Mutual Insurance Company (2012-2017). | | None. | | Since March 2018 |
PGIM Portfolio Ballast ETF
| | | | | | |
| |
Independent Board Members |
| | | | |
Name Year of Birth Position(s) Portfolios Overseen | | Principal Occupation(s) During Past Five Years | | Other Directorships Held During Past Five Years | | Length of Board Service |
| | | | |
Grace C. Torres 1959 Board Member Portfolios Overseen: 100 | | Retired; formerly Treasurer and Principal Financial and Accounting Officer of the PGIM Funds, Target Funds, Advanced Series Trust, Prudential Variable Contract Accounts and The Prudential Series Fund (1998-June 2014); Assistant Treasurer (March 1999-June 2014) and Senior Vice President (September 1999-June 2014) of PGIM Investments LLC; Assistant Treasurer (May 2003-June 2014) and Vice President (June 2005-June 2014) of AST Investment Services, Inc.; Senior Vice President and Assistant Treasurer (May 2003-June 2014) of Prudential Annuities Advisory Services, Inc. | | Director (since January 2018) of OceanFirst Financial Corp. and OceanFirst Bank; formerly Director (July 2015-January 2018) of Sun Bancorp, Inc. N.A. and Sun National Bank. | | Since December 2017 |
Visit our website at pgim.com/investments
| | | | | | |
| |
Interested Board Members |
| | | | |
Name Year of Birth Position(s) Portfolios Overseen | | Principal Occupation(s) During Past Five Years | | Other Directorships Held During Past Five Years | | Length of Board Service |
| | | | |
Stuart S. Parker 1962 Board Member & President Portfolios Overseen: 100 | | President, Chief Executive Officer, Chief Operating Officer and Officer in Charge of PGIM Investments LLC (formerly known as Prudential Investments LLC) (since January 2012); President and PEO (since September 2022) of the PGIM Private Credit Fund, President and Principal Executive Officer (“PEO”) (since March 2022) of the PGIM Private Real Estate Fund, Inc.; formerly Executive Vice President of Jennison Associates LLC and Head of Retail Distribution of PGIM Investments LLC (June 2005-December 2011); Investment Company Institute - Board of Governors (since May 2012). | | None. | | Since December 2017 |
| | | | |
Scott E. Benjamin 1973 Board Member & Vice President Portfolios Overseen: 100 | | Executive Vice President (since May 2009) of PGIM Investments LLC; Vice President (since June 2012) of Prudential Investment Management Services LLC; Executive Vice President (since September 2009) of AST Investment Services, Inc.; Senior Vice President of Product Development and Marketing, PGIM Investments (since February 2006); Vice President (since September 2022) of the PGIM Private Credit Fund, Vice President (since March 2022) of the PGIM Private Real Estate Fund, Inc.; formerly Vice President of Product Development and Product Management, PGIM Investments LLC (2003-2006). | | None. | | Since December 2017 |
PGIM Portfolio Ballast ETF
| | | | |
| |
Fund Officers(a) |
| | | |
Name Year of Birth Fund Position | | Principal Occupation(s) During Past Five Years | | Length of
Service as Fund
Officer |
| | | |
Claudia DiGiacomo 1974 Chief Legal Officer | | Chief Legal Officer (since September 2022) of the PGIM Private Credit Fund; Chief Legal Officer (since July 2022) of the PGIM Private Real Estate Fund, Inc.; Chief Legal Officer, Executive Vice President and Secretary of PGIM Investments LLC (since August 2020); Chief Legal Officer of Prudential Mutual Fund Services LLC (since August 2020); Chief Legal Officer of PIFM Holdco, LLC (since August 2020); Vice President and Corporate Counsel (since January 2005) of Prudential; and Corporate Counsel of AST Investment Services, Inc. (since August 2020); formerly Vice President and Assistant Secretary of PGIM Investments LLC (2005-2020); formerly Associate at Sidley Austin Brown & Wood LLP (1999-2004). | | Since December 2017 |
| | | |
Andrew Donohue 1972 Chief Compliance Officer | | Chief Compliance Officer (since May 2023) of the PGIM Funds, Target Funds, PGIM ETF Trust, PGIM Global High Yield Fund, Inc., PGIM High Yield Bond Fund, Inc., PGIM Short Duration High Yield Opportunities Fund, Advanced Series Trust, The Prudential Series Fund, Prudential’s Gibraltar Fund, Inc., PGIM Private Credit Fund, PGIM Private Real Estate Fund, Inc.; Vice President, Chief Compliance Officer of PGIM Investments LLC (since September 2022); Chief Compliance Officer of AST Investment Services, Inc. (since October 2022); formerly various senior compliance roles within Principal Global Investors, LLC., global asset management for Principal Financial (2011-2022), most recently as Global Chief Compliance Officer (2016-2022). | | Since May 2023 |
| | | |
Andrew R. French 1962 Secretary | | Vice President (since December 2018) of PGIM Investments LLC; formerly Vice President and Corporate Counsel (2010-2018) of Prudential; Secretary (since September 2022) of the PGIM Private Credit Fund, Secretary (since March 2022) of the PGIM Private Real Estate Fund, Inc.; formerly Director and Corporate Counsel (2006-2010) of Prudential; Vice President and Assistant Secretary (since January 2007) of PGIM Investments LLC; Vice President and Assistant Secretary (since January 2007) of Prudential Mutual Fund Services LLC. | | Since December 2017 |
| | | |
Melissa Gonzalez 1980 Assistant Secretary | | Vice President and Corporate Counsel (since September 2018) of Prudential; Vice President and Assistant Secretary (since August 2020) of PGIM Investments LLC; Assistant Secretary (since September 2022) of the PGIM Private Credit Fund, Assistant Secretary (since March 2022) of the PGIM Private Real Estate Fund, Inc.; formerly Director and Corporate Counsel (March 2014-September 2018) of Prudential. | | Since March 2020 |
Visit our website at pgim.com/investments
| | | | |
| |
Fund Officers(a) |
| | | |
Name Year of Birth Fund Position | | Principal Occupation(s) During Past Five Years | | Length of
Service as Fund
Officer |
| | | |
Patrick E. McGuinness 1986 Assistant Secretary | | Vice President and Assistant Secretary (since August 2020) of PGIM Investments LLC; Director and Corporate Counsel (since February 2017) of Prudential; Assistant Secretary (since September 2022) of the PGIM Private Credit Fund, Assistant Secretary (since March 2022) of the PGIM Private Real Estate Fund, Inc. | | Since June 2020 |
| | | |
Debra Rubano 1975 Assistant Secretary | | Vice President and Corporate Counsel (since November 2020) of Prudential; Assistant Secretary (since March 2022) of the PGIM Private Real Estate Fund, Inc; Assistant Secretary (since September 2022) of the PGIM Private Credit Fund; formerly Director and Senior Counsel of Allianz Global Investors U.S. Holdings LLC (2010-2020) and Assistant Secretary of numerous funds in the Allianz fund complex (2015-2020). | | Since December 2020 |
| | | |
Christian J. Kelly 1975 Chief Financial Officer | | Vice President, Global Head of Fund Administration of PGIM Investments LLC (since November 2018); Chief Financial Officer (since March 2023) of PGIM Investments mutual funds, closed end funds and ETFs, Advanced Series Trust Portfolios, Prudential Series Funds and Prudential Gibraltar Fund; Chief Financial Officer of PGIM Private Credit Fund (since September 2022); Chief Financial Officer of PGIM Private Real Estate Fund, Inc. (since July 2022); formerly Treasurer and Principal Financial Officer (January 2019- March 2023) of PGIM Investments mutual funds, closed end funds and ETFs, Advanced Series Trust Portfolios, Prudential Series Funds and Prudential Gibraltar Fund; formerly Treasurer and Principal Financial Officer (March 2022 – July 2022) of the PGIM Private Real Estate Fund, Inc.; formerly Director of Fund Administration of Lord Abbett & Co. LLC (2009-2018), Treasurer and Principal Accounting Officer of the Lord Abbett Family of Funds (2017-2018); Director of Accounting, Avenue Capital Group (2008-2009); Senior Manager, Investment Management Practice of Deloitte & Touche LLP (1998-2007). | | Since January 2019 |
| | | |
Lana Lomuti 1967 Assistant Treasurer | | Vice President (since 2007) within PGIM Investments Fund Administration; formerly Assistant Treasurer (December 2007-February 2014) of The Greater China Fund, Inc.; formerly Director (2005-2007) within PGIM Investments Fund Administration. | | Since December 2017 |
PGIM Portfolio Ballast ETF
| | | | |
| |
Fund Officers(a) |
| | | |
Name Year of Birth Fund Position | | Principal Occupation(s) During Past Five Years | | Length of
Service as Fund
Officer |
| | | |
Russ Shupak 1973 Treasurer and Principal Accounting Officer | | Vice President (since 2017) within PGIM Investments Fund Administration; Treasurer and Principal Accounting Officer of PGIM Investments mutual funds, closed end funds and ETFs (since March 2023); Treasurer and Principal Accounting Officer (since July 2022) of the PGIM Private Real Estate Fund, Inc.; Assistant Treasurer (since September 2022) of the PGIM Private Credit Fund; formerly Assistant Treasurer (March 2022 – July 2022) of the PGIM Private Real Estate Fund, Inc.; Assistant Treasurer of Advanced Series Trust Portfolios, Prudential Series Funds and Prudential Gibraltar Fund (since October 2019); formerly Director (2013-2017) within PGIM Investments Fund Administration. | | Since October 2019 |
| | | |
Deborah Conway 1969 Assistant Treasurer | | Vice President (since 2017) within PGIM Investments Fund Administration; Assistant Treasurer (since September 2022) of the PGIM Private Credit Fund; Assistant Treasurer (since March 2022) of the PGIM Private Real Estate Fund, Inc.; formerly Director (2007-2017) within PGIM Investments Fund Administration. | | Since October 2019 |
| | | |
Elyse M. McLaughlin 1974 Assistant Treasurer | | Vice President (since 2017) within PGIM Investments Fund Administration; Treasurer and Principal Accounting Officer of the Advanced Series Trust, the Prudential Series Fund and the Prudential Gibraltar Fund (since March 2023); Treasurer and Principal Accounting Officer (since September 2022) of the PGIM Private Credit Fund; Assistant Treasurer (since March 2022) of the PGIM Private Real Estate Fund, Inc.; Assistant Treasurer of PGIM Investments mutual funds, closed end funds and ETFs (since October 2019); formerly Director (2011-2017) within PGIM Investments Fund Administration. | | Since October 2019 |
| | | |
Robert W. McCormack 1973 Assistant Treasurer | | Vice President (since 2019) within PGIM Investments Fund Administration; Assistant Treasurer (Since March 2023) of PGIM Investments mutual funds, closed end funds, ETFs, Advanced Series Trust Portfolios, Prudential Series Funds and Prudential Gibraltar Fund; Assistant Treasurer (since September 2022) of the PGIM Private Credit Fund; Assistant Treasurer (since March 2022) of the PGIM Private Real Estate Fund, Inc.; formerly Director (2016-2019) within PGIM Investments Fund Administration; formerly Vice President within Goldman, Sachs & Co. Investment Management Controllers (2008- 2016), Assistant Treasurer of Goldman Sachs Family of Funds (2015-2016). | | Since March 2023 |
Visit our website at pgim.com/investments
| | | | |
| |
Fund Officers(a) |
| | | |
Name Year of Birth Fund Position | | Principal Occupation(s) During Past Five Years | | Length of
Service as Fund
Officer |
| | | |
Kelly Florio 1978 Anti-Money Laundering Compliance Officer | | Vice President, Corporate Compliance, Global Compliance Programs and Compliance Risk Management (since December 2021) of Prudential; formerly, Head of Fraud Risk Management (October 2019 to December 2021) at New York Life Insurance Company; formerly, Head of Key Risk Area Operations (November 2018 to October 2019), Director of the US Anti-Money Laundering Compliance Unit (2009-2018) and Bank Loss Prevention Associate (2006 -2009) at MetLife. | | Since June 2022 |
(a) Excludes Mr. Parker and Mr. Benjamin, interested Board Members who also serve as President and Vice President, respectively.
Explanatory Notes to Tables:
| ∎ | Board Members are deemed to be “Interested,” as defined in the 1940 Act, by reason of their affiliation with PGIM Investments LLC and/or an affiliate of PGIM Investments LLC. |
| ∎ | Unless otherwise noted, the address of all Board Members and Officers is c/o PGIM Investments LLC, 655 Broad Street, Newark, New Jersey 07102-4410. |
| ∎ | There is no set term of office for Board Members or Officers. The Board Members have adopted a retirement policy, which calls for the retirement of Board Members on December 31 of the year in which they reach the age of 75. |
| ∎ | “Other Directorships Held” includes all directorships of companies required to register or file reports with the SEC under the 1934 Act (that is, “public companies”) or other investment companies registered under the 1940 Act. |
| ∎ | “Portfolios Overseen” includes such applicable investment companies managed by PGIM Investments LLC and overseen by the trustee/director. The investment companies for which PGIM Investments LLC serves as manager include the PGIM Mutual Funds, Target Funds, PGIM ETF Trust, PGIM Private Real Estate Fund, Inc., PGIM Private Credit Fund, PGIM High Yield Bond Fund, Inc., PGIM Global High Yield Fund, Inc., PGIM Short Duration High Yield Opportunities Fund, The Prudential Series Fund, Prudential’s Gibraltar Fund, Inc. and the Advanced Series Trust. |
| ∎ | As used in the Fund Officers table “Prudential” means The Prudential Insurance Company of America. |
PGIM Portfolio Ballast ETF
| | | | |
| | | |
| ∎ MAIL | | ∎ TELEPHONE | | ∎ WEBSITE |
| | | |
655 Broad Street Newark, NJ 07102 | | (800) 225-1852 | | pgim.com/investments |
|
| |
| PROXY VOTING |
| |
| The Board of Trustees delegated to the Fund’s subadviser the responsibility for voting any proxies and maintaining proxy recordkeeping with respect to the Fund. A description of these proxy voting policies and procedures is available without charge, upon request, by calling (800) 225-1852 or by visiting the Securities and Exchange Commission’s website at sec.gov. Information regarding how the Fund voted proxies relating to portfolio securities during the most recent 12-month period ended June 30 is available on the Fund’s website and on the Securities and Exchange Commission’s website. |
|
| |
| TRUSTEES |
| |
| Ellen S. Alberding ● Kevin J. Bannon ● Scott E. Benjamin ● Linda W. Bynoe ● Barry H. Evans ● Keith F. Hartstein ● Laurie Simon Hodrick ● Stuart S. Parker ● Brian K. Reid ● Grace C.Torres |
|
| |
| OFFICERS |
| |
| Stuart S. Parker, President ● Scott E. Benjamin, Vice President ● Christian J. Kelly, Chief Financial Officer ● Claudia DiGiacomo, Chief Legal Officer ● Andrew Donohue, Chief Compliance Officer ● Russ Shupak, Treasurer and Principal Accounting Officer ● Kelly Florio, Anti-Money Laundering Compliance Officer ● Andrew R. French, Secretary ● Melissa Gonzalez, Assistant Secretary ● Kelly A. Coyne, Assistant Secretary ● Patrick E. McGuinness, Assistant Secretary ● Debra Rubano, Assistant Secretary ● Lana Lomuti, Assistant Treasurer ● Elyse M. McLaughlin, Assistant Treasurer ● Deborah Conway, Assistant Treasurer ● Robert W. McCormack, Assistant Treasurer |
| | | | |
| MANAGER | | PGIM Investments LLC | | 655 Broad Street Newark, NJ 07102 |
| | |
| SUBADVISER | | PGIM Quantitative Solutions LLC | | 655 Broad Street 16th Floor Newark, NJ 07102 |
| | |
| DISTRIBUTOR | | Prudential Investment Management Services LLC | | 655 Broad Street Newark, NJ 07102 |
| | |
| CUSTODIAN/TRANSFER AGENT | | The Bank of New York Mellon | | 240 Greenwich Street New York, NY 10286 |
| | |
INDEPENDENT REGISTERED PUBLIC ACCOUNTING FIRM | | PricewaterhouseCoopers LLP | | 300 Madison Avenue New York, NY 10017 |
| | |
| FUND COUNSEL | | Willkie Farr &Gallagher LLP | | 787 Seventh Avenue New York, NY 10019 |
|
| |
| An investor should consider the investment objectives, risks, charges, and expenses of the Funds carefully before investing. The prospectus and summary prospectus contain this and other information about the Fund. An investor may obtain the prospectus and summary prospectus by visiting our website at pgim.com/investments or by calling (800) 225-1852. The prospectus and summary prospectus should be read carefully before investing. |
|
| |
| E-DELIVERY |
| |
| To receive your fund documents online,go to pgim.com/investments/resource/edelivery and enroll. Instead of receiving printed documents by mail, you will receive notification via email when new materials are available.You can cancel your enrollment or change your email address at any time by visiting the website address above. |
|
| |
| SHAREHOLDER COMMUNICATIONS WITH TRUSTEES |
| |
| Shareholders can communicate directly with the Board of Trustees by writing to the Chair of the Board, PGIM Portfolio Ballast ETF, PGIM Investments, Attn: Board of Trustees, 655 Broad Street, Newark, NJ 07102. Shareholders can communicate directly with an individual Trustee by writing to that Trustee at the same address.Communications are not screened before being delivered to the addressee. |
|
| |
| AVAILABILITY OF PORTFOLIO HOLDINGS |
| |
| On each business day, before commencement of trading on the Exchange, the Fund will disclose on www.pgiminvestments.com the Fund’s portfolio holdings that will form the basis for the Fund’s calculation of NAV at the end of the business day.The Fund files its complete schedule of portfolio holdings with the Securities and Exchange Commission for the first and third quarters of each fiscal year as an exhibit to its reports on Form N-PORT. The Fund’s Form N-PORT filings are available on the Commission’s website at sec.gov. |
|
| |
| The Fund’s Statement of Additional Information contains additional information about the Fund’s Trustees and is available without charge, upon request, by calling (800) 225-1852. |
| | | | |
Funds: | | | | |
ARE NOT INSURED BY THE FDIC OR ANY | | MAY LOSE VALUE | | ARE NOT A DEPOSIT OF OR GUARANTEED |
FEDERAL GOVERNMENT AGENCY | | BY ANY BANK OR ANY BANK AFFILIATE |
| | | | |
PGIM PORTFOLIO BALLAST ETF |
|
| Fund | | Ticker Symbol | | |
| | |
PGIM Portfolio Ballast ETF | | PBL | | |
ETF1011E
Item 2 – Code of Ethics — See Exhibit (a)
As of the end of the period covered by this report, the registrant has adopted a code of ethics (the “Section 406 Standards for Investment Companies – Ethical Standards for Principal Executive and Financial Officers”) that applies to the registrant’s Principal Executive Officer and Principal Financial Officer; the registrant’s Principal Financial Officer also serves as the Principal Accounting Officer.
The registrant hereby undertakes to provide any person, without charge, upon request, a copy of the code of ethics. To request a copy of the code of ethics, contact the registrant 800-225-1852, and ask for a copy of the Section 406 Standards for Investment Companies - Ethical Standards for Principal Executive and Financial Officers.
Item 3 – Audit Committee Financial Expert –
The registrant’s Board has determined that Ms. Grace C. Torres, member of the Board’s Audit Committee is an “audit committee financial expert,” and that she is “independent,” for purposes of this item.
Item 4 – Principal Accountant Fees and Services –
(a) Audit Fees
For the fiscal years ended August 31, 2023 and August 31, 2022, PricewaterhouseCoopers LLP (“PwC”), the Registrant’s principal accountant, billed the Registrant $240,300 and $143,500, respectively, for professional services rendered for the audit of the Registrant’s annual financial statements or services that are normally provided in connection with statutory and regulatory filings.
(b) Audit-Related Fees
For the fiscal years ended August 31, 2023 and August 31, 2022, fees of $0 and $50,000 were billed to the registrant for services rendered by PwC in connection with the custodian and accounting conversion.
(c) Tax Fees
For the fiscal years ended August 31, 2023 and August 31, 2022: none.
(d) All Other Fees
For the fiscal years ended August 31, 2023 and August 31, 2022: none.
(e) (1) Audit Committee Pre-Approval Policies and Procedures
THE PGIM MUTUAL FUNDS
AUDIT COMMITTEE POLICY
on
Pre-Approval of Services Provided by the Independent Accountants
The Audit Committee of each PGIM Mutual Fund is charged with the responsibility to monitor the independence of the Fund’s independent accountants. As part of this responsibility, the Audit Committee must pre-approve the independent accounting firm’s engagement to render audit and/or permissible non-audit services, as required by law. In evaluating a proposed engagement of the independent accountants, the Audit Committee will assess the effect that the engagement might reasonably be expected to have on the accountant’s independence. The Committee’s evaluation will be based on:
| | • | | a review of the nature of the professional services expected to be provided, |
| | • | | a review of the safeguards put into place by the accounting firm to safeguard independence, and |
| | • | | periodic meetings with the accounting firm. |
Policy for Audit and Non-Audit Services Provided to the Funds
On an annual basis, the scope of audits for each Fund, audit fees and expenses, and audit-related and non-audit services (and fees proposed in respect thereof) proposed to be performed by the Fund’s independent accountants will be presented by the Treasurer and the independent accountants to the Audit Committee for review and, as appropriate, approval prior to the initiation of such services.
Such presentation shall be accompanied by confirmation by both the Treasurer and the independent accountants that the proposed non-audit services will not adversely affect the independence of the independent accountants. Such proposed non-audit services shall be described in sufficient detail to enable the Audit Committee to assess the appropriateness of such services and fees, and the compatibility of the provision of such services with the auditor’s independence. The Committee shall receive periodic reports on the progress of the audit and other services which are approved by the Committee or by the Committee Chair pursuant to authority delegated in this Policy.
The categories of services enumerated under “Audit Services”, “Audit-related Services”, and “Tax Services” are intended to provide guidance to the Treasurer and the independent accountants as to those categories of services which the Committee believes are generally consistent with the independence of the independent accountants and which the Committee (or the Committee Chair) would expect upon the presentation of specific proposals to pre-approve. The enumerated categories are not intended as an exclusive list of audit, audit-related or tax services, which the Committee (or the Committee Chair) would consider for pre-approval.
Audit Services
The following categories of audit services are considered to be consistent with the role of the Fund’s independent accountants:
| | • | | Annual Fund financial statement audits |
| | • | | Seed audits (related to new product filings, as required) |
| | • | | SEC and regulatory filings and consents |
Audit-related Services
The following categories of audit-related services are considered to be consistent with the role of the Fund’s independent accountants:
| | • | | Accounting consultations |
| | • | | Fund merger support services |
| | • | | Agreed Upon Procedure Reports |
| | • | | Other Internal Control Reports |
Individual audit-related services that fall within one of these categories (except for fund merger support services) and are not presented to the Audit Committee as part of the annual pre-approval process are subject to an authorized pre-approval by the Audit Committee so long as the estimated fee for those services does not exceed $30,000. Any services provided under such pre-approval will be reported to the Audit Committee at its next regular meeting. Should the amount of such services exceed $30,000 any additional fees will be subject to pre-approval by the Committee Chair (or any other Committee member on
whom this responsibility has been delegated). Fees related to fund merger support services are subject to a separate authorized pre-approval by the Audit Committee with fees determined on a per occurrence and merger complexity basis.
Tax Services
The following categories of tax services are considered to be consistent with the role of the Fund’s independent accountants:
| | • | | Tax compliance services related to the filing or amendment of the following: |
| | • | | Federal, state and local income tax compliance; and, |
| | • | | Sales and use tax compliance |
| | • | | Timely RIC qualification reviews |
| | • | | Tax distribution analysis and planning |
| | • | | Tax authority examination services |
| | • | | Tax appeals support services |
| | • | | Accounting methods studies |
| | • | | Fund merger support services |
| | • | | Tax consulting services and related projects |
Individual tax services that fall within one of these categories and are not presented to the Audit Committee as part of the annual pre-approval process are subject to an authorized pre-approval by the Audit Committee so long as the estimated fee for those services does not exceed $30,000. Any services provided under such pre-approval will be reported to the Audit Committee at its next regular meeting. Should the amount of such services exceed $30,000 any additional fees will be subject to pre-approval by the Committee Chair (or any other Committee member on whom this responsibility has been delegated).
Other Non-Audit Services
Certain non-audit services that the independent accountants are legally permitted to render will be subject to pre-approval by the Committee or by one or more Committee members to whom the Committee has delegated this authority and who will report to the full Committee any pre-approval decisions made pursuant to this Policy. Non-audit services presented for pre-approval pursuant to this paragraph will be accompanied by a confirmation from both the Treasurer and the independent accountants that the proposed services will not adversely affect the independence of the independent accountants.
Proscribed Services
The Fund’s independent accountants will not render services in the following categories of non-audit services:
| | • | | Bookkeeping or other services related to the accounting records or financial statements of the Fund |
| | • | | Financial information systems design and implementation |
| | • | | Appraisal or valuation services, fairness opinions, or contribution-in-kind reports |
| | • | | Internal audit outsourcing services |
| | • | | Management functions or human resources |
| | • | | Broker or dealer, investment adviser, or investment banking services |
| | • | | Legal services and expert services unrelated to the audit |
| | • | | Any other service that the Public Company Accounting Oversight Board determines, by regulation, is impermissible. |
Pre-approval of Non-Audit Services Provided to Other Entities Within the PGIM Fund Complex
Certain non-audit services provided to PGIM Investments LLC or any of its affiliates that also provide ongoing services to the PGIM Mutual Funds will be subject to pre-approval by the Audit Committee. The only non-audit services provided to
these entities that will require pre-approval are those related directly to the operations and financial reporting of the Funds. Individual projects that are not presented to the Audit Committee as part of the annual pre-approval process will be subject to pre-approval by the Committee Chair (or any other Committee member on whom this responsibility has been delegated) so long as the estimated fee for those services does not exceed $30,000. Services presented for pre-approval pursuant to this paragraph will be accompanied by a confirmation from both the Treasurer and the independent accountants that the proposed services will not adversely affect the independence of the independent accountants.
Although the Audit Committee will not pre-approve all services provided to PGIM Investments LLC and its affiliates, the Committee will receive an annual report from the Fund’s independent accounting firm showing the aggregate fees for all services provided to PGIM Investments and its affiliates.
| (e) (2) | Percentage of services described in each of paragraphs (b) through (d) of this Item that were approved by the audit committee pursuant to paragraph (c)(7)(i)(C) of Rule 2-01 of Regulation S-X – |
| | | | |
| | Fiscal Year Ended August 31,
2023 | | Fiscal Year Ended August 31,
2022 |
| | |
4(b) | | Not applicable | | 0% |
| | |
4(c) | | Not applicable. | | Not applicable. |
| | |
4(d) | | Not applicable. | | Not applicable. |
(f) Percentage of hours expended attributable to work performed by other than full time employees of principal accountant if greater than 50%.
The percentage of hours expended on the principal accountant’s engagement to audit the registrant’s financial statements for the most recent fiscal year that were attributed to work performed by persons other than the principal accountant’s full-time, permanent employees was 0%.
(g) Non-Audit Fees
The aggregate non-audit fees billed by the Registrant’s principal accountant for services rendered to the registrant’s investment adviser and any entity controlling, controlled by, or under common control with the investment adviser that provides ongoing services to the registrant for the fiscal years ended August 31, 2023 and August 31, 2022 was $0 and $0, respectively.
(h) Principal Accountant’s Independence
Not applicable as the Registrant’s principal accountant has not provided non-audit services to the registrant’s investment adviser and any entity controlling, controlled by, or under common control with the investment adviser that provides ongoing services to the registrant that were not pre-approved pursuant to Rule 2-01(c)(7)(ii) of Regulation S-X.
(i) Not applicable.
(j) Not applicable.
Item 5 – Audit Committee of Listed Registrants – The registrant has a separately designated standing audit committee (the “Audit Committee”) established in accordance with Section 3(a)(58)(A) of the Securities Exchange Act of 1934. The members of the Audit Committee are Grace C. Torres (chair), Barry H. Evens, Brian K. Reid, Laurie Simon Hodrick and Keith F. Hartstein.
Item 6 – Schedule of Investments – The schedule is included as part of the report to shareholders filed under Item 1 of this Form.
Item 7 – Disclosure of Proxy Voting Policies and Procedures for Closed-End Management Investment Companies – Not applicable.
Item 8 – Portfolio Managers of Closed-End Management Investment Companies – Not applicable.
| Item 9 – | Purchases of Equity Securities by Closed-End Management Investment Company and Affiliated Purchasers – Not applicable. |
Item 10 – Submission of Matters to a Vote of Security Holders – There have been no material changes to these procedures.
Item 11 – Controls and Procedures
| | (a) | It is the conclusion of the registrant’s principal executive officer and principal financial officer that the effectiveness of the registrant’s current disclosure controls and procedures (such disclosure controls and procedures having been evaluated within 90 days of the date of this filing) provide reasonable assurance that the information required to be disclosed by the registrant has been recorded, processed, summarized and reported within the time period specified in the Commission’s rules and forms and that the information required to be disclosed by the registrant has been accumulated and communicated to the registrant’s principal executive officer and principal financial officer in order to allow timely decisions regarding required disclosure. |
| | (b) | There has been no significant change in the registrant’s internal control over financial reporting (as defined in Rule 30a-3(d) under the Act (17 CFR 270.30a-3(d))) that occurred during the period covered by this report that has materially affected, or is reasonably likely to materially affect, the registrant’s internal control over financial reporting. |
Item 12 – Controls and Procedures - Disclosure of Securities Lending Activities for Closed-End Management Investment Companies – Not applicable.
Item 13 – Exhibits
(a)(2)(1) Any written solicitation to purchase securities under Rule 23c-1 – Not applicable.
(a)(2)(2) Change in the registrant’s independent public accountant – Not applicable.
SIGNATURES
Pursuant to the requirements of the Securities Exchange Act of 1934 and the Investment Company Act of 1940, the registrant has duly caused this report to be signed on its behalf by the undersigned, thereunto duly authorized.
| | |
| Registrant: | | PGIM ETF Trust |
| |
| By: | | /s/ Andrew R. French |
| | Andrew R. French |
| | Secretary |
| |
| Date: | | October 19, 2023 |
Pursuant to the requirements of the Securities Exchange Act of 1934 and the Investment Company Act of 1940, this report has been signed below by the following persons on behalf of the registrant and in the capacities and on the dates indicated.
| | |
| By: | | /s/ Stuart S. Parker |
| | Stuart S. Parker |
| | President and Principal Executive Officer |
| |
| Date: | | October 19, 2023 |
| |
| By: | | /s/ Christian J. Kelly |
| | Christian J. Kelly |
| | Chief Financial Officer (Principal Financial Officer) |
| |
| Date: | | October 19, 2023 |