UNITED STATES
SECURITIES AND EXCHANGE COMMISSION
Washington, D.C. 20549
SECURITIES AND EXCHANGE COMMISSION
Washington, D.C. 20549
FORM N-CSR
CERTIFIED SHAREHOLDER REPORT OF REGISTERED
MANAGEMENT INVESTMENT COMPANIES
Investment Company Act file number 811- 23373
NORTH SQUARE INVESTMENTS TRUST
(Exact name of registrant as specified in charter)
(Exact name of registrant as specified in charter)
10 South LaSalle Street, Suite 1925
Chicago IL 60603
(Address of principal executive offices) (Zip code)
(Address of principal executive offices) (Zip code)
Alan E. Molotsky, Esq.
North Square Investments Trust
10 South LaSalle Street, Suite 1925
Chicago IL 60603
(Name and address of agent for service)
(Name and address of agent for service)
(312) 857-2160
Registrant's telephone number, including area code
Date of fiscal year end: May 31, 2019
Date of reporting period: June 1, 2018 – May 31, 2019
Item 1. Reports to Stockholders.
ANNUAL REPORT
NORTH SQUARE OAK RIDGE SMALL CAP GROWTH FUND
NORTH SQUARE INTERNATIONAL SMALL CAP FUND
NORTH SQUARE DYNAMIC SMALL CAP FUND
NORTH SQUARE OAK RIDGE DISCIPLINED GROWTH FUND
NORTH SQUARE MULTI STRATEGY FUND
NORTH SQUARE OAK RIDGE DIVIDEND GROWTH FUND
MAY 31, 2019
Beginning on January 1, 2021, as permitted by regulations adopted by the Securities and Exchange Commission, paper copies of the Fund’s shareholder reports like this one will no longer be sent by mail, unless you specifically request paper copies of the reports from the Fund, if you hold your shares directly with the Fund, or from your financial intermediary, such as a broker-dealer or bank, if you hold your shares through a financial intermediary. Instead, the reports will be made available on a website, and you will be notified by mail each time a report is posted and provided with a website link to access the report.
If you already elected to receive shareholder reports electronically, you will not be affected by this change and you need not take any action. If you hold your shares directly with the Fund, you may elect to receive shareholder reports and other communications from the Fund electronically by contacting the Fund at (855) 551-5521 or, if you hold your shares through a financial intermediary, contacting your financial intermediary.
You may elect to receive all future reports in paper free of charge. If you hold your shares directly with the Fund, you can inform the Fund that you wish to continue receiving paper copies of your shareholder reports at (855) 551-5521 or, if you hold your shares through a financial intermediary, contacting your financial intermediary. Your election to receive reports in paper will apply to all of the Investment Managers Series Trust’s Funds you hold directly or through your financial intermediary, as applicable.
 | North Square Investments | www.northsquareinvest.com |
North Square Funds
Table of Contents
| Shareholder Letters | 1 | |
| Fund Performance | 13 | |
| Schedules of Investments | 22 | |
| Statements of Assets and Liabilities | 46 | |
| Statements of Operations | 50 | |
| Statements of Changes in Net Assets | 52 | |
| Financial Highlights | 58 | |
| Notes to Financial Statements | 72 | |
| Report of Independent Registered Public Accounting Firm | 85 | |
| Supplemental Information | 86 | |
| Expense Examples | 93 |
This report and the financial statements contained herein are provided for the general information of the shareholders of the North Square Funds. This report is not authorized for distribution to prospective investors in the Funds unless preceded or accompanied by an effective prospectus.
www.northsquareinvest.com
 | |
| Discussion of Fund Performance | |
A letter from David Klaskin, Chief Executive Officer and Chief Investment Officer of Oak Ridge Investments and lead portfolio manager of the North Square Oak Ridge Small Cap Growth Fund.
Fellow Shareholders,
The markets began 2019 with a powerful reversal of the fourth quarter meltdown. The advance during the first few months of the year nearly erased the entire prior year’s decline in the major averages market indices, amidst a dramatic shift in sentiment. Within US equity markets the Russell 1000 surpassed previous highs from September 2018, while smaller caps have shown strong absolute returns but have yet to recover from the fourth quarter of 2018. Investor confidence was influenced by the Fed statement in December, which indicated that additional rate increases were no longer imminent, and the sale of Fed assets would also be tempered or eliminated. Much less attention was paid to the fears of economic slowdowns, both in the U.S. and globally, which led to the change in policy. This seems to be a good time to evaluate what factors are most likely to impact the markets looking ahead from here.
Long-term investors are rewarded for patient discipline and are guided by history. Throughout time, financial markets experience frequent cycles. Economies may grow, then overheat. Inflation fears emerge and through control of money supply and policy, governments slow that economic growth, which has been too difficult to precisely manage, and recessions generally occur and remain until confidence is re-established to ignite another growth phase. Expansions outpace contractions, as innovation and progress remain a constant that ultimately improves productivity. There is a wise adage, that history repeats and those adhering to the belief “this time is different”, end up sorely mistaken. The lows of the Great Recession reflected an overreaction, but the decline in interest rates, taxes and inflation have created an environment that has expanded profit margins and earnings growth. Accordingly, stocks seem fairly valued and those firms that continue to grow earnings look well positioned for further gains.
Innovation has been extraordinarily positive for the country, but the widespread availability and use of debt for individuals and decades of out of control government spending to compensate for irresponsible fiscal policies, has created a very challenging environment. The recent Trump trade action and threats may promote some changes, but technology has helped create a global economy and the cost savings from movement of manufacturing abroad are a significant impediment to repatriating meaningful jobs. Unemployment is extremely low and job growth will likely remain strong, but wage increases are nascent and not considered an inflationary threat beyond some activity around the hike in minimum wage. Technological advances are inherently deflationary. The greatest challenge is sluggish economic growth, which has been further threatened by an aging population in the U.S. and even greater challenges in most areas of the world.
The North Square Oak Ridge Small Cap Growth Fund for A shares at NAV (before any applicable taxes) returned -1.96% for the year versus the Russell 2000 Growth returns of -6.88% for the year ending 5/31/2019. Sector allocation and stock selection were both positive contributors to relative returns over the year. Our investment style takes a tempered approach to more cyclically oriented areas of the market in favor of more consistent growth opportunities. This not only manifests itself within the sector allocations we emphasize but within the particular industries underlying those sectors. The largest contribution was from an overweight position within the IT Services area of Information Technology. The semiconductor and technology equipment segments of the index generally did poorly relative to the market and sector. Three companies dramatically contributed to the outperformance over the period: Euronet Worldwide, EPAM Systems and Wix.com. Euronet Worldwide provides electronic payment processing and solutions for ATM, prepaid cards and money transfers. The company has shown consistent earnings per share growth with a compounded annual growth rate over the trailing five years in excess of 20% with excellent visibility going forward. EPAM Systems, a software development and digital engineering service firm, has captured a secular trend within information technology. Applications within fintech have been particularly rewarding. Wix.com has a highly scalable model for users to create websites. Their service can meet the requirements of varying levels of client needs from simple webpages to websites with higher degrees of customer engagement. Littelfuse was a mild detractor as concerns over slowing sales in new automotive vehicles has weighed more recently on the stock.
Consumer Discretionary was another area of contribution to the positive stock selection for the year. Off-price retailers, such as Five Below and Ollie’s Bargain Outlet, have been a consistent segment to find higher quality growth within retail, particularly as Amazon has increased its presence across most retail categories over the past few years. These companies compete by offering budget conscious shoppers looking for “great deals” a treasure hunt experience, which leads to a more consistent client engagement. Pool Corporation is a distributor of supplies and equipment for maintenance of swimming pools. Pool has become the dominant purveyor within a high recurring revenue business. These more consistent models contributed to returns, faring better than our other retail-oriented holdings which all suffered losses over the full year: Party-City Holdco, Duluth Holdings and American Eagle Outfitters. Each of the retailers have developed business models that we believe to have adapted to the shifting behavior of the consumer; nevertheless, the stocks have been more susceptible to changes in overall investor sentiment.
1
An underweight to the Industrials and Financials Sectors was beneficial to relative returns; however, stock selection within these two areas was an overall detractor to returns. Our more growth-oriented banks disproportionately declined with the broad banking area. Our two consumer finance holdings suffered meaningful losses for the year and had a larger impact on underperformance in the area. PRAA Group manages portfolios of distressed consumer credit card debt. We sold out of the position after years of patiently waiting for the distressed debt market to become more active. The stock was replaced by a promising financial technology company, Green Dot which as situated itself in a unique position within the industry by providing technology solutions and acting as a bank holding company. The subsequent announcement that the company would increase investment spending to bolster its competitive position was not appreciated by investors and sent the stock down precipitously. Its track record has shown an intelligent evolution in the development of its product capabilities and we believe the current negative sentiment is temporary. Within Industrials, our focus has been on businesses that have a recurring aspect to their model such as Watsco and A.O. Smith. These two long-term holdings have long served as performance leaders during more volatile periods; however, each had stock specific related issues that encouraged us to exit the positions. SAIA, a less-than-truckload transportation company, suffered with the general transport stocks during the period. We attempt to remain adequately diversified and have held this more cyclically exposed company due to its growth prospects across new regions. Its potential to expand should help the company outperform its peers should the transport market remain difficult while providing the overall portfolio with some economic exposure should conditions for the more cyclical companies improve.
Continuity and the Importance of Active Management
The Fund has been managed by the same portfolio managers, employing the same discipline rooted in fundamentals with a valuation awareness, since the Fund’s inception. Our persistent focus on supportable valuations and quality has often not appeared as relevant, and has actually detracted from investment results, throughout this long bull market; however, this overlooked metric is likely to be a key factor in determining success over the next several years.
Thank you for your continued confidence in Oak Ridge Investments.
Sincerely,
David Klaskin
CIO & Senior Portfolio Manager
The views in this letter are those of the Fund’s direct advisor were as of July 1, 2019 and may not necessarily reflect the same views on the date this letter is first published or any date thereafter. These views are intended to help shareholders in understanding the fund’s investment methodology and do not constitute investment advice.
Investment in equity securities involves substantial risks and may be subject to wide and sudden fluctuations in market value. Investing in small and mid-cap companies may be subject to more abrupt or erratic market movements and may have lower trading volumes or more erratic trading than securities of larger companies. Please see the prospectus for a more complete discussion of the fund’s risks.
The Russell 2000 Growth Index measures the performance of small cap U.S. growth stocks.
2
| | |
| Discussion of Fund Performance | |
A letter from Bram Zeigler of Algert Global LLC, portfolio manager of the North Square International Small Cap Fund.
Fellow Shareholders,
International small cap stocks fell as the Fund’s benchmark, the MSCI EAFE Small Cap Index (ND), declined 11.91% over the twelve-month period covering June 1, 2018 through May 31, 2019. The Fund trailed the benchmark over this period, delivering an absolute return of -17.14% for Class A shares at NAV.
Stock Selection Designed to be the Primary Source of Benchmark Outperformance
During the trailing 12-month period, stock selection contributed negatively to Fund performance, accounting for approximately a quarter of the Fund’s underperformance. The remaining portion of the underperformance was due to the portfolio’s allocation to various risk factors (e.g. a company’s industry, country, currency, size and beta characteristics).
Relative Value
The Relative Value model was a positive contributor to the performance of the Fund during the measurement period. Stocks that the Relative Value model ranked as the most attractive 10% of the investable universe outperformed the universe on a risk-adjusted basis. Inputs that value a company based on its ability to generate free cash flow and EBITDA were the primary contributors during the period. Inputs based on P/E ratio growth and dividend yield detracted.
Quality
The Quality model was a modest positive contributor to the performance of the Fund. Stocks that the Quality model ranked as the most attractive 10% of the investable universe modestly outperformed the universe on a risk-adjusted basis. Inputs that value a company based on its ability to generate taxable income and debt issuance were the primary contributors during the period. Inputs based on management communication methods and growth financing detracted.
Catalyst
The Catalyst model was a modest positive contributor to the performance of the Fund. Stocks that the Catalyst model ranked as the most attractive 10% of the investable universe modestly outperformed the universe on a risk-adjusted basis. Inputs that assess the presence of “smart money” investors and companies operating momentum were the primary contributors during the period. Most of the inputs based on technical trends and management sentiment detracted.
Risk Factors
Incidental active exposures to countries, industries and risk factors such as leverage, volatility and liquidity detracted from the performance of the Fund. While the performance impact of these exposures was larger than normal, we have experienced similar periods of risk factor performance in the past. The expectation is that these exposures will have minimal impact on the Fund’s active performance over a full market cycle.
Fund Positioning for the Future
We believe the Fund is positioned to take advantage of the market’s renewed emphasis (Catalyst) towards companies that are cheap relative to their peers (Relative Value) and have relatively sustainable projections (Quality). Over the past 12 months, we have increased our stock selection model’s emphasis on Quality at the expense of Catalyst, while keeping Relative Value relatively unchanged.
Thank you for your confidence in Algert Global LLC.
Sincerely,
Bram Zeigler,
Portfolio Manager
3
The views in this letter are those of the Fund’s advisor were as of July 1, 2019 and may not necessarily reflect the same views on the date this letter is first published or any date thereafter. These views are intended to help shareholders in understanding the fund’s investment methodology and do not constitute investment advice. Investment in equity securities involves substantial risks and may be subject to wide and sudden fluctuations in market value. Investing in mid cap companies may be subject to more abrupt or erratic market movements and may have lower trading volumes or more erratic trading than securities of larger companies. International investments are subject to unique risks including currency fluctuations, social, economic and political uncertainties, which could increase volatility. In addition, changes in exchange rates and interest rates may adversely affect the value of the fund’s foreign investments. Please see the prospectus for a more complete discussion of the fund’s risks.
The MSCI EAFE Small Cap Index measures the performance of small cap companies across developed markets outside of the U.S. & Canada.
4
| | |
| Discussion of Fund Performance | |
A letter from Peter Algert, Chief Investment Officer of Algert Global LLC and portfolio manager of the North Square Dynamic Small Cap Fund.
Fellow Shareholders,
U.S. small-cap stocks experienced a significant amount of volatility over the 12-month period ending 5/31/19. After a significant drawdown during the latter half of 2018, the Russell 2000 Index rebounded at the beginning of 2019 however was unable to fully recover prior losses, ending the 12-month period at -9.04%. The Fund however outperformed the index over this period, delivering an absolute return of -8.67% for Class A shares at NAV.
Stock Selection Designed to be the Primary Source of Benchmark Outperformance
During the trailing 12-month period, stock selection contributed positively to Fund performance, however was partially offset by negative contribution from incidental active exposures to various risk factors (e.g. a company’s industry, leverage, liquidity and beta characteristics). In addition to positive stock selection, the Fund also benefitted from various stock-specific events.
Relative Value
The Relative Value model detracted from the Fund’s performance during the measurement period. The “Value” style of investing has been challenged lately as investors have favored stocks with stronger growth characteristics and price levels which have made them unattractive on most valuation criteria. The poor performance of our Relative Value model has been particularly acute in the more fundamental insights, while some of our non-traditional valuation factors have performed better. For example, insights identifying the value of a stock based on activity and positioning within the fixed income markets, performed well relative to the more traditional cash-flow valuation measures.
Quality
The Quality model was a positive contributor to the performance of the Fund. With an uncertain economic backdrop, including events like Brexit and the ongoing trade war, investors appeared to favor companies with more defensive characteristics. The performance of our Quality insights was strong across various types of insights, particularly those constructed with natural language processing (NLP) techniques.
Catalyst
The Catalyst model was a positive contributor to the Fund’s performance. The Catalyst theme, which assesses sentiment and activities by other market participants, struggled at times during the latter half of 2018 but later rebounded as insights favoring various growth characteristics continued their longer-term trend of strong performance.
Risk Factors
Incidental active exposures to industries and risk factors such as leverage, volatility and liquidity detracted from performance over the measurement period. In particular, the Fund’s industry weights relative to the index detracted as dispersion in industry returns over the trailing 12-months was meaningful. While the impact of these exposures was larger than normal, we expect these exposures will have minimal impact on the Fund’s active performance over a full market cycle.
Fund Positioning for the Future
The Fund aims to be diversified across its three main investment themes, Relative Value, Quality and Catalyst. Given somewhat conflicting views from the fixed income and equity markets, we expect our positive tilt towards Quality metrics will be beneficial for the portfolio. We continue to favor Catalyst over Value however are monitoring this closely as the spread between the two styles has increased significantly in recent years.
Sincerely,
Peter Algert,
Chief Investment Officer
5
The views in this letter were as of July 1, 2019 and may not necessarily reflect the same views on the date this letter is first published or any time thereafter. These views are intended to help shareholders in understanding the fund’s investment methodology and do not constitute investment advice.
Investment in equity securities involves substantial risks and may be subject to wide and sudden fluctuations in market value. Investing in small cap companies may be subject to more abrupt or erratic market movements and may have lower trading volumes or more erratic trading than securities of larger companies. International investments are subject to unique risks including currency fluctuations, social, economic and political uncertainties, which could increase volatility. In addition, changes in exchange rates and interest rates may adversely affect the value of the fund’s foreign investments. Please see the prospectus for a more complete discussion of the fund’s risks.
The Russell 2000 Index measures the performance of primarily small cap U.S. stocks.
6
| | |
| Discussion of Fund Performance | |
A letter from Robert G. McVicker, Director of Research of Oak Ridge Investments and portfolio manager of the North Square Oak Ridge Disciplined Growth Fund.
Fellow Shareholders,
Despite the disruption of the fourth quarter of 2018, the North Square Oak Ridge Disciplined Growth Fund presented modest gains for the year ended May 31, 2019. After a healthier year of economic growth, equity markets rose disproportionately to fundamentals with further success becoming increasingly reliant on elevated profit margins and stronger economic growth. The prospect of a deceleration in GDP growth combined with a further rate hike from the Federal Reserve encouraged a correction in late 2018. The Fund’s style of investing in higher quality growth companies with strong visibility and healthy balance sheets supported relative returns during the difficult fourth quarter. Surprisingly, the market quickly recovered in the beginning months of 2019 with the Fund’s benchmark index, the Russell 3000 Growth, returning to new highs in April. A stoic Federal Reserve, combined with uncertainty about the effects of an increasingly inflammatory trade dispute between the US and it largest trading partners, triggered a return to a more risk averse market in May. Rapidly shifting investor sentiment over the trailing year encourages additional caution as 2019 progresses. The Fund outperformance in fourth quarter 2018 and May of 2019, gives us additional confidence that our style of investing can add value to our clients’ portfolios. The dynamic market environment is likely to continue, given growing economic uncertainty and an increasing scarcity for growth equity opportunities.
The Disciplined Growth Fund returned 6.80% for I shares at NAV (before any applicable taxes) for the annual period ending May 31, 2019. The Russell 3000 Growth Index returned 4.42% for the same one-year period. Stock selection was the primary driver of outperformance for the year with contributions from the Industrials, Consumer Discretionary and Information Technology Sectors. Our long-term approach to investing within the Industrials sector has been to avoid excessive exposure to more cyclically-oriented segments. Three successful contributors to relative returns demonstrate our approach: Transdigm Group, a provider of components and systems to the aerospace and defense industries; Waste Connections, a savvy operator within the waste management business; and Verisk Analytics, a professional services firm providing data analytics to insurance, energy and financial services businesses. The companies exemplify our focus on consistent, visible growth with less cycle dependence. XPO Logistics, on the other hand, is a less than truckload transportation company. The stock was a detractor to performance within the sector and was sold from the portfolio due to slowing growth prospects and large customer losses.
Within Consumer Discretionary, the strongest contributors to relative returns were ULTA Beauty, Ross Stores and Yum! Brands. After a difficult prior year due to concerns on Amazon encroachment, health and beauty retailer ULTA Beauty made a strong recovery in performance relative to the broad consumer group. Above average sales and earnings growth relative to other retailers has made ULTA a long-term contributor to the performance of the strategy. Off-price retailers, such as Ross Stores, have been a consistent segment to find higher quality growth within retail, particularly as Amazon has increased its presence across most retail categories over the past few years. These companies compete by offering budget conscious shoppers looking for “great deals” a treasure hunt experience, which leads to a more consistent client engagement. Yum! Brands is a franchise licensor for consumer brands such as Taco Bell, KFC and Pizza Hut. Careful management combined with highly recognizable brands has contributed to better earnings growth over the past few years in what has been a more difficult environment for restaurants. The largest negative contributor within the Consumer Discretionary was LKQ Corporation, which provides replacement automotive parts for collision and general repair. Larger European exposure has been the primary concerns for investors; however, sales and earnings growth over the preceding three years have been healthy.
Reduced exposure to the more volatile Semiconductor segment of the Information Technology sector in favor of more consistent IT Services businesses led to outperformance within Information Technology. The only major economic sector within the benchmark index that detracted from performance was Health Care. The three largest detractors within the sector were three of our largest contributors over the prior fiscal year: ABIOMED, a health care equipment company improving patient outcomes with a less invasive treatment for patients suffering from common, life threatening diseases of the heart; Globus Medical, which sells robots and related consumable products to promote healing in patients with musculoskeletal disorders; and Ligand Pharmaceuticals, which engages in the discovery and development of biopharmaceutical medicines through a portfolio of technologies, companies and partnerships. We take a long-term approach to investing that has served us well over time. The underlying fundamentals of these companies remain intact and we are confident that our patience will be rewarded.
7
Continuity and the Importance of Active Management
The Fund has been managed by the same lead portfolio manager, employing the same discipline rooted in fundamentals with a valuation awareness, since the Fund’s inception. Our persistent focus on supportable valuations and quality has often not appeared as relevant, and has actually detracted from investment results, throughout this long bull market; however, this overlooked metric is likely to be a key factor in determining success over the next several years.
Thank you for your continued confidence in Oak Ridge Investments.
Sincerely,
Robert G. McVicker
Senior Portfolio Manager
The views in this letter are those of the Fund’s direct advisor were as of July 1, 2019 and may not necessarily reflect the same views on the date this letter is first published or any date thereafter. These views are intended to help shareholders in understanding the fund’s investment methodology and do not constitute investment advice.
Investment in equity securities involves substantial risks and may be subject to wide and sudden fluctuations in market value. Investing in small and mid-cap companies may be subject to more abrupt or erratic market movements and may have lower trading volumes or more erratic trading than securities of larger companies. Please see the prospectus for a more complete discussion of the fund’s risks.
The Russell 3000 Growth Index measures the performance of stocks across almost all market caps.
8
| | |
| Discussion of Fund Performance | |
A letter from David Klaskin, Chief Executive Officer and Chief Investment Officer of Oak Ridge Investments and lead portfolio manager of the North Square Multi Strategy Fund.
Fellow Shareholders,
The US domestic equity markets began the calendar year with a strong recovery from the tumult of the fourth quarter of 2018. In April the Russell 1000 surpassed previous highs from September 2018, while smaller caps have shown strong absolute returns but have yet to recover from the fourth quarter of 2018. A stoic Federal Reserve combined with uncertainty of the effects of an increasingly inflammatory trade dispute between the US and it largest trading partners triggered a return to a more risk averse market in May. To be expected, US domestic equity indices led international indices for the year. Recent US preliminary GDP results for the first quarter came in higher than expected and estimates for the calendar year have stabilized while international economies continued to show signs of deceleration.
The North Square Multi Strategy Fund returned -4.88% for the A shares at NAV for the annual period ending May 31, 2019 as compared to the Russell 3000 Index return of 2.50% and the 5.39% return for the Russell 1000 Growth index for the same one-year period. Over the past year, the Fund has meaningfully diversified across the equity capitalization and style spectrum, while allocation to fixed income has been subdued. Rapidly shifting investor sentiment over the trailing year encourages additional caution as 2019 progresses; however, we continue to view opportunities within the US equity markets. We maintained our exposure to smaller capitalizations throughout the tumultuous fourth quarter as valuations continued to seem favorable for smaller capitalizations versus larger companies. Our largest holding over the period was the North Square Dynamic Small Cap Fund (Class I: -8.39%). While we reduced the position marginally throughout the year, the category underperformed other categories. Recent estimates across the small capitalization index, however, have revised downward more aggressively than in larger companies. This growing uncertainty in company fundamentals has exhausted the inertia of the recovering small cap stocks more so than larger caps. Further revisions downward or a lack of confirmation of conservatism over the approaching earnings season may prematurely punctuate our thesis as we look to the coming months as a guide.
The North Square International Small Cap Fund (Class I: -16.85%) produced losses over the period. We have maintained our lower weight to the International Small Cap Fund throughout the year as longer-term prospects have been less favorable than US equities. The North Square Global Resources & Infrastructure Fund (Class I: -20.09%) was the largest negative contributor to returns for the year. Brent Crude peaked on October 3rd at $86.29 before finishing the year at $53.80. The precipitous decline in oil prices was attributed both to deteriorating demand, as major economies showed decelerating growth, as well as supply considerations from OPEC and non-OPEC producers. The Global Resources Fund carries a high sensitivity to oil and other commodities, driving the Fund to decline over 18% in the fourth quarter. Efforts to reduce our exposure proved too gradual to avoid higher losses from that fund. In 2019, Materials underperformed as China growth deceleration pressured the Metals/Mining and Chemicals industries while oil prices gradually moved higher. Unfortunately, the partial recovery in oil year-to-date has not offset the broader concerns for global growth. The Multi Strategy has continued to taper exposure to the Global Resources Fund in 2019.
The North Square Oak Ridge Disciplined Growth Fund (Class I: 6.80%) and the North Square Oak Ridge Dividend Growth Fund (Class I: 6.94%) were the two strongest performers for the year. The subadvisor for the two funds, Oak Ridge Investments, focuses on higher quality companies with strong visibility and healthy balance sheets. This quality driven approach to the two investments styles of growth and income proved effective as each fund was able to preserve capital relative to their respective index during the two periods of risk-aversion, the fourth quarter 2018 and the month of May 2019, while participating in the positive performing periods. The dynamic market environment is likely to continue given growing economic uncertainty and an increasing scarcity for attractive opportunities within equities. The Dividend Growth Fund invests in companies with stable cash flows and an opportunity for shareholder income which are likely to continue to appeal to investors. Similarly, select growth opportunities will continue to exist within the market irrespective of the ultimate direction for global economic growth. The tempered approach to growth investing of the Disciplined Growth Fund, emphasizing quality and consistency, is a more conservative growth investment for the overall strategy in a year that may prove to be more differentiating. In general, we continue to believe this environment to be most conducive to flexible active managers with a focus on evaluating the relative merits of fundamentals rather than broad index exposures.
We appreciate your continued confidence in Oak Ridge Investments.
Sincerely,
David Klaskin
CIO & Senior Portfolio Manager
9
The views in this letter are those of the Fund’s direct advisor were as of July 1, 2019 and may not necessarily reflect the same views on the date this letter is first published or any date thereafter. These views are intended to help shareholders in understanding the fund’s investment methodology and do not constitute investment advice.
Investment in equity securities involves substantial risks and may be subject to wide and sudden fluctuations in market value. Investing in small and mid-cap companies may be subject to more abrupt or erratic market movements and may have lower trading volumes or more erratic trading than securities of larger companies. International investments are subject to unique risks including currency fluctuations, social, economic and political uncertainties, which could increase volatility. In addition, changes in exchange rates and interest rates may adversely affect the value of the fund’s foreign investments. Please see the prospectus for a more complete discussion of the fund’s risks.
The Russell 1000 Growth Index measures the performance of U.S., large capitalization growth stocks.
10
| | |
| Discussion of Fund Performance | |
A letter from David Klaskin, Chief Executive Officer and Chief Investment Officer of Oak Ridge Investments and lead portfolio manager of the North Square Oak Ridge Dividend Growth Fund.
Fellow Shareholders,
The fourth quarter of 2018 tested what has been a nearly unprecedented US stock market advance. The prospect of a deceleration in GDP growth combined with a further rate hike from the Federal Reserve encouraged a correction in late 2018. Surprisingly, the market quickly recovered in the beginning months of 2019 with the Fund’s benchmark index, the S&P 500, returning to new highs in April. The strategy focuses on stable to growing companies with an ability to increase shareholder income over time, which proved to be an appropriate recipe in a year where investor sentiment fluctuated so dramatically. The Fund was able to preserve capital relative to the broad index during the two periods of risk-aversion, first in fourth quarter 2018 and then in the month of May, while participating during the positive performing periods. As economic growth abates from the healthier growth of 2018 investors are likely to question overall valuation levels more acutely. Stable cash flows and an opportunity for shareholder income are likely to continue to appeal to investors should the rapidly shifting market environment continue.
Despite the difficult fourth quarter and the discontinuity during the month of May the Fund presented modest gains for the year ending 5/31/2019. The North Square Oak Ridge Dividend Growth Fund for A shares at NAV returned 6.73% for the year versus the S&P 500 returns of 3.78%. Utilities and Real Estate were the best returning economic sectors within the S&P 500 for the year. The Fund did not have holdings in either of these yielding areas; nevertheless, stock selection contributed to healthy outperformance across multiple sectors. The Energy, Information Technology and Industrials Sectors were the strongest contributors to relative returns. The Energy sector was the worst performing sector within the index for the year. Despite minor losses over the year in Exxon Mobil and Chevron, the Fund’s holdings in that sector were positive for the year due to the Fund’s holding in Kinder Morgan. Reduced exposure to more cyclical holdings within Industrials, in favor of the more consistent Waste Management, supported relative returns. Illinois Tool Works, which was sold from the portfolio, and Boeing, following the controversy surrounding the 737 MAX, were mild detractors for the year.
Returns within the Information Technology sector continue to outpace the broad index. As a strategy that seeks shareholder yield, many of the fastest growing companies are excluded from our investable universe; however, contributions from Cisco Systems, Automatic Data Systems and Qualcomm led to the Fund’s outperformance within the sector. Cisco’s years of stable cash flows had been underappreciated by investors. A resurgence in growth prospects from cloud networking solutions has enhanced returns over the past year. Similarly, ADP has been a stable performer over the long-run and recent management initiatives have unlocked the potential for margin expansion. Throughout the year the Fund has reduced overall exposure to semiconductors by selling lagging Intel and Analog Devices while retaining Qualcomm. Following the settlement of the long-standing dispute with Apple, investors were able to focus on the unique opportunities that have been developing for Qualcomm in the burgeoning 5G market.
Relative returns within our Consumer Staples and Consumer Discretionary sectors detracted from Fund performance for the year. Weakness within Consumer Staples was entirely related to Kraft Heinz Company. Over the past few years Kraft Heinz has made several attempts to acquire other large consumer brand firms that might help the firm move into more relevant product categories. Thus far, large deals that could have an immediate impact on the firm’s product mix have been unsuccessful. We have been patient, expecting that their small changes to the product portfolio will eventually improve the long-term prospects of the firm. Shifting dynamics in consumer behavior over the past few years has warranted a more muted exposure to the Consumer Discretionary space. New addition, Carnival Corporation, was the primary detractor within the sector due to weakness in its European business.
Continuity and the Importance of Active Management
The Fund has been managed by the same lead portfolio manager, employing the same discipline rooted in fundamentals with a valuation awareness, since the Fund’s inception. Our persistent focus on supportable valuations and quality has often not appeared as relevant, and has actually detracted from investment results, during this long bull market; however, this overlooked metric is likely to be a key factor in determining success over the next several years.
Thank you for your continued confidence in Oak Ridge Investments.
Sincerely,
David Klaskin
CIO & Senior Portfolio Manager
11
The views in this letter are those of the Fund’s direct advisor were as of July 1, 2019 and may not necessarily reflect the same views on the date this letter is first published or any date thereafter. These views are intended to help shareholders in understanding the fund’s investment methodology and do not constitute investment advice.
Investment in equity securities involves substantial risks and may be subject to wide and sudden fluctuations in market value. Investing in small and mid-cap companies may be subject to more abrupt or erratic market movements and may have lower trading volumes or more erratic trading than securities of larger companies. Please see the prospectus for a more complete discussion of the fund’s risks.
The S&P 500 Index measures the performance of the largest 500 U.S. stocks.
12
North Square Oak Ridge Small Cap Growth Fund
FUND PERFORMANCE at May 31, 2019 (Unaudited)
Performance of a $1,000,000 Investment
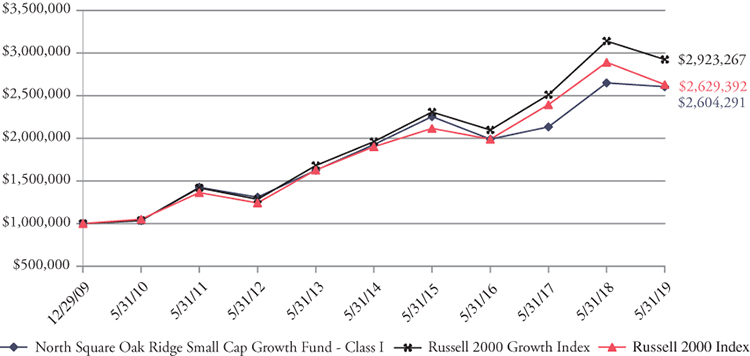
This graph compares a hypothetical $1,000,000 investment in the Fund’s Class I shares (the Class with the largest net assets), made at its inception, with a similar investment in the Russell 2000 Growth Index and the Russell 2000 Index. The performance graph above is shown for the Fund’s Class I Shares; Class A, Class C, and Class K shares performance may vary. Results include the reinvestment of all dividends and capital gains.
The Russell 2000 Growth Index measures the performance of U.S. small cap growth stocks. The Russell 2000 Index measures the performance of the small cap segment of the U.S. equity universe. These indices do not reflect expenses, fees or sales charge, which would lower performance. The indices are unmanaged and they are not available for investment.
| Since | Inception | ||||
Average Annual Total Returns as of May 31, 2019 | 1 Year | 5 Year | 10 Year | Inception | Date |
| Before deducting maximum sales charge | |||||
Class A1 | -1.96% | 5.90% | 11.98% | 9.74% | 01/03/94 |
Class C2 | -2.55% | 5.12% | 11.12% | 7.43% | 03/01/97 |
Class I3 | -1.67% | 6.23% | N/A | 10.70% | 12/29/09 |
Class K3 | -1.51% | 6.38% | N/A | 9.78% | 12/20/12 |
| After deducting maximum sales charge | |||||
Class A1 | -7.57% | 4.65% | 11.32% | 9.48% | 01/03/94 |
Class C2 | -3.26% | 5.12% | 11.12% | 7.43% | 03/01/97 |
| Russell 2000 Growth Index | -6.88% | 8.32% | 13.93% | 7.34% | 01/03/94 |
| Russell 2000 Index | -9.04% | 6.71% | 12.84% | 8.56% | 01/03/94 |
1 | Maximum sales charge for Class A shares is 5.75%. No sales charge applies on investments of $500,000 or more, but a contingent deferred sales charge (“CDSC”) of 1.00% will be imposed on certain redemptions of such shares within 12 months of the date of purchase. |
2 | A CDSC of 1.00% will be charged on Class C Shares purchases that are redeemed in whole or in part within 12 months of the date of purchase. |
3 | Class I and Class K shares do not have any initial or contingent deferred sales charge. |
The Fund acquired the assets and liabilities of the Pioneer Oak Ridge Small Cap Growth Fund (the “Predecessor Fund”) on October 17, 2014. As a result of the reorganization, the Fund is the accounting successor of the Predecessor Fund. Performance results shown in the graph and the performance table above for the period prior to October 17, 2014, reflect the performance of the Predecessor Fund.
13
North Square Oak Ridge Small Cap Growth Fund
FUND PERFORMANCE at May 31, 2019 (Unaudited) – Continued
The performance data quoted here represents past performance and past performance is not a guarantee of future results. Investment return and principal value will fluctuate so that an investor’s shares, when redeemed, may be worth more or less than their original cost. Current performance may be lower or higher than the performance information quoted. The most recent month end performance may be obtained by calling (855) 551-5521.
Gross and net expense ratios for Class A shares were 1.51% and 1.42%, for Class C shares were 2.26% and 2.17%, for Class I shares were 1.26% and 1.17%, and for Class K shares were 1.02% and 1.02%, which were the amounts stated in the current prospectus dated May 15, 2019. For the Fund’s current one year expense ratios, please refer to the Financial Highlights section of this report. The Fund’s advisor has contractually agreed to waive its fees and/or pay for operating expenses of the Fund to ensure that total annual fund operating expenses do not exceed 1.39%, 2.14%, 1.14%, and 0.99% of the average daily net assets of the Fund’s Class A, Class C, Class I, and Class K shares, respectively. This agreement is in effect until May 10, 2021, and it may be terminated before that date only by the Trust’s Board of Trustees. In the absence of such waivers, the Fund’s returns would have been lower.
Returns reflect the reinvestment of distributions made by the Fund, if any. The graph and the performance table shown do not reflect the deduction of taxes that a shareholder would pay on Fund distributions or the redemption of Fund shares.
14
North Square International Small Cap Fund
FUND PERFORMANCE at May 31, 2019 (Unaudited)
Performance of a $1,000,000 Investment
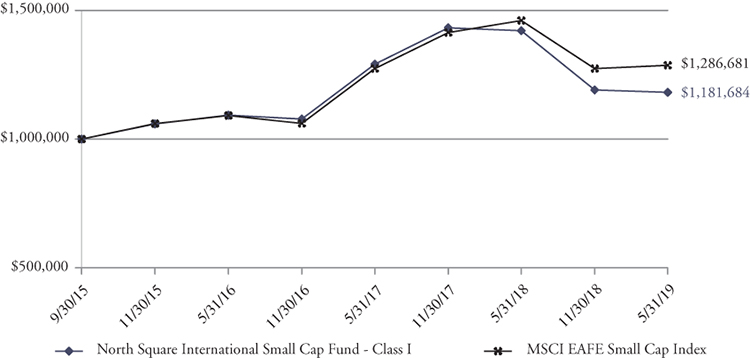
This graph compares a hypothetical $1,000,000 investment in the Fund’s Class l shares, made at its inception, with a similar investment in the MSCI EAFE Small Cap Index. The performance graph above is shown for the Fund’s Class I Shares; Class A shares performance may vary. Results include the reinvestment of all dividends and capital gains.
The MSCI EAFE Small Cap Index measures the performance of primarily small cap foreign stocks. The index does not reflect expenses, fees or sales charge, which would lower performance. The index is unmanaged and it is not available for investment.
| Since | Inception | |||
Average Annual Total Returns as of May 31, 2019 | 1 Year | 3 Year | Inception* | Date |
| Before deducting maximum sales charge | ||||
Class A1 | -17.14% | 2.35% | 2.69% | 12/01/15 |
Class I3 | -16.85% | 2.63% | 4.66% | 09/30/15 |
| After deducting maximum sales charge | ||||
Class A1 | -21.90% | 0.35% | 0.97% | 12/01/15 |
| MSCI EAFE Small Cap Index | -11.91% | 5.64% | 7.11% | 09/30/15 |
| * | The performance figures for Class A include the performance for Class I for the periods prior to the start date of Class A. Class A imposes higher expenses than that of Class I. |
1 | Maximum sales charge for Class A shares is 5.75%. No initial sales charge applies on investments of $500,000 or more, but a contingent deferred sales charge (“CDSC”) of 1.00% will be imposed on certain redemptions of such shares within 12 months of the date of purchase. |
2 | Class I shares do not have any initial or contingent deferred sales charge. |
The performance data quoted here represents past performance and past performance is not a guarantee of future results. Investment return and principal value will fluctuate so that an investor’s shares, when redeemed, may be worth more or less than their original cost. Current performance may be lower or higher than the performance information quoted. The most recent month end performance may be obtained by calling (855) 551-5521.
Gross and net expense ratios for Class A shares were 1.68% and 1.51%, respectively, and for Class I shares were 1.43% and 1.26%, respectively, which were the amounts stated in the current prospectus dated May 15, 2019. For the Fund’s current one year expense ratios, please refer to the Financial Highlights section of this report. The Fund’s Advisor has contractually agreed to waive its fees and/or pay for operating expenses of the Fund to ensure that total annual fund operating expenses do not exceed 1.50% and 1.25% of the average daily net assets of the Fund’s Class A and Class I shares, respectively. This agreement is in effect until May 10, 2029, and it may be terminated before that date only by the Trust’s Board of Trustees. In the absence of such waivers, the Fund’s returns would have been lower.
Returns reflect the reinvestment of distributions made by the Fund, if any. The graph and the performance table above do not reflect the deduction of taxes that a shareholder would pay on Fund distributions or the redemption of Fund shares.
15
North Square Dynamic Small Cap Fund
FUND PERFORMANCE at May 31, 2019 (Unaudited)
Performance of a $1,000,000 Investment
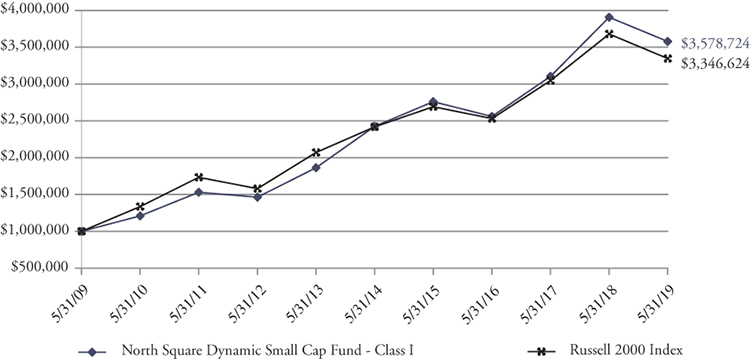
This graph compares a hypothetical $1,000,000 investment in the Fund’s Class l shares, made at its inception, with a similar investment in the Russell 2000 Index. The performance graph above is shown for the Fund’s Class I Shares; Class A shares performance may vary. Results include the reinvestment of all dividends and capital gains.
The Russell 2000 Index measures the performance of primarily small cap U.S. stocks. The index does not reflect expenses, fees or sales charge, which would lower performance. The index is unmanaged and it is not available for investment.
| Since | Inception | ||||
Average Annual Total Returns as of May 31, 2019 | 1 Year | 5 Year | 10 Year | Inception | Date |
| Before deducting maximum sales charge | |||||
Class A*1 | -8.67% | 7.83% | 13.32% | 6.97% | 12/01/15 |
Class I2 | -8.42% | 8.09% | 13.60% | 13.16% | 11/01/08 |
| After deducting maximum sales charge | |||||
Class A*1 | -13.92% | 6.56% | 12.65% | 5.17% | 12/01/15 |
| Russell 2000 Index | -9.04% | 6.71% | 12.84% | 11.48% | 11/01/08 |
| * | The performance figures for Class A include the performance for Class I for the periods prior to the start date of Class A. Class A imposes higher expenses than that of Class I. |
1 | Maximum sales charge for Class A shares is 5.75%. No initial sales charge applies on investments of $500,000 or more, but a contingent deferred sales charge (“CDSC”) of 1.00% will be imposed on certain redemptions of such shares within 12 months of the date of purchase. |
2 | Class I shares do not have any initial or contingent deferred sales charge. |
The Fund commenced investment operations on September 30, 2015 after the conversion of an account, the Algert Global U.S. Small Cap account (the “Predecessor Account”), into Class I shares of the Fund. The Predecessor Account commenced operations on November 1, 2008. Performance results shown in the graph and performance table above prior to September 30, 2015 reflect the performance of the Predecessor Account. The Predecessor Account was not registered under the 1940 Act and therefore was not subject to certain restrictions imposed by the 1940 Act on registered investment companies and by the Internal Revenue Code of 1986 on regulated investment companies. If the Predecessor Account had been registered under the 1940 Act, the Predecessor Account’s performance may have been adversely affected.
The performance data quoted here represents past performance and past performance is not a guarantee of future results. Investment return and principal value will fluctuate so that an investor’s shares, when redeemed, may be worth more or less than their original cost. Current performance may be lower or higher than the performance information quoted. The most recent month end performance may be obtained by calling (855) 551-5521.
16
North Square Dynamic Small Cap Fund
FUND PERFORMANCE at May 31, 2019 (Unaudited) – Continued
Gross and net expense ratios for Class A shares were 1.86% and 1.40%, respectively, and for Class I shares were 1.61% and 1.15%, respectively, which were the amounts stated in the current prospectus dated May 15, 2019. For the Fund’s current one year expense ratios, please refer to the Financial Highlights section of this report. The Fund’s Advisor has contractually agreed to waive its fees and/or pay for operating expenses of the Fund to ensure that total annual fund operating expenses do not exceed 1.40% and 1.15% of the average daily net assets of the Fund’s Class A and Class I shares, respectively. This agreement is in effect until May 10, 2029, and it may be terminated before that date only by the Trust’s Board of Trustees. In the absence of such waivers, the Fund’s returns would have been lower.
Returns reflect the reinvestment of distributions made by the Fund, if any. The graph and the performance table above do not reflect the deduction of taxes that a shareholder would pay on Fund distributions or the redemption of Fund shares.
17
North Square Oak Ridge Disciplined Growth Fund
FUND PERFORMANCE at May 31, 2019 (Unaudited)
Performance of a $1,000,000 Investment
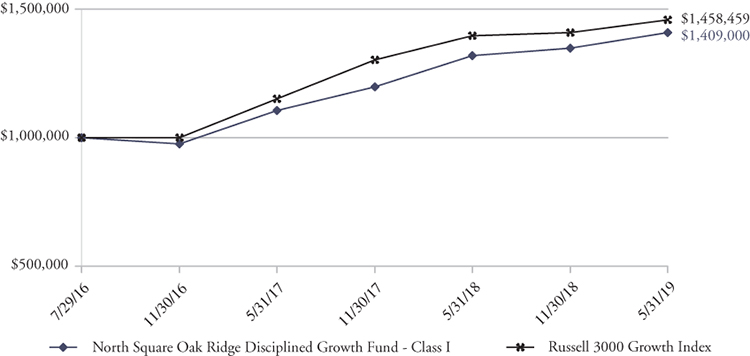
This graph compares a hypothetical $1,000,000 investment in the Fund’s Class I shares, made at its inception, with a similar investment in the Russell 3000 Growth Index. Results include the reinvestment of all dividends and capital gains.
The Russell 3000 Growth Index is a market capitalization weighted index and includes companies that display signs of above average growth. The index is used to provide a gauge of the performance of growth stocks in the U.S. This index does not reflect expenses, fees, or sales charge, which would lower performance. The index is unmanaged and it is not available for investment.
| Since | Inception | ||
Average Annual Total Returns as of May 31, 2019 | 1 Year | Inception | Date |
| Class I | 6.80% | 12.84% | 07/29/16 |
| Russell 3000 Growth Index | 4.42% | 14.22% | 07/29/16 |
The performance data quoted here represents past performance and past performance is not a guarantee of future results. Investment return and principal value will fluctuate so that an investor’s shares, when redeemed, may be worth more or less than their original cost. Current performance may be lower or higher than the performance information quoted. The most recent month end performance may be obtained by calling (855) 551-5521.
Gross and net expense ratios for the Class I shares were 1.62% and 0.95%, respectively, which were stated in the current prospectus dated May 15, 2019. For the Fund’s current one year expense ratios, please refer to the Financial Highlights section of this report. The Fund’s Advisor has contractually agreed to waive its fees and/or pay for operating expenses of the Fund to ensure that total annual fund operating expenses does not exceed 0.95% of the average daily net assets of the Fund’s Class I shares. This agreement is in effect until May 10, 2029, and it may be terminated before that date only by the Trust’s Board of Trustees. In the absence of such waivers, the Fund’s returns would have been lower.
Returns reflect the reinvestment of distributions made by the Fund, if any. The graph and the performance table above do not reflect the deduction of taxes that a shareholder would pay on Fund distributions or the redemption of the Fund shares.
18
North Square Multi Strategy Fund
FUND PERFORMANCE at May 31, 2019 (Unaudited)
Performance of a $10,000 Investment
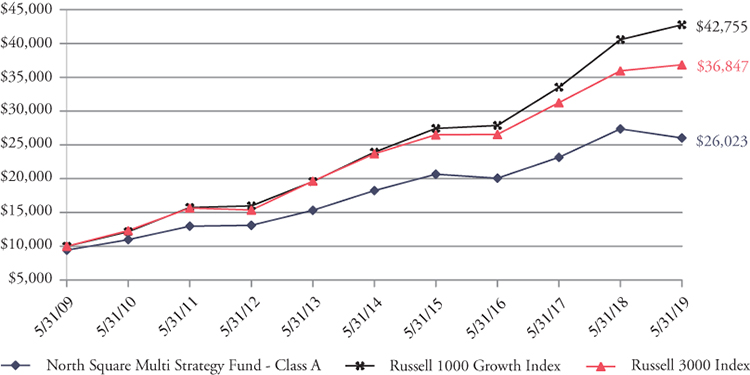
This graph compares a hypothetical $10,000 investment in the Fund’s Class A shares (assumes the maximum sales load charged by the Fund) with a similar investment in the Russell 1000 Growth Index and the Russell 3000 Index during the periods shown. The performance graph above is shown for the Fund’s Class A Shares; Class I and Class C shares performance may vary. Results include the reinvestment of all dividends and capital gains.
The Russell 1000 Growth Index measures the performance of U.S. large cap growth stocks. The Russell 3000 Index is a market-capitalization-weighted equity index maintained by the FTSE Russell that provides exposure to the entire U.S. stock market. These indices do not reflect expenses, fees or sales charge, which would lower performance. The indices are unmanaged and they are not available for investment.
| Since | Inception | ||||
Average Annual Total Returns as of May 31, 2019 | 1 Year | 5 Year | 10 Year | Inception | Date |
| Before deducting maximum sales charge | |||||
Class A1 | -4.88% | 7.37% | 10.69% | 4.73% | 03/01/99 |
Class C2 | -5.55% | 6.48% | 9.74% | 3.87% | 03/01/99 |
Class I3 | -4.23% | 7.60% | 10.88% | 6.74% | 08/10/04 |
| After deducting maximum sales charge | |||||
Class A1 | -10.35% | 6.11% | 10.04% | 4.42% | 03/01/99 |
Class C2 | -6.13% | 6.48% | 9.74% | 3.87% | 03/01/99 |
| Russell 1000 Growth Index | 5.39% | 12.33% | 15.64% | 5.60% | 03/01/99 |
| Russell 3000 Index | 2.50% | 9.25% | 13.93% | 6.44% | 03/01/99 |
1 | Maximum sales charge for Class A shares is 5.75%. No sales charge applies on investments of $500,000 or more, but a contingent deferred sales charge (“CDSC”) of 1.00% will be imposed on certain redemptions of such shares within 12 months of the date of purchase. |
2 | A CDSC of 1.00% will be charged on Class C Shares purchases that are redeemed in whole or in part within 12 months of the date of purchase. |
3 | Class I shares do not have any initial or contingent deferred sales charge. |
The Fund acquired the assets and liabilities of the Pioneer Oak Ridge Large Cap Growth Fund (the “Predecessor Fund”) on October 17, 2014. As a result of the reorganization, the Fund is the accounting successor of the Predecessor Fund. Performance results shown in the graph and the performance table above for the period prior to October 17, 2014, reflect the performance of the Predecessor Fund.
19
North Square Multi Strategy Fund
FUND PERFORMANCE at May 31, 2019 (Unaudited) – Continued
The performance data quoted here represents past performance and past performance is not a guarantee of future results. Investment return and principal value will fluctuate so that an investor’s shares, when redeemed, may be worth more or less than their original cost. Current performance may be lower or higher than the performance information quoted. The most recent month end performance may be obtained by calling (855) 551-5521.
Gross and net expense ratios for Class A shares were 1.78% and 1.78%, respectively, for Class C shares were 2.53% and 2.53%, respectively, and for Class I shares were 1.53% and 1.53%, respectively, which were the amounts stated in the current prospectus dated May 15, 2019. For the Fund’s current one year expense ratios, please refer to the Financial Highlights section of this report. The Fund’s Advisor has contractually agreed to waive its fees and/or pay for operating expenses of the Fund to ensure that total annual fund operating expenses do not exceed 1.20%, 2.10%, and 1.17% of the average daily net assets of the Fund’s Class A, Class C, and Class I shares, respectively. This agreement is in effect until May 10, 2029, and it may be terminated before that date only by the Trust’s Board of Trustees. In the absence of such waivers, the Fund’s returns would have been lower.
Returns reflect the reinvestment of distributions made by the Fund, if any. The graph and the performance table shown do not reflect the deduction of taxes that a shareholder would pay on Fund distributions or the redemption of Fund shares.
20
North Square Oak Ridge Dividend Growth Fund
FUND PERFORMANCE at May 31, 2019 (Unaudited)
Performance of a $1,000,000 Investment
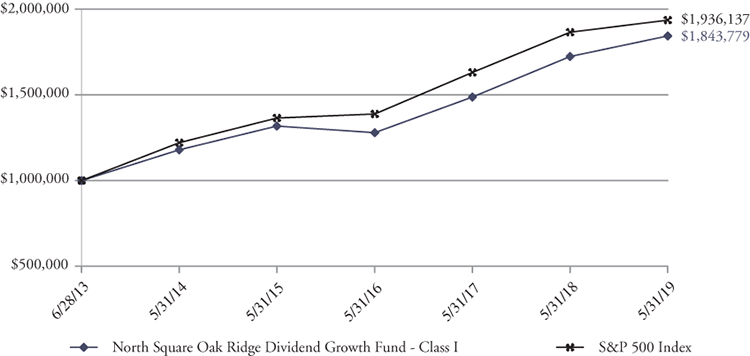
This graph compares a hypothetical $1,000,000 investment in the Fund’s Class l shares, made at its inception, with a similar investment in the S&P 500 Index. The performance graph above is shown for the Fund’s Class I Shares; Class A shares performance may vary. Results include the reinvestment of all dividends and capital gains.
The S&P 500 Index measures the performance of primarily large cap U.S. stocks. The index does not reflect expenses, fees or sales charge, which would lower performance. The index is unmanaged and it is not available for investment.
| Since | Inception | ||||
Average Annual Total Returns as of May 31, 2019 | 1 Year | 3 Year | 5 Year | Inception | Date |
| Before deducting maximum sales charge | |||||
Class A*1 | 6.73% | 12.67% | 9.08% | 10.46% | 06/28/13 |
Class I2 | 6.94% | 12.95% | 9.35% | 10.88% | 06/28/13 |
| After deducting maximum sales charge | |||||
Class A1 | 0.58% | 10.47% | 7.79% | 9.36% | 06/28/13 |
| S&P 500 Index | 3.78% | 11.72% | 9.66% | 11.80% | 06/28/13 |
1 | Maximum sales charge for Class A shares is 5.75%. No initial sales charge applies on investments of $500,000 or more, but a contingent deferred sales charge (“CDSC”) of 1.00% will be imposed on certain redemptions of such shares within 12 months of the date of purchase. |
2 | Class I shares do not have any initial or contingent deferred sales charge. |
The performance data quoted here represents past performance and past performance is not a guarantee of future results. Investment return and principal value will fluctuate so that an investor’s shares, when redeemed, may be worth more or less than their original cost. Current performance may be lower or higher than the performance information quoted. The most recent month end performance may be obtained by calling (855) 551-5521.
Gross and net expense ratios for Class A shares were 2.41% and 1.25%, respectively, and for Class I shares were 2.16% and 1.00%, respectively, which were the amounts stated in the current prospectus dated May 15, 2019. For the Fund’s current one year expense ratios, please refer to the Financial Highlights section of this report. The Fund’s Advisor has contractually agreed to waive its fees and/or pay for operating expenses of the Fund to ensure that total annual fund operating expenses do not exceed 1.25% and 1.00% of the average daily net assets of the Fund’s Class A and Class I shares, respectively. This agreement is in effect until May 10, 2029, and it may be terminated before that date only by the Trust’s Board of Trustees. In the absence of such waivers, the Fund’s returns would have been lower.
Returns reflect the reinvestment of distributions made by the Fund, if any. The graph and the performance table above do not reflect the deduction of taxes that a shareholder would pay on Fund distributions or the redemption of Fund shares.
21
North Square Oak Ridge Small Cap Growth Fund
SCHEDULE OF INVESTMENTS
As of May 31, 2019
| Number | |||||||
| of Shares | Value | ||||||
| COMMON STOCKS – 94.4% | |||||||
| COMMUNICATION SERVICES – 1.4% | |||||||
| 138,500 | MSG Networks Inc. – Class A* | $ | 2,923,735 | ||||
| CONSUMER DISCRETIONARY – 18.5% | |||||||
| 188,500 | American Eagle Outfitters, Inc. | 3,279,900 | |||||
| 26,500 | Bright Horizons Family Solutions Inc.* | 3,632,090 | |||||
| 30,000 | Burlington Stores, Inc.* | 4,697,400 | |||||
| 144,500 | Duluth Holdings, Inc. – Class B* | 2,160,275 | |||||
| 53,700 | Five Below, Inc.* | 6,912,801 | |||||
| 75,200 | Ollie’s Bargain Outlet Holdings, Inc.* | 7,423,744 | |||||
| 177,600 | Party City Holdco Inc.* | 1,403,040 | |||||
| 29,600 | Pool Corp. | 5,321,488 | |||||
| 118,700 | YETI Holdings, Inc.* | 2,839,304 | |||||
| 37,670,042 | |||||||
| CONSUMER STAPLES – 4.5% | |||||||
| 288,700 | Nomad Foods Ltd.*1 | 6,126,214 | |||||
| 156,500 | Sprouts Farmers Market, Inc.* | 3,137,825 | |||||
| 9,264,039 | |||||||
| ENERGY – 0.9% | |||||||
| 111,300 | Matador Resources Co.* | 1,829,772 | |||||
| FINANCIALS – 4.9% | |||||||
| 86,800 | Ameris Bancorp | 3,063,172 | |||||
| 54,900 | Green Dot Corp. – Class A* | 2,547,909 | |||||
| 90,300 | Home BancShares Inc. | 1,582,056 | |||||
| 44,200 | Pinnacle Financial Partners, Inc. | 2,340,390 | |||||
| 8,000 | Stifel Financial Corp. | 429,040 | |||||
| 9,962,567 | |||||||
| HEALTH CARE – 23.8% | |||||||
| 72,000 | Array BioPharma Inc.* | 1,902,240 | |||||
| 96,000 | Arrowhead Pharmaceuticals, Inc.* | 2,276,160 | |||||
| 108,600 | Codexis, Inc.* | 1,965,660 | |||||
| 33,000 | CONMED Corp. | 2,655,840 | |||||
| 105,400 | Evolent Health, Inc. – Class A* | 1,121,456 | |||||
| 63,300 | Globus Medical, Inc. – Class A* | 2,487,690 | |||||
| 42,700 | Heron Therapeutics, Inc.* | 727,181 | |||||
| 134,200 | Horizon Therapeutics Public Limited Co.*1 | 3,197,986 | |||||
| 28,000 | Insulet Corp.* | 3,074,120 | |||||
| 28,300 | LHC Group, Inc.* | 3,205,824 | |||||
| 27,600 | Ligand Pharmaceuticals Inc.* | 2,963,688 | |||||
| 45,100 | Merit Medical Systems, Inc.* | 2,328,513 | |||||
| 102,000 | NeoGenomics, Inc.* | 2,214,420 | |||||
| 83,400 | Omnicell, Inc.* | 6,626,130 | |||||
| 33,700 | Pacira BioSciences, Inc.* | 1,466,287 | |||||
| 18,700 | Penumbra, Inc.* | 2,668,490 | |||||
| 79,200 | Retrophin, Inc.* | 1,467,576 | |||||
| 19,800 | Sage Therapeutics, Inc.* | 3,403,026 | |||||
See accompanying Notes to Financial Statements.
22
North Square Oak Ridge Small Cap Growth Fund
SCHEDULE OF INVESTMENTS – Continued
As of May 31, 2019
| Number | |||||||
| of Shares | Value | ||||||
| COMMON STOCKS (Continued) | |||||||
| HEALTH CARE (Continued) | |||||||
| 12,300 | Sarepta Therapeutics, Inc.* | $ | 1,400,355 | ||||
| 47,300 | Supernus Pharmaceuticals, Inc.* | 1,420,419 | |||||
| 48,573,061 | |||||||
| INDUSTRIALS – 13.8% | |||||||
| 157,700 | Advanced Disposal Services, Inc.* | 5,068,478 | |||||
| 42,100 | ASGN Inc.* | 2,135,733 | |||||
| 84,800 | Beacon Roofing Supply, Inc.* | 2,930,688 | |||||
| 117,000 | Casella Waste Systems, Inc. – Class A* | 4,530,240 | |||||
| 30,500 | Insperity, Inc. | 3,473,950 | |||||
| 20,300 | John Bean Technologies Corp. | 2,081,765 | |||||
| 54,800 | Saia, Inc.* | 3,233,200 | |||||
| 34,400 | SiteOne Landscape Supply, Inc.* | 2,231,528 | |||||
| 160,500 | Welbilt, Inc.* | 2,476,515 | |||||
| 28,162,097 | |||||||
| INFORMATION TECHNOLOGY – 26.6% | |||||||
| 127,800 | The Descartes Systems Group Inc.*1 | 5,124,780 | |||||
| 78,700 | Envestnet, Inc.* | 5,265,817 | |||||
| 32,500 | EPAM Systems, Inc.* | 5,609,175 | |||||
| 46,200 | Euronet Worldwide, Inc.* | 7,162,848 | |||||
| 52,700 | Five9, Inc.* | 2,706,145 | |||||
| 21,200 | Littelfuse, Inc. | 3,460,052 | |||||
| 55,000 | Mimecast Ltd.*1 | 2,497,000 | |||||
| 21,700 | New Relic, Inc.* | 2,176,944 | |||||
| 95,000 | Perficient, Inc.* | 2,890,850 | |||||
| 63,500 | Rapid7, Inc.* | 3,317,875 | |||||
| 25,500 | ShotSpotter, Inc.* | 1,173,000 | |||||
| 28,000 | Silicon Laboratories Inc.* | 2,619,960 | |||||
| 29,100 | WEX Inc.* | 5,498,154 | |||||
| 34,500 | Wix.com Ltd.*1 | 4,738,230 | |||||
| 54,240,830 | |||||||
| TOTAL COMMON STOCKS | |||||||
| (Cost $147,494,079) | 192,626,143 | ||||||
| REAL ESTATE INVESTMENT TRUST (REIT) – 1.5% | |||||||
| 66,300 | Terreno Realty Corp. | 3,030,573 | |||||
| TOTAL REIT | |||||||
| (Cost $2,222,601) | 3,030,573 | ||||||
See accompanying Notes to Financial Statements.
23
North Square Oak Ridge Small Cap Growth Fund
SCHEDULE OF INVESTMENTS – Continued
As of May 31, 2019
| Number | |||||||
| of Shares | Value | ||||||
| SHORT-TERM INVESTMENT – 4.4% | |||||||
| 8,944,659 | First American Treasury Obligations Fund, 2.30%2 | $ | 8,944,659 | ||||
| TOTAL SHORT-TERM INVESTMENT | |||||||
| (Cost $8,944,659) | 8,944,659 | ||||||
| TOTAL INVESTMENTS – 100.3% | |||||||
| (Cost $158,661,339) | 204,601,375 | ||||||
| Liabilities in Excess of Other Assets – (0.3)% | (637,979 | ) | |||||
| TOTAL NET ASSETS – 100.0% | $ | 203,963,396 | |||||
| * | Non-income producing security. | |
1 | Foreign security denominated in U.S. Dollars. | |
2 | The rate is the annualized seven-day yield at period end. |
Investments are classified by industry pursuant to the Global Industry Classification Standard (GICS®), which was developed by and/or is the exclusive property of Morgan Stanley Capital International, Inc. (“MSCI”) and Standard & Poor’s Financial Services LLC (“S&P”). GICS is a service mark of MSCI and S&P and has been licensed for use by U.S. Bancorp Fund Services, LLC.
See accompanying Notes to Financial Statements.
24
North Square Oak Ridge Small Cap Growth Fund
SUMMARY OF INVESTMENTS
As of May 31, 2019
| Percent of Total | |||||
| Security Type/Sector | Net Assets | ||||
| Common Stocks | |||||
| Information Technology | 26.6 | % | |||
| Health Care | 23.8 | % | |||
| Consumer Discretionary | 18.5 | % | |||
| Industrials | 13.8 | % | |||
| Financials | 4.9 | % | |||
| Consumer Staples | 4.5 | % | |||
| Communication Services | 1.4 | % | |||
| Energy | 0.9 | % | |||
| Total Common Stocks | 94.4 | % | |||
| REIT | 1.5 | % | |||
| Short-Term Investment | 4.4 | % | |||
| Total Investments | 100.3 | % | |||
| Liabilities in Excess of Other Assets | (0.3 | )% | |||
| Total Net Assets | 100.0 | % | |||
See accompanying Notes to Financial Statements.
25
North Square International Small Cap Fund
SCHEDULE OF INVESTMENTS
As of May 31, 2019
| Number | |||||||
| of Shares | Value | ||||||
| COMMON STOCKS – 97.1% | |||||||
| AUSTRALIA – 6.1% | |||||||
| 65,715 | Accent Group Ltd. | $ | 67,696 | ||||
| 102,004 | GWA Group Ltd. | 247,660 | |||||
| 129,739 | IDP Education Ltd. | 1,538,094 | |||||
| 5,832 | New Hope Corp. Ltd. | 10,640 | |||||
| 11,323 | Nick Scali Ltd. | 55,533 | |||||
| 127,606 | Regis Resources Ltd. | 393,914 | |||||
| 37,930 | Sandfire Resources NL | 161,818 | |||||
| 50,931 | SmartGroup Corp. Ltd. | 309,144 | |||||
| 2,784,499 | |||||||
| AUSTRIA – 0.8% | |||||||
| 10,876 | Oesterreichische Post AG | 364,506 | |||||
| BELGIUM – 1.1% | |||||||
| 1,169 | Barco N.V. | 227,759 | |||||
| 6,575 | S.A. D’Ieteren N.V. | 284,630 | |||||
| 512,389 | |||||||
| BERMUDA – 0.1% | |||||||
| 3,300 | VTech Holdings Ltd. | 27,361 | |||||
| CHINA – 0.3% | |||||||
| 318,000 | Sinopec Shanghai Petrochemical Co. Ltd. – H Shares | 138,727 | |||||
| DENMARK – 3.7% | |||||||
| 35,150 | GN Store Nord A/S | 1,655,305 | |||||
| FINLAND – 1.6% | |||||||
| 31,746 | Valmet Corp. | 732,712 | |||||
| FRANCE – 0.2% | |||||||
| 972 | Gaztransport Et Technigaz | 88,499 | |||||
| GERMANY – 6.2% | |||||||
| 18,435 | ADVA Optical Networking SE* | 140,250 | |||||
| 82 | Amadeus Fire AG | 10,535 | |||||
| 11,349 | Hamburger Hafen und Logistik AG | 269,547 | |||||
| 834 | Isra Vision AG | 30,374 | |||||
| 21,307 | Jenoptik AG | 662,920 | |||||
| 9,106 | Nemetschek SE | 1,396,729 | |||||
| 4,114 | Siltronic AG | 281,366 | |||||
| 2,791,721 | |||||||
| HONG KONG – 3.3% | |||||||
| 372,000 | China Communications Services Corp. Ltd. – H Shares | 278,542 | |||||
| 245,400 | China Lesso Group Holdings Ltd. | 156,514 | |||||
| 44,406 | K Wah International Holdings Ltd. | 25,716 | |||||
| 115,548 | Kerry Logistics Network Ltd. | 187,776 | |||||
| 245,000 | Lonking Holdings Ltd. | 65,004 | |||||
See accompanying Notes to Financial Statements.
26
North Square International Small Cap Fund
SCHEDULE OF INVESTMENTS – Continued
As of May 31, 2019
| Number | |||||||
| of Shares | Value | ||||||
| COMMON STOCKS (Continued) | |||||||
| HONG KONG (Continued) | |||||||
| 125,769 | SmarTone Telecommunications Holdings Ltd. | $ | 123,530 | ||||
| 126,000 | Vitasoy International Holdings Ltd. | 675,842 | |||||
| 1,512,924 | |||||||
| ITALY – 3.7% | |||||||
| 254,455 | A2A S.p.A | 414,886 | |||||
| 2,224 | Acea | 41,343 | |||||
| 28,103 | Fiera Milano S.p.A. | 123,855 | |||||
| 11,397 | Hera S.p.A. | 41,380 | |||||
| 103,282 | Italgas S.p.A. | 653,986 | |||||
| 147,020 | Piaggio & C. S.p.A. | 424,407 | |||||
| 1,699,857 | |||||||
| JAPAN – 31.7% | |||||||
| 700 | The 77 Bank, Ltd. | 10,529 | |||||
| 72,500 | AEON Mall Co., Ltd. | 1,067,111 | |||||
| 6,800 | Belluna Co., Ltd. | 47,816 | |||||
| 2,000 | Dainichiseika Color & Chemicals Manufacturing Co., Ltd. | 52,785 | |||||
| 1,400 | Daiwabo Holdings Co., Ltd. | 58,847 | |||||
| 9,200 | DOUTOR NICHIRES Holdings Co., Ltd | 177,692 | |||||
| 5,800 | F-TECH Inc. | 38,055 | |||||
| 14,793 | Furukawa Electric Co., Ltd. | 396,428 | |||||
| 3,700 | Fuyo General Lease Co. Ltd. | 180,621 | |||||
| 7,900 | GLORY Ltd. | 195,668 | |||||
| 3,900 | G-Tekt Corp. | 53,120 | |||||
| 18,024 | The Gunma Bank, Ltd. | 64,036 | |||||
| 23,000 | Gurunavi, Inc. | 115,462 | |||||
| 5,400 | Hanwa Co., Ltd. | 137,336 | |||||
| 63,200 | The Hiroshima Bank, Ltd. | 324,850 | |||||
| 3,679 | Hokuhoku Financial Group, Inc. | 39,586 | |||||
| 22,800 | ITO EN, Ltd. | 1,081,456 | |||||
| 32,600 | Iwatani Corp. | 1,069,469 | |||||
| 1,000 | Jaccs Co., Ltd. | 17,506 | |||||
| 53,600 | JTEKT Corp. | 569,808 | |||||
| 41,800 | JVC Kenwood Corp. | 89,104 | |||||
| 3,500 | Kaga Electronics Co., Ltd. | 51,225 | |||||
| 15,000 | Kakaku.com, Inc. | 304,803 | |||||
| 13,800 | Kanamoto Co., Ltd. | 307,034 | |||||
| 12,800 | Kandenko Co., Ltd. | 103,945 | |||||
| 23,700 | Kanematsu Corp. | 268,133 | |||||
| 12,800 | Kewpie Corp. | 287,148 | |||||
| 3,500 | Kobe Steel, Ltd. | 21,737 | |||||
| 7,000 | Maruzen Showa Unyu Co., Ltd. | 212,522 | |||||
| 13,200 | Meidensha Corp. | 183,690 | |||||
| 5,400 | Mimasu Semiconductor Industry Co., Ltd. | 73,601 | |||||
| 26,100 | Mitsubishi Materials Corp. | 682,336 | |||||
| 1,600 | The Miyazaki Bank, Ltd. | 38,226 | |||||
| 100 | Monogatari Corp. | 7,982 | |||||
| 20,600 | Nagase & Co., Ltd. | 301,496 | |||||
See accompanying Notes to Financial Statements.
27
North Square International Small Cap Fund
SCHEDULE OF INVESTMENTS – Continued
As of May 31, 2019
| Number | |||||||
| of Shares | Value | ||||||
| COMMON STOCKS (Continued) | |||||||
| JAPAN (Continued) | |||||||
| 1,000 | Nihon M&A Center Inc. | $ | 24,943 | ||||
| 125,100 | Nippon Suisan Kaisha, Ltd. | 761,925 | |||||
| 1,600 | Nishio Rent All Co., Ltd. | 41,593 | |||||
| 4,500 | The Nisshin Oillio Group, Ltd. | 131,431 | |||||
| 17,200 | NS Solutions Corp. | 537,277 | |||||
| 7,800 | Onoken Co., Ltd. | 98,323 | |||||
| 2,200 | Relo Group, Inc. | 59,078 | |||||
| 25,800 | Rohto Pharmaceutical Co., Ltd. | 704,729 | |||||
| 2,600 | Shinagawa Refractories Co., Ltd. | 70,036 | |||||
| 3,300 | STUDIO ALICE Co., Ltd. | 61,636 | |||||
| 56,100 | Sumitomo Forestry Co., Ltd. | 638,318 | |||||
| 51,800 | Sun Frontier Fudousan Co., Ltd. | 479,926 | |||||
| 5,500 | Sun-Wa Technos Corp. | 39,994 | |||||
| 5,100 | Takara Bio Inc. | 109,375 | |||||
| 27,000 | Takara Leben Co. Ltd. | 91,939 | |||||
| 8,400 | Teijin Ltd. | 137,436 | |||||
| 23,500 | Toyo Construction Co., Ltd. | 86,961 | |||||
| 4,711 | TPR Co., Ltd. | 76,818 | |||||
| 7,500 | Tsuruha Holdings Inc. | 602,824 | |||||
| 14,900 | UACJ Corp. | 237,047 | |||||
| 18,100 | Unipres Corp. | 286,286 | |||||
| 3,000 | Valor Co., Ltd. | 61,044 | |||||
| 22,900 | Yamazen Corp. | 213,225 | |||||
| 1,900 | Yorozu Corp. | 22,706 | |||||
| 6,574 | Yuasa Trading Co., Ltd. | 178,902 | |||||
| 14,384,935 | |||||||
| JERSEY – 3.4% | |||||||
| 469,394 | boohoo Group PLC* | 1,338,193 | |||||
| 74,816 | Gulf Keystone Petroleum Ltd.* | 216,603 | |||||
| 1,554,796 | |||||||
| LUXEMBOURG – 0.7% | |||||||
| 12,221 | Grand City Properties S.A. | 314,014 | |||||
| NETHERLANDS – 2.5% | |||||||
| 2,795 | ASM International N.V. | 163,554 | |||||
| 36,721 | Signify N.V. | 982,913 | |||||
| 1,146,467 | |||||||
| NORWAY – 2.3% | |||||||
| 2,932 | Salmar ASA | 134,008 | |||||
| 36,391 | TGS NOPEC Geophysical Co. ASA | 911,886 | |||||
| 1,045,894 | |||||||
| PORTUGAL – 0.9% | |||||||
| 61,049 | Altri, S.G.P.S., S.A. | 413,982 | |||||
| SINGAPORE – 1.4% | |||||||
| 69,300 | Best World International Ltd.1 | 68,609 | |||||
See accompanying Notes to Financial Statements.
28
North Square International Small Cap Fund
SCHEDULE OF INVESTMENTS – Continued
As of May 31, 2019
| Number | |||||||
| of Shares | Value | ||||||
| COMMON STOCKS (Continued) | |||||||
| SINGAPORE (Continued) | |||||||
| 74,300 | ComfortDelGro Corp Ltd. | $ | 133,055 | ||||
| 18,600 | Hi-P International Ltd. | 15,842 | |||||
| 37,500 | Venture Corporation Ltd. | 412,481 | |||||
| 629,987 | |||||||
| SPAIN – 1.4% | |||||||
| 29,573 | Compania de Distribucion Integral Logista Holdings, S.A. | 653,815 | |||||
| SWEDEN – 5.5% | |||||||
| 60,975 | Betsson AB* | 385,657 | |||||
| 46,550 | Evolution Gaming Group AB | 886,209 | |||||
| 5,100 | Lifco AB – B Shares | 248,162 | |||||
| 6,326 | Lindab International AB | 65,418 | |||||
| 11,219 | Nolato AB – B Shares | 534,790 | |||||
| 4,776 | Tethys Oil AB | 31,214 | |||||
| 22,374 | Wihlborgs Fastigheter AB | 325,478 | |||||
| 2,476,928 | |||||||
| SWITZERLAND – 2.0% | |||||||
| 122 | Forbo Holding AG | 197,393 | |||||
| 1,997 | Huber + Suhner AG | 153,776 | |||||
| 3,056 | Kardex AG | 471,868 | |||||
| 2,034 | Logitech International S.A. | 74,311 | |||||
| 897,348 | |||||||
| UNITED KINGDOM – 18.2% | |||||||
| 27,595 | Bodycote PLC | 271,422 | |||||
| 12,393 | Card Factory PLC | 29,675 | |||||
| 20,370 | Dialog Semiconductor PLC* | 648,559 | |||||
| 1,733 | Diploma PLC | 32,557 | |||||
| 53,897 | Dunelm Group PLC | 606,442 | |||||
| 4,354 | Electrocomponents PLC | 33,457 | |||||
| 15,685 | EMIS Group PLC | 236,372 | |||||
| 35,212 | Ferrexpo PLC | 102,522 | |||||
| 7,854 | The Go-Ahead Group PLC | 185,581 | |||||
| 54,972 | Greggs PLC | 1,510,899 | |||||
| 594,679 | Hays PLC | 1,115,709 | |||||
| 13,289 | HomeServe PLC | 202,616 | |||||
| 51,315 | PageGroup PLC | 330,215 | |||||
| 38,714 | Pets at Home Group PLC | 90,009 | |||||
| 249,407 | QinetiQ Group PLC | 918,825 | |||||
| 68,511 | Redde PLC | 92,852 | |||||
| 29,790 | Redrow PLC | 205,261 | |||||
| 116,803 | Spirent Communications PLC | 231,544 | |||||
| 2,599 | SSP Group PLC | 22,018 | |||||
| 55,304 | WH Smith PLC | 1,371,798 | |||||
| 8,238,333 | |||||||
| TOTAL COMMON STOCKS | |||||||
| (Cost $43,204,618) | 44,064,999 | ||||||
See accompanying Notes to Financial Statements.
29
North Square International Small Cap Fund
SCHEDULE OF INVESTMENTS – Continued
As of May 31, 2019
| Number | |||||||
| of Shares | Value | ||||||
| PREFERRED STOCK – 0.4% | |||||||
| GERMANY – 0.4% | |||||||
| 6,401 | Jungheinrich AG | $ | 180,632 | ||||
| TOTAL PREFERRED STOCK | |||||||
| (Cost $209,594) | 180,632 | ||||||
| REAL ESTATE INVESTMENT TRUST (REIT) – 0.3% | |||||||
| GERMANY – 0.3% | |||||||
| 8,824 | Alstria Office REIT-AG | 137,911 | |||||
| TOTAL REIT | |||||||
| (Cost $136,961) | 137,911 | ||||||
| EXCHANGE TRADED FUND – 0.8% | |||||||
| 6,000 | iShares MSCI EAFE ETF | 380,400 | |||||
| TOTAL EXCHANGE TRADED FUND | |||||||
| (Cost $391,599) | 380,400 | ||||||
| SHORT-TERM INVESTMENT – 0.8% | |||||||
| 354,119 | First American Treasury Obligations Fund, 2.30%2 | 354,119 | |||||
| TOTAL SHORT-TERM INVESTMENT | |||||||
| (Cost $354,119) | 354,119 | ||||||
| TOTAL INVESTMENTS – 99.4% | |||||||
| (Cost $44,296,891) | 45,118,061 | ||||||
| Other Assets in Excess of Liabilities – 0.6% | 276,001 | ||||||
| TOTAL NET ASSETS – 100.00% | $ | 45,394,062 | |||||
ADR – American Depositary Receipt
PLC – Public Limited Company
| * | Non-income producing security. |
1 | Level 3 securities fair valued under procedures established by the Board of Trustees, represents 0.15% of Net Assets. The total value of these securities is $68,609. |
2 | The rate is the annualized seven-day yield at period end. |
Investments are classified by industry pursuant to the Global Industry Classification Standard (GICS®), which was developed by and/or is the exclusive property of Morgan Stanley Capital International, Inc. (“MSCI”) and Standard & Poor’s Financial Services LLC (“S&P”). GICS is a service mark of MSCI and S&P and has been licensed for use by U.S. Bancorp Fund Services, LLC.
See accompanying Notes to Financial Statements.
30
North Square International Small Cap Fund
SUMMARY OF INVESTMENTS
As of May 31, 2019
| Percent of Total | |||||
| Security Type/Sector | Net Assets | ||||
| Common Stocks | |||||
| Communication Services | 1.8 | % | |||
| Consumer Discretionary | 23.2 | % | |||
| Consumer Staples | 8.4 | % | |||
| Energy | 5.1 | % | |||
| Financials | 1.5 | % | |||
| Health Care | 6.0 | % | |||
| Industrials | 26.8 | % | |||
| Information Technology | 11.3 | % | |||
| Materials | 5.3 | % | |||
| Real Estate | 5.2 | % | |||
| Utilities | 2.5 | % | |||
| Total Common Stocks | 97.1 | % | |||
| Preferred Stock | 0.4 | % | |||
| REIT | 0.3 | % | |||
| Exchange Traded Fund | 0.8 | % | |||
| Short-Term Investment | 0.8 | % | |||
| Total Investments | 99.4 | % | |||
| Assets in Excess of Other Liabilities | 0.6 | % | |||
| Total Net Assets | 100.0 | % | |||
See accompanying Notes to Financial Statements.
31
North Square Dynamic Small Cap Fund
SCHEDULE OF INVESTMENTS
As of May 31, 2019
| Number | |||||||
| of Shares | Value | ||||||
| COMMON STOCKS – 89.4% | |||||||
| COMMUNICATION SERVICES – 4.5% | |||||||
| 1,010 | AMC Networks Inc. – Class A* | $ | 53,298 | ||||
| 3,350 | Cargurus, Inc.* | 114,436 | |||||
| 770 | Match Group, Inc. | 52,860 | |||||
| 8,840 | The Meet Group, Inc.* | 34,211 | |||||
| 11,831 | MSG Networks Inc. – Class A* | 249,752 | |||||
| 750 | Shenandoah Telecommunications Co. | 30,158 | |||||
| 6,450 | Sinclair Broadcast Group, Inc. – Class A | 346,236 | |||||
| 1,640 | Yelp Inc.* | 50,397 | |||||
| 931,348 | |||||||
| CONSUMER DISCRETIONARY – 9.1% | |||||||
| 9,455 | 1-800-FLOWERS.COM, Inc. – Class A* | 172,648 | |||||
| 3,539 | America’s Car-Mart, Inc.* | 304,708 | |||||
| 6,840 | Boot Barn Holdings, Inc.* | 178,729 | |||||
| 909 | Carrols Restaurant Group Inc.* | 7,745 | |||||
| 5,210 | Conn’s, Inc.* | 93,519 | |||||
| 5,100 | Core-Mark Holding Co., Inc. | 188,088 | |||||
| 2,120 | Dave & Buster’s Entertainment Inc. | 105,449 | |||||
| 955 | Del Taco Restaurants, Inc.* | 10,333 | |||||
| 4,449 | El Pollo Loco Holdings, Inc.* | 46,625 | |||||
| 8,360 | GoPro, Inc. – Class A* | 52,668 | |||||
| 3,530 | Hilton Grand Vacations Inc.* | 89,733 | |||||
| 11,676 | Malibu Boats, Inc. – Class A* | 419,169 | |||||
| 9,204 | Modine Manufacturing Co.* | 118,271 | |||||
| 5,102 | Zumiez Inc.* | 100,918 | |||||
| 1,888,603 | |||||||
| CONSUMER STAPLES – 3.1% | |||||||
| 5,250 | e.l.f. Beauty, Inc.* | 53,497 | |||||
| 2,740 | Freshpet, Inc.* | 127,328 | |||||
| 850 | Inter Parfums, Inc. | 55,063 | |||||
| 2,240 | Landec Corp.* | 22,221 | |||||
| 7,060 | Performance Food Group Co.* | 277,811 | |||||
| 1,880 | Universal Corp. of Virginia | 106,258 | |||||
| 642,178 | |||||||
| ENERGY – 4.7% | |||||||
| 2,940 | Archrock, Inc. | 26,078 | |||||
| 5,130 | Cactus, Inc. – Class A* | 166,982 | |||||
| 2,393 | CVR Energy, Inc. | 101,630 | |||||
| 5,400 | Delek US Holdings, Inc. | 165,294 | |||||
| 1,680 | DMC Global Inc. | 113,635 | |||||
| 8,180 | Forum Energy Technologies, Inc.* | 31,248 | |||||
| 990 | Matrix Service Co.* | 17,919 | |||||
| 10,270 | ProPetro Holding Corp.* | 199,443 | |||||
| 3,768 | Scorpio Tankers Inc.2 | 98,081 | |||||
| 1,891 | World Fuel Services Corp. | 55,104 | |||||
| 975,414 | |||||||
See accompanying Notes to Financial Statements.
32
North Square Dynamic Small Cap Fund
SCHEDULE OF INVESTMENTS – Continued
As of May 31, 2019
| Number | |||||||
| of Shares | Value | ||||||
| COMMON STOCKS (Continued) | |||||||
| FINANCIALS – 10.9% | |||||||
| 2,865 | Bank OZK | $ | 82,798 | ||||
| 6,320 | Brighthouse Financial, Inc.* | 224,297 | |||||
| 4,270 | BrightSphere Investment Group PLC2 | 45,860 | |||||
| 3,525 | Cathay General Bancorp | 118,581 | |||||
| 5,665 | ConnectOne Bancorp, Inc. | 119,022 | |||||
| 4,560 | First Merchants Corp. | 151,620 | |||||
| 650 | IBERIABANK Corp. | 46,475 | |||||
| 2,060 | Lakeland Bancorp, Inc. | 31,744 | |||||
| 6,107 | NMI Holdings, Inc. – Class A* | 166,477 | |||||
| 15,161 | On Deck Capital, Inc.* | 60,947 | |||||
| 2,220 | Peapack-Gladstone Financial Corp. | 60,029 | |||||
| 3,400 | Preferred Bank | 148,818 | |||||
| 7,640 | Sandy Spring Bancorp, Inc. | 245,626 | |||||
| 7,818 | Universal Insurance Holdings, Inc. | 227,034 | |||||
| 4,690 | Univest Financial Corp. | 111,997 | |||||
| 9,964 | Western Alliance Bancorp* | 410,019 | |||||
| 2,251,344 | |||||||
| HEALTH CARE – 13.7% | |||||||
| 33,748 | Accuray Inc.* | 125,205 | |||||
| 8,760 | Achillion Pharmaceuticals, Inc.* | 24,353 | |||||
| 2,560 | Array BioPharma Inc.* | 67,635 | |||||
| 261 | Ascendis Pharma A/S – ADR*2 | 32,536 | |||||
| 2,080 | Audentes Therapeutics, Inc.* | 73,050 | |||||
| 1,080 | Bruker Corp. | 45,112 | |||||
| 1,000 | CareDx, Inc.* | 31,620 | |||||
| 6,245 | CytomX Therapeutics, Inc.* | 60,327 | |||||
| 460 | Eagle Pharmaceuticals Inc. of Delaware* | 23,373 | |||||
| 142 | Enanta Pharmaceuticals, Inc.* | 12,847 | |||||
| 830 | The Ensign Group, Inc. | 44,206 | |||||
| 13,496 | Epizyme, Inc.* | 185,435 | |||||
| 7,470 | Halozyme Therapeutics, Inc.* | 110,182 | |||||
| 1,590 | HealthStream, Inc.* | 39,750 | |||||
| 5,511 | Integer Holdings Corp.* | 386,321 | |||||
| 14,750 | Invitae Corp.* | 257,387 | |||||
| 4,080 | Iovance Biotherapeutics, Inc.* | 66,708 | |||||
| 4,660 | KalVista Pharmaceuticals, Inc.* | 99,025 | |||||
| 1,510 | LeMaitre Vascular, Inc. | 38,973 | |||||
| 3,570 | MacroGenics, Inc.* | 65,474 | |||||
| 2,780 | Natera, Inc.* | 63,662 | |||||
| 560 | Omnicell, Inc.* | 44,492 | |||||
| 8,391 | Phibro Animal Health Corp. – Class A | 248,206 | |||||
| 6,470 | Repligen Corp.* | 449,471 | |||||
| 470 | Taro Pharmaceutical Industries Ltd.2 | 43,700 | |||||
| 6,910 | Veracyte, Inc.* | 156,581 | |||||
| 2,013 | Voyager Therapeutics, Inc.* | 43,903 | |||||
| 2,839,534 | |||||||
See accompanying Notes to Financial Statements.
33
North Square Dynamic Small Cap Fund
SCHEDULE OF INVESTMENTS – Continued
As of May 31, 2019
| Number | |||||||
| of Shares | Value | ||||||
| COMMON STOCKS (Continued) | |||||||
| INDUSTRIALS – 20.7% | |||||||
| 1,480 | Applied Industrial Technologies, Inc. | $ | 80,408 | ||||
| 13,920 | BMC Stock Holdings Inc.* | 278,818 | |||||
| 4,090 | Comfort Systems USA, Inc. | 192,966 | |||||
| 1,000 | CSW Industrials, Inc. | 63,930 | |||||
| 1,500 | Deluxe Corp. | 55,800 | |||||
| 1,230 | DXP Enterprises, Inc. of Texas* | 39,631 | |||||
| 3,850 | Encore Wire Corp. | 192,154 | |||||
| 7,007 | Federal Signal Corp. | 167,397 | |||||
| 2,230 | Forward Air Corp. | 124,501 | |||||
| 6,340 | GMS Inc.* | 106,766 | |||||
| 7,520 | H&E Equipment Services, Inc. | 182,811 | |||||
| 2,900 | Harsco Corp.* | 72,500 | |||||
| 2,450 | Herc Holdings, Inc.* | 83,373 | |||||
| 3,550 | Herman Miller, Inc. | 125,989 | |||||
| 4,990 | Hub Group, Inc. – Class A* | 194,410 | |||||
| 440 | Insperity, Inc. | 50,116 | |||||
| 7,021 | Knoll, Inc. | 137,892 | |||||
| 7,792 | Korn Ferry | 335,679 | |||||
| 690 | Landstar System, Inc. | 66,413 | |||||
| 5,812 | McGrath RentCorp | 326,809 | |||||
| 6,950 | Primoris Services Corp. | 126,768 | |||||
| 12,582 | Resources Connection Inc. | 193,134 | |||||
| 12,120 | Schneider National, Inc. – Class B | 203,616 | |||||
| 2,480 | SPX FLOW, Inc.* | 88,536 | |||||
| 4,670 | Steelcase Inc. – Class A | 74,907 | |||||
| 6,020 | TriMas Corp.* | 172,473 | |||||
| 1,120 | TriNet Group, Inc.* | 70,986 | |||||
| 1,850 | TrueBlue, Inc.* | 39,294 | |||||
| 9,240 | WESCO International, Inc.* | 432,709 | |||||
| 4,280,786 | |||||||
| INFORMATION TECHNOLOGY – 16.3% | |||||||
| 15,384 | A10 Networks Inc.* | 93,689 | |||||
| 2,090 | Acacia Communications, Inc.* | 97,394 | |||||
| 2,930 | Agilysys, Inc.* | 63,874 | |||||
| 35,919 | Amkor Technology, Inc.* | 232,755 | |||||
| 1,390 | Anixter International Inc.* | 74,170 | |||||
| 6,420 | Avid Technology, Inc.* | 49,755 | |||||
| 3,652 | Axcelis Technologies, Inc.* | 54,159 | |||||
| 500 | CACI International Inc. – Class A* | 101,760 | |||||
| 2,980 | Camtek Ltd.*2 | 24,019 | |||||
| 2,510 | Cardtronics PLC – Class A* | 75,802 | |||||
| 6,416 | Comtech Telecommunications Corp. | 135,698 | |||||
| 160 | Control4 Corp.* | 3,786 | |||||
| 580 | Cornerstone OnDemand, Inc.* | 30,874 | |||||
| 13,820 | Diodes Inc.* | 427,453 | |||||
| 4,740 | Dropbox, Inc. – Class A* | 106,934 | |||||
| 2,000 | eGain Corp.* | 15,760 | |||||
See accompanying Notes to Financial Statements.
34
North Square Dynamic Small Cap Fund
SCHEDULE OF INVESTMENTS – Continued
As of May 31, 2019
| Number | |||||||
| of Shares | Value | ||||||
| COMMON STOCKS (Continued) | |||||||
| INFORMATION TECHNOLOGY (Continued) | |||||||
| 9,141 | EVERTEC, Inc.2 | $ | 261,981 | ||||
| 12,525 | Extreme Networks, Inc.* | 70,516 | |||||
| 2,260 | Fabrinet*2 | 96,366 | |||||
| 610 | Globant S.A.*2 | 56,632 | |||||
| 1,240 | Inphi Corp.* | 54,411 | |||||
| 2,898 | KEMET Corp. | 46,078 | |||||
| 4,045 | Lattice Semiconductor Corp.* | 51,776 | |||||
| 1,040 | LogMeIn, Inc. | 74,703 | |||||
| 9,050 | MagnaChip Semiconductor Corp.* | 73,396 | |||||
| 1,300 | Manhattan Associates, Inc.* | 85,111 | |||||
| 2,933 | NeoPhotonics Corp.* | 11,409 | |||||
| 12,704 | NIC, Inc. | 202,756 | |||||
| 3,670 | Paylocity Holding Corp.* | 367,807 | |||||
| 1,420 | PCM Inc.* | 36,281 | |||||
| 7,800 | Presidio, Inc. | 103,350 | |||||
| 10,260 | Telenav, Inc.* | 76,540 | |||||
| 3,160 | TTEC Holdings, Inc. | 125,389 | |||||
| �� | 3,382,384 | ||||||
| MATERIALS – 4.3% | |||||||
| 405 | Ferro Corp.* | 5,484 | |||||
| 5,580 | Innophos Holdings, Inc. | 148,372 | |||||
| 5,808 | Innospec Inc. | 468,764 | |||||
| 4,300 | Materion Corp. | 259,935 | |||||
| 882,555 | |||||||
| UTILITIES – 2.1% | |||||||
| 1,110 | ALLETE, Inc. | 90,898 | |||||
| 956 | Chesapeake Utilities Corp. | 86,786 | |||||
| 6,456 | MDU Resources Group, Inc. | 159,334 | |||||
| 1,040 | Southwest Gas Holdings, Inc. | 88,545 | |||||
| 425,563 | |||||||
| TOTAL COMMON STOCKS | |||||||
| (Cost $18,932,841) | 18,499,709 | ||||||
| REAL ESTATE INVESTMENT TRUSTS (REITS) – 10.0% | |||||||
| 58,570 | Cousins Properties, Inc. | 530,058 | |||||
| 2,050 | The GEO Group, Inc. | 44,957 | |||||
| 22,520 | Industrial Logistics Properties Trust | 424,727 | |||||
| 2,920 | National Storage Affiliates Trust | 86,987 | |||||
| 12,987 | OUTFRONT Media Inc. | 320,130 | |||||
| 3,293 | PS Business Parks, Inc. | 529,910 | |||||
| 2,960 | Retail Properties of America, Inc. – Class A | 35,194 | |||||
| 4,246 | Urstadt Biddle Properties Inc. – Class A | 92,902 | |||||
| TOTAL REITS | |||||||
| (Cost $2,011,926) | 2,064,865 | ||||||
See accompanying Notes to Financial Statements.
35
North Square Dynamic Small Cap Fund
SCHEDULE OF INVESTMENTS – Continued
As of May 31, 2019
| Number | |||||||
| of Shares | Value | ||||||
| RIGHTS – 0.0% | |||||||
| 7,920 | First Eagle Holdings, Inc.*1 | $ | 5,703 | ||||
| TOTAL RIGHTS | |||||||
| (Cost $— ) | 5,703 | ||||||
| SHORT-TERM INVESTMENT – 0.7% | |||||||
| 134,014 | First American Treasury Obligations Fund, 2.30%3 | 134,014 | |||||
| TOTAL SHORT-TERM INVESTMENT | |||||||
| (Cost $134,014) | 134,014 | ||||||
| TOTAL INVESTMENTS – 100.1% | |||||||
| (Cost $21,078,781) | 20,704,291 | ||||||
| Liabilities in Excess of Other Assets – (0.1)% | (11,650 | ) | |||||
| TOTAL NET ASSETS – 100.0% | $ | 20,692,641 | |||||
ADR – American Depositary Receipt
PLC – Public Limited Company
| * | Non-income producing security. |
1 | Level 3 securities fair valued under procedures established by the Board of Trustees, represents 0.03% of Net Assets. The total value of these securities is $5,703. |
2 | Foreign security denominated in U.S. Dollars. |
3 | The rate is the annualized seven-day yield at period end. |
Investments are classified by industry pursuant to the Global Industry Classification Standard (GICS®), which was developed by and/or is the exclusive property of Morgan Stanley Capital International, Inc. (“MSCI”) and Standard & Poor’s Financial Services LLC (“S&P”). GICS is a service mark of MSCI and S&P and has been licensed for use by U.S. Bancorp Fund Services, LLC.
See accompanying Notes to Financial Statements.
36
North Square Dynamic Small Cap Fund
SUMMARY OF INVESTMENTS
As of May 31, 2019
| Percent of Total | |||||
| Security Type/Sector | Net Assets | ||||
| Common Stocks | |||||
| Industrials | 20.7 | % | |||
| Information Technology | 16.3 | % | |||
| Health Care | 13.7 | % | |||
| Financials | 10.9 | % | |||
| Consumer Discretionary | 9.1 | % | |||
| Energy | 4.7 | % | |||
| Communication Services | 4.5 | % | |||
| Materials | 4.3 | % | |||
| Consumer Staples | 3.1 | % | |||
| Utilities | 2.1 | % | |||
| Total Common Stocks | 89.4 | % | |||
| REITs | 10.0 | % | |||
| Rights | 0.0 | % | |||
| Short-Term Investment | 0.7 | % | |||
| Total Investments | 100.1 | % | |||
| Liabilities in Excess of Other Assets | (0.1 | )% | |||
| Total Net Assets | 100.0 | % | |||
See accompanying Notes to Financial Statements.
37
North Square Oak Ridge Disciplined Growth Fund
SCHEDULE OF INVESTMENTS
As of May 31, 2019
| Number | |||||||
| of Shares | Value | ||||||
| COMMON STOCKS – 94.3% | |||||||
| COMMUNICATION SERVICES – 10.9% | |||||||
| 368 | Alphabet Inc. – Class A* | $ | 407,192 | ||||
| 382 | Alphabet Inc. – Class C* | 421,586 | |||||
| 5,968 | Comcast Corp. – Class A | 244,688 | |||||
| 1,551 | Facebook, Inc. – Class A* | 275,256 | |||||
| 481 | Netflix Inc.* | 165,118 | |||||
| 1,513,840 | |||||||
| CONSUMER DISCRETIONARY – 14.3% | |||||||
| 421 | Amazon.com, Inc.* | 747,305 | |||||
| 1 | Kontoor Brands, Inc.* | 25 | |||||
| 3,837 | LKQ Corp.* | 98,419 | |||||
| 3,788 | Ross Stores, Inc. | 352,246 | |||||
| 1,115 | Ulta Beauty, Inc.* | 371,719 | |||||
| 2,624 | VF Corp. | 214,853 | |||||
| 1,815 | Yum! Brands, Inc. | 185,765 | |||||
| 1,970,332 | |||||||
| CONSUMER STAPLES – 5.6% | |||||||
| 5,761 | The Coca-Cola Co. | 283,038 | |||||
| 1,481 | Costco Wholesale Corp. | 354,818 | |||||
| 2,218 | Unilever PLC – ADR1 | 135,098 | |||||
| 772,954 | |||||||
| ENERGY – 0.6% | |||||||
| 1,011 | EOG Resources, Inc. | 82,781 | |||||
| FINANCIALS – 7.1% | |||||||
| 3,269 | Intercontinental Exchange, Inc. | 268,745 | |||||
| 1,602 | PayPal Holdings, Inc.* | 175,819 | |||||
| 3,323 | Visa Inc. – A Shares | 536,100 | |||||
| 980,664 | |||||||
| HEALTH CARE – 17.7% | |||||||
| 1,775 | Abbott Laboratories | 135,131 | |||||
| 584 | ABIOMED, Inc.* | 152,961 | |||||
| 1,131 | Alexion Pharmaceuticals, Inc.* | 128,572 | |||||
| 1,946 | Danaher Corp. | 256,892 | |||||
| 2,285 | Eli Lilly and Co. | 264,923 | |||||
| 4,394 | Globus Medical, Inc. – Class A* | 172,684 | |||||
| 722 | Incyte Corp.* | 56,771 | |||||
| 975 | LHC Group, Inc.* | 110,448 | |||||
| 672 | Ligand Pharmaceuticals Inc.* | 72,159 | |||||
| 1,382 | Pacira BioSciences, Inc.* | 60,131 | |||||
| 961 | Sage Therapeutics, Inc.* | 165,167 | |||||
| 1,711 | Stryker Corp. | 313,523 | |||||
| 1,946 | UnitedHealth Group Inc. | 470,543 | |||||
| 554 | Vertex Pharmaceuticals Inc.* | 92,064 | |||||
| 2,451,969 | |||||||
See accompanying Notes to Financial Statements.
38
North Square Oak Ridge Disciplined Growth Fund
SCHEDULE OF INVESTMENTS – Continued
As of May 31, 2019
| Number | |||||||
| of Shares | Value | ||||||
| COMMON STOCKS (Continued) | |||||||
| INDUSTRIALS – 10.3% | |||||||
| 612 | TransDigm Group, Inc.* | $ | 269,862 | ||||
| 3,208 | AMETEK, Inc. | 262,703 | |||||
| 2,487 | Fortive Corp. | 189,385 | |||||
| 1,312 | Verisk Analytics, Inc. | 183,680 | |||||
| 5,455 | Waste Connections, Inc.1 | 516,261 | |||||
| 1,421,891 | |||||||
| INFORMATION TECHNOLOGY – 25.5% | |||||||
| 1,530 | ANSYS, Inc.* | 274,635 | |||||
| 4,978 | Apple Inc. | 871,498 | |||||
| 421 | Broadcom Inc. | 105,940 | |||||
| 4,187 | Cisco Systems, Inc. | 217,850 | |||||
| 2,366 | Cognizant Technology Solutions Corp. – Class A | 146,526 | |||||
| 2,634 | EPAM Systems, Inc.* | 454,602 | |||||
| 1,196 | Fidelity National Information Services, Inc. | 143,879 | |||||
| 1,376 | Five9, Inc.* | 70,657 | |||||
| 2,218 | Fortinet, Inc.* | 160,761 | |||||
| 765 | KLA-Tencor Corp. | 78,849 | |||||
| 6,219 | Microsoft Corp. | 769,166 | |||||
| 1,509 | salesforce.com, Inc.* | 228,478 | |||||
| 3,522,841 | |||||||
| MATERIALS – 2.3% | |||||||
| 1,760 | Ecolab Inc. | 323,998 | |||||
| TOTAL COMMON STOCKS | |||||||
| (Cost $10,260,629) | 13,041,270 | ||||||
| SHORT-TERM INVESTMENT – 5.8% | |||||||
| 801,310 | First American Treasury Obligations Fund, 2.30%2 | 801,310 | |||||
| TOTAL SHORT-TERM INVESTMENT | |||||||
| (Cost $801,310) | 801,310 | ||||||
| TOTAL INVESTMENTS – 100.1% | |||||||
| (Cost $11,061,939) | 13,842,580 | ||||||
| Liabilities in Excess of Other Assets – (0.1)% | (19,953 | ) | |||||
| TOTAL NET ASSETS – 100.0% | $ | 13,822,627 | |||||
ADR – American Depositary Receipt
PLC – Public Limited Company
| * | Non-income producing security. |
1 | Foreign security denominated in U.S. Dollars. |
2 | The rate is the annualized seven-day yield at period end. |
Investments are classified by industry pursuant to the Global Industry Classification Standard (GICS®), which was developed by and/or is the exclusive property of Morgan Stanley Capital International, Inc. (“MSCI”) and Standard & Poor’s Financial Services LLC (“S&P”). GICS is a service mark of MSCI and S&P and has been licensed for use by U.S. Bancorp Fund Services, LLC.
See accompanying Notes to Financial Statements.
39
North Square Oak Ridge Disciplined Growth Fund
SUMMARY OF INVESTMENTS
As of May 31, 2019
| Percent of Total | |||||
| Security Type/Sector | Net Assets | ||||
| Common Stocks | |||||
| Information Technology | 25.5 | % | |||
| Health Care | 17.7 | % | |||
| Consumer Discretionary | 14.3 | % | |||
| Communication Services | 10.9 | % | |||
| Industrials | 10.3 | % | |||
| Financials | 7.1 | % | |||
| Consumer Staples | 5.6 | % | |||
| Materials | 2.3 | % | |||
| Energy | 0.6 | % | |||
| Total Common Stocks | 94.3 | % | |||
| Short-Term Investment | 5.8 | % | |||
| Total Investments | 100.1 | % | |||
| Assets in Excess of Other Liabilities | (0.1 | )% | |||
| Total Net Assets | 100.0 | % | |||
See accompanying Notes to Financial Statements.
40
North Square Multi Strategy Fund
SCHEDULE OF INVESTMENTS
As of May 31, 2019
| Number | |||||||
| of Shares | Value | ||||||
| MUTUAL FUNDS – 98.5% | |||||||
| 261,965 | Bramshill Income Performance Fund | $ | 2,611,790 | ||||
| 1,686,263 | North Square Dynamic Small Cap Fund – Class I1 | 19,464,364 | |||||
| 479,345 | North Square Global Resources & Infrastructure Fund – Class I1 | 4,962,855 | |||||
| 236,506 | North Square International Small Cap Fund – Class I1 | 2,280,084 | |||||
| 967,750 | North Square Oak Ridge Disciplined Growth Fund – Class I1 | 13,489,849 | |||||
| 710,531 | North Square Oak Ridge Dividend Growth Fund – Class I1 | 11,547,829 | |||||
| 50,279 | Wavelength Interest Rate Neutral Fund | 515,862 | |||||
| TOTAL MUTUAL FUNDS | |||||||
| (Cost $53,445,893) | 54,872,633 | ||||||
| SHORT-TERM INVESTMENT – 2.0% | |||||||
| 1,118,066 | First American Treasury Obligations Fund, 2.30%2 | 1,118,066 | |||||
| TOTAL SHORT-TERM INVESTMENT | |||||||
| (Cost $1,118,066) | 1,118,066 | ||||||
| TOTAL INVESTMENTS – 100.5% | |||||||
| (Cost $54,563,959) | 55,990,699 | ||||||
| Liabilities in Excess of Other Assets – (0.5)% | (281,421 | ) | |||||
| TOTAL NET ASSETS – 100.0% | $ | 55,709,278 | |||||
1 | Affiliated company. |
2 | The rate is the annualized seven-day yield at period end. |
Investments are classified by industry pursuant to the Global Industry Classification Standard (GICS®), which was developed by and/or is the exclusive property of Morgan Stanley Capital International, Inc. (“MSCI”) and Standard & Poor’s Financial Services LLC (“S&P”). GICS is a service mark of MSCI and S&P and has been licensed for use by U.S. Bancorp Fund Services, LLC.
See accompanying Notes to Financial Statements.
41
North Square Multi Strategy Fund
SUMMARY OF INVESTMENTS
As of May 31, 2019
| Percent of Total | |||||
| Security Type/Sector | Net Assets | ||||
| Mutual Funds | 98.5 | % | |||
| Short-Term Investment | 2.0 | % | |||
| Total Investments | 100.5 | % | |||
| Liabilities in Excess of Other Assets | (0.5 | )% | |||
| Total Net Assets | 100.0 | % | |||
See accompanying Notes to Financial Statements.
42
North Square Oak Ridge Dividend Growth Fund
SCHEDULE OF INVESTMENTS
As of May 31, 2019
| Number | |||||||
| of Shares | Value | ||||||
| COMMON STOCKS – 96.0% | |||||||
| COMMUNICATION SERVICES – 5.2% | |||||||
| 6,219 | Verizon Communications Inc. | $ | 338,003 | ||||
| 2,532 | The Walt Disney Co. | 334,325 | |||||
| 672,328 | |||||||
| CONSUMER DISCRETIONARY – 7.6% | |||||||
| 5,315 | Carnival Corp.1 | 272,075 | |||||
| 2,164 | The Home Depot, Inc. | 410,835 | |||||
| 0 | Kontoor Brands, Inc.* | 8 | |||||
| 3,579 | VF Corp. | 293,049 | |||||
| 975,967 | |||||||
| CONSUMER STAPLES – 6.4% | |||||||
| 7,562 | The Coca-Cola Co. | 371,521 | |||||
| 3,962 | The Kraft Heinz Co. | 109,549 | |||||
| 5,769 | Unilever PLC – ADR1 | 351,390 | |||||
| 832,460 | |||||||
| ENERGY – 6.6% | |||||||
| 2,402 | Chevron Corp. | 273,468 | |||||
| 3,107 | Exxon Mobil Corp. | 219,882 | |||||
| 18,074 | Kinder Morgan, Inc. of Delaware | 360,576 | |||||
| 853,926 | |||||||
| FINANCIALS – 16.7% | |||||||
| 1,074 | BlackRock, Inc. | 446,312 | |||||
| 11,712 | The Blackstone Group L.P. | 443,299 | |||||
| 3,352 | CME Group Inc. | 643,986 | |||||
| 5,905 | JPMorgan Chase & Co. | 625,694 | |||||
| 2,159,291 | |||||||
| HEALTH CARE – 18.4% | |||||||
| 3,327 | AbbVie Inc. | 255,214 | |||||
| 831 | Alcon Inc.*1 | 48,348 | |||||
| 1,492 | Becton, Dickinson and Co. | 348,292 | |||||
| 3,656 | Eli Lilly and Co. | 423,877 | |||||
| 4,155 | Novartis AG – ADR1 | 355,834 | |||||
| 2,779 | Stryker Corp. | 509,224 | |||||
| 1,814 | UnitedHealth Group Inc. | 438,625 | |||||
| 2,379,414 | |||||||
| INDUSTRIALS – 9.8% | |||||||
| 1,105 | The Boeing Co. | 377,479 | |||||
| 2,952 | Stanley Black & Decker Inc. | 375,554 | |||||
| 4,655 | Waste Management, Inc. | 509,024 | |||||
| 1,262,057 | |||||||
| INFORMATION TECHNOLOGY – 23.1% | |||||||
| 2,313 | Apple Inc. | 404,937 | |||||
| 3,376 | Automatic Data Processing, Inc. | 540,565 | |||||
| 9,603 | Cisco Systems, Inc. | 499,644 | |||||
| 3,449 | Fidelity National Information Services, Inc. | 414,915 | |||||
| 5,448 | Microsoft Corp. | 673,809 | |||||
See accompanying Notes to Financial Statements.
43
North Square Oak Ridge Dividend Growth Fund
SCHEDULE OF INVESTMENTS – Continued
As of May 31, 2019
| Number | |||||||
| of Shares | Value | ||||||
| COMMON STOCKS (Continued) | |||||||
| INFORMATION TECHNOLOGY (Continued) | |||||||
| 6,678 | QUALCOMM Inc. | $ | 446,224 | ||||
| 2,980,094 | |||||||
| MATERIALS – 2.2% | |||||||
| 1,580 | Linde PLC1 | 285,269 | |||||
| TOTAL COMMON STOCKS | |||||||
| (Cost $10,770,905) | 12,400,806 | ||||||
| SHORT-TERM INVESTMENT – 4.2% | |||||||
| 541,728 | First American Treasury Obligations Fund, 2.30%2 | 541,728 | |||||
| TOTAL SHORT-TERM INVESTMENT | |||||||
| (Cost $541,728) | 541,728 | ||||||
| TOTAL INVESTMENTS – 100.2% | |||||||
| (Cost $11,312,633) | 12,942,534 | ||||||
| Liabilities in Excess of Other Assets – (0.2)% | (21,947 | ) | |||||
| TOTAL NET ASSETS – 100.0% | $ | 12,920,587 | |||||
ADR – American Depositary Receipt
LP – Limited Partnership
PLC – Public Limited Company
| * | Non-income producing security. |
1 | Foreign security denominated in U.S. Dollars. |
2 | The rate is the annualized seven-day yield at period end. |
Investments are classified by industry pursuant to the Global Industry Classification Standard (GICS®), which was developed by and/or is the exclusive property of Morgan Stanley Capital International, Inc. (“MSCI”) and Standard & Poor’s Financial Services LLC (“S&P”). GICS is a service mark of MSCI and S&P and has been licensed for use by U.S. Bancorp Fund Services, LLC.
See accompanying Notes to Financial Statements.
44
North Square Oak Ridge Dividend Growth Fund
SUMMARY OF INVESTMENTS
As of May 31, 2019
| Percent of Total | |||||
| Security Type/Sector | Net Assets | ||||
| Common Stocks | |||||
| Information Technology | 23.1 | % | |||
| Health Care | 18.4 | % | |||
| Financials | 16.7 | % | |||
| Industrials | 9.8 | % | |||
| Consumer Discretionary | 7.6 | % | |||
| Energy | 6.6 | % | |||
| Consumer Staples | 6.4 | % | |||
| Communication Services | 5.2 | % | |||
| Materials | 2.2 | % | |||
| Total Common Stocks | 96.0 | % | |||
| Short-Term Investment | 4.2 | % | |||
| Total Investments | 100.2 | % | |||
| Liabilities in Excess of Other Assets | (0.2 | )% | |||
| Total Net Assets | 100.0 | % | |||
See accompanying Notes to Financial Statements.
45
STATEMENTS OF ASSETS AND LIABILITIES
As of May 31, 2019
| North Square | ||||||||||||
| Oak Ridge | North Square | North Square | ||||||||||
| Small Cap | International | Dynamic | ||||||||||
| Growth Fund | Small Cap Fund | Small Cap Fund | ||||||||||
| Assets: | ||||||||||||
| Investments, at cost | $ | 158,661,339 | $ | 44,296,891 | $ | 21,078,781 | ||||||
| Investments in affiliated issuers, at cost | — | — | — | |||||||||
| Investments, at value | $ | 204,601,375 | $ | 45,118,061 | $ | 20,704,291 | ||||||
| Investments in affiliated issuers, at value | — | — | — | |||||||||
| Cash | — | 40,755 | — | |||||||||
| Cash denominated in foreign currency (cost $2,633) | — | 2,653 | — | |||||||||
| Receivables: | ||||||||||||
| Investment securities sold | — | 862,922 | 986,163 | |||||||||
| Fund shares sold | 106,428 | 27,923 | 1,652 | |||||||||
| Dividends and interest | 41,572 | 337,637 | 16,858 | |||||||||
| Due from Advisor | — | — | 9,589 | |||||||||
| Prepaid expenses | — | 191 | 2,835 | |||||||||
| Total assets | 204,749,375 | 46,390,162 | 21,721,388 | |||||||||
| Liabilities: | ||||||||||||
| Payables: | ||||||||||||
| Investment securities purchased | — | 632,385 | 950,927 | |||||||||
| Fund shares redeemed | 357,826 | 222,498 | — | |||||||||
| Advisory fees | 160,347 | 17,709 | 10,128 | |||||||||
| Distribution fees (Note 8) | 41,921 | 1,306 | 67 | |||||||||
| Shareholder servicing fees (Note 7) | 844 | 13,984 | 4,553 | |||||||||
| Transfer agent fees and expenses (Note 4) | 127,577 | 12,953 | 8,504 | |||||||||
| Fund administration fees | 22,039 | 32,068 | 12,394 | |||||||||
| Auditing fees | 19,450 | 19,450 | 19,450 | |||||||||
| Legal fees | 5,101 | 10,483 | 11,247 | |||||||||
| Custody fees | 4,946 | 14,708 | 2,644 | |||||||||
| Trustees’ fees and expenses | 701 | 558 | 2,218 | |||||||||
| Chief Compliance Officer fees | 420 | 687 | 687 | |||||||||
| Due to custodian | 21,679 | — | 3,616 | |||||||||
| Accrued other expenses | 23,128 | 17,311 | 2,312 | |||||||||
| Total liabilities | 785,979 | 996,100 | 1,028,747 | |||||||||
| Net Assets | $ | 203,963,396 | $ | 45,394,062 | $ | 20,692,641 | ||||||
| Components of Net Assets: | ||||||||||||
| Paid-in capital (par value of $0.01 per share | ||||||||||||
| with an unlimited number of shares authorized) | $ | 123,098,378 | $ | 61,507,919 | $ | 21,611,685 | ||||||
| Total distributable earnings/(deficit) | 80,865,018 | (16,113,857 | ) | (919,044 | ) | |||||||
| Net Assets | $ | 203,963,396 | $ | 45,394,062 | $ | 20,692,641 | ||||||
See accompanying Notes to Financial Statements.
46
STATEMENTS OF ASSETS AND LIABILITIES – Continued
As of May 31, 2019
| North Square | ||||||||||||
| Oak Ridge | North Square | North Square | ||||||||||
| Small Cap | International | Dynamic | ||||||||||
| Growth Fund | Small Cap Fund | Small Cap Fund | ||||||||||
| Maximum Offering Price per Share: | ||||||||||||
| Class A Shares: | ||||||||||||
| Net assets applicable to shares outstanding | $ | 109,748,561 | $ | 5,824,760 | $ | 303,641 | ||||||
| Shares of beneficial interest issued and outstanding | 7,899,429 | 605,444 | 26,564 | |||||||||
| Redemption price per share* | 13.89 | 9.62 | 11.43 | |||||||||
| Maximum sales charge (5.75% of offering price)** | 0.85 | 0.59 | 0.70 | |||||||||
| Maximum offering price to public | $ | 14.74 | $ | 10.21 | $ | 12.13 | ||||||
| Class C Shares: | ||||||||||||
| Net assets applicable to shares outstanding | $ | 19,308,808 | $ | — | $ | — | ||||||
| Shares of beneficial interest issued and outstanding | 4,304,610 | — | — | |||||||||
| Redemption price per share*** | $ | 4.49 | $ | — | $ | — | ||||||
| Class I Shares: | ||||||||||||
| Net assets applicable to shares outstanding | $ | 64,500,854 | $ | 39,569,302 | $ | 20,389,000 | ||||||
| Shares of beneficial interest issued and outstanding | 4,202,747 | 4,104,711 | 1,766,361 | |||||||||
| Redemption price per share | $ | 15.35 | $ | 9.64 | $ | 11.54 | ||||||
| Class K Shares: | ||||||||||||
| Net assets applicable to shares outstanding | $ | 10,405,173 | $ | — | $ | — | ||||||
| Shares of beneficial interest issued and outstanding | 687,469 | — | — | |||||||||
| Redemption price per share | $ | 15.14 | $ | — | $ | — | ||||||
| * | No sales charge applies on investments of $500,000 or more, but a Contingent Deferred Sales Charge (“CDSC”) of 1% may be imposed on certain redemptions of such shares within 12 months of the date of purchase. | |
| ** | On sales of $50,000 or more, the sales charge will be reduced. | |
| *** | A Contingent Deferred Sales Charge (“CDSC”) of 1% may be charged on share purchases that are redeemed in whole or in part within 12 months of purchase. |
See accompanying Notes to Financial Statements.
47
STATEMENTS OF ASSETS AND LIABILITIES ��� Continued
As of May 31, 2019
| North Square | North Square | |||||||||||
| Oak Ridge | North Square | Oak Ridge | ||||||||||
| Disciplined | Multi Strategy | Dividend | ||||||||||
| Growth Fund | Fund | Growth Fund | ||||||||||
| Assets: | ||||||||||||
| Investments, at cost | $ | 11,061,939 | $ | 4,209,451 | $ | 11,312,633 | ||||||
| Investments in affiliated issuers, at cost | — | 50,354,508 | — | |||||||||
| Investments, at value | $ | 13,842,580 | $ | 4,245,718 | $ | 12,942,534 | ||||||
| Investments in affiliated issuers, at value | — | 51,744,981 | — | |||||||||
| Cash | — | — | — | |||||||||
| Receivables: | ||||||||||||
| Investment securities sold | 10,937 | — | 14,943 | |||||||||
| Fund shares sold | — | 1,802 | 158 | |||||||||
| Dividends and interest | 7,849 | 12,489 | 22,135 | |||||||||
| Due from Advisor | 4,865 | — | 294 | |||||||||
| Prepaid expenses | 10,811 | — | — | |||||||||
| Total assets | 13,877,042 | 56,004,990 | 12,980,064 | |||||||||
| Liabilities: | ||||||||||||
| Payables: | ||||||||||||
| Fund shares redeemed | — | 64,849 | — | |||||||||
| Advisory fees | — | 29,226 | — | |||||||||
| Distribution fees (Note 8) | — | 15,844 | 75 | |||||||||
| Shareholder servicing fees (Note 7) | 2,650 | 243 | 2,499 | |||||||||
| Transfer agent fees and expenses (Note 4) | 4,711 | 30,839 | 8,058 | |||||||||
| Fund administration fees | 9,356 | 12,834 | 10,039 | |||||||||
| Auditing fees | 19,450 | 19,450 | 18,595 | |||||||||
| Legal fees | 10,773 | 4,370 | 10,383 | |||||||||
| Custody fees | 1,609 | 1,815 | 1,339 | |||||||||
| Trustees’ fees and expenses | 465 | 401 | 465 | |||||||||
| Chief Compliance Officer fees | 387 | 432 | 387 | |||||||||
| Due to custodian | 2,771 | 108,752 | 5,277 | |||||||||
| Accrued other expenses | 2,243 | 6,657 | 2,360 | |||||||||
| Total liabilities | 54,415 | 295,712 | 59,477 | |||||||||
| Net Assets | $ | 13,822,627 | $ | 55,709,278 | $ | 12,920,587 | ||||||
| Components of Net Assets: | ||||||||||||
| Paid-in capital (par value of $0.01 per share | ||||||||||||
| with an unlimited number of shares authorized) | $ | 10,801,951 | $ | 49,986,371 | $ | 11,276,084 | ||||||
| Total distributable earnings | 3,020,676 | 5,722,907 | 1,644,503 | |||||||||
| Net Assets | $ | 13,822,627 | $ | 55,709,278 | $ | 12,920,587 | ||||||
See accompanying Notes to Financial Statements.
48
STATEMENTS OF ASSETS AND LIABILITIES – Continued
As of May 31, 2019
| North Square | North Square | |||||||||||
| Oak Ridge | North Square | Oak Ridge | ||||||||||
| Disciplined | Multi Strategy | Dividend | ||||||||||
| Growth Fund | Fund | Growth Fund | ||||||||||
| Maximum Offering Price per Share: | ||||||||||||
| Class A Shares: | ||||||||||||
| Net assets applicable to shares outstanding | $ | — | $ | 33,287,466 | $ | 907,006 | ||||||
| Shares of beneficial interest issued and outstanding | — | 1,967,415 | 56,203 | |||||||||
| Redemption price per share* | — | 16.92 | 16.14 | |||||||||
| Maximum sales charge (5.75% of offering price)** | — | 1.03 | 0.98 | |||||||||
| Maximum offering price to public | $ | — | $ | 17.95 | $ | 17.12 | ||||||
| Class C Shares: | ||||||||||||
| Net assets applicable to shares outstanding | $ | — | $ | 9,503,233 | $ | — | ||||||
| Shares of beneficial interest issued and outstanding | — | 682,579 | — | |||||||||
| Redemption price per share*** | $ | — | $ | 13.92 | $ | — | ||||||
| Class I Shares: | ||||||||||||
| Net assets applicable to shares outstanding | $ | 13,822,627 | $ | 12,918,579 | $ | 12,013,581 | ||||||
| Shares of beneficial interest issued and outstanding | 991,672 | 734,246 | 739,187 | |||||||||
| Redemption price per share | $ | 13.94 | $ | 17.59 | $ | 16.25 | ||||||
| * | No sales charge applies on investments of $500,000 or more, but a Contingent Deferred Sales Charge (“CDSC”) of 1% may be imposed on certain redemptions of such shares within 12 months of the date of purchase. | |
| ** | On sales of $50,000 or more, the sales charge will be reduced. | |
| *** | A Contingent Deferred Sales Charge (“CDSC”) of 1% may be charged on share purchases that are redeemed in whole or in part within 12 months of purchase. |
See accompanying Notes to Financial Statements.
49
STATEMENTS OF OPERATIONS
For the Year Ended May 31, 2019
| North Square | ||||||||||||
| Oak Ridge | North Square | North Square | ||||||||||
| Small Cap | International | Dynamic | ||||||||||
| Growth Fund | Small Cap Fund | Small Cap Fund | ||||||||||
| Investment Income: | ||||||||||||
| Dividends (net of foreign withholding taxes of | ||||||||||||
| $0, $181,016 and $46, respectively) | $ | 747,806 | $ | 1,413,192 | $ | 276,684 | ||||||
| Dividends from affiliated regulated investment companies | 98,987 | — | — | |||||||||
| Interest | 263,388 | 25,064 | 7,409 | |||||||||
| Total investment income | 1,110,181 | 1,438,256 | 284,093 | |||||||||
| Expenses: | ||||||||||||
| Advisory fees | 2,439,648 | 785,395 | 238,985 | |||||||||
| Distribution fees – Class A (Note 8) | 333,888 | 33,759 | 260 | |||||||||
| Distribution fees – Class C (Note 8) | 254,495 | — | — | |||||||||
| Transfer agent fees and expenses | 220,220 | 59,445 | 43,235 | |||||||||
| Transfer agent fees and expenses – Class A (Note 4) | 178,209 | — | — | |||||||||
| Transfer agent fees and expenses – Class C (Note 4) | 27,953 | — | — | |||||||||
| Transfer agent fees and expenses – Class I (Note 4) | 146,022 | — | — | |||||||||
| Fund administration fees | 187,032 | 124,851 | 66,235 | |||||||||
| Fund accounting fees | 17,298 | 34,337 | 9,027 | |||||||||
| Registration fees | 104,016 | 57,603 | 44,858 | |||||||||
| Auditing fees | 19,413 | 19,818 | 19,818 | |||||||||
| Legal fees | 15,596 | 16,588 | 15,752 | |||||||||
| Shareholder reporting fees | 51,282 | 10,500 | 4,288 | |||||||||
| Custody fees | 30,986 | 149,172 | 13,226 | |||||||||
| Miscellaneous | 4,431 | 2,999 | 4,882 | |||||||||
| Trustees’ fees and expenses | 5,533 | 8,372 | 7,853 | |||||||||
| Chief Compliance Officer fees | 4,282 | 8,996 | 9,003 | |||||||||
| Insurance fees | 3,659 | 2,255 | 2,025 | |||||||||
| Shareholder servicing fees (Note 7) | 844 | 40,890 | 35,873 | |||||||||
| Total expenses | 4,044,807 | 1,354,980 | 515,320 | |||||||||
| Less fees waived and expenses reimbursed | (221,211 | ) | (359,345 | ) | (221,364 | ) | ||||||
| Affiliated fund fee waived (Note 4) | (15,776 | ) | — | — | ||||||||
| Advisory fees recovered (Note 4) | — | — | — | |||||||||
| Net expenses | 3,807,820 | 995,635 | 293,956 | |||||||||
| Net investment income (loss) | (2,697,639 | ) | 442,621 | (9,863 | ) | |||||||
| Realized and Unrealized Gain (Loss): | ||||||||||||
| Net realized gain (loss) on: | ||||||||||||
| Investments | 81,107,620 | (16,686,960 | ) | 1,035,376 | ||||||||
| Foreign currency transactions | — | (37,996 | ) | — | ||||||||
| Affiliated issuers | (36,232 | ) | — | — | ||||||||
| Net realized gain | 81,071,388 | (16,724,956 | ) | 1,035,376 | ||||||||
| Capital gain distributions from | ||||||||||||
| affiliated regulated investment companies | — | — | — | |||||||||
| Net change in unrealized appreciation/depreciation on: | ||||||||||||
| Investments | (79,439,867 | ) | (1,746,660 | ) | (3,336,117 | ) | ||||||
| Foreign currency transactions | — | 13,402 | — | |||||||||
| Affiliated issuers | (743,219 | ) | — | — | ||||||||
| Net change in unrealized appreciation/depreciation | (80,183,086 | ) | (1,733,258 | ) | (3,336,117 | ) | ||||||
| Net increase from payment by affiliate (Note 4) | — | — | — | |||||||||
| Net realized and unrealized gain | 888,302 | (18,458,214 | ) | (2,300,741 | ) | |||||||
| Net increase (decrease) in net assets resulting from operations | $ | (1,809,337 | ) | $ | (18,015,593 | ) | $ | (2,310,604 | ) | |||
See accompanying Notes to Financial Statements.
50
STATEMENTS OF OPERATIONS – Continued
For the Year Ended May 31, 2019
| North Square | North Square | |||||||||||
| Oak Ridge | North Square | Oak Ridge | ||||||||||
| Disciplined | Multi Strategy | Dividend | ||||||||||
| Growth Fund | Fund | Growth Fund | ||||||||||
| Investment Income: | ||||||||||||
| Dividends (net of foreign withholding taxes of | ||||||||||||
| $560, $0 and $1,797, respectively) | $ | 124,754 | $ | 94,066 | $ | 309,777 | ||||||
| Dividends from affiliated regulated investment companies | — | 358,924 | — | |||||||||
| Interest | 16,221 | 23,411 | 11,291 | |||||||||
| Total investment income | 140,975 | 476,401 | 321,068 | |||||||||
| Expenses: | ||||||||||||
| Advisory fees | 105,602 | 17,978 | 94,058 | |||||||||
| Distribution fees – Class A (Note 8) | — | 95,056 | 1,846 | |||||||||
| Distribution fees – Class C (Note 8) | — | 119,371 | — | |||||||||
| Transfer agent fees and expenses | 24,513 | — | 43,511 | |||||||||
| Transfer agent fees and expenses – Class A (Note 4) | — | 82,731 | — | |||||||||
| Transfer agent fees and expenses – Class C (Note 4) | — | 29,203 | — | |||||||||
| Transfer agent fees and expenses – Class I (Note 4) | — | 13,998 | — | |||||||||
| Fund administration fees | 53,237 | 75,879 | 59,207 | |||||||||
| Fund accounting fees | 7,683 | 9,268 | 7,712 | |||||||||
| Registration fees | 28,151 | 61,633 | 14,086 | |||||||||
| Auditing fees | 19,562 | 18,752 | 18,568 | |||||||||
| Legal fees | 17,099 | 1,714 | 16,376 | |||||||||
| Shareholder reporting fees | 2,205 | 14,661 | 3,573 | |||||||||
| Custody fees | 9,965 | 10,292 | 7,915 | |||||||||
| Miscellaneous | 4,382 | 6,501 | 4,773 | |||||||||
| Trustees’ fees and expenses | 7,459 | 5,725 | 7,092 | |||||||||
| Chief Compliance Officer fees | 4,611 | 4,024 | 4,438 | |||||||||
| Insurance fees | 1,814 | 1,669 | 1,994 | |||||||||
| Shareholder servicing fees (Note 7) | 20,675 | 243 | 15,689 | |||||||||
| Total expenses | 306,958 | 568,698 | 300,838 | |||||||||
| Less fees waived and expenses reimbursed | (162,758 | ) | — | (166,469 | ) | |||||||
| Affiliated fund fee waived (Note 4) | — | — | — | |||||||||
| Advisory fees recovered (Note 4) | — | 121,242 | — | |||||||||
| Net expenses | 144,200 | 689,940 | 134,369 | |||||||||
| Net investment income (loss) | (3,225 | ) | (213,539 | ) | 186,699 | |||||||
| Realized and Unrealized Gain (Loss): | ||||||||||||
| Net realized gain (loss) on: | ||||||||||||
| Investments | 361,659 | 3,350 | 116,938 | |||||||||
| Affiliated issuers | — | 211,883 | — | |||||||||
| Net realized gain | 361,659 | 215,233 | 116,938 | |||||||||
| Capital gain distributions from | ||||||||||||
| affiliated regulated investment companies | — | 4,310,982 | — | |||||||||
| Net change in unrealized appreciation/depreciation on: | ||||||||||||
| Investments | 444,553 | 41,121 | 511,962 | |||||||||
| Affiliated issuers | — | (8,209,815 | ) | — | ||||||||
| Net change in unrealized appreciation/depreciation | 444,553 | (8,168,694 | ) | 511,962 | ||||||||
| Net increase from payment by affiliate (Note 4) | — | — | — | |||||||||
| Net realized and unrealized gain | 806,212 | (3,642,479 | ) | 628,900 | ||||||||
| Net increase (decrease) in net assets resulting from operations | $ | 802,987 | $ | (3,856,018 | ) | $ | 815,599 | |||||
See accompanying Notes to Financial Statements.
51
STATEMENTS OF CHANGES IN NET ASSETS
| North Square | ||||||||||||||||
| Oak Ridge | North Square | |||||||||||||||
| Small Cap | International | |||||||||||||||
| Growth Fund | Small Cap Fund | |||||||||||||||
| Year Ended | Year Ended | Year Ended | Year Ended | |||||||||||||
| May 31, 2019 | May 31, 2018 | May 31, 2019 | May 31, 2018 | |||||||||||||
| Increase (Decrease) in Net Assets from: | ||||||||||||||||
| Operations: | ||||||||||||||||
| Net investment income (loss) | $ | (2,697,639 | ) | $ | (5,799,692 | ) | $ | 442,621 | $ | 1,267,264 | ||||||
| Net realized gain on investments, affiliated | ||||||||||||||||
| issuers and foreign currency transactions | 81,071,388 | 383,945,438 | (16,724,956 | ) | 7,254,492 | |||||||||||
| Capital gain distributions from | ||||||||||||||||
| regulated investment companies | — | 1,076,546 | — | — | ||||||||||||
| Net change in unrealized appreciation/depreciation | ||||||||||||||||
| on investments and affiliated issuers | (80,183,086 | ) | (241,441,333 | ) | (1,733,258 | ) | (3,226,776 | ) | ||||||||
| Net increase from reimbursement by affiliate | ||||||||||||||||
| for investment transaction loss (Note 4) | — | — | — | 41 | ||||||||||||
| Net increase (decrease) in net assets | ||||||||||||||||
| resulting from operations | (1,809,337 | ) | 137,780,959 | (18,015,593 | ) | 5,295,021 | ||||||||||
| Distributions to Shareholders: | ||||||||||||||||
| From net investment income and net realized gain | ||||||||||||||||
from investment transactions – Class A(a) | (18,261,525 | ) | (115,701,928 | ) | (1,270,682 | ) | (793,004 | ) | ||||||||
| From net investment income and net realized gain | ||||||||||||||||
from investment transactions – Class C(a) | (8,797,820 | ) | (30,191,676 | ) | — | — | ||||||||||
| From net investment income and net realized gain | ||||||||||||||||
from investment transactions – Class I1(a) | (13,437,843 | ) | (164,004,759 | ) | (3,201,095 | ) | (6,768,269 | ) | ||||||||
| From net investment income and net realized gain | ||||||||||||||||
from investment transactions – Class K(a) | (2,775,073 | ) | (39,460,921 | ) | — | — | ||||||||||
| (43,272,261 | ) | (349,359,284 | ) | (4,471,777 | ) | (7,561,273 | ) | |||||||||
| Capital Transactions: | ||||||||||||||||
| Net proceeds from shares sold: | ||||||||||||||||
| Class A | 31,247,320 | 34,465,741 | 4,882,377 | 18,390,380 | ||||||||||||
| Class C | 2,081,913 | 3,837,915 | ||||||||||||||
Class I1 | 19,461,490 | 94,465,028 | 39,236,226 | 93,211,278 | ||||||||||||
| Class K | 24,160,915 | 9,938,798 | ||||||||||||||
| Reinvestment of distributions: | ||||||||||||||||
| Class A | 16,680,431 | 104,647,840 | 1,270,538 | 793,004 | ||||||||||||
| Class C | 8,069,940 | 27,041,226 | ||||||||||||||
Class I1 | 12,953,299 | 152,794,760 | 3,201,095 | 6,764,641 | ||||||||||||
| Class K | 2,775,073 | 34,402,662 | ||||||||||||||
| Cost of shares redeemed: | ||||||||||||||||
| Class A | (83,056,243 | ) | (145,582,702 | ) | (15,359,797 | ) | (3,118,965 | ) | ||||||||
| Class C | (11,838,721 | ) | (24,082,882 | ) | ||||||||||||
Class I1 | (126,950,749 | ) | (1,023,348,800 | ) | (86,698,355 | ) | (47,125,490 | ) | ||||||||
| Class K | (36,112,414 | ) | (99,462,440 | ) | — | — | ||||||||||
| Net increase (decrease) in net assets | ||||||||||||||||
| from capital transactions | (140,527,746 | ) | (830,882,854 | ) | (53,467,916 | ) | 68,914,848 | |||||||||
| Total increase (decrease) in net assets | (185,609,344 | ) | (1,042,461,179 | ) | (75,955,286 | ) | 66,648,596 | |||||||||
Net Assets:(b) | ||||||||||||||||
| Beginning of period | 389,572,740 | 1,432,033,919 | 121,349,348 | 54,700,752 | ||||||||||||
| End of period | $ | 203,963,396 | $ | 389,572,740 | $ | 45,394,062 | $ | 121,349,348 | ||||||||
See accompanying Notes to Financial Statements.
52
STATEMENTS OF CHANGES IN NET ASSETS – Continued
| North Square | ||||||||||||||||
| Oak Ridge | North Square | |||||||||||||||
| Small Cap | International | |||||||||||||||
| Growth Fund | Small Cap Fund | |||||||||||||||
| Year Ended | Year Ended | Year Ended | Year Ended | |||||||||||||
| May 31, 2019 | May 31, 2018 | May 31, 2019 | May 31, 2018 | |||||||||||||
| Capital Share Transactions: | ||||||||||||||||
| Shares sold | ||||||||||||||||
| Class A | 2,076,976 | 1,951,967 | 416,851 | 1,402,197 | ||||||||||||
| Class C | 444,367 | 547,259 | — | — | ||||||||||||
Class I1 | 1,097,235 | 3,295,240 | 3,809,750 | 7,018,641 | ||||||||||||
| Class K | 1,305,455 | 407,444 | — | — | ||||||||||||
| Shares reinvested: | ||||||||||||||||
| Class A | 1,284,096 | 6,944,117 | 134,449 | 62,245 | ||||||||||||
| Class C | 1,916,851 | 4,128,431 | — | — | ||||||||||||
Class I1 | 903,929 | 9,350,964 | 338,740 | 530,560 | ||||||||||||
| Class K | 196,535 | 2,134,160 | — | — | ||||||||||||
| Shares redeemed: | ||||||||||||||||
| Class A | (5,117,778 | ) | (6,332,636 | ) | (1,557,105 | ) | (232,267 | ) | ||||||||
| Class C | (2,233,434 | ) | (2,232,317 | ) | — | — | ||||||||||
Class I1 | (7,252,777 | ) | (32,703,504 | ) | (7,972,451 | ) | (3,546,879 | ) | ||||||||
| Class K | (2,112,570 | ) | (4,196,274 | ) | — | — | ||||||||||
| Net increase (decrease) in fund shares | (7,491,115 | ) | (16,705,149 | ) | (4,829,766 | ) | 5,234,497 | |||||||||
1 | Effective September 30, 2015, the Class Y shares were re-designated as Class I shares. |
The following information was previously reported in the May 31, 2018 financial statements. The distribution information for the period ended May 31, 2019 presented on the Statement of Changes is presented for comparative purposes to the May 31, 2018 financial statements, which conform to the SEC Final Rule on Disclosure Update and Simplification which was effective November 5, 2018.
(a) | For the year ended March 31, 2018, dividends and distributions to shareholders totaled the following for each Funds, respectively: |
| North Square | North Square | |||||||||
| Oak Ridge | International | |||||||||
| Small Cap Growth Fund | Small Cap Fund | |||||||||
| From Net Investment Income | $ | — | $ | (919,662 | ) | |||||
| From Net Realized Gain from Investment Transactions | $ | (349,359,284 | ) | $ | (6,641,611 | ) | ||||
(b) | As of May 31, 2018, undistributed (distribution in excess of) net investment income(loss) totaled the following for each Funds, respectively: |
| North Square | North Square | |||||||||
| Oak Ridge | International | |||||||||
| Small Cap Growth Fund | Small Cap Fund | |||||||||
| Undistributed (distribution in excess of) | ||||||||||
| net investment income (loss) | $ | — | $ | 978,710 | ||||||
See accompanying Notes to Financial Statements.
53
STATEMENTS OF CHANGES IN NET ASSETS – Continued
| North Square | North Square | |||||||||||||||
| Dynamic | Oak Ridge | |||||||||||||||
| Small Cap Fund | Disciplined Growth Fund | |||||||||||||||
| Year Ended | Year Ended | Year Ended | Year Ended | |||||||||||||
| May 31, 2019 | May 31, 2018 | May 31, 2019 | May 31, 2018 | |||||||||||||
| Increase (Decrease) in Net Assets from: | ||||||||||||||||
| Operations: | ||||||||||||||||
| Net investment income (loss) | $ | (9,863 | ) | $ | 4,102 | $ | (3,225 | ) | $ | 10,750 | ||||||
| Net realized gain on investments, affiliated | ||||||||||||||||
| issuers and foreign currency transactions | 1,035,376 | 2,473,452 | 361,659 | 5,652 | ||||||||||||
| Net change in unrealized appreciation/depreciation | ||||||||||||||||
| on investments and affiliated issuers | (3,336,117 | ) | 2,886,739 | 444,553 | 2,301,875 | |||||||||||
| Net increase (decrease) in net assets | ||||||||||||||||
| resulting from operations | (2,310,604 | ) | 5,364,293 | 802,987 | 2,318,277 | |||||||||||
| Distributions to Shareholders: | ||||||||||||||||
| From net investment income and net realized gain | ||||||||||||||||
from investment transactions – Class A(a) | (12,496 | ) | (242 | ) | — | — | ||||||||||
| From net investment income and net realized gain | ||||||||||||||||
from investment transactions – Class I1(a) | (4,034,881 | ) | (87,378 | ) | (124,163 | ) | (120 | ) | ||||||||
| (4,047,377 | ) | (87,620 | ) | (124,163 | ) | (120 | ) | |||||||||
| Capital Transactions: | ||||||||||||||||
| Net proceeds from shares sold: | ||||||||||||||||
| Class A | 253,291 | 1,037 | — | — | ||||||||||||
Class I1 | 710,545 | 24,283,960 | 1,890,000 | 18,090,000 | ||||||||||||
| Reinvestment of distributions: | ||||||||||||||||
| Class A | 12,496 | 242 | — | — | ||||||||||||
Class I1 | 4,034,881 | 87,378 | 124,163 | 120 | ||||||||||||
| Cost of shares redeemed: | ||||||||||||||||
| Class A | (1,030 | ) | (5,337 | ) | — | — | ||||||||||
Class I1 | (6,318,305 | ) | (2,519,847 | ) | (3,155,030 | ) | (6,404,430 | ) | ||||||||
| Net increase (decrease) in net assets | ||||||||||||||||
| from capital transactions | (1,308,122 | ) | 21,847,433 | (1,140,867 | ) | 11,685,690 | ||||||||||
| Total increase (decrease) in net assets | (7,666,103 | ) | 27,124,106 | (462,043 | ) | 14,003,847 | ||||||||||
Net Assets:(b) | ||||||||||||||||
| Beginning of period | 28,358,744 | 1,234,638 | 14,284,670 | 280,823 | ||||||||||||
| End of period | $ | 20,692,641 | $ | 28,358,744 | $ | 13,822,627 | $ | 14,284,670 | ||||||||
See accompanying Notes to Financial Statements.
54
STATEMENTS OF CHANGES IN NET ASSETS – Continued
| North Square | North Square | |||||||||||||||
| Dynamic | Oak Ridge | |||||||||||||||
| Small Cap Fund | Disciplined Growth Fund | |||||||||||||||
| Year Ended | Year Ended | Year Ended | Year Ended | |||||||||||||
| May 31, 2019 | May 31, 2018 | May 31, 2019 | May 31, 2018 | |||||||||||||
| Capital Share Transactions: | ||||||||||||||||
| Shares sold | ||||||||||||||||
| Class A | 20,202 | 70 | — | — | ||||||||||||
Class I1 | 50,605 | 1,944,867 | 138,738 | 1,615,178 | ||||||||||||
| Shares reinvested: | ||||||||||||||||
| Class A | 1,113 | 18 | — | — | ||||||||||||
Class I1 | 356,124 | 6,355 | 9,792 | 10 | ||||||||||||
| Shares redeemed: | ||||||||||||||||
| Class A | (66 | ) | (390 | ) | — | — | ||||||||||
Class I1 | (507,722 | ) | (180,527 | ) | (242,719 | ) | (554,782 | ) | ||||||||
| Net increase (decrease) in fund shares | (79,744 | ) | 1,770,393 | (94,189 | ) | 1,060,406 | ||||||||||
1 | Effective September 30, 2015, the Class Y shares were re-designated as Class I shares. |
The following information was previously reported in the May 31, 2018 financial statements. The distribution information for the period ended May 31, 2019 presented on the Statement of Changes is presented for comparative purposes to the May 31, 2018 financial statements, which conform to the SEC Final Rule on Disclosure Update and Simplification which was effective November 5, 2018.
(a) | For the year ended March 31, 2018, dividends and distributions to shareholders totaled the following for each Funds, respectively: |
| North Square | North Square | |||||||||
| Dynamic | Oak Ridge | |||||||||
| Small Cap Fund | Disciplined Growth Fund | |||||||||
| From Net Investment Income | $ | — | $ | (120 | ) | |||||
| From Net Realized Gain from Investment Transactions | $ | (87,620 | ) | $ | — | |||||
(b) | As of May 31, 2018, undistributed (distribution in excess of) net investment income(loss) totaled the following for each Funds, respectively: |
| North Square | North Square | |||||||||
| Dynamic | Oak Ridge | |||||||||
| Small Cap Fund | Disciplined Growth Fund | |||||||||
| Undistributed (distribution in excess of) | ||||||||||
| net investment income (loss) | $ | — | $ | (6,142 | ) | |||||
See accompanying Notes to Financial Statements.
55
STATEMENTS OF CHANGES IN NET ASSETS – Continued
| North Square | ||||||||||||||||
| North Square | Oak Ridge | |||||||||||||||
| Multi Strategy Fund | Dividend Growth Fund | |||||||||||||||
| Year Ended | Year Ended | Year Ended | Year Ended | |||||||||||||
| May 31, 2019 | May 31, 2018 | May 31, 2019 | May 31, 2018 | |||||||||||||
| Increase (Decrease) in Net Assets from: | ||||||||||||||||
| Operations: | ||||||||||||||||
| Net investment income (loss) | $ | (213,539 | ) | $ | (483,881 | ) | $ | 186,699 | $ | 125,633 | ||||||
| Net realized gain on investments, affiliated | ||||||||||||||||
| issuers and foreign currency transactions | 215,233 | 26,601,338 | 116,938 | 39,046 | ||||||||||||
| Capital gain distributions from | ||||||||||||||||
| regulated investment companies | 4,310,982 | 518,511 | — | — | ||||||||||||
| Net change in unrealized appreciation/depreciation | ||||||||||||||||
| on investments and affiliated issuers | (8,168,694 | ) | (15,546,364 | ) | 511,962 | 1,011,233 | ||||||||||
| Net increase (decrease) in net assets | ||||||||||||||||
| resulting from operations | (3,856,018 | ) | 11,089,604 | 815,599 | 1,175,912 | |||||||||||
| Distributions to Shareholders: | ||||||||||||||||
| From net investment income and net realized gain | ||||||||||||||||
from investment transactions – Class A(a) | (12,202,745 | ) | — | (21,330 | ) | (1,525 | ) | |||||||||
| From net investment income and net realized gain | ||||||||||||||||
from investment transactions – Class C(a) | (4,572,374 | ) | — | — | — | |||||||||||
| From net investment income and net realized gain | ||||||||||||||||
from investment transactions – Class I1(a) | (5,572,193 | ) | — | (342,802 | ) | (93,162 | ) | |||||||||
| (22,347,312 | ) | — | (364,132 | ) | (94,687 | ) | ||||||||||
| Capital Transactions: | ||||||||||||||||
| Net proceeds from shares sold: | ||||||||||||||||
| Class A | 5,435,800 | 2,201,621 | 726,622 | 8,140 | ||||||||||||
| Class C | 1,441,191 | 544,555 | — | — | ||||||||||||
Class I1 | 12,325,746 | 753,279 | 1,601,322 | 8,510,847 | ||||||||||||
| Reinvestment of distributions: | ||||||||||||||||
| Class A | 11,272,650 | — | 21,331 | 1,525 | ||||||||||||
| Class C | 4,246,300 | — | — | — | ||||||||||||
Class I1 | 4,909,302 | — | 342,802 | 93,161 | ||||||||||||
| Cost of shares redeemed: | ||||||||||||||||
| Class A | (10,939,863 | ) | (7,891,929 | ) | (5,105 | ) | (10,891 | ) | ||||||||
| Class C | (4,095,978 | ) | (2,653,338 | ) | — | — | ||||||||||
Class I1 | (9,933,851 | ) | (4,003,335 | ) | (400,000 | ) | (3,000 | ) | ||||||||
| Net increase (decrease) in net assets | ||||||||||||||||
| from capital transactions | 14,661,297 | (11,049,147 | ) | 2,286,972 | 8,599,782 | |||||||||||
| Total increase (decrease) in net assets | (11,542,033 | ) | 40,457 | 2,738,439 | 9,681,007 | |||||||||||
Net Assets:(b) | ||||||||||||||||
| Beginning of period | 67,251,311 | 67,210,854 | 10,182,148 | 501,141 | ||||||||||||
| End of period | $ | 55,709,278 | $ | 67,251,311 | $ | 12,920,587 | $ | 10,182,148 | ||||||||
See accompanying Notes to Financial Statements.
56
STATEMENTS OF CHANGES IN NET ASSETS – Continued
| North Square | ||||||||||||||||
| North Square | Oak Ridge | |||||||||||||||
| Multi Strategy Fund | Dividend Growth Fund | |||||||||||||||
| Year Ended | Year Ended | Year Ended | Year Ended | |||||||||||||
| May 31, 2019 | May 31, 2018 | May 31, 2019 | May 31, 2018 | |||||||||||||
| Capital Share Transactions: | ||||||||||||||||
| Shares sold | ||||||||||||||||
| Class A | 257,526 | 87,205 | 45,736 | 529 | ||||||||||||
| Class C | 73,963 | 24,360 | — | — | ||||||||||||
Class I1 | 474,824 | 30,541 | 101,984 | 608,136 | ||||||||||||
| Shares reinvested: | ||||||||||||||||
| Class A | 693,275 | — | 1,384 | 104 | ||||||||||||
| Class C | 316,416 | — | — | — | ||||||||||||
Class I1 | 292,220 | — | 22,050 | 6,184 | ||||||||||||
| Shares redeemed: | ||||||||||||||||
| Class A | (526,007 | ) | (315,937 | ) | (316 | ) | (754 | ) | ||||||||
| Class C | (261,119 | ) | (120,247 | ) | — | — | ||||||||||
Class I1 | (484,509 | ) | (162,353 | ) | (26,127 | ) | (205 | ) | ||||||||
| Net increase (decrease) in fund shares | 836,589 | (456,431 | ) | 144,711 | 613,994 | |||||||||||
1 | Effective September 30, 2015, the Class Y shares were re-designated as Class I shares. |
The following information was previously reported in the May 31, 2018 financial statements. The distribution information for the period ended May 31, 2019 presented on the Statement of Changes is presented for comparative purposes to the May 31, 2018 financial statements, which conform to the SEC Final Rule on Disclosure Update and Simplification which was effective November 5, 2018.
(a) | For the year ended March 31, 2018, dividends and distributions to shareholders totaled the following for each Funds, respectively: |
| North Square | ||||||||||
| North Square | Oak Ridge | |||||||||
| Multi Strategy Fund | Dividend Growth Fund | |||||||||
| From Net Investment Income | $ | — | $ | (91,043 | ) | |||||
| From Net Realized Gain from Investment Transactions | $ | — | $ | (3,644 | ) | |||||
(b) | As of May 31, 2018, undistributed (distribution in excess of) net investment income(loss) totaled the following for each Funds, respectively: |
| North Square | ||||||||||
| North Square | Oak Ridge | |||||||||
| Multi Strategy Fund | Dividend Growth Fund | |||||||||
| Undistributed (distribution in excess of) | ||||||||||
| net investment income (loss) | $ | — | $ | 23,439 | ||||||
See accompanying Notes to Financial Statements.
57
North Square Oak Ridge Small Cap Growth Fund
FINANCIAL HIGHLIGHTS
Class A*
Per share operating performance.
For a capital share outstanding throughout each period.
| For the Period | For the | |||||||||||||||||||||||
| December 1, | Year Ended | |||||||||||||||||||||||
| For the Year Ended May 31, | 2014 through | November 30, | ||||||||||||||||||||||
| 2019 | 2018 | 2017 | 2016 | May 31, 2015** | 2014*** | |||||||||||||||||||
| Net asset value, beginning of period | $ | 16.85 | $ | 34.16 | $ | 34.02 | $ | 41.23 | $ | 40.94 | $ | 38.74 | ||||||||||||
| Income from Investment Operations: | ||||||||||||||||||||||||
| Net investment loss | (0.16 | )1,2 | (0.23 | )1,2 | (0.33 | )1,2 | (0.37 | )1 | (0.21 | )1 | (0.40 | )1 | ||||||||||||
| Net realized and unrealized gain (loss) | (0.34 | ) | 5.69 | 2.62 | (4.54 | ) | 3.10 | 2.60 | ||||||||||||||||
| Total from investment operations | (0.50 | ) | 5.46 | 2.29 | (4.91 | ) | 2.89 | 2.20 | ||||||||||||||||
| Less Distributions: | ||||||||||||||||||||||||
| From net investment income | — | — | — | — | — | — | ||||||||||||||||||
| From net realized gain | (2.46 | ) | (22.77 | ) | (2.15 | ) | (2.30 | ) | (2.60 | ) | — | |||||||||||||
| Total distributions | (2.46 | ) | (22.77 | ) | (2.15 | ) | (2.30 | ) | (2.60 | ) | — | |||||||||||||
| Net asset value, end of period | $ | 13.89 | $ | 16.85 | $ | 34.16 | $ | 34.02 | $ | 41.23 | $ | 40.94 | ||||||||||||
Total return3 | -1.96 | % | 23.85 | % | 6.82 | % | (12.00 | )% | 7.83 | %4 | 5.68 | % | ||||||||||||
| Ratios and Supplemental Data: | ||||||||||||||||||||||||
| Net assets, end of period (in thousands) | $ | 109,749 | $ | 162,714 | $ | 242,299 | $ | 357,215 | $ | 466,398 | $ | 467,897 | ||||||||||||
Ratio of expenses to average net assets (including interest expense): | ||||||||||||||||||||||||
Before fees waived and expenses absorbed5 | 1.46 | % | 1.40 | % | 1.44 | % | 1.38 | % | 1.34 | %6 | 1.39 | % | ||||||||||||
After fees waived and expenses absorbed5 | 1.38 | % | 1.38 | %7 | 1.39 | % | 1.38 | % | 1.34 | %6 | 1.38 | % | ||||||||||||
Ratio of net investment loss to average net assets (including interest expense): | ||||||||||||||||||||||||
Before fees waived and expenses absorbed5 | (1.08 | )% | (0.97 | )% | (1.02 | )% | (1.02 | )% | (1.03 | )%6 | (1.04 | )% | ||||||||||||
After fees waived and expenses absorbed5 | (1.00 | )% | (0.95 | )% | (0.97 | )% | (1.02 | )% | (1.03 | )%6 | (1.03 | )% | ||||||||||||
| Portfolio turnover rate | 31 | % | 39 | % | 30 | % | 30 | % | 22 | %4 | 23 | % | ||||||||||||
| * | Financial information from December 1, 2012 through October 17, 2014 is for the Pioneer Oak Ridge Small Cap Growth Fund, which was reorganized into the Oak Ridge Small Cap Growth Fund as of the close of business October 17, 2014. | |
| ** | Fiscal year changed to May 31, effective December 1, 2014. | |
| *** | In connection with the reorganization of the Pioneer Oak Ridge Small Cap Growth Fund into Oak Ridge Small Cap Growth Fund as of the close of business October 17, 2014, Class B and Class R per share amounts are included with Class A per share amounts to properly reflect the historic performance of the Fund. See Note 3 in the accompanying Notes to Financial Statements. | |
1 | Based on average shares outstanding for the period. | |
2 | Recognition of net investment income by the Fund is affected by the timing of the declaration of dividends by the underlying investment companies in which the Fund invests. The ratio does not include net investment income of the investment companies in which the Fund invests. | |
3 | Total returns would have been lower/higher had expenses not been waived or absorbed/recovered by the Advisor. Returns shown do not include payment of a sales load of 5.75% of offering price, which is reduced on sales of $50,000 or more. Returns shown do not include payment of a Contingent Deferred Sales Charge (“CDSC”) of 1% on certain redemptions made within 12 months of the date of purchase. If the sales load and CDSC were included, total return would be lower. These returns include Rule 12b-1 fees of up to 0.25% and do not reflect the deduction of taxes that a shareholder would pay on Fund distributions or the redemption of Fund shares. | |
4 | Not annualized. | |
5 | Does not include expenses of the investment companies in which the Fund invests. | |
6 | Annualized. | |
7 | Effective October 5, 2017, the Fund’s advisor had contractually agreed to waive its fees and/or absorb expenses of the Fund to ensure that total annual fund operating expenses (excluding taxes, leverage interest, brokerage commissions, dividend expenses on short sales, acquired fund fees and expenses as determined in accordance with SEC Form N-1A, expenses incurred in connection with any merger or reorganization, or extraordinary expenses such as litigation) do not exceed 1.39% of average daily net assets of the fund. Prior to October 5, 2017, the annual operating expense limitation was 1.40%. |
See accompanying Notes to Financial Statements.
58
North Square Oak Ridge Small Cap Growth Fund
FINANCIAL HIGHLIGHTS
Class C*
Per share operating performance.
For a capital share outstanding throughout each period.
| For the Period | For the | |||||||||||||||||||||||
| December 1, | Year Ended | |||||||||||||||||||||||
| For the Year Ended May 31, | 2014 through | November 30, | ||||||||||||||||||||||
| 2019 | 2018 | 2017 | 2016 | May 31, 2015** | 2014 | |||||||||||||||||||
| Net asset value, beginning of period | $ | 7.30 | $ | 26.58 | $ | 27.12 | $ | 33.63 | $ | 34.01 | $ | 32.42 | ||||||||||||
| Income from Investment Operations: | ||||||||||||||||||||||||
| Net investment loss | (0.10 | )1,2 | (0.21 | )1,2 | (0.46 | )1,2 | (0.52 | )1 | (0.29 | )1 | (0.56 | )1 | ||||||||||||
| Net realized and unrealized gain (loss) | (0.25 | ) | 3.70 | 2.07 | (3.69 | ) | 2.51 | 2.15 | ||||||||||||||||
| Total from investment operations | (0.35 | ) | 3.49 | 1.61 | (4.21 | ) | 2.22 | 1.59 | ||||||||||||||||
| Less Distributions: | ||||||||||||||||||||||||
| From net investment income | — | — | — | — | — | — | ||||||||||||||||||
| From net realized gain | (2.46 | ) | (22.77 | ) | (2.15 | ) | (2.30 | ) | (2.60 | ) | — | |||||||||||||
| Total distributions | (2.46 | ) | (22.77 | ) | (2.15 | ) | (2.30 | ) | (2.60 | ) | — | |||||||||||||
| Net asset value, end of period | $ | 4.49 | $ | 7.30 | $ | 26.58 | $ | 27.12 | $ | 33.63 | $ | 34.01 | ||||||||||||
Total return3 | -2.55 | % | 22.93 | % | 6.06 | % | (12.68 | )% | 7.42 | %4 | 4.90 | % | ||||||||||||
| Ratios and Supplemental Data: | ||||||||||||||||||||||||
| Net assets, end of period (in thousands) | $ | 19,309 | $ | 30,498 | $ | 46,077 | $ | 71,123 | $ | 95,018 | $ | 92,622 | ||||||||||||
| Ratio of expenses to average net assets (including interest expense): | ||||||||||||||||||||||||
Before fees waived and expenses absorbed5 | 2.19 | % | 2.12 | % | 2.13 | % | 2.17 | % | 2.12 | %6 | 2.08 | % | ||||||||||||
After fees waived and expenses absorbed5 | 2.11 | % | 2.11 | %7 | 2.11 | % | 2.16 | % | 2.12 | %6 | 2.08 | % | ||||||||||||
Ratio of net investment loss to average net assets (including interest expense): | ||||||||||||||||||||||||
Before fees waived and expenses absorbed5 | (1.80 | )% | (1.69 | )% | (1.71 | )% | (1.81 | )% | (1.81 | )%6 | (1.74 | )% | ||||||||||||
After fees waived and expenses absorbed5 | (1.72 | )% | (1.68 | )% | (1.69 | )% | (1.80 | )% | (1.81 | )%6 | (1.74 | )% | ||||||||||||
| Portfolio turnover rate | 31 | % | 39 | % | 30 | % | 30 | % | 22 | %4 | 23 | % | ||||||||||||
| * | Financial information from December 1, 2012 through October 17, 2014 is for the Pioneer Oak Ridge Small Cap Growth Fund, which was reorganized into the Oak Ridge Small Cap Growth Fund as of the close of business October 17, 2014. | |
| ** | Fiscal year changed to May 31, effective December 1, 2014. | |
1 | Based on average shares outstanding for the period. | |
2 | Recognition of net investment income by the Fund is affected by the timing of the declaration of dividends by the underlying investment companies in which the Fund invests. The ratio does not include net investment income of the investment companies in which the Fund invests. | |
3 | Total returns would have been lower/higher had expenses not been waived or absorbed/recovered by the Advisor. Returns shown do not include payment of a Contingent Deferred Sales Charge (“CDSC”) of 1% on certain redemptions made within 12 months of the date of purchase. If the CDSC were included, total return would be lower. These returns include Rule 12b-1 fees of up to 1.00% and do not reflect the deduction of taxes that a shareholder would pay on Fund distributions or the redemption of Fund shares. | |
4 | Not annualized. | |
5 | Does not include expenses of the investment companies in which the Fund invests. | |
6 | Annualized. | |
7 | Effective October 5, 2017, the Fund’s advisor had contractually agreed to waive its fees and/or absorb expenses of the Fund to ensure that total annual fund operating expenses (excluding taxes, leverage interest, brokerage commissions, dividend expenses on short sales, acquired fund fees and expenses as determined in accordance with SEC Form N-1A, expenses incurred in connection with any merger or reorganization, or extraordinary expenses such as litigation) do not exceed 2.14% of average daily net assets of the fund. Prior to October 5, 2017, the annual operating expense was 2.30%. |
See accompanying Notes to Financial Statements.
59
North Square Oak Ridge Small Cap Growth Fund
FINANCIAL HIGHLIGHTS
Class I*7
Per share operating performance.
For a capital share outstanding throughout each period.
| For the Period | For the | |||||||||||||||||||||||
| December 1, | Year Ended | |||||||||||||||||||||||
| For the Year Ended May 31, | 2014 through | November 30, | ||||||||||||||||||||||
| 2019 | 2018 | 2017 | 2016 | May 31, 2015** | 2014 | |||||||||||||||||||
| Net asset value, beginning of period | $ | 18.29 | $ | 35.25 | $ | 34.92 | $ | 42.12 | $ | 41.69 | $ | 39.31 | ||||||||||||
| Income from Investment Operations: | ||||||||||||||||||||||||
| Net investment loss | (0.13 | )1,2 | (0.19 | )1,2 | (0.22 | )1,2 | (0.25 | )1 | (0.15 | )1 | (0.26 | )1 | ||||||||||||
| Net realized and unrealized gain (loss) | (0.35 | ) | 6.00 | 2.70 | (4.65 | ) | 3.18 | 2.64 | ||||||||||||||||
| Total from investment operations | (0.48 | ) | 5.81 | 2.48 | (4.90 | ) | 3.03 | 2.38 | ||||||||||||||||
| Less Distributions: | ||||||||||||||||||||||||
| From net investment income | — | — | — | — | — | — | ||||||||||||||||||
| From net realized gain | (2.46 | ) | (22.77 | ) | (2.15 | ) | (2.30 | ) | (2.60 | ) | — | |||||||||||||
| Total distributions | (2.46 | ) | (22.77 | ) | (2.15 | ) | (2.30 | ) | (2.60 | ) | — | |||||||||||||
| Net asset value, end of period | $ | 15.35 | $ | 18.29 | $ | 35.25 | $ | 34.92 | $ | 42.12 | $ | 41.69 | ||||||||||||
Total return3 | -1.67 | % | 24.19 | % | 7.23 | % | (11.74 | )% | 8.03 | %4 | 6.05 | % | ||||||||||||
| Ratios and Supplemental Data: | ||||||||||||||||||||||||
| Net assets, end of period (in thousands) | $ | 64,501 | $ | 172,935 | $ | 1,040,256 | $ | 1,657,047 | $ | 1,842,921 | $ | 1,591,679 | ||||||||||||
Ratio of expenses to average net assets (including interest expense): | ||||||||||||||||||||||||
Before fees waived and expenses absorbed5 | 1.22 | % | 1.05 | % | 1.09 | % | 1.10 | % | 1.05 | %6 | 1.00 | % | ||||||||||||
After fees waived and expenses absorbed5 | 1.14 | % | 1.06 | %8 | 1.04 | % | 1.04 | % | 1.05 | %6 | 1.00 | % | ||||||||||||
Ratio of net investment loss to average net assets (including interest expense): | ||||||||||||||||||||||||
Before fees waived and expenses absorbed5 | (0.84 | )% | (0.63 | )% | (0.67 | )% | (0.75 | )% | (0.74 | )%6 | (0.65 | )% | ||||||||||||
After fees waived and expenses absorbed5 | (0.75 | )% | (0.64 | )% | (0.62 | )% | (0.69 | )% | (0.74 | )%6 | (0.65 | )% | ||||||||||||
| Portfolio turnover rate | 31 | % | 39 | % | 30 | % | 30 | % | 22 | %4 | 23 | % | ||||||||||||
| * | Financial information from December 1, 2012 through October 17, 2014 is for the Pioneer Oak Ridge Small Cap Growth Fund, which was reorganized into the Oak Ridge Small Cap Growth Fund as of the close of business October 17, 2014. | |
| ** | Fiscal year changed to May 31, effective December 1, 2014. | |
1 | Based on average shares outstanding for the period. | |
2 | Recognition of net investment income by the Fund is affected by the timing of the declaration of dividends by the underlying investment companies in which the Fund invests. The ratio does not include net investment income of the investment companies in which the Fund invests. | |
3 | Total returns would have been lower/higher had expenses not been waived or absorbed/recovered by the Advisor. Returns shown do not reflect the deduction of taxes that a shareholder would pay on Fund distributions or the redemption of Fund shares. | |
4 | Not annualized. | |
5 | Does not include expenses of the investment companies in which the Fund invests. | |
6 | Annualized. | |
7 | Effective September 30, 2015, the Class Y shares were re-designated as Class I shares. | |
8 | Effective October 5, 2017, the Fund’s advisor had contractually agreed to waive its fees and/or absorb expenses of the Fund to ensure that total annual fund operating expenses (excluding taxes, leverage interest, brokerage commissions, dividend expenses on short sales, acquired fund fees and expenses as determined in accordance with SEC Form N-1A, expenses incurred in connection with any merger or reorganization, or extraordinary expenses such as litigation) do not exceed 1.14% of average daily net assets of the fund. Prior to October 5, 2017, the annual operating expense limitation was 1.05%. |
See accompanying Notes to Financial Statements.
60
North Square Oak Ridge Small Cap Growth Fund
FINANCIAL HIGHLIGHTS
Class K*
Per share operating performance.
For a capital share outstanding throughout each period.
| For the Period | For the | |||||||||||||||||||||||
| December 1, | Year Ended | |||||||||||||||||||||||
| For the Year Ended May 31, | 2014 through | November 30, | ||||||||||||||||||||||
| 2019 | 2018 | 2017 | 2016 | May 31, 2015** | 2014 | |||||||||||||||||||
| Net asset value, beginning of period | $ | 18.05 | $ | 35.02 | $ | 34.66 | $ | 41.77 | $ | 41.35 | $ | 38.94 | ||||||||||||
| Income from Investment Operations: | ||||||||||||||||||||||||
| Net investment loss | (0.11 | )1,2 | (0.14 | )1,2 | (0.17 | )1,2 | (0.20 | )1 | (0.12 | )1 | (0.21 | )1 | ||||||||||||
| Net realized and unrealized gain (loss) | (0.34 | ) | 5.94 | 2.68 | (4.61 | ) | 3.14 | 2.62 | ||||||||||||||||
| Total from investment operations | (0.45 | ) | 5.80 | 2.51 | (4.81 | ) | 3.02 | 2.41 | ||||||||||||||||
| Less Distributions: | ||||||||||||||||||||||||
| From net investment income | — | — | — | — | — | — | ||||||||||||||||||
| From net realized gain | (2.46 | ) | (22.77 | ) | (2.15 | ) | (2.30 | ) | (2.60 | ) | — | |||||||||||||
| Total distributions | (2.46 | ) | (22.77 | ) | (2.15 | ) | (2.30 | ) | (2.60 | ) | — | |||||||||||||
| Net asset value, end of period | $ | 15.14 | $ | 18.05 | $ | 35.02 | $ | 34.66 | $ | 41.77 | $ | 41.35 | ||||||||||||
Total return4 | -1.51 | % | 24.34 | % | 7.34 | % | (11.59 | )% | 8.08 | %5 | 6.19 | % | ||||||||||||
| Ratios and Supplemental Data: | ||||||||||||||||||||||||
| Net assets, end of period (in thousands) | $ | 10,405 | $ | 23,426 | $ | 103,403 | $ | 141,566 | $ | 130,003 | $ | 86,265 | ||||||||||||
Ratio of expenses to average net assets (including interest expense): | ||||||||||||||||||||||||
Before fees waived and expenses absorbed6 | 1.08 | % | 0.96 | % | 0.93 | % | 0.92 | % | 0.90 | %7 | 0.88 | % | ||||||||||||
After fees waived and expenses absorbed6 | 1.00 | % | 0.95 | %8 | 0.91 | % | 0.91 | % | 0.90 | %7 | 0.88 | % | ||||||||||||
Ratio of net investment loss to average net assets (including interest expense): | ||||||||||||||||||||||||
Before fees waived and expenses absorbed6 | (0.69 | )% | (0.53 | )% | (0.51 | )% | (0.57 | )% | (0.59 | )%7 | (0.54 | )% | ||||||||||||
After fees waived and expenses absorbed6 | (0.61 | )% | (0.52 | )% | (0.49 | )% | (0.56 | )% | (0.59 | )%7 | (0.54 | )% | ||||||||||||
| Portfolio turnover rate | 31 | % | 39 | % | 30 | % | 30 | % | 22 | %5 | 23 | % | ||||||||||||
| * | Financial information from December 20, 2012 through October 17, 2014 is for the Pioneer Oak Ridge Small Cap Growth Fund, which was reorganized into the Oak Ridge Small Cap Growth Fund as of the close of business October 17, 2014. | |
| ** | Fiscal year changed to May 31, effective December 1, 2014. | |
| *** | Class K shares were first publicly offered on December 20, 2012. | |
1 | Based on average shares outstanding for the period. | |
2 | Recognition of net investment income by the Fund is affected by the timing of the declaration of dividends by the underlying investment companies in which the Fund invests. The ratio does not include net investment income of the investment companies in which the Fund invests. | |
3 | The amount shown for a share outstanding does not correspond with the aggregate gain on investments for the period due to the timing of sales and repurchases of shares in relation to fluctuating market values of the investments of the Fund. | |
4 | Total returns would have been lower/higher had expenses not been waived or absorbed/recovered by the Advisor. Returns shown do not reflect the deduction of taxes that a shareholder would pay on Fund distributions or the redemption of Fund shares. | |
5 | Not annualized. | |
6 | Does not include expenses of the investment companies in which the Fund invests. | |
7 | Annualized. | |
8 | Effective October 5, 2017, the Fund’s advisor had contractually agreed to waive its fees and/or absorb expenses of the Fund to ensure that total annual fund operating expenses (excluding taxes, leverage interest, brokerage commissions, dividend expenses on short sales, acquired fund fees and expenses as determined in accordance with SEC Form N-1A, expenses incurred in connection with any merger or reorganization, or extraordinary expenses such as litigation) do not exceed 0.99% of average daily net assets of the fund. Prior to October 5, 2017, the annual operating expense limitation was 0.92%. |
See accompanying Notes to Financial Statements.
61
North Square International Small Cap Fund
FINANCIAL HIGHLIGHTS
Class A
Per share operating performance.
For a capital share outstanding throughout each period.
| For the Period | ||||||||||||||||
| December 1, | ||||||||||||||||
| For the Year Ended May 31, | 2015* through | |||||||||||||||
| 2019 | 2018 | 2017 | May 31, 2016 | |||||||||||||
| Net asset value, beginning of period | $ | 12.70 | $ | 12.69 | $ | 10.95 | $ | 10.68 | ||||||||
| Income from Investment Operations: | ||||||||||||||||
Net investment income (loss)1 | 0.04 | 0.16 | 0.11 | 0.06 | ||||||||||||
| Net realized and unrealized gain (loss) | (2.23 | ) | 1.10 | 1.78 | 0.19 | |||||||||||
Net increase from reimbursement by affiliate for investment transaction loss (Note 4) | — | — | 2 | — | — | 2 | ||||||||||
| Total from investment operations | (2.19 | ) | 1.26 | 1.89 | 0.25 | |||||||||||
| Less Distributions: | ||||||||||||||||
| From net investment income | (0.14 | ) | (0.13 | ) | (0.11 | ) | — | |||||||||
| From net realized gain | (0.75 | ) | (1.12 | ) | (0.04 | ) | — | |||||||||
| Total distributions | (0.89 | ) | (1.25 | ) | (0.15 | ) | — | |||||||||
| Contribution to capital from affiliate (Note 4) | — | — | — | 0.02 | ||||||||||||
| Net asset value, end of period | $ | 9.62 | $ | 12.70 | $ | 12.69 | $ | 10.95 | ||||||||
Total return3 | -17.14 | % | 9.90 | % | 17.52 | % | 2.53 | %4,5 | ||||||||
| Ratios and Supplemental Data: | ||||||||||||||||
| Net assets, end of period (in thousands) | $ | 5,825 | $ | 20,462 | $ | 4,812 | $ | 2,151 | ||||||||
| Ratio of expenses to average net assets: | ||||||||||||||||
| Before fees waived and expenses absorbed | 1.99 | % | 1.78 | % | 2.22 | % | 2.43 | %6 | ||||||||
| After fees waived and expenses absorbed | 1.50 | % | 1.50 | % | 1.50 | % | 1.50 | %6 | ||||||||
| Ratio of net investment income (loss) to average net assets: | ||||||||||||||||
| Before fees waived and expenses absorbed | (0.10 | )% | 0.93 | % | 0.25 | % | 0.25 | %6 | ||||||||
| After fees waived and expenses absorbed | 0.39 | % | 1.21 | % | 0.97 | % | 1.18 | %6 | ||||||||
| Portfolio turnover rate | 204 | % | 234 | % | 124 | % | 76 | %5 | ||||||||
| * | Commencement of operations. | |
1 | Based on average shares outstanding for the period. | |
2 | Amount represents less than $0.01 per share. | |
3 | Total returns would have been lower had expenses not been waived or absorbed by the Advisor. Returns shown do not include payment of a sales load of 5.75% of offering price, which is reduced on sales of $50,000 or more. Returns shown do not include payment of a Contingent Deferred Sales Charge (“CDSC”) of 1% on certain redemptions made within 12 months of the date of purchase. If the sales load and CDSC were included, total return would be lower. These returns include Rule 12b-1 fees of up to 0.25% and do not reflect the deduction of taxes that a shareholder would pay on Fund distributions or the redemption of Fund shares. | |
4 | In 2016, 0.19% of the fund’s total return consists of a voluntary reimbursement by an affiliate for investment transaction losses. | |
5 | Not annualized. | |
6 | Annualized. |
See accompanying Notes to Financial Statements.
62
North Square International Small Cap Fund
FINANCIAL HIGHLIGHTS
Class I
Per share operating performance.
For a capital share outstanding throughout each period.
| For the Period | ||||||||||||||||
| September 30, | ||||||||||||||||
| For the Year Ended May 31, | 2015* through | |||||||||||||||
| 2019 | 2018 | 2017 | May 31, 2016 | |||||||||||||
| Net asset value, beginning of period | $ | 12.72 | $ | 12.71 | $ | 10.97 | $ | 10.00 | ||||||||
| Income from Investment Operations: | ||||||||||||||||
Net investment income1 | 0.07 | 0.19 | 0.14 | 0.07 | ||||||||||||
| Net realized and unrealized gain (loss) | (2.23 | ) | 1.10 | 1.77 | 0.87 | |||||||||||
Net increase from reimbursement by affiliate for investment transaction loss (Note 4) | — | — | — | 0.03 | ||||||||||||
| Total from investment operations | (2.16 | ) | 1.29 | 1.91 | 0.97 | |||||||||||
| Contribution to capital from affiliate (Note 4) | — | — | 2 | — | — | 2 | ||||||||||
| Less Distributions: | ||||||||||||||||
| From net investment income | (0.17 | ) | (0.16 | ) | (0.13 | ) | — | |||||||||
| From net realized gain | (0.75 | ) | (1.12 | ) | (0.04 | ) | — | |||||||||
| Total distributions | (0.92 | ) | (1.28 | ) | (0.17 | ) | — | |||||||||
| Net asset value, end of period | $ | 9.64 | $ | 12.72 | $ | 12.71 | $ | 10.97 | ||||||||
Total return3 | -16.85 | % | 10.07 | % | 17.70 | % | 9.70 | %4,5 | ||||||||
| Ratios and Supplemental Data: | ||||||||||||||||
| Net assets, end of period (in thousands) | $ | 39,569 | $ | 100,887 | $ | 49,889 | $ | 28,341 | ||||||||
| Ratio of expenses to average net assets: | ||||||||||||||||
| Before fees waived and expenses absorbed | 1.74 | % | 1.53 | % | 1.97 | % | 2.12 | %6 | ||||||||
| After fees waived and expenses absorbed | 1.25 | % | 1.25 | % | 1.25 | % | 1.25 | %6 | ||||||||
| Ratio of net investment income (loss) to average net assets: | ||||||||||||||||
| Before fees waived and expenses absorbed | 0.15 | % | 1.18 | % | 0.50 | % | 0.08 | %6 | ||||||||
| After fees waived and expenses absorbed | 0.64 | % | 1.46 | % | 1.22 | % | 0.95 | %6 | ||||||||
| Portfolio turnover rate | 204 | % | 234 | % | 124 | % | 76 | %5 | ||||||||
| * | Commencement of operations. |
1 | Based on average shares outstanding for the period. |
2 | Amount represents less than $0.01 per share. |
3 | Total returns would have been lower had expenses not been waived by the Advisor. Returns shown do not reflect the deduction of taxes that a shareholder would pay on Fund distributions or the redemption of Fund shares. |
4 | In 2016, 0.40% of the fund’s total return consists of a voluntary reimbursement by an affiliate for investment transaction losses. |
5 | Not annualized. |
6 | Annualized. |
See accompanying Notes to Financial Statements.
63
North Square Dynamic Small Cap Fund
FINANCIAL HIGHLIGHTS
Class A
Per share operating performance.
For a capital share outstanding throughout each period.
| For the Period | ||||||||||||||||
| December 1, | ||||||||||||||||
| For the Year Ended May 31, | 2015* through | |||||||||||||||
| 2019 | 2018 | 2017 | May 31, 2016 | |||||||||||||
| Net asset value, beginning of period | $ | 15.06 | $ | 12.03 | $ | 9.97 | $ | 10.97 | ||||||||
| Income from Investment Operations: | ||||||||||||||||
Net investment loss1 | (0.04 | ) | (0.03 | ) | (0.05 | ) | (0.02 | ) | ||||||||
| Net realized and unrealized gain (loss) | (1.31 | ) | 3.10 | 2.14 | (0.95 | ) | ||||||||||
| Total from investment operations | (1.35 | ) | 3.07 | 2.09 | (0.97 | ) | ||||||||||
| Less Distributions: | ||||||||||||||||
| From net investment income | — | — | — | (0.01 | ) | |||||||||||
| From net realized gain | (2.28 | ) | (0.04 | ) | (0.03 | ) | (0.02 | ) | ||||||||
| Total distributions | (2.28 | ) | (0.04 | ) | (0.03 | ) | (0.03 | ) | ||||||||
| Net asset value, end of period | $ | 11.43 | $ | 15.06 | $ | 12.03 | $ | 9.97 | ||||||||
Total return2 | -8.67 | % | 25.59 | % | 21.01 | % | (8.81 | )%3 | ||||||||
| Ratios and Supplemental Data: | ||||||||||||||||
| Net assets, end of period (in thousands) | $ | 304 | $ | 80 | $ | 68 | $ | 32 | ||||||||
| Ratio of expenses to average net assets: | ||||||||||||||||
| Before fees waived and expenses absorbed | 2.27 | % | 2.14 | % | 20.14 | % | 38.27 | %4 | ||||||||
| After fees waived and expenses absorbed | 1.40 | % | 1.40 | % | 1.40 | % | 1.40 | %4 | ||||||||
| Ratio of net investment loss to average net assets: | ||||||||||||||||
| Before fees waived and expenses absorbed | (1.16 | )% | (0.96 | )% | (19.22 | )% | (37.24 | )%4 | ||||||||
| After fees waived and expenses absorbed | (0.29 | )% | (0.22 | )% | (0.48 | )% | (0.37 | )%4 | ||||||||
| Portfolio turnover rate | 133 | % | 170 | % | 181 | % | 78 | %3 | ||||||||
| * | Commencement of operations. | |
1 | Based on average shares outstanding for the period. | |
2 | Total returns would have been lower had expenses not been waived or absorbed by the Advisor. Returns shown do not include payment of a sales load of 5.75% of offering price, which is reduced on sales of $50,000 or more. Returns shown do not include payment of a Contingent Deferred Sales Charge (“CDSC”) of 1% on certain redemptions made within 12 months of the date of purchase. If the sales load and CDSC were included, total return would be lower. These returns include Rule 12b-1 fees of up to 0.25% and do not reflect the deduction of taxes that a shareholder would pay on Fund distributions or the redemption of Fund shares. | |
3 | Not annualized. | |
4 | Annualized. |
See accompanying Notes to Financial Statements.
64
North Square Dynamic Small Cap Fund
FINANCIAL HIGHLIGHTS
Class I
Per share operating performance.
For a capital share outstanding throughout each period.
| For the Period | ||||||||||||||||
| September 30, | ||||||||||||||||
| For the Year Ended May 31, | 2015* through | |||||||||||||||
| 2019 | 2018 | 2017 | May 31, 2016 | |||||||||||||
| Net asset value, beginning of period | $ | 15.14 | $ | 12.07 | $ | 9.98 | $ | 10.00 | ||||||||
| Income from Investment Operations: | ||||||||||||||||
Net investment income (loss)1 | (0.01 | ) | — | 2 | (0.03 | ) | — | 2 | ||||||||
| Net realized and unrealized gain (loss) | (1.31 | ) | 3.11 | 2.15 | 0.01 | |||||||||||
| Total from investment operations | (1.32 | ) | 3.11 | 2.12 | 0.01 | |||||||||||
| Less Distributions: | ||||||||||||||||
| From net investment income | — | — | — | (0.01 | ) | |||||||||||
| From net realized gain | (2.28 | ) | (0.04 | ) | (0.03 | ) | (0.02 | ) | ||||||||
| Total distributions | (2.28 | ) | (0.04 | ) | (0.03 | ) | (0.03 | ) | ||||||||
| Net asset value, end of period | $ | 11.54 | $ | 15.14 | $ | 12.07 | $ | 9.98 | ||||||||
Total return3 | -8.42 | % | 25.83 | % | 21.29 | % | 0.16 | %4 | ||||||||
| Ratios and Supplemental Data: | ||||||||||||||||
| Net assets, end of period (in thousands) | $ | 20,389 | $ | 28,279 | $ | 1,167 | $ | 799 | ||||||||
| Ratio of expenses to average net assets: | ||||||||||||||||
| Before fees waived and expenses absorbed | 2.02 | % | 1.89 | % | 19.89 | % | 36.44 | %5 | ||||||||
| After fees waived and expenses absorbed | 1.15 | % | 1.15 | % | 1.15 | % | 1.15 | %5 | ||||||||
| Ratio of net investment income (loss) to average net assets: | ||||||||||||||||
| Before fees waived and expenses absorbed | (0.91 | )% | (0.71 | )% | (18.97 | )% | (35.29 | )%5 | ||||||||
| After fees waived and expenses absorbed | (0.04 | )% | 0.03 | % | (0.22 | )% | 0.00 | %5 | ||||||||
| Portfolio turnover rate | 133 | % | 170 | % | 181 | % | 78 | %4 | ||||||||
| * | Commencement of operations. | |
1 | Based on average shares outstanding for the period. | |
2 | Amount represents less than $0.01 per share. | |
3 | Total returns would have been lower had expenses not been waived by the Advisor. Returns shown do not reflect the deduction of taxes that a shareholder would pay on Fund distributions or the redemption of Fund shares. | |
4 | Not annualized. | |
5 | Annualized. |
See accompanying Notes to Financial Statements.
65
North Square Oak Ridge Disciplined Growth Fund
FINANCIAL HIGHLIGHTS
Class I
Per share operating performance.
For a capital share outstanding throughout each period.
| For the Period | ||||||||||||
| July 29, | ||||||||||||
| For the Year Ended May 31, | 2016* through | |||||||||||
| 2019 | 2018 | May 31, 2017 | ||||||||||
| Net asset value, beginning of period | $ | 13.16 | $ | 11.03 | $ | 10.00 | ||||||
| Income from Investment Operations: | ||||||||||||
Net investment income1 | — | 2 | 0.01 | 0.03 | ||||||||
| Net realized and unrealized gain | 0.88 | 2.12 | 1.02 | |||||||||
| Total from investment operations | 0.88 | 2.13 | 1.05 | |||||||||
| Less Distributions: | ||||||||||||
| From net investment income | — | — | 2 | (0.02 | ) | |||||||
| From net realized gain | (0.10 | ) | — | — | ||||||||
| Total distributions | (0.10 | ) | — | — | ||||||||
| Net asset value, end of period | $ | 13.94 | $ | 13.16 | $ | 11.03 | ||||||
Total return3 | 6.80 | % | 19.31 | % | 10.58 | %4 | ||||||
| Ratios and Supplemental Data: | ||||||||||||
| Net assets, end of period (in thousands) | $ | 13,823 | $ | 14,285 | $ | 281 | ||||||
| Ratio of expenses to average net assets: | ||||||||||||
| Before fees waived and expenses absorbed | 2.04 | % | 1.99 | % | 45.40 | %5 | ||||||
| After fees waived and expenses absorbed | 0.95 | % | 0.95 | % | 0.95 | %5 | ||||||
| Ratio of net investment income (loss) to average net assets: | ||||||||||||
| Before fees waived and expenses absorbed | (1.10 | )% | (0.96 | )% | (44.13 | )%5 | ||||||
| After fees waived and expenses absorbed | (0.01 | )% | 0.08 | % | 0.32 | %5 | ||||||
| Portfolio turnover rate | 18 | % | 74 | % | 116 | %4 | ||||||
| * | Commencement of operations. | |
1 | Based on average shares outstanding for the period. | |
2 | Amount represents less than $0.01 per share. | |
3 | Total returns would have been lower had expenses not been waived or absorbed by the Advisor. Returns shown do not reflect the deduction of taxes that a shareholder would pay on Fund distributions or the redemption of Fund shares. | |
4 | Not annualized. | |
5 | Annualized. |
See accompanying Notes to Financial Statements.
66
North Square Multi Strategy Fund
FINANCIAL HIGHLIGHTS
Class A*
Per share operating performance.
For a capital share outstanding throughout each period.
| For the Period | For the | |||||||||||||||||||||||
| December 1, | Year Ended | |||||||||||||||||||||||
| For the Year Ended May 31, | 2014 through | November 30, | ||||||||||||||||||||||
| 2019 | 2018 | 2017 | 2016 | May 31, 2015** | 2014*** | |||||||||||||||||||
| Net asset value, beginning of period | $ | 26.95 | $ | 22.81 | $ | 19.77 | $ | 20.35 | $ | 19.55 | $ | 17.40 | ||||||||||||
| Income from Investment Operations: | ||||||||||||||||||||||||
Net investment income (loss)7 | (0.06 | )1 | (0.16 | )1 | — | 1,2 | (0.02 | )1 | (0.02 | )1 | (0.05 | )1 | ||||||||||||
| Net realized and unrealized gain (loss) | (1.60 | ) | 4.30 | 3.04 | (0.56 | ) | 0.82 | 2.20 | ||||||||||||||||
| Total from investment operations | (1.66 | ) | 4.14 | 3.04 | (0.58 | ) | 0.80 | 2.15 | ||||||||||||||||
| Less Distributions: | ||||||||||||||||||||||||
| From net realized gain | (8.37 | ) | — | — | — | — | — | |||||||||||||||||
| Total distributions | (8.37 | ) | — | — | — | — | — | |||||||||||||||||
| Net asset value, end of period | $ | 16.92 | $ | 26.95 | $ | 22.81 | $ | 19.77 | $ | 20.35 | $ | 19.55 | ||||||||||||
Total return3 | -4.88 | % | 18.15 | % | 15.38 | % | (2.85 | )% | 4.09 | %4 | 12.36 | % | ||||||||||||
| Ratios and Supplemental Data: | ||||||||||||||||||||||||
| Net assets, end of period (in thousands) | $ | 33,287 | $ | 41,570 | $ | 40,399 | $ | 39,346 | $ | 44,427 | $ | 44,742 | ||||||||||||
| Ratio of expenses to average net assets: | ||||||||||||||||||||||||
Before fees waived/recovered6 | 0.82 | % | 0.93 | %8 | 1.63 | % | 1.54 | % | 1.61 | %5 | 1.59 | % | ||||||||||||
After fees waived/recovered6 | 1.00 | % | 1.13 | %8 | 1.20 | % | 1.20 | % | 1.20 | %5 | 1.23 | % | ||||||||||||
Ratio of net investment income (loss) to average net assets: | ||||||||||||||||||||||||
Before fees waived/recovered6,7 | (0.09 | )% | (0.43 | )% | (0.43 | )% | (0.45 | )% | (0.65 | )%5 | (0.61 | )% | ||||||||||||
After fees waived/recovered6,7 | (0.27 | )% | (0.63 | )% | 0.00 | % | (0.11 | )% | (0.24 | )%5 | (0.25 | )% | ||||||||||||
| Portfolio turnover rate | 17 | % | 117 | % | 17 | % | 23 | % | 11 | %4 | 29 | % | ||||||||||||
| * | Financial information from December 1, 2012 through October 17, 2014 is for the Pioneer Oak Ridge Large Cap Growth Fund, which was reorganized into the Oak Ridge Large Cap Growth Fund as of the close of business October 17, 2014. | |
| ** | Fiscal year changed to May 31, effective December 1, 2014. | |
| *** | In connection with the reorganization of the Pioneer Oak Ridge Large Cap Growth Fund into Oak Ridge Large Cap Growth Fund as of the close of business October 17, 2014, Class B and Class R per share amounts are included with Class A per share amounts to properly reflect the historic performance of the Fund. See Note 3 in the accompanying Notes to Financial Statements. | |
1 | Based on average shares outstanding for the period. | |
2 | Amount represents less than $0.01 per share. | |
3 | Total returns would have been lower had expenses not been waived or absorbed by the Advisor. Returns shown do not include payment of a sales load of 5.75% of offering price, which is reduced on sales of $50,000 or more. Returns shown do not include payment of a Contingent Deferred Sales Charge (“CDSC”) of 1% on certain redemptions made within 12 months of the date of purchase. If the sales load and CDSC were included, total return would be lower. These returns include Rule 12b-1 fees of up to 0.25% and do not reflect the deduction of taxes that a shareholder would pay on Fund distributions or the redemption of Fund shares. | |
4 | Not annualized. | |
5 | Annualized. | |
6 | Does not include expenses of the investment companies in which the Fund invests. | |
7 | Recognition of net investment income by the Fund is affected by the timing of the declaration of dividends by the underlying investment companies in which the Fund invests. The ratio does not include net investment income of the investment companies in which the Fund invests. | |
8 | The Advisor does not receive management fees for Fund assets invested in other series of the Trust advised by the Advisor (affiliated investments). |
See accompanying Notes to Financial Statements.
67
North Square Multi Strategy Fund
FINANCIAL HIGHLIGHTS
Class C*
Per share operating performance.
For a capital share outstanding throughout each period.
| For the Period | For the | |||||||||||||||||||||||
| December 1, | Year Ended | |||||||||||||||||||||||
| For the Year Ended May 31, | 2014 through | November 30, | ||||||||||||||||||||||
| 2019 | 2018 | 2017 | 2016 | May 31, 2015** | 2014 | |||||||||||||||||||
| Net asset value, beginning of period | $ | 23.94 | $ | 20.41 | $ | 17.86 | $ | 18.54 | $ | 17.89 | $ | 16.07 | ||||||||||||
| Income from Investment Operations: | ||||||||||||||||||||||||
Net investment loss6 | (0.19 | )1 | (0.30 | )1 | (0.17 | )1 | (0.18 | )1 | (0.10 | )1 | (0.18 | )1 | ||||||||||||
| Net realized and unrealized gain (loss) | (1.46 | ) | 3.83 | 2.72 | (0.50 | ) | 0.75 | 2.00 | ||||||||||||||||
| Total from investment operations | (1.65 | ) | 3.53 | 2.55 | (0.68 | ) | 0.65 | 1.82 | ||||||||||||||||
| Less Distributions: | ||||||||||||||||||||||||
| From net realized gain | (8.37 | ) | — | — | — | — | — | |||||||||||||||||
| Total distributions | (8.37 | ) | — | — | — | — | — | |||||||||||||||||
| Net asset value, end of period | $ | 13.92 | $ | 23.94 | $ | 20.41 | $ | 17.86 | $ | 18.54 | $ | 17.89 | ||||||||||||
Total return2 | -5.55 | % | 17.30 | % | 14.28 | % | (3.67 | )% | 3.63 | %3 | 11.33 | % | ||||||||||||
| Ratios and Supplemental Data: | ||||||||||||||||||||||||
| Net assets, end of period (in thousands) | $ | 9,503 | $ | 13,247 | $ | 13,251 | $ | 15,876 | $ | 18,532 | $ | 19,527 | ||||||||||||
| Ratio of expenses to average net assets: | ||||||||||||||||||||||||
Before fees waived/recovered5 | 1.59 | % | 1.66 | %7 | 2.20 | % | 2.24 | % | 2.30 | %4 | 2.19 | % | ||||||||||||
After fees waived/recovered5 | 1.78 | % | 1.86 | %7 | 2.10 | % | 2.10 | % | 2.10 | %4 | 2.10 | % | ||||||||||||
Ratio of net investment loss to average net assets: | ||||||||||||||||||||||||
Before fees waived/recovered5,6 | (0.87 | )% | (1.16 | )% | (1.00 | )% | (1.15 | )% | (1.34 | )%4 | (1.21 | )% | ||||||||||||
After fees waived/recovered5,6 | (1.05 | )% | (1.36 | )% | (0.90 | )% | (1.01 | )% | (1.14 | )%4 | (1.12 | )% | ||||||||||||
| Portfolio turnover rate | 17 | % | 117 | % | 17 | % | 23 | % | 11 | %3 | 29 | % | ||||||||||||
| * | Financial information from December 1, 2012 through October 17, 2014 is for the Pioneer Oak Ridge Large Cap Growth Fund, which was reorganized into the Oak Ridge Large Cap Growth Fund as of the close of business October 17, 2014. | |
| ** | Fiscal year changed to May 31, effective December 1, 2014. | |
1 | Based on average shares outstanding for the period. | |
2 | Total returns would have been lower had expenses not been waived or absorbed by the Advisor. Returns shown do not include payment of a Contingent Deferred Sales Charge (“CDSC”) of 1% on certain redemptions made within 12 months of the date of purchase. If the CDSC were included, total return would be lower. These returns include Rule 12b-1 fees of up to 1.00% and do not reflect the deduction of taxes that a shareholder would pay on Fund distributions or the redemption of Fund shares. | |
3 | Not annualized. | |
4 | Annualized. | |
5 | Does not include expenses of the investment companies in which the Fund invests. | |
6 | Recognition of net investment income by the Fund is affected by the timing of the declaration of dividends by the underlying investment companies in which the Fund invests. The ratio does not include net investment income of the investment companies in which the Fund invests. | |
7 | The Advisor does not receive management fees for Fund assets invested in other series of the Trust advised by the Advisor (affiliated investments). |
See accompanying Notes to Financial Statements.
68
North Square Multi Strategy Fund
FINANCIAL HIGHLIGHTS
Class I*5
Per share operating performance.
For a capital share outstanding throughout each period.
| For the Period | For the | |||||||||||||||||||||||
| December 1, | Year Ended | |||||||||||||||||||||||
| For the Year Ended May 31, | 2014 through | November 30, | ||||||||||||||||||||||
| 2019 | 2018 | 2017 | 2016 | May 31, 2015** | 2014 | |||||||||||||||||||
| Net asset value, beginning of period | $ | 27.53 | $ | 23.24 | $ | 20.14 | $ | 20.72 | $ | 19.90 | $ | 17.69 | ||||||||||||
| Income from Investment Operations: | ||||||||||||||||||||||||
Net investment income (loss)7 | 0.02 | 1,2 | (0.10 | )1 | 0.01 | 1 | (0.02 | )1 | (0.02 | )1 | (0.02 | )1 | ||||||||||||
| Net realized and unrealized gain (loss) | (1.59 | ) | 4.39 | 3.09 | (0.56 | ) | 0.84 | 2.23 | ||||||||||||||||
| Total from investment operations | (1.57 | ) | 4.29 | 3.10 | (0.58 | ) | 0.82 | 2.21 | ||||||||||||||||
| Less Distributions: | ||||||||||||||||||||||||
| From net realized gain | (8.37 | ) | — | — | — | — | — | |||||||||||||||||
| Total distributions | (8.37 | ) | — | — | — | — | — | |||||||||||||||||
| Net asset value, end of period | $ | 17.59 | $ | 27.53 | $ | 23.24 | $ | 20.14 | $ | 20.72 | $ | 19.90 | ||||||||||||
Total return2 | -4.23 | % | 18.46 | % | 15.39 | % | (2.80 | )% | 4.12 | %3 | 12.49 | % | ||||||||||||
| Ratios and Supplemental Data: | ||||||||||||||||||||||||
| Net assets, end of period (in thousands) | $ | 12,919 | $ | 12,434 | $ | 13,561 | $ | 14,172 | $ | 16,361 | $ | 16,206 | ||||||||||||
| Ratio of expenses to average net assets: | ||||||||||||||||||||||||
Before fees waived/recovered6 | 0.44 | % | 0.72 | %8 | 1.26 | % | 1.22 | % | 1.15 | %4 | 1.09 | % | ||||||||||||
After fees waived/recovered6 | 0.62 | % | 0.88 | %8 | 1.17 | % | 1.17 | % | 1.15 | %4 | 1.09 | % | ||||||||||||
Ratio of net investment income (loss) to average net assets: | ||||||||||||||||||||||||
Before fees waived/recovered6,7 | 0.29 | % | (0.22 | )% | (0.06 | )% | (0.13 | )% | (0.19 | )%4 | (0.10 | )% | ||||||||||||
After fees waived/recovered6,7 | 0.10 | % | (0.38 | )% | 0.03 | % | (0.08 | )% | (0.19 | )%4 | (0.10 | )% | ||||||||||||
| Portfolio turnover rate | 17 | % | 117 | % | 17 | % | 23 | % | 11 | %3 | 29 | % | ||||||||||||
| * | Financial information from December 1, 2012 through October 17, 2014 is for the Pioneer Oak Ridge Large Cap Growth Fund, which was reorganized into the Oak Ridge Large Cap Growth Fund as of the close of business October 17, 2014. | |
| ** | Fiscal year changed to May 31, effective December 1, 2014. | |
1 | Based on average shares outstanding for the period. | |
2 | Total returns would have been lower had expenses not been waived or absorbed by the Advisor. Returns shown do not reflect the deduction of taxes that a shareholder would pay on Fund distributions or the redemption of Fund shares. | |
3 | Not annualized. | |
4 | Annualized. | |
5 | Effective September 30, 2015, the Class Y shares were re-designated as Class I shares. | |
6 | Does not include expenses of the investment companies in which the Fund invests. | |
7 | Recognition of net investment income by the Fund is affected by the timing of the declaration of dividends by the underlying investment companies in which the Fund invests. The ratio does not include net investment income of the investment companies in which the Fund invests. | |
8 | The Advisor does not receive management fees for Fund assets invested in other series of the Trust advised by the Advisor (affiliated investments). |
See accompanying Notes to Financial Statements.
69
North Square Oak Ridge Dividend Growth Fund
FINANCIAL HIGHLIGHTS
Class A
Per share operating performance.
For a capital share outstanding throughout each period.
| For the Year Ended May 31, | ||||||||||||||||||||
| 2019 | 2018 | 2017 | 2016 | 2015 | ||||||||||||||||
| Net asset value, beginning of period | $ | 15.54 | $ | 13.59 | $ | 12.00 | $ | 12.75 | $ | 11.59 | ||||||||||
| Income from Investment Operations: | ||||||||||||||||||||
Net investment income1 | 0.20 | 0.20 | 0.18 | 0.17 | 0.14 | |||||||||||||||
| Net realized and unrealized gain (loss) | 0.82 | 1.92 | 1.71 | (0.57 | ) | 1.17 | ||||||||||||||
| Total from investment operations | 1.02 | 2.12 | 1.89 | (0.40 | ) | 1.31 | ||||||||||||||
| Less Distributions: | ||||||||||||||||||||
| From net investment income | (0.20 | ) | (0.16 | ) | (0.16 | ) | (0.17 | ) | (0.14 | ) | ||||||||||
| From net realized gain | (0.22 | ) | (0.01 | ) | (0.14 | ) | (0.18 | ) | (0.01 | ) | ||||||||||
| Total distributions | (0.42 | ) | (0.17 | ) | (0.30 | ) | (0.35 | ) | (0.15 | ) | ||||||||||
| Net asset value, end of period | $ | 16.14 | $ | 15.54 | $ | 13.59 | $ | 12.00 | $ | 12.75 | ||||||||||
Total return2 | 6.73 | % | 15.64 | % | 15.91 | % | (3.09 | )% | 11.38 | % | ||||||||||
| Ratios and Supplemental Data: | ||||||||||||||||||||
| Net assets, end of period (in thousands) | $ | 907 | $ | 146 | $ | 129 | $ | 101 | $ | 67 | ||||||||||
| Ratio of expenses to average net assets: | ||||||||||||||||||||
| Before fees waived and expenses absorbed | 2.62 | % | 3.18 | % | 36.49 | % | 42.68 | % | 51.52 | % | ||||||||||
| After fees waived and expenses absorbed | 1.25 | % | 1.25 | % | 1.25 | % | 1.25 | % | 1.25 | % | ||||||||||
| Ratio of net investment income (loss) to average net assets: | ||||||||||||||||||||
| Before fees waived and expenses absorbed | (0.06 | )% | (0.58 | )% | (33.82 | )% | (39.98 | )% | (49.16 | )% | ||||||||||
| After fees waived and expenses absorbed | 1.31 | % | 1.35 | % | 1.42 | % | 1.45 | % | 1.11 | % | ||||||||||
| Portfolio turnover rate | 15 | % | 30 | % | 22 | % | 11 | % | 18 | % | ||||||||||
| * | Commencement of operations. | |
1 | Based on average shares outstanding for the period. | |
2 | Total returns would have been lower had expenses not been waived or absorbed by the Advisor. Returns shown do not include payment of a sales load of 5.75% of offering price, which is reduced on sales of $50,000 or more. Returns shown do not include payment of a Contingent Deferred Sales Charge (“CDSC”) of 1% on certain redemptions made within 12 months of the date of purchase. If the sales load and CDSC were included, total return would be lower. These returns include Rule 12b-1 fees of up to 0.25% and do not reflect the deduction of taxes that a shareholder would pay on Fund distributions or the redemption of Fund shares. |
See accompanying Notes to Financial Statements.
70
North Square Oak Ridge Dividend Growth Fund
FINANCIAL HIGHLIGHTS
Class I
Per share operating performance.
For a capital share outstanding throughout each period.
| For the Year Ended May 31, | ||||||||||||||||||||
| 2019 | 2018 | 2017 | 2016 | 2015 | ||||||||||||||||
| Net asset value, beginning of period | $ | 15.65 | $ | 13.69 | $ | 12.08 | $ | 12.84 | $ | 11.66 | ||||||||||
| Income from Investment Operations: | ||||||||||||||||||||
Net investment income1 | 0.24 | 0.24 | 0.21 | 0.20 | 0.17 | |||||||||||||||
| Net realized and unrealized gain (loss) | 0.82 | 1.93 | 1.73 | (0.58 | ) | 1.19 | ||||||||||||||
| Total from investment operations | 1.06 | 2.17 | 1.94 | (0.38 | ) | 1.36 | ||||||||||||||
| Less Distributions: | ||||||||||||||||||||
| From net investment income | (0.24 | ) | (0.20 | ) | (0.19 | ) | (0.20 | ) | (0.17 | ) | ||||||||||
| From net realized gain | (0.22 | ) | (0.01 | ) | (0.14 | ) | (0.18 | ) | (0.01 | ) | ||||||||||
| Total distributions | (0.46 | ) | (0.21 | ) | (0.33 | ) | (0.38 | ) | (0.18 | ) | ||||||||||
| Net asset value, end of period | $ | 16.25 | $ | 15.65 | $ | 13.69 | $ | 12.08 | $ | 12.84 | ||||||||||
Total return2 | 6.94 | % | 15.89 | % | 16.25 | % | (2.92 | )% | 11.75 | % | ||||||||||
| Ratios and Supplemental Data: | ||||||||||||||||||||
| Net assets, end of period (in thousands) | $ | 12,014 | $ | 10,036 | $ | 372 | $ | 320 | $ | 329 | ||||||||||
| Ratio of expenses to average net assets: | ||||||||||||||||||||
| Before fees waived and expenses absorbed | 2.38 | % | 2.93 | % | 36.24 | % | 42.43 | % | 51.27 | % | ||||||||||
| After fees waived and expenses absorbed | 1.00 | % | 1.00 | % | 1.00 | % | 1.00 | % | 1.00 | % | ||||||||||
| Ratio of net investment income (loss) to average net assets: | ||||||||||||||||||||
| Before fees waived and expenses absorbed | 0.18 | % | (0.33 | )% | (33.57 | )% | (39.73 | )% | (48.91 | )% | ||||||||||
| After fees waived and expenses absorbed | 1.56 | % | 1.60 | % | 1.67 | % | 1.70 | % | 1.36 | % | ||||||||||
| Portfolio turnover rate | 15 | % | 30 | % | 22 | % | 11 | % | 18 | % | ||||||||||
| * | Commencement of operations. | |
1 | Based on average shares outstanding for the period. | |
2 | Total returns would have been lower had expenses not been waived or absorbed by the Advisor. Returns shown do not reflect the deduction of taxes that a shareholder would pay on Fund distributions or the redemption of Fund shares. |
See accompanying Notes to Financial Statements.
71
North Square Funds
NOTES TO FINANCIAL STATEMENTS
May 31, 2019
Note 1 – Organization
North Square Oak Ridge Small Cap Growth Fund (“Small Cap Growth” or “Small Cap Growth Fund”), North Square International Small Cap Fund (“International Small Cap” or “International Small Cap Fund”), North Square Dynamic Small Cap Fund (“Dynamic Small Cap” or “Dynamic Small Cap Fund”), North Square Oak Ridge Disciplined Growth Fund (“Disciplined Growth” or “Disciplined Growth Fund”), North square Multi Strategy Fund, (“Multi Strategy” or “Multi Strategy Fund”) and North Square Oak Ridge Dividend Growth Fund (“Dividend Growth” or “Dividend Growth Fund”) (each a “Fund” and collectively the “Funds”) are organized as a series of North Square Funds, a Delaware statutory trust (the “Trust”) which is registered as an open-end management investment company under the Investment Company Act of 1940, as amended (the “1940 Act”). The Small Cap Growth Fund, International Small Cap Fund, Dynamic Small Cap Fund, Disciplined Growth Fund, Multi Strategy Fund, and Dividend Growth Fund are diversified Funds.
The Small Cap Growth Fund’s primary investment objective is to seek capital appreciation. The Small Cap Growth Fund (the “Successor Fund”) acquired the assets and liabilities of the Pioneer Oak Ridge Small Cap Growth Fund (the “Predecessor Fund”) on October 17, 2014. With respect to Pioneer Oak Ridge Small Cap Growth Fund, Class A, B and R shareholders received Class A shares of the Successor Fund, Class C shareholders received Class C shares of the Successor Fund, Class K shareholders received Class K shares of the Successor Fund, and Class Y shareholders received Class Y shares of the Successor Fund. As a result of the reorganization, the Fund is the accounting successor of the Predecessor Fund and accordingly, certain financial history of the Predecessor Fund is included in these financial statements. The Small Cap Growth Fund’s fiscal year end was changed to May 31, as of December 1, 2014. Effective September 30, 2015, the Class Y shares were re-designated as Class I shares.
The International Small Cap Fund’s primary investment objective is to seek long-term capital appreciation. The Fund commenced investment operations on September 30, 2015 with Class I shares. The Class A shares commenced operations on December 1, 2015.
The Dynamic Small Cap Fund’s primary investment objective is to seek long-term capital appreciation. The Fund commenced investment operations on September 30, 2015 with Class I shares, prior to which its only activity was the receipt of a $100 investment from principals of the Fund’s advisor and a $519,981 transfer of shares of the Fund in exchange for the net assets of an account owned by Algert Global LLC, a Delaware limited liability company (the “Account”). This exchange was nontaxable, whereby the Dynamic Small Cap Fund issued 51,998 shares for the net assets of the Account on September 30, 2015. The Account with a fair value of $505,921 (identified cost of investments transferred were $527,537) and cash were the primary assets received by the Dynamic Small Cap Fund. For financial reporting purposes, assets received and shares issued by the Dynamic Small Cap Fund were recorded at fair value; however, the cost basis of the investments received from the Account was carried forward to align ongoing reporting of the Dynamic Small Cap Fund’s realized and unrealized gains and losses with amounts distributable to shareholders for tax purposes. The Class A shares commenced operations on December 1, 2015.
The Disciplined Growth Fund’s primary investment objective is to seek long-term growth of capital. The Fund commenced investment operations on July 29, 2016, with Class I shares. Class A shares had not yet commenced operations as of May 31, 2019.
The Multi Strategy Fund’s primary investment objective is to seek capital appreciation. The Multi Strategy Fund (the “Successor Fund”) acquired the assets and liabilities of the Pioneer Oak Ridge Large Cap Growth Fund (the “Predecessor Fund”) on October 17, 2014. With respect to Pioneer Oak Ridge Large Cap Growth Fund, Class A, B and R shareholders received Class A shares of the Successor Fund, Class C shareholders received Class C shares of the Successor Fund, and Class Y shareholders received Class Y shares of the Successor Fund. As a result of the reorganization, the Fund is the accounting successor of the Predecessor Fund and accordingly, certain financial history of the Predecessor Fund is included in these financial statements. The Multi Strategy Fund’s fiscal year end was changed to May 31, as of December 1, 2014. Effective September 30, 2015, the Class Y shares were re-designated as Class I shares. Effective July 18, 2017, the Large Cap Growth Fund changed its name to the Multi Strategy Fund.
The Dividend Growth Fund’s primary investment objective is to provide current income and to seek long-term capital appreciation. The Fund commenced investment operations on June 28, 2013, with two classes of shares, Class A and Class I.
The shares of each class represent an interest in the same portfolio of investments of the Fund and have equal rights as to voting, redemptions, dividends and liquidation, subject to the approval of the Trustees. Income, expenses (other than expenses attributable to a specific class) and realized and unrealized gains and losses on investments are allocated to each class of shares in proportion to their relative shares outstanding. Shareholders of a class that bears distribution and service expenses under the terms of a distribution plan have exclusive voting rights to that distribution plan.
Each Fund is an investment company and accordingly follows the investment company accounting and reporting guidance of the Financial Accounting Standards Board (FASB) Accounting Standard Codification Topic 946 “Financial Services—Investment Companies”.
72
North Square Funds
NOTES TO FINANCIAL STATEMENTS – Continued
May 31, 2019
Note 2 – Accounting Policies
The following is a summary of the significant accounting policies consistently followed by the Funds in the preparation of their financial statements. The preparation of financial statements in conformity with accounting principles generally accepted in the United States of America (“GAAP”) requires management to make estimates and assumptions that affect the reported amounts and disclosures in the financial statements. Actual results could differ from these estimates.
(a) Valuation of Investments
Each Fund values equity securities at the last reported sale price on the principal exchange or in the principal over the counter (“OTC”) market in which such securities are traded, as of the close of regular trading on the NYSE on the day the securities are being valued or, if the last-quoted sales price is not readily available, the securities will be valued at the last bid or the mean between the last available bid and ask price. Securities traded on the NASDAQ are valued at the NASDAQ Official Closing Price (“NOCP”). Investments in open-end investment companies are valued at the daily closing net asset value of the respective investment company. Debt securities are valued by utilizing a price supplied by independent pricing service providers. The independent pricing service providers may use various valuation methodologies including matrix pricing and other analytical pricing models as well as market transactions and dealer quotations. These models generally consider such factors as yields or prices of bonds of comparable quality, type of issue, coupon, maturity, ratings and general market conditions. If a price is not readily available for a portfolio security, the security will be valued at fair value (the amount which the Fund might reasonably expect to receive for the security upon its current sale) as determined in good faith by the Fund’s advisor, subject to review and approval by the Valuation Committee, pursuant to procedures adopted by the Board of Trustees. The actions of the Valuation Committee are subsequently reviewed by the Board at its next regularly scheduled board meeting. The Valuation Committee meets as needed. The Valuation Committee is comprised of all the Trustees, but action may be taken by any one of the Trustees.
Fair value pricing may be applied to foreign securities held by the Funds upon the occurrence of an event after the close of trading on non-U.S. markets but before the close of trading on the NYSE when each Fund’s NAV is determined. If the event may result in a material adjustment to the price of the Fund’s foreign securities once non-U.S. markets open on the following business day (such as, for example, a significant surge or decline in the U.S. market), the Fund may value such foreign securities at fair value, taking into account the effect of such event, in order to calculate the Fund’s NAV. Other types of portfolio securities that the Fund may fair value include, but are not limited to: (1) investments that are illiquid or traded infrequently, including “restricted” securities and private placements for which there is no public market; (2) investments for which, in the judgment of the Advisor, the market price is stale; (3) securities of an issuer that has entered into a restructuring; (4) securities for which trading has been halted or suspended; and (5) fixed income securities for which there is not a current market value quotation.
Foreign securities traded in countries outside the U.S. are fair valued by utilizing the quotations of an independent pricing service or from a brokerage firm. The pricing service or broker will use a statistical analyses and quantitative models to adjust local prices using factors such as subsequent movement and changes in the prices of indexes, securities and exchange rates in other markets in determining fair value as of the time the Fund calculates the NAVs. The Board reviews the independent third party fair valuation analysis report quarterly.
(b) Investment Transactions, Investment Income and Expenses
Investment transactions are accounted for on the trade date. Realized gains and losses on investments are determined on the identified cost basis. Dividend income is recorded net of applicable withholding taxes on the ex-dividend date and interest income is recorded on an accrual basis. Withholding taxes on foreign dividends, if applicable, are paid (a portion of which may be reclaimable) or provided for in accordance with the applicable country’s tax rules and rates and are disclosed in the Statements of Operations. Withholding tax reclaims are filed in certain countries to recover a portion of the amounts previously withheld. The Funds record a reclaim receivable based on a number of factors, including a jurisdiction’s legal obligation to pay reclaims as well as payment history and market convention. Discounts or premiums on debt securities are accreted or amortized to interest income over the lives of the respective securities using the effective interest method. Income and expenses of the Funds are allocated on a pro rata basis to each class of shares. Expenses incurred by the Trust with respect to more than one fund are allocated in proportion to the net assets of each fund except where allocation of direct expenses to each fund or an alternative allocation method can be more appropriately made. Expenses such as distribution and service fees pursuant to Rule 12b-1, transfer agent fees and expenses with respect to the Multi Strategy Fund and Small Cap Growth Fund, that are specific to individual share classes, are accrued directly to the respective share class. Transfer agent fees and expenses reported on the Statements of Operations for the Multi Strategy Fund and the Small Cap Growth Fund include payments to third parties for performing shareholder services to their customers.
73
North Square Funds
NOTES TO FINANCIAL STATEMENTS – Continued
May 31, 2019
(c) Federal Income Taxes
Each Fund intends to comply with the requirements of Subchapter M of the Internal Revenue Code applicable to regulated investment companies and to distribute substantially all of its net investment income and any net realized gains to its shareholders. Therefore, no provision is made for federal income or excise taxes. Due to the timing of dividend distributions and the differences in accounting for income and realized gains and losses for financial statement and federal income tax purposes, the fiscal year in which amounts are distributed may differ from the year in which the income and realized gains and losses are recorded by the Funds.
Accounting for Uncertainty in Income Taxes (the “Income Tax Statement”) requires an evaluation of tax positions taken (or expected to be taken) in the course of preparing a Fund’s tax returns to determine whether these positions meet a “more-likely-than-not” standard that, based on the technical merits, have a more than fifty percent likelihood of being sustained by a taxing authority upon examination. A tax position that meets the “more-likely-than-not” recognition threshold is measured to determine the amount of benefit to recognize in the financial statements. The Fund recognizes interest and penalties, if any, related to unrecognized tax benefits as income tax expense in the Statement of Operations.
The Income Tax Statement requires management of the Funds to analyze tax positions taken in the prior three open tax years, if any, and tax positions expected to be taken in the Funds’ current tax year, as defined by the IRS statute of limitations for all major jurisdictions, including federal tax authorities and certain state tax authorities. As of and during the open years ended May 31, 2016-2019 for the Small Cap Growth Fund, the Multi Strategy Fund, and the Dividend Growth Fund, and the open years ended May 31, 2016-2019 for the International Small Cap Fund, Dynamic Small Cap Fund, and the open years ended May 31, 2017-2019 for the Disciplined Growth Fund. The Funds did not have a liability for any unrecognized tax benefits. The Funds have no examination in progress and are not aware of any tax positions for which it is reasonably possible that the total amounts of unrecognized tax benefits will significantly change in the next twelve months.
(d) Distributions to Shareholders
The Dividend Growth Fund will make distributions of net investment income quarterly. The Small Cap Growth Fund, International Small Cap Fund, Dynamic Small Cap Fund, Disciplined Growth Fund, and Multi Strategy Fund will make distributions of net investment income, if any, at least annually. Each Fund makes distributions of its net capital gains, if any, at least annually. Distributions to shareholders are recorded on the ex-dividend date. The amount and timing of distributions are determined in accordance with federal income tax regulations, which may differ from GAAP.
The character of distributions made during the year from net investment income or net realized gains may differ from the characterization for federal income tax purposes due to differences in the recognition of income, expense and gain (loss) items for financial statement and tax purposes.
Note 3 – Reorganization Information
On September 30, 2014, beneficial owners of the Pioneer Oak Ridge Small Cap Growth Fund and Pioneer Oak Ridge Large Cap Growth Fund, each a series of Pioneer Series Trust I, a Delaware statutory trust (the “Pioneer Trust”), approved a proposed Agreement and Plan of Reorganization that provided for the reorganization into the Small Cap Growth Fund and Multi Strategy Fund, respectively, as detailed below. The Plan of Reorganization was approved by the Trust’s Board on May 20, 2014 and by the Pioneer Trust Board on May 27, 2014. This tax-free reorganization was accomplished on October 17, 2014 (the “Closing Date”), by exchanging the assets and liabilities of the Pioneer Oak Ridge Small Cap Growth Fund and Pioneer Oak Ridge Large Cap Growth Fund for shares of the Small Cap Growth Fund and Multi Strategy Fund, respectively. Class A, B and R shareholders received Class A shares of the corresponding Successor Fund. Class C, Class K and Class Y shareholders received Class C, Class K and Class Y shares of the corresponding Successor Fund, respectively. The table below contains details of the reorganization as of the Closing Date:
| Pioneer Oak Ridge | ||||||||||||||||
| Small Cap Growth Fund | Small Cap Growth Fund | |||||||||||||||
| Exchange per Class: | Shares | Amount | Shares | Amount | ||||||||||||
| Class A | 11,772,220 | $ | 441,977,460 | 11,933,693 | * | $ | 448,039,810 | * | ||||||||
| Class B | 77,777 | * | 2,609,869 | — | — | |||||||||||
| Class C | 2,930,895 | 91,501,958 | 2,930,895 | 91,501,958 | ||||||||||||
| Class K | 2,054,817 | 77,877,195 | 2,054,817 | 77,877,195 | ||||||||||||
| Class R | 92,409 | * | 3,452,481 | — | — | |||||||||||
| Class Y | 38,469,782 | 1,470,383,380 | 38,469,782 | 1,470,383,380 | ||||||||||||
| Net Assets | $ | 2,087,802,343 | $ | 2,087,802,343 | ||||||||||||
| * | Class B and Class R shares of the Pioneer Oak Ridge Small Cap Growth Fund were exchanged for 161,473 shares of Class A of the Small Cap Growth Fund (69,515 shares Class B and 91,958 shares Class R) (valued at $6,062,350). |
74
North Square Funds
NOTES TO FINANCIAL STATEMENTS – Continued
May 31, 2019
| Pioneer Oak Ridge | ||||||||||||||||
| Large Cap Growth Fund | Multi Strategy Fund | |||||||||||||||
| Exchange per Class: | Shares | Amount | Shares | Amount | ||||||||||||
| Class A | 2,479,758 | $ | 43,827,593 | 2,602,640 | * | $ | 45,999,411 | * | ||||||||
| Class B | 64,482 | * | 1,037,997 | — | — | |||||||||||
| Class C | 1,295,138 | 20,971,577 | 1,295,138 | 20,971,577 | ||||||||||||
| Class R | 66,641 | * | 1,133,821 | — | — | |||||||||||
| Class Y | 811,464 | 14,599,659 | 811,464 | 14,599,659 | ||||||||||||
| Net Assets | $ | 81,570,647 | $ | 81,570,647 | ||||||||||||
| * | Class B and Class R shares of the Pioneer Oak Ridge Large Cap Growth Fund were exchanged for 122,882 shares of Class A of the Multi Strategy Fund (58,730 shares Class B and 64,152 shares Class R) (valued at $2,171,818). |
The Pioneer Oak Ridge Small Cap Growth Fund and the Pioneer Oak Ridge Large Cap Growth Fund’s net assets on conversion date included $510,703,113 and $26,868,745 of unrealized appreciation and $152,508,507 and $14,290,543 of accumulated gain, respectively. The cost basis of the investments received from each Predecessor Fund was carried forward to align ongoing reporting of the Fund’s realized and unrealized gains and losses with amounts distributable to shareholders for tax purposes.
Note 4 – Investment Advisory and Other Agreements
The Trust, on behalf of the Funds, entered into an Investment Advisory Agreement (the “Agreement”) with North Square Investments, LLC (the “Advisor” or “NSI”). Under the terms of the Agreement, the Funds pay a monthly investment advisory fee to the Advisor based on each Fund’s average daily net assets. The annual and tiered rates are listed by Fund in the below table:
| Investment | |||
Advisory Fees | |||
| Small Cap Growth Fund | |||
| First $1 billion | 0.85% | ||
| Thereafter | 0.80% | ||
| International Small Cap Fund | 1.00% | ||
| Dynamic Small Cap Fund | 0.90% | ||
| Disciplined Growth Fund | 0.70% | ||
| Multi Strategy Fund | 0.00% – 0.50%1 | ||
| Dividend Growth Fund | 0.75% |
1 | The annual advisory fee is calculated as follows: (i) 0.00% for Fund assets invested in other series of the trust advised by the Advisor (“affiliated investments”) and (ii) 0.50% for Fund assets invested in non-affiliated investments. Prior to July 18, 2017, the advisory fees were 0.75% on the first $1 billion and 0.70% thereafter. |
In addition, the Advisor has voluntarily agreed to waive its advisory fee payable by the Small Cap Growth Fund equal to the amount of the advisory fee payable on the Fund’s assets invested in the International Small Cap Fund. For the year ended May 31, 2019, the amount of advisory fee waived is reported under “Affiliated fund fee waived” on the Statements of Operations.
The Advisor engages Algert Global LLC (the “Sub-Advisor”) to manage International Small Cap Fund and Dynamic Small Cap Fund and pays the Sub-Advisor from its advisory fees.
The Advisor has contractually agreed to waive its fee and, if necessary, to absorb other operating expenses to ensure that total annual operating expenses (excluding taxes, leverage interest, brokerage commissions, dividend and interest expenses on short sales, acquired fund fees and expenses as determined in accordance with Form N-1A, expenses incurred in connection with any merger or reorganization, or extraordinary expenses such as litigation expenses) are limited. The agreements are effective until the dates listed below and may be terminated before those dates only by the Trust’s Board of Trustees. The table below contains the agreement expiration and expense cap by Fund and by Class:
75
North Square Funds
NOTES TO FINANCIAL STATEMENTS – Continued
May 31, 2019
| Total Limit on Annual Operating Expenses | |||||
| Class A | Class C | Class I | Class K | ||
| Agreement Expires | Shares† | Shares† | Shares†* | Shares† | |
| Small Cap Growth Fund** | May 10, 2021 | 1.39% | 2.14% | 1.14% | 0.99% |
| International Small Cap Fund | May 10, 2029 | 1.50% | — | 1.25% | — |
| Dynamic Small Cap Fund | May 10, 2029 | 1.40% | — | 1.15% | — |
| Disciplined Growth Fund | May 10, 2029 | 1.20% | — | 0.95% | — |
| Multi Strategy Fund | May 10, 2029 | 1.20% | 2.10% | 1.17% | — |
| Dividend Growth Fund | May 10, 2029 | 1.25% | — | 1.00% | — |
| † | The total limit on annual operating expenses is calculated based on each Fund’s average daily net assets. | |
| * | Effective September 30, 2015, the Class Y shares of the Small Cap Growth Fund and Large Cap Growth Fund were re-designated as Class I shares. | |
| ** | The current expense information for Small Cap Growth Fund was effective October 5, 2017. Prior to October 5, 2017 the total limit on annual operating expenses for Class A, Class C, Class I, and Class K were 1.40%, 2.30%, 1.05%, and 0.92%, respectively. |
Each Fund’s advisor is permitted to seek reimbursement from the Fund, subject to certain limitations, of fees waived or payments made to the Fund for a period ending three full fiscal years after the date of the waiver or payment. The Multi Strategy Fund includes a maximum reimbursement of 0.20% per fiscal year. This reimbursement may be requested from the Fund if the reimbursement will not cause the Fund’s annual expense ratio to exceed the lesser of (a) the expense limitation amount in effect at the time such fees were waived or payments made, or (b) the expense limitation amount in effect at the time of the reimbursement. The Advisor may recapture all or a portion of this amount no later than the dates stated below:
| Small Cap Growth Fund | |||||
| Class A | Class C | Class I | Class K | Total | |
| May 31, 2020 | $117,780 | $ 1,897 | $506,751 | $17,598 | $644,026 |
| May 31, 2021 | $ 12,733 | $ — | $ — | $ — | $ 12,733 |
| May 31, 2022 | $101,259 | $13,006 | $ 84,760 | $22,186 | $221,211 |
| $231,772 | $14,903 | $591,511 | $39,784 | $877,970 | |
| Multi Strategy Fund | |||||
| Class A | Class C | Class I | Total | ||
| May 31, 2020 | $166,530 | $15,097 | $— | $181,627 | |
| International | Dynamic | Disciplined | Dividend | ||
| Small | Small | Growth | Growth | ||
| Cap Fund | Cap Fund | Fund | Fund | ||
| May 31, 2020 | $254,436 | $193,816 | $151,058 | $165,928 | |
| May 31, 2021 | $249,905 | $174,897 | $134,795 | $152,014 | |
| May 31, 2022 | $359,345 | $221,364 | $162,758 | $166,469 | |
| $863,686 | $590,077 | $448,611 | $484,411 | ||
Compass Distributors LLC serves as the Funds’ distributor; U.S. Bank Global Fund Services (“GFS”) serves as the Funds’ fund accountant, transfer agent and administrator. U.S. Bank, n.a., an affiliate of GFS, serves as the Funds’ custodian.
For the year ended May 31, 2019, GFS received transfer agent fees as follows:
| Transfer agent fees | |||
paid to GFS | |||
| Small Cap Growth Fund | $220,220 | ||
| International Small Cap Fund | $ 59,445 | ||
| Dynamic Small Cap Fund | $ 43,235 | ||
| Disciplined Growth Fund | $ 24,513 | ||
| Multi Strategy Fund | $ 78,625 | ||
| Dividend Growth Fund | $ 43,511 |
76
North Square Funds
NOTES TO FINANCIAL STATEMENTS – Continued
May 31, 2019
Cipperman Compliance Services provides Chief Compliance Officer (“CCO”) services to the Trust. The Funds’ allocated fees incurred for CCO services for the year ended May 31, 2019, are reported on the Statements of Operations.
For the year ended May 31, 2018, the Sub-Advisor reimbursed the International Small Cap Fund $41 for losses from a trade error. The amounts are reported on the Fund’s Statements of Operations, Statements of Changes, and Financial Highlights in Net Assets under the captions “Net increase from payment by affiliate” as well as “Net increase from reimbursement by affiliate for investment transaction loss”.
During the period ended May 31, 2016, the Sub-Advisor reimbursed the International Small Cap Fund $599 for losses from a trade error. In addition, an affiliate reimbursed the International Small Cap Fund $86,981 for losses on transactions and made related contributions to capital in the amounts of $3,779 and $3,516 to Class A and Class I shares, respectively. The amounts are reported on the Fund’s Financial Highlights under the caption “Net increase from reimbursement by affiliate for investment transaction loss”.
Note 5 – Federal Income Taxes
At May 31, 2019, gross unrealized appreciation and depreciation of investments, based on cost for federal income tax purposes were as follows:
| Small Cap | International | Dynamic | ||||||||||
| Growth Fund | Small Cap Fund | Small Cap Fund | ||||||||||
| Cost of investments | $ | 159,014,567 | $ | 46,998,370 | $ | 21,115,672 | ||||||
| Gross unrealized appreciation | $ | 59,636,120 | $ | 3,755,193 | $ | 1,321,872 | ||||||
| Gross unrealized depreciation | (14,049,312 | ) | (5,635,502 | ) | (1,733,253 | ) | ||||||
| Net unrealized appreciation on investments | $ | 45,586,808 | $ | (1,880,309 | ) | $ | (411,381 | ) | ||||
| Disciplined | Multi Strategy | Dividend | ||||||||||
| Growth Fund | Fund | Growth Fund | ||||||||||
| Cost of investments | $ | 11,051,919 | $ | 54,798,150 | $ | 11,298,071 | ||||||
| Gross unrealized appreciation | $ | 3,037,553 | $ | 3,807,370 | $ | 2,100,961 | ||||||
| Gross unrealized depreciation | (246,892 | ) | (2,614,821 | ) | (456,498 | ) | ||||||
| Net unrealized appreciation on investments | $ | 2,790,661 | $ | 1,192,549 | $ | 1,644,463 | ||||||
The difference between cost amounts for financial statement and federal income tax purposes is due primarily to timing differences in recognizing certain gains and losses in security transactions.
GAAP requires that certain components of net assets be reclassified between financial and tax reporting. These reclassifications have no effect on net assets or net asset value per share. For the year ended May 31, 2019, permanent differences in book and tax accounting have been reclassified to paid in capital, accumulated net investment income/loss and accumulated net realized gain/loss as follows:
| Increase (Decrease) | ||||||||
| Total | ||||||||
| Distributable | ||||||||
| Paid In Capital | Earnings | |||||||
| Small Cap Growth Fund | $ | (601,564 | ) | $ | 601,564 | |||
| International Small Cap Fund | $ | 4,344 | $ | (4,344 | ) | |||
| Dynamic Small Cap Fund | $ | — | $ | — | ||||
| Disciplined Growth Fund | $ | (5,931 | ) | $ | 5,931 | |||
| Multi Strategy Fund | $ | 4,217,602 | $ | (4,217,602 | ) | |||
| Dividend Growth Fund | $ | — | $ | — | ||||
77
North Square Funds
NOTES TO FINANCIAL STATEMENTS – Continued
May 31, 2019
As of May 31, 2019, the components of accumulated earnings (deficit) on a tax basis for the Funds were as follows:
| Small Cap | International | Dynamic | ||||||||||
| Growth Fund | Small Cap Fund | Small Cap Fund | ||||||||||
| Undistributed ordinary income | $ | — | $ | 392,577 | $ | — | ||||||
| Undistributed long-term gains | $ | 36,145,135 | $ | — | $ | — | ||||||
| Accumulated earnings | $ | 36,145,135 | $ | 392,577 | $ | — | ||||||
| Accumulated capital and other losses | $ | (866,925 | ) | $ | (14,628,522 | ) | $ | (507,663 | ) | |||
| Unrealized appreciation on investments | $ | 45,586,808 | $ | (1,880,309 | ) | $ | (411,381 | ) | ||||
| Unrealized depreciation on foreign currency | $ | — | $ | 2,397 | $ | — | ||||||
| Total accumulated earnings | $ | 80,865,018 | $ | (16,113,857 | ) | $ | (919,044 | ) | ||||
| Disciplined | Multi Strategy | Dividend | ||||||||||
| Growth Fund | Fund | Growth Fund | ||||||||||
| Undistributed ordinary income | $ | — | $ | 3,328,765 | $ | 13,915 | ||||||
| Undistributed long-term gains | $ | 233,451 | $ | 1,201,593 | $ | — | ||||||
| Accumulated earnings | $ | 233,451 | $ | 4,530,358 | $ | 13,915 | ||||||
| Accumulated capital and other losses | $ | (3,436 | ) | $ | — | $ | (13,875 | ) | ||||
| Unrealized appreciation on investments | $ | 2,790,661 | $ | 1,192,549 | $ | 1,644,463 | ||||||
| Unrealized depreciation on foreign currency | $ | — | $ | — | $ | — | ||||||
| Total accumulated earnings | $ | 3,020,676 | $ | 5,722,907 | $ | 1,644,503 | ||||||
The tax character of distributions paid during the fiscal years ended May 31, 2019 and May 31, 2018 were as follows:
| Small Cap | International | Dynamic | ||||||||||||||||||||||
| Growth Fund | Small Cap Fund | Small Cap Fund | ||||||||||||||||||||||
| Distributions paid from: | 2019 | 2018 | 2019 | 2018 | 2019 | 2018 | ||||||||||||||||||
| Ordinary income | $ | 2,696 | $ | — | $ | 2,153,919 | $ | 3,449,802 | $ | 3,574,258 | $ | 79,341 | ||||||||||||
| Net long-term capital gains | 43,269,565 | 349,359,284 | 2,317,858 | 4,111,471 | 473,119 | 8,279 | ||||||||||||||||||
| Total distributions paid | $ | 43,273,261 | $ | 349,359,284 | $ | 4,471,777 | $ | 7,561,273 | $ | 4,047,377 | $ | 87,620 | ||||||||||||
| Disciplined | Multi Strategy | Dividend | ||||||||||||||||||||||
| Growth Fund | Fund | Growth Fund | ||||||||||||||||||||||
| Distributions paid from: | 2019 | 2018 | 2019 | 2018 | 2019 | 2018 | ||||||||||||||||||
| Ordinary income | $ | — | $ | 120 | $ | — | $ | — | $ | 307,986 | $ | 91,043 | ||||||||||||
| Net long-term capital gains | 124,163 | — | 22,347,312 | — | 56,146 | 3,644 | ||||||||||||||||||
| Total distributions paid | $ | 124,163 | $ | 120 | $ | 22,347,312 | $ | — | $ | 364,132 | $ | 94,687 | ||||||||||||
As of May 31, 2019, the Funds had accumulated capital loss carryforwards as follows:
| Small Cap | International | Dynamic | ||||||||||
| Growth Fund | Small Cap Fund | Small Cap Fund | ||||||||||
| Not Subject to Expiration | $ | — | $ | — | $ | — | ||||||
| Short-Term | — | (14,624,493 | ) | — | ||||||||
| $ | — | $ | (14,624,493 | ) | $ | — | ||||||
| Disciplined | Multi Strategy | Dividend | ||||||||||
| Growth Fund | Fund | Growth Fund | ||||||||||
| Not Subject to Expiration | $ | — | $ | — | $ | — | ||||||
| Short-Term | — | — | — | |||||||||
| $ | — | $ | — | $ | — | |||||||
78
North Square Funds
NOTES TO FINANCIAL STATEMENTS – Continued
May 31, 2019
To the extent that a Fund may realize future net capital gains, those gains will be offset by any of its unused capital loss carryforward. Future capital loss carryover utilization in any given year may be subject to Internal Revenue Code limitations. During the year ended May 31, 2019, the Disciplined Growth Fund utilized $6,655 of short-term non-expiring capital loss carryforward.
As of May 31, 2019, the Funds had the following qualified late-year ordinary losses which are deferred until fiscal year 2020 for tax purposes. Net late-year losses incurred after December 31, and within the taxable year are deemed to arise on the first day of the Fund’s next taxable year.
| Late Year Losses | Post October Losses | ||||||||
| Small Cap Growth Fund | $ | (866,925 | ) | $ | — | ||||
| Dynamic Small Cap Fund | $ | — | $ | (507,663 | ) | ||||
| Disciplined Growth Fund | $ | (3,436 | ) | $ | — | ||||
| Dividend Growth Fund | $ | — | $ | (13,875 | ) | ||||
Note 6 – Investment Transactions
For the year ended May 31, 2019, purchases and sales of investments were as follows:
| Purchases | Sales | ||||||||
| Small Cap Growth Fund | $ | 84,686,268 | $ | 266,941,597 | |||||
| International Small Cap Fund | $ | 154,453,936 | $ | 209,851,445 | |||||
| Dynamic Small Cap Fund | $ | 33,461,020 | $ | 38,711,704 | |||||
| Disciplined Growth Fund | $ | 2,581,007 | $ | 4,081,303 | |||||
| Multi Strategy Fund | $ | 10,758,315 | $ | 14,530,000 | |||||
| Dividend Growth Fund | $ | 4,234,403 | $ | 1,812,138 | |||||
Note 7 – Shareholder Servicing Plan
The Trust, on behalf of the International Small Cap Fund, Dynamic Small Cap Fund, Disciplined Growth Fund and Dividend Growth Fund, has adopted a Shareholder Servicing Plan to pay a fee at an annual rate of up to 0.15% of each Fund’s average daily net assets of shares serviced by shareholder servicing agents who provide administrative and support services to their customers. There is no Shareholder Servicing Plan for the Small Cap Growth Fund and Multi Strategy Fund.
For the year ended May 31, 2019, for the International Small Cap Fund, Dynamic Small Cap Fund, Disciplined Growth Fund and Dividend Growth Fund, shareholder servicing fees incurred are disclosed on the Statements of Operations.
Note 8 – Distribution Plan
The Trust, on behalf of each Fund, has adopted a Distribution Plan (the “Plan”) pursuant to Rule 12b-1 under the 1940 Act that allows each Fund to pay distribution fees for the sale and distribution of its Class A and Class C shares. The Plan provides for the payment of distribution fees at the annual rate of up to 0.25% of each Fund’s average daily net assets attributable to Class A shares and 1.00% of average daily net assets attributable to Class C shares.
For the year ended May 31, 2019, distribution fees incurred with respect to Class A and Class C shares are disclosed on the Statements of Operations.
Note 9 – Indemnifications
In the normal course of business, the Funds enter into contracts that contain a variety of representations which provide general indemnifications. The Funds’ maximum exposure under these arrangements is unknown, as this would involve future claims that may be made against the Funds that have not yet occurred. However, the Funds expect the risk of loss to be remote.
Note 10 – Fair Value Measurements and Disclosure
Fair Value Measurements and Disclosures defines fair value, establishes a framework for measuring fair value in accordance with GAAP, and expands disclosure about fair value measurements. It also provides guidance on determining when there has been a significant decrease in the volume and level of activity for an asset or a liability, when a transaction is not orderly, and how that information must be incorporated into a fair value measurement.
79
North Square Funds
NOTES TO FINANCIAL STATEMENTS – Continued
May 31, 2019
Under Fair Value Measurements and Disclosures, various inputs are used in determining the value of the Funds’ investments. These inputs are summarized into three broad Levels as described below:
| • | Level 1 – Unadjusted quoted prices in active markets for identical assets or liabilities that the Fund has the ability to access. | |
| • | Level 2 – Observable inputs other than quoted prices included in Level 1 that are observable for the asset or liability, either directly or indirectly. These inputs may include quoted prices for the identical instrument on an inactive market, prices for similar instruments, interest rates, prepayment speeds, credit risk, yield curves, default rates and similar data. | |
| • | Level 3 – Unobservable inputs for the asset or liability, to the extent relevant observable inputs are not available, representing the Fund’s own assumptions about the assumptions a market participant would use in valuing the asset or liability, and would be based on the best information available. |
The availability of observable inputs can vary from security to security and is affected by a wide variety of factors, including for example, the type of security, whether the security is new and not yet established in the marketplace, the liquidity of markets, and other characteristics particular to the security. To the extent that valuation is based on models or inputs that are less observable or unobservable in the market, the determination of fair value requires more judgment. Accordingly, the degree of judgment exercised in determining fair value is greatest for instruments categorized in Level 3.
The inputs to measure fair value may fall into different Levels of the fair value hierarchy. In such cases, for disclosure purposes, the Level in the fair value hierarchy within which the fair value measurement falls in its entirety, is determined based on the lowest Level input that is significant to the fair value measurement in its entirety.
The inputs or methodology used for valuing securities are not an indication of the risk associated with investing in those securities. The following is a summary of the inputs used, as of May 31, 2019, in valuing the Funds’ assets carried at fair value:
| Small Cap Growth Fund | Level 1 | Level 2* | Level 3** | Total | ||||||||||||
| Investments | ||||||||||||||||
Common Stocks1 | $ | 192,626,143 | $ | — | $ | — | $ | 192,626,143 | ||||||||
| REIT | 3,030,573 | — | — | 3,030,573 | ||||||||||||
| Short-Term Investment | 8,944,659 | — | — | 8,944,659 | ||||||||||||
| Total | $ | 204,601,375 | $ | — | $ | — | $ | 204,601,375 | ||||||||
1 | All common stocks held in the Fund are Level 1 securities. For a detailed break-out of common stocks by major industry classification, please refer to the Schedule of Investments. | |
| * | The Funds did not hold any Level 2 securities at period end. | |
| ** | The Funds did not hold any Level 3 securities at period end. |
80
North Square Funds
NOTES TO FINANCIAL STATEMENTS – Continued
May 31, 2019
| International Small Cap Fund | Level 1 | Level 2* | Level 3 | Total | ||||||||||||
| Investments | ||||||||||||||||
Common Stocks1 | ||||||||||||||||
| Australia | $ | 2,784,499 | $ | — | $ | — | $ | 2,784,499 | ||||||||
| Austria | 364,506 | — | — | 364,506 | ||||||||||||
| Belgium | 512,389 | — | — | 512,389 | ||||||||||||
| Bermuda | 27,361 | — | — | 27,361 | ||||||||||||
| China | 138,727 | — | — | 138,727 | ||||||||||||
| Denmark | 1,655,305 | — | — | 1,655,305 | ||||||||||||
| Finland | 732,712 | — | — | 732,712 | ||||||||||||
| France | 88,499 | — | — | 88,499 | ||||||||||||
| Germany | 2,791,721 | — | — | 2,791,721 | ||||||||||||
| Hong Kong | 1,512,924 | — | — | 1,512,924 | ||||||||||||
| Italy | 1,699,857 | — | — | 1,699,857 | ||||||||||||
| Japan | 14,384,935 | — | — | 14,384,935 | ||||||||||||
| Jersey | 1,554,796 | — | — | 1,554,796 | ||||||||||||
| Luxembourg | 314,014 | — | — | 314,014 | ||||||||||||
| Netherlands | 1,146,467 | — | — | 1,146,467 | ||||||||||||
| Norway | 1,045,894 | — | — | 1,045,894 | ||||||||||||
| Portugal | 413,982 | — | — | 413,982 | ||||||||||||
| Singapore | 561,378 | — | 68,609 | 629,987 | ||||||||||||
| Spain | 653,815 | — | — | 653,815 | ||||||||||||
| Sweden | 2,476,928 | — | — | 2,476,928 | ||||||||||||
| Switzerland | 897,348 | — | — | 897,348 | ||||||||||||
| United Kingdom | 8,238,333 | — | — | 8,238,333 | ||||||||||||
| Preferred Stock | ||||||||||||||||
| Germany | 180,632 | — | — | 180,632 | ||||||||||||
| REIT | ||||||||||||||||
| Germany | 137,911 | — | — | 137,911 | ||||||||||||
| Exchange Traded Fund | 380,400 | — | — | 380,400 | ||||||||||||
| Short-Term Investment | 354,119 | — | — | 354,119 | ||||||||||||
| Total | $ | 45,049,452 | $ | — | $ | 68,609 | $ | 45,118,061 | ||||||||
| Dynamic Small Cap Fund | Level 1 | Level 2* | Level 3 | Total | ||||||||||||
| Investments | ||||||||||||||||
Common Stocks1 | $ | 18,499,709 | $ | — | $ | — | $ | 18,499,709 | ||||||||
| REITs | 2,064,865 | — | — | 2,064,865 | ||||||||||||
| Rights | — | — | 5,703 | 5,703 | ||||||||||||
| Short-Term Investment | 134,014 | — | — | 134,014 | ||||||||||||
| Total | $ | 20,698,588 | $ | — | $ | 5,703 | $ | 20,704,291 | ||||||||
| Disciplined Growth Fund | Level 1 | Level 2* | Level 3** | Total | ||||||||||||
| Investments | ||||||||||||||||
Common Stocks1 | $ | 13,041,270 | $ | — | $ | — | $ | 13,041,270 | ||||||||
| Short-Term Investment | 801,310 | — | — | 801,310 | ||||||||||||
| Total | $ | 13,842,580 | $ | — | $ | — | $ | 13,842,580 | ||||||||
1 | All common stocks held in the Fund are Level 1 securities. For a detailed break-out of common stocks by major industry classification, please refer to the Schedule of Investments. | |
| * | The Funds did not hold any Level 2 securities at period end. | |
| ** | The Funds did not hold any Level 3 securities at period end. |
81
North Square Funds
NOTES TO FINANCIAL STATEMENTS – Continued
May 31, 2019
| Multi Strategy Fund | Level 1 | Level 2* | Level 3** | Total | ||||||||||||
| Investments | ||||||||||||||||
| Mutual Funds | $ | 54,872,633 | $ | — | $ | — | $ | 54,872,633 | ||||||||
| Short-Term Investment | 1,118,066 | — | — | 1,118,066 | ||||||||||||
| Total | $ | 55,990,699 | $ | — | $ | — | $ | 55,990,699 | ||||||||
| Dividend Growth Fund | Level 1 | Level 2* | Level 3** | Total | ||||||||||||
| Investments | ||||||||||||||||
Common Stocks1 | $ | 12,400,806 | $ | — | $ | — | $ | 12,400,806 | ||||||||
| Short-Term Investment | 541,728 | — | — | 541,728 | ||||||||||||
| Total | $ | 12,942,534 | $ | — | $ | — | $ | 12,942,534 | ||||||||
1 | All common stocks held in the Fund are Level 1 securities. For a detailed break-out of common stocks by major industry classification, please refer to the Schedule of Investments. | |
| * | The Funds did not hold any Level 2 securities at period end. | |
| ** | The Funds did not hold any Level 3 securities at period end. |
Transfers between Levels 1, 2 or 3 are recognized at the end of the reporting period. Transfers between Level 1 and Level 2 relate to the use of systematic fair valuation. When systematic fair valuation is used, securities whose primary market closes before the NYSE are classified as Level 2. The following is a reconciliation of transfers between Levels for the Funds from May 31, 2018 to May 31, 2019, represented by recognizing the May 31, 2019 market value of securities:
| International Small Cap Fund | ||||
| Transfers into Level 1 | $ | 364,506 | ||
| Transfers out of Level 1 | $ | — | ||
| Net transfers in (out) of Level 1 | $ | 364,506 | ||
| Transfers into Level 2 | $ | — | ||
| Transfers out of Level 2 | $ | (364,506 | ) | |
| Net transfers in (out) of Level 2 | $ | (364,506 | ) | |
The following is a reconciliation of assets in which significant unobservable inputs (Level 3) were used in determining value:
| International Small Cap Fund | ||||
| Beginning balance May 31, 2018 | — | |||
| Transfers into Level 3 during the period | — | |||
| Transfers out of Level 3 during the period | — | |||
| Total realized gain/(loss) | — | |||
| Total unrealized appreciation/(depreciation) | $ | (69,227 | ) | |
| Net purchases | 137,836 | |||
| Net sales | — | |||
| Balance as of May 31, 2019 | $ | 68,609 | ||
82
North Square Funds
NOTES TO FINANCIAL STATEMENTS – Continued
May 31, 2019
| Dynamic Small Cap Fund | ||||
| Beginning balance May 31, 2018 | $ | 7,524 | ||
| Transfers into Level 3 during the period | — | |||
| Transfers out of Level 3 during the period | — | |||
| Total realized gain/(loss) | — | |||
| Total unrealized appreciation/(depreciation) | $ | (1,821 | ) | |
| Net purchases | — | |||
| Net sales | — | |||
| Balance as of May 31, 2019 | $ | 5,703 | ||
| Impact to | |||||
| Valuation from | |||||
| Fair Value | Valuation | Unobservable | Input | an increase | |
| May 31, 2019 | Methodologies | Input(1) | Range/Value | in Input(2) | |
| International | Adjusted by management | ||||
| Small Cap Fund – | Fair Value | to reflect | |||
| Common Stock | $68,609 | Pricing | current conditions | — | Increase |
| Dynamic | Adjusted by management | ||||
| Small Cap Fund – | Fair Value | to reflect | |||
| Rights | $ 5,703 | Pricing | current conditions | — | Increase |
(1) | The investment advisor considers relevant indications of value that are reasonably and timely available to it in determining the fair value to be assigned to a particular security, such as the type and cost of the security; contractual or legal restrictions on resale of the security; relevant financial or business developments of the issuer; actively traded related securities; conversion or exchange rights on the security; related corporate actions; significant events occurring after the close of trading in the security; and changes in overall market conditions. The Fund’s use of fair value pricing may cause the net asset value of Fund shares to differ from the net asset value that would be calculated using market quotations. Fair value pricing involves subjective judgments and it is possible that the fair value determined for a security may be materially different than the value that could be realized upon the sale of that security. |
(2) | This column represents the directional change in the fair value of the Level 3 investments that would result from an increase to the corresponding unobservable input. A decrease to the unobservable input would have the opposite effect. |
Note 11 – Investments in Affiliated Issuers
An affiliated issuer is an entity in which the Fund has ownership of at least 5% of the voting securities or any investment in an Oak Ridge Fund. Issuers that are affiliates of the Fund at period-end are noted in the Fund’s Schedule of Investments. Additional security purchases and the reduction of certain securities shares outstanding of existing portfolio holdings that were not considered affiliated in prior years may result in the Fund owning in excess of 5% of the outstanding shares at period-end. The table below reflects transactions during the period with entities that are affiliates as of May 31, 2019 and may include acquisitions of new investments, prior year holdings that became affiliated during the period and prior period affiliated holdings that are no longer affiliated as of period-end.
| Small Cap Growth Fund | ||||||||
| Change in | ||||||||
| Value | Net | Unrealized | Capital | |||||
| Beginning | Sales | Realized | Appreciation | Value End | Dividend | Gain | ||
| Fund/Security Description | of Period | Purchases | Proceeds | Gain (Loss) | (Depreciation) | of Period | Income | Distributions |
| North Square International | ||||||||
| Small Cap Fund – Class I | $4,714,121 | $98,987 | $(4,033,658) | $(36,232) | $(743,218) | $— | $18,257 | $80,730 |
| Shares | Shares | |||||||
| Beginning | End | |||||||
| Fund/Security Description | of Period | Purchases | Sales | of Period | ||||
| North Square International | ||||||||
| Small Cap Fund – Class I | 307,607 | 10,475 | (318,082) | — | ||||
83
North Square Funds
NOTES TO FINANCIAL STATEMENTS – Continued
May 31, 2019
| Multi Strategy Fund | ||||||||||||||||||||||||||||||||
| Change in | ||||||||||||||||||||||||||||||||
| Value | Net | Unrealized | Capital | |||||||||||||||||||||||||||||
| Beginning | Sales | Realized | Appreciation | Value End | Dividend | Gain | ||||||||||||||||||||||||||
| Fund/Security Description | of Period | Purchases | Proceeds | Gain (Loss) | (Depreciation) | of Period | Income | Distributions | ||||||||||||||||||||||||
| North Square Dynamic | ||||||||||||||||||||||||||||||||
| Small Cap Fund – Class I | $ | 26,855,297 | $ | 3,801,875 | $ | (5,250,000 | ) | $ | (30,201 | ) | $ | (5,912,607 | ) | $ | 19,464,364 | $ | — | $ | 3,801,875 | |||||||||||||
| North Square Global | ||||||||||||||||||||||||||||||||
| Resources & Infrastructure | ||||||||||||||||||||||||||||||||
| Fund – Class I | 12,227,212 | 178,654 | (5,150,000 | ) | (22,899 | ) | (2,270,112 | ) | 4,962,855 | 145,194 | 33,460 | |||||||||||||||||||||
| North Square International | ||||||||||||||||||||||||||||||||
| Small Cap Fund – Class I | 3,450,847 | 237,812 | (575,000 | ) | (203,780 | ) | (629,795 | ) | 2,280,084 | 43,861 | 193,951 | |||||||||||||||||||||
| North Square Oak Ridge | ||||||||||||||||||||||||||||||||
| Disciplined Growth Fund – | ||||||||||||||||||||||||||||||||
| Class I | 13,977,674 | 2,011,673 | (3,155,000 | ) | 436,572 | 218,930 | 13,489,849 | — | 121,673 | |||||||||||||||||||||||
| North Square Oak Ridge | ||||||||||||||||||||||||||||||||
| Dividend Growth Fund – | ||||||||||||||||||||||||||||||||
| Class I | 9,601,977 | 1,929,892 | (400,000 | ) | 32,191 | 383,769 | 11,547,829 | 169,869 | 160,024 | |||||||||||||||||||||||
| $ | 211,883 | $ | (8,209,815 | ) | $ | 51,744,981 | $ | 358,924 | $ | 4,310,982 | ||||||||||||||||||||||
| Shares | Shares | |||||||||||||||||||||||||||||||
| Beginning | End | |||||||||||||||||||||||||||||||
| Fund/Security Description | of Period | Purchases | Sales | of Period | ||||||||||||||||||||||||||||
| North Square Dynamic | ||||||||||||||||||||||||||||||||
| Small Cap Fund – Class I | 1,773,798 | 335,558 | (423,093 | ) | 1,686,263 | |||||||||||||||||||||||||||
| North Square Global | ||||||||||||||||||||||||||||||||
| Resources & Infrastructure | ||||||||||||||||||||||||||||||||
| Fund – Class I | 922,808 | 16,759 | (460,222 | ) | 479,345 | |||||||||||||||||||||||||||
| North Square International | ||||||||||||||||||||||||||||||||
| Small Cap Fund – Class I | 271,293 | 25,165 | (59,952 | ) | 236,506 | |||||||||||||||||||||||||||
| North Square Oak Ridge | ||||||||||||||||||||||||||||||||
| Disciplined Growth Fund – | ||||||||||||||||||||||||||||||||
| Class I | 1,062,133 | 148,333 | (242,716 | ) | 967,750 | |||||||||||||||||||||||||||
| North Square Oak Ridge | ||||||||||||||||||||||||||||||||
| Dividend Growth Fund – | ||||||||||||||||||||||||||||||||
| Class I | 613,545 | 123,113 | (26,127 | ) | 710,531 | |||||||||||||||||||||||||||
| 4,080,395 | ||||||||||||||||||||||||||||||||
Note 12 – Events Subsequent to the Fiscal Period End
The Funds have adopted financial reporting rules regarding subsequent events which require an entity to recognize in the financial statements the effects of all subsequent events that provide additional evidence about conditions that existed at the date of the balance sheet. Management has evaluated the Funds’ related events and transactions that occurred through the date of issuance of the Funds’ financial statements.
There were no events or transactions that occurred during this period that materially impacted the amounts or disclosures in the Funds’ financial statements.
84
REPORT OF INDEPENDENT REGISTERED PUBLIC ACCOUNTING FIRM
To the Board of Trustees and Shareholders of North Square Investments Trust
Opinion on the Financial Statements
We have audited the accompanying statements of assets and liabilities of the North Square Oak Ridge Small Cap Growth Fund, North Square International Small Cap Fund, North Square Dynamic Small Cap Fund, North Square Oak Ridge Disciplined Growth Fund, North Square Multi Strategy Fund, and North Square Oak Ridge Dividend Growth Fund (the “Funds”), each a series of North Square Investments Trust (the “Trust”), including the schedules of investments, as of May 31, 2019, the related statements of operations for the year then ended, the statements of changes in net assets for each of the two years in the period then ended, and with respect to the North Square Oak Ridge Small Cap Growth Fund and North Square Multi Strategy Fund, the financial highlights for each of the four years in the period then ended, and for the six month period ended May 31, 2015 and the year ended November 30, 2014, with respect to the North Square Oak Ridge Dividend Growth Fund, the financial highlights for each of the five years in the period then ended, with respect to the North Square International Small Cap Fund and North Square Dynamic Small Cap Fund, the financial highlights for each of the three years in the period then ended and for the period September 30, 2015 (commencement of operations) to May 31, 2016, with respect to North Square Oak Ridge Disciplined Growth Fund, the financial highlights for each of the two years in the period then ended and for the period July 29, 2016 (commencement of operations) to May 31, 2017, and the related notes (collectively referred to as the “financial statements”). In our opinion, the financial statements and financial highlights referred to above present fairly, in all material respects, the financial position of the North Square Oak Ridge Small Cap Growth Fund, North Square International Small Cap Fund, North Square Dynamic Small Cap Fund, North Square Oak Ridge Disciplined Growth Fund, North Square Multi Strategy Fund, and North Square Oak Ridge Dividend Growth Fund as of May 31, 2019, and the results of their operations, the changes in their net assets, and their financial highlights for the periods referred to above, in conformity with accounting principles generally accepted in the United States of America.
Basis for Opinion
These financial statements are the responsibility of the Funds’ management. Our responsibility is to express an opinion on the Funds’ financial statements based on our audits. We are a public accounting firm registered with the Public Company Accounting Oversight Board (United States) (“PCAOB”) and are required to be independent with respect to the Funds in accordance with the U.S. federal securities laws and the applicable rules and regulations of the Securities and Exchange Commission and the PCAOB. We have served as the auditor of one or more of the funds in the Trust since 2007.
We conducted our audits in accordance with the standards of the PCAOB. Those standards require that we plan and perform the audits to obtain reasonable assurance about whether the financial statements are free of material misstatement, whether due to error or fraud. The Funds are not required to have, nor were we engaged to perform, an audit of the Funds’ internal control over financial reporting. As part of our audits we are required to obtain an understanding of internal control over financial reporting, but not for the purpose of expressing an opinion on the effectiveness of the Funds’ internal control over financial reporting. Accordingly, we express no such opinion.
Our audits included performing procedures to assess the risks of material misstatement of the financial statements, whether due to error or fraud, and performing procedures that respond to those risks. Such procedures included examining, on a test basis, evidence regarding the amounts and disclosures in the financial statements. Our audits also included evaluating the accounting principles used and significant estimates made by management, as well as evaluating the overall presentation of the financial statements. Our procedures included confirmation of securities owned as of May 31, 2019 by correspondence with the custodian and brokers or by other appropriate auditing procedures where replies from broker were not received. We believe that our audits provide a reasonable basis for our opinion.
TAIT, WELLER & BAKER LLP
Philadelphia, Pennsylvania
July 30, 2019
85
North Square Funds
SUPPLEMENTAL INFORMATION (Unaudited)
Board Consideration of Investment Management and Sub-Advisory Agreements
Section 15(c) of the Investment Company Act of 1940, as amended (the “1940 Act”), requires that each mutual fund's board of trustees, including a majority of those trustees who are not “interested persons” of the fund, as defined in the 1940 Act (the “Independent Trustees”), initially approve, and annually review and consider the continuation of, the fund's investment advisory and sub-advisory agreements. At its organizational meeting held on August 24, 2018 (the “Organizational Meeting”), the Board of Trustees (the “Board”) of North Square Investments Trust (the “Trust”), including each of the Independent Trustees, unanimously voted to approve for an initial two-year period: (i) a proposed investment management agreement (the “Management Agreement”) between North Square Investments, LLC (the “Adviser”) and the Trust, on behalf of each of its series (each, a “Fund” and collectively, the “Funds”); (ii) a proposed investment sub-advisory agreement between the Adviser and Oak Ridge Investments, LLC (“Oak Ridge Investments”), with respect to North Square Oak Ridge Small Cap Growth Fund, North Square Oak Ridge Disciplined Growth Fund, North Square Oak Ridge Dividend Growth Fund and North Square Multi Strategy Fund; and (iii) a proposed investment sub-advisory agreement between the Adviser and Algert Global LLC (“Algert Global” and together with Oak Ridge Investments, the “Sub-Advisers”), with respect to North Square International Small Cap Fund and North Square Dynamic Small Cap Fund. The Adviser and the Sub-Advisers are collectively referred to as the “Advisers.” The investment sub-advisory agreements with the Sub-Advisers are collectively referred to as the “Sub-Advisory Agreements,” and the Management Agreement and the Sub-Advisory Agreements are collectively referred to as the “Agreements.”
Each Fund is a newly-organized investment portfolio of the Trust and successor to corresponding series of Investment Managers Series Trust (each, a “Predecessor Fund” and collectively, the “Predecessor Funds”). On May 10, 2019, each Fund will acquire the assets and liabilities of its corresponding Predecessor Fund through a reorganization (each, a “Reorganization” and collectively, the “Reorganizations”). As a result of the Reorganizations, each Fund adopted the performance and financial history of its corresponding Predecessor Fund. In addition, North Square Investments replaced Oak Ridge Investments as the investment adviser to each Predecessor Fund, Oak Ridge Investments assumed a sub-adviser role for the Funds that correspond to the Predecessor Funds for which Oak Ridge Investments acted as the sole investment adviser, and Algert Global continued to serve as the sub-adviser to the Funds that correspond to the Predecessor Funds for which Algert Global served as a sub-adviser. Each Fund has the same portfolio management team and contractual management fee and sub-advisory fee (as applicable) as those of its corresponding Predecessor Fund. The terms and conditions of the Management Agreement are materially the same as those of the investment advisory agreement (the “Predecessor Advisory Agreement”) between Investment Managers Series Trust, on behalf of each Predecessor Fund, and Oak Ridge Investments. Similarly, the terms and conditions of the Sub-Advisory Agreements are materially the same as those of the sub-advisory agreements (the “Predecessor Sub-Advisory Agreements” and together with the Predecessor Advisory Agreement the “Predecessor Agreements”) between Oak Ridge Investments and Algert Global, with respect to the sub-advised Predecessor Funds.
In the months preceding the Organizational Meeting, the Board requested and reviewed responses from the Advisers to questions posed to the Advisers on behalf of the Independent Trustees and supporting materials relating to those questions and responses. In addition, the Board considered such additional information as it deemed reasonably necessary to evaluate the Agreements, as applicable, with respect to each Fund, including the fact that the Predecessor Agreements were most recently considered and approved by the board of trustees of Investment Managers Series Trust at an in-person meeting held on June 20-21, 2018. The Board also considered the materials and in-person presentations by Fund officers and representatives of the Advisers received at the Organizational Meeting concerning the Agreements.
In determining whether to approve the Agreements for a Fund, the members of the Board reviewed and evaluated information and factors they believed to be relevant and appropriate in the exercise of their reasonable business judgment. While individual members of the Board may have weighed certain factors differently, the Board’s determination to approve the Agreements was based on a comprehensive consideration of all information provided to the Board with respect to the approval of the Agreements. The Board was also furnished with an analysis of its fiduciary obligations in connection with its evaluation of the Agreements and, throughout the evaluation process, the Board was assisted by counsel for the Funds. The Independent Trustees were also separately assisted by independent legal counsel, from whom they received separate legal advice and with whom they met separately. A more detailed summary of the important, but not necessarily all, factors the Board considered with respect to its approval of the Agreements is provided below.
Nature, Extent and Quality of Services
The Board considered information regarding the nature, extent and quality of services to be provided to the Funds by the Advisers. The Board considered, among other things, the terms of the Agreements and the range of services to be provided by the Advisers. The Board noted the non-investment advisory services to be provided by the Adviser consistent with the terms of the Management Agreements, including the supervision and coordination of the Funds’ services providers and the provision of related administrative and other services. The Board considered each Adviser’s reputation, organizational structure, resources and overall financial strength, as well as its willingness to consider and implement organizational and operational changes designed to enhance services to the Funds.
86
North Square Funds
SUPPLEMENTAL INFORMATION (Unaudited) – Continued
The Board considered the Advisers’ professional personnel who will provide services to the Funds, including each Adviser’s ability and experience in attracting and retaining qualified personnel to service the Funds. The Board also considered the compliance programs and compliance records of the Advisers. The Board noted the Advisers’ support of the Funds’ compliance control structure, including the resources that will be devoted by the Advisers in support of the Funds’ obligations pursuant to Rule 38a-1 under the 1940 Act and the efforts of the Advisers to combat cybersecurity risks and invest in business continuity planning.
The Board considered that the Adviser and Oak Ridge Investments had recently entered into an Asset Purchase Agreement for the sale of certain of the distribution- and asset management-related business assets of Oak Ridge Investments, along with the transfer of over twenty employees from Oak Ridge Investments to the Adviser, including the senior executives primarily responsible for sales, marketing, operations and distribution activities (the “Acquisition”). The Board evaluated the anticipated impact of the Acquisition on the nature, extent and quality of services to be provided to the Funds by the Adviser and Oak Ridge Investments.
With respect to the Adviser, the Board considered the Funds’ proposed operation in a “manager-of-managers” structure and reviewed the responsibilities that the Adviser would have under this structure, including monitoring and evaluating the performance of the Sub-Advisers, monitoring the Sub-Advisers for adherence to the stated investment objectives, strategies, policies and restrictions of the Funds, and supervising the Sub-Advisers with respect to the services that the Sub-Advisers would provide under the Sub-Advisory Agreements. In this regard, the Board evaluated information about the nature and extent of responsibilities retained and risks assumed by the Adviser and not delegated to or assumed by the Sub-Advisers. The Board also considered the process used by the Adviser, consistent with this structure, to identify and recommend subadvisers, and its ability to monitor and oversee subadvisers and recommend replacement subadvisers, when necessary, and provide other services under the Management Agreement.
With respect to the Sub-Advisers, which provide certain day-to-day portfolio management services for the Funds, subject to oversight by the Adviser, the Board considered, among other things, the quality of each Sub-Adviser’s investment personnel, its investment philosophies and processes, its investment research capabilities and resources, its performance record, its experience, its trade execution capabilities and its approach to managing risk. The Board considered the experience of each Fund’s portfolio managers, the number of accounts managed by the portfolio managers, and each Sub-Adviser’s method for compensating the portfolio managers. Moreover, the Board considered that the Adviser would oversee potential conflicts of interest between each Fund’s investments and those of other funds or accounts managed by the Fund’s portfolio managers.
After consideration of the foregoing factors, among others, the Board concluded that the nature, extent and quality of services to be provided by the Adviser and the Sub-Advisers, taken as a whole, are appropriate and consistent with the terms of the Management Agreement and the Sub-Advisory Agreements.
Fund Performance
The Board noted that the Funds are newly formed and did not have prior performance records but considered the performance of each Fund’s corresponding Predecessor Fund, each of which was previously managed by Oak Ridge Investments. The Board reviewed the performance of each Predecessor Fund over different time periods presented in the materials and evaluated the Adviser’s analysis of the Predecessor Fund’s performance for these time periods, recognizing that each Fund is expected to assume the performance history of its corresponding Predecessor Fund.
The Board considered information and materials provided to the Board by the Advisers concerning Predecessor Fund performance, as well as information from Morningstar Inc. (“Morningstar”), an independent provider of investment company data, comparing the investment performance of each Predecessor Fund to an appropriate benchmark index, and to a universe of peer funds as determined by Morningstar (the “Fund Universe”) and a peer group of funds selected from the Fund Universe by Morningstar (the “Performance Group”). The Board received a description of the methodology used by Morningstar to select the funds in each Predecessor Fund’s Performance Group and Fund Universe and considered potential imprecision resulting from the selection methodology. For details regarding each Predecessor Fund’s performance for various periods ended March 31, 2018, see the Fund-by-Fund synopsis below.
The Board received information concerning, and discussed factors contributing to, the performance of the Predecessor Funds relative to their respective benchmarks and Fund Universes for the relevant periods. The Board took note of the explanations for any relative underperformance of a Predecessor Fund during these periods, including with respect to investment decisions and market factors that affected the Predecessor Fund’s investment performance.
Based on these considerations, the Board concluded that it was satisfied that the Adviser and the Sub-Advisers have the capability of providing satisfactory investment performance for the Funds, as applicable.
Management Fees and Expenses
The Board reviewed and considered the proposed management fee rate to be paid by each Fund to the Adviser under the Management Agreement and each Fund’s anticipated total expense ratio. The Board noted that each Fund’s proposed contractual management fee
87
North Square Funds
SUPPLEMENTAL INFORMATION (Unaudited) – Continued
rate was identical to its corresponding Predecessor Fund’s contractual management fee rate. The Board also noted that each Fund’s anticipated total net expense ratio was identical to its corresponding Predecessor Fund’s total net expense ratio as a result of the Adviser’s contractual agreement to limit the Funds’ total operating expenses to specified levels for a period of at least two years (at least ten years for certain Funds) from the date of the Reorganizations. The Board also reviewed and considered the proposed sub-advisory fee rate to be paid by the Adviser to each Sub-Adviser for sub-advisory services. The Board reviewed information from Morningstar comparing each Fund’s proposed management fee rate and anticipated total expense ratio relative to a peer group of funds selected from the Fund Universe by Morningstar (the “Expense Group”). While the Board recognized that comparisons between a Fund and its peer funds may be imprecise, the comparative information provided by Morningstar assisted the Board in evaluating the reasonableness of each Fund’s proposed fees and anticipated total expense ratio. For details regarding each Fund’s expenses, see the Fund-by-Fund synopsis below.
The Board also received and considered information about the portion of the management fee that will be retained by the Adviser after payment of the fee to each Sub-Adviser for sub-advisory services. The Board considered that this amount was identical to the portion of the management fee that was retained by Oak Ridge Investments as investment adviser to the sub-advised Predecessor Funds. In assessing the reasonableness of this amount, the Board received and evaluated information about the nature and extent of responsibilities that will be retained and risks that will be assumed by Adviser and not delegated to or assumed by the Sub-Advisers, and about the Adviser’s on-going oversight services. The Board also considered that the sub-advisory fees to be paid to each Sub-Adviser had been negotiated by the Adviser on an arm’s length basis.
The Board also received and considered information about the nature and extent of services offered and fee rates charged by the Adviser and the Sub-Advisers to other types of clients with investment strategies similar to those of the Funds. In this regard, the Board received information about the significantly greater scope of services, and compliance, reporting and other legal burdens and risks of managing proprietary mutual funds compared with those associated with managing assets of other types of clients, including non-mutual fund clients such as institutional separate accounts.
Based on its consideration of the factors and information it deemed relevant, including those described here, the Board concluded that the compensation payable to the Adviser under the Management Agreement and to the Sub-Advisers under the Sub-Advisory Agreements were reasonable.
Profitability
The Board received and considered information concerning the Adviser’s projected costs of sponsoring the Funds and the projected profitability to the Adviser from providing services to the Funds. The Adviser reported on the methodologies and estimates used in calculating profitability, including a description of the methodology used to allocate certain expenses. The Board noted that the levels of profitability reported on a Fund-by-Fund basis may be affected by numerous factors including, among other things, the size, type and age of the Fund and fee waivers and expense reimbursements by the Adviser. The Board also received information relating to the operations and projected profitability to each Sub-Adviser from providing services to the Funds. The Board considered representations from the Adviser and each Sub-Adviser that the Sub-Adviser’s fees were negotiated at arm’s length on a Fund-by-Fund basis and that the sub-advisory fees would be paid by the Adviser and not the Funds. Accordingly, the Board concluded that the projected profitability of each Sub-Adviser is a less relevant factor with respect to the Board’s consideration of the Sub-Advisory Agreements.
Based on its review, the Board did not deem the projected profits reported by the Advisers from services to be provided to the Funds to be at a level that would prevent it from approving the Agreements.
Economies of Scale
The Board received and considered information about the potential for the Adviser to experience economies of scale in the provision of management services to each Fund, the difficulties of calculating economies of scale at an individual fund level, and the extent to which potential scale benefits may be shared with shareholders of the Fund. The Board reviewed the breakpoints in the management fee schedule for each Fund, if any, which reduce fee rates as the Fund’s assets grow over time. The Board considered that in addition to management fee breakpoints, the Adviser may share potential economies of scale from its management business in a variety of ways, including through fee waiver and expense reimbursement arrangements, services that benefit shareholders, competitive management fee rates set at the outset without regard to breakpoints, and investments in the business intended to enhance services available to shareholders.
The Board concluded that the Adviser’s arrangements with respect to the Funds constituted a reasonable approach to sharing potential economies of scale with the Funds and their shareholders.
88
North Square Funds
SUPPLEMENTAL INFORMATION (Unaudited) – Continued
“Fall-Out” Benefits
The Board received and considered information regarding potential “fall-out” or ancillary benefits that the Adviser and its affiliates may receive as a result of their relationships with the Funds. Ancillary benefits could include, among others, benefits directly attributable to other relationships with the Fund and benefits potentially derived from an increase in the Adviser’s business as a result of their relationships with the Fund. In addition, the Board considered the potential benefits, other than subadvisory fees, that the Sub-Advisers and their affiliates may receive because of their relationships with the Funds, including the benefits of research services that may be available to the Sub-Adviser as a result of securities transactions effected for the Funds and other investment advisory clients, as well as other benefits from increases in assets under management.
Based on its consideration of the factors and information it deemed relevant, including those described here, the Board did not find that any ancillary benefits that may be received by the Advisers and their affiliates are unreasonable.
Fund-by-Fund Factors
North Square Dynamic Small Cap Fund
| • | The Board noted that the Predecessor Fund’s performance was above the median performance of the Performance Group for the 1-, 3- and 5-year periods. The Board noted that the Predecessor Fund’s performance was above the median performance of the Fund Universe for the 1-, 3- and 5-year periods. The Board also noted that the Predecessor Fund’s performance was above its benchmark for the 1-, 3- and 5-year periods. | |
| • | The Board noted that the Fund’s proposed management fee rate was above the median rate of the Expense Group. The Board noted that the Fund’s anticipated total net expense ratio was below the median rate of the Expense Group. |
North Square International Small Cap Fund
| • | The Board noted that the Predecessor Fund’s performance was below the median performance of the Performance Group for the 1-year period. The Board noted that the Predecessor Fund’s performance was below the median performance of the Fund Universe for the 1-year period. The Board also noted that the Predecessor Fund’s performance was below its benchmark for the 1-year period. The Board considered that the Fund had been operating for a short period, and that performance over longer periods would be more meaningful. | |
| • | The Board noted that the Fund’s proposed management fee rate was equal to the median rate of the Expense Group. The Board noted that the Fund’s anticipated total net expense ratio was below the median rate of the Expense Group. |
North Square Multi Strategy Fund
| • | The Board noted that the Predecessor Fund’s performance was above the median performance of the Performance Group for the 1-, 3-, 5- and 10-year periods. The Board noted that the Predecessor Fund’s performance was above the median performance of the Fund Universe for the 1-, 3-, 5- and 10-year periods. The Board also noted that the Predecessor Fund’s performance was below its benchmark for the 1-, 3-, 5- and 10-year periods. | |
| • | The Board noted that the Fund’s proposed management fee rate was below the median rate of the Expense Group. The Board noted that the Fund’s anticipated total net expense ratio was above the median rate of the Expense Group. The Board considered that the Adviser will not receive management fees from the Fund with respect to assets that are invested in underlying funds advised by the Adviser. |
North Square Oak Ridge Disciplined Growth Fund
| • | The Board noted that the Predecessor Fund’s performance was below the median performance of the Performance Group for the 1-year period. The Board noted that the Predecessor Fund’s performance was below the median performance of the Fund Universe for the 1-year period. The Board also noted that the Predecessor Fund’s performance was below its benchmark for the 1-year period. The Board considered that the Fund had been operating for a short period, and that performance over longer periods would be more meaningful. | |
| • | The Board noted that the Fund’s proposed management fee rate was below the median rate of the Expense Group. The Board noted that the Fund’s anticipated total net expense ratio was below the median rate of the Expense Group. |
North Square Oak Ridge Dividend Growth Fund
| • | The Board noted that the Predecessor Fund’s performance was above the median performance of the Performance Group for the 1- and 3-year periods. The Board noted that the Predecessor Fund’s performance was above the median performance of the Fund Universe for the 1-year period and below the median performance of the Fund Universe for the 3-year period. The Board also noted that the Predecessor Fund’s performance was below its benchmark for the 1-year period and below its benchmark for the 3-year period. |
89
North Square Funds
SUPPLEMENTAL INFORMATION (Unaudited) – Continued
| • | The Board noted that the Fund’s proposed management fee rate was above the median rate of the Expense Group. The Board noted that the Fund’s anticipated total net expense ratio was below the median rate of the Expense Group and the Universe. |
North Square Oak Ridge Small Cap Growth Fund
| • | The Board noted that the Predecessor Fund’s performance was below the median performance of the Performance Group for the 1- 3-, 5- and 10-year periods. The Board noted that the Predecessor Fund’s performance was above the median performance of the Fund Universe for the 1-year period and below the median performance of the Fund Universe for the 3-, 5- and 10-year periods. The Board also noted that the Predecessor Fund’s performance was above its benchmark for the 1-year period and below its benchmark for the 3-, 5- and 10-year periods. | |
| • | The Board noted that the Fund’s proposed management fee rate was equal to the median rate of the Expense Group. The Board noted that the Fund’s anticipated total net expense ratio was below the median rate of the Expense Group. |
Conclusion
At the Organizational Meeting, after considering the above-described factors and based on its deliberations and its evaluation of the information described above, the Board unanimously approved the Agreements.
90
North Square Funds
SUPPLEMENTAL INFORMATION (Unaudited) – Continued
Corporate Dividends Received Deduction
For the year ended May 31, 2019, 33.68%, 11.94% and 88.82%, respectively, of the dividends to be paid from net investment income, including short-term capital gains (if any) from the Small Cap Growth, Dynamic Small Cap and Dividend Growth is designated as dividends received deduction available to corporate shareholders.
Qualified Dividend Income
For the year ended May 31, 2019, 34.83%, 56.86%, 12.58% and 98.61%, respectively, of dividends to be paid from net investment income, including short-term capital gains (if any) from the Small Cap Growth, International Small Cap, Dynamic Small Cap and Dividend Growth is designated as qualified dividend income.
Long-Term Capital Gain Designation
For the year ended May 31, 2019, the Small Cap Growth, International Small Cap, Dynamic Small Cap, Disciplined Growth, Multi-Strategy and Dividend Growth Funds designate $43,269,565, $2,317,858, $473,119, $124,163, $22,347,312 and $56,146, respectively, as 20.00% rate gain distributions for purposes of the dividends paid deduction.
Trustees and Officers Information
Additional information about the Trustees is included in each Fund’s Statement of Additional Information which is available, without charge, upon request by calling (855) 551-5521 or on the Funds’ website at www.northsquareinvest.com. The Trustees and officers of each Fund and their principal occupations during the past five years are as follows:
| Number of | |||||
| Portfolios | |||||
| in Fund | Other Directorship/ | ||||
Name, Addressa, | Complex | Trusteeship | |||
| Year of Birth and | Term of Office | Overseen | Positions held by | ||
| Position(s) with | Position with | and Length of | Principal Occupations During | by | Trustee During |
| the Trust | the Trust | Time Servedb | the Past Five Years or Longer | Trusteec | the Past 5 Years |
| Independent Trustees | |||||
| David B. Boon | Trustee | 08/2018 to present | Chief Financial Officer and Managing | 7 | N/A |
| (1960) | Director, Eagle Capital Management, LLC | ||||
| (since 2018); Chief Financial Officer and | |||||
| Partner, Cedar Capital, LLC (2013 – 2018); | |||||
| Managing Director, Putnam Investment | |||||
| Management, LLC (2000 – 2013). | |||||
| Donald J. Herrema | Chairman of the | 08/2018 to present | Vice Chair and Chief Investment Officer, | 7 | Chairman (since 2013) |
| (1952) | Board and Trustee | Independent Life Insurance Company | and Director | ||
| (since 2018); Financial Services Executive, | (since 2009), TD Asset | ||||
| Advisor and Founder of BlackSterling | Management USA Funds | ||||
| Partners, LLC (private investments and | Inc.; Director, Abel Noser | ||||
| advisory firm) (since 2004); Executive Vice | Holdings, LLC (since | ||||
| Chairman and Senior Advisor at Kennedy | 2016); Member, USC | ||||
| Wilson (real estate investment company) | Marshall Business School | ||||
| (2009 – 2016). | Board (since 2010); | ||||
| President and | |||||
| Trustee,Christ Church | |||||
| (2008 – 2016); Director, | |||||
| Lepercq de Neuflize | |||||
| (2009 – 2016); Chairman | |||||
| and Trustee Emeritus | |||||
| (since 2014), Trustee | |||||
| (1995 – 2014), Whittier | |||||
| College; Director, FEG | |||||
| Investment Advisors | |||||
| (since 2017); Director, | |||||
| Independent Life | |||||
| Insurance Company | |||||
| (since 2018). | |||||
91
North Square Funds
SUPPLEMENTAL INFORMATION (Unaudited) – Continued
| Number of | |||||
| Portfolios | |||||
| in Fund | Other Directorship/ | ||||
Name, Addressa, | Complex | Trusteeship | |||
| Year of Birth and | Term of Office | Overseen | Positions held by | ||
| Position(s) with | Position with | and Length of | Principal Occupations During | by | Trustee During |
| the Trust | the Trust | Time Servedb | the Past Five Years or Longer | Trusteec | the Past 5 Years |
| Catherine A. Zaharis | Trustee | 08/2018 to present | Director, Professional/Employer Development, | 7 | Director, The |
| (1960) | Finance Department (since 2015), Adjunct | Vantagepoint Funds | |||
| Lecturer (since 2010), and Business Director, | (2015 – 2016). | ||||
| MBA Finance Career Academy (2008 – 2015), | |||||
| University of Iowa, Tippie College of Business; | |||||
| Chair (2013 – 2016), Director (1999 – 2016), | |||||
| and Investment Committee Member (1999 – | |||||
| 2013) and Chair (2003 – 2013), | |||||
| University of Iowa Foundation. | |||||
Interested Trusteesd | |||||
| Mark D. Goodwin | Trustee and | 08/2018 to present | Chief Executive Officer, North Square | 7 | N/A |
| (1964) | President | Investments LLC (since July 2018); President | |||
| and Chief Operating Officer (2015 – July 2018) | |||||
| and Executive Vice President (2014 – 2015), | |||||
| Oak Ridge Investments, LLC; Chief Operating | |||||
| Officer, AmundiPioneer Asset Management Inc. | |||||
| (2005 – 2014). | |||||
| Officers of the Trust: | |||||
| Alan E. Molotsky | Treasurer | 08/2018 to present | Chief Financial Officer, Chief Compliance Officer, | N/A | N/A |
| (1964) | and | General Counsel and Senior Managing Director, | |||
| Secretary | North Square Investments, LLC (since July 2018); | ||||
| Chief Financial Officer, Chief Compliance Officer, | |||||
| General Counsel and Executive Vice President, | |||||
| Oak Ridge Investments LLC (2004 – July 2018). | |||||
| David J. Gaspar | Vice | 08/2018 to present | Chief Operations and Information Officer and | N/A | N/A |
| (1964) | President | Senior Managing Director, North Square | |||
| Investments, LLC (since July 2018); Chief | |||||
| Operations Officer, Chief Information Officer, | |||||
| Chief Information Security Officer and Executive | |||||
| Vice President, Oak Ridge Investments, LLC | |||||
| (2000 – July 2018). | |||||
| Douglas N. Tyre | Chief | 09/2018 to present | Assistant Compliance Director, Cipperman | N/A | N/A |
| (1964) | Compliance | Compliance Services, LLC (since 2014); | |||
| Officer | Client Services & Operations Specialist | ||||
| and Senior Associate, Echo Point Investment | |||||
| Management LLC (2010 – 2014). | |||||
| a | The business address of each Trustee and officer is c/o North Square Investments, LLC, 10 South LaSalle Street, Suite 1925, Chicago, Illinois 60603. |
| b | Trustees and officers serve until their successors are duly elected and qualified. |
| c | The term “Fund Complex” applies to the seven portfolios that currently comprise the Trust, which consists of the six Funds and the North Square Global Resources & Infrastructure Fund. |
| d | Mr. Goodwin is considered to be an “interested person” of the Trust as that term is defined in the 1940 Act by virtue of his positions with the Adviser. |
92
North Square Funds
EXPENSE EXAMPLES
For the Six Months Ended May 31, 2019 (Unaudited)
Expense Examples
As a shareholder of the Funds, you incur two types of costs: (1) transaction costs, including sales charges (loads) on purchase payments (Class A only); and redemption fees; and (2) ongoing costs, including management fees; distribution and/or service (12b-1) fees (Class A and C only); and other Fund expenses. The examples below are intended to help you understand your ongoing costs (in dollars) of investing in the Funds and to compare these costs with the ongoing costs of investing in other mutual funds.
These examples are based on an investment of $1,000 invested at the beginning of the period and held for the entire six month period from December 1, 2018 to May 31, 2019.
Actual Expenses
The information in the row titled “Actual Performance” of the table below provides actual account values and actual expenses. You may use the information in these columns, together with the amount you invested, to estimate the expenses that you paid over the period. Simply divide your account value by $1,000 (for example, an $8,600 account value divided by $1,000 = 8.6), then multiply the result by the number in the appropriate row for your share class, in the column titled “Expenses Paid During Period” to estimate the expenses you paid on your account during this period.
Hypothetical Example for Comparison Purposes
The information in the row titled “Hypothetical (5% annual return before expenses)” of the table below provides hypothetical account values and hypothetical expenses based on the Fund’s actual expense ratios and an assumed rate of return of 5% per year before expenses, which is not the Fund’s actual return. The hypothetical account values and expenses may not be used to estimate the actual ending account balance or expenses you paid for the period. You may use this information to compare the ongoing costs of investing in the Fund and other funds. To do so, compare these 5% hypothetical examples with the 5% hypothetical examples that appear in the shareholder reports of the other funds.
Please note that the expenses shown in the table are meant to highlight your ongoing costs only and do not reflect any transaction costs, such as sales charges (loads) or redemption fees. Therefore, the information in the row titled “Hypothetical (5% annual return before expenses)” is useful in comparing ongoing costs only, and will not help you determine the relative total costs of owning different funds. In addition, if these transactional costs were included, your costs would have been higher.
93
North Square Funds
EXPENSE EXAMPLES – Continued
For the Six Months Ended May 31, 2019 (Unaudited)
| Beginning | Ending | Expense Paid | ||
| Account | Account | During | ||
| Value | Value | Period* | ||
| Small Cap Growth Fund | 12/1/18 | 5/31/19 | 12/1/18 – 5/31/19 | |
| Class A | Actual Performance | $1,000.00 | $ 996.70 | $ 6.82 |
| Hypothetical (5% annual return before expenses) | $1,000.00 | $1,018.10 | $ 6.89 | |
| Class C | Actual Performance | $1,000.00 | $ 992.60 | $10.53 |
| Hypothetical (5% annual return before expenses) | $1,000.00 | $1,014.36 | $10.65 | |
| Class I | Actual Performance | $1,000.00 | $ 997.90 | $ 5.58 |
| Hypothetical (5% annual return before expenses) | $1,000.00 | $1,019.35 | $ 5.64 | |
| Class K | Actual Performance | $1,000.00 | $ 999.10 | $ 5.58 |
| Hypothetical (5% annual return before expenses) | $1,000.00 | $1,019.35 | $ 5.64 | |
| * | Expenses are equal to the Fund’s annualized expense ratios of 1.37%, 2.12%, 1.12% and 1.12% for Class A, Class C, Class I and Class K, respectively, multiplied by the average account values over the period, multiplied by 182/365 (to reflect the six month period). The expense ratio reflect a recovery of previously waived fees. Assumes all dividends and distributions were reinvested. |
| Beginning | Ending | Expense Paid | ||
| Account | Account | During | ||
| Value | Value | Period* | ||
| International Small Cap Fund | 12/1/18 | 5/31/19 | 12/1/18 – 5/31/19 | |
| Class A | Actual Performance | $1,000.00 | $ 991.00 | $7.50 |
| Hypothetical (5% annual return before expenses) | $1,000.00 | $1,017.40 | $7.59 | |
| Class I | Actual Performance | $1,000.00 | $ 992.20 | $6.26 |
| Hypothetical (5% annual return before expenses) | $1,000.00 | $1,018.65 | $6.34 | |
| * | Expenses are equal to the Fund’s annualized expense ratios of 1.51% and 1.26% for Class A and Class I, respectively, multiplied by the average account values over the period, multiplied by 182/365 (to reflect the six month period). The expense ratio reflects an expense waiver. Assumes all dividends and distributions were reinvested. |
| Beginning | Ending | Expense Paid | ||
| Account | Account | During | ||
| Value | Value | Period* | ||
| Dynamic Small Cap Fund | 12/1/18 | 5/31/19 | 12/1/18 – 5/31/19 | |
| Class A | Actual Performance | $1,000.00 | $ 962.50 | $6.85 |
| Hypothetical (5% annual return before expenses) | $1,000.00 | $1,017.95 | $7.04 | |
| Class I | Actual Performance | $1,000.00 | $ 962.80 | $5.63 |
| Hypothetical (5% annual return before expenses) | $1,000.00 | $1,019.20 | $5.79 | |
| * | Expenses are equal to the Fund’s annualized expense ratios of 1.40% and 1.15% for Class A and Class I, respectively, multiplied by the average account values over the period, multiplied by 182/365 (to reflect the six month period). The expense ratio reflects an expense waiver. Assumes all dividends and distributions were reinvested. |
| Beginning | Ending | Expense Paid | ||
| Account | Account | During | ||
| Value | Value | Period* | ||
| Disciplined Growth Fund | 12/1/18 | 5/31/19 | 12/1/18 – 5/31/19 | |
| Class I | Actual Performance | $1,000.00 | $1,045.00 | $4.89 |
| Hypothetical (5% annual return before expenses) | $1,000.00 | $1,020.14 | $4.84 | |
| * | Expenses are equal to the Fund’s annualized expense ratio of 0.96%, multiplied by the average account values over the period, multiplied by 182/365 (to reflect the six month period). The expense ratios reflect an expense waiver. Assumes all dividends and distributions were reinvested. |
94
North Square Funds
EXPENSE EXAMPLES – Continued
For the Six Months Ended May 31, 2019 (Unaudited)
| Beginning | Ending | Expense Paid | ||
| Account | Account | During | ||
| Value | Value | Period* | ||
| Multi Strategy Fund | 12/1/18 | 5/31/19 | 12/1/18 – 5/31/19 | |
| Class A | Actual Performance | $1,000.00 | $ 995.10 | $4.87 |
| Hypothetical (5% annual return before expenses) | $1,000.00 | $1,020.04 | $4.94 | |
| Class C | Actual Performance | $1,000.00 | $ 992.10 | $8.59 |
| Hypothetical (5% annual return before expenses) | $1,000.00 | $1,016.31 | $8.70 | |
| Class I | Actual Performance | $1,000.00 | $1,001.30 | $3.64 |
| Hypothetical (5% annual return before expenses) | $1,000.00 | $1,021.29 | $3.68 | |
| * | Expenses are equal to the Fund’s annualized expense ratios of 0.98%, 1.73 and 0.73% for Class A, Class C and Class I, respectively, multiplied by the average account values over the period, multiplied by 182/365 (to reflect the six month period). The expense ratio reflect a recovery of previously waived fees. Assumes all dividends and distributions were reinvested. |
| Beginning | Ending | Expense Paid | ||
| Account | Account | During | ||
| Value | Value | Period* | ||
| Dividend Growth Fund | 12/1/18 | 5/31/19 | 12/1/18 – 5/31/19 | |
| Class A | Actual Performance | $1,000.00 | $1,017.50 | $6.49 |
| Hypothetical (5% annual return before expenses) | $1,000.00 | $1,018.50 | $6.49 | |
| Class I | Actual Performance | $1,000.00 | $1,019.00 | $5.34 |
| Hypothetical (5% annual return before expenses) | $1,000.00 | $1,019.65 | $5.34 | |
| * | Expenses are equal to the Fund’s annualized expense ratios of 1.29% and 1.06% for Class A and Class I, respectively, multiplied by the average account values over the period, multiplied by 182/365 (to reflect the six month period). The expense ratio reflects an expense waiver. Assumes all dividends and distributions were reinvested. |
95
North Square Funds
Advisor
North Square Investments
10 South LaSalle Street, Suite 1900
Chicago, Illinois 60603
Sub-Advisor
Algert Global LLC
555 California Street
Suite 3325
San Francisco, California 94104
Independent Registered Public Accounting Firm
Tait, Weller & Baker LLP
1818 Market Street, Suite 2400
Philadelphia, Pennsylvania 19103
Custodian
U.S. Bank, N.A.
1555 N. RiverCenter Drive, Ste 300
Milwaukee, Wisconsin 53212
Fund Administrator, Transfer Agent and Fund Accountant
U.S. Bank Global Fund Services
615 East Michigan Street
Milwaukee, Wisconsin 53202
Distributor
Compass Distributors LLC
Three Canal Plaza, Suite 100
Portland, Maine 04101
www.foreside.com
(This Page Intentionally Left Blank.)
FUND INFORMATION
| Fund Name | Ticker | CUSIP | |
| North Square Oak Ridge Small Cap Growth Fund | Class A | ORIGX | 66263L 304 |
| North Square Oak Ridge Small Cap Growth Fund | Class C | ORICX | 66263L 874 |
| North Square Oak Ridge Small Cap Growth Fund | Class K | ORIKX | 66263L 866 |
| North Square Oak Ridge Small Cap Growth Fund | Class I | ORIYX | 66263L 858 |
| North Square International Small Cap Fund | Class A | ORIAX | 66263L 403 |
| North Square International Small Cap Fund | Class I | ORIIX | 66263L 817 |
| North Square Dynamic Small Cap Fund | Class A | ORSAX | 66263L 502 |
| North Square Dynamic Small Cap Fund | Class I | ORSIX | 66263L 825 |
| North Square Oak Ridge Disciplined Growth Fund | Class I | ODGIX | 66263L 601 |
| North Square Multi Strategy Fund | Class A | ORILX | 66263L 700 |
| North Square Multi Strategy Fund | Class C | ORLCX | 66263L 841 |
| North Square Multi Strategy Fund | Class I | PORYX | 66263L 833 |
| North Square Oak Ridge Dividend Growth Fund | Class A | ORDAX | 66263L 809 |
| North Square Oak Ridge Dividend Growth Fund | Class I | ORDNX | 66263L 882 |
Privacy Principles of the Oak Ridge Funds for Shareholders
The Funds are committed to maintaining the privacy of their shareholders and to safeguarding their non-public personal information. The following information is provided to help you understand what personal information the Funds collect, how we protect that information and why, in certain cases, we may share information with select other parties.
Generally, the Funds do not receive any non-public personal information relating to their shareholders, although certain non-public personal information of their shareholders may become available to the Funds. The Funds do not disclose any non-public personal information about their shareholders or former shareholders to anyone, except as permitted by law or as is necessary in order to service shareholder accounts (for example, to a transfer agent or third party administrator).
This report is sent to shareholders of the Oak Ridge Funds for their information. It is not a Prospectus, circular or representation intended for use in the purchase or sale of shares of the Funds or of any securities mentioned in this report.
Proxy Voting Policies and Procedures
A description of the Funds’ proxy voting policies and procedures related to portfolio securities is available without charge, upon request, by calling the Funds at (855) 551-5521 or on the U.S. Securities and Exchange Commission’s (“SEC”) website at www.sec.gov.
Proxy Voting Record
Information regarding how the Funds voted proxies for portfolio securities, if applicable, during the most recent 12-month period ended June 30, is also available, without charge and upon request by calling (855) 551-5521 or by accessing the Funds’ Form N-PX on the SEC’s website at www.sec.gov.
Form N-Q Disclosure
The Funds file their complete schedule of portfolio holdings with the SEC for the first and third quarters of each fiscal year on Form N-Q. The Funds’ Form N-Q is available on the SEC website at www.sec.gov. The Funds’ Form N-Q may also be viewed and copied at the SEC’s Public Reference Room in Washington, DC. Information on the operation of the Public Reference Room may be obtained by calling (800) SEC-0330.
Householding
The Funds will mail only one copy of shareholder documents, including prospectuses, annual and semi-annual reports and proxy statements, to shareholders with multiple accounts at the same address. This practice is commonly called “householding” and is intended to reduce expenses and eliminate duplicate mailings of shareholder documents. Mailings of your shareholder documents may be householded indefinitely unless you instruct us otherwise. If you do not want the mailing of these documents to be combined with those for other members of your household, please call the Funds at (855) 551-5521.
North Square Funds
c/o U.S. Bancorp Fund Services, LLC
P.O. Box 2175
Milwaukee, Wisconsin 53201
1-855-551-5521
Item 2. Code of Ethics.
The registrant has adopted a code of ethics that applies to the registrant’s principal executive officer and principal financial officer. The registrant has not made any substantive amendments to its code of ethics during the period covered by this report. The registrant has not granted any waivers from any provisions of the code of ethics during the period covered by this report.
A copy of the registrant’s Code of Ethics is filed herewith.
Item 3. Audit Committee Financial Expert.
The Registrant’s Board of Trustees has determined that it does not have an audit committee financial expert serving on its audit committee. At this time, the Registrant believes that the experience provided by each member of the Audit Committee together offers the registrant adequate oversight for the Registrant’s level of financial complexity.
Item 4. Principal Accountant Fees and Services.
(1) (a) — (d) Aggregate fees billed to the Registrant for each of the last two fiscal years for professional services rendered by the Registrant’s Independent Registered Public Accounting Firm were as follows:
| FYE 5/31/2019 | FYE 5/31/2018 | |
| Audit Fees | $100,100 | $92,700 |
| Audit-Related Fees | $0 | $0 |
| Tax Fees | $16,800 | $16,800 |
| All Other Fees | $0 | $0 |
Audit fees include amounts related to the audit of the Registrant’s annual financial statements and services normally provided by the Independent Registered Public Accounting Firm in connection with statutory and regulatory filings, including registration statements. Audit-related fees refer to the reading and commenting on the Registrant’s semi-annual reports. Tax fees include amounts related to tax compliance, tax planning, and tax advice, including specifically tax return review and excise tax distribution review services. There were no fees billed for services rendered to the Registrant’s investment adviser or any entity controlling, controlled by or under common control with the investment adviser that provides ongoing services to the Registrant that were required to be approved pursuant to paragraph (c)(7)(ii) of Rule 2-01 of Regulation S-X.
(e) (1) The Registrant’s audit committee charter requires pre-approval in advance of (i) audit and non-audit services performed by the Registrant’s Independent Registered Public Accounting Firm for the Registrant; and (ii) audit and non-audit services relating directly to the operations and financial reporting of the Registrant performed by the Registrant’s principal accounting officer for the Registrant’s investment adviser, and any entity controlling, controlled by, or under common control with the investment adviser that provides ongoing services to the Registrant.
(2) None of the services described in (b) — (d) above were approved by the audit committee specifically pursuant to paragraph (c)(7)(i)(C) of Rule 2-01 of Regulation S-X.
(f) Not applicable.
(g) The aggregate non-audit fees were for audit-related and tax services rendered to the Registrant. As disclosed above, the amount of fees billed for such services were $16,800 and $16,800 for the 2019 and 2018 fiscal years, respectively.
(h) The aggregate fees billed for non-audit services rendered to the Registrant’s investment advisor related to surprise security count procedures were $16,800 and $16,800 for the 2019 and 2018 fiscal years respectively. These fees were not required to be preapproved pursuant to paragraph (c)(7)(ii) of Rule 2-01 of Regulation S-X.
Item 5. Audit Committee of Listed Registrants.
Not applicable to registrants who are not listed issuers (as defined in Rule 10A-3 under the Securities Exchange Act of 1934).
Item 6. Investments.
(a) | Schedule of Investments is included as part of the report to shareholders filed under Item 1 of this Form. |
(b) | Not Applicable. |
Item 7. Disclosure of Proxy Voting Policies and Procedures for Closed-End Management Investment Companies.
Not applicable to open-end investment companies.
Item 8. Portfolio Managers of Closed-End Management Investment Companies.
Not applicable to open-end investment companies.
Item 9. Purchases of Equity Securities by Closed‑End Management Investment Company and Affiliated Purchasers.
Not applicable to open-end investment companies.
Item 10. Submission of Matters to a Vote of Security Holders.
There have been no material changes to the procedures by which shareholders may recommend nominees to the Registrant’s Board of Trustees.
Item 11. Controls and Procedures.
(a) | The Registrant’s President and Treasurer have reviewed the Registrant's disclosure controls and procedures (as defined in Rule 30a-3(c) under the Investment Company Act of 1940 (the “Act”)) as of a date within 90 days of the filing of this report, as required by Rule 30a-3(b) under the Act and Rules 13a-15(b) or 15d‑15(b) under the Securities Exchange Act of 1934. Based on their review, such officers have concluded that the disclosure controls and procedures are effective in ensuring that information required to be disclosed in this report is appropriately recorded, processed, summarized and reported and made known to them by others within the Registrant and by the Registrant’s service provider. |
(b) | There were no changes in the Registrant's internal control over financial reporting (as defined in Rule 30a-3(d) under the Act) that occurred during the second fiscal quarter of the period covered by this report that have materially affected, or are reasonably likely to materially affect, the Registrant's internal control over financial reporting. |
Item 12. Disclosure of Securities Lending Activities for Closed-End Management Investment Companies
Not applicable to open-end investment companies.
Item 13. Exhibits.
| (a) | (1) Code of ethics. Filed herewith |
(2) A separate certification for each principal executive officer and principal financial officer pursuant to Section 302 of the Sarbanes-Oxley Act of 2002. Filed herewith.
(3) Not applicable to open-end investment companies.
(4) There was no change in the registrant’s independent public accountant for the period covered by this report.
| (b) | Certifications pursuant to Section 906 of the Sarbanes‑Oxley Act of 2002. Furnished herewith. |
SIGNATURES
Pursuant to the requirements of the Securities Exchange Act of 1934 and the Investment Company Act of 1940, the registrant has duly caused this report to be signed on its behalf by the undersigned, thereunto duly authorized.
North Square Investments Trust
By: /s/Mark D. Goodwin
Mark D. Goodwin,
President
Date: August 5, 2019
Pursuant to the requirements of the Securities Exchange Act of 1934 and the Investment Company Act of 1940, this report has been signed below by the following persons on behalf of the registrant and in the capacities and on the dates indicated.
By: /s/Mark D. Goodwin
Mark D. Goodwin,
President
Date August 5, 2019
By: /s/Alan E. Molotsky
Alan E. Molotsky,
Treasurer
Date August 5, 2019