ANNUAL REPORT
NORTH SQUARE OAK RIDGE SMALL CAP GROWTH FUND
NORTH SQUARE DYNAMIC SMALL CAP FUND
NORTH SQUARE OAK RIDGE DISCIPLINED GROWTH FUND
NORTH SQUARE MULTI STRATEGY FUND
NORTH SQUARE OAK RIDGE DIVIDEND GROWTH FUND
MAY 31, 2020
Beginning on January 1, 2021, as permitted by regulations adopted by the U.S. Securities and Exchange Commission, paper copies of the Funds’ shareholder reports will no longer be sent by mail, unless you specifically request paper copies of the reports from the Fund or from your financial intermediary, such as a broker-dealer or bank. Instead, the reports will be made available on the Funds’ website, www.northsquareinvest.com, and you will be notified by mail each time a report is posted and provided with a website link to access the report.
If you already elected to receive shareholder reports electronically, you will not be affected by this change and you need not take any action. You may elect to receive shareholder reports and other communications from the Funds electronically by contacting your financial intermediary, such as a broker-dealer or bank, or, if you are a direct investor, by calling the Funds toll-free at 1-855-551-5521.
You may elect to receive all future reports in paper free of charge. If you invest through a financial intermediary, you can contact your financial intermediary to request that you continue to receive paper copies of your shareholder reports. If you invest directly with the Funds, you can call the Funds toll-free at 1-855-551-5521 to let the Funds know you wish to continue receiving paper copies of your shareholder reports. Your election to receive reports in paper will apply to all Funds held in your account if you invest through your financial intermediary.
 | North Square Investments | www.northsquareinvest.com |
North Square Funds
Table of Contents
| Shareholder Letters | 1 |
| Fund Performance | 11 |
| Schedules of Investments | 18 |
| Statements of Assets and Liabilities | 36 |
| Statements of Operations | 40 |
| Statements of Changes in Net Assets | 42 |
| Financial Highlights | 47 |
| Notes to Financial Statements | 57 |
| Report of Independent Registered Public Accounting Firm | 67 |
| Supplemental Information | 68 |
| Expense Examples | 71 |
This report and the financial statements contained herein are provided for the general information of the shareholders of the North Square Funds. This report is not authorized for distribution to prospective investors in the Funds unless preceded or accompanied by an effective prospectus.
www.northsquareinvest.com
| Discussion of Fund Performance |  |
A letter from David Klaskin, Chief Executive Officer and Chief Investment Officer of Oak Ridge Investments and lead portfolio manager of the North Square Oak Ridge Small Cap Growth Fund.
Fellow Shareholders,
There have been many unprecedented occurrences as the result of COVID-19. This included the fastest decline of over 30% in history during a 33-day period in February and March, as the economy ground to a halt with the first ever shutdown of societies across the globe. The U.S. economy declined at a rate of 5% during the first quarter due to the closures in March and despite the partial reopening of businesses, GDP is expected to decline an unimaginable 40% in the second quarter. Even knowing a 20% rebound was forecasted for GDP over the next three months due to pent-up demand, very few investors anticipated the ensuing rally that included the largest 50-day advance in history, which nearly erased all of the broad market declines for the year.
The gains were much greater in growth stocks. The Nasdaq Composite, which is heavily comprised of leading companies with strong earnings visibility in the technology and healthcare sectors is shockingly 11% ahead of the Standard & Poor’s 500 Index for the year through May 31. Despite a strong recovery from doomsday levels, cyclical stocks remain significantly lower for the year and face uncertain futures dependent on a more significant economic recovery and in many cases, further government aid. The primary credit for the rapid turnaround is owed to the swift and aggressive response around the globe in providing broad stimulus and targeted aid. There was no alternative to the unparalleled level of debt incurred to maintain order and it is impossible to determine how severe unemployment might have been without extraordinary incentives for employee retention, or how rapidly companies will rehire. The damage to people and businesses has been uneven, as those deemed essential, or able to thrive remotely and online, are mostly financially whole through this ordeal, while others are on the brink of despair. Forecasts for a ‘V’-shaped recovery seem to ignore the need for businesses to recover what they lost during the shutdown by remaining cautious on expenditures, particularly given the uncertainty of the economic impact of the virus going forward.
The stock market is forward looking and there will clearly be easy comparisons and significant pent-up demand for everything from travel to elective medical procedures. While debt is high, significant government spending is earmarked for infrastructure improvements and interest rates should remain extremely low for a number of years, providing technology and innovation continue to keep inflation in check. There are few alternatives to the equity markets for retirees and pension plans in need of returns to meet their objectives, which should support stock prices. The largest stocks continue to lead the market, but over time, the averages are likely to level off and new leaders and surviving long-standing businesses will attract investor interest and reward active management.
The North Square Oak Ridge Small Cap Growth Fund – Class I Shares returned 1.41% versus the Russell 2000 Growth Index return of 7.32% for the year ending May 31, 2020. Our investment style favors more consistent growth opportunities, taking a tempered approach to less visible areas. This not only manifests itself within the sector allocations we emphasize but within the particular industries underlying those sectors. The recovery across healthcare and information technology stocks drove positive returns for the index for the year. While the Fund produced healthy gains for the year in these two sectors, they were also the largest detractors to relative returns. Within healthcare, the biopharma industry group was the strongest contributor to index returns. The broad opportunity set amidst this group in small caps, however, has grown increasingly aggressive as the vast majority of companies did not produce positive earnings for the year. While the growth potential for many burgeoning biopharma companies can be attractive, the visibility is low when most are developmental stage companies. We have maintained a cautious underweight to the industries while focusing more on equipment and life sciences where we believe there has been great visibility over time. As many healthcare services have been postponed due to concerns over the spread of coronavirus, many stable companies have seen uncharacteristic disruption in their businesses.
The dramatic and unexpected need for large segments of the workforce to begin working from home supported cloud-based computing and infrastructure stocks during the treacherous market of the first quarter of 2020. These companies went onto lead the recovery in the Russell 2000 Growth Index from the March 18th trough. The secular trend towards utilization of services provided through the cloud has only strengthened during this crisis, further driving what has been extraordinary outperformance of the group over the past few years. The strength in semiconductors, much like within the unprofitable biotechnology stocks, was surprising given it is a departure from experiences during previous market downturns. Returns within the semiconductor industry have proven themselves over time to be transient and we have favored the more service-oriented businesses within information technology. Two IT Services companies in particular proved less resilient than expected, WEX (-21.7%) and Euronet Worldwide (-38.9%). As a card service provider for the trucking industry and a portfolio holding since 2008, WEX was hurt by a material decline in the use of credit cards and severe weakness in key verticals tied to fuel prices and the travel industry. This consistent grower is a prototype Oak Ridge
holding that lost 80% of its value in 2008 despite never being in danger of losing money, before rising nearly 30 fold over the following 11 years. We remain highly confident in this holding over the next several years. Euronet Worldwide is a provider of ATM machines within large segments of Europe, as people have stayed home cash withdrawal has declined in an otherwise healthy cash usage region.
Avoiding weaker segments within the index such as communication services, utilities and materials benefited the portfolio. We adjusted our thesis throughout the year on consumer discretionary companies. The strength of the consumer seemed a positive driver for stocks; however, as the length of the lockdown measures became more clear we have reduced our weight across the sector. Unfortunately, positive stock selection did not make up for the overweight we have held within the sector. Within industrials, the machinery segment was a large detractor of performance. The industry has a history of being a place where we have been able to find unique end market companies with long-term opportunities. This has not changed but the near term has been difficult for otherwise healthy companies, particularly in Welbilt Inc. (-63.6%, sold from the portfolio in 2020) a provider of restaurant equipment. The strongest contribution to relative returns came from the real estate sector, where our two companies Terreno Realty (+14.6%) and recently added CoreSite Realty (-2.2%) proved to be the healthier markets within an otherwise abysmal sector.
We remain constructive on our portfolio and acknowledge that the unfolding public health and resulting economic crisis has not been resolved. We are confident that our patient, fundamentally-driven process is well suited for the uncertain times ahead.
Continuity and the Importance of Active Management
The Fund has been managed by the same lead portfolio manager, employing the same discipline rooted in fundamentals with a valuation awareness, since the Fund’s inception. Our persistent focus on supportable valuations and quality has often not appeared as relevant, and has actually detracted from investment results, throughout this long bull market. This overlooked metric, however, is likely to be a key factor in determining success over the next several years.
Thank you for your continued confidence in Oak Ridge Investments.
Sincerely,
David Klaskin
CIO & Senior Portfolio Manager
The views in this letter are those of the Fund’s direct advisor were as of July 30, 2020 and may not necessarily reflect the same views on the date this letter is first published or any date thereafter. These views are intended to help shareholders in understanding the fund’s investment methodology and do not constitute investment advice.
Investment in equity securities involves substantial risks and may be subject to wide and sudden fluctuations in market value. Investing in small and mid cap companies may be subject to more abrupt or erratic market movements and may have lower trading volumes or more erratic trading than securities of larger companies. Please see the prospectus for a more complete discussion of the fund’s risks.
The Russell 2000 Growth Index measures the performance of small cap U.S. growth stocks.
| Discussion of Fund Performance | |
A letter from Peter Algert, Chief Investment Officer of Algert Global LLC and portfolio manager of the North Square Dynamic Small Cap Fund.
Fellow Shareholders,
U.S. small-cap stocks experienced a significant amount of volatility over the 12-month period ending May 31, 2020, primarily driven by the unprecedented public health and economic crises related to the COVID-19 pandemic. After a significant rally spanning the fourth quarter of 2019 and the beginning of 2020, the Russell 2000 Index fell precipitously in February-March 2020 and subsequently partially rebounded, ending the 12-month period at -3.44%. The Fund however outperformed the index over this period, delivering an absolute return of -0.44% for Class I shares at NAV.
Stock Selection Designed to be the Primary Source of Benchmark Outperformance
During the trailing 12-month period, stock selection contributed positively to Fund performance, however it was partially offset by negative contribution from incidental active exposures to various risk factors (e.g. a company’s industry, leverage, liquidity and beta characteristics). In addition to positive stock selection, the Fund also benefitted from various stock-specific events.
Relative Value
The Relative Value model detracted from the Fund’s performance during the measurement period. Value-related positioning underperformed as investors have favored stocks with stronger growth characteristics and price levels which have made them unattractive on most valuation criteria. The poor performance of our Relative Value model has been particularly acute in the more fundamental insights, while some of our non-traditional valuation factors have performed modestly better.
Quality
The Quality model was the primary positive contributor to the performance of the Fund. With an uncertain economic backdrop, investors appeared to favor companies with more robust and sustainable business models relative to peers. The performance of our Quality insights was strong across various types of insights, particularly those constructed with natural language processing (NLP) techniques.
Catalyst
The Catalyst model was a positive contributor to the Fund’s performance. The Catalyst theme, which assesses sentiment and activities by other market participants, was volatile at times during the measurement period but ultimately profited as insights favoring various growth characteristics continued their longer term trend of strong performance.
Risk Factors
Incidental active exposures to industries and risk factors such as leverage, volatility and liquidity detracted from performance over the measurement period. In particular, the Fund’s industry weights relative to the index detracted as dispersion in industry returns over the trailing 12-months was meaningful, for example within the materials and energy sectors. While these exposures detracted during the measurement period, we expect these exposures will have minimal impact on the Fund’s active performance over a full market cycle.
Fund Positioning for the Future
The Fund aims to be diversified across its three main investment themes, Relative Value, Quality and Catalyst. Given the uncertain economic backdrop relating to the COVID-19 pandemic, we expect our Quality-driven positioning will be beneficial for the portfolio. We continue to favor Catalyst-driven positions relative to Value driven, in part, by the expectation of ongoing access to cheap financing for growth-oriented firms.
Sincerely,
Peter Algert,
Chief Investment Officer
The views in this letter were as of July 30, 2020 and may not necessarily reflect the same views on the date this letter is first published or any time thereafter. These views are intended to help shareholders in understanding the fund’s investment methodology and do not constitute investment advice.
Investment in equity securities involves substantial risks and may be subject to wide and sudden fluctuations in market value. Investing in small cap companies may be subject to more abrupt or erratic market movements and may have lower trading volumes or more erratic trading than securities of larger companies. International investments are subject to unique risks including currency fluctuations, social, economic and political uncertainties, which could increase volatility. In addition, changes in exchange rates and interest rates may adversely affect the value of the fund’s foreign investments. Please see the prospectus for a more complete discussion of the fund’s risks.
The Russell 2000 Index measures the performance of primarily small cap U.S. stocks.
| Discussion of Fund Performance | |
A letter from Robert G. McVicker, Director of Research of Oak Ridge Investments and portfolio manager of the North Square Oak Ridge Disciplined Growth Fund.
Fellow Shareholders,
Despite the significant economic disruption as a result of COVID-19, U.S. large cap growth indexes remarkably returned over 20% for the year ending May 31. The primary credit for the rapid turnaround from doomsday levels is owed to the swift and aggressive response around the globe in providing broad stimulus and targeted aid. There was no alternative to the unparalleled level of debt incurred to maintain order. It is impossible to determine how severe unemployment might have been without extraordinary incentives for employee retention. The damage to people and businesses has been uneven, as those deemed essential or able to thrive remotely and online, are mostly financially whole through this ordeal, while others are facing great uncertainty. Cyclical stocks remain significantly lower for the year as their uncertain futures are more dependent on significant economic recovery, and in many cases, further government aid. Forecasts for a ‘V’-shaped recovery seem to ignore the need for businesses to recover what they lost during the shutdown by remaining cautious on expenditures, particularly given the uncertainty of the economic impact of the virus going forward.
The stock market is forward looking and there will clearly be easy comparisons and some pent-up demand for everything from travel to elective medical procedures. While debt is high, significant government spending is earmarked for infrastructure improvements and interest rates should remain extremely low for a number of years, providing technology and innovation continue to keep inflation in check. Current valuations are a consideration and long term expected returns should be evaluated conservatively. The largest stocks continue to lead the market, but over time, the averages are likely to level off and new leaders and surviving long standing businesses should attract investor interest and reward active management.
The North Square Oak Ridge Disciplined Growth Fund - Class I Shares returned 22.05% compared to the Russell 3000 Growth Index which returned 24.99% for the year ending May 31, 2020. Returns for the year were most notably driven by the large cap technology-based companies Facebook (+26.8%) Apple (+83.8%), Amazon(+37.6%), Microsoft (+50.0%) and Google (+29.6%) which accounted for 27.8% of the index weight during the year while contributing 50% of the total returns for the year. The crisis surrounding COVID-19 has accelerated many of the trends that were benefiting these companies over the past few years. As we look across the opportunities for growth and profitability, these companies, even following healthy increases in share price, have had superior fundamental growth in the current environment and present the more visible and consistent growth trajectories going forward. This is not to suggest that these five stocks represented the extent of the market opportunity for the past year. Excluding the above FAAMG stocks, the index returned 16.9% for the year, which is still stronger than the 12.8% return of the S&P 500 Index.
The growth style has significantly outperformed value in 2020 through May 31, with the Russell 3000 Growth Index outperforming the Russell 3000 Value Index by over 20%. Economic growth in the foreseeable future will likely impact future consumer spending priorities due to concerns of public safety, whether through a broad understanding of herd immunity or a heavily vaccinated population. As such many of drivers of the long-term underperformance of value to growth persist. Surely there will be a recovery, but the longer the disruption to the economy the more trying the rebound will be for many cyclical stocks. Many of the dynamic elements of the market that have been drivers within the market for the past few years, such as ecommerce, cloud computing, big data analytics and medical genetics, continue to have traction into the future. An exposure to these types of secular and organic growth themes within the market is an important consideration for investors, particularly should the long-term growth environment of the economy remain tepid.
Holdings in healthcare, consumer discretionary and the portfolio’s cash position were the primary detractors to performance for the year, but partially offset by strong stock selection in information technology, real estate and industrials. Healthcare underperformance was driven largely by stock selection in biotechnology company Sage Therapeutics (-57.8%, sold from the portfolio), which had mixed results on a trial to treat major depressive disorders, and healthcare equipment maker ABIOMED (-31.7%, sold from the portfolio), which had seen diminishing growth in utilization of their Impella technology. Both these companies had been long-term positive contributors to portfolio returns. Consumer discretionary was inhibited by retail-oriented companies VF Corp (-29.8%) and Ulta Beauty (-28.8%, sold from the portfolio). Software and IT services, two areas we tend to favor for their recurring revenue potential, were the largest contributors within information technology. The purchase of data center real estate firm Equinix (+33.1%) proved a timely purchase in an otherwise poor performing Real Estate sector. Within industrials, avoiding deep cyclical type companies in favor of more recurring businesses such as Verisk Analytics (+24.2%) and Transdigm Group (+7.8%) benefited relative returns.
We remain constructive on our portfolio and acknowledge that the unfolding public health and resulting economic crisis has not been resolved. We are confident that our patient, fundamentally-driven process is well suited for the uncertain times ahead.
Thank you for your continued confidence in Oak Ridge Investments.
Sincerely,
Robert G. McVicker
Senior Portfolio Manager
The views in this letter are those of the Fund’s direct advisor were as of July 30, 2020 and may not necessarily reflect the same views on the date this letter is first published or any date thereafter. These views are intended to help shareholders in understanding the fund’s investment methodology and do not constitute investment advice.
Investment in equity securities involves substantial risks and may be subject to wide and sudden fluctuations in market value. Investing in small and mid cap companies may be subject to more abrupt or erratic market movements and may have lower trading volumes or more erratic trading than securities of larger companies. Please see the prospectus for a more complete discussion of the fund’s risks.
The Russell 3000 Growth Index measures the performance of growth stocks across almost all market caps.
| Discussion of Fund Performance | |
A letter from David Klaskin, Chief Executive Officer and Chief Investment Officer of Oak Ridge Investments and lead portfolio manager of the North Square Multi Strategy Fund.
Fellow Shareholders:
The pace and scale of the recovery within the U.S. financial markets past couple of months has been remarkable. Swift intervention from the Federal Reserve Board proved highly effective in alleviating liquidity concerns and restoring investor confidence in financial markets. The scope of the Federal Reserve’s response combined actions used during the Financial Crisis with new tools, but over a much more accelerated timeline. In addition to standard quantitative easing and liquidity support for critical markets such as commercial paper, the Federal Reserve announced it would also purchase corporate bonds. Rapidly increasing spreads across the corporate bond markets, including within high yield, began to narrow and select portions of the US equity markets quickly recovered toward pre-COVID-19 levels. With the promise of Fed support of corporate bonds companies opportunistically raised capital with new bond issuances, a critical cash infusion for many companies facing the brunt of revenue losses from shutdown measures. Within US equities, large cap technology companies that had previously been leading pre-virus experienced muted drawdowns relative to more economically sensitive sectors as economic shutdowns proved less impactful to their business models and in many cases amplified existing secular trends. At the same time the ability to acquire capital through bond issuance and secondary offerings to meet their current cash needs helped the more disrupted businesses to survive and to rebound off the March trough. The recovery across equities in the second quarter, nevertheless, was heavily imbalanced, reflecting continued economic uncertainty.
The most troubling part of the current economic narrative is the rampant rise in unemployment. The unemployment rate in the US rose to 14.7% in April. While the rate of unemployment shows signs of decline and initial claims have tapered in recent weeks, employment metrics are still dangerously above anything experienced in recent memory. Government support for small businesses and the unemployed has temporarily ameliorated a difficult situation for the most immediately affected portions of the population, though it will be an elongated challenge to restore a more normalized employment environment with perhaps the more pervasive legacy of the COVID-19 crisis being underemployment. As we look at the employment situation combined with sizable increases in public and private debt, we must consider how much of the pain has been postponed. Government actions undoubtably avoided liquidity issues from immediately turning into a more cataclysmic solvency crisis, but the degree to which financial markets have disconnected from the real economy gives us pause. This is not meant to convey a draconian outlook for the US economy and markets but more to suggest current valuations are a consideration and long-term expected returns should be evaluated conservatively.
Following significant cuts in the Federal Funds rate in March we are once again in an ultra-low interest rate environment. It is not surprising that growth has outperformed value given the growing cyclical nature of the value indexes. In order to resume manufacturing, travel and consumption in earnest going forward we need some assurance of public safety, whether through a broad understanding of herd immunity or a heavily vaccinated population. Surely there will be a recovery, but the longer the disruption to the economy the more trying the rebound will be for many cyclical stocks. On the other hand, many of the dynamic elements that have been drivers of the market for the past few years, such as ecommerce, cloud computing, big data analytics and medical genetics, continue to have traction into the future. An exposure to these types of secular and organic growth themes within the market is an important consideration for investors, particularly should the long-term growth environment of the economy remain tepid.
The North Square Multi Strategy Fund - Class I returned 7.17% for the year ending May 31, 2020 relative to 11.46% within the Russell 3000 Index and 24.99% for the Russell 3000 Growth Index. Growth equities remain an important element within the Multi Strategy. The North Square Oak Ridge Disciplined Growth Fund – Class I (+22.1%) has been a strong contributor to returns for the year. The strategy allocates opportunistically across growth companies and more recently heavily in the larger cap range. The FAAMG stocks (Facebook, Apple, Amazon, Microsoft and Google) have disproportionately contributed to returns. Even following healthy increases in share prices, the companies have had superior fundamental growth in the current environment and present visible and consistent growth trajectories. As growth stocks have continued to rampage higher; however, the strategy has more recently taken a more conservative view within the portfolio. The strategy’s overall quality-minded approach to growth investing resonates with the Multi Strategy’s cautious enthusiasm for growth equities looking forward. Our allocation to the North Square Oak Ridge Dividend Growth Fund – Class I (9.4%) was a detractor to returns in the year. The strategy has remained consistent in its discipline towards stable to growing businesses that continue to increase dividends to shareholders overtime. As a strategy that focuses on stable to growing companies with an ability to increase shareholder income over time, companies such as Amazon, Google and Facebook do not meet the yield requirement for inclusion within the strategy and are not owned by the Fund. Despite mild underperformance in the difficult first quarter of 2020, we are not dissuaded from the merit of holding stable companies at the core of the strategy and are encouraged at how well the quality driven approach has competed against a highly growth centric environment. Monetary and fiscal
measures punctuated what would likely have been a more disastrous drawdown in the market. Had the Federal Reserve not intervened we believe in the case of the Dividend Growth Fund that quality would have proven to be even more effective in preserving capital.
The largest detractor for the year was the North Square Dynamic Small Cap Fund – Class I (-0.4%). Recovery within small caps has been strong but has not made up for losses in the first quarter. In fact, the Russell 2000 has still not reached the former highs from September of 2018. We believe that over the next three to five years that Small Caps present one of the best return opportunities in US equity markets. In the near term there are higher tail risks in a few segments of the small cap universe, namely the growing share of unprofitable companies. The Dynamic Small Cap Fund, with its systematic approach across three main investment themes: Relative Value, Quality and Catalyst, has successfully generated alpha throughout the more challenging past few years for small cap managers. We remain confident that their flexible, diversified strategy will continue to successfully navigate what will likely continue to be a dynamic environment.
The Fund has sold out of the North Square Global Resources and Infrastructure Fund and North Square International Small Cap Fund. The Global Resources Fund was a detractor to returns over the preceding years. As most of our equity managers have had meaningful underweight positions to resource and infrastructure sectors such as energy, materials and utilities the Global Resources Fund provided specialized exposure to these under-represented areas. The strategy, however, maintained a heavy exposure to energy, particularly in exploration and production companies, throughout the volatile past few years. Following the sale of the International Small Cap Fund we have limited exposure to international equities. International equities (MSCI EAFE: -2.4%) and emerging market equities (MSCI EM: -4.0%) underperformed the US for the first half of the year. The US equity market environment has clearly become more volatile, but still appears to be a better near-term opportunity than most international markets.
Perhaps the boldest action of the Federal Reserve in the past few months was their announcement that they would provide directed support to the corporate bond market. The ensuing deluge of new issuances; however, has altered the allocation across the US aggregate bond universe with an influx of lower quality rated bonds. With the 10-year Treasury yield declining to 0.65% as of May 29, the fixed income investment environment will be more challenging going forward and given ongoing economic uncertainty it is questionable whether investors are being broadly compensated for potential risks in bonds below the highest quality investment ratings. As interest rates have compressed and spreads tightened our focus within the fixed income allocation has been towards non-traditional fixed income managers where managers can adjust across multiple bond categories to capitalize on relative opportunities in the dynamic fixed income environment. The portfolio management team for the recently added North Square Strategic Income Fund specializes in investing in preferred securities where they feel they can achieve higher yields without investing in lower quality companies. Results have been strong since the strategy was added to the Fund in late March as the team has been opportunistic during the recovery in fixed income markets.
In general, we continue to believe this environment to be most conducive to flexible active managers with a focus on evaluating the relative merits of fundamentals rather than broad index exposures. We believe we have a set of holdings that are well suited to navigate a more differentiating market environment within each of the funds’ areas of expertise. We appreciate your continued confidence in North Square Investments.
Sincerely,
David Klaskin
CIO & Senior Portfolio Manager
The views in this letter are those of the Fund’s direct advisor were as of July 30, 2020 and may not necessarily reflect the same views on the date this letter is first published or any date thereafter. These views are intended to help shareholders in understanding the fund’s investment methodology and do not constitute investment advice.
Investment in equity securities involves substantial risks and may be subject to wide and sudden fluctuations in market value. Investing in small and mid-cap companies may be subject to more abrupt or erratic market movements and may have lower trading volumes or more erratic trading than securities of larger companies. International investments are subject to unique risks including currency fluctuations, social, economic and political uncertainties, which could increase volatility. In addition, changes in exchange rates and interest rates may adversely affect the value of the fund’s foreign investments. Please see the prospectus for a more complete discussion of the fund’s risks.
The Russell 3000 Growth Index measures the performance of growth stocks across all market caps.
| Discussion of Fund Performance | |
A letter from David Klaskin, Chief Executive Officer and Chief Investment Officer of Oak Ridge Investments and lead portfolio manager of the North Square Oak Ridge Dividend Growth Fund.
Fellow Shareholders,
There have been many unprecedented occurrences as the result of COVID-19. This included the fastest decline of over 30% in history during a 33-day period in February and March, as the economy ground to a halt with the first ever shutdown of societies across the globe. The U.S. economy declined at a rate of 5% during the first quarter due to the closures in March and, despite the partial reopening of businesses, GDP is expected to decline an unimaginable 40% in the second quarter. Even knowing a 20% rebound was forecasted for GDP over the next three months due to pent-up demand, very few investors anticipated the ensuing rally that included the largest 50-day advance in history, which nearly erased all of the broad market declines for the year.
The gains were much greater in growth stocks. The Nasdaq Composite, which is heavily comprised of leading companies with strong earnings visibility in the technology and healthcare sectors, is shockingly 11% ahead of the S&P 500 Index for the year through May 31. Despite the significant economic disruption as a result of COVID-19, U.S. large cap growth indexes remarkably returned over 20% for the year ending May 31. The primary credit for the rapid turnaround from doomsday levels is owed to the swift and aggressive response around the globe in providing broad stimulus and targeted aid. There was no alternative to the unparalleled level of debt incurred to maintain order. It is impossible to determine how severe unemployment might have been without extraordinary incentives for employee retention. The damage to people and businesses has been uneven, as those deemed essential or able to thrive remotely and online, are mostly financially whole through this ordeal, while others are on the brink of despair. Cyclical stocks remain significantly lower for the year as their uncertain futures are more dependent on significant economic recovery, and in many cases, further government aid. Forecasts for a ‘V’-shaped recovery seem to ignore the need for businesses to recover what they lost during the shutdown by remaining cautious on expenditures, particularly given the uncertainty of the economic impact of the virus going forward.
The stock market is forward looking and there will clearly be easy comparisons and significant pent-up demand for everything from travel to elective medical procedures. While debt is high, significant government spending is earmarked for infrastructure improvements and interest rates should remain extremely low for a number of years, providing technology and innovation continue to keep inflation in check. There are few alternatives to the equity markets for retirees and pension plans in need of returns to meet their objectives, which should support stock prices. The largest stocks continue to lead the market, but over time, the averages are likely to level off and new leaders and surviving long standing businesses will attract investor interest and reward active management.
The North Square Oak Ridge Dividend Growth Fund - Class I Shares returned 9.35% compared to the S&P 500 Index, which returned 12.84% for the year ending May 31, 2020. The crisis surrounding COVID-19 has accelerated many of the trends that were benefiting the largest growth companies over past few years. As a strategy that focuses on stable to growing companies with an ability to increase shareholder income over time, companies such as Amazon (+37.6%), Google (+29.6%) and Facebook (+26.8%) do not meet the yield requirement for inclusion within the strategy and are not owned by the Fund. These three companies collectively detracted 1.4% from relative returns for the year. Our approach leads to cash flow-oriented businesses that have historically performed well in difficult market environments, which we believe results in superior compounded returns in the long run. Over the trailing three years, which includes periods such as the fourth quarter of 2018 (S&P 500: -13.5%) and the first quarter of 2020 (S&P 500: -19.6%), the North Square Oak Ridge Dividend Growth Fund - Class I Shares returned 10.67% compared to the S&P 500, which returned 10.23%.
The financials sector was the strongest contributor to relative returns for the year. Capital markets firms, Blackstone Group (+55.7%) and BlackRock (+31.4%), were resilient amidst a fractious environment for financial companies. Similarly, recent additions within the real estate sector Prologis (-1.6%) and American Tower Corporation (+7.1%), were brighter areas of an otherwise negative performing sector over the past year. Information technology, communication services and the Fund’s cash and equivalents position were the primary detractors for the quarter. As mentioned previously, many high growth companies are outside of the investment guidelines due to their lack of a dividend. In addition to Google and Facebook, within communication services, companies such as NVIDIA (+162.7%; semiconductors) and PayPal (+41.3%; IT services) within information technology performed remarkably over the past year but were not owned. We believe that Qualcomm (+25.0%) and recently added Broadcom (+4.7%) within semiconductors, which both contributed positively to relative returns, have a stable outlook for their businesses and the potential for yield makes them attractive companies to own.
We remain constructive on our portfolio and acknowledge that the unfolding public health and resulting economic crisis have not been resolved. Dividends were less of a focus for the markets over the past year; nevertheless, we believe the Dividend Growth Fund can add value to the long-term investor’s overall allocation. Stable cash flows and an opportunity for shareholder income should appeal to investors as the rapidly shifting market environment continues.
Thank you for your continued confidence in Oak Ridge Investments.
Sincerely,
David Klaskin
CIO & Senior Portfolio Manager
The views in this letter are those of the Fund’s direct advisor were as of July 30, 2020 and may not necessarily reflect the same views on the date this letter is first published or any date thereafter. These views are intended to help shareholders in understanding the fund’s investment methodology and do not constitute investment advice.
Investment in equity securities involves substantial risks and may be subject to wide and sudden fluctuations in market value. Investing in small and mid-cap companies may be subject to more abrupt or erratic market movements and may have lower trading volumes or more erratic trading than securities of larger companies. Please see the prospectus for a more complete discussion of the fund’s risks.
The S&P 500 Index measures the performance of the largest 500 U.S. stocks.
North Square Oak Ridge Small Cap Growth Fund
FUND PERFORMANCE at May 31, 2020 (Unaudited)
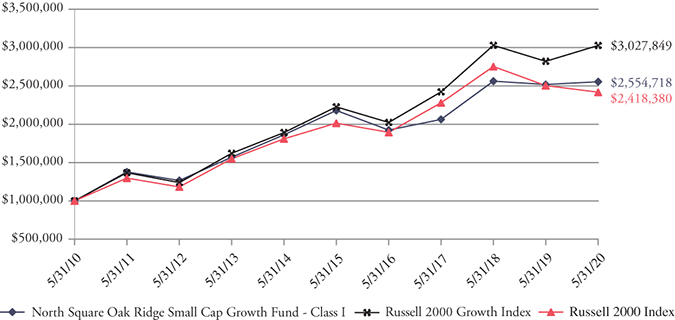
Performance of a $1,000,000 Investment
This graph compares a hypothetical $1,000,000 investment in the Fund’s Class I shares (the Class with the largest net assets), made on May 31, 2010, with a similar investment in the Russell 2000 Growth Index and the Russell 2000 Index. The performance graph above is shown for the Fund’s Class I shares; Class A, Class C, and Class K shares performance may vary. Results include the reinvestment of all dividends and capital gains.
The Russell 2000 Growth Index measures the performance of U.S. small cap growth stocks. The Russell 2000 Index measures the performance of the small cap segment of the U.S. equity universe. These indices do not reflect expenses, fees or sales charge, which would lower performance. The indices are unmanaged and they are not available for investment.
| | | | | Since | Inception |
Average Annual Total Returns as of May 31, 2020 | 1 Year | 5 Year | 10 Year | Inception | Date |
| Before deducting maximum sales charge | | | | | |
Class A1 | 1.16% | 2.92% | 9.48% | 9.40% | 01/03/94 |
Class C2 | 0.39% | 2.16% | 8.66% | 7.12% | 03/01/97 |
Class I3 | 1.41% | 3.22% | 9.83% | 9.77% | 12/29/09 |
Class K3 | 1.56% | 3.37% | N/A | 8.64% | 12/20/12 |
| After deducting maximum sales charge | | | | | |
Class A1 | -4.66%
| 1.71% | 8.84% | 9.16% | 01/03/94 |
Class C2 | -0.17%
| 2.16% | 8.66% | 7.12% | 03/01/97 |
| Russell 2000 Growth Index | 7.32% | 6.34% | 11.72%
| 7.34% | 01/03/94 |
| Russell 2000 Index | -3.44%
| 3.72% | 9.23% | 8.08% | 01/03/94 |
1 | Maximum sales charge for Class A shares is 5.75%. No initial sales charge applies on investments of $500,000 or more, but a contingent deferred sales charge (“CDSC”) of 1.00% will be imposed on certain redemptions of such shares within 12 months of the date of purchase. |
2 | A CDSC of 1.00% will be charged on Class C Shares purchases that are redeemed in whole or in part within 12 months of the date of purchase. |
3 | Class I and Class K shares do not have any initial or contingent deferred sales charge. |
The Fund acquired all assets and assumed the liabilities of the Oak Ridge Small Cap Growth Fund (the “Predecessor Fund”) effective the close of business on May 10, 2019. As a result of the reorganization, the Fund is the accounting successor of the Predecessor Fund. Performance results shown in the table above for periods prior to the close of business on May 10, 2019 reflect the performance of the Predecessor Fund.
North Square Oak Ridge Small Cap Growth Fund
FUND PERFORMANCE at May 31, 2020 (Unaudited) – Continued
The performance data quoted here represents past performance and past performance is not a guarantee of future results. Investment return and principal value will fluctuate so that an investor’s shares, when redeemed, may be worth more or less than their original cost. Current performance may be lower or higher than the performance information quoted. The most recent month end performance may be obtained by calling 1-855-551-5521.
Gross and net expense ratios for Class A shares were 1.46% and 1.38%, for Class C shares were 2.19% and 2.11%, for Class I shares were 1.22% and 1.14%, and for Class K shares were 1.08% and 1.00%, which were the amounts stated in the current prospectus dated September 27, 2019. Expense ratios reported for other periods in the Financial Highlights section of this report may differ. The Fund’s advisor has contractually agreed to waive its fees and/or pay for operating expenses of the Fund to ensure that total annual fund operating expenses do not exceed 1.39%, 2.14%, 1.14%, and 0.99% of the average daily net assets of the Fund’s Class A, Class C, Class I, and Class K shares, respectively. This agreement is in effect until September 30, 2021, and it may be terminated before that date only by the Trust’s Board of Trustees. In the absence of such waivers, the Fund’s returns would have been lower.
Returns reflect the reinvestment of distributions made by the Fund, if any. The graph and performance table shown do not reflect the deduction of taxes that a shareholder would pay on Fund distributions or the redemption of Fund shares.
North Square Dynamic Small Cap Fund
FUND PERFORMANCE at May 31, 2020 (Unaudited)
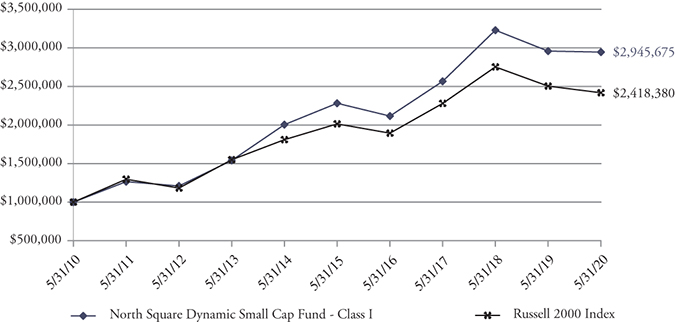
Performance of a $1,000,000 Investment
This graph compares a hypothetical $1,000,000 investment in the Fund’s Class I shares, made on May 31, 2010, with a similar investment in the Russell 2000 Index. Results include the reinvestment of all dividends and capital gains.
The Russell 2000 Index measures the performance of the small cap segment of the U.S. equity universe. The index does not reflect expenses, fees or sales charge, which would lower performance. The index is unmanaged and it is not available for investment.
| | | | | Since | Inception |
Average Annual Total Returns as of May 31, 2020 | 1 Year | 5 Year | 10 Year | Inception | Date |
| Class I | -0.44% | 5.24% | 11.41% | 11.92% | 11/01/08 |
| Russell 2000 Index | -3.44% | 3.72% | 9.23% | 10.11% | 11/01/08 |
The Fund acquired all assets and assumed the liabilities of the Oak Ridge Dynamic Small Cap Fund (the “Predecessor Fund”) effective the close of business on May 10, 2019. The Predecessor Fund commenced operations on September 30, 2015 after the conversion of the Algert Global U.S. Small Cap account (the “Predecessor Account”). As a result of each reorganization, the Fund is the accounting successor of each the Predecessor Fund and Predecessor Account. Performance results shown in the performance table above between May 10, 2019 and September 30, 2015 represent the performance of the Predecessor Fund, and performance results shown prior to September 30, 2015 represent the performance of the Predecessor Account. The Predecessor Account was not registered under the Investment Company Act of 1940, as amended (the “1940 Act”), and therefore was not subject to certain restrictions imposed by the 1940 Act on registered investment companies and by the Internal Revenue Code of 1986 on regulated investment companies. If the Predecessor Account had been registered under the 1940 Act, the Predecessor Account’s performance may have been adversely affected.
The performance data quoted here represents past performance and past performance is not a guarantee of future results. Investment return and principal value will fluctuate so that an investor’s shares, when redeemed, may be worth more or less than their original cost. Current performance may be lower or higher than the performance information quoted. The most recent month end performance may be obtained by calling 1-855-551-5521.
Gross and net expense ratios for Class I shares were 2.02% and 1.15%, respectively, which were the amounts stated in the current prospectus dated September 27, 2019. Expense ratios reported for other periods in the Financial Highlights section of this report may differ. The Fund’s advisor has contractually agreed to waive its fees and/or pay for operating expenses of the Fund to ensure that total annual fund operating expenses do not exceed 1.15% of the average daily net assets of the Fund’s Class I shares. This agreement is in effect until September 30, 2029, and it may be terminated before that date only by the Trust’s Board of Trustees. In the absence of such waivers, the Fund’s returns would have been lower.
Returns reflect the reinvestment of distributions made by the Fund, if any. The graph and performance table above do not reflect the deduction of taxes that a shareholder would pay on Fund distributions or the redemption of Fund shares.
North Square Oak Ridge Disciplined Growth Fund
FUND PERFORMANCE at May 31, 2020 (Unaudited)
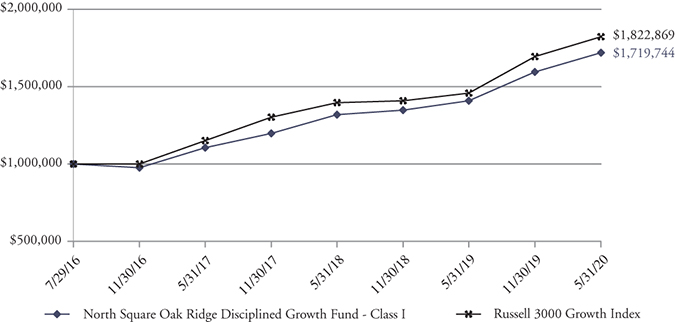
Performance of a $1,000,000 Investment
This graph compares a hypothetical $1,000,000 investment in the Fund’s Class I shares, made at its inception, with a similar investment in the Russell 3000 Growth Index. Results include the reinvestment of all dividends and capital gains.
The Russell 3000 Growth Index is a market capitalization weighted index and includes companies that display signs of above average growth. The index is used to provide a gauge of the performance of growth stocks in the U.S. This index does not reflect expenses, fees, or sales charge, which would lower performance. The index is unmanaged and it is not available for investment.
| | | | Since | Inception |
Average Annual Total Returns as of May 31, 2020 | 1 Year | 3 Year | Inception | Date |
| Class I | 22.05% | 15.86% | 15.17% | 07/29/16 |
| Russell 3000 Growth Index | 24.99% | 16.55% | 16.93% | 07/29/16 |
The Fund acquired all assets and assumed the liabilities of the Oak Ridge Disciplined Growth Fund (the “Predecessor Fund”) effective the close of business on May 10, 2019. As a result of the reorganization, the Fund is the accounting successor of the Predecessor Fund. Performance results shown in the table above for periods prior to the close of business on May 10, 2019 reflect the performance of the Predecessor Fund.
The performance data quoted here represents past performance and past performance is not a guarantee of future results. Investment return and principal value will fluctuate so that an investor’s shares, when redeemed, may be worth more or less than their original cost. Current performance may be lower or higher than the performance information quoted. The most recent month end performance may be obtained by calling 1-855-551-5521.
Gross and net expense ratios for the Class I shares were 2.04% and 0.95%, respectively, which were stated in the current prospectus dated September 27, 2019. Expense ratios reported for other periods in the Financial Highlights section of this report may differ. The Fund’s advisor has contractually agreed to waive its fees and/or pay for operating expenses of the Fund to ensure that total annual fund operating expenses does not exceed 0.95% of the average daily net assets of the Fund’s Class I shares. This agreement is in effect until September 30, 2029, and it may be terminated before that date only by the Trust’s Board of Trustees. In the absence of such waivers, the Fund’s returns would have been lower.
Returns reflect the reinvestment of distributions made by the Fund, if any. The graph and performance table above do not reflect the deduction of taxes that a shareholder would pay on Fund distributions or the redemption of the Fund shares.
North Square Multi Strategy Fund
FUND PERFORMANCE at May 31, 2020 (Unaudited)
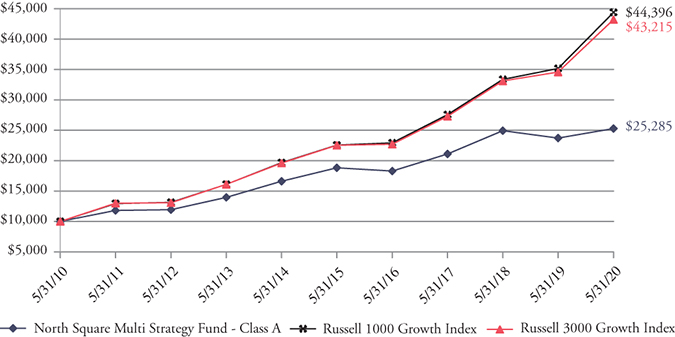
Performance of a $10,000 Investment
This graph compares a hypothetical $10,000 investment in the Fund’s Class A shares (assumes the maximum sales load charged by the Fund), made on May 31, 2010, with a similar investment in the Russell 1000 Growth Index and the Russell 3000 Growth Index. The performance graph above is shown for the Fund’s Class A shares; Class I and Class C shares performance may vary. Results include the reinvestment of all dividends and capital gains.
The Russell 1000 Growth Index measures the performance of U.S. large cap growth stocks. The Russell 3000 Growth Index is a market capitalization weighted index and includes companies that display signs of above average growth. These indices do not reflect expenses, fees or sales charge, which would lower performance. The indices are unmanaged and they are not available for investment.
| | | | | Since | Inception |
Average Annual Total Returns as of May 31, 2020 | 1 Year | 5 Year | 10 Year | Inception | Date |
| Before deducting maximum sales charge | | | | | |
Class A1 | 6.63% | 6.08% | 9.72% | 4.82% | 03/01/99 |
Class C2 | 5.75% | 5.22% | 8.78% | 5.12% | 02/13/04 |
Class I3 | 7.17% | 6.40% | 9.94% | 6.77% | 08/10/04 |
| After deducting maximum sales charge | | | | | |
Class A1 | 0.50% | 4.83% | 9.07% | 4.52% | 03/01/99 |
Class C2 | 4.76% | 5.22% | 8.78% | 5.12% | 02/13/04 |
| Russell 1000 Growth Index | 26.25% | 14.50% | 16.07% | 6.49% | 03/01/99 |
| Russell 3000 Growth Index | 24.99% | 13.91% | 15.76% | 6.53% | 03/01/99 |
1 | Maximum sales charge for Class A shares is 5.75%. No initial sales charge applies on investments of $500,000 or more, but a contingent deferred sales charge (“CDSC”) of 1.00% will be imposed on certain redemptions of such shares within 12 months of the date of purchase. |
2 | A CDSC of 1.00% will be charged on Class C Shares purchases that are redeemed in whole or in part within 12 months of the date of purchase. |
3 | Class I and Class K shares do not have any initial or contingent deferred sales charge. |
The Fund acquired all assets and assumed the liabilities of the Oak Ridge Multi Strategy Fund (the “Predecessor Fund”) effective the close of business on May 10, 2019. As a result of the reorganization, the Fund is the accounting successor of the Predecessor Fund. Performance results shown in the table above for periods prior to the close of business on May 10, 2019 reflect the performance of the Predecessor Fund.
North Square Multi Strategy Fund
FUND PERFORMANCE at May 31, 2020 (Unaudited) – Continued
The performance data quoted here represents past performance and past performance is not a guarantee of future results. Investment return and principal value will fluctuate so that an investor’s shares, when redeemed, may be worth more or less than their original cost. Current performance may be lower or higher than the performance information quoted. The most recent month end performance may be obtained by calling 1-855-551-5521.
Gross and net expense ratios for Class A shares were 1.32% and 1.50%, respectively, for Class C shares were 2.09% and 2.28%, respectively, and for Class I shares were 0.94% and 1.12%, respectively, which were the amounts stated in the current prospectus dated September 27, 2019. Expense ratios reported for other periods in the Financial Highlights section of this report may differ. The Fund’s advisor has contractually agreed to waive its fees and/or pay for operating expenses of the Fund to ensure that total annual fund operating expenses do not exceed 1.20%, 2.10%, and 1.17% of the average daily net assets of the Fund’s Class A, Class C, and Class I shares, respectively. This agreement is in effect until September 30, 2029, and it may be terminated before that date only by the Trust’s Board of Trustees. In the absence of such waivers, the Fund’s returns would have been lower.
Returns reflect the reinvestment of distributions made by the Fund, if any. The graph and performance table shown do not reflect the deduction of taxes that a shareholder would pay on Fund distributions or the redemption of Fund shares.
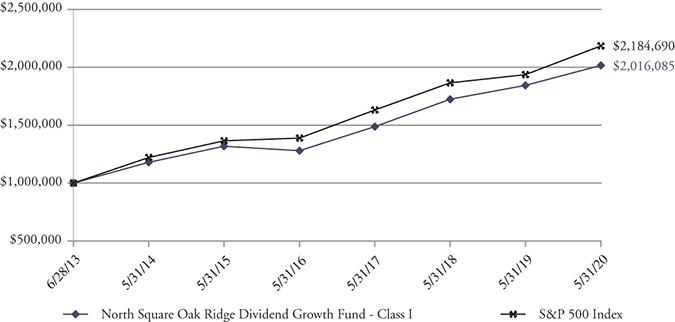
North Square Oak Ridge Dividend Growth Fund
FUND PERFORMANCE at May 31, 2020 (Unaudited)
Performance of a $1,000,000 Investment
This graph compares a hypothetical $1,000,000 investment in the Fund’s Class I shares, made at its inception, with a similar investment in the S&P 500 Index. Results include the reinvestment of all dividends and capital gains.
The S&P 500 Index measures the performance of primarily large cap U.S. stocks. The index does not reflect expenses, fees or sales charge, which would lower performance. The index is unmanaged and it is not available for investment.
| | | | | Since | Inception |
Average Annual Total Returns as of May 31, 2020 | 1 Year | 3 Year | 5 Year | Inception | Date |
| Class I | 9.35% | 10.67% | 8.87% | 10.66% | 06/28/13 |
| S&P 500 Index | 12.84% | 10.23% | 9.86% | 11.95% | 06/28/13 |
The Fund acquired all assets and assumed the liabilities of the Oak Ridge Dividend Growth Fund (the “Predecessor Fund”) effective the close of business on May 10, 2019. As a result of the reorganization, the Fund is the accounting successor of the Predecessor Fund. Performance results shown in the table above for periods prior to the close of business on May 10, 2019 reflect the performance of the Predecessor Fund.
The performance data quoted here represents past performance and past performance is not a guarantee of future results. Investment return and principal value will fluctuate so that an investor’s shares, when redeemed, may be worth more or less than their original cost. Current performance may be lower or higher than the performance information quoted. The most recent month end performance may be obtained by calling 1-855-551-5521.
Gross and net expense ratios for Class I shares were 2.38% and 1.00%, respectively, which were the amounts stated in the current prospectus dated September 27, 2019. Expense ratios reported for other periods in the Financial Highlights section of this report may differ. The Fund’s advisor has contractually agreed to waive its fees and/or pay for operating expenses of the Fund to ensure that total annual fund operating expenses do not exceed 1.00% of the average daily net assets of the Fund’s Class I shares. This agreement is in effect until September 30, 2029, and it may be terminated before that date only by the Trust’s Board of Trustees. In the absence of such waivers, the Fund’s returns would have been lower.
Returns reflect the reinvestment of distributions made by the Fund, if any. The graph and performance table above do not reflect the deduction of taxes that a shareholder would pay on Fund distributions or the redemption of Fund shares.
North Square Oak Ridge Small Cap Growth Fund
SCHEDULE OF INVESTMENTS
As of May 31, 2020
| Number | | | | | |
| of Shares | | | | Value | |
| | | COMMON STOCKS – 91.4% | | | |
| | | | | | |
| | | CONSUMER DISCRETIONARY – 13.5% | | | |
| | 7,981 | | Burlington Stores, Inc.* | | $ | 1,673,376 | |
| | 12,328 | | Five Below, Inc.* | | | 1,290,125 | |
| | 47,469 | | frontdoor, inc.* | | | 2,166,960 | |
| | 76,166 | | National Vision Holdings, Inc.* | | | 2,039,725 | |
| | 46,450 | | Ollie’s Bargain Outlet Holdings, Inc.* | | | 4,247,853 | |
| | 15,858 | | Pool Corp. | | | 4,266,119 | |
| | 56,789 | | YETI Holdings, Inc.* | | | 1,822,927 | |
| | | | | | | 17,507,085 | |
| | | | CONSUMER STAPLES – 6.8% | | | | |
| | 82,586 | | BJ’s Wholesale Club Holdings, Inc.* | | | 2,973,096 | |
| | 59,321 | | Grocery Outlet Holding Corp.* | | | 2,183,606 | |
| | 172,659 | | Nomad Foods Ltd.*1 | | | 3,656,918 | |
| | | | | | | 8,813,620 | |
| | | | FINANCIALS – 1.8% | | | | |
| | 7,950 | | Kinsale Capital Group, Inc. | | | 1,187,094 | |
| | 15,740 | | Palomar Holdings, Inc.* | | | 1,171,371 | |
| | | | | | | 2,358,465 | |
| | | | HEALTH CARE – 30.3% | | | | |
| | 13,845 | | Acceleron Pharma, Inc.* | | | 1,368,301 | |
| | 6,063 | | argenx SE – ADR*1 | | | 1,329,616 | |
| | 34,017 | | Arrowhead Pharmaceuticals, Inc.* | | | 1,096,708 | |
| | 10,874 | | Axsome Therapeutics, Inc.* | | | 837,081 | |
| | 12,298 | | Blueprint Medicines Corp.* | | | 801,092 | |
| | 32,055 | | CONMED Corp. | | | 2,353,158 | |
| | 108,190 | | Heron Therapeutics, Inc.* | | | 1,971,222 | |
| | 93,309 | | Horizon Therapeutics PLC*1 | | | 4,733,566 | |
| | 20,383 | | Inspire Medical Systems, Inc.* | | | 1,662,030 | |
| | 6,069 | | Insulet Corp.* | | | 1,144,431 | |
| | 8,612 | | Intercept Pharmaceuticals, Inc.* | | | 622,303 | |
| | 19,801 | | LHC Group, Inc.* | | | 3,217,860 | |
| | 17,144 | | Ligand Pharmaceuticals Inc.* | | | 1,741,316 | |
| | 58,127 | | Livongo Health, Inc.* | | | 3,483,551 | |
| | 5,104 | | Mesa Laboratories, Inc. | | | 1,348,732 | |
| | 108,473 | | NeoGenomics, Inc.* | | | 2,895,144 | |
| | 34,889 | | Omnicell, Inc.* | | | 2,334,423 | |
| | 22,577 | | OrthoPediatrics Corp.* | | | 1,041,477 | |
| | 28,550 | | Oyster Point Pharma, Inc.* | | | 812,533 | |
| | 10,948 | | Penumbra, Inc.* | | | 1,887,654 | |
| | 48,446 | | Retrophin, Inc.* | | | 759,876 | |
| | 7,398 | | Sarepta Therapeutics, Inc.* | | | 1,126,493 | |
| | 20,900 | | Zogenix, Inc.* | | | 608,817 | |
| | | | | | | 39,177,384 | |
See accompanying Notes to Financial Statements.
North Square Oak Ridge Small Cap Growth Fund
SCHEDULE OF INVESTMENTS – Continued
As of May 31, 2020
| Number | | | | | |
| of Shares | | | | Value | |
| | | COMMON STOCKS (Continued) | | | |
| | | | | | |
| | | INDUSTRIALS – 17.4% | | | |
| | 91,950 | | Advanced Disposal Services, Inc.* | | $ | 2,867,001 | |
| | 78,097 | | Casella Waste Systems, Inc. – Class A* | | | 3,979,042 | |
| | 59,588 | | Colfax Corp.* | | | 1,672,039 | |
| | 48,058 | | Construction Partners, Inc. – Class A* | | | 850,627 | |
| | 41,938 | | Cubic Corp. | | | 1,728,265 | |
| | 21,821 | | John Bean Technologies Corp. | | | 1,792,595 | |
| | 26,299 | | Mercury Systems, Inc.* | | | 2,349,816 | |
| | 13,443 | | RBC Bearings, Inc.* | | | 1,890,758 | |
| | 19,078 | | Saia, Inc.* | | | 2,068,818 | |
| | 21,632 | | SiteOne Landscape Supply, Inc.* | | | 2,299,698 | |
| | 17,900 | | Vicor Corp.* | | | 1,091,542 | |
| | | | | | | 22,590,201 | |
| | | | INFORMATION TECHNOLOGY – 21.6% | | | | |
| | 52,943 | | The Descartes Systems Group Inc.*1 | | | 2,519,557 | |
| | 47,264 | | Envestnet, Inc.* | | | 3,431,839 | |
| | 9,721 | | EPAM Systems, Inc.* | | | 2,242,051 | |
| | 26,448 | | Euronet Worldwide, Inc.* | | | 2,505,419 | |
| | 19,385 | | Everbridge, Inc.* | | | 2,835,250 | |
| | 32,144 | | Five9, Inc.* | | | 3,349,405 | |
| | 77,783 | | Lattice Semiconductor Corp.* | | | 1,934,463 | |
| | 12,486 | | Littelfuse, Inc. | | | 2,028,850 | |
| | 58,326 | | Perficient, Inc.* | | | 1,985,417 | |
| | 32,702 | | ShotSpotter, Inc.* | | | 760,322 | |
| | 59,152 | | Upland Software Inc.* | | | 2,043,702 | |
| | 15,306 | | WEX Inc.* | | | 2,266,513 | |
| | | | | | | 27,902,788 | |
| | | | TOTAL COMMON STOCKS | | | | |
| | | | (Cost $85,945,077) | | | 118,349,543 | |
| | | | | | | | |
| | | | REAL ESTATE INVESTMENT TRUSTS (REITS) – 3.8% | | | | |
| | 18,775 | | CoreSite Realty Corp. | | | 2,343,495 | |
| | 50,978 | | Terreno Realty Corp. | | | 2,609,564 | |
| | | | TOTAL REITS | | | | |
| | | | (Cost $4,194,819) | | | 4,953,059 | |
See accompanying Notes to Financial Statements.
North Square Oak Ridge Small Cap Growth Fund
SCHEDULE OF INVESTMENTS – Continued
As of May 31, 2020
| Number | | | | | |
| of Shares | | | | Value | |
| | | SHORT-TERM INVESTMENT – 7.1% | | | |
| | 9,123,003 | | First American Treasury Obligations Fund – Class X, 0.10%2 | | $ | 9,123,003 | |
| | | | TOTAL SHORT-TERM INVESTMENT | | | | |
| | | | (Cost $9,123,003) | | | 9,123,003 | |
| | | | TOTAL INVESTMENTS – 102.3% | | | | |
| | | | (Cost $99,262,899) | | | 132,425,605 | |
| | | | Liabilities in Excess of Other Assets – (2.3)% | | | (2,998,228 | ) |
| | | | TOTAL NET ASSETS – 100.0% | | $ | 129,427,377 | |
ADR – American Depositary Receipt
PLC – Public Limited Company
| * | Non-Income producing security. |
1 | Foreign security denominated in U.S. Dollars. |
2 | The rate is the annualized seven-day yield at period end. |
Investments are classified by industry pursuant to the Global Industry Classification Standard (GICS®), which was developed by and/or is the exclusive property of Morgan Stanley Capital International, Inc. (“MSCI”) and Standard & Poor’s Financial Services LLC (“S&P”). GICS is a service mark of MSCI and S&P and has been licensed for use by U.S. Bancorp Fund Services, LLC.
See accompanying Notes to Financial Statements.
North Square Oak Ridge Small Cap Growth Fund
SUMMARY OF INVESTMENTS
As of May 31, 2020
| | Percent of Total |
| Security Type/Sector | Net Assets |
| Common Stocks | | | | |
| Health Care | | | 30.3 | % | |
| Information Technology | | | 21.6 | % | |
| Industrials | | | 17.4 | % | |
| Consumer Discretionary | | | 13.5 | % | |
| Consumer Staples | | | 6.8 | % | |
| Financials | | | 1.8 | % | |
| Total Common Stocks | | | 91.4 | % | |
| REITs | | | 3.8 | % | |
| Short-Term Investment | | | 7.1 | % | |
| Total Investments | | | 102.3 | % | |
| Liabilities in Excess of Other Assets | | | (2.3 | )% | |
| Total Net Assets | | | 100.0 | % | |
See accompanying Notes to Financial Statements.
North Square Dynamic Small Cap Fund
SCHEDULE OF INVESTMENTS
As of May 31, 2020
| Number | | | | | |
| of Shares | | | | Value | |
| | | COMMON STOCKS – 95.4% | | | |
| | | | | | |
| | | COMMUNICATION SERVICES – 4.5% | | | |
| | 170 | | ATN International, Inc. | | $ | 10,098 | |
| | 560 | | Bandwidth, Inc. – Class A* | | | 62,076 | |
| | 2,980 | | Boingo Wireless, Inc.* | | | 40,826 | |
| | 3,160 | | Cogent Communications Holdings, Inc. | | | 241,803 | |
| | 2,090 | | EverQuote, Inc. – Class A* | | | 112,693 | |
| | 5,000 | | Ooma, Inc.* | | | 62,700 | |
| | 2,230 | | Scholastic Corp. | | | 65,562 | |
| | 7,850 | | TrueCar, Inc.* | | | 21,195 | |
| | 2,150 | | United States Cellular Corp.* | | | 67,746 | |
| | 310 | | World Wrestling Entertainment, Inc. – Class A | | | 14,344 | |
| | | | | | | 699,043 | |
| | | | CONSUMER DISCRETIONARY – 13.3% | | | | |
| | 3,634 | | American Outdoor Brands Corp.* | | | 42,954 | |
| | 1,640 | | Boot Barn Holdings, Inc.* | | | 35,227 | |
| | 3,680 | | Callaway Golf Co. | | | 56,378 | |
| | 8,660 | | Core-Mark Holding Co., Inc. | | | 242,307 | |
| | 560 | | Five Below, Inc.* | | | 58,604 | |
| | 810 | | Floor & Decor Holdings, Inc. – Class A* | | | 42,120 | |
| | 1,240 | | Fox Factory Holding Corp.* | | | 89,416 | |
| | 6,450 | | Hilton Grand Vacations Inc.* | | | 138,933 | |
| | 1,230 | | LCI Industries | | | 121,684 | |
| | 630 | | LGI Homes, Inc.* | | | 52,555 | |
| | 2,600 | | MarineMax, Inc.* | | | 49,478 | |
| | 2,830 | | M.D.C. Holdings, Inc. | | | 96,192 | |
| | 1,420 | | Ollie’s Bargain Outlet Holdings, Inc.* | | | 129,859 | |
| | 4,329 | | Perdoceo Education Corp.* | | | 70,476 | |
| | 2,590 | | PetMed Express, Inc. | | | 93,499 | |
| | 6,076 | | PlayAGS, Inc.* | | | 31,656 | |
| | 12,340 | | Red Rock Resorts, Inc. – Class A | | | 170,292 | |
| | 1,570 | | Scientific Games Corp.* | | | 24,696 | |
| | 230 | | Stamps.com, Inc.* | | | 45,574 | |
| | 2,370 | | Stitch Fix, Inc. – Class A* | | | 54,794 | |
| | 500 | | Sturm Ruger & Co, Inc. | | | 31,170 | |
| | 730 | | TopBuild Corp.* | | | 83,724 | |
| | 1,693 | | Wingstop, Inc. | | | 206,461 | |
| | 730 | | YETI Holdings, Inc.* | | | 23,433 | |
| | 2,972 | | Zumiez Inc.* | | | 72,428 | |
| | | | | | | 2,063,910 | |
| | | | CONSUMER STAPLES – 4.4% | | | | |
| | 290 | | Beyond Meat, Inc.* | | | 37,204 | |
| | 2,420 | | The Chefs’ Warehouse, Inc. | | | 35,816 | |
| | 1,940 | | Freshpet, Inc.* | | | 149,729 | |
| | 1,800 | | Inter Parfums, Inc. | | | 83,538 | |
| | 1,050 | | J&J Snack Foods Corp. | | | 135,062 | |
| | 1,130 | | Lancaster Colony Corp. | | | 173,410 | |
| | 2,180 | | The Simply Good Foods Co. | | | 37,125 | |
| | 1,154 | | Turning Point Brands, Inc. | | | 27,684 | |
| | | | | | | 679,568 | |
See accompanying Notes to Financial Statements.
North Square Dynamic Small Cap Fund
SCHEDULE OF INVESTMENTS – Continued
As of May 31, 2020
| Number | | | | | |
| of Shares | | | | Value | |
| | | COMMON STOCKS (Continued) | | | |
| | | | | | |
| | | ENERGY – 1.6% | | | |
| | 4,314 | | Cactus, Inc. – Class A | | $ | 82,311 | |
| | 5,380 | | GasLog Ltd.2 | | | 18,454 | |
| | 4,780 | | International Seaways, Inc.2 | | | 108,410 | |
| | 1,403 | | Matrix Service Co.* | | | 15,461 | |
| | 1,170 | | Scorpio Tankers Inc.2 | | | 20,756 | |
| | | | | | | 245,392 | |
| | | | FINANCIALS – 9.1% | | | | |
| | 7,335 | | Bank OZK | | | 164,964 | |
| | 3,437 | | Brightsphere Investment Group Inc. | | | 28,699 | |
| | 9,588 | | First BanCorp.2 | | | 52,446 | |
| | 930 | | Great Western Bancorp, Inc. | | | 13,243 | |
| | 2,950 | | IBERIABANK Corp. | | | 125,109 | |
| | 6,675 | | International Bancshares Corp. | | | 205,456 | |
| | 12,849 | | National General Holdings Corp. | | | 260,835 | |
| | 2,557 | | NMI Holdings, Inc. – Class A* | | | 39,288 | |
| | 2,220 | | Peapack-Gladstone Financial Corp. | | | 41,803 | |
| | 780 | | Primerica, Inc. | | | 88,639 | |
| | 3,540 | | Univest Financial Corp. | | | 58,198 | |
| | 3,291 | | Walker & Dunlop, Inc. | | | 133,286 | |
| | 5,244 | | Western Alliance Bancorp | | | 200,059 | |
| | | | | | | 1,412,025 | |
| | | | HEALTH CARE – 20.8% | | | | |
| | 830 | | ACADIA Pharmaceuticals Inc.* | | | 41,234 | |
| | 210 | | Acceleron Pharma, Inc.* | | | 20,754 | |
| | 1,835 | | Addus HomeCare Corp.* | | | 181,592 | |
| | 2,063 | | Adverum Biotechnologies, Inc.* | | | 42,560 | |
| | 1,950 | | Aerie Pharmaceuticals, Inc.* | | | 27,359 | |
| | 230 | | Amedisys, Inc.* | | | 44,172 | |
| | 7,100 | | Amicus Therapeutics, Inc.* | | | 88,573 | |
| | 990 | | AMN Healthcare Services, Inc.* | | | 43,916 | |
| | 5,660 | | AnaptysBio, Inc.* | | | 107,993 | |
| | 2,980 | | Apellis Pharmaceuticals, Inc.* | | | 100,396 | |
| | 828 | | Arcus Biosciences, Inc.* | | | 25,958 | |
| | 7,324 | | Ardelyx, Inc.* | | | 53,685 | |
| | 2,360 | | Arvinas, Inc.* | | | 78,517 | |
| | 260 | | Ascendis Pharma A/S – ADR*2 | | | 37,827 | |
| | 11,180 | | BioDelivery Sciences International, Inc.* | | | 53,440 | |
| | 1,890 | | BioTelemetry, Inc.* | | | 89,170 | |
| | 810 | | Blueprint Medicines Corp.* | | | 52,763 | |
| | 1,010 | | ChemoCentryx, Inc.* | | | 63,014 | |
| | 640 | | China Biologic Products Holdings, Inc.*2 | | | 70,893 | |
| | 2,461 | | Constellation Pharmaceuticals, Inc.* | | | 87,439 | |
| | 380 | | Deciphera Pharmaceuticals, Inc.* | | | 22,257 | |
| | 10,417 | | Eiger BioPharmaceuticals, Inc.* | | | 125,733 | |
| | 2,655 | | Epizyme, Inc.* | | | 46,595 | |
| | 1,460 | | Globus Medical, Inc. – Class A* | | | 79,789 | |
| | 3,660 | | Iovance Biotherapeutics, Inc.* | | | 117,449 | |
See accompanying Notes to Financial Statements.
North Square Dynamic Small Cap Fund
SCHEDULE OF INVESTMENTS – Continued
As of May 31, 2020
| Number | | | | | |
| of Shares | | | | Value | |
| | | COMMON STOCKS (Continued) | | | |
| | | | | | |
| | | HEALTH CARE (Continued) | | | |
| | 230 | | iRhythm Technologies, Inc.* | | $ | 28,591 | |
| | 1,630 | | Kiniksa Pharmaceuticals, Ltd. – Class A*2 | | | 34,018 | |
| | 5,450 | | Kura Oncology, Inc.* | | | 93,141 | |
| | 1,820 | | Luminex Corp. | | | 56,711 | |
| | 2,450 | | Mersana Therapeutics, Inc.* | | | 55,468 | |
| | 1,050 | | Mirati Therapeutics, Inc.* | | | 104,150 | |
| | 1,510 | | Molecular Templates, Inc.* | | | 23,435 | |
| | 910 | | Momenta Pharmaceuticals, Inc.* | | | 28,647 | |
| | 3,630 | | Natera, Inc.* | | | 159,176 | |
| | 800 | | National Research Corp. | | | 45,376 | |
| | 2,210 | | NextGen Healthcare, Inc.* | | | 22,807 | |
| | 200 | | Omnicell, Inc.* | | | 13,382 | |
| | 471 | | Quidel Corp.* | | | 82,425 | |
| | 1,160 | | Rocket Pharmaceuticals, Inc.* | | | 21,820 | |
| | 3,420 | | Sage Therapeutics, Inc.* | | | 122,162 | |
| | 3,642 | | Simulations Plus, Inc. | | | 184,540 | |
| | 2,230 | | STAAR Surgical Co.* | | | 86,524 | |
| | 1,740 | | Tactile Systems Technology, Inc.* | | | 84,303 | |
| | 1,900 | | Tandem Diabetes Care, Inc.* | | | 157,985 | |
| | 592 | | Twist Bioscience Corp.* | | | 22,466 | |
| | 400 | | uniQure NV*2 | | | 26,864 | |
| | 350 | | United Therapeutics Corp.* | | | 41,283 | |
| | 2,526 | | Voyager Therapeutics, Inc.* | | | 30,565 | |
| | | | | | | 3,228,917 | |
| | | | INDUSTRIALS – 15.7% | | | | |
| | 707 | | AAR Corp. | | | 14,260 | |
| | 6,210 | | BMC Stock Holdings Inc.* | | | 162,516 | |
| | 3,750 | | Comfort Systems USA, Inc. | | | 138,750 | |
| | 445 | | CSW Industrials, Inc. | | | 31,844 | |
| | 1,236 | | DXP Enterprises, Inc. of Texas* | | | 21,791 | |
| | 2,400 | | Encore Wire Corp. | | | 115,896 | |
| | 560 | | Exponent, Inc. | | | 41,574 | |
| | 9,185 | | Federal Signal Corp. | | | 267,651 | |
| | 1,080 | | Forward Air Corp. | | | 53,654 | |
| | 8,150 | | H&E Equipment Services, Inc. | | | 139,691 | |
| | 2,890 | | Healthcare Services Group, Inc. | | | 69,129 | |
| | 970 | | Insperity, Inc. | | | 50,285 | |
| | 1,802 | | Korn Ferry | | | 54,529 | |
| | 9,140 | | Marten Transport Ltd. | | | 233,893 | |
| | 3,973 | | McGrath RentCorp | | | 221,534 | |
| | 1,140 | | RBC Bearings, Inc.* | | | 160,341 | |
| | 860 | | Robert Half International, Inc. | | | 43,636 | |
| | 1,100 | | Rush Enterprises, Inc. – Class A | | | 45,782 | |
| | 4,470 | | Sunrun Inc.* | | | 74,649 | |
| | 2,020 | | Trex Co, Inc.* | | | 242,642 | |
| | 530 | | TriNet Group, Inc.* | | | 28,477 | |
| | 1,090 | | UFP Industries, Inc. | | | 49,846 | |
See accompanying Notes to Financial Statements.
North Square Dynamic Small Cap Fund
SCHEDULE OF INVESTMENTS – Continued
As of May 31, 2020
| Number | | | | | |
| of Shares | | | | Value | |
| | | COMMON STOCKS (Continued) | | | |
| | | | | | |
| | | INDUSTRIALS (Continued) | | | |
| | 1,270 | | Vicor Corp.* | | $ | 77,445 | |
| | 1,050 | | Watts Water Technologies, Inc. – Class A | | | 87,318 | |
| | | | | | | 2,427,133 | |
| | | | INFORMATION TECHNOLOGY – 18.6% | | | | |
| | 13,880 | | A10 Networks Inc.* | | | 94,384 | |
| | 660 | | Alarm.com Holdings, Inc.* | | | 31,211 | |
| | 1,930 | | Altair Engineering, Inc. – Class A* | | | 75,444 | |
| | 3,710 | | Amkor Technology, Inc.* | | | 39,252 | |
| | 1,240 | | Appfolio, Inc. – Class A* | | | 196,552 | |
| | 2,190 | | Axcelis Technologies, Inc.* | | | 58,801 | |
| | 19,740 | | Box, Inc. – Class A* | | | 394,405 | |
| | 2,910 | | Dolby Laboratories, Inc. – Class A | | | 176,724 | |
| | 720 | | DSP Group, Inc.* | | | 12,974 | |
| | 3,889 | | ePlus, Inc.* | | | 286,658 | |
| | 2,380 | | Fabrinet*2 | | | 152,177 | |
| | 474 | | Globant S.A.*2 | | | 66,460 | |
| | 29,411 | | Harmonic Inc.* | | | 158,525 | |
| | 1,410 | | Impinj, Inc.* | | | 36,448 | |
| | 8,580 | | Limelight Networks, Inc.* | | | 42,385 | |
| | 4,950 | | LivePerson, Inc.* | | | 185,378 | |
| | 5,402 | | MagnaChip Semiconductor Corp.* | | | 59,746 | |
| | 1,070 | | Manhattan Associates, Inc.* | | | 94,588 | |
| | 1,613 | | ManTech International Corp. – Class A | | | 125,395 | |
| | 3,140 | | National Instruments Corp. | | | 121,581 | |
| | 4,150 | | NeoPhotonics Corp.* | | | 35,981 | |
| | 7,833 | | OneSpan Inc.* | | | 159,167 | |
| | 1,010 | | PC Connection, Inc. | | | 43,713 | |
| | 4,770 | | Perficient, Inc.* | | | 162,371 | |
| | 1,620 | | Switch, Inc. – Class A | | | 30,958 | |
| | 1,139 | | TTEC Holdings, Inc. | | | 48,248 | |
| | | | | | | 2,889,526 | |
| | | | MATERIALS – 3.9% | | | | |
| | 10,580 | | Amyris, Inc.* | | | 39,464 | |
| | 4,300 | | Boise Cascade Co. | | | 146,329 | |
| | 2,558 | | Innospec Inc. | | | 197,196 | |
| | 7,310 | | Louisiana-Pacific Corp. | | | 172,589 | |
| | 513 | | Stepan Co. | | | 49,843 | |
| | | | | | | 605,421 | |
| | | | REAL ESTATE – 0.4% | | | | |
| | 2,030 | | Redfin Corp.* | | | 60,880 | |
| | | | | | | | |
| | | | UTILITIES – 3.1% | | | | |
| | 1,090 | | American States Water Co. | | | 89,391 | |
| | 870 | | Black Hills Corp. | | | 53,688 | |
| | 470 | | Otter Tail Corp. | | | 20,168 | |
| | 1,690 | | Portland General Electric Co. | | | 79,616 | |
| | 2,230 | | Southwest Gas Holdings, Inc. | | | 169,368 | |
See accompanying Notes to Financial Statements.
North Square Dynamic Small Cap Fund
SCHEDULE OF INVESTMENTS – Continued
As of May 31, 2020
| Number | | | | | |
| of Shares | | | | Value | |
| | | COMMON STOCKS (Continued) | | | |
| | | | | | |
| | | UTILITIES (Continued) | | | |
| | 1,250 | | Unitil Corp. | | $ | 60,212 | |
| | | | | | | 472,443 | |
| | | | TOTAL COMMON STOCKS | | | | |
| | | | (Cost $14,139,686) | | | 14,784,258 | |
| | | | | | | | |
| | | | REAL ESTATE INVESTMENT TRUSTS (REITS) – 3.2% | | | | |
| | 740 | | American Assets Trust, Inc. | | | 19,366 | |
| | 2,670 | | CareTrust REIT, Inc. | | | 49,742 | |
| | 12,020 | | Four Corners Property Trust, Inc. | | | 259,872 | |
| | 2,551 | | Hannon Armstrong Sustainable Infrastructure Capital, Inc. | | | 74,005 | |
| | 460 | | Innovative Industrial Properties, Inc. | | | 37,591 | |
| | 3,097 | | OUTFRONT Media Inc. | | | 43,482 | |
| | 320 | | Rexford Industrial Realty, Inc. | | | 12,736 | |
| | | | TOTAL REITS | | | | |
| | | | (Cost $585,539) | | | 496,794 | |
| | | | | | | | |
| | | | RIGHTS – 0.0% | | | | |
| | 7,920 | | NewStar Financial, Inc. CVR*1 | | | 5,544 | |
| | | | TOTAL RIGHTS | | | | |
| | | | (Cost $—) | | | 5,544 | |
| | | | | | | | |
| | | | SHORT-TERM INVESTMENT – 1.6% | | | | |
| | 250,690 | | First American Treasury Obligations Fund – Class X, 0.10%3 | | | 250,690 | |
| | | | TOTAL SHORT-TERM INVESTMENT | | | | |
| | | | (Cost $250,690) | | | 250,690 | |
| | | | TOTAL INVESTMENTS – 100.2% | | | | |
| | | | (Cost $14,975,915) | | | 15,537,286 | |
| | | | Liabilities in Excess of Other Assets – (0.2)% | | | (37,424 | ) |
| | | | TOTAL NET ASSETS – 100.0% | | $ | 15,499,862 | |
ADR – American Depositary Receipt
| * | Non-Income producing security. |
1 | Level 3 securities fair valued under procedures established by the Board of Trustees, represents 0.04% of Net Assets. The total value of these securities is $5,544. |
2 | Foreign security denominated in U.S. Dollars. |
3 | The rate is the annualized seven-day yield at period end. |
Investments are classified by industry pursuant to the Global Industry Classification Standard (GICS®), which was developed by and/or is the exclusive property of Morgan Stanley Capital International, Inc. (“MSCI”) and Standard & Poor’s Financial Services LLC (“S&P”). GICS is a service mark of MSCI and S&P and has been licensed for use by U.S. Bancorp Fund Services, LLC.
See accompanying Notes to Financial Statements.
North Square Dynamic Small Cap Fund
SUMMARY OF INVESTMENTS
As of May 31, 2020
| | Percent of Total |
| Security Type/Sector | Net Assets |
| Common Stocks | | | | |
| Health Care | | | 20.8 | % | |
| Information Technology | | | 18.6 | % | |
| Industrials | | | 15.7 | % | |
| Consumer Discretionary | | | 13.3 | % | |
| Financials | | | 9.1 | % | |
| Communication Services | | | 4.5 | % | |
| Consumer Staples | | | 4.4 | % | |
| Materials | | | 3.9 | % | |
| Utilities | | | 3.1 | % | |
| Energy | | | 1.6 | % | |
| Real Estate | | | 0.4 | % | |
| Total Common Stocks | | | 95.4 | % | |
| REITs | | | 3.2 | % | |
| Rights | | | 0.0 | % | |
| Short-Term Investment | | | 1.6 | % | |
| Total Investments | | | 100.2 | % | |
| Liabilities in Excess of Other Assets | | | (0.2 | )% | |
| Total Net Assets | | | 100.0 | % | |
See accompanying Notes to Financial Statements.
North Square Oak Ridge Disciplined Growth Fund
SCHEDULE OF INVESTMENTS
As of May 31, 2020
| Number | | | | | |
| of Shares | | | | Value | |
| | | COMMON STOCKS – 93.5% | | | |
| | | | | | |
| | | COMMUNICATION SERVICES – 12.4% | | | |
| | 906 | | Activision Blizzard, Inc. | | $ | 65,214 | |
| | 175 | | Alphabet Inc. – Class A* | | | 250,866 | |
| | 282 | | Alphabet Inc. – Class C* | | | 402,955 | |
| | 173 | | Charter Communications, Inc. – Class A* | | | 94,112 | |
| | 4,298 | | Comcast Corp. – Class A | | | 170,201 | |
| | 2,345 | | Facebook, Inc. – Class A* | | | 527,836 | |
| | | | | | | 1,511,184 | |
| | | | CONSUMER DISCRETIONARY – 9.7% | | | | |
| | 306 | | Amazon.com, Inc.* | | | 747,365 | |
| | 0 | | Kontoor Brands, Inc. | | | 0 | |
| | 2,732 | | Ross Stores, Inc. | | | 264,895 | |
| | 1,906 | | VF Corp. | | | 106,926 | |
| | 1,799 | | YETI Holdings, Inc.* | | | 57,748 | |
| | | | | | | 1,176,934 | |
| | | | CONSUMER STAPLES – 5.0% | | | | |
| | 4,168 | | The Coca-Cola Co. | | | 194,562 | |
| | 1,080 | | Costco Wholesale Corp. | | | 333,148 | |
| | 1,566 | | Unilever PLC – ADR1 | | | 84,642 | |
| | | | | | | 612,352 | |
| | | | FINANCIALS – 2.5% | | | | |
| | 2,344 | | Intercontinental Exchange, Inc. | | | 227,954 | |
| | 768 | | Marsh & McLennan Cos, Inc. | | | 81,347 | |
| | | | | | | 309,301 | |
| | | | HEALTH CARE – 14.3% | | | | |
| | 1,293 | | Abbott Laboratories | | | 122,732 | |
| | 807 | | Alexion Pharmaceuticals, Inc.* | | | 96,759 | |
| | 2,335 | | Bristol-Myers Squibb Co. | | | 139,446 | |
| | 1,406 | | Danaher Corp. | | | 234,254 | |
| | 360 | | Edwards Lifesciences Corp.* | | | 80,899 | |
| | 1,620 | | Eli Lilly and Co. | | | 247,779 | |
| | 520 | | Incyte Corp.* | | | 52,993 | |
| | 546 | | Inspire Medical Systems, Inc.* | | | 44,521 | |
| | 661 | | LHC Group, Inc.* | | | 107,419 | |
| | 1,404 | | NeoGenomics, Inc.* | | | 37,473 | |
| | 750 | | Stryker Corp. | | | 146,797 | |
| | 1,026 | | UnitedHealth Group Inc. | | | 312,776 | |
| | 409 | | Vertex Pharmaceuticals Inc.* | | | 117,776 | |
| | | | | | | 1,741,624 | |
| | | | INDUSTRIALS – 7.7% | | | | |
| | 2,339 | | AMETEK, Inc. | | | 214,510 | |
| | 443 | | TransDigm Group, Inc. | | | 188,195 | |
| | 944 | | Verisk Analytics, Inc. | | | 163,010 | |
| | 3,919 | | Waste Connections, Inc.1 | | | 368,543 | |
| | | | | | | 934,258 | |
See accompanying Notes to Financial Statements.
North Square Oak Ridge Disciplined Growth Fund
SCHEDULE OF INVESTMENTS – Continued
As of May 31, 2020
| Number | | | | | |
| of Shares | | | | Value | |
| | | COMMON STOCKS (Continued) | | | |
| | | | | | |
| | | INFORMATION TECHNOLOGY – 39.7% | | | |
| | 1,114 | | ANSYS, Inc.* | | $ | 315,262 | |
| | 3,657 | | Apple Inc. | | | 1,162,707 | |
| | 302 | | Broadcom Inc. | | | 87,964 | |
| | 1,241 | | EPAM Systems, Inc.* | | | 286,224 | |
| | 866 | | Fidelity National Information Services, Inc. | | | 120,227 | |
| | 1,002 | | Five9, Inc.* | | | 104,408 | |
| | 992 | | Fortinet, Inc.* | | | 138,086 | |
| | 384 | | Intuit, Inc. | | | 111,483 | |
| | 550 | | KLA Corp. | | | 96,778 | |
| | 884 | | Mastercard Inc. – Class A | | | 265,987 | |
| | 5,578 | | Microsoft Corp. | | | 1,022,168 | |
| | 514 | | NVIDIA Corp. | | | 182,480 | |
| | 1,163 | | PayPal Holdings, Inc.* | | | 180,277 | |
| | 1,374 | | QUALCOMM Inc. | | | 111,129 | |
| | 1,114 | | salesforce.com, Inc.* | | | 194,716 | |
| | 273 | | ServiceNow, Inc.* | | | 105,905 | |
| | 1,819 | | Visa Inc. – Class A | | | 355,142 | |
| | | | | | | 4,840,943 | |
| | | | MATERIALS – 2.2% | | | | |
| | 1,269 | | Ecolab Inc. | | | 269,764 | |
| | | | TOTAL COMMON STOCKS | | | | |
| | | | (Cost $7,069,845) | | | 11,396,360 | |
| | | | | | | | |
| | | | REAL ESTATE INVESTMENT TRUSTS (REIT) – 1.1% | | | | |
| | 198 | | Equinix, Inc. | | | 138,131 | |
| | | | TOTAL REIT | | | | |
| | | | (Cost $105,181) | | | 138,131 | |
| | | | | | | | |
| | | | SHORT-TERM INVESTMENT – 5.6% | | | | |
| | 679,836 | | First American Treasury Obligations Fund – Class X, 0.10%2 | | | 679,836 | |
| | | | TOTAL SHORT-TERM INVESTMENT | | | | |
| | | | (Cost $679,836) | | | 679,836 | |
| | | | TOTAL INVESTMENTS – 100.2% | | | | |
| | | | (Cost $7,854,862) | | | 12,214,327 | |
| | | | Liabilities in Excess of Other Assets – (0.2)% | | | (23,631 | ) |
| | | | TOTAL NET ASSETS – 100.0% | | $ | 12,190,696 | |
ADR – American Depositary Receipt
PLC – Public Limited Company
| * | Non-Income producing security. |
1 | Foreign security denominated in U.S. Dollars. |
2 | The rate is the annualized seven-day yield at period end. |
Investments are classified by industry pursuant to the Global Industry Classification Standard (GICS®), which was developed by and/or is the exclusive property of Morgan Stanley Capital International, Inc. (“MSCI”) and Standard & Poor’s Financial Services LLC (“S&P”). GICS is a service mark of MSCI and S&P and has been licensed for use by U.S. Bancorp Fund Services, LLC.
See accompanying Notes to Financial Statements.
North Square Oak Ridge Disciplined Growth Fund
SUMMARY OF INVESTMENTS
As of May 31, 2020
| | Percent of Total |
| Security Type/Sector | Net Assets |
| Common Stocks | | | | |
| Information Technology | | | 39.7 | % | |
| Health Care | | | 14.3 | % | |
| Communication Services | | | 12.4 | % | |
| Consumer Discretionary | | | 9.7 | % | |
| Industrials | | | 7.7 | % | |
| Consumer Staples | | | 5.0 | % | |
| Financials | | | 2.5 | % | |
| Materials | | | 2.2 | % | |
| Total Common Stocks | | | 93.5 | % | |
| REIT | | | 1.1 | % | |
| Short-Term Investment | | | 5.6 | % | |
| Total Investments | | | 100.2 | % | |
| Liabilities in Excess of Other Assets | | | (0.2 | )% | |
| Total Net Assets | | | 100.0 | % | |
See accompanying Notes to Financial Statements.
North Square Multi Strategy Fund
SCHEDULE OF INVESTMENTS
As of May 31, 2020
| Number | | | | | |
| of Shares | | | | Value | |
| | | MUTUAL FUNDS – 93.5% | | | |
| | 165,296 | | Bramshill Income Performance Fund – Class I | | $ | 1,624,863 | |
| | 1,275,860 | | North Square Dynamic Small Cap Fund – Class I1 | | | 14,625,699 | |
| | 725,126 | | North Square Oak Ridge Disciplined Growth Fund – Class I1 | | | 11,777,503 | |
| | 604,682 | | North Square Oak Ridge Dividend Growth Fund – Class I1 | | | 10,565,429 | |
| | 113,000 | | North Square Strategic Income Fund – Class I1 | | | 1,107,398 | |
| | 198,941 | | Wavelength Interest Rate Neutral Fund | | | 2,059,042 | |
| | | | TOTAL MUTUAL FUNDS | | | | |
| | | | (Cost $37,028,744) | | | 41,759,934 | |
| | | | | | | | |
| | | | SHORT-TERM INVESTMENT – 6.9% | | | | |
| | 3,099,328 | | First American Treasury Obligations Fund – Class X, 0.10%2 | | | 3,099,328 | |
| | | | TOTAL SHORT-TERM INVESTMENT | | | | |
| | | | (Cost $3,099,328) | | | 3,099,328 | |
| | | | TOTAL INVESTMENTS – 100.4% | | | | |
| | | | (Cost $40,128,072) | | | 44,859,262 | |
| | | | Liabilities in Excess of Other Assets – (0.4)% | | | (199,544 | ) |
| | | | TOTAL NET ASSETS – 100.0% | | $ | 44,659,718 | |
1 | Affiliated company. See Note 11. |
2 | The rate is the annualized seven-day yield at period end. |
Investments are classified by industry pursuant to the Global Industry Classification Standard (GICS®), which was developed by and/or is the exclusive property of Morgan Stanley Capital International, Inc. (“MSCI”) and Standard & Poor’s Financial Services LLC (“S&P”). GICS is a service mark of MSCI and S&P and has been licensed for use by U.S. Bancorp Fund Services, LLC.
See accompanying Notes to Financial Statements.
North Square Multi Strategy Fund
SUMMARY OF INVESTMENTS
As of May 31, 2020
| | Percent of Total |
| Security Type/Sector | Net Assets |
| Mutual Funds | | | 93.5 | % | |
| Short-Term Investment | | | 6.9 | % | |
| Total Investments | | | 100.4 | % | |
| Liabilities in Excess of Other Assets | | | (0.4 | )% | |
| Total Net Assets | | | 100.0 | % | |
See accompanying Notes to Financial Statements.
North Square Oak Ridge Dividend Growth Fund
SCHEDULE OF INVESTMENTS
As of May 31, 2020
| Number | | | | | |
| of Shares | | | | Value | |
| | | COMMON STOCKS – 98.4% | | | |
| | | | | | |
| | | COMMUNICATION SERVICES – 3.4% | | | |
| | 6,599 | | Verizon Communications Inc. | | $ | 378,651 | |
| | | | | | | | |
| | | | CONSUMER DISCRETIONARY – 12.8% | | | | |
| | 1,892 | | The Home Depot, Inc. | | | 470,124 | |
| | 4,121 | | Target Corp. | | | 504,122 | |
| | 5,688 | | The TJX Co., Inc. | | | 300,099 | |
| | 2,830 | | VF Corp. | | | 158,763 | |
| | | | | | | 1,433,108 | |
| | | | CONSUMER STAPLES – 5.2% | | | | |
| | 7,014 | | The Coca-Cola Co. | | | 327,413 | |
| | 4,692 | | Unilever PLC – ADR1 | | | 253,603 | |
| | | | | | | 581,016 | |
| | | | ENERGY – 4.0% | | | | |
| | 2,112 | | Chevron Corp. | | | 193,671 | |
| | 15,793 | | Kinder Morgan, Inc. of Delaware | | | 249,529 | |
| | | | | | | 443,200 | |
| | | | FINANCIALS – 15.3% | | | | |
| | 831 | | BlackRock, Inc. | | | 439,300 | |
| | 8,020 | | The Blackstone Group Inc. – Class A | | | 455,536 | |
| | 2,038 | | CME Group Inc. | | | 372,139 | |
| | 4,474 | | JPMorgan Chase & Co. | | | 435,365 | |
| | | | | | | 1,702,340 | |
| | | | HEALTH CARE – 13.8% | | | | |
| | 3,050 | | AbbVie Inc. | | | 282,644 | |
| | 3,079 | | Eli Lilly and Co. | | | 470,933 | |
| | 3,593 | | Novartis AG – ADR1 | | | 314,136 | |
| | 1,540 | | UnitedHealth Group Inc. | | | 469,469 | |
| | | | | | | 1,537,182 | |
| | | | INDUSTRIALS – 9.7% | | | | |
| | 2,581 | | Stanley Black & Decker Inc. | | | 323,786 | |
| | 3,945 | | Waste Management, Inc. | | | 421,129 | |
| | 1,911 | | Watsco, Inc. | | | 339,986 | |
| | | | | | | 1,084,901 | |
| | | | INFORMATION TECHNOLOGY – 31.7% | | | | |
| | 2,024 | | Apple Inc. | | | 643,511 | |
| | 2,102 | | Automatic Data Processing, Inc. | | | 307,922 | |
| | 1,452 | | Broadcom Inc. | | | 422,924 | |
| | 8,124 | | Cisco Systems, Inc. | | | 388,490 | |
| | 3,021 | | Fidelity National Information Services, Inc. | | | 419,405 | |
| | 4,810 | | Microsoft Corp. | | | 881,432 | |
| | 5,807 | | QUALCOMM Inc. | | | 469,670 | |
| | | | | | | 3,533,354 | |
| | | | MATERIALS – 2.5% | | | | |
| | 1,378 | | Linde PLC1 | | | 278,824 | |
| | | | TOTAL COMMON STOCKS | | | | |
| | | | (Cost $8,267,795) | | | 10,972,576 | |
See accompanying Notes to Financial Statements.
North Square Oak Ridge Dividend Growth Fund
SCHEDULE OF INVESTMENTS – Continued
As of May 31, 2020
| Number | | | | | |
| of Shares | | | | Value | |
| | | REAL ESTATE INVESTMENT TRUSTS (REITS) – 6.6% | | | |
| | 1,286 | | American Tower Corp. | | $ | 332,007 | |
| | 4,355 | | Prologis, Inc. | | | 398,482 | |
| | | | TOTAL REITS | | | | |
| | | | (Cost $717,765) | | | 730,489 | |
| | | | | | | | |
| | | | SHORT-TERM INVESTMENT – 3.0% | | | | |
| | 333,086 | | First American Treasury Obligations Fund – Class X, 0.10%2 | | | 333,086 | |
| | | | TOTAL SHORT-TERM INVESTMENT | | | | |
| | | | (Cost $333,086) | | | 333,086 | |
| | | | TOTAL INVESTMENTS – 108.0% | | | | |
| | | | (Cost $9,318,646) | | | 12,036,151 | |
| | | | Liabilities in Excess of Other Assets – (8.0)% | | | (890,467 | ) |
| | | | TOTAL NET ASSETS – 100.0% | | $ | 11,145,684 | |
ADR – American Depositary Receipt
PLC – Public Limited Company
1 | Foreign security denominated in U.S. Dollars. |
2 | The rate is the annualized seven-day yield at period end. |
Investments are classified by industry pursuant to the Global Industry Classification Standard (GICS®), which was developed by and/or is the exclusive property of Morgan Stanley Capital International, Inc. (“MSCI”) and Standard & Poor’s Financial Services LLC (“S&P”). GICS is a service mark of MSCI and S&P and has been licensed for use by U.S. Bancorp Fund Services, LLC.
See accompanying Notes to Financial Statements.
North Square Oak Ridge Dividend Growth Fund
SUMMARY OF INVESTMENTS
As of May 31, 2020
| | Percent of Total |
| Security Type/Sector | Net Assets |
| Common Stocks | | | | |
| Information Technology | | | 31.7 | % | |
| Financials | | | 15.3 | % | |
| Health Care | | | 13.8 | % | |
| Consumer Discretionary | | | 12.8 | % | |
| Industrials | | | 9.7 | % | |
| Consumer Staples | | | 5.2 | % | |
| Energy | | | 4.0 | % | |
| Communication Services | | | 3.4 | % | |
| Materials | | | 2.5 | % | |
| Total Common Stocks | | | 98.4 | % | |
| REITs | | | 6.6 | % | |
| Short-Term Investment | | | 3.0 | % | |
| Total Investments | | | 108.0 | % | |
| Liabilities in Excess of Other Assets | | | (8.0 | )% | |
| Total Net Assets | | | 100.0 | % | |
See accompanying Notes to Financial Statements.
STATEMENTS OF ASSETS AND LIABILITIES
As of May 31, 2020
| | | North Square | | | | | | North Square | |
| | | Oak Ridge | | | North Square | | | Oak Ridge | |
| | | Small Cap | | | Dynamic | | | Disciplined | |
| | | Growth Fund | | | Small Cap Fund | | | Growth Fund | |
| Assets: | | | | | | | | | |
| Investments, at cost | | $ | 99,262,899 | | | $ | 14,975,915 | | | $ | 7,854,862 | |
| Investments, at value | | $ | 132,425,605 | | | $ | 15,537,286 | | | $ | 12,214,327 | |
| Cash | | | — | | | | 24 | | | | 11 | |
| Receivables: | | | | | | | | | | | | |
| Due from Advisor (Note 3) | | | 331,055 | | | | 39,201 | | | | 14,804 | |
| Investment securities sold | | | — | | | | 274,801 | | | | — | |
| Fund shares sold | | | 66,440 | | | | 70,478 | | | | — | |
| Dividends and interest | | | 9,859 | | | | 15,580 | | | | 6,421 | |
| Prepaid Expenses | | | 26,247 | | | | 19,182 | | | | 8,087 | |
| Total assets | | | 132,859,206 | | | | 15,956,552 | | | | 12,243,650 | |
| | | | | | | | | | | | | |
| Liabilities: | | | | | | | | | | | | |
| Payables: | | | | | | | | | | | | |
| Investment securities purchased | | | 2,395,943 | | | | 302,041 | | | | — | |
| Fund shares redeemed | | | 676,948 | | | | 71,730 | | | | — | |
| Due to custodian | | | 3,315 | | | | — | | | | — | |
| Accrued expenses: | | | | | | | | | | | | |
| Distribution fees (Note 7) | | | 22,051 | | | | 14 | | | | — | |
| Organizational and offering costs | | | 218,132 | | | | 28,993 | | | | 14,805 | |
| Fund administration fees | | | — | | | | 9,807 | | | | 5,945 | |
| Auditing fees | | | 57,521 | | | | 13,100 | | | | 10,900 | |
| Transfer agent fees | | | — | | | | 9,647 | | | | 5,920 | |
| Due to Trustees | | | 35,970 | | | | 3,691 | | | | 2,675 | |
| Shareholder servicing fees (Note 6) | | | 16,426 | | | | 10,564 | | | | 8,161 | |
| Chief Compliance Officer fees (Note 4) | | | 3,522 | | | | 374 | | | | 166 | |
| Accrued other expenses | | | 2,001 | | | | 6,729 | | | | 4,382 | |
| Total liabilities | | | 3,431,829 | | | | 456,690 | | | | 52,954 | |
| | | | | | | | | | | | | |
| Net Assets | | $ | 129,427,377 | | | $ | 15,499,862 | | | $ | 12,190,696 | |
| | | | | | | | | | | | | |
| Components of Net Assets: | | | | | | | | | | | | |
| Paid-in capital (par value of $0.01 per share | | | | | | | | | | | | |
| with an unlimited number of shares authorized) | | $ | 92,225,269 | | | $ | 16,018,272 | | | $ | 7,233,090 | |
| Total distributable earnings (loss) | | | 37,202,108 | | | | (518,410 | ) | | | 4,957,606 | |
| Net Assets | | $ | 129,427,377 | | | $ | 15,499,862 | | | $ | 12,190,696 | |
See accompanying Notes to Financial Statements.
STATEMENTS OF ASSETS AND LIABILITIES – Continued
As of May 31, 2020
| | | North Square | | | | | | North Square | |
| | | Oak Ridge | | | North Square | | | Oak Ridge | |
| | | Small Cap | | | Dynamic | | | Disciplined | |
| | | Growth Fund | | | Small Cap Fund* | | | Growth Fund | |
| Maximum Offering Price per Share: | | | | | | | | | |
| Class A Shares: | | | | | | | | | |
| Net assets applicable to shares outstanding | | $ | 73,973,264 | | | $ | — | | | $ | — | |
| Shares of beneficial interest issued and outstanding | | | 6,129,264 | | | | — | | | | — | |
| Redemption price | | | 12.07 | | | | — | | | | — | |
| Maximum sales charge (5.75% of offering price)** | | | 0.74 | | | | — | | | | — | |
| Maximum offering price to public | | $ | 12.81 | | | $ | — | | | $ | — | |
| | | | | | | | | | | | | |
| Class C Shares: | | | | | | | | | | | | |
| Net assets applicable to shares outstanding | | $ | 8,953,114 | | | $ | — | | | $ | — | |
| Shares of beneficial interest issued and outstanding | | | 3,547,151 | | | | — | | | | — | |
| Redemption price | | $ | 2.52 | | | $ | — | | | $ | — | |
| | | | | | | | | | | | | |
| Class I Shares: | | | | | | | | | | | | |
| Net assets applicable to shares outstanding | | $ | 40,165,124 | | | $ | 15,499,862 | | | $ | 12,190,696 | |
| Shares of beneficial interest issued and outstanding | | | 2,958,372 | | | | 1,351,995 | | | | 750,567 | |
| Redemption price | | $ | 13.58 | | | $ | 11.46 | | | $ | 16.24 | |
| | | | | | | | | | | | | |
| Class K Shares: | | | | | | | | | | | | |
| Net assets applicable to shares outstanding | | $ | 6,335,875 | | | $ | — | | | $ | — | |
| Shares of beneficial interest issued and outstanding | | | 473,434 | | | | — | | | | — | |
| Redemption price | | $ | 13.38 | | | $ | — | | | $ | — | |
| * | | At the close of business on May 29, 2020, Class A shares converted into Class I shares. |
| ** | | No sales charge applies on investments of $500,000 or more, but a Contingent Deferred Sales Charge (“CDSC”) of 1% will be imposed on certain redemptions of such shares within 12 months of the date of purchase. |
See accompanying Notes to Financial Statements.
STATEMENTS OF ASSETS AND LIABILITIES – Continued
As of May 31, 2020
| | | | | | North Square | |
| | | North Square | | | Oak Ridge | |
| | | Multi Strategy | | | Dividend | |
| | | Fund | | | Growth Fund | |
| Assets: | | | | | | |
| Investments, at cost | | $ | 6,814,904 | | | $ | 9,318,646 | |
| Investments in affiliated issuers, at cost | | | 33,313,168 | | | | — | |
| Investments, at value | | $ | 6,783,233 | | | $ | 12,036,151 | |
| Investments in affiliated issuers, at value | | | 38,076,029 | | | | — | |
| Cash | | | 3,819 | | | | 11 | |
| Receivables: | | | | | | | | |
| Due from Advisor (Note 3) | | | — | | | | 3,886 | |
| Fund shares sold | | | 2,696 | | | | 143,934 | |
| Dividends and interest | | | 121 | | | | 12,320 | |
| Prepaid Expenses | | | 18,247 | | | | 11,025 | |
| Total assets | | | 44,884,145 | | | | 12,207,327 | |
| | | | | | | | | |
| Liabilities: | | | | | | | | |
| Payables: | | | | | | | | |
| Investment securities purchased | | | 4,094 | | | | — | |
| Fund shares redeemed | | | 23,680 | | | | 1,015,392 | |
| Accrued expenses: | | | | | | | | |
| Advisory fees (Note 3) | | | 25,807 | | | | — | |
| Distribution fees (Note 7) | | | 10,052 | | | | 208 | |
| Organizational and offering costs | | | 60,588 | | | | 12,772 | |
| Fund administration fees | | | 22,664 | | | | 7,702 | |
| Auditing fees | | | 23,714 | | | | 11,200 | |
| Transfer agent fees | | | 20,817 | | | | 7,880 | |
| Due to Trustees | | | 10,576 | | | | 2,464 | |
| Shareholder servicing fees (Note 6) | | | 16,865 | | | | — | |
| Chief Compliance Officer fees (Note 4) | | | 237 | | | | 85 | |
| Accrued other expenses | | | 5,333 | | | | 3,940 | |
| Total liabilities | | | 224,427 | | | | 1,061,643 | |
| | | | | | | | | |
| Net Assets | | $ | 44,659,718 | | | $ | 11,145,684 | |
| | | | | | | | | |
| Components of Net Assets: | | | | | | | | |
| Paid-in capital (par value of $0.01 per share | | | | | | | | |
| with an unlimited number of shares authorized) | | $ | 40,153,757 | | | $ | 8,457,376 | |
| Total distributable earnings | | | 4,505,961 | | | | 2,688,308 | |
| Net Assets | | $ | 44,659,718 | | | $ | 11,145,684 | |
See accompanying Notes to Financial Statements.
STATEMENTS OF ASSETS AND LIABILITIES – Continued
As of May 31, 2020
| | | | | | North Square | |
| | | North Square | | | Oak Ridge | |
| | | Multi Strategy | | | Dividend | |
| | | Fund | | | Growth Fund* | |
| Maximum Offering Price per Share: | | | | | | |
| Class A Shares: | | | | | | |
| Net assets applicable to shares outstanding | | $ | 35,278,250 | | | $ | — | |
| Shares of beneficial interest issued and outstanding | | | 2,083,339 | | | | — | |
| Redemption price | | | 16.93 | | | | — | |
| Maximum sales charge (5.75% of offering price)** | | | 1.04 | | | | — | |
| Maximum offering price to public | | $ | 17.97 | | | $ | — | |
| | | | | | | | | |
| Class C Shares: | | | | | | | | |
| Net assets applicable to shares outstanding | | $ | 3,530,911 | | | $ | — | |
| Shares of beneficial interest issued and outstanding | | | 257,507 | | | | — | |
| Redemption price | | $ | 13.71 | | | $ | — | |
| | | | | | | | | |
| Class I Shares: | | | | | | | | |
| Net assets applicable to shares outstanding | | $ | 5,850,557 | | | $ | 11,145,684 | |
| Shares of beneficial interest issued and outstanding | | | 330,072 | | | | 637,893 | |
| Redemption price | | $ | 17.73 | | | $ | 17.47 | |
| * | | At the close of business on May 29, 2020, Class A shares converted into Class I shares. |
| ** | | No sales charge applies on investments of $500,000 or more, but a Contingent Deferred Sales Charge (“CDSC”) of 1% will be imposed on certain redemptions of such shares within 12 months of the date of purchase. |
See accompanying Notes to Financial Statements.
STATEMENTS OF OPERATIONS
For the Year Ended May 31, 2020
| | | North Square | | | | | | North Square | |
| | | Oak Ridge | | | North Square | | | Oak Ridge | |
| | | Small Cap | | | Dynamic | | | Disciplined | |
| | | Growth Fund | | | Small Cap Fund* | | | Growth Fund | |
| Investment Income: | | | | | | | | | |
| Dividends (net of foreign withholding taxes | | | | | | | | | |
| of $0, $416 and $722, respectively) | | $ | 361,844 | | | $ | 249,029 | | | $ | 137,911 | |
| Interest | | | 95,303 | | | | 3,893 | | | | 10,710 | |
| Total investment income | | | 457,147 | | | | 252,922 | | | | 148,621 | |
| Expenses: | | | | | | | | | | | | |
| Advisory fees | | | 1,405,230 | | | | 171,820 | | | | 90,959 | |
| Distribution fees – Class A (Note 7) | | | 229,753 | | | | 360 | | | | — | |
| Distribution fees – Class C (Note 7) | | | 145,004 | | | | — | | | | — | |
| Legal fees | | | 354,894 | | | | 29,895 | | | | 17,184 | |
| Organizational and offering costs | | | 220,729 | | | | 28,994 | | | | 14,805 | |
| Transfer agent fees and expenses | | | 209,222 | | | | 51,790 | | | | 30,955 | |
| Fund administration fees | | | 205,179 | | | | 38,162 | | | | 19,351 | |
| Trustees’ fees and expenses | | | 182,984 | | | | 20,044 | | | | 13,296 | |
| Shareholder servicing fees – Class A (Note 6) | | | 90,107 | | | | 18 | | | | — | |
| Shareholder servicing fees – Class C (Note 6) | | | 14,219 | | | | — | | | | — | |
| Shareholder servicing fees – Class I (Note 6) | | | 39,344 | | | | 28,238 | | | | 19,375 | |
| Auditing fees | | | 98,871 | | | | 3,850 | | | | 450 | |
| Registration fees | | | 32,184 | | | | 16,221 | | | | 15,804 | |
| Shareholder reporting fees | | | 26,777 | | | | 3,633 | | | | 1,461 | |
| Insurance fees | | | 25,775 | | | | 2,737 | | | | 1,794 | |
| Fund accounting fees | | | 22,444 | | | | 8,870 | | | | 4,995 | |
| Chief Compliance Officer fees | | | 14,872 | | | | 6,024 | | | | 5,826 | |
| Custody fees | | | 7,801 | | | | 13,819 | | | | 6,455 | |
| Miscellaneous | | | 7,605 | | | | 1,937 | | | | 1,508 | |
| Total expenses | | | 3,332,994 | | | | 426,412 | | | | 244,218 | |
| Less fees waived by service providers (Note 4) | | | (122,977 | ) | | | — | | | | — | |
| Less advisory fees waived & expenses reimbursed | | | | | | | | | | | | |
| Class A | | | (545,621 | ) | | | (1,230 | ) | | | — | |
| Class C | | | (79,702 | ) | | | — | | | | — | |
| Class I | | | (287,430 | ) | | | (205,274 | ) | | | (120,773 | ) |
| Class K | | | (50,089 | ) | | | — | | | | — | |
| Net expenses | | | 2,247,175 | | | | 219,908 | | | | 123,445 | |
| Net investment income (loss) | | | (1,790,028 | ) | | | 33,014 | | | | 25,176 | |
| Net Realized and Unrealized Gain (Loss): | | | | | | | | | | | | |
| Net realized gain (loss) on: | | | | | | | | | | | | |
| Investments | | | 17,098,431 | | | | (516,330 | ) | | | 1,058,634 | |
| Net realized gain (loss) | | | 17,098,431 | | | | (516,330 | ) | | | 1,058,634 | |
| Net change in unrealized appreciation/depreciation on: | | | | | | | | | | | | |
| Investments | | | (12,777,330 | ) | | | 935,861 | | | | 1,578,824 | |
| Net change in unrealized appreciation/depreciation | | | (12,777,330 | ) | | | 935,861 | | | | 1,578,824 | |
| Net realized and unrealized gain | | | 4,321,101 | | | | 419,531 | | | | 2,637,458 | |
| Net increase in net assets resulting from operations | | $ | 2,531,073 | | | $ | 452,545 | | | $ | 2,662,634 | |
* At the close of business on May 29, 2020, Class A shares converted into Class I shares.
See accompanying Notes to Financial Statements.
STATEMENTS OF OPERATIONS – Continued
For the Year Ended May 31, 2020
| | | | | | North Square | |
| | | North Square | | | Oak Ridge | |
| | | Multi Strategy | | | Dividend | |
| | | Fund | | | Growth Fund* | |
| Investment Income: | | | | | | |
| Dividends (net of foreign withholding taxes of $0 and $1,736, respectively) | | $ | 113,514 | | | $ | 300,184 | |
| Dividends from affiliated regulated investment companies | | | 338,336 | | | | — | |
| Interest | | | 16,027 | | | | 6,307 | |
| Total investment income | | | 467,877 | | | | 306,491 | |
| Expenses: | | | | | | | | |
| Advisory fees | | | 256,511 | | | | 97,328 | |
| Distribution fees – Class A (Note 7) | | | 88,593 | | | | 2,645 | |
| Distribution fees – Class C (Note 7) | | | 62,974 | | | | — | |
| Legal fees | | | 103,393 | | | | 17,231 | |
| Organizational and offering costs | | | 60,588 | | | | 12,773 | |
| Transfer agent fees and expenses | | | 93,163 | | | | 46,052 | |
| Fund administration fees | | | 83,056 | | | | 32,664 | |
| Trustees’ fees and expenses | | | 54,391 | | | | 12,910 | |
| Shareholder servicing fees – Class A (Note 6) | | | 32,337 | | | | 144 | |
| Shareholder servicing fees – Class C (Note 6) | | | 3,736 | | | | — | |
| Shareholder servicing fees – Class I (Note 6) | | | 11,189 | | | | — | |
| Auditing fees | | | 17,664 | | | | 1,205 | |
| Registration fees | | | 24,153 | | | | 3,646 | |
| Shareholder reporting fees | | | 10,135 | | | | 1,483 | |
| Insurance fees | | | 7,700 | | | | 1,787 | |
| Fund accounting fees | | | 8,094 | | | | 4,845 | |
| Chief Compliance Officer fees | | | 7,453 | | | | 6,046 | |
| Custody fees | | | 6,440 | | | | 5,522 | |
| Miscellaneous | | | 2,363 | | | | 1,902 | |
| Total expenses | | | 933,933 | | | | 248,183 | |
| Affiliated fund fees waived (Note 4) | | | (233,515 | ) | | | — | |
| Less advisory fees waived & expenses reimbursed | | | | | | | | |
| Class A | | | (51,827 | ) | | | (9,677 | ) |
| Class C | | | (2,664 | ) | | | — | |
| Class I | | | (2,345 | ) | | | (106,089 | ) |
| Net expenses | | | 643,582 | | | | 132,417 | |
| Net investment income (loss) | | | (175,705 | ) | | | 174,074 | |
| Net Realized and Unrealized Gain (Loss): | | | | | | | | |
| Net realized gain (loss) on: | | | | | | | | |
| Investments | | | 96,400 | | | | (1,124 | ) |
| Affiliated issuers | | | (149,982 | ) | | | — | |
| Net realized loss | | | (53,582 | ) | | | (1,124 | ) |
| Capital gain distributions from regulated investment companies | | | | | | | | |
| Unaffiliated issuers | | | 31,848 | | | | — | |
| Affiliated issuers | | | 607,382 | | | | — | |
| Total capital gain distributions | | | 639,230 | | | | — | |
| Net change in unrealized appreciation/depreciation on: | | | | | | | | |
| Investments | | | (67,938 | ) | | | 1,087,604 | |
| Affiliated issuers | | | 3,372,388 | | | | — | |
| Net change in unrealized appreciation/depreciation | | | 3,304,450 | | | | 1,087,604 | |
| Net realized and unrealized gain | | | 3,890,098 | | | | 1,086,480 | |
| Net increase in net assets resulting from operations | | $ | 3,714,393 | | | $ | 1,260,554 | |
* At the close of business on May 29, 2020, Class A shares converted into Class I shares.
See accompanying Notes to Financial Statements.
STATEMENTS OF CHANGES IN NET ASSETS
| | | North Square | | | | | | | |
| | | Oak Ridge | | | North Square | |
| | | Small Cap | | | Dynamic | |
| | | Growth Fund | | | Small Cap Fund* | |
| | | Year Ended | | | Year Ended | | | Year Ended | | | Year Ended | |
| | | May 31, 2020 | | | May 31, 2019 | | | May 31, 2020 | | | May 31, 2019 | |
| Increase (Decrease) in Net Assets from: | | | | | | | | | | | | |
| Operations: | | | | | | | | | | | | |
| Net investment income (loss) | | $ | (1,790,028 | ) | | $ | (2,697,639 | ) | | $ | 33,014 | | | $ | (9,863 | ) |
| Net realized gain (loss) on investments | | | | | | | | | | | | | | | | |
| and foreign currency transactions | | | 17,098,431 | | | | 81,071,388 | | | | (516,330 | ) | | | 1,035,376 | |
| Net change in unrealized appreciation/depreciation | | | | | | | | | | | | | | | | |
| on investments and foreign currency translations | | | (12,777,330 | ) | | | (80,183,086 | ) | | | 935,861 | | | | (3,336,117 | ) |
| Net increase (decrease) in net assets | | | | | | | | | | | | | | | | |
| resulting from operations | | | 2,531,073 | | | | (1,809,337 | ) | | | 452,545 | | | | (2,310,604 | ) |
| | | | | | | | | | | | | | | | | |
| Distributions to shareholders: | | | | | | | | | | | | | | | | |
| Distributions: | | | | | | | | | | | | | | | | |
| Class A | | | (13,192,375 | ) | | | (18,261,525 | ) | | | (24 | ) | | | (12,496 | ) |
| Class C | | | (6,840,656 | ) | | | (8,797,820 | ) | | | — | | | | — | |
| Class I | | | (6,578,301 | ) | | | (13,437,843 | ) | | | (51,889 | ) | | | (4,034,881 | ) |
| Class K | | | (1,070,578 | ) | | | (2,775,073 | ) | | | — | | | | — | |
| Total | | | (27,681,910 | ) | | | (43,272,261 | ) | | | (51,913 | ) | | | (4,047,377 | ) |
| | | | | | | | | | | | | | | | | |
| Capital Transactions: | | | | | | | | | | | | | | | | |
| Net proceeds from shares sold: | | | | | | | | | | | | | | | | |
| Class A | | | 8,458,392 | | | | 31,247,320 | | | | 10,524 | | | | 253,291 | |
| Class C | | | 266,434 | | | | 2,081,913 | | | | — | | | | — | |
| Class I | | | 4,460,414 | | | | 19,461,490 | | | | 599,316 | | | | 710,545 | |
| Class K | | | 2,669,364 | | | | 24,160,915 | | | | — | | | | — | |
| Reinvestment of Distributions: | | | | | | | | | | | | | | | | |
| Class A | | | 12,417,644 | | | | 16,680,431 | | | | 19 | | | | 12,496 | |
| Class C | | | 6,296,227 | | | | 8,069,940 | | | | — | | | | — | |
| Class I | | | 6,393,431 | | | | 12,953,299 | | | | 51,889 | | | | 4,034,881 | |
| Class K | | | 1,070,578 | | | | 2,775,073 | | | | — | | | | — | |
| Cost of shares redeemed: | | | | | | | | | | | | | | | | |
| Class A | | | (45,471,440 | ) | | | (83,056,243 | ) | | | (326,032 | ) | | | (1,030 | ) |
| Class C | | | (9,677,044 | ) | | | (11,838,721 | ) | | | — | | | | — | |
| Class I | | | (29,407,971 | ) | | | (126,950,749 | ) | | | (5,929,127 | ) | | | (6,318,305 | ) |
| Class K | | | (6,861,211 | ) | | | (36,112,414 | ) | | | — | | | | — | |
| Net decrease in net assets | | | | | | | | | | | | | | | | |
| from capital transactions | | | (49,385,182 | ) | | | (140,527,746 | ) | | | (5,593,411 | ) | | | (1,308,122 | ) |
| Total decrease in net assets | | | (74,536,019 | ) | | | (185,609,344 | ) | | | (5,192,779 | ) | | | (7,666,103 | ) |
| | | | | | | | | | | | | | | | | |
| Net Assets: | | | | | | | | | | | | | | | | |
| Beginning of period | | | 203,963,396 | | | | 389,572,740 | | | | 20,692,641 | | | | 28,358,744 | |
| End of period | | $ | 129,427,377 | | | $ | 203,963,396 | | | $ | 15,499,862 | | | $ | 20,692,641 | |
* As of the close of business on May 29, 2020, Class A shares converted into Class I shares.
See accompanying Notes to Financial Statements.
STATEMENTS OF CHANGES IN NET ASSETS – Continued
| | | North Square | | | | | | | |
| | | Oak Ridge | | | North Square | |
| | | Small Cap | | | Dynamic | |
| | | Growth Fund | | | Small Cap Fund* | |
| | | Year Ended | | | Year Ended | | | Year Ended | | | Year Ended | |
| | | May 31, 2020 | | | May 31, 2019 | | | May 31, 2020 | | | May 31, 2019 | |
| Capital Share Transactions: | | | | | | | | | | | | |
| Shares sold: | | | | | | | | | | | | |
| Class A | | | 703,797 | | | | 2,076,976 | | | | 854 | | | | 20,202 | |
| Class C | | | 90,147 | | | | 444,367 | | | | — | | | | — | |
| Class I | | | 323,532 | | | | 1,097,235 | | | | 50,444 | | | | 50,605 | |
| Class K | | | 192,284 | | | | 1,305,455 | | | | — | | | | — | |
| Shares reinvested: | | | | | | | | | | | | | | | | |
| Class A | | | 966,624 | | | | 1,284,096 | | | | 1 | | | | 1,113 | |
| Class C | | | 2,335,742 | | | | 1,916,851 | | | | — | | | | — | |
| Class I | | | 442,887 | | | | 903,929 | | | | 3,839 | | | | 356,124 | |
| Class K | | | 75,282 | | | | 196,535 | | | | — | | | | — | |
| Shares redeemed: | | | | | | | | | | | | | | | | |
| Class A | | | (3,440,586 | ) | | | (5,117,778 | ) | | | (27,419 | ) | | | (66 | ) |
| Class C | | | (3,183,348 | ) | | | (2,233,434 | ) | | | — | | | | — | |
| Class I | | | (2,010,794 | ) | | | (7,252,777 | ) | | | (468,649 | ) | | | (507,722 | ) |
| Class K | | | (481,601 | ) | | | (2,112,570 | ) | | | — | | | | — | |
| Net decrease in capital share transactions | | | (3,986,034 | ) | | | (7,491,115 | ) | | | (440,930 | ) | | | (79,744 | ) |
* As of the close of business on May 29, 2020, Class A shares converted into Class I shares.
See accompanying Notes to Financial Statements.
STATEMENTS OF CHANGES IN NET ASSETS – Continued
| | | North Square | | | | | | | |
| | | Oak Ridge | | | North Square | |
| | | Disciplined Growth Fund | | | Multi Strategy Fund | |
| | | Year Ended | | | Year Ended | | | Year Ended | | | Year Ended | |
| | | May 31, 2020 | | | May 31, 2019 | | | May 31, 2020 | | | May 31, 2019 | |
| Increase (Decrease) in Net Assets from: | | | | | | | | | | | | |
| Operations: | | | | | | | | | | | | |
| Net investment income (loss) | | $ | 25,176 | | | $ | (3,225 | ) | | $ | (175,705 | ) | | $ | (213,539 | ) |
| Net realized gain (loss) on investments, affiliated | | | | | | | | | | | | | | | | |
| issuers and foreign currency transactions | | | 1,058,634 | | | | 361,659 | | | | (53,582 | ) | | | 215,233 | |
| Capital gain distributions from | | | | | | | | | | | | | | | | |
| regulated investment companies | | | — | | | | — | | | | 639,230 | | | | 4,310,982 | |
| Net change in unrealized appreciation/depreciation | | | | | | | | | | | | | | | | |
| on investments and foreign currency translations | | | 1,578,824 | | | | 444,553 | | | | 3,304,450 | | | | (8,168,694 | ) |
| Net increase (decrease) in net assets | | | | | | | | | | | | | | | | |
| resulting from operations | | | 2,662,634 | | | | 802,987 | | | | 3,714,393 | | | | (3,856,018 | ) |
| | | | | | | | | | | | | | | | | |
| Distributions to shareholders: | | | | | | | | | | | | | | | | |
| Distributions: | | | | | | | | | | | | | | | | |
| Class A | | | — | | | | — | | | | (2,346,535 | ) | | | (12,202,745 | ) |
| Class C | | | — | | | | — | | | | (449,855 | ) | | | (4,572,374 | ) |
| Class I | | | (600,962 | ) | | | (124,163 | ) | | | (529,026 | ) | | | (5,572,193 | ) |
| Total | | | (600,962 | ) | | | (124,163 | ) | | | (3,325,416 | ) | | | (22,347,312 | ) |
| | | | | | | | | | | | | | | | | |
| Capital Transactions: | | | | | | | | | | | | | | | | |
| Net proceeds from shares sold: | | | | | | | | | | | | | | | | |
| Class A | | | — | | | | — | | | | 6,088,259 | | | | 5,435,800 | |
| Class C | | | — | | | | — | | | | 48,969 | | | | 1,441,191 | |
| Class I | | | 5,465 | | | | 1,890,000 | | | | 610,000 | | | | 12,325,746 | |
| Reinvestment of Distributions: | | | | | | | | | | | | | | | | |
| Class A | | | — | | | | — | | | | 2,185,152 | | | | 11,272,650 | |
| Class C | | | — | | | | — | | | | 420,421 | | | | 4,246,300 | |
| Class I | | | 600,962 | | | | 124,163 | | | | 471,672 | | | | 4,909,302 | |
| Cost of shares redeemed: | | | | | | | | | | | | | | | | |
| Class A | | | — | | | | — | | | | (6,199,393 | ) | | | (10,939,863 | ) |
| Class C | | | — | | | | — | | | | (6,375,487 | ) | | | (4,095,978 | ) |
| Class I | | | (4,300,030 | ) | | | (3,155,030 | ) | | | (8,688,130 | ) | | | (9,933,851 | ) |
| Net increase (decrease) in net assets | | | | | | | | | | | | | | | | |
| from capital transactions | | | (3,693,603 | ) | | | (1,140,867 | ) | | | (11,438,537 | ) | | | 14,661,297 | |
| Total decrease in net assets | | | (1,631,931 | ) | | | (462,043 | ) | | | (11,049,560 | ) | | | (11,542,033 | ) |
| | | | | | | | | | | | | | | | | |
| Net Assets: | | | | | | | | | | | | | | | | |
| Beginning of period | | | 13,822,627 | | | | 14,284,670 | | | | 55,709,278 | | | | 67,251,311 | |
| End of period | | $ | 12,190,696 | | | $ | 13,822,627 | | | $ | 44,659,718 | | | $ | 55,709,278 | |
See accompanying Notes to Financial Statements.
STATEMENTS OF CHANGES IN NET ASSETS – Continued
| | | North Square | | | | | | | |
| | | Oak Ridge | | | North Square | |
| | | Disciplined Growth Fund | | | Multi Strategy Fund | |
| | | Year Ended | | | Year Ended | | | Year Ended | | | Year Ended | |
| | | May 31, 2020 | | | May 31, 2019 | | | May 31, 2020 | | | May 31, 2019 | |
| Capital Share Transactions: | | | | | | | | | | | | |
| Shares sold: | | | | | | | | | | | | |
| Class A | | | — | | | | — | | | | 356,598 | | | | 257,526 | |
| Class C | | | — | | | | — | | | | 3,361 | | | | 73,963 | |
| Class I | | | 374 | | | | 138,738 | | | | 32,814 | | | | 474,824 | |
| Shares reinvested: | | | | | | | | | | | | | | | | |
| Class A | | | — | | | | — | | | | 120,071 | | | | 693,275 | |
| Class C | | | — | | | | — | | | | 28,415 | | | | 316,416 | |
| Class I | | | 39,187 | | | | 9,792 | | | | 24,882 | | | | 292,220 | |
| Shares redeemed: | | | | | | | | | | | | | | | | |
| Class A | | | — | | | | — | | | | (360,745 | ) | | | (526,007 | ) |
| Class C | | | — | | | | — | | | | (456,848 | ) | | | (261,119 | ) |
| Class I | | | (280,666 | ) | | | (242,719 | ) | | | (461,870 | ) | | | (484,509 | ) |
| Net increase (decrease) in | | | | | | | | | | | | | | | | |
| capital share transactions | | | (241,105 | ) | | | (94,189 | ) | | | (713,322 | ) | | | 836,589 | |
See accompanying Notes to Financial Statements.
STATEMENTS OF CHANGES IN NET ASSETS – Continued
| | | North Square | |
| | | Oak Ridge | |
| | | Dividend Growth Fund* | |
| | | Year Ended | | | Year Ended | |
| | | May 31, 2020 | | | May 31, 2019 | |
| Increase (Decrease) in Net Assets from: | | | | | | |
| Operations: | | | | | | |
| Net investment income | | $ | 174,074 | | | $ | 186,699 | |
| Net realized gain (loss) on investments | | | | | | | | |
| and foreign currency transactions | | | (1,124 | ) | | | 116,938 | |
| Net change in unrealized appreciation/depreciation | | | | | | | | |
| on investments and foreign currency translations | | | 1,087,604 | | | | 511,962 | |
| Net increase in net assets resulting from operations | | | 1,260,554 | | | | 815,599 | |
| | | | | | | | | |
| Distributions to shareholders: | | | | | | | | |
| Distributions: | | | | | | | | |
| Class A | | | (16,267 | ) | | | (21,330 | ) |
| Class I | | | (200,482 | ) | | | (342,802 | ) |
| Total | | | (216,749 | ) | | | (364,132 | ) |
| | | | | | | | | |
| Capital Transactions: | | | | | | | | |
| Net proceeds from shares sold: | | | | | | | | |
| Class A | | | 258,921 | | | | 726,622 | |
| Class I | | | 497,850 | | | | 1,601,322 | |
| Reinvestment of Distributions: | | | | | | | | |
| Class A | | | 16,267 | | | | 21,331 | |
| Class I | | | 200,482 | | | | 342,802 | |
| Cost of shares redeemed: | | | | | | | | |
| Class A | | | (1,238,515 | ) | | | (5,105 | ) |
| Class I | | | (2,553,713 | ) | | | (400,000 | ) |
| Net increase (decrease) in net assets | | | | | | | | |
| from capital transactions | | | (2,818,708 | ) | | | 2,286,972 | |
| Total increase (decrease) in net assets | | | (1,774,903 | ) | | | 2,738,439 | |
| | | | | | | | | |
| Net Assets: | | | | | | | | |
| Beginning of period | | | 12,920,587 | | | | 10,182,148 | |
| End of period | | $ | 11,145,684 | | | $ | 12,920,587 | |
| | | | | | | | | |
| Capital Share Transactions: | | | | | | | | |
| Shares sold: | | | | | | | | |
| Class A | | | 15,122 | | | | 45,736 | |
| Class I | | | 28,103 | | | | 101,984 | |
| Shares reinvested: | | | | | | | | |
| Class A | | | 929 | | | | 1,384 | |
| Class I | | | 11,328 | | | | 22,050 | |
| Shares redeemed: | | | | | | | | |
| Class A | | | (72,254 | ) | | | (316 | ) |
| Class I | | | (140,725 | ) | | | (26,127 | ) |
| Net increase (decrease) in capital share transactions | | | (157,497 | ) | | | 144,711 | |
* As of the close of business on May 29, 2020, Class A shares converted into Class I shares.
See accompanying Notes to Financial Statements.
North Square Oak Ridge Small Cap Growth Fund
FINANCIAL HIGHLIGHTS
Class A
Per share operating performance.
For a capital share outstanding throughout each period.
| | | For the Year Ended May 31, | |
| | | 2020 | | | 2019 | | | 2018 | | | 2017 | | | 2016 | |
| Net asset value, beginning of period | | $ | 13.89 | | | $ | 16.85 | | | $ | 34.16 | | | $ | 34.02 | | | $ | 41.23 | |
| Income from Investment Operations: | | | | | | | | | | | | | | | | | | | | |
Net investment loss1 | | | (0.15 | ) | | | (0.16 | )2 | | | (0.23 | )2 | | | (0.33 | )2 | | | (0.37 | ) |
| Net realized and unrealized gain (loss) | | | 0.44 | | | | (0.34 | ) | | | 5.69 | | | | 2.62 | | | | (4.54 | ) |
| Total from investment operations | | | 0.29 | | | | (0.50 | ) | | | 5.46 | | | | 2.29 | | | | (4.91 | ) |
| Less Distributions: | | | | | | | | | | | | | | | | | | | | |
| From net realized gain | | | (2.11 | ) | | | (2.46 | ) | | | (22.77 | ) | | | (2.15 | ) | | | (2.30 | ) |
| Total distributions | | | (2.11 | ) | | | (2.46 | ) | | | (22.77 | ) | | | (2.15 | ) | | | (2.30 | ) |
| Net asset value, end of period | | $ | 12.07 | | | $ | 13.89 | | | $ | 16.85 | | | $ | 34.16 | | | $ | 34.02 | |
Total return3 | | | 1.16 | % | | | (1.96 | )% | | | 23.85 | % | | | 6.82 | % | | | (12.00 | )% |
| Ratios and Supplemental Data: | | | | | | | | | | | | | | | | | | | | |
| Net assets, end of period (in thousands) | | $ | 73,973 | | | $ | 109,749 | | | $ | 162,714 | | | $ | 242,299 | | | $ | 357,215 | |
Ratio of expenses to average net assets (including interest expense): | | | | | | | | | | | | | | | | | |
Before fees waived and expenses absorbed4 | | | 2.06 | % | | | 1.46 | % | | | 1.40 | % | | | 1.44 | % | | | 1.38 | % |
After fees waived and expenses absorbed4 | | | 1.39 | % | | | 1.38 | % | | | 1.38 | %5 | | | 1.39 | % | | | 1.38 | % |
Ratio of net investment loss to average net assets (including interest expense): | | | | | | | | | | | | | | | | |
Before fees waived and expenses absorbed4 | | | (1.78 | )% | | | (1.08 | )% | | | (0.97 | )% | | | (1.02 | )% | | | (1.02 | )% |
After fees waived and expenses absorbed4 | | | (1.11 | )% | | | (1.00 | )% | | | (0.95 | )% | | | (0.97 | )% | | | (1.02 | )% |
| Portfolio turnover rate | | | 38 | % | | | 31 | % | | | 39 | % | | | 30 | % | | | 30 | % |
1 | Based on average shares outstanding for the period. |
2 | Recognition of net investment income by the Fund is affected by the timing of the declaration of dividends by the underlying investment companies in which the Fund invests. The ratio does not include net investment income of the investment companies in which the Fund invests. |
3 | Total returns would have been lower/higher had expenses not been waived or absorbed/recovered by the Advisor. Returns shown do not include payment of a sales load of 5.75% of offering price, which is reduced on sales of $50,000 or more. Returns shown do not include payment of a Contingent Deferred Sales Charge (“CDSC”) of 1% on certain redemptions made within 12 months of the date of purchase. If the sales load and CDSC were included, total return would be lower. These returns include Rule 12b-1 fees of up to 0.25% and do not reflect the deduction of taxes that a shareholder would pay on Fund distributions or the redemption of Fund shares. |
4 | Does not include expenses of the investment companies in which the Fund invests. |
5 | Effective October 5, 2017, the Fund’s advisor had contractually agreed to waive its fees and/or absorb expenses of the Fund to ensure that total annual fund operating expenses (excluding taxes, leverage interest, brokerage commissions, dividend expenses on short sales, acquired fund fees and expenses as determined in accordance with SEC Form N-1A, expenses incurred in connection with any merger or reorganization, or extraordinary expenses such as litigation) do not exceed 1.39% of average daily net assets of the fund. Prior to October 5, 2017, the annual operating expense limitation was 1.40%. |
See accompanying Notes to Financial Statements.
North Square Oak Ridge Small Cap Growth Fund
FINANCIAL HIGHLIGHTS
Class C
Per share operating performance.
For a capital share outstanding throughout each period.
| | | For the Year Ended May 31, | |
| | | 2020 | | | 2019 | | | 2018 | | | 2017 | | | 2016 | |
| Net asset value, beginning of period | | $ | 4.49 | | | $ | 7.30 | | | $ | 26.58 | | | $ | 27.12 | | | $ | 33.63 | |
| Income from Investment Operations: | | | | | | | | | | | | | | | | | | | | |
Net investment loss1 | | | (0.07 | ) | | | (0.10 | )2 | | | (0.21 | )2 | | | (0.46 | )2 | | | (0.52 | ) |
| Net realized and unrealized gain (loss) | | | 0.21 | | | | (0.25 | ) | | | 3.70 | | | | 2.07 | | | | (3.69 | ) |
| Total from investment operations | | | 0.14 | | | | (0.35 | ) | | | 3.49 | | | | 1.61 | | | | (4.21 | ) |
| Less Distributions: | | | | | | | | | | | | | | | | | | | | |
| From net realized gain | | | (2.11 | ) | | | (2.46 | ) | | | (22.77 | ) | | | (2.15 | ) | | | (2.30 | ) |
| Total distributions | | | (2.11 | ) | | | (2.46 | ) | | | (22.77 | ) | | | (2.15 | ) | | | (2.30 | ) |
| Net asset value, end of period | | $ | 2.52 | | | $ | 4.49 | | | $ | 7.30 | | | $ | 26.58 | | | $ | 27.12 | |
Total return3 | | | 0.39 | % | | | (2.55 | )% | | | 22.93 | % | | | 6.06 | % | | | (12.68 | )% |
| Ratios and Supplemental Data: | | | | | | | | | | | | | | | | | | | | |
| Net assets, end of period (in thousands) | | $ | 8,953 | | | $ | 19,309 | | | $ | 30,498 | | | $ | 46,077 | | | $ | 71,123 | |
Ratio of expenses to average net assets (including interest expense): | | | | | | | | | | | | | | | | | | | | |
Before fees waived and expenses absorbed4 | | | 2.76 | % | | | 2.19 | % | | | 2.12 | % | | | 2.13 | % | | | 2.17 | % |
After fees waived and expenses absorbed4 | | | 2.14 | % | | | 2.11 | % | | | 2.11 | %5 | | | 2.11 | % | | | 2.16 | % |
Ratio of net investment loss to average net assets (including interest expense): | | | | | | | | | | | | | | | | | | | | |
Before fees waived and expenses absorbed4 | | | (2.48 | )% | | | (1.80 | )% | | | (1.69 | )% | | | (1.71 | )% | | | (1.81 | )% |
After fees waived and expenses absorbed4 | | | (1.86 | )% | | | (1.72 | )% | | | (1.68 | )% | | | (1.69 | )% | | | (1.80 | )% |
| Portfolio turnover rate | | | 38 | % | | | 31 | % | | | 39 | % | | | 30 | % | | | 30 | % |
1 | Based on average shares outstanding for the period. |
2 | Recognition of net investment income by the Fund is affected by the timing of the declaration of dividends by the underlying investment companies in which the Fund invests. The ratio does not include net investment income of the investment companies in which the Fund invests. |
3 | Total returns would have been lower/higher had expenses not been waived or absorbed/recovered by the Advisor. Returns shown do not include payment of a Contingent Deferred Sales Charge (“CDSC”) of 1% on certain redemptions made within 12 months of the date of purchase. If the CDSC were included, total return would be lower. These returns include Rule 12b-1 fees of up to 1.00% and do not reflect the deduction of taxes that a shareholder would pay on Fund distributions or the redemption of Fund shares. |
4 | Does not include expenses of the investment companies in which the Fund invests. |
5 | Effective October 5, 2017, the Fund’s advisor had contractually agreed to waive its fees and/or absorb expenses of the Fund to ensure that total annual fund operating expenses (excluding taxes, leverage interest, brokerage commissions, dividend expenses on short sales, acquired fund fees and expenses as determined in accordance with SEC Form N-1A, expenses incurred in connection with any merger or reorganization, or extraordinary expenses such as litigation) do not exceed 2.14% of average daily net assets of the fund. Prior to October 5, 2017, the annual operating expense was 2.30%. |
See accompanying Notes to Financial Statements.
North Square Oak Ridge Small Cap Growth Fund
FINANCIAL HIGHLIGHTS
Class I5
Per share operating performance.
For a capital share outstanding throughout each period.
| | | For the Year Ended May 31, | |
| | | 2020 | | | 2019 | | | 2018 | | | 2017 | | | 2016 | |
| Net asset value, beginning of period | | $ | 15.35 | | | $ | 18.29 | | | $ | 35.25 | | | $ | 34.92 | | | $ | 42.12 | |
| Income from Investment Operations: | | | | | | | | | | | | | | | | | | | | |
Net investment loss1 | | | (0.13 | ) | | | (0.13 | )2 | | | (0.19 | )2 | | | (0.22 | )2 | | | (0.25 | ) |
| Net realized and unrealized gain (loss) | | | 0.47 | | | | (0.35 | ) | | | 6.00 | | | | 2.70 | | | | (4.65 | ) |
| Total from investment operations | | | 0.34 | | | | (0.48 | ) | | | 5.81 | | | | 2.48 | | | | (4.90 | ) |
| Less Distributions: | | | | | | | | | | | | | | | | | | | | |
| From net realized gain | | | (2.11 | ) | | | (2.46 | ) | | | (22.77 | ) | | | (2.15 | ) | | | (2.30 | ) |
| Total distributions | | | (2.11 | ) | | | (2.46 | ) | | | (22.77 | ) | | | (2.15 | ) | | | (2.30 | ) |
| Net asset value, end of period | | $ | 13.58 | | | $ | 15.35 | | | $ | 18.29 | | | $ | 35.25 | | | $ | 34.92 | |
Total return3 | | | 1.41 | % | | | (1.67 | )% | | | 24.19 | % | | | 7.23 | % | | | (11.74 | )% |
| Ratios and Supplemental Data: | | | | | | | | | | | | | | | | | | | | |
| Net assets, end of period (in thousands) | | $ | 40,165 | | | $ | 64,501 | | | $ | 172,935 | | | $ | 1,040,256 | | | $ | 1,657,047 | |
Ratio of expenses to average net assets (including interest expense): | | | | | | | | | | | | | | | | | | | | |
Before fees waived and expenses absorbed4 | | | 1.78 | % | | | 1.22 | % | | | 1.05 | % | | | 1.09 | % | | | 1.10 | % |
After fees waived and expenses absorbed4 | | | 1.14 | % | | | 1.14 | % | | | 1.06 | %6 | | | 1.04 | % | | | 1.04 | % |
Ratio of net investment loss to average net assets (including interest expense): | | | | | | | | | | | | | | | | | | | | |
Before fees waived and expenses absorbed4 | | | (1.50 | )% | | | (0.84 | )% | | | (0.63 | )% | | | (0.67 | )% | | | (0.75 | )% |
After fees waived and expenses absorbed4 | | | (0.86 | )% | | | (0.75 | )% | | | (0.64 | )% | | | (0.62 | )% | | | (0.69 | )% |
| Portfolio turnover rate | | | 38 | % | | | 31 | % | | | 39 | % | | | 30 | % | | | 30 | % |
1 | Based on average shares outstanding for the period. |
2 | Recognition of net investment income by the Fund is affected by the timing of the declaration of dividends by the underlying investment companies in which the Fund invests. The ratio does not include net investment income of the investment companies in which the Fund invests. |
3 | Total returns would have been lower/higher had expenses not been waived or absorbed/recovered by the Advisor. Returns shown do not reflect the deduction of taxes that a shareholder would pay on Fund distributions or the redemption of Fund shares. |
4 | Does not include expenses of the investment companies in which the Fund invests. |
5 | Effective September 30, 2015, the Class Y shares were re-designated as Class I shares. |
6 | Effective October 5, 2017, the Fund’s advisor had contractually agreed to waive its fees and/or absorb expenses of the Fund to ensure that total annual fund operating expenses (excluding taxes, leverage interest, brokerage commissions, dividend expenses on short sales, acquired fund fees and expenses as determined in accordance with SEC Form N-1A, expenses incurred in connection with any merger or reorganization, or extraordinary expenses such as litigation) do not exceed 1.14% of average daily net assets of the fund. Prior to October 5, 2017, the annual operating expense limitation was 1.05%. |
See accompanying Notes to Financial Statements.
North Square Oak Ridge Small Cap Growth Fund
FINANCIAL HIGHLIGHTS
Class K
Per share operating performance.
For a capital share outstanding throughout each period.
| | | For the Year Ended May 31, | |
| | | 2020 | | | 2019 | | | 2018 | | | 2017 | | | 2016 | |
| Net asset value, beginning of period | | $ | 15.14 | | | $ | 18.05 | | | $ | 35.02 | | | $ | 34.66 | | | $ | 41.77 | |
| Income from Investment Operations: | | | | | | | | | | | | | | | | | | | | |
Net investment loss1 | | | (0.10 | ) | | | (0.11 | )2 | | | (0.14 | )2 | | | (0.17 | )2 | | | (0.20 | ) |
| Net realized and unrealized gain (loss) | | | 0.45 | | | | (0.34 | ) | | | 5.94 | | | | 2.68 | | | | (4.61 | ) |
| Total from investment operations | | | 0.35 | | | | (0.45 | ) | | | 5.80 | | | | 2.51 | | | | (4.81 | ) |
| Less Distributions: | | | | | | | | | | | | | | | | | | | | |
| From net realized gain | | | (2.11 | ) | | | (2.46 | ) | | | (22.77 | ) | | | (2.15 | ) | | | (2.30 | ) |
| Total distributions | | | (2.11 | ) | | | (2.46 | ) | | | (22.77 | ) | | | (2.15 | ) | | | (2.30 | ) |
| Net asset value, end of period | | $ | 13.38 | | | $ | 15.14 | | | $ | 18.05 | | | $ | 35.02 | | | $ | 34.66 | |
Total return3 | | | 1.56 | % | | | (1.51 | )% | | | 24.34 | % | | | 7.34 | % | | | (11.59 | )% |
| Ratios and Supplemental Data: | | | | | | | | | | | | | | | | | | | | |
| Net assets, end of period (in thousands) | | $ | 6,336 | | | $ | 10,405 | | | $ | 23,426 | | | $ | 103,403 | | | $ | 141,566 | |
Ratio of expenses to average net assets (including interest expense): | | | | | | | | | | | | | | | | | | | | |
Before fees waived and expenses absorbed4 | | | 1.68 | % | | | 1.08 | % | | | 0.96 | % | | | 0.93 | % | | | 0.92 | % |
After fees waived and expenses absorbed4 | | | 0.99 | % | | | 1.00 | % | | | 0.95 | %5 | | | 0.91 | % | | | 0.91 | % |
Ratio of net investment loss to average net assets (including interest expense): | | | | | | | | | | | | | | | | | | | | |
Before fees waived and expenses absorbed4 | | | (1.40 | )% | | | (0.69 | )% | | | (0.53 | )% | | | (0.51 | )% | | | (0.57 | )% |
After fees waived and expenses absorbed4 | | | (0.71 | )% | | | (0.61 | )% | | | (0.52 | )% | | | (0.49 | )% | | | (0.56 | )% |
| Portfolio turnover rate | | | 38 | % | | | 31 | % | | | 39 | % | | | 30 | % | | | 30 | % |
1 | Based on average shares outstanding for the period. |
2 | Recognition of net investment income by the Fund is affected by the timing of the declaration of dividends by the underlying investment companies in which the Fund invests. The ratio does not include net investment income of the investment companies in which the Fund invests. |
3 | Total returns would have been lower/higher had expenses not been waived or absorbed/recovered by the Advisor. Returns shown do not reflect the deduction of taxes that a shareholder would pay on Fund distributions or the redemption of Fund shares. |
4 | Does not include expenses of the investment companies in which the Fund invests. |
5 | Effective October 5, 2017, the Fund’s advisor had contractually agreed to waive its fees and/or absorb expenses of the Fund to ensure that total annual fund operating expenses (excluding taxes, leverage interest, brokerage commissions, dividend expenses on short sales, acquired fund fees and expenses as determined in accordance with SEC Form N-1A, expenses incurred in connection with any merger or reorganization, or extraordinary expenses such as litigation) do not exceed 0.99% of average daily net assets of the fund. Prior to October 5, 2017, the annual operating expense limitation was 0.92%. |
See accompanying Notes to Financial Statements.
North Square Dynamic Small Cap Fund
FINANCIAL HIGHLIGHTS
Class I
Per share operating performance.
For a capital share outstanding throughout each period.
| | | | | | | | | | | | | | | For the Period | |
| | | For the Year Ended May 31, | | | September 30, | |
| | | | | 2015* through | |
| | | 2020 | | | 2019 | | | 2018 | | | 2017 | | | May 31, 2016 | |
| Net asset value, beginning of period | | $ | 11.54 | | | $ | 15.14 | | | $ | 12.07 | | | $ | 9.98 | | | $ | 10.00 | |
| Income from Investment Operations: | | | | | | | | | | | | | | | | | | | | |
Net investment income (loss)1 | | | 0.02 | | | | (0.01 | ) | | | — | 2 | | | (0.03 | ) | | | — | 2 |
| Net realized and unrealized gain (loss) | | | (0.07 | ) | | | (1.31 | ) | | | 3.11 | | | | 2.15 | | | | 0.01 | |
| Total from investment operations | | | (0.05 | ) | | | (1.32 | ) | | | 3.11 | | | | 2.12 | | | | 0.01 | |
| Less Distributions: | | | | | | | | | | | | | | | | | | | | |
| From net investment income | | | (0.03 | ) | | | — | | | | — | | | | — | | | | (0.01 | ) |
| From net realized gain | | | — | | | | (2.28 | ) | | | (0.04 | ) | | | (0.03 | ) | | | (0.02 | ) |
| Total distributions | | | (0.03 | ) | | | (2.28 | ) | | | (0.04 | ) | | | (0.03 | ) | | | (0.03 | ) |
| Net asset value, end of period | | $ | 11.46 | | | $ | 11.54 | | | $ | 15.14 | | | $ | 12.07 | | | $ | 9.98 | |
Total return3 | | | (0.44 | )% | | | (8.42 | )% | | | 25.83 | % | | | 21.29 | % | | | 0.16 | %4 |
| Ratios and Supplemental Data: | | | | | | | | | | | | | | | | | | | | |
| Net assets, end of period (in thousands) | | $ | 15,500 | | | $ | 20,389 | | | $ | 28,279 | | | $ | 1,167 | | | $ | 799 | |
| Ratio of expenses to average net assets: | | | | | | | | | | | | | | | | | | | | |
| Before fees waived and expenses absorbed | | | 2.23 | % | | | 2.02 | % | | | 1.89 | % | | | 19.89 | % | | | 36.44 | %5 |
| After fees waived and expenses absorbed | | | 1.15 | % | | | 1.15 | % | | | 1.15 | % | | | 1.15 | % | | | 1.15 | %5 |
| Ratio of net investment income (loss) to average net assets: | | | | | | | | | | | | | | | | | | | | |
| Before fees waived and expenses absorbed | | | (0.91 | )% | | | (0.91 | )% | | | (0.71 | )% | | | (18.97 | )% | | | (35.29 | )%5 |
| After fees waived and expenses absorbed | | | 0.17 | % | | | (0.04 | )% | | | 0.03 | % | | | (0.22 | )% | | | 0.00 | %5 |
| Portfolio turnover rate | | | 170 | % | | | 133 | % | | | 170 | % | | | 181 | % | | | 78 | %4 |
| * | Commencement of operations. |
1 | Based on average shares outstanding for the period. |
2 | Amount represents less than $0.005 per share. |
3 | Total returns would have been lower had expenses not been waived by the Advisor. Returns shown do not reflect the deduction of taxes that a shareholder would pay on Fund distributions or the redemption of Fund shares. |
4 | Not annualized. |
5 | Annualized. |
See accompanying Notes to Financial Statements.
North Square Oak Ridge Disciplined Growth Fund
FINANCIAL HIGHLIGHTS
Class I
Per share operating performance.
For a capital share outstanding throughout each period.
| | | | | | | | | | | | For the Period | |
| | | For the Year Ended May 31, | | | July 29, | |
| | | | | 2016* through | |
| | | 2020 | | | 2019 | | | 2018 | | | May 31, 2017 | |
| Net asset value, beginning of period | | $ | 13.94 | | | $ | 13.16 | | | $ | 11.03 | | | $ | 10.00 | |
| Income from Investment Operations: | | | | | | | | | | | | | | | | |
Net investment income1 | | | 0.03 | | | | — | 2 | | | 0.01 | | | | 0.03 | |
| Net realized and unrealized gain | | | 3.00 | | | | 0.88 | | | | 2.12 | | | | 1.02 | |
| Total from investment operations | | | 3.03 | | | | 0.88 | | | | 2.13 | | | | 1.05 | |
| Less Distributions: | | | | | | | | | | | | | | | | |
| From net investment income | | | (0.01 | ) | | | — | | | | — | 2 | | | (0.02 | ) |
| From net realized gain | | | (0.72 | ) | | | (0.10 | ) | | | — | | | | — | |
| Total distributions | | | (0.73 | ) | | | (0.10 | ) | | | — | | | | (0.02 | ) |
| Net asset value, end of period | | $ | 16.24 | | | $ | 13.94 | | | $ | 13.16 | | | $ | 11.03 | |
Total return3 | | | 22.05 | % | | | 6.80 | % | | | 19.31 | % | | | 10.58 | %4 |
| Ratios and Supplemental Data: | | | | | | | | | | | | | | | | |
| Net assets, end of period (in thousands) | | $ | 12,191 | | | $ | 13,823 | | | $ | 14,285 | | | $ | 281 | |
| Ratio of expenses to average net assets: | | | | | | | | | | | | | | | | |
| Before fees waived and expenses absorbed | | | 1.88 | % | | | 2.04 | % | | | 1.99 | % | | | 45.40 | %5 |
| After fees waived and expenses absorbed | | | 0.95 | % | | | 0.95 | % | | | 0.95 | % | | | 0.95 | %5 |
| Ratio of net investment income (loss) to average net assets: | | | | | | | | | | | | | | | | |
| Before fees waived and expenses absorbed | | | (0.74 | )% | | | (1.10 | )% | | | (0.96 | )% | | | (44.13 | )%5 |
| After fees waived and expenses absorbed | | | 0.19 | % | | | (0.01 | )% | | | 0.08 | % | | | 0.32 | %5 |
| Portfolio turnover rate | | | 18 | % | | | 18 | % | | | 74 | % | | | 116 | %4 |
| * | Commencement of operations. |
1 | Based on average shares outstanding for the period. |
2 | Amount represents less than $0.005 per share. |
3 | Total returns would have been lower had expenses not been waived or absorbed by the Advisor. Returns shown do not reflect the deduction of taxes that a shareholder would pay on Fund distributions or the redemption of Fund shares. |
4 | Not annualized. |
5 | Annualized. |
See accompanying Notes to Financial Statements.
North Square Multi Strategy Fund
FINANCIAL HIGHLIGHTS
Class A
Per share operating performance.
For a capital share outstanding throughout each period.
| | | For the Year Ended May 31, | |
| | | 2020 | | | 2019 | | | 2018 | | | 2017 | | | 2016 | |
| Net asset value, beginning of period | | $ | 16.92 | | | $ | 26.95 | | | $ | 22.81 | | | $ | 19.77 | | | $ | 20.35 | |
| Income from Investment Operations: | | | | | | | | | | | | | | | | | | | | |
Net investment income (loss)1,5 | | | (0.05 | ) | | | (0.06 | ) | | | (0.16 | ) | | | — | 2 | | | (0.02 | ) |
| Net realized and unrealized gain (loss) | | | 1.25 | | | | (1.60 | ) | | | 4.30 | | | | 3.04 | | | | (0.56 | ) |
| Total from investment operations | | | 1.20 | | | | (1.66 | ) | | | 4.14 | | | | 3.04 | | | | (0.58 | ) |
| Less Distributions: | | | | | | | | | | | | | | | | | | | | |
| From net investment income | | | (1.19 | ) | | | — | | | | — | | | | — | | | | — | |
| From net realized gain | | | — | | | | (8.37 | ) | | | — | | | | — | | | | — | |
| Total distributions | | | (1.19 | ) | | | (8.37 | ) | | | — | | | | — | | | | — | |
| Net asset value, end of period | | $ | 16.93 | | | $ | 16.92 | | | $ | 26.95 | | | $ | 22.81 | | | $ | 19.77 | |
Total return3 | | | 6.63 | % | | | (4.88 | )% | | | 18.15 | % | | | 15.38 | % | | | (2.85 | )% |
| Ratios and Supplemental Data: | | | | | | | | | | | | | | | | | | | | |
| Net assets, end of period (in thousands) | | $ | 35,278 | | | $ | 33,287 | | | $ | 41,570 | | | $ | 40,399 | | | $ | 39,346 | |
| Ratio of expenses to average net assets: | | | | | | | | | | | | | | | | | | | | |
Before fees waived/recovered4 | | | 1.80 | %6 | | | 0.82 | %6 | | | 0.93 | %6 | | | 1.63 | % | | | 1.54 | % |
After fees waived/recovered4 | | | 1.20 | %6 | | | 1.00 | %6 | | | 1.13 | %6 | | | 1.20 | % | | | 1.20 | % |
| Ratio of net investment income (loss) to average net assets: | | | | | | | | | | | | | | | | | | | | |
Before fees waived/recovered4,5 | | | (0.86 | )% | | | (0.09 | )% | | | (0.43 | )% | | | (0.43 | )% | | | (0.45 | )% |
After fees waived/recovered4,5 | | | (0.26 | )% | | | (0.27 | )% | | | (0.63 | )% | | | 0.00 | % | | | (0.11 | )% |
| Portfolio turnover rate | | | 7 | % | | | 17 | % | | | 117 | % | | | 17 | % | | | 23 | % |
1 | Based on average shares outstanding for the period. |
2 | Amount represents less than $0.005 per share. |
3 | Total returns would have been lower had expenses not been waived or absorbed by the Advisor. Returns shown do not include payment of a sales load of 5.75% of offering price, which is reduced on sales of $50,000 or more. Returns shown do not include payment of a Contingent Deferred Sales Charge (“CDSC”) of 1% on certain redemptions made within 12 months of the date of purchase. If the sales load and CDSC were included, total return would be lower. These returns include Rule 12b-1 fees of up to 0.25% and do not reflect the deduction of taxes that a shareholder would pay on Fund distributions or the redemption of Fund shares. |
4 | Does not include expenses of the investment companies in which the Fund invests. |
5 | Recognition of net investment income by the Fund is affected by the timing of the declaration of dividends by the underlying investment companies in which the Fund invests. The ratio does not include net investment income of the investment companies in which the Fund invests. |
6 | The Advisor does not receive management fees for Fund assets invested in other series of the Trust advised by the Advisor (affiliated investments). |
See accompanying Notes to Financial Statements.
North Square Multi Strategy Fund
FINANCIAL HIGHLIGHTS
Class C
Per share operating performance.
For a capital share outstanding throughout each period.
| | | For the Year Ended May 31, | |
| | | 2020 | | | 2019 | | | 2018 | | | 2017 | | | 2016 | |
| Net asset value, beginning of period | | $ | 13.92 | | | $ | 23.94 | | | $ | 20.41 | | | $ | 17.86 | | | $ | 18.54 | |
| Income from Investment Operations: | | | | | | | | | | | | | | | | | | | | |
Net investment loss1,4 | | | (0.17 | ) | | | (0.19 | ) | | | (0.30 | ) | | | (0.17 | ) | | | (0.18 | ) |
| Net realized and unrealized gain (loss) | | | 1.05 | | | | (1.46 | ) | | | 3.83 | | | | 2.72 | | | | (0.50 | ) |
| Total from investment operations | | | 0.88 | | | | (1.65 | ) | | | 3.53 | | | | 2.55 | | | | (0.68 | ) |
| Less Distributions: | | | | | | | | | | | | | | | | | | | | |
| From net investment income | | | (1.09 | ) | | | — | | | | — | | | | — | | | | — | |
| From net realized gain | | | — | | | | (8.37 | ) | | | — | | | | — | | | | — | |
| Total distributions | | | (1.09 | ) | | | (8.37 | ) | | | — | | | | — | | | | — | |
| Net asset value, end of period | | $ | 13.71 | | | $ | 13.92 | | | $ | 23.94 | | | $ | 20.41 | | | $ | 17.86 | |
Total return2 | | | 5.75 | % | | | (5.55 | )% | | | 17.30 | % | | | 14.28 | % | | | (3.67 | )% |
| Ratios and Supplemental Data: | | | | | | | | | | | | | | | | | | | | |
| Net assets, end of period (in thousands) | | $ | 3,531 | | | $ | 9,503 | | | $ | 13,247 | | | $ | 13,251 | | | $ | 15,876 | |
| Ratio of expenses to average net assets: | | | | | | | | | | | | | | | | | | | | |
Before fees waived/recovered3 | | | 2.60 | %5 | | | 1.59 | %5 | | | 1.66 | %5 | | | 2.20 | % | | | 2.24 | % |
After fees waived/recovered3 | | | 2.10 | %5 | | | 1.78 | %5 | | | 1.86 | %5 | | | 2.10 | % | | | 2.10 | % |
| Ratio of net investment loss to average net assets: | | | | | | | | | | | | | | | | | | | | |
Before fees waived/recovered3,4 | | | (1.69 | )% | | | (0.87 | )% | | | (1.16 | )% | | | (1.00 | )% | | | (1.15 | )% |
After fees waived/recovered3,4 | | | (1.19 | )% | | | (1.05 | )% | | | (1.36 | )% | | | (0.90 | )% | | | (1.01 | )% |
| Portfolio turnover rate | | | 7 | % | | | 17 | % | | | 117 | % | | | 17 | % | | | 23 | % |
1 | Based on average shares outstanding for the period. |
2 | Total returns would have been lower had expenses not been waived or absorbed by the Advisor. Returns shown do not include payment of a Contingent Deferred Sales Charge (“CDSC”) of 1% on certain redemptions made within 12 months of the date of purchase. If the CDSC were included, total return would be lower. These returns include Rule 12b-1 fees of up to 1.00% and do not reflect the deduction of taxes that a shareholder would pay on Fund distributions or the redemption of Fund shares. |
3 | Does not include expenses of the investment companies in which the Fund invests. |
4 | Recognition of net investment income by the Fund is affected by the timing of the declaration of dividends by the underlying investment companies in which the Fund invests. The ratio does not include net investment income of the investment companies in which the Fund invests. |
5 | The Advisor does not receive management fees for Fund assets invested in other series of the Trust advised by the Advisor (affiliated investments). |
See accompanying Notes to Financial Statements.
North Square Multi Strategy Fund
FINANCIAL HIGHLIGHTS
Class I3
Per share operating performance.
For a capital share outstanding throughout each period.
| | | For the Year Ended May 31, | |
| | | 2020 | | | 2019 | | | 2018 | | | 2017 | | | 2016 | |
| Net asset value, beginning of period | | $ | 17.59 | | | $ | 27.53 | | | $ | 23.24 | | | $ | 20.14 | | | $ | 20.72 | |
| Income from Investment Operations: | | | | | | | | | | | | | | | | | | | | |
Net investment income (loss)1,5 | | | (0.01 | ) | | | 0.02 | 2 | | | (0.10 | ) | | | 0.01 | | | | (0.02 | ) |
| Net realized and unrealized gain (loss) | | | 1.36 | | | | (1.59 | ) | | | 4.39 | | | | 3.09 | | | | (0.56 | ) |
| Total from investment operations | | | 1.35 | | | | (1.57 | ) | | | 4.29 | | | | 3.10 | | | | (0.58 | ) |
| Less Distributions: | | | | | | | | | | | | | | | | | | | | |
| From net investment income | | | (1.21 | ) | | | — | | | | — | | | | — | | | | — | |
| From net realized gain | | | — | | | | (8.37 | ) | | | — | | | | — | | | | — | |
| Total distributions | | | (1.21 | ) | | | (8.37 | ) | | | — | | | | — | | | | — | |
| Net asset value, end of period | | $ | 17.73 | | | $ | 17.59 | | | $ | 27.53 | | | $ | 23.24 | | | $ | 20.14 | |
Total return2 | | | 7.17 | % | | | (4.23 | )% | | | 18.46 | % | | | 15.39 | % | | | (2.80 | )% |
| Ratios and Supplemental Data: | | | | | | | | | | | | | | | | | | | | |
| Net assets, end of period (in thousands) | | $ | 5,851 | | | $ | 12,919 | | | $ | 12,434 | | | $ | 13,561 | | | $ | 14,172 | |
| Ratio of expenses to average net assets: | | | | | | | | | | | | | | | | | | | | |
Before fees waived/recovered4 | | | 1.38 | %6 | | | 0.44 | %6 | | | 0.72 | %6 | | | 1.26 | % | | | 1.22 | % |
After fees waived/recovered4 | | | 0.90 | %6 | | | 0.62 | %6 | | | 0.88 | %6 | | | 1.17 | % | | | 1.17 | % |
| Ratio of net investment income (loss) to average net assets: | | | | | | | | | | | | | | | | | | | | |
Before fees waived/recovered4,5 | | | (0.56 | )% | | | 0.29 | % | | | (0.22 | )% | | | (0.06 | )% | | | (0.13 | )% |
After fees waived/recovered4,5 | | | (0.08 | )% | | | 0.10 | % | | | (0.38 | )% | | | 0.03 | % | | | (0.08 | )% |
| Portfolio turnover rate | | | 7 | % | | | 17 | % | | | 117 | % | | | 17 | % | | | 23 | % |
1 | Based on average shares outstanding for the period. |
2 | Total returns would have been lower had expenses not been waived or absorbed by the Advisor. Returns shown do not reflect the deduction of taxes that a shareholder would pay on Fund distributions or the redemption of Fund shares. |
3 | Effective September 30, 2015, the Class Y shares were re-designated as Class I shares. |
4 | Does not include expenses of the investment companies in which the Fund invests. |
5 | Recognition of net investment income by the Fund is affected by the timing of the declaration of dividends by the underlying investment companies in which the Fund invests. The ratio does not include net investment income of the investment companies in which the Fund invests. |
6 | The Advisor does not receive management fees for Fund assets invested in other series of the Trust advised by the Advisor (affiliated investments). |
See accompanying Notes to Financial Statements.
North Square Oak Ridge Dividend Growth Fund
FINANCIAL HIGHLIGHTS
Class I
Per share operating performance.
For a capital share outstanding throughout each period.
| | | For the Year Ended May 31, | |
| | | 2020 | | | 2019 | | | 2018 | | | 2017 | | | 2016 | |
| Net asset value, beginning of period | | $ | 16.25 | | | $ | 15.65 | | | $ | 13.69 | | | $ | 12.08 | | | $ | 12.84 | |
| Income from Investment Operations: | | | | | | | | | | | | | | | | | | | | |
Net investment income1 | | | 0.24 | | | | 0.24 | | | | 0.24 | | | | 0.21 | | | | 0.20 | |
| Net realized and unrealized gain (loss) | | | 1.28 | | | | 0.82 | | | | 1.93 | | | | 1.73 | | | | (0.58 | ) |
| Total from investment operations | | | 1.52 | | | | 1.06 | | | | 2.17 | | | | 1.94 | | | | (0.38 | ) |
| Less Distributions: | | | | | | | | | | | | | | | | | | | | |
| From net investment income | | | (0.25 | ) | | | (0.24 | ) | | | (0.20 | ) | | | (0.19 | ) | | | (0.20 | ) |
| From net realized gain | | | (0.05 | ) | | | (0.22 | ) | | | (0.01 | ) | | | (0.14 | ) | | | (0.18 | ) |
| Total distributions | | | (0.30 | ) | | | (0.46 | ) | | | (0.21 | ) | | | (0.33 | ) | | | (0.38 | ) |
| Net asset value, end of period | | $ | 17.47 | | | $ | 16.25 | | | $ | 15.65 | | | $ | 13.69 | | | $ | 12.08 | |
Total return2 | | | 9.35 | % | | | 6.94 | % | | | 15.89 | % | | | 16.25 | % | | | (2.92 | )% |
| Ratios and Supplemental Data: | | | | | | | | | | | | | | | | | | | | |
| Net assets, end of period (in thousands) | | $ | 11,146 | | | $ | 12,014 | | | $ | 10,036 | | | $ | 372 | | | $ | 320 | |
| Ratio of expenses to average net assets: | | | | | | | | | | | | | | | | | | | | |
| Before fees waived and expenses absorbed | | | 1.89 | % | | | 2.38 | % | | | 2.93 | % | | | 36.24 | % | | | 42.43 | % |
| After fees waived and expenses absorbed | | | 1.00 | % | | | 1.00 | % | | | 1.00 | % | | | 1.00 | % | | | 1.00 | % |
| Ratio of net investment income (loss) to average net assets: | | | | | | | | | | | | | | | | | | | | |
| Before fees waived and expenses absorbed | | | 0.47 | % | | | 0.18 | % | | | (0.33 | )% | | | (33.57 | )% | | | (39.73 | )% |
| After fees waived and expenses absorbed | | | 1.36 | % | | | 1.56 | % | | | 1.60 | % | | | 1.67 | % | | | 1.70 | % |
| Portfolio turnover rate | | | 18 | % | | | 15 | % | | | 30 | % | | | 22 | % | | | 11 | % |
1 | Based on average shares outstanding for the period. |
2 | Total returns would have been lower had expenses not been waived or absorbed by the Advisor. Returns shown do not reflect the deduction of taxes that a shareholder would pay on Fund distributions or the redemption of Fund shares. |
See accompanying Notes to Financial Statements.
North Square Funds
NOTES TO FINANCIAL STATEMENTS
May 31, 2020
Note 1 – Organization
North Square Oak Ridge Small Cap Growth Fund (“Small Cap Growth” or “Small Cap Growth Fund”), North Square Dynamic Small Cap Fund (“Dynamic Small Cap” or “Dynamic Small Cap Fund”), North Square Oak Ridge Disciplined Growth Fund (“Disciplined Growth” or “Disciplined Growth Fund”), North Square Multi Strategy Fund, (“Multi Strategy” or “Multi Strategy Fund”) and North Square Oak Ridge Dividend Growth Fund (“Dividend Growth” or “Dividend Growth Fund”) (each a “Fund” and collectively the “Funds”) are organized as a series of North Square Investments Trust, a Delaware statutory trust (the “Trust”) which is registered as an open-end management investment company under the Investment Company Act of 1940, as amended (the “1940 Act”). The Small Cap Growth Fund, Dynamic Small Cap Fund, Disciplined Growth Fund, Multi Strategy Fund, and Dividend Growth Fund are diversified Funds.
The Small Cap Growth Fund’s primary investment objective is to seek capital appreciated. Effective the close of business on May 10, 2019, the Small Cap Growth Fund acquired all the assets and assumed the liabilities of the Oak Ridge Small Cap Growth Fund (the “Predecessor Fund”), a series of Investment Managers Series Trust.
The Dynamic Small Cap Fund’s primary investment objective is to seek long-term capital appreciation. Effective the close of business on May 10, 2019, the Dynamic Small Cap Fund acquired all the assets and assumed the liabilities of the Oak Ridge Dynamic Small Cap Fund (the “Predecessor Fund”), a series of Investment Managers Series Trust.
The Disciplined Growth Fund’s primary investment objective is to seek long-term growth of capital. Effective the close of business on May 10, 2019, the Disciplined Growth Fund acquired all the assets and assumed the liabilities of the Oak Ridge Disciplined Growth Fund (the “Predecessor Fund”), a series of Investment Managers Series Trust.
The Multi Strategy Fund’s primary investment objective is to seek capital appreciation. Effective the close of business on May 10, 2019, the Multi Strategy Fund acquired all the assets and assumed the liabilities of the Oak Ridge Multi Strategy Fund (the “Predecessor Fund”), a series of Investment Managers Series Trust.
The Dividend Growth Fund’s primary investment objective is to provide current income and to seek long-term capital appreciation. Effective the close of business on May 10, 2019, the Dividend Growth Fund acquired all the assets and assumed the liabilities of the Oak Ridge Dividend Growth Fund (the “Predecessor Fund”), a series of Investment Managers Series Trust.
Each fund conversion was accomplished by the following tax free reorganization in which shareholders of each predecessor fund received the same aggregated net asset value in the corresponding funds and classes as noted below:
| | | | | | | | | | | | Net Unrealized | |
| | | | | | | | | Net Asset | | | Appreciation | |
| Fund/Share Class | | Total Shares | | | Net Assets | | | Value/Share | | | (Depreciation) | |
| Small Cap Growth Fund | | | | | | | | | | | $ | 49,075,731 | |
| Class A | | | 8,000,311 | | | $ | 116,101,186 | | | $ | 14.51 | | | | | |
| Class C | | | 4,382,712 | | | $ | 20,542,431 | | | $ | 4.69 | | | | | |
| Class I | | | 4,282,521 | | | $ | 68,643,841 | | | $ | 16.03 | | | | | |
| Class K | | | 708,215 | | | $ | 11,194,276 | | | $ | 15.81 | | | | | |
| Dynamic Small Cap Fund | | | | | | | | | | | | | | $ | 739,413 | |
| Class A | | | 26,564 | | | $ | 329,084 | | | $ | 12.39 | | | | | |
| Class I | | | 1,765,813 | | | $ | 22,084,940 | | | $ | 12.51 | | | | | |
| Disciplined Growth Fund | | | | | | | | | | | | | | $ | 2,901,154 | |
| Class I | | | 991,672 | | | $ | 14,317,175 | | | $ | 14.44 | | | | | |
| Multi Strategy Fund | | | | | | | | | | | | | | $ | 2,848,104 | |
| Class A | | | 1,983,414 | | | $ | 35,323,305 | | | $ | 17.81 | | | | | |
| Class C | | | 684,732 | | | $ | 10,043,626 | | | $ | 14.67 | | | | | |
| Class I | | | 742,488 | | | $ | 13,748,654 | | | $ | 18.52 | | | | | |
| Dividend Growth Fund | | | | | | | | | | | | | | $ | 1,800,482 | |
| Class A | | | 55,474 | | | $ | 925,451 | | | $ | 16.68 | | | | | |
| Class I | | | 739,187 | | | $ | 12,419,039 | | | $ | 16.80 | | | | | |
Class A shares of the Dynamic Small Cap Fund and Dividend Growth Fund closed as of the close of business on May 29, 2020, and shareholders of those classes could transfer into Class I shares of their respective Fund (See Note 3).
The shares of each class represent an interest in the same portfolio of investments of the Fund and have equal rights as to voting, redemptions, dividends and liquidation, subject to the approval of the Trustees. Income, expenses (other than expenses attributable to a
North Square Funds
NOTES TO FINANCIAL STATEMENTS – Continued
May 31, 2020
specific class) and realized and unrealized gains and losses on investments are allocated to each class of shares in proportion to their relative shares outstanding. Shareholders of a class that bears distribution and service expenses under the terms of a distribution plan have exclusive voting rights to that distribution plan.
Each Fund is an investment company and accordingly follows the investment company accounting and reporting guidance of the Financial Accounting Standards Board (FASB) Accounting Standard Codification Topic 946 “Financial Services—Investment Companies”.
Note 2 – Accounting Policies
The following is a summary of the significant accounting policies consistently followed by the Funds in the preparation of their financial statements. The preparation of financial statements in conformity with accounting principles generally accepted in the United States of America (“GAAP”) requires management to make estimates and assumptions that affect the reported amounts and disclosures in the financial statements. Actual results could differ from these estimates.
(a) Valuation of Investments
Each Fund values equity securities at the last reported sale price on the principal exchange or in the principal over the counter (“OTC”) market in which such securities are traded, as of the close of regular trading on the NYSE on the day the securities are being valued or, if the last-quoted sales price is not readily available, the securities will be valued at the last bid or the mean between the last available bid and ask price. Securities traded on the NASDAQ are valued at the NASDAQ Official Closing Price (“NOCP”). Investments in open-end investment companies are valued at the daily closing net asset value of the respective investment company. Debt securities are valued by utilizing a price supplied by independent pricing service providers. The independent pricing service providers may use various valuation methodologies including matrix pricing and other analytical pricing models as well as market transactions and dealer quotations. These models generally consider such factors as yields or prices of bonds of comparable quality, type of issue, coupon, maturity, ratings and general market conditions. If a price is not readily available for a portfolio security, the security will be valued at fair value (the amount which the Fund might reasonably expect to receive for the security upon its current sale) as determined in good faith by the Fund’s advisor, subject to review and approval by the Valuation Committee, pursuant to procedures adopted by the Board of Trustees. The actions of the Valuation Committee are subsequently reviewed by the Board at its next regularly scheduled board meeting. The Valuation Committee meets as needed. The Valuation Committee is comprised of all the Trustees, but action may be taken by any one of the Trustees.
Fair value pricing may be applied to foreign securities held by the Funds upon the occurrence of an event after the close of trading on non-U.S. markets but before the close of trading on the NYSE when each Fund’s NAV is determined. If the event may result in a material adjustment to the price of the Fund’s foreign securities once non-U.S. markets open on the following business day (such as, for example, a significant surge or decline in the U.S. market), the Fund may value such foreign securities at fair value, taking into account the effect of such event, in order to calculate the Fund’s NAV. Other types of portfolio securities that the Fund may fair value include, but are not limited to: (1) investments that are illiquid or traded infrequently, including “restricted” securities and private placements for which there is no public market; (2) investments for which, in the judgment of the advisor, the market price is stale; (3) securities of an issuer that has entered into a restructuring; (4) securities for which trading has been halted or suspended; and (5) fixed income securities for which there is not a current market value quotation.
Foreign securities traded in countries outside the U.S. are fair valued by utilizing the quotations of an independent pricing service or from a brokerage firm. The pricing service or broker will use a statistical analyses and quantitative models to adjust local prices using factors such as subsequent movement and changes in the prices of indexes, securities and exchange rates in other markets in determining fair value as of the time the Fund calculates the NAVs. The Board reviews the independent third party fair valuation analysis report quarterly.
The global outbreak of COVID-19 (commonly referred to as “coronavirus”) has disrupted economic markets and the prolonged economic impact is uncertain. The ultimate economic fallout from the pandemic, and the long-term impact on economies, markets, industries and individual issuers, are not known. The operational and financial performance of the issuers of securities in which the Funds invest depends on future developments, including the duration and spread of the outbreak, and such uncertainty may in turn adversely affect the value and liquidity of the Funds’ investments, impair the Funds’ ability to satisfy redemption requests, and negatively impact the Funds’ performance.
(b) Investment Transactions, Investment Income and Expenses
Investment transactions are accounted for on the trade date. Realized gains and losses on investments are determined on the identified cost basis. Dividend income is recorded net of applicable withholding taxes on the ex-dividend date and interest income is recorded on an accrual basis. Withholding taxes on foreign dividends, if applicable, are paid (a portion of which may be reclaimable) or provided for in accordance with the applicable country’s tax rules and rates and are disclosed in the Statements of Operations. Withholding tax
North Square Funds
NOTES TO FINANCIAL STATEMENTS – Continued
May 31, 2020
reclaims are filed in certain countries to recover a portion of the amounts previously withheld. The Funds record a reclaim receivable based on a number of factors, including a jurisdiction’s legal obligation to pay reclaims as well as payment history and market convention. Discounts or premiums on debt securities are accreted or amortized to interest income over the lives of the respective securities using the effective interest method. Income and expenses of the Funds are allocated on a pro rata basis to each class of shares. Expenses incurred by the Trust with respect to more than one fund are allocated in proportion to the net assets of each fund except where allocation of direct expenses to each fund or an alternative allocation method can be more appropriately made. Expenses such as distribution and service fees pursuant to Rule 12b-1, transfer agent fees and expenses with respect to the Funds, that are specific to individual share classes, are accrued directly to the respective share class.
(c) Federal Income Taxes
Each Fund intends to comply with the requirements of Subchapter M of the Internal Revenue Code applicable to regulated investment companies and to distribute substantially all of its net investment income and any net realized gains to its shareholders. Therefore, no provision is made for federal income or excise taxes. Due to the timing of dividend distributions and the differences in accounting for income and realized gains and losses for financial statement and federal income tax purposes, the fiscal year in which amounts are distributed may differ from the year in which the income and realized gains and losses are recorded by the Funds.
Accounting for Uncertainty in Income Taxes (the “Income Tax Statement”) requires an evaluation of tax positions taken (or expected to be taken) in the course of preparing a Fund’s tax returns to determine whether these positions meet a “more-likely-than-not” standard that, based on the technical merits, have a more than fifty percent likelihood of being sustained by a taxing authority upon examination. A tax position that meets the “more-likely-than-not” recognition threshold is measured to determine the amount of benefit to recognize in the financial statements. The Fund recognizes interest and penalties, if any, related to unrecognized tax benefits as income tax expense in the Statement of Operations.
The Income Tax Statement requires management of the Funds to analyze tax positions taken in the prior three open tax years, if any, and tax positions expected to be taken in the Funds’ current tax year, as defined by the IRS statute of limitations for all major jurisdictions, including federal tax authorities and certain state tax authorities. As of and during the open years ended May 31, 2018-2020 the Funds did not have a liability for any unrecognized tax benefits. The Funds have no examination in progress and are not aware of any tax positions for which it is reasonably possible that the total amounts of unrecognized tax benefits will significantly change in the next twelve months.
(d) Distributions to Shareholders
The Dividend Growth Fund will make distributions of net investment income quarterly. The Small Cap Growth Fund, Dynamic Small Cap Fund, Disciplined Growth Fund, and Multi Strategy Fund will make distributions of net investment income, if any, at least annually. Each Fund makes distributions of its net capital gains, if any, at least annually. Distributions to shareholders are recorded on the ex-dividend date. The amount and timing of distributions are determined in accordance with federal income tax regulations, which may differ from GAAP.
The character of distributions made during the year from net investment income or net realized gains may differ from the characterization for federal income tax purposes due to differences in the recognition of income, expense and gain (loss) items for financial statement and tax purposes.
Note 3 – Reorganization Information
Effective upon the close of business on May 29, 2020, the outstanding Class A shares of the Dynamic Small Cap Fund and the Dividend Growth Fund were converted into Class I shares of their respective funds, as applicable (the “Class Conversion”) pursuant to the Supplement to the Prospectus dated April 29, 2020. The Class Conversion was completed based on the share classes’ relative net asset values on the date of conversion, without the imposition of any sales charge or any other charge as detailed below:
| | | Shares | | | Net | | | NAV | | | Share | |
| Dynamic Small Cap Fund | | Outstanding | | | Assets | | | per Share | | | Conversion Ratio | |
| Class A | | | 6,302 | | | $ | 71,729 | | | $ | 11.3825 | | | 0.9929 | |
| Class I (before conversion) | | | 1,345,847 | | | $ | 15,429,378 | | | $ | 11.4644 | | | | |
| Class I (after conversion) | | | 1,351,995 | | | $ | 15,499,862 | | | $ | 11.4644 | | | | |
| | | | | | | | | | | | | |
| | | Shares | | | Net | | | NAV | | | Share | |
| Dividend Growth Fund | | Outstanding | | | Assets | | | per Share | | | Conversion Ratio | |
| Class A | | | 58,551 | | | $ | 1,015,389 | | | $ | 17.3420 | | | 0.9925 | |
| Class I (before conversion) | | | 629,655 | | | $ | 11,001,753 | | | $ | 17.4727 | | | | |
| Class I (after conversion) | | | 637,893 | | | $ | 11,145,684 | | | $ | 17.4727 | | | | |
North Square Funds
NOTES TO FINANCIAL STATEMENTS – Continued
May 31, 2020
Note 4 – Investment Advisory and Other Agreements
The Trust, on behalf of the Funds, entered into an Investment Advisory Agreement (the “Agreement”) with North Square Investments, LLC (the “Advisor” or “NSI”). Under the terms of the Agreement, the Funds pay a monthly investment advisory fee to the Advisor based on each Fund’s average daily net assets. Fees paid to the Advisor for the period ended May 31, 2020 are reported on the Statements of Operations. The annual and tiered rates are listed by Fund in the below table:
| | | Investment | |
| | | Advisory Fees | |
| | Small Cap Growth Fund | | |
| | First $1 billion | 0.85% | |
| | Thereafter | 0.80% | |
| | Dynamic Small Cap Fund | 0.90% | |
| | Disciplined Growth Fund | 0.70% | |
| | Multi Strategy Fund | 0.00% – 0.50%1 | |
| | Dividend Growth Fund | 0.75% | |
1 | The annual advisory fee is calculated as follows: (i) 0.00% for Fund assets invested in other series of the Trust advised by the Advisor (“affiliated investments”) and (ii) 0.50% for Fund assets invested in non-affiliated investments. For the period ended May 31, 2020, the amount of advisory fees waived due to affiliated investments is reported under “Affiliated fund fee waived” on the Statements of Operations. |
The Advisor engages Oak Ridge Investments, LLC (“Oak Ridge”) to manage the Small Cap Growth Fund, Disciplined Growth Fund, Multi Strategy Fund and Dividend Growth Fund as a sub-advisor. The Advisor also engages Algert Global LLC (“Algert Global”) to manage the Dynamic Small Cap Fund as a sub-advisor. The Advisor pays the sub-advisors from its advisory fees.
The Advisor has contractually agreed to waive its fee and, if necessary, to absorb other operating expenses to ensure that total annual operating expenses (excluding taxes, leverage interest, brokerage commissions, dividend and interest expenses on short sales, acquired fund fees and expenses as determined in accordance with Form N-1A, expenses incurred in connection with any merger or reorganization, or extraordinary expenses such as litigation expenses) are limited. The agreements are effective until the dates listed below and may be terminated before those dates only by the Trust’s Board of Trustees. The table below contains the agreement expiration and expense cap by Fund and by Class:
| | | Total Limit on Annual Operating Expenses |
| | | Class A | Class C | Class I | Class K |
| | Agreement Expires | Shares† | Shares† | Shares† | Shares† |
| Small Cap Growth Fund | September 30, 2021 | 1.39% | 2.14% | 1.14% | 0.99% |
| Dynamic Small Cap Fund | September 30, 2029 | — | — | 1.15% | — |
| Disciplined Growth Fund | September 30, 2029 | 1.20% | — | 0.95% | — |
| Multi Strategy Fund | September 30, 2029 | 1.20% | 2.10% | 1.17% | — |
| Dividend Growth Fund | September 30, 2029 | — | — | 1.00% | — |
| † | The total limit on annual operating expenses is calculated based on each Fund’s average daily net assets. |
Each Fund’s advisor is permitted to seek reimbursement from the Fund, subject to certain limitations, of fees waived or payments made to the Fund for a period ending thirty-six months after the date of the waiver or payment. The Multi Strategy Fund includes a maximum reimbursement of 0.20% per fiscal year. This reimbursement may be requested from the Fund if the reimbursement will not cause the Fund’s annual expense ratio to exceed the lesser of (a) the expense limitation amount in effect at the time such fees were waived or payments made, or (b) the expense limitation amount in effect at the time of the reimbursement. The Advisor may recapture all or a portion of this amount no later than the dates stated below:
| | | Small Cap Growth Fund | |
| | | Class A | | | Class C | | | Class I | | | Class K | | | Total | |
| May 31, 2021 | | $ | 12,733 | | | $ | — | | | $ | — | | | $ | — | | | $ | 12,733 | |
| May 31, 2022 | | $ | 101,259 | | | $ | 13,006 | | | $ | 84,760 | | | $ | 22,186 | | | $ | 221,211 | |
| May 31, 2023 | | $ | 574,021 | | | $ | 84,473 | | | $ | 303,815 | | | $ | 50,089 | | | $ | 1,012,398 | |
| | | $ | 688,013 | | | $ | 97,479 | | | $ | 388,575 | | | $ | 72,275 | | | $ | 1,246,342 | |
North Square Funds
NOTES TO FINANCIAL STATEMENTS – Continued
May 31, 2020
| | | Multi Strategy Fund | |
| | | Class A | | | Class C | | | Class I | | | Total | |
| May 31, 2021 | | $ | — | | | $ | — | | | $ | — | | | $ | — | |
| May 31, 2022 | | $ | — | | | $ | — | | | $ | — | | | $ | — | |
| May 31, 2023 | | $ | 51,827 | | | $ | 2,664 | | | $ | 2,345 | | | $ | 56,836 | |
| | | $ | 51,827 | | | $ | 2,664 | | | $ | 2,345 | | | $ | 56,836 | |
| | | | | | | | | | | | | | | | | |
| | | Dynamic | | | Disciplined | | | Dividend | | | | | |
| | | Small | | | Growth | | | Growth | | | | | |
| | | Cap Fund | | | Fund | | | Fund | | | | | |
| May 31, 2021 | | $ | 174,858 | | | $ | 134,756 | | | $ | 152,015 | | | | | |
| May 31, 2022 | | $ | 221,364 | | | $ | 162,758 | | | $ | 166,469 | | | | | |
| May 31, 2023 | | $ | 205,274 | | | $ | 120,773 | | | $ | 109,975 | | | | | |
| | | $ | 601,496 | | | $ | 418,287 | | | $ | 428,459 | | | | | |
U.S. Bancorp Fund Services, LLC doing business as U.S. Bank Global Fund Services (“GFS”) serves as the Funds’ fund accountant, transfer agent and administrator. U.S. Bank N.A., serves as the Funds’ custodian. The Funds’ allocated fees incurred for fund accounting, transfer agency, fund administration and custody services for the period ended May 31, 2020 are reported on the Statements of Operations.
Compass Distributors, LLC serves as the Funds’ distributor (the “Distributor”). The Distributor does not receive compensation from the Funds for its distribution services; the Advisor pays the Distributor a fee for its distribution-related services.
Cipperman Compliance Services provides Chief Compliance Officer (“CCO”) services to the Trust. The Funds’ allocated fees incurred for CCO services for the period ended May 31, 2020, are reported on the Statements of Operations.
Note 5 – Federal Income Taxes
At May 31, 2020, gross unrealized appreciation and depreciation of investments, based on cost for federal income tax purposes were as follows:
| | | Small Cap | | | Dynamic | | | Disciplined | |
| | | Growth Fund | | | Small Cap Fund | | | Growth Fund | |
| Cost of investments | | $ | 99,310,321 | | | $ | 15,145,375 | | | $ | 7,846,423 | |
| Gross unrealized appreciation | | $ | 38,469,951 | | | $ | 2,041,194 | | | $ | 4,412,724 | |
| Gross unrealized depreciation | | | (5,354,667 | ) | | | (1,649,283 | ) | | | (44,820 | ) |
| Net unrealized appreciation on investments | | $ | 33,115,284 | | | $ | 391,911 | | | $ | 4,367,904 | |
| | | | | | | | | | | | | |
| | | Multi Strategy | | | Dividend | | | | | |
| | | Fund | | | Growth Fund | | | | | |
| Cost of investments | | $ | 40,241,608 | | | $ | 9,311,763 | | | | | |
| Gross unrealized appreciation | | $ | 5,734,317 | | | $ | 2,841,145 | | | | | |
| Gross unrealized depreciation | | | (1,116,663 | ) | | | (116,757 | ) | | | | |
| Net unrealized appreciation on investments | | $ | 4,617,654 | | | $ | 2,724,388 | | | | | |
The difference between cost amounts for financial statement and federal income tax purposes is due primarily to timing differences in recognizing certain gains and losses in security transactions.
North Square Funds
NOTES TO FINANCIAL STATEMENTS – Continued
May 31, 2020
GAAP requires that certain components of net assets be reclassified between financial and tax reporting. These reclassifications have no effect on net assets or net asset value per share. For the year ended May 31, 2020, permanent differences in book and tax accounting have been reclassified to paid in capital, accumulated net investment income/loss and accumulated net realized gain/loss as follows:
| | | Increase (Decrease) | |
| | | | | | Total | |
| | | | | | Distributable | |
| | | Paid In Capital | | | Earnings | |
| Small Cap Growth Fund | | $ | 18,512,073 | | | $ | (18,512,073 | ) |
| Dynamic Small Cap Fund | | $ | — | | | $ | — | |
| Disciplined Growth Fund | | $ | 124,742 | | | $ | (124,742 | ) |
| Multi Strategy Fund | | $ | 1,605,923 | | | $ | (1,605,923 | ) |
| Dividend Growth Fund | | $ | — | | | $ | — | |
As of May 31, 2020, the components of accumulated earnings (deficit) on a tax basis for the Funds were as follows:
| | | Small Cap | | | Dynamic | | | Disciplined | |
| | | Growth Fund | | | Small Cap Fund | | | Growth Fund | |
| Undistributed ordinary income | | $ | — | | | $ | — | | | $ | 15,967 | |
| Undistributed long-term gains | | | 4,719,440 | | | | — | | | | 573,735 | |
| Accumulated earnings | | $ | 4,719,440 | | | $ | — | | | $ | 589,702 | |
| Accumulated capital and other losses | | $ | (632,616 | ) | | $ | (910,321 | ) | | $ | — | |
| Net unrealized appreciation on investments | | | 33,115,284 | | | | 391,911 | | | | 4,367,904 | |
| Total accumulated earnings | | $ | 37,202,108 | | | $ | (518,410 | ) | | $ | 4,957,606 | |
| | | | | | | | | | | | | |
| | | Multi Strategy | | | Dividend | | | | | |
| | | Fund | | | Growth Fund | | | | | |
| Undistributed ordinary income | | $ | — | | | $ | — | | | | | |
| Undistributed long-term gains | | | — | | | | — | | | | | |
| Accumulated earnings | | $ | — | | | $ | — | | | | | |
| Accumulated capital and other losses | | $ | (111,693 | ) | | $ | (36,080 | ) | | | | |
| Net unrealized appreciation on investments | | | 4,617,654 | | | | 2,724,388 | | | | | |
| Total accumulated earnings | | $ | 4,505,961 | | | $ | 2,688,308 | | | | | |
The tax character of distributions paid during the fiscal years ended May 31, 2020 and May 31, 2019 were as follows:
| | | Small Cap | | | Dynamic | | | Disciplined | |
| | | Growth Fund | | | Small Cap Fund | | | Growth Fund | |
| | | May 31, | | | May 31, | | | May 31, | | | May 31, | | | May 31, | | | May 31, | |
| Distributions paid from: | | 2020 | | | 2019 | | | 2020 | | | 2019 | | | 2020 | | | 2019 | |
| Ordinary income | | $ | — | | | $ | 2,696 | | | $ | 51,913 | | | $ | 3,574,258 | | | $ | 5,773 | | | $ | — | |
| Net long-term capital gains | | | 27,681,910 | | | | 43,269,565 | | | | — | | | | 473,119 | | | | 595,189 | | | | 124,163 | |
| Total distributions paid | | $ | 27,681,910 | | | $ | 43,272,261 | | | $ | 51,913 | | | $ | 4,047,377 | | | $ | 600,962 | | | $ | 124,163 | |
| | | | | | | | | | | | | | | | | | | | | | | | | |
| | | Multi Strategy | | | Dividend | | | | | | | | | |
| | | Fund | | | Growth Fund | | | | | | | | | |
| | | May 31, | | | May 31, | | | May 31, | | | May 31, | | | | | | | | | |
| Distributions paid from: | | 2020 | | | 2019 | | | 2020 | | | 2019 | | | | | | | | | |
| Ordinary income | | $ | 3,325,416 | | | $ | — | | | $ | 216,749 | | | $ | 307,986 | | | | | | | | | |
| Net long-term capital gains | | | — | | | | 22,347,312 | | | | — | | | | 56,146 | | | | | | | | | |
| Total distributions paid | | $ | 3,325,416 | | | $ | 22,347,312 | | | $ | 216,749 | | | $ | 364,132 | | | | | | | | | |
As of May 31, 2020, the Funds did not have any accumulated capital loss carryforwards.
North Square Funds
NOTES TO FINANCIAL STATEMENTS – Continued
May 31, 2020
As of May 31, 2020, the Funds had the following qualified late-year ordinary losses which are deferred until fiscal year 2021 for tax purposes. Net late-year losses incurred after December 31, and within the taxable year are deemed to arise on the first day of the Fund’s next taxable year.
| | Late Year Losses | | Post October Losses | |
| Small Cap Growth Fund | | $ | (632,616 | ) | | | $ | — | | |
| Dynamic Small Cap Fund | | $ | — | | | | $ | (910,321 | ) | |
| Disciplined Growth Fund | | $ | — | | | | $ | — | | |
| Multi Strategy Fund | | $ | (111,693 | ) | | | $ | — | | |
| Dividend Growth Fund | | $ | (36,080 | ) | | | $ | — | | |
Note 6 – Investment Transactions
For the year ended May 31, 2020, purchases and sales of investments were as follows:
| | | Purchases | | | | Sales | | |
| Small Cap Growth Fund | | $ | 60,403,628 | | | | $ | 137,078,844 | | |
| Dynamic Small Cap Fund | | $ | 31,957,702 | | | | $ | 37,644,344 | | |
| Disciplined Growth Fund | | $ | 2,178,039 | | | | $ | 6,319,862 | | |
| Multi Strategy Fund | | $ | 3,607,446 | | | | $ | 19,887,077 | | |
| Dividend Growth Fund | | $ | 2,298,336 | | | | $ | 4,054,077 | | |
Note 7 – Shareholder Servicing Plan
The Trust, on behalf of the Funds, has adopted a Shareholder Servicing Plan to pay a fee at an annual rate of up to 0.15% of each Fund’s average daily net assets of shares serviced by shareholder servicing agents who provide administrative and support services to their customers.
For the period ended May 31, 2020, shareholder servicing fees incurred are disclosed on the Statements of Operations.
Note 8 – Distribution Plan
The Trust, on behalf of each Fund, has adopted a Distribution Plan (the “Plan”) pursuant to Rule 12b-1 under the 1940 Act that allows each Fund to pay distribution fees for the sale and distribution of its Class A and Class C shares. The Plan provides for the payment of distribution fees at the annual rate of up to 0.25% of each Fund’s average daily net assets attributable to Class A shares and 1.00% of average daily net assets attributable to Class C shares.
For the period ended May 31, 2020, distribution fees incurred with respect to Class A and Class C shares are disclosed on the Statements of Operations.
Note 9 – Indemnifications
In the normal course of business, the Funds enter into contracts that contain a variety of representations which provide general indemnifications. The Funds’ maximum exposure under these arrangements is unknown, as this would involve future claims that may be made against the Funds that have not yet occurred. However, the Funds expect the risk of loss to be remote.
Note 10 – Fair Value Measurements and Disclosure
Fair Value Measurements and Disclosures defines fair value, establishes a framework for measuring fair value in accordance with GAAP, and expands disclosure about fair value measurements. It also provides guidance on determining when there has been a significant decrease in the volume and level of activity for an asset or a liability, when a transaction is not orderly, and how that information must be incorporated into a fair value measurement.
Under Fair Value Measurements and Disclosures, various inputs are used in determining the value of the Funds’ investments. These inputs are summarized into three broad Levels as described below:
| | • | Level 1 – Unadjusted quoted prices in active markets for identical assets or liabilities that the Fund has the ability to access. |
| | | |
| | • | Level 2 – Observable inputs other than quoted prices included in Level 1 that are observable for the asset or liability, either directly or indirectly. These inputs may include quoted prices for the identical instrument on an inactive market, prices for similar instruments, interest rates, prepayment speeds, credit risk, yield curves, default rates and similar data. |
| | | |
| | • | Level 3 – Unobservable inputs for the asset or liability, to the extent relevant observable inputs are not available, representing the Fund’s own assumptions about the assumptions a market participant would use in valuing the asset or liability, and would be based on the best information available. |
North Square Funds
NOTES TO FINANCIAL STATEMENTS – Continued
May 31, 2020
The availability of observable inputs can vary from security to security and is affected by a wide variety of factors, including for example, the type of security, whether the security is new and not yet established in the marketplace, the liquidity of markets, and other characteristics particular to the security. To the extent that valuation is based on models or inputs that are less observable or unobservable in the market, the determination of fair value requires more judgment. Accordingly, the degree of judgment exercised in determining fair value is greatest for instruments categorized in Level 3.
The inputs to measure fair value may fall into different Levels of the fair value hierarchy. In such cases, for disclosure purposes, the Level in the fair value hierarchy within which the fair value measurement falls in its entirety, is determined based on the lowest Level input that is significant to the fair value measurement in its entirety.
The inputs or methodology used for valuing securities are not an indication of the risk associated with investing in those securities. The following is a summary of the inputs used, as of May 31, 2020, in valuing the Funds’ assets carried at fair value:
| Small Cap Growth Fund | | Level 1 | | | Level 2* | | | Level 3** | | | Total | |
| Investments | | | | | | | | | | | | |
Common Stocks1 | | $ | 118,349,543 | | | $ | — | | | $ | — | | | $ | 118,349,543 | |
| REITs | | | 4,953,059 | | | | — | | | | — | | | | 4,953,059 | |
| Short-Term Investment | | | 9,123,003 | | | | — | | | | — | | | | 9,123,003 | |
| Total | | $ | 132,425,605 | | | $ | — | | | $ | — | | | $ | 132,425,605 | |
| | | | | | | | | | | | | | | | | |
| Dynamic Small Cap Fund | | Level 1 | | | Level 2* | | | Level 3 | | | Total | |
| Investments | | | | | | | | | | | | | | | | |
Common Stocks1 | | $ | 14,784,258 | | | $ | — | | | $ | — | | | $ | 14,784,258 | |
| REITs | | | 496,794 | | | | — | | | | — | | | | 496,794 | |
| Rights | | | — | | | | — | | | | 5,544 | | | | 5,544 | |
| Short-Term Investment | | | 250,690 | | | | — | | | | — | | | | 250,690 | |
| Total | | $ | 15,531,742 | | | $ | — | | | $ | 5,544 | | | $ | 15,537,286 | |
| | | | | | | | | | | | | | | | | |
| Disciplined Growth Fund | | Level 1 | | | Level 2* | | | Level 3** | | | Total | |
| Investments | | | | | | | | | | | | | | | | |
Common Stocks1 | | $ | 11,396,360 | | | $ | — | | | $ | — | | | $ | 11,396,360 | |
| REIT | | | 138,131 | | | | — | | | | — | | | | 138,131 | |
| Short-Term Investment | | | 679,836 | | | | — | | | | — | | | | 679,836 | |
| Total | | $ | 12,214,327 | | | $ | — | | | $ | — | | | $ | 12,214,327 | |
| | | | | | | | | | | | | | | | | |
| Multi Strategy Fund | | Level 1 | | | Level 2* | | | Level 3** | | | Total | |
| Investments | | | | | | | | | | | | | | | | |
Mutual Funds | | $ | 41,759,934 | | | $ | — | | | $ | — | | | $ | 41,759,934 | |
| Short-Term Investment | | | 3,099,328 | | | | — | | | | — | | | | 3,099,328 | |
| Total | | $ | 44,859,262 | | | $ | — | | | $ | — | | | $ | 44,859,262 | |
| | | | | | | | | | | | | | | | | |
| Dividend Growth Fund | | Level 1 | | | Level 2* | | | Level 3** | | | Total | |
| Investments | | | | | | | | | | | | | | | | |
Common Stocks1 | | $ | 10,972,576 | | | $ | — | | | $ | — | | | $ | 10,972,576 | |
| REITs | | | 730,489 | | | | — | | | | — | | | | 730,489 | |
| Short-Term Investment | | | 333,086 | | | | — | | | | — | | | | 333,086 | |
| Total | | $ | 12,036,151 | | | $ | — | | | $ | — | | | $ | 12,036,151 | |
1 | | All common stocks held in the Fund are Level 1 securities. For a detailed break-out of common stocks by major sector classification, please refer to the Schedule of Investments. |
| * | | The Fund did not hold any Level 2 securities at period end. |
| ** | | The Fund did not hold any Level 3 securities at period end. |
North Square Funds
NOTES TO FINANCIAL STATEMENTS – Continued
May 31, 2020
The following is a reconciliation of assets in which significant unobservable inputs (Level 3) were used in determining value:
| | Dynamic Small Cap Fund | |
| Beginning balance May 31, 2019 | | $ | 5,703 | | | |
| Transfers into Level 3 during the period | | | — | | | |
| Transfers out of Level 3 during the period | | | — | | | |
| Total realized gain (loss) | | | — | | | |
| Total unrealized appreciation (depreciation) | | | (159 | ) | | |
| Net purchases | | | — | | | |
| Net sales | | | — | | | |
| Balance as of May 31, 2020 | | $ | 5,544 | | | |
| | | | | | Impact to |
| | | | | | Valuation from |
| | Fair Value | Valuation | Unobservable | Input | an increase |
| | May 31, 2020 | Methodologies | Input1 | Range/Value | in Input2 |
| Dynamic | | | Adjusted by management | | |
| Small Cap Fund – | | Fair Value | to reflect | | |
| Rights | $5,544 | Pricing | current conditions | — | Increase |
1 | The investment advisor considers relevant indications of value that are reasonably and timely available to it in determining the fair value to be assigned to a particular security, such as the type and cost of the security; contractual or legal restrictions on resale of the security; relevant financial or business developments of the issuer; actively traded related securities; conversion or exchange rights on the security; related corporate actions; significant events occurring after the close of trading in the security; and changes in overall market conditions. The Fund’s use of fair value pricing may cause the net asset value of Fund shares to differ from the net asset value that would be calculated using market quotations. Fair value pricing involves subjective judgments and it is possible that the fair value determined for a security may be materially different than the value that could be realized upon the sale of that security. |
2 | This column represents the directional change in the fair value of the Level 3 investments that would result from an increase to the corresponding unobservable input. A decrease to the unobservable input would have the opposite effect. |
Note 11 – Investments in Affiliated Issuers
An affiliated issuer is an entity in which the Fund has ownership of at least 5% of the voting securities or any investment in a North Square Fund. Issuers that are affiliates of the Fund at period-end are noted in the Fund’s Schedule of Investments. Additional security purchases and the reduction of certain securities shares outstanding of existing portfolio holdings that were not considered affiliated in prior years may result in the Fund owning in excess of 5% of the outstanding shares at period-end. The table below reflects transactions during the period with entities that are affiliates as of May 31, 2020 and may include acquisitions of new investments, prior year holdings that became affiliated during the period and prior period affiliated holdings that are no longer affiliated as of period-end.
North Square Funds
NOTES TO FINANCIAL STATEMENTS – Continued
May 31, 2020
| Multi Strategy Fund | |
| | | | | | | | | | | | | | | Change in | | | | | | | | | | |
| | | Value, | | | | | | | | | Net | | | Unrealized | | | Value, | | | | | | Capital | |
| | | Beginning | | | | | | Sales | | | Realized | | | Appreciation | | | End | | | Dividend | | | Gain | |
| | | of Period | | | Purchases | | | Proceeds | | | Gain (Loss) | | | (Depreciation) | | | of Period | | | Income | | | Distributions | |
| North Square Dynamic | | | | | | | | | | | | | | | | | | | | | | | | |
| Small Cap Fund – Class I | | $ | 19,464,364 | | | $ | 49,116 | | | $ | 5,300,000 | | | $ | 129,062 | | | $ | 283,157 | | | $ | 14,625,699 | | | $ | 49,116 | | | $ | — | |
| | | | | | | | | | | | | | | | | | | | | | | | | | | | | | | | | |
| North Square Global | | | | | | | | | | | | | | | | | | | | | | | | | | | | | | | | |
| Resources & Infrastructure | | | | | | | | | | | | | | | | | | | | | | | | | | | | | | | | |
| Fund – Class I | | | 4,962,855 | | | | 85,950 | | | | 4,804,533 | | | | (659,539 | ) | | | 415,267 | | | | — | | | | 85,950 | | | | — | |
| | | | | | | | | | | | | | | | | | | | | | | | | | | | | | | | | |
| North Square International | | | | | | | | | | | | | | | | | | | | | | | | | | | | | | | | |
| Small Cap – Class I | | | 2,280,084 | | | | 29,395 | | | | 2,282,544 | | | | (720,701 | ) | | | 693,766 | | | | — | | | | 29,395 | | | | — | |
| | | | | | | | | | | | | | | | | | | | | | | | | | | | | | | | | |
| North Square Strategic | | | | | | | | | | | | | | | | | | | | | | | | | | | | | | | | |
| Income Fund – Class I | | | — | | | | 1,004,399 | | | | — | | | | — | | | | 102,999 | | | | 1,107,398 | | | | 4,399 | | | | — | |
| | | | | | | | | | | | | | | | | | | | | | | | | | | | | | | | | |
| North Square Oak Ridge | | | | | | | | | | | | | | | | | | | | | | | | | | | | | | | | |
| Disciplined Growth Fund – | | | | | | | | | | | | | | | | | | | | | | | | | | | | | | | | |
| Class I | | | 13,489,849 | | | | 583,383 | | | | 4,300,000 | | | | 806,224 | | | | 1,198,047 | | | | 11,777,503 | | | | 5,604 | | | | 577,778 | |
| | | | | | | | | | | | | | | | | | | | | | | | | | | | | | | | | |
| North Square Oak Ridge | | | | | | | | | | | | | | | | | | | | | | | | | | | | | | | | |
| Dividend Growth Fund – | | | | | | | | | | | | | | | | | | | | | | | | | | | | | | | | |
| Class I | | | 11,547,829 | | | | 193,476 | | | | 2,150,000 | | | | 294,972 | | | | 679,152 | | | | 10,565,429 | | | | 163,872 | | | | 29,604 | |
| | | $ | 51,744,981 | | | $ | 1,945,719 | | | $ | 18,837,077 | | | $ | (149,982 | ) | | $ | 3,372,388 | | | $ | 38,076,029 | | | $ | 338,336 | | | $ | 607,382 | |
| | | Shares, | | | | | | | | | Shares, | |
| | | Beginning | | | | | | | | | End | |
| | | of Period | | | Purchases | | | Sales
| | | of Period | |
| North Square Dynamic | | | | | | | | | | | | |
| Small Cap Fund – Class I | | | 1,686,263 | | | | 3,633 | | | | (414,036 | ) | | | 1,275,860 | |
| | | | | | | | | | | | | | | | | |
| North Square Global | | | | | | | | | | | | | | | | |
| Resources & Infrastructure | | | | | | | | | | | | | | | | |
| Fund – Class I | | | 479,345 | | | | 8,126 | | | | (487,471 | ) | | | — | |
| | | | | | | | | | | | | | | | | |
| North Square International | | | | | | | | | | | | | | | | |
| Small Cap – Class I | | | 236,506 | | | | 2,716 | | | | (239,222 | ) | | | — | |
| | | | | | | | | | | | | | | | | |
| North Square Strategic | | | | | | | | | | | | | | | | |
| Income Fund – Class I | | | — | | | | 113,000 | | | | — | | | | 113,000 | |
| | | | | | | | | | | | | | | | | |
| North Square Oak Ridge | | | | | | | | | | | | | | | | |
| Disciplined Growth Fund – | | | | | | | | | | | | | | | | |
| Class I | | | 967,750 | | | | 38,041 | | | | (280,665 | ) | | | 725,126 | |
| | | | | | | | | | | | | | | | | |
| North Square Oak Ridge | | | | | | | | | | | | | | | | |
| Dividend Growth Fund – | | | | | | | | | | | | | | | | |
| Class I | | | 710,531 | | | | 10,931 | | | | (116,780 | ) | | | 604,682 | |
| | | | | | | | | | | | | | | | 2,718,668 | |
Note 12 – Events Subsequent to the Fiscal Period End
The Funds have adopted financial reporting rules regarding subsequent events which require an entity to recognize in the financial statements the effects of all subsequent events that provide additional evidence about conditions that existed at the date of the balance sheet. Management has evaluated the Funds’ related events and transactions that occurred through the date of issuance of the Funds’ financial statements.
There were no events or transactions that occurred during this period that materially impacted the amounts or disclosures in the Funds’ financial statements.
REPORT OF INDEPENDENT REGISTERED PUBLIC ACCOUNTING FIRM
To the Board of Trustees and Shareholders of North Square Investments Trust
Opinion on the Financial Statements
We have audited the accompanying statements of assets and liabilities of the North Square Oak Ridge Small Cap Growth Fund, North Square Dynamic Small Cap Fund, North Square Oak Ridge Disciplined Growth Fund, North Square Multi Strategy Fund, and North Square Oak Ridge Dividend Growth Fund (the ���Funds”), each a series of North Square Investments Trust (the “Trust”), including the schedules of investments, as of May 31, 2020, the related statements of operations, the statements of changes in net assets, and the financial highlights for each of the periods indicated in the table below, and the related notes (collectively referred to as the “financial statements”). In our opinion, the financial statements and financial highlights referred to above present fairly, in all material respects, the financial position of the Funds as of May 31, 2020, the results of their operations, the changes in their net assets, and their financial highlights for the periods indicated in the table below, in conformity with accounting principles generally accepted in the United States of America.
| Individual Funds | | | |
| Constituting | | | |
| North Square | Statement of | Statements of | |
| Investments Trust | Operations | Changes In Net Assets | Financial Highlights |
| North Square Oak Ridge | For the year ended | For each of the two years in the | For each of the five years in the |
| Small Cap Growth Fund, | May 31, 2020 | period ended May 31, 2020 | period ended May 31, 2020 |
| North Square Multi Strategy Fund, | | | |
| and North Square Oak Ridge | | | |
| Dividend Growth Fund | | | |
| | | | |
| North Square Dynamic | For the year ended | For each of the two years in the | For each of the four years in the |
| Small Cap Fund | May 31, 2020 | period ended May 31, 2020 | period ended May 31, 2020 and |
| | | | the period September 30, 2015 |
| | | | (commencement of operations) |
| | | | through May 31, 2016 |
| | | | |
| North Square Oak Ridge | For the year ended | For each of the two years in the | For each of the three years in the |
| Disciplined Growth Fund | May 31, 2020 | period ended May 31, 2020 | period ended May 31, 2020 and |
| | | | the period July 29, 2016 |
| | | | (commencement of operations) |
| | | | through May 31, 2017 |
Basis for Opinion
These financial statements are the responsibility of the Funds’ management. Our responsibility is to express an opinion on the Funds’ financial statements based on our audits. We are a public accounting firm registered with the Public Company Accounting Oversight Board (United States) (“PCAOB”) and are required to be independent with respect to the Funds in accordance with the U.S. federal securities laws and the applicable rules and regulations of the Securities and Exchange Commission and the PCAOB. We have served as the auditor of one or more of the funds in the Trust since 2013.
We conducted our audits in accordance with the standards of the PCAOB. Those standards require that we plan and perform the audits to obtain reasonable assurance about whether the financial statements are free of material misstatement, whether due to error or fraud. The Funds are not required to have, nor were we engaged to perform, an audit of the Funds’ internal control over financial reporting. As part of our audits we are required to obtain an understanding of internal control over financial reporting, but not for the purpose of expressing an opinion on the effectiveness of the Funds’ internal control over financial reporting. Accordingly, we express no such opinion.
Our audits included performing procedures to assess the risks of material misstatement of the financial statements, whether due to error or fraud, and performing procedures that respond to those risks. Such procedures included examining, on a test basis, evidence regarding the amounts and disclosures in the financial statements. Our audits also included evaluating the accounting principles used and significant estimates made by management, as well as evaluating the overall presentation of the financial statements. Our procedures included confirmation of securities owned as of May 31, 2020 by correspondence with the custodian and brokers or by other appropriate auditing procedures where replies from broker were not received. We believe that our audits provide a reasonable basis for our opinion.
TAIT, WELLER & BAKER LLP
Philadelphia, Pennsylvania
July 30, 2020
North Square Funds
SUPPLEMENTAL INFORMATION (Unaudited)
Corporate Dividends Received Deduction
For corporate shareholders, the percent of ordinary income distributions qualifying for the corporate dividends received deduction for the fiscal year ended May 31, 2020 was as follows:
| Small Cap Growth Fund | 0.00% | | Multi Strategy Fund | 23.11% |
| Dynamic Small Cap Fund | 100.00% | | Dividend Growth Fund | 99.08% |
| Disciplined Growth Fund | 100.00% | | | |
Qualified Dividend Income
For the fiscal year ended May 31, 2020, certain dividends paid by the Funds may be subject to a maximum tax rate of 23.8%, as provided for by the Jobs and Growth Tax Relief Reconciliation Act of 2003. The percentage of dividends declared from ordinary income designated as qualified dividend income was as follows:
| Small Cap Growth Fund | 0.00% | | Multi Strategy Fund | 27.86% |
| Dynamic Small Cap Fund | 100.00% | | Dividend Growth Fund | 99.89% |
| Disciplined Growth Fund | 100.00% | | | |
Long-Term Capital Gain Designation
For the fiscal year ended May 31, 2020, the Funds designate a portion of distributions as 20.00% rate gain distributions for the purposed of the dividends paid deduction. The dollar amount be fund was as follows:
| Small Cap Growth Fund | $27,681,910 | | Multi Strategy Fund | $ — |
| Dynamic Small Cap Fund | $ — | | Dividend Growth Fund | $ — |
| Disciplined Growth Fund | $ — | | | |
Trustees and Officers Information
Additional information about the Trustees is included in each Fund’s Statement of Additional Information which is available, without charge, upon request by calling (855) 551-5521 or on the Funds’ website at www.northsquareinvest.com. The Trustees and officers of each Fund and their principal occupations during the past five years are as follows:
| | | | | Number of | |
| | | | | Portfolios | |
| | | | | in Fund | Other Directorship/ |
Name, Addressa, | | | | Complex | Trusteeship |
| Year of Birth and | | Term of Office | | Overseen | Positions held by |
| Position(s) with | Position with | and Length of | Principal Occupations During | by | Trustee During |
| the Trust | the Trust | Time Servedb | the Past Five Years or Longer | Trusteec | the Past 5 Years |
| Independent Trustees | | | | | |
| David B. Boon | Trustee | 08/2018 to present | Chief Financial Officer and Managing | 7 | N/A |
| (1960) | | | Director, Eagle Capital Management, LLC | | |
| | | | (since 2018); Chief Financial Officer and | | |
| | | | Partner, Cedar Capital, LLC (2013 – 2018). | | |
North Square Funds
SUPPLEMENTAL INFORMATION (Unaudited) – Continued
| | | | | Number of | |
| | | | | Portfolios | |
| | | | | in Fund | Other Directorship/ |
Name, Addressa, | | | | Complex | Trusteeship |
| Year of Birth and | | Term of Office | | Overseen | Positions held by |
| Position(s) with | Position with | and Length of | Principal Occupations During | by | Trustee During |
| the Trust | the Trust | Time Servedb | the Past Five Years or Longer | Trusteec | the Past 5 Years |
| Donald J. Herrema | Chairman of the | 08/2018 to present | Vice Chair and Chief Investment Officer, | 7 | Chairman and Director |
| (1952) | Board and Trustee | | Independent Life Insurance Company | | Emeritus, TD Funds |
| | | | (since 2018); Financial Services Executive, | | USA (2009 – 2019) |
| | | | Advisor and Founder of BlackSterling | | Director, Abel Noser |
| | | | Partners, LLC (private investments and | | Holdings, LLC (since |
| | | | advisory firm) (since 2004); Executive Vice | | 2016); Member, USC |
| | | | Chairman and Senior Advisor at Kennedy | | Marshall Business School |
| | | | Wilson (real estate investment company) | | Board (since 2010); |
| | | | (2009 – 2016). | | President and Trustee, |
| | | | | | Christ Church |
| | | | | | (2008 – 2016); Director, |
| | | | | | Lepercq de Neuflize |
| | | | | | (2009 – 2016); Chairman |
| | | | | | and Trustee Emeritus |
| | | | | | (since 2014), FEG |
| | | | | | Investment Advisors |
| | | | | | (since 2017); Director, |
| | | | | | Independent Life |
| | | | | | Insurance Company |
| | | | | | (since 2018). |
| Catherine A. Zaharis | Trustee | 08/2018 to present | Professor of Practice (since 2019), Director, | 7 | Director, The |
| (1960) | | | Professional/Employer Development, | | Vantagepoint Funds |
| | | | Finance Department (2015 – 2019), Adjunct | | (2015 – 2016). |
| | | | Lecturer (2010 – 2019), and Business Director, | | |
| | | | MBA Finance Career Academy (2008 – 2015), | | |
| | | | University of Iowa, Tippie College of Business; | | |
| | | | Chair (2013 – 2016), Director (1999 – 2016), | | |
| | | | and Investment Committee Member (1999 – | | |
| | | | 2013) and Chair (2003 – 2013), | | |
| | | | University of Iowa Foundation. | | |
Interested Trusteesd | | | | | |
| Mark D. Goodwin | Trustee and | 08/2018 to present | Chief Executive Officer, North Square | 7 | N/A |
| (1964) | President | | Investments LLC (since July 2018); President | | |
| | | | and Chief Operating Officer (2015 – July 2018) | | |
| | | | and Executive Vice President (2014 – 2015), | | |
| | | | Oak Ridge Investments, LLC. | | |
North Square Funds
SUPPLEMENTAL INFORMATION (Unaudited) – Continued
| | | | | Number of | |
| | | | | Portfolios | |
| | | | | in Fund | Other Directorship/ |
Name, Addressa, | | | | Complex | Trusteeship |
| Year of Birth and | | Term of Office | | Overseen | Positions held by |
| Position(s) with | Position with | and Length of | Principal Occupations During | by | Trustee During |
| the Trust | the Trust | Time Servedb | the Past Five Years or Longer | Trusteec | the Past 5 Years |
| Officers of the Trust: | | | | | |
| Alan E. Molotsky | Treasurer | 08/2018 to present | Chief Financial Officer, Chief Compliance Officer, | N/A | N/A |
| (1964) | and | | General Counsel and Senior Managing Director, | | |
| | Secretary | | North Square Investments, LLC (since July 2018); | | |
| | | | Chief Financial Officer, Chief Compliance Officer, | | |
| | | | General Counsel and Executive Vice President, | | |
| | | | Oak Ridge Investments LLC (2004 – July 2018). | | |
| David J. Gaspar | Vice | 08/2018 to present | Chief Operations and Information Officer and | N/A | N/A |
| (1964) | President | | Senior Managing Director, North Square | | |
| | | | Investments, LLC (since July 2018); Chief | | |
| | | | Operations Officer, Chief Information Officer, | | |
| | | | Chief Information Security Officer and Executive | | |
| | | | Vice President, Oak Ridge Investments, LLC | | |
| | | | (2000 – July 2018). | | |
| Douglas N. Tyre | Chief | 09/2018 to present | Assistant Compliance Director, Cipperman | N/A | N/A |
| (1964) | Compliance | | Compliance Services, LLC (since 2014). | | |
| | Officer | | | | |
| a. | The business address of each Trustee and officer is c/o North Square Investments, LLC, 10 South LaSalle Street, Suite 1925, Chicago, Illinois 60603. |
| b. | Trustees and officers serve until their successors are duly elected and qualified. |
| c. | The term “Fund Complex” applies to the seven portfolios that currently comprise the Trust, which consists of the five Funds, the North Square Advisory Research All Cap Value Fund, and the North Square Strategic Income Fund. |
| d. | Mr. Goodwin is considered to be an “interested person” of the Trust as that term is defined in the 1940 Act by virtue of his positions with the Adviser. |
North Square Funds
EXPENSE EXAMPLES
For the Six Months Ended May 31, 2020 (Unaudited)
Expense Examples
As a shareholder of the Funds, you incur two types of costs: (1) transaction costs, including sales charges (loads) on purchase payments (Class A only); and redemption fees; and (2) ongoing costs, including management fees; distribution and/or service (12b-1) fees (Class A and C only); and other Fund expenses. The examples below are intended to help you understand your ongoing costs (in dollars) of investing in the Funds and to compare these costs with the ongoing costs of investing in other mutual funds.
These examples are based on an investment of $1,000 invested at the beginning of the period and held for the entire six month period from December 1, 2019 to May 31, 2020.
Actual Expenses
The information in the row titled “Actual Performance” of the table below provides actual account values and actual expenses. You may use the information in these columns, together with the amount you invested, to estimate the expenses that you paid over the period. Simply divide your account value by $1,000 (for example, an $8,600 account value divided by $1,000 = 8.6), then multiply the result by the number in the appropriate row for your share class, in the column titled “Expenses Paid During Period” to estimate the expenses you paid on your account during this period.
Hypothetical Example for Comparison Purposes
The information in the row titled “Hypothetical (5% annual return before expenses)” of the table below provides hypothetical account values and hypothetical expenses based on each Fund’s actual expense ratios and an assumed rate of return of 5% per year before expenses, which is not the Fund’s actual return. The hypothetical account values and expenses may not be used to estimate the actual ending account balance or expenses you paid for the period. You may use this information to compare the ongoing costs of investing in the Fund and other funds. To do so, compare these 5% hypothetical examples with the 5% hypothetical examples that appear in the shareholder reports of the other funds.
Please note that the expenses shown in the table are meant to highlight your ongoing costs only and do not reflect any transaction costs, such as sales charges (loads) or redemption fees. Therefore, the information in the row titled “Hypothetical (5% annual return before expenses)” is useful in comparing ongoing costs only, and will not help you determine the relative total costs of owning different funds. In addition, if these transactional costs were included, your costs would have been higher.
| | | Beginning | Ending | Expense Paid |
| | | Account | Account | During |
| | | Value | Value | Period* |
| Small Cap Growth Fund | 12/1/19 | 5/31/20 | 12/1/19 – 5/31/20 |
| Class A | Actual Performance | $1,000.00 | $ 943.30 | $ 6.75 |
| | Hypothetical (5% annual return before expenses) | $1,000.00 | $1,018.05 | $ 7.01 |
| Class C | Actual Performance | $1,000.00 | $ 939.70 | $10.38 |
| | Hypothetical (5% annual return before expenses) | $1,000.00 | $1,014.30 | $10.78 |
| Class I | Actual Performance | $1,000.00 | $ 944.50 | $ 5.54 |
| | Hypothetical (5% annual return before expenses) | $1,000.00 | $1,019.30 | $ 5.76 |
| Class K | Actual Performance | $1,000.00 | $ 945.10 | $ 4.81 |
| | Hypothetical (5% annual return before expenses) | $1,000.00 | $1,020.05 | $ 5.00 |
| * | Expenses are equal to the Fund’s annualized expense ratios of 1.39%, 2.14%, 1.14% and 0.99% for Class A, Class C, Class I and Class K, respectively, multiplied by the average account values over the period, multiplied by 183/366 (to reflect the six month period). The expense ratios reflect an expense waiver. Assumes all dividends and distributions were reinvested. |
| | | Beginning | Ending | Expense Paid |
| | | Account | Account | During |
| | | Value | Value | Period* |
| Dynamic Small Cap Fund | 12/1/19 | 5/31/20 | 12/1/19 – 5/31/20 |
| Class I | Actual Performance | $1,000.00 | $ 873.80 | $ 5.39 |
| | Hypothetical (5% annual return before expenses) | $1,000.00 | $1,019.25 | $ 5.81 |
| * | Expenses are equal to the Fund’s annualized expense ratios of 1.15%, multiplied by the average account values over the period, multiplied by 183/366 (to reflect the six month period). The expense ratio reflects an expense waiver. Assumes all dividends and distributions were reinvested. |
North Square Funds
EXPENSE EXAMPLES – Continued
For the Six Months Ended May 31, 2020 (Unaudited)
| | | Beginning | Ending | Expense Paid |
| | | Account | Account | During |
| | | Value | Value | Period* |
| Disciplined Growth Fund | 12/1/19 | 5/31/20 | 12/1/19 – 5/31/20 |
| Class I | Actual Performance | $1,000.00 | $1,078.00 | $ 4.94 |
| Hypothetical (5% annual return before expenses) | | | $ 4.80 |
| * | Expenses are equal to the Fund’s annualized expense ratio of 0.95%, multiplied by the average account values over the period, multiplied by 183/366 (to reflect the six month period). The expense ratio reflects an expense waiver. Assumes all dividends and distributions were reinvested. |
| | | Beginning | Ending | Expense Paid |
| | | Account | Account | During |
| | | Value | Value | Period* |
| Multi Strategy Fund | 12/1/19 | 5/31/20 | 12/1/19 – 5/31/20 |
| Class A | Actual Performance | $1,000.00 | $ 954.30 | $ 5.86 |
| | Hypothetical (5% annual return before expenses) | $1,000.00 | $1,019.00 | $ 6.06 |
| Class C | Actual Performance | $1,000.00 | $ 949.90 | $10.24 |
| | Hypothetical (5% annual return before expenses) | $1,000.00 | $1,014.50 | $10.58 |
| Class I | Actual Performance | $1,000.00 | $ 959.00 | $ 1.93 |
| | Hypothetical (5% annual return before expenses) | $1,000.00 | $1,023.03 | $ 1.99 |
| * | Expenses are equal to the Fund’s annualized expense ratios of 1.20%, 2.10% and 0.39% for Class A, Class C and Class I, respectively, multiplied by the average account values over the period, multiplied by 183/366 (to reflect the six month period). The expense ratios reflect a recovery of previously waived fees. Assumes all dividends and distributions were reinvested. |
| | | Beginning | Ending | Expense Paid |
| | | Account | Account | During |
| | | Value | Value | Period* |
| Dividend Growth Fund | 12/1/19 | 5/31/20 | 12/1/19 – 5/31/20 |
| Class I | Actual Performance | $1,000.00 | $ 955.00 | $ 4.89 |
| | Hypothetical (5% annual return before expenses) | $1,000.00 | $1,020.00 | $ 5.05 |
| * | Expenses are equal to the Fund’s annualized expense ratios of 1.00%, multiplied by the average account values over the period, multiplied by 183/366 (to reflect the six month period). The expense ratio reflects an expense waiver. Assumes all dividends and distributions were reinvested. |
North Square Funds
Advisor
North Square Investments, LLC
10 South LaSalle Street, Suite 1925
Chicago, Illinois 60603
| Sub-Advisor | Sub-Advisor |
| Algert Global LLC | Oak Ridge Investments, LLC |
| 101 California Street, Suite 4225 | 10 South La Salle Street, Suite 1925 |
| San Francisco, California 94111 | Chicago, Illinois 60603 |
Independent Registered Public Accounting Firm
Tait, Weller & Baker LLP
50 South 16th Street, Suite 2900
Philadelphia, Pennsylvania 19102
Custodian
U.S. Bank, N.A.
1555 N. RiverCenter Drive, Suite 300
Milwaukee, Wisconsin 53212
Fund Administrator, Transfer Agent and Fund Accountant
U.S. Bank Global Fund Services
615 East Michigan Street
Milwaukee, Wisconsin 53202
Distributor
Compass Distributors LLC
Three Canal Plaza, Suite 100
Portland, Maine 04101
www.foreside.com
FUND INFORMATION
| Fund Name | | Ticker | CUSIP |
| North Square Oak Ridge Small Cap Growth Fund | Class A | ORIGX | 66263L 304 |
| North Square Oak Ridge Small Cap Growth Fund | Class C | ORICX | 66263L 874 |
| North Square Oak Ridge Small Cap Growth Fund | Class K | ORIKX | 66263L 866 |
| North Square Oak Ridge Small Cap Growth Fund | Class I | ORIYX | 66263L 858 |
| North Square Dynamic Small Cap Fund | Class I | ORSIX | 66263L 825 |
| North Square Oak Ridge Disciplined Growth Fund | Class I | ODGIX | 66263L 601 |
| North Square Multi Strategy Fund | Class A | ORILX | 66263L 700 |
| North Square Multi Strategy Fund | Class C | ORLCX | 66263L 841 |
| North Square Multi Strategy Fund | Class I | PORYX | 66263L 833 |
| North Square Oak Ridge Dividend Growth Fund | Class I | ORDNX | 66263L 882 |
Privacy Principles of the North Square Funds for Shareholders
The Funds are committed to maintaining the privacy of their shareholders and to safeguarding their non-public personal information. The following information is provided to help you understand what personal information the Funds collect, how we protect that information and why, in certain cases, we may share information with select other parties.
Generally, the Funds do not receive any non-public personal information relating to their shareholders, although certain non-public personal information of their shareholders may become available to the Funds. The Funds do not disclose any non-public personal information about their shareholders or former shareholders to anyone, except as permitted by law or as is necessary in order to service shareholder accounts (for example, to a transfer agent or third party administrator).
This report is sent to shareholders of the North Square Funds for their information. It is not a Prospectus, circular or representation intended for use in the purchase or sale of shares of the Funds or of any securities mentioned in this report.
Proxy Voting Policies and Procedures
A description of the Funds’ proxy voting policies and procedures related to portfolio securities is available without charge, upon request, by calling the Funds at (855) 551-5521 or on the U.S. Securities and Exchange Commission’s (“SEC”) website at www.sec.gov.
Proxy Voting Record
Information regarding how the Funds voted proxies for portfolio securities, if applicable, during the most recent 12-month period ended June 30, is also available, without charge and upon request by calling (855) 551-5521 or by accessing the Funds’ Form N-PX on the SEC’s website at www.sec.gov.
Portfolio Holdings Disclosure
The Funds file a complete schedule of portfolio holdings with the U.S. Securities and Exchange Commission (the “SEC”) for the first and third quarters of each fiscal year on Form N-Q or Part F of Form N-PORT (beginning with filings after March 31, 2020). The Funds’ Forms N-Q or Part F of Form N-PORT are available on the SEC’s website at www.sec.gov and may be reviewed and copied at the SEC’s Public Reference Room in Washington, D.C. Information on the operation of the Public Reference Room may be obtained by calling (800) 732-0330. The Funds’ Forms N-Q or Part F of Form NPORT may also be obtained by calling toll-free (855) 551-5521.
Householding
The Funds will mail only one copy of shareholder documents, including prospectuses, annual and semi-annual reports and proxy statements, to shareholders with multiple accounts at the same address. This practice is commonly called “householding” and is intended to reduce expenses and eliminate duplicate mailings of shareholder documents. Mailings of your shareholder documents may be householded indefinitely unless you instruct us otherwise. If you do not want the mailing of these documents to be combined with those for other members of your household, please call the Funds at (855) 551-5521.
North Square Funds
c/o U.S. Bancorp Fund Services, LLC
P.O. Box 701
Milwaukee, Wisconsin 53201
1-855-551-5521
Item 2. Code of Ethics.
The Registrant has adopted a code of ethics that applies to the Registrant’s principal executive officer and principal financial officer. The Registrant has not made any substantive amendments to its code of ethics during the period covered by this report. The Registrant has not granted any waivers from any provisions of the code of ethics during the period covered by this report.
A copy of the Registrant’s Code of Ethics is filed herewith.
Item 3. Audit Committee Financial Expert.
The Registrant’s board of Trustees has determined that there is at least one audit committee financial expert serving on its audit committee. David B. Boon is the “audit committee financial expert” and is considered to be “independent” as each term is defined in Item 3 of Form N‑CSR.
Item 4. Principal Accountant Fees and Services.
The Registrant has engaged its principal accountant to perform audit services, audit-related services, tax services and other services during the past two fiscal years. “Audit services” refer to performing an audit of the Registrant's annual financial statements or services that are normally provided by the accountant in connection with statutory and regulatory filings or engagements for those fiscal years. “Audit-related services” refer to the assurance and related services by the principal accountant that are reasonably related to the performance of the audit. “Tax services” refer to professional services rendered by the principal accountant for tax compliance, tax advice, and tax planning. The following table details the aggregate fees billed or expected to be billed for each of the last two fiscal years for audit fees, audit-related fees, tax fees and other fees by the principal accountant.
| | FYE 5/31/2020 | FYE 5/31/2019 |
| Audit Fees | $102,200 | $100,100 |
| Audit-Related Fees | $0 | $0 |
| Tax Fees | $14,000 | $16,800 |
| All Other Fees | $0 | $0 |
The Audit Committee has adopted pre-approval policies and procedures that require the Audit Committee to pre‑approve all audit and non‑audit services of the Registrant, including services provided to any entity affiliated with the Registrant.
The percentage of fees billed by Tait, Weller & Baker LLP applicable to non-audit services pursuant to waiver of pre-approval requirement were as follows:
| | FYE 5/31/2020 | FYE 5/31/2019 |
Audit-Related Fees | 0% | 0% |
Tax Fees | 0% | 0% |
All Other Fees | 0% | 0% |
All of the principal accountant’s hours spent on auditing the Registrant’s financial statements were attributed to work performed by full‑time permanent employees of the principal accountant. There were no non-audit fees billed or expected to be billed by the Registrant’s accountant for services to the Registrant and to the Registrant’s investment adviser (and any other controlling entity, etc. –not sub-adviser) for the last two years.
Item 5. Audit Committee of Listed Registrants.
Not applicable to registrants who are not listed issuers (as defined in Rule 10A-3 under the Securities Exchange Act of 1934).
Item 6. Investments.
(a) | Schedule of Investments is included as part of the report to shareholders filed under Item 1 of this Form. |
Item 7. Disclosure of Proxy Voting Policies and Procedures for Closed-End Management Investment Companies.
Not applicable to open-end investment companies.
Item 8. Portfolio Managers of Closed-End Management Investment Companies.
Not applicable to open-end investment companies.
Item 9. Purchases of Equity Securities by Closed‑End Management Investment Company and Affiliated Purchasers.
Not applicable to open-end investment companies.
Item 10. Submission of Matters to a Vote of Security Holders.
There have been no material changes to the procedures by which shareholders may recommend nominees to the Registrant’s Board of Trustees.
Item 11. Controls and Procedures.
(a) | The Registrant’s President and Treasurer have reviewed the Registrant's disclosure controls and procedures (as defined in Rule 30a-3(c) under the Investment Company Act of 1940 (the “Act”)) as of a date within 90 days of the filing of this report, as required by Rule 30a-3(b) under the Act and Rules 13a-15(b) or 15d‑15(b) under the Securities Exchange Act of 1934. Based on their review, such officers have concluded that the disclosure controls and procedures are effective in ensuring that information required to be disclosed in this report is appropriately recorded, processed, summarized and reported and made known to them by others within the Registrant and by the Registrant’s service provider. |
(b) | There were no changes in the Registrant's internal control over financial reporting (as defined in Rule 30a-3(d) under the Act) that occurred during the most recent fiscal quarter of the period covered by this report that have materially affected, or are reasonably likely to materially affect, the Registrant's internal control over financial reporting. |
Item 12. Disclosure of Securities Lending Activities for Closed-End Management Investment Companies
Not applicable to open-end investment companies.
Item 13. Exhibits.
(3) Not applicable to open-end investment companies.
(4) There was no change in the Registrant’s independent public accountant for the period covered by this report.
SIGNATURES
Pursuant to the requirements of the Securities Exchange Act of 1934 and the Investment Company Act of 1940, the Registrant has duly caused this report to be signed on its behalf by the undersigned, thereunto duly authorized.
North Square Investments Trust
By: /s/ Mark Goodwin
Mark D. Goodwin,
President
Date: 8/5/2020
Pursuant to the requirements of the Securities Exchange Act of 1934 and the Investment Company Act of 1940, this report has been signed below by the following persons on behalf of the Registrant and in the capacities and on the dates indicated.
By: /s/ Mark Goodwin
Mark D. Goodwin,
President
Date 8/5/2020
By: /s/ Alan Molotsky
Alan E. Molotsky,
Treasurer
Date 8/5/2020