ANNUAL REPORT
NORTH SQUARE OAK RIDGE SMALL CAP GROWTH FUND
NORTH SQUARE DYNAMIC SMALL CAP FUND
NORTH SQUARE OAK RIDGE ALL CAP GROWTH FUND
NORTH SQUARE MULTI STRATEGY FUND
NORTH SQUARE OAK RIDGE DIVIDEND GROWTH FUND
MAY 31, 2021
Beginning on January 1, 2021, as permitted by regulations adopted by the U.S. Securities and Exchange Commission, paper copies of the Funds’ shareholder reports will no longer be sent by mail, unless you specifically request paper copies of the reports from the Fund or from your financial intermediary, such as a broker-dealer or bank. Instead, the reports will be made available on the Funds’ website, www.northsquareinvest.com, and you will be notified by mail each time a report is posted and provided with a website link to access the report.
If you already elected to receive shareholder reports electronically, you will not be affected by this change and you need not take any action. You may elect to receive shareholder reports and other communications from the Funds electronically by contacting your financial intermediary, such as a broker-dealer or bank, or, if you are a direct investor, by calling the Funds toll-free at 1-855-551-5521.
You may elect to receive all future reports in paper free of charge. If you invest through a financial intermediary, you can contact your financial intermediary to request that you continue to receive paper copies of your shareholder reports. If you invest directly with the Funds, you can call the Funds toll-free at 1-855-551-5521 to let the Funds know you wish to continue receiving paper copies of your shareholder reports. Your election to receive reports in paper will apply to all Funds held in your account if you invest through your financial intermediary.
 | North Square Investments | www.northsquareinvest.com |
North Square Funds
Table of Contents
| Shareholder Letters | 1 |
| Fund Performance | 11 |
| Schedules of Investments | 18 |
| Statements of Assets and Liabilities | 42 |
| Statements of Operations | 46 |
| Statements of Changes in Net Assets | 48 |
| Financial Highlights | 53 |
| Notes to Financial Statements | 60 |
| Report of Independent Registered Public Accounting Firm | 71 |
| Supplemental Information | 72 |
| Expense Examples | 75 |
This report and the financial statements contained herein are provided for the general information of the shareholders of the North Square Funds. This report is not authorized for distribution to prospective investors in the Funds unless preceded or accompanied by an effective prospectus.
www.northsquareinvest.com
| Discussion of Fund Performance |  |
A letter from David Klaskin, Chief Executive Officer and Chief Investment Officer of Oak Ridge Investments and lead portfolio manager of the North Square Oak Ridge Small Cap Growth Fund.
Fellow Shareholders,
All U.S. stock indices have had a strong ascent over the past year, and more recently, vaccine adoption has unlocked significant pent-up demand and expanded growth expectations. There is debate over the need for ongoing broad economic aid and its impact on available labor and the inflation uptick, but we are clearly in the midst of a very strong recovery, with forecasts for GDP growth in excess of 6% for 2021. This would likely be even higher if there were not inventory and supply issues for a number of key inputs, such as semiconductor components and certain commodities. The consumer is very healthy, with near record levels of savings and low debt, fueled by confidence from a booming stock market and escalating home prices. Spending should remain strong and eventually shift toward leisure travel and other discretionary activities. There is a consensus belief that 2022 will see U.S. GDP growth remain in excess of 4%, with a stronger catch-up throughout global markets, particularly those with good access to effective vaccines.
Expansion has been meager for twenty years, as 2000 was the last time the economy grew at the once average rate of 4%, until the COVID relief spike of this year. Demographic shifts, high debt, political uncertainties and the influx of technology driven efficiencies have created a sluggish economic backdrop and more than a generation of muted inflation. It has been three decades since the CPI advanced at a rate of 4%. The common belief is that the current spike in inflationary indicators will be transitory. This is far from certain. Job openings now exceed pre-Pandemic levels, yet employment subsidies will continue into the fall. Wage pressures will remain, given popular legislative movements and a workforce relatively untrained for many of the job openings. Heightened regulations encourage fair labor practices, promote competitive markets and support the environment, but they are also inflationary as they pressure supply channels and make products more expensive to produce. Striking a balance is key, but perhaps less realistic in these polarizing political times.
Housing has exploded to the upside, benefitting from extremely low interest rates, available credit, increased wealth and the need for more space as most of the country has been relegated to their homes. People have fled the big cities, which lost their appeal during the shutdown and have experienced increased violence. The most favorable tax states have seen a surge in relocations of businesses and wealthy individuals, which is not likely to abate and is expected to result in widening budget deficits in already troubled states. The Federal government is likely to take on more of the expenses of beleaguered states, which will be another contributing factor to the burgeoning national debt. This is less a partisan issue over the next couple of years, as the country regains its footing, but it will continue to pressure the U.S. dollar and, at some point down the road, stress our standard of living.
Accelerated economic growth encouraged the broadening of equity leadership in late 2020 and into the early part of 2021, as value stocks began to outperform growth and the early COVID beneficiaries. The longer-term strength of this trend, however, will be highly dependent on the trajectory of broad economic growth going forward. Aside from a limited area of excessive speculation, there are not material bubbles in the sense of unviable investment attractions garnering large inflows. There are, nevertheless, valuations above levels that have been historically sustainable, where we must model realistic, and in most cases, more subdued returns going forward. Whenever the proverbial music stops and the Fed becomes less accommodating, earnings growth will be at a premium and valuations will reflect individual companies’ ability to navigate effectively. Price/earnings ratios are also influenced by interest rates, as a lack of alternatives for competitive returns is a large contributing factor to the unprecedented returns since the 2008 financial crisis. While the Fed is in no hurry, they will be closely monitoring inflation to determine rate policy.
The North Square Oak Ridge Small Cap Growth Fund – Class I Shares returned 43.92% versus the Russell 2000 Growth return of 50.14% for the year ending May 31, 2021. The year began with investors heavily pivoted toward companies that were the most likely beneficiaries of unusual economic circumstances. In many ways, the emphasis on software and other services that did not require in-person contact accentuated the trends that had been driving the small cap growth marketplace over the prior few years. In the first two quarters of the market’s recovery, choice investments within Information Technology and Health Care Technology allowed the strategy to lead the index by 469 basis points. As we approached the end of 2020, however, market breadth expanded, with highly economically sensitive and the most deeply impacted companies beginning to outperform in anticipation of broad economic recovery. The small cap market began to outperform its larger capitalization brethren and those beneficiaries that benefitted in the first few months lagged. Given our low turnover and emphasis on earnings consistency and visibility, we by nature under-represent the most economically sensitive companies within our strategy. At the time, a robust recovery was not a given; furthermore, as we have progressed further into 2021 many of the long-tailed effects of the COVID crisis on the economy remain unclear. We continued to firmly hold positions that had clear opportunity to grow, rather than rely on a fickle market for recovery and turnaround stories.
Industrials and Consumer Discretionary were the primary detractors to relative performance for the year, where the shift mid-year away from the initial beneficiaries toward recovery stocks was most acute. Within Consumer Discretionary, Ollies’ Bargain Outlet (OLLI: -5.48%), one of America’s largest closeout retailers, did not keep pace with investors renewed interest in restaurants and other hard hit areas despite its continued success in growing their business, opening 20 new stores in the first 5 months of 2021. Within the Industrials sector, a combination of recovery in construction and other heavier industrial areas with speculation in green energy stocks drove the sector to outperform the broad index. High quality Mercury Systems Inc (MRCY: -26.75%) was a larger detractor as defense budgets contracted; however, growth going forward continues to look more visible and less contingent on economic growth or individual government programs. Our electrical component firm Vicor Corporation (VICR: 47.72%) is more functional in its application across various power systems and did not strike the same heightened interest as the pure-play alternative energy companies within the Electrical Equipment industry.
Continuity and the Importance of Active Management
The Fund has been managed by the same lead portfolio manager, employing the same discipline rooted in fundamentals with a valuation awareness, since the Fund’s inception. Our persistent focus on supportable valuations and quality has often not appeared as relevant, and has actually detracted from investment results, throughout this long bull market. This overlooked metric, however, is likely to be a key factor in determining success over the next several years.
Thank you for your continued confidence in Oak Ridge Investments.
Sincerely,
David Klaskin
CIO & Senior Portfolio Manager
The views in this letter are those of the Fund’s direct advisor and were as of May 31, 2021 and may not necessarily reflect the same views on the date this letter is first published or any date thereafter. These views are intended to help shareholders in understanding the fund’s investment methodology and do not constitute investment advice.
Investment in equity securities involves substantial risks and may be subject to wide and sudden fluctuations in market value. Investing in small and mid cap companies may be subject to more abrupt or erratic market movements and may have lower trading volumes or more erratic trading than securities of larger companies. Please see the prospectus for a more complete discussion of the fund’s risks.
The Russell 2000 Growth Index measures the performance of small cap U.S. growth stocks.
| Discussion of Fund Performance | |
A letter from Peter Algert, Chief Investment Officer of Algert Global LLC and portfolio manager of the North Square Dynamic Small Cap Fund.
Fellow Shareholders,
U.S. small-cap stocks experienced a significant rally over the 12-month period ending May 31, 2021, primarily driven by an ongoing economic recovery from the unprecedented public health and economic crises related to the COVID-19 pandemic. After falling precipitously in February-March 2020, the Russell 2000 Index rose significantly over the remainder of 2020 and thus far in 2021, ending the trailing 12-month period at +64.56%. The Fund however underperformed the index over this period, delivering an absolute return of +62.34% for Class I shares at NAV.
Stock Selection Designed to be the Primary Source of Benchmark Outperformance
During the trailing 12-month period, stock selection contributed negatively to Fund performance, however it was partially offset by positive contribution from incidental active exposures to various risk factors (e.g. a company’s industry, leverage, liquidity and beta characteristics). In addition to negative stock selection performance, the Fund also suffered from various unusual stock-specific events, such as the rise of meme stocks early in 2021.
Relative Value
The Relative Value model detracted from the Fund’s performance during the measurement period. Value-related positioning underperformed as investors have favored stocks with stronger growth characteristics and price levels which have made them unattractive on most valuation criteria. Value-related stocks subsequently rebounded in Q4 2020 – Q1 2021 amid favorable COVID-19 vaccination developments and falling infection rates. The Strategy continues to view value-oriented exposures less favorably relative to other opportunities.
Quality
The Quality model was the primary positive contributor to the performance of the Fund. With an uncertain economic backdrop, investors appeared to favor companies with more robust and sustainable business models relative to peers. The performance of our Quality insights was strong across various types of insights, particularly those constructed with natural language processing (NLP) techniques.
Catalyst
The Catalyst model was a modestly negative contributor to the Fund’s performance. The Catalyst theme, which assesses sentiment and activities by other market participants, was volatile at times during the measurement period but ultimately ended nearly flat relative to the benchmark as insights favoring various growth characteristics continued to be favored by investors amid the evolving and uneven economic recovery.
Risk Factors
Incidental active exposures to industries and risk factors such as leverage, volatility and liquidity contributed to gains over the measurement period. In particular, the Fund’s exposure to cyclically-exposures, high beta stocks helped as these stocks meaningfully outperformed over the trailing 12-months. While these exposures benefitted during the measurement period, we expect these exposures will have minimal impact on the Fund’s active performance over a full market cycle.
Fund Positioning for the Future
The Fund aims to be diversified across its three main investment themes, Relative Value, Quality and Catalyst. Given the uncertain economic backdrop relating to the COVID-19 pandemic, we expect our Quality-driven positioning will be beneficial for the portfolio and should be the dominant theme going forward in the near term. We continue to favor Catalyst-driven positions relative to Value driven, in part, by the expectation of ongoing access to cheap financing for growth-oriented firms.
Sincerely,
Peter Algert,
Chief Investment Officer
The views in this letter were as of May 31, 2021 and may not necessarily reflect the same views on the date this letter is first published or any time thereafter. These views are intended to help shareholders in understanding the fund’s investment methodology and do not constitute investment advice.
Investment in equity securities involves substantial risks and may be subject to wide and sudden fluctuations in market value. Investing in small cap companies may be subject to more abrupt or erratic market movements and may have lower trading volumes or more erratic trading than securities of larger companies. International investments are subject to unique risks including currency fluctuations, social, economic and political uncertainties, which could increase volatility. In addition, changes in exchange rates and interest rates may adversely affect the value of the fund’s foreign investments. Please see the prospectus for a more complete discussion of the fund’s risks.
The Russell 2000 Index measures the performance of primarily small cap U.S. stocks.
| Discussion of Fund Performance | |
A letter from Robert G. McVicker, lead portfolio manager of the North Square Oak Ridge All Cap Growth Fund.
Fellow Shareholders,
US equity markets continued their rampant rise over the past year from the initial impact of COVID-19. As 2020 progressed, the near-term likelihood of effective vaccines encouraged the market forward in anticipation of a robust economic recovery. As adoption of novel vaccines has continued to spread over a more meaningful share of the population the economic recovery is beginning to take shape. It would be naïve to think that the broad shutdown of large segments of the economy would not cause issues as the economy began to reopen in earnest. Challenges in key inputs, such as semiconductor components and certain commodities, will disrupt the pace of the recovery in certain segments but a largely inoculated population gives consumers an opportunity to shift spending towards travel and other discretionary services. Despite the startlingly high unemployment numbers in 2020, the consumer in aggregate has remained relatively healthy, increasing savings and reducing high interest revolving debt. A decline in utilization of services was one of the leading contributors to the decline in GDP in 2020 and consumer strength will be critical to both the recuperation of the service sector and reintegration of the unemployed back into the workforce this fall.
During the early phases of the market rebound, investors pivoted toward companies that were the most likely beneficiaries of unusual economic circumstances. In many ways, the emphasis on software and other services that did not require in-person contact accentuated the trends that had been driving the growth indices over the prior few years. As we approached the end of 2020, however, market breadth expanded, with highly economically sensitive and the most deeply impacted companies beginning to outperform in anticipation of broad economic recovery. The small cap market began to outperform its larger capitalization brethren and those beneficiaries that benefitted in the first few months lagged. As we have progressed further into 2021, growth equities have begun to show strength against value as concerns over peak growth rates question the long-term trajectory for more procyclical companies. The specter of inflation has become a more debated risk factor as Consumer Price Index (CPI) results exceed levels not seen for decades. The Federal Reserve believes the current spike in inflationary indicators will be transitory and, at least for the moment, the market seems more focused on the long run growth prospects of the economy.
The North Square Oak Ridge All Cap Growth Fund – Class I Shares returned 35.93% compared to the Russell 3000 Growth Index which returned 40.51% for the year ending May 31, 2021. Generally, our discipline towards more consistent growth companies with healthy balance sheets has served us well. As growth at the expense of profitability has become an increasingly common theme amongst segments of the growth investment universe, our attention to quality has lagged at times. As we approached the end of 2020, however, market breadth expanded, with highly economically sensitive and the most deeply impacted companies beginning to outperform in anticipation of broad economic recovery. This erratic behavior has been a challenge for our style of investing. We are not completely averse to companies that are more sensitive to broad economic growth, however, we prefer to find returns in these companies incrementally as the greater consistency and visibility of our companies prove themselves over multiple periods. Our perennial style of investing has on a relative basis seemingly become consistently out of season as the appetite for risk shifts dramatically, leaving our quiet and consistent companies operating in the background of a market that seeks the flair of either a sharp economic rally or the most rampant growth prospects.
The Fund’s cash position was the primary detractor to relative performance for the year. A combination of an underweight position and our generally more conservative mix of holdings within the Consumer Discretionary and Industrial sectors were further detractors, only partially offset by stronger relative returns from our Information Technology and Health Care holdings. After such a dramatic year of performance, not owning Tesla (TSLA: 274%) was the leading cause of underperformance within Consumer Discretionary. Our exposure within Industrials is skewed towards more consistent service businesses. Companies such as Waste Connections (WCN: 5% sold from the portfolio), a waste management company, and Verisk Analytics (VRSK: 0.7%) did not participate in the strong rally that caused the benchmark sector to outperform the broad index. Within Information Technology, Five9 (FIVN: 70%) and Fortinet (FTNT: 57%) presented strong returns during a period where the software segment underperformed the index. The Health Care sector, in general, underperformed the Russell 3000 Growth. Within the portfolio UnitedHealth Group (UNH: 37%), a health care insurance company, Eli Lilly and Company (LLY: 33%), a pharmaceutical company, led to stronger sector returns in the portfolio relative to the benchmark sector. The sector has many of the attractive qualities we seek in the strategy, but we have maintained a mild underweight relative to the index due to the ongoing headline risks that have led to broad underperformance for several years.
The characteristics that we look for within our process has led to stronger returns in more sustained down-market periods in the past. Overall outperformance in the first quarter of 2020 during the disruption caused by the coronavirus demonstrates the value of the process we have continued to develop over the past 27 years. We are confident that an adherence to our discipline can potentially be rewarded as the US continues to navigate from the ongoing public health and economic crisis.
Thank you for your continued confidence in Oak Ridge Investments.
Sincerely,
Robert G. McVicker
Senior Portfolio Manager
The views in this letter are those of the Fund’s direct advisor and were as of May 31, 2021 and may not necessarily reflect the same views on the date this letter is first published or any date thereafter. These views are intended to help shareholders in understanding the fund’s investment methodology and do not constitute investment advice.
Investment in equity securities involves substantial risks and may be subject to wide and sudden fluctuations in market value. Investing in small and mid cap companies may be subject to more abrupt or erratic market movements and may have lower trading volumes or more erratic trading than securities of larger companies. Please see the prospectus for a more complete discussion of the fund’s risks.
The Russell 3000 Growth Index measures the performance of growth stocks across almost all market caps.
| Discussion of Fund Performance | |
A letter from David Klaskin, Chief Executive Officer and Chief Investment Officer of Oak Ridge Investments and lead portfolio manager of the North Square Multi Strategy Fund.
Fellow Shareholders:
US equity markets continued their rampant rise over the past year from the initial impact of COVID-19. The COVID-19 crisis indeed creates challenges across the economy, however the unprecedented support from the Federal Reserve effectively stymied what would likely have been a much more severe disruption to financial markets. In the initial phases, investors immediately pivoted to companies that were the most likely beneficiaries of unusual economic circumstances. As 2020 progressed, the near-term likelihood of effective vaccines encouraged the market forward in anticipation of a robust economic recovery and market breadth expanded, with highly economically sensitive and the most deeply impacted companies beginning to outperform. With adoption of novel vaccines continuing to spread over a more meaningful share of the population, the economic recovery is only beginning to take shape in the US. The recent increase in expanded leadership is encouraging, but the trajectory of broad economic growth going forward will determine the longer-term strength of this trend. The US is leading other global markets in the recovery, but the advent of new variants of the coronavirus adds uncertainty as governments handle the ongoing public health crisis and the broad reopening of their economies.
The specter of inflation has become a more debated risk factor as CPI results exceed levels not seen for decades. The 10-year yield rose from a low of 0.54% in early August of 2020 to 1.71% in April of 2021. The Federal Reserve believes the current spike in inflationary indicators will be transitory and has maintained cautious language about the potential for rate increases. In recent months, the 10-year has begun to slide lower despite the increasingly higher inflation figures. At least for the moment, the market seems more focused on the long run growth prospects of the economy and its subsequent impact on equity markets. There is growing concern that the second quarter of 2021 will be the peak for the US GDP growth rate. Expansion has been meager for twenty years, as 2000 was the last time the economy grew at the once average rate of 4%. Prior to the current crisis, a paucity of growth across the investment landscape encouraged more aggressive investment within select areas of the market that appear to offer rapid growth. This has left equity valuations in some segments above levels that have been historically sustainable, while the nascent recovery within the more cyclically oriented value companies is heavily path dependent. Furthermore, Treasury yields are relatively low and US corporate credit spreads have compressed significantly to below pre-pandemic levels. The investment landscape going forward could prove challenging and will likely require a more differentiated approach than in prior years.
The North Square Multi Fund – Class I Shares returned 40.07% versus the Russell 3000 return of 43.91% for the year ending May 31, 2021. Up until recently it had been a particularly difficult period to invest outside of traditional large cap strategies. Our allocation to the Dynamic Small Cap Fund had hurt relative returns despite exceptional alpha generation from the fund relative to its benchmark and favorable relative valuations to areas within larger capitalizations. As the market rotated towards value and small cap companies in late 2020, however, our patience with our position was rewarded as the fund returned 62.34% for the year ending May 31, 2021. Over the trailing 1 year, the Dynamic Small Cap Fund has been the largest contributor to returns as positions in the All Cap Growth Fund and Dividend Growth Fund have lagged the Russell 3000. We continue to maintain a strong position in the Dividend Growth Fund as the low-volatility nature of the strategy has proven effective in more tortuous market environments.
The Multi Strategy added three new funds into the strategy over the past year: the North Square Advisory Research All Cap Value Fund, the North Square Altrinsic International Equity Fund and the North Square McKee Bond Fund. The All Cap Value Fund sub-advised by Advisory Research was a timely addition to the Multi Strategy as years of underperformance of the value style relative to growth reversed in late 2020. We recently increased our allocation to the strategy after having reduced some of our excess growth exposure in March of 2021. Our initial weight within the Altrinsic International Equity Fund is modest, but the Fund provides a helpful means of diversifying our domestic equity exposure with an experienced manager should international markets continue to improve. CS McKee has a long history of managing core bond portfolios and the team is well seasoned in managing fixed income across a variety of rate environments. As the onset of 2021 has demonstrated, the comfort of consistently falling interest rates seen over the past few decades may be challenged. While the Multi Strategy competes within the 85%+ Equity category and thus has a limited allocation to fixed income, having an allocation to a strong core bond offering within the strategy is encouraging.
In general, we continue to believe this environment to be most conducive to flexible active managers with a focus on evaluating the relative merits of fundamentals rather than broad index exposures. The current holdings within the Multi Strategy provide a diverse cross section of investment strategies and we believe the Multi Strategy is well equipped to meet a variety of market environments; nevertheless, North Square and Oak Ridge continue to seek new managers and strategies to further enhance the portfolio’s allocation opportunities. We appreciate your continued confidence in North Square Investments.
Sincerely,
David Klaskin
CIO & Senior Portfolio Manager
The views in this letter are those of the Fund’s direct advisor and were as of May 31, 2021 and may not necessarily reflect the same views on the date this letter is first published or any date thereafter. These views are intended to help shareholders in understanding the fund’s investment methodology and do not constitute investment advice.
Investment in equity securities involves substantial risks and may be subject to wide and sudden fluctuations in market value. Investing in small and mid-cap companies may be subject to more abrupt or erratic market movements and may have lower trading volumes or more erratic trading than securities of larger companies. International investments are subject to unique risks including currency fluctuations, social, economic and political uncertainties, which could increase volatility. In addition, changes in exchange rates and interest rates may adversely affect the value of the fund’s foreign investments. Please see the prospectus for a more complete discussion of the fund’s risks.
The Russell 3000 Growth Index measures the performance of growth stocks across all market caps.
| Discussion of Fund Performance | |
A letter from David Klaskin, Chief Executive Officer and Chief Investment Officer of Oak Ridge Investments and lead portfolio manager of the North Square Oak Ridge Dividend Growth Fund.
Fellow Shareholders,
All U.S. stock indices have had a strong ascent over the past year, and more recently, vaccine adoption has unlocked significant pent-up demand and expanded growth expectations. There is debate over the need for ongoing broad economic aid and its impact on available labor and the inflation uptick, but we are clearly in the midst of a very strong recovery, with forecasts for GDP growth in excess of 6% for 2021. This would likely be even higher if there were not inventory and supply issues for a number of key inputs, such as semiconductor components and certain commodities. The consumer is very healthy, with near record levels of savings and low debt, fueled by confidence from a booming stock market and escalating home prices. Spending should remain strong and eventually shift toward leisure travel and other discretionary activities. There is a consensus belief that 2022 will see U.S. GDP growth remain in excess of 4%, with a stronger catch-up throughout global markets, particularly those with good access to effective vaccines.
Expansion has been meager for twenty years, as 2000 was the last time the economy grew at the once average rate of 4%, until the COVID relief spike of this year. Demographic shifts, high debt, political uncertainties and the influx of technology driven efficiencies have created a sluggish economic backdrop and more than a generation of muted inflation. It has been three decades since the CPI advanced at a rate of 4%. The common belief is that the current spike in inflationary indicators will be transitory. This is far from certain. Job openings now exceed pre-Pandemic levels, yet employment subsidies will continue into the fall. Wage pressures will remain, given popular legislative movements and a workforce relatively untrained for many of the job openings. Heightened regulations encourage fair labor practices, promote competitive markets and support the environment, but they are also inflationary as they pressure supply channels and make products more expensive to produce. Striking a balance is key, but perhaps less realistic in these polarizing political times.
Accelerated economic growth encouraged the broadening of equity leadership in late 2020 and into the early part of 2021, as value stocks began to outperform growth and the early COVID beneficiaries. The longer-term strength of this trend, however, will be highly dependent on the trajectory of broad economic growth going forward. Aside from a limited area of excessive speculation, there are not material bubbles in the sense of unviable investment attractions garnering large inflows. There are, nevertheless, valuations above levels that have been sustainable, and in most cases, more subdued returns going forward. Whenever the proverbial music stops and the Fed becomes less accommodating, earnings growth will be at a premium and valuations will reflect individual companies’ ability to navigate effectively. Price/earnings ratios* are also influenced by interest rates, as a lack of alternatives for competitive returns is a large contributing factor to the unprecedented returns since the 2008 financial crisis. While the Fed is in no hurry, they will be closely monitoring inflation to determine rate policy.
The North Square Oak Ridge Dividend Growth Fund – Class I Shares returned 37.06% versus the S&P 500 return of 40.32% for the year ending May 31, 2021. The process focuses on companies that are able to consistently grow their dividend over time while maintaining a reasonable payout ratio. This approach can lead to stable-to-growing cash flow businesses that have historically performed well in difficult market environments. The COVID crisis disrupted businesses in different ways than a typical recessionary period. The traditional model of seeking stable cash flow businesses did not operate in the same way as some businesses fared better than others atypically during restrictions. The swift intervention from the Federal Reserve, while necessary to stabilize markets, further disavowed the merits of consistent dividend paying businesses. The S&P 500 index itself has been supported since the March 23rd lows, albeit by the two divergent groups of companies. In the leading quarters of the market recovery, previously leading technology-based companies printed impressive gains relative to the market, given their models were not only less impacted but were often enhanced by a homebound populace. As recovery prospects improved in late 2020, the market shifted towards the most damaged companies with the value-oriented segment supporting the index as growth stocks began to wane. More recently, investors have begun to scrutinize the risks of higher valuations within Growth stocks as well as the concerns for the speed of the recovery for Value stocks. This has favored the more stable dividend stocks that we hold within the portfolio relative to the broad market.
The portfolio’s cash position, an overweight in Real Estate and stock selection within Communication Services were the Fund’s primary detractors to relative returns. Verizon Wireless was sold from the portfolio after declining 1% during our holding period amidst a year of robust market returns. The Communication Services sector was largely driven by Facebook (FB: 46.04%) and Alphabet Inc. (GOOG: 64%; GOOGL: 69%), which are non-dividend paying companies and are thereby not something we would hold in the portfolio. Consumer Discretionary was a positive contributor to relative returns. Our combination of holdings was able to outperform the broad market despite not holding companies such as Amazon.com (AMZN: 32%). The Health Care sector, in general,
underperformed the S&P 500. Within the portfolio UnitedHealth Group (UNH: 37%), a health care insurance company, Eli Lilly and Company (LLY: 33%), a pharmaceutical company, led to stronger sector returns in the portfolio relative to the benchmark sector. The sector has many of the attractive qualities we seek in the strategy, but we have maintained a neutral weight relative to the index due to the ongoing headline risks that have led to broad underperformance for several years.
Without a sustained drawdown in the market, the attractiveness of dividend payors over the long run is less apparent. For long stretches, yield as a factor has become less important, such as during the rising rate environment and during the periods when the more dynamic growth companies led US equity markets. We are encouraged by how well our quality driven approach has competed against a broad based index. As longer horizons have shown, the virtue of the lower volatility component of the market is that gains are more likely retained when the market does experience duress. We are confident our disciplined approach and portfolio of strong cash flow generating companies remains an attractive option for investors as the US continues to navigate from the ongoing public health and economic crisis.
Thank you for your continued confidence in Oak Ridge Investments.
Sincerely,
David Klaskin
CIO & Senior Portfolio Manager
| * | The price-to-earnings ratio (P/E ratio) is the ratio for valuing a company that measures its current share price relative to its per-share earnings (EPS) |
The views in this letter are those of the Fund’s direct advisor and were as of May 31, 2021 and may not necessarily reflect the same views on the date this letter is first published or any date thereafter. These views are intended to help shareholders in understanding the fund’s investment methodology and do not constitute investment advice.
Investment in equity securities involves substantial risks and may be subject to wide and sudden fluctuations in market value. Investing in small and mid-cap companies may be subject to more abrupt or erratic market movements and may have lower trading volumes or more erratic trading than securities of larger companies. Please see the prospectus for a more complete discussion of the fund’s risks.
The S&P 500 Index measures the performance of the largest 500 U.S. stocks.
North Square Oak Ridge Small Cap Growth Fund
FUND PERFORMANCE at May 31, 2021 (Unaudited)
Performance of a $1,000,000 Investment
This graph compares a hypothetical $1,000,000 investment in the Fund’s Class I shares (the Class with the largest net assets), made on May 31, 2011, with a similar investment in the Russell 2000 Growth Index and the Russell 2000 Index. The performance graph above is shown for the Fund’s Class I shares; Class A shares performance may vary. Results include the reinvestment of all dividends and capital gains.
The Russell 2000 Growth Index measures the performance of U.S. small cap growth stocks. The Russell 2000 Index measures the performance of the small cap segment of the U.S. equity universe. These indices do not reflect expenses, fees or sales charge, which would lower performance. The indices are unmanaged and they are not available for investment.
| | | | | Since | Inception |
Average Annual Total Returns as of May 31, 2021 | 1 Year | 5 Year | 10 Year | Inception | Date |
| Before deducting maximum sales charge | | | | | |
Class A1 | 43.47% | 13.49% | 9.96% | 10.49% | 01/03/94 |
Class I2 | 43.92% | 13.81% | 10.31% | 12.40% | 12/29/09 |
| After deducting maximum sales charge | | | | | |
Class A1 | 35.22% | 12.16% | 9.31% | 10.25% | 01/03/94 |
| Russell 2000 Growth Index | 50.14% | 17.57% | 12.76% | 8.66% | 01/03/94 |
| Russell 2000 Index | 64.56% | 16.01% | 11.86% | 9.75% | 01/03/94 |
1 | Maximum sales charge for Class A shares is 5.75%. No initial sales charge applies on investments of $500,000 or more, but a contingent deferred sales charge (“CDSC”) of 1.00% will be imposed on certain redemptions of such shares within 12 months of the date of purchase. |
2 | Class I shares do not have any initial or contingent deferred sales charge. |
The Fund acquired all assets and assumed the liabilities of the Oak Ridge Small Cap Growth Fund (the “Predecessor Fund”) effective the close of business on May 10, 2019. As a result of the reorganization, the Fund is the accounting successor of the Predecessor Fund. Performance results shown in the table above for periods prior to the close of business on May 10, 2019 reflect the performance of the Predecessor Fund.
North Square Oak Ridge Small Cap Growth Fund
FUND PERFORMANCE at May 31, 2021 (Unaudited) – Continued
The performance data quoted here represents past performance and past performance is not a guarantee of future results. Investment return and principal value will fluctuate so that an investor’s shares, when redeemed, may be worth more or less than their original cost. Current performance may be lower or higher than the performance information quoted. The most recent month end performance may be obtained by calling 1-855-551-5521.
Gross and net expense ratios for Class A shares were 2.07% and 1.40%, and for Class I shares were 1.79% and 1.15%, which were the amounts stated in the current prospectus dated September 30, 2020. Expense ratios reported for other periods in the Financial Highlights section of this report may differ. The Fund’s advisor has contractually agreed to waive its fees and/or pay for operating expenses of the Fund to ensure that total annual fund operating expenses do not exceed 1.39%, and 1.14% of the average daily net assets of the Fund’s Class A and Class I shares, respectively. This agreement is in effect until September 30, 2021, and it may be terminated before that date only by the Trust’s Board of Trustees. In the absence of such waivers, the Fund’s returns would have been lower.
Returns reflect the reinvestment of distributions made by the Fund, if any. The graph and performance table shown do not reflect the deduction of taxes that a shareholder would pay on Fund distributions or the redemption of Fund shares.
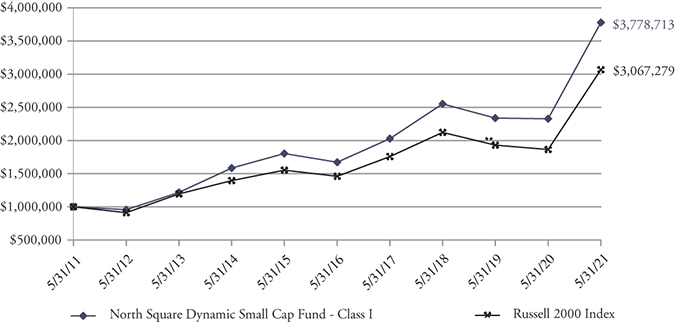
North Square Dynamic Small Cap Fund
FUND PERFORMANCE at May 31, 2021 (Unaudited)
Performance of a $1,000,000 Investment
This graph compares a hypothetical $1,000,000 investment in the Fund’s Class I shares, made on May 31, 2011, with a similar investment in the Russell 2000 Index. Results include the reinvestment of all dividends and capital gains.
The Russell 2000 Index measures the performance of the small cap segment of the U.S. equity universe. The index does not reflect expenses, fees or sales charge, which would lower performance. The index is unmanaged and it is not available for investment.
| | | | | Since | Inception |
Average Annual Total Returns as of May 31, 2021 | 1 Year | 5 Year | 10 Year | Inception | Date |
| Class I | 62.34% | 17.71% | 14.22% | 15.28% | 11/01/08 |
| Russell 2000 Index | 64.56% | 16.01% | 11.86% | 13.68% | 11/01/08 |
The Fund acquired all assets and assumed the liabilities of the Oak Ridge Dynamic Small Cap Fund (the “Predecessor Fund”) effective the close of business on May 10, 2019. The Predecessor Fund commenced operations on September 30, 2015 after the conversion of the Algert Global U.S. Small Cap account (the “Predecessor Account”). As a result of each reorganization, the Fund is the accounting successor of each the Predecessor Fund and Predecessor Account. Performance results shown in the performance table above between May 10, 2019 and September 30, 2015 represent the performance of the Predecessor Fund, and performance results shown prior to September 30, 2015 represent the performance of the Predecessor Account. The Predecessor Account was not registered under the Investment Company Act of 1940, as amended (the “1940 Act”), and therefore was not subject to certain restrictions imposed by the 1940 Act on registered investment companies and by the Internal Revenue Code of 1986 on regulated investment companies. If the Predecessor Account had been registered under the 1940 Act, the Predecessor Account’s performance may have been adversely affected.
The performance data quoted here represents past performance and past performance is not a guarantee of future results. Investment return and principal value will fluctuate so that an investor’s shares, when redeemed, may be worth more or less than their original cost. Current performance may be lower or higher than the performance information quoted. The most recent month end performance may be obtained by calling 1-855-551-5521.
Gross and net expense ratios for Class I shares were 2.23% and 1.15%, respectively, which were the amounts stated in the current prospectus dated September 30, 2020. Expense ratios reported for other periods in the Financial Highlights section of this report may differ. The Fund’s advisor has contractually agreed to waive its fees and/or pay for operating expenses of the Fund to ensure that total annual fund operating expenses do not exceed 1.15% of the average daily net assets of the Fund’s Class I shares. This agreement is in effect until September 30, 2029, and it may be terminated before that date only by the Trust’s Board of Trustees. In the absence of such waivers, the Fund’s returns would have been lower.
Returns reflect the reinvestment of distributions made by the Fund, if any. The graph and performance table above do not reflect the deduction of taxes that a shareholder would pay on Fund distributions or the redemption of Fund shares.
North Square Oak Ridge All Cap Growth Fund
FUND PERFORMANCE at May 31, 2021 (Unaudited)
Performance of a $1,000,000 Investment
This graph compares a hypothetical $1,000,000 investment in the Fund’s Class I shares, made at its inception, with a similar investment in the Russell 3000 Growth Index. Results include the reinvestment of all dividends and capital gains.
The Russell 3000 Growth Index is a market capitalization weighted index and includes companies that display signs of above average growth. The index is used to provide a gauge of the performance of growth stocks in the U.S. This index does not reflect expenses, fees, or sales charge, which would lower performance. The index is unmanaged and it is not available for investment.
| | | | Since | Inception |
Average Annual Total Returns as of May 31, 2021 | 1 Year | 3 Year | Inception | Date |
| Class I | 35.93% | 21.01% | 19.18% | 07/29/16 |
| Russell 3000 Growth Index | 40.51% | 22.40% | 21.46% | 07/29/16 |
The Fund acquired all assets and assumed the liabilities of the Oak Ridge Disciplined Growth Fund (the “Predecessor Fund”) effective the close of business on May 10, 2019. As a result of the reorganization, the Fund is the accounting successor of the Predecessor Fund. Performance results shown in the table above for periods prior to the close of business on May 10, 2019 reflect the performance of the Predecessor Fund.
The performance data quoted here represents past performance and past performance is not a guarantee of future results. Investment return and principal value will fluctuate so that an investor’s shares, when redeemed, may be worth more or less than their original cost. Current performance may be lower or higher than the performance information quoted. The most recent month end performance may be obtained by calling 1-855-551-5521.
Gross and net expense ratios for the Class I shares were 1.89% and 0.96%, respectively, which were stated in the current prospectus dated September 30, 2020. Expense ratios reported for other periods in the Financial Highlights section of this report may differ. The Fund’s advisor has contractually agreed to waive its fees and/or pay for operating expenses of the Fund to ensure that total annual fund operating expenses does not exceed 0.95% of the average daily net assets of the Fund’s Class I shares. This agreement is in effect until September 30, 2029, and it may be terminated before that date only by the Trust’s Board of Trustees. In the absence of such waivers, the Fund’s returns would have been lower.
Returns reflect the reinvestment of distributions made by the Fund, if any. The graph and performance table above do not reflect the deduction of taxes that a shareholder would pay on Fund distributions or the redemption of the Fund shares.
North Square Multi Strategy Fund
FUND PERFORMANCE at May 31, 2021 (Unaudited)
Performance of a $10,000 Investment
This graph compares a hypothetical $10,000 investment in the Fund’s Class A shares (assumes the maximum sales load charged by the Fund), made on May 31, 2011, with a similar investment in the Russell 3000 Index and the Russell 3000 Growth Index. The performance graph above is shown for the Fund’s Class A shares; Class I shares performance may vary. Results include the reinvestment of all dividends and capital gains.
The Russell 3000 Index measures the performance of the largest 3,000 US companies. The Russell 3000 Growth Index is a market capitalization weighted index and includes companies that display signs of above average growth. These indices do not reflect expenses, fees or sales charge, which would lower performance. The indices are unmanaged and they are not available for investment.
| | | | | Since | Inception |
Average Annual Total Returns as of May 31, 2021 | 1 Year | 5 Year | 10 Year | Inception | Date |
| Before deducting maximum sales charge | | | | | |
Class A1 | 39.20% | 13.98% | 11.53% | 6.16% | 03/01/99 |
Class I2 | 40.07% | 14.44% | 11.80% | 8.50% | 08/10/04 |
| After deducting maximum sales charge | | | | | |
Class A1 | 31.17% | 12.64% | 10.87% | 5.88% | 03/01/99 |
| Russell 3000 Index | 43.91% | 17.36% | 14.21% | 8.12% | 03/01/99 |
| Russell 3000 Growth Index | 40.51% | 21.75% | 16.66% | 7.87% | 03/01/99 |
1 | Maximum sales charge for Class A shares is 5.75%. No initial sales charge applies on investments of $500,000 or more, but a contingent deferred sales charge (“CDSC”) of 1.00% will be imposed on certain redemptions of such shares within 12 months of the date of purchase. |
2 | Class I shares do not have any initial or contingent deferred sales charge. |
The Fund acquired all assets and assumed the liabilities of the Oak Ridge Multi Strategy Fund (the “Predecessor Fund”) effective the close of business on May 10, 2019. As a result of the reorganization, the Fund is the accounting successor of the Predecessor Fund. Performance results shown in the table above for periods prior to the close of business on May 10, 2019 reflect the performance of the Predecessor Fund.
North Square Multi Strategy Fund
FUND PERFORMANCE at May 31, 2021 (Unaudited) – Continued
The performance data quoted here represents past performance and past performance is not a guarantee of future results. Investment return and principal value will fluctuate so that an investor’s shares, when redeemed, may be worth more or less than their original cost. Current performance may be lower or higher than the performance information quoted. The most recent month end performance may be obtained by calling 1-855-551-5521.
Gross and net expense ratios for Class A shares were 2.85% and 2.25%, respectively, and for Class I shares were 2.43% and 1.95%, respectively, which were the amounts stated in the current prospectus dated September 30, 2020. Expense ratios reported for other periods in the Financial Highlights section of this report may differ. The Fund’s advisor has contractually agreed to waive its fees and/or pay for operating expenses of the Fund to ensure that total annual fund operating expenses do not exceed 1.20% and 1.17% of the average daily net assets of the Fund’s Class A and Class I shares, respectively. This agreement is in effect until September 30, 2029, and it may be terminated before that date only by the Trust’s Board of Trustees. In the absence of such waivers, the Fund’s returns would have been lower.
Returns reflect the reinvestment of distributions made by the Fund, if any. The graph and performance table shown do not reflect the deduction of taxes that a shareholder would pay on Fund distributions or the redemption of Fund shares.
North Square Oak Ridge Dividend Growth Fund
FUND PERFORMANCE at May 31, 2021 (Unaudited)
Performance of a $1,000,000 Investment
This graph compares a hypothetical $1,000,000 investment in the Fund’s Class I shares, made at its inception, with a similar investment in the S&P 500 Index. Results include the reinvestment of all dividends and capital gains.
The S&P 500 Index measures the performance of primarily large cap U.S. stocks. The index does not reflect expenses, fees or sales charge, which would lower performance. The index is unmanaged and it is not available for investment.
| | | | | Since | Inception |
Average Annual Total Returns as of May 31, 2021 | 1 Year | 3 Year | 5 Year | Inception | Date |
| Class I | 37.06% | 17.03% | 16.65% | 13.69% | 06/28/13 |
| S&P 500 Index | 40.32% | 18.00% | 17.16% | 15.19% | 06/28/13 |
The Fund acquired all assets and assumed the liabilities of the Oak Ridge Dividend Growth Fund (the “Predecessor Fund”) effective the close of business on May 10, 2019. As a result of the reorganization, the Fund is the accounting successor of the Predecessor Fund. Performance results shown in the table above for periods prior to the close of business on May 10, 2019 reflect the performance of the Predecessor Fund.
The performance data quoted here represents past performance and past performance is not a guarantee of future results. Investment return and principal value will fluctuate so that an investor’s shares, when redeemed, may be worth more or less than their original cost. Current performance may be lower or higher than the performance information quoted. The most recent month end performance may be obtained by calling 1-855-551-5521.
Gross and net expense ratios for Class I shares were 1.90% and 1.01%, respectively, which were the amounts stated in the current prospectus dated September 30, 2020. Expense ratios reported for other periods in the Financial Highlights section of this report may differ. The Fund’s advisor has contractually agreed to waive its fees and/or pay for operating expenses of the Fund to ensure that total annual fund operating expenses do not exceed 1.00% of the average daily net assets of the Fund’s Class I shares. This agreement is in effect until September 30, 2029, and it may be terminated before that date only by the Trust’s Board of Trustees. In the absence of such waivers, the Fund’s returns would have been lower.
Returns reflect the reinvestment of distributions made by the Fund, if any. The graph and performance table above do not reflect the deduction of taxes that a shareholder would pay on Fund distributions or the redemption of Fund shares.
North Square Oak Ridge Small Cap Growth Fund
SCHEDULE OF INVESTMENTS
As of May 31, 2021
| Number | | | | | |
| of Shares | | | | Value | |
| | | COMMON STOCKS – 99.7% | | | |
| | | | | | |
| | | CONSUMER DISCRETIONARY – 16.1% | | | |
| | | | | | |
| | | Distributors – 1.5% | | | |
| | 5,000 | | Pool Corp. | | $ | 2,182,750 | |
| | | | | | | | |
| | | | Diversified Consumer Services – 1.5% | | | | |
| | 40,859 | | frontdoor, Inc.* | | | 2,194,128 | |
| | | | | | | | |
| | | | Hotels, Restaurants & Leisure – 1.7% | | | | |
| | 18,525 | | NeoGames S.A.*1 | | | 1,187,452 | |
| | 9,845 | | Wingstop, Inc. | | | 1,404,685 | |
| | | | | | | 2,592,137 | |
| | | | Internet & Direct Marketing Retail – 0.8% | | | | |
| | 64,777 | | The RealReal Inc.* | | | 1,131,654 | |
| | | | | | | | |
| | | | Leisure Products – 2.5% | | | | |
| | 43,392 | | YETI Holdings, Inc.* | | | 3,801,139 | |
| | | | | | | | |
| | | | Multiline Retail – 1.5% | | | | |
| | 25,549 | | Ollie’s Bargain Outlet Holdings, Inc.* | | | 2,208,456 | |
| | | | | | | | |
| | | | Specialty Retail – 6.6% | | | | |
| | 5,767 | | Burlington Stores, Inc.* | | | 1,864,875 | |
| | 10,320 | | Five Below, Inc.* | | | 1,900,118 | |
| | 102,230 | | Leslie’s, Inc.* | | | 2,981,027 | |
| | 60,909 | | National Vision Holdings, Inc.* | | | 3,025,350 | |
| | | | | | | 9,771,370 | |
| | | | TOTAL CONSUMER DISCRETIONARY | | | 23,881,634 | |
| | | | | | | | |
| | | | CONSUMER STAPLES – 5.8% | | | | |
| | | | | | | | |
| | | | Food & Staples Retailing – 3.0% | | | | |
| | 64,575 | | BJ’s Wholesale Club Holdings, Inc.* | | | 2,892,314 | |
| | 46,340 | | Grocery Outlet Holding Corp.* | | | 1,578,804 | |
| | | | | | | 4,471,118 | |
| | | | Food Products – 2.8% | | | | |
| | 137,054 | | Nomad Foods Ltd.*1 | | | 4,203,446 | |
| | | | TOTAL CONSUMER STAPLES | | | 8,674,564 | |
| | | | | | | | |
| | | | FINANCIALS – 1.7% | | | | |
| | | | | | | | |
| | | | Insurance – 1.7% | | | | |
| | 6,872 | | Kinsale Capital Group, Inc. | | | 1,143,913 | |
| | 19,397 | | Palomar Holdings, Inc.* | | | 1,415,981 | |
| | | | TOTAL FINANCIALS | | | 2,559,894 | |
| | | | | | | | |
| | | | HEALTH CARE – 31.4% | | | | |
| | | | | | | | |
| | | | Biotechnology – 11.6% | | | | |
| | 10,900 | | Acceleron Pharma, Inc.* | | | 1,426,701 | |
| | 5,167 | | argenx SE – ADR*1 | | | 1,441,541 | |
| | 27,542 | | Arrowhead Pharmaceuticals, Inc.* | | | 1,999,549 | |
| | 13,413 | | Biohaven Pharmaceutical Holding Co Ltd.*1 | | | 1,166,931 | |
| | 9,937 | | Blueprint Medicines Corp.* | | | 907,745 | |
See accompanying Notes to Financial Statements.
North Square Oak Ridge Small Cap Growth Fund
SCHEDULE OF INVESTMENTS – Continued
As of May 31, 2021
| Number | | | | | |
| of Shares | | | | Value | |
| | | COMMON STOCKS (Continued) | | | |
| | | | | | |
| | | HEALTH CARE (Continued) | | | |
| | | | | | |
| | | Biotechnology (Continued) | | | |
| | 21,999 | | Emergent BioSolutions, Inc.* | | $ | 1,334,239 | |
| | 59,101 | | Halozyme Therapeutics, Inc.* | | | 2,447,372 | |
| | 97,277 | | Heron Therapeutics, Inc.* | | | 1,290,866 | |
| | 16,686 | | Horizon Therapeutics PLC*1 | | | 1,529,439 | |
| | 32,486 | | Insmed, Inc.* | | | 799,156 | |
| | 21,924 | | Oyster Point Pharma, Inc.* | | | 392,878 | |
| | 54,134 | | Travere Therapeutics, Inc.* | | | 821,213 | |
| | 41,143 | | Veracyte, Inc.* | | | 1,606,634 | |
| | | | | | | 17,164,264 | |
| | | | Health Care Equipment & Supplies – 8.9% | | | | |
| | 37,317 | | AtriCure, Inc.* | | | 2,788,699 | |
| | 42,021 | | Axonics, Inc.* | | | 2,424,192 | |
| | 25,551 | | CONMED Corp. | | | 3,518,117 | |
| | 4,233 | | Insulet Corp.* | | | 1,141,513 | |
| | 20,092 | | OrthoPediatrics Corp.* | | | 1,134,997 | |
| | 4,632 | | Penumbra, Inc.* | | | 1,153,878 | |
| | 68,236 | | Zynex, Inc.* | | | 1,038,552 | |
| | | | | | | 13,199,948 | |
| | | | Health Care Providers & Services – 2.1% | | | | |
| | 15,903 | | LHC Group, Inc.* | | | 3,130,506 | |
| | | | | | | | |
| | | | Health Care Technology – 5.9% | | | | |
| | 60,852 | | Inovalon Holdings, Inc. – Class A* | | | 1,908,319 | |
| | 15,375 | | Inspire Medical Systems, Inc.* | | | 2,987,363 | |
| | 15,389 | | Omnicell, Inc.* | | | 2,139,071 | |
| | 25,263 | | Schrodinger, LLC* | | | 1,772,957 | |
| | | | | | | 8,807,710 | |
| | | | Life Sciences Tools & Services – 2.4% | | | | |
| | 86,611 | | NeoGenomics, Inc.* | | | 3,553,649 | |
| | | | | | | | |
| | | | Pharmaceuticals – 0.5% | | | | |
| | 11,865 | | Axsome Therapeutics, Inc.* | | | 720,324 | |
| | | | TOTAL HEALTH CARE | | | 46,576,401 | |
| | | | | | | | |
| | | | INDUSTRIALS – 15.7% | | | | |
| | | | | | | | |
| | | | Aerospace & Defense – 1.0% | | | | |
| | 21,928 | | Mercury Systems, Inc.* | | | 1,435,187 | |
| | | | | | | | |
| | | | Building Products – 1.3% | | | | |
| | 45,996 | | The AZEK Co. Inc.* | | | 2,002,206 | |
| | | | | | | | |
| | | | Commercial Services & Supplies – 1.7% | | | | |
| | 38,469 | | Casella Waste Systems, Inc. – Class A* | | | 2,593,965 | |
| | | | | | | | |
| | | | Construction & Engineering – 1.5% | | | | |
| | 67,174 | | Construction Partners, Inc. – Class A* | | | 2,163,674 | |
| | | | | | | | |
| | | | Electrical Equipment – 2.0% | | | | |
| | 32,584 | | Vicor Corp.* | | | 2,935,167 | |
See accompanying Notes to Financial Statements.
North Square Oak Ridge Small Cap Growth Fund
SCHEDULE OF INVESTMENTS – Continued
As of May 31, 2021
| Number | | | | | |
| of Shares | | | | Value | |
| | | COMMON STOCKS (Continued) | | | |
| | | | | | |
| | | INDUSTRIALS (Continued) | | | |
| | | | | | |
| | | Machinery – 4.0% | | | |
| | 75,859 | | Colfax Corp.* | | $ | 3,352,968 | |
| | 18,399 | | John Bean Technologies Corp. | | | 2,650,008 | |
| | | | | | | 6,002,976 | |
| | | | Road & Rail – 2.3% | | | | |
| | 14,858 | | Saia, Inc.* | | | 3,419,717 | |
| | | | | | | | |
| | | | Trading Companies & Distributors – 1.9% | | | | |
| | 16,300 | | SiteOne Landscape Supply, Inc.* | | | 2,804,252 | |
| | | | TOTAL INDUSTRIALS | | | 23,357,144 | |
| | | | | | | | |
| | | | INFORMATION TECHNOLOGY – 28.2% | | | | |
| | | | | | | | |
| | | | Electronic Equipment, Instruments & Components – 1.8% | | | | |
| | 10,026 | | Littelfuse, Inc. | | | 2,619,192 | |
| | | | | | | | |
| | | | IT Services – 11.5% | | | | |
| | 34,193 | | Endava PLC – ADR*1 | | | 3,507,518 | |
| | 16,555 | | Euronet Worldwide, Inc.* | | | 2,477,290 | |
| | 37,397 | | Maximus, Inc. | | | 3,465,580 | |
| | 46,750 | | Perficient, Inc.* | | | 3,346,833 | |
| | 66,706 | | Repay Holdings Corp.* | | | 1,514,893 | |
| | 14,305 | | WEX, Inc.* | | | 2,802,493 | |
| | | | | | | 17,114,607 | |
| | | | Semiconductors & Semiconductor Equipment – 3.9% | | | | |
| | 30,908 | | Diodes, Inc.* | | | 2,338,808 | |
| | 64,058 | | Lattice Semiconductor Corp.* | | | 3,399,558 | |
| | | | | | | 5,738,366 | |
| | | | Software – 11.0% | | | | |
| | 36,733 | | Altair Engineering, Inc. – Class A* | | | 2,474,702 | |
| | 15,141 | | Cerence, Inc.* | | | 1,440,363 | |
| | 40,673 | | The Descartes Systems Group Inc.*1 | | | 2,376,930 | |
| | 31,754 | | Envestnet, Inc.* | | | 2,285,336 | |
| | 8,344 | | Everbridge, Inc.* | | | 980,420 | |
| | 25,313 | | Five9, Inc.* | | | 4,482,932 | |
| | 54,763 | | Upland Software, Inc.* | | | 2,244,736 | |
| | | | | | | 16,285,419 | |
| | | | TOTAL INFORMATION TECHNOLOGY | | | 41,757,584 | |
| | | | | | | | |
| | | | REAL ESTATE – 0.8% | | | | |
| | | | | | | | |
| | | | Real Estate Management & Development – 0.8% | | | | |
| | 20,605 | | Redfin Corp.* | | | 1,216,313 | |
| | | | TOTAL REAL ESTATE | | | 1,216,313 | |
| | | | TOTAL COMMON STOCKS | | | | |
| | | | (Cost $94,358,726) | | | 148,023,534 | |
See accompanying Notes to Financial Statements.
North Square Oak Ridge Small Cap Growth Fund
SCHEDULE OF INVESTMENTS – Continued
As of May 31, 2021
| Number | | | | | |
| of Shares | | | | Value | |
| | | SHORT-TERM INVESTMENT – 0.5% | | | |
| | 726,027 | | First American Treasury Obligations Fund – Class X, 0.02%2 | | $ | 726,027 | |
| | | | TOTAL SHORT-TERM INVESTMENT | | | | |
| | | | (Cost $726,027) | | | 726,027 | |
| | | | TOTAL INVESTMENTS – 100.2% | | | | |
| | | | (Cost $95,084,753) | | | 148,749,561 | |
| | | | Liabilities in Excess of Other Assets – (0.2)% | | | (337,563 | ) |
| | | | TOTAL NET ASSETS – 100.0% | | $ | 148,411,998 | |
ADR – American Depositary Receipt
PLC – Public Limited Company
| * | Non-Income producing security. |
1 | Foreign security denominated in U.S. Dollars. |
2 | The rate is the annualized seven-day yield at period end. |
Investments are classified by industry pursuant to the Global Industry Classification Standard (GICS®), which was developed by and/or is the exclusive property of Morgan Stanley Capital International, Inc. (“MSCI”) and Standard & Poor’s Financial Services LLC (“S&P”). GICS is a service mark of MSCI and S&P and has been licensed for use by U.S. Bancorp Fund Services, LLC.
See accompanying Notes to Financial Statements.
North Square Oak Ridge Small Cap Growth Fund
SUMMARY OF INVESTMENTS
As of May 31, 2021
| | Percent of Total |
| Security Type/Sector | Net Assets |
| Common Stocks | | | |
| Health Care | | 31.4% | |
| Information Technology | | 28.2% | |
| Consumer Discretionary | | 16.1% | |
| Industrials | | 15.7% | |
| Consumer Staples | | 5.8% | |
| Financials | | 1.7% | |
| Real Estate | | 0.8% | |
| Total Common Stocks | | 99.7% | |
| Short-Term Investment | | 0.5% | |
| Total Investments | | 100.2% | |
| Liabilities in Excess of Other Assets | | (0.2)% | |
| Total Net Assets | | 100.0% | |
See accompanying Notes to Financial Statements.
North Square Dynamic Small Cap Fund
SCHEDULE OF INVESTMENTS
As of May 31, 2021
| Number | | | | | |
| of Shares | | | | Value | |
| | | COMMON STOCKS – 95.3% | | | |
| | | | | | |
| | | COMMUNICATION SERVICES – 3.0% | | | |
| | | | | | |
| | | Diversified Telecommunication Services – 0.9% | | | |
| | 1,270 | | Cogent Communications Holdings, Inc. | | $ | 96,012 | |
| | 4,430 | | Ooma, Inc.* | | | 85,986 | |
| | | | | | | 181,998 | |
| | | | Entertainment – 0.4% | | | | |
| | 8,560 | | Zynga, Inc. – Class A* | | | 92,790 | |
| | | | | | | | |
| | | | Media – 1.1% | | | | |
| | 1,960 | | AMC Networks, Inc. – Class A* | | | 105,213 | |
| | 2,720 | | Gray Television, Inc. | | | 63,267 | |
| | 760 | | TechTarget, Inc.* | | | 53,436 | |
| | | | | | | 221,916 | |
| | | | Wireless Telecommunication Services – 0.6% | | | | |
| | 8,890 | | Gogo, Inc.* | | | 121,082 | |
| | | | TOTAL COMMUNICATION SERVICES | | | 617,786 | |
| | | | | | | | |
| | | | CONSUMER DISCRETIONARY – 21.1% | | | | |
| | | | | | | | |
| | | | Auto Components – 1.8% | | | | |
| | 200 | | Fox Factory Holding Corp.* | | | 31,096 | |
| | 3,158 | | Patrick Industries, Inc. | | | 270,640 | |
| | 860 | | XPEL, Inc.* | | | 70,520 | |
| | | | | | | 372,256 | |
| | | | Automobiles – 1.3% | | | | |
| | 3,700 | | Winnebago Industries, Inc. | | | 273,652 | |
| | | | | | | | |
| | | | Distributors – 0.3% | | | | |
| | 1,170 | | Core-Mark Holding Co., Inc. | | | 53,656 | |
| | | | | | | | |
| | | | Diversified Consumer Services – 1.0% | | | | |
| | 7,701 | | Stride, Inc.* | | | 207,003 | |
| | | | | | | | |
| | | | Hotels, Restaurants & Leisure – 5.3% | | | | |
| | 8,530 | | Bloomin’ Brands, Inc.* | | | 252,061 | |
| | 620 | | Dave & Buster’s Entertainment, Inc.* | | | 26,214 | |
| | 7,820 | | Everi Holdings, Inc.* | | | 162,109 | |
| | 4,490 | | International Game Technology PLC*2 | | | 108,927 | |
| | 240 | | Jack in the Box, Inc. | | | 27,264 | |
| | 1,272 | | Monarch Casino & Resort, Inc.* | | | 90,770 | |
| | 1,580 | | Papa John’s International, Inc. | | | 148,441 | |
| | 750 | | Penn National Gaming, Inc.* | | | 61,477 | |
| | 370 | | Scientific Games Corp.* | | | 26,840 | |
| | 850 | | Texas Roadhouse, Inc. | | | 85,604 | |
| | 563 | | Wingstop, Inc. | | | 80,329 | |
| | | | | | | 1,070,036 | |
| | | | Household Durables – 2.5% | | | | |
| | 1,460 | | Helen of Troy Ltd.*2 | | | 307,301 | |
| | 210 | | iRobot Corp.* | | | 20,517 | |
| | 2,090 | | Purple Innovation, Inc.* | | | 59,607 | |
| | 3,000 | | Sonos, Inc.* | | | 111,000 | |
| | | | | | | 498,425 | |
See accompanying Notes to Financial Statements.
North Square Dynamic Small Cap Fund
SCHEDULE OF INVESTMENTS – Continued
As of May 31, 2021
| Number | | | | | |
| of Shares | | | | Value | |
| | | COMMON STOCKS (Continued) | | | |
| | | | | | |
| | | CONSUMER DISCRETIONARY (Continued) | | | |
| | | | | | |
| | | Internet & Direct Marketing Retail – 1.2% | | | |
| | 3,140 | | CarParts.com, Inc.* | | $ | 51,307 | |
| | 1,634 | | Overstock.com, Inc.* | | | 139,593 | |
| | 2,180 | | PetMed Express, Inc. | | | 63,002 | |
| | | | | | | 253,902 | |
| | | | Leisure Products – 1.8% | | | | |
| | 4,600 | | Nautilus, Inc.* | | | 82,846 | |
| | 3,230 | | YETI Holdings, Inc.* | | | 282,948 | |
| | | | | | | 365,794 | |
| | | | Specialty Retail – 3.3% | | | | |
| | 690 | | RH* | | | 442,325 | |
| | 910 | | Sleep Number Corp.* | | | 101,456 | |
| | 2,740 | | Sonic Automotive, Inc. – Class A | | | 132,150 | |
| | | | | | | 675,931 | |
| | | | Textiles, Apparel & Luxury Goods – 2.6% | | | | |
| | 2,700 | | Carter’s, Inc. | | | 276,048 | |
| | 410 | | Deckers Outdoor Corp.* | | | 137,530 | |
| | 1,880 | | Kontoor Brands, Inc. | | | 120,358 | |
| | | | | | | 533,936 | |
| | | | TOTAL CONSUMER DISCRETIONARY | | | 4,304,591 | |
| | | | | | | | |
| | | | CONSUMER STAPLES – 7.2% | | | | |
| | | | | | | | |
| | | | Beverages – 0.9% | | | | |
| | 2,710 | | MGP Ingredients, Inc. | | | 188,860 | |
| | | | | | | | |
| | | | Food & Staples Retailing – 1.2% | | | | |
| | 4,639 | | The Andersons, Inc. | | | 144,180 | |
| | 4,990 | | SpartanNash Co. | | | 104,640 | |
| | | | | | | 248,820 | |
| | | | Food Products – 0.6% | | | | |
| | 3,630 | | B&G Foods, Inc. | | | 111,078 | |
| | | | | | | | |
| | | | Personal Products – 4.3% | | | | |
| | 8,190 | | e.l.f. Beauty, Inc.* | | | 229,320 | |
| | 4,250 | | Herbalife Nutrition Ltd.*2 | | | 223,422 | |
| | 720 | | Inter Parfums, Inc. | | | 55,066 | |
| | 500 | | Medifast, Inc. | | | 166,125 | |
| | 1,810 | | Nu Skin Enterprises, Inc. – Class A | | | 108,890 | |
| | 860 | | USANA Health Sciences, Inc.* | | | 90,936 | |
| | | | | | | 873,759 | |
| | | | Tobacco – 0.2% | | | | |
| | 800 | | Turning Point Brands, Inc. | | | 34,216 | |
| | | | TOTAL CONSUMER STAPLES | | | 1,456,733 | |
| | | | | | | | |
| | | | ENERGY – 3.1% | | | | |
| | | | | | | | |
| | | | Energy Equipment & Services – 0.7% | | | | |
| | 580 | | Dril-Quip, Inc.* | | | 19,447 | |
| | 2,710 | | Select Energy Services, Inc. – Class A* | | | 15,393 | |
See accompanying Notes to Financial Statements.
North Square Dynamic Small Cap Fund
SCHEDULE OF INVESTMENTS – Continued
As of May 31, 2021
| Number | | | | | |
| of Shares | | | | Value | |
| | | COMMON STOCKS (Continued) | | | |
| | | | | | |
| | | ENERGY (Continued) | | | |
| | | | | | |
| | | Energy Equipment & Services (Continued) | | | |
| | 8,130 | | Solaris Oilfield Infrastructure, Inc. – Class A | | $ | 81,219 | |
| | 2,880 | | US Silica Holdings, Inc.* | | | 29,549 | |
| | | | | | | 145,608 | |
| | | | Oil, Gas & Consumable Fuels – 2.4% | | | | |
| | 3,680 | | Brigham Minerals, Inc. – Class A | | | 66,755 | |
| | 10,040 | | Dorian LPG Ltd.*2 | | | 142,668 | |
| | 13,560 | | Magnolia Oil & Gas Corp. – Class A* | | | 175,195 | |
| | 1,240 | | Renewable Energy Group, Inc.* | | | 75,727 | |
| | 168 | | REX American Resources Corp.* | | | 16,133 | |
| | | | | | | 476,478 | |
| | | | TOTAL ENERGY | | | 622,086 | |
| | | | | | | | |
| | | | FINANCIALS – 10.1% | | | | |
| | | | | | | | |
| | | | Banks – 4.7% | | | | |
| | 1,295 | | Bank OZK | | | 55,309 | |
| | 3,390 | | First Commonwealth Financial Corp. | | | 51,359 | |
| | 2,220 | | First Foundation, Inc. | | | 55,722 | |
| | 1,251 | | Great Western Bancorp, Inc. | | | 41,858 | |
| | 2,730 | | National Bank Holdings Corp. – Class A | | | 108,108 | |
| | 2,130 | | OFG Bancorp2 | | | 51,333 | |
| | 3,650 | | TriState Capital Holdings, Inc.* | | | 83,914 | |
| | 4,180 | | United Community Banks, Inc. of Georgia | | | 144,544 | |
| | 1,360 | | Univest Financial Corp. | | | 39,658 | |
| | 1,194 | | Western Alliance Bancorp | | | 119,412 | |
| | 3,510 | | Zions Bancorp NA | | | 203,159 | |
| | | | | | | 954,376 | |
| | | | Capital Markets – 1.7% | | | | |
| | 4,000 | | Cowen, Inc. – Class A | | | 157,320 | |
| | 1,530 | | Piper Sandler Cos | | | 195,014 | |
| | | | | | | 352,334 | |
| | | | Consumer Finance – 1.1% | | | | |
| | 4,300 | | PROG Holdings, Inc. | | | 226,696 | |
| | | | | | | | |
| | | | Insurance – 1.8% | | | | |
| �� | 10,780 | | American Equity Investment Life Holding Co. | | | 328,790 | |
| | 430 | | First American Financial Corp. | | | 27,653 | |
| | 360 | | James River Group Holdings Ltd.2 | | | 12,571 | |
| | | | | | | 369,014 | |
| | | | Thrifts & Mortgage Finance – 0.8% | | | | |
| | 2,730 | | Flagstar Bancorp, Inc. | | | 125,034 | |
| | 291 | | Walker & Dunlop, Inc. | | | 29,548 | |
| | | | | | | 154,582 | |
| | | | TOTAL FINANCIALS | | | 2,057,002 | |
See accompanying Notes to Financial Statements.
North Square Dynamic Small Cap Fund
SCHEDULE OF INVESTMENTS – Continued
As of May 31, 2021
| Number | | | | | |
| of Shares | | | | Value | |
| | | COMMON STOCKS (Continued) | | | |
| | | | | | |
| | | HEALTH CARE – 16.0% | | | |
| | | | | | |
| | | Biotechnology – 5.1% | | | |
| | 7,013 | | Adverum Biotechnologies, Inc.* | | $ | 24,265 | |
| | 5,505 | | Aeglea BioTherapeutics, Inc.* | | | 36,388 | |
| | 1,850 | | Arena Pharmaceuticals, Inc.* | | | 113,053 | |
| | 680 | | Celldex Therapeutics, Inc.* | | | 19,006 | |
| | 5,401 | | Constellation Pharmaceuticals, Inc.* | | | 106,994 | |
| | 5,187 | | Eiger BioPharmaceuticals, Inc.* | | | 40,770 | |
| | 10,280 | | Immunovant, Inc.* | | | 155,845 | |
| | 1,120 | | Iovance Biotherapeutics, Inc.* | | | 20,798 | |
| | 4,458 | | IVERIC bio, Inc.* | | | 31,518 | |
| | 6,920 | | Kura Oncology, Inc.* | | | 153,970 | |
| | 1,230 | | Magenta Therapeutics, Inc.* | | | 15,191 | |
| | 1,240 | | Molecular Templates, Inc.* | | | 11,086 | |
| | 1,830 | | RAPT Therapeutics, Inc.* | | | 35,319 | |
| | 1,240 | | REVOLUTION Medicines, Inc.* | | | 37,088 | |
| | 4,720 | | Sutro Biopharma, Inc.* | | | 87,839 | |
| | 1,380 | | Twist Bioscience Corp.* | | | 148,088 | |
| | | | | | | 1,037,218 | |
| | | | Health Care Equipment & Supplies – 4.6% | | | | |
| | 1,650 | | Cardiovascular Systems, Inc.* | | | 64,663 | |
| | 3,520 | | Inmode Ltd.*2 | | | 300,467 | |
| | 7,607 | | Sientra, Inc.* | | | 52,945 | |
| | 440 | | STAAR Surgical Co.* | | | 64,253 | |
| | 800 | | Surmodics, Inc.* | | | 42,440 | |
| | 810 | | Tactile Systems Technology, Inc.* | | | 43,554 | |
| | 3,450 | | Tandem Diabetes Care, Inc.* | | | 294,596 | |
| | 4,863 | | Zynex, Inc.* | | | 74,015 | |
| | | | | | | 936,933 | |
| | | | Health Care Providers & Services – 1.7% | | | | |
| | 1,120 | | AMN Healthcare Services, Inc.* | | | 99,344 | |
| | 290 | | Fulgent Genetics, Inc.* | | | 21,480 | |
| | 759 | | The Joint Corp.* | | | 53,950 | |
| | 2,740 | | Progyny, Inc.* | | | 175,470 | |
| | | | | | | 350,244 | |
| | | | Health Care Technology – 0.8% | | | | |
| | 1,560 | | Evolent Health, Inc. – Class A* | | | 30,311 | |
| | 7,802 | | NextGen Healthcare, Inc.* | | | 128,109 | |
| | | | | | | 158,420 | |
| | | | Life Sciences Tools & Services – 2.2% | | | | |
| | 6,040 | | Bionano Genomics, Inc.* | | | 37,267 | |
| | 1,370 | | Bruker Corp. | | | 95,133 | |
| | 5,047 | | Codexis, Inc.* | | | 103,463 | |
| | 440 | | Medpace Holdings, Inc.* | | | 73,506 | |
| | 2,300 | | Personalis, Inc.* | | | 51,727 | |
| | 470 | | Quanterix Corp.* | | | 24,200 | |
| | 380 | | Repligen Corp.* | | | 69,392 | |
| | | | | | | 454,688 | |
See accompanying Notes to Financial Statements.
North Square Dynamic Small Cap Fund
SCHEDULE OF INVESTMENTS – Continued
As of May 31, 2021
| Number | | | | | |
| of Shares | | | | Value | |
| | | COMMON STOCKS (Continued) | | | |
| | | | | | |
| | | HEALTH CARE (Continued) | | | |
| | | | | | |
| | | Pharmaceuticals – 1.6% | | | |
| | 11,220 | | Amneal Pharmaceuticals, Inc.* | | $ | 63,505 | |
| | 7,850 | | Antares Pharma, Inc.* | | | 31,164 | |
| | 41,750 | | BioDelivery Sciences International, Inc.* | | | 147,378 | |
| | 2,710 | | Phibro Animal Health Corp. – Class A | | | 76,395 | |
| | | | | | | 318,442 | |
| | | | TOTAL HEALTH CARE | | | 3,255,945 | |
| | | | | | | | |
| | | | INDUSTRIALS – 17.7% | | | | |
| | | | | | | | |
| | | | Aerospace & Defense – 0.1% | | | | |
| | 220 | | HEICO Corp. | | | 30,901 | |
| | | | | | | | |
| | | | Building Products – 0.8% | | | | |
| | 930 | | Trex Co, Inc.* | | | 90,591 | |
| | 830 | | UFP Industries, Inc. | | | 66,002 | |
| | | | | | | 156,593 | |
| | | | Commercial Services & Supplies – 1.6% | | | | |
| | 5,760 | | HNI Corp. | | | 262,771 | |
| | 2,610 | | Knoll, Inc. | | | 67,860 | |
| | | | | | | 330,631 | |
| | | | Construction & Engineering – 1.4% | | | | |
| | 3,050 | | Ameresco, Inc. – Class A* | | | 163,968 | |
| | 919 | | NV5 Global, Inc.* | | | 83,932 | |
| | 1,980 | | Tutor Perini Corp.* | | | 30,651 | |
| | | | | | | 278,551 | |
| | | | Electrical Equipment – 3.3% | | | | |
| | 3,210 | | Bloom Energy Corp. – Class A* | | | 77,586 | |
| | 3,150 | | Encore Wire Corp. | | | 258,930 | |
| | 1,360 | | FuelCell Energy, Inc.* | | | 13,355 | |
| | 20,480 | | GrafTech International Ltd. | | | 271,974 | |
| | 1,773 | | Plug Power, Inc.* | | | 54,431 | |
| | | | | | | 676,276 | |
| | | | Machinery – 0.8% | | | | |
| | 280 | | Allison Transmission Holdings, Inc. | | | 11,847 | |
| | 3,120 | | Mueller Industries, Inc. | | | 144,862 | |
| | | | | | | 156,709 | |
| | | | Professional Services – 3.2% | | | | |
| | 870 | | ASGN, Inc.* | | | 89,688 | |
| | 750 | | Exponent, Inc. | | | 68,422 | |
| | 630 | | FTI Consulting, Inc.* | | | 86,657 | |
| | 390 | | Insperity, Inc. | | | 35,954 | |
| | 750 | | Kforce, Inc. | | | 47,033 | |
| | 1,110 | | ManpowerGroup, Inc. | | | 134,299 | |
| | 2,240 | | TriNet Group, Inc.* | | | 168,762 | |
| | 870 | | TrueBlue, Inc.* | | | 23,603 | |
| | | | | | | 654,418 | |
See accompanying Notes to Financial Statements.
North Square Dynamic Small Cap Fund
SCHEDULE OF INVESTMENTS – Continued
As of May 31, 2021
| Number | | | | | |
| of Shares | | | | Value | |
| | | COMMON STOCKS (Continued) | | | |
| | | | | | |
| | | INDUSTRIALS (Continued) | | | |
| | | | | | |
| | | Trading Companies & Distributors – 6.5% | | | |
| | 1,810 | | BlueLinx Holdings, Inc.* | | $ | 91,224 | |
| | 2,010 | | Boise Cascade Co. | | | 132,640 | |
| | 6,130 | | CAI International, Inc. | | | 263,099 | |
| | 4,910 | | H&E Equipment Services, Inc. | | | 183,634 | |
| | 2,823 | | McGrath RentCorp | | | 242,016 | |
| | 210 | | SiteOne Landscape Supply, Inc.* | | | 36,128 | |
| | 3,300 | | Textainer Group Holdings Ltd.*2 | | | 111,210 | |
| | 6,800 | | Univar Solutions, Inc.* | | | 184,212 | |
| | 1,180 | | Veritiv Corp.* | | | 72,476 | |
| | | | | | | 1,316,639 | |
| | | | TOTAL INDUSTRIALS | | | 3,600,718 | |
| | | | | | | | |
| | | | INFORMATION TECHNOLOGY – 11.5% | | | | |
| | | | | | | | |
| | | | Communications Equipment – 1.3% | | | | |
| | 1,150 | | Aviat Networks, Inc.* | | | 42,504 | |
| | 4,810 | | Calix, Inc.* | | | 213,131 | |
| | | | | | | 255,635 | |
| | | | Electronic Equipment, Instruments & Components – 0.7% | | | | |
| | 3,340 | | Arlo Technologies, Inc.* | | | 22,412 | |
| | 1,209 | | ePlus, Inc.* | | | 114,335 | |
| | | | | | | 136,747 | |
| | | | IT Services – 0.0% | | | | |
| | 272 | | BM Technologies, Inc.* | | | 3,495 | |
| | | | | | | | |
| | | | Semiconductors & Semiconductor Equipment – 2.1% | | | | |
| | 4,210 | | Axcelis Technologies, Inc.* | | | 174,462 | |
| | 3,400 | | Cirrus Logic, Inc.* | | | 265,438 | |
| | | | | | | 439,900 | |
| | | | Software – 6.1% | | | | |
| | 1,900 | | A10 Networks, Inc.* | | | 18,487 | |
| | 8,310 | | Avaya Holdings Corp.* | | | 238,330 | |
| | 15,880 | | Box, Inc. – Class A* | | | 370,163 | |
| | 4,430 | | CommVault Systems, Inc.* | | | 337,433 | |
| | 1,320 | | Dolby Laboratories, Inc. – Class A | | | 128,753 | |
| | 1,060 | | Manhattan Associates, Inc.* | | | 144,139 | |
| | | | | | | 1,237,305 | |
| | | | Technology Hardware, Storage & Peripherals – 1.4% | | | | |
| | 2,890 | | Pure Storage, Inc. – Class A* | | | 55,055 | |
| | 3,170 | | Quantum Corp.* | | | 23,807 | |
| | 5,760 | | Super Micro Computer, Inc.* | | | 200,102 | |
| | | | | | | 278,964 | |
| | | | TOTAL INFORMATION TECHNOLOGY | | | 2,352,046 | |
| | | | | | | | |
| | | | MATERIALS – 4.1% | | | | |
| | | | | | | | |
| | | | Chemicals – 0.9% | | | | |
| | 2,810 | | Amyris, Inc.* | | | 39,986 | |
| | 3,980 | | Livent Corp.* | | | 77,650 | |
See accompanying Notes to Financial Statements.
North Square Dynamic Small Cap Fund
SCHEDULE OF INVESTMENTS – Continued
As of May 31, 2021
| Number | | | | | |
| of Shares | | | | Value | |
| | | COMMON STOCKS (Continued) | | | |
| | | | | | |
| | | MATERIALS (Continued) | | | |
| | | | | | |
| | | Chemicals (Continued) | | | |
| | 3,430 | | Orion Engineered Carbons SA*2 | | $ | 69,423 | |
| | | | | | | 187,059 | |
| | | | Construction Materials – 1.1% | | | | |
| | 6,230 | | Summit Materials, Inc. – Class A* | | | 216,929 | |
| | | | | | | | |
| | | | Containers & Packaging – 1.1% | | | | |
| | 5,310 | | Silgan Holdings, Inc. | | | 223,710 | |
| | | | | | | | |
| | | | Metals & Mining – 0.6% | | | | |
| | 6,030 | | Cleveland-Cliffs, Inc.* | | | 121,324 | |
| | | | | | | | |
| | | | Paper & Forest Products – 0.4% | | | | |
| | 4,759 | | Mercer International, Inc. | | | 70,624 | |
| | 910 | | Verso Corp. – Class A | | | 15,479 | |
| | | | | | | 86,103 | |
| | | | TOTAL MATERIALS | | | 835,125 | |
| | | | | | | | |
| | | | REAL ESTATE – 0.5% | | | | |
| | | | | | | | |
| | | | Real Estate Management & Development – 0.5% | | | | |
| | 3,330 | | eXp World Holdings, Inc.* | | | 107,426 | |
| | | | TOTAL REAL ESTATE | | | 107,426 | |
| | | | | | | | |
| | | | UTILITIES – 1.0% | | | | |
| | | | | | | | |
| | | | Independent Power & Renewable Electricity Producers – 0.6% | | | | |
| | 4,390 | | Sunnova Energy International, Inc.* | | | 128,188 | |
| | | | | | | | |
| | | | Water Utilities – 0.4% | | | | |
| | 890 | | American States Water Co. | | | 70,639 | |
| | | | TOTAL UTILITIES | | | 198,827 | |
| | | | TOTAL COMMON STOCKS | | | | |
| | | | (Cost $16,947,727) | | | 19,408,285 | |
| | | | | | | | |
| | | | REAL ESTATE INVESTMENT TRUSTS (REITS) – 3.0% | | | | |
| | 5,310 | | Ashford Hospitality Trust, Inc.* | | | 21,505 | |
| | 6,120 | | CareTrust REIT, Inc. | | | 142,474 | |
| | 420 | | Community Healthcare Trust, Inc. | | | 19,858 | |
| | 3,750 | | Easterly Government Properties, Inc. | | | 77,737 | |
| | 1,170 | | Innovative Industrial Properties, Inc. | | | 210,869 | |
| | 500 | | National Storage Affiliates Trust | | | 23,050 | |
| | 4,780 | | RLJ Lodging Trust | | | 73,469 | |
| | 700 | | Safehold, Inc. | | | 49,070 | |
| | | | TOTAL REITS | | | | |
| | | | (Cost $504,374) | | | 618,032 | |
| | | | | | | | |
| | | | RIGHTS – 0.0% | | | | |
| | 7,920 | | NewStar Financial, Inc. CVR*1 | | | 818 | |
| | | | TOTAL RIGHTS | | | | |
| | | | (Cost $0) | | | 818 | |
See accompanying Notes to Financial Statements.
North Square Dynamic Small Cap Fund
SCHEDULE OF INVESTMENTS – Continued
As of May 31, 2021
| Number | | | | | |
| of Shares | | | | Value | |
| | | SHORT-TERM INVESTMENT – 1.5% | | | |
| | 295,133 | | First American Treasury Obligations Fund – Class X, 0.02%3 | | $ | 295,133 | |
| | | | TOTAL SHORT-TERM INVESTMENT | | | | |
| | | | (Cost $295,133) | | | 295,133 | |
| | | | TOTAL INVESTMENTS – 99.8% | | | | |
| | | | (Cost $17,747,234) | | | 20,322,268 | |
| | | | Other Assets in Excess of Liabilities – 0.2% | | | 46,739 | |
| | | | TOTAL NET ASSETS – 100.0% | | $ | 20,369,007 | |
PLC – Public Limited Company
| * | Non-Income producing security. |
1 | Level 3 securities fair valued under procedures established by the Board of Trustees, represents 0.004% of Net Assets. The total value of these securities is $818. |
2 | Foreign security denominated in U.S. Dollars. |
3 | The rate is the annualized seven-day yield at period end. |
Investments are classified by industry pursuant to the Global Industry Classification Standard (GICS®), which was developed by and/or is the exclusive property of Morgan Stanley Capital International, Inc. (“MSCI”) and Standard & Poor’s Financial Services LLC (“S&P”). GICS is a service mark of MSCI and S&P and has been licensed for use by U.S. Bancorp Fund Services, LLC.
See accompanying Notes to Financial Statements.
North Square Dynamic Small Cap Fund
SUMMARY OF INVESTMENTS
As of May 31, 2021
| | Percent of Total |
| Security Type/Sector | Net Assets |
| Common Stocks | | | |
| Consumer Discretionary | | 21.1% | |
| Industrials | | 17.7% | |
| Health Care | | 16.0% | |
| Information Technology | | 11.5% | |
| Financials | | 10.1% | |
| Consumer Staples | | 7.2% | |
| Materials | | 4.1% | |
| Energy | | 3.1% | |
| Communication Services | | 3.0% | |
| Utilities | | 1.0% | |
| Real Estate | | 0.5% | |
| Total Common Stocks | | 95.3% | |
| REITs | | 3.0% | |
| Rights | | 0.0% | |
| Short-Term Investment | | 1.5% | |
| Total Investments | | 99.8% | |
| Other Assets in Excess of Liabilities | | 0.2% | |
| Total Net Assets | | 100.0% | |
See accompanying Notes to Financial Statements.
North Square Oak Ridge All Cap Growth Fund
SCHEDULE OF INVESTMENTS
As of May 31, 2021
| Number | | | | | |
| of Shares | | | | Value | |
| | | COMMON STOCKS – 94.1% | | | |
| | | | | | |
| | | COMMUNICATION SERVICES – 15.1% | | | |
| | | | | | |
| | | Entertainment – 1.7% | | | |
| | 682 | | Activision Blizzard, Inc. | | $ | 66,325 | |
| | 278 | | Netflix Inc.* | | | 139,781 | |
| | | | | | | 206,106 | |
| | | | Interactive Media & Services – 12.7% | | | | |
| | 131 | | Alphabet Inc. – Class A* | | | 308,747 | |
| | 213 | | Alphabet Inc. – Class C* | | | 513,662 | |
| | 1,997 | | Facebook, Inc. – Class A* | | | 656,474 | |
| | 1,638 | | Pinterest, Inc. – Class A* | | | 106,962 | |
| | | | | | | 1,585,845 | |
| | | | Media – 0.7% | | | | |
| | 131 | | Charter Communications, Inc. – Class A* | | | 90,983 | |
| | | | TOTAL COMMUNICATION SERVICES | | | 1,882,934 | |
| | | | | | | | |
| | | | CONSUMER DISCRETIONARY – 11.3% | | | | |
| | | | | | | | |
| | | | Internet & Direct Marketing Retail – 7.3% | | | | |
| | 792 | | Alibaba Group Holding Ltd. – ADR*1 | | | 169,457 | |
| | 230 | | Amazon.com, Inc.* | | | 741,306 | |
| | | | | | | 910,763 | |
| | | | Leisure Products – 1.0% | | | | |
| | 1,355 | | YETI Holdings, Inc.* | | | 118,698 | |
| | | | | | | | |
| | | | Specialty Retail – 2.1% | | | | |
| | 2,057 | | Ross Stores, Inc. | | | 259,984 | |
| | | | | | | | |
| | | | Textiles, Apparel & Luxury Goods – 0.9% | | | | |
| | 1,435 | | VF Corp. | | | 114,398 | |
| | | | TOTAL CONSUMER DISCRETIONARY | | | 1,403,843 | |
| | | | | | | | |
| | | | CONSUMER STAPLES – 3.0% | | | | |
| | | | | | | | |
| | | | Food & Staples Retailing – 2.5% | | | | |
| | 813 | | Costco Wholesale Corp. | | | 307,533 | |
| | | | | | | | |
| | | | Personal Products – 0.5% | | | | |
| | 1,179 | | Unilever PLC – ADR1 | | | 70,705 | |
| | | | TOTAL CONSUMER STAPLES | | | 378,238 | |
| | | | | | | | |
| | | | FINANCIALS – 2.2% | | | | |
| | | | | | | | |
| | | | Capital Markets – 1.6% | | | | |
| | 1,764 | | Intercontinental Exchange, Inc. | | | 199,121 | |
| | | | | | | | |
| | | | Insurance – 0.6% | | | | |
| | 578 | | Marsh & McLennan Cos, Inc. | | | 79,966 | |
| | | | TOTAL FINANCIALS | | | 279,087 | |
| | | | | | | | |
| | | | HEALTH CARE – 13.9% | | | | |
| | | | | | | | |
| | | | Biotechnology – 1.4% | | | | |
| | 607 | | Alexion Pharmaceuticals, Inc.* | | | 107,166 | |
| | 690 | | Horizon Therapeutics PLC*1 | | | 63,245 | |
| | | | | | | 170,411 | |
See accompanying Notes to Financial Statements.
North Square Oak Ridge All Cap Growth Fund
SCHEDULE OF INVESTMENTS – Continued
As of May 31, 2021
| Number | | | | | |
| of Shares | | | | Value | |
| | | COMMON STOCKS (Continued) | | | |
| | | | | | |
| | | HEALTH CARE (Continued) | | | |
| | | | | | |
| | | Health Care Equipment & Supplies – 5.3% | | | |
| | 974 | | Abbott Laboratories | | $ | 113,617 | |
| | 1,058 | | Danaher Corp. | | | 270,996 | |
| | 813 | | Edwards Lifesciences Corp.* | | | 77,967 | |
| | 564 | | Stryker Corp. | | | 143,972 | |
| | 140 | | Teleflex, Inc. | | | 56,307 | |
| | | | | | | 662,859 | |
| | | | Health Care Providers & Services – 3.3% | | | | |
| | 498 | | LHC Group, Inc.* | | | 98,032 | |
| | 773 | | UnitedHealth Group Inc. | | | 318,414 | |
| | | | | | | 416,446 | |
| | | | Health Care Technology – 0.6% | | | | |
| | 411 | | Inspire Medical Systems, Inc.* | | | 79,857 | |
| | | | | | | | |
| | | | Life Sciences Tools & Services – 0.4% | | | | |
| | 1,057 | | NeoGenomics, Inc.* | | | 43,369 | |
| | | | | | | | |
| | | | Pharmaceuticals – 2.9% | | | | |
| | 1,759 | | Bristol-Myers Squibb Co. | | | 115,601 | |
| | 1,220 | | Eli Lilly & Co. | | | 243,683 | |
| | | | | | | 359,284 | |
| | | | TOTAL HEALTH CARE | | | 1,732,226 | |
| | | | | | | | |
| | | | INDUSTRIALS – 3.6% | | | | |
| | | | | | | | |
| | | | Aerospace & Defense – 1.2% | | | | |
| | 235 | | TransDigm Group, Inc.* | | | 152,477 | |
| | | | | | | | |
| | | | Industrial Conglomerates – 0.9% | | | | |
| | 251 | | Roper Technologies, Inc. | | | 112,953 | |
| | | | | | | | |
| | | | Professional Services – 1.0% | | | | |
| | 711 | | Verisk Analytics, Inc. | | | 122,882 | |
| | | | | | | | |
| | | | Road & Rail – 0.5% | | | | |
| | 266 | | Saia, Inc.* | | | 61,223 | |
| | | | TOTAL INDUSTRIALS | | | 449,535 | |
| | | | | | | | |
| | | | INFORMATION TECHNOLOGY – 43.3% | | | | |
| | | | | | | | |
| | | | IT Services – 10.6% | | | | |
| | 934 | | EPAM Systems, Inc.* | | | 446,078 | |
| | 652 | | Fidelity National Information Services, Inc. | | | 97,135 | |
| | 666 | | Mastercard Inc. – Class A | | | 240,146 | |
| | 875 | | PayPal Holdings, Inc.* | | | 227,518 | |
| | 1,370 | | Visa Inc. – Class A | | | 311,401 | |
| | | | | | | 1,322,278 | |
| | | | Semiconductors & Semiconductor Equipment – 5.1% | | | | |
| | 227 | | Broadcom Inc. | | | 107,219 | |
| | 414 | | KLA Corp. | | | 131,192 | |
| | 387 | | NVIDIA Corp. | | | 251,465 | |
| | 1,035 | | QUALCOMM, Inc. | | | 139,249 | |
| | | | | | | 629,125 | |
See accompanying Notes to Financial Statements.
North Square Oak Ridge All Cap Growth Fund
SCHEDULE OF INVESTMENTS – Continued
As of May 31, 2021
| Number | | | | | |
| of Shares | | | | Value | |
| | | COMMON STOCKS (Continued) | | | |
| | | | | | |
| | | INFORMATION TECHNOLOGY (Continued) | | | |
| | | | | | |
| | | Software – 16.6% | | | |
| | 385 | | Adobe, Inc.* | | $ | 194,263 | |
| | 324 | | ANSYS, Inc.* | | | 109,493 | |
| | 755 | | Five9, Inc.* | | | 133,710 | |
| | 746 | | Fortinet, Inc.* | | | 163,031 | |
| | 289 | | Intuit, Inc. | | | 126,897 | |
| | 4,200 | | Microsoft Corp. | | | 1,048,656 | |
| | 838 | | salesforce.com, Inc.* | | | 199,528 | |
| | 206 | | ServiceNow, Inc.* | | | 97,619 | |
| | | | | | | 2,073,197 | |
| | | | Technology Hardware, Storage & Peripherals – 11.0% | | | | |
| | 11,013 | | Apple Inc. | | | 1,372,330 | |
| | | | TOTAL INFORMATION TECHNOLOGY | | | 5,396,930 | |
| | | | | | | | |
| | | | MATERIALS – 1.7% | | | | |
| | | | | | | | |
| | | | Chemicals – 1.7% | | | | |
| | 955 | | Ecolab Inc. | | | 205,401 | |
| | | | TOTAL MATERIALS | | | 205,401 | |
| | | | TOTAL COMMON STOCKS | | | | |
| | | | (Cost $5,416,468) | | | 11,728,194 | |
| | | | | | | | |
| | | | REAL ESTATE INVESTMENT TRUST (REIT) – 0.9% | | | | |
| | 149 | | Equinix, Inc. | | | 109,772 | |
| | | | TOTAL REIT | | | | |
| | | | (Cost $79,151) | | | 109,772 | |
| | | | | | | | |
| | | | SHORT-TERM INVESTMENT – 5.1% | | | | |
| | 638,810 | | First American Treasury Obligations Fund – Class X, 0.02%2 | | | 638,810 | |
| | | | TOTAL SHORT-TERM INVESTMENT | | | | |
| | | | (Cost $638,810) | | | 638,810 | |
| | | | TOTAL INVESTMENTS – 100.1% | | | | |
| | | | (Cost $6,134,429) | | | 12,476,776 | |
| | | | Liabilities in Excess of Other Assets – (0.1)% | | | (13,770 | ) |
| | | | TOTAL NET ASSETS – 100.0% | | $ | 12,463,006 | |
ADR – American Depositary Receipt
PLC – Public Limited Company
| * | Non-Income producing security. |
1 | Foreign security denominated in U.S. Dollars. |
2 | The rate is the annualized seven-day yield at period end. |
Investments are classified by industry pursuant to the Global Industry Classification Standard (GICS®), which was developed by and/or is the exclusive property of Morgan Stanley Capital International, Inc. (“MSCI”) and Standard & Poor’s Financial Services LLC (“S&P”). GICS is a service mark of MSCI and S&P and has been licensed for use by U.S. Bancorp Fund Services, LLC.
See accompanying Notes to Financial Statements.
North Square Oak Ridge All Cap Growth Fund
SUMMARY OF INVESTMENTS
As of May 31, 2021
| | Percent of Total |
| Security Type/Sector | Net Assets |
| Common Stocks | | | |
| Information Technology | | 43.3% | |
| Communication Services | | 15.1% | |
| Health Care | | 13.9% | |
| Consumer Discretionary | | 11.3% | |
| Industrials | | 3.6% | |
| Consumer Staples | | 3.0% | |
| Financials | | 2.2% | |
| Materials | | 1.7% | |
| Total Common Stocks | | 94.1% | |
| REIT | | 0.9% | |
| Short-Term Investment | | 5.1% | |
| Total Investments | | 100.1% | |
| Liabilities in Excess of Other Assets | | (0.1)% | |
| Total Net Assets | | 100.0% | |
See accompanying Notes to Financial Statements.
North Square Multi Strategy Fund
SCHEDULE OF INVESTMENTS
As of May 31, 2021
| Number | | | | | |
| of Shares | | | | Value | |
| | | MUTUAL FUNDS – 98.1% | | | |
| | 304,971 | | North Square Advisory Research All Cap Value Fund – Class I1 | | $ | 3,508,534 | |
| | 100,109 | | North Square Altrinsic International Equity Fund – Class I1 | | | 1,114,354 | |
| | 1,032,441 | | North Square Dynamic Small Cap Fund – Class I1 | | | 18,865,796 | |
| | 150,441 | | North Square McKee Bond Fund – Class I1 | | | 1,491,593 | |
| | 567,875 | | North Square Oak Ridge All Cap Growth Fund – Class I1 | | | 11,873,010 | |
| | 620,914 | | North Square Oak Ridge Dividend Growth Fund – Class I1 | | | 14,480,760 | |
| | 121,291 | | North Square Strategic Income Fund – Class I1 | | | 1,221,663 | |
| | 196,236 | | Wavelength Interest Rate Neutral Fund | | | 2,156,634 | |
| | | | TOTAL MUTUAL FUNDS | | | | |
| | | | (Cost $36,473,193) | | | 54,712,344 | |
| | | | | | | | |
| | | | SHORT-TERM INVESTMENT – 2.3% | | | | |
| | 1,266,222 | | First American Treasury Obligations Fund – Class X, 0.02%2 | | | 1,266,222 | |
| | | | TOTAL SHORT-TERM INVESTMENT | | | | |
| | | | (Cost $1,266,222) | | | 1,266,222 | |
| | | | TOTAL INVESTMENTS – 100.4% | | | | |
| | | | (Cost $37,739,415) | | | 55,978,566 | |
| | | | Liabilities in Excess of Other Assets – (0.4)% | | | (246,236 | ) |
| | | | TOTAL NET ASSETS – 100.0% | | $ | 55,732,330 | |
1 | Affiliated company. See Note 11. |
2 | The rate is the annualized seven-day yield at period end. |
Investments are classified by industry pursuant to the Global Industry Classification Standard (GICS®), which was developed by and/or is the exclusive property of Morgan Stanley Capital International, Inc. (“MSCI”) and Standard & Poor’s Financial Services LLC (“S&P”). GICS is a service mark of MSCI and S&P and has been licensed for use by U.S. Bancorp Fund Services, LLC.
See accompanying Notes to Financial Statements.
North Square Multi Strategy Fund
SUMMARY OF INVESTMENTS
As of May 31, 2021
| | Percent of Total |
| Security Type/Sector | Net Assets |
| Mutual Funds | | 98.1% | |
| Short-Term Investment | | 2.3% | |
| Total Investments | | 100.4% | |
| Liabilities in Excess of Other Assets | | (0.4)% | |
| Total Net Assets | | 100.0% | |
See accompanying Notes to Financial Statements.
North Square Oak Ridge Dividend Growth Fund
SCHEDULE OF INVESTMENTS
As of May 31, 2021
| Number | | | | | |
| of Shares | | | | Value | |
| | | COMMON STOCKS – 96.6% | | | |
| | | | | | |
| | | CONSUMER DISCRETIONARY – 13.0% | | | |
| | | | | | |
| | | Multiline Retail – 5.6% | | | |
| | 4,006 | | Target Corp. | | $ | 909,042 | |
| | | | | | | | |
| | | | Specialty Retail – 6.0% | | | | |
| | 1,839 | | The Home Depot, Inc. | | | 586,475 | |
| | 5,674 | | The TJX Co., Inc. | | | 383,222 | |
| | | | | | | 969,697 | |
| | | | Textiles, Apparel & Luxury Goods – 1.4% | | | | |
| | 2,752 | | VF Corp. | | | 219,389 | |
| | | | TOTAL CONSUMER DISCRETIONARY | | | 2,098,128 | |
| | | | | | | | |
| | | | CONSUMER STAPLES – 1.7% | | | | |
| | | | | | | | |
| | | | Personal Products – 1.7% | | | | |
| | 4,562 | | Unilever PLC – ADR1 | | | 273,583 | |
| | | | TOTAL CONSUMER STAPLES | | | 273,583 | |
| | | | | | | | |
| | | | ENERGY – 6.1% | | | | |
| | | | | | | | |
| | | | Oil, Gas & Consumable Fuels – 6.1% | | | | |
| | 20,936 | | Enterprise Products Partners LP | | | 494,299 | |
| | 27,376 | | Kinder Morgan, Inc. | | | 502,076 | |
| | | | | | | 996,375 | |
| | | | TOTAL ENERGY | | | 996,375 | |
| | | | | | | | |
| | | | FINANCIALS – 16.0% | | | | |
| | | | | | | | |
| | | | Banks – 4.5% | | | | |
| | 4,477 | | JPMorgan Chase & Co. | | | 735,302 | |
| | | | | | | | |
| | | | Capital Markets – 11.5% | | | | |
| | 781 | | BlackRock, Inc. | | | 684,968 | |
| | 8,012 | | The Blackstone Group Inc. – Class A | | | 742,472 | |
| | 1,982 | | CME Group Inc. | | | 433,583 | |
| | | | | | | 1,861,023 | |
| | | | TOTAL FINANCIALS | | | 2,596,325 | |
| | | | | | | | |
| | | | HEALTH CARE – 13.0% | | | | |
| | | | | | | | |
| | | | Biotechnology – 2.8% | | | | |
| | 4,070 | | AbbVie Inc. | | | 460,724 | |
| | | | | | | | |
| | | | Health Care Providers & Services – 3.8% | | | | |
| | 1,497 | | UnitedHealth Group Inc. | | | 616,644 | |
| | | | | | | | |
| | | | Pharmaceuticals – 6.4% | | | | |
| | 6,581 | | Bristol-Myers Squibb Co. | | | 432,503 | |
| | 2,994 | | Eli Lilly & Co. | | | 598,022 | |
| | | | | | | 1,030,525 | |
| | | | TOTAL HEALTH CARE | | | 2,107,893 | |
See accompanying Notes to Financial Statements.
North Square Oak Ridge Dividend Growth Fund
SCHEDULE OF INVESTMENTS – Continued
As of May 31, 2021
| Number | | | | | |
| of Shares | | | | Value | |
| | | COMMON STOCKS (Continued) | | | |
| | | | | | |
| | | INDUSTRIALS – 9.7% | | | |
| | | | | | |
| | | Machinery – 6.3% | | | |
| | 2,027 | | Illinois Tool Works, Inc. | | $ | 469,778 | |
| | 2,509 | | Stanley Black & Decker, Inc. | | | 543,951 | |
| | | | | | | 1,013,729 | |
| | | | Trading Companies & Distributors – 3.4% | | | | |
| | 1,896 | | Watsco, Inc. | | | 552,494 | |
| | | | TOTAL INDUSTRIALS | | | 1,566,223 | |
| | | | | | | | |
| | | | INFORMATION TECHNOLOGY – 32.1% | | | | |
| | | | | | | | |
| | | | Electronic Equipment, Instruments & Components – 3.2% | | | | |
| | 11,998 | | Corning, Inc. | | | 523,473 | |
| | | | | | | | |
| | | | IT Services – 4.7% | | | | |
| | 2,937 | | Fidelity National Information Services, Inc. | | | 437,554 | |
| | 1,407 | | Visa Inc. – Class A | | | 319,811 | |
| | | | | | | 757,365 | |
| | | | Semiconductors & Semiconductor Equipment – 13.4% | | | | |
| | 1,411 | | Broadcom Inc. | | | 666,458 | |
| | 6,517 | | Intel Corp. | | | 372,251 | |
| | 5,646 | | QUALCOMM, Inc. | | | 759,613 | |
| | 2,133 | | Skyworks Solutions, Inc. | | | 362,610 | |
| | | | | | | 2,160,932 | |
| | | | Software – 6.7% | | | | |
| | 4,344 | | Microsoft Corp. | | | 1,084,610 | |
| | | | | | | | |
| | | | Technology Hardware, Storage & Peripherals – 4.1% | | | | |
| | 5,351 | | Apple Inc. | | | 666,788 | |
| | | | TOTAL INFORMATION TECHNOLOGY | | | 5,193,168 | |
| | | | | | | | |
| | | | MATERIALS – 5.0% | | | | |
| | | | | | | | |
| | | | Chemicals – 2.5% | | | | |
| | 1,340 | | Linde PLC1 | | | 402,804 | |
| | | | | | | | |
| | | | Metals & Mining – 2.5% | | | | |
| | 5,439 | | Newmont Corp. | | | 399,658 | |
| | | | TOTAL MATERIALS | | | 802,462 | |
| | | | TOTAL COMMON STOCKS | | | | |
| | | | (Cost $9,425,863) | | | 15,634,157 | |
| | | | | | | | |
| | | | REAL ESTATE INVESTMENT TRUST (REIT) – 3.1% | | | | |
| | 4,234 | | Prologis, Inc. | | | 498,935 | |
| | | | TOTAL REIT | | | | |
| | | | (Cost $397,436) | | | 498,935 | |
See accompanying Notes to Financial Statements.
North Square Oak Ridge Dividend Growth Fund
SCHEDULE OF INVESTMENTS – Continued
As of May 31, 2021
| Number | | | | | |
| of Shares | | | | Value | |
| | | SHORT-TERM INVESTMENT – 0.3% | | | |
| | 56,067 | | First American Treasury Obligations Fund – Class X, 0.02%2 | | $ | 56,067 | |
| | | | TOTAL SHORT-TERM INVESTMENT | | | | |
| | | | (Cost $56,067) | | | 56,067 | |
| | | | TOTAL INVESTMENTS – 100.0% | | | | |
| | | | (Cost $9,879,366) | | | 16,189,159 | |
| | | | Liabilities in Excess of Other Assets – (0.0)% | | | (2,831 | ) |
| | | | TOTAL NET ASSETS – 100.0% | | $ | 16,186,328 | |
ADR – American Depositary Receipt
PLC – Public Limited Company
1 | Foreign security denominated in U.S. Dollars. |
2 | The rate is the annualized seven-day yield at period end. |
Investments are classified by industry pursuant to the Global Industry Classification Standard (GICS®), which was developed by and/or is the exclusive property of Morgan Stanley Capital International, Inc. (“MSCI”) and Standard & Poor’s Financial Services LLC (“S&P”). GICS is a service mark of MSCI and S&P and has been licensed for use by U.S. Bancorp Fund Services, LLC.
See accompanying Notes to Financial Statements.
North Square Oak Ridge Dividend Growth Fund
SUMMARY OF INVESTMENTS
As of May 31, 2021
| | Percent of Total |
| Security Type/Sector | Net Assets |
| Common Stocks | | | |
| Information Technology | | 32.1% | |
| Financials | | 16.0% | |
| Health Care | | 13.0% | |
| Consumer Discretionary | | 13.0% | |
| Industrials | | 9.7% | |
| Energy | | 6.1% | |
| Materials | | 5.0% | |
| Consumer Staples | | 1.7% | |
| Total Common Stocks | | 96.6% | |
| REIT | | 3.1% | |
| Short-Term Investment | | 0.3% | |
| Total Investments | | 100.0% | |
| Liabilities in Excess of Other Assets | | (0.0)% | |
| Total Net Assets | | 100.0% | |
See accompanying Notes to Financial Statements.
STATEMENTS OF ASSETS AND LIABILITIES
As of May 31, 2021
| | | North Square | | | | | | North Square | |
| | | Oak Ridge | | | North Square | | | Oak Ridge | |
| | | Small Cap | | | Dynamic | | | All Cap | |
| | | Growth Fund | | | Small Cap Fund | | | Growth Fund | |
| Assets: | | | | | | | | | |
| Investments, at cost | | $ | 95,084,753 | | | $ | 17,747,234 | | | $ | 6,134,429 | |
| Investments, at value | | $ | 148,749,561 | | | $ | 20,322,268 | | | $ | 12,476,776 | |
| Receivables: | | | | | | | | | | | | |
| Fund shares sold | | | 22,572 | | | | 2,803 | | | | — | |
| Dividends and interest | | | 8,822 | | | | 10,204 | | | | 5,293 | |
| Investment securities sold | | | — | | | | 69,382 | | | | — | |
| Prepaid expenses | | | 27,570 | | | | 9,603 | | | | 11,549 | |
| Total assets | | | 148,808,525 | | | | 20,414,260 | | | | 12,493,618 | |
| | | | | | | | | | | | | |
| Liabilities: | | | | | | | | | | | | |
| Payables: | | | | | | | | | | | | |
| Fund shares redeemed | | | 90,547 | | | | — | | | | — | |
| Accrued expenses: | | | | | | | | | | | | |
| Due to Advisor (Note 4) | | | 70,529 | | | | 8,552 | | | | 5,764 | |
| Auditing fees | | | 79,371 | | | | 9,126 | | | | 10,300 | |
| Fund administration fees | | | 52,970 | | | | 7,672 | | | | 4,986 | |
| Legal fees | | | 32,011 | | | | 5,150 | | | | 1,914 | |
| Transfer agent fees | | | 19,338 | | | | 3,729 | | | | 2,563 | |
| Distribution fees (Note 7) | | | 18,410 | | | | — | | | | — | |
| Due to Trustees | | | 16,888 | | | | 2,308 | | | | 1,370 | |
| Shareholder servicing fees (Note 6) | | | 5,661 | | | | 3,544 | | | | 1,814 | |
| Chief Compliance Officer fees (Note 4) | | | 121 | | | | 88 | | | | 33 | |
| Accrued other expenses | | | 10,681 | | | | 5,084 | | | | 1,868 | |
| Total liabilities | | | 396,527 | | | | 45,253 | | | | 30,612 | |
| | | | | | | | | | | | | |
| Net Assets | | $ | 148,411,998 | | | $ | 20,369,007 | | | $ | 12,463,006 | |
| | | | | | | | | | | | | |
| Components of Net Assets: | | | | | | | | | | | | |
| Paid-in capital (par value of $0.01 per share | | | | | | | | | | | | |
| with an unlimited number of shares authorized) | | $ | 82,391,480 | | | $ | 12,750,607 | | | $ | 4,382,751 | |
| Total distributable earnings | | | 66,020,518 | | | | 7,618,400 | | | | 8,080,255 | |
| Net Assets | | $ | 148,411,998 | | | $ | 20,369,007 | | | $ | 12,463,006 | |
See accompanying Notes to Financial Statements.
STATEMENTS OF ASSETS AND LIABILITIES – Continued
As of May 31, 2021
| | | North Square | | | | | | North Square | |
| | | Oak Ridge | | | North Square | | | Oak Ridge | |
| | | Small Cap | | | Dynamic | | | All Cap | |
| | | Growth Fund | | | Small Cap Fund | | | Growth Fund | |
| Maximum Offering Price per Share: | | | | | | | | | |
| Class A Shares: | | | | | | | | | |
| Net assets applicable to shares outstanding | | $ | 87,290,707 | | | $ | — | | | $ | — | |
| Shares of beneficial interest issued and outstanding | | | 5,681,318 | | | | — | | | | — | |
| Redemption price | | | 15.36 | | | | — | | | | — | |
| Maximum sales charge (5.75% of offering price)* | | | 0.94 | | | | — | | | | — | |
| Maximum offering price to public | | $ | 16.30 | | | $ | — | | | $ | — | |
| | | | | | | | | | | | | |
| Class I Shares: | | | | | | | | | | | | |
| Net assets applicable to shares outstanding | | $ | 61,121,291 | | | $ | 20,369,007 | | | $ | 12,463,006 | |
| Shares of beneficial interest issued and outstanding | | | 3,475,555 | | | | 1,114,706 | | | | 596,094 | |
| Redemption price | | $ | 17.59 | | | $ | 18.27 | | | $ | 20.91 | |
| * | No sales charge applies on investments of $500,000 or more, but a Contingent Deferred Sales Charge (“CDSC”) of 1% will be imposed on certain redemptions of such shares within 12 months of the date of purchase. |
See accompanying Notes to Financial Statements.
STATEMENTS OF ASSETS AND LIABILITIES – Continued
As of May 31, 2021
| | | | | | North Square | |
| | | North Square | | | Oak Ridge | |
| | | Multi Strategy | | | Dividend | |
| | | Fund | | | Growth Fund | |
| Assets: | | | | | | |
| Investments, at cost | | $ | 3,323,013 | | | $ | 9,879,366 | |
| Investments in affiliated issuers, at cost | | | 34,416,402 | | | | — | |
| Investments, at value | | $ | 3,422,856 | | | $ | 16,189,159 | |
| Investments in affiliated issuers, at value | | | 52,555,710 | | | | — | |
| Receivables: | | | | | | | | |
| Fund shares sold | | | 1,502 | | | | — | |
| Dividends and interest | | | 22 | | | | 18,192 | |
| Prepaid expenses | | | 20,865 | | | | 3,405 | |
| Total assets | | | 56,000,955 | | | | 16,210,756 | |
| | | | | | | | | |
| Liabilities: | | | | | | | | |
| Payables: | | | | | | | | |
| Fund shares redeemed | | | 4,245 | | | | — | |
| Accrued expenses: | | | | | | | | |
| Due to Advisor (Note 4) | | | 179,952 | | | | 3,634 | |
| Auditing fees | | | 27,758 | | | | 7,934 | |
| Fund administration fees | | | 17,937 | | | | 4,770 | |
| Legal fees | | | 11,904 | | | | 3,469 | |
| Transfer agent fees | | | 4,782 | | | | 1,245 | |
| Distribution fees (Note 7) | | | 9,501 | | | | — | |
| Due to Trustees | | | 5,907 | | | | 1,627 | |
| Shareholder servicing fees (Note 6) | | | 1,432 | | | | 583 | |
| Accrued other expenses | | | 5,207 | | | | 1,166 | |
| Total liabilities | | | 268,625 | | | | 24,428 | |
| | | | | | | | | |
| Net Assets | | $ | 55,732,330 | | | $ | 16,186,328 | |
| | | | | | | | | |
| Components of Net Assets: | | | | | | | | |
| Paid-in capital (par value of $0.01 per share | | | | | | | | |
| with an unlimited number of shares authorized) | | $ | 34,453,512 | | | $ | 9,466,719 | |
| Total distributable earnings | | | 21,278,818 | | | | 6,719,609 | |
| Net Assets | | $ | 55,732,330 | | | $ | 16,186,328 | |
See accompanying Notes to Financial Statements.
STATEMENTS OF ASSETS AND LIABILITIES – Continued
As of May 31, 2021
| | | | | | North Square | |
| | | North Square | | | Oak Ridge | |
| | | Multi Strategy | | | Dividend | |
| | | Fund | | | Growth Fund | |
| Maximum Offering Price per Share: | | | | | | |
| Class A Shares: | | | | | | |
| Net assets applicable to shares outstanding | | $ | 45,140,172 | | | $ | — | |
| Shares of beneficial interest issued and outstanding | | | 1,914,991 | | | | — | |
| Redemption price | | | 23.57 | | | | — | |
| Maximum sales charge (5.75% of offering price)* | | | 1.44 | | | | — | |
| Maximum offering price to public | | $ | 25.01 | | | $ | — | |
| | | | | | | | | |
| Class I Shares: | | | | | | | | |
| Net assets applicable to shares outstanding | | $ | 10,592,158 | | | $ | 16,186,328 | |
| Shares of beneficial interest issued and outstanding | | | 426,627 | | | | 694,047 | |
| Redemption price | | $ | 24.83 | | | $ | 23.32 | |
| * | No sales charge applies on investments of $500,000 or more, but a Contingent Deferred Sales Charge (“CDSC”) of 1% will be imposed on certain redemptions of such shares within 12 months of the date of purchase. |
See accompanying Notes to Financial Statements.
STATEMENTS OF OPERATIONS
For the Year Ended May 31, 2021
| | | North Square | | | | | | North Square | |
| | | Oak Ridge | | | North Square | | | Oak Ridge | |
| | | Small Cap | | | Dynamic | | | All Cap | |
| | | Growth Fund* | | | Small Cap Fund | | | Growth Fund | |
| Investment Income: | | | | | | | | | |
| Dividends (net of foreign withholding taxes and/or | | | | | | | | | |
| issuance fees of $0, $37, and $204, respectively) | | $ | 297,569 | | | $ | 160,890 | | | $ | 89,538 | |
| Interest | | | 2,092 | | | | 140 | | | | 307 | |
| Total investment income | | | 299,661 | | | | 161,030 | | | | 89,845 | |
| Expenses: | | | | | | | | | | | | |
| Advisory fees | | | 1,239,824 | | | | 169,557 | | | | 95,631 | |
| Fund administration fees | | | 298,587 | | | | 38,725 | | | | 29,095 | |
| Distribution fees – Class A (Note 7) | | | 216,348 | | | | — | | | | — | |
| Distribution fees – Class C (Note 7) | | | 34,210 | | | | — | | | | — | |
| Transfer agent fees and expenses | | | 183,173 | | | | 20,776 | | | | 16,216 | |
| Shareholder servicing fees – Class A | | | 59,208 | | | | — | | | | — | |
| Shareholder servicing fees – Class C | | | 3,775 | | | | — | | | | — | |
| Shareholder servicing fees – Class I | | | 42,341 | | | | 11,449 | | | | 10,381 | |
| Auditing fees | | | 83,695 | | | | 5,172 | | | | 3,302 | |
| Legal fees | | | 67,296 | | | | 8,554 | | | | 4,154 | |
| Registration fees | | | 47,373 | | | | 30,522 | | | | 20,772 | |
| Chief Compliance Officer fees | | | 42,990 | | | | 4,717 | | | | 3,882 | |
| Trustees’ fees and expenses | | | 41,439 | | | | 3,410 | | | | 3,110 | |
| Shareholder reporting fees | | | 26,828 | | | | 2,339 | | | | 989 | |
| Fund accounting fees | | | 23,167 | | | | 2,493 | | | | 2,087 | |
| Custody fees | | | 6,807 | | | | 14,130 | | | | 5,986 | |
| Other expenses | | | 29,371 | | | | 3,397 | | | | 2,904 | |
| Total expenses | | | 2,446,432 | | | | 315,241 | | | | 198,509 | |
| Distribution fees refunded | | | (79,655 | ) | | | — | | | | — | |
| Less advisory fees waived & expenses reimbursed | | | | | | | | | | | | |
| Class A | | | (312,918 | ) | | | — | | | | — | |
| Class C | | | (13,379 | ) | | | — | | | | — | |
| Class I | | | (158,301 | ) | | | (98,584 | ) | | | (68,724 | ) |
| Class K | | | (5,310 | ) | | | — | | | | — | |
| Net expenses | | | 1,876,869 | | | | 216,657 | | | | 129,785 | |
| Net Investment loss | | | (1,577,208 | ) | | | (55,627 | ) | | | (39,940 | ) |
| Net Realized and Unrealized Gain: | | | | | | | | | | | | |
| Net realized gain on: | | | | | | | | | | | | |
| Investments | | | 32,671,779 | | | | 6,975,800 | | | | 2,127,491 | |
| Net realized gain | | | 32,671,779 | | | | 6,975,800 | | | | 2,127,491 | |
| Net change in unrealized appreciation/depreciation on: | | | | | | | | | | | | |
| Investments | | | 20,502,102 | | | | 2,013,661 | | | | 1,982,882 | |
| Net change in unrealized appreciation/depreciation | | | 20,502,102 | | | | 2,013,661 | | | | 1,982,882 | |
| Net realized and unrealized gain | | | 53,173,881 | | | | 8,989,461 | | | | 4,110,373 | |
| Net increase in net assets from operations | | $ | 51,596,673 | | | $ | 8,933,834 | | | $ | 4,070,433 | |
| * | At the close of business on October 9, 2020, Class C and Class K shares converted into Class I shares. |
See accompanying Notes to Financial Statements.
STATEMENTS OF OPERATIONS – Continued
For the Year Ended May 31, 2021
| | | | | | North Square | |
| | | North Square | | | Oak Ridge | |
| | | Multi Strategy | | | Dividend | |
| | | Fund* | | | Growth Fund | |
| Investment Income: | | | | | | |
| Dividends from unaffiliated investments | | $ | 60,291 | | | $ | 283,419 | |
| Dividends from affiliated regulated investment companies | | | 290,841 | | | | — | |
| Interest | | | 710 | | | | 298 | |
| Total investment income | | | 351,842 | | | | 283,717 | |
| Expenses: | | | | | | | | |
| Advisory fees | | | 255,180 | | | | 104,889 | |
| Fund administration fees | | | 103,175 | | | | 27,811 | |
| Distribution fees – Class A (Note 7) | | | 102,272 | | | | — | |
| Distribution fees – Class C (Note 7) | | | 12,901 | | | | — | |
| Transfer agent fees and expenses | | | 56,951 | | | | 15,379 | |
| Shareholder servicing fees – Class A | | | 23,300 | | | | — | |
| Shareholder servicing fees – Class C | | | 622 | | | | — | |
| Shareholder servicing fees – Class I | | | 5,209 | | | | 13,237 | |
| Auditing fees | | | 22,781 | | | | 7,345 | |
| Legal fees | | | 20,792 | | | | 5,720 | |
| Registration fees | | | 37,642 | | | | 7,707 | |
| Chief Compliance Officer fees | | | 14,425 | | | | 3,952 | |
| Trustees’ fees and expenses | | | 10,750 | | | | 3,874 | |
| Shareholder reporting fees | | | 4,249 | | | | 1,145 | |
| Fund accounting fees | | | 7,865 | | | | 2,098 | |
| Custody fees | | | 5,515 | | | | 4,954 | |
| Other expenses | | | 8,357 | | | | 2,784 | |
| Total expenses | | | 691,986 | | | | 200,895 | |
| Affiliated fund fees waived (Note 4) | | | (235,695 | ) | | | — | |
| Distribution fees refunded | | | (20,500 | ) | | | (1,007 | ) |
| Less advisory fees waived & expenses reimbursed | | | | | | | | |
| Class A | | | 87,092 | | | | — | |
| Class C | | | 4,936 | | | | — | |
| Class I | | | — | | | | (60,057 | ) |
| Net expenses | | | 527,819 | | | | 139,831 | |
| Net Investment income (loss) | | | (175,977 | ) | | | 143,886 | |
| Net Realized and Unrealized Gain: | | | | | | | | |
| Net realized gain on: | | | | | | | | |
| Investments | | | 66,549 | | | | 664,556 | |
| Affiliated issuers | | | 2,052,676 | | | | — | |
| Net realized gain | | | 2,119,225 | | | | 664,556 | |
| Capital gain distributions from regulated investment companies: | | | | | | | | |
| Unaffiliated issuers | | | 7,229 | | | | — | |
| Affiliated issuers | | | 1,334,718 | | | | — | |
| Total capital gain distributions | | | 1,341,947 | | | | — | |
| Net change in unrealized appreciation/depreciation on: | | | | | | | | |
| Investments | | | 131,515 | | | | 3,592,288 | |
| Affiliated issuers | | | 13,376,446 | | | | — | |
| Net change in unrealized appreciation/depreciation | | | 13,507,961 | | | | 3,592,288 | |
| Net realized and unrealized gain | | | 16,969,133 | | | | 4,256,844 | |
| Net increase in net assets from operations | | $ | 16,793,156 | | | $ | 4,400,730 | |
| * | At the close of business on October 9, 2020, Class C shares converted into Class I shares. |
See accompanying Notes to Financial Statements.
STATEMENTS OF CHANGES IN NET ASSETS
| | | North Square Oak Ridge | | | North Square Dynamic | |
| | | Small Cap Growth Fund | | | Small Cap Fund | |
| | | Year Ended | | | Year Ended | | | Year Ended | | | Year Ended | |
| | | May 31, 2021* | | | May 31, 2020 | | | May 31, 2021 | | | May 31, 2020** | |
| Increase (Decrease) in Net Assets from: | | | | | | | | | | | | |
| Operations: | | | | | | | | | | | | |
| Net investment income (loss) | | $ | (1,577,208 | ) | | $ | (1,790,028 | ) | | $ | (55,627 | ) | | $ | 33,014 | |
| Net realized gain (loss) on investments | | | | | | | | | | | | | | | | |
| and foreign currency translations | | | 32,671,779 | | | | 17,098,431 | | | | 6,975,800 | | | | (516,330 | ) |
| Net change in unrealized appreciation/depreciation | | | | | | | | | | | | | | | | |
| on investments and foreign currency translations | | | 20,502,102 | | | | (12,777,330 | ) | | | 2,013,661 | | | | 935,861 | |
| Net increase in net assets | | | | | | | | | | | | | | | | |
| resulting from operations | | | 51,596,673 | | | | 2,531,073 | | | | 8,933,834 | | | | 452,545 | |
| | | | | | | | | | | | | | | | | |
| Distributions to shareholders: | | | | | | | | | | | | | | | | |
| Distributions: | | | | | | | | | | | | | | | | |
| Class A | | | (10,715,503 | ) | | | (13,192,375 | ) | | | — | | | | (24 | ) |
| Class C | | | — | | | | (6,840,656 | ) | | | — | | | | — | |
| Class I | | | (6,326,766 | ) | | | (6,578,301 | ) | | | (360,974 | ) | | | (51,889 | ) |
| Class K | | | — | | | | (1,070,578 | ) | | | — | | | | — | |
| Total | | | (17,042,269 | ) | | | (27,681,910 | ) | | | (360,974 | ) | | | (51,913 | ) |
| | | | | | | | | | | | | | | | | |
| Capital Transactions: | | | | | | | | | | | | | | | | |
| Net proceeds from shares sold: | | | | | | | | | | | | | | | | |
| Class A | | | 6,635,455 | | | | 8,458,392 | | | | — | | | | 10,524 | |
| Class C | | | 140,654 | | | | 266,434 | | | | — | | | | — | |
| Class I | | | 19,574,442 | | | | 4,460,414 | | | | 458,063 | | | | 599,316 | |
| Class K | | | 821,418 | | | | 2,669,364 | | | | — | | | | — | |
| Reinvestment of distributions: | | | | | | | | | | | | | | | | |
| Class A | | | 10,275,309 | | | | 12,417,644 | | | | — | | | | 19 | |
| Class C | | | — | | | | 6,296,227 | | | | — | | | | — | |
| Class I | | | 6,135,604 | | | | 6,393,431 | | | | 360,974 | | | | 51,889 | |
| Class K | | | — | | | | 1,070,578 | | | | — | | | | — | |
| Cost of shares redeemed: | | | | | | | | | | | | | | | | |
| Class A | | | (23,410,067 | ) | | | (45,471,440 | ) | | | — | | | | (326,032 | ) |
| Class C | | | (10,888,219 | ) | | | (9,677,044 | ) | | | — | | | | — | |
| Class I | | | (16,947,193 | ) | | | (29,407,971 | ) | | | (4,522,752 | ) | | | (5,929,127 | ) |
| Class K | | | (7,907,186 | ) | | | (6,861,211 | ) | | | — | | | | — | |
| Net decrease in net assets | | | | | | | | | | | | | | | | |
| from capital transactions | | | (15,569,783 | ) | | | (49,385,182 | ) | | | (3,703,715 | ) | | | (5,593,411 | ) |
| Total increase (decrease) in net assets | | | 18,984,621 | | | | (74,536,019 | ) | | | 4,869,145 | | | | (5,192,779 | ) |
| | | | | | | | | | | | | | | | | |
| Net Assets: | | | | | | | | | | | | | | | | |
| Beginning of Period | | | 129,427,377 | | | | 203,963,396 | | | | 15,499,862 | | | | 20,692,641 | |
| End of Period | | $ | 148,411,998 | | | $ | 129,427,377 | | | $ | 20,369,007 | | | $ | 15,499,862 | |
| * | | As of the close of business on October 9, 2020, Class C and Class K shares converted into Class I shares. |
| ** | | As of the close of business on May 29, 2020, Class A shares converted into Class I shares. |
See accompanying Notes to Financial Statements.
STATEMENTS OF CHANGES IN NET ASSETS – Continued
| | | North Square Oak Ridge | | | North Square Dynamic | |
| | | Small Cap Growth Fund | | | Small Cap Fund | |
| | | Year Ended | | | Year Ended | | | Year Ended | | | Year Ended | |
| | | May 31, 2021* | | | May 31, 2020 | | | May 31, 2021 | | | May 31, 2020** | |
| Capital Share Transactions: | | | | | | | | | | | | |
| Shares sold: | | | | | | | | | | | | |
| Class A | | | 454,711 | | | | 703,797 | | | | — | | | | 854 | |
| Class C | | | 51,042 | | | | 90,147 | | | | — | | | | — | |
| Class I | | | 1,190,853 | | | | 323,532 | | | | 28,862 | | | | 50,444 | |
| Class K | | | 56,114 | | | | 192,284 | | | | — | | | | — | |
| Shares reinvested: | | | | | | | | | | | | | | | | |
| Class A | | | 692,901 | | | | 966,624 | | | | — | | | | 1 | |
| Class C | | | — | | | | 2,335,742 | | | | — | | | | — | |
| Class I | | | 362,083 | | | | 442,887 | | | | 22,822 | | | | 3,839 | |
| Class K | | | — | | | | 75,282 | | | | — | | | | — | |
| Shares redeemed: | | | | | | | | | | | | | | | | |
| Class A | | | (1,595,558 | ) | | | (3,440,586 | ) | | | — | | | | (27,419 | ) |
| Class C | | | (3,598,192 | ) | | | (3,183,348 | ) | | | — | | | | — | |
| Class I | | | (1,035,753 | ) | | | (2,010,794 | ) | | | (288,973 | ) | | | (468,649 | ) |
| Class K | | | (529,547 | ) | | | (481,601 | ) | | | — | | | | — | |
| Net decrease in | | | | | | | | | | | | | | | | |
| capital share transactions | | | (3,951,346 | ) | | | (3,986,034 | ) | | | (237,289 | ) | | | (440,930 | ) |
| * | | As of the close of business on October 9, 2020, Class C and Class K shares converted into Class I shares. |
| ** | | As of the close of business on May 29, 2020, Class A shares converted into Class I shares. |
See accompanying Notes to Financial Statements.
STATEMENTS OF CHANGES IN NET ASSETS – Continued
| | | North Square Oak Ridge | | | North Square | |
| | | All Cap Growth Fund | | | Multi Strategy Fund | |
| | | Year Ended | | | Year Ended | | | Year Ended | | | Year Ended | |
| | | May 31, 2021 | | | May 31, 2020 | | | May 31, 2021* | | | May 31, 2020 | |
| Increase (Decrease) in Net Assets from: | | | | | | | | | | | | |
| Operations: | | | | | | | | | | | | |
| Net investment income (loss) | | $ | (39,940 | ) | | $ | 25,176 | | | $ | (175,977 | ) | | $ | (175,705 | ) |
| Net realized gain (loss) on investments | | | | | | | | | | | | | | | | |
| and foreign currency translations | | | 2,127,491 | | | | 1,058,634 | | | | 2,119,225 | | | | (53,582 | ) |
| Capital gain distributions from | | | | | | | | | | | | | | | | |
| regulated investment companies | | | — | | | | — | | | | 1,341,947 | | | | 639,230 | |
| Net change in unrealized appreciation/depreciation | | | | | | | | | | | | | | | | |
| on investments and foreign currency translations | | | 1,982,882 | | | | 1,578,824 | | | | 13,507,961 | | | | 3,304,450 | |
| Net increase in net assets | | | | | | | | | | | | | | | | |
| resulting from operations | | | 4,070,433 | | | | 2,662,634 | | | | 16,793,156 | | | | 3,714,393 | |
| | | | | | | | | | | | | | | | | |
| Distributions to shareholders: | | | | | | | | | | | | | | | | |
| Distributions: | | | | | | | | | | | | | | | | |
| Class A | | | — | | | | — | | | | — | | | | (2,346,535 | ) |
| Class C | | | — | | | | — | | | | — | | | | (449,855 | ) |
| Class I | | | (775,050 | ) | | | (600,962 | ) | | | — | | | | (529,026 | ) |
| Total | | | (775,050 | ) | | | (600,962 | ) | | | — | | | | (3,325,416 | ) |
| | | | | | | | | | | | | | | | | |
| Capital Transactions: | | | | | | | | | | | | | | | | |
| Net proceeds from shares sold: | | | | | | | | | | | | | | | | |
| Class A | | | — | | | | — | | | | 1,491,365 | | | | 6,088,259 | |
| Class C | | | — | | | | — | | | | 16,998 | | | | 48,969 | |
| Class I | | | 58,913 | | | | 5,465 | | | | 3,857,218 | | | | 610,000 | |
| Reinvestment of distributions: | | | | | | | | | | | | | | | | |
| Class A | | | — | | | | — | | | | — | | | | 2,185,152 | |
| Class C | | | — | | | | — | | | | — | | | | 420,421 | |
| Class I | | | 775,050 | | | | 600,962 | | | | — | | | | 471,672 | |
| Cost of shares redeemed: | | | | | | | | | | | | | | | | |
| Class A | | | — | | | | — | | | | (5,027,549 | ) | | | (6,199,393 | ) |
| Class C | | | — | | | | — | | | | (4,034,136 | ) | | | (6,375,487 | ) |
| Class I | | | (3,857,036 | ) | | | (4,300,030 | ) | | | (2,024,440 | ) | | | (8,688,130 | ) |
| Net decrease in net assets | | | | | | | | | | | | | | | | |
| from capital transactions | | | (3,023,073 | ) | | | (3,693,603 | ) | | | (5,720,544 | ) | | | (11,438,537 | ) |
| Total increase (decrease) in net assets | | | 272,310 | | | | (1,631,931 | ) | | | 11,072,612 | | | | (11,049,560 | ) |
| | | | | | | | | | | | | | | | | |
| Net Assets: | | | | | | | | | | | | | | | | |
| Beginning of Period | | | 12,190,696 | | | | 13,822,627 | | | | 44,659,718 | | | | 55,709,278 | |
| End of Period | | $ | 12,463,006 | | | $ | 12,190,696 | | | $ | 55,732,330 | | | $ | 44,659,718 | |
| * | As of the close of business on October 9, 2020, Class C shares converted into Class I shares. |
See accompanying Notes to Financial Statements.
STATEMENTS OF CHANGES IN NET ASSETS – Continued
| | | North Square Oak Ridge | | | North Square | |
| | | All Cap Growth Fund | | | Multi Strategy Fund | |
| | | Year Ended | | | Year Ended | | | Year Ended | | | Year Ended | |
| | | May 31, 2021 | | | May 31, 2020 | | | May 31, 2021* | | | May 31, 2020 | |
| Capital Share Transactions: | | | | | | | | | | | | |
| Shares sold: | | | | | | | | | | | | |
| Class A | | | — | | | | — | | | | 73,292 | | | | 356,598 | |
| Class C | | | — | | | | — | | | | 1,210 | | | | 3,361 | |
| Class I | | | 2,940 | | | | 374 | | | | 188,700 | | | | 32,814 | |
| Shares reinvested: | | | | | | | | | | | | | | | | |
| Class A | | | — | | | | — | | | | — | | | | 120,071 | |
| Class C | | | — | | | | — | | | | — | | | | 28,415 | |
| Class I | | | 39,968 | | | | 39,187 | | | | — | | | | 24,882 | |
| Shares redeemed: | | | | | | | | | | | | | | | | |
| Class A | | | — | | | | — | | | | (241,640 | ) | | | (360,745 | ) |
| Class C | | | — | | | | — | | | | (258,716 | ) | | | (456,848 | ) |
| Class I | | | (197,381 | ) | | | (280,666 | ) | | | (92,145 | ) | | | (461,870 | ) |
| Net decrease in | | | | | | | | | | | | | | | | |
| capital share transactions | | | (154,473 | ) | | | (241,105 | ) | | | (329,299 | ) | | | (713,322 | ) |
| * | As of the close of business on October 9, 2020, Class C shares converted into Class I shares. |
See accompanying Notes to Financial Statements.
STATEMENTS OF CHANGES IN NET ASSETS – Continued
| | | North Square Oak Ridge | |
| | | Dividend Growth Fund | |
| | | Year Ended | | | Year Ended | |
| | | May 31, 2021 | | | May 31, 2020* | |
| Increase (Decrease) in Net Assets from: | | | | | | |
| Operations: | | | | | | |
| Net investment income | | $ | 143,886 | | | $ | 174,074 | |
| Net realized gain (loss) on investments and foreign currency translations | | | 664,556 | | | | (1,124 | ) |
| Net change in unrealized appreciation/depreciation | | | | | | | | |
| on investments and foreign currency translations | | | 3,592,288 | | | | 1,087,604 | |
| Net increase in net assets resulting from operations | | | 4,400,730 | | | | 1,260,554 | |
| | | | | | | | | |
| Distributions to shareholders: | | | | | | | | |
| Distributions: | | | | | | | | |
| Class A | | | — | | | | (16,267 | ) |
| Class I | | | (369,429 | ) | | | (200,482 | ) |
| Total | | | (369,429 | ) | | | (216,749 | ) |
| | | | | | | | | |
| Capital Transactions: | | | | | | | | |
| Net proceeds from shares sold: | | | | | | | | |
| Class A | | | — | | | | 258,921 | |
| Class I | | | 878,900 | | | | 497,850 | |
| Reinvestment of distributions: | | | | | | | | |
| Class A | | | — | | | | 16,267 | |
| Class I | | | 369,429 | | | | 200,482 | |
| Cost of shares redeemed: | | | | | | | | |
| Class A | | | — | | | | (1,238,515 | ) |
| Class I | | | (238,986 | ) | | | (2,553,713 | ) |
| Net increase (decrease) in net assets from capital transactions | | | 1,009,343 | | | | (2,818,708 | ) |
| Total increase (decrease) in net assets | | | 5,040,644 | | | | (1,774,903 | ) |
| | | | | | | | | |
| Net Assets: | | | | | | | | |
| Beginning of Period | | | 11,145,684 | | | | 12,920,587 | |
| End of Period | | $ | 16,186,328 | | | $ | 11,145,684 | |
| | | | | | | | | |
| Capital Share Transactions: | | | | | | | | |
| Shares sold: | | | | | | | | |
| Class A | | | — | | | | 15,122 | |
| Class I | | | 49,284 | | | | 28,103 | |
| Shares reinvested: | | | | | | | | |
| Class A | | | — | | | | 929 | |
| Class I | | | 18,325 | | | | 11,328 | |
| Shares redeemed: | | | | | | | | |
| Class A | | | — | | | | (72,254 | ) |
| Class I | | | (11,455 | ) | | | (140,725 | ) |
| Net increase (decrease) in capital share transactions | | | 56,154 | | | | (157,497 | ) |
| * | As of the close of business on May 29, 2020, Class A shares converted into Class I shares. |
See accompanying Notes to Financial Statements.
North Square Oak Ridge Small Cap Growth Fund
FINANCIAL HIGHLIGHTS
Class A
Per share operating performance.
For a capital share outstanding throughout each period.
| | | For the Year Ended May 31, | |
| | | 2021 | | | 2020 | | | 2019 | | | 2018 | | | 2017 | |
| Net asset value, beginning of period | | $ | 12.07 | | | $ | 13.89 | | | $ | 16.85 | | | $ | 34.16 | | | $ | 34.02 | |
| Income from Investment Operations: | | | | | | | | | | | | | | | | | | | | |
Net investment loss1 | | | (0.17 | ) | | | (0.15 | ) | | | (0.16 | )2 | | | (0.23 | )2 | | | (0.33 | )2 |
| Net realized and unrealized gain (loss) | | | 5.34 | | | | 0.44 | | | | (0.34 | ) | | | 5.69 | | | | 2.62 | |
| Total from investment operations | | | 5.17 | | | | 0.29 | | | | (0.50 | ) | | | 5.46 | | | | 2.29 | |
| Less Distributions: | | | | | | | | | | | | | | | | | | | | |
| From net realized gain | | | (1.88 | ) | | | (2.11 | ) | | | (2.46 | ) | | | (22.77 | ) | | | (2.15 | ) |
| Total distributions | | | (1.88 | ) | | | (2.11 | ) | | | (2.46 | ) | | | (22.77 | ) | | | (2.15 | ) |
| Net asset value, end of period | | $ | 15.36 | | | $ | 12.07 | | | $ | 13.89 | | | $ | 16.85 | | | $ | 34.16 | |
Total return3 | | | 43.47 | % | | | 1.16 | % | | | (1.96 | )% | | | 23.85 | % | | | 6.82 | % |
| Ratios and Supplemental Data: | | | | | | | | | | | | | | | | | | | | |
| Net assets, end of period (in thousands) | | $ | 87,291 | | | $ | 73,973 | | | $ | 109,749 | | | $ | 162,714 | | | $ | 242,299 | |
| Ratio of expenses to average net assets: | | | | | | | | | | | | | | | | | | | | |
Before fees waived and expenses absorbed4 | | | 1.75 | % | | | 2.06 | % | | | 1.46 | % | | | 1.40 | % | | | 1.44 | % |
After fees waived and expenses absorbed4 | | | 1.39 | % | | | 1.39 | % | | | 1.38 | % | | | 1.38 | %5 | | | 1.39 | % |
| Ratio of net investment loss to average net assets: | | | | | | | | | | | | | | | | | | | | |
Before fees waived and expenses absorbed4 | | | (1.54 | )% | | | (1.78 | )% | | | (1.08 | )% | | | (0.97 | )% | | | (1.02 | )% |
After fees waived and expenses absorbed4 | | | (1.18 | )% | | | (1.11 | )% | | | (1.00 | )% | | | (0.95 | )% | | | (0.97 | )% |
| Portfolio turnover rate | | | 33 | % | | | 38 | % | | | 31 | % | | | 39 | % | | | 30 | % |
1 | Based on average shares outstanding for the period. |
2 | Recognition of net investment income by the Fund is affected by the timing of the declaration of dividends by the underlying investment companies in which the Fund invests. The ratio does not include net investment income of the investment companies in which the Fund invests. |
3 | Total returns would have been lower had expenses not been waived or absorbed by the Advisor. Returns shown do not include payment of a sales load of 5.75% of offering price, which is reduced on sales of $50,000 or more. Returns shown do not include payment of a Contingent Deferred Sales Charge (“CDSC”) of 1% on certain redemptions made within 12 months of the date of purchase. If the sales load and CDSC were included, total returns would be lower. These returns include Rule 12b-1 fees of up to 0.25% and do not reflect the deduction of taxes that a shareholder would pay on Fund distributions or the redemption of Fund shares. |
4 | Does not include expenses of the investment companies in which the Fund invests. |
5 | Effective October 5, 2017, the Advisor had contractually agreed to waive its fees and/or absorb expenses of the Fund to ensure that total fund operating expenses (excluding taxes, leverage interest, brokerage commissions, dividend expenses on short sales, acquired fund fees and expenses as determined in accordance with SEC Form N-1A, expenses incurred in connection with any merger or reorganization, or extraordinary expenses such as litigation) do not exceed 1.39% of average daily net assets of the Fund. Prior to October 5, 2017, the annual fund operating expense limitation was 1.40%. |
See accompanying Notes to Financial Statements.
North Square Oak Ridge Small Cap Growth Fund
FINANCIAL HIGHLIGHTS
Class I
Per share operating performance.
For a capital share outstanding throughout each period.
| | | For the Year Ended May 31, | |
| | | 2021 | | | 2020 | | | 2019 | | | 2018 | | | 2017 | |
| Net asset value, beginning of period | | $ | 13.58 | | | $ | 15.35 | | | $ | 18.29 | | | $ | 35.25 | | | $ | 34.92 | |
| Income from Investment Operations: | | | | | | | | | | | | | | | | | | | | |
Net investment loss1 | | | (0.15 | ) | | | (0.13 | ) | | | (0.13 | )2 | | | (0.19 | )2 | | | (0.22 | )2 |
| Net realized and unrealized gain (loss) | | | 6.04 | | | | 0.47 | | | | (0.35 | ) | | | 6.00 | | | | 2.70 | |
| Total from investment operations | | | 5.89 | | | | 0.34 | | | | (0.48 | ) | | | 5.81 | | | | 2.48 | |
| Less Distributions: | | | | | | | | | | | | | | | | | | | | |
| From net realized gain | | | (1.88 | ) | | | (2.11 | ) | | | (2.46 | ) | | | (22.77 | ) | | | (2.15 | ) |
| Total distributions | | | (1.88 | ) | | | (2.11 | ) | | | (2.46 | ) | | | (22.77 | ) | | | (2.15 | ) |
| Net asset value, end of period | | $ | 17.59 | | | $ | 13.58 | | | $ | 15.35 | | | $ | 18.29 | | | $ | 35.25 | |
Total return3 | | | 43.92 | % | | | 1.41 | % | | | (1.67 | )% | | | 24.19 | % | | | 7.23 | % |
| Ratios and Supplemental Data: | | | | | | | | | | | | | | | | | | | | |
| Net assets, end of period (in thousands) | | $ | 61,121 | | | $ | 40,165 | | | $ | 64,501 | | | $ | 172,935 | | | $ | 1,040,256 | |
| Ratio of expenses to average net assets: | | | | | | | | | | | | | | | | | | | | |
Before fees waived and expenses absorbed4 | | | 1.51 | %6 | | | 1.78 | % | | | 1.22 | % | | | 1.05 | % | | | 1.09 | % |
After fees waived and expenses absorbed4 | | | 1.08 | % | | | 1.14 | % | | | 1.14 | % | | | 1.06 | %5 | | | 1.04 | % |
| Ratio of net investment loss to average net assets: | | | | | | | | | | | | | | | | | | | | |
Before fees waived and expenses absorbed4 | | | (1.31 | )%6 | | | (1.50 | )% | | | (0.84 | )% | | | (0.63 | )% | | | (0.67 | )% |
After fees waived and expenses absorbed4 | | | (0.87 | )% | | | (0.86 | )% | | | (0.75 | )% | | | (0.64 | )% | | | (0.62 | )% |
| Portfolio turnover rate | | | 33 | % | | | 38 | % | | | 31 | % | | | 39 | % | | | 30 | % |
1 | Based on average shares outstanding for the period. |
2 | Recognition of net investment income by the Fund is affected by the timing of the declaration of dividends by the underlying investment companies in which the Fund invests. The ratio does not include net investment income of the investment companies in which the Fund invests. |
3 | Total returns would have been lower had expenses not been waived by the Advisor. Returns shown do not reflect the deduction of taxes that a shareholder would pay on Fund distributions or the redemption of Fund shares. |
4 | Does not include expenses of the investment companies in which the Fund invests. |
5 | Effective October 5, 2017, the Advisor had contractually agreed to waive its fees and/or absorb expenses of the Fund to ensure that total fund operating expenses (excluding taxes, leverage interest, brokerage commissions, dividend expenses on short sales, acquired fund fees and expenses as determined in accordance with SEC Form N-1A, expenses incurred or in connection with any merger reorganization, or extraordinary expenses such as litigation) do not exceed 1.39% of average daily net assets of the Fund. Prior to October 5, 2017, the annual fund operating expense limitation was 1.40%. |
6 | Ratios exclude the 12b-1 refund (Note 8). |
See accompanying Notes to Financial Statements.
North Square Dynamic Small Cap Fund
FINANCIAL HIGHLIGHTS
Class I
Per share operating performance.
For a capital share outstanding throughout each period.
| | | For the Year Ended May 31, | |
| | | 2021 | | | 2020 | | | 2019 | | | 2018 | | | 2017 | |
| Net asset value, beginning of period | | $ | 11.46 | | | $ | 11.54 | | | $ | 15.14 | | | $ | 12.07 | | | $ | 9.98 | |
| Income from Investment Operations: | | | | | | | | | | | | | | | | | | | | |
Net investment income (loss)1 | | | (0.04 | ) | | | 0.02 | | | | (0.01 | ) | | | — | 2 | | | (0.03 | ) |
| Net realized and unrealized gain (loss) | | | 7.14 | | | | (0.07 | ) | | | (1.31 | ) | | | 3.11 | | | | 2.15 | |
| Total from investment operations | | | 7.10 | | | | (0.05 | ) | | | (1.32 | ) | | | 3.11 | | | | 2.12 | |
| Less Distributions: | | | | | | | | | | | | | | | | | | | | |
| From net investment income | | | (0.01 | ) | | | (0.03 | ) | | | — | | | | — | | | | — | |
| From net realized gain | | | (0.28 | ) | | | — | | | | (2.28 | ) | | | (0.04 | ) | | | (0.03 | ) |
| Total distributions | | | (0.29 | ) | | | (0.03 | ) | | | (2.28 | ) | | | (0.04 | ) | | | (0.03 | ) |
| Net asset value, end of period | | $ | 18.27 | | | $ | 11.46 | | | $ | 11.54 | | | $ | 15.14 | | | $ | 12.07 | |
Total return3 | | | 62.34 | % | | | (0.44 | )% | | | (8.42 | )% | | | 25.83 | % | | | 21.29 | % |
| Ratios and Supplemental Data: | | | | | | | | | | | | | | | | | | | | |
| Net assets, end of period (in thousands) | | $ | 20,369 | | | $ | 15,500 | | | $ | 20,389 | | | $ | 28,279 | | | $ | 1,167 | |
| Ratio of expenses to average net assets: | | | | | | | | | | | | | | | | | | | | |
| Before fees waived and expenses absorbed | | | 1.67 | % | | | 2.23 | % | | | 2.02 | % | | | 1.89 | % | | | 19.89 | % |
| After fees waived and expenses absorbed | | | 1.15 | % | | | 1.15 | % | | | 1.15 | % | | | 1.15 | % | | | 1.15 | % |
| Ratio of net investment income (loss) to average net assets: | | | | | | | | | | | | | | | | | | | | |
| Before fees waived and expenses absorbed | | | (0.82 | )% | | | (0.91 | )% | | | (0.91 | )% | | | (0.71 | )% | | | (18.97 | )% |
| After fees waived and expenses absorbed | | | (0.30 | )% | | | 0.17 | % | | | (0.04 | )% | | | 0.03 | % | | | (0.22 | )% |
| Portfolio turnover rate | | | 179 | % | | | 170 | % | | | 133 | % | | | 170 | % | | | 181 | % |
1 | Based on average shares outstanding for the period. |
2 | Amount represents less than $0.005 per share. |
3 | Total returns would have been lower had expenses not been waived by the Advisor. Returns shown do not reflect the deduction of taxes that a shareholder would pay on Fund distributions or the redemption of Fund shares. |
See accompanying Notes to Financial Statements.
North Square Oak Ridge All Cap Growth Fund
FINANCIAL HIGHLIGHTS
Class I
Per share operating performance.
For a capital share outstanding throughout each period.
| | | | | | | | | | | | | | | For the Period | |
| | | For the Year Ended May 31, | | | July 29, 2016* | |
| | | | | through | |
| | | 2021 | | | 2020 | | | 2019 | | | 2018 | | | May 31, 2017 | |
| Net asset value, beginning of period | | $ | 16.24 | | | $ | 13.94 | | | $ | 13.16 | | | $ | 11.03 | | | $ | 10.00 | |
| Income from Investment Operations: | | | | | | | | | | | | | | | | | | | | |
Net investment income (loss)1 | | | (0.06 | ) | | | 0.03 | | | | (0.00 | )2 | | | 0.01 | | | | 0.03 | |
| Net realized and unrealized gain | | | 5.82 | | | | 3.00 | | | | 0.88 | | | | 2.12 | | | | 1.02 | |
| Total from investment operations | | | 5.76 | | | | 3.03 | | | | 0.88 | | | | 2.13 | | | | 1.05 | |
| Less Distributions: | | | | | | | | | | | | | | | | | | | | |
| From net investment income | | | (0.03 | ) | | | (0.01 | ) | | | — | | | | (0.00 | )2 | | | (0.02 | ) |
| From net realized gain | | | (1.06 | ) | | | (0.72 | ) | | | (0.10 | ) | | | — | | | | — | |
| Total distributions | | | (1.09 | ) | | | (0.73 | ) | | | (0.10 | ) | | | (0.00 | ) | | | (0.02 | ) |
| Net asset value, end of period | | $ | 20.91 | | | $ | 16.24 | | | $ | 13.94 | | | $ | 13.16 | | | $ | 11.03 | |
Total return3 | | | 35.93 | % | | | 22.05 | % | | | 6.80 | % | | | 19.31 | % | | | 10.58 | %4 |
| Ratios and Supplemental Data: | | | | | | | | | | | | | | | | | | | | |
| Net assets, end of period (in thousands) | | $ | 12,463 | | | $ | 12,191 | | | $ | 13,823 | | | $ | 14,285 | | | $ | 281 | |
| Ratio of expenses to average net assets: | | | | | | | | | | | | | | | | | | | | |
| Before fees waived and expenses absorbed | | | 1.45 | % | | | 1.88 | % | | | 2.04 | % | | | 1.99 | % | | | 45.40 | %5 |
| After fees waived and expenses absorbed | | | 0.95 | % | | | 0.95 | % | | | 0.95 | % | | | 0.95 | % | | | 0.95 | %5 |
| Ratio of net investment income (loss) to average net assets: | | | | | | | | | | | | | | | | | | | | |
| Before fees waived and expenses absorbed | | | (0.79 | )% | | | (0.74 | )% | | | (1.10 | )% | | | (0.96 | )% | | | (44.13 | )%5 |
| After fees waived and expenses absorbed | | | (0.29 | )% | | | 0.19 | % | | | (0.01 | )% | | | 0.08 | % | | | 0.32 | %5 |
| Portfolio turnover rate | | | 9 | % | | | 18 | % | | | 18 | % | | | 74 | % | | | 116 | %4 |
| * | Commencement of operations. |
1 | Based on average shares outstanding for the period. |
2 | Amount represents less than $0.005 per share. |
3 | Total returns would have been lower had expenses not been waived by the Advisor. Returns shown do not reflect the deduction of taxes that a shareholder would pay on Fund distributions or the redemption of Fund shares. |
4 | Not annualized. |
5 | Annualized. |
See accompanying Notes to Financial Statements.
North Square Multi Strategy Fund
FINANCIAL HIGHLIGHTS
Class A
Per share operating performance.
For a capital share outstanding throughout each period.
| | | For the Year Ended May 31, | |
| | | 2021 | | | 2020 | | | 2019 | | | 2018 | | | 2017 | |
| Net asset value, beginning of period | | $ | 16.93 | | | $ | 16.92 | | | $ | 26.95 | | | $ | 22.81 | | | $ | 19.77 | |
| Income from Investment Operations: | | | | | | | | | | | | | | | | | | | | |
Net investment income (loss)1,5 | | | (0.09 | ) | | | (0.05 | ) | | | (0.06 | ) | | | (0.16 | ) | | | — | 2 |
| Net realized and unrealized gain (loss) | | | 6.73 | | | | 1.25 | | | | (1.60 | ) | | | 4.30 | | | | 3.04 | |
| Total from investment operations | | | 6.64 | | | | 1.20 | | | | (1.66 | ) | | | 4.14 | | | | 3.04 | |
| Less Distributions: | | | | | | | | | | | | | | | | | | | | |
| From net investment income | | | — | | | | (1.19 | ) | | | — | | | | — | | | | — | |
| From net realized gain | | | — | | | | — | | | | (8.37 | ) | | | — | | | | — | |
| Total distributions | | | — | | | | (1.19 | ) | | | (8.37 | ) | | | — | | | | — | |
| Net asset value, end of period | | $ | 23.57 | | | $ | 16.93 | | | $ | 16.92 | | | $ | 26.95 | | | $ | 22.81 | |
Total return3 | | | 39.20 | % | | | 6.63 | % | | | (4.88 | )% | | | 18.15 | % | | | 15.38 | % |
| Ratios and Supplemental Data: | | | | | | | | | | | | | | | | | | | | |
| Net assets, end of period (in thousands) | | $ | 45,140 | | | $ | 35,278 | | | $ | 33,287 | | | $ | 41,570 | | | $ | 40,399 | |
| Ratio of expenses to average net assets: | | | | | | | | | | | | | | | | | | | | |
Before fees waived/recovered4 | | | 0.92 | %6 | | | 1.34 | %6 | | | 0.82 | %6 | | | 0.93 | %6 | | | 1.63 | % |
After fees waived/recovered4 | | | 1.13 | %6 | | | 1.20 | %6 | | | 1.00 | %6 | | | 1.13 | %6 | | | 1.20 | % |
| Ratio of net investment income (loss) to average net assets: | | | | | | | | | | | | | | | | | | | | |
Before fees waived/recovered4,5 | | | (0.23 | )% | | | (0.40 | )% | | | (0.09 | )% | | | (0.43 | )% | | | (0.43 | )% |
After fees waived/recovered4,5 | | | (0.44 | )% | | | (0.26 | )% | | | (0.27 | )% | | | (0.63 | )% | | | 0.00 | % |
| Portfolio turnover rate | | | 15 | % | | | 7 | % | | | 17 | % | | | 117 | % | | | 17 | % |
1 | Based on average shares outstanding for the period. |
2 | Amount represents less than $0.005 per share. |
3 | Total returns would have been lower had expenses not been waived or absorbed by the Advisor. Returns shown do not include payment of a sales load of 5.75% of offering price, which is reduced on sales of $50,000 or more. Returns shown do not include payment of a Contingent Deferred Sales Charge (“CDSC”) of 1% on certain redemptions made within 12 months of the date of purchase. If the sales load and CDSC were included, total returns would be lower. These returns include Rule 12b-1 fees of up to 0.25% and do not reflect the deduction of taxes that a shareholder would pay on Fund distributions or the redemption of Fund shares. |
4 | Does not include expenses of the investment companies in which the Fund invests. |
5 | Recognition of net investment income by the Fund is affected by the timing of the declaration of dividends by the underlying investment companies in which the Fund invests. The ratio does not include net investment income of the investment companies in which the Fund invests. |
6 | The Advisor does not receive management fees for Fund assets invested in other series of the Trust advised by the Advisor (affiliated investments). |
See accompanying Notes to Financial Statements.
North Square Multi Strategy Fund
FINANCIAL HIGHLIGHTS
Class I
Per share operating performance.
For a capital share outstanding throughout each period.
| | | For the Year Ended May 31, | |
| | | 2021 | | | 2020 | | | 2019 | | | 2018 | | | 2017 | |
| Net asset value, beginning of period | | $ | 17.73 | | | $ | 17.59 | | | $ | 27.53 | | | $ | 23.24 | | | $ | 20.14 | |
| Income from Investment Operations: | | | | | | | | | | | | | | | | | | | | |
Net investment income (loss)1,4 | | | 0.06 | | | | (0.01 | ) | | | 0.02 | | | | (0.10 | ) | | | 0.01 | |
| Net realized and unrealized gain (loss) | | | 7.04 | | | | 1.36 | | | | (1.59 | ) | | | 4.39 | | | | 3.09 | |
| Total from investment operations | | | 7.10 | | | | 1.35 | | | | (1.57 | ) | | | 4.29 | | | | 3.10 | |
| Less Distributions: | | | | | | | | | | | | | | | | | | | | |
| From net investment income | | | — | | | | (1.21 | ) | | | — | | | | — | | | | — | |
| From net realized gain | | | — | | | | — | | | | (8.37 | ) | | | — | | | | — | |
| Total distributions | | | — | | | | (1.21 | ) | | | (8.37 | ) | | | — | | | | — | |
| Net asset value, end of period | | $ | 24.83 | | | $ | 17.73 | | | $ | 17.59 | | | $ | 27.53 | | | $ | 23.24 | |
Total return2 | | | 40.07 | % | | | 7.17 | % | | | (4.23 | )% | | | 18.46 | % | | | 15.39 | % |
| Ratios and Supplemental Data: | | | | | | | | | | | | | | | | | | | | |
| Net assets, end of period (in thousands) | | $ | 10,592 | | | $ | 5,851 | | | $ | 12,919 | | | $ | 12,434 | | | $ | 13,561 | |
| Ratio of expenses to average net assets: | | | | | | | | | | | | | | | | | | | | |
Before fees waived/recovered3 | | | 0.67 | %5,6 | | | 0.92 | %5 | | | 0.44 | %5 | | | 0.72 | %5 | | | 1.26 | % |
After fees waived/recovered3 | | | 0.43 | %5 | | | 0.90 | %5 | | | 0.62 | %5 | | | 0.88 | %5 | | | 1.17 | % |
| Ratio of net investment income (loss) to average net assets: | | | | | | | | | | | | | | | | | | | | |
Before fees waived/recovered3,4 | | | 0.05 | %6 | | | (0.10 | )% | | | 0.29 | % | | | (0.22 | )% | | | (0.06 | )% |
After fees waived/recovered3,4 | | | 0.29 | % | | | (0.08 | )% | | | 0.10 | % | | | (0.38 | )% | | | 0.03 | % |
| Portfolio turnover rate | | | 15 | % | | | 7 | % | | | 17 | % | | | 117 | % | | | 17 | % |
1 | Based on average shares outstanding for the period. |
2 | Total returns would have been lower had expenses not been waived by the Advisor. Returns shown do not reflect the deduction of taxes that a shareholder would pay on Fund distributions or the redemption of Fund shares. |
3 | Does not include expenses of investment companies in which the Fund invests. |
4 | Recognition of net investment income by the Fund is affected by the timing of the declaration of dividends by the underlying investment companies in which the Fund invests. The ratio does not include net investment income of the investment companies in which the Fund invests. |
5 | The Advisor does not receive management fees for Fund assets invested in other series of the Trust advised by the Advisor (affiliated investments). |
6 | Ratios exclude the 12b-1 refund (Note 8). |
See accompanying Notes to Financial Statements.
North Square Oak Ridge Dividend Growth Fund
FINANCIAL HIGHLIGHTS
Class I
Per share operating performance.
For a capital share outstanding throughout each period.
| | | For the Year Ended May 31, | |
| | | 2021 | | | 2020 | | | 2019 | | | 2018 | | | 2017 | |
| Net asset value, beginning of period | | $ | 17.47 | | | $ | 16.25 | | | $ | 15.65 | | | $ | 13.69 | | | $ | 12.08 | |
| Income from Investment Operations: | | | | | | | | | | | | | | | | | | | | |
Net investment income1 | | | 0.21 | | | | 0.24 | | | | 0.24 | | | | 0.24 | | | | 0.21 | |
| Net realized and unrealized gain | | | 6.18 | | | | 1.28 | | | | 0.82 | | | | 1.93 | | | | 1.73 | |
| Total from investment operations | | | 6.39 | | | | 1.52 | | | | 1.06 | | | | 2.17 | | | | 1.94 | |
| Less Distributions: | | | | | | | | | | | | | | | | | | | | |
| From net investment income | | | (0.18 | ) | | | (0.25 | ) | | | (0.24 | ) | | | (0.20 | ) | | | (0.19 | ) |
| From net realized gain | | | (0.36 | ) | | | (0.05 | ) | | | (0.22 | ) | | | (0.01 | ) | | | (0.14 | ) |
| Total distributions | | | (0.54 | ) | | | (0.30 | ) | | | (0.46 | ) | | | (0.21 | ) | | | (0.33 | ) |
| Net asset value, end of period | | $ | 23.32 | | | $ | 17.47 | | | $ | 16.25 | | | $ | 15.65 | | | $ | 13.69 | |
Total return2 | | | 37.06 | % | | | 9.35 | % | | | 6.94 | % | | | 15.89 | % | | | 16.25 | % |
| Ratios and Supplemental Data: | | | | | | | | | | | | | | | | | | | | |
| Net assets, end of period (in thousands) | | $ | 16,186 | | | $ | 11,146 | | | $ | 12,014 | | | $ | 10,036 | | | $ | 372 | |
| Ratio of expenses to average net assets: | | | | | | | | | | | | | | | | | | | | |
| Before fees waived and expenses absorbed | | | 1.44 | %3 | | | 1.89 | % | | | 2.38 | % | | | 2.93 | % | | | 36.24 | % |
| After fees waived and expenses absorbed | | | 1.00 | % | | | 1.00 | % | | | 1.00 | % | | | 1.00 | % | | | 1.00 | % |
| Ratio of net investment income (loss) to average net assets: | | | | | | | | | | | | | | | | | | | | |
| Before fees waived and expenses absorbed | | | 0.59 | %3 | | | 0.47 | % | | | 0.18 | % | | | (0.33 | )% | | | (33.57 | )% |
| After fees waived and expenses absorbed | | | 1.03 | % | | | 1.36 | % | | | 1.56 | % | | | 1.60 | % | | | 1.67 | % |
| Portfolio turnover rate | | | 28 | % | | | 18 | % | | | 15 | % | | | 30 | % | | | 22 | % |
1 | Based on average shares outstanding for the period. |
2 | Total returns would have been lower had expenses not been waived by the Advisor. Returns shown do not reflect the deduction of taxes that a shareholder would pay on Fund distributions or the redemption of Fund shares. |
3 | Ratios exclude the 12b-1 refund (Note 8). |
See accompanying Notes to Financial Statements.
North Square Funds
NOTES TO FINANCIAL STATEMENTS
May 31, 2021
Note 1 – Organization
North Square Oak Ridge Small Cap Growth Fund (“Small Cap Growth” or “Small Cap Growth Fund”), North Square Dynamic Small Cap Fund (“Dynamic Small Cap” or “Dynamic Small Cap Fund”), North Square Oak Ridge All Cap Growth Fund (“All Cap Growth” or “All Cap Growth Fund”), North Square Multi Strategy Fund, (“Multi Strategy” or “Multi Strategy Fund”) and North Square Oak Ridge Dividend Growth Fund (“Dividend Growth” or “Dividend Growth Fund”) (each a “Fund” and collectively the “Funds”) are organized as a series of North Square Investments Trust, a Delaware statutory trust (the “Trust”) which is registered as an open-end management investment company under the Investment Company Act of 1940, as amended (the “1940 Act”). The Small Cap Growth Fund, Dynamic Small Cap Fund, All Cap Growth Fund, Multi Strategy Fund, and Dividend Growth Fund are diversified Funds.
The Small Cap Growth Fund’s primary investment objective is to seek capital appreciated. Effective the close of business on May 10, 2019, the Small Cap Growth Fund acquired all the assets and assumed the liabilities of the Oak Ridge Small Cap Growth Fund (the “Predecessor Fund”), a series of Investment Managers Series Trust.
The Dynamic Small Cap Fund’s primary investment objective is to seek long-term capital appreciation. Effective the close of business on May 10, 2019, the Dynamic Small Cap Fund acquired all the assets and assumed the liabilities of the Oak Ridge Dynamic Small Cap Fund (the “Predecessor Fund”), a series of Investment Managers Series Trust.
The All Cap Growth Fund’s primary investment objective is to seek long-term growth of capital. Effective the close of business on May 10, 2019, the All Cap Growth Fund acquired all the assets and assumed the liabilities of the Oak Ridge All Cap Growth Fund (the “Predecessor Fund”), a series of Investment Managers Series Trust.
The Multi Strategy Fund’s primary investment objective is to seek capital appreciation. Effective the close of business on May 10, 2019, the Multi Strategy Fund acquired all the assets and assumed the liabilities of the Oak Ridge Multi Strategy Fund (the “Predecessor Fund”), a series of Investment Managers Series Trust.
The Dividend Growth Fund’s primary investment objective is to provide current income and to seek long-term capital appreciation. Effective the close of business on May 10, 2019, the Dividend Growth Fund acquired all the assets and assumed the liabilities of the Oak Ridge Dividend Growth Fund (the “Predecessor Fund”), a series of Investment Managers Series Trust.
The shares of each class represent an interest in the same portfolio of investments of the Fund and have equal rights as to voting, redemptions, dividends and liquidation, subject to the approval of the Trustees. Income, expenses (other than expenses attributable to a specific class) and realized and unrealized gains and losses on investments are allocated to each class of shares in proportion to their relative shares outstanding. Shareholders of a class that bears distribution and service expenses under the terms of a distribution plan have exclusive voting rights to that distribution plan.
Each Fund is an investment company and accordingly follows the investment company accounting and reporting guidance of the Financial Accounting Standards Board (FASB) Accounting Standard Codification Topic 946 “Financial Services—Investment Companies”.
Note 2 – Accounting Policies
The following is a summary of the significant accounting policies consistently followed by the Funds in the preparation of their financial statements. The preparation of financial statements in conformity with accounting principles generally accepted in the United States of America (“GAAP”) requires management to make estimates and assumptions that affect the reported amounts and disclosures in the financial statements. Actual results could differ from these estimates.
(a) Valuation of Investments
Each Fund values equity securities at the last reported sale price on the principal exchange or in the principal over the counter (“OTC”) market in which such securities are traded, as of the close of regular trading on the NYSE on the day the securities are being valued or, if the last-quoted sales price is not readily available, the securities will be valued at the last bid or the mean between the last available bid and ask price. Securities traded on the NASDAQ are valued at the NASDAQ Official Closing Price (“NOCP”). Investments in open-end investment companies are valued at the daily closing net asset value of the respective investment company. Debt securities are valued by utilizing a price supplied by independent pricing service providers. The independent pricing service providers may use various valuation methodologies including matrix pricing and other analytical pricing models as well as market transactions and dealer quotations. These models generally consider such factors as yields or prices of bonds of comparable quality, type of issue, coupon, maturity, ratings and general market conditions. If a price is not readily available for a portfolio security, the security will be valued at fair value (the amount which the Fund might reasonably expect to receive for the security upon its current sale) as determined in good faith by the Fund’s advisor, subject to review and approval by the Valuation Committee, pursuant to procedures adopted by the Board of Trustees. The actions of the Valuation Committee are subsequently reviewed by the Board at its next regularly scheduled board meeting. The Valuation Committee meets as needed. The Valuation Committee is comprised of all the Trustees, but action may be taken by any one of the Trustees.
North Square Funds
NOTES TO FINANCIAL STATEMENTS – Continued
May 31, 2021
Fair value pricing may be applied to foreign securities held by the Funds upon the occurrence of an event after the close of trading on non-U.S. markets but before the close of trading on the NYSE when each Fund’s NAV is determined. If the event may result in a material adjustment to the price of the Fund’s foreign securities once non-U.S. markets open on the following business day (such as, for example, a significant surge or decline in the U.S. market), the Fund may value such foreign securities at fair value, taking into account the effect of such event, in order to calculate the Fund’s NAV. Other types of portfolio securities that the Fund may fair value include, but are not limited to: (1) investments that are illiquid or traded infrequently, including “restricted” securities and private placements for which there is no public market; (2) investments for which, in the judgment of the advisor, the market price is stale; (3) securities of an issuer that has entered into a restructuring; (4) securities for which trading has been halted or suspended; and (5) fixed income securities for which there is not a current market value quotation.
Foreign securities traded in countries outside the U.S. are fair valued by utilizing the quotations of an independent pricing service or from a brokerage firm. The pricing service or broker will use a statistical analyses and quantitative models to adjust local prices using factors such as subsequent movement and changes in the prices of indexes, securities and exchange rates in other markets in determining fair value as of the time the Fund calculates the NAVs. The Board reviews the independent third party fair valuation analysis report quarterly.
The global outbreak of COVID-19 (commonly referred to as “coronavirus”) has disrupted economic markets and the prolonged economic impact is uncertain. The ultimate economic fallout from the pandemic, and the long-term impact on economies, markets, industries and individual issuers, are not known. The operational and financial performance of the issuers of securities in which the Funds invest depends on future developments, including the duration and spread of the outbreak, and such uncertainty may in turn adversely affect the value and liquidity of the Funds’ investments, impair the Funds’ ability to satisfy redemption requests, and negatively impact the Funds’ performance.
(b) Investment Transactions, Investment Income and Expenses
Investment transactions are accounted for on the trade date. Realized gains and losses on investments are determined on the identified cost basis. Dividend income is recorded net of applicable withholding taxes on the ex-dividend date and interest income is recorded on an accrual basis. Withholding taxes on foreign dividends, if applicable, are paid (a portion of which may be reclaimable) or provided for in accordance with the applicable country’s tax rules and rates and are disclosed in the Statements of Operations. Withholding tax reclaims are filed in certain countries to recover a portion of the amounts previously withheld. The Funds record a reclaim receivable based on a number of factors, including a jurisdiction’s legal obligation to pay reclaims as well as payment history and market convention. Discounts or premiums on debt securities are accreted or amortized to interest income over the lives of the respective securities using the effective interest method. Income and expenses of the Funds are allocated on a pro rata basis to each class of shares. Expenses incurred by the Trust with respect to more than one fund are allocated in proportion to the net assets of each fund except where allocation of direct expenses to each fund or an alternative allocation method can be more appropriately made. Expenses such as distribution and service fees pursuant to Rule 12b-1, transfer agent fees and expenses with respect to the Funds, that are specific to individual share classes, are accrued directly to the respective share class.
(c) Federal Income Taxes
Each Fund intends to comply with the requirements of Subchapter M of the Internal Revenue Code applicable to regulated investment companies and to distribute substantially all of its net investment income and any net realized gains to its shareholders. Therefore, no provision is made for federal income or excise taxes. Due to the timing of dividend distributions and the differences in accounting for income and realized gains and losses for financial statement and federal income tax purposes, the fiscal year in which amounts are distributed may differ from the year in which the income and realized gains and losses are recorded by the Funds.
Accounting for Uncertainty in Income Taxes (the “Income Tax Statement”) requires an evaluation of tax positions taken (or expected to be taken) in the course of preparing a Fund’s tax returns to determine whether these positions meet a “more-likely-than-not” standard that, based on the technical merits, have a more than fifty percent likelihood of being sustained by a taxing authority upon examination. A tax position that meets the “more-likely-than-not” recognition threshold is measured to determine the amount of benefit to recognize in the financial statements. The Fund recognizes interest and penalties, if any, related to unrecognized tax benefits as income tax expense in the Statement of Operations.
The Income Tax Statement requires management of the Funds to analyze tax positions taken in the prior three open tax years, if any, and tax positions expected to be taken in the Funds’ current tax year, as defined by the IRS statute of limitations for all major jurisdictions, including federal tax authorities and certain state tax authorities. As of and during the open years ended May 31, 2018-2020 the Funds did not have a liability for any unrecognized tax benefits. The Funds have no examination in progress and are not aware of any tax positions for which it is reasonably possible that the total amounts of unrecognized tax benefits will significantly change in the next twelve months.
North Square Funds
NOTES TO FINANCIAL STATEMENTS – Continued
May 31, 2021
(d) Distributions to Shareholders
The Dividend Growth Fund will make distributions of net investment income quarterly. The Small Cap Growth Fund, Dynamic Small Cap Fund, All Cap Growth Fund, and Multi Strategy Fund will make distributions of net investment income, if any, at least annually. Each Fund makes distributions of its net capital gains, if any, at least annually. Distributions to shareholders are recorded on the ex-dividend date. The amount and timing of distributions are determined in accordance with federal income tax regulations, which may differ from GAAP.
The character of distributions made during the year from net investment income or net realized gains may differ from the characterization for federal income tax purposes due to differences in the recognition of income, expense and gain (loss) items for financial statement and tax purposes.
Note 3 – Reorganization Information
Effective upon the close of business on May 29, 2020, the outstanding Class A shares of the Dynamic Small Cap Fund and the Dividend Growth Fund were converted into Class I shares of their respective funds, as applicable (the “Class Conversion”) pursuant to the Supplement to the Prospectus dated April 29, 2020. The Class Conversion was completed based on the share classes’ relative net asset values on the date of conversion, without the imposition of any sales charge or any other charge as detailed below:
| | | Shares | | | Net | | | NAV | | | Share | |
| Dynamic Small Cap Fund | | Outstanding | | | Assets | | | per Share | | | Conversion Ratio | |
| Class A | | | 6,302 | | | $ | 71,729 | | | $ | 11.3825 | | | 0.9929 | |
| Class I (before conversion) | | | 1,345,847 | | | $ | 15,429,378 | | | $ | 11.4644 | | | | |
| Class I (after conversion) | | | 1,351,995 | | | $ | 15,499,862 | | | $ | 11.4644 | | | | |
| | | | | | | | | | | | | | | | |
| | | Shares | | | Net | | | NAV | | | Share | |
| Dividend Growth Fund | | Outstanding | | | Assets | | | per Share | | | Conversion Ratio | |
| Class A | | | 58,551 | | | $ | 1,015,389 | | | $ | 17.3420 | | | 0.9925 | |
| Class I (before conversion) | | | 629,655 | | | $ | 11,001,753 | | | $ | 17.4727 | | | | |
| Class I (after conversion) | | | 637,893 | | | $ | 11,145,684 | | | $ | 17.4727 | | | | |
Effective upon the close of business on October 9, 2020, the outstanding Class C and Class K shares of the Small Cap Growth Fund and the Class C shares of the Multi Strategy Fund were converted into Class I shares of their respective funds, as applicable (the “Class Conversion”) pursuant to the Supplement to the Prospectus dated August 10, 2020. The Class Conversion was completed based on the share classes’ relative net asset values on the date of conversion, without the imposition of any sales charge or any other charge as detailed below:
| | | Shares | | | Net | | | NAV | | | Share | |
| Small Cap Growth Fund | | Outstanding | | | Assets | | | per Share | | | Conversion Ratio | |
| Class C | | | 3,147,304 | | | $ | 9,634,212 | | | $ | 3.0611 | | | 0.1852 | |
| Class K | | | 105,492 | | | $ | 1,719,425 | | | $ | 16.2991 | | | 0.9862 | |
| Class I (before conversion) | | | 2,729,370 | | | $ | 45,107,746 | | | $ | 16.5268 | | | | |
| Class I (after conversion) | | | 3,416,353 | | | $ | 56,461,383 | | | $ | 16.5268 | | | | |
| | | | | | | | | | | | | | | | |
| | | Shares | | | Net | | | NAV | | | Share | |
| Multi Strategy Fund | | Outstanding | | | Assets | | | per Share | | | Conversion Ratio | |
| Class C | | | 218,468 | | | $ | 3,433,793 | | | $ | 15.7176 | | | 0.7701 | |
| Class I (before conversion) | | | 319,524 | | | $ | 6,521,801 | | | $ | 20.4110 | | | | |
| Class I (after conversion) | | | 487,756 | | | $ | 9,955,594 | | | $ | 20.4110 | | | | |
North Square Funds
NOTES TO FINANCIAL STATEMENTS – Continued
May 31, 2021
Note 4 – Investment Advisory and Other Agreements
The Trust, on behalf of the Funds, entered into an Investment Advisory Agreement (the “Agreement”) with North Square Investments, LLC (the “Advisor” or “NSI”). Under the terms of the Agreement, the Funds pay a monthly investment advisory fee to the Advisor based on each Fund’s average daily net assets. Fees paid to the Advisor for the period ended May 31, 2021 are reported on the Statements of Operations. The annual and tiered rates are listed by Fund in the below table:
| | | Investment | |
| | | Advisory Fees | |
| | Small Cap Growth Fund | | |
| | First $1 billion | 0.85% | |
| | Thereafter | 0.80% | |
| | Dynamic Small Cap Fund | 0.90% | |
| | All Cap Growth Fund | 0.70% | |
| | Multi Strategy Fund | 0.00% – 0.50%1 | |
| | Dividend Growth Fund | 0.75% | |
1 | The annual advisory fee is calculated as follows: (i) 0.00% for Fund assets invested in other series of the Trust advised by the Advisor (“affiliated investments”) and (ii) 0.50% for Fund assets invested in non-affiliated investments. For the period ended May 31, 2021, the amount of advisory fees waived due to affiliated investments is reported under “Affiliated fund fee waived” on the Statements of Operations. |
The Advisor engages Oak Ridge Investments, LLC (“Oak Ridge”) to manage the Small Cap Growth Fund, All Cap Growth Fund, Multi Strategy Fund and Dividend Growth Fund as a sub-advisor. The Advisor also engages Algert Global LLC (“Algert Global”) to manage the Dynamic Small Cap Fund as a sub-advisor. The Advisor pays the sub-advisors from its advisory fees.
The Advisor has contractually agreed to waive its fee and, if necessary, to absorb other operating expenses to ensure that total annual operating expenses (excluding taxes, leverage interest, brokerage commissions, dividend and interest expenses on short sales, acquired fund fees and expenses as determined in accordance with Form N-1A, expenses incurred in connection with any merger or reorganization, or extraordinary expenses such as litigation expenses) are limited. The agreements are effective until the dates listed below and may be terminated before those dates only by the Trust’s Board of Trustees. The table below contains the agreement expiration and expense cap by Fund and by Class:
| | | Total Limit on Annual Operating Expenses |
| | | Class A | Class I |
| | Agreement Expires | Shares† | Shares† |
| Small Cap Growth Fund | September 30, 2021 | 1.39% | 1.14% |
| Dynamic Small Cap Fund | September 30, 2029 | — | 1.15% |
| All Cap Growth Fund | September 30, 2029 | 1.20%* | 0.95% |
| Multi Strategy Fund | September 30, 2029 | 1.20% | 1.17% |
| Dividend Growth Fund | September 30, 2029 | — | 1.00% |
| † | The total limit on annual operating expenses is calculated based on each Fund’s average daily net assets. |
| * | This class is currently not available for purchase. |
Each Fund’s advisor is permitted to seek reimbursement from the Fund, subject to certain limitations, of fees waived or payments made to the Fund for a period ending thirty-six months after the date of the waiver or payment. The Multi Strategy Fund includes a maximum reimbursement of 0.20% per fiscal year. This reimbursement may be requested from the Fund if the reimbursement will not cause the Fund’s annual expense ratio to exceed the lesser of (a) the expense limitation amount in effect at the time such fees were waived or payments made, or (b) the expense limitation amount in effect at the time of the reimbursement. For the period ended May 31, 2021, the Small Cap Growth Fund recouped $8,094 in the Class I shares, and the Multi Strategy Fund recouped $87,092 and $4,935 in the Class A and Class C shares, respectively. The Advisor may recapture all or a portion of this amount no later than the dates stated below:
| | | Small Cap Growth Fund | |
| | | Class A | | | Class I | | | Total | |
| May 31, 2022 | | $ | 115,146 | | | $ | 119,436 | | | $ | 234,582 | |
| May 31, 2023 | | $ | 642,383 | | | $ | 341,572 | | | $ | 983,955 | |
| May 31, 2024 | | $ | 312,918 | | | $ | 166,395 | | | $ | 479,313 | |
| | | $ | 1,070,447 | | | $ | 627,403 | | | $ | 1,697,850 | |
North Square Funds
NOTES TO FINANCIAL STATEMENTS – Continued
May 31, 2021
| | | Multi Strategy Fund | |
| | | Class A | | | Class I | | | Total | |
| May 31, 2022 | | $ | — | | | $ | — | | | $ | — | |
| May 31, 2023 | | $ | 1,388 | | | $ | — | | | $ | 1,388 | |
| May 31, 2024 | | $ | — | | | $ | — | | | $ | — | |
| | | $ | 1,388 | | | $ | — | | | $ | 1,388 | |
| | | | | | | | | | | | | |
| | | Dynamic | | | | | | | Dividend | |
| | | Small | | | All Cap | | | Growth | |
| | | Cap Fund | | | Growth Fund | | | Fund | |
| May 31, 2022 | | $ | 221,364 | | | $ | 162,758 | | | $ | 166,469 | |
| May 31, 2023 | | $ | 206,505 | | | $ | 120,773 | | | $ | 119,996 | |
| May 31, 2024 | | $ | 98,584 | | | $ | 68,724 | | | $ | 60,057 | |
| | | $ | 526,453 | | | $ | 352,255 | | | $ | 346,522 | |
U.S. Bancorp Fund Services, LLC doing business as U.S. Bank Global Fund Services (“GFS”) serves as the Funds’ fund accountant, transfer agent and administrator. U.S. Bank N.A., serves as the Funds’ custodian. The Funds’ allocated fees incurred for fund accounting, transfer agency, fund administration and custody services for the period ended May 31, 2021 are reported on the Statements of Operations.
Compass Distributors, LLC serves as the Funds’ distributor (the “Distributor”). The Distributor does not receive compensation from the Funds for its distribution services; the Advisor pays the Distributor a fee for its distribution-related services.
Cipperman Compliance Services provides Chief Compliance Officer (“CCO”) services to the Trust. The Funds’ allocated fees incurred for CCO services for the period ended May 31, 2021, are reported on the Statements of Operations.
Note 5 – Federal Income Taxes
At May 31, 2021, gross unrealized appreciation and depreciation of investments, based on cost for federal income tax purposes were as follows:
| | | Small Cap | | | Dynamic | | | All Cap | |
| | | Growth Fund | | | Small Cap Fund | | | Growth Fund | |
| Cost of investments | | $ | 95,094,906 | | | $ | 17,870,488 | | | $ | 6,129,952 | |
| Gross unrealized appreciation | | $ | 57,554,173 | | | $ | 3,199,076 | | | $ | 6,378,111 | |
| Gross unrealized depreciation | | | (3,899,518 | ) | | | (747,296 | ) | | | (31,287 | ) |
| Net unrealized appreciation on investments | | $ | 53,654,655 | | | $ | 2,451,780 | | | $ | 6,346,824 | |
| | | | | | | | | | | | | |
| | | Multi Strategy | | | Dividend | | | | | |
| | | Fund | | | Growth Fund | | | | | |
| Cost of investments | | $ | 37,852,940 | | | $ | 9,885,670 | | | | | |
| Gross unrealized appreciation | | $ | 18,251,959 | | | $ | 6,314,266 | | | | | |
| Gross unrealized depreciation | | | (126,333 | ) | | | (10,777 | ) | | | | |
| Net unrealized appreciation on investments | | $ | 18,125,626 | | | $ | 6,303,489 | | | | | |
The difference between cost amounts for financial statement and federal income tax purposes is due primarily to timing differences in recognizing certain gains and losses in security transactions.
GAAP requires that certain components of net assets be reclassified between financial and tax reporting. These reclassifications have no effect on net assets or net asset value per share. For the year ended May 31, 2021, permanent differences in book and tax accounting have been reclassified to paid in capital, accumulated net investment income/loss and accumulated net realized gain/loss as follows:
North Square Funds
NOTES TO FINANCIAL STATEMENTS – Continued
May 31, 2021
| | | Increase (Decrease) | |
| | | | | | Total | |
| | | | | | Distributable | |
| | | Paid In Capital | | | Earnings | |
| Small Cap Growth Fund | | $ | 5,735,994 | | | $ | (5,735,994 | ) |
| Dynamic Small Cap Fund | | $ | 436,050 | | | $ | (436,050 | ) |
| All Cap Growth Fund | | $ | 172,734 | | | $ | (172,734 | ) |
| Multi Strategy Fund | | $ | 20,299 | | | $ | (20,299 | ) |
| Dividend Growth Fund | | $ | — | | | $ | — | |
As of May 31, 2021, the components of accumulated earnings (deficit) on a tax basis for the Funds were as follows:
| | | Small Cap | | | Dynamic | | | All Cap | |
| | | Growth Fund | | | Small Cap Fund | | | Growth Fund | |
| Undistributed ordinary income | | $ | 2,234,366 | | | $ | 4,543,870 | | | $ | 10,604 | |
| Undistributed long-term gains | | | 10,131,497 | | | | 622,750 | | | | 1,722,827 | |
| Accumulated earnings | | $ | 12,365,863 | | | $ | 5,166,620 | | | $ | 1,733,431 | |
| Accumulated capital and other losses | | $ | — | | | $ | — | | | $ | 0 | |
| Net unrealized appreciation on investments | | | 53,654,655 | | | | 2,451,780 | | | | 6,346,824 | |
| Total accumulated earnings | | $ | 66,020,518 | | | $ | 7,618,400 | | | $ | 8,080,255 | |
| | | | | | | | | | | | | |
| | | Multi Strategy | | | Dividend | | | | | |
| | | Fund | | | Growth Fund | | | | | |
| Undistributed ordinary income | | $ | — | | | $ | 18,169 | | | | | |
| Undistributed long-term gains | | | 3,299,525 | | | | 397,951 | | | | | |
| Accumulated earnings | | $ | 3,299,525 | | | $ | 416,120 | | | | | |
| Accumulated capital and other losses | | $ | (146,333 | ) | | $ | 0 | | | | | |
| Net unrealized appreciation on investments | | | 18,125,626 | | | | 6,303,489 | | | | | |
| Total accumulated earnings | | $ | 21,278,818 | | | $ | 6,719,609 | | | | | |
The tax character of distributions paid during the fiscal years ended May 31, 2021 and May 31, 2020 were as follows:
| | | Small Cap | | | Dynamic | | | All Cap | |
| | | Growth Fund | | | Small Cap Fund | | | Growth Fund | |
| | | May 31, | | | May 31, | | | May 31, | | | May 31, | | | May 31, | | | May 31, | |
| Distributions paid from: | | 2021 | | | 2020 | | | 2021 | | | 2020 | | | 2021 | | | 2020 | |
| Ordinary income | | $ | 2,283,449 | | | $ | — | | | $ | 72,357 | | | $ | 51,913 | | | $ | 16,524 | | | $ | 5,773 | |
| Net long-term capital gains | | | 14,758,820 | | | | 27,681,910 | | | | 288,617 | | | | — | | | | 758,526 | | | | 595,189 | |
| Total distributions paid | | $ | 17,042,269 | | | $ | 27,681,910 | | | $ | 360,974 | | | $ | 51,913 | | | $ | 775,050 | | | $ | 600,962 | |
| | | | | | | | | | | | | | | | | | | | | | | | | |
| | | Multi Strategy | | | Dividend | | | | | | | | | |
| | | Fund | | | Growth Fund | | | | | | | | | |
| | | May 31, | | | May 31, | | | May 31, | | | May 31, | | | | | | | | | |
| Distributions paid from: | | 2021 | | | 2020 | | | 2021 | | | 2020 | | | | | | | | | |
| Ordinary income | | $ | — | | | $ | 3,325,416 | | | $ | 125,884 | | | $ | 216,749 | | | | | | | | | |
| Net long-term capital gains | | | — | | | | — | | | | 243,545 | | | | — | | | | | | | | | |
| Total distributions paid | | $ | — | | | $ | 3,325,416 | | | $ | 369,429 | | | $ | 216,749 | | | | | | | | | |
As of May 31, 2021, the Funds did not have any accumulated capital loss carryforwards.
As of May 31, 2021, the Funds had the following qualified late-year ordinary losses which are deferred until fiscal year 2021 for tax purposes. Net late-year losses incurred after December 31, and within the taxable year are deemed to arise on the first day of the Fund’s next taxable year.
North Square Funds
NOTES TO FINANCIAL STATEMENTS – Continued
May 31, 2021
| | | Late Year Losses | | | Post October Losses | |
| Small Cap Growth Fund | | $ | — | | | $ | — | |
| Dynamic Small Cap Fund | | $ | — | | | $ | — | |
| All Cap Growth Fund | | $ | — | | | $ | — | |
| Multi Strategy Fund | | $ | (146,333 | ) | | $ | — | |
| Dividend Growth Fund | | $ | — | | | $ | — | |
Note 6 – Investment Transactions
For the year ended May 31, 2021, purchases and sales of investments were as follows:
| | | Purchases | | | Sales | |
| Small Cap Growth Fund | | $ | 46,156,500 | | | $ | 74,504,341 | |
| Dynamic Small Cap Fund | | $ | 32,446,014 | | | $ | 36,670,008 | |
| All Cap Growth Fund | | $ | 1,122,088 | | | $ | 4,928,987 | |
| Multi Strategy Fund | | $ | 7,193,193 | | | $ | 9,859,015 | |
| Dividend Growth Fund | | $ | 4,043,405 | | | $ | 3,830,552 | |
Note 7 – Shareholder Servicing Plan
The Trust, on behalf of the Funds, has adopted a Shareholder Servicing Plan to pay a fee at an annual rate of up to 0.15% of each Fund’s average daily net assets of shares serviced by shareholder servicing agents who provide administrative and support services to their customers.
For the period ended May 31, 2021, shareholder servicing fees incurred are disclosed on the Statements of Operations.
Note 8 – Distribution Plan
The Trust, on behalf of each Fund, has adopted a Distribution Plan (the “Plan”) pursuant to Rule 12b-1 under the 1940 Act that allows each Fund to pay distribution fees for the sale and distribution of its Class A and Class C shares. The Plan provides for the payment of distribution fees at the annual rate of up to 0.25% of each Fund’s average daily net assets attributable to Class A shares and 1.00% of average daily net assets attributable to Class C shares.
For the period ended May 31, 2021, distribution fees incurred with respect to Class A and Class C shares are disclosed on the Statements of Operations.
In May of 2021, the Funds' distributor, Compass Distributors, LLC, returned unused 12b-1 fees from closed share classes. The Dividend Growth Fund Class A shares closed in May of 2020, the Small Cap Growth Fund Class C shares closed in October of 2020, and the Multi Strategy Fund Class C shares closed in October of 2020. All shareholders of these closed classes were converted into the Class I shares of each respective Fund. The amounts in the table below were returned to the respective Funds during the fiscal year ended May 31, 2021.
| | | Fees Returned | |
| Dividend Growth Fund | | $ | 1,007 | |
| Small Cap Growth Fund | | | 79,654 | |
| Multi Strategy Fund | | | 20,501 | |
The return of 12b-1 fees by the Distributor is non-recurring and is included in the ratios appearing in the financial highlights of this report. Had the Funds not received the returned 12b-1 fees, the ratios of net expenses to average net assets and net investment income/(loss) to average net assets would have been:
| | | | Ratio of Net | Ratio of Net |
| | Ratio of | Ratio of | Investment | Investment |
| | Expenses to Average | Expenses to average | Income/(Loss) to | Income/(Loss) to |
| | Net Assets Before | Net Assets After | Average Net Assets | Average Net Assets |
| | Fees Waived and | Fees Waived and | Before Fees Waived and | After Fees Waived and |
| | Expenses Absorbed | Expenses Absorbed | Expenses Absorbed | Expenses Absorbed |
| | Year Ended | Year Ended | Year Ended | Year Ended |
| | May 31, 2021 | May 31, 2021 | May 31, 2021 | May 31, 2021 |
| Dividend Growth Fund Class I | 1.44% | 1.01% | 0.59% | 1.02% |
| Small Cap Growth Fund Class I | 1.51% | 1.23% | (1.31)% | (1.02)% |
| Multi Strategy Fund Class I | 0.66% | 0.66% | 0.05% | 0.05% |
North Square Funds
NOTES TO FINANCIAL STATEMENTS – Continued
May 31, 2021
Except for the Fund classes listed below, total return would have been the same for the year ended May 31, 2021, if the Funds had not received the returned 12b-1 fee amounts reported above. Had the Funds not received the 12b-1 fee amounts the total return would have been:
| | Year Ended May 31, 2021 |
| Small Cap Growth Fund Class I | 43.73% |
| Multi Strategy Fund Class I | 39.80% |
Note 9 – Indemnifications
In the normal course of business, the Funds enter into contracts that contain a variety of representations which provide general indemnifications. The Funds’ maximum exposure under these arrangements is unknown, as this would involve future claims that may be made against the Funds that have not yet occurred. However, the Funds expect the risk of loss to be remote.
Note 10 – Fair Value Measurements and Disclosure
Fair Value Measurements and Disclosures defines fair value, establishes a framework for measuring fair value in accordance with GAAP, and expands disclosure about fair value measurements. It also provides guidance on determining when there has been a significant decrease in the volume and level of activity for an asset or a liability, when a transaction is not orderly, and how that information must be incorporated into a fair value measurement.
Under Fair Value Measurements and Disclosures, various inputs are used in determining the value of the Funds’ investments. These inputs are summarized into three broad Levels as described below:
| | • | Level 1 – Unadjusted quoted prices in active markets for identical assets or liabilities that the Fund has the ability to access. |
| | | |
| | • | Level 2 – Observable inputs other than quoted prices included in Level 1 that are observable for the asset or liability, either directly or indirectly. These inputs may include quoted prices for the identical instrument on an inactive market, prices for similar instruments, interest rates, prepayment speeds, credit risk, yield curves, default rates and similar data. |
| | | |
| | • | Level 3 – Unobservable inputs for the asset or liability, to the extent relevant observable inputs are not available, representing the Fund’s own assumptions about the assumptions a market participant would use in valuing the asset or liability, and would be based on the best information available. |
The availability of observable inputs can vary from security to security and is affected by a wide variety of factors, including for example, the type of security, whether the security is new and not yet established in the marketplace, the liquidity of markets, and other characteristics particular to the security. To the extent that valuation is based on models or inputs that are less observable or unobservable in the market, the determination of fair value requires more judgment. Accordingly, the degree of judgment exercised in determining fair value is greatest for instruments categorized in Level 3.
The inputs to measure fair value may fall into different Levels of the fair value hierarchy. In such cases, for disclosure purposes, the Level in the fair value hierarchy within which the fair value measurement falls in its entirety, is determined based on the lowest Level input that is significant to the fair value measurement in its entirety.
The inputs or methodology used for valuing securities are not an indication of the risk associated with investing in those securities. The following is a summary of the inputs used, as of May 31, 2021, in valuing the Funds’ assets carried at fair value:
| Small Cap Growth Fund | | Level 1 | | | Level 2* | | | Level 3** | | | Total | |
| Investments | | | | | | | | | | | | |
Common Stocks1 | | $ | 148,023,534 | | | $ | — | | | $ | — | | | $ | 148,023,534 | |
| Short-Term Investment | | | 726,027 | | | | — | | | | — | | | | 726,027 | |
| Total | | $ | 148,749,561 | | | $ | — | | | $ | — | | | $ | 148,749,561 | |
| | | | | | | | | | | | | | | | | |
| Dynamic Small Cap Fund | | Level 1 | | | Level 2* | | | Level 3 | | | Total | |
| Investments | | | | | | | | | | | | | | | | |
Common Stocks1 | | $ | 19,408,285 | | | $ | — | | | $ | — | | | $ | 19,408,285 | |
| REITs | | | 618,032 | | | | — | | | | — | | | | 618,032 | |
| Rights | | | — | | | | — | | | | 818 | | | | 818 | |
| Short-Term Investment | | | 295,133 | | | | — | | | | — | | | | 295,133 | |
| Total | | $ | 20,321,450 | | | $ | — | | | $ | 818 | | | $ | 20,322,268 | |
North Square Funds
NOTES TO FINANCIAL STATEMENTS – Continued
May 31, 2021
| All Cap Growth Fund | | Level 1 | | | Level 2* | | | Level 3** | | | Total | |
| Investments | | | | | | | | | | | | |
Common Stocks1 | | $ | 11,728,194 | | | $ | — | | | $ | — | | | $ | 11,728,194 | |
| REIT | | | 109,772 | | | | — | | | | — | | | | 109,772 | |
| Short-Term Investment | | | 638,810 | | | | — | | | | — | | | | 638,810 | |
| Total | | $ | 12,476,776 | | | $ | — | | | $ | — | | | $ | 12,476,776 | |
| | | | | | | | | | | | | | | | | |
| Multi Strategy Fund | | Level 1 | | | Level 2* | | | Level 3** | | | Total | |
| Investments | | | | | | | | | | | | | | | | |
| Mutual Funds | | $ | 54,712,344 | | | $ | — | | | $ | — | | | $ | 54,712,344 | |
| Short-Term Investment | | | 1,266,222 | | | | — | | | | — | | | | 1,266,222 | |
| Total | | $ | 55,978,566 | | | $ | — | | | $ | — | | | $ | 55,978,566 | |
| | | | | | | | | | | | | | | | | |
| Dividend Growth Fund | | Level 1 | | | Level 2* | | | Level 3** | | | Total | |
| Investments | | | | | | | | | | | | | | | | |
Common Stocks1 | | $ | 15,634,157 | | | $ | — | | | $ | — | | | $ | 15,634,157 | |
| REIT | | | 498,935 | | | | — | | | | — | | | | 498,935 | |
| Short-Term Investment | | | 56,067 | | | | — | | | | — | | | | 56,067 | |
| Total | | $ | 16,189,159 | | | $ | — | | | $ | — | | | $ | 16,189,159 | |
1 | | For a detailed break-out of these securities by major sector and industry classification, please refer to the Schedule of Investments. |
| * | | The Fund did not hold any Level 2 securities at period end. |
| ** | | The Fund did not hold any Level 3 securities at period end. |
The following is a reconciliation of assets in which significant unobservable inputs (Level 3) were used in determining value:
| | |
| | Dynamic Small Cap Fund |
| Beginning balance May 31, 2020 | | $ | 5,544 | | |
| Transfers into Level 3 during the period | | | — | | |
| Transfers out of Level 3 during the period | | | — | | |
| Total realized gain (loss) | | | — | | |
| Total unrealized appreciation (depreciation) | | | (4,726 | ) | |
| Net purchases | | | — | | |
| Net sales | | | — | | |
| Balance as of May 31, 2021 | | $ | 818 | | |
| | | | | | Impact to |
| | | | | | Valuation from |
| | Fair Value | Valuation | Unobservable | Input | an increase |
| | May 31, 2021 | Methodologies | Input1 | Range/Value | in Input2 |
| Dynamic Small Cap Fund – | | Fair Value | Adjusted by management to | | |
| Rights | $818 | Pricing | reflect current conditions | — | Increase |
1 | The investment advisor considers relevant indications of value that are reasonably and timely available to it in determining the fair value to be assigned to a particular security, such as the type and cost of the security; contractual or legal restrictions on resale of the security; relevant financial or business developments of the issuer; actively traded related securities; conversion or exchange rights on the security; related corporate actions; significant events occurring after the close of trading in the security; and changes in overall market conditions. The Fund’s use of fair value pricing may cause the net asset value of Fund shares to differ from the net asset value that would be calculated using market quotations. Fair value pricing involves subjective judgments and it is possible that the fair value determined for a security may be materially different than the value that could be realized upon the sale of that security. |
2 | This column represents the directional change in the fair value of the Level 3 investments that would result from an increase to the corresponding unobservable input. A decrease to the unobservable input would have the opposite effect. |
North Square Funds
NOTES TO FINANCIAL STATEMENTS – Continued
May 31, 2021
Note 11 – Investments in Affiliated Issuers
An affiliated issuer is an entity in which the Fund has ownership of at least 5% of the voting securities or any investment in a North Square Fund. Issuers that are affiliates of the Fund at period-end are noted in the Fund’s Schedule of Investments. Additional security purchases and the reduction of certain securities shares outstanding of existing portfolio holdings that were not considered affiliated in prior years may result in the Fund owning in excess of 5% of the outstanding shares at period-end. The table below reflects transactions during the period with entities that are affiliates as of May 31, 2021 and may include acquisitions of new investments, prior year holdings that became affiliated during the period and prior period affiliated holdings that are no longer affiliated as of period-end.
| | | | | | | | | | | | | | | Change in | | | | | | | | | | |
| | | Value, | | | | | | | | | Net | | | Unrealized | | | Value, | | | | | | Capital | |
| | | Beginning | | | | | | Sales | | | Realized | | | Appreciation | | | End | | | Dividend | | | Gain | |
| | | of Period | | | Purchases | | | Proceeds | | | Gain (Loss) | | | (Depreciation) | | | of Period | | | Income | | | Distributions | |
| North Square Advisory | | | | | | | | | | | | | | | | | | | | | | | | |
| Research All Cap | | | | | | | | | | | | | | | | | | | | | | | | |
| Value Fund – Class I | | $ | — | | | $ | 3,122,663 | | | $ | (50,000 | ) | | $ | 353 | | | $ | 435,518 | | | $ | 3,508,534 | | | $ | 11,427 | | | $ | 111,236 | |
| | | | | | | | | | | | | | | | | | | | | | | | | | | | | | | | | |
| North Square Altrinsic | | | | | | | | | | | | | | | | | | | | | | | | | | | | | | | | |
| International Equity | | | | | | | | | | | | | | | | | | | | | | | | | | | | | | | | |
| Fund – Class I | | | — | | | | 1,001,077 | | | | — | | | | — | | | | 113,277 | | | | 1,114,354 | | | | 1,077 | | | | — | |
| | | | | | | | | | | | | | | | | | | | | | | | | | | | | | | | | |
| North Square Dynamic | | | | | | | | | | | | | | | | | | | | | | | | | | | | | | | | |
| Small Cap Fund – Class I | | | 14,625,699 | | | | 340,915 | | | | (4,200,000 | ) | | | 893,138 | | | | 7,206,044 | | | | 18,865,796 | | | | 68,336 | | | | 272,578 | |
| | | | | | | | | | | | | | | | | | | | | | | | | | | | | | | | | |
| North Square McKee | | | | | | | | | | | | | | | | | | | | | | | | | | | | | | | | |
| Bond Fund – Class I | | | — | | | | 1,504,367 | | | | — | | | | — | | | | (12,774 | ) | | | 1,491,593 | | | | 4,367 | | | | — | |
| | | | | | | | | | | | | | | | | | | | | | | | | | | | | | | | | |
| North Square Oak Ridge | | | | | | | | | | | | | | | | | | | | | | | | | | | | | | | | |
| All Cap Growth Fund – | | | | | | | | | | | | | | | | | | | | | | | | | | | | | | | | |
| Class I | | | 11,777,503 | | | | 747,267 | | | | (3,825,000 | ) | | | 1,159,185 | | | | 2,014,055 | | | | 11,873,010 | | | | 15,932 | | | | 731,335 | |
| | | | | | | | | | | | | | | | | | | | | | | | | | | | | | | | | |
| North Square Oak Ridge | | | | | | | | | | | | | | | | | | | | | | | | | | | | | | | | |
| Dividend Growth Fund – | | | | | | | | | | | | | | | | | | | | | | | | | | | | | | | | |
| Class I | | | 10,565,429 | | | | 327,277 | | | | — | | | | — | | | | 3,588,054 | | | | 14,480,760 | | | | 111,528 | | | | 215,750 | |
| | | | | | | | | | | | | | | | | | | | | | | | | | | | | | | | | |
| North Square Strategic | | | | | | | | | | | | | | | | | | | | | | | | | | | | | | | | |
| Income Fund – Class I | | | 1,107,398 | | | | 81,993 | | | | — | | | | — | | | | 32,272 | | | | 1,221,663 | | | | 78,174 | | | | 3,819 | |
| | | $ | 38,076,029 | | | $ | 7,125,559 | | | $ | (8,075,000 | ) | | $ | 2,052,676 | | | $ | 13,376,446 | | | $ | 52,555,710 | | | $ | 290,841 | | | $ | 1,334,718 | |
| | | Shares, | | | | | | | | | Shares, | | |
| | | Beginning | | | | | | | | | End | | |
| | | of Period | | | Purchases | | | Sales | | | of Period | | |
| North Square Advisory Research | | | | | | | | | | | | | |
| All Cap Value Fund – Class I | | | — | | | | 310,165 | | | | (5,194 | ) | | | 304,971 | | |
| | | | | | | | | | | | | | | | | | |
| North Square Altrinsic | | | | | | | | | | | | | | | | | |
| International Equity Fund – | | | | | | | | | | | | | | | | | |
| Class I | | | — | | | | 100,109 | | | | — | | | | 100,109 | | |
| | | | | | | | | | | | | | | | | | |
| North Square Dynamic | | | | | | | | | | | | | | | | | |
| Small Cap Fund – Class I | | | 1,275,860 | | | | 21,554 | | | | (264,973 | ) | | | 1,032,441 | | |
| | | | | | | | | | | | | | | | | | |
| North Square McKee | | | | | | | | | | | | | | | | | |
| Bond Fund – Class I | | | — | | | | 150,441 | | | | — | | | | 150,441 | | |
| | | | | | | | | | | | | | | | | | |
| North Square Oak Ridge | | | | | | | | | | | | | | | | | |
| All Cap Growth Fund – Class I | | | 725,126 | | | | 38,536 | | | | (195,787 | ) | | | 567,875 | | |
| | | | | | | | | | | | | | | | | | |
| North Square Oak Ridge | | | | | | | | | | | | | | | | | |
| Dividend Growth Fund – | | | | | | | | | | | | | | | | | |
| Class I | | | 604,682 | | | | 16,232 | | | | — | | | | 620,914 | | |
| | | | | | | | | | | | | | | | | | |
| North Square Strategic | | | | | | | | | | | | | | | | | |
| Income Fund – Class I | | | 113,000 | | | | 8,291 | | | | — | | | | 121,291 | | |
| | | | | | | | | | | | | | | | 2,898,042 | | |
North Square Funds
NOTES TO FINANCIAL STATEMENTS – Continued
May 31, 2021
Note 12 – Accounting Regulations
Rule 18f-4
In October 2020, the SEC adopted new regulations governing the use of derivatives by registered investment companies (“Rule 18f-4”). Rule 18f-4 will impose limits on the amount of derivatives a Fund can enter into, eliminate the asset segregation framework currently used by funds to comply with Section 18 of the 1940 Act, and require funds whose use of derivatives is greater than a limited specified amount to establish and maintain a comprehensive derivatives risk management program and appoint a derivatives risk manager. Funds will be required to comply with Rule 18f-4 by August 19, 2022. It is not currently clear what impact, if any, Rule 18f-4 will have on the availability, liquidity or performance of derivatives. Management is currently evaluating the potential impact of Rule 18f-4 on the Fund(s). When fully implemented, Rule 18f-4 may require changes in how a Fund uses derivatives, adversely affect the Fund’s performance and increase costs related to the Fund’s use of derivatives.
Rule 2a-5
In December 2020, the SEC adopted a new rule providing a framework for fund valuation practices (“Rule 2a-5”). Rule 2a-5 establishes requirements for determining fair value in good faith for purposes of the 1940 Act. Rule 2a-5 will permit fund boards to designate certain parties to perform fair value determinations, subject to board oversight and certain other conditions. Rule 2a-5 also defines when market quotations are “readily available” for purposes of the 1940 Act and the threshold for determining whether a fund must fair value a security. In connection with Rule 2a-5, the SEC also adopted related recordkeeping requirements and is rescinding previously issued guidance, including with respect to the role of a board in determining fair value and the accounting and auditing of fund investments. The Funds will be required to comply with the rules by September 8, 2022. Management is currently assessing the potential impact of the new rules on the Funds’ financial statements.
Rule 12d1-4
The SEC adopted new Rule 12d1-4, which will allow registered investment companies (including business development companies (“BDCs”), unit investment trusts (“UITs”), closed-end funds, exchange-traded funds (“ETFs”), and exchange-traded managed funds (“ETMFs”) (an “acquiring” fund), to invest in other investment companies (an “acquired fund”), including private funds under a specific exception, beyond the limits of Section 12(d)(1), subject to the conditions of the rule. Rule 12d1‐4 became effective January 19, 2021.
London Interbank Offered Rate (“LIBOR”)
In March 2020, FASB issued ASU 2020-04, Reference Rate Reform: Facilitation of the Effects of Reference Rate Reform on Financial Reporting. The main objective of the new guidance is to provide relief to companies that will be impacted by the expected change in benchmark interest rates at the end of 2021, when participating banks will no longer be required to submit London Interbank Offered Rate (“LIBOR”) quotes by the UK Financial Conduct Authority. The new guidance allows companies to, provided the only change to existing contracts are a change to an approved benchmark interest rate, account for modifications as a continuance of the existing contract without additional analysis. In addition, derivative contracts that qualified for hedge accounting prior to modification, will be allowed to continue to receive such treatment, even if critical terms change due to a change in the benchmark interest rate. For new and existing contracts, the Funds may elect to apply the amendments as of March 12, 2020 through December 31, 2022. Management is currently assessing the impact of the ASU’s adoption to the Funds’ financial statements and various filings.
Note 13 – Events Subsequent to the Fiscal Period End
The Funds have adopted financial reporting rules regarding subsequent events which require an entity to recognize in the financial statements the effects of all subsequent events that provide additional evidence about conditions that existed at the date of the balance sheet. Management has evaluated the Funds’ related events and transactions that occurred through the date of issuance of the Funds’ financial statements.
At a regular meeting of the Board of Trustees on December 16, 2020, the Advisor and the Board approved a resolution to acquire the Stadion Tactical Growth Fund, Stadion Tactical Defensive Fund, and Stadion Trilogy Alternative Return Fund (the “Stadion Funds”). The Stadion Funds reorganized into separate funds within the North Square Investments Trust after the close of business on June 11, 2021.
On July 7, 2021, Foreside Financial Group, LLC (“Foreside”), the parent company of Compass Distributors LLC (“Compass”), the Funds’ distributor, announced that it had entered into a definitive purchase and sale agreement with Genstar Capital (“Genstar”) such that Genstar would acquire a majority stake in Foreside. The transaction is expected to close at the end of the third quarter of 2021. Compass will remain the Funds’ distributor at the close of the transaction, subject to Board approval.
REPORT OF INDEPENDENT REGISTERED PUBLIC ACCOUNTING FIRM
To the Board of Trustees and Shareholders of North Square Investments Trust
Opinion on the Financial Statements
We have audited the accompanying statements of assets and liabilities of the North Square Oak Ridge Small Cap Growth Fund, North Square Dynamic Small Cap Fund, North Square Oak Ridge All Cap Growth Fund, North Square Multi Strategy Fund, and North Square Oak Ridge Dividend Growth Fund (the “Funds”), each a series of North Square Investments Trust (the “Trust”), including the schedules of investments, as of May 31, 2021, the related statements of operations, the statements of changes in net assets, and the financial highlights for each of the periods indicated in the table below, and the related notes (collectively referred to as the “financial statements”). In our opinion, the financial statements and financial highlights referred to above present fairly, in all material respects, the financial position of the Funds as of May 31, 2021, the results of their operations, the changes in their net assets, and their financial highlights for the periods indicated in the table below, in conformity with accounting principles generally accepted in the United States of America.
| Individual Funds | | | |
| Constituting | | | |
| North Square | Statements of | Statement of | |
| Investments Trust | Operations | Changes in Net Assets | Financial Highlights |
| North Square Oak Ridge | For the year ended | For each of the two years in the | For each of the five years in the |
| Small Cap Growth Fund, | May 31, 2021 | period ended May 31, 2021 | period ended May 31, 2021 |
| North Square Dynamic Small | | | |
| Cap Fund, North Square | | | |
| Multi Strategy Fund, and | | | |
| North Square Oak Ridge | | | |
| Dividend Growth Fund | | | |
| | | | |
| North Square Oak Ridge | For the year ended | For each of the two years in the | For each of the four years in the |
| All Cap Growth Fund | May 31, 2021 | period ended May 31, 2021 | period ended May 31, 2021 and |
| | | | the period July 29, 2016 |
| | | | (commencement of operations) |
| | | | through May 31, 2017 |
Basis for Opinion
These financial statements are the responsibility of the Funds’ management. Our responsibility is to express an opinion on the Funds’ financial statements based on our audits. We are a public accounting firm registered with the Public Company Accounting Oversight Board (United States) (“PCAOB”) and are required to be independent with respect to the Funds in accordance with the U.S. federal securities laws and the applicable rules and regulations of the Securities and Exchange Commission and the PCAOB. We have served as the auditor of one or more of the funds in the Trust since 2013.
We conducted our audits in accordance with the standards of the PCAOB. Those standards require that we plan and perform the audits to obtain reasonable assurance about whether the financial statements are free of material misstatement, whether due to error or fraud. The Funds are not required to have, nor were we engaged to perform, an audit of the Funds’ internal control over financial reporting. As part of our audits we are required to obtain an understanding of internal control over financial reporting, but not for the purpose of expressing an opinion on the effectiveness of the Funds’ internal control over financial reporting. Accordingly, we express no such opinion.
Our audits included performing procedures to assess the risks of material misstatement of the financial statements, whether due to error or fraud, and performing procedures that respond to those risks. Such procedures included examining, on a test basis, evidence regarding the amounts and disclosures in the financial statements. Our audits also included evaluating the accounting principles used and significant estimates made by management, as well as evaluating the overall presentation of the financial statements. Our procedures included confirmation of securities owned as of May 31, 2021 by correspondence with the custodian and brokers or by other appropriate auditing procedures where replies from broker were not received. We believe that our audits provide a reasonable basis for our opinion.
TAIT, WELLER & BAKER LLP
Philadelphia, Pennsylvania
July 30, 2021
North Square Funds
SUPPLEMENTAL INFORMATION (Unaudited)
Corporate Dividends Received Deduction
For corporate shareholders, the percent of ordinary income distributions qualifying for the corporate dividends received deduction for the fiscal year ended May 31, 2021 was as follows:
| Small Cap Growth Fund | 3.16% | | Multi Strategy Fund | 0.00% | |
| Dynamic Small Cap Fund | 2.90% | | Dividend Growth Fund | 100.00% | |
| All Cap Growth Fund | 100.00% | | | | |
Qualified Dividend Income
For the fiscal year ended May 31, 2021, certain dividends paid by the Funds may be subject to a maximum tax rate of 23.8%, as provided for by the Jobs and Growth Tax Relief Reconciliation Act of 2003. The percentage of dividends declared from ordinary income designated as qualified dividend income was as follows:
| Small Cap Growth Fund | 3.24% | | Multi Strategy Fund | 0.00% | |
| Dynamic Small Cap Fund | 2.88% | | Dividend Growth Fund | 100.00% | |
| All Cap Growth Fund | 100.00% | | | | |
Long-Term Capital Gain Designation
For the fiscal year ended May 31, 2021, the Funds designate a portion of distributions as 20.00% rate gain distributions for the purposed of the dividends paid deduction. The dollar amount by fund was as follows:
| Small Cap Growth Fund | | $ | 14,758,820 | | Multi Strategy Fund | | $ | — | |
| Dynamic Small Cap Fund | | $ | 288,617 | | Dividend Growth Fund | | $ | 243,545 | |
| All Cap Growth Fund | | $ | — | | | | | | |
Trustees and Officers Information
Additional information about the Trustees is included in each Fund’s Statement of Additional Information which is available, without charge, upon request by calling (855) 551-5521 or on the Funds’ website at www.northsquareinvest.com. The Trustees and officers of each Fund and their principal occupations during the past five years are as follows:
| | | | | | Number of | |
| | | | | | Portfolios | |
| | | | | | in Fund | Other Directorship/ |
| | Name, Addressa, | | | | Complex | Trusteeship |
| | Year of Birth and | | Term of Office | | Overseen | Positions held by |
| | Position(s) with | Position with | and Length of | Principal Occupations During | by | Trustee During |
| | the Trust | the Trust | Time Servedb | the Past Five Years or Longer | Trusteec | the Past 5 Years |
| | Independent Trustees | | | | | |
| | David B. Boon | Trustee | 08/2018 to present | Chief Financial Officer and Managing | 9 | None |
| | (1960) | | | Director, Eagle Capital Management, LLC | | |
| | | | | (since 2018); Chief Financial Officer and | | |
| | | | | Partner, Cedar Capital, LLC (2013 – 2018). | | |
North Square Funds
SUPPLEMENTAL INFORMATION (Unaudited) – Continued
| | | | | | Number of | |
| | | | | | Portfolios | |
| | | | | | in Fund | Other Directorship/ |
| | Name, Addressa, | | | | Complex | Trusteeship |
| | Year of Birth and | | Term of Office | | Overseen | Positions held by |
| | Position(s) with | Position with | and Length of | Principal Occupations During | by | Trustee During |
| | the Trust | the Trust | Time Servedb | the Past Five Years or Longer | Trusteec | the Past 5 Years |
| | Donald J. Herrema | Chairman of the | 08/2018 to present | Vice Chair and Chief Investment Officer, | 9 | Chairman and Director |
| | (1952) | Board and Trustee | | Independent Life Insurance Company | | Emeritus, TD Funds |
| | | | | (since 2018); Financial Services Executive, | | USA (2009 – 2019) |
| | | | | Advisor and Founder of BlackSterling | | Director, Abel Noser |
| | | | | Partners, LLC (private investments and | | Holdings, LLC (since |
| | | | | advisory firm) (since 2004); Executive Vice | | 2016); Member, USC |
| | | | | Chairman and Senior Advisor at Kennedy | | Marshall Business School |
| | | | | Wilson (real estate investment company) | | Board (since 2010); |
| | | | | (2009 – 2016). | | President and Trustee, |
| | | | | | | Christ Church |
| | | | | | | (2008 – 2016); Director, |
| | | | | | | Lepercq de Neuflize |
| | | | | | | (2009 – 2016); Chairman |
| | | | | | | and Trustee Emeritus |
| | | | | | | (since 2014), Director, |
| | | | | | | FEG Investment Advisors |
| | | | | | | (since 2017); Director, |
| | | | | | | Independent Life |
| | | | | | | Insurance Company |
| | | | | | | (since 2018). |
| | Catherine A. Zaharis | Trustee | 08/2018 to present | Professor of Practice (since 2019), Director, | 9 | Director, The |
| | (1960) | | | Professional/Employer Development, | | Vantagepoint Funds |
| | | | | Finance Department (2015 – 2019), Adjunct | | (2015 – 2016). |
| | | | | Lecturer (2010 – 2019), and Business Director, | | |
| | | | | MBA Finance Career Academy (2008 – 2015), | | |
| | | | | University of Iowa, Tippie College of Business; | | |
| | | | | Chair (2013 – 2016), Director (1999 – 2016), | | |
| | | | | and Investment Committee Member (1999 – | | |
| | | | | 2013) and Chair (2003 – 2013), | | |
| | | | | University of Iowa Foundation. | | |
| | Interested Trusteesd | | | | | |
| | Mark D. Goodwin | Trustee and | 08/2018 to present | Chief Executive Officer, North Square | 9 | None |
| | (1964) | President | | Investments LLC (since July 2018); President | | |
| | | | | and Chief Operating Officer (2015 – July 2018) | | |
| | | | | and Executive Vice President (2014 – 2015), | | |
| | | | | Oak Ridge Investments, LLC. | | |
North Square Funds
SUPPLEMENTAL INFORMATION (Unaudited) – Continued
| | | | | | Number of | |
| | | | | | Portfolios | |
| | | | | | in Fund | Other Directorship/ |
| | Name, Addressa, | | | | Complex | Trusteeship |
| | Year of Birth and | | Term of Office | | Overseen | Positions held by |
| | Position(s) with | Position with | and Length of | Principal Occupations During | by | Trustee During |
| | the Trust | the Trust | Time Servedb | the Past Five Years or Longer | Trusteec | the Past 5 Years |
| | Officers of the Trust: | | | | | |
| | Alan E. Molotsky | Treasurer | 08/2018 to present | Chief Financial Officer, Chief Compliance Officer | N/A | N/A |
| | (1956) | and | | (July 2018 – March 2021), General Counsel and | | |
| | | Secretary | | Senior Managing Director, North Square | | |
| | | | | Investments, LLC (since July 2018); Chief | | |
| | | | | Financial Officer, Chief Compliance Officer, | | |
| | | | | General Counsel and Executive Vice President, | | |
| | | | | Oak Ridge Investments LLC (2004 – July 2018). | | |
| | David J. Gaspar | Vice | 08/2018 to present | Chief Operations and Information Officer and | N/A | N/A |
| | (1954) | President | | Senior Managing Director, North Square | | |
| | | | | Investments, LLC (since July 2018); Chief | | |
| | | | | Operations Officer, Chief Information Officer, | | |
| | | | | Chief Information Security Officer and Executive | | |
| | | | | Vice President, Oak Ridge Investments, LLC | | |
| | | | | (2000 – July 2018). | | |
| | Douglas N. Tyre | Chief | 09/2018 to present | Assistant Compliance Director, Cipperman | N/A | N/A |
| | (1980) | Compliance | | Compliance Services, LLC (since 2014). | | |
| | | Officer | | | | |
| a. | The business address of each Trustee and officer is c/o North Square Investments, LLC, 10 South LaSalle Street, Suite 1925, Chicago, Illinois 60603. |
| b. | Trustees and officers serve until their successors are duly elected and qualified. |
| c. | The term “Fund Complex” applies to the nine portfolios that currently comprise the Trust, which consists of the five Funds, the North Square Advisory Research All Cap Value Fund, and the North Square Strategic Income Fund, the North Square Altrinsic International Equity Fund, and the North Square McKee Bond Fund. |
| d. | Mr. Goodwin is considered to be an “interested person” of the Trust as that term is defined in the 1940 Act by virtue of his positions with the Adviser. |
North Square Funds
EXPENSE EXAMPLES
For the Six Months Ended May 31, 2021 (Unaudited)
Expense Examples
As a shareholder of the Funds, you incur two types of costs: (1) transaction costs, including sales charges (loads) on purchase payments (Class A only); and redemption fees; and (2) ongoing costs, including management fees; distribution and/or service (12b-1) fees (Class A and C only); and other Fund expenses. The examples below are intended to help you understand your ongoing costs (in dollars) of investing in the Funds and to compare these costs with the ongoing costs of investing in other mutual funds.
These examples are based on an investment of $1,000 invested at the beginning of the period and held for the entire six month period from December 1, 2020 to May 31, 2021.
Actual Expenses
The information in the row titled “Actual Performance” of the table below provides actual account values and actual expenses. You may use the information in these columns, together with the amount you invested, to estimate the expenses that you paid over the period. Simply divide your account value by $1,000 (for example, an $8,600 account value divided by $1,000 = 8.6), then multiply the result by the number in the appropriate row for your share class, in the column titled “Expenses Paid During Period” to estimate the expenses you paid on your account during this period.
Hypothetical Example for Comparison Purposes
The information in the row titled “Hypothetical (5% annual return before expenses)” of the table below provides hypothetical account values and hypothetical expenses based on each Fund’s actual expense ratios and an assumed rate of return of 5% per year before expenses, which is not the Fund’s actual return. The hypothetical account values and expenses may not be used to estimate the actual ending account balance or expenses you paid for the period. You may use this information to compare the ongoing costs of investing in the Fund and other funds. To do so, compare these 5% hypothetical examples with the 5% hypothetical examples that appear in the shareholder reports of the other funds.
Please note that the expenses shown in the table are meant to highlight your ongoing costs only and do not reflect any transaction costs, such as sales charges (loads) or redemption fees. Therefore, the information in the row titled “Hypothetical (5% annual return before expenses)” is useful in comparing ongoing costs only, and will not help you determine the relative total costs of owning different funds. In addition, if these transactional costs were included, your costs would have been higher.
| | | Beginning | Ending | Expense Paid |
| | | Account | Account | During |
| | | Value | Value | Period* |
| Small Cap Growth Fund | 12/1/20 | 5/31/21 | 12/1/20 – 05/31/21 |
| Class A | Actual Performance | $1,000.00 | $1,106.70 | $7.30 |
| | Hypothetical (5% annual return before expenses) | $1,000.00 | $1,018.00 | $6.99 |
| Class I | Actual Performance | $1,000.00 | $1,108.10 | $5.99 |
| | Hypothetical (5% annual return before expenses) | $1,000.00 | $1,019.25 | $5.74 |
| * | Expenses are equal to the Fund’s annualized expense ratios of 1.39%, and 1.14% for Class A and Class I, respectively, multiplied by the average account values over the period, multiplied by 182/365 (to reflect the six month period). The expense ratios reflect an expense waiver. Assumes all dividends and distributions were reinvested. |
| | | Beginning | Ending | Expense Paid |
| | | Account | Account | During |
| | | Value | Value | Period* |
| Dynamic Small Cap Fund | 12/1/20 | 5/31/21 | 12/1/20 – 05/31/21 |
| Class I | Actual Performance | $1,000.00 | $1,262.40 | $6.49 |
| | Hypothetical (5% annual return before expenses) | $1,000.00 | $1,019.20 | $5.79 |
| * | Expenses are equal to the Fund’s annualized expense ratios of 1.15%, multiplied by the average account values over the period, multiplied by 182/365 (to reflect the six month period). The expense ratios reflect an expense waiver. Assumes all dividends and distributions were reinvested. |
North Square Funds
EXPENSE EXAMPLES – Continued
For the Six Months Ended May 31, 2021 (Unaudited)
| | | Beginning | Ending | Expense Paid |
| | | Account | Account | During |
| | | Value | Value | Period* |
| All Cap Growth Fund | 12/1/20 | 5/31/21 | 12/1/20 – 05/31/21 |
| Class I | Actual Performance | $1,000.00 | $1,110.00 | $5.00 |
| | Hypothetical (5% annual return before expenses) | $1,000.00 | $1,020.19 | $4.78 |
| * | Expenses are equal to the Fund’s annualized expense ratios of 0.95%, multiplied by the average account values over the period, multiplied by 182/365 (to reflect the six month period). The expense ratios reflect an expense waiver. Assumes all dividends and distributions were reinvested. |
| | | Beginning | Ending | Expense Paid |
| | | Account | Account | During |
| | | Value | Value | Period* |
| Multi Strategy Fund | 12/1/20 | 5/31/21 | 12/1/20 – 05/31/21 |
| Class A | Actual Performance | $1,000.00 | $1,162.60 | $5.77 |
| | Hypothetical (5% annual return before expenses) | $1,000.00 | $1,019.60 | $5.39 |
| Class I | Actual Performance | $1,000.00 | $1,166.30 | $1.19 |
| | Hypothetical (5% annual return before expenses) | $1,000.00 | $1,023.83 | $1.11 |
| * | Expenses are equal to the Fund’s annualized expense ratios of 1.07%, and 0.22% for Class A and Class I, respectively, multiplied by the average account values over the period, multiplied by 182/365 (to reflect the six month period). The expense ratios reflect an expense waiver. Assumes all dividends and distributions were reinvested. |
| | | Beginning | Ending | Expense Paid |
| | | Account | Account | During |
| | | Value | Value | Period* |
| Dividend Growth Fund | 12/1/20 | 5/31/21 | 12/1/20 – 05/31/21 |
| Class I | Actual Performance | $1,000.00 | $1,165.10 | $5.40 |
| | Hypothetical (5% annual return before expenses) | $1,000.00 | $1,019.95 | $5.04 |
| * | Expenses are equal to the Fund’s annualized expense ratios of 1.00%, multiplied by the average account values over the period, multiplied by 182/365 (to reflect the six month period). The expense ratios reflect an expense waiver. Assumes all dividends and distributions were reinvested. |
North Square Funds
Advisor
North Square Investments, LLC
10 South LaSalle Street, Suite 1925
Chicago, Illinois 60603
| | Sub-Advisor | Sub-Advisor | |
| | Algert Global LLC | Oak Ridge Investments, LLC | |
| | 101 California Street, Suite 4225 | 10 South La Salle Street, Suite 1900 | |
| | San Francisco, California 94111 | Chicago, Illinois 60603 | |
Independent Registered Public Accounting Firm
Tait, Weller & Baker LLP
50 South 16th Street, Suite 2900
Philadelphia, Pennsylvania 19102
Custodian
U.S. Bank, N.A.
1555 N. RiverCenter Drive, Suite 300
Milwaukee, Wisconsin 53212
Fund Administrator, Transfer Agent and Fund Accountant
U.S. Bank Global Fund Services
615 East Michigan Street
Milwaukee, Wisconsin 53202
Distributor
Compass Distributors LLC
Three Canal Plaza, Suite 100
Portland, Maine 04101
www.foreside.com
FUND INFORMATION
| Fund Name | | Ticker | CUSIP |
| North Square Oak Ridge Small Cap Growth Fund | Class A | ORIGX | 66263L 304 |
| North Square Oak Ridge Small Cap Growth Fund | Class I | ORIYX | 66263L 858 |
| North Square Dynamic Small Cap Fund | Class I | ORSIX | 66263L 825 |
| North Square Oak Ridge All Cap Growth Fund | Class I | ODGIX | 66263L 601 |
| North Square Multi Strategy Fund | Class A | ORILX | 66263L 700 |
| North Square Multi Strategy Fund | Class I | PORYX | 66263L 833 |
| North Square Oak Ridge Dividend Growth Fund | Class I | ORDNX | 66263L 882 |
Privacy Principles of the North Square Funds for Shareholders
The Funds are committed to maintaining the privacy of their shareholders and to safeguarding their non-public personal information. The following information is provided to help you understand what personal information the Funds collect, how we protect that information and why, in certain cases, we may share information with select other parties.
Generally, the Funds do not receive any non-public personal information relating to their shareholders, although certain non-public personal information of their shareholders may become available to the Funds. The Funds do not disclose any non-public personal information about their shareholders or former shareholders to anyone, except as permitted by law or as is necessary in order to service shareholder accounts (for example, to a transfer agent or third party administrator).
This report is sent to shareholders of the North Square Funds for their information. It is not a Prospectus, circular or representation intended for use in the purchase or sale of shares of the Funds or of any securities mentioned in this report.
Proxy Voting Policies and Procedures
A description of the Funds’ proxy voting policies and procedures related to portfolio securities is available without charge, upon request, by calling the Funds at (855) 551-5521 or on the U.S. Securities and Exchange Commission’s (“SEC”) website at www.sec.gov.
Proxy Voting Record
Information regarding how the Funds voted proxies for portfolio securities, if applicable, during the most recent 12-month period ended June 30, is also available, without charge and upon request by calling (855) 551-5521 or by accessing the Funds’ Form N-PX on the SEC’s website at www.sec.gov.
Portfolio Holdings Disclosure
The Funds file a complete schedule of portfolio holdings with the U.S. Securities and Exchange Commission (the “SEC”) for the first and third quarters of each fiscal year on Form N-Q or Part F of Form N-PORT (beginning with filings after March 31, 2020). The Funds’ Forms N-Q or Part F of Form N-PORT are available on the SEC’s website at www.sec.gov and may be reviewed and copied at the SEC’s Public Reference Room in Washington, D.C. Information on the operation of the Public Reference Room may be obtained by calling (800) 732-0330. The Funds’ Forms N-Q or Part F of Form NPORT may also be obtained by calling toll-free (855) 551-5521 or by visiting the Funds’ website at www.northsquareinvest.com/fund-reports-holdings.
Householding
The Funds will mail only one copy of shareholder documents, including prospectuses, annual and semi-annual reports and proxy statements, to shareholders with multiple accounts at the same address. This practice is commonly called “householding” and is intended to reduce expenses and eliminate duplicate mailings of shareholder documents. Mailings of your shareholder documents may be householded indefinitely unless you instruct us otherwise. If you do not want the mailing of these documents to be combined with those for other members of your household, please call the Funds at (855) 551-5521.
North Square Funds
c/o U.S. Bancorp Fund Services, LLC
P.O. Box 701
Milwaukee, Wisconsin 53201
1-855-551-5521
Item 2. Code of Ethics.
The Registrant has adopted a code of ethics that applies to the Registrant’s principal executive officer and principal financial officer. The Registrant has not made any substantive amendments to its code of ethics during the period covered by this report. The Registrant has not granted any waivers from any provisions of the code of ethics during the period covered by this report.
A copy of the Registrant’s Code of Ethics is filed herewith.
Item 3. Audit Committee Financial Expert.
The Registrant’s Board of Directors has determined that there is at least one audit committee financial expert serving on its audit committee. David B. Boon is the “audit committee financial expert” and is considered to be “independent” as each term is defined in Item 3 of Form N‑CSR.
Item 4. Principal Accountant Fees and Services.
The Registrant has engaged its principal accountant to perform audit services, audit-related services, tax services and other services during the past two fiscal years. “Audit services” refer to performing an audit of the Registrant's annual financial statements or services that are normally provided by the accountant in connection with statutory and regulatory filings or engagements for those fiscal years. “Audit-related services” refer to the assurance and related services by the principal accountant that are reasonably related to the performance of the audit. “Tax services” refer to professional services rendered by the principal accountant for tax compliance, tax advice, and tax planning. The following table details the aggregate fees billed or expected to be billed for each of the last two fiscal years for audit fees, audit-related fees, tax fees and other fees by the principal accountant.
| | FYE 5/31/2021 | FYE 5/31/2020 |
| Audit Fees | $84,900 | $102,200 |
| Audit-Related Fees | $0 | $0 |
| Tax Fees | $12,500 | $16,800 |
| All Other Fees | $0 | $0 |
The Audit Committee has adopted pre-approval policies and procedures that require the audit committee to pre‑approve all audit and non‑audit services of the Registrant, including services provided to any entity affiliated with the Registrant.
The percentage of fees billed by Tait, Weller & Baker LLP applicable to non-audit services pursuant to waiver of pre-approval requirement were as follows:
| | FYE 5/31/2021 | FYE 5/31/2020 |
Audit-Related Fees | 0% | 0% |
Tax Fees | 0% | 0% |
All Other Fees | 0% | 0% |
All of the principal accountant’s hours spent on auditing the Registrant’s financial statements were attributed to work performed by full‑time permanent employees of the principal accountant.
The Registrant has not been identified by the U.S. Securities and Exchange Commission as having filed an annual report issued by a registered public accounting firm branch or office that is located in a foreign jurisdiction where the Public Company Accounting Oversight Board is unable to inspect or completely investigate because of a position taken by an authority in that jurisdiction.
The Registrant is not a foreign issuer.
Item 5. Audit Committee of Listed Registrants.
Not applicable to Registrants who are not listed issuers (as defined in Rule 10A-3 under the Securities Exchange Act of 1934).
Item 6. Investments.
(a) | Schedule of Investments is included as part of the report to shareholders filed under Item 1 of this Form. |
Item 7. Disclosure of Proxy Voting Policies and Procedures for Closed-End Management Investment Companies.
Not applicable to open-end investment companies.
Item 8. Portfolio Managers of Closed-End Management Investment Companies.
Not applicable to open-end investment companies.
Item 9. Purchases of Equity Securities by Closed‑End Management Investment Company and Affiliated Purchasers.
Not applicable to open-end investment companies.
Item 10. Submission of Matters to a Vote of Security Holders.
There have been no material changes to the procedures by which shareholders may recommend nominees to the Registrant’s Board of Directors.
Item 11. Controls and Procedures.
(a) | The Registrant’s President and Treasurer have reviewed the Registrant's disclosure controls and procedures (as defined in Rule 30a-3(c) under the Investment Company Act of 1940 (the “Act”)) as of a date within 90 days of the filing of this report, as required by Rule 30a-3(b) under the Act and Rules 13a-15(b) or 15d‑15(b) under the Securities Exchange Act of 1934. Based on their review, such officers have concluded that the disclosure controls and procedures are effective in ensuring that information required to be disclosed in this report is appropriately recorded, processed, summarized and reported and made known to them by others within the Registrant and by the Registrant’s service provider. |
(b) | There were no changes in the Registrant's internal control over financial reporting (as defined in Rule 30a-3(d) under the Act) that occurred during the period covered by this report that have materially affected, or are reasonably likely to materially affect, the Registrant's internal control over financial reporting. |
Item 12. Disclosure of Securities Lending Activities for Closed-End Management Investment Companies
Not applicable to open-end investment companies.
Item 13. Exhibits.
(3) Not applicable to open-end investment companies.
(4) There was no change in the Registrant’s independent public accountant for the period covered by this report.
SIGNATURES
Pursuant to the requirements of the Securities Exchange Act of 1934 and the Investment Company Act of 1940, the Registrant has duly caused this report to be signed on its behalf by the undersigned, thereunto duly authorized.
North Square Investments Trust
By: /s/Mark D. Goodwin
Mark D. Goodwin,President
Date: August 9, 2021
Pursuant to the requirements of the Securities Exchange Act of 1934 and the Investment Company Act of 1940, this report has been signed below by the following persons on behalf of the Registrant and in the capacities and on the dates indicated.
By: /s/Mark D. Goodwin
Mark D. Goodwin,President
Date: August 9, 2021
By: /s/Alan E. Molotsky
Alan E. Molotsky,Treasurer
Date: August 9, 2021