| ANNUAL REPORT | |
| | |
| | |
| NORTH SQUARE ADVISORY RESEARCH ALL CAP VALUE FUND | |
| NORTH SQUARE ALTRINSIC INTERNATIONAL EQUITY FUND | |
| NORTH SQUARE MCKEE BOND FUND | |
| NORTH SQUARE STRATEGIC INCOME FUND | |
| | |
| | |
| OCTOBER 31, 2021 | |
As of January 1, 2021, as permitted by regulations adopted by the U.S. Securities and Exchange Commission, paper copies of the Funds’ shareholder reports will no longer be sent by mail, unless you specifically request paper copies of the reports from the Fund or from your financial intermediary, such as a broker-dealer or bank. Instead, the reports will be made available on the Funds’ website, www.northsquareinvest.com, and you will be notified by mail each time a report is posted and provided with a website link to access the report.
If you already elected to receive shareholder reports electronically, you will not be affected by this change and you need not take any action. You may elect to receive shareholder reports and other communications from the Funds electronically by contacting your financial intermediary, such as a broker-dealer or bank, or, if you are a direct investor, by calling the Funds toll-free at 1-855-551-5521.
You may elect to receive all future reports in paper free of charge. If you invest through a financial intermediary, you can contact your financial intermediary to request that you continue to receive paper copies of your shareholder reports. If you invest directly with the Funds, you can call the Funds toll-free at 1-855-551-5521 to let the Funds know you wish to continue receiving paper copies of your shareholder reports. Your election to receive reports in paper will apply to all Funds held in your account if you invest through your financial intermediary.

North Square Investments | www.northsquareinvest.com
North Square Funds
Table of Contents
| Shareholder Letters | | | 1 |
| Fund Performance | | | 9 |
| Schedules of Investments | | | 14 |
| Statements of Assets and Liabilities | | | 50 |
| Statements of Operations | | | 51 |
| Statements of Changes in Net Assets | | | 52 |
| Financial Highlights | | | 54 |
| Notes to Financial Statements | | | 59 |
| Report of Independent Registered Public Accounting Firm | | | 69 |
| Supplemental Information | | | 70 |
| Expense Examples | | | 76 |
This report and the financial statements contained herein are provided for the general information of the shareholders of the North Square Funds. This report is not authorized for distribution to prospective investors in the Funds unless preceded or accompanied by an effective prospectus.
www.northsquareinvest.com
| Discussion of North Square Advisory Research All Cap Value Fund Performance | |  |
Dear Shareholder,
The past twelve months saw a continued rally in the U.S. stock market, as the economy continued its strong recovery from the 2020 economic shutdowns caused by the coronavirus pandemic. The S&P 500 Index rallied to a new all-time high over 4,600 in late October 2021. Demand for products and services continued to be strong, so much so that supply chains were not able to keep up. Transportation snarls (such as delays at West Coast ports) and parts shortages (semiconductors, for example) have impeded suppliers’ ability to meet demand. But that should lead to continued economic growth into 2022 as supply-side issues work themselves out.
Supply-side issues also contributed to an uptick in inflation. The Federal Reserve’s preferred gauge, the Personal Consumption Expenditures Index,1 breached 4% during the year, a level it had not reached since mid-2008. Still, the Fed believes this higher inflation is transitory and will subside. The markets appear to agree, as the breakeven spread between a nominal 10-year Treasury note and a Treasury Inflation-Protected Security of the same maturity was around 2.60% at the end of October – not far from the Fed’s long-term target goal of 2% inflation.
In early November 2021, the Fed announced that it will formally wind down the bond-buying program it started in early 2020 to counter the economic effects of the pandemic. If all goes according to plan, the program will terminate in mid-2022. While the Fed has not announced when it will start raising the target for the Federal Funds rate from the zero bound, market expectations are for at least one 25 basis point raise in the back half of 2022.2
All of this suggests that the economy should be supportive of business activity and ultimately create a constructive backdrop for the equity markets in the new year.
As of October 31, 2021, the North Square Advisory Research All Cap Value Fund (the Fund) returned 46.09% for the trailing twelve months (its fiscal year), versus 44.97% for its primary benchmark, the Russell 3000 Value Index.3 According to attribution analysis, smaller cap names made a material contribution to our performance during the year. We have typically run with an overweight to small caps relative to the benchmark, as we believe our research process allows us to uncover high quality, underfollowed, and misunderstood companies at the lower end of the market cap spectrum. We are pleased that our strategy has outperformed its benchmark over the past year, as well as longer term over the past five years.4
At the company level, Element Solutions (ESI), was one of our strongest performers. ESI is a specialty chemical manufacturer, and it specializes in chemicals and products used in semiconductor manufacturing. The company has been a beneficiary of the increased demand for semiconductors in the “connected” global economy for things such as 5G phones, automobile electrification, the “Internet of Things,” and cloud computing. It should continue to see strong top and bottom line growth as these macro trends continue to evolve. On the downside, one of our weaker performers was Cannae Holdings (CNNE), a diversified holding company with a mix of majority and minority owned investments in a variety of industries, including technology-enabled healthcare services, financials services, real estate, and more. CNNE fell during the year as the market prices for some of its publicly-traded portfolio investments came in. However, we believe the discount between CNNE’s stock price and the sum of its parts is too wide. We also believe our position is bolstered in CNNE through its management team, led by legendary investor Bill Foley.
__________________
1 | The Personal Consumption Expenditure Index, published by the Bureau of Economic Analysis, reflects changes in the prices of goods and services purchased by consumers in the United States. It is the Federal Reserve’s preferred gauge of inflation. |
2 | A basis point (bp) is equal to 1/100th of 1% or 0.01%. |
3 | The Russell 3000® Value Index measures the performance of the broad value segment of the U.S. equity value universe. It includes those Russell 3000® companies with lower price-to-book ratios and lower forecasted growth values. |
4 | Please see page 9 for the fund’s complete standardized returns. |
Outlook
We are pleased with the performance of the portfolio over the past year and longer term. We believe that keeping a sharp eye on fundamentals, as well as the price paid for them, will continue to work. Return on equity (ROE) is a telling indicator of business quality, and our portfolio’s 16.9% ROE is materially above the Russell 3000 Value Index’s 10.5% level.5 We also want our businesses to exhibit good earnings growth going forward, and the weighted average estimated EPS growth for the portfolio is 12.1% over the next three to five years, compared to 9.8% for the index.6 At the same time, we want our companies to have sound balance sheets. Our portfolio’s debt to equity ratio is 1.38x, whereas the benchmark is at 1.48x.7 Overall, we think our forward P/E ratio of 18.8x, a little higher than the Russell 3000 Value’s 16.2x, is warranted.8
We remain confident in our process and current positioning. By focusing on both downside protection and upside potential over a multi-year investment horizon, we believe the Fund is well-positioned for a positively skewed risk/reward payoff. Relative to our benchmark, we own businesses that generate higher returns and are growing earnings faster, with responsible financial positions.
We thank you for investing in the North Square Advisory Research All Cap Value Fund and look forward to updating you again in 2022.
Advisory Research, Inc.
The views in this letter are those of the Fund’s direct advisor as of December 30, 2021 and may not necessarily reflect the same views on the date this letter is first published or any date thereafter. These views are intended to help shareholders in understanding the fund’s investment methodology and do not constitute investment advice.
Investment in equity securities involves substantial risks and may be subject to wide and sudden fluctuations in market value. Investing in small and mid-cap companies may be subject to more abrupt or erratic market movements and may have lower trading volumes or more erratic trading than securities of larger companies. Please see the prospectus for a more complete discussion of the fund’s risks.
Fund holdings and sector allocations are subject to change at any time. Please see the Schedule of Investments in this report for a complete list of Fund holdings.
__________________
5 | Return on equity (ROE) is a measure of financial performance calculated by dividing net income by shareholders’ equity. |
6 | Earnings per share (EPS) growth measures the increase in EPS over a period of time. |
7 | The debt to equity calculation excludes companies with negative common equity. |
8 | P/E ratio is stock price dividend by EPS. |
| Discussion of North Square Altrinsic International Equity Fund Performance | | |
Dear Shareholder,
The global economy rebounded sharply over the last year, aided by positive COVID-19 vaccine developments, incredibly supportive monetary and fiscal stimulus, and pent-up consumer demand. However, the growth in corporate earnings and liquidity supporting equity markets for most of this year appears to have peaked, just as uncertainties stemming from central bank policies, shifting regulatory regimes, and inflationary pressures have contributed to increased market volatility.
Developments involving inflationary pressures and interest rates, China, and cyber risks are among the topics capturing headlines and likely to have a significant influence on markets in both the near and long terms. Interest rates, which were tethered to inflation for decades, are increasingly fixed at low levels as central bankers seek to buoy the global economy and governments work to manage their war-time debt levels. Simultaneously, rising inflationary pressures, which began with the prices of goods, are now appearing in the service industries in many countries. Meanwhile, China is embarking on the delicate act of slowing its considerable and highly leveraged “old” economy and managing continued geopolitical tensions at home and abroad while increasingly relying on its internet giants to forge its future. Atop these other macro forces, cyber risks transcend all boundaries. They are underappreciated, intensifying, and will significantly impact individuals, companies, and nations. These issues, independently and in the aggregate, present both risks and nuanced opportunities for companies and investors alike.
A long-overdue broadening out of stock market leadership has begun. Near the end of 2020, the virtually uninterrupted leadership by highly-valued growth stocks initially gave way to lower quality and leveraged deep cyclical stocks. Market leadership has subsequently ebbed and flowed between these two segments of equity markets. We see vulnerability at both extremes, with growth stocks often priced for unfettered growth and permanently low interest rates, while many cyclical stocks are priced for a “new normal” in profitability.
As of October 31, 2021 calendar year to date, the North Square Altrinsic International Equity Fund gained 7.36%, underperforming the MSCI EAFE Index’s 11.01% gain1. While performance was strong on an absolute basis, underperformance can largely be attributed to our minimal exposure to growth stocks and low-quality deep cyclicals as well as the portfolio’s below-market risk. From a sector perspective, strong performance in non-bank financials (Aon and Chubb) and real estate (Daito Trust) were more than offset by consumer discretionary (Alibaba and Sands China) and information technology investments (Check Point and Cognizant).
We believe the Fund is attractively positioned, focusing on companies with underappreciated business models in which fundamentals are improving and where disciplined leaders are allocating capital in our long-term interest. Our insurance investments (including Chubb and Zurich) are expected to benefit from the combination of the strongest competitive environment in decades, increased demand for risk-reduction products, considerable cost control, and any increase in economic activity. Our exchange holdings (including Euronext and Singapore Exchange) are shifting their business mix to proprietary high-margin products like data and clearing services. Our health care holdings (including GSK and Astellas) are moving away from their declining pipelines, investing heavily in innovative sciences, and shifting business models to more recurring revenues but still trade at very attractive valuations. Our positions in consumer staples (including Diageo and Heineken) are often seen as boring and defensive but, in our view, offer several avenues for growth, including improving category mix, better capital allocation, and significant tailwinds from the world reopening to consumers. Our enterprise technology investments (including Check Point and SAP) are transitioning to stickier, recurring revenues, and we expect an uptake in demand as companies seek to reduce risks, lower costs, and become more digital.
__________________
1 | The MSCI EAFE Index is an equity index which captures large and mid cap representations across 21 Developed Markets countries around the world, excluding the U.S. and Canada. With 841 constituents, the index covers approximately 85% of the free float-adjusted market capitalization in each country. It is not possible to invest directly in an index. |
Looking ahead, we believe that most highly cyclical and highly leveraged stocks are likely to be tested given current valuation levels, margin expectations, and accelerating threats from new technologies. At the other end of the spectrum, many “new economy” companies may produce considerable revenue growth but fail to meet the lofty hurdles set by investors – or see their stocks prices swing considerably due to small changes in interest rates. We continue to see the greatest opportunities between these two extremes, primarily among companies that are not overly dependent on strong economic growth and have the ability to improve shareholder value through their independent initiatives.
We thank you for investing in the North Square Altrinsic International Equity Fund.
Sincerely,
John Hock
John DeVita
Rich McCormick
The securities identified in this letter are not necessarily held by the Fund at the time of publication or thereafter, and should not be considered a recommendation or solicitation to purchase or sell these securities. It should not be assumed that any investment in these securities was, or will be, profitable. The outlook and opportunities noted in this letter are prospective and based upon the opinions of Altrinsic as of the date of this letter. There is no guarantee that we will be successful in our efforts to implement investment strategies that take advantage of such perceived opportunities.
Risk is inherent in all investing including an investment in the Fund. An investment in the Fund involves certain principal risks, including, among others: Equity Risk, Large-Cap Company Risk, Market Risk, Foreign Investment Risk, Emerging Market Risk, Currency Risk, and Management and Strategy Risk. The Fund may invest in foreign securities which will involve political, economic and currency risks, greater volatility, and differences in accounting methods. These risks are greater for investments in emerging markets. Before you decide whether to invest in the Fund, carefully consider these risks associated with investing in the Fund, which may cause investors to lose money. There can be no assurance that the Fund will achieve its investment objective.
| Discussion of North Square McKee Bond Fund Performance | | |
Dear Shareholders:
While it thankfully paled in comparison to 2020, the first ten months of 2021 (the funds’ tenure1) saw its share of volatility in the fixed income markets. The first chapter of this saga began with the 10-year Treasury yielding just 0.91%, double the 2020 low but significantly below all broad measures of inflation. Yields on intermediate and long-term Treasuries proceeded to rise in the first quarter as economic growth and inflation readings began to increase. Continued fiscal and monetary policy stimulus and increasing COVID-19 vaccine distribution boosted consumer financial conditions and unleashed pent up demand for goods and services. The surge in demand ran head long into reduced inventories, supply shortages, and staffing problems, prompting rising materials pricing and significant wage increases to fill open positions.
After stabilizing for much of the second and third calendar quarters of this year, market yields resumed their climb in late September as doubts concerning the “transitory” nature of inflation raised investors’ concern for the future of monetary policy. The Fed confirmed the market’s predictions at its November meeting, announcing a planned reduction in the pace of Treasury and mortgage buying.
While Treasury yields moved higher over the course the year through October, the favorable outlook for economy boosted investor demand for credit-sensitive bonds including corporate, asset-backed and commercial mortgage securities. These securities uniformly outperformed Treasuries with similar maturity dates, rewarding the Fund’s overweighting to each of these sectors. We expect the relative returns of these bonds versus Treasuries to continue over the next twelve months.
As of October 31, 2021, the calendar year to date return for the North Square McKee Bond Fund – Class I2 was -1.06%, versus -1.22% for Bloomberg Intermediate Aggregate Index3, the fund’s performance benchmark. Contributing to the Fund’s performance were the aforementioned allocation overweightings as well as significant contribution from government agency security selection and reduced holdings in residential agency mortgage holdings.
Fund performance also benefitted from an increasing allocation to floating-rate securities, bonds with coupon income rates that adjust higher in response to increases in certain market interest rates. Though these securities typically pay less than longer maturity, fixed-rate securities, they generally suffer very little price loss due to increasing interest rates relative to fixed-rate bonds. Of particular interest in floating rate securities are those tied to commercial mortgage loans, specifically those secured by distribution centers, data storage and other “new economy” assets.
Outlook
Though the Federal Open Market Committee has announced its intention to increase the Funds rate by a total 2% by 2024 (8 increases of 0.25%), we believe fewer rate hikes will be required to stabilize inflation and continue to promote economic growth. Nevertheless, we remain cautious and defensive with respect to portfolio structure while markets interest rates remain well below the current and expected levels of inflation. The bond market historically high degree of price sensitivity to changes in interest rates reinforces our focus on our own “dual mandate”, providing diversification within portfolios containing equities and other risk assets and principal preservation in a rising rate environment. Portfolio liquidity and active management allow us to achieve both goals.
On behalf of all the dedicated members of the CS McKee team, we thank you for the opportunity to serve your investment needs and wish you a safe and enjoyable holiday season!
Regards,
Brian S. Allen, CFA
Director – Fixed Income
CS McKee Asset Management
__________________
1 | The North Square McKee Bond Fund launched on December 28, 2020. |
2 | Effective on December 1, 2021, the outstanding Class Y shares of the McKee Bond Fund were renamed as Class I shares, and the previously outstanding Class I shares of the Fund were renamed as Class R6 shares. The ticker symbols of the renamed classes did not change. All references to Class Y shares in this report represent the new Class I shares, and all references to Class I shares in this report represent the new Class R6 shares. There were no charges imposed in connection with this renaming of share classes. |
3 | The Bloomberg Intermediate Aggregate index measures the performance of investment grade bonds with maturities (or average lives) of between one-year and ten years. |
The views in this letter are those of the Fund’s direct advisor as of December 30, 2021 and may not necessarily reflect the same views on the date this letter is first published or any date thereafter. These views are intended to help shareholders in understanding the fund’s investment methodology and do not constitute investment advice.
The Fund invests in foreign securities which carry the associated risks of economic and political instability, market liquidity, currency volatility and differences in accounting standards. The Fund invests in debt securities which can lose their value as interest rates rise and are subject to credit risk which is the risk of deterioration in the financial condition of an issuer and/or general economic conditions that can cause the issuer to not make timely payments of principal and interest also causing the securities to decline in value and an investor can lose principal. When interest rates rise, the price of debt securities generally falls. Longer term securities are generally more volatile. The Fund invests in investment grade debt securities which may be downgraded by a Nationally Recognized Statistical Rating Organization (NRSRO) to below investment grade status. The Fund invests in non-investment grade debt securities which are considered speculative with respect to the issuers' ability to make timely payments of interest and principal, may lack liquidity and have had more frequent and larger price changes than other debt securities. The Fund invests in U.S. government and agency securities which are neither issued nor guaranteed by the U.S. Treasury and are not guaranteed against price movements due to changing interest rates. The Fund invests in mortgage-backed securities and asset-backed securities which are subject to the risks of prepayment, defaults, changing interest rates and, at times, the financial condition of the issuer. The advisor engages the sub-advisor to manage the Fund's portfolio; the sub-advisor's judgment may impact the Fund's performance.
| Discussion of North Square Strategic Income Fund Performance | | |
Dear Shareholders,
As we near the end of 2021 with nearly 2 years of battling the COVID-19 pandemic under our belts, much of the world is still awash in lockdowns and illness with seemingly no end in sight. It turns out that the vaccines are not the panacea that everyone had hoped for and perhaps herd immunity is but a pipe dream. The silver lining in all this is that the world is now learning to live with the virus. That is to say, perhaps COVID-19 is moving from pandemic to endemic. As evidence of this I would submit that for the first time in nearly 2 years, I did not mention COVID-19 (this letter to shareholders notwithstanding) in many of my third quarter investment update meetings.
In the beginning of the North Square Strategic Income Fund’s (the Fund) fiscal year, the world was only a few months away from the first vaccine rollouts. Red Cedar had already moved the fund aggressively to take advantage of the ensuing pro-cyclical economic re-opening trade by owning preferred securities, European Alternative Tier 1 (AT1) securities, and corporate bonds. We also added some higher yielding Sovereign Debt, denominated in local currency. The capital markets had plenty of reasons to be optimistic: central bankers were providing unprecedented liquidity, the economic re-opening was finally upon us, and asset prices were still at reasonable, if not cheap levels.
The economic re-opening, supply chain disruptions, fiscal largesse of governments, labor shortages and incredibly easy financial conditions courtesy of the world’s central banks are all conditions contributing to inflationary pressures globally. As sub-advisor to the Fund, Red Cedar Investment Management was not an advocate of the Federal Reserve’s (the Fed) transitory narrative on the topic of inflation and positioned the Fund accordingly with a more defensive posture with respect duration. Put another way, we did not believe and still do not believe investors are being compensated appropriately to take unnecessary interest rate risk.
As 2021 unfolded, the reflationary trade was in overdrive, allowing credit spreads to tighten dramatically and boosting returns to the fund. During those first 3 months of the year, the relative safety of U.S. Treasuries (UST) began to lose its allure as the yield on 10-year USTs rose from 0.92% to 1.74%. The Fund’s positioning of low interest rate risk and overweighting of credit risk enabled it to achieve a slightly positive total return for the quarter, while the Bloomberg U.S. Aggregate Bond Index* (the Fund’s benchmark) posted a -3.4% return – its worst start to a year ever.
As we approached mid-year, the Federal Reserve seemed to be wavering on its ultra-dovish stance. Indeed, after the June 16 Federal Open Market Committee (FOMC) meeting, Fed Chairman Jerome Powell indicated that the Fed was now much closer to meeting their employment and inflation goals. Furthermore, the infamous “Dot Plot” now indicated that 13 of 18 FOMC members thought rate hikes would begin no later than 2023. With this new messaging from the Fed, U.S. Treasuries rallied, sending the 10-year UST yield down to 1.47%. Despite the Fund’s shorter duration stance than the broader fixed income market, it was able to outperform its benchmark during the quarter on the strength of its credit positioning.
The Fed has now telegraphed its intentions for Quantitative Easing and future rate hikes – they will begin tapering by year end and will not begin raising rates until after bond buying ceases. It did not take long for the markets to get comfortable with the Fed’s plans and interest rates traded in a relatively tight range until the Fund’s fiscal year end. While Red Cedar still sees plenty of runway before financial conditions truly begin to tighten, the clock is now ticking as to when the Fed begins to hike rates. As we also consider that inflation continues to run hot - prints of this magnitude have not been reported since the early 1990’s in the U.S. – the possibility of the Fed taking away the punch bowl early and/or a policy error does exist. Against this backdrop, Red Cedar increased the active tail-risk hedging within the Fund during the summer months. The hedging strategy is designed to help mitigate potential underperformance of risky assets held in the Fund if the aforementioned scenarios play out and cause a spike in volatility or a market spasm. While this is not our base case, it should be emphasized that tail-risk hedging is an important element of the Fund’s strategy.
Against the backdrop of exceptionally low interest rates globally, traditional fixed income investors experienced a total return of -0.48% as represented by the Bloomberg U.S. Aggregate Bond Index for the fiscal year ended October 31, 2021. The North Square Strategic Income Fund provided value to its shareholders with a return of 8.63% during that same time period. Red Cedar believes it has provided that return without undertaking undue levels of risk for the shareholders.
We at Red Cedar Investment Management would like to wish everyone a safe and peaceful holiday season and send our best wishes for a Happy New Year.
Regards,
John L. Cassady III, CFA
Chief Investment Officer
Red Cedar Investment Management
* The Bloomberg US Aggregate Bond Index is a broad-based flagship benchmark that measures the investment grade, US dollar-denominated, fixed-rate taxable bond market. The index includes Treasuries, government-related and corporate securities, MBS (agency fixed-rate pass-throughs), ABS and CMBS (agency and non-agency).
The views in this letter are those of the Fund’s direct advisor as of December 30, 2021 and may not necessarily reflect the same views on the date this letter is first published or any date thereafter. These views are intended to help shareholders in understanding the fund’s investment methodology and do not constitute investment advice.
The value of a convertible security is influenced by changes in interest rates, the credit standing of the issuer and other factors. Debt securities have interest rate, inflation and credit risks and are subject to prepayment and default risk. High yield and junk securities involve greater risk and tend to be more sensitive to economic conditions and credit risk. Foreign and US currencies may unfavorably fluctuate in value relative to each other. Distressed securities are typically unrated, lower-rated, in default or close to default and the prices may be extremely volatile, more likely to become worthless and the Fund may lose all of its investment.
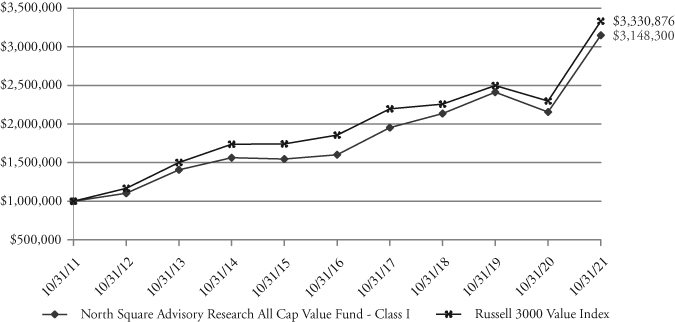
North Square Advisory Research All Cap Value Fund
FUND PERFORMANCE at October 31, 2021 (Unaudited)
Performance of a $1,000,000 Investment
This graph compares a hypothetical $1,000,000 investment in the Fund, made on October 31, 2011, with a similar investment in the Russell 3000 Value Index. Results include the reinvestment of all dividends and capital gains.
The Russell 3000 Value Index measures the performance of the broad value segment of the U.S. equity value universe. It includes those Russell 3000 companies with lower price-to-book ratios and lower forecasted growth values. This index does not reflect expenses, fees or sales charge, which would lower performance. The index is unmanaged and is not available for investment.
| | | | | Since | Inception |
Average Annual Total Returns as of October 31, 2021 | 1 Year | 5 Year | 10 Year | Inception | Date |
Class I | 46.09% | 14.47% | 12.15% | 11.75% | 11/16/09 |
Russell 3000 Value Index | 44.97% | 12.41% | 12.79% | 11.90% | 11/16/09 |
The performance data quoted here represents past performance and past performance is not a guarantee of future results. Investment return and principal value will fluctuate so that an investor’s shares, when redeemed, may be worth more or less than their original cost. Current performance may be lower or higher than the performance information quoted. The most recent month end performance may be obtained by calling 1-855-551-5521.
The Fund acquired all assets and assumed the liabilities of the Advisory Research All Cap Value Fund (the “Predecessor Fund”) effective the close of business on February 21, 2020. The Predecessor Fund commenced investment operations on November 16, 2009. As a result of the reorganization, the Fund is the accounting successor of the Predecessor Fund. Performance results shown in the performance table above prior to February 21, 2020 reflect the performance of the Predecessor Fund.
Gross and net expense ratios for Class I shares were 1.96% and 0.96%, respectively, which were the amounts stated in the current prospectus dated February 28, 2021. For the Fund’s current one year expense ratios, please refer to the Financial Highlights section of this report. The Fund’s advisor has contractually agreed to waive its fees and/or pay for operating expenses of the Fund to ensure that total annual fund operating expenses do not exceed 0.95% of the average daily net assets of the Fund’s Class I shares. This agreement is in effect until February 28, 2023, and it may be terminated before that date only by the Trust’s Board of Trustees. In the absence of such waivers, the Fund’s returns would have been lower.
Returns reflect the reinvestment of distributions made by the Fund, if any. The graph and performance table above do not reflect the deduction of taxes that a shareholder would pay on Fund distributions or the redemption of Fund shares.
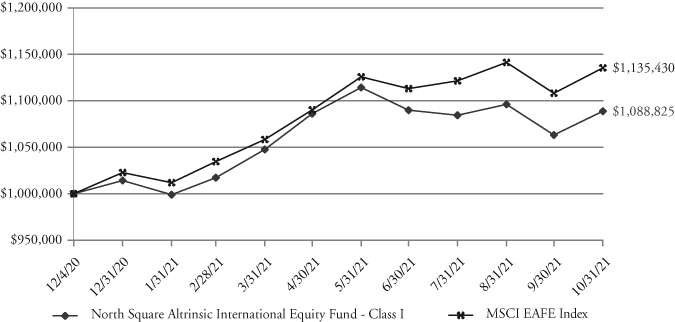
North Square Altrinsic International Equity Fund
FUND PERFORMANCE at October 31, 2021 (Unaudited)
Performance of a $1,000,000 Investment
This graph compares a hypothetical $1,000,000 investment in the Fund, made at the Fund’s inception, with a similar investment in the MSCI EAFE Index. Results include the reinvestment of all dividends and capital gains.
The MSCI EAFE Index is an equity index which captures large and mid cap representation across 21 developed markets countries around the world, excluding the US and Canada. With 841 constituents, the index covers approximately 85% of the free float-adjusted market capitalization in each country.
| | | Calendar | Since | Inception |
Total Returns as of October 31, 2021 | 6 Month | Year to Date | Inception | Date |
Class I | 0.24% | 7.36% | 8.88% | 12/04/20 |
MSCI EAFE Index | 4.14% | 11.01% | 13.54% | 12/04/20 |
The performance data quoted here represents past performance and past performance is not a guarantee of future results. Investment return and principal value will fluctuate so that an investor’s shares, when redeemed, may be worth more or less than their original cost. Current performance may be lower or higher than the performance information quoted. The most recent month end performance may be obtained by calling 1-855-551-5521.
Gross and net expense ratios for Class I shares were 1.52% and 0.98%, respectively, which were the amounts stated in the current prospectus dated November 2, 2020. For the Fund’s current expense ratios, please refer to the Financial Highlights section of this report. The Fund’s advisor has contractually agreed to waive its fees and/or pay for operating expenses of the Fund to ensure that total annual fund operating expenses do not exceed 0.97% of the average daily net assets of the Fund’s Class I shares. This agreement is in effect until November 2, 2022, and it may be terminated before that date only by the Trust’s Board of Trustees. In the absence of such waivers, the Fund’s returns would have been lower.
Returns reflect the reinvestment of distributions made by the Fund, if any. The graph and performance table above do not reflect the deduction of taxes that a shareholder would pay on Fund distributions or the redemption of Fund shares.
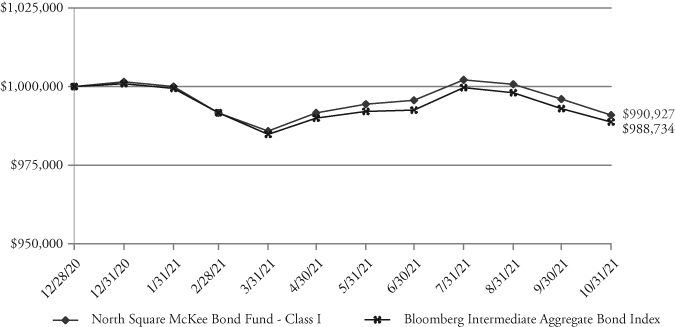
North Square McKee Bond Fund
FUND PERFORMANCE at October 31, 2021 (Unaudited)
Performance of a $1,000,000 Investment
This graph compares a hypothetical $1,000,000 investment in the Fund’s Class I shares (the class with the largest net assets), made at the Fund’s inception, with a similar investment in the Blomberg Intermediate Aggregate Bond Index. Results include the reinvestment of all dividends and capital gains.
The Bloomberg Intermediate Aggregate Bond Index is a broad base, market capitalization-weighted bond market index representing intermediate term investment grade bonds traded in the United States.
| | | | Calendar | Since | Inception |
Total Returns as of October 31, 2021 | 3 Month | 6 Month | Year to Date | Inception | Date |
Class I | (1.12)% | (0.07)% | (1.06)% | (0.91)% | 12/28/20 |
Class Y | (1.17)% | N/A | N/A | (0.12)% | 05/19/21 |
Bloomberg Intermediate Aggregate Bond Index | (1.09)% | (0.12)% | (1.22)% | (1.13)% | 12/28/20 |
The performance data quoted here represents past performance and past performance is not a guarantee of future results. Investment return and principal value will fluctuate so that an investor’s shares, when redeemed, may be worth more or less than their original cost. Current performance may be lower or higher than the performance information quoted. The most recent month end performance may be obtained by calling 1-855-551-5521.
Gross and net expense ratios for Class I shares were 0.82% and 0.28%, and for Class Y shares were 0.82% and 0.47%, which were the amounts stated in the current prospectus dated November 2, 2020. For the Fund’s current expense ratios, please refer to the Financial Highlights section of this report. The Fund’s advisor has contractually agreed to waive its fees and/or pay for operating expenses of the Fund to ensure that total annual fund operating expenses do not exceed 0.28% and 0.47% of the average daily net assets of the Fund’s Class I and Class Y shares, respectively. This agreement is in effect until November 2, 2022, and it may be terminated before that date only by the Trust’s Board of Trustees. In the absence of such waivers, the Fund’s returns would have been lower.
Returns reflect the reinvestment of distributions made by the Fund, if any. The graph and performance table above do not reflect the deduction of taxes that a shareholder would pay on Fund distributions or the redemption of Fund shares.
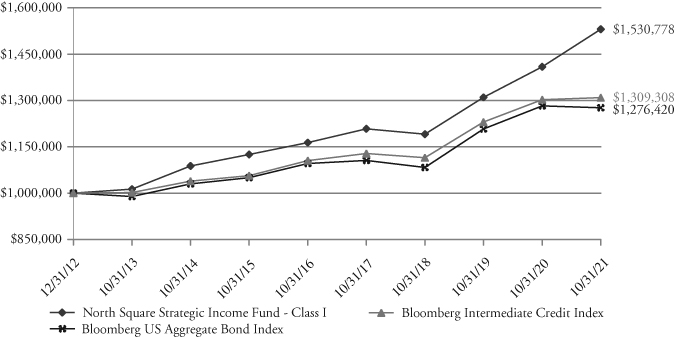
North Square Strategic Income Fund
FUND PERFORMANCE at October 31, 2021 (Unaudited)
Performance of a $1,000,000 Investment
This graph compares a hypothetical $1,000,000 investment in the Fund, made on October 31, 2010, with a similar investment in the Bloomberg US Aggregate Bond Index and the Bloomberg Intermediate Credit Index. Results include the reinvestment of all dividends and capital gains.
The Bloomberg US Aggregate Bond Index is a broad-based flagship benchmark that measures the investment grade, US dollar denominated, fixed-rate taxable bond market. The Bloomberg Intermediate Credit Index is a board-based flagship benchmark that measures the non-securitized component of the US Aggregate Index with less than 10 years to maturity. The indices do not reflect expenses, fees or sales charge, which would lower performance. The indices are unmanaged and are not available for investment.
| | | | | Since | Inception |
Average Annual Total Returns as of October 31, 2021 | 1 Year | 5 Year | 10 Year | Inception | Date |
Class I | 8.63% | 5.64% | 5.33% | 4.58% | 12/31/12 |
Bloomberg US Aggregate Bond Index | (0.48)% | 3.10% | 3.00% | 2.80% | 12/31/12 |
Bloomberg Intermediate Credit Index | 0.51% | 3.44% | 3.53% | 3.10% | 12/31/12 |
The performance data quoted here represents past performance and past performance is not a guarantee of future results. Investment return and principal value will fluctuate so that an investor’s shares, when redeemed, may be worth more or less than their original cost. Current performance may be lower or higher than the performance information quoted. The most recent month end performance may be obtained by calling 1-855-551-5521.
The Fund acquired all assets and assumed the liabilities of the Advisory Research Strategic Income Fund (the “Predecessor Fund”) effective the close of business on February 21, 2020. The Predecessor Fund commenced investment operations on December 31, 2012 after the conversion of a limited partnership account, the Advisory Research Value Income Fund, L.P. (the “Predecessor Account”), which commenced operations on June 30, 2003. As a result of each reorganization, the Fund is the accounting successor of each the Predecessor Fund and Predecessor Account. Performance results shown in the performance table above between February 21, 2020 and December 31, 2012 reflect the performance of the Predecessor Fund, and performance results shown prior to December 31, 2012 reflect the performance of the Predecessor Account. The Predecessor Account was not registered under the 1940 Act and therefore was not subject to certain restrictions imposed by the 1940 Act on registered investment companies and by the Internal Revenue Code of 1986 on regulated investment companies. If the Predecessor Account had been registered under the 1940 Act, the Predecessor Account’s performance may have been adversely affected.
North Square Strategic Income Fund
FUND PERFORMANCE at October 31, 2021 (Unaudited)
Gross and net expense ratios for Class I shares were 1.50% and 0.92%, respectively, which were the amounts stated in the current prospectus dated February 28, 2021. For the Fund’s current one year expense ratios, please refer to the Financial Highlights section of this report. The Fund’s advisor has contractually agreed to waive its fees and/or pay for operating expenses of the Fund to ensure that total annual fund operating expenses do not exceed 0.90% of the average daily net assets of the Fund’s Class I shares. This agreement is in effect until February 28, 2023, and it may be terminated before that date only by the Trust’s Board of Trustees. In the absence of such waivers, the Fund’s returns would have been lower.
Returns reflect the reinvestment of distributions made by the Fund, if any. The graph and performance table above do not reflect the deduction of taxes that a shareholder would pay on Fund distributions or the redemption of Fund shares.
North Square Advisory Research All Cap Value Fund
SCHEDULE OF INVESTMENTS
As of October 31, 2021
| Number | | | | | |
| of Shares | | | | Value | |
| | | COMMON STOCKS – 96.7% | | | |
| | | | | | |
| | | BASIC MATERIALS – 4.5% | | | |
| | | Specialty Chemicals – 4.5% | | | |
| | 20,034 | | Element Solutions Inc. | | $ | 454,972 | |
| | | | TOTAL BASIC MATERIALS | | | 454,972 | |
| | | | | | | | |
| | | | | | | | |
| | | | CONSUMER DISCRETIONARY – 21.0% | | | | |
| | | | Apparel Retailers – 3.5% | | | | |
| | 5,412 | | The TJX Co., Inc. | | | 354,432 | |
| | | | Home Improvement Retailers – 3.0% | | | | |
| | 823 | | The Home Depot, Inc. | | | 305,942 | |
| | | | Household Furnishings – 3.1% | | | | |
| | 3,103 | | Fortune Brands Home & Security, Inc. | | | 314,644 | |
| | | | Restaurants and Bars – 4.9% | | | | |
| | 1,067 | | McDonald’s Corp. | | | 262,002 | |
| | 2,214 | | Starbucks Corp. | | | 234,839 | |
| | | | | | | 496,841 | |
| | | | Specialty Retailers – 6.5% | | | | |
| | 1,576 | | Asbury Automotive Group, Inc.* | | | 308,439 | |
| | 193 | | AutoZone, Inc.* | | | 344,474 | |
| | | | | | | 652,913 | |
| | | | TOTAL CONSUMER DISCRETIONARY | | | 2,124,772 | |
| | | | | | | | |
| | | | CONSUMER STAPLES – 3.0% | | | | |
| | | | Food Retailers and Wholesalers – 3.0% | | | | |
| | 6,665 | | Performance Food Group Co.* | | | 301,458 | |
| | | | TOTAL CONSUMER STAPLES | | | 301,458 | |
| | | | | | | | |
| | | | ENERGY – 7.2% | | | | |
| | | | Integrated Oil and Gas – 3.5% | | | | |
| | 3,103 | | Chevron Corp. | | | 355,262 | |
| | | | Oil: Crude Producers – 3.7% | | | | |
| | 4,389 | | Denbury Inc.* | | | 371,573 | |
| | | | TOTAL ENERGY | | | 726,835 | |
| | | | | | | | |
| | | | FINANCIALS – 17.5% | | | | |
| | | | Banks – 6.0% | | | | |
| | 8,327 | | First Interstate BancSystem, Inc. – Class A | | | 346,154 | |
| | 3,552 | | Nicolet Bankshares, Inc.* | | | 255,353 | |
| | | | | | | 601,507 | |
| | | | Diversified Financial Services – 7.0% | | | | |
| | 9,044 | | Cannae Holdings, Inc.* | | | 308,400 | |
| | 2,364 | | JPMorgan Chase & Co. | | | 401,620 | |
| | | | | | | 710,020 | |
| | | | Reinsurance – 4.5% | | | | |
| | 1,577 | | Berkshire Hathaway Inc. – Class B* | | | 452,615 | |
| | | | TOTAL FINANCIALS | | | 1,764,142 | |
See accompanying Notes to Financial Statements.
North Square Advisory Research All Cap Value Fund
SCHEDULE OF INVESTMENTS – Continued
As of October 31, 2021
| Number | | | | | |
| of Shares | | | | Value | |
| | | COMMON STOCKS (Continued) | | | |
| | | | | | |
| | | HEALTH CARE – 10.7% | | | |
| | | Health Care Management Services – 3.7% | | | |
| | 805 | | UnitedHealth Group Inc. | | $ | 370,678 | |
| | | | Medical Equipment – 3.4% | | | | |
| | 2,872 | | Medtronic, PLC1 | | | 344,238 | |
| | | | Pharmaceuticals – 3.6% | | | | |
| | 2,800 | | Abbott Laboratories | | | 360,892 | |
| | | | TOTAL HEALTH CARE | | | 1,075,808 | |
| | | | | | | | |
| | | | INDUSTRIALS – 17.0% | | | | |
| | | | Commercial Vehicles and Parts – 2.5% | | | | |
| | 5,961 | | Federal Signal Corp. | | | 255,190 | |
| | | | Electrical Components – 2.0% | | | | |
| | 1,346 | | Regal Rexnord Corp. | | | 205,030 | |
| | | | Industrial Suppliers – 3.6% | | | | |
| | 22,117 | | Gates Industrial Corp. plc*1 | | | 363,603 | |
| | | | Machinery: Industrial – 2.0% | | | | |
| | 5,503 | | Zurn Water Solutions Corp. | | | 199,649 | |
| | | | Railroads – 3.6% | | | | |
| | 1,512 | | Union Pacific Corp. | | | 364,997 | |
| | | | Transaction Processing Services – 3.3% | | | | |
| | 1,925 | | American Express Co. | | | 334,527 | |
| | | | TOTAL INDUSTRIALS | | | 1,722,996 | |
| | | | | | | | |
| | | | TECHNOLOGY – 10.4% | | | | |
| | | | Computer Hardware – 3.4% | | | | |
| | 1,841 | | CDW Corp. of Delaware | | | 343,623 | |
| | | | Consumer Digital Services – 4.3% | | | | |
| | 148 | | Alphabet Inc. – Class A* | | | 438,216 | |
| | | | Software – 2.7% | | | | |
| | 822 | | Microsoft Corp. | | | 272,592 | |
| | | | TOTAL TECHNOLOGY | | | 1,054,431 | |
| | | | | | | | |
| | | | TELECOMMUNICATIONS – 3.3% | | | | |
| | | | Telecommunications Equipment – 3.3% | | | | |
| | 1,445 | | L3Harris Technologies, Inc. | | | 333,130 | |
| | | | TOTAL TELECOMMUNICATIONS | | | 333,130 | |
| | | | | | | | |
| | | | UTILITIES – 2.1% | | | | |
| | | | Gas Distribution – 2.1% | | | | |
| | 1,624 | | Chesapeake Utilities Corp. | | | 212,858 | |
| | | | TOTAL UTILITIES | | | 212,858 | |
| | | | TOTAL COMMON STOCKS | | | | |
| | | | (Cost $7,647,942) | | | 9,771,402 | |
See accompanying Notes to Financial Statements.
North Square Advisory Research All Cap Value Fund
SCHEDULE OF INVESTMENTS – Continued
As of October 31, 2021
| Number | | | | | |
| of Shares | | | | Value | |
| | | SHORT-TERM INVESTMENT – 3.2% | | | |
| | 326,810 | | First American Treasury Obligations Fund – Class X, 0.01%2 | | $ | 326,810 | |
| | | | TOTAL SHORT-TERM INVESTMENT | | | | |
| | | | (Cost $326,810) | | | 326,810 | |
| | | | TOTAL INVESTMENTS – 99.9% | | | | |
| | | | (Cost $7,974,752) | | | 10,098,212 | |
| | | | Other Assets in Excess of Liabilities – 0.1% | | | 13,210 | |
| | | | TOTAL NET ASSETS – 100.0% | | $ | 10,111,422 | |
PLC – Public Limited Company
| * | Non-Income producing security. |
1 | Foreign security denominated in U.S. Dollars. |
2 | The rate is the annualized seven-day yield at period end. |
See accompanying Notes to Financial Statements.
North Square Advisory Research All Cap Value Fund
SUMMARY OF INVESTMENTS
As of October 31, 2021
| | | Percent of Total |
Security Type/Sector | | Net Assets |
Common Stocks | | | |
Consumer Discretionary | | | 21.0 | % |
Financials | | | 17.5 | % |
Industrials | | | 17.0 | % |
Health Care | | | 10.7 | % |
Technology | | | 10.4 | % |
Energy | | | 7.2 | % |
Basic Materials | | | 4.5 | % |
Telecommunications | | | 3.3 | % |
Consumer Staples | | | 3.0 | % |
Utilities | | | 2.1 | % |
| Total Common Stocks | | | 96.7 | % |
Short-Term Investment | | | 3.2 | % |
| Total Investments | | | 99.9 | % |
Other Assets in Excess of Liabilities | | | 0.1 | % |
| Total Net Assets | | | 100.0 | % |
See accompanying Notes to Financial Statements.
North Square Altrinsic International Equity Fund
SCHEDULE OF INVESTMENTS
As of October 31, 2021
| Number | | | | | |
| of Shares | | | | Value | |
| | | COMMON STOCKS – 93.8% | | | |
| | | | | | |
| | | BERMUDA – 2.4% | | | |
| | 2,094 | | Credicorp Ltd. | | $ | 271,508 | |
| | 3,086 | | Everest Re Group, Ltd. | | | 806,989 | |
| | | | | | | 1,078,497 | |
| | | | CANADA – 1.6% | | | | |
| | 5,245 | | Agnico Eagle Mines Ltd. | | | 278,247 | |
| | 71,759 | | Kinross Gold Corp. | | | 431,389 | |
| | | | | | | 709,636 | |
| | | | CHINA – 4.3% | | | | |
| | 2,883 | | Alibaba Group Holding Ltd. – ADR* | | | 475,522 | |
| | 2,827 | | Baidu, Inc. – ADR* | | | 458,653 | |
| | 129,200 | | Sands China Ltd.* | | | 295,248 | |
| | 27,297 | | Tencent Music Entertainment – ADR* | | | 214,555 | |
| | 17,060 | | Trip.com Group Ltd. – ADR* | | | 487,233 | |
| | | | | | | 1,931,211 | |
| | | | FRANCE – 12.0% | | | | |
| | 11,324 | | Accor SA* | | | 404,630 | |
| | 43,274 | | AXA SA | | | 1,258,625 | |
| | 27,607 | | Bureau Veritas SA | | | 876,352 | |
| | 9,429 | | Danone | | | 614,212 | |
| | 10,035 | | Sanofi | | | 1,002,630 | |
| | 6,386 | | SCOR SE | | | 214,823 | |
| | 19,704 | | TotalEnergies SE | | | 987,876 | |
| | | | | | | 5,359,148 | |
| | | | GERMANY – 7.4% | | | | |
| | 708 | | adidas AG | | | 231,867 | |
| | 2,953 | | Continental AG* | | | 346,556 | |
| | 9,815 | | Fresenius Medical Care AG & Co. KGaA | | | 651,951 | |
| | 6,765 | | SAP SE | | | 980,047 | |
| | 5,203 | | Siemens AG | | | 843,740 | |
| | 9,525 | | Siemens Energy AG* | | | 273,291 | |
| | | | | | | 3,327,452 | |
| | | | IRELAND – 4.3% | | | | |
| | 671 | | Linde Public Limited Co. | | | 216,026 | |
| | 5,665 | | Medtronic, PLC | | | 679,007 | |
| | 4,161 | | Willis Towers Watson Public Limited Co. | | | 1,008,127 | |
| | | | | | | 1,903,160 | |
| | | | ISRAEL – 2.4% | | | | |
| | 8,761 | | Check Point Software Technologies Ltd.* | | | 1,047,816 | |
| | | | | | | | |
| | | | JAPAN – 13.8% | | | | |
| | 70,346 | | Astellas Pharma Inc. | | | 1,183,183 | |
| | 9,687 | | Daito Trust Construction Co., Ltd. | | | 1,200,092 | |
| | 20,537 | | Japan Exchange Group Inc. | | | 485,338 | |
| | 10,740 | | KUBOTA CORP. | | | 228,275 | |
| | 14,623 | | Makita Corp. | | | 675,243 | |
| | 865 | | Nintendo Co., Ltd. | | | 380,987 | |
See accompanying Notes to Financial Statements.
North Square Altrinsic International Equity Fund
SCHEDULE OF INVESTMENTS – Continued
As of October 31, 2021
| Number | | | | | |
| of Shares | | | | Value | |
| | | COMMON STOCKS (Continued) | | | |
| | | | | | |
| | | JAPAN (Continued) | | | |
| | 25,201 | | Sumitomo Mitsui Trust Holdings, Inc. | | $ | 830,046 | |
| | 22,572 | | Tokio Marine Holdings, Inc. | | | 1,187,865 | |
| | | | | | | 6,171,029 | |
| | | | MEXICO – 0.1% | | | | |
| | 8,660 | | Grupo Financiero Banorte S.A.B. de C.V. | | | 54,741 | |
| | | | | | | | |
| | | | NETHERLANDS – 7.6% | | | | |
| | 7,126 | | Akzo Nobel N.V. | | | 818,990 | |
| | 10,730 | | Euronext NV | | | 1,208,141 | |
| | 12,509 | | Heineken N.V. | | | 1,385,599 | |
| | | | | | | 3,412,730 | |
| | | | REPUBLIC OF KOREA – 2.8% | | | | |
| | 20,098 | | KB Financial Group Inc. – ADR* | | | 966,111 | |
| | 199 | | Samsung Electronics Co., Ltd. – GDR | | | 297,107 | |
| | | | | | | 1,263,218 | |
| | | | SINGAPORE – 1.7% | | | | |
| | 106,431 | | Singapore Exchange Ltd. | | | 763,999 | |
| | | | | | | | |
| | | | SPAIN – 1.0% | | | | |
| | 2,736 | | Aena SME, S.A.* | | | 448,014 | |
| | | | | | | | |
| | | | SWEDEN – 1.5% | | | | |
| | 14,991 | | ASSA ABLOY AB – Class B | | | 439,012 | |
| | 22,112 | | Telefonaktiebolaget LM Ericsson – Class B | | | 242,027 | |
| | | | | | | 681,039 | |
| | | | SWITZERLAND – 15.0% | | | | |
| | 9,759 | | Chubb Ltd. | | | 1,906,713 | |
| | 10,027 | | Julius Baer Group Ltd. | | | 724,756 | |
| | 11,598 | | Nestle S.A. | | | 1,530,439 | |
| | 9,717 | | Novartis AG | | | 802,745 | |
| | 1,116 | | Roche Holding AG | | | 431,542 | |
| | 2,947 | | Zurich Insurance Group AG | | | 1,306,452 | |
| | | | | | | 6,702,647 | |
| | | | UNITED KINGDOM – 14.6% | | | | |
| | 2,166 | | Aon PLC – Class A | | | 692,947 | |
| | 12,615 | | BP p.l.c – ADR | | | 363,186 | |
| | 241,567 | | BT Group PLC* | | | 459,199 | |
| | 26,387 | | Diageo plc | | | 1,311,586 | |
| | 61,634 | | GlaxoSmithKline PLC | | | 1,272,493 | |
| | 29,544 | | Liberty Global plc – Class A* | | | 849,094 | |
| | 760,658 | | Lloyds Banking Group plc | | | 522,790 | |
| | 17,362 | | Smiths Group PLC | | | 322,077 | |
| | 49,314 | | Vodafone Group PLC – ADR | | | 737,244 | |
| | | | | | | 6,530,616 | |
See accompanying Notes to Financial Statements.
North Square Altrinsic International Equity Fund
SCHEDULE OF INVESTMENTS – Continued
As of October 31, 2021
| Number | | | | | |
| of Shares | | | | Value | |
| | | COMMON STOCKS (Continued) | | | |
| | | | | | |
| | | UNITED STATES – 1.3% | | | |
| | 105 | | Booking Holdings Inc.* | | $ | 254,182 | |
| | 4,430 | | Cognizant Technology Solutions Corp. – Class A | | | 345,938 | |
| | | | | | | 600,120 | |
| | | | TOTAL COMMON STOCKS | | | | |
| | | | (Cost $40,292,631) | | | 41,985,073 | |
| | | | | | | | |
| | | | PREFERRED STOCK – 1.6% | | | | |
| | | | GERMANY – 1.6% | | | | |
| | 7,807 | | Henkel AG & Co. KGaA | | | 698,348 | |
| | | | TOTAL PREFERRED STOCK | | | | |
| | | | (Cost $795,117) | | | 698,348 | |
| | | | | | | | |
| | | | SHORT-TERM INVESTMENT – 3.5% | | | | |
| | 1,550,715 | | First American Treasury Obligations Fund – Class X, 0.01%1 | | | 1,550,715 | |
| | | | TOTAL SHORT-TERM INVESTMENT | | | | |
| | | | (Cost $1,550,715) | | | 1,550,715 | |
| | | | TOTAL INVESTMENTS – 98.9% | | | | |
| | | | (Cost $42,638,463) | | | 44,234,136 | |
| | | | Other Assets in Excess of Liabilities – 1.1% | | | 498,790 | |
| | | | TOTAL NET ASSETS – 100.0% | | $ | 44,732,926 | |
ADR – American Depositary Receipt
GDR – Global Depositary Receipt
PLC – Public Limited Company
| * | Non-Income producing security. |
1 | The rate is the annualized seven-day yield at period end. |
Investments are classified by industry pursuant to the Global Industry Classification Standard (GICS®), which was developed by and/or is the exclusive property of Morgan Stanley Capital International, Inc. (“MSCI”) and Standard & Poor’s Financial Services LLC (“S&P”). GICS is a service mark of MSCI and S&P and has been licensed for use by U.S. Bancorp Fund Services, LLC.
See accompanying Notes to Financial Statements.
North Square Altrinsic International Equity Fund
SUMMARY OF INVESTMENTS
As of October 31, 2021
| | | Percent of Total |
Security Type/Sector | | Net Assets |
Common Stocks | | | |
Financials | | | 31.8 | % |
Health Care | | | 13.4 | % |
Consumer Staples | | | 10.8 | % |
Industrials | | | 9.2 | % |
Communication Services | | | 6.9 | % |
Information Technology | | | 6.5 | % |
Consumer Discretionary | | | 5.6 | % |
Materials | | | 3.9 | % |
Energy | | | 3.0 | % |
Real Estate | | | 2.7 | % |
| Total Common Stocks | | | 93.8 | % |
Preferred Stock | | | 1.6 | % |
Short-Term Investment | | | 3.5 | % |
| Total Investments | | | 98.9 | % |
Other Assets in Excess of Liabilities | | | 1.1 | % |
| Total Net Assets | | | 100.0 | % |
See accompanying Notes to Financial Statements.
North Square McKee Bond Fund
SCHEDULE OF INVESTMENTS
As of October 31, 2021
| Principal | | | | | |
| Amount | | | | Value | |
| | | ASSET BACKED SECURITIES – 8.1% | | | |
| | | Aligned Data Centers Issuer LLC | | | |
$ | 400,000 | | 1.937%, 08/15/20461 | | $ | 398,526 | |
| | | | AmeriCredit Automobile Receivables Trust 2019-1 | | | | |
| | 28,371 | | 2.970%, 11/20/2023 | | | 28,429 | |
| | | | AmeriCredit Automobile Receivables Trust 2019-2 | | | | |
| | 161,000 | | 2.540%, 07/18/2024 | | | 163,126 | |
| | | | AmeriCredit Automobile Receivables Trust 2020-2 | | | | |
| | 245,544 | | 0.600%, 12/18/2023 | | | 245,720 | |
| | | | AMSR 2019-SFR1 Trust | | | | |
| | 500,000 | | 2.774%, 01/20/20391 | | | 515,532 | |
| | | | AMSR 2021-SFR2 Trust | | | | |
| | 200,000 | | 1.527%, 08/19/20381 | | | 197,814 | |
| | | | Amur Equipment Finance Receivables IX LLC | | | | |
| | 97,336 | | 0.750%, 11/20/20261 | | | 97,197 | |
| | | | Avis Budget Rental Car Funding AESOP LLC | | | | |
| | 208,333 | | 3.450%, 03/20/20231 | | | 209,810 | |
| | | | BNSF Railway Co 2015-1 Pass Through Trust | | | | |
| | 199,775 | | 3.442%, 06/16/20281 | | | 217,712 | |
| | | | Burlington Northern and Santa Fe Railway Co 2006-1 Pass Through Trust | | | | |
| | 91,261 | | 5.720%, 01/15/2024 | | | 95,627 | |
| | | | CNH Equipment Trust 2019-A | | | | |
| | 39,787 | | 3.010%, 04/15/2024 | | | 40,190 | |
| | | | CNH Equipment Trust 2020-A | | | | |
| | 6,532 | | 1.080%, 07/15/2023 | | | 6,535 | |
| | | | DT Auto Owner Trust 2020-1 | | | | |
| | 220,000 | | 2.160%, 05/15/20241 | | | 221,073 | |
| | | | Enterprise Fleet Funding 2021-1 LLC | | | | |
| | 475,000 | | 0.440%, 12/20/20261 | | | 473,823 | |
| | | | Exeter Automobile Receivables Trust 2021-2 | | | | |
| | 540,000 | | 0.340%, 03/15/2024 | | | 540,171 | |
| | | | Exeter Automobile Receivables Trust 2021-3 | | | | |
| | 306,000 | | 0.690%, 01/15/2026 | | | 305,067 | |
| | | | Federal Express Corp 1998 Pass Through Trust | | | | |
| | 33,212 | | 6.720%, 07/15/2023 | | | 33,560 | |
| | | | Federal Express Corp 1999 Pass Through Trust | | | | |
| | 39,201 | | 7.650%, 07/15/2024 | | | 40,221 | |
| | | | FedEx Corp 2020-1 Class AA Pass Through Trust | | | | |
| | 460,959 | | 1.875%, 08/20/2035 | | | 456,696 | |
| | | | Flagship Credit Auto Trust 2021-3 | | | | |
| | 131,407 | | 0.360%, 07/15/20271 | | | 131,131 | |
| | | | GLS Auto Receivables Issuer Trust 2021-3 | | | | |
| | 574,000 | | 0.780%, 11/17/20251 | | | 570,861 | |
| | | | GM Financial Automobile Leasing Trust 2020-1 | | | | |
| | 410,000 | | 1.700%, 12/20/2023 | | | 413,173 | |
| | | | GM Financial Automobile Leasing Trust 2020-2 | | | | |
| | 290,000 | | 2.560%, 07/20/2024 | | | 297,010 | |
| | | | GM Financial Automobile Leasing Trust 2021-3 | | | | |
| | 5,000 | | 0.240%, 12/20/2023 | | | 4,995 | |
See accompanying Notes to Financial Statements.
North Square McKee Bond Fund
SCHEDULE OF INVESTMENTS – Continued
As of October 31, 2021
| Principal | | | | | |
| Amount | | | | Value | |
| | | ASSET BACKED SECURITIES (Continued) | | | |
| | | GreatAmerica Leasing Receivables Funding LLC Series 2018-1 | | | |
$ | 22,304 | | 2.830%, 06/17/20241 | | $ | 22,328 | |
| | | | MMAF Equipment Finance LLC 2018-A | | | | |
| | 380,000 | | 3.390%, 01/10/20251 | | | 386,443 | |
| | | | Oportun Funding XIV LLC | | | | |
| | 100,000 | | 1.210%, 03/08/20281 | | | 100,060 | |
| | | | Oscar US Funding X LLC | | | | |
| | 340,000 | | 3.270%, 05/11/20261,2 | | | 351,376 | |
| | | | Oscar US Funding XII LLC | | | | |
| | 110,000 | | 0.700%, 04/10/20251,2 | | | 109,739 | |
| | | | Santander Drive Auto Receivables Trust 2020-4 | | | | |
| | 204,000 | | 0.730%, 03/17/2025 | | | 204,437 | |
| | | | Santander Drive Auto Receivables Trust 2021-1 | | | | |
| | 164,347 | | 0.290%, 11/15/2023 | | | 164,364 | |
| | | | Santander Retail Auto Lease Trust 2021-C | | | | |
| | 227,000 | | 0.500%, 03/20/20251 | | | 225,952 | |
| | | | Union Pacific Railroad Co 2005 Pass Through Trust | | | | |
| | 38,841 | | 5.082%, 01/02/2029 | | | 42,714 | |
| | | | Union Pacific Railroad Co 2014-1 Pass Through Trust | | | | |
| | 151,081 | | 3.227%, 05/14/2026 | | | 160,947 | |
| | | | Verizon Master Trust | | | | |
| | 274,000 | | 0.690%, 05/20/2027 | | | 271,659 | |
| | | | Verizon Owner Trust 2019-C | | | | |
| | 123,000 | | 1.940%, 04/20/2024 | | | 124,016 | |
| | | | Verizon Owner Trust 2020-C | | | | |
| | 340,000 | | 0.670%, 04/21/2025 | | | 338,721 | |
| | | | VMC Finance 2021-FL4 LLC | | | | |
| | 465,997 | | 1.180% (1 Month LIBOR USD + 1.100%), 06/18/20361 | | | 466,159 | |
| | | | Volvo Financial Equipment LLC Series 2019-2 | | | | |
| | 252,264 | | 2.040%, 11/15/20231 | | | 254,382 | |
| | | | Westlake Automobile Receivables Trust 2020-2 | | | | |
| | 300,000 | | 1.320%, 07/15/20251 | | | 301,870 | |
| | | | Westlake Automobile Receivables Trust 2020-3 | | | | |
| | 128,568 | | 0.560%, 05/15/20241 | | | 128,694 | |
| | | | Westlake Automobile Receivables Trust 2021-1 | | | | |
| | 166,706 | | 0.390%, 10/15/20241 | | | 166,720 | |
| | 295,000 | | 0.640%, 03/16/20261 | | | 294,972 | |
| | | | Westlake Automobile Receivables Trust 2021-2 | | | | |
| | 320,000 | | 0.620%, 07/15/20261 | | | 319,075 | |
| | | | World Financial Network Credit Card Master Trust | | | | |
| | 602,000 | | 2.490%, 04/15/2026 | | | 610,445 | |
| | 250,000 | | 2.210%, 07/15/2026 | | | 254,078 | |
| | | | World Omni Auto Receivables Trust 2018-A | | | | |
| | 23,845 | | 2.500%, 04/17/2023 | | | 23,899 | |
| | | | World Omni Auto Receivables Trust 2019-C | | | | |
| | 284,642 | | 1.960%, 12/15/2024 | | | 287,203 | |
| | | | TOTAL ASSET BACKED SECURITIES | | | | |
| | | | (Cost $11,354,221) | | | 11,314,252 | |
See accompanying Notes to Financial Statements.
North Square McKee Bond Fund
SCHEDULE OF INVESTMENTS – Continued
As of October 31, 2021
| Principal | | | | | |
| Amount | | | | Value | |
| | | CORPORATE BONDS – 28.1% | | | |
| | | | | | |
| | | COMMUNICATION SERVICES – 2.3% | | | |
| | | Diversified Telecommunication Services – 1.6% | | | |
| | | AT&T Inc. | | | |
$ | 292,000 | | 1.700%, 03/25/2026 | | $ | 293,334 | |
| | 545,000 | | 4.350%, 03/01/2029 | | | 619,091 | |
| | | | Verizon Communications Inc. | | | | |
| | 905,000 | | 2.100%, 03/22/2028 | | | 907,926 | |
| | 243,000 | | 4.329%, 09/21/2028 | | | 277,510 | |
| | 229,000 | | 4.016%, 12/03/2029 | | | 256,789 | |
| | | | | | | 2,354,650 | |
| | | | Entertainment – 0.4% | | | | |
| | | | The Walt Disney Co. | | | | |
| | 301,000 | | 1.750%, 01/13/2026 | | | 305,514 | |
| | 180,000 | | 2.000%, 09/01/2029 | | | 180,251 | |
| | | | | | | 485,765 | |
| | | | Media – 0.3% | | | | |
| | | | Fox Corp. | | | | |
| | 389,000 | | 3.050%, 04/07/2025 | | | 410,875 | |
| | | | TOTAL COMMUNICATION SERVICES | | | 3,251,290 | |
| | | | | | | | |
| | | | CONSUMER DISCRETIONARY – 2.6% | | | | |
| | | | Automobiles – 2.2% | | | | |
| | | | American Honda Finance Corp. | | | | |
| | 218,000 | | 2.000%, 03/24/2028 | | | 220,267 | |
| | | | Daimler Finance North America LLC | | | | |
| | 150,000 | | 1.450%, 03/02/20261 | | | 149,371 | |
| | | | General Motors Financial Co, Inc. | | | | |
| | 1,207,000 | | 1.250%, 01/08/2026 | | | 1,184,570 | |
| | 129,000 | | 2.400%, 04/10/2028 | | | 128,538 | |
| | | | Hyundai Capital America | | | | |
| | 250,000 | | 5.875%, 04/07/20251 | | | 284,029 | |
| | 122,000 | | 3.500%, 11/02/20261 | | | 129,747 | |
| | | | Toyota Motor Credit Corp. | | | | |
| | 894,000 | | 3.000%, 04/01/2025 | | | 946,781 | |
| | | | | | | 3,043,303 | |
| | | | Hotels, Restaurants & Leisure – 0.4% | | | | |
| | | | Booking Holdings Inc. | | | | |
| | 112,000 | | 3.650%, 03/15/2025 | | | 120,522 | |
| | 67,000 | | 3.600%, 06/01/2026 | | | 72,924 | |
| | | | McDonald’s Corp. | | | | |
| | 82,000 | | 3.300%, 07/01/2025 | | | 87,609 | |
| | | | Starbucks Corp. | | | | |
| | 287,000 | | 3.550%, 08/15/2029 | | | 316,658 | |
| | | | | | | 597,713 | |
| | | | TOTAL CONSUMER DISCRETIONARY | | | 2,456,446 | |
See accompanying Notes to Financial Statements.
North Square McKee Bond Fund
SCHEDULE OF INVESTMENTS – Continued
As of October 31, 2021
| Principal | | | | | |
| Amount | | | | Value | |
| | | CORPORATE BONDS (Continued) | | | |
| | | | | | |
| | | CONSUMER STAPLES – 1.2% | | | |
| | | Beverages – 0.3% | | | |
| | | The Coca-Cola Co. | | | |
$ | 152,000 | | 1.000%, 03/15/2028 | | $ | 145,570 | |
| | | | PepsiCo, Inc. | | | | |
| | 243,000 | | 2.625%, 03/19/2027 | | | 256,701 | |
| | | | | | | 402,271 | |
| | | | Tobacco – 0.9% | | | | |
| | | | Altria Group, Inc. | | | | |
| | 360,000 | | 4.800%, 02/14/2029 | | | 410,396 | |
| | | | B.A.T. Capital Corp. | | | | |
| | 254,000 | | 2.259%, 03/25/2028 | | | 249,536 | |
| | 257,000 | | 4.906%, 04/02/2030 | | | 291,400 | |
| | | | Philip Morris International Inc. | | | | |
| | 354,000 | | 2.750%, 02/25/2026 | | | 372,328 | |
| | | | | | | 1,323,660 | |
| | | | TOTAL CONSUMER STAPLES | | | 1,725,931 | |
| | | | | | | | |
| | | | ENERGY – 3.1% | | | | |
| | | | Oil, Gas & Consumable Fuels – 3.1% | | | | |
| | | | BP Capital Markets America Inc. | | | | |
| | 115,000 | | 2.750%, 05/10/2023 | | | 118,686 | |
| | 175,000 | | 3.017%, 01/16/2027 | | | 185,889 | |
| | 191,000 | | 3.543%, 04/06/2027 | | | 208,054 | |
| | 244,000 | | 3.937%, 09/21/2028 | | | 273,413 | |
| | | | Chevron Corp. | | | | |
| | 583,000 | | 2.954%, 05/16/2026 | | | 621,635 | |
| | | | Equinor ASA | | | | |
| | 515,000 | | 3.125%, 04/06/20302 | | | 556,400 | |
| | | | Exxon Mobil Corp. | | | | |
| | 619,000 | | 2.992%, 03/19/2025 | | | 654,603 | |
| | | | Saudi Arabian Oil Co. | | | | |
| | 200,000 | | 3.500%, 04/16/20291,2 | | | 213,866 | |
| | | | Shell International Finance B.V. | | | | |
| | 888,000 | | 2.375%, 11/07/20292 | | | 912,072 | |
| | | | TransCanada PipeLines Ltd. | | | | |
| | 590,000 | | 1.000%, 10/12/20242 | | | 587,805 | |
| | | | TOTAL ENERGY | | | 4,332,423 | |
| | | | | | | | |
| | | | FINANCIALS – 11.2% | | | | |
| | | | Banks – 8.2% | | | | |
| | | | Bank of America Corp. | | | | |
| | 557,000 | | 1.658% (SOFR + 0.910%), 03/11/20273 | | | 554,680 | |
| | 865,000 | | 1.734% (SOFR + 0.960%), 07/22/20273 | | | 859,718 | |
| | | | Bank of Montreal | | | | |
| | 170,000 | | 1.850%, 05/01/20252 | | | 173,667 | |
| | | | The Bank of Nova Scotia | | | | |
| | 717,000 | | 1.300%, 06/11/20252 | | | 717,016 | |
See accompanying Notes to Financial Statements.
North Square McKee Bond Fund
SCHEDULE OF INVESTMENTS – Continued
As of October 31, 2021
| Principal | | | | | |
| Amount | | | | Value | |
| | | CORPORATE BONDS (Continued) | | | |
| | | | | | |
| | | FINANCIALS (Continued) | | | |
| | | Banks (Continued) | | | |
| | | Canadian Imperial Bank of Commerce | | | |
$ | 415,000 | | 2.250%, 01/28/20252 | | $ | 427,810 | |
| | | | Citigroup Inc. | | | | |
| | 628,000 | | 0.981% (SOFR + 0.669%), 05/01/20253 | | | 625,399 | |
| | | | Comerica Inc. | | | | |
| | 128,000 | | 3.700%, 07/31/2023 | | | 134,279 | |
| | | | F.N.B. Corp. of Pennsylvania | | | | |
| | 249,000 | | 2.200%, 02/24/2023 | | | 251,932 | |
| | | | Federation des caisses Desjardins du Quebec | | | | |
| | 220,000 | | 2.050%, 02/10/20251,2 | | | 224,659 | |
| | | | Fifth Third Bancorp | | | | |
| | 536,000 | | 3.650%, 01/25/2024 | | | 567,302 | |
| | | | JPMorgan Chase & Co. | | | | |
| | 783,000 | | 0.969% (SOFR + 0.580%), 06/23/20253 | | | 778,769 | |
| | 1,688,000 | | 2.005% (SOFR + 1.585%), 03/13/20263 | | | 1,720,894 | |
| | 525,000 | | 1.578% (SOFR + 0.885%), 04/22/20273 | | | 520,170 | |
| | 286,000 | | 1.953% (SOFR + 1.065%), 02/04/20323 | | | 273,849 | |
| | | | KeyCorp | | | | |
| | 190,000 | | 2.250%, 04/06/2027 | | | 194,569 | |
| | | | PNC Financial Services Group, Inc. | | | | |
| | 301,000 | | 1.150%, 08/13/2026 | | | 298,349 | |
| | 513,000 | | 2.550%, 01/22/2030 | | | 530,174 | |
| | | | Royal Bank of Canada | | | | |
| | 431,000 | | 1.200%, 04/27/20262 | | | 425,027 | |
| | | | The Toronto-Dominion Bank | | | | |
| | 941,000 | | 1.150%, 06/12/20252 | | | 937,986 | |
| | 282,000 | | 1.250%, 09/10/20262 | | | 276,919 | |
| | | | Truist Financial Corp. | | | | |
| | 379,000 | | 1.200%, 08/05/2025 | | | 378,867 | |
| | | | U.S. Bancorp | | | | |
| | 404,000 | | 2.400%, 07/30/2024 | | | 419,975 | |
| | 135,000 | | 1.450%, 05/12/2025 | | | 136,355 | |
| | | | | | | 11,428,365 | |
| | | | Capital Markets – 2.5% | | | | |
| | | | The Charles Schwab Corp. | | | | |
| | 87,000 | | 2.000%, 03/20/2028 | | | 87,826 | |
| | | | The Goldman Sachs Group, Inc. | | | | |
| | 881,000 | | 3.272% (3 Month LIBOR USD + 1.201%), 09/29/20253 | | | 930,100 | |
| | 477,000 | | 1.431% (SOFR + 0.798%), 03/09/20273 | | | 469,887 | |
| | 692,000 | | 1.992% (SOFR + 1.090%), 01/27/20323 | | | 663,510 | |
| | | | Morgan Stanley | | | | |
| | 349,000 | | 0.790% (SOFR + 0.525%), 05/30/20253 | | | 345,347 | |
| | 1,036,000 | | 1.593% (SOFR + 0.879%), 05/04/20273 | | | 1,026,657 | |
| | | | | | | 3,523,327 | |
See accompanying Notes to Financial Statements.
North Square McKee Bond Fund
SCHEDULE OF INVESTMENTS – Continued
As of October 31, 2021
| Principal | | | | | |
| Amount | | | | Value | |
| | | CORPORATE BONDS (Continued) | | | |
| | | | | | |
| | | FINANCIALS (Continued) | | | |
| | | Consumer Finance – 0.4% | | | |
| | | Capital One Financial Corp. | | | |
$ | 206,000 | | 2.600%, 05/11/2023 | | $ | 211,810 | |
| | 279,000 | | 1.878%, 11/02/2027 | | | 278,528 | |
| | | | | | | 490,338 | |
| | | | Insurance – 0.1% | | | | |
| | | | American International Group, Inc. | | | | |
| | 100,000 | | 2.500%, 06/30/2025 | | | 103,914 | |
| | | | TOTAL FINANCIALS | | | 15,545,944 | |
| | | | | | | | |
| | | | HEALTH CARE – 1.4% | | | | |
| | | | Biotechnology – 0.3% | | | | |
| | | | AbbVie Inc. | | | | |
| | 195,000 | | 3.600%, 05/14/2025 | | | 209,137 | |
| | | | Amgen Inc. | | | | |
| | 197,000 | | 2.450%, 02/21/2030 | | | 200,315 | |
| | | | | | | 409,452 | |
| | | | Health Care Providers & Services – 0.8% | | | | |
| | | | CVS Health Corp. | | | | |
| | 70,000 | | 4.300%, 03/25/2028 | | | 79,286 | |
| | | | UnitedHealth Group Inc. | | | | |
| | 914,000 | | 3.750%, 07/15/2025 | | | 997,566 | |
| | 79,000 | | 2.300%, 05/15/2031 | | | 79,909 | |
| | | | | | | 1,156,761 | |
| | | | Pharmaceuticals – 0.3% | | | | |
| | | | AstraZeneca PLC | | | | |
| | 268,000 | | 0.700%, 04/08/20262 | | | 260,439 | |
| | | | Merck & Co., Inc. | | | | |
| | 130,000 | | 2.750%, 02/10/2025 | | | 136,495 | |
| | | | | | | 396,934 | |
| | | | TOTAL HEALTH CARE | | | 1,963,147 | |
| | | | | | | | |
| | | | INDUSTRIALS – 1.3% | | | | |
| | | | Aerospace & Defense – 0.8% | | | | |
| | | | The Boeing Co. | | | | |
| | 192,000 | | 1.167%, 02/04/2023 | | | 192,229 | |
| | 830,000 | | 4.875%, 05/01/2025 | | | 917,233 | |
| | | | | | | 1,109,462 | |
| | | | Air Freight & Logistics – 0.1% | | | | |
| | | | United Parcel Service, Inc. | | | | |
| | 152,000 | | 3.900%, 04/01/2025 | | | 165,307 | |
| | | | Machinery – 0.0% | | | | |
| | | | Caterpillar Financial Services Corp. | | | | |
| | 12,000 | | 2.150%, 11/08/2024 | | | 12,437 | |
See accompanying Notes to Financial Statements.
North Square McKee Bond Fund
SCHEDULE OF INVESTMENTS – Continued
As of October 31, 2021
| Principal | | | | | |
| Amount | | | | Value | |
| | | CORPORATE BONDS (Continued) | | | |
| | | | | | |
| | | INDUSTRIALS (Continued) | | | |
| | | Road & Rail – 0.4% | | | |
| | | CSX Corp. | | | |
$ | 150,000 | | 3.800%, 03/01/2028 | | $ | 166,531 | |
| | | | CSX Transportation, Inc. | | | | |
| | 323,183 | | 6.251%, 01/15/2023 | | | 342,321 | |
| | | | | | | 508,852 | |
| | | | TOTAL INDUSTRIALS | | | 1,796,058 | |
| | | | | | | | |
| | | | INFORMATION TECHNOLOGY – 2.9% | | | | |
| | | | Semiconductors & Semiconductor Equipment – 0.6% | | | | |
| | | | Broadcom Inc. | | | | |
| | 504,000 | | 3.459%, 09/15/2026 | | | 538,248 | |
| | | | Intel Corp. | | | | |
| | 296,000 | | 3.700%, 07/29/2025 | | | 321,615 | |
| | | | | | | 859,863 | |
| | | | Software – 0.8% | | | | |
| | | | Microsoft Corp. | | | | |
| | 671,000 | | 2.400%, 08/08/2026 | | | 704,363 | |
| | | | Oracle Corp. | | | | |
| | 390,000 | | 2.650%, 07/15/2026 | | | 405,542 | |
| | | | | | | 1,109,905 | |
| | | | | | | | |
| | | | Technology Hardware, Storage & Peripherals – 1.5% | | | | |
| | | | Apple Inc. | | | | |
| | 590,000 | | 2.050%, 09/11/2026 | | | 607,611 | |
| | 657,000 | | 1.400%, 08/05/2028 | | | 640,889 | |
| | | | Hewlett Packard Enterprise Co. | | | | |
| | 837,000 | | 1.450%, 04/01/2024 | | | 846,042 | |
| | | | | | | 2,094,542 | |
| | | | TOTAL INFORMATION TECHNOLOGY | | | 4,064,310 | |
| | | | | | | | |
| | | | MATERIALS – 0.4% | | | | |
| | | | Chemicals – 0.4% | | | | |
| | | | DuPont de Nemours, Inc. | | | | |
| | 306,000 | | 4.493%, 11/15/2025 | | | 340,568 | |
| | 155,000 | | 4.725%, 11/15/2028 | | | 181,356 | |
| | | | TOTAL MATERIALS | | | 521,924 | |
| | | | | | | | |
| | | | REAL ESTATE – 0.4% | | | | |
| | | | Equity Real Estate Investment Trusts (REITs) – 0.4% | | | | |
| | | | Crown Castle International Corp. | | | | |
| | 504,000 | | 1.050%, 07/15/2026 | | | 488,214 | |
| | | | TOTAL REAL ESTATE | | | 488,214 | |
See accompanying Notes to Financial Statements.
North Square McKee Bond Fund
SCHEDULE OF INVESTMENTS – Continued
As of October 31, 2021
| Principal | | | | | |
| Amount | | | | Value | |
| | | CORPORATE BONDS (Continued) | | | |
| | | UTILITIES – 1.3% | | | |
| | | | | | |
| | | Electric Utilities – 1.1% | | | |
| | | Duke Energy Corp. | | | |
$ | 151,000 | | 2.450%, 06/01/2030 | | $ | 151,059 | |
| | | | Florida Power & Light Co. | | | | |
| | 99,000 | | 2.850%, 04/01/2025 | | | 104,226 | |
| | | | NextEra Energy Capital Holdings, Inc.. | | | | |
| | 576,000 | | 1.900%, 06/15/2028 | | | 569,663 | |
| | | | Pacific Gas and Electric Co. | | | | |
| | 349,000 | | 1.367%, 03/10/2023 | | | 347,944 | |
| | | | Virginia Electric and Power Co. | | | | |
| | 324,000 | | 3.150%, 01/15/2026 | | | 346,071 | |
| | | | | | | 1,518,963 | |
| | | | Multi-Utilities – 0.2% | | | | |
| | | | Consolidated Edison Co. of New York, Inc. | | | | |
| | 327,000 | | 3.350%, 04/01/2030 | | | 355,672 | |
| | | | TOTAL UTILITIES | | | 1,874,635 | |
| | | | TOTAL CORPORATE BONDS | | | | |
| | | | (Cost $39,630,094) | | | 39,204,892 | |
| | | | | | | | |
| | | | MORTGAGE BACKED SECURITIES – 33.7% | | | | |
| | | | COMM 2012-CCRE4 Mortgage Trust | | | | |
| | 268,361 | | 2.853%, 10/17/2045 | | | 272,479 | |
| | | | DBUBS 2017-BRBK Mortgage Trust | | | | |
| | 300,000 | | 3.452%, 10/12/20341 | | | 315,028 | |
| | | | EQUS 2021-EQAZ Mortgage Trust | | | | |
| | 600,000 | | 0.846% (1 Month LIBOR USD + 0.755%), 10/15/20361,4 | | | 597,433 | |
| | | | Fannie Mae Pool | | | | |
| | 18,357 | | 4.500%, 07/01/2026 | | | 19,256 | |
| | 60,684 | | 2.500%, 08/01/2028 | | | 63,148 | |
| | 46,125 | | 5.000%, 11/01/2029 | | | 51,229 | |
| | 186,209 | | 3.000%, 07/01/2030 | | | 196,243 | |
| | 310,633 | | 3.000%, 09/01/2030 | | | 328,390 | |
| | 13,842 | | 4.000%, 10/01/2030 | | | 14,921 | |
| | 106,747 | | 4.500%, 05/01/2031 | | | 116,463 | |
| | 98,883 | | 4.000%, 09/01/2031 | | | 107,347 | |
| | 42,058 | | 4.500%, 01/01/2032 | | | 45,857 | |
| | 28,086 | | 3.500%, 04/01/2032 | | | 30,423 | |
| | 556,784 | | 2.500%, 06/01/2032 | | | 579,819 | |
| | 249,810 | | 3.000%, 11/01/2032 | | | 264,969 | |
| | 185,871 | | 3.500%, 02/01/2033 | | | 198,275 | |
| | 1,246,855 | | 3.500%, 05/01/2033 | | | 1,347,904 | |
| | 367,890 | | 3.000%, 05/01/2033 | | | 390,521 | |
| | 157,863 | | 3.500%, 12/01/2033 | | | 167,444 | |
| | 108,597 | | 4.500%, 05/01/2034 | | | 119,216 | |
| | 127,468 | | 4.000%, 06/01/2034 | | | 139,626 | |
| | 179,248 | | 3.500%, 08/01/2034 | | | 190,655 | |
| | 148,378 | | 3.500%, 12/01/2034 | | | 159,348 | |
See accompanying Notes to Financial Statements.
North Square McKee Bond Fund
SCHEDULE OF INVESTMENTS – Continued
As of October 31, 2021
| Principal | | | | | |
| Amount | | | | Value | |
| | | MORTGAGE BACKED SECURITIES (Continued) | | | |
| | | Fannie Mae Pool (Continued) | | | |
$ | 297,402 | | 3.500%, 02/01/2035 | | $ | 317,619 | |
| | 197,158 | | 3.000%, 02/01/2035 | | | 208,209 | |
| | 66,765 | | 3.500%, 11/01/2035 | | | 71,591 | |
| | 142,447 | | 4.000%, 11/01/2035 | | | 154,877 | |
| | 271,704 | | 2.500%, 04/01/2037 | | | 279,553 | |
| | 91,417 | | 3.000%, 04/01/2037 | | | 96,711 | |
| | 157,171 | | 4.000%, 07/01/2037 | | | 170,167 | |
| | 142,586 | | 3.500%, 12/01/2037 | | | 153,772 | |
| | 147,533 | | 4.000%, 12/01/2037 | | | 160,315 | |
| | 102,629 | | 4.000%, 06/01/2038 | | | 112,550 | |
| | 5,690 | | 4.000%, 03/01/2039 | | | 6,289 | |
| | 50,578 | | 4.500%, 01/01/2040 | | | 56,181 | |
| | 59,021 | | 4.500%, 01/01/2040 | | | 65,995 | |
| | 774,594 | | 2.500%, 06/01/2040 | | | 796,340 | |
| | 14,433 | | 4.500%, 07/01/2040 | | | 16,086 | |
| | 392,501 | | 2.000%, 08/01/2040 | | | 394,771 | |
| | 4,638 | | 4.000%, 09/01/2040 | | | 5,119 | |
| | 106,681 | | 4.000%, 09/01/2040 | | | 116,834 | |
| | 24,187 | | 4.500%, 09/01/2040 | | | 26,956 | |
| | 450,287 | | 3.000%, 10/01/2040 | | | 470,572 | |
| | 299,877 | | 2.000%, 11/01/2040 | | | 304,692 | |
| | 14,697 | | 4.500%, 11/01/2040 | | | 16,158 | |
| | 39,014 | | 4.500%, 12/01/2040 | | | 43,634 | |
| | 7,465 | | 4.000%, 01/01/2041 | | | 8,254 | |
| | 70,438 | | 4.000%, 01/01/2041 | | | 77,638 | |
| | 191,724 | | 2.000%, 01/01/2041 | | | 195,453 | |
| | 37,475 | | 4.000%, 01/01/2041 | | | 41,436 | |
| | 417,980 | | 1.500%, 03/01/2041 | | | 411,727 | |
| | 99,554 | | 4.500%, 04/01/2041 | | | 110,985 | |
| | 25,178 | | 4.500%, 05/01/2041 | | | 28,039 | |
| | 537,523 | | 2.500%, 09/01/2041 | | | 557,728 | |
| | 553,530 | | 2.500%, 10/01/2041 | | | 577,069 | |
| | 11,773 | | 4.000%, 10/01/2041 | | | 12,788 | |
| | 24,711 | | 3.000%, 09/01/2042 | | | 26,364 | |
| | 168,878 | | 3.000%, 04/01/2043 | | | 180,499 | |
| | 145,724 | | 3.500%, 07/01/2043 | | | 157,440 | |
| | 53,897 | | 3.500%, 01/01/2044 | | | 58,238 | |
| | 44,776 | | 3.500%, 12/01/2045 | | | 48,035 | |
| | 226,992 | | 4.500%, 03/01/2046 | | | 252,724 | |
| | 142,770 | | 3.000%, 04/01/2046 | | | 150,562 | |
| | 194,276 | | 2.500%, 05/01/2046 | | | 200,269 | |
| | 136,460 | | 3.500%, 06/01/2046 | | | 145,942 | |
| | 170,941 | | 3.000%, 06/01/2046 | | | 182,188 | |
| | 86,070 | | 3.000%, 10/01/2046 | | | 90,977 | |
| | 7,901 | | 3.000%, 11/01/2046 | | | 8,329 | |
| | 226,081 | | 3.000%, 02/01/2047 | | | 238,875 | |
| | 330,605 | | 2.500%, 12/01/2047 | | | 340,802 | |
| | 68,876 | | 3.500%, 03/01/2048 | | | 73,152 | |
See accompanying Notes to Financial Statements.
North Square McKee Bond Fund
SCHEDULE OF INVESTMENTS – Continued
As of October 31, 2021
| Principal | | | | | |
| Amount | | | | Value | |
| | | MORTGAGE BACKED SECURITIES (Continued) | | | |
| | | Fannie Mae Pool (Continued) | | | |
$ | 140,804 | | 3.000%, 04/01/2048 | | $ | 148,051 | |
| | 246,409 | | 2.500%, 04/01/2048 | | | 254,441 | |
| | 455,639 | | 3.500%, 08/01/2048 | | | 490,545 | |
| | 15,092 | | 4.500%, 11/01/2048 | | | 16,307 | |
| | 139,052 | | 3.500%, 11/01/2048 | | | 147,025 | |
| | 169,583 | | 3.000%, 12/01/2048 | | | 178,820 | |
| | 57,695 | | 3.000%, 02/01/2049 | | | 60,593 | |
| | 27,632 | | 3.500%, 02/01/2049 | | | 29,213 | |
| | 753,346 | | 2.500%, 07/01/2049 | | | 777,874 | |
| | 795,331 | | 3.500%, 09/01/2049 | | | 826,330 | |
| | 132,049 | | 3.000%, 12/01/2049 | | | 138,730 | |
| | 509,938 | | 2.500%, 04/01/2050 | | | 521,137 | |
| | 366,302 | | 2.500%, 05/01/2050 | | | 374,304 | |
| | 488,548 | | 3.000%, 07/01/2050 | | | 512,261 | |
| | 178,553 | | 3.500%, 08/01/2050 | | | 194,966 | |
| | 586,866 | | 2.500%, 09/01/2050 | | | 609,052 | |
| | 152,577 | | 2.500%, 10/01/2050 | | | 158,418 | |
| | 386,146 | | 2.000%, 03/01/2051 | | | 389,807 | |
| | 1,601,596 | | 2.500%, 07/01/2051 | | | 1,651,461 | |
| | 909,020 | | 2.500%, 08/01/2051 | | | 936,039 | |
| | 2,097,932 | | 2.500%, 10/01/2051 | | | 2,156,829 | |
| | 555,000 | | 2.500%, 10/01/2051 | | | 570,832 | |
| | | | Fannie Mae REMICS | | | | |
| | 2,694 | | 7.000%, 11/25/2022 | | | 2,761 | |
| | 32,270 | | 5.500%, 01/25/2026 | | | 34,102 | |
| | 135,139 | | 4.000%, 04/25/2033 | | | 147,686 | |
| | 225,000 | | 4.000%, 09/25/2033 | | | 238,974 | |
| | 5,296 | | 5.000%, 08/25/2035 | | | 5,959 | |
| | 16,061 | | 4.500%, 02/25/2038 | | | 16,304 | |
| | 1,132 | | 3.000%, 01/25/2040 | | | 1,138 | |
| | 29,272 | | 3.000%, 07/25/2041 | | | 29,583 | |
| | 2,999 | | 2.000%, 07/25/2041 | | | 3,029 | |
| | 52,467 | | 2.000%, 12/25/2041 | | | 53,404 | |
| | 158,390 | | 3.500%, 02/25/2043 | | | 164,933 | |
| | 128,620 | | 2.000%, 02/25/2043 | | | 131,313 | |
| | 16,216 | | 3.500%, 08/25/2043 | | | 16,710 | |
| | 162,381 | | 2.000%, 10/25/2044 | | | 164,299 | |
| | 85,269 | | 2.000%, 10/25/2044 | | | 86,513 | |
| | 50,246 | | 3.000%, 04/25/2045 | | | 52,683 | |
| | 31,951 | | 3.500%, 08/25/2045 | | | 32,268 | |
| | 108,697 | | 2.500%, 01/25/2048 | | | 111,629 | |
| | 127,031 | | 3.500%, 09/25/2048 | | | 137,670 | |
| | 856,540 | | 2.000%, 04/25/2049 | | | 861,943 | |
| | 94,237 | | 3.000%, 07/25/2049 | | | 97,486 | |
| | 13,773 | | 3.500%, 06/25/2053 | | | 14,704 | |
| | | | Fannie Mae Trust 2003-W8 | | | | |
| | 17,661 | | 0.439% (1 Month LIBOR USD + 0.350%), 05/25/2042 | | | 17,797 | |
See accompanying Notes to Financial Statements.
North Square McKee Bond Fund
SCHEDULE OF INVESTMENTS – Continued
As of October 31, 2021
| Principal | | | | | |
| Amount | | | | Value | |
| | | MORTGAGE BACKED SECURITIES (Continued) | | | |
| | | Fannie Mae-Aces | | | |
$ | 114,042 | | 3.485%, 01/25/20245 | | $ | 119,564 | |
| | | | Freddie Mac Gold Pool | | | | |
| | 5,893 | | 6.000%, 01/01/2024 | | | 6,109 | |
| | 18,969 | | 4.500%, 12/01/2024 | | | 19,818 | |
| | 45,671 | | 4.500%, 10/01/2028 | | | 48,480 | |
| | 160,565 | | 3.000%, 10/01/2028 | | | 168,966 | |
| | 287,701 | | 3.000%, 07/01/2030 | | | 304,745 | |
| | 92,095 | | 4.500%, 05/01/2031 | | | 100,501 | |
| | 7,948 | | 4.000%, 09/01/2031 | | | 8,629 | |
| | 61,003 | | 3.500%, 05/01/2032 | | | 65,431 | |
| | 294,722 | | 3.500%, 08/01/2032 | | | 314,549 | |
| | 142,035 | | 3.000%, 11/01/2032 | | | 151,252 | |
| | 56,538 | | 3.500%, 06/01/2033 | | | 60,751 | |
| | 145,552 | | 4.000%, 11/01/2033 | | | 159,494 | |
| | 19,862 | | 3.500%, 07/01/2036 | | | 20,991 | |
| | 179,829 | | 3.500%, 08/01/2036 | | | 193,152 | |
| | 30,627 | | 4.500%, 12/01/2039 | | | 34,254 | |
| | 30,956 | | 4.000%, 01/01/2041 | | | 34,121 | |
| | 51,768 | | 3.000%, 11/01/2042 | | | 55,140 | |
| | 122,788 | | 3.500%, 12/01/2042 | | | 133,333 | |
| | 435,936 | | 3.000%, 12/01/2046 | | | 459,430 | |
| | 329,786 | | 3.000%, 12/01/2046 | | | 348,683 | |
| | 84,008 | | 3.000%, 01/01/2047 | | | 89,205 | |
| | | | Freddie Mac Multifamily Structured Pass Through Certificates | | | | |
| | 40,316 | | 0.420% (1 Month LIBOR USD + 0.340%), 07/25/2024 | | | 40,392 | |
| | 19,360 | | 2.775%, 01/25/20465 | | | 19,360 | |
| | | | Freddie Mac Pool | | | | |
| | 201,128 | | 3.000%, 09/01/2029 | | | 212,415 | |
| | 299,234 | | 3.500%, 07/01/2030 | | | 320,358 | |
| | 32,941 | | 2.000%, 12/01/2030 | | | 33,839 | |
| | 141,586 | | 2.500%, 11/01/2031 | | | 147,571 | |
| | 416,753 | | 3.000%, 02/01/2032 | | | 437,796 | |
| | 63,277 | | 3.000%, 10/01/2032 | | | 67,482 | |
| | 365,053 | | 3.000%, 12/01/2032 | | | 384,655 | |
| | 109,561 | | 3.500%, 11/01/2034 | | | 117,149 | |
| | 404,586 | | 3.000%, 07/01/2038 | | | 430,943 | |
| | 541,435 | | 2.500%, 10/01/2046 | | | 559,335 | |
| | 48,492 | | 3.500%, 01/01/2048 | | | 51,535 | |
| | 311,096 | | 2.500%, 11/01/2050 | | | 319,951 | |
| | 372,763 | | 2.000%, 02/01/2051 | | | 373,091 | |
| | 565,142 | | 2.500%, 03/01/2051 | | | 584,389 | |
| | | | Freddie Mac REMICS | | | | |
| | 32,261 | | 4.500%, 09/15/2025 | | | 34,025 | |
| | 177,871 | | 3.500%, 08/15/2027 | | | 185,198 | |
| | 29,803 | | 3.000%, 11/15/2032 | | | 30,908 | |
| | 46,871 | | 3.000%, 11/15/2032 | | | 47,193 | |
| | 15,987 | | 3.000%, 09/15/2037 | | | 16,158 | |
| | 262,504 | | 3.000%, 08/15/2040 | | | 269,927 | |
See accompanying Notes to Financial Statements.
North Square McKee Bond Fund
SCHEDULE OF INVESTMENTS – Continued
As of October 31, 2021
| Principal | | | | | |
| Amount | | | | Value | |
| | | MORTGAGE BACKED SECURITIES (Continued) | | | |
| | | Freddie Mac REMICS (Continued) | | | |
$ | 59 | | 2.750%, 04/15/2041 | | $ | 59 | |
| | 208,928 | | 2.000%, 09/15/2041 | | | 212,656 | |
| | 22,892 | | 2.000%, 12/15/2041 | | | 23,251 | |
| | 578,564 | | 2.000%, 11/15/2042 | | | 589,438 | |
| | 113,135 | | 3.000%, 05/15/2043 | | | 116,208 | |
| | 53,847 | | 3.000%, 11/15/2043 | | | 55,872 | |
| | 130,545 | | 2.000%, 03/25/2044 | | | 132,680 | |
| | 295,877 | | 3.000%, 08/15/2044 | | | 305,042 | |
| | 34,767 | | 4.000%, 07/15/2045 | | | 35,101 | |
| | 186,236 | | 1.000%, 04/25/2049 | | | 184,813 | |
| | 69,132 | | 1.000%, 01/25/2050 | | | 66,492 | |
| | 294,748 | | 3.250%, 04/15/2053 | | | 308,144 | |
| | 72,088 | | 3.000%, 01/15/2055 | | | 74,627 | |
| | | | Freddie Mac STACR REMIC Trust 2021-DNA3 | | | | |
| | 120,000 | | 0.799% (SOFR30A + 0.750%), 10/25/20331 | | | 120,119 | |
| | | | Freddie Mac Structured Agency Credit Risk Debt Notes | | | | |
| | 107,144 | | 0.849% (SOFR30A + 0.800%), 08/25/20331 | | | 107,242 | |
| | | | Freddie Mac Structured Pass-Through Certificates | | | | |
| | 138,930 | | 1.487% (12 Month US Treasury Average + 1.400%), 07/25/2044 | | | 143,187 | |
| | 20,940 | | 1.287% (12 Month US Treasury Average + 1.200%), 10/25/2044 | | | 21,491 | |
| | | | GNMA REMIC TRUST 2021-154 | | | | |
| | 1,992,991 | | 1.750%, 09/20/2051 | | | 1,998,179 | |
| | | | Government National Mortgage Association | | | | |
| | 735 | | 5.000%, 12/20/2027 | | | 769 | |
| | 71,889 | | 5.500%, 09/20/2033 | | | 78,674 | |
| | 2,792 | | 3.000%, 10/20/2039 | | | 2,801 | |
| | 171,529 | | 2.750%, 06/20/2042 | | | 176,743 | |
| | 209,000 | | 3.000%, 01/20/2043 | | | 225,643 | |
| | 163,231 | | 2.200%, 11/16/2043 | | | 165,286 | |
| | 17,734 | | 2.250%, 09/16/2044 | | | 17,940 | |
| | 46,665 | | 2.000%, 03/20/2045 | | | 47,362 | |
| | 26,029 | | 2.500%, 10/20/2045 | | | 26,449 | |
| | 35,002 | | 2.500%, 09/20/2046 | | | 35,814 | |
| | 623,406 | | 2.000%, 03/20/2050 | | | 631,262 | |
| | 206,330 | | 1.000%, 08/20/2050 | | | 203,804 | |
| | 248,861 | | 1.250%, 05/20/2051 | | | 245,117 | |
| | 59,095 | | 2.700%, 12/16/20545 | | | 59,791 | |
| | | | GS Mortgage Securities Corp Trust 2021-RENT | | | | |
| | 300,000 | | 0.786% (1 Month LIBOR USD + 0.700%), 11/21/20351 | | | 300,173 | |
| | | | GS Mortgage Securities Corp Trust 2021-ROSS | | | | |
| | 310,000 | | 1.241% (1 Month LIBOR USD + 1.150%), 06/16/20361 | | | 310,837 | |
| | | | Industrial Logistics Properties Trust | | | | |
| | 145,000 | | 4.145%, 02/13/20411 | | | 162,433 | |
| | | | JP Morgan Chase Commercial Mortgage Securities Trust 2016-JP2 | | | | |
| | 124,000 | | 2.822%, 08/17/2049 | | | 130,154 | |
| | | | Morgan Stanley Capital I Trust 2015-UBS8 | | | | |
| | 168,000 | | 3.809%, 12/17/2048 | | | 181,219 | |
| | | | Morgan Stanley Capital I Trust 2016-UBS12 | | | | |
| | 413,000 | | 3.596%, 12/17/2049 | | | 448,664 | |
See accompanying Notes to Financial Statements.
North Square McKee Bond Fund
SCHEDULE OF INVESTMENTS – Continued
As of October 31, 2021
| Principal | | | | | |
| Amount | | | | Value | |
| | | MORTGAGE BACKED SECURITIES (Continued) | | | |
| | | Morgan Stanley Capital I Trust 2016-UBS9 | | | |
$ | 337,000 | | 3.594%, 03/17/2049 | | $ | 361,505 | |
| | | | RLGH Trust 2021-TROT | | | | |
| | 430,000 | | 0.891% (1 Month LIBOR USD + 0.800%), 04/15/20361 | | | 430,692 | |
| | | | Seasoned Credit Risk Transfer Trust | | | | |
| | 102,829 | | 2.000%, 11/25/2060 | | | 103,946 | |
| | | | UBS Commercial Mortgage Trust | | | | |
| | 334,000 | | 2.921%, 10/18/2052 | | | 351,640 | |
| | | | UBS-Barclays Commercial Mortgage Trust 2012-C4 | | | | |
| | 26,217 | | 2.533%, 12/12/2045 | | | 26,373 | |
| | | | UBS-Barclays Commercial Mortgage Trust 2013-C5 | | | | |
| | 187,125 | | 2.687%, 03/12/2046 | | | 189,629 | |
| | | | UBS-Barclays Commercial Mortgage Trust 2013-C6 | | | | |
| | 656,000 | | 3.244%, 04/12/2046 | | | 673,190 | |
| | | | VNDO 2012-6AVE Mortgage Trust | | | | |
| | 300,000 | | 2.996%, 11/15/20301 | | | 305,757 | |
| | | | Wells Fargo Commercial Mortgage Trust 2016-C35 | | | | |
| | 160,000 | | 2.931%, 07/17/2048 | | | 167,934 | |
| | | | Wells Fargo Commercial Mortgage Trust 2016-NXS6 | | | | |
| | 437,000 | | 2.918%, 11/18/2049 | | | 460,662 | |
| | | | Wells Fargo Commercial Mortgage Trust 2017-RB1 | | | | |
| | 351,000 | | 3.635%, 03/15/2050 | | | 383,565 | |
| | | | Wells Fargo Commercial Mortgage Trust 2021-SAVE | | | | |
| | 222,710 | | 1.240% (1 Month LIBOR USD + 1.150%), 02/15/20401 | | | 223,506 | |
| | | | WFRBS Commercial Mortgage Trust 2013-C12 | | | | |
| | 214,639 | | 3.198%, 03/17/2048 | | | 220,064 | |
| | | | TOTAL MORTGAGE BACKED SECURITIES | | | | |
| | | | (Cost $47,076,371) | | | 46,926,688 | |
| | | | | | | | |
| | | | U.S. GOVERNMENT AGENCY ISSUE – 4.6% | | | | |
| | | | Federal Home Loan Banks | | | | |
| | 2,020,000 | | 1.000%, 11/08/2024 | | | 2,019,934 | |
| | 500,000 | | 1.100%, 11/15/2024 | | | 500,003 | |
| | 1,135,000 | | 1.050%, 11/15/2024 | | | 1,134,830 | |
| | 550,875 | | 1.000%, 03/23/2026 | | | 547,870 | |
| | 100,000 | | 0.500%, 08/26/2027 | | | 99,283 | |
| | | | Ginnie Mae I Pool | | | | |
| | 1,680 | | 4.500%, 04/15/2023 | | | 1,753 | |
| | 99,068 | | 4.000%, 11/15/2024 | | | 104,602 | |
| | 319,154 | | 3.020%, 09/15/2041 | | | 337,152 | |
| | 402,845 | | 3.000%, 08/15/2045 | | | 425,024 | |
| | | | Ginnie Mae II Pool | | | | |
| | 140,283 | | 3.500%, 04/20/2027 | | | 149,133 | |
| | 48,995 | | 3.500%, 07/20/2027 | | | 52,091 | |
| | 911,178 | | 3.500%, 12/20/2034 | | | 971,810 | |
| | 98,417 | | 5.000%, 07/20/2048 | | | 106,797 | |
| | | | TOTAL U.S. GOVERNMENT AGENCY ISSUE | | | | |
| | | | (Cost $6,431,022) | | | 6,450,282 | |
See accompanying Notes to Financial Statements.
North Square McKee Bond Fund
SCHEDULE OF INVESTMENTS – Continued
As of October 31, 2021
| Principal | | | | | |
| Amount | | | | Value | |
| | | U.S. GOVERNMENT NOTES/BONDS – 20.5% | | | |
| | | United States Treasury Inflation Indexed Bonds | | | |
$ | 923,883 | | 0.625%, 01/15/2024 | | $ | 989,255 | |
| | 971,047 | | 0.750%, 07/15/2028 | | | 1,117,266 | |
| | | | United States Treasury Note/Bond | | | | |
| | 1,828,000 | | 0.375%, 09/15/2024 | | | 1,809,649 | |
| | 2,968,000 | | 0.250%, 10/31/2025 | | | 2,876,061 | |
| | 1,618,000 | | 0.750%, 08/31/2026 | | | 1,585,703 | |
| | 1,934,000 | | 0.875%, 09/30/2026 | | | 1,905,972 | |
| | 5,242,000 | | 0.500%, 08/31/2027 | | | 4,998,636 | |
| | 6,929,000 | | 1.125%, 08/31/2028 | | | 6,779,593 | |
| | 647,000 | | 2.375%, 05/15/2029 | | | 688,537 | |
| | 1,482,000 | | 0.625%, 08/15/2030 | | | 1,373,716 | |
| | 4,531,000 | | 1.250%, 08/15/2031 | | | 4,403,566 | |
| | | | TOTAL U.S. GOVERNMENT NOTES/BONDS | | | | |
| | | | (Cost $28,922,644) | | | 28,527,954 | |
| | | | | | | | |
| | | | FOREIGN GOVERNMENT AGENCY ISSUE – 0.2% | | | | |
| | | | Province of Ontario Canada | | | | |
| | 235,000 | | 1.050%, 04/14/20262 | | | 233,535 | |
| | | | TOTAL FOREIGN GOVERNMENT AGENCY ISSUE | | | | |
| | | | (Cost $236,167) | | | 233,535 | |
| | | | | | | | |
| | | | FOREIGN GOVERNMENT BOND – 0.3% | | | | |
| | | | Mexico Government International Bond | | | | |
| | 422,000 | | 3.250%, 04/16/20302 | | | 432,111 | |
| | | | TOTAL FOREIGN GOVERNMENT BOND | | | | |
| | | | (Cost $435,505) | | | 432,111 | |
| | | | | | | | |
| | | | CERTIFICATES OF DEPOSIT – 3.9% | | | | |
| | | | BMW Bank of North America | | | | |
| | 750,000 | | 0.650%, 9/10/2024 | | | 748,952 | |
| | 29,000 | | 1.450%, 4/14/2023 | | | 29,484 | |
| | | | Capital One NA | | | | |
| | 240,000 | | 2.650%, 5/30/2024 | | | 252,466 | |
| | | | Goldman Sachs Bank USA/New York NY | | | | |
| | 865,000 | | 1.000%, 2/11/2026 | | | 867,231 | |
| | 245,000 | | 0.650%, 9/9/2024 | | | 244,663 | |
| | 105,000 | | 0.650%, 9/16/2024 | | | 104,839 | |
| | | | HSBC Bank USA NA | | | | |
| | 225,000 | | 0.125%, 11/15/20223 | | | 223,989 | |
| | 55,000 | | 1.300%, 5/7/2025 | | | 55,358 | |
| | | | JPMorgan Chase Bank NA | | | | |
| | 72,000 | | 0.232%, 12/4/2023 | | | 71,020 | |
| | 105,000 | | 0.120%, 12/17/20255 | | | 102,090 | |
| | 100,000 | | 0.121%, 11/29/20243 | | | 98,605 | |
| | 298,000 | | 3.500%, 11/15/20293 | | | 297,769 | |
| | | | Morgan Stanley Private Bank NA | | | | |
| | 78,000 | | 3.550%, 11/24/2023 | | | 82,920 | |
See accompanying Notes to Financial Statements.
North Square McKee Bond Fund
SCHEDULE OF INVESTMENTS – Continued
As of October 31, 2021
| Principal | | | | | |
| Amount | | | | Value | |
| | | CERTIFICATES OF DEPOSIT (Continued) | | | |
| | | Sallie Mae Bank | | | |
$ | 679,000 | | 0.550%, 7/15/2024 | | $ | 677,034 | |
| | 243,000 | | 0.400%, 8/11/2023 | | | 242,987 | |
| | | | Toyota Financial Savings Bank | | | | |
| | 682,000 | | 0.600%, 8/12/2024 | | | 680,527 | |
| | | | UBS Bank USA, | | | | |
| | 268,000 | | 0.650%, 9/9/2024 | | | 267,631 | |
| | | | Wells Fargo Bank NA | | | | |
| | 376,000 | | 3.500%, 11/9/2023 | | | 399,364 | |
| | | | TOTAL CERTIFICATES OF DEPOSIT | | | | |
| | | | (Cost $5,446,409) | | | 5,446,929 | |
| | | | | | | | |
| | | | SHORT-TERM INVESTMENT – 2.3% | | | | |
| | 3,171,809 | | First American Treasury Obligations Fund – Class X, 0.01%6 | | | 3,171,809 | |
| | | | TOTAL SHORT-TERM INVESTMENT | | | | |
| | | | (Cost $3,171,809) | | | 3,171,809 | |
| | | | TOTAL INVESTMENTS – 101.7% | | | | |
| | | | (Cost $142,704,242) | | | 141,708,452 | |
| | | | Liabilities in Excess of Other Assets – (1.7)% | | | (2,417,041 | ) |
| | | | TOTAL NET ASSETS – 100.0% | | $ | 139,291,411 | |
PLC – Public Limited Company
LIBOR – London Inter-bank Offered Rate
SOFR – Secured Overnight Financing Rate
1 | Security as defined in Rule 144A under the Securities Act of 1933 and classified as liquid under the Fund’s liquidity risk management program. Purchased in a private placement transaction; resale to the public may require registration or may extend only to qualified institutional buyers. At October 31, 2021, the value of these securities total $10,036,142, which represents 7.21% of total net assets. |
2 | Foreign security denominated in U.S. Dollars. |
3 | Variable rate security based on a reference index and spread. The rate reported is the rate in effect as of October 31, 2021. |
4 | Level 3 securities fair valued under procedures established by the Board of Trustees, represents 0.43% of Net Assets. The total value of these securities is $597,433. |
5 | Variable rate security. The coupon is based on an underlying pool of loans. The rate reported is the rate in effect as of October 31, 2021. |
6 | The rate is the annualized seven-day yield at period end. |
Investments are classified by industry pursuant to the Global Industry Classification Standard (GICS®), which was developed by and/or is the exclusive property of Morgan Stanley Capital International, Inc. (“MSCI”) and Standard & Poor’s Financial Services LLC (“S&P”). GICS is a service mark of MSCI and S&P and has been licensed for use by U.S. Bancorp Fund Services, LLC.
See accompanying Notes to Financial Statements.
North Square McKee Bond Fund
SUMMARY OF INVESTMENTS
As of October 31, 2021
| | | Percent of Total |
Security Type/Sector | | Net Assets |
Asset Backed Securities | | | 8.1 | % |
Corporate Bonds | | | | |
Financials | | | 11.2 | % |
Energy | | | 3.1 | % |
Information Technology | | | 2.9 | % |
Consumer Discretionary | | | 2.6 | % |
Communication Services | | | 2.3 | % |
Health Care | | | 1.4 | % |
Industrials | | | 1.3 | % |
Utilities | | | 1.3 | % |
Consumer Staples | | | 1.2 | % |
Materials | | | 0.4 | % |
Real Estate | | | 0.4 | % |
| Total Corporate Bonds | | | 28.1 | % |
Mortgage Backed Securities | | | 33.7 | % |
U.S. Government Agency Issue | | | 4.6 | % |
U.S. Government Notes/Bonds | | | 20.5 | % |
Foreign Government Agency Issue | | | 0.2 | % |
Foreign Government Bond | | | 0.3 | % |
Certificates of Deposit | | | 3.9 | % |
Short-Term Investment | | | 2.3 | % |
| Total Investments | | | 101.7 | % |
Liabilities in Excess of Other Assets | | | (1.7 | )% |
| Total Net Assets | | | 100.0 | % |
See accompanying Notes to Financial Statements.
North Square Strategic Income Fund
SCHEDULE OF INVESTMENTS
As of October 31, 202
| Number | | | | | |
| of Shares | | | | Value | |
| | | COMMON STOCKS – 9.7% | | | |
| | | | | | |
| | | CONSUMER DISCRETIONARY – 0.5% | | | |
| | | Hotels, Restaurants & Leisure – 0.5% | | | |
| | 4,019 | | Starbucks Corp. | | $ | 426,295 | |
| | | | TOTAL CONSUMER DISCRETIONARY | | | 426,295 | |
| | | | | | | | |
| | | | CONSUMER STAPLES – 1.2% | | | | |
| | | | Beverages – 0.8% | | | | |
| | 10,453 | | The Coca-Cola Co. | | | 589,236 | |
| | | | Food & Staples Retailing – 0.4% | | | | |
| | 4,370 | | Sysco Corp. | | | 336,053 | |
| | | | TOTAL CONSUMER STAPLES | | | 925,289 | |
| | | | | | | | |
| | | | ENERGY – 1.3% | | | | |
| | | | Oil, Gas & Consumable Fuels – 1.3% | | | | |
| | 7,276 | | Chevron Corp. | | | 833,029 | |
| | 3,039 | | Valero Energy Corp. | | | 235,006 | |
| | | | TOTAL ENERGY | | | 1,068,035 | |
| | | | | | | | |
| | | | FINANCIALS – 0.5% | | | | |
| | | | Capital Markets – 0.5% | | | | |
| | 434 | | BlackRock, Inc. | | | 409,462 | |
| | | | TOTAL FINANCIALS | | | 409,462 | |
| | | | | | | | |
| | | | HEALTH CARE – 1.3% | | | | |
| | | | Biotechnology – 0.5% | | | | |
| | 3,273 | | AbbVie Inc. | | | 375,315 | |
| | | | Health Care Equipment & Supplies – 0.4% | | | | |
| | 3,565 | | Baxter International Inc. | | | 281,492 | |
| | | | Pharmaceuticals – 0.4% | | | | |
| | 7,652 | | Pfizer Inc. | | | 334,699 | |
| | | | TOTAL HEALTH CARE | | | 991,506 | |
| | | | | | | | |
| | | | INDUSTRIALS – 2.6% | | | | |
| | | | Building Products – 0.6% | | | | |
| | 6,941 | | Johnson Controls International plc1 | | | 509,261 | |
| | | | Commercial Services & Supplies – 0.5% | | | | |
| | 2,213 | | Waste Management, Inc. | | | 354,589 | |
| | | | Electrical Equipment – 1.0% | | | | |
| | 2,625 | | Eaton Corp. PLC1 | | | 432,495 | |
| | 1,125 | | Rockwell Automation, Inc. | | | 359,325 | |
| | | | | | | 791,820 | |
| | | | Machinery – 0.5% | | | | |
| | 1,777 | | Illinois Tool Works Inc. | | | 404,925 | |
| | | | TOTAL INDUSTRIALS | | | 2,060,595 | |
See accompanying Notes to Financial Statements.
North Square Strategic Income Fund
SCHEDULE OF INVESTMENTS – Continued
As of October 31, 2021
| Number | | | | | |
| of Shares | | | | Value | |
| | | COMMON STOCKS (Continued) | | | |
| | | | | | |
| | | INFORMATION TECHNOLOGY – 1.8% | | | |
| | | Communications Equipment – 0.3% | | | |
| | 937 | | Motorola Solutions, Inc. | | $ | 232,929 | |
| | | | IT Services – 0.8% | | | | |
| | 5,195 | | Paychex, Inc. | | | 640,440 | |
| | | | Semiconductors & Semiconductor Equipment – 0.7% | | | | |
| | 1,078 | | Broadcom Inc. | | | 573,140 | |
| | | | TOTAL INFORMATION TECHNOLOGY | | | 1,446,509 | |
| | | | | | | | |
| | | | MATERIALS – 0.5% | | | | |
| | | | Metals & Mining – 0.5% | | | | |
| | 10,606 | | Barrick Gold Corp.1 | | | 194,832 | |
| | 3,499 | | Newmont Corp. | | | 188,946 | |
| | | | TOTAL MATERIALS | | | 383,778 | |
| | | | TOTAL COMMON STOCKS | | | | |
| | | | (Cost $7,198,866) | | | 7,711,469 | |
| | | | | | | | |
| | | | PREFERRED STOCKS – 5.6% | | | | |
| | | | COMMUNICATION SERVICES – 1.0% | | | | |
| | | | Diversified Telecommunication Services – 1.0% | | | | |
| | | | AT&T Inc. | | | | |
| | 29,100 | | 4.750%, Perpetual | | | 757,764 | |
| | | | TOTAL COMMUNICATION SERVICES | | | 757,764 | |
| | | | | | | | |
| | | | CONSUMER STAPLES – 0.1% | | | | |
| | | | Food Products – 0.1% | | | | |
| | | | CHS Inc. | | | | |
| | 2,000 | | 7.500%, Perpetual | | | 57,980 | |
| | 1,000 | | 7.100% (3 Month LIBOR USD + 4.298%), Perpetual2 | | | 27,860 | |
| | | | TOTAL CONSUMER STAPLES | | | 85,840 | |
| | | | | | | | |
| | | | FINANCIALS – 4.5% | | | | |
| | | | Capital Markets – 2.1% | | | | |
| | | | AMG | | | | |
| | 2,000 | | 5.875%, Perpetual | | | 55,120 | |
| | | | The Goldman Sachs Group, Inc. | | | | |
| | 37,900 | | 0.000% (3 Month LIBOR USD + 0.670%), Perpetual | | | 956,975 | |
| | | | Morgan Stanley | | | | |
| | 25,000 | | 4.875%, Perpetual | | | 672,500 | |
| | | | | | | 1,684,595 | |
| | | | Insurance – 2.4% | | | | |
| | | | American Financial Group, Inc. | | | | |
| | 22,795 | | 5.625%, Perpetual | | | 659,003 | |
| | | | American International Group, Inc. | | | | |
| | 23,000 | | 5.850%, Perpetual | | | 626,520 | |
See accompanying Notes to Financial Statements.
North Square Strategic Income Fund
SCHEDULE OF INVESTMENTS – Continued
As of October 31, 2021
| Number | | | | | |
| of Shares | | | | Value | |
| | | PREFERRED STOCKS (Continued) | | | |
| | | | | | |
| | | FINANCIALS (Continued) | | | |
| | | Insurance (Continued) | | | |
| | | MetLife, Inc. | | | |
| | 23,000 | | 4.750%, Perpetual | | $ | 617,320 | |
| | | | | | | 1,902,843 | |
| | | | TOTAL FINANCIALS | | | 3,587,438 | |
| | | | TOTAL PREFERRED STOCKS | | | | |
| | | | (Cost $3,711,532) | | | 4,431,042 | |
| | | | | | | | |
| | | | PURCHASED OPTION – 1.1% | | | | |
| | 300 | | S&P500 EMINI FUT Dec21, Expiration Date: December 2021, Exercise Price $4,660.00 | | | 843,750 | |
| | | | TOTAL PURCHASED OPTION | | | | |
| | | | (Cost $624,196) | | | 843,750 | |
| | | | | | | | |
| | | | REAL ESTATE INVESTMENT TRUSTS (REITS) – 6.0% | | | | |
| | 31,035 | | AGNC Investment Corp. | | | 494,077 | |
| | 49,727 | | Chimera Investment Corp. | | | 776,239 | |
| | 2,270 | | Crown Castle International Corp. | | | 409,281 | |
| | 5,115 | | Life Storage, Inc. | | | 684,438 | |
| | 33,957 | | New Residential Investment Corp. | | | 385,752 | |
| | 5,322 | | Prologis, Inc. | | | 771,477 | |
| | 3,125 | | Simon Property Group, Inc. | | | 458,062 | |
| | 29,983 | | Starwood Property Trust, Inc. | | | 763,667 | |
| | | | TOTAL REITS | | | | |
| | | | (Cost $3,360,588) | | | 4,742,993 | |
| | | | | | | | |
Principal | | | | | | |
Amount | | | | | | |
| | | | ASSET BACKED SECURITIES – 2.3% | | | | |
| | | | Aligned Data Centers Issuer LLC | | | | |
$
| 600,000 | | 1.937%, 08/15/20463 | | | 597,790 | |
| | | | Citigroup Mortgage Loan Trust 2006-HE1 | | | | |
| | 69,908 | | 0.449% (1 Month LIBOR USD + 0.540%), 01/25/2036 | | | 69,954 | |
| | | | Foundation Finance Trust 2017-1 | | | | |
| | 222,314 | | 3.300%, 07/15/20333 | | | 224,763 | |
| | | | OASIS 2020-2 LLC | | | | |
| | 236,951 | | 4.262%, 05/15/20323 | | | 238,472 | |
| | | | Park Place Securities Inc Asset-Backed Pass-Through Ctfs Ser 2005-WHQ2 | | | | |
| | 55,518 | | 0.549% (1 Month LIBOR USD + 0.690%), 05/25/2035 | | | 55,604 | |
| | | | Vantage Data Centers LLC | | | | |
| | 655,000 | | 2.165%, 10/15/20463,4 | | | 655,358 | |
| | | | TOTAL ASSET BACKED SECURITIES | | | | |
| | | | (Cost $1,840,486) | | | 1,841,941 | |
See accompanying Notes to Financial Statements.
North Square Strategic Income Fund
SCHEDULE OF INVESTMENTS – Continued
As of October 31, 2021
| Principal | | | | | |
| Amount | | �� | | Value | |
| | | CORPORATE BONDS – 60.7% | | | |
| | | | | | |
| | | COMMUNICATION SERVICES – 3.1% | | | |
| | | Diversified Telecommunication Services – 1.6% | | | |
| | | T-Mobile USA, Inc. | | | |
$ | 1,200,000 | | 3.500%, 04/15/20313 | | $ | 1,243,506 | |
| | | | Entertainment – 0.7% | | | | |
| | | | Netflix Inc. | | | | |
| | 500,000 | | 4.875%, 06/15/20303 | | | 588,135 | |
| | | | Wireless Telecommunication Services – 0.8% | | | | |
| | | | Vodafone Group PLC | | | | |
| | 515,000 | | 7.000% (5 Year Swap Rate USD + 4.873%), 04/04/20791,5 | | | 623,104 | |
| | | | TOTAL COMMUNICATION SERVICES | | | 2,454,745 | |
| | | | | | | | |
| | | | CONSUMER DISCRETIONARY – 4.2% | | | | |
| | | | Automobiles – 2.6% | | | | |
| | | | Ford Motor Co. | | | | |
| | 500,000 | | 9.625%, 04/22/2030 | | | 720,940 | |
| | | | Ford Motor Credit Co. LLC | | | | |
| | 500,000 | | 3.625%, 06/17/2031 | | | 506,250 | |
| | | | General Motors Financial Co., Inc. | | | | |
| | 750,000 | | 5.700% (5 Year CMT Rate + 4.997%), 09/30/21695 | | | 867,187 | |
| | | | | | | 2,094,377 | |
| | | | Leisure Products – 1.6% | | | | |
| | | | Mattel, Inc. | | | | |
| | 1,250,000 | | 3.750%, 04/01/20293 | | | 1,300,063 | |
| | | | TOTAL CONSUMER DISCRETIONARY | | | 3,394,440 | |
| | | | | | | | |
| | | | CONSUMER STAPLES – 1.7% | | | | |
| | | | Food Products – 1.7% | | | | |
| | | | Kraft Heinz Food Co. | | | | |
| | 1,200,000 | | 4.250%, 03/01/2031 | | | 1,356,112 | |
| | | | TOTAL CONSUMER STAPLES | | | 1,356,112 | |
| | | | | | | | |
| | | | ENERGY – 5.8% | | | | |
| | | | Oil, Gas & Consumable Fuels – 5.8% | | | | |
| | | | Cheniere Energy, Inc. | | | | |
| | 360,000 | | 4.625%, 10/15/2028 | | | 377,982 | |
| | | | Enbridge Inc. | | | | |
| | 800,000 | | 5.750% (5 Year CMT Rate + 5.314%), 07/15/20801,5 | | | 901,200 | |
| | | | Energy Transfer LP | | | | |
| | 900,000 | | 6.625% (3 Month LIBOR USD + 4.155%), 08/15/20285 | | | 875,250 | |
| | | | Occidental Petroleum Corp. | | | | |
| | 600,000 | | 6.125%, 01/01/2031 | | | 719,250 | |
| | | | Targa Resources Partners LP / Targa Resources Partners Finance Corp. | | | | |
| | 500,000 | | 4.000%, 01/15/20323 | | | 516,610 | |
| | | | Transcanada Trust | | | | |
| | 700,000 | | 5.500% (SOFR + 4.416%), 09/15/20791,5 | | | 765,625 | |
| | | | Western Midstream Operating, LP | | | | |
| | 400,000 | | 5.300%, 02/01/2030 | | | 439,000 | |
| | | | TOTAL ENERGY | | | 4,594,917 | |
See accompanying Notes to Financial Statements.
North Square Strategic Income Fund
SCHEDULE OF INVESTMENTS – Continued
As of October 31, 2021
| Principal | | | | | |
| Amount | | | | Value | |
| | | CORPORATE BONDS (Continued) | | | |
| | | | | | |
| | | FINANCIALS – 28.8% | | | |
| | | Banks – 20.6% | | | |
| | | Australia and New Zealand Banking Group Ltd. | | | |
$ | 750,000 | | 6.750% (5 Year Mid Swap Rate USD + 5.168%), 12/29/20491,3,5 | | $ | 863,209 | |
| | | | Banco Bilbao Vizcaya Argentaria, S.A. | | | | |
| | 600,000 | | 6.500% (5 Year CMT Rate + 5.192%), 06/05/20251,5 | | | 645,000 | |
| | | | Banco Santander S.A. | | | | |
| | 600,000 | | 4.750% (5 Year CMT Rate + 3.753%), 08/12/21691,5 | | | 604,602 | |
| | | | Bank of America Corp. | | | | |
| | 550,000 | | 6.500% (3 Month LIBOR USD + 4.174%), 04/23/20255 | | | 609,125 | |
| | | | Barclays PLC | | | | |
| | 700,000 | | 4.375% (5 Year CMT Rate + 3.410%), 12/15/21541,5 | | | 690,410 | |
| | | | BNP Paribas SA | | | | |
| | 700,000 | | 7.375% (5 Year Swap Rate USD + 5.150%), 12/29/20491,3,5 | | | 803,736 | |
| | | | Citigroup Inc. | | | | |
| | 1,000,000 | | 4.000% (5 Year CMT Rate + 3.597%), 06/10/21695 | | | 1,023,750 | |
| | | | Credit Agricole S.A. | | | | |
| | 650,000 | | 7.875% (5 Year Swap Rate USD + 4.898%), 01/29/20491,3,5 | | | 720,346 | |
| | | | Fifth Third Bancorp | | | | |
| | 1,000,000 | | 4.500% (5 Year CMT Rate + 4.215%), 12/30/20255 | | | 1,078,750 | |
| | | | Huntington Bancshares Inc. | | | | |
| | 700,000 | | 4.450% (H15T7Y + 4.045%), 03/15/21685 | | | 749,875 | |
| | 500,000 | | 5.625% (10 Year CMT Rate + 4.945%), 01/15/21695 | | | 581,875 | |
| | | | ILFC E-Capital Trust I | | | | |
| | 840,000 | | 3.460% (N/A + 1.550%), 12/21/20653,5 | | | 689,518 | |
| | | | JPMorgan Chase & Co. | | | | |
| | 800,000 | | 6.750% (3 Month LIBOR USD + 3.780%), 01/29/20505 | | | 874,932 | |
| | | | Lloyds Banking Group plc | | | | |
| | 700,000 | | 6.750% (5 Year CMT Rate + 4.815%), 12/27/21661,5 | | | 800,510 | |
| | | | M&T Bank Corp. | | | | |
| | 325,000 | | 6.450% (3 Month LIBOR USD + 3.610%), 12/29/20495 | | | 351,609 | |
| | | | NatWest Group plc | | | | |
| | 700,000 | | 6.000% (5 Year CMT Rate + 5.625%), 09/29/21661,5 | | | 775,551 | |
| | | | Regions Financial Corp. | | | | |
| | 500,000 | | 5.750% (5 Year CMT Rate + 5.430%), 12/15/21655 | | | 553,125 | |
| | | | Skandinaviska Enskilda Banken AB | | | | |
| | 800,000 | | 5.125% (5 Year CMT Rate + 3.463%), 11/13/20251,5 | | | 849,486 | |
| | | | Societe Generale SA | | | | |
| | 700,000 | | 4.750% (5 Year CMT Rate + 3.931%), 11/26/21661,3,5 | | | 718,795 | |
| | | | SVB Financial Group | | | | |
| | 500,000 | | 4.000% (5 Year CMT Rate + 3.202%), 11/15/21695 | | | 501,875 | |
| | | | Truist Financial Corp. | | | | |
| | 1,000,000 | | 5.100% (10 Year CMT Rate + 4.349%), 03/01/20615 | | | 1,121,300 | |
| | | | Westpac Banking Corp. | | | | |
| | 750,000 | | 5.000% (5 Year Mid Swap Rate USD + 2.888%), 09/21/21621,5 | | | 787,341 | |
| | | | | | | 16,394,720 | |
See accompanying Notes to Financial Statements.
North Square Strategic Income Fund
SCHEDULE OF INVESTMENTS – Continued
As of October 31, 2021
| Principal | | | | | |
| Amount | | | | Value | |
| | | CORPORATE BONDS (Continued) | | | |
| | | | | | |
| | | FINANCIALS (Continued) | | | |
| | | Capital Markets – 5.3% | | | |
| | | The Bank of New York Mellon Corp. | | | |
$ | 760,000 | | 3.542% (3 Month LIBOR USD + 3.420%), 12/29/20495 | | $ | 762,850 | |
| | 600,000 | | 4.700% (5 Year CMT Rate + 4.358%), 03/20/21695 | | | 654,420 | |
| | | | The Charles Schwab Corp. | | | | |
| | 500,000 | | 5.375% (5 Year CMT Rate + 4.971%), 05/01/20255 | | | 551,200 | |
| | 240,000 | | 7.000% (3 Month LIBOR USD + 4.820%), 02/28/20495 | | | 243,000 | |
| | | | Deutsche Bank AG | | | | |
| | 600,000 | | 4.789% (5 Year Swap Rate USD + 4.358%), 04/30/21651,5 | | | 602,754 | |
| | | | The Goldman Sachs Group, Inc. | | | | |
| | 125,000 | | 5.300% (3 Month LIBOR USD + 3.834%), 12/29/20495 | | | 137,188 | |
| | | | Northern Trust Corp. | | | | |
| | 250,000 | | 4.600% (3 Month LIBOR USD + 3.202%), 04/01/20275 | | | 271,767 | |
| | | | State Street Corp. | | | | |
| | 250,000 | | 3.713% (3 Month LIBOR USD + 3.597%), 12/29/20495 | | | 250,484 | |
| | | | UBS Group AG | | | | |
| | 700,000 | | 5.125% (5 Year CMT Rate + 4.855%), 07/29/21701,5 | | | 755,395 | |
| | | | | | | 4,229,058 | |
| | | | Consumer Finance – 0.7% | | | | |
| | | | Ally Financial Inc. | | | | |
| | 500,000 | | 4.700% (H15T7Y + 3.481%), 11/15/21695 | | | 510,000 | |
| | | | Insurance – 2.2% | | | | |
| | | | Assurant, Inc. | | | | |
| | 700,000 | | 7.000% (3 Month LIBOR USD + 4.135%), 03/27/20485 | | | 817,159 | |
| | | | MetLife, Inc. | | | | |
| | 400,000 | | 3.850% (5 Year CMT Rate + 3.576%), 03/15/20265 | | | 416,000 | |
| | | | PartnerRe Finance B LLC | | | | |
| | 500,000 | | 4.500% (5 Year CMT Rate + 3.815%), 10/01/20505 | | | 534,220 | |
| | | | | | | 1,767,379 | |
| | | | TOTAL FINANCIALS | | | 22,901,157 | |
| | | | | | | | |
| | | | HEALTH CARE – 3.0% | | | | |
| | | | Biotechnology – 1.3% | | | | |
| | | | Perrigo Finance Unlimited Co. | | | | |
| | 1,000,000 | | 3.150%, 06/15/20301 | | | 1,008,976 | |
| | | | Health Care Providers & Services – 1.7% | | | | |
| | | | Centene Corp. | | | | |
| | 1,400,000 | | 2.500%, 03/01/2031 | | | 1,366,778 | |
| | | | TOTAL HEALTH CARE | | | 2,375,754 | |
| | | | | | | | |
| | | | INDUSTRIALS – 6.2% | | | | |
| | | | Aerospace & Defense – 1.5% | | | | |
| | | | The Boeing Co. | | | | |
| | 1,000,000 | | 5.150%, 05/01/2030 | | | 1,167,217 | |
See accompanying Notes to Financial Statements.
North Square Strategic Income Fund
SCHEDULE OF INVESTMENTS – Continued
As of October 31, 2021
| Principal | | | | | |
| Amount | | | | Value | |
| | | CORPORATE BONDS (Continued) | | | |
| | | | | | |
| | | INDUSTRIALS (Continued) | | | |
| | | Airlines – 2.9% | | | |
| | | American Airlines, Inc. / AAdvantage Loyalty IP Ltd. | | | |
$
| 700,000 | | 5.750%, 04/20/20291,3 | | $
| 754,250 | |
| | | | Delta Air Lines, Inc. | | | | |
| | 600,000 | | 4.500%, 10/20/20251,3 | | | 640,321 | |
| | 125,000 | | 4.375%, 04/19/2028 | | | 133,405 | |
| | | | Mileage Plus Holdings LLC / Mileage Plus Intellectual Property Assets Ltd. | | | | |
| | 700,000 | | 6.500%, 06/20/20273 | | | 762,727 | |
| | | | | | | 2,290,703 | |
| | | | Industrial Conglomerates – 1.9% | | | | |
| | | | General Electric Co. | | | | |
| | 1,500,000 | | 3.446% (3 Month LIBOR USD + 3.330%), 09/15/21695 | | | 1,465,938 | |
| | | | TOTAL INDUSTRIALS | | | 4,923,858 | |
| | | | | | | | |
| | | | MATERIALS – 3.7% | | | | |
| | | | Metals & Mining – 3.7% | | | | |
| | | | Alcoa Nederland Holding B.V. | | | | |
| | 700,000 | | 6.125%, 05/15/20281,3 | | | 751,310 | |
| | | | Freeport-McMoRan Inc. | | | | |
| | 1,300,000 | | 4.625%, 08/01/2030 | | | 1,407,250 | |
| | | | Teck Resources Ltd. | | | | |
| | 700,000 | | 3.900%, 07/15/20301 | | | 759,978 | |
| | | | TOTAL MATERIALS | | | 2,918,538 | |
| | | | | | | | |
| | | | UTILITIES – 4.2% | | | | |
| | | | Electric Utilities – 2.4% | | | | |
| | | | Duke Energy Corp. | | | | |
| | 1,000,000 | | 4.875% (5 Year CMT Rate + 3.388%), 03/16/20255 | | | 1,064,000 | |
| | | | Emera Inc. | | | | |
| | 750,000 | | 6.750% (3 Month LIBOR USD + 5.440%), 06/15/20761,5 | | | 883,223 | |
| | | | | | | 1,947,223 | |
| | | | Multi-Utilities – 1.8% | | | | |
| | | | CMS Energy Corp. | | | | |
| | 700,000 | | 3.750% (5 Year CMT Rate + 2.900%), 12/01/20505 | | | 700,000 | |
| | | | Dominion Energy, Inc. | | | | |
| | 650,000 | | 5.750% (3 Month LIBOR USD + 3.057%), 10/01/20545 | | | 709,787 | |
| | | | | | | 1,409,787 | |
| | | | TOTAL UTILITIES | | | 3,357,010 | |
| | | | TOTAL CORPORATE BONDS | | | | |
| | | | (Cost $46,708,442) | | | 48,276,531 | |
See accompanying Notes to Financial Statements.
North Square Strategic Income Fund
SCHEDULE OF INVESTMENTS – Continued
As of October 31, 2021
| Principal | | | | | |
| Amount | | | | Value | |
| | | FOREIGN GOVERNMENT NOTES/BONDS – 1.8% | | | |
| | | Indonesia Treasury Bond | | | |
$ | 11,000,000,000 | | 6.500%, 02/15/20311 | | $ | 795,835 | |
| | | | Mexican Bonos | | | | |
| | 120,000 | | 8.500%, 05/31/20291 | | | 618,184 | |
| | | | TOTAL FOREIGN GOVERNMENT NOTES/BONDS | | | | |
| | | | (Cost $1,369,254) | | | 1,414,019 | |
| | | | | | | | |
| | | | MORTGAGE BACKED SECURITIES – 7.9% | | | | |
| | | | Fannie Mae-Aces | | | | |
| | 8,993,637 | | 0.664%, 05/25/20222 | | | 370 | |
| | 3,860,000 | | 1.381%, 08/25/20282 | | | 318,085 | |
| | 3,627,276 | | 1.273%, 03/26/20292 | | | 295,155 | |
| | | | Freddie Mac Multiclass Certificates Series 2015-P001 | | | | |
| | 3,025,000 | | 1.826%, 10/27/20282 | | | 316,584 | |
| | | | Freddie Mac Multifamily Structured Pass Through Certificates | | | | |
| | 137,698 | | 2.197%, 11/25/2023 | | | 140,679 | |
| | 10,925,256 | | 0.969%, 01/25/20262 | | | 367,463 | |
| | 2,700,000 | | 1.799%, 04/25/20302 | | | 373,939 | |
| | 2,074,000 | | 1.868%, 04/25/20302 | | | 298,672 | |
| | 3,332,000 | | 1.600%, 08/25/20302 | | | 424,735 | |
| | 8,200,000 | | 1.721%, 09/25/20412 | | | 237,962 | |
| | 1,835,000 | | 3.176%, 04/25/20482 | | | 427,195 | |
| | 2,035,000 | | 2.631%, 01/25/20492 | | | 405,517 | |
| | 1,715,000 | | 2.620%, 02/25/20492 | | | 345,416 | |
| | | | FREMF 2016-K55 Mortgage Trust | | | | |
| | 400,000 | | 4.163%, 04/25/20492,3 | | | 425,326 | |
| | | | FREMF 2016-K59 Mortgage Trust | | | | |
| | 64,089,171 | | 0.100%, 11/25/20493 | | | 251,499 | |
| | | | Government National Mortgage Association | | | | |
| | 3,340,642 | | 0.870%, 12/16/20562 | | | 177,449 | |
| | 4,905,749 | | 1.269%, 09/16/20602 | | | 476,610 | |
| | 1,583,390 | | 0.911%, 11/16/20602 | | | 132,326 | |
| | 5,420,734 | | 0.997%, 05/16/20632 | | | 469,810 | |
| | 4,251,230 | | 0.989%, 05/16/20632 | | | 368,613 | |
| | | | TOTAL MORTGAGE BACKED SECURITIES | | | | |
| | | | (Cost $5,883,667) | | | 6,253,405 | |
See accompanying Notes to Financial Statements.
North Square Strategic Income Fund
SCHEDULE OF INVESTMENTS – Continued
As of October 31, 2021
| Number of | | | | | |
| Shares | | | | Value | |
| | | SHORT-TERM INVESTMENT – 4.7% | | | |
| | 3,752,009 | | First American Treasury Obligations Fund – Class X, 0.01%6 | | $ | 3,752,009 | |
| | | | TOTAL SHORT-TERM INVESTMENT | | | | |
| | | | (Cost $3,752,009) | | | 3,752,009 | |
| | | | TOTAL INVESTMENTS – 99.8% | | | | |
| | | | (Cost $74,449,040) | | | 79,267,159 | |
| | | | Other Assets in Excess of Liabilities – 0.2% | | | 193,003 | |
| | | | TOTAL NET ASSETS – 100.0% | | $ | 79,460,162 | |
CMT – Constant Maturity Rate
LIBOR – London Inter-bank Offered Rate
PLC – Public Limited Company
SOFR – Secured Overnight Financing Rate
1 | Foreign security denominated in U.S. Dollars. |
2 | Variable rate security. The coupon is based on an underlying pool of loans. The rate reported is the rate in effect as of October 31, 2021. |
3 | Security as defined in Rule 144A under the Securities Act of 1933 and classified as liquid under the Fund’s liquidity risk management program. Purchased in a private placement transaction; resale to the public may require registration or may extend only to qualified institutional buyers. At October 31, 2021, the value of these securities total $12,745,734 which represents 16.04% of total net assets. |
4 | Level 3 securities fair valued under procedures established by the Board of Trustees, represents 0.82% of Net Assets. The total value of these securities is $655,358. |
5 | Variable rate security based on a reference index and spread. The rate reported is the rate in effect as of October 31, 2021. |
6 | The rate is the annualized seven-day yield at period end. |
Investments are classified by industry pursuant to the Global Industry Classification Standard (GICS®), which was developed by and/or is the exclusive property of Morgan Stanley Capital International, Inc. (“MSCI”) and Standard & Poor’s Financial Services LLC (“S&P”). GICS is a service mark of MSCI and S&P and has been licensed for use by U.S. Bancorp Fund Services, LLC.
See accompanying Notes to Financial Statements.
North Square Strategic Income Fund
SCHEDULE OF OPTIONS WRITTEN
As of October 31, 2021
| Contracts | | | | Notional Amount | | | Value | |
| | | CALL OPTIONS | | | | | | |
| | | Barrick Gold Corp. | | | | | | |
| | 106 | | Expiration: January 2022, Exercise Price: $20.00 | | $ | 194,722 | | | $ | 4,717 | |
| | | | BlackRock, Inc. | | | | | | | | |
| | 4 | | Expiration: December 2021, Exercise Price: $980.00 | | | 377,384 | | | | 4,700 | |
| | | | Crown Castle International Corp. | | | | | | | | |
| | 22 | | Expiration: January 2022, Exercise Price: $195.00 | | | 396,660 | | | | 3,465 | |
| | | | Newmont Corp. | | | | | | | | |
| | 34 | | Expiration: January 2022, Exercise Price: $62.50 | | | 183,600 | | | | 1,870 | |
| | | | Paychex, Inc. | | | | | | | | |
| | 29 | | Expiration: December 2021, Exercise Price: $120.00 | | | 357,512 | | | | 15,370 | |
| | | | Prologis, Inc. | | | | | | | | |
| | 53 | | Expiration: January 2022, Exercise Price: $150.00 | | | 768,288 | | | | 17,490 | |
| | | | Valero Energy Corp. | | | | | | | | |
| | 30 | | Expiration: January 2022, Exercise Price: $95.00 | | | 231,990 | | | | 1,635 | |
| | | | Waste Management, Inc. | | | | | | | | |
| | 22 | | Expiration: January 2022, Exercise Price: $170.00 | | | 352,506 | | | | 3,850 | |
| | | | | | | | | | | 53,097 | |
| | | | TOTAL WRITTEN OPTIONS | | | | | | | | |
| | | | (Premium received $34,349) | | | | | | $ | 53,097 | |
See accompanying Notes to Financial Statements.
North Square Strategic Income Fund
SCHEDULE OF OPEN FUTURES CONTRACTS
As of October 31, 2021
| | | Number of | | | | | | | | | | | |
| | | Contracts | | | | Current | | | Value At | | | Value | |
| | | Purchased | | Settlement | | Notional | | | Trade | | | Unrealized | | | Unrealized | |
| Description | | (Sold) | | Month-Year | | Amount | | | Date | | | Appreciation | | | (Depreciation) | |
| Purchase Contracts: | | | | | | | | | | | | | | | | |
| US Ultra Bond Cbt | | | 6 | | Dec-21 | | $ | 1,178,437 | | | $ | 1,179,203 | | | $ | — | | | $ | (766 | ) |
| Total Purchase Contracts | | | | |
| | $ | 1,178,437 | | | $ | 1,179,203 | | | $ | — | | | $ | (766 | ) |
| Sale Contracts: | | | | | | | | | | | | | | | | | | | | | |
| S&P500 Emini Future | | | (109 | ) | Dec-21 | | $ | 25,053,650 | | | $ | 24,643,279 | | | $ | — | | | $ | (410,371 | ) |
| US 5Yr Note (Cbt) | | | (48 | ) | Dec-21 | | | 5,844,000 | | | | 5,918,930 | | | | 74,930 | | | | — | |
| US 10Yr Ultra Future | | | (5 | ) | Dec-21 | | | 725,156 | | | | 737,278 | | | | 12,122 | | | | — | |
| Total Sale Contracts | | | | | | | $ | 31,622,806 | | | $ | 31,299,487 | | | $ | 87,052 | | | $ | (410,371 | ) |
| Total Futures Contracts | | | | | | | $ | (30,444,369 | ) | | $ | (30,120,284 | ) | | $ | 87,052 | | | $ | (411,137 | ) |
| Net Unrealized Depreciation | | | | | | | | | | | | | | | | | | | $ | (324,085 | ) |
See accompanying Notes to Financial Statements.
North Square Strategic Income Fund
SUMMARY OF INVESTMENTS
As of October 31, 2021
| | | Percent of Total |
Security Type/Sector | | Net Assets |
Common Stocks | | | |
Industrials | | | 2.6 | % |
Information Technology | | | 1.8 | % |
Energy | | | 1.3 | % |
Health Care | | | 1.3 | % |
Consumer Staples | | | 1.2 | % |
Consumer Discretionary | | | 0.5 | % |
Financials | | | 0.5 | % |
Materials | | | 0.5 | % |
| Total Common Stocks | | | 9.7 | % |
Preferred Stocks | | | | |
Financials | | | 4.5 | % |
Communication Services | | | 1.0 | % |
Consumer Staples | | | 0.1 | % |
| Total Preferred Stocks | | | 5.6 | % |
Purchased Call Option | | | 1.1 | % |
REITs | | | 6.0 | % |
Asset Backed Securities | | | 2.3 | % |
Corporate Bonds | | | | |
Financials | | | 28.8 | % |
Industrials | | | 6.2 | % |
Energy | | | 5.8 | % |
Consumer Discretionary | | | 4.2 | % |
Utilities | | | 4.2 | % |
Materials | | | 3.7 | % |
Communication Services | | | 3.1 | % |
Health Care | | | 3.0 | % |
Consumer Staples | | | 1.7 | % |
| Total Corporate Bonds | | | 60.7 | % |
Foreign Government Notes/Bonds | | | 1.8 | % |
Mortgage Backed Securities | | | 7.9 | % |
Short-Term Investment | | | 4.7 | % |
| Total Investments | | | 99.8 | % |
Other Assets in Excess of Liabilities | | | 0.2 | % |
| Total Net Assets | | | 100.0 | % |
See accompanying Notes to Financial Statements.
STATEMENTS OF ASSETS AND LIABILITIES
As of October 31, 2021
| | | North Square | | | North Square | | | | | | | |
| | | Advisory | | | Altrinsic | | | North Square | | | North Square | |
| | | Research All Cap | | | International | | | McKee | | | Strategic | |
| | | Value Fund | | | Equity Fund | | | Bond Fund | | | Income Fund | |
| Assets: | | | | | | | | | | | | |
| Investments, at cost | | $ | 7,974,752 | | | $ | 42,638,463 | | | $ | 142,704,242 | | | $ | 74,449,040 | |
| | | | | | | | | | | | | | | | | |
| Investments, at value | | $ | 10,098,212 | | | $ | 44,234,136 | | | $ | 141,708,452 | | | $ | 79,267,159 | |
| Receivables: | | | | | | | | | | | | | | | | |
| Dividends and interest | | | 3,513 | | | | 130,416 | | | | 407,320 | | | | 587,620 | |
| Investment securities sold | | | — | | | | 344,664 | | | | 1,957,567 | | | | 2,132,819 | |
| Due from Advisor (Note 3) | | | — | | | | — | | | | 88,830 | | | | — | |
| Fund shares sold | | | — | | | | — | | | | — | | | | 34,740 | |
| Prepaid expenses | | | 23,458 | | | | 73,420 | | | | 74,825 | | | | 19,963 | |
| Total assets | | | 10,125,183 | | | | 44,782,636 | | | | 144,236,994 | | | | 82,042,301 | |
| | | | | | | | | | | | | | | | | |
| Liabilities: | | | | | | | | | | | | | | | | |
| Payables: | | | | | | | | | | | | | | | | |
| Investment securities purchased | | | — | | | | — | | | | 4,738,963 | | | | 2,275,875 | |
| Fund shares redeemed | | | — | | | | — | | | | 79,780 | | | | 31,821 | |
| Variation Margin | | | — | | | | — | | | | — | | | | 53,756 | |
| Written options contracts, at value (proceeds $34,349) | | | — | | | | — | | | | — | | | | 53,097 | |
| Accrued expenses: | | | | | | | | | | | | | | | | |
| Due to Advisor (Note 3) | | | 4,349 | | | | 9,688 | | | | — | | | | 59,051 | |
| Legal fees | | | 2,866 | | | | 15,339 | | | | 45,577 | | | | 33,814 | |
| Shareholder servicing fees (Note 6) | | | 1,945 | | | | — | | | | 5,877 | | | | 22,420 | |
| Fund administration fees | | | 1,163 | | | | 4,525 | | | | 14,121 | | | | 16,578 | |
| Custody fees | | | 942 | | | | 4,657 | | | | 6,750 | | | | 3,461 | |
| Auditing fees | | | 811 | | | | 4,287 | | | | 11,948 | | | | 9,962 | |
| Transfer agent fees | | | 593 | | | | 2,515 | | | | 8,918 | | | | 8,243 | |
| Accrued other expenses | | | 554 | | | | 5,923 | | | | 21,293 | | | | 6,329 | |
| Due to Trustees | | | 536 | | | | 2,776 | | | | 11,665 | | | | 7,106 | |
| Chief Compliance Officer fees (Note 3) | | | 2 | | | | — | | | | 691 | | | | 626 | |
| Total liabilities | | | 13,761 | | | | 49,710 | | | | 4,945,583 | | | | 2,582,139 | |
| | | | | | | | | | | | | | | | | |
| Net Assets | | $ | 10,111,422 | | | $ | 44,732,926 | | | | | | | $ | 79,460,162 | |
| | | | | | | | | | | | | | | | | |
| Components of Net Assets: | | | | | | | | | | | | | | | | |
| Paid-in capital (par value of $0.01 per share with | | | | | | | | | | | | | | | | |
| an unlimited number of shares authorized) | | | | | | $ | 42,355,516 | | | | | | | $ | 72,880,986 | |
| Total distributable earnings (accumulated deficit) | | | 2,802,739 | | | | 2,377,410 | | | | (1,400,656 | ) | | | 6,579,176 | |
| Net Assets | | | | | | | | | | | | | | $ | 79,460,162 | |
| | | | | | | | | | | | | | | | | |
| Maximum Offering Price per Share: | | | | | | | | | | | | | | | | |
| Class I Shares: | | | | | | | | | | | | | | | | |
| Net assets applicable to shares outstanding | | $ | 10,111,422 | | | $ | 44,732,926 | | | $ | 139,281,423 | | | $ | 79,460,162 | |
| Shares of beneficial interest issued and outstanding | | | 828,352 | | | | 4,112,839 | | | | 14,149,199 | | | | 7,874,449 | |
| Net asset value, redemption and offering price per share | | $ | 12.21 | | | $ | 10.88 | | | $ | 9.84 | | | $ | 10.09 | |
| | | | | | | | | | | | | | | | | |
| Class Y Shares: | | | | | | | | | | | | | | | | |
| Net assets applicable to shares outstanding | | $ | — | | | $ | — | | | $ | 9,987 | | | $ | — | |
| Shares of beneficial interest issued and outstanding | | | — | | | | — | | | | 1,015 | | | | — | |
| Net asset value, redemption and offering price per share | | $ | — | | | $ | — | | | $ | 9.84 | | | $ | — | |
See accompanying Notes to Financial Statements.
STATEMENTS OF OPERATIONS
For the Year Ended October 31, 2021
| | | North Square | | | North Square
| | |
| | | | |
| | | Advisory | | | Altrinsic | | | North Square | | | North Square | |
| | | Research All Cap | | | International | | | McKee | | | Strategic | |
| | | Value Fund | | | Equity Fund | | | Bond Fund | | | Income Fund | |
| Investment Income: | | | | | | | | | | | | |
| Dividends (net of foreign withholding taxes and/or | | | | | | | | | | | | |
| issuance fees of $287, $71,193, $0, and $0, respectively) | | $ | 79,449 | | | $ | 632,705 | | | | | | | $ | 405,626 | |
| Interest (net of foreign withholding taxes and/or | | | | | | | | | | | | | | | | |
| issuance fees of $0, $0, $933, and $1,686, respectively) | | | | | | | 200 | | | | 379,333 | | | | 2,079,062 | |
| Total investment income | | | 79,504 | | | | 632,905 | | | | 379,333 | | | | 2,484,688 | |
| | | | | | | | | | | | | | | | | |
| Expenses: | | | | | | | | | | | | | | | | |
| Advisory fees (Note 3) | | | 43,211 | | | | 215,177 | | | | 131,582 | | | | 521,120 | |
| Registration fees | | | 19,875 | | | | 8,200 | | | | 6,184 | | | | 19,803 | |
| Fund administration fees | | | 8,377 | | | | | | | | 52,725 | | | | 109,002 | |
| Shareholder servicing fees – Class I (Note 6) | | | 6,724 | | | | — | | | | 13,046 | | | | 89,285 | |
| Custody fees | | | 5,838 | | | | 28,446 | | | | 19,954 | | | | 16,554 | |
| Transfer agent fees and expenses | | | 4,734 | | | | 18,517 | | | | 30,591 | | | | 64,538 | |
| Legal fees | | | 3,602 | | | | 17,828 | | | | 51,294 | | | | 42,301 | |
| Trustees’ fees and expenses | | | 1,958 | | | | 9,368 | | | | 21,080 | | | | 22,999 | |
| Auditing fees | | | 1,672 | | | | 7,951 | | | | 15,352 | | | | 19,954 | |
| Chief Compliance Officer fees (Note 3) | | | 1,492 | | | | 6,000 | | | | 9,119 | | | | 18,186 | |
| Shareholder reporting fees | | | 887 | | | | 1,555 | | | | 3,114 | | | | 6,744 | |
| Fund accounting fees | | | 788 | | | | 3,486 | | | | 5,511 | | | | 9,744 | |
| Offering costs | | | — | | | | 28,140 | | | | 20,000 | | | | — | |
| Other expenses | | | 1,121 | | | | 5,640 | | | | 19,170 | | | | 13,742 | |
| Total expenses | | | 100,279 | | | | 385,216 | | | | 398,722 | | | | 953,972 | |
| Less advisory fees waived & expenses reimbursed | | | (41,637 | ) | | | (124,314 | ) | | | (245,201 | ) | | | (283,961 | ) |
| Net expenses | | | 58,642 | | | | 260,902 | | | | | | | | 670,011 | |
| Net Investment income | | | 20,862 | | | | 372,003 | | | | 225,812 | | | | 1,814,677 | |
| | | | | | | | | | | | | | | | | |
| Net Realized and Unrealized Gain (Loss): | | | | | | | | | | | | | | | | |
| Net realized gain (loss) on: | | | | | | | | | | | | | | | | |
| Investments | | | 784,340 | | | | 456,343 | | | | (160,681 | ) | | | 2,347,500 | |
| Futures contracts | | | — | | | | — | | | | — | | | | 222,859 | |
| Purchased options | | | — | | | | — | | | | — | | | | (260,022 | ) |
| Written options | | | — | | | | — | | | | — | | | | 14,513 | |
| Foreign currency transactions | | | — | | | | (20,880 | ) | | | — | | | | 477 | |
| Net realized gain (loss) | | | 784,340 | | | | 435,463 | | | | (160,681 | ) | | | 2,325,327 | |
| Net change in unrealized appreciation/depreciation on: | | | | | | | | | | | | | | | | |
| Investments | | | 1,342,207 | | | | 1,595,673 | | | | (995,789 | ) | | | 2,096,818 | |
| Futures contracts | | | — | | | | — | | | | — | | | | (324,085 | ) |
| Purchased options | | | — | | | | — | | | | — | | | | 219,554 | |
| Written options | | | — | | | | — | | | | — | | | | (18,748 | ) |
| Foreign currency transactions | | | — | | | | (2,775 | ) | | | — | | | | (360 | ) |
| Net change in unrealized appreciation/depreciation | | | 1,342,207 | | | | 1,592,898 | | | | (995,789 | ) | | | 1,973,179 | |
| Net realized and unrealized gain (loss) | | | 2,126,547 | | | | 2,028,361 | | | | (1,156,470 | ) | | | 4,298,506 | |
| Net increase (decrease) in net assets from operations | | $ | 2,147,409 | | | | | | | $ | (930,658 | ) | | $ | 6,113,183 | |
See accompanying Notes to Financial Statements.
STATEMENTS OF CHANGES IN NET ASSETS
| | | | | | | | | North Square | |
| | | | | | | | | Altrinsic | |
| | | North Square Advisory | | | International | |
| | | Research All Cap Value Fund | | | Equity Fund | |
| | | | |
| | | For the Period | |
| | | For the | | | For the | | | December 4, | |
| | | Year Ended | | | Year Ended | | | 2020* through | |
| | | October 31, | | | October 31, | | | October 31, | |
| | | 2021 | | | 2020 | | | 2021 | |
| Increase (Decrease) in Net Assets from: | | | | | | | | | |
| Operations: | | | | | | | | | |
| Net investment income | | $ | 20,862 | | | $ | 51,097 | | | $ | 372,003 | |
| Net realized gain on investments and foreign currency translations | | | 784,340 | | | | 713,327 | | | | 435,463 | |
| Net change in unrealized appreciation/depreciation | | | | | | | | | | | | |
| on investments and foreign currency translations | | | 1,342,207 | | | | (1,742,113 | ) | | | 1,592,898 | |
| Net increase (decrease) in net assets resulting from operations | | | 2,147,409 | | | | (977,689 | ) | | | 2,400,364 | |
| | | | | | | | | | | | | |
| Distributions to shareholders | | | (514,487 | ) | | | (1,010,006 | ) | | | (22,954 | ) |
| | | | | | | | | | | | | |
| Capital Transactions: | | | | | | | | | | | | |
| Net proceeds from shares sold | | | 5,221,139 | | | | 1,382,870 | | | | 42,332,562 | |
| Reinvestment of distributions | | | 514,487 | | | | 1,010,006 | | | | 22,954 | |
| Cost of shares redeemed | | | (1,635,227 | ) | | | (5,411,998 | ) | | | — | |
| Net increase (decrease) in net assets from capital transactions | | | 4,100,399 | | | | (3,019,122 | ) | | | 42,355,516 | |
| | | | | | | | | | | | | |
| Total increase (decrease) in net assets | | | 5,733,321 | | | | (5,006,817 | ) | | | 44,732,926 | |
| | | | | | | | | | | | | |
| Net Assets: | | | | | | | | | | | | |
| Beginning of Period | | | 4,378,101 | | | | 9,384,918 | | | | — | |
| End of Period | | $ | 10,111,422 | | | $ | 4,378,101 | | | $ | 44,732,926 | |
| | | | | | | | | | | | | |
| Capital Share Transactions: | | | | | | | | | | | | |
| Shares sold | | | 460,973 | | | | 146,298 | | | | 4,110,516 | |
| Shares reinvested | | | 53,827 | | | | 91,074 | | | | 2,323 | |
| Shares redeemed | | | (155,852 | ) | | | (574,580 | ) | | | — | |
| Net increase (decrease) in capital share transactions | | | 358,948 | | | | (337,208 | ) | | | 4,112,839 | |
| * | Commencement of Operations |
See accompanying Notes to Financial Statements.
STATEMENTS OF CHANGES IN NET ASSETS – Continued
| | | North Square | | | | | | | |
| | | McKee Bond | | | North Square | |
| | | Fund | | | Strategic Income Fund | |
| | | For the Period | | | | | | | |
| | | December 28, | | | For the | | | For the | |
| | | 2020* through | | | Year Ended | | | Year Ended | |
| | | October 31, | | | October 31, | | | October 31, | |
| | | 2021 | | | 2021 | | | 2020 | |
| Increase (Decrease) in Net Assets from: | | | | | | | | | |
| Operations: | | | | | | | | | |
| Net investment income | | $ | 225,812 | | | $ | 1,814,677 | | | $ | 1,072,285 | |
| Net realized gain (loss) on investments and foreign currency translations | | | (160,681 | ) | | | 2,325,327 | | | | 3,652,857 | |
| Net change in unrealized appreciation/depreciation | | | | | | | | | | | | |
| on investments and foreign currency translations | | | (995,789 | ) | | | 1,973,179 | | | | 2,021,714 | |
| Net increase (decrease) in net assets resulting from operations | | | (930,658 | ) | | | 6,113,183 | | | | 6,746,856 | |
| | | | | | | | | | | | | |
| Distributions to shareholders: | | | | | | | | | | | | |
| Distributions: | | | | | | | | | | | | |
| Class I | | | (472,810 | ) | | | (5,504,517 | ) | | | (975,490 | ) |
| Class Y** | | | (38 | ) | | | — | | | | — | |
| Total | | | (472,848 | ) | | | (5,504,517 | ) | | | (975,490 | ) |
| | | | | | | | | | | | | |
| Capital Transactions: | | | | | | | | | | | | |
| Net proceeds from shares sold: | | | | | | | | | | | | |
| Class I | | | 147,553,321 | | | | 19,060,975 | | | | 63,245,780 | |
| Class Y** | | | 10,000 | | | | — | | | | — | |
| Reinvestment of distributions: | | | | | | | | | | | | |
| Class I | | | 372,220 | | | | 5,465,425 | | | | 975,066 | |
| Class Y** | | | 38 | | | | — | | | | — | |
| Cost of shares redeemed: | | | | | | | | | | | | |
| Class I | | | (7,240,662 | ) | | | (19,962,307 | ) | | | (6,345,626 | ) |
| Class Y** | | | — | | | | — | | | | — | |
| Net increase in net assets from capital transactions | | | 140,694,917 | | | | 4,564,093 | | | | 57,875,220 | |
| | | | | | | | | | | | | |
| Total increase in net assets | | | 139,291,411 | | | | 5,172,759 | | | | 63,646,586 | |
| | | | | | | | | | | | | |
| Net Assets: | | | | | | | | | | | | |
| Beginning of Period | | | — | | | | 74,287,403 | | | | 10,640,817 | |
| End of Period | | $ | 139,291,411 | | | $ | 79,460,162 | | | $ | 74,287,403 | |
| | | | | | | | | | | | | |
| Capital Share Transactions: | | | | | | | | | | | | |
| Shares sold: | | | | | | | | | | | | |
| Class I | | | 14,843,011 | | | | 1,888,568 | | | | 6,857,165 | |
| Class Y** | | | 1,011 | | | | — | | | | — | |
| Shares reinvested: | | | | | | | | | | | | |
| Class I | | | 37,556 | | | | 551,632 | | | | 99,285 | |
| Class Y** | | | 4 | | | | — | | | | — | |
| Shares redeemed: | | | | | | | | | | | | |
| Class I | | | (731,368 | ) | | | (1,998,562 | ) | | | (640,318 | ) |
| Class Y** | | | — | | | | — | | | | — | |
| Net increase (decrease) in capital share transactions | | | 14,150,214 | | | | 441,638 | | | | 6,316,132 | |
| * | Commencement of Operations for Class I |
| ** | For the period May 19, 2021 through October 31, 2021 |
See accompanying Notes to Financial Statements.
North Square Advisory Research All Cap Value Fund
FINANCIAL HIGHLIGHTS
Class I
Per share operating performance.
For a capital share outstanding throughout each period.
| | | For the Year Ended October 31, | |
| | | 2021 | | | 2020 | | | 2019 | | | 2018 | | | 2017 | |
| Net asset value, beginning of period | | $ | 9.33 | | | $ | 11.63 | | | $ | 14.73 | | | $ | 14.77 | | | $ | 12.99 | |
| Income from Investment Operations: | | | | | | | | | | | | | | | | | | | | |
Net investment income1 | | | 0.04 | | | | 0.08 | | | | 0.07 | | | | 0.06 | | | | 0.06 | |
| Net realized and unrealized gain (loss) | | | 3.95 | | | | (1.11 | ) | | | 0.85 | | | | 1.27 | | | | 2.68 | |
| Total from investment operations | | | 3.99 | | | | (1.03 | ) | | | 0.92 | | | | 1.33 | | | | 2.74 | |
| Less Distributions: | | | | | | | | | | | | | | | | | | | | |
| From net investment income | | | (0.10 | ) | | | (0.07 | ) | | | (0.07 | ) | | | (0.05 | ) | | | (0.09 | ) |
| From net realized gain | | | (1.01 | ) | | | (1.20 | ) | | | (3.95 | ) | | | (1.32 | ) | | | (0.87 | ) |
| Total distributions | | | (1.11 | ) | | | (1.27 | ) | | | (4.02 | ) | | | (1.37 | ) | | | (0.96 | ) |
Redemption Fee Proceeds1 | | | — | | | | — | | | | — | 2 | | | — | 2 | | | — | 2 |
| Net asset value, end of period | | $ | 12.21 | | | $ | 9.33 | | | $ | 11.63 | | | $ | 14.73 | | | $ | 14.77 | |
Total return3 | | | 46.09 | % | | | (10.63 | )% | | | 12.95 | % | | | 9.33 | % | | | 21.93 | % |
| Ratios and Supplemental Data: | | | | | | | | | | | | | | | | | | | | |
Net assets, end of period (in thousands) | | $ | 10,111 | | | $ | 4,378 | | | $ | 9,385 | | | $ | 10,575 | | | $ | 15,603 | |
Ratio of expenses to average net assets: | | | | | | | | | | | | | | | | | | | | |
| Before fees waived and expenses absorbed | | | 1.63 | % | | | 1.97 | % | | | 1.76 | % | | | 1.78 | % | | | 1.74 | % |
| After fees waived and expenses absorbed | | | 0.95 | % | | | 0.97 | %4 | | | 1.00 | % | | | 1.00 | % | | | 1.00 | % |
Ratio of net investment income (loss) to average net assets: | | | | | | | | | | | | | | | | | | | | |
| Before fees waived and expenses absorbed | | | (0.34 | )% | | | (0.21 | )% | | | (0.17 | )% | | | (0.39 | )% | | | (0.29 | )% |
| After fees waived and expenses absorbed | | | 0.34 | % | | | 0.79 | % | | | 0.59 | % | | | 0.39 | % | | | 0.45 | % |
Portfolio turnover rate | | | 45 | % | | | 49 | % | | | 26 | % | | | 42 | % | | | 31 | % |
1 | Based on average shares outstanding for the period. |
2 | Amount represents less than $0.005 per share. |
3 | Total returns would have been lower had expenses not been waived by the Advisor. Returns shown do not reflect the deduction of taxes that a shareholder would pay on Fund distributions or the redemption of Fund shares. |
4 | The annual net expense ratio changed from 1.00% to 0.95% of net assets as of the close of business on February 21, 2020. |
See accompanying Notes to Financial Statements.
North Square Altrinsic International Equity Fund
FINANCIAL HIGHLIGHTS
Class I
Per share operating performance.
For a capital share outstanding throughout each period.
| | | For the Period | |
| | | December 4, | |
| | | 2020* through | |
| | | October 31, 2021 | |
| Net asset value, beginning of period | | $ | 10.00 | |
| Income from Investment Operations: | | | | |
Net investment income1 | | | 0.13 | |
| Net realized and unrealized gain (loss) | | | 0.76 | |
| Total from investment operations | | | 10.89 | |
| Less Distributions: | | | | |
| From net investment income | | | (0.01 | ) |
| Total distributions | | | (0.01 | ) |
| Net asset value, end of period | | $ | 10.88 | |
Total return2 | | | 8.88 | %3 |
| Ratios and Supplemental Data: | | | | |
Net assets, end of period (in thousands) | | $ | 44,733 | |
Ratio of expenses to average net assets: | | | | |
| Before fees waived and expenses absorbed | | | 1.43 | %4 |
| After fees waived and expenses absorbed | | | 0.97 | %4 |
Ratio of net investment income (loss) to average net assets: | | | | |
| Before fees waived and expenses absorbed | | | 0.92 | %4 |
| After fees waived and expenses absorbed | | | 1.38 | %4 |
Portfolio turnover rate | | | 22 | %3 |
| * | Commencement of operations. |
1 | Based on average shares outstanding for the period. |
2 | Total returns would have been lower had expenses not been waived by the Advisor. Returns shown do not reflect the deduction of taxes that a shareholder would pay on Fund distributions or the redemption of Fund shares. |
3 | Not Annualized. |
4 | Annualized. |
See accompanying Notes to Financial Statements.
North Square McKee Bond Fund
FINANCIAL HIGHLIGHTS
Class I
Per share operating performance.
For a capital share outstanding throughout each period.
| | | For the Period | |
| | | December 28, | |
| | | 2020* through | |
| | | October 31, 2021 | |
| Net asset value, beginning of period | | $ | 10.00 | |
| Income from Investment Operations: | | | | |
Net investment income1 | | | 0.03 | |
| Net realized and unrealized gain (loss) | | | (0.13 | ) |
| Total from investment operations | | | (0.10 | ) |
| Less Distributions: | | | | |
| From net investment income | | | (0.06 | ) |
| Total distributions | | | (0.06 | ) |
| Net asset value, end of period | | $ | 9.84 | |
Total return2 | | | (0.91 | )%3 |
| Ratios and Supplemental Data: | | | | |
Net assets, end of period (in thousands) | | $ | 139,281 | |
Ratio of expenses to average net assets: | | | | |
| Before fees waived and expenses absorbed | | | 0.73 | %4 |
| After fees waived and expenses absorbed | | | 0.28 | %4 |
Ratio of net investment income (loss) to average net assets: | | | | |
| Before fees waived and expenses absorbed | | | (0.04 | )%4 |
| After fees waived and expenses absorbed | | | 0.41 | %4 |
Portfolio turnover rate | | | 321 | %3,5 |
| * | Commencement of operations. |
1 | Based on average shares outstanding for the period. |
2 | Total returns would have been lower had expenses not been waived by the Advisor. Returns shown do not reflect the deduction of taxes that a shareholder would pay on Fund distributions or the redemption of Fund shares. |
3 | Not Annualized. |
4 | Annualized. |
5 | Securities purchased-in-kind were excluded from the computation of the ratio. |
See accompanying Notes to Financial Statements.
North Square McKee Bond Fund
FINANCIAL HIGHLIGHTS
Class Y
Per share operating performance.
For a capital share outstanding throughout each period.
| | | For the Period | |
| | | May 19, 2021* | |
| | | through | |
| | | October 31, 2021 | |
| Net asset value, beginning of period | | $ | 9.89 | |
| Income from Investment Operations: | | | | |
Net investment income1 | | | 0.01 | |
| Net realized and unrealized gain (loss) | | | (0.02 | ) |
| Total from investment operations | | | (0.01 | ) |
| Less Distributions: | | | | |
| From net investment income | | | (0.04 | ) |
| Total distributions | | | (0.04 | ) |
| Net asset value, end of period | | $ | 9.84 | |
Total return2 | | | (0.12 | )%3 |
| Ratios and Supplemental Data: | | | | |
Net assets, end of period (in thousands) | | $ | 10 | |
Ratio of expenses to average net assets: | | | | |
| Before fees waived and expenses absorbed | | | 0.64 | %4 |
| After fees waived and expenses absorbed | | | 0.47 | %4 |
Ratio of net investment income (loss) to average net assets: | | | | |
| Before fees waived and expenses absorbed | | | 0.13 | %4 |
| After fees waived and expenses absorbed | | | 0.30 | %4 |
Portfolio turnover rate | | | 321 | %3,5 |
| * | Commencement of operations. |
1 | Based on average shares outstanding for the period. |
2 | Total returns would have been lower had expenses not been waived by the Advisor. Returns shown do not reflect the deduction of taxes that a shareholder would pay on Fund distributions or the redemption of Fund shares. |
3 | Not Annualized. |
4 | Annualized. |
5 | Securities purchased-in-kind were excluded from the computation of the ratio. |
See accompanying Notes to Financial Statements.
North Square Strategic Income Fund
FINANCIAL HIGHLIGHTS
Class I
Per share operating performance.
For a capital share outstanding throughout each period.
| | | For the Year Ended October 31, | |
| | | 2021 | | | 2020 | | | 2019 | | | 2018 | | | 2017 | |
| Net asset value, beginning of period | | $ | 9.99 | | | $ | 9.53 | | | $ | 8.97 | | | $ | 9.46 | | | $ | 9.47 | |
| Income from Investment Operations: | | | | | | | | | | | | | | | | | | | | |
Net investment income1 | | | 0.24 | | | | 0.23 | | | | 0.32 | | | | 0.35 | | | | 0.39 | |
| Net realized and unrealized gain (loss) | | | 0.60 | | | | 0.48 | | | | 0.56 | | | | (0.49 | ) | | | (0.04 | ) |
| Total from investment operations | | | 0.84 | | | | 0.71 | | | | 0.88 | | | | (0.14 | ) | | | 0.35 | |
| Less Distributions: | | | | | | | | | | | | | | | | | | | | |
| From net investment income | | | (0.28 | ) | | | (0.25 | ) | | | (0.32 | ) | | | (0.34 | ) | | | (0.36 | ) |
| From net realized gain | | | (0.46 | ) | | | — | | | | — | | | | (0.01 | ) | | | — | |
| Total distributions | | | (0.74 | ) | | | (0.25 | ) | | | (0.32 | ) | | | (0.35 | ) | | | (0.36 | ) |
Redemption Fee Proceeds1 | | | — | | | | — | | | | — | 2 | | | — | 2 | | | — | 2 |
| Net asset value, end of period | | $ | 10.09 | | | $ | 9.99 | | | $ | 9.53 | | | $ | 8.97 | | | $ | 9.46 | |
Total return3 | | | 8.63 | % | | | 7.56 | % | | | 10.00 | % | | | (1.43 | )% | | | 3.83 | % |
| Ratios and Supplemental Data: | | | | | | | | | | | | | | | | | | | | |
Net assets, end of period (in thousands) | | $ | 79,460 | | | $ | 74,287 | | | $ | 10,641 | | | $ | 10,403 | | | $ | 10,806 | |
Ratio of expenses to average net assets: | | | | | | | | | | | | | | | | | | | | |
| Before fees waived and expenses absorbed | | | 1.28 | % | | | 1.48 | % | | | 1.76 | % | | | 2.27 | % | | | 2.49 | % |
| After fees waived and expenses absorbed | | | 0.90 | % | | | 0.90 | % | | | 0.90 | % | | | 0.90 | % | | | 0.90 | % |
Ratio of net investment income (loss) to average net assets: | | | | | | | | | | | | | | | | | | | | |
| Before fees waived and expenses absorbed | | | 2.06 | % | | | 1.75 | % | | | 2.56 | % | | | 2.41 | % | | | 2.53 | % |
| After fees waived and expenses absorbed | | | 2.44 | % | | | 2.33 | % | | | 3.42 | % | | | 3.78 | % | | | 4.12 | % |
Portfolio turnover rate | | | 77 | % | | | 145 | % | | | 36 | % | | | 48 | % | | | 64 | % |
1 | Based on average shares outstanding for the period. |
2 | Amount represents less than $0.005 per share. |
3 | Total returns would have been lower had expenses not been waived by the Advisor. Returns shown do not reflect the deduction of taxes that a shareholder would pay on Fund distributions or the redemption of Fund shares. |
See accompanying Notes to Financial Statements.
North Square Funds
NOTES TO FINANCIAL STATEMENTS
October 31, 2021
Note 1 – Organization
The North Square Advisory Research All Cap Value Fund (“All Cap Value” or “All Cap Value Fund”), North Square Altrinsic International Equity Fund (“International Equity” or “International Equity Fund”), North Square McKee Bond Fund (“McKee Bond” or “McKee Bond Fund”), and North Square Strategic Income Fund (“Strategic Income” or “Strategic Income Fund”)(each a “Fund” and collectively the “Funds”) are organized as a series of the North Square Investments Trust, a Delaware statutory trust (the “Trust”) which is registered as an open-end management investment company under the Investment Company Act of 1940, as amended (the “1940 Act”). The Funds are diversified funds.
The All Cap Value Fund’s primary investment objective is to seek long-term capital appreciation. Effective the close of business on February 21, 2020, the All Cap Value Fund (the “Successor Fund”) acquired the assets and assumed the liabilities of the Advisory Research All Cap Value Fund (the “Predecessor Fund”), a series of Investment Managers Series Trust, which commenced operations on November 16, 2009.
The International Equity Fund’s primary investment objective is to provide long-term growth of capital. The Fund commenced operations on December 4, 2020.
The McKee Bond Fund’s primary investment objective is to maximize total return and generate consistent outperformance of the Fund’s benchmark, the Bloomberg Intermediate Aggregate Bond Index, with a high quality and highly liquid, well diversified portfolio through opportunistic, risk-controlled management. The Fund’s Class I share commenced operations on December 28, 2020 and Class Y share commenced operations on May 19, 2021. Effective on December 1, 2021, the outstanding Class Y shares of the McKee Bond Fund were renamed as Class I shares, and the previously outstanding Class I shares of the Fund were renamed as Class R6 shares. The ticker symbols of the renamed classes did not change. All references to Class Y shares in this report represent the new Class I shares, and all references to Class I shares in this report represent the new Class R6 shares. There were no charges imposed in connection with this renaming of share classes.
The Strategic Income Fund’s primary investment objectives are to seek high current income and to seek long-term capital appreciation. Effective the close of business on February 21, 2020, the Strategic Income Fund (the “Successor Fund”) acquired the assets and assumed the liabilities of the Advisory Research Strategic Income Fund (the “Predecessor Fund”), a series of Investment Managers Series Trust, which commenced operations on December 31, 2012.
Note 2 – Accounting Policies
The following is a summary of the significant accounting policies consistently followed by the Funds in the preparation of their financial statements. The preparation of financial statements in conformity with accounting principles generally accepted in the United States of America (“GAAP”) requires management to make estimates and assumptions that affect the reported amounts and disclosures in the financial statements. Actual results could differ from these estimates.
(a) Valuation of Investments
Each Fund values equity securities at the last reported sale price on the principal exchange or in the principal over the counter (“OTC”) market in which such securities are traded, as of the close of regular trading on the NYSE on the day the securities are being valued or, if the last-quoted sales price is not readily available, the securities will be valued at the last bid or the mean between the last available bid and ask price. Securities traded on the NASDAQ are valued at the NASDAQ Official Closing Price (“NOCP”). Investments in open-end investment companies are valued at the daily closing net asset value of the respective investment company. Debt securities are valued by utilizing a price supplied by independent pricing service providers. The independent pricing service providers may use various valuation methodologies including matrix pricing and other analytical pricing models as well as market transactions and dealer quotations. These models generally consider such factors as yields or prices of bonds of comparable quality, type of issue, coupon, maturity, ratings and general market conditions. If a price is not readily available for a portfolio security, the security will be valued at fair value (the amount which the Fund might reasonably expect to receive for the security upon its current sale) as determined in good faith by the Fund’s advisor, subject to review and approval by the Valuation Committee, pursuant to procedures adopted by the Board of Trustees. The actions of the Valuation Committee are subsequently reviewed by the Board at its next regularly scheduled board meeting. The Valuation Committee meets as needed.
Fair value pricing may be applied to foreign securities held by the Funds upon the occurrence of an event after the close of trading on non-U.S. markets but before the close of trading on the NYSE when each Fund’s NAV is determined. If the event may result in a material adjustment to the price of the Fund’s foreign securities once non-U.S. markets open on the following business day (such as, for example, a significant surge or decline in the U.S. market), the Fund may value such foreign securities at fair value, taking into account the effect of such event, in order to calculate the Fund’s NAV. Other types of portfolio securities that the Fund may fair value include, but are not limited to: (1) investments that are illiquid or traded infrequently, including “restricted” securities and private
North Square Funds
NOTES TO FINANCIAL STATEMENTS – Continued
October 31, 2021
placements for which there is no public market; (2) investments for which, in the judgment of the advisor, the market price is stale; (3) securities of an issuer that has entered into a restructuring; (4) securities for which trading has been halted or suspended; and (5) fixed income securities for which there is not a current market value quotation.
Foreign securities traded in countries outside the U.S. are fair valued by utilizing the quotations of an independent pricing service or from a brokerage firm. The pricing service or broker will use a statistical analyses and quantitative models to adjust local prices using factors such as subsequent movement and changes in the prices of indexes, securities and exchange rates in other markets in determining fair value as of the time the Fund calculates the NAVs. The Board reviews the independent third party fair valuation analysis report quarterly.
The global outbreak of COVID-19 (commonly referred to as “coronavirus”) has disrupted economic markets and the prolonged economic impact is uncertain. The ultimate economic fallout from the pandemic, and the long-term impact on economies, markets, industries and individual issuers, are not known. The operational and financial performance of the issuers of securities in which the Funds invest depends on future developments, including the duration and spread of the outbreak, and such uncertainty may in turn adversely affect the value and liquidity of the Funds’ investments, impair the Funds’ ability to satisfy redemption requests, and negatively impact the Funds’ performance.
(b) Deposits with Broker
When trading derivative instruments, such as forward or futures contracts, the Funds are only required to post initial or variation margin with the exchange or clearing broker. The use of margin in trading these instruments has the effect of creating leverage, which can expose the Funds to substantial gains or losses occurring from relatively small price changes in the value of the underlying instrument and can increase the volatility of the Funds’ returns. Volatility is a statistical measure of the dispersion of returns of an investment, where higher volatility generally indicates greater risk.
Upon entering into a futures contract (with the exception of futures contracts traded on the London Metal Exchange (“LME”)), and to maintain the Funds’ open positions in futures contracts, the Fund would be required to deposit with its custodian or futures broker in a segregated account in the name of the futures broker an amount of cash, U.S. government securities, suitable money market instruments, or other liquid securities, known as “initial margin.” The margin required for a particular futures contract is set by the exchange on which the contract is traded, and may be significantly modified from time to time by the exchange during the term of the contract. Futures contracts are customarily purchased and sold on margins that may range upward from less than 5% of the value of the contract being traded.
At October 31, 2021, the Strategic Income Fund had $270,329 in cash and cash equivalents on deposit with brokers for futures.
(c) Investment Transactions, Investment Income and Expenses
Investment transactions are accounted for on the trade date. Realized gains and losses on investments are determined on the identified cost basis. Dividend income is recorded net of applicable withholding taxes on the ex-dividend date and interest income is recorded on an accrual basis. Withholding taxes on foreign dividends, if applicable, are paid (a portion of which may be reclaimable) or provided for in accordance with the applicable country’s tax rules and rates and are disclosed in the Statements of Operations. Withholding tax reclaims are filed in certain countries to recover a portion of the amounts previously withheld. The Funds record a reclaim receivable based on a number of factors, including a jurisdiction’s legal obligation to pay reclaims as well as payment history and market convention. Discounts or premiums on debt securities are accreted or amortized to interest income over the lives of the respective securities using the effective interest method. Expenses incurred by the Trust with respect to more than one fund are allocated in proportion to the net assets of each fund except where allocation of direct expenses to each fund or an alternative allocation method can be more appropriately made.
(d) Federal Income Taxes
Each Fund intends to comply with the requirements of Subchapter M of the Internal Revenue Code applicable to regulated investment companies and to distribute substantially all of its net investment income and any net realized gains to its shareholders. Therefore, no provision is made for federal income or excise taxes. Due to the timing of dividend distributions and the differences in accounting for income and realized gains and losses for financial statement and federal income tax purposes, the fiscal year in which amounts are distributed may differ from the year in which the income and realized gains and losses are recorded by the Funds.
Accounting for Uncertainty in Income Taxes (the “Income Tax Statement”) requires an evaluation of tax positions taken (or expected to be taken) in the course of preparing a Fund’s tax returns to determine whether these positions meet a “more-likely-than-not” standard that, based on the technical merits, have a more than fifty percent likelihood of being sustained by a taxing authority upon examination. A tax position that meets the “more-likely-than-not” recognition threshold is measured to determine the amount of benefit to recognize in the financial statements. The Fund recognizes interest and penalties, if any, related to unrecognized tax benefits as income tax expense in the Statement of Operations.
North Square Funds
NOTES TO FINANCIAL STATEMENTS – Continued
October 31, 2021
The Income Tax Statement requires management of the Funds to analyze tax positions taken in the prior three open tax years, if any, and tax positions expected to be taken in the Funds’ current tax year, as defined by the IRS statute of limitations for all major jurisdictions, including federal tax authorities and certain state tax authorities. As of and during the open years ended October 31, 2018-2021 the Funds did not have a liability for any unrecognized tax benefits. The Funds have no examination in progress and are not aware of any tax positions for which it is reasonably possible that the total amounts of unrecognized tax benefits will significantly change in the next twelve months.
The Funds may utilize equalization accounting for tax purposes and designate earnings and profits, including net realized gains distributed to shareholders on redemption of shares, as part of the dividends paid deduction for income tax purposes.
(e) Distributions to Shareholders
The McKee Bond Fund and Strategic Income Fund will make distributions of net investment income monthly. The Advisory Research All Cap Value Fund and Altrinsic International Equity Fund will make distributions of net investment income, if any, at least annually. Each Fund makes distributions of its net capital gains, if any, at least annually. Distributions to shareholders are recorded on the ex-dividend date. The amount and timing of distributions are determined in accordance with federal income tax regulations, which may differ from GAAP.
The character of distributions made during the year from net investment income or net realized gains may differ from the characterization for federal income tax purposes due to differences in the recognition of income, expense and gain (loss) items for financial statement and tax purposes.
Note 3 – Investment Advisory and Other Agreements
The Trust, on behalf of the Funds, entered into an Investment Advisory Agreement (the “Agreement”) with North Square Investments, LLC (the “Advisor” or “NSI”). Under the terms of the Agreement, the Funds pay a monthly investment advisory fee to the Advisor based on each Fund’s average daily net assets. Fees paid to the Advisor for the period ended October 31, 2021 are reported on the Statements of Operations. The annual rates are listed by Fund in the below table:
| Fund | Investment Advisory Fees |
All Cap Value Fund | 0.70% |
International Equity Fund | 0.80% |
McKee Bond Fund | 0.24% |
Strategic Income Fund | 0.70% |
The Advisor engages Advisory Research, Inc. to manage the All Cap Value Fund, Altrinsic Global Advisors, LLC to manage the International Equity Fund, CSM Advisors, LLC to manage the McKee Bond Fund, and Red Cedar Investment Management, LLC to manage the Strategic Income Fund (each a “Sub Advisor” and collectively the “Sub Advisors”). The Advisor pays the Sub Advisors from its advisory fees.
The Advisor has contractually agreed to waive its fee and, if necessary, to absorb other operating expenses to ensure that total annual operating expenses (excluding taxes, leverage interest, brokerage commissions, dividend and interest expenses on short sales, acquired fund fees and expenses as determined in accordance with Form N-1A, expenses incurred in connection with any merger or reorganization, or extraordinary expenses such as litigation expenses) are limited. The agreements are effective until the dates listed below and may be terminated before those dates only by the Trust’s Board of Trustees. The table below contains the agreement expiration and expense cap by Fund and by Class:
| | | Total Limit on Annual Operating Expenses† |
| | | Class A | Class I | Class Y |
| Fund | Agreement Expires | Shares | Shares | Shares |
All Cap Value Fund | February 28, 2023 | — | 0.95% | — |
International Equity Fund | November 2, 2022 | — | 0.97% | — |
McKee Bond Fund | November 2, 2022 | — | 0.28% | 0.47% |
Strategic Income Fund | February 28, 2023 | 1.15%* | 0.90% | — |
† | The total limit on annual operating expenses is calculated based on each Fund’s average daily net assets. |
* | This class is currently not available for purchase. |
The Funds’ advisor is permitted to seek reimbursement from the Funds, subject to certain limitations, of fees waived or payments made to the Funds for a period ending thirty-six months after the date of the waiver or payment. This reimbursement may be requested from
North Square Funds
NOTES TO FINANCIAL STATEMENTS – Continued
October 31, 2021
the Funds if the reimbursement will not cause the Funds’ annual expense ratio to exceed the lesser of (a) the expense limitation amount in effect at the time such fees were waived or payments made, or (b) the expense limitation amount in effect at the time of the reimbursement. For the period ended October 31, 2021, the Strategic Income Fund recouped $12,161, and the McKee Bond Fund recouped $1 in the Class Y shares. The Advisor may recapture all or a portion of this amount no later than the dates stated below:
| | | All Cap Value | | International Equity | | McKee Bond – I | | | McKee Bond – Y | | | Strategic Income | |
October 31, 2022 | | $ | 75,274 | | | $ | — | | | $ | — | | | $ | — | | | $ | 92,526 | |
October 31, 2023 | | $ | 75,703 | | | $ | — | | | $ | — | | | $ | — | | | $ | 273,154 | |
October 31, 2024 | | $ | 41,637 | | | $ | 124,314 | | | $ | 245,194 | | | $ | 8 | | | $ | 296,122 | |
Total | | $ | 192,614 | | | $ | 124,314 | | | $ | 245,194 | | | $ | 8 | | | $ | 661,802 | |
U.S. Bancorp Fund Services, LLC, doing business as U.S. Bank Global Fund Services, serves as the Funds’ fund accountant, transfer agent and administrator. U.S. Bank, N.A., serves as the Funds’ custodian. The Funds’ allocated fees incurred for fund accounting, fund administration, transfer agency and custody services for the period ended October 31, 2021 are reported on the Statements of Operations.
Compass Distributors, LLC serves as the Funds’ distributor (the “Distributor”). The Distributor does not receive compensation from the Funds for its distribution services; the Advisor pays the Distributor a fee for its distribution related services.
Cipperman Compliance Services provides Chief Compliance Officer (“CCO”) services to the Funds. The Funds’ allocated fees incurred for CCO services for the period ended October 31, 2021 are reported on the Statements of Operations.
Note 4 – Federal Income Taxes
At October 31, 2021, gross unrealized appreciation and depreciation on investments, based on cost for federal income tax purposes were as follows:
| | | All Cap Value | | International Equity | | McKee Bond | | | Strategic Income | |
Cost of investments | | $ | 8,014,095 | | | $ | 42,645,206 | | | $ | 142,763,477 | | | $ | 74,414,691 | |
Gross unrealized appreciation | | $ | 2,233,840 | | | $ | 3,115,329 | | | $ | 186,310 | | | $ | 5,225,871 | |
Gross unrealized depreciation | | | (149,723 | ) | | | (1,526,399 | ) | | | (1,241,335 | ) | | | (426,500 | ) |
Net unrealized appreciation | | | | | | | | | | | | | | | | |
(depreciation) on investments | | $ | 2,084,117 | | | $ | 1,588,930 | | | $ | (1,055,025 | ) | | $ | 4,799,371 | |
The difference between cost amounts for financial statement and federal income tax purposes is due primarily to timing differences in recognizing certain gains and losses in security transactions.
GAAP requires that certain components of net assets be reclassified between financial and tax reporting. These reclassifications have no effect on net assets or net asset value per share. For the year ended October 31, 2021, permanent differences in book and tax accounting have been reclassified to paid in capital, accumulated net investment income/loss and accumulated net realized gain/loss (total distributable earnings) as follows:
| | | Increase (Decrease) | |
| | | | | | Total | |
| | | | | | Distributable | |
| | | Paid In Capital | | | Earnings | |
All Cap Value | | $ | 67,188 | | | $ | (67,188 | ) |
International Equity | | $ | — | | | $ | — | |
McKee Bond | | $ | (2,850 | ) | | $ | 2,850 | |
Strategic Income | | $ | 106,524 | | | $ | (106,524 | ) |
North Square Funds
NOTES TO FINANCIAL STATEMENTS – Continued
October 31, 2021
As of October 31, 2021, the components of accumulated earnings (deficit) on a tax basis for the Funds were as follows:
| | | All Cap Value | | International Equity |
Undistributed ordinary income | | $ | 84,780 | | | $ | 791,255 | |
Undistributed long-term gains | | | 633,842 | | | | — | |
Accumulated earnings | | $ | 718,622 | | | $ | 791,255 | |
Accumulated capital and other losses | | | — | | | | — | |
Unrealized appreciation (depreciation) on foreign currency | | | — | | | | (2,775 | ) |
Unrealized appreciation (depreciation) on investments | | | 2,084,117 | | | | 1,588,930 | |
Total accumulated earnings | | $ | 2,802,739 | | | $ | 2,377,410 | |
| | | | | | | | | |
| | | McKee Bond | | | Strategic Income | |
Undistributed ordinary income | | $ | — | | | $ | 1,249,065 | |
Undistributed long-term gains | | | — | | | | 530,784 | |
Accumulated earnings | | $ | — | | | $ | 1,779,849 | |
Accumulated capital and other losses | | | (345,632 | ) | | | — | |
Unrealized appreciation (depreciation) on foreign currency | | | — | | | | (44 | ) |
Unrealized appreciation (depreciation) on investments | | | (1,055,024 | ) | | | 4,799,371 | |
Total accumulated earnings | | $ | (1,400,656 | ) | | $ | 6,579,176 | |
The tax character of distributions paid during the fiscal years ending October 31, 2021 and October 31, 2020 were as follows:
| | | All Cap Value | | | International Equity | |
| | | October 31, | | | October 31, | | | October 31, | | | October 31, | |
Distributions paid from: | | 2021 | | | 2020 | | | 2021 | | | 2020 | |
Ordinary income | | $ | 47,928 | | | $ | 137,582 | | | $ | 22,954 | | | $ | — | |
Net long-term capital gains | | | 466,559 | | | | 872,424 | | | | — | | | | — | |
Total distributions paid | | $ | 514,487 | | | $ | 1,010,006 | | | $ | 22,954 | | | $ | — | |
| | | | | | | |
| | | McKee Bond | | | Strategic Income | |
| | | October 31, | | | October 31, | | | October 31, | | | October 31, | |
Distributions paid from: | | 2021 | | | 2020 | | | 2021 | | | 2020 | |
Ordinary income | | $ | 472,848 | | | $ | — | | | $ | 5,252,612 | | | $ | 975,490 | |
Net long-term capital gains | | | — | | | | — | | | | 251,905 | | | | — | |
Total distributions paid | | $ | 472,848 | | | $ | — | | | $ | 5,504,517 | | | $ | 975,490 | |
As of October 31, 2021, the McKee Bond Fund has $345,632 short-term capital loss carryforwards.
To the extent that a Fund may realize future net capital gains, those gains will be offset by any of its unused capital loss carryforward. Future capital loss carryover utilization in any given year may be subject to Internal Revenue Code limitations.
Note 5 – Investment Transactions
For the year ended October 31, 2021, purchases and sales of investments were as follows:
| | | Purchases | | | Sales | |
All Cap Value Fund | | $ | 6,212,902 | | | $ | 2,645,288 | |
International Equity Fund | | $ | 47,236,306 | | | $ | 6,596,794 | |
McKee Bond Fund | | $ | 157,719,077 | | | $ | 105,961,455 | |
Strategic Income Fund | | $ | 55,771,429 | | | $ | 55,057,794 | |
Note 6 – Shareholder Servicing Plan
The Trust, on behalf of the Funds, has adopted a Shareholder Servicing Plan to pay a fee at an annual rate of up to 0.15% of each Fund’s average daily net assets of shares serviced by shareholder servicing agents who provide administrative and support services to their customers.
For the period ended October 31, 2021, shareholder servicing fees incurred are disclosed on the Statements of Operations.
North Square Funds
NOTES TO FINANCIAL STATEMENTS – Continued
October 31, 2021
Note 7 – Indemnifications
In the normal course of business, the Funds enter into contracts that contain a variety of representations which provide general indemnifications. The Funds’ maximum exposure under these arrangements is unknown, as this would involve future claims that may be made against the Funds that have not yet occurred. However, the Funds expect the risk of loss to be remote.
Note 8 – Fair Value Measurements and Disclosure
Fair Value Measurements and Disclosures defines fair value, establishes a framework for measuring fair value in accordance with GAAP, and expands disclosure about fair value measurements. It also provides guidance on determining when there has been a significant decrease in the volume and level of activity for an asset or a liability, when a transaction is not orderly, and how that information must be incorporated into a fair value measurement.
Under Fair Value Measurements and Disclosures, various inputs are used in determining the value of the Funds’ investments. These inputs are summarized into three broad Levels as described below:
| | • | Level 1 – Unadjusted quoted prices in active markets for identical assets or liabilities that the Fund has the ability to access. |
| | | |
| | • | Level 2 – Observable inputs other than quoted prices included in Level 1 that are observable for the asset or liability, either directly or indirectly. These inputs may include quoted prices for the identical instrument on an inactive market, prices for similar instruments, interest rates, prepayment speeds, credit risk, yield curves, default rates and similar data. |
| | | |
| | • | Level 3 – Unobservable inputs for the asset or liability, to the extent relevant observable inputs are not available, representing the Fund’s own assumptions about the assumptions a market participant would use in valuing the asset or liability, and would be based on the best information available. |
Futures contracts are carried at fair value using the primary exchange’s closing (settlement) price and are generally categorized in Level 1.
The availability of observable inputs can vary from security to security and is affected by a wide variety of factors, including for example, the type of security, whether the security is new and not yet established in the marketplace, the liquidity of markets, and other characteristics particular to the security. To the extent that valuation is based on models or inputs that are less observable or unobservable in the market, the determination of fair value requires more judgment. Accordingly, the degree of judgment exercised in determining fair value is greatest for instruments categorized in Level 3.
The inputs to measure fair value may fall into different Levels of the fair value hierarchy. In such cases, for disclosure purposes, the Level in the fair value hierarchy within which the fair value measurement falls in its entirety, is determined based on the lowest Level input that is significant to the fair value measurement in its entirety.
North Square Funds
NOTES TO FINANCIAL STATEMENTS – Continued
October 31, 2021
The inputs or methodology used for valuing securities are not an indication of the risk associated with investing in those securities. The following is a summary of the inputs used, as of October 31, 2021, in valuing the Funds’ assets carried at fair value:
| All Cap Value Fund | | Level 1 | | | Level 2* | | | Level 3** | | | Total | |
| Investments | | | | | | | | | | | | |
Common Stocks1 | | $ | 9,771,402 | | | $ | — | | | $ | — | | | $ | 9,771,402 | |
Short-Term Investment | | | 326,810 | | | | — | | | | — | | | | 326,810 | |
Total Investments | | $ | 10,098,212 | | | $ | — | | | $ | — | | | $ | 10,098,212 | |
| | | | | | | | | | | | | | | | | |
| International Equity Fund | | Level 1 | | | Level 2* | | | Level 3** | | | Total | |
| Investments | | | | | | | | | | | | | | | | |
Common Stocks | | | | | | | | | | | | | | | | |
Bermuda | | $ | 1,078,497 | | | $ | — | | | $ | — | | | $ | 1,078,497 | |
Canada | | | 709,636 | | | | — | | | | — | | | | 709,636 | |
China | | | 1,931,211 | | | | — | | | | — | | | | 1,931,211 | |
France | | | 5,359,148 | | | | — | | | | — | | | | 5,359,148 | |
Germany | | | 3,327,452 | | | | — | | | | — | | | | 3,327,452 | |
Ireland | | | 1,903,160 | | | | — | | | | — | | | | 1,903,160 | |
Israel | | | 1,047,816 | | | | — | | | | — | | | | 1,047,816 | |
Japan | | | 6,171,029 | | | | — | | | | — | | | | 6,171,029 | |
Mexico | | | 54,741 | | | | — | | | | — | | | | 54,741 | |
Netherlands | | | 3,412,730 | | | | — | | | | — | | | | 3,412,730 | |
Republic of Korea | | | 1,263,218 | | | | — | | | | — | | | | 1,263,218 | |
Singapore | | | 763,999 | | | | — | | | | — | | | | 763,999 | |
Spain | | | 448,014 | | | | — | | | | — | | | | 448,014 | |
Sweden | | | 681,039 | | | | — | | | | — | | | | 681,039 | |
Switzerland | | | 6,702,647 | | | | — | | | | — | | | | 6,702,647 | |
United Kingdom | | | 6,530,616 | | | | — | | | | — | | | | 6,530,616 | |
United States | | | 600,120 | | | | — | | | | — | | | | 600,120 | |
Preferred Stock | | | | | | | | | | | | | | | | |
Germany | | | 698,348 | | | | — | | | | — | | | | 698,348 | |
Short-Term Investment | | | 1,550,715 | | | | — | | | | — | | | | 1,550,715 | |
Total Investments | | $ | 44,234,136 | | | $ | — | | | $ | — | | | $ | 44,234,136 | |
| | | | | | | | | | | | | | | | | |
| McKee Bond Fund | | Level 1 | | | Level 2 | | | Level 3 | | | Total | |
| Investments | | | | | | | | | | | | | | | | |
Asset Backed Securities | | $ | — | | | $ | 11,314,252 | | | $ | — | | | $ | 11,314,252 | |
Corporate Bonds1 | | | — | | | | 39,204,892 | | | | — | | | | 39,204,892 | |
Mortgage Backed Securities | | | — | | | | 46,329,255 | | | | 597,433 | | | | 46,926,688 | |
U.S. Government Agency Issue | | | — | | | | 6,450,282 | | | | — | | | | 6,450,282 | |
U.S. Government Notes/Bonds | | | — | | | | 28,527,954 | | | | — | | | | 28,527,954 | |
Foreign Government Agency Issue | | | — | | | | 233,535 | | | | — | | | | 233,535 | |
Foreign Government Bond | | | — | | | | 432,111 | | | | — | | | | 432,111 | |
Certificates of Deposit | | | — | | | | 5,446,929 | | | | — | | | | 5,446,929 | |
Short-Term Investment | | | 3,171,809 | | | | — | | | | — | | | | 3,171,809 | |
Total Investments | | $ | 3,171,809 | | | $ | 137,939,210 | | | $ | 597,433 | | | $ | 141,708,452 | |
| 1 | For a detailed break-out of these securities by major sector and industry classification, please refer to the Schedule of Investments. |
| * | The Fund did not hold any Level 2 securities at period end. |
| ** | The Fund did not hold any Level 3 securities at period end. |
North Square Funds
NOTES TO FINANCIAL STATEMENTS – Continued
October 31, 2021
| Strategic Income Fund | | Level 1 | | | Level 2 | | | Level 3 | | | Total | |
| Investments | | | | | | | | | | | | |
Common Stocks1 | | $ | 7,711,469 | | | $ | — | | | $ | — | | | $ | 7,711,469 | |
Preferred Stocks1 | | | 4,431,042 | | | | — | | | | — | | | | 4,431,042 | |
Purchased Option | | | 843,750 | | | | — | | | | — | | | | 843,750 | |
REITs | | | 4,742,993 | | | | — | | | | — | | | | 4,742,993 | |
Asset Backed Securities | | | — | | | | 1,186,583 | | | | 655,358 | | | | 1,841,941 | |
Corporate Bonds1 | | | — | | | | 48,276,531 | | | | — | | | | 48,276,531 | |
Foreign Government Notes/Bonds | | | — | | | | 1,414,019 | | | | — | | | | 1,414,019 | |
Mortgage Backed Securities | | | — | | | | 6,253,405 | | | | — | | | | 6,253,405 | |
Short-Term Investment | | | 3,752,009 | | | | — | | | | — | | | | 3,752,009 | |
Total Investments | | $ | 21,481,263 | | | $ | 57,130,538 | | | $ | 655,358 | | | $ | 79,267,159 | |
Written Options | | $ | (3,850 | ) | | $ | (49,247 | ) | | $ | — | | | $ | (53,097 | ) |
Total Written Options | | $ | (3,850 | ) | | $ | (49,247 | ) | | $ | — | | | $ | (53,097 | ) |
Futures Contracts*** | | | | | | | | | | | | | | | | |
Long | | $ | (766 | ) | | $ | — | | | $ | — | | | $ | (766 | ) |
Short | | | (323,319 | ) | | | — | | | | — | | | | (323,319 | ) |
Total Futures Contracts | | $ | (324,085 | ) | | $ | — | | | $ | — | | | $ | (324,085 | ) |
1 | | For a detailed break-out of these securities by major sector and industry classification, please refer to the Schedule of Investments. |
| * | | The Fund did not hold any Level 2 securities at period end. |
| ** | | The Fund did not hold any Level 3 securities at period end. |
| *** | | The fair value of the Fund’s futures contracts represents the net unrealized appreciation (depreciation) at period end. |
The following is a reconciliation of assets in which significant unobservable inputs (Level 3) were used in determining value:
| | | McKee Bond Fund | | | Strategic Income Fund | |
Beginning balance* | | $ | — | | | $ | — | |
Transfers into Level 3 during the period | | | — | | | | — | |
Transfers out of Level 3 during the period | | | — | | | | — | |
Total realized gain (loss) | | | — | | | | — | |
Total unrealized appreciation (depreciation) | | | — | | | | 358 | |
Net purchases | | | 597,433 | | | | 655,000 | |
Net sales | | | — | | | | — | |
Balance as of October 31, 2021 | | $ | 597,433 | | | $ | 655,358 | |
| * | The beginning balance for the McKee Bond Fund is the inception date of the Fund, December 28, 2020. The beginning balance for the Strategic Income Fund is the beginning of the fiscal year, November 1, 2020. |
Note 9 – Derivative and Other Financial Instruments
At October 31, 2021, the North Square Strategic Income Fund held derivative and other financial instruments which are not subject to a master netting arrangement. As the tables below illustrate, no positions are netted in the Fund’s financial statements:
| Liabilities: | | | | | | | | | | | | | | | | | | |
| | | | | | | | | | | | Gross Amounts not | | | | |
| | | | | | | | | | | | offset in the Statement | | | | |
| | | | | | Gross Amounts | | | Net Amounts | | | of Assets and Liabilities | | | | |
| | | Gross Amounts | | | Offset in the | | | Presented in the | | | | | | Collateral | | | | |
| | | of Recognized | | | Statement of Assets | | | Statement of Assets | | | Financial | | | Received | | | | |
| Description | | Liabilities | | | and Liabilities | | | and Liabilities | | | Instruments | | | (Pledged) | | | Net Amount | |
Futures contracts* | | $ | 53,756 | | | $ | — | | | $ | 53,756 | | | $ | — | | | $ | (53,756 | ) | | $ | — | |
Written option contracts | | | 53,097 | | | | — | | | | 53,097 | | | | 53,097 | | | | — | | | | — | |
| | | 106,853 | | | | | | | | | | | | |
| | | (53,756 | )
| | | — | |
Total | | $ | 106,853 | | | $ | — | | | $ | 106,853 | | | $ | 53,097 | | | $ | (53,756 | ) | | $ | — | |
| * | Reflects the current day variation margin as reported on the Fund’s statement of assets and liabilities. |
North Square Funds
NOTES TO FINANCIAL STATEMENTS – Continued
October 31, 2021
The following table presents the fair value of derivative instruments for the North Square Strategic Income Fund as of October 31, 2021 as presented on the Fund’s statement of assets and liabilities:
| | | | | | | | | Net Unrealized | |
| | | Fair Value | | | Gain (Loss) on | |
| Derivatives Not Accounted for as Hedging Instruments | | Assets | | | Liabilities | | | Open Positions | |
| North Square Strategic Income Fund | | | | | | | | | |
Futures Contracts* | | | | | | | | | |
Long Contracts | | | | | | | | | |
Interest Rate | | $ | — | | | $ | 766 | | | $ | (766 | ) |
| | | | | | | | | | | | | |
Total Long Contracts | | | — | | | | 766 | | | | (766 | ) |
Short Contracts | | | | | | | | | | | | |
Equity | | $ | — | | | $ | 410,371 | | | $ | (410,371 | ) |
Interest Rate | | | 87,052 | | | | — | | | | 87,052 | |
Total Short Contracts | | | 87,052 | | | | 410,371 | | | | (323,319 | ) |
Total Futures Contracts | | $ | 87,052 | | | $ | 411,137 | | | $ | (324,085 | ) |
| | | | | | | | | | | | | |
Option Contracts | | | | | | | | | | | | |
Purchased Option Contracts | | $ | 843,750 | | | $ | — | | | $ | 219,554 | |
Written Option Contracts | | | — | | | | 53,097 | | | | (18,748 | ) |
Total Option Contracts | | $ | 843,750 | | | $ | 53,097 | | | $ | 200,806 | |
| * | Reflects the cumulative unrealized appreciation (depreciation) of futures contracts as reported in the Fund’s schedule of open futures contracts. Only the current day variation margin for futures contracts is separately reported within the Fund’s statement of assets and liabilities. |
The following table presents the results of the derivative trading and information related to volume for the year ended October 31, 2021 for the North Square Strategic Income Fund. The below captions of “Net Realized” and “Net Change in Unrealized” correspond to the captions in the Fund’s statement of operations.
| | | Gain (Loss) from Trading | |
| | | | | | Net Change | |
| Fund and Type of Derivative Instrument | | Net Realized | | | in Unrealized | |
| North Square Strategic Income Fund | | | | | | |
Futures Contracts | | | | | | |
Equity | | $ | 327,820 | | | $ | (410,370 | ) |
Interest rate | | | (104,961 | ) | | | 86,286 | |
Total Futures Contracts | | $ | 222,859 | | | $ | (324,084 | ) |
Option Contracts | | | | | | | | |
Purchased Option Contracts* | | $ | (260,022 | ) | | $ | 219,554 | |
Written Option Contracts | | | 14,513 | | | | (18,748 | ) |
Total Option Contracts | | $ | (245,509 | ) | | $ | 200,806 | |
| * | Purchased options are included in the net realized gain (loss) on investments and net change in unrealized appreciation (depreciation) on investments. |
The average monthly notional amount is shown as an indicator of volume. The average monthly notional amounts held in the Strategic Income Fund during the year ended October 31, 2021 were:
| | | Average Notional | |
| | | Long | | | Short | |
Futures contracts | | $ | 589,573 | | | $ | 8,211,001 | |
Option contracts | | | 245,066 | | | | 525,976 | |
Please refer to the Fund's prospectus for a full listing of risks associated with these investments.
North Square Funds
NOTES TO FINANCIAL STATEMENTS – Continued
October 31, 2021
Note 10 – Accounting Regulations
Rule 18f-4
In October 2020, the SEC adopted new regulations governing the use of derivatives by registered investment companies (“Rule 18f-4”). Rule 18f-4 will impose limits on the amount of derivatives a Fund can enter into, eliminate the asset segregation framework currently used by funds to comply with Section 18 of the 1940 Act, and require funds whose use of derivatives is greater than a limited specified amount to establish and maintain a comprehensive derivatives risk management program and appoint a derivatives risk manager. Funds will be required to comply with Rule 18f-4 by August 19, 2022. It is not currently clear what impact, if any, Rule 18f-4 will have on the availability, liquidity or performance of derivatives. Management is currently evaluating the potential impact of Rule 18f-4 on the Fund(s). When fully implemented, Rule 18f-4 may require changes in how a Fund uses derivatives, adversely affect the Fund’s performance and increase costs related to the Fund’s use of derivatives.
Rule 2a-5
In December 2020, the SEC adopted a new rule providing a framework for fund valuation practices (“Rule 2a-5”). Rule 2a-5 establishes requirements for determining fair value in good faith for purposes of the 1940 Act. Rule 2a-5 will permit fund boards to designate certain parties to perform fair value determinations, subject to board oversight and certain other conditions. Rule 2a-5 also defines when market quotations are “readily available” for purposes of the 1940 Act and the threshold for determining whether a fund must fair value a security. In connection with Rule 2a-5, the SEC also adopted related recordkeeping requirements and is rescinding previously issued guidance, including with respect to the role of a board in determining fair value and the accounting and auditing of fund investments. The Funds will be required to comply with the rules by September 8, 2022. Management is currently assessing the potential impact of the new rules on the Funds’ financial statements.
Rule 12d1-4
The SEC adopted new Rule 12d1-4, which will allow registered investment companies (including business development companies (“BDCs”), unit investment trusts (“UITs”), closed-end funds, exchange-traded funds (“ETFs”), and exchange-traded managed funds (“ETMFs”) (an “acquiring” fund), to invest in other investment companies (an “acquired fund”), including private funds under a specific exception, beyond the limits of Section 12(d)(1), subject to the conditions of the rule. Rule 12d1-4 became effective January 19, 2021.
London Interbank Offered Rate (“LIBOR”)
In March 2020, FASB issued ASU 2020-04, Reference Rate Reform: Facilitation of the Effects of Reference Rate Reform on Financial Reporting. The main objective of the new guidance is to provide relief to companies that will be impacted by the expected change in benchmark interest rates at the end of 2021, when participating banks will no longer be required to submit London Interbank Offered Rate (“LIBOR”) quotes by the UK Financial Conduct Authority. The new guidance allows companies to, provided the only change to existing contracts are a change to an approved benchmark interest rate, account for modifications as a continuance of the existing contract without additional analysis. In addition, derivative contracts that qualified for hedge accounting prior to modification, will be allowed to continue to receive such treatment, even if critical terms change due to a change in the benchmark interest rate. For new and existing contracts, the Funds may elect to apply the amendments as of March 12, 2020 through December 31, 2022. Management is currently assessing the impact of the ASU’s adoption to the Funds’ financial statements and various filings.
Note 11 – Events Subsequent to the Fiscal Period End
The Funds have adopted financial reporting rules regarding subsequent events which require an entity to recognize in the financial statements the effects of all subsequent events that provide additional evidence about conditions that existed at the date of the balance sheet. Management has evaluated the Funds’ related events and transactions that occurred through the date of issuance of the Funds’ financial statements.
Effective on December 1, 2021, the outstanding Class Y shares of the McKee Bond Fund were renamed as Class I shares, and the previously outstanding Class I shares of the Fund were renamed as Class R6 shares. The ticker symbols of the renamed classes did not change. All references to Class Y shares in this report represent the new Class I shares, and all references to Class I shares in this report represent the new Class R6 shares. There were no charges imposed in connection with this renaming of share classes.
REPORT OF INDEPENDENT REGISTERED PUBLIC ACCOUNTING FIRM
To the Board of Trustees and
Shareholders of North Square Investments Trust
Opinion on the Financial Statements
We have audited the accompanying statements of assets and liabilities of the North Square Advisory Research All Cap Value Fund, North Square Altrinsic International Equity Fund, North Square McKee Bond Fund, and North Square Strategic Income Fund, (the “Funds”), each a series of North Square Investments Trust (the “Trust”), including the schedules of investments, as of October 31, 2021, the related statements of operations, the statements of changes in net assets, and the financial highlights for each of the periods indicated in the table below, and the related notes (collectively referred to as the “financial statements”). In our opinion, the financial statements and financial highlights referred to above present fairly, in all material respects, the financial position of the Funds as of October 31, 2021, the results of their operations, the changes in their net assets, and their financial highlights for the periods indicated in the table below, in conformity with accounting principles generally accepted in the United States of America.
| Individual Funds Constituting | Statement Of | Statements Of | |
North Square Investments Trust | Operations | Changes in Net Assets | Financial Highlights |
North Square Advisory Research | For the year ended | For each of the two years | For each of the five years |
All Cap Value Fund and North | October 31, 2021 | in the period ended | in the period ended |
Square Strategic Income Fund | | October 31, 2021 | October 31, 2021 |
| | | | |
North Square Altrinsic | For the period | For the period | For the period |
International Equity Fund | December 4, 2020 | December 4, 2020 | December 4, 2020 |
| | (commencement of operations) | (commencement of operations) | (commencement of |
| | through October 31, 2021 | through October 31, 2021 | operations) through |
| | | | October 31, 2021 |
| | | | |
North Square McKee Bond Fund | For the period | For the period | For the period |
| | December 28, 2020 | December 28, 2020 | December 28, 2020 |
| | (commencement of operations) | (commencement of operations) | (commencement of |
| | through October 31, 2021 | through October 31, 2021 | operations) through |
| | | | October 31, 2021 |
Basis for Opinion
These financial statements are the responsibility of the Funds’ management. Our responsibility is to express an opinion on the Funds’ financial statements based on our audits. We are a public accounting firm registered with the Public Company Accounting Oversight Board (United States) (“PCAOB”) and are required to be independent with respect to the Funds in accordance with the U.S. federal securities laws and the applicable rules and regulations of the Securities and Exchange Commission and the PCAOB. We have served as the auditor of one or more of the funds in the Trust since 2009.
We conducted our audits in accordance with the standards of the PCAOB. Those standards require that we plan and perform the audits to obtain reasonable assurance about whether the financial statements are free of material misstatement, whether due to error or fraud. The Funds are not required to have, nor were we engaged to perform, an audit of the Funds’ internal control over financial reporting. As part of our audits we are required to obtain an understanding of internal control over financial reporting, but not for the purpose of expressing an opinion on the effectiveness of the Funds’ internal control over financial reporting. Accordingly, we express no such opinion.
Our audits included performing procedures to assess the risks of material misstatement of the financial statements, whether due to error or fraud, and performing procedures that respond to those risks. Such procedures included examining, on a test basis, evidence regarding the amounts and disclosures in the financial statements. Our audits also included evaluating the accounting principles used and significant estimates made by management, as well as evaluating the overall presentation of the financial statements. Our procedures included confirmation of securities owned as of October 31, 2021 by correspondence with the custodian and brokers or by other appropriate auditing procedures where replies from broker were not received. We believe that our audits provide a reasonable basis for our opinion.
|  |
| |
| TAIT, WELLER & BAKER LLP |
Philadelphia, Pennsylvania
December 30, 2021
North Square Funds
SUPPLEMENTAL INFORMATION
Board Consideration of the Continuation of the Investment Advisory Agreement and Sub- Advisory Agreements and Approval of Sub-Advisory Agreement and Related Agreements
Section 15(c) of the Investment Company Act of 1940, as amended (the “1940 Act”), requires that each mutual fund’s board of trustees, including a majority of those trustees who are not “interested persons” of the fund, as defined in the 1940 Act (the “Independent Trustees”), initially approve, and annually review and consider the continuation of, the fund’s investment advisory and sub-advisory agreements. At a meeting held on September 22-23, 2021 (the “Meeting”), the Board of Trustees (the “Board”) of North Square Investments Trust (the “Trust”), including each of the Independent Trustees, unanimously voted to approve the continuation of: (i) the investment advisory agreement (the “Advisory Agreement”) between North Square Investments, LLC (the “Adviser”) and the Trust, on behalf of the North Square Strategic Income Fund and the North Square Advisory Research All Cap Value Fund (each, a “Fund” and collectively, the “Funds”); (ii) the investment sub-advisory agreement between the Adviser and Red Cedar Investment Management, LLC (“Red Cedar”) with respect to the North Square Strategic Income Fund; and (iii) the investment sub-advisory agreement between the Adviser and Advisory Research, Inc. (“Advisory Research” collectively with Red Cedar, the “Sub-Advisers”) with respect to the North Square Advisory Research All Cap Value Fund. The Adviser and the Sub-Advisers are collectively referred to as the “Advisers.” The investment sub-advisory agreements with the Sub-Advisers are collectively referred to as the “Sub-Advisory Agreements,” and the Advisory Agreement and the Sub- Advisory Agreements are collectively referred to as the “Agreements.”
In connection with its consideration of the Agreements proposed for continuation or approval, as applicable, the Board requested and reviewed responses from the Advisers to questions posed to the Advisers on behalf of the Independent Trustees and supporting materials relating to those questions and responses, as well as other information and data provided. In this capacity, the Board reviewed and discussed various information that had been provided prior to the Meeting, including the Advisory Agreement, the Sub-Advisory Agreements, memoranda provided by both legal counsel and independent trustee counsel summarizing the guidelines relevant to the Board’s consideration of the approvals of such Agreements, a memorandum and other information provided in response to Section 15(c) requests to the Adviser and Sub-Advisers by Independent Trustee Counsel on behalf of the Board (including, but not limited to, each of the Advisers’ Form ADV Part 1A, brochures and brochure supplements, profitability information, comparative information about the Funds’ performance for periods ended June 30, 2021, advisory fees and expense ratios, information about similar accounts managed by the Adviser, and other pertinent information. In addition, the Board considered such additional information as it deemed reasonably necessary, including information provided by the Adviser during the course of the year, to evaluate the Agreements, as applicable, with respect to each Fund. The Board considered the Adviser’s 15(c) responses and discussed various questions and information with representatives of the Advisers at the Meeting. The Board also considered the materials and presentations by Trust officers and representatives of the Advisers and Sub-Advisers provided at the Meeting concerning the Agreements. The Board, as noted above, also took into account information reviewed periodically throughout the year that was relevant to its consideration of the Agreements, including performance, advisory fee and other expense information and discussions with the Funds’ portfolio managers, as well as additional information it deemed relevant and appropriate in its judgement. Based on its evaluation of this information, the Board, including the Independent Trustees, unanimously approved the continuation or approval, as applicable, of the Agreements for the Funds for an additional one-year period.
In determining whether to approve the continuation or approval, as applicable, of the Agreements, the members of the Board reviewed and evaluated information and factors they believed to be relevant and appropriate in the exercise of their reasonable business judgment. While individual members of the Board may have weighed certain factors differently, the Board’s determination to approve the Agreements was based on a comprehensive consideration of all information provided to the Board with respect to the approval of the Agreements. The Board was also furnished with an analysis of its fiduciary obligations in connection with its evaluation of the Agreements and, throughout the evaluation process, the Board was assisted by Fund Counsel and Independent Trustee Counsel who, as noted above, each provided legal memoranda to the Board detailing the duties and responsibilities of the Board in connection with the various actions and approvals required in connection with the renewal of the Agreements. A more detailed summary of the important, but not necessarily all, factors the Board considered with respect to its renewal of the Agreements is provided below.
Nature, Extent and Quality of Services
The Board considered information regarding the nature, extent and quality of services being provided to the Funds by the Advisers. The Board considered, among other things, the terms of the Agreements and the range of services being provided by the Advisers. The Board noted the non-investment advisory services being provided by the Adviser, including the supervision and coordination of the Funds’ service providers and the provision of related administrative and other services. The Board considered each Adviser’s reputation, organizational structure, resources and overall financial strength (including economic and other support provided by affiliates of the Adviser), its willingness to consider and implement organizational and operational changes designed to enhance services to the Funds.
The Board also considered the Advisers’ professional personnel who provide or will provide services to the Funds, including each Adviser’s ability and experience in attracting and retaining qualified personnel to service the Funds. In addition, the Board considered
North Square Funds
SUPPLEMENTAL INFORMATION – Continued
the compliance programs and compliance records of the Advisers. In this regard, the Board considered the Advisor’s compliance programs. The Board noted the Advisers’ support of the Funds’ compliance control structure, including the resources that are devoted by the Advisers in support of the Funds’ obligations pursuant to Rule 38a-1 under the 1940 Act and the efforts of the Advisers to address cybersecurity risks and invest in business continuity planning, including the steps taken by the Adviser to address the challenges created by the Covid-19 pandemic.
With respect to the Adviser, the Board considered the Funds’ ongoing and proposed operation in a “manager-of-managers” structure and reviewed the responsibilities that the Adviser has under this structure, including, but not limited to, monitoring and evaluating the performance of the Sub-Advisers, monitoring the Sub-Advisers for adherence to the stated investment objectives, strategies, policies and restrictions of the Funds, and supervising the Sub-Advisers with respect to the services that the Sub-Advisers currently provide under the Sub-Advisory Agreements. In this regard, the Board evaluated information about the nature and extent of responsibilities retained and risks assumed by the Adviser and not delegated to or assumed by the Sub-Advisers. The Board also considered the process used by the Adviser, consistent with this structure, to identify and recommend sub-advisers, and its ability to monitor and oversee sub- advisers and recommend replacement sub-advisers, when necessary, and provide other services under the Advisory Agreement. The Board also considered the financial support provided by affiliates of the Adviser that enabled the Adviser to expand the NSI Funds Complex, including through the adoption of the Stadion Funds.
With respect to the Sub-Advisers, which provide certain day-to-day portfolio advisory services for the Funds, subject to oversight by the Adviser, the Board considered, among other things, the quality of each Sub-Adviser’s investment personnel, its investment philosophies and processes, its investment research capabilities and resources, its performance record, its experience, its trade execution capabilities and its approach to managing risk. The Board considered the experience of each Fund’s portfolio managers or anticipated portfolio managers, the number of accounts managed by the portfolio managers, and each Sub-Adviser’s method for compensating the portfolio managers. Moreover, the Board considered that the Advisor has oversight responsibility for conflicts of interest relating to the Funds.
After consideration of the foregoing factors, among others, the Board concluded that the nature, extent and quality of services being provided or to be provided by the Adviser and the Sub-Advisers, taken as a whole, remain appropriate and consistent with the terms of the Advisory Agreement and the Sub-Advisory Agreements, as applicable. In addition, the Board concluded that each Fund was likely to continue to benefit from services being provided or to be provided under each of the Agreements.
Fund Performance
The Board reviewed the performance of each Fund over different time periods presented in the materials. The Board noted, as applicable, that performance for certain longer time periods were the performance of Predecessor Funds that had similar investment objectives that were managed by the same Sub-Advisers prior to joining the Trust.
The Board considered various data and materials provided to the Board by the Advisers concerning Fund performance, as well as information from Morningstar Inc. (“Morningstar”), an independent provider of investment company data, comparing the investment performance of each Fund to its respective benchmark index, and to a universe of peer funds as determined by Morningstar (the “Universe”) and a more focused peer group of funds selected from the Universe by Morningstar (the “Peer Group”). The Board received a description of the methodology used by Morningstar to select the funds in each Fund’s Peer Group and Universe.
The Board received information at the Meeting, and throughout the year, concerning, and discussed factors contributing to, the performance of the Funds relative to their respective benchmarks and universes for the relevant periods. The Board evaluated the explanations for any relative underperformance of a Fund during these periods, including with respect to investment decisions and market and other factors that affected the Fund’s investment performance.
Based on these considerations, the Board concluded that it was satisfied that the Adviser and the Sub-Advisers continue to have or will have, as applicable, the capability of providing satisfactory investment performance for the Funds, as applicable.
Advisory Fees and Expenses
The Board reviewed and considered the advisory fee rate of each Fund that is being paid to the Adviser under the Advisory Agreement and each Fund’s total net expense ratio. The Board noted that each Fund’s total net expense ratio was as a result of the Adviser’s contractual agreement to limit each Funds’ total operating expenses to specified levels for a period of at least two years from the date of the initial prospectus for each Fund, which agreement has been continued. The Board also reviewed and considered the sub-advisory fee rates being paid by the Adviser to each Sub-Adviser for sub-advisory services.
The Board reviewed information from Morningstar comparing each Fund’s advisory fee rate and total expense ratio relative to a group of its peer funds. While the Board recognized that comparisons between a Fund and its peer funds may be imprecise, the comparative information provided by Morningstar assisted the Board in evaluating the reasonableness of each Fund’s fees and total expense ratio.
North Square Funds
SUPPLEMENTAL INFORMATION – Continued
The Board also received and considered information about the portion of the advisory fee that is being retained by the Adviser after payment of the fee to each Sub-Adviser for sub-advisory services. In assessing the reasonableness of this amount, the Board received and evaluated information about the nature and extent of responsibilities that are retained and risks that are assumed by Adviser and not delegated to or assumed by the Sub-Advisers, and about the Adviser’s on-going oversight services. The Board also considered that the sub-advisory fees being paid to each Sub-Adviser had been negotiated by the Adviser on an arm’s length basis.
The Board also received and considered information about the nature and extent of services offered and fee rates charged by the Adviser and the Sub-Advisers to other types of clients with investment strategies similar to those of the Funds. In this regard, the Board received information about the significantly greater scope of services, and compliance, reporting and other legal burdens and risks of managing proprietary mutual funds compared with those associated with managing assets of other types of clients, including non-mutual fund clients such as institutional separate accounts.
Based on its consideration of the factors and information it deemed relevant, including those described here, the Board concluded that the compensation payable to the Adviser under the Advisory Agreement and to the Sub-Advisers under the Sub-Advisory Agreements were reasonable.
Profitability
The Board received and considered information concerning the Adviser’s costs of sponsoring the Funds and the profitability to the Adviser from providing services to the Funds. The Board noted that the levels of profitability may be affected by numerous factors. The Board also received information relating to the operations and profitability to each Sub-Adviser from providing services to the Funds. The Board considered representations from the Adviser and each Sub-Adviser that the Sub-Adviser’s fees were negotiated at arm’s length on a Fund-by- Fund basis and that the sub-advisory fees are paid by the Adviser and not the Funds. Accordingly, the Board concluded that the profitability of each Sub-Adviser is a less relevant factor with respect to the Board’s consideration of the Sub-Advisory Agreements. In addition, the Board took note that each of the Funds remains in a relatively early stage of development, and accordingly, NSI enjoys limited or no profitability from the Funds at this time.
Based on its review, the Board did not deem the profits reported by the Advisers from services being provided to the Funds to be at a level that would prevent it from approving the Agreements.
Economies of Scale
The Board considered the potential for the Adviser to experience economies of scale in the provision of advisory services to each Fund as the Funds grew. The Board reviewed the breakpoints in the advisory fee schedule for each Fund, if any, which reduce fee rates as the Fund’s assets grow over time. The Board considered that in addition to advisory fee breakpoints, the Adviser may share potential economies of scale from its advisory business in a variety of ways, including through fee waiver and expense reimbursement arrangements, services that benefit shareholders, competitive advisory fee rates set at the outset without regard to breakpoints, and investments in the business intended to enhance services available to shareholders. The Board observed that each of the Funds remains in a relatively early stage of development.
The Board concluded that, especially in light of the current stage of development of the Funds, the Adviser’s arrangements with respect to the Funds constituted a reasonable approach to sharing potential economies of scale with the Funds and their shareholders.
“Fall-Out” Benefits
The Board received and considered information regarding potential “fall-out” or ancillary benefits that the Adviser and its affiliates may receive as a result of their relationships with the Funds. Ancillary benefits could include, among others, benefits directly attributable to other relationships with the Fund and benefits potentially derived from an increase in the Adviser’s business as a result of their relationships with the Fund. In addition, the Board considered the potential benefits, other than sub-advisory fees, that the Sub-Advisers and their affiliates may receive because of their relationships with the Funds, including the benefits of research services that may be available to the Sub-Adviser as a result of securities transactions effected for the Funds and other investment advisory clients, as well as other benefits from increases in assets under management.
Based on its consideration of the factors and information it deemed relevant, including those described here, the Board did not find that any ancillary benefits that may be received by the Advisers and their affiliates are unreasonable.
Conclusion
At the Meeting, after considering the above-described material factors and based on its deliberations and its evaluation of the information described above, and assisted by the advice of both Fund and independent legal counsel, the Board, including the Independent Trustees, concluded that the approval of the renewal and continuation of the Agreements are in the best interest of each Fund and its shareholders.
North Square Funds
SUPPLEMENTAL INFORMATION – Continued
Corporate Dividends Received Deduction
For corporate shareholders, the percent of ordinary income distributions qualifying for the corporate dividends received deduction for the fiscal year ended October 31, 2021 was as follows:
| All Cap Value Fund | | | | % | | International Equity Fund | | | | % |
| McKee Bond Fund | | | 0.00 | % | | Strategic Income Fund | | | | % |
Qualified Dividend Income
For the fiscal year ended October 31, 2021, certain dividends paid by the Funds may be subject to a maximum tax rate of 23.8%, as provided for by the Jobs and Growth Tax Relief Reconciliation Act of 2003. The percentage of dividends declared from ordinary income designated as qualified dividend income was as follows:
| All Cap Value Fund | | | 97.65 | % | | International Equity Fund | | | 77.16 | % |
| McKee Bond Fund | | | 0.00 | % | | Strategic Income Fund | | | 9.07 | % |
Long-Term Capital Gain Designation
For the fiscal year ended October 31, 2021, the Funds designate a portion of distributions as 20.00% rate gain distributions for the purposed of the dividends paid deduction. The dollar amount by fund was as follows:
| All Cap Value Fund | | $ | 466,559 | | International Equity Fund | | $ | — | |
| McKee Bond Fund | | $ | — | | Strategic Income Fund | | $ | 251,905 | |
Trustees and Officers Information
Additional information about the Trustees is included in each Fund’s Statement of Additional Information which is available, without charge, upon request by calling (855) 551-5521 or on the Funds’ website at www.northsquareinvest.com. The Trustees and officers of each Fund and their principal occupations during the past five years are as follows:
| | | | | Number of | |
| | | | | Portfolios | |
| | | | | in Fund | Other Directorship/ |
Name, Addressa, | | | | Complex | Trusteeship |
| Year of Birth and | | Term of Office | | Overseen | Positions held by |
| Position(s) with | Position with | and Length of | Principal Occupations During | by | Trustee During |
| the Trust | the Trust | Time Servedb | the Past Five Years or Longer | Trusteec | the Past 5 Years |
| Independent Trustees | | | | | |
David B. Boon | Trustee | 08/2018 to present | Chief Financial Officer and Managing | 9 | None |
(1960) | | | Director, Eagle Capital Management, LLC | | |
| | | | (since 2018); Chief Financial Officer and | | |
| | | | Partner, Cedar Capital, LLC (2013 – 2018). | | |
Donald J. Herrema | Chairman of the | 08/2018 to present | Vice Chair and Chief Investment Officer, | 9 | Chairman and Director |
(1952) | Board and Trustee | | Independent Life Insurance Company | | Emeritus, TD Funds |
| | | | (since 2018); Financial Services Executive, | | USA (2009 – 2019); |
| | | | Advisor and Founder of BlackSterling | | Director, Abel Noser |
| | | | Partners, LLC (private investments and | | Holdings, LLC (since |
| | | | advisory firm) (since 2004); Executive Vice | | 2016); Member, USC |
| | | | Chairman and Senior Advisor at Kennedy | | Marshall Business School |
| | | | Wilson (real estate investment company) | | Board (since 2010); |
| | | | (2009 – 2016). | | President and Trustee, |
| | | |
| | Christ Church |
| | | | | | (2008 – 2016); Director, |
| | | | | | Lepercq de Neuflize |
| | | | | | (2009 – 2016); Chairman |
| | | | | | and Trustee Emeritus |
| | | | | | (since 2014), Director, |
| | | | | | FEG Investment Advisors |
| | | | | | (since 2017); Director, |
| | | | | | Independent Life |
| | | | | | Insurance Company |
| | | | | | (since 2018). |
North Square Funds
SUPPLEMENTAL INFORMATION – Continued
| | | | | Number of | |
| | | | | Portfolios | |
| | | | | in Fund | Other Directorship/ |
Name, Addressa, | | | | Complex | Trusteeship |
| Year of Birth and | | Term of Office | | Overseen | Positions held by |
| Position(s) with | Position with | and Length of | Principal Occupations During | by | Trustee During |
| the Trust | the Trust | Time Servedb | the Past Five Years or Longer | Trusteec | the Past 5 Years |
Catherine A. Zaharis | Trustee | 08/2018 to present | Professor of Practice (since 2019), Director, | 9 | Director, The |
(1960) | | | Professional/Employer Development, | | Vantagepoint Funds |
| | | | Finance Department (2015 – 2019), Adjunct | | (2015 – 2016). |
| | | | Lecturer (2010 – 2019), and Business Director, | | |
| | | | MBA Finance Career Academy (2008 – 2015), | | |
| | | | University of Iowa, Tippie College of Business; | |
| | | | Chair (2013 – 2016), Director (1999 – 2016), | | |
| | | | and Investment Committee Member | | |
| | | | (1999 – 2013) and Chair (2003 – 2013), | | |
| | | | University of Iowa Foundation. | | |
Interested Trusteesd | | | | | |
Mark D. Goodwin | Trustee and | 08/2018 to present | Chief Executive Officer, North Square | 9 | None |
(1964) | President | | Investments LLC (since July 2018); President | | |
| | | | and Chief Operating Officer (2015 – July 2018) | |
| | | | and Executive Vice President (2014 – 2015), | | |
| | | | Oak Ridge Investments, LLC. | | |
| Officers of the Trust | | | | | |
Alan E. Molotsky | Treasurer | 08/2018 to present | Chief Financial Officer, Chief Compliance | N/A | N/A |
(1956) | and | | Officer (July 2018 – March 2021), General | | |
| | Secretary | | Counsel and Senior Managing Director, | | |
| | | | North Square Investments, LLC (since July 2018); |
| | | | Chief Financial Officer, Chief Compliance Officer, | |
| | | | General Counsel and Executive Vice President, | | |
| | | | Oak Ridge Investments LLC (2004 – July 2018). | |
David J. Gaspar | Vice | 08/2018 to present | Chief Operations and Information Officer and | N/A | N/A |
(1954) | President | | Senior Managing Director, North Square | | |
| | | | Investments, LLC (since July 2018); Chief | | |
| | | | Operations Officer, Chief Information Officer, | | |
| | | | Chief Information Security Officer and Executive | |
| | | | Vice President, Oak Ridge Investments, LLC | | |
| | | | (2000 – July 2018). | | |
Douglas N. Tyre | Chief | 09/2018 to present | Assistant Compliance Director, Cipperman | N/A | N/A |
(1980) | Compliance | | Compliance Services, LLC (since 2014). | | |
| | Officer | | | | |
| a. | The business address of each Trustee and officer is c/o North Square Investments, LLC, 10 South LaSalle Street, Suite 1925, Chicago, Illinois 60603. |
| b. | Trustees and officers serve until their successors are duly elected and qualified. |
| c. | The term “Fund Complex” applies to the twelve portfolios that currently comprise the Trust, which consists of the four Funds, the North Square Oak Ridge Small Cap Growth Fund, the North Square Oak Ridge All Cap Growth Fund, the North Square Oak Ridge Dividend Growth Fund, the North Square Multi Strategy Fund, the North Square Dynamic Small Cap Fund, the North Square Tactical Defensive Fund, the North Square Tactical Growth Fund, and the North Square Trilogy Alternative Return Fund. |
| d. | Mr. Goodwin is considered to be an “interested person” of the Trust as that term is defined in the 1940 Act by virtue of his positions with the Adviser. |
North Square Funds
SUPPLEMENTAL INFORMATION – Continued
Liquidity Risk Management Program
In accordance with Rule 22e-4 under the Investment Company Act of 1940, as amended (the “Liquidity Rule”), the North Square Investments Trust (the “Trust”) has adopted and implemented a liquidity risk management program (the “Program”) for the funds within the Trust (the “Funds”). The Program seeks to assess and manage each Funds’ liquidity risk. “Liquidity risk” is defined under the Liquidity Rule as the risk that each Fund is unable to meet redemption requests without significantly diluting remaining investors’ interests in the Fund. The Trust’s Board of Trustees (the “Board”) has approved the designation of the Funds’ investment adviser as the administrator for the Program (the “Trust Program Administrator”).
At its meeting on December 8-9, 2021, the Board received and reviewed a written report (the “Report”) from the Trust’s Vice President, on behalf of the Trust Program Administrator, concerning the operation of the Program for the period of October 1, 2020 through September 30, 2021 (the “Period”). The Report noted that the Program complied with the key factors for consideration under the Liquidity Rule for assessing, managing and periodically reviewing a Fund’s liquidity risk, including the following: (1) the periodic assessment (no less frequently than annually) of certain factors that influence each Fund’s liquidity risk; (2) the periodic classification (no less frequently than monthly) of the Fund’s investments into one of four liquidity categories that reflect an estimate of their liquidity under current market conditions; (3) a 15% limit on the acquisition of “illiquid investments” (as defined under the Liquidity Rule); (4) to the extent a Fund does not invest primarily in “highly liquid investments” (as defined under the Liquidity Rule), the determination of a minimum percentage of the Fund’s assets that generally will be invested in highly liquid investments (an “HLIM”); (5) if a Fund has established an HLIM, the periodic review (no less frequently than annually) of the HLIM and the adoption of policies and procedures for responding to a shortfall of the Fund’s highly liquid investments below its HLIM; and (6) periodic reporting to the Board.
The Report summarized the operation of the Program and the information and factors considered by the Trust Program Administrator in assessing whether the Program has been adequately and effectively implemented with respect to the Funds. The Report considered each Fund’s liquidity risk under both normal and reasonably foreseeable stressed market conditions using certain factors required by the Rule and the Program, to the extent deemed appropriate by the Trust Program Administrator. The Report stated that the Funds have retained ICE Data Services, a third-party vendor, to provide a liquidity risk classification specified by the Rule. The Report also noted that each Fund primarily held investments that were classified as highly liquid during the review period and that each Fund’s portfolio is expected to continue to primarily hold highly liquid investments. Thus, the Trust Program Administrator concluded in the Report that each Fund is considered a “primarily highly liquid fund” (as defined in the Rule and Program) and each Fund can therefore rely on the exclusion in the Rule from the requirements to establish an HLIM and to adopt policies and procedures for responding to a HLIM shortfall. There were no material changes to the Program during the Period.
Based on its review, the Report of the Trust Program Administrator concluded that the Program is reasonably designed to assess and manage liquidity risk and has been and continues to be adequately and effectively implemented to monitor and, as applicable, respond to each Funds’ liquidity developments.
North Square Funds
EXPENSE EXAMPLES
For the Six Months Ended October 31, 2021 (Unaudited)
Expense Examples
As a shareholder of the Funds, you incur two types of costs: (1) transaction costs, including redemption fees; and (2) ongoing costs, including management fees; and other Fund expenses. The examples below are intended to help you understand your ongoing costs (in dollars) of investing in the Funds and to compare these costs with the ongoing costs of investing in other mutual funds.
These examples are based on an investment of $1,000 invested at the beginning of the period and held for the entire six month period from May 1, 2021 to October 31, 2021.
Actual Expenses
The information in the row titled “Actual Performance” of the table below provides actual account values and actual expenses. You may use the information in these columns, together with the amount you invested, to estimate the expenses that you paid over the period. Simply divide your account value by $1,000 (for example, an $8,600 account value divided by $1,000 = 8.6), then multiply the result by the number in the appropriate row for your share class, in the column titled “Expenses Paid During Period” to estimate the expenses you paid on your account during this period.
Hypothetical Example for Comparison Purposes
The information in the row titled “Hypothetical (5% annual return before expenses)” of the table below provides hypothetical account values and hypothetical expenses based on each Fund’s actual expense ratios and an assumed rate of return of 5% per year before expenses, which is not the Fund’s actual return. The hypothetical account values and expenses may not be used to estimate the actual ending account balance or expenses you paid for the period. You may use this information to compare the ongoing costs of investing in the Fund and other funds. To do so, compare these 5% hypothetical examples with the 5% hypothetical examples that appear in the shareholder reports of the other funds.
Please note that the expenses shown in the table are meant to highlight your ongoing costs only and do not reflect any transaction costs, such as sales charges (loads) or redemption fees. Therefore, the information in the row titled “Hypothetical (5% annual return before expenses)” is useful in comparing ongoing costs only, and will not help you determine the relative total costs of owning different funds. In addition, if these transactional costs were included, your costs would have been higher.
| | | Beginning | Ending | Expense Paid |
| | | Account | Account | During |
| | | Value | Value | Period* |
| All Cap Value Fund | 5/1/21 | 10/31/21 | 5/1/21 – 10/31/21 |
Class I
| Actual Performance | $1,000.00 | $1,074.00 | $4.97 |
| | Hypothetical (5% annual return before expenses) | $1,000.00 | $1,020.42 | $4.84 |
| * | Expenses are equal to the Fund’s annualized expense ratios of 0.95% for Class I, multiplied by the average account value over the period, multiplied by 184/365 (to reflect the sixth month period). The expense ratios reflect an expense waiver. Assumes all dividends and distributions were reinvested. |
| | | Beginning | Ending | Expense Paid |
| | | Account | Account | During |
| | | Value | Value | Period* |
| International Equity Fund | 5/1/21 | 10/31/21 | 5/1/21 – 10/31/21 |
Class I | Actual Performance | $1,000.00 | $1,002.40 | $4.90 |
| | Hypothetical (5% annual return before expenses) | $1,000.00 | $1,020.32 | $4.94 |
| * | Expenses are equal to the Fund’s annualized expense ratios of 0.97% for Class I, multiplied by the average account value over the period, multiplied by 184/365 (to reflect the period since the commencement of operations). The expense ratios reflect an expense waiver. Assumes all dividends and distributions were reinvested. |
North Square Funds
EXPENSE EXAMPLES – Continued
For the Six Months Ended October 31, 2021 (Unaudited)
| | | Beginning | Ending | Expense Paid |
| | | Account | Account | During |
| | | Value | Value | Period* |
| McKee Bond Fund | 5/1/21 | 10/31/21 | 5/1/21 – 10/31/21 |
Class I | Actual Performance | $1,000.00 | $999.30 | $1.41 |
| | Hypothetical (5% annual return before expenses) | $1,000.00 | $1,023.79 | $1.43 |
| * | Expenses are equal to the Fund’s annualized expense ratios of 0.28% for Class I, multiplied by the average account value over the period, multiplied by 184/365 (to reflect the period since the commencement of operations). The expense ratios reflect an expense waiver. Assumes all dividends and distributions were reinvested. |
| | | Beginning | Ending | Expense Paid |
| | | Account | Account | During |
| | | Value | Value | Period** |
| McKee Bond Fund | 5/19/21* | 10/31/21 | 5/19/21* – 10/31/21 |
Class Y | Actual Performance | $1,000.00 | $998.80 | $2.12 |
| | Hypothetical (5% annual return before expenses) | $1,000.00 | $1,022.84 | $2.40 |
| * | | Commencement of operations. |
| ** | | Expenses are equal to the Fund’s annualized expense ratios of 0.47% for Class Y, multiplied by the average account value over the period, multiplied by 165/365 (to reflect the period since the commencement of operations). The expense ratios reflect an expense waiver. Assumes all dividends and distributions were reinvested. |
| | | Beginning | Ending | Expense Paid |
| | | Account | Account | During |
| | | Value | Value | Period* |
| Strategic Income Fund | 5/1/21 | 10/31/21 | 5/1/21 – 10/31/21 |
Class I | Actual Performance | $1,000.00 | $1,023.40 | $4.59 |
| | Hypothetical (5% annual return before expenses) | $1,000.00 | $1,020.67 | $4.58 |
| * | Expenses are equal to the Fund’s annualized expense ratios of 0.90% for Class I, multiplied by the average account value over the period, multiplied by 184/365 (to reflect the sixth month period). The expense ratios reflect an expense waiver. Assumes all dividends and distributions were reinvested. |
(This Page Intentionally Left Blank.)
North Square Funds
Advisor
North Square Investments, LLC
10 South LaSalle Street, Suite 1925
Chicago, Illinois 60603
| Sub-Advisor | Sub-Advisor |
| Advisory Research, Inc. | Red Cedar Investment Management, LLC |
| Two Prudential Plaza | 333 Bridge Street NW, Suite 601 |
| 180 N. Stetson Avenue, Suite 5500 | Grand Rapids, Michigan 49504 |
| Chicago, Illinois 60601 | |
| | |
| | |
| | |
| Sub-Advisor | Sub-Advisor |
| Altrinsic Global Advisors, LLC | CSM Advisors, LLC |
| 8 Sound Shore Drive, 3rd Floor | One Gateway Center, 8th Floor |
| Greenwich, Connecticut 06830 | Pittsburgh, Pennsylvania 15222 |
Independent Registered Public Accounting Firm
Tait, Weller & Baker LLP
50 South 16th Street, Suite 2900
Philadelphia, Pennsylvania 19102
Custodian
U.S. Bank, N.A.
1555 N. RiverCenter Drive, Suite 300
Milwaukee, Wisconsin 53212
Fund Administrator, Transfer Agent and Fund Accountant
U.S. Bank Global Fund Services
615 East Michigan Street
Milwaukee, Wisconsin 53202
Distributor
Compass Distributors LLC
Three Canal Plaza, Suite 100
Portland, Maine 04101
www.foreside.com
| FUND INFORMATION | | | |
| Fund Name |
| Ticker | CUSIP |
North Square Advisory Research All Cap Value Fund | Class I | ADVGX | 66263L775 |
North Square Altrinsic International Equity Fund | Class I | NSIVX | 66263L767 |
North Square McKee Bond Fund | Class I | NMKBX | 66263L759 |
North Square McKee Bond Fund | Class Y | NMKYX | 66263L643 |
North Square Strategic Income Fund | Class I | ADVNX | 66263L791 |
Privacy Principles of the North Square Funds for Shareholders
The Funds are committed to maintaining the privacy of their shareholders and to safeguarding their non-public personal information. The following information is provided to help you understand what personal information the Funds collect, how we protect that information and why, in certain cases, we may share information with select other parties.
Generally, the Funds do not receive any non-public personal information relating to their shareholders, although certain non-public personal information of their shareholders may become available to the Funds. The Funds do not disclose any non-public personal information about their shareholders or former shareholders to anyone, except as permitted by law or as is necessary in order to service shareholder accounts (for example, to a transfer agent or third party administrator).
This report is sent to shareholders of the North Square Funds for their information. It is not a Prospectus, circular or representation intended for use in the purchase or sale of shares of the Funds or of any securities mentioned in this report.
Proxy Voting Policies and Procedures
A description of the Funds’ proxy voting policies and procedures related to portfolio securities is available without charge, upon request, by calling the Funds at (855) 551-5521 or on the U.S. Securities and Exchange Commission’s (“SEC”) website at www.sec.gov.
Proxy Voting Record
Information regarding how the Funds voted proxies for portfolio securities, if applicable, during the most recent 12-month period ended June 30, is also available, without charge and upon request by calling (855) 551-5521 or by accessing the Funds’ Form N-PX on the SEC’s website at www.sec.gov.
Portfolio Holdings Disclosure
The Funds file a complete schedule of portfolio holdings with the U.S. Securities and Exchange Commission (the “SEC”) for the first and third quarters of each fiscal year on Form N-Q or Part F of Form N-PORT (beginning with filings after March 31, 2020). The Funds’ Forms N-Q or Part F of Form N-PORT are available on the SEC’s website at www.sec.gov and may be reviewed and copied at the SEC’s Public Reference Room in Washington, D.C. Information on the operation of the Public Reference Room may be obtained by calling (800) 732-0330. The Funds’ Forms N-Q or Part F of Form N-PORT may also be obtained by calling toll-free (855) 551-5521 or by visiting the Funds’ website at www.northsquareinvest.com/fund-reports-holdings.
Householding
The Funds will mail only one copy of shareholder documents, including prospectuses, annual and semi-annual reports and proxy statements, to shareholders with multiple accounts at the same address. This practice is commonly called “householding” and is intended to reduce expenses and eliminate duplicate mailings of shareholder documents. Mailings of your shareholder documents may be householded indefinitely unless you instruct us otherwise. If you do not want the mailing of these documents to be combined with those for other members of your household, please call the Funds at (855) 551-5521.
North Square Funds
c/o U.S. Bancorp Fund Services, LLC
P.O. Box 701
Milwaukee, Wisconsin 53201
1-855-551-5521
Item 2. Code of Ethics.
The Registrant has adopted a code of ethics that applies to the Registrant’s principal executive officer and principal financial officer. The Registrant has not made any substantive amendments to its code of ethics during the period covered by this report. The Registrant has not granted any waivers from any provisions of the code of ethics during the period covered by this report.
A copy of the Registrant’s Code of Ethics is filed herewith.
Item 3. Audit Committee Financial Expert.
The Registrant’s Board of Directors has determined that there is at least one audit committee financial expert serving on its audit committee. David B. Boon is the “audit committee financial expert” and is considered to be “independent” as each term is defined in Item 3 of Form N‑CSR.
Item 4. Principal Accountant Fees and Services.
The Registrant has engaged its principal accountant to perform audit services, audit-related services, tax services and other services during the past two fiscal years. “Audit services” refer to performing an audit of the Registrant's annual financial statements or services that are normally provided by the accountant in connection with statutory and regulatory filings or engagements for those fiscal years. “Audit-related services” refer to the assurance and related services by the principal accountant that are reasonably related to the performance of the audit. “Tax services” refer to professional services rendered by the principal accountant for tax compliance, tax advice, and tax planning. The following table details the aggregate fees billed or expected to be billed for each of the last two fiscal years for audit fees, audit-related fees, tax fees and other fees by the principal accountant.
| | FYE 10/31/2021 | FYE 10/31/2020 |
| Audit Fees | $35,240 | $14,300 |
| Audit-Related Fees | $0 | $0 |
| Tax Fees | $10,000 | $5,600 |
| All Other Fees | $0 | $0 |
The Audit Committee has adopted pre-approval policies and procedures that require the audit committee to pre‑approve all audit and non‑audit services of the Registrant, including services provided to any entity affiliated with the Registrant.
The percentage of fees billed by Tait, Weller & Baker LLP applicable to non-audit services pursuant to waiver of pre-approval requirement were as follows:
| | FYE 10/31/2021 | FYE 10/31/2020 |
Audit-Related Fees | 0% | 0% |
Tax Fees | 0% | 0% |
All Other Fees | 0% | 0% |
All of the principal accountant’s hours spent on auditing the Registrant’s financial statements were attributed to work performed by full‑time permanent employees of the principal accountant.
The Registrant has not been identified by the U.S. Securities and Exchange Commission as having filed an annual report issued by a registered public accounting firm branch or office that is located in a foreign jurisdiction where the Public Company Accounting Oversight Board is unable to inspect or completely investigate because of a position taken by an authority in that jurisdiction.
The Registrant is not a foreign issuer.
Item 5. Audit Committee of Listed Registrants.
Not applicable to Registrants who are not listed issuers (as defined in Rule 10A-3 under the Securities Exchange Act of 1934).
Item 6. Investments.
| (a) | Schedule of Investments is included as part of the report to shareholders filed under Item 1 of this Form. |
Item 7. Disclosure of Proxy Voting Policies and Procedures for Closed-End Management Investment Companies.
Not applicable to open-end investment companies.
Item 8. Portfolio Managers of Closed-End Management Investment Companies.
Not applicable to open-end investment companies.
Item 9. Purchases of Equity Securities by Closed‑End Management Investment Company and Affiliated Purchasers.
Not applicable to open-end investment companies.
Item 10. Submission of Matters to a Vote of Security Holders.
There have been no material changes to the procedures by which shareholders may recommend nominees to the Registrant’s Board of Directors.
Item 11. Controls and Procedures.
| (a) | The Registrant’s President and Treasurer have reviewed the Registrant's disclosure controls and procedures (as defined in Rule 30a-3(c) under the Investment Company Act of 1940 (the “Act”)) as of a date within 90 days of the filing of this report, as required by Rule 30a-3(b) under the Act and Rules 13a-15(b) or 15d‑15(b) under the Securities Exchange Act of 1934. Based on their review, such officers have concluded that the disclosure controls and procedures are effective in ensuring that information required to be disclosed in this report is appropriately recorded, processed, summarized and reported and made known to them by others within the Registrant and by the Registrant’s service provider. |
| (b) | There were no changes in the Registrant's internal control over financial reporting (as defined in Rule 30a-3(d) under the Act) that occurred during the period covered by this report that have materially affected, or are reasonably likely to materially affect, the Registrant's internal control over financial reporting. |
Item 12. Disclosure of Securities Lending Activities for Closed-End Management Investment Companies
Not applicable to open-end investment companies.
Item 13. Exhibits.
(3) Not applicable to open-end investment companies.
| (4) | Change in the Registrant’s independent public accountant. There was no change in the Registrant’s independent public accountant for the period covered by this report. |
SIGNATURES
Pursuant to the requirements of the Securities Exchange Act of 1934 and the Investment Company Act of 1940, the Registrant has duly caused this report to be signed on its behalf by the undersigned, thereunto duly authorized.
North Square Investments Trust
By: /s/ Mark D. Goodwin
Mark D. Goodwin,
President
Date: January 10, 2022
Pursuant to the requirements of the Securities Exchange Act of 1934 and the Investment Company Act of 1940, this report has been signed below by the following persons on behalf of the Registrant and in the capacities and on the dates indicated.
By: /s/ Mark D. Goodwin
Mark D. Goodwin,
President
Date: January 10, 2022
By: /s/ Alan E. Molotsky
Alan E. Molotsky,
Treasurer