UNITED STATES
SECURITIES AND EXCHANGE COMMISSION
Washington, D.C. 20549
SECURITIES AND EXCHANGE COMMISSION
Washington, D.C. 20549
FORM N-CSR
CERTIFIED SHAREHOLDER REPORT OF REGISTERED
MANAGEMENT INVESTMENT COMPANIES
Investment Company Act file number 811- 23373
NORTH SQUARE INVESTMENTS TRUST
(Exact name of Registrant as specified in charter)
(Exact name of Registrant as specified in charter)
10 South LaSalle Street, Suite 1925
Chicago IL 60603
(Address of principal executive offices) (Zip code)
(Address of principal executive offices) (Zip code)
Alan E. Molotsky, Esq.
North Square Investments Trust
10 South LaSalle Street, Suite 1925
Chicago IL 60603
(Name and address of agent for service)
(Name and address of agent for service)
(312) 857-2160
Registrant's telephone number, including area code
Date of fiscal year end: October 31, 2020
Date of reporting period: November 1, 2019 – October 31, 2020
Item 1. Reports to Stockholders.
ANNUAL REPORT | |
NORTH SQUARE ADVISORY RESEARCH ALL CAP VALUE FUND | |
NORTH SQUARE STRATEGIC INCOME FUND | |
OCTOBER 31, 2020 | |
Beginning on January 1, 2021, as permitted by regulations adopted by the U.S. Securities and Exchange Commission, paper copies of the Funds’ shareholder reports will no longer be sent by mail, unless you specifically request paper copies of the reports from the Fund or from your financial intermediary, such as a broker-dealer or bank. Instead, the reports will be made available on the Funds’ website, www.northsquareinvest.com, and you will be notified by mail each time a report is posted and provided with a website link to access the report.
If you already elected to receive shareholder reports electronically, you will not be affected by this change and you need not take any action. You may elect to receive shareholder reports and other communications from the Funds electronically by contacting your financial intermediary, such as a broker-dealer or bank, or, if you are a direct investor, by calling the Funds toll-free at 1-855-551-5521.
You may elect to receive all future reports in paper free of charge. If you invest through a financial intermediary, you can contact your financial intermediary to request that you continue to receive paper copies of your shareholder reports. If you invest directly with the Funds, you can call the Funds toll-free at 1-855-551-5521 to let the Funds know you wish to continue receiving paper copies of your shareholder reports. Your election to receive reports in paper will apply to all Funds held in your account if you invest through your financial intermediary.
 North Square Investments | www.northsquareinvest.com
North Square Funds
Table of Contents
| Shareholder Letters | 1 | ||
| Fund Performance | 5 | ||
| Schedules of Investments | 8 | ||
| Statements of Assets and Liabilities | 20 | ||
| Statements of Operations | 21 | ||
| Statements of Changes in Net Assets | 22 | ||
| Financial Highlights | 23 | ||
| Notes to Financial Statements | 25 | ||
| Report of Independent Registered Public Accounting Firm | 31 | ||
| Supplemental Information | 32 | ||
| Expense Examples | 36 |
This report and the financial statements contained herein are provided for the general information of the shareholders of the North Square Funds. This report is not authorized for distribution to prospective investors in the Funds unless preceded or accompanied by an effective prospectus.
www.northsquareinvest.com
| Discussion of Fund Performance |  |
Dear Shareholders,
The past twelve months have seen unprecedented volatility in the U.S. stock market. The S&P 500 Index reached a (then) record 3,386 on February 19, 2020. A month later, the equity markets were in bear market territory, having declined over 30% at the lowest point – a decline which had not occurred since the 2008-09 recession. The culprit, of course, was coronavirus. The emergence of the disease and its attendant effect on the economy through shutdowns (restrictions on interaction and travel) were something never experienced in our country.
The federal government went “all in” with its response. The Federal Reserve cut the target federal funds rate to the zero bound (a range of 0.00%-0.25%) and launched a series of liquidity programs to improve conditions in the credit markets. Congress passed several stimulus measures, most notably the Coronavirus Aid, Relief, and Economic Security Act (CARES Act), a record, $2 trillion stimulus package. The CARES Act injected bridge capital broadly through different “pipes” in the economy to combat the dislocations caused by the shutdowns.
The federal government’s response was rapid and played a pivotal role in generating a recovery in the economy and financial markets. After falling at an annualized -31.4% rate in the second calendar quarter of 2020, GDP rose 33.4% in the third quarter. Unemployment, which peaked at 14.7% in April 2020, fell to 6.9% in October, a far more rapid improvement than most experts had expected just a few months prior. And the S&P 500 roared back, reaching 3,581 in early September, before closing on October 30 at 3,270, just a few percentage points below the pre-coronavirus peak in February 2020.
As of October 31, 2020, the North Square Advisory Research All Cap Value Fund returned -10.63% for the trailing 12 months (its fiscal year), versus -8.00% for its primary benchmark, the Russell 3000 Value Index. According to attribution analysis, the biggest detractor from performance was our allocation to small cap stocks, and that allocation more than explains our underperformance. Small caps underperformed large caps during the year. In the value arena, the large cap Russell 1000 Value Index returned -7.58%, while the small cap Russell 2000 Value Index returned -13.95%. We have typically run with an overweight to small caps relative to the benchmark, as we believe our research process allows us to uncover high quality, underfollowed, and misunderstood companies at the lower end of the market cap spectrum. But that turned out to be a headwind in the current year.
Still, we believe we have a distinctive approach to the market, looking for profitable, well-capitalized companies with strong asset bases that trade at a discount to our estimate of their net asset value. While we are disappointed in our one-year performance, we are pleased that our strategy has outperformed its benchmark over the past three- and five-year periods.
At the company level, Fortune Brands Home & Security, Inc. (FBHS), was our strongest performer. Coronavirus has generated two macro trends in the economy: a dramatic increase in people working from home, and deurbanization (people seeking to move out of city centers and into single family homes in the suburbs to have more space and reduce the risk of contracting coronavirus). These trends have had a substantial, positive impact on the residential housing market. FBHS has been a big beneficiary of these trends, as a leading manufacturer of plumbing and cabinetry. On the downside, one of our weaker performers was Howard Hughes Corporation (HHC), a real estate developer. Howard Hughes’ projects include a substantial development in New York City called Seaport. The development was not performing to expectations prior to coronavirus and has been negatively impacted since. Our assessment of the company materially changed in light of coronavirus, and we chose to exit and redeploy the capital to other opportunities during the year.
Outlook
While we are disappointed with portfolio performance over the past year, we remain pleased with the performance of the portfolio over the longer term. We believe that keeping a sharp eye on fundamentals, as well as the price paid for them, will continue to work. Return on equity (ROE) is a telling indicator of business quality, and our portfolio’s 21.5% ROE is materially above the Russell 3000 Value Index’s 16.2% level. We also want our businesses to exhibit good earnings growth going forward, and the weighted average estimated EPS growth for the portfolio is 8.6% over the next three to five years, compared to 6.9% for the index. At the same time, we want our companies to have sound balance sheets. Our portfolio’s net debt to equity ratio is 1.11x, whereas the benchmark is at 1.38x.1 Overall, we think our forward P/E ratio of 20.1x, a little higher than the Russell 3000 Value’s 17.1x, is warranted.
1 | Net debt to equity reduces debt in the numerator by cash on the balance sheet; the calculation excludes companies with negative common equity. |
1
We remain confident in our process and current positioning. By focusing on both downside protection and upside potential over a multi-year investment horizon, we believe the fund is well-positioned for a positively skewed risk/reward payoff. Relative to our benchmark, we own businesses that generate higher returns and are growing earnings faster, with responsible financial positions.
We thank you for investing in the North Square Advisory Research All Cap Value Fund and look forward to updating you again in 2021.
Advisory Research, Inc.
The views in this letter are those of the Fund’s direct advisor as of December 30, 2020 and may not necessarily reflect the same views on the date this letter is first published or any date thereafter. These views are intended to help shareholders in understanding the fund’s investment methodology and do not constitute investment advice.
Investment in equity securities involves substantial risks and may be subject to wide and sudden fluctuations in market value. Investing in small and mid-cap companies may be subject to more abrupt or erratic market movements and may have lower trading volumes or more erratic trading than securities of larger companies. Please see the prospectus for a more complete discussion of the fund’s risks.
2
| Discussion of Fund Performance | |
Dear Shareholders,
Looking back to November of 2019, very few could have seen the looming storm clouds on the horizon that was the coronavirus. At that moment, the world was seemingly unaware of the pandemic that was about to disrupt the lives of people everywhere. Our thoughts go out to those that have suffered physically, emotionally, and financially during the COVID-19 pandemic.
The toll that the pandemic has taken on the global economy has been staggering and rapid. The past 12 months have tested Red Cedar Investment Management’s experience and knowledge of the capital markets and given us the chance to address the risks and opportunities that presented themselves during these volatile times. The pandemic, polarized politics, monetary stimulus, fiscal stimulus, and a Presidential campaign all contributed to a level of volatility and uncertainty which had been largely subdued since the Great Financial Crisis in 2008.
As the early stages of the pandemic unfolded through the month of February, the S&P 500® had just come off its then near record high a few weeks earlier, and two-year US Treasury securities were yielding around 1.25%. The United States had just finished 2019 with its longest economic expansion on record and it appeared that the economy would continue to hum along with GDP trending over 2% as it had over the past several quarters.
By March, the global economy would be devastated. Equity markets collapsed, dropping close to 34% from peak to trough. Corporate bond yields spiked with investment grade corporate bond yields rising approximately 250 basis points relative to US Treasuries over a similar time period, according to Bloomberg data. As all risk assets were punished, the fiscal year to date total return of the North Square Strategic Income Fund turned negative in March and reached its low point in net asset value (NAV) during the second half of the month. During the month of March, Red Cedar moved aggressively to add preferred securities and credit risk to the portfolio based on valuation and what we saw as a committed Federal Reserve utilizing a playbook similar to what we experienced in the aftermath of the Great Financial Crisis. In this case, however, the Fed moved quickly and with a greater sense of urgency.
On March 3rd, the Fed announced its first interest rate cut; it eventually reduced rates to 0% during the month. On March 17th, it announced the first of several credit facilities to support the capital and credit markets, to ensure that credit markets did not lock up during the period of stress. On March 23rd, support facilities were expanded and ultimately included a backstop for even the High Yield bond market.
From late March to mid-April, corporate bond yields relative to US Treasury yields compressed approximately 1.60% as fiscal and monetary stimulus demonstrated to the markets that the government and the Fed would do what was necessary to support the macro economy and the capital markets.
The Fund’s NAV retraced the losses it incurred in March, and by the beginning of June it had come full circle. Indeed, by mid-year the performance of the Fund had improved immensely despite the continued uncertainty surrounding COVID-19. Although the virus had not disappeared, the economy was opening back up and the unemployment rate, which peaked at 14.7%, had declined to 6.9% by the end of October (Bureau of Labor Statistics).
During the recovery period we saw the Fund’s performance aided by a rebound in preferred securities and corporate bonds. The US Dollar’s weakness during the second half of the calendar year along with price appreciation of foreign sovereign debt – with unhedged FX exposure- also were a tailwind for performance. The Fund further benefitted from a lower than benchmark duration. In particular, the decision to underweight the long end of the yield curve was additive to performance as the curve steepened.
While the Presidential elections were fraught with drama and there was considerable debate as to which candidate would be better for the capital markets, much of that was overshadowed by the COVID-19 pandemic. Red Cedar believed regardless of the election outcome, both political parties were likely to suspend concerns over the national deficit and embark on additional fiscal stimulus. This would be in addition to the extremely generous stimulus packages already doled out by governments globally. Combined with the monetary stimulus we have seen from central bankers this year; we believe the US and the global markets are headed for a reflationary period which could be larger than we have seen in years. With regulatory approval of a few vaccines feeling imminent, we sense the grey cloud of the pandemic may be lifting over the first few months of 2021 which would add fuel to the economic fire.
The Red Cedar team has positioned the portfolio to take advantage of this market environment with an increase to the pro-cyclical bent that typically accompanies the early stages of economic recovery. This includes adding to the preferred securities holdings, including contingent convertible securities (CoCo’s). We have also increased exposure to non-USD securities as we expect US Dollar weakness to continue.
3
While the year was challenging, we feel the team has provided solid performance relative to the Fund’s stated benchmark and has done so in a way that has provided value to the shareholders. As of October 31, 2020, the North Square Strategic Income Fund returned 7.56% for the trailing 12 months. During the same period, the Bloomberg Barclays US Aggregate Bond Index returned 6.19% and the Bloomberg Barclays Intermediate Credit Index returned 5.88%.
We at Red Cedar Investment Management would like to wish everyone a safe and peaceful holiday season and send our best wishes for a Happy New Year.
Regards,
John L. Cassady III, CFA
Chief Investment Officer
Red Cedar Investment Management
The views in this letter are those of the Fund’s direct advisor as of December 30, 2020 and may not necessarily reflect the same views on the date this letter is first published or any date thereafter. These views are intended to help shareholders in understanding the fund’s investment methodology and do not constitute investment advice.
The value of a convertible security is influenced by changes in interest rates, the credit standing of the issuer and other factors. Debt securities have interest rate, inflation and credit risks and are subject to prepayment and default risk. High yield and junk securities involve greater risk and tend to be more sensitive to economic conditions and credit risk. Foreign and US currencies may unfavorably fluctuate in value relative to each other. Distressed securities are typically unrated, lower-rated, in default or close to default and the prices may be extremely volatile, more likely to become worthless and the Fund may lose all of its investment.
4
North Square Advisory Research All Cap Value Fund
FUND PERFORMANCE at October 31, 2020 (Unaudited)
Performance of a $1,000,000 Investment
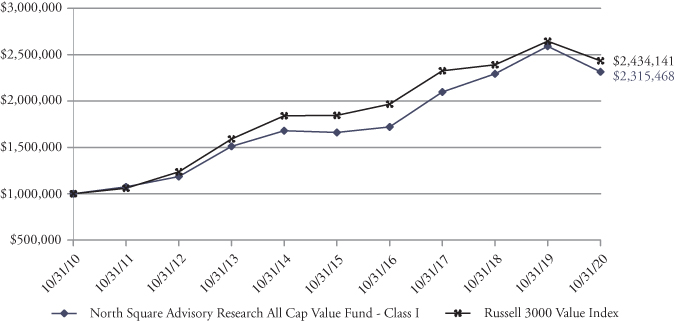
This graph compares a hypothetical $1,000,000 investment in the Fund, made on October 31, 2010, with a similar investment in the Russell 3000 Value Index. Results include the reinvestment of all dividends and capital gains.
The Russell 3000 Value Index measures the performance of the broad value segment of the U.S. equity value universe. It includes those Russell 3000 companies with lower price-to-book ratios and lower forecasted growth values. This index does not reflect expenses, fees or sales charge, which would lower performance. The index is unmanaged and is not available for investment.
| Average Annual | ||||||
| Since | Inception | |||||
Total Returns as of October 31, 2020 | 6 Month | 1 Year | 5 Year | 10 Year | Inception | Date |
Class I | 7.13% | (10.63)% | 6.86% | 8.76% | 9.05% | 11/16/09 |
Russell 3000 Value Index | 7.36% | (8.00)% | 5.69% | 9.30% | 9.29% | 11/16/09 |
The performance data quoted here represents past performance and past performance is not a guarantee of future results. Investment return and principal value will fluctuate so that an investor’s shares, when redeemed, may be worth more or less than their original cost. Current performance may be lower or higher than the performance information quoted. The most recent month end performance may be obtained by calling 1-855-551-5521.
The Fund acquired all assets and assumed the liabilities of the Advisory Research All Cap Value Fund (the “Predecessor Fund”) effective the close of business on February 21, 2020. The Predecessor Fund commenced investment operations on November 16, 2009. As a result of the reorganization, the Fund is the accounting successor of the Predecessor Fund. Performance results shown in the graph and performance table above prior to February 21, 2020 reflect the performance of the Predecessor Fund.
Gross and net expense ratios for Class I shares were 2.14% and 0.95%, respectively, which were the amounts stated in the current prospectus dated February 25, 2020. For the Fund’s current one year expense ratios, please refer to the Financial Highlights section of this report. The Fund’s advisor has contractually agreed to waive its fees and/or pay for operating expenses of the Fund to ensure that total annual fund operating expenses do not exceed 0.95% of the average daily net assets of the Fund’s Class I shares. This agreement is in effect until February 28, 2022, and it may be terminated before that date only by the Trust’s Board of Trustees. In the absence of such waivers, the Fund’s returns would have been lower.
Returns reflect the reinvestment of distributions made by the Fund, if any. The graph and performance table above do not reflect the deduction of taxes that a shareholder would pay on Fund distributions or the redemption of Fund shares.
5
North Square Strategic Income Fund
FUND PERFORMANCE at October 31, 2020 (Unaudited)
Performance of a $1,000,000 Investment
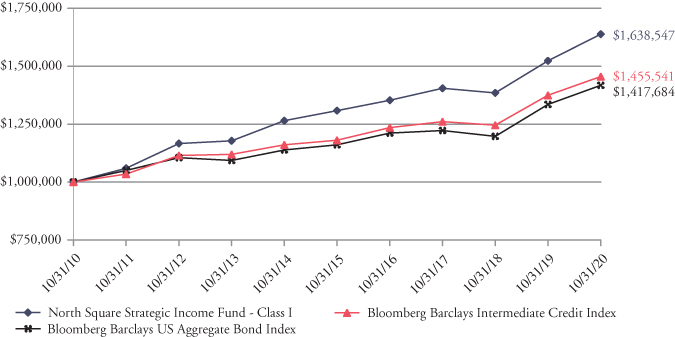
This graph compares a hypothetical $1,000,000 investment in the Fund, made on October 31, 2010, with a similar investment in the Bloomberg Barclays US Aggregate Bond Index and the Bloomberg Barclays Intermediate Credit Index. Results include the reinvestment of all dividends and capital gains.
The Bloomberg Barclays US Aggregate Bond Index is a broad-based flagship benchmark that measures the investment grade, US dollar-denominated, fixed-rate taxable bond market. The Bloomberg Barclays Intermediate Credit Index is a board-based flagship benchmark that measures the non-securitized component of the US Aggregate Index with less than 10 years to maturity. The indices do not reflect expenses, fees or sales charge, which would lower performance. The indices are unmanaged and are not available for investment.
| Average Annual | ||||||
| Since | Inception | |||||
Total Returns as of October 31, 2020 | 6 Month | 1 Year | 5 Year | 10 Year | Inception | Date |
Class I | 4.38% | 7.56% | 4.60% | 5.06% | 4.48% | 12/31/12 |
Bloomberg Barclays US Aggregate Bond Index | 1.27% | 6.19% | 4.08% | 3.55% | 3.23% | 12/31/12 |
Bloomberg Barclays Intermediate Credit Index | 4.41% | 5.88% | 4.28% | 3.83% | 3.43% | 12/31/12 |
The performance data quoted here represents past performance and past performance is not a guarantee of future results. Investment return and principal value will fluctuate so that an investor’s shares, when redeemed, may be worth more or less than their original cost. Current performance may be lower or higher than the performance information quoted. The most recent month end performance may be obtained by calling 1-855-551-5521.
The Fund acquired all assets and assumed the liabilities of the Advisory Research Strategic Income Fund (the “Predecessor Fund”) effective the close of business on February 21, 2020. The Predecessor Fund commenced investment operations on December 31, 2012 after the conversion of a limited partnership account, the Advisory Research Value Income Fund, L.P. (the “Predecessor Account”), which commenced operations on June 30, 2003. As a result of each reorganization, the Fund is the accounting successor of each the Predecessor Fund and Predecessor Account. Performance results shown in the graph and performance table above between February 21, 2020 and December 31, 2012 reflect the performance of the Predecessor Fund, and performance results shown prior to December 31, 2012 reflect the performance of the Predecessor Account. The Predecessor Account was not registered under the 1940 Act and therefore was not subject to certain restrictions imposed by the 1940 Act on registered investment companies and by the Internal Revenue Code of 1986 on regulated investment companies. If the Predecessor Account had been registered under the 1940 Act, the Predecessor Account’s performance may have been adversely affected.
6
North Square Strategic Income Fund
FUND PERFORMANCE at October 31, 2020 (Unaudited) – Continued
Gross and net expense ratios for Class I shares were 1.96% and 0.95%, respectively, which were the amounts stated in the current prospectus dated February 25, 2020. For the Fund’s current one year expense ratios, please refer to the Financial Highlights section of this report. The Fund’s advisor has contractually agreed to waive its fees and/or pay for operating expenses of the Fund to ensure that total annual fund operating expenses do not exceed 0.90% of the average daily net assets of the Fund’s Class I shares. This agreement is in effect until February 28, 2022, and it may be terminated before that date only by the Trust’s Board of Trustees. In the absence of such waivers, the Fund’s returns would have been lower.
Returns reflect the reinvestment of distributions made by the Fund, if any. The graph and performance table above do not reflect the deduction of taxes that a shareholder would pay on Fund distributions or the redemption of Fund shares.
7
North Square Advisory Research All Cap Value Fund
SCHEDULE OF INVESTMENTS
As of October 31, 2020
| Number | |||||||
| of Shares | Value | ||||||
| COMMON STOCKS – 96.2% | |||||||
| COMMUNICATION SERVICES – 5.4% | |||||||
145 | Alphabet Inc. – Class A* | $ | 234,336 | ||||
| CONSUMER DISCRETIONARY – 20.9% | |||||||
157 | AutoZone, Inc.* | 177,250 | |||||
5,485 | Core-Mark Holding Co., Inc. | 150,015 | |||||
323 | The Home Depot, Inc. | 86,147 | |||||
400 | McDonald’s Corp. | 85,200 | |||||
1,306 | Starbucks Corp. | 113,570 | |||||
2,890 | Terminix Global Holdings, Inc.* | 136,090 | |||||
3,266 | The TJX Co., Inc. | 165,913 | |||||
| 914,185 | |||||||
| CONSUMER STAPLES – 2.0% | |||||||
659 | PepsiCo, Inc. | 87,838 | |||||
| ENERGY – 3.1% | |||||||
1,971 | Chevron Corp. | 136,984 | |||||
| FINANCIALS – 15.8% | |||||||
1,729 | American Express Co. | 157,754 | |||||
921 | Berkshire Hathaway, Inc. – Class B* | 185,950 | |||||
4,956 | First Interstate BancSystem, Inc. – Class A | 174,947 | |||||
1,779 | JPMorgan Chase & Co. | 174,413 | |||||
| 693,064 | |||||||
| HEALTH CARE – 11.6% | |||||||
1,452 | Abbott Laboratories | 152,620 | |||||
344 | Anthem, Inc. | 93,843 | |||||
1,704 | Medtronic PLC1 | 171,371 | |||||
297 | UnitedHealth Group Inc. | 90,627 | |||||
| 508,461 | |||||||
| INDUSTRIALS – 21.9% | |||||||
2,550 | Allison Transmission Holdings, Inc. | 92,183 | |||||
1,840 | Fortune Brands Home & Security, Inc. | 148,801 | |||||
1,110 | L3Harris Technologies, Inc. | 178,832 | |||||
3,638 | Rexnord Corp. | 116,707 | |||||
901 | Snap-on, Inc. | 141,935 | |||||
5,689 | TriMas Corp.* | 138,413 | |||||
796 | Union Pacific Corp. | 141,043 | |||||
| 957,914 | |||||||
| INFORMATION TECHNOLOGY – 4.8% | |||||||
1,003 | CDW Corp. of Delaware | 122,968 | |||||
430 | Microsoft Corp. | 87,062 | |||||
| 210,030 | |||||||
| MATERIALS – 4.1% | |||||||
15,382 | Element Solutions, Inc.* | 180,277 | |||||
See accompanying Notes to Financial Statements.
8
North Square Advisory Research All Cap Value Fund
SCHEDULE OF INVESTMENTS – Continued
As of October 31, 2020
| Number | |||||||
| of Shares | Value | ||||||
| COMMON STOCKS (Continued) | |||||||
| UTILITIES – 6.6% | |||||||
1,737 | Chesapeake Utilities Corp. | $ | 168,854 | ||||
1,339 | IDACORP, Inc. | 117,470 | |||||
| 286,324 | |||||||
| TOTAL COMMON STOCKS | |||||||
(Cost $3,428,160) | 4,209,413 | ||||||
| SHORT-TERM INVESTMENT – 4.0% | |||||||
176,299 | First American Treasury Obligations Fund – Class X, 0.05%2 | 176,299 | |||||
| TOTAL SHORT-TERM INVESTMENT | |||||||
(Cost $176,299) | 176,299 | ||||||
| TOTAL INVESTMENTS – 100.2% | |||||||
(Cost $3,604,459) | 4,385,712 | ||||||
Liabilities in Excess of Other Assets – (0.2)% | (7,611 | ) | |||||
| TOTAL NET ASSETS – 100.0% | $ | 4,378,101 | |||||
PLC – Public Limited Company
| * | Non-Income producing security. |
1 | Foreign security denominated in U.S. Dollars. |
2 | The rate is the annualized seven-day yield at period end. |
Investments are classified by industry pursuant to the Global Industry Classification Standard (GICS®), which was developed by and/or is the exclusive property of Morgan Stanley Capital International, Inc. (“MSCI”) and Standard & Poor’s Financial Services LLC (“S&P”). GICS is a service mark of MSCI and S&P and has been licensed for use by U.S. Bancorp Fund Services, LLC.
See accompanying Notes to Financial Statements.
9
North Square Advisory Research All Cap Value Fund
SUMMARY OF INVESTMENTS
As of October 31, 2020
| Percent of Total | ||||
Security Type/Sector | Net Assets | |||
Common Stocks | ||||
Industrials | 21.9 | % | ||
Consumer Discretionary | 20.9 | % | ||
Financials | 15.8 | % | ||
Health Care | 11.6 | % | ||
Utilities | 6.6 | % | ||
Communication Services | 5.4 | % | ||
Information Technology | 4.8 | % | ||
Materials | 4.1 | % | ||
Energy | 3.1 | % | ||
Consumer Staples | 2.0 | % | ||
| Total Common Stocks | 96.2 | % | ||
Short-Term Investment | 4.0 | % | ||
| Total Investments | 100.2 | % | ||
Liabilities in Excess of Other Assets | (0.2 | )% | ||
| Total Net Assets | 100.0 | % | ||
See accompanying Notes to Financial Statements.
10
North Square Strategic Income Fund
SCHEDULE OF INVESTMENTS
As of October 31, 2020
| Principal | |||||||
| Amount | Value | ||||||
| ASSET BACKED SECURITIES – 11.9% | |||||||
Accredited Mortgage Loan Trust 2005-4 | |||||||
$ | 753,227 | 0.549% (1 Month LIBOR USD + 0.400%), 12/25/2035 | $ | 748,209 | |||
Asset Backed Securities Corp Home Equity Loan Trust Series OOMC 2006-HE3 | |||||||
375,000 | 0.419% (1 Month LIBOR USD + 0.270%), 03/25/2036 | 364,888 | |||||
Bear Stearns Asset Backed Securities I Trust 2005-TC2 | |||||||
316,564 | 1.229% (1 Month LIBOR USD + 1.080%), 08/25/2035 | 316,828 | |||||
Citigroup Mortgage Loan Trust 2006-HE1 | |||||||
244,886 | 0.689% (1 Month LIBOR USD + 0.540%), 01/25/2036 | 244,556 | |||||
Foundation Finance Trust 2017-1 | |||||||
546,201 | 3.300%, 07/15/20333 | 556,620 | |||||
GSAA Home Equity Trust 2005-6 | |||||||
286,269 | 0.579% (1 Month LIBOR USD + 0.430%), 06/25/2035 | 288,869 | |||||
JP Morgan Mortgage Acquisition Trust 2007-CH3 | |||||||
483,035 | 0.409% (1 Month LIBOR USD + 0.260%), 03/25/2037 | 475,940 | |||||
Mill City Mortgage Loan Trust 2018-2 | |||||||
469,276 | 3.500%, 05/25/20583,4 | 488,829 | |||||
Newcastle Mortgage Securities Trust 2006-1 | |||||||
243,965 | 0.519% (1 Month LIBOR USD + 0.370%), 03/25/2036 | 243,539 | |||||
OASIS 2020-2 LLC | |||||||
526,469 | 4.262%, 05/15/20323 | 527,729 | |||||
Park Place Securities Inc Asset-Backed Pass-Through Ctfs Ser 2005-WHQ2 | |||||||
220,122 | 0.839% (1 Month LIBOR USD + 0.690%), 05/25/2035 | 219,683 | |||||
RAMP Series 2006-EFC2 Trust | |||||||
578,968 | 0.369% (1 Month LIBOR USD + 0.220%), 12/25/2036 | 572,971 | |||||
Structured Asset Investment Loan Trust 2004-8 | |||||||
706,315 | 1.149% (1 Month LIBOR USD + 1.000%), 09/25/2034 | 700,342 | |||||
Structured Asset Securities Corp Mortgage Loan Trust 2006-WF1 | |||||||
670,000 | 0.579% (1 Month LIBOR USD + 0.430%), 02/25/2036 | 664,248 | |||||
Synchrony Credit Card Master Note Trust | |||||||
360,000 | 2.620%, 10/15/2025 | 374,916 | |||||
Towd Point Mortgage Trust 2015-2 | |||||||
182,783 | 2.500%, 11/25/20603,4 | 184,708 | |||||
Towd Point Mortgage Trust 2016-1 | |||||||
384,000 | 3.500%, 02/25/20553,4 | 390,586 | |||||
Towd Point Mortgage Trust 2017-3 | |||||||
432,623 | 2.750%, 06/25/20573,4 | 445,572 | |||||
Towd Point Mortgage Trust 2017-6 | |||||||
257,266 | 2.750%, 10/25/20573,4 | 265,729 | |||||
Towd Point Mortgage Trust 2018-3 | |||||||
719,892 | 3.750%, 05/25/20583,4 | 768,408 | |||||
| TOTAL ASSET BACKED SECURITIES | |||||||
(Cost $8,569,128) | 8,843,170 | ||||||
See accompanying Notes to Financial Statements.
11
North Square Strategic Income Fund
SCHEDULE OF INVESTMENTS – Continued
As of October 31, 2020
| Number | |||||||
| of Shares | Value | ||||||
| COMMON STOCKS – 5.4% | |||||||
| CONSUMER DISCRETIONARY – 1.9% | |||||||
6,343 | Dick’s Sporting Goods, Inc. | $ | 359,331 | ||||
2,292 | The Home Depot, Inc. | 611,299 | |||||
3,905 | NIKE, Inc. | 468,913 | |||||
| 1,439,543 | |||||||
| FINANCIALS – 0.3% | |||||||
434 | BlackRock, Inc. | 260,057 | |||||
| HEALTH CARE – 0.4% | |||||||
2,697 | Abbott Laboratories | 283,482 | |||||
| INDUSTRIALS – 0.4% | |||||||
862 | Cintas Corp. | 271,142 | |||||
| INFORMATION TECHNOLOGY – 2.0% | |||||||
3,351 | Apple Inc. | 364,790 | |||||
1,256 | Broadcom Inc. | 439,135 | |||||
1,374 | Mastercard Inc. – Class A | 396,591 | |||||
1,369 | Microsoft Corp. | 277,182 | |||||
| 1,477,698 | |||||||
| UTILITIES – 0.4% | |||||||
3,692 | NextEra Energy, Inc. | 270,291 | |||||
| TOTAL COMMON STOCKS | |||||||
(Cost $3,963,388) | 4,002,213 | ||||||
| Principal | |||||||
| Amount | |||||||
| CORPORATE BONDS – 43.1% | |||||||
| COMMUNICATION SERVICES – 0.8% | |||||||
Vodafone Group PLC | |||||||
$ | 515,000 | 7.000% (5 Year Swap Rate USD + 4.873%), 04/04/20791,4 | 611,614 | ||||
| CONSUMER DISCRETIONARY – 4.1% | |||||||
DR Horton, Inc. | |||||||
1,000,000 | 1.400%, 10/15/2027 | 987,489 | |||||
General Motors Financial Co, Inc. | |||||||
750,000 | 5.700% (5 Year CMT Rate + 4.997%), 09/30/21694 | 778,125 | |||||
Lennar Corp. | |||||||
400,000 | 5.250%, 06/01/2026 | 455,504 | |||||
Marriott International, Inc. | |||||||
650,000 | 5.750%, 05/01/2025 | 723,422 | |||||
Starbucks Corp. | |||||||
100,000 | 3.500%, 03/01/2028 | 113,265 | |||||
| 3,057,805 | |||||||
| CONSUMER STAPLES – 0.9% | |||||||
Keurig Dr Pepper, Inc. | |||||||
550,000 | 3.200%, 05/01/2030 | 614,459 | |||||
See accompanying Notes to Financial Statements.
12
North Square Strategic Income Fund
SCHEDULE OF INVESTMENTS – Continued
As of October 31, 2020
| Principal | |||||||
| Amount | Value | ||||||
| CORPORATE BONDS (Continued) | |||||||
| ENERGY – 5.3% | |||||||
BP Capital Markets PLC | |||||||
$ | 1,000,000 | 4.375% (5 Year CMT Rate + 4.036%), 09/22/20251,4 | $ | 1,035,000 | |||
Enbridge, Inc. | |||||||
800,000 | 5.750% (5 Year CMT Rate + 5.314%), 07/15/20801,4 | 817,217 | |||||
Energy Transfer Operating LP | |||||||
900,000 | 6.625% (3 Month LIBOR USD + 4.155%), 05/15/20284 | 640,570 | |||||
ONEOK, Inc. | |||||||
775,000 | 3.100%, 03/15/2030 | 745,040 | |||||
Transcanada Trust | |||||||
700,000 | 5.500% (3 Month LIBOR USD + 4.154%), 09/15/20791,4 | 718,185 | |||||
| 3,956,012 | |||||||
| FINANCIALS – 24.5% | |||||||
Assurant, Inc. | |||||||
700,000 | 7.000% (3 Month LIBOR USD + 4.135%), 03/27/20484 | 763,150 | |||||
Australia and New Zealand Banking Group Ltd. | |||||||
750,000 | 6.750% (5 Year Mid Swap Rate USD + 5.168%), 12/29/20491,3,4 | 851,321 | |||||
Bank of America Corp. | |||||||
550,000 | 6.500% (3 Month LIBOR USD + 4.174%), 04/23/20254 | 615,120 | |||||
Bank of Montreal | |||||||
700,000 | 4.800% (5 Year CMT Rate + 2.979%), 08/25/21681,4 | 712,737 | |||||
The Bank of New York Mellon Corp. | |||||||
760,000 | 3.647% (3 Month LIBOR USD + 3.420%), 12/29/20494 | 751,532 | |||||
600,000 | 4.700% (5 Year CMT Rate + 4.358%), 03/20/21694 | 643,500 | |||||
The Charles Schwab Corp. | |||||||
500,000 | 5.375% (5 Year CMT Rate + 4.971%), 05/01/20254 | 548,400 | |||||
Citigroup, Inc. | |||||||
670,000 | 6.250% (3 Month LIBOR USD + 4.517%), 12/29/20494 | 749,003 | |||||
Credit Agricole SA | |||||||
650,000 | 7.875% (5 Year Swap Rate USD + 4.898%), 01/29/20493 | 718,354 | |||||
Credit Suisse Group AG | |||||||
650,000 | 7.500%, 12/11/20493 | 707,785 | |||||
Fifth Third Bancorp | |||||||
1,000,000 | 4.500% (5 Year CMT Rate + 4.215%), 12/30/20254 | 1,012,500 | |||||
The Goldman Sachs Group, Inc. | |||||||
125,000 | 5.300% (3 Month LIBOR USD + 3.834%), 12/29/20494 | 133,196 | |||||
Huntington Bancshares, Inc. | |||||||
700,000 | 4.450% (H15T7Y + 4.045%), 03/15/21684 | 698,250 | |||||
500,000 | 5.625% (10 Year CMT Rate + 4.945%), 01/15/21694 | 560,625 | |||||
JPMorgan Chase & Co. | |||||||
800,000 | 6.750% (3 Month LIBOR USD + 3.780%), 01/29/20504 | 874,943 | |||||
KeyCorp | |||||||
750,000 | 5.000% (3 Month LIBOR USD + 3.606%), 12/15/21654 | 771,251 | |||||
M&T Bank Corp. | |||||||
325,000 | 6.450% (3 Month LIBOR USD + 3.610%), 12/29/20494 | 348,788 | |||||
MetLife, Inc. | |||||||
400,000 | 3.850% (5 Year CMT Rate + 3.576%), 03/15/20264 | 402,144 | |||||
34,000 | 3.825% (3 Month LIBOR USD + 3.575%), 12/29/20494 | 33,724 | |||||
100,000 | 6.400%, 12/15/2066 | 124,363 | |||||
See accompanying Notes to Financial Statements.
13
North Square Strategic Income Fund
SCHEDULE OF INVESTMENTS – Continued
As of October 31, 2020
| Principal | |||||||
| Amount | Value | ||||||
| CORPORATE BONDS (Continued) | |||||||
| FINANCIALS (Continued) | |||||||
Morgan Stanley | |||||||
$ | 500,000 | 4.047% (3 Month LIBOR USD + 3.810%), 12/29/20494 | $ | 490,704 | |||
Northern Trust Corp. | |||||||
250,000 | 4.600% (3 Month LIBOR USD + 3.202%), 04/01/20274 | 263,750 | |||||
PartnerRe Ltd. | |||||||
500,000 | 4.500% (5 Year CMT Rate + 3.815%), 10/01/20504 | 502,108 | |||||
Regions Financial Corp. | |||||||
500,000 | 5.750% (5 Year CMT Rate + 5.430%), 12/15/21654 | 536,875 | |||||
Skandinaviska Enskilda Banken AB | |||||||
800,000 | 5.125% (5 Year CMT Rate + 3.463%), 11/13/20251,4 | 813,922 | |||||
State Street Corp. | |||||||
750,000 | 3.847% (3 Month LIBOR USD + 3.597%), 12/29/20494 | 747,525 | |||||
240,000 | 7.000% (3 Month LIBOR USD + 4.820%), 02/28/20494 | 250,274 | |||||
Truist Financial Corp. | |||||||
1,000,000 | 5.100% (10 Year CMT Rate + 4.349%), 03/01/20614 | 1,096,810 | |||||
UBS Group AG | |||||||
700,000 | 5.125% (5 Year CMT Rate + 4.855%), 07/29/21701,4 | 728,457 | |||||
Westpac Banking Corp. | |||||||
750,000 | 5.000% (5 Year Mid Swap Rate USD + 2.888%), 09/21/21621,4 | 760,382 | |||||
| 18,211,493 | |||||||
| HEALTH CARE – 0.5% | |||||||
CVS Health Corp. | |||||||
200,000 | 3.625%, 04/01/2027 | 224,293 | |||||
Thermo Fisher Scientific, Inc. | |||||||
90,000 | 4.150%, 02/01/2024 | 99,246 | |||||
| 323,539 | |||||||
| INDUSTRIALS – 2.9% | |||||||
AerCap Holdings N.V. | |||||||
675,000 | 5.875% (5 Year CMT Rate + 4.535%), 10/10/20791,4 | 535,548 | |||||
Delta Air Lines, Inc. | |||||||
600,000 | 4.500%, 10/20/20251,3 | 609,469 | |||||
125,000 | 4.375%, 04/19/2028 | 108,238 | |||||
General Dynamics Corp. | |||||||
500,000 | 3.750%, 05/15/2028 | 582,635 | |||||
John Deere Capital Corp. | |||||||
300,000 | 3.050%, 01/06/2028 | 335,985 | |||||
| 2,171,875 | |||||||
| MATERIALS – 1.0% | |||||||
Teck Resources Ltd. | |||||||
700,000 | 3.900%, 07/15/20301,4 | 735,205 | |||||
| UTILITIES – 3.1% | |||||||
Dominion Energy, Inc. | |||||||
150,000 | 5.750% (3 Month LIBOR USD + 3.057%), 10/01/20544 | 162,292 | |||||
Emera, Inc. | |||||||
350,000 | 6.750% (3 Month LIBOR USD + 5.440%), 06/15/20761,4 | 388,236 | |||||
See accompanying Notes to Financial Statements.
14
North Square Strategic Income Fund
SCHEDULE OF INVESTMENTS – Continued
As of October 31, 2020
| Principal | |||||||
| Amount | Value | ||||||
| CORPORATE BONDS (Continued) | |||||||
| UTILITIES (Continued) | |||||||
The Southern Co. | |||||||
$ | 500,000 | 4.000% (5 Year CMT Rate + 3.733%), 01/15/20514 | $ | 508,695 | |||
650,000 | 5.500% (3 Month LIBOR USD + 3.630%), 03/15/20574 | 668,685 | |||||
Xcel Energy, Inc. | |||||||
500,000 | 3.400%, 06/01/2030 | 568,592 | |||||
| 2,296,500 | |||||||
| TOTAL CORPORATE BONDS | |||||||
(Cost $31,072,214) | 31,978,502 | ||||||
| Number | |||||||
| of Shares | |||||||
| EXCHANGE TRADED FUNDS (ETFS) – 3.8% | |||||||
76,245 | First Trust Preferred Securities and Income ETF | 1,461,617 | |||||
22,871 | iShares Currency Hedged MSCI Japan ETF | 715,405 | |||||
17,735 | VanEck Vectors Gold Miners ETF | 664,885 | |||||
| TOTAL ETFS | |||||||
(Cost $2,744,047) | 2,841,907 | ||||||
| Principal | |||||||
| Amount | |||||||
| FOREIGN GOVERNMENT NOTES/BONDS – 4.6% | |||||||
Australia Government Bond | |||||||
$ | 1,225,000 | 2.500%, 05/21/20301 | 997,462 | ||||
Indonesia Treasury Bond | |||||||
11,000,000,000 | 6.500%, 02/15/20311 | 748,186 | |||||
Mexican Bonos | |||||||
120,000 | 8.500%, 05/31/20291 | 660,547 | |||||
Republic of Poland Government Bond | |||||||
3,700,000 | 2.500%, 07/25/20261 | 1,034,125 | |||||
| TOTAL FOREIGN GOVERNMENT NOTES/BONDS | |||||||
(Cost $3,404,267) | 3,440,320 | ||||||
| MORTGAGE BACKED SECURITIES – 17.9% | |||||||
Bear Stearns ALT-A Trust 2004-4 | |||||||
459,367 | 0.749% (1 Month LIBOR USD + 0.600%), 06/25/2034 | 462,322 | |||||
Comm 2014-UBS2 Mortgage Trust | |||||||
270,000 | 3.961%, 03/10/20475 | 293,685 | |||||
Fannie Mae-Aces | |||||||
14,127,070 | 0.632%, 05/25/20225 | 95,444 | |||||
3,860,000 | 1.378%, 08/25/20285 | 358,003 | |||||
3,763,052 | 1.284%, 03/26/20295 | 338,453 | |||||
Freddie Mac Multiclass Certificates Series 2015-P001 | |||||||
3,025,000 | 1.826%, 10/27/20285 | 371,701 | |||||
See accompanying Notes to Financial Statements.
15
North Square Strategic Income Fund
SCHEDULE OF INVESTMENTS – Continued
As of October 31, 2020
| Principal | |||||||
| Amount | Value | ||||||
| MORTGAGE BACKED SECURITIES (Continued) | |||||||
Freddie Mac Multifamily Structured Pass Through Certificates | |||||||
$ | 294,692 | 2.197%, 11/25/20235 | $ | 305,749 | |||
2,700,000 | 1.799%, 04/25/20305 | 407,161 | |||||
2,074,000 | 1.868%, 04/25/20305 | 326,224 | |||||
3,332,000 | 1.600%, 08/25/20305 | 462,923 | |||||
2,199,468 | 1.513%, 02/25/2035 | 350,261 | |||||
FREMF 2012-K20 Mortgage Trust | |||||||
610,000 | 3.868%, 05/25/20453,5 | 630,597 | |||||
FREMF 2012-K21 Mortgage Trust | |||||||
285,000 | 3.935%, 07/25/20453,5 | 298,048 | |||||
FREMF 2013-K29 Mortgage Trust | |||||||
395,000 | 3.476%, 05/25/20463,5 | 412,364 | |||||
FREMF 2013-K33 Mortgage Trust | |||||||
206,000 | 3.498%, 08/25/20463,5 | 219,218 | |||||
FREMF 2013-K35 Mortgage Trust | |||||||
615,000 | 3.935%, 12/25/20463,5 | 663,962 | |||||
FREMF 2014-K36 Mortgage Trust | |||||||
500,000 | 4.365%, 12/25/20463,5 | 537,597 | |||||
FREMF 2014-K40 Mortgage Trust | |||||||
625,000 | 4.071%, 11/25/20473,5 | 690,743 | |||||
FREMF 2014-K41 Mortgage Trust | |||||||
635,000 | 3.833%, 11/25/20473,5 | 697,453 | |||||
FREMF 2015-K46 Mortgage Trust | |||||||
650,000 | 3.695%, 04/25/20483,5 | 705,667 | |||||
FREMF 2016-K55 Mortgage Trust | |||||||
400,000 | 4.163%, 04/25/20493,5 | 429,140 | |||||
FREMF 2016-K59 Mortgage Trust | |||||||
64,923,139 | 0.100%, 11/25/20493,5 | 312,436 | |||||
FREMF 2017-K66 Mortgage Trust | |||||||
430,000 | 4.035%, 08/25/20503,5 | 482,816 | |||||
Government National Mortgage Association | |||||||
4,066,461 | 0.911%, 12/16/20565 | 242,190 | |||||
4,739,072 | 0.717%, 11/16/20605 | 362,457 | |||||
GS Mortgage Securities Trust 2014-GC20 | |||||||
265,000 | 3.998%, 04/12/20475 | 286,972 | |||||
HomeBanc Mortgage Trust 2005-4 | |||||||
460,775 | 0.419% (1 Month LIBOR USD + 0.270%), 10/25/20355 | 461,801 | |||||
JP Morgan Chase Commercial Mortgage Securities Trust 2010-C2 | |||||||
665,804 | 4.070%, 11/15/20433,5 | 665,282 | |||||
MortgageIT Trust 2005-5 | |||||||
205,145 | 0.669% (1 Month LIBOR USD + 0.520%), 12/25/20355 | 203,370 | |||||
New Residential Mortgage Loan Trust 2016-3 | |||||||
177,507 | 3.250%, 09/25/20563,5 | 189,244 | |||||
New Residential Mortgage Loan Trust 2017-3 | |||||||
505,781 | 4.000%, 04/25/20573,5 | 547,974 | |||||
New Residential Mortgage Loan Trust 2017-6 | |||||||
213,893 | 4.000%, 08/25/20573,5 | 231,299 | |||||
See accompanying Notes to Financial Statements.
16
North Square Strategic Income Fund
SCHEDULE OF INVESTMENTS – Continued
As of October 31, 2020
| Principal | |||||||
| Amount | Value | ||||||
| MORTGAGE BACKED SECURITIES (Continued) | |||||||
New Residential Mortgage Loan Trust 2018-1 | |||||||
$ | 188,582 | 4.000%, 12/25/20573,5 | $ | 204,256 | |||
| TOTAL MORTGAGE BACKED SECURITIES | |||||||
(Cost $12,919,813) | 13,246,812 | ||||||
| Number | |||||||
| of Shares | |||||||
| PREFERRED STOCKS – 5.5% | |||||||
| COMMUNICATION SERVICES – 1.0% | |||||||
AT&T, Inc. | |||||||
| 29,100 | 4.750% | 735,939 | |||||
| CONSUMER STAPLES – 0.1% | |||||||
CHS, Inc. | |||||||
2,000 | 7.100%, (3 Month LIBOR USD + 4.298%)4 | 56,040 | |||||
1,000 | 7.500%4 | 27,440 | |||||
| 83,480 | |||||||
| FINANCIALS – 4.4% | |||||||
Affiliated Managers Group, Inc. | |||||||
2,000 | 5.875% | 53,620 | |||||
American Financial Group, Inc. | |||||||
22,795 | 5.625% | 622,303 | |||||
American International Group, Inc. | |||||||
23,000 | 5.850% | 623,300 | |||||
The Goldman Sachs Group, Inc. | |||||||
30,000 | 0.000% (3 Month LIBOR USD + 0.670%) | 704,100 | |||||
MetLife, Inc. | |||||||
23,000 | 4.750% | 603,980 | |||||
Morgan Stanley | |||||||
25,000 | 4.875% | 668,750 | |||||
| 3,276,053 | |||||||
| TOTAL PREFERRED STOCKS | |||||||
(Cost $3,519,325) | 4,095,472 | ||||||
| REAL ESTATE INVESTMENT TRUSTS (REITS) – 3.0% | |||||||
24,531 | AGNC Investment Corp. | 342,698 | |||||
1,460 | American Tower Corp. | 335,289 | |||||
38,914 | Chimera Investment Corp. | 324,932 | |||||
2,270 | Crown Castle International Corp. | 354,574 | |||||
2,486 | Digital Realty Trust, Inc. | 358,730 | |||||
5,322 | Prologis, Inc. | 527,942 | |||||
| TOTAL REITS | |||||||
(Cost $1,999,019) | 2,244,165 | ||||||
See accompanying Notes to Financial Statements.
17
North Square Strategic Income Fund
SCHEDULE OF INVESTMENTS – Continued
As of October 31, 2020
| Number | |||||||
| of Shares | Value | ||||||
| U.S. GOVERNMENT NOTES/BONDS – 0.6% | |||||||
United States Treasury Note/Bond | |||||||
265,000 | 1.625%, 12/31/2021 | $ | 269,591 | ||||
175,000 | 1.750%, 06/15/2022 | 179,512 | |||||
| TOTAL U.S. GOVERNMENT NOTES/BONDS | |||||||
(Cost $448,716) | 449,103 | ||||||
| SHORT TERM INVESTMENT – 4.7% | |||||||
3,504,234 | First American US Treasury Money Market Fund – Class V, 0.00%2 | 3,504,234 | |||||
| TOTAL SHORT TERM INVESTMENT | |||||||
(Cost $3,504,234) | 3,504,234 | ||||||
| TOTAL INVESTMENTS – 100.5% | |||||||
(Cost $72,144,151) | 74,645,898 | ||||||
Liabilities in Excess of Other Assets – (0.5)% | (358,495 | ) | |||||
| TOTAL NET ASSETS – 100.0% | $ | 74,287,403 | |||||
CMT – Constant Maturity Rate
LIBOR – London Inter-bank Offered Rate
PLC – Public Limited Company
1 | Foreign security denominated in U.S. Dollars. |
2 | The rate is the annualized seven-day yield at period end. |
3 | Security as defined in Rule 144A under the Securities Act of 1933 and classified as liquid under the Fund’s liquidity risk management program. Purchased in a private placement transaction; resale to the public may require registration or may extend only to qualified institutional buyers. At October 31, 2020, the value of these securities total $15,168,411, which represents 20.42% of total net assets. |
4 | Variable rate security based on a reference index and spread. The rate reported is the rate in effect as of October 31, 2020. |
5 | Variable rate security. The coupon is based on an underlying pool of loans. The rate reported is the rate in effect as of October 31, 2020. |
Investments are classified by industry pursuant to the Global Industry Classification Standard (GICS®), which was developed by and/or is the exclusive property of Morgan Stanley Capital International, Inc. (“MSCI”) and Standard & Poor’s Financial Services LLC (“S&P”). GICS is a service mark of MSCI and S&P and has been licensed for use by U.S. Bancorp Fund Services, LLC.
See accompanying Notes to Financial Statements.
18
North Square Strategic Income Fund
SUMMARY OF INVESTMENTS
As of October 31, 2020
| Percent of Total | ||||
Security Type/Sector | Net Assets | |||
Asset Backed Securities | 11.9 | % | ||
Common Stocks | ||||
Information Technology | 2.0 | % | ||
Consumer Discretionary | 1.9 | % | ||
Health Care | 0.4 | % | ||
Industrials | 0.4 | % | ||
Utilities | 0.4 | % | ||
Financials | 0.3 | % | ||
| Total Common Stocks | 5.4 | % | ||
Corporate Bonds | ||||
Financials | 24.5 | % | ||
Energy | 5.3 | % | ||
Consumer Discretionary | 4.1 | % | ||
Utilities | 3.1 | % | ||
Industrials | 2.9 | % | ||
Materials | 1.0 | % | ||
Consumer Staples | 0.9 | % | ||
Communication Services | 0.8 | % | ||
Health Care | 0.5 | % | ||
| Total Corporate Bonds | 43.1 | % | ||
ETFs | 3.8 | % | ||
Foreign Government Notes/Bonds | 4.6 | % | ||
Mortgage Backed Securities | 17.9 | % | ||
Preferred Stocks | ||||
Financials | 4.4 | % | ||
Communication Services | 1.0 | % | ||
Consumer Staples | 0.1 | % | ||
| Total Preferred Stocks | 5.5 | % | ||
REITs | 3.0 | % | ||
U.S. Government Notes/Bonds | 0.6 | % | ||
Short Term Investment | 4.7 | % | ||
| Total Investments | 100.5 | % | ||
Liabilities in Excess of Other Assets | (0.5 | )% | ||
| Total Net Assets | 100.0 | % | ||
See accompanying Notes to Financial Statements.
19
STATEMENTS OF ASSETS AND LIABILITIES
As of October 31, 2020
| North Square | ||||||||
| Advisory | North Square | |||||||
| Research All Cap | Strategic | |||||||
| Value Fund | Income Fund | |||||||
| Assets: | ||||||||
| Investments, at cost | $ | 3,604,459 | $ | 72,144,151 | ||||
| Investments, at value | $ | 4,385,712 | $ | 74,645,898 | ||||
| Receivables: | ||||||||
| Investment securities sold | — | 2,337,846 | ||||||
| Dividends and interest | 2,943 | 485,050 | ||||||
| Due from Advisor (Note 3) | — | 40,254 | ||||||
| Fund shares sold | — | 39,000 | ||||||
| Prepaid expenses | 13,854 | 13,491 | ||||||
| Total assets | 4,402,509 | 77,561,539 | ||||||
| Liabilities: | ||||||||
| Payables: | ||||||||
| Investment securities purchased | — | 2,212,239 | ||||||
| Due to custodian | — | 946,535 | ||||||
| Accrued expenses: | ||||||||
| Due to Advisor (Note 3) | 13,555 | — | ||||||
| Auditing fees | 2,331 | 35,549 | ||||||
| Fund administration fees | 2,290 | 24,050 | ||||||
| Transfer agent fees | 1,458 | 16,103 | ||||||
| Legal fees | 1,252 | 14,205 | ||||||
| Custody fees | 1,065 | 3,463 | ||||||
| Shareholder servicing fees (Note 6) | 869 | — | ||||||
| Due to Trustees | 371 | 6,769 | ||||||
| Chief Compliance Officer fees (Note 3) | 278 | 5,612 | ||||||
| Accrued other expenses | 939 | 9,611 | ||||||
| Total liabilities | 24,408 | 3,274,136 | ||||||
| Net Assets | $ | 4,378,101 | $ | 74,287,403 | ||||
| Components of Net Assets: | ||||||||
| Paid-in capital (par value of $0.01 per share | ||||||||
| with an unlimited number of shares authorized) | $ | 3,141,096 | $ | 68,210,369 | ||||
| Total distributable earnings | 1,237,005 | 6,077,034 | ||||||
| Net Assets | $ | 4,378,101 | $ | 74,287,403 | ||||
| Maximum Offering Price per Share: | ||||||||
| Class I Shares: | ||||||||
| Net assets applicable to shares outstanding | $ | 4,378,101 | $ | 74,287,403 | ||||
| Shares of beneficial interest issued and outstanding | 469,404 | 7,432,811 | ||||||
| Net asset value, redemption and offering price per share | $ | 9.33 | $ | 9.99 | ||||
See accompanying Notes to Financial Statements.
20
STATEMENTS OF OPERATIONS
For the Year Ended October 31, 2020
| North Square | ||||||||
| Advisory | North Square | |||||||
| Research All Cap | Strategic | |||||||
| Value Fund | Income Fund | |||||||
| Investment Income: | ||||||||
| Dividends (net of foreign withholding taxes | ||||||||
| and/or issuance fees of $0 and $0, respectively) | $ | 113,464 | $ | 469,057 | ||||
| Interest (net of foreign withholding taxes | ||||||||
| and/or issuance fees of $0 and $(6,234), respectively) | 658 | 1,017,111 | ||||||
| Total investment income | 114,122 | 1,486,168 | ||||||
| Expenses: | ||||||||
| Advisory fees (Note 3) | 46,818 | 321,907 | ||||||
| Fund administration fees | 19,703 | 108,551 | ||||||
| Registration fees | 17,694 | 18,465 | ||||||
| Legal fees | 10,848 | 28,466 | ||||||
| Transfer agent fees and expenses | 8,022 | 64,892 | ||||||
| Custody fees | 5,799 | 10,042 | ||||||
| Shareholder servicing fees (Note 6) | 4,227 | 42,369 | ||||||
| Chief Compliance Officer fees (Note 3) | 3,933 | 11,017 | ||||||
| Fund accounting fees | 3,363 | 9,017 | ||||||
| Auditing fees | 2,285 | 33,471 | ||||||
| Trustees’ fees and expenses | 1,979 | 15,611 | ||||||
| Shareholder reporting fees | 1,898 | 12,512 | ||||||
| Other expenses | 1,325 | 5,727 | ||||||
| Total expenses | 127,894 | 682,047 | ||||||
| Less advisory fees waived & expenses reimbursed | (64,869 | ) | (268,164 | ) | ||||
| Net expenses | 63,025 | 413,883 | ||||||
| Net Investment income | 51,097 | 1,072,285 | ||||||
| Net Realized and Unrealized Gain (Loss): | ||||||||
| Net realized gain on: | ||||||||
| Investments | 713,327 | 3,651,509 | ||||||
| Foreign currency transactions | — | 1,348 | ||||||
| Net realized gain | 713,327 | 3,652,857 | ||||||
| Net change in unrealized appreciation/depreciation on: | ||||||||
| Investments | (1,742,113 | ) | 2,021,398 | |||||
| Foreign currency transactions | — | 316 | ||||||
| Net change in unrealized appreciation/depreciation | (1,742,113 | ) | 2,021,714 | |||||
| Net realized and unrealized gain (loss) | (1,028,786 | ) | 5,674,571 | |||||
| Net increase (decrease) in net assets from operations | $ | (977,689 | ) | $ | 6,746,856 | |||
See accompanying Notes to Financial Statements.
21
STATEMENTS OF CHANGES IN NET ASSETS
North Square | ||||||||||||||||
Advisory | North Square | |||||||||||||||
Research All Cap | Strategic | |||||||||||||||
Value Fund | Income Fund | |||||||||||||||
| For the | For the | For the | For the | |||||||||||||
| Year Ended | Year Ended | Year Ended | Year Ended | |||||||||||||
| October 31, | October 31, | October 31, | October 31, | |||||||||||||
| 2020 | 2019 | 2020 | 2019 | |||||||||||||
| Increase (Decrease) in Net Assets from: | ||||||||||||||||
| Operations: | ||||||||||||||||
| Net investment income | $ | 51,097 | $ | 58,380 | $ | 1,072,285 | $ | 369,689 | ||||||||
| Net realized gain (loss) on investments | ||||||||||||||||
| and foreign currency translations | 713,327 | 971,913 | 3,652,857 | (32,451 | ) | |||||||||||
| Net change in unrealized appreciation/depreciation | ||||||||||||||||
| on investments and foreign currency translations | (1,742,113 | ) | 141,556 | 2,021,714 | 700,365 | |||||||||||
| Net increase (decrease) in net assets | ||||||||||||||||
| resulting from operations | (977,689 | ) | 1,171,849 | 6,746,856 | 1,037,603 | |||||||||||
| Distributions to shareholders | (1,010,006 | ) | (2,940,027 | ) | (975,490 | ) | (372,928 | ) | ||||||||
| Capital Transactions: | ||||||||||||||||
| Net proceeds from shares sold | 1,382,870 | 761,793 | 63,245,780 | 1,215,473 | ||||||||||||
| Reinvestment of distributions | 1,010,006 | 2,940,025 | 975,066 | 372,174 | ||||||||||||
Cost of shares redeemed1 | (5,411,998 | ) | (3,123,743 | ) | (6,345,626 | ) | (2,014,450 | ) | ||||||||
| Net increase (decrease) in net assets | ||||||||||||||||
| from capital transactions | (3,019,122 | ) | 578,075 | 57,875,220 | (426,803 | ) | ||||||||||
| Total increase (decrease) in net assets | (5,006,817 | ) | (1,190,103 | ) | 63,646,586 | 237,872 | ||||||||||
| Net Assets: | ||||||||||||||||
| Beginning of Period | 9,384,918 | 10,575,021 | 10,640,817 | 10,402,945 | ||||||||||||
| End of Period | $ | 4,378,101 | $ | 9,384,918 | $ | 74,287,403 | $ | 10,640,817 | ||||||||
| Capital Share Transactions: | ||||||||||||||||
| Shares sold | 146,298 | 59,931 | 6,857,165 | 133,622 | ||||||||||||
| Shares reinvested | 91,074 | 315,115 | 99,285 | 40,711 | ||||||||||||
| Shares redeemed | (574,580 | ) | (286,487 | ) | (640,318 | ) | (217,555 | ) | ||||||||
| Net increase (decrease) in capital share transactions | (337,208 | ) | 88,559 | 6,316,132 | (43,222 | ) | ||||||||||
1 | Net of redemption fee proceeds for the North Square Advisory Research All Cap Value Fund of $0 and $1,311, respectively. Net of redemption fee proceeds for the North Square Strategic Income Fund of $0 and $12, respectively. |
See accompanying Notes to Financial Statements.
22
North Square Advisory Research All Cap Value Fund
FINANCIAL HIGHLIGHTS
Class I
Per share operating performance.
For a capital share outstanding throughout each period.
| For the Year Ended October 31, | ||||||||||||||||||||
| 2020 | 2019 | 2018 | 2017 | 2016 | ||||||||||||||||
| Net asset value, beginning of period | $ | 11.63 | $ | 14.73 | $ | 14.77 | $ | 12.99 | $ | 15.02 | ||||||||||
| Income from Investment Operations: | ||||||||||||||||||||
Net investment income1 | 0.08 | 0.07 | 0.06 | 0.06 | 0.09 | |||||||||||||||
| Net realized and unrealized gain (loss) | (1.11 | ) | 0.85 | 1.27 | 2.68 | 0.26 | ||||||||||||||
| Total from investment operations | (1.03 | ) | 0.92 | 1.33 | 2.74 | 0.35 | ||||||||||||||
| Less Distributions: | ||||||||||||||||||||
| From net investment income | (0.07 | ) | (0.07 | ) | (0.05 | ) | (0.09 | ) | (0.13 | ) | ||||||||||
| From net realized gain | (1.20 | ) | (3.95 | ) | (1.32 | ) | (0.87 | ) | (2.28 | ) | ||||||||||
| Total distributions | (1.27 | ) | (4.02 | ) | (1.37 | ) | (0.96 | ) | (2.41 | ) | ||||||||||
Redemption Fee Proceeds1 | — | — | 2 | — | 2 | — | 2 | 0.03 | ||||||||||||
| Net asset value, end of period | $ | 9.33 | $ | 11.63 | $ | 14.73 | $ | 14.77 | $ | 12.99 | ||||||||||
Total Return3 | (10.63 | )% | 12.95 | % | 9.33 | % | 21.93 | % | 3.57 | % | ||||||||||
| Ratios and Supplemental Data: | ||||||||||||||||||||
Net assets, end of period (in thousands) | $ | 4,378 | $ | 9,385 | $ | 10,575 | $ | 15,603 | $ | 20,900 | ||||||||||
Ratio of expenses to average net assets: | ||||||||||||||||||||
| Before fees waived and expenses absorbed | 1.97 | % | 1.76 | % | 1.78 | % | 1.74 | % | 1.52 | % | ||||||||||
| After fees waived and expenses absorbed | 0.97 | %4 | 1.00 | % | 1.00 | % | 1.00 | % | 1.00 | % | ||||||||||
Ratio of net investment income (loss) to average net assets: | ||||||||||||||||||||
| Before fees waived and expenses absorbed | (0.21 | )% | (0.17 | )% | (0.39 | )% | (0.29 | )% | 0.18 | % | ||||||||||
| After fees waived and expenses absorbed | 0.79 | % | 0.59 | % | 0.39 | % | 0.45 | % | 0.70 | % | ||||||||||
Portfolio turnover rate | 49 | % | 26 | % | 42 | % | 31 | % | 51 | % | ||||||||||
1 | Based on average shares outstanding for the period. |
2 | Amount represents less than $0.005 per share. |
3 | Total returns would have been lower had expenses not been waived by the Advisor. Returns shown do not reflect the deduction of taxes that a shareholder would pay on of Fund shares. |
4 | The annual net expense ratio changed from 1.00% to 0.95% of net assets as of the close of business on February 21, 2020. |
See accompanying Notes to Financial Statements.
23
North Square Strategic Income Fund
FINANCIAL HIGHLIGHTS
Class I
Per share operating performance.
For a capital share outstanding throughout each period.
| For the Year Ended October 31, | ||||||||||||||||||||
| 2020 | 2019 | 2018 | 2017 | 2016 | ||||||||||||||||
| Net asset value, beginning of period | $ | 9.53 | $ | 8.97 | $ | 9.46 | $ | 9.47 | $ | 9.70 | ||||||||||
| Income from Investment Operations: | ||||||||||||||||||||
Net investment income1 | 0.23 | 0.32 | 0.35 | 0.39 | 0.40 | |||||||||||||||
| Net realized and unrealized gain (loss) | 0.48 | 0.56 | (0.49 | ) | (0.04 | ) | (0.08 | ) | ||||||||||||
| Total from investment operations | 0.71 | 0.88 | (0.14 | ) | 0.35 | 0.32 | ||||||||||||||
| Less Distributions: | ||||||||||||||||||||
| From net investment income | (0.25 | ) | (0.32 | ) | (0.34 | ) | (0.36 | ) | (0.42 | ) | ||||||||||
| From net realized gain | — | — | (0.01 | ) | — | (0.13 | ) | |||||||||||||
| Total distributions | (0.25 | ) | (0.32 | ) | (0.35 | ) | (0.36 | ) | (0.55 | ) | ||||||||||
Redemption Fee Proceeds1 | — | — | 2 | — | 2 | — | 2 | — | 2 | |||||||||||
| Net asset value, end of period | $ | 9.99 | $ | 9.53 | $ | 8.97 | $ | 9.46 | $ | 9.47 | ||||||||||
Total Return3 | 7.56 | % | 10.00 | % | (1.43 | )% | 3.83 | % | 3.42 | % | ||||||||||
| Ratios and Supplemental Data: | ||||||||||||||||||||
Net assets, end of period (in thousands) | $ | 74,287 | $ | 10,641 | $ | 10,403 | $ | 10,806 | $ | 12,463 | ||||||||||
Ratio of expenses to average net assets: | ||||||||||||||||||||
| Before fees waived and expenses absorbed | 1.48 | % | 1.76 | % | 2.27 | % | 2.49 | % | 1.99 | % | ||||||||||
| After fees waived and expenses absorbed | 0.90 | % | 0.90 | % | 0.90 | % | 0.90 | % | 0.91 | % | ||||||||||
Ratio of net investment income to average net assets: | ||||||||||||||||||||
| Before fees waived and expenses absorbed | 1.75 | % | 2.56 | % | 2.41 | % | 2.53 | % | 3.19 | % | ||||||||||
| After fees waived and expenses absorbed | 2.33 | % | 3.42 | % | 3.78 | % | 4.12 | % | 4.27 | % | ||||||||||
Portfolio turnover rate | 145 | % | 36 | % | 48 | % | 64 | % | 63 | % | ||||||||||
1 | Based on average shares outstanding for the period. |
2 | Amount represents less than $0.005 per share. |
3 | Total returns would have been lower had expenses not been waived by the Advisor. Returns shown do not reflect the deduction of taxes that a shareholder would pay on Fund distributions or the redemption of Fund shares. |
See accompanying Notes to Financial Statements.
24
North Square Funds
NOTES TO FINANCIAL STATEMENTS
October 31, 2020
Note 1 – Organization
The North Square Advisory Research All Cap Value Fund (“All Cap Value” or “All Cap Value Fund”) and North Square Strategic Income Fund (“Strategic Income” or “Strategic Income Fund”)(each a “Fund” and collectively the “Funds”) are organized as a series of the North Square Investments Trust, a Delaware statutory trust (the “Trust”) which is registered as an open-end management investment company under the Investment Company Act of 1940, as amended (the “1940 Act”). The All Cap Value Fund and Strategic Income Fund are diversified funds.
The All Cap Value Fund’s primary investment objective is to seek long-term capital appreciation. Effective the close of business on February 21, 2020, the All Cap Value Fund (the “Successor Fund”) acquired the assets and assumed the liabilities of the Advisory Research All Cap Value Fund (the “Predecessor Fund”), a series of Investment Managers Series Trust, which commenced operations on November 16, 2009.
The Strategic Income Fund’s primary investment objectives are to seek high current income and to seek long-term capital appreciation. Effective the close of business on February 21, 2020, the Strategic Income Fund (the “Successor Fund”) acquired the assets and assumed the liabilities of the Advisory Research Strategic Income Fund (the “Predecessor Fund”), a series of Investment Managers Series Trust, which commenced operations on December 31, 2012.
Each conversion was accomplished by the following tax free reorganizations in which each shareholder of the Predecessor Funds received the same aggregated net asset value of their respective Successor Fund as noted below:
| Net Unrealized | ||||
| Net Asset | Appreciation | |||
| Fund | Total Shares | Net Assets | Value/Share | (Depreciation) |
| All Cap Value Fund | 765,939 | $ 8,372,508 | $10.93 | $2,272,251 |
| Strategic Income Fund | 1,075,153 | $10,395,386 | $ 9.67 | $ 613,928 |
Each Fund is an investment company and accordingly follows the investment company accounting and reporting guidance of the Financial Accounting Standards Board (FASB) Accounting Standard Codification Topic 946 “Financial Services—Investment Companies”.
Note 2 – Accounting Policies
The following is a summary of the significant accounting policies consistently followed by the Funds in the preparation of their financial statements. The preparation of financial statements in conformity with accounting principles generally accepted in the United States of America (“GAAP”) requires management to make estimates and assumptions that affect the reported amounts and disclosures in the financial statements. Actual results could differ from these estimates.
(a) Valuation of Investments
Each Fund values equity securities at the last reported sale price on the principal exchange or in the principal over the counter (“OTC”) market in which such securities are traded, as of the close of regular trading on the NYSE on the day the securities are being valued or, if the last-quoted sales price is not readily available, the securities will be valued at the last bid or the mean between the last available bid and ask price. Securities traded on the NASDAQ are valued at the NASDAQ Official Closing Price (“NOCP”). Investments in open-end investment companies are valued at the daily closing net asset value of the respective investment company. Debt securities are valued by utilizing a price supplied by independent pricing service providers. The independent pricing service providers may use various valuation methodologies including matrix pricing and other analytical pricing models as well as market transactions and dealer quotations. These models generally consider such factors as yields or prices of bonds of comparable quality, type of issue, coupon, maturity, ratings and general market conditions. If a price is not readily available for a portfolio security, the security will be valued at fair value (the amount which the Fund might reasonably expect to receive for the security upon its current sale) as determined in good faith by the Fund’s advisor, subject to review and approval by the Valuation Committee, pursuant to procedures adopted by the Board of Trustees. The actions of the Valuation Committee are subsequently reviewed by the Board at its next regularly scheduled board meeting. The Valuation Committee meets as needed. The Valuation Committee is comprised of all the Trustees, but action may be taken by any one of the Trustees.
Fair value pricing may be applied to foreign securities held by the Funds upon the occurrence of an event after the close of trading on non-U.S. markets but before the close of trading on the NYSE when each Fund’s NAV is determined. If the event may result in a material adjustment to the price of the Fund’s foreign securities once non-U.S. markets open on the following business day (such as, for example, a significant surge or decline in the U.S. market), the Fund may value such foreign securities at fair value, taking into account the effect of such event, in order to calculate the Fund’s NAV. Other types of portfolio securities that the Fund may fair value include, but are not limited to: (1) investments that are illiquid or traded infrequently, including “restricted” securities and private
25
North Square Funds
NOTES TO FINANCIAL STATEMENTS – Continued
October 31, 2020
placements for which there is no public market; (2) investments for which, in the judgment of the advisor, the market price is stale; (3) securities of an issuer that has entered into a restructuring; (4) securities for which trading has been halted or suspended; and (5) fixed income securities for which there is not a current market value quotation.
Foreign securities traded in countries outside the U.S. are fair valued by utilizing the quotations of an independent pricing service or from a brokerage firm. The pricing service or broker will use a statistical analyses and quantitative models to adjust local prices using factors such as subsequent movement and changes in the prices of indexes, securities and exchange rates in other markets in determining fair value as of the time the Fund calculates the NAVs. The Board reviews the independent third party fair valuation analysis report quarterly.
The global outbreak of COVID-19 (commonly referred to as “coronavirus”) has disrupted economic markets and the prolonged economic impact is uncertain. The ultimate economic fallout from the pandemic, and the long-term impact on economies, markets, industries and individual issuers, are not known. The operational and financial performance of the issuers of securities in which the Funds invest depends on future developments, including the duration and spread of the outbreak, and such uncertainty may in turn adversely affect the value and liquidity of the Funds’ investments, impair the Funds’ ability to satisfy redemption requests, and negatively impact the Funds’ performance.
(b) Investment Transactions, Investment Income and Expenses
Investment transactions are accounted for on the trade date. Realized gains and losses on investments are determined on the identified cost basis. Dividend income is recorded net of applicable withholding taxes on the ex-dividend date and interest income is recorded on an accrual basis. Withholding taxes on foreign dividends, if applicable, are paid (a portion of which may be reclaimable) or provided for in accordance with the applicable country’s tax rules and rates and are disclosed in the Statements of Operations. Withholding tax reclaims are filed in certain countries to recover a portion of the amounts previously withheld. The Funds record a reclaim receivable based on a number of factors, including a jurisdiction’s legal obligation to pay reclaims as well as payment history and market convention. Discounts or premiums on debt securities are accreted or amortized to interest income over the lives of the respective securities using the effective interest method. Expenses incurred by the Trust with respect to more than one fund are allocated in proportion to the net assets of each fund except where allocation of direct expenses to each fund or an alternative allocation method can be more appropriately made.
(c) Federal Income Taxes
Each Fund intends to comply with the requirements of Subchapter M of the Internal Revenue Code applicable to regulated investment companies and to distribute substantially all of its net investment income and any net realized gains to its shareholders. Therefore, no provision is made for federal income or excise taxes. Due to the timing of dividend distributions and the differences in accounting for income and realized gains and losses for financial statement and federal income tax purposes, the fiscal year in which amounts are distributed may differ from the year in which the income and realized gains and losses are recorded by the Funds.
Accounting for Uncertainty in Income Taxes (the “Income Tax Statement”) requires an evaluation of tax positions taken (or expected to be taken) in the course of preparing a Fund’s tax returns to determine whether these positions meet a “more-likely-than-not” standard that, based on the technical merits, have a more than fifty percent likelihood of being sustained by a taxing authority upon examination. A tax position that meets the “more-likely-than-not” recognition threshold is measured to determine the amount of benefit to recognize in the financial statements. The Fund recognizes interest and penalties, if any, related to unrecognized tax benefits as income tax expense in the Statement of Operations.
The Income Tax Statement requires management of the Funds to analyze tax positions taken in the prior three open tax years, if any, and tax positions expected to be taken in the Funds’ current tax year, as defined by the IRS statute of limitations for all major jurisdictions, including federal tax authorities and certain state tax authorities. As of and during the open years ended October 31, 2017-2020 the Funds did not have a liability for any unrecognized tax benefits. The Funds have no examination in progress and are not aware of any tax positions for which it is reasonably possible that the total amounts of unrecognized tax benefits will significantly change in the next twelve months.
The Funds may utilize equalization accounting for tax purposes and designate earnings and profits, including net realized gains distributed to shareholders on redemption of shares, as part of the dividends paid deduction for income tax purposes.
(d) Distributions to Shareholders
The Strategic Income Fund will make distributions of net investment income monthly. The Advisory Research All Cap Value Fund will make distributions of net investment income, if any, at least annually. Each Fund makes distributions of its net capital gains, if any, at least annually. Distributions to shareholders are recorded on the ex-dividend date. The amount and timing of distributions are determined in accordance with federal income tax regulations, which may differ from GAAP.
26
North Square Funds
NOTES TO FINANCIAL STATEMENTS – Continued
October 31, 2020
The character of distributions made during the year from net investment income or net realized gains may differ from the characterization for federal income tax purposes due to differences in the recognition of income, expense and gain (loss) items for financial statement and tax purposes.
(e) Recent Accounting Pronouncement
In March 2020, FASB issued Accounting Standards Update 2020-04, Reference Rate Reform: Facilitation of the Effects of Reference Rate Reform on Financial Reporting (“ASU 2020-04”). The main objective of ASU 2020-04 is to provide relief to companies that will be impacted by the expected change in benchmark interest rates at the end of 2021, when participating banks will no longer be required to submit London Inter-bank Offered Rate (“LIBOR”) quotes by the UK Financial Conduct Authority. ASU 2020-04 allows companies to, provided the only change to existing contracts are a change to an approved benchmark interest rate, account for modifications as a continuance of the existing contract without additional analysis. In addition, derivative contracts that qualified for hedge accounting prior to modification, will be allowed to continue to receive such treatment, even if critical terms change due to a change in the benchmark interest rate. For new and existing contracts, the Funds may elect to apply the amendments as of March 12, 2020 through December 31, 2022. Management is currently assessing the impact of the adoption of ASU 2020-04 to the Funds’ financial statements and various filings.
Note 3 – Investment Advisory and Other Agreements
The Trust, on behalf of the Funds, entered into an Investment Advisory Agreement (the “Agreement”) with North Square Investments, LLC (the “Advisor” or “NSI”). Under the terms of the Agreement, the Funds pay a monthly investment advisory fee to the Advisor based on each Fund’s average daily net assets. Fees paid to the Advisor for the period ended October 31, 2020 are reported on the Statements of Operations. The annual rates are listed by Fund in the below table:
| Fund | Investment Advisory Fees |
All Cap Value Fund | 0.70% |
Strategic Income Fund | 0.70% |
Prior to the close of business on February 21, 2020, the contractual advisory fees due to the Predecessor Funds of the All Cap Value Fund and Strategic Income Fund were 0.75% and 0.70%, respectively.
The Advisor engages Advisory Research, Inc. to manage the All Cap Value Fund and engages Red Cedar Investment Management, LLC to manage the Strategic Income Fund (each a “Sub-Advisor” and collectively the “Sub-Advisors”). The Advisor pays the Sub-Advisors from its advisory fees.
The Advisor has contractually agreed to waive its fees and, if necessary, to absorb other operating expenses to ensure that total annual operating expenses (excluding taxes, leverage interest, brokerage commissions, dividend and interest expenses on short sales, acquired fund fees and expenses in accordance with Form N-1A, expenses incurred in connection with any merger, reorganization, or extraordinary expenses such as litigation expenses) for the All Cap Value Fund and Strategic Income Fund do not exceed 0.95% and 0.90%, respectively. The agreements are effective until February 28, 2022 and may be terminated before this date only by the Trust’s Board of Trustees.
The Funds’ advisor is permitted to seek reimbursement from the Funds, subject to certain limitations, of fees waived or payments made to the Funds for a period ending thirty-six months after the date of the waiver or payment. This reimbursement may be requested from the Funds if the reimbursement will not cause the Funds’ annual expense ratio to exceed the lesser of (a) the expense limitation amount in effect at the time such fees were waived or payments made, or (b) the expense limitation amount in effect at the time of the reimbursement. At October 31, 2020, the amount of these potentially recoverable expenses in the All Cap Value Fund was $253,108 and in the Strategic Income Fund was $510,303. The Advisor may recapture all or a portion of this amount no later than October 31 of the years stated below:
| All Cap Value | Strategic Income | |||||||
2021 | $ | 102,131 | $ | 144,623 | ||||
2022 | $ | 75,274 | $ | 92,526 | ||||
2023 | $ | 75,703 | $ | 273,154 | ||||
Total | $ | 253,108 | $ | 510,303 | ||||
Effective the close of business on February 21, 2020, U.S. Bancorp Fund Services, LLC, doing business as U.S. Bank Global Fund Services, serves as the Funds’ fund accountant, transfer agent and administrator. U.S. Bank, N.A., serves as the Funds’ custodian. Prior to the close of business on February 21, 2020, UMB Fund Services, Inc. served as the Funds’ fund accountant, transfer agent and administrator, and UMB Bank N.A. served as the Funds’ custodian. The Funds’ allocated fees incurred for fund accounting, fund administration, transfer agency and custody services for the period ended October 31, 2020 are reported on the Statement of Operations.
27
North Square Funds
NOTES TO FINANCIAL STATEMENTS – Continued
October 31, 2020
Effective the close of business on February 21, 2020, Compass Distributors, LLC serves as the Funds’ distributor (the “Distributor”). Prior to the close of business on February 21, 2020, IMST Distributors, LLC served as the Funds’ distributor. The Distributor does not receive compensation from the Funds for its distribution services; the Advisor pays the Distributor a fee for its distribution related services.
Effective the close of business on February 21, 2020, Cipperman Compliance Services provides Chief Compliance Officer (“CCO”) services to the Funds. Prior to the close of business on February 21, 2020, Dziura Compliance Consulting, LLC provided CCO services to the Investment Managers Series Trust to which the Funds belonged. The Funds’ allocated fees incurred for CCO services for the period ended October 31, 2020 are reported on the Statement of Operations.
Note 4 – Federal Income Taxes
At October 31, 2020, gross unrealized appreciation and depreciation on investments, based on cost for federal income tax purposes were as follows:
| All Cap Value | Strategic Income | |||||||
Cost of investments | $ | 3,655,188 | $ | 72,144,151 | ||||
Gross unrealized appreciation | $ | 892,893 | $ | 3,012,025 | ||||
Gross unrealized depreciation | (162,369 | ) | (509,962 | ) | ||||
Net unrealized appreciation on investments | $ | 730,524 | $ | 2,502,063 | * | |||
| * | Includes $316 of unrealized appreciation on foreign currency. |
The difference between cost amounts for financial statement and federal income tax purposes is due primarily to timing differences in recognizing certain gains and losses in security transactions.
GAAP requires that certain components of net assets be reclassified between financial and tax reporting. These reclassifications have no effect on net assets or net asset value per share. For the year ended October 31, 2020, permanent differences in book and tax accounting have been reclassified to paid in capital, accumulated net investment income/loss and accumulated net realized gain/loss (total distributable earnings) as follows:
| Increase (Decrease) | ||
| Total | ||
| Distributable | ||
| Paid In Capital | Earnings | |
All Cap Value | $260,371 | $(260,371) |
Strategic Income | $170,543 | $(170,543) |
As of October 31, 2020, the components of accumulated earnings (deficit) on a tax basis for the Funds were as follows:
| All Cap Value | Strategic Income | |||||||
Undistributed ordinary income | $ | 39,922 | $ | 3,323,121 | ||||
Undistributed long-term gains | 466,559 | 251,850 | ||||||
Accumulated earnings | $ | 506,481 | $ | 3,574,971 | ||||
Accumulated capital and other losses | — | — | ||||||
Unrealized appreciation on investments | 730,524 | 2,502,063 | ||||||
Total accumulated earnings | $ | 1,237,005 | $ | 6,077,034 | ||||
The tax character of distributions paid during the period ended October 31, 2020 and fiscal year ended October 31, 2019 were as follows:
| All Cap Value | Strategic Income | |||||||||||||||
| October 31, | October 31, | October 31, | October 31, | |||||||||||||
| Distributions paid from: | 2020 | 2019 | 2020 | 2019 | ||||||||||||
| Ordinary income | $ | 137,582 | $ | 315,514 | $ | 975,490 | $ | 372,928 | ||||||||
| Net long-term capital gains | 872,424 | 2,626,513 | — | — | ||||||||||||
| Total distributions paid | $ | 1,010,006 | $ | 2,940,027 | $ | 975,490 | $ | 372,928 | ||||||||
As of October 31, 2020, the Funds did not have any accumulated capital loss carryforwards.
To the extent that a Fund may realize future net capital gains, those gains will be offset by any of its unused capital loss carryforward. Future capital loss carryover utilization in any given year may be subject to Internal Revenue Code limitations.
28
North Square Funds
NOTES TO FINANCIAL STATEMENTS – Continued
October 31, 2020
Note 5 – Investment Transactions
For the period ended October 31, 2020, purchases and sales of investments were as follows:
| Purchases | Sales | |||||||
All Cap Value Fund | $ | 2,981,639 | $ | 6,863,495 | ||||
Strategic Income Fund | $ | 119,616,974 | $ | 64,071,308 | ||||
Note 6 – Shareholder Servicing Plan
The Trust, on behalf of the Funds, has adopted a Shareholder Servicing Plan to pay a fee at an annual rate of up to 0.15% of each Fund’s average daily net assets of shares serviced by shareholder servicing agents who provide administrative and support services to their customers.
For the period ended October 31, 2020, shareholder servicing fees incurred are disclosed on the Statements of Operations.
Note 7 – Indemnifications
In the normal course of business, the Funds enter into contracts that contain a variety of representations which provide general indemnifications. The Funds’ maximum exposure under these arrangements is unknown, as this would involve future claims that may be made against the Funds that have not yet occurred. However, the Funds expect the risk of loss to be remote.
Note 8 – Fair Value Measurements and Disclosure
Fair Value Measurements and Disclosures defines fair value, establishes a framework for measuring fair value in accordance with GAAP, and expands disclosure about fair value measurements. It also provides guidance on determining when there has been a significant decrease in the volume and level of activity for an asset or a liability, when a transaction is not orderly, and how that information must be incorporated into a fair value measurement.
Under Fair Value Measurements and Disclosures, various inputs are used in determining the value of the Funds’ investments. These inputs are summarized into three broad Levels as described below:
| • | Level 1 – | Unadjusted quoted prices in active markets for identical assets or liabilities that the Fund has the ability to access. | |
| • | Level 2 – | Observable inputs other than quoted prices included in Level 1 that are observable for the asset or liability, either directly or indirectly. These inputs may include quoted prices for the identical instrument on an inactive market, prices for similar instruments, interest rates, prepayment speeds, credit risk, yield curves, default rates and similar data. | |
| • | Level 3 – | Unobservable inputs for the asset or liability, to the extent relevant observable inputs are not available, representing the Fund’s own assumptions about the assumptions a market participant would use in valuing the asset or liability, and would be based on the best information available. |
The availability of observable inputs can vary from security to security and is affected by a wide variety of factors, including for example, the type of security, whether the security is new and not yet established in the marketplace, the liquidity of markets, and other characteristics particular to the security. To the extent that valuation is based on models or inputs that are less observable or unobservable in the market, the determination of fair value requires more judgment. Accordingly, the degree of judgment exercised in determining fair value is greatest for instruments categorized in Level 3.
The inputs to measure fair value may fall into different Levels of the fair value hierarchy. In such cases, for disclosure purposes, the Level in the fair value hierarchy within which the fair value measurement falls in its entirety, is determined based on the lowest Level input that is significant to the fair value measurement in its entirety.
The inputs or methodology used for valuing securities are not an indication of the risk associated with investing in those securities. The following is a summary of the inputs used, as of October 31, 2020, in valuing the Funds’ assets carried at fair value:
| All Cap Value Fund | Level 1 | Level 2* | Level 3** | Total | ||||||||||||
| Investments | ||||||||||||||||
Common Stocks1 | $ | 4,209,413 | $ | — | $ | — | $ | 4,209,413 | ||||||||
| Short-Term Investment | 176,299 | — | — | 176,299 | ||||||||||||
| Total Investments | $ | 4,385,712 | $ | — | $ | — | $ | 4,385,712 | ||||||||
1 | All common stocks held in the Fund are Level 1 securities. For a detailed break-out of common stocks by major sector classification, please refer to the Schedule of Investments. | |
| * | The Fund did not hold any Level 2 securities at period end. | |
| ** | The Fund did not hold any Level 3 securities at period end. |
29
North Square Funds
NOTES TO FINANCIAL STATEMENTS – Continued
October 31, 2020
| Strategic Income Fund | Level 1 | Level 2 | Level 3* | Total | ||||||||||||
| Investments | ||||||||||||||||
| Asset Backed Securities | $ | — | $ | 8,843,170 | $ | — | $ | 8,843,170 | ||||||||
Common Stocks1 | 4,002,213 | — | — | 4,002,213 | ||||||||||||
| Corporate Bonds | — | 31,978,502 | — | 31,978,502 | ||||||||||||
ETFs1 | 2,841,907 | — | — | 2,841,907 | ||||||||||||
| Foreign Government Securities | — | 3,440,320 | — | 3,440,320 | ||||||||||||
| Mortgage Backed Securities | — | 13,246,812 | — | 13,246,812 | ||||||||||||
Preferred Stocks1 | 4,095,472 | — | — | 4,095,472 | ||||||||||||
REITs1 | 2,244,165 | — | — | 2,244,165 | ||||||||||||
| United States Government Securities | — | 449,103 | — | 449,103 | ||||||||||||
| Short-Term Investments | 3,504,234 | — | — | 3,504,234 | ||||||||||||
| Total Investments | $ | 16,687,991 | $ | 57,957,907 | $ | — | $ | 74,645,898 | ||||||||
1 | All common stocks, ETFs, preferred stocks, and REITs held in the Fund are Level 1 securities. For a detailed break-out of common stocks by major sector classification, please refer to the Schedule of Investments. |
| * | The Fund did not hold any Level 3 securities at period end. |
Note 9 – Events Subsequent to the Fiscal Period End
The Funds have adopted financial reporting rules regarding subsequent events which require an entity to recognize in the financial statements the effects of all subsequent events that provide additional evidence about conditions that existed at the date of the balance sheet. Management has evaluated the Funds’ related events and transactions that occurred through the date of issuance of the Funds’ financial statements.
At a regular meeting of the Board of Trustees on December 16, 2020, the Advisor and the Board approved a resolution to acquire the Stadion Tactical Growth Fund, Stadion Tactical Defensive Fund, and Stadion Trilogy Alternative Return Fund (the “Stadion Funds”). The Stadion Funds will be reorganized into separate funds within the North Square Investments Trust upon receiving the approval by the shareholders of each Stadion Fund.
30
REPORT OF INDEPENDENT REGISTERED PUBLIC ACCOUNTING FIRM
To the Board of Trustees and
Shareholders of North Square Investments Trust
Opinion on the Financial Statements
We have audited the accompanying statements of assets and liabilities of the North Square Advisory Research All Cap Value Fund (formerly Advisory Research All Cap Value Fund) and North Square Strategic Income Fund (formerly Advisory Research Strategic Income Fund) (the “Funds”), each a series of North Square Investments Trust (formerly each a series of Investment Managers Series Trust) (the “Trust”), including the schedules of investments, as of October 31, 2020, the related statements of operations for the year then ended, the statements of changes in net assets for each of the two years in the period then ended, the financial highlights for each of the five years in the period then ended, and the related notes (collectively referred to as the “financial statements”). In our opinion, the financial statements and financial highlights referred to above present fairly, in all material respects, the financial position of the Funds as of October 31, 2020, the results of their operations for the year then ended, the changes in their net assets for each of the two years in the period then ended, and their financial highlights for each of the five years in the period then ended, in conformity with accounting principles generally accepted in the United States of America.
Basis for Opinion
These financial statements are the responsibility of the Funds’ management. Our responsibility is to express an opinion on the Funds’ financial statements based on our audits. We are a public accounting firm registered with the Public Company Accounting Oversight Board (United States) (“PCAOB”) and are required to be independent with respect to the Funds in accordance with the U.S. federal securities laws and the applicable rules and regulations of the Securities and Exchange Commission and the PCAOB. We have served as the auditor of one or more of the funds in the Trust since 2009.
We conducted our audits in accordance with the standards of the PCAOB. Those standards require that we plan and perform the audits to obtain reasonable assurance about whether the financial statements are free of material misstatement, whether due to error or fraud. The Funds are not required to have, nor were we engaged to perform, an audit of the Funds’ internal control over financial reporting. As part of our audits we are required to obtain an understanding of internal control over financial reporting, but not for the purpose of expressing an opinion on the effectiveness of the Funds’ internal control over financial reporting. Accordingly, we express no such opinion.
Our audits included performing procedures to assess the risks of material misstatement of the financial statements, whether due to error or fraud, and performing procedures that respond to those risks. Such procedures included examining, on a test basis, evidence regarding the amounts and disclosures in the financial statements. Our audits also included evaluating the accounting principles used and significant estimates made by management, as well as evaluating the overall presentation of the financial statements. Our procedures included confirmation of securities owned as of October 31, 2020 by correspondence with the custodian and brokers or by other appropriate auditing procedures where replies from broker were not received. We believe that our audits provide a reasonable basis for our opinion.
 | |
| TAIT, WELLER & BAKER LLP |
Philadelphia, Pennsylvania
December 30, 2020
31
North Square Funds
SUPPLEMENTAL INFORMATION
Corporate Dividends Received Deduction
For corporate shareholders, the percent of ordinary income distributions qualifying for the corporate dividends received deduction for the fiscal year ended October 31, 2020 was as follows:
| All Cap Value Fund | 100.00% | |
| Strategic Income Fund | 9.47% |
Qualified Dividend Income
For the fiscal year ended October 31, 2020, certain dividends paid by the Funds may be subject to a maximum tax rate of 23.8%, as provided for by the Jobs and Growth Tax Relief Reconciliation Act of 2003. The percentage of dividends declared from ordinary income designated as qualified dividend income was as follows:
| All Cap Value Fund | 100.00% | |
| Strategic Income Fund | 9.66% |
Long-Term Capital Gain Designation
For the fiscal year ended October 31, 2020, the Funds designate a portion of distributions as 20.00% rate gain distributions for the purposed of the dividends paid deduction. The dollar amount by fund was as follows:
| All Cap Value Fund | $ | 872,424 | ||
| Strategic Income Fund | $ | — |
Trustees and Officers Information
Additional information about the Trustees is included in each Fund’s Statement of Additional Information which is available, without charge, upon request by calling (855) 551-5521 or on the Funds’ website at www.northsquareinvest.com. The Trustees and officers of each Fund and their principal occupations during the past five years are as follows:
| Number of | |||||
| Portfolios | |||||
| in Fund | Other Directorship/ | ||||
Name, Addressa, | Complex | Trusteeship | |||
| Year of Birth and | Term of Office | Overseen | Positions held by | ||
| Position(s) with | Position with | and Length of | Principal Occupations During | by | Trustee During |
| the Trust | the Trust | Time Servedb | the Past Five Years or Longer | Trusteec | the Past 5 Years |
| Independent Trustees | |||||
David B. Boon | Trustee | 08/2018 to present | Chief Financial Officer and Managing | 9 | None |
(1960) | Director, Eagle Capital Management, LLC | ||||
(since 2018); Chief Financial Officer and | |||||
Partner, Cedar Capital, LLC (2013 – 2018). |
32
North Square Funds
SUPPLEMENTAL INFORMATION – Continued
| Number of | |||||
| Portfolios | |||||
| in Fund | Other Directorship/ | ||||
Name, Addressa, | Complex | Trusteeship | |||
| Year of Birth and | Term of Office | Overseen | Positions held by | ||
| Position(s) with | Position with | and Length of | Principal Occupations During | by | Trustee During |
| the Trust | the Trust | Time Servedb | the Past Five Years or Longer | Trusteec | the Past 5 Years |
Donald J. Herrema | Chairman of the | 08/2018 to present | Vice Chair and Chief Investment Officer, | 9 | Chairman and Director |
(1952) | Board and Trustee | Independent Life Insurance Company | Emeritus, TD Funds | ||
(since 2018); Financial Services Executive, | USA (2009 – 2019); | ||||
Advisor and Founder of BlackSterling | Director, Abel Noser | ||||
Partners, LLC (private investments and | Holdings, LLC (since | ||||
advisory firm) (since 2004); Executive Vice | 2016); Member, USC | ||||
Chairman and Senior Advisor at Kennedy | Marshall Business School | ||||
Wilson (real estate investment company) | Board (since 2010); | ||||
(2009 – 2016). | President and Trustee, | ||||
Christ Church | |||||
(2008 – 2016); Director, | |||||
Lepercq de Neuflize | |||||
(2009 – 2016); Chairman | |||||
and Trustee Emeritus | |||||
(since 2014), Director, | |||||
FEG Investment Advisors | |||||
(since 2017); Director, | |||||
Independent Life | |||||
Insurance Company | |||||
(since 2018). | |||||
Catherine A. Zaharis | Trustee | 08/2018 to present | Professor of Practice (since 2019), Director, | 9 | Director, The |
(1960) | Professional/Employer Development, | Vantagepoint Funds | |||
Finance Department (2015 – 2019), Adjunct | (2015 – 2016). | ||||
Lecturer (2010 – 2019), and Business Director, | |||||
MBA Finance Career Academy (2008 – 2015), | |||||
University of Iowa, Tippie College of Business; | |||||
Chair (2013 – 2016), Director (1999 – 2016), | |||||
and Investment Committee Member | |||||
(1999 – 2013) and Chair (2003 – 2013), | |||||
University of Iowa Foundation. | |||||
Interested Trusteesd | |||||
Mark D. Goodwin | Trustee and | 08/2018 to present | Chief Executive Officer, North Square | 9 | None |
(1964) | President | Investments LLC (since July 2018); President | |||
and Chief Operating Officer (2015 – July 2018) | |||||
and Executive Vice President (2014 – 2015), | |||||
Oak Ridge Investments, LLC. |
33
North Square Funds
SUPPLEMENTAL INFORMATION – Continued
| Number of | |||||
| Portfolios | |||||
| in Fund | Other Directorship/ | ||||
Name, Addressa, | Complex | Trusteeship | |||
| Year of Birth and | Term of Office | Overseen | Positions held by | ||
| Position(s) with | Position with | and Length of | Principal Occupations During | by | Trustee During |
| the Trust | the Trust | Time Servedb | the Past Five Years or Longer | Trusteec | the Past 5 Years |
| Officers of the Trust | |||||
Alan E. Molotsky | Treasurer | 08/2018 to present | Chief Financial Officer, Chief Compliance Officer, | N/A | N/A |
(1956) | and | General Counsel and Senior Managing Director, | |||
Secretary | North Square Investments, LLC (since July 2018); | ||||
Chief Financial Officer, Chief Compliance Officer, | |||||
General Counsel and Executive Vice President, | |||||
Oak Ridge Investments LLC (2004 – July 2018). | |||||
David J. Gaspar | Vice | 08/2018 to present | Chief Operations and Information Officer and | N/A | N/A |
(1954) | President | Senior Managing Director, North Square | |||
Investments, LLC (since July 2018); Chief | |||||
Operations Officer, Chief Information Officer, | |||||
Chief Information Security Officer and Executive | |||||
Vice President, Oak Ridge Investments, LLC | |||||
(2000 – July 2018). | |||||
Douglas N. Tyre | Chief | 09/2018 to present | Assistant Compliance Director, Cipperman | N/A | N/A |
(1980) | Compliance | Compliance Services, LLC (since 2014). | |||
Officer |
| a. | The business address of each Trustee and officer is c/o North Square Investments, LLC, 10 South LaSalle Street, Suite 1925, Chicago, Illinois 60603. |
| b. | Trustees and officers serve until their successors are duly elected and qualified. |
| c. | The term “Fund Complex” applies to the nine portfolios that currently comprise the Trust, which consists of the two Funds, the North Square Oak Ridge Small Cap Growth Fund, the North Square Oak Ridge All Cap Growth Fund, the North Square Oak Ridge Dividend Growth Fund, the North Square Multi Strategy Fund, the North Square Dynamic Small Cap Fund, the North Square Altrinsic International Equity Fund, and the North Square McKee Bond Fund. |
| d. | Mr. Goodwin is considered to be an “interested person” of the Trust as that term is defined in the 1940 Act by virtue of his positions with the Adviser. |
Liquidity Risk Management Program
In accordance with Rule 22e-4 under the Investment Company Act of 1940, as amended (the “Liquidity Rule”), the North Square Investments Trust (the “Trust”) has adopted and implemented a liquidity risk management program (the “Program”) for the funds within the Trust (the “Funds”). The Program seeks to assess and manage each Funds’ liquidity risk. “Liquidity risk” is defined under the Liquidity Rule as the risk that each Fund is unable to meet redemption requests without significantly diluting remaining investors’ interests in the Fund. The Trust’s Board of Trustees (the “Board”) has approved the designation of the Funds’ investment adviser as the administrator for the Program (the “Trust Program Administrator”).
At its meeting on December 16, 2020, the Board received and reviewed a written report (the “Report”) from the Trust’s Vice President, on behalf of the Trust Program Administrator, concerning the operation of the Program for the period from the Program’s inception on June 1, 2019 through September 30, 2020 (the “Period”). The Report noted that the Program complied with the key factors for consideration under the Liquidity Rule for assessing, managing and periodically reviewing a Fund’s liquidity risk, including the following: (1) the periodic assessment (no less frequently than annually) of certain factors that influence each Fund’s liquidity risk; (2) the periodic classification (no less frequently than monthly) of the Fund’s investments into one of four liquidity categories that reflect an estimate of their liquidity under current market conditions; (3) a 15% limit on the acquisition of “illiquid investments” (as defined under the Liquidity Rule); (4) to the extent a Fund does not invest primarily in “highly liquid investments” (as defined under the Liquidity Rule), the determination of a minimum percentage of the Fund’s assets that generally will be invested in highly liquid investments (an “HLIM”); (5) if a Fund has established an HLIM, the periodic review (no less frequently than annually) of the HLIM and the adoption of policies and procedures for responding to a shortfall of the Fund’s highly liquid investments below its HLIM; and (6) periodic reporting to the Board.
The Report summarized the operation of the Program and the information and factors considered by the Trust Program Administrator in assessing whether the Program has been adequately and effectively implemented with respect to the Funds. The Report considered each Fund’s liquidity risk under both normal and reasonably foreseeable stressed market conditions using certain factors required by the
34
North Square Funds
SUPPLEMENTAL INFORMATION – Continued
Rule and the Program, to the extent deemed appropriate by the Trust Program Administrator. The Report stated that the Funds have retained ICE Data Services, a third-party vendor, to provide a liquidity risk classification specified by the Rule. The Report also noted that each Fund primarily held investments that were classified as highly liquid during the review period and that each Fund’s portfolio is expected to continue to primarily hold highly liquid investments. Thus, the Trust Program Administrator concluded in the Report that each Fund is considered a “primarily highly liquid fund” (as defined in the Rule and Program) and each Fund can therefore rely on the exclusion in the Rule from the requirements to establish an HLIM and to adopt policies and procedures for responding to a HLIM shortfall. There were no material changes to the Program during the Period.
Based on its review, the Report of the Trust Program Administrator concluded that the Program is reasonably designed to assess and manage liquidity risk and has been and continues to be adequately and effectively implemented to monitor and, as applicable, respond to each Funds’ liquidity developments.
35
North Square Funds
EXPENSE EXAMPLES
For the Six Months Ended October 31, 2020 (Unaudited)
Expense Examples
As a shareholder of the Funds, you incur two types of costs: (1) transaction costs, including redemption fees; and (2) ongoing costs, including management fees; and other Fund expenses. The examples below are intended to help you understand your ongoing costs (in dollars) of investing in the Funds and to compare these costs with the ongoing costs of investing in other mutual funds.
These examples are based on an investment of $1,000 invested at the beginning of the period and held for the entire six month period from May 1, 2020 to October 31, 2020.
Actual Expenses
The information in the row titled “Actual Performance” of the table below provides actual account values and actual expenses. You may use the information in these columns, together with the amount you invested, to estimate the expenses that you paid over the period. Simply divide your account value by $1,000 (for example, an $8,600 account value divided by $1,000 = 8.6), then multiply the result by the number in the appropriate row for your share class, in the column titled “Expenses Paid During Period” to estimate the expenses you paid on your account during this period.
Hypothetical Example for Comparison Purposes
The information in the row titled “Hypothetical (5% annual return before expenses)” of the table below provides hypothetical account values and hypothetical expenses based on each Fund’s actual expense ratios and an assumed rate of return of 5% per year before expenses, which is not the Fund’s actual return. The hypothetical account values and expenses may not be used to estimate the actual ending account balance or expenses you paid for the period. You may use this information to compare the ongoing costs of investing in the Fund and other funds. To do so, compare these 5% hypothetical examples with the 5% hypothetical examples that appear in the shareholder reports of the other funds.
Please note that the expenses shown in the table are meant to highlight your ongoing costs only and do not reflect any transaction costs, such as sales charges (loads) or redemption fees. Therefore, the information in the row titled “Hypothetical (5% annual return before expenses)” is useful in comparing ongoing costs only, and will not help you determine the relative total costs of owning different funds. In addition, if these transactional costs were included, your costs would have been higher.
| Beginning | Ending | Expense Paid | ||
| Account | Account | During | ||
| Value | Value | Period* | ||
| All Cap Value Fund | 5/1/20 | 10/31/20 | 5/1/20 – 10/31/20 | |
Class I | Actual Performance | $1,000.00 | $1,071.30 | $4.95 |
Hypothetical (5% annual return before expenses) | $1,000.00 | $1,020.36 | $4.82 | |
| * | Expenses are equal to the Fund’s annualized expense ratios of 0.95% for Class I, multiplied by the average account value over the period, multiplied by 184/366 (to reflect the sixth month period). The expense ratios reflect an expense waiver. Assumes all dividends and distributions were reinvested. |
| Beginning | Ending | Expense Paid | ||
| Account | Account | During | ||
| Value | Value | Period* | ||
| Strategic Income Fund | 5/1/20 | 10/31/20 | 5/1/20 – 10/31/20 | |
Class I | Actual Performance | $1,000.00 | $1,043.80 | $4.62 |
Hypothetical (5% annual return before expenses) | $1,000.00 | $1,020.61 | $4.57 | |
| * | Expenses are equal to the Fund’s annualized expense ratios of 0.90% for Class I, multiplied by the average account value over the period, multiplied by 184/366 (to reflect the sixth month period). The expense ratios reflect an expense waiver. Assumes all dividends and distributions were reinvested. |
36
North Square Funds
Advisor
North Square Investments, LLC
10 South LaSalle Street, Suite 1925
Chicago, Illinois 60603
| Sub-Advisor | Sub-Advisor |
| Advisory Research, Inc. | Red Cedar Investment Management, LLC |
| Two Prudential Plaza | 333 Bridge Street NW, Suite 601 |
| 180 N. Stetson Avenue, Suite 5500 | Grand Rapids, Michigan 49504 |
| Chicago, Illinois 60601 |
Independent Registered Public Accounting Firm
Tait, Weller & Baker LLP
50 South 16th Street, Suite 2900
Philadelphia, Pennsylvania 19102
Custodian
U.S. Bank, N.A.
1555 N. RiverCenter Drive, Suite 300
Milwaukee, Wisconsin 53212
Fund Administrator, Transfer Agent and Fund Accountant
U.S. Bank Global Fund Services
615 East Michigan Street
Milwaukee, Wisconsin 53202
Distributor
Compass Distributors LLC
Three Canal Plaza, Suite 100
Portland, Maine 04101
www.foreside.com
FUND INFORMATION
| Fund Name | Ticker | CUSIP | |
North Square Advisory Research All Cap Value Fund | Class I | ADVGX | 66263L775 |
North Square Strategic Income Fund | Class I | ADVNX | 66263L791 |
Privacy Principles of the North Square Funds for Shareholders
The Funds are committed to maintaining the privacy of their shareholders and to safeguarding their non-public personal information. The following information is provided to help you understand what personal information the Funds collect, how we protect that information and why, in certain cases, we may share information with select other parties.
Generally, the Funds do not receive any non-public personal information relating to their shareholders, although certain non-public personal information of their shareholders may become available to the Funds. The Funds do not disclose any non-public personal information about their shareholders or former shareholders to anyone, except as permitted by law or as is necessary in order to service shareholder accounts (for example, to a transfer agent or third party administrator).
This report is sent to shareholders of the North Square Funds for their information. It is not a Prospectus, circular or representation intended for use in the purchase or sale of shares of the Funds or of any securities mentioned in this report.
Proxy Voting Policies and Procedures
A description of the Funds’ proxy voting policies and procedures related to portfolio securities is available without charge, upon request, by calling the Funds at (855) 551-5521 or on the U.S. Securities and Exchange Commission’s (“SEC”) website at www.sec.gov.
Proxy Voting Record
Information regarding how the Funds voted proxies for portfolio securities, if applicable, during the most recent 12-month period ended June 30, is also available, without charge and upon request by calling (855) 551-5521 or by accessing the Funds’ Form N-PX on the SEC’s website at www.sec.gov.
Portfolio Holdings Disclosure
The Funds file a complete schedule of portfolio holdings with the U.S. Securities and Exchange Commission (the “SEC”) for the first and third quarters of each fiscal year on Form N-Q or Part F of Form N-PORT (beginning with filings after March 31, 2020). The Funds’ Forms N-Q or Part F of Form N-PORT are available on the SEC’s website at www.sec.gov and may be reviewed and copied at the SEC’s Public Reference Room in Washington, D.C. Information on the operation of the Public Reference Room may be obtained by calling (800) 732-0330. The Funds’ Forms N-Q or Part F of Form N-PORT may also be obtained by calling toll-free (855) 551-5521.
Householding
The Funds will mail only one copy of shareholder documents, including prospectuses, annual and semi-annual reports and proxy statements, to shareholders with multiple accounts at the same address. This practice is commonly called “householding” and is intended to reduce expenses and eliminate duplicate mailings of shareholder documents. Mailings of your shareholder documents may be householded indefinitely unless you instruct us otherwise. If you do not want the mailing of these documents to be combined with those for other members of your household, please call the Funds at (855) 551-5521.
North Square Funds
c/o U.S. Bancorp Fund Services, LLC
P.O. Box 701
Milwaukee, Wisconsin 53201
1-855-551-5521
Item 2. Code of Ethics.
The Registrant has adopted a code of ethics that applies to the Registrant’s principal executive officer and principal financial officer. The Registrant has not made any substantive amendments to its code of ethics during the period covered by this report. The Registrant has not granted any waivers from any provisions of the code of ethics during the period covered by this report.
A copy of the Registrant’s Code of Ethics is filed herewith.
Item 3. Audit Committee Financial Expert.
The Registrant’s board of trustees has determined that there is at least one audit committee financial expert serving on its audit committee. David B. Boon is the “audit committee financial expert” and is considered to be “independent” as each term is defined in Item 3 of Form N‑CSR.
Item 4. Principal Accountant Fees and Services.
The Registrant has engaged its principal accountant to perform audit services, audit-related services, tax services and other services during the past two fiscal years. “Audit services” refer to performing an audit of the Registrant's annual financial statements or services that are normally provided by the accountant in connection with statutory and regulatory filings or engagements for those fiscal years. “Audit-related services” refer to the assurance and related services by the principal accountant that are reasonably related to the performance of the audit. “Tax services” refer to professional services rendered by the principal accountant for tax compliance, tax advice, and tax planning. The following table details the aggregate fees billed or expected to be billed for each of the last two fiscal years for audit fees, audit-related fees, tax fees and other fees by the principal accountant.
| FYE 10/31/2020 | FYE 10/31/2019 | |
Audit Fees | $14,300 | $31,200 |
Audit-Related Fees | $0 | $0 |
Tax Fees | $5,600 | $5,600 |
All Other Fees | $0 | $0 |
The audit committee has adopted pre-approval policies and procedures that require the audit committee to pre‑approve all audit and non‑audit services of the Registrant, including services provided to any entity affiliated with the Registrant.
The percentage of fees billed by Tait, Weller & Baker LLP applicable to non-audit services pursuant to waiver of pre-approval requirement were as follows:
| FYE 10/31/2020 | FYE 10/31/2019 | |
Audit-Related Fees | 0% | 0% |
Tax Fees | 0% | 0% |
All Other Fees | 0% | 0% |
All of the principal accountant’s hours spent on auditing the Registrant’s financial statements were attributed to work performed by full time permanent employees of the principal accountant. There were no non-audit fees billed or expected to be billed by the Registrant’s accountant for services to the Registrant and to the Registrant’s investment adviser (and any other controlling entity, etc. –not sub-adviser) for the last two years.
Item 5. Audit Committee of Listed Registrants.
Not applicable to Registrants who are not listed issuers (as defined in Rule 10A-3 under the Securities Exchange Act of 1934).
Item 6. Investments.
(a) | Schedule of Investments is included as part of the report to shareholders filed under Item 1 of this Form. |
(b) | Not Applicable. |
Item 7. Disclosure of Proxy Voting Policies and Procedures for Closed-End Management Investment Companies.
Not applicable to open-end investment companies.
Item 8. Portfolio Managers of Closed-End Management Investment Companies.
Not applicable to open-end investment companies.
Item 9. Purchases of Equity Securities by Closed‑End Management Investment Company and Affiliated Purchasers.
Not applicable to open-end investment companies.
Item 10. Submission of Matters to a Vote of Security Holders.
There have been no material changes to the procedures by which shareholders may recommend nominees to the Registrant’s board of trustees.
Item 11. Controls and Procedures.
(a) | The Registrant’s President and Treasurer have reviewed the Registrant's disclosure controls and procedures (as defined in Rule 30a-3(c) under the Investment Company Act of 1940 (the “Act”)) as of a date within 90 days of the filing of this report, as required by Rule 30a-3(b) under the Act and Rules 13a-15(b) or 15d‑15(b) under the Securities Exchange Act of 1934. Based on their review, such officers have concluded that the disclosure controls and procedures are effective in ensuring that information required to be disclosed in this report is appropriately recorded, processed, summarized and reported and made known to them by others within the Registrant and by the Registrant’s service provider. |
(b) | There were no changes in the Registrant's internal control over financial reporting (as defined in Rule 30a-3(d) under the Act) that occurred during the period covered by this report that have materially affected, or are reasonably likely to materially affect, the Registrant's internal control over financial reporting. |
Item 12. Disclosure of Securities Lending Activities for Closed-End Management Investment Companies
Not applicable to open-end investment companies.
Item 13. Exhibits.
(3) Not applicable to open-end investment companies.
(4) There was no change in the Registrant’s independent public accountant for the period covered by this report.
SIGNATURES
Pursuant to the requirements of the Securities Exchange Act of 1934 and the Investment Company Act of 1940, the Registrant has duly caused this report to be signed on its behalf by the undersigned, thereunto duly authorized.
North Square Investments Trust
By: /s/ Mark D. Goodwin
Mark D. Goodwin,
President
Date: 1/6/2021
Pursuant to the requirements of the Securities Exchange Act of 1934 and the Investment Company Act of 1940, this report has been signed below by the following persons on behalf of the Registrant and in the capacities and on the dates indicated.
By: /s/ Mark D. Goodwin
Mark D. Goodwin,
President
Date: 1/6/2021
By: /s/ Alan E. Molotsky
Alan E. Molotsky,
Treasurer
Date: 1/6/2021