UNITED STATES
SECURITIES AND EXCHANGE COMMISSION
Washington, D.C. 20549
FORM N-CSR
CERTIFIED SHAREHOLDER REPORT OF REGISTERED
MANAGEMENT INVESTMENT COMPANIES
Investment Company Act file number 811- 23373
NORTH SQUARE INVESTMENTS TRUST
(Exact name of Registrant as specified in charter)
10 South LaSalle Street, Suite 1925
Chicago IL 60603
(Address of principal executive offices) (Zip code)
Alan E. Molotsky, Esq.
North Square Investments Trust
10 South LaSalle Street, Suite 1925
Chicago IL 60603
(Name and address of agent for service)
(312) 857-2160
Registrant's telephone number, including area code
Date of fiscal year end: May 31, 2022
Date of reporting period: June 1, 2021 – May 31, 2022
Item 1. Reports to Stockholders.
| | |
| ANNUAL REPORT | |
| | |
| NORTH SQUARE SPECTRUM ALPHA FUND | |
| (FORMERLY, NORTH SQUARE OAK RIDGE SMALL CAP GROWTH FUND) | |
| | |
| NORTH SQUARE DYNAMIC SMALL CAP FUND | |
| | |
| NORTH SQUARE ADVISORY RESEARCH SMALL CAP GROWTH FUND | |
| (FORMERLY, NORTH SQUARE OAK RIDGE ALL CAP GROWTH FUND) | |
| | |
| NORTH SQUARE MULTI STRATEGY FUND | |
| | |
| NORTH SQUARE PREFERRED AND INCOME SECURITIES FUND | |
| (FORMERLY, NORTH SQUARE OAK RIDGE DIVIDEND GROWTH FUND) | |
| | |
| NORTH SQUARE TACTICAL GROWTH FUND | |
| | |
| NORTH SQUARE TACTICAL DEFENSIVE FUND | |
| | |
| NORTH SQUARE TRILOGY ALTERNATIVE RETURN FUND | |
| | |
| MAY 31, 2022 | |
| | |

North Square Investments | www.northsquareinvest.com
North Square Funds
Table of Contents
| Shareholder Letters | | | 1 |
| | | | |
| Fund Performance | | | 17 |
| | | | |
| Schedules of Investments | | | 30 |
| | | | |
| Statements of Assets and Liabilities | | | 64 |
| | | | |
| Statements of Operations | | | 68 |
| | | | |
| Statements of Changes in Net Assets | | | 70 |
| | | | |
| Financial Highlights | | | 78 |
| | | | |
| Notes to Financial Statements | | | 94 |
| | | | |
| Report of Independent Registered Public Accounting Firm | | | 110 |
| | | | |
| Supplemental Information | | | 111 |
| | | | |
| Expense Examples | | | 115 |
This report and the financial statements contained herein are provided for the general information of the shareholders of the North Square Funds. This report is not authorized for distribution to prospective investors in the Funds unless preceded or accompanied by an effective prospectus.
www.northsquareinvest.com
|  |
| Discussion of Fund Performance |
|
A letter from David Appleby, Vice President - Risk, Quantitative Analysis and Portfolio Construction of NSI Retail Advisors, LLC and Portfolio Manager of the North Square Spectrum Alpha Fund.
Dear Shareholder,
Since the beginning of 2022 financial markets have been challenging across asset classes. Inflation has become more entrenched than originally anticipated and encouraged stronger language from the Federal Reserve on mitigation strategies. Impending tightening policy ignited volatility amidst fixed income markets while cautioning the equity marketplace that they should not anticipate monetary policy support in the near term. Bonds, which have often been a safe haven in other market corrections, offered only mild relative protection from the fall in asset prices. The Russell 3000 has declined 13.89% calendar year to date through May 31, 2022 and the Bloomberg Aggregate Bond Index has fallen 8.92%. In this changing environment, financial markets have begun a process of reevaluating risk and return. Those areas of the equity markets that had the most accelerated returns during the market fervor have experienced the greatest drawdowns as markets seek to internalize the disruptions to the economy. We believe, however, that as the tumultuous environment evolves, the more robust investment opportunities will become increasingly evident.
The small cap universe is populated with a diverse set of opportunities for investors. While the segment is more volatile than large cap indexes, it offers the potential to differentiate as the market shifts away from a regime of low interest rates and accommodative policy. Within an evolving investment landscape, compelling valuation and growth opportunities exist for the discerning investor. The North Square Spectrum Alpha Fund is an allocation strategy designed to bring together experienced active managers that can provide distinctive insights within the smaller capitalization equity marketplace. The strategy combines differentiated funds across style and smaller capitalizations seeking to improve alpha generating potential in an allocation with a similar risk profile to the Russell 2000.
On January 11, 2022, the North Square Spectrum Alpha Fund (formerly known as the North Square Oak Ridge Small Cap Growth Fund) changed subadvisers from Oak Ridge Investments to NSI Retail Advisors and expanded its focus from small cap growth to small cap funds in various styles. For the year ending May 31, 2022, the North Square Spectrum Alpha Fund (formerly known as the North Square Oak Ridge Small Cap Growth Fund) returned -18.90% for Class I shares. By comparison, the Russell 2000 index returned -16.92% and the Russell 2000 Growth index returned -25.71%*. The small cap growth index has had the most severe losses over the past year, skewed towards unprofitable and the most highly valued companies. At the beginning of the year, the Fund has more broadly diversified the small cap growth exposure to include a set of managers within the initial allocation that offer a more balanced solution to a small cap allocation: the North Square Dynamic Small Cap Fund, North Square Advisory Research Small Cap Value Fund and North Square Advisory Research Small Cap Growth Fund. Each of the managers has a demonstrated track record of investing in small capitalization companies throughout a variety of market environments. The Spectrum Alpha Fund currently has a larger allocation towards small cap core and small cap value compared to small cap growth.
Asset prices have had a material adjustment in the beginning months of 2022; however, we do not know how far along we are in rationalizing the multitude of economic challenges into prices. Though the investment climate may continue to be difficult, the current selection of managers inspires confidence in our ability to navigate its impact on the small cap universe. North Square and NSI Retail Advisors continue to seek additional managers and strategies that would further enhance the portfolio’s opportunity set. We appreciate your confidence in North Square Investments.
Sincerely,
David Appleby
Vice President – Risk, Quantitative Analysis and Portfolio Construction & Portfolio Manager
*Call 855-551-5521 or visit northsquareinvest.com for the most recent month-end performance results. Current performance may be lower or higher than the performance data quoted. The performance data quoted represents past performance, which is no guarantee of future results. Investment return and principal value of an investment will fluctuate so that an investor’s shares, when redeemed, may be worth more or less than their original cost.
Principal Risks of Investing: Risk is inherent in all investing, including an in-vestment in the Fund. An investment in the Fund involves risk, including the following principal risks, among others: Market Risk, Micro-Cap, Small, and Mid-Sized Company Risk, Foreign and Emerging Market Company Risk, Affiliated Underlying Funds Risk, Blend Style Risk, Derivatives Risk, and ETF and Mutual Funds Risk. Summary descriptions of these and other principal risks of investing in the Fund are set forth in the Fund’s prospectus. Before you decide whether to invest in the Fund, carefully consider these risk factors and special considerations associated
with investing in the Fund, which may cause investors to lose money. There can be no assurance that the Fund will achieve its investment objective. An investment in the Fund is not a deposit of the bank and is not insured or guaranteed by the Federal Deposit Insurance Corporation or any other government agency. Please see the Fund’s prospectus for additional risk disclosures.
The Russell 3000® Index is a capitalization-weighted stock market index that seeks to be a benchmark of the entire U.S stock market.
The Bloomberg US Aggregate Bond Index is a broad base, market capitalization-weighted bond market index representing intermediate term investment grade bonds traded in the United States. The index is frequently used by investors as a “stand-in” for measuring the performance of the US bond market.
Effective January 11, 2022, the Russell 2000® Index has replaced the Russell 2000 Total Return Index as the Fund’s primary benchmark as the Russell 2000 Index is more closely aligned with the Fund’s principal investment strategies and portfolio holdings.
The Russell 2000 Index, the Fund’s benchmark, is a subset of the Russell 3000 Index representing approximately 10% of the total market capitalization of that index. It includes approximately 2000 of the smallest securities based on a combination of their market cap and current index membership. The volatility (beta) of an account may be greater or less than its respective benchmark. It is not possible to invest directly in an index.
The Russell 2000 Growth Index measures the performance of those Russell 2000 companies with higher price-to-book ratios and higher forecasted growth values. The volatility (beta) of an account may be greater or less than its respective benchmark.
All indexes are shown for comparative purposes only. One cannot invest directly in an index.
A market “drawdown” measures the percentage decline from a peak to a trough.
The views in this letter are those of the Fund’s direct advisor and were as of May 31, 2022 and may not necessarily reflect the same views on the date this letter is first published or any date thereafter. These views are intended to help shareholders in understanding the fund’s investment methodology and do not constitute investment advice.
Investment in equity securities involves substantial risks and may be subject to wide and sudden fluctuations in market value. Investing in small and mid-cap companies may be subject to more abrupt or erratic market movements and may have lower trading volumes or more erratic trading than securities of larger companies. International investments are subject to unique risks including currency fluctuations, social, economic and political uncertainties, which could increase volatility. In addition, changes in exchange rates and interest rates may adversely affect the value of the fund’s foreign investments. Please see the prospectus for a more complete discussion of the fund’s risks.
| |
| Discussion of Fund Performance |
|
A letter from Peter Algert, Chief Investment Officer of Algert Global LLC and Portfolio Manager of the North Square Dynamic Small Cap Fund.
Dear Shareholder,
U.S. small-cap stocks experienced a volatile period over the 12-months ending May 31, 2022, primarily driven by increasing inflationary and geopolitical concerns given ongoing dislocations in the aftermath of the COVID-19 pandemic and the Russian invasion of Ukraine. After rallying strongly in 2020 and the early part of 2021, the Russell 2000 Index fell, ending the trailing 12-month period at -16.92%. The Fund however notably outperformed the index over this period, delivering an absolute return of -10.43% for Class I shares at NAV.*
Stock Selection Designed to be the Primary Source of Benchmark Outperformance
During the trailing 12-month period, stock selection contributed positively to Fund performance. The Fund also benefitted from positive performance contribution from incidental active exposures to various risk factors (e.g. a company’s industry, leverage, liquidity and beta characteristics). Active industry-related positioning modestly detracted during the period.
Catalyst
The Catalyst model was the primary positive contributor to the performance of the Fund. Given the uncertain economic backdrop over the past 12 months, Catalyst-related exposures, which seek to assess investor sentiment and activities by other market participants, were able to capture the preference for stocks with attractive growth characteristics, supportive investor positioning, and strong underlying business model momentum.
Quality
The Quality model also contributed positively to the performance of the Fund. With an worsening economic outlook, investors appeared to favor companies with more robust and sustainable business models relative to peers. The performance of the Fund’s Quality exposures was strong across various types of insights, particularly those that seek to differentiate firms across cash flow and revenue generation.
Relative Value
The Relative Value model detracted modestly from the Fund’s performance during the measurement period. Value-related positioning underperformed as investors have favored stocks with stronger growth characteristics, despite generally unattractive valuations. However, as the inflationary concerns grew in early 2022 and the Federal Reserve began to raise interest rates, value-related stocks outperformed the broader market. The Fund continues to view value-oriented exposures less favorably relative to other opportunities.
Risk Factors
Incidental active exposures to industries and risk factors such as leverage, volatility and liquidity generally contributed positively to performance over the measurement period. While these exposures generated gains, we expect these exposures will have minimal impact on the Fund’s active performance over a full market cycle.
Fund Positioning for the Future
The Fund aims to be diversified across its three main investment themes, Relative Value, Quality and Catalyst. Given the uncertain economic backdrop given increasing inflationary and recessionary concerns, we expect the Fund’s Quality-driven positioning will be beneficial for the portfolio and should be the dominant theme going forward in the near term. We continue to favor Catalyst-driven positions relative to Value driven, in part, by the expectation of outperformance of firms with attractive trends in underlying business fundamentals.
Sincerely,
Peter Algert,
Chief Investment Officer
*Call 855-551-5521 or visit northsquareinvest.com for the most recent month-end performance results. Current performance may be lower or higher than the performance data quoted. The performance data quoted represents past performance, which is no guarantee of future results. Investment return and principal value of an investment will fluctuate so that an investor’s shares, when redeemed, may be worth more or less than their original cost.
Principal Risks of Investing: Risk is inherent in all investing, including an investment in the Fund. An investment in the Fund involves risk, including the following principal risks, among others: Equity Risk, ETF Risk, Foreign Investment Risk, IPO Risk, Liquidity Risk, Management and Strategy Risk, Market Risk, Portfolio Turnover Risk, Preferred Stock Risk, Real Estate Investment Trust (“REIT”) Risk, Reliance on Technology Risk, Small Cap Company Risk, and Value-Oriented Investment Strategies Risk. Summary descriptions of these and other principal risks of investing in the Fund are set forth in the prospectus. Before you decide whether to invest in the Fund, carefully consider these risk factors and special considerations associated with investing in the Fund, which may cause investors to lose money. There can be no assurance that the Fund will achieve its investment objective. An investment in the Fund is not a deposit of the bank and is not insured or guaranteed by the Federal Deposit Insurance Corporation or any other government agency. Please see the Fund’s prospectus for additional risk disclosures.
The Russell 2000 Index, the Fund’s benchmark, is a subset of the Russell 3000 Index representing approximately 10% of the total market capitalization of that index. It includes approximately 2000 of the smallest securities based on a combination of their market cap and current index membership. The index is shown for comparative purposes only. One cannot invest directly in an index.
Cash flow is the amount of cash that comes in and goes out of a business. Companies take in money from sales as revenues and spend money on expenses.
| |
| Discussion of Fund Performance |
|
A letter from Andrew Cupps, Managing Director of Advisory Research, Inc. and Portfolio Manager of the North Square Advisory Research Small Cap Growth Fund.
Dear Shareholder,
The investment environment for 2022 through May was defined by several powerful negative forces. COVID-19’s impact persisted, in this period through the rapidly spreading omicron variant that wreaked human and economic havoc across the globe. Inflation, which had been essentially non-existent for over 20 years, emerged after the COVID lockdowns and began to accelerate through the economy in the form of home prices, energy prices, food prices and almost every other good and service. In response to the growing threat of inflation, the Federal Reserve, which had focused almost without exception on stimulating the economy all the way back to the 9/11 attacks, began to recognize the opposite approach was required and made clear in November that it would begin raising interest rates. The labor market and supply chains were in turmoil as a function of the government’s hard stop of the economy for COVID, followed by trillions of dollars in payments that created too much demand and too little supply across numerous sectors. The fragile global economy was further assaulted in February when Russia began an unprovoked hot war against Ukraine and at the same time effectively launched a cold war with Western powers that caused oil and energy prices to skyrocket.
For the period January through May, the benchmark Russell 2000 Growth index1 was down 24.8% and the Class I shares of the Fund declined 29.5%, though corporate earnings remained fairly robust and unemployment remained near historic lows. Investors sold stocks aggressively on rising rates and expectations of even higher rates as inflation pressures continued to mount. Higher growth sectors such as technology, healthcare and consumer discretionary were the hardest hit, with more mature, slower growth sectors like consumer staples and basic materials faring better. Energy was the sole sector with a positive return as oil prices climbed over $100. The Fund capitalized on the opportunity in energy by making a large relative allocation late last year. It also benefitted from good stock selections in healthcare. The most important holding in healthcare was Evolent Health, which has expertise in lowering the cost of patient care for health systems and insurance companies. Another selection that outperformed significantly in the period was Titan International, a manufacturer of large tires and wheels for agricultural tractors and mining trucks. Those industries were beneficiaries of the rising commodity prices. Two stocks that were notable decliners in the period were InMode, which makes devices for non-invasive cosmetic surgery and Kornit Digital, which makes digital printers that print directly on to fabric and garments. Both stocks were very strong performers throughout 2021 but were vulnerable to post-COVID changes in consumer behavior and the higher interest rates of 2022.
The defining variable for stocks in the year ahead is likely to be how long inflation remains elevated. Stubbornly high inflation data may lead to continuing difficult market conditions, whereas a downward inflection in inflation data could allow the Fed to limit additional interest rate hikes and give investors confidence that a recession can be avoided or that it will be brief. Steady or declining rates would also tend to be constructive for growth stock valuations. Though risks abound, we are generally optimistic, believing that with time the economy will overcome its COVID-related turbulence to better match supply and demand in the form of more stable prices, and appreciating the compelling opportunities created by significant reductions in stock valuations.
On behalf of all the dedicated members of the Advisory Research team, I thank you for investing in the North Square Advisory Research Small Cap Growth Fund.
Sincerely,
Andrew Cupps
Managing Director
______________
1 | The Russell 2000 Growth Index measures the performance of the small-cap growth segment of the US equity universe. It includes those Russell 2000 companies with relatively higher price-to-book rations, higher I/B/E/S (Institutional Brokers’ Estimate System) forecast medium term (2 year) growth and higher sales per share historical growth (5 years). |
*Call 855-551-5521 or visit northsquareinvest.com for the most recent month-end performance results. Current performance may be lower or higher than the performance data quoted. The performance data quoted represents past performance, which is no guarantee of future results. Investment return and principal value of an investment will fluctuate so that an investor’s shares, when redeemed, may be worth more or less than their original cost.
Principal Risks of Investing: Risk is inherent in all investing, including an investment in the Fund. An investment in the Fund involves risk, including the following principal risks, among others: Equity Risk, Sector Focus Risk, Portfolio Turnover Risk, Market Risk, Small-Cap Company Risk, Cybersecurity Risk, Preferred Securities Risk, Convertible Securities Risk, ETF Risk, Currency Risk, Emerging Market Risk, Growth-Style Investing Risk, Foreign Investment Risk, and Management and Strategy Risk. Summary descriptions of these and other principal risks of investing in the Fund are set forth in the Fund’s prospectus. Before you decide whether to invest in the Fund, carefully consider these risk factors and special considerations associated with investing in the Fund, which may cause investors to lose money. There can be no assurance that the Fund will achieve its investment objective. An investment in the Fund is not a deposit of the bank and is not insured or guaranteed by the Federal Deposit Insurance Corporation or any other government agency. Please see the Fund’s prospectus for additional risk disclosures.
The Russell 2000 Growth Index is unmanaged, its return assumes reinvestment of dividends and, unlike mutual funds returns, does not reflect any fees or expenses associated with a mutual fund. It is not possible to invest directly in an index.
| |
| Discussion of Fund Performance |
|
A letter from David Appleby, Vice President - Risk, Quantitative Analysis and Portfolio Construction of NSI Retail Advisors, LLC and Portfolio Manager of the North Square Multi Strategy Fund.
Dear Shareholder,
At the start of 2022, the S&P 500 was over 40% higher than its close on February 19, 2020 (the high prior to the COVID-19 shock to markets). This is primarily a symbol of the resilience of the US economy and the swift actions by the Federal Reserve to alleviate strain on the financial system at a critical point. Inflation, however, has become more entrenched than originally anticipated and encouraged stronger language from the Federal Reserve on mitigation strategies. Impending tightening policy and the lingering uncertainties related to the COVID crisis did not fully reconcile with the lofty expectations embedded in the US equity markets. In the first few weeks of 2022, the ramifications of a less spendthrift Federal Reserve began factoring into markets. Rates were rising along the curve, and the most ebullient portions of the equity indices (growth equities in particular) led to broad market declines.
Russian hostilities towards Ukraine further encouraged weakness across equity markets in the weeks leading into the events of February 24, 2022. As it became more apparent that the Ukrainian crisis was more than an isolated skirmish, energy and other commodity prices received further support at elevated levels, and ongoing inflation concerns only increased. The Federal Reserve is committed to containing inflation. They ended the pandemic quantitative easing purchase program in early 2022 and began implementing Fed Funds rate increases in March. The Ukrainian crisis, nevertheless, created an additional level of volatility in an already challenging rising rate environment. The 10-year Treasury yield rose from 1.63% on January 1, 2022, to a peak of 2.05% in mid-February, the highest since summer of 2019. Afterward, it declined to 1.71% on March 1, 2022, and ultimately ending at 2.84% on May 31, 2022. Meanwhile, yields for the two-year treasury note and shorter-dated Treasuries have risen more precipitously than longer-dated treasuries, effectively flattening the yield curve. Long-term economic growth expectations continue to decline and will likely weigh on equity markets as monetary policy’s efforts to control inflation limit further stimulative policy. The path to an improving outlook will depend on the whether the factors influencing price increases begin to subside to prevent the need for excessive policy rate adjustments.
The North Square Multi-Strategy Fund (Class I Shares) returned -4.79% for the fiscal year ending May 31, 2022.* Comparatively, the Russell 3000 Index returned -3.68%, and the Bloomberg US Aggregate Bond Index declined by -8.22%. As the market began to turn in January 2022, the Fund adjusted its allocation to meet the structural changes in markets. The Fund reduced its exposure to large-cap growth in favor of a more core-value exposure through a mixture of low-cost ETFs. Furthermore, a large portion of the allocation to dividend equities converted to the North Square Preferred and Income Securities Fund, a fund focused primarily on investing in preferred and debt securities as well as other income-producing securities. These updates to the allocation provided helpful risk mitigation during the most acute phases of the 2022 market drawdown.
The Fund diversified small-cap exposure early in 2022 to include the North Square Advisory Research Small Cap Growth Fund and North Square Advisory Research Small Cap Value Fund alongside the North Square Dynamic Small Cap Fund. While our overall allocation to small-cap detracted from performance for the fiscal year, we believe our adjustments early in 2022 helped to offset our continued emphasis on small-cap. We view the relative opportunity within smaller capitalization stocks in the US versus large-cap stocks as positive over the long run. Additionally, the more domestic market focus of small cap companies could prove beneficial should European and global tensions escalate. Leading into the new year our view was to gradually increase international exposure through the Altrinsic International Equity Fund, a value-focused strategy investing in developed and key emerging markets. After years of under-allocation to international equities, there appeared to be more promising economic growth prospects as countries recovered from the coronavirus. Following the events in Ukraine, we remain under-allocated to international equities and will be cautious of adding any more exposure until geopolitical events become clearer.
In October of 2021, the subadviser to the Fund changed from Oak Ridge Investments to NSI Retail Advisors. The investment objectives of the Multi Strategy Fund following the change of subadviser remain consistent with investment objectives as a multi strategy offering under Oak Ridge Investments. In general, we continue to believe this environment to be most conducive to flexible active managers with a focus on evaluating the relative merits of fundamental opportunities. The current holdings within the Multi Strategy Fund provide a diverse cross-section of investment strategies, and we believe the Multi Strategy Fund is well-equipped to meet a variety of market environments; nevertheless, North Square and NSI Retail Advisors continue to seek new managers and strategies that further enhance the portfolio’s opportunity set. We appreciate your continued confidence in North Square Investments.
Sincerely,
David Appleby
Vice President – Risk, Quantitative Analysis and Portfolio Construction & Portfolio Manager
*Call 855-551-5521 or visit northsquareinvest.com for the most recent month-end performance results. Current performance may be lower or higher than the performance data quoted. The performance data quoted represents past performance, which is no guarantee of future results. Investment return and principal value of an investment will fluctuate so that an investor’s shares, when redeemed, may be worth more or less than their original cost.
Principal Risks of Investing: Risk is inherent in all investing, including an investment in the Fund. An investment in the Fund involves risk, including the following principal risks, among others: Bank Loan Risk, Convertible Securities Risk, Credit Risk, Currency Risk, Emerging Market Risk, Equity Risk, ETF and Mutual Funds Risk, Fixed Income Securities Risk, Foreign Investment Risk, Government-Sponsored Entities Risk, Growth-Oriented Investment Strategies Risk, High Yield (“Junk”) Bond Risk, Inflation-Linked Securities Risk, Interest Rate Risk, IPO Risk, Large Cap Company Risk, Liquidity Risk, Management and Strategy Risk, Market Risk, Mortgage-Backed and Asset-Backed Securities Risk, Municipal Securities Risk, Preferred Stock Risk, Small and Mid Cap Company Risk, Value-Oriented Investment Strategies Risk, and Warrants and Rights Risk. Summary descriptions of these and other principal risks of investing in the Fund are set forth below. Before you decide whether to invest in the Fund, carefully consider these risk factors and special considerations associated with investing in the Fund, which may cause investors to lose money. There can be no assurance that the Fund will achieve its investment objective. An investment in the Fund is not a deposit of the bank and is not insured or guaranteed by the Federal Deposit Insurance Corporation or any other government agency. Please see the Fund’s prospectus for additional risk disclosures.
The S&P 500 Index is the Standard & Poor’s Composite Index of 500 stocks and is a widely recognized, unmanaged index of common stock prices.
The 10-year Treasury yield is the yield that the U.S. government pays investors that purchase the Treasury’s 10-year note. Purchase of the 10-year note is essentially a loan made to the U.S. government.
The Russell 3000® Index is a capitalization-weighted stock market index that seeks to be a benchmark of the entire U.S stock market.
The Bloomberg US Aggregate Bond Index is a broad base, market capitalization-weighted bond market index representing intermediate term investment grade bonds traded in the United States. The index is frequently used by investors as a “stand-in” for measuring the performance of the US bond market.
All indexes are shown for comparative purposes only. One cannot invest directly in an index.
The views in this letter are those of the Fund’s direct advisor and were as of May 31, 2022 and may not necessarily reflect the same views on the date this letter is first published or any date thereafter. These views are intended to help shareholders in understanding the fund’s investment methodology and do not constitute investment advice.
Investment in equity securities involves substantial risks and may be subject to wide and sudden fluctuations in market value. Investing in small and mid-cap companies may be subject to more abrupt or erratic market movements and may have lower trading volumes or more erratic trading than securities of larger companies. International investments are subject to unique risks including currency fluctuations, social, economic and political uncertainties, which could increase volatility. In addition, changes in exchange rates and interest rates may adversely affect the value of the fund’s foreign investments. Please see the prospectus for a more complete discussion of the fund’s risks.
| |
| Discussion of Fund Performance |
|
A letter from John L. Cassady III, CFA, Chief Investment Officer, and Brandon Bajema CFA, CPA, Sr. Portfolio Manager, Portfolio Managers of the North Square Preferred and Income Securities Fund.
Dear Shareholder,
The past several months has seen the world recovering from a pandemic only to be faced with a military conflict that has threatened the European theater in a way not seen in decades. This new crisis has significant humanitarian consequences for the people of Ukraine and, potentially, globally as energy and agricultural supply lines have been deeply curtailed. One bright spot has been the unifying impact this terror has brought among Ukraine, Western Europe, and the United States. Our thoughts continue to be with those most impacted by this war and we hope for a swift resolution.
The economy had already begun to heat up due to fiscal stimulus and accommodative FOMC (Federal Open Market Committee) policy in response to COVID challenges. Inflation as measured by CPI rose from 5.0% year-over-year in May of 2021 to 8.6% year-over-year in May of this year. Since the Russian invasion of Ukraine on February 24, energy prices in particular have surged due to sanctions. Lingering supply chain shortages along with additional shortages caused by the invasion do not appear to be abating any time soon.
It was only in March of this year that the Federal Reserve (“Fed”) embarked on its rate hike cycle by increasing the Fed Funds target rate by just 25 basis points. Realizing that it might be behind the curve on fighting inflation, the Fed began to move in earnest by increasing rates 50 basis points at the May 4 meeting, bringing the upper band of the Fed Funds target rate to 1.0%. The FOMC also continued its hawkish rhetoric as inflation remained stubbornly high.
The Fund provided investors with a total return of 9.38% for Class I Shares from the beginning of the fiscal year through January 10, 2022, when it was re-purposed to a preferred and income securities fund.* Since that date and against a backdrop of stubborn inflation, higher interest rates, and a slowing global economy, most risky assets have had a negative return during the second half of the Fund’s fiscal year. Preferred securities were no exception to the market sell-off and the fund returned -9.95% since inception of the new fund mandate through May 31, 2022. For the fiscal year the fund returned -1.49%.
While there is still uncertainty surrounding the war in Ukraine, inflation, the economy, and the path of the Fed, this sell-off has created some compelling opportunities in preferred securities. We continue to position the portfolio in anticipation of higher interest rates. Accordingly, the fund is underweight the longer duration fixed for life preferreds, and overweight the variable rate and shorter duration structures. Bank balance sheets remain in robust shape; hence we prefer credit risk to interest rate risk and have positioned the fund accordingly. The fund also continues to overweight European AT1’s, as many yield more than similarly rated U.S. Bank preferreds. Additionally, most AT1’s now trade at a meaningful discount to par.
Markets move quickly and respond rapidly to changing conditions in a world where news and opinions are broadcast almost instantaneously. We believe it is important to sort through the noise and focus on the issues which most directly impact the fund. With this focus and dedication, we strive to bring our investors the performance they have come to expect.
Regards,
John L. Cassady III, CFA
CIO
Brandon Bajema CFA, CPA
Senior Portfolio Manager
*Call 855-551-5521 or visit northsquareinvest.com for the most recent month-end performance results. Current performance may be lower or higher than the performance data quoted. The performance data quoted represents past performance, which is no guarantee of future results. Investment return and principal value of an investment will fluctuate so that an investor’s shares, when redeemed, may be worth more or less than their original cost.
Principal Risks of Investing: Risk is inherent in all investing, including an in-vestment in the Fund. An investment in the Fund involves risk, including the following principal risks, among others: Credit and Subordination Risk, Preferred Securities Risk, Hybrid
Security Risk, Additional Tier 1 Securities Risk, Optionality Risk, Foreign Investments Risk, Rule 144A and Regulation S Securities Risk, Currency Risk, Emerging Markets Risk, Derivatives and Hedging Transactions Risk, and LIBOR Risk. Summary descriptions of these and other principal risks of investing in the Fund are set forth in the Fund’s prospectus. Before you decide whether to invest in the Fund, carefully consider these risk factors and special considerations associated with investing in the Fund, which may cause investors to lose money. There can be no assurance that the Fund will achieve its investment objective. An investment in the Fund is not a deposit of the bank and is not insured or guaranteed by the Federal Deposit Insurance Corporation or any other government agency. Please see the Fund’s prospectus for additional risk disclosures.
The Consumer Price Index (CPI) is a measure of the average change over time in the prices paid by urban consumers for a market basket of consumer goods and services. Indexes are available for the U.S. and various geographic areas. Average price data for select utility, automotive fuel, and food items are also available.
A basis point (bp) is a standard measure for interest rates and other percentages in finance, representing one-one hundredth of one percent. 100 basis points = 1.0 percent.
AT1s, also known as contingent convertible securities, are debt or preferred securities with loss absorption characteristics that provide for an automatic write-down of the principal amount or value of securities or the mandatory conversion into common shares of the issuer under certain circumstances. A mandatory conversion might be automatically triggered, for instance, if a company fails to meet the capital minimum described in the security, the company’s regulator makes a determination that the security should convert, or the company receives specified levels of extraordinary public support. Since the common stock of the issuer may not pay a dividend, investors in these instruments could experience a reduced income rate, potentially to zero, and conversion would deepen the subordination of the investor (worsening the Fund’s standing in a bankruptcy). In addition, some AT1s provide for an automatic write-down of capital under such circumstances.
| |
| Discussion of Fund Performance |
|
A letter from Paul Frank of NSI Retail Advisors, LLC and Portfolio Manager of the North Square Tactical Growth Fund.
Dear Shareholder,
The North Square Tactical Growth Fund follows a rules-based, disciplined, proprietary model that quantitatively ranks—according to risk-adjusted return—all actively traded Exchange Traded Funds (“ETFs”) that pass our initial fundamental review. The Tactical Growth Fund will purchase and hold ETFs showing strength, and it will sell or not consider for purchase ETFs showing weakness. The Tactical Growth Fund’s objective is to produce long-term equity-like returns with less volatility than passive equity investments.
For the year ending May 31, 2022, the Tactical Growth Fund – Class I returned -5.71%.* The Fund’s benchmark, the Morningstar Moderately Aggressive Target Risk Index, returned -7.44%. The widely watched and referenced S&P 500 Index returned -0.30%, while the NASDAQ Composite Index led the way down with -11.53%.
On the fixed-income side, the Bloomberg U.S. Agg Total Return Index lost -8.22%.
The Fund’s portfolio started the fiscal year with four distinct asset classes. The first asset class was domestic equity which comprised approximately 70% of the portfolio. The second asset class was international equity, which was 5% of the portfolio. Overall, the combined equity allocation was 75%, which neared the Fund’s long-term average of 77%. The third asset class of the portfolio was fixed income which totaled 12%. Finally, the fourth asset class in the Fund was an 8% position in two energy-based commodities ETFs.
During the summer of 2021, the Fund sold its commodities holdings. During the autumn of 2021, our total equity weight increased to 83% of the portfolio. Our proprietary rankings did not find investable alternatives to equities, and our cash position rose to over 10%.
In January 2022, many of our holdings showed weakness in our proprietary internal rankings. We followed the Fund’s process and started to de-risk the portfolio. We sold core holdings in large-cap growth and some sector holdings in financials and small-cap. In February 2022, we further lightened our equity exposure and brought it down to 40%.
Our allocation to value-oriented holdings in 2020 and early 2021 worked well during this period by offsetting declines in our growth holdings.
In March 2022, our internal rankings showed strength and we added domestic equity exposure. We also added an international position in Brazil. We ended the first quarter of 2022 with 76% invested in equities, 7% in fixed-income, and 17% in cash. In April and May, our rankings showed weakness in our equity holdings, so we followed the process by de-risking the portfolio and selling a portion of our equity positioning. The portfolio ended the period covered in this letter in a moderately defensive posture. Our equity holdings totaled 60%. Fixed income constituted 8% of the Fund, and the remaining 32% was in cash.
Tactical Growth Fund followed its process during these 12 months, and our holdings and allocation changes helped limit the portfolio’s volatility.
The North Square Tactical Growth Fund started in 2004, and its process and goal have not changed over those 18 years. We strive to build a well-diversified multi-asset portfolio that compensates its investors for market risk.
Sincerely,
Paul Frank
Portfolio Manager
*Call 855-551-5521 or visit northsquareinvest.com for the most recent month-end performance results. Current performance may be lower or higher than the performance data quoted. The performance data quoted represents past performance, which is no guarantee of future results. Investment return and principal value of an investment will fluctuate so that an investor’s shares, when redeemed, may be worth more or less than their original cost.
Principal Risks of Investing: Risk is inherent in all investing including an investment in the Fund. An investment in the Fund involves risk, including, the following principal risks, among others: Management and Strategy Risk, ETF and Mutual Funds Risk,
| |
| Discussion of Fund Performance |
|
Derivatives Risk, Market Risk, Equity Risk, Fixed Income Securities Risk and Growth-Oriented Investment Strategies Risk. Summary descriptions of these and other principal risks of investing in the Fund are set forth below. Before you decide whether to invest in the Fund, carefully consider these risks associated with investing in the Fund, which may cause investors to lose money. There can be no assurance that the Fund will achieve its investment objective. An investment in the Fund is not a deposit of the bank and is not insured or guaranteed by the Federal Deposit Insurance Corporation or any other government agency. Please see the Fund’s prospectus for additional risk disclosures.
The Morningstar Target Risk Index family is designed to meet the needs of investors who would like to maintain a target level of equity exposure through a portfolio diversified across equities, bonds and inflation-hedged instruments. The Morningstar Moderately Aggressive Target Risk Index seeks approximately 77.5% global equity exposure.
The S&P 500 Index is the Standard & Poor’s Composite Index of 500 stocks and is a widely recognized, unmanaged index of common stock prices.
The NASDAQ Composite is a stock market index that includes almost all stocks listed on the Nasdaq stock exchange.
The Bloomberg US Aggregate Bond Index is a broad base, market capitalization-weighted bond market index representing intermediate term investment grade bonds traded in the United States. The index is frequently used by investors as a “stand-in” for measuring the performance of the US bond market.
All indexes are shown for comparative purposes only. One cannot invest directly in an index.
| |
| Discussion of Fund Performance |
|
A letter from Brad Thompson, Director - Multi Asset Class Solutions of NSI Retail Advisors, LLC and Portfolio Manager of the North Square Tactical Defensive Fund.
Dear Shareholder,
Over the past twelve months ending in May 2022, we experienced two distinctly different investment environments. From May 2021 to December 2021, the Federal Reserve (Fed) provided quantitative easing to fuel the economy despite signs of inflation that the Fed initially deemed "transitory." Markets experienced subdued volatility and reached a new all-time high. The Fed remained dovish through the calendar year of 2021, global economies reopened, and Global Central Banks supported global growth. The mood changed at the beginning of 2022, and it became apparent that inflation was never transitory and had suddenly become a key concern. The S&P 500 Index sold off by -5.17% in January as investors’ outlooks dimmed when the Fed reversed its position to a decidedly hawkish stance. Investors feared rapid rate increases as the Fed tried to control inflation before it was too late. In February, Russia invaded Ukraine, which exacerbated the threat of rising inflation. The Russian-Ukraine war intensified an already stressed global supply chain shortage. By May, gasoline prices at the pumps rose to record highs, oil prices surged above $100-per-barrel as the world placed sanctions on Russia, the cost of wheat nearly doubled as Ukraine’s wheat production halted overnight, and China reestablished COVID-19 lockdowns. This uncertainty and volatility caused the S&P 500 Index to decline by -12.76% from 12/31/2021 to 5/31/2022. Rising rates combined with the high likelihood of a recession caused the NASDAQ Composite Index to fall by -22.53% during that same period. Equities were not the only asset class to struggle as bonds took a big hit with rising rates, evidenced by The Bloomberg US Aggregate Bond Total Return Index losing -8.92% and leaving few options for investors.
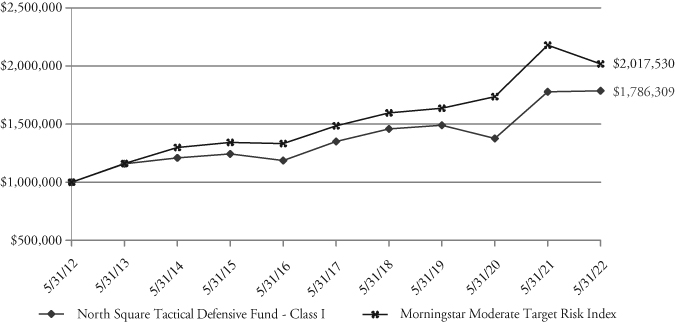
For the fiscal year ending 5/31/2022, the North Square Tactical Defensive Fund returned 0.46% for Class I shares compared to the Fund’s benchmark, the Morningstar Moderate Target Risk Index, which was down -7.42%. The S&P 500 Total Return Index declined by -0.30%, and the Nasdaq Composite Index lost -11.53%.
The Tactical Defensive Fund focuses on long and short-term market trends to balance safety and return. The longer-term Cyclical Trend (CT) measure governs one-half of the portfolio (core) and the other (satellite) by the shorter (more safety conscious) intermediate term, Dynamic Trend (DT) measure.
The Fund’s long-term measure remained fully invested from May 2021 through December 2021 as markets soared to all-time highs. The Fund’s faster reacting Dynamic Trend measure signaled higher risk levels at times, which triggered the Fund to reduce its equity allocation. The Fund closed the calendar year with a portfolio of 75% equities and 25% defensive positions. From May 31, 2021, through December 31, 2021, the Fund returned 7.31% compared to the Fund’s benchmark of 3.41%.
After the S&P 500 Index reached an all-time high on January 3, 2022, the investment climate rapidly changed. There was no place to hide as stocks and bonds both experienced significant price pressures. From December 31, 2021, to May 31, 2022, the S&P 500 Index fell by -12.76%, the NASDAQ Composite Index dropped by -22.53%, and the Bloomberg US Aggregate Bond Index lost -8.92%. Throughout most of that period, the Dynamic Trend measure signaled defensive to moderate allocations. The Cyclical Trend measure went to cash on two separate occasions (mid-February to mid-March and from April 8, 2022, through May). The defensive positioning helped decrease volatility in the Fund and reduced the overall drawdown. The Tactical Defensive Fund was down -6.38% and the Morningstar Moderate Target Risk Index benchmark was down -10.47% over the same period.
We are currently amid an unprecedented market environment with high inflation, a hawkish FED, global slowdowns, an ongoing war, and both Fixed Income and U.S. Equity markets suffering declines. The economic outlook over the next 6-months is pessimistic as the risk of global recession weighs on investors. That is why active management is a vital component of your overall portfolio. We follow a systematic approach to help us make allocation decisions during periods of uncertainty. The goal of the Tactical Defensive Fund is for long-term equity-like returns with lower drawdowns and less volatility than a typical long-only passive strategy, which can help provide the diversification needed to weather the storm.
Sincerely,
Brad Thompson
Director – Multi Asset Class Solutions & Portfolio Manager
*Call 855-551-5521 or visit northsquareinvest.com for the most recent month-end performance results. Current performance may be lower or higher than the performance data quoted. The performance data quoted represents past performance, which is no guarantee of future results. Investment return and principal value of an investment will fluctuate so that an investor’s shares, when redeemed, may be worth more or less than their original cost.
Principal Risks of Investing: Risk is inherent in all investing including an investment in the Fund. An investment in the Fund involves risk, including, the following principal risks, among others: Management and Strategy Risk, ETF and Mutual Funds Risk, Derivatives Risk, Fixed Income Securities Risk, Equity Risk, Market Risk, Currency Risk, Foreign Investment Risk, and Portfolio Turnover Risk. Summary descriptions of these and other principal risks of investing in the Fund are set forth below. Before you decide whether to invest in the Fund, carefully consider these risks associated with investing in the Fund, which may cause investors to lose money. There can be no assurance that the Fund will achieve its investment objective. An investment in the Fund is not a deposit of the bank and is not insured or guaranteed by the Federal Deposit Insurance Corporation or any other government agency. Please see the Fund’s prospectus for additional risk disclosures.
The Morningstar Target Risk Index family is designed to meet the needs of investors who would like to maintain a target level of equity exposure through a portfolio diversified across equities, bonds and inflation-hedged instruments. The Morningstar Moderate Target Risk Index, the Fund’s benchmark, seeks approximately 60% global equity exposure.
The S&P 500 Index is the Standard & Poor’s Composite Index of 500 stocks and is a widely recognized, unmanaged index of common stock prices.
The NASDAQ Composite is a stock market index that includes almost all stocks listed on the Nasdaq stock exchange.
The Bloomberg US Aggregate Bond Index is a broad base, market capitalization-weighted bond market index representing intermediate term investment grade bonds traded in the United States. The index is frequently used by investors as a “stand-in” for measuring the performance of the US bond market.
All indexes are shown for comparative purposes only. One cannot invest directly in an index.
| |
| Discussion of Fund Performance |
|
A letter from Clayton Wilkin of NSI Retail Advisors, LLC and portfolio manager of the North Square Trilogy Alternative Return Fund.
Dear Shareholder,
From May 2021 to December 2021, during a period of subdued volatility, the equity markets soared to new all-time highs. A number of factors contributed to the markets’ move higher, including more accommodative Federal Reserve monetary policy, the reopening of global economies and the underlying support provided to foster growth by global central banks.
Not long after the beginning of 2022, market sentiment changed markedly, however. The Federal Reserve shifted monetary policy to a more “hawkish,” or restrictive stance, signaling their intention to raise interest rates to subdue inflation and engineer a “soft landing” for an economy that appeared to be overheating. As a result, the S&P 500 Index sold off by -5.17% in January as investors and market observers began to readjust their outlooks and forecasts.
In February, Russia invaded Ukraine, which exacerbated the threat of rising inflation. The Russian-Ukraine war intensified a global supply chain shortage that was beginning to recover from the COVID-19 crisis. As the world placed sanctions on Russia, one of the world’s largest oil and natural gas providers, by May, retail gasoline prices at the pumps rose to record highs, and oil prices surged above $100-per-barrel. Additionally, the cost of wheat nearly doubled as Ukraine’s wheat production halted overnight, and China went through another round of COVID-19 lockdowns. All this uncertainty and volatility caused the S&P 500 Total Return Index to decline by -12.76% from 12/31/2021 to 5/31/2022.
For the fiscal year ending 5/31/2022, the North Square Trilogy Alternative Return Fund returned -5.45% for Class I shares, the Bloomberg US Agg Total Return Index lost -8.22%, the S&P 500 Index declined by -0.30%, and the HFRX Absolute Return Index returned 0.22%.
The North Square Trilogy Alternative Return Fund is a total return mutual fund managed with the aim of maintaining lower risk and volatility than the U.S. equity markets. However, it was a challenging market environment for the Trilogy Fund’s portfolio management team as the fixed income markets experienced one of its worst years in recent memory. For example, from December 31, 2021, to May 31, 2022, the Bloomberg US Agg Total Return Index was down -8.92%. As noted, the S&P Total Return Index was also down by -12.76%. During that same period, the Fund was only down -6.54%.* When there is a strong positive correlation between the fixed income and equity markets, fixed income securities cannot always be relied upon to supply the typical flight to safety during periods of market decline. The negative returns in both fixed income and equities hurt the Fund’s Income Position, which consists of fixed income ETFs, and the Equity Position, which consists of U.S. stocks and ETFs. Although it was a difficult 12 months, not all of the Trilogy Alternative Return Fund’s stocks were down as the Fund had robust performers in the healthcare sector. Merck, Pfizer, and Eli Lilly all contributed solid gains of over 30% from May 2021 to May 2022.
Fortunately, the Fund has option strategies that may help alleviate the pain of market drawdowns with downside protection. For example, the Equity Position has an option collar surrounding the notional value of the equity holdings. The Fund also has a Market Movement Position that employs various option strategies. In particular, the Market Movement Position holds long-put spreads that help protect your portfolio during periods of massive declines.
We have experienced a market environment unlike any other in recent years: high inflation, restrictive Federal Reserve monetary policy, global economic slowdowns, global war. Consequently, both fixed income and U.S. equity markets have suffered declines. We do not have another historical comparison we can look to for guidance, and the economic outlook over the next six months is pessimistic. That is why we believe active management is a necessity for your portfolio. We follow a systematic approach to help us make decisions during periods of uncertainty. We are confident the mix between equities, fixed income, and options will provide the Trilogy Alternative Return Fund and your portfolio the diversification that is required to weather the ongoing storm.
Sincerely,
Clayton Wilkin
Portfolio Manager
*Call 855-551-5521 or visit northsquareinvest.com for the most recent month-end performance results. Current performance may be lower or higher than the performance data quoted. The performance data quoted represents past performance, which is no guarantee of future results. Investment return and principal value of an investment will fluctuate so that an investor’s shares, when redeemed, may be worth more or less than their original cost.
Principal Risks of Investing: Risk is inherent in all investing including an investment in the Fund. An investment in the Fund involves risk, including, the following principal risks, among others: Management and Strategy Risk, ETF and Mutual Funds Risk, Derivatives Risk, Fixed Income Securities Risk, Equity Risk, Market Risk, Currency Risk, Foreign Investment Risk and High Yield (“Junk”) Bond Risk. Summary descriptions of these and other principal risks of investing in the Fund are set forth below. Before you decide whether to invest in the Fund, carefully consider these risks associated with investing in the Fund, which may cause investors to lose money. There can be no assurance that the Fund will achieve its investment objective. An investment in the Fund is not a deposit of the bank and is not insured or guaranteed by the Federal Deposit Insurance Corporation or any other government agency. Please see the Fund’s prospectus for additional risk disclosures.
The S&P 500 Index is the Standard & Poor’s Composite Index of 500 stocks and is a widely recognized, unmanaged index of common stock prices. One cannot invest directly in an index.
The Bloomberg US Aggregate Bond Index is a broad base, market capitalization-weighted bond market index representing intermediate term investment grade bonds traded in the United States. The index is frequently used by investors as a “stand-in” for measuring the performance of the US bond market. This index is shown for comparative purposes only.
A market “drawdown” measures the percentage decline from a peak to a trough.
North Square Spectrum Alpha Fund
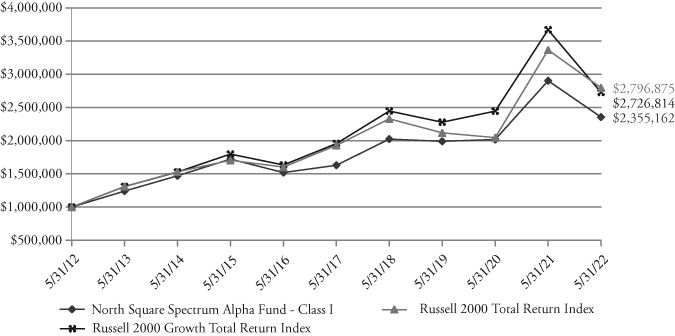
FUND PERFORMANCE at May 31, 2022 (Unaudited)
Performance of a $1,000,000 Investment
This graph compares a hypothetical $1,000,000 investment in the Fund’s Class I shares, made on May 31, 2012, with a similar investment in the Russell 2000 Growth Total Return Index and the Russell 2000 Total Return Index. The performance graph above is shown for the Fund’s Class I shares; Class A shares performance may vary. Results include the reinvestment of all dividends and capital gains.
The Russell 2000 Growth Total Return Index measures the performance of U.S. small cap growth stocks. The Russell 2000 Total Return Index measures the performance of the small cap segment of the U.S. equity universe. These indices do not reflect expenses, fees or sales charge, which would lower performance. The indices are unmanaged and they are not available for investment.
| | | Average Annual | |
| | | | | | Since | Inception |
Total Returns as of May 31, 2022 | 6 Month | 1 Year | 5 Year | 10 Year | Inception | Date |
| Before deducting maximum sales charge | | | | | | |
Class A1 | -22.44% | -19.05% | 7.37% | 8.61% | 9.28% | 01/03/94 |
Class I2 | -22.34% | -18.90% | 7.65% | 8.94% | 9.49% | 12/29/09 |
| After deducting maximum sales charge | | | | | | |
Class A1 | -26.90% | -23.71% | 6.11% | 7.97% | 9.06% | 01/03/94 |
| Russell 2000 Growth Total Return Index | -24.46% | -25.71% | 6.87% | 10.55% | 7.22% | 01/03/94 |
| Russell 2000 Total Return Index | -14.70% | -16.92% | 7.72% | 10.83% | 8.68% | 01/03/94 |
1 | Maximum sales charge for Class A shares is 5.75%. No initial sales charge applies on investments of $500,000 or more, but a contingent deferred sales charge (“CDSC”) of 1.00% will be imposed on certain redemptions of such shares within 12 months of the date of purchase. |
2 | Class I shares do not have any initial or contingent deferred sales charge. |
The Fund acquired all assets and assumed the liabilities of the Oak Ridge Small Cap Growth Fund (the “Predecessor Fund”) effective the close of business on May 10, 2019. As a result of the reorganization, the Fund is the accounting successor of the Predecessor Fund. Performance results shown in the table above for periods prior to the close of business on May 10, 2019 reflect the performance of the Predecessor Fund. Effective January 11, 2022, the Fund changed names to the North Square Spectrum Alpha Fund (formerly, North Square Oak Ridge Small Cap Growth Fund), changed investment strategy (Note 1), and changed Sub-Advisors to NSI Retail Advisors, LLC (formerly, Oak Ridge Investments, LLC).
The performance data quoted here represents past performance and past performance is not a guarantee of future results. Investment return and principal value will fluctuate so that an investor’s shares, when redeemed, may be worth more or less than their original cost. Current performance may be lower or higher than the performance information quoted. The most recent month end performance may be obtained by calling 1-855-551-5521.
North Square Spectrum Alpha Fund
FUND PERFORMANCE at May 31, 2022 (Unaudited) – Continued
Gross and net expense ratios for Class A shares were 1.83% and 2.03%, for Class I shares were 1.59% and 1.78%, which were the amounts stated in the current prospectus dated January 11, 2022. The net expense ratio is higher than the gross as a result of fee recoupment. For the Fund’s current one year expense ratios, please refer to the Financial Highlights section of this report. The Fund’s advisor has contractually agreed to waive its fees and/or pay for operating expenses of the Fund to ensure that total annual fund operating expenses do not exceed 1.30% and 1.05% of the average daily net assets of the Fund’s Class A, and Class I shares, respectively. This agreement is in effect until September 30, 2023, and it may be terminated before that date only by the Trust’s Board of Trustees. In the absence of such waivers, the Fund’s returns would have been lower.
Returns reflect the reinvestment of distributions made by the Fund, if any. The graph and the performance table shown do not reflect the deduction of taxes that a shareholder would pay on Fund distributions or the redemption of Fund shares.
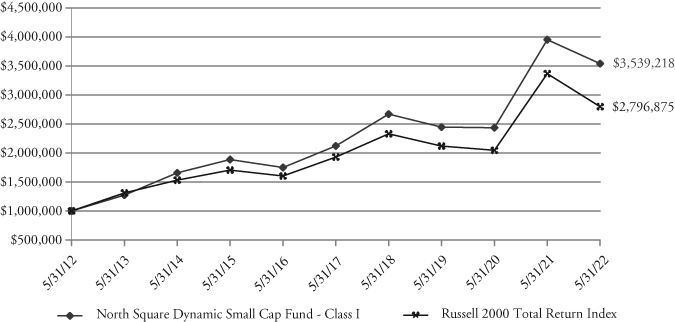
North Square Dynamic Small Cap Fund
FUND PERFORMANCE at May 31, 2022 (Unaudited)
Performance of a $1,000,000 Investment
This graph compares a hypothetical $1,000,000 investment in the Fund’s Class I shares, made on May 31, 2012, with a similar investment in the Russell 2000 Total Return Index. Results include the reinvestment of all dividends and capital gains.
The Russell 2000 Total Return Index measures the performance of the small cap segment of the U.S. equity universe. The index does not reflect expenses, fees or sales charge, which would lower performance. The index is unmanaged and it is not available for investment.
| | | Average Annual | |
| | | | | | Since | Inception |
Total Returns as of May 31, 2022 | 6 Month | 1 Year | 5 Year | 10 Year | Inception | Date |
Class I | -12.93% | -10.43% | 10.78% | 13.47% | 13.16% | 11/01/08 |
| Russell 2000 Total Return Index | -14.70% | -16.92% | 7.72% | 10.83% | 11.09% | 11/01/08 |
The Fund acquired all assets and assumed the liabilities of the Oak Ridge Dynamic Small Cap Fund (the “Predecessor Fund”) effective the close of business on May 10, 2019. The Predecessor Fund commenced operations on September 30, 2015 after the conversion of the Algert Global U.S. Small Cap account (the “Predecessor Account”). As a result of each reorganization, the Fund is the accounting successor of each the Predecessor Fund and Predecessor Account. Performance results shown in the performance table above between May 10, 2019 and September 30, 2015 represent the performance of the Predecessor Fund, and performance results shown prior to September 30, 2015 represent the performance of the Predecessor Account. The Predecessor Account was not registered under the Investment Company Act of 1940, as amended (the “1940 Act”), and therefore was not subject to certain restrictions imposed by the 1940 Act on registered investment companies and by the Internal Revenue Code of 1986 on regulated investment companies. If the Predecessor Account had been registered under the 1940 Act, the Predecessor Account’s performance may have been adversely affected.
The performance data quoted here represents past performance and past performance is not a guarantee of future results. Investment return and principal value will fluctuate so that an investor’s shares, when redeemed, may be worth more or less than their original cost. Current performance may be lower or higher than the performance information quoted. The most recent month end performance may be obtained by calling 1-855-551-5521.
Gross and net expense ratios for the Class I shares were 1.67% and 0.99%, respectively, which were stated in the current prospectus dated September 27, 2021. For the Fund’s current one year expense ratios, please refer to the Financial Highlights section of this report. The Fund’s Advisor has contractually agreed to waive its fees and/or pay for operating expenses of the Fund to ensure that total annual fund operating expenses does not exceed 0.99% of the average daily net assets of the Fund’s Class I shares. This agreement is in effect until September 30, 2029, and it may be terminated before that date only by the Trust’s Board of Trustees. In the absence of such waivers, the Fund’s returns would have been lower.
Returns reflect the reinvestment of distributions made by the Fund, if any. The graph and the performance table above do not reflect the deduction of taxes that a shareholder would pay on Fund distributions or the redemption of Fund shares.
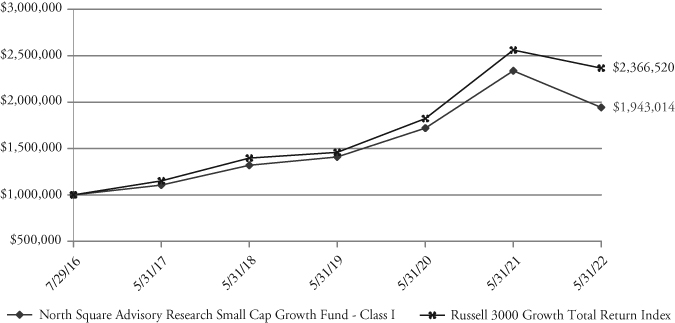
North Square Advisory Research Small Cap Growth Fund
FUND PERFORMANCE at May 31, 2022 (Unaudited)
Performance of a $1,000,000 Investment
This graph compares a hypothetical $1,000,000 investment in the Fund’s Class I shares, made at May 31, 2012, with a similar investment in the Russell 3000 Growth Total Return Index. Results include the reinvestment of all dividends and capital gains.
The Russell 3000 Growth Total Return Index is a market capitalization weighted index and includes companies that display signs of above average growth. The index is used to provide a gauge of the performance of growth stocks in the U.S. This index does not reflect expenses, fees, or sales charge, which would lower performance. The index is unmanaged and it is not available for investment.
| | | Average Annual | |
| | | | | | Since | Inception |
Total Returns as of May 31, 2022 | 6 Month | 1 Year | 3 Year | 5 Year | Inception | Date |
| Class I | -27.22% | -16.88% | 11.31% | 11.93% | 12.05% | 07/29/16 |
| Russell 3000 Growth Total Return Index | -20.48% | -7.60% | 17.51% | 15.50% | 15.90% | 07/29/16 |
The Fund acquired all assets and assumed the liabilities of the Oak Ridge Disciplined Growth Fund (the “Predecessor Fund”) effective the close of business on May 10, 2019. As a result of the reorganization, the Fund is the accounting successor of the Predecessor Fund. Performance results shown in the table above for periods prior to the close of business on May 10, 2019 reflect the performance of the Predecessor Fund. Effective January 11, 2022, the Fund changed names to the North Square Advisory Research Small Cap Growth Fund (formerly, North Square Oak Ridge All Cap Growth Fund), changed investment strategy (Note 1), and changed Sub-Advisors to Advisory Research, Inc. (formerly, Oak Ridge Investments, LLC).
The performance data quoted here represents past performance and past performance is not a guarantee of future results. Investment return and principal value will fluctuate so that an investor’s shares, when redeemed, may be worth more or less than their original cost. Current performance may be lower or higher than the performance information quoted. The most recent month end performance may be obtained by calling 1-855-551-5521.
Gross and net expense ratios for the Class I shares were 1.45% and 0.94%, respectively, which were stated in the current prospectus dated September 27, 2019. For the Fund’s current one year expense ratios, please refer to the Financial Highlights section of this report. The Fund’s Advisor has contractually agreed to waive its fees and/or pay for operating expenses of the Fund to ensure that total annual fund operating expenses does not exceed 0.94% of the average daily net assets of the Fund’s Class I shares. This agreement is in effect until September 30, 2029, and it may be terminated before that date only by the Trust’s Board of Trustees. In the absence of such waivers, the Fund’s returns would have been lower.
Returns reflect the reinvestment of distributions made by the Fund, if any. The graph and the performance table above do not reflect the deduction of taxes that a shareholder would pay on Fund distributions or the redemption of the Fund shares.
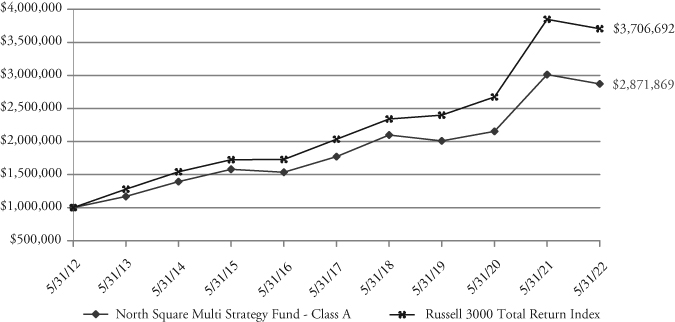
North Square Multi Strategy Fund
FUND PERFORMANCE at May 31, 2022 (Unaudited)
Performance of a $10,000 Investment
This graph compares a hypothetical $1,000,000 investment in the Fund’s Class I shares, made on May 31, 2012, with a similar investment in the Russell 3000 Total Return Index. The performance graph above is shown for the Fund’s Class I shares; Class A shares performance may vary. Results include the reinvestment of all dividends and capital gains.
The Russell 3000 Index measures the performance of the largest 3,000 U.S. companies. The index does not reflect expenses, fees or sales charge, which would lower performance. The index is unmanaged, and it is not available for investment.
| | | Average Annual | |
| | | | | | Since | Inception |
Total Returns as of May 31, 2022 | 6 Month | 1 Year | 5 Year | 10 Year | Inception | Date |
| Before deducting maximum sales charge | | | | | | |
Class A1 | -9.48% | -4.94% | 9.66% | 10.86% | 5.66% | 03/01/99 |
Class I2 | -9.38% | -4.79% | 10.15% | 11.13% | 7.71% | 08/10/04 |
| After deducting maximum sales charge | | | | | | |
Class A1 | -14.69% | -10.41% | 8.37% | 10.21% | 5.39% | 03/01/99 |
| Russell 3000 Total Return Index | -10.50% | -3.68% | 12.75% | 14.00% | 7.58% | 03/01/99 |
1 | Maximum sales charge for Class A shares is 5.75%. No initial sales charge applies on investments of $500,000 or more, but a contingent deferred sales charge (“CDSC”) of 1.00% will be imposed on certain redemptions of such shares within 12 months of the date of purchase. |
2 | Class I shares do not have any initial or contingent deferred sales charge. |
The Fund acquired all assets and assumed the liabilities of the Oak Ridge Multi Strategy Fund (the “Predecessor Fund”) effective the close of business on May 10, 2019. As a result of the reorganization, the Fund is the accounting successor of the Predecessor Fund. Performance results shown in the table above for periods prior to the close of business on May 10, 2019 reflect the performance of the Predecessor Fund. Effective September 30, 2021, the Fund changed Sub-Advisors to NSI Retail Advisors, LLC (formerly, Oak Ridge Investments, LLC).
North Square Multi Strategy Fund
FUND PERFORMANCE at May 31, 2022 (Unaudited) – Continued
The performance data quoted here represents past performance and past performance is not a guarantee of future results. Investment return and principal value will fluctuate so that an investor’s shares, when redeemed, may be worth more or less than their original cost. Current performance may be lower or higher than the performance information quoted. The most recent month end performance may be obtained by calling 1-855-551-5521.
The gross expense ratio for Class A shares was 1.93% and for Class I shares was 1.68%, which were the amounts stated in the current prospectus dated September 30, 2021. Expense ratios reported for other periods in the Financial Highlights section of this report may differ. The Fund’s advisor has contractually agreed to waive its fees and/or pay for operating expenses of the Fund to ensure that total annual fund operating expenses (exclusive of any taxes, leverage interest, brokerage commissions, dividend and interest expenses on short sales, any acquired fund fees and expenses, expenses incurred in connection with any merger or reorganization, and extraordinary expenses such as litigation expenses) do not exceed 1.20% and 1.17% of the average daily net assets of the Fund’s Class A and Class I shares, respectively. This agreement is in effect until September 30, 2029, and it may be terminated before that date only by the Trust’s Board of Trustees. In the absence of such waivers, the Fund’s returns would have been lower.
Returns reflect the reinvestment of distributions made by the Fund, if any. The graph and the performance table shown do not reflect the deduction of taxes that a shareholder would pay on Fund distributions or the redemption of Fund shares.
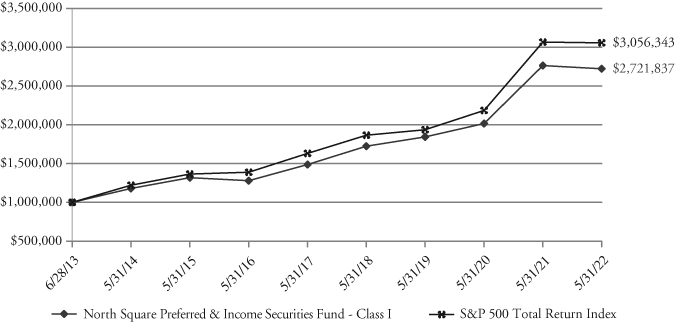
North Square Preferred and Income Securities Fund
FUND PERFORMANCE at May 31, 2022 (Unaudited)
Performance of a $1,000,000 Investment
This graph compares a hypothetical $1,000,000 investment in the Fund’s Class I shares, made at its inception, with a similar investment in the S&P 500 Total Return Index. Results include the reinvestment of all dividends and capital gains.
The S&P 500 Total Return Index measures the performance of primarily large cap U.S. stocks. The index does not reflect expenses, fees or sales charge, which would lower performance. The index is unmanaged and it is not available for investment.
| | | Average Annual | |
| | | | | | Since | Inception |
Total Returns as of May 31, 2022 | 6 Month | 1 Year | 3 Year | 5 Year | Inception | Date |
Class I | -7.70% | -1.49% | 13.86% | 12.85% | 11.88% | 06/28/13 |
| S&P 500 Total Return Index | -8.85% | -0.30% | 16.44% | 13.38% | 13.34% | 06/28/13 |
The Fund acquired all assets and assumed the liabilities of the Oak Ridge Dividend Growth Fund (the “Predecessor Fund”) effective the close of business on May 10, 2019. As a result of the reorganization, the Fund is the accounting successor of the Predecessor Fund. Performance results shown in the table above for periods prior to the close of business on May 10, 2019 reflect the performance of the Predecessor Fund. Effective January 11, 2022, the Fund changed names to the North Square Preferred and Income Securities Fund (formerly, North Square Oak Ridge Dividend Growth Fund), changed investment strategy (Note 1), and changed Sub-Advisors to Red Cedar Investment Management, LLC (formerly, Oak Ridge Investments, LLC).
The performance data quoted here represents past performance and past performance is not a guarantee of future results. Investment return and principal value will fluctuate so that an investor’s shares, when redeemed, may be worth more or less than their original cost. Current performance may be lower or higher than the performance information quoted. The most recent month end performance may be obtained by calling 1-855-551-5521.
Gross and net expense ratios for the Class I shares were 1.43% and 0.97%, respectively, which were stated in the current prospectus dated September 27, 2019. For the Fund’s current one year expense ratios, please refer to the Financial Highlights section of this report. The Fund’s Advisor has contractually agreed to waive its fees and/or pay for operating expenses of the Fund to ensure that total annual fund operating expenses does not exceed 0.97% of the average daily net assets of the Fund’s Class I shares. This agreement is in effect until September 30, 2029, and it may be terminated before that date only by the Trust’s Board of Trustees. In the absence of such waivers, the Fund’s returns would have been lower.
Returns reflect the reinvestment of distributions made by the Fund, if any. The graph and the performance table above do not reflect the deduction of taxes that a shareholder would pay on Fund distributions or the redemption of Fund shares.
North Square Tactical Growth Fund
FUND PERFORMANCE at May 31, 2022 (Unaudited)
Performance of a $1,000,000 Investment
This graph compares a hypothetical $1,000,000 investment in the Fund’s Class I shares, made at its inception, with a similar investment in the Morningstar Moderately Aggressive Target Risk Total Return Index. Results include the reinvestment of all dividends and capital gains.
The Morningstar Moderately Aggressive Target Risk Total Return Index seeks approximately 80% exposure to global equity markets. The index does not incorporate Environmental, Social, or Governance (ESG) criteria. The index does not reflect expenses, fees or sales charge, which would lower performance. The index is unmanaged, and it is not available for investment.
| | | Average Annual | |
| | | | | | Since | Inception |
Total Returns as of May 31, 2022 | 6 Month | 1 Year | 5 Year | 10 Year | Inception | Date |
| Before deducting maximum sales charge | | | | | | |
Class A1 | -8.05% | -5.93% | 6.82% | NA | 6.88% | 04/01/13 |
Class C2 | -8.40% | -6.61% | 6.02% | NA | 6.08% | 04/01/13 |
Class I3 | -7.94% | -5.71% | 7.08% | 7.91% | 6.75% | 05/03/04 |
| After deducting maximum sales charge | | | | | | |
Class A1 | -13.34% | -11.34% | 5.56% | NA | 6.20% | 04/01/13 |
Class C2 | -9.27% | -7.50% | 6.02% | NA | 6.08% | 04/01/13 |
| Morningstar Moderately | | | | | | |
| Aggressive Target Risk Total Return Index | -7.87% | -7.44% | 7.72% | 9.03% | 7.57% | 05/03/04 |
1 | Maximum sales charge for Class A shares is 5.75%. No initial sales charge applies on investments of $500,000 or more, but a contingent deferred sales charge (“CDSC”) of 1.00% will be imposed on certain redemptions of such shares within 12 months of the date of purchase. |
2 | A CDSC of 1.00% will be charged on Class C Shares purchases that are redeemed in whole or in part within 12 months of the date of purchase. |
3 | Class I shares do not have any initial or contingent deferred sales charge. |
The Fund acquired all assets and assumed the liabilities of the Stadion Tactical Growth Fund (the “Predecessor Fund”) effective the close of business on June 11, 2021. The Predecessor Fund commenced operations on March 23, 2013 after the conversion of the ETF Market Opportunity Fund (the “Acquired Fund”), a series of Aviemore Trust. As a result of each reorganization, the Fund is the accounting successor of each the Predecessor Fund and Acquired Fund. Performance results shown in the performance table above between June 11, 2021 and March 23, 2013 reflect the performance of the Predecessor Fund, and performance results shown prior to March 23, 2013 represent the performance of the Acquired Fund. The performance shown for Class A and Class C shares for periods pre-dating the commencement of operations of those classes reflects the performance of the Fund’s Class I shares, the initial share class,
North Square Tactical Growth Fund
FUND PERFORMANCE at May 31, 2022 (Unaudited) – Continued
calculated using the fees and expenses of Class A and Class C shares respectively and without the effect of any fee and expense limitations or waivers. If Class A and Class C shares of the Fund had been available during periods prior to April 1, 2013, the performance shown may have been different.
The performance data quoted here represents past performance and past performance is not a guarantee of future results. Investment return and principal value will fluctuate so that an investor’s shares, when redeemed, may be worth more or less than their original cost. Current performance may be lower or higher than the performance information quoted. The most recent month end performance may be obtained by calling 1-855-551-5521.
Gross expense ratios for Class A, C and I shares were 1.73%, 2.49% and 1.51%, respectively, and net expense ratios for Class A, C, and I shares were 1.73%, 2.48% and 1.48%, respectively, which were the amounts stated in the current prospectus dated September 30, 2021. Expense ratios reported for other periods in the Financial Highlights section of this report may differ. The Fund’s advisor has contractually agreed to waive its fees and/or pay for operating expenses of the Fund to ensure that total annual fund operating expenses (exclusive of any taxes, leverage interest, brokerage commissions, dividend and interest expenses on short sales, any acquired fund fees and expenses, expenses incurred in connection with any merger or reorganization, extraordinary expenses such as litigation expenses, and payments, if any, under Rule 12b-1 Distribution Plan) do not exceed 1.30% of the average daily net assets of the each class of the Fund. This agreement is in effect until January 19, 2023, and it may be terminated before that date only by the Trust’s Board of Trustees. In the absence of such waivers, the Fund’s returns would have been lower.
Returns reflect the reinvestment of distributions made by the Fund, if any. The performance table above does not reflect the deduction of taxes that a shareholder would pay on Fund distributions or the redemption of Fund shares.
North Square Tactical Defensive Fund
FUND PERFORMANCE at May 31, 2022 (Unaudited)
Performance of a $1,000,000 Investment
This graph compares a hypothetical $1,000,000 investment in the Fund’s Class I shares, made at its inception, with a similar investment in the Morningstar Moderate Target Risk Index. Results include the reinvestment of all dividends and capital gains.
The Morningstar Moderate Target Risk Index seeks approximately 60% exposure to global equity markets. The index does not incorporate Environmental, Social, or Governance (ESG) criteria. The index does not reflect expenses, fees or sales charge, which would lower performance. The index is unmanaged, and it is not available for investment.
| | | Average Annual | |
| | | | | | Since | Inception |
Total Returns as of May 31, 2022 | 6 Month | 1 Year | 5 Year | 10 Year | Inception | Date |
| Before deducting maximum sales charge | | | | | | |
Class A1 | -4.31% | 0.30% | 5.54% | 5.75% | 4.21% | 09/15/06 |
Class C2 | -4.67% | -0.49% | 4.75% | 4.94% | 4.66% | 10/01/09 |
Class I3 | -4.21% | 0.46% | 5.76% | 5.97% | 5.58% | 05/28/10 |
| After deducting maximum sales charge | | | | | | |
Class A1 | -9.81% | -5.47% | 4.30% | 5.13% | 3.82% | 09/15/06 |
Class C2 | -5.62% | -1.49% | 4.75% | 4.94% | 4.66% | 10/01/09 |
| Morningstar Moderate Target Risk Index | -7.96% | -7.42% | 6.32% | 7.27% | 6.18% | 09/15/06 |
1 | Maximum sales charge for Class A shares is 5.75%. No initial sales charge applies on investments of $500,000 or more, but a contingent deferred sales charge (“CDSC”) of 1.00% will be imposed on certain redemptions of such shares within 12 months of the date of purchase. |
2 | A CDSC of 1.00% will be charged on Class C Shares purchases that are redeemed in whole or in part within 12 months of the date of purchase. |
3 | Class I shares do not have any initial or contingent deferred sales charge. |
The Fund acquired all assets and assumed the liabilities of the Stadion Tactical Defensive Fund (the “Predecessor Fund”) effective the close of business on June 11, 2021. As a result of the reorganization, the Fund is the accounting successor of the Predecessor Fund. Performance results shown in the table above for periods prior to the close of business on June 11, 2021 reflect the performance of the Predecessor Fund.
North Square Tactical Defensive Fund
FUND PERFORMANCE at May 31, 2022 (Unaudited) – Continued
The performance data quoted here represents past performance and past performance is not a guarantee of future results. Investment return and principal value will fluctuate so that an investor’s shares, when redeemed, may be worth more or less than their original cost. Current performance may be lower or higher than the performance information quoted. The most recent month end performance may be obtained by calling 1-855-551-5521.
Gross expense ratios for Class A, C and I shares were 1.98%, 2.72% and 1.79%, respectively, which were the amounts stated in the current prospectus dated September 30, 2021. Expense ratios reported for other periods in the Financial Highlights section of this report may differ. The Fund’s advisor has contractually agreed to waive its fees and/or pay for operating expenses of the Fund to ensure that total annual fund operating expenses (exclusive of any taxes, leverage interest, brokerage commissions, dividend and interest expenses on short sales, any acquired fund fees and expenses, expenses incurred in connection with any merger or reorganization, extraordinary expenses such as litigation expenses, and payments, if any, under Rule 12b-1 Distribution Plan) do not exceed 1.70% of the average daily net assets of the each class of the Fund. This agreement is in effect until January 19, 2023, and it may be terminated before that date only by the Trust’s Board of Trustees. In the absence of such waivers, the Fund’s returns would have been lower.
Returns reflect the reinvestment of distributions made by the Fund, if any. The graph and the performance table shown do not reflect the deduction of taxes that a shareholder would pay on Fund distributions or the redemption of Fund shares.
North Square Trilogy Alternative Return Fund
FUND PERFORMANCE at May 31, 2022 (Unaudited)
Performance of a $1,000,000 Investment
This graph compares a hypothetical $1,000,000 investment in the Fund’s Class I shares, made at its inception, with a similar investment in the Morningstar Moderate Target Risk Total Return Index. Results include the reinvestment of all dividends and capital gains.
The HFRX Absolute Return Index is designed to be representative of the overall composition of the hedge fund universe. It is comprised of all eligible hedge fund strategies; including but not limited to convertible arbitrage, distressed securities, equity hedge, equity market neutral, event driven, macro, merger arbitrage, and relative value arbitrage. The Bloomberg U.S. Aggregate Bond Index is a broad-based benchmark that measures the investment grade, U.S. dollardenominated, fixed-rate taxable bond market. This includes Treasuries, government-related and corporate securities, mortgage-backed securities, asset-backed securities and collateralised mortgage-backed securities. The indeces do not reflect expenses, fees or sales charge, which would lower performance. The indeces are unmanaged, and they are not available for investment.
| | | Average Annual | |
| | | | | | Since | Inception |
Total Returns as of May 31, 2022 | 6 Month | 1 Year | 5 Year | 10 Year | Inception | Date |
| Before deducting maximum sales charge | | | | | | |
Class A1 | -5.34% | -5.69% | 0.63% | 1.99% | 1.81% | 04/02/12 |
Class C2 | -5.71% | -6.41% | -0.11% | 1.22% | 1.05% | 04/02/12 |
Class I3 | -5.22% | -5.45% | 0.90% | 2.23% | 2.05% | 04/02/12 |
| After deducting maximum sales charge | | | | | | |
Class A1 | -10.78% | -11.11% | -0.55% | 1.39% | 1.21% | 04/02/12 |
Class C2 | -6.65% | -7.35% | -0.11% | 1.22% | 1.05% | 04/02/12 |
| HFRX Absolute Return Index | 0.94% | 0.22% | 2.14% | 2.03% | 1.96% | 04/02/12 |
| Bloomberg U.S. Aggregate Bond Index | -9.15% | -8.22% | 1.18% | 1.71% | 1.87% | 04/02/12 |
1 | Maximum sales charge for Class A shares is 5.75%. No initial sales charge applies on investments of $500,000 or more, but a contingent deferred sales charge (“CDSC”) of 1.00% will be imposed on certain redemptions of such shares within 12 months of the date of purchase. |
2 | A CDSC of 1.00% will be charged on Class C Shares purchases that are redeemed in whole or in part within 12 months of the date of purchase. |
3 | Class I shares do not have any initial or contingent deferred sales charge. |
The Fund acquired all assets and assumed the liabilities of the Stadion Tactical Trilogy Alternative Return Fund (the “Predecessor Fund”) effective the close of business on June 11, 2021. As a result of the reorganization, the Fund is the accounting successor of the Predecessor Fund. Performance results shown in the table above for periods prior to the close of business on June 11, 2021 reflect the performance of the Predecessor Fund.
North Square Trilogy Alternative Return Fund
FUND PERFORMANCE at May 31, 2022 (Unaudited) – Continued
The performance data quoted here represents past performance and past performance is not a guarantee of future results. Investment return and principal value will fluctuate so that an investor’s shares, when redeemed, may be worth more or less than their original cost. Current performance may be lower or higher than the performance information quoted. The most recent month end performance may be obtained by calling 1-855-551-5521.
Gross expense ratios for Class A, C and I shares were 2.03%, 2.79% and 1.85%, respectively, and net expense ratios for Class A, C, and I were 1.69%, 2.44% and 1.44%, respectively, which were the amounts stated in the current prospectus dated September 30, 2021. Expense ratios reported for other periods in the Financial Highlights section of this report may differ. The Fund’s advisor has contractually agreed to waive its fees and/or pay for operating expenses of the Fund to ensure that total annual fund operating expenses (exclusive of any taxes, leverage interest, brokerage commissions, dividend and interest expenses on short sales, any acquired fund fees and expenses, expenses incurred in connection with any merger or reorganization, extraordinary expenses such as litigation expenses, and payments, if any, under Rule 12b-1 Distribution Plan) do not exceed 1.38% of the average daily net assets of the each class of the Fund. This agreement is in effect until January 19, 2023, and it may be terminated before that date only by the Trust’s Board of Trustees. In the absence of such waivers, the Fund’s returns would have been lower.
Returns reflect the reinvestment of distributions made by the Fund, if any. The performance table above does not reflect the deduction of taxes that a shareholder would pay on Fund distributions or the redemption of Fund shares.
North Square Spectrum Alpha Fund
SCHEDULE OF INVESTMENTS
As of May 31, 2022
| Number | | | | | |
| of Shares | | | | Value | |
| | | MUTUAL FUNDS – 99.5% | | | |
| | 836,475 | | North Square Advisory Research Small Cap Growth Fund – Class I1 | | $ | 10,600,059 | |
| | 1,630,496 | | North Square Advisory Research Small Cap Value Fund – Class I1 | | | 17,370,495 | |
| | 6,060,602 | | North Square Dynamic Small Cap Fund – Class I1 | | | 67,197,530 | |
| | | | TOTAL MUTUAL FUNDS | | | | |
| | | | (Cost $110,940,563) | | | 95,168,084 | |
| | | | | | | | |
| | | | SHORT-TERM INVESTMENT – 0.7% | | | | |
| | 667,060 | | First American Treasury Obligations Fund – Class X, 0.67%2 | | | 667,060 | |
| | | | TOTAL SHORT-TERM INVESTMENT | | | | |
| | | | (Cost $667,060) | | | 667,060 | |
| | | | TOTAL INVESTMENTS – 100.2% | | | | |
| | | | (Cost $111,607,623) | | | 95,835,144 | |
| | | | Liabilities in Excess of Other Assets – (0.2)% | | | (208,079 | ) |
| | | | TOTAL NET ASSETS – 100.0% | | $ | 95,627,065 | |
1 | Affiliated Company. See Note 11. |
2 | The rate is the annualized seven-day yield at period end. |
Investments are classified by industry pursuant to the Global Industry Classification Standard (GICS®), which was developed by and/or is the exclusive property of Morgan Stanley Capital International, Inc. (“MSCI”) and Standard & Poor’s Financial Services LLC (“S&P”). GICS is a service mark of MSCI and S&P and has been licensed for use by U.S. Bancorp Fund Services, LLC.
See accompanying Notes to Financial Statements.
North Square Spectrum Alpha Fund
SUMMARY OF INVESTMENTS
As of May 31, 2022
| | | Percent of Total |
Security Type/Sector | | Net Assets |
Mutual Funds | | | 99.5 | % |
Short-Term Investment | | | 0.7 | % |
| Total Investments | | | 100.2 | % |
Liabilities in Excess of Other Assets | | | (0.2 | )% |
| Total Net Assets | | | 100.0 | % |
See accompanying Notes to Financial Statements.
North Square Dynamic Small Cap Fund
SCHEDULE OF INVESTMENTS
As of May 31, 2022
| Number | | | | | |
| of Shares | | | | Value | |
| | | COMMON STOCKS – 91.6% | | | |
| | | | | | |
| | | COMMUNICATION SERVICES – 3.5% | | | |
| | | Diversified Telecommunication Services – 0.8% | | | |
| | 5,650 | | Cogent Communications Holdings, Inc. | | $ | 341,204 | |
| | 3,190 | | Iridium Communications Inc.* | | | 118,381 | |
| | 11,910 | | Ooma, Inc.* | | | 167,216 | |
| | | | | | | 626,801 | |
| | | | | | | | |
| | | | Entertainment – 0.7% | | | | |
| | 2,780 | | Madison Square Garden Sports Corp.* | | | 455,531 | |
| | 13,240 | | PLAYSTUDIOS, Inc.* | | | 83,015 | |
| | | | | | | 538,546 | |
| | | | | | | | |
| | | | Interactive Media & Services – 1.0% | | | | |
| | 10,440 | | TripAdvisor, Inc.* | | | 259,330 | |
| | 32,450 | | ZipRecruiter, Inc. – Class A* | | | 582,802 | |
| | | | | | | 842,132 | |
| | | | | | | | |
| | | | Media – 0.4% | | | | |
| | 25,633 | | Altice USA, Inc. – Class A* | | | 291,703 | |
| | | | | | | | |
| | | | Wireless Telecommunication Services – 0.6% | | | | |
| | 24,290 | | Gogo Inc.* | | | 492,115 | |
| | | | TOTAL COMMUNICATION SERVICES | | | 2,791,297 | |
| | | | | | | | |
| | | | | | | | |
| | | | CONSUMER DISCRETIONARY – 8.9% | | | | |
| | | | Auto Components – 1.3% | | | | |
| | 4,740 | | Fox Factory Holding Corp.* | | | 388,775 | |
| | 9,868 | | Patrick Industries, Inc. | | | 593,166 | |
| | 1,241 | | XPEL, Inc.* | | | 64,060 | |
| | | | | | | 1,046,001 | |
| | | | | | | | |
| | | | Automobiles – 0.1% | | | | |
| | 810 | | Thor Industries, Inc. – Class A | | | 61,536 | |
| | | | Distributors – 0.5% | | | | |
| | 20,410 | | Funko, Inc. – Class A* | | | 415,752 | |
| | | | | | | | |
| | | | Hotels, Restaurants & Leisure – 2.0% | | | | |
| | 4,560 | | Bluegreen Vacations Holding Corp. | | | 127,042 | |
| | 11,880 | | Dave & Buster’s Entertainment, Inc.* | | | 450,133 | |
| | 72,030 | | Playa Hotels & Resorts N.V.*1 | | | 622,339 | |
| | 3,900 | | SeaWorld Entertainment, Inc.* | | | 211,302 | |
| | 2,480 | | Travel + Leisure Co. | | | 126,753 | |
| | 4,900 | | Xponential Fitness, Inc. – Class A* | | | 92,512 | |
| | | | | | | 1,630,081 | |
| | | | | | | | |
| | | | Household Durables – 1.8% | | | | |
| | 24,810 | | GoPro, Inc. – Class A* | | | 171,437 | |
| | 8,290 | | Green Brick Partners, Inc.* | | | 201,613 | |
| | 46,150 | | Sonos, Inc.* | | | 1,021,299 | |
| | | | | | | 1,394,349 | |
| | | | | | | | |
| | | | Internet & Direct Marketing Retail – 0.2% | | | | |
| | 4,780 | | Revolve Group, Inc.* | | | 140,436 | |
See accompanying Notes to Financial Statements.
North Square Dynamic Small Cap Fund
SCHEDULE OF INVESTMENTS – Continued
As of May 31, 2022
| Number | | | | | |
| of Shares | | | | Value | |
| | | COMMON STOCKS (Continued) | | | |
| | | | | | |
| | | CONSUMER DISCRETIONARY (Continued) | | | |
| | | Leisure Products – 0.7% | | | |
| | 12,910 | | Clarus Corp. | | $ | 282,858 | |
| | 6,910 | | Vista Outdoor Inc.* | | | 266,311 | |
| | | | | | | 549,169 | |
| | | | | | | | |
| | | | Textiles, Apparel & Luxury Goods – 2.3% | | | | |
| | 11,130 | | Crocs, Inc.* | | | 620,609 | |
| | 940 | | Deckers Outdoor Corp.* | | | 252,446 | |
| | 25,520 | | Steven Madden, Ltd. | | | 948,834 | |
| | | | | | | 1,821,889 | |
| | | | TOTAL CONSUMER DISCRETIONARY | | | 7,059,213 | |
| | | | | | | | |
| | | | | | | | |
| | | | CONSUMER STAPLES – 4.6% | | | | |
| | | | Beverages – 0.7% | | | | |
| | 5,710 | | MGP Ingredients, Inc. | | | 553,071 | |
| | | | | | | | |
| | | | Food Products – 1.8% | | | | |
| | 8,200 | | Pilgrim’s Pride Corp.* | | | 273,224 | |
| | 5,080 | | Sanderson Farms, Inc. | | | 1,013,460 | |
| | 16,420 | | Vital Farms, Inc.* | | | 162,558 | |
| | | | | | | 1,449,242 | |
| | | | | | | | |
| | | | Personal Products – 1.6% | | | | |
| | 14,410 | | Herbalife Nutrition Ltd.*1 | | | 313,994 | |
| | 4,090 | | Medifast, Inc. | | | 682,007 | |
| | 3,590 | | USANA Health Sciences, Inc.* | | | 252,485 | |
| | | | | | | 1,248,486 | |
| | | | | | | | |
| | | | Tobacco – 0.5% | | | | |
| | 14,210 | | Turning Point Brands, Inc. | | | 415,500 | |
| | | | TOTAL CONSUMER STAPLES | | | 3,666,299 | |
| | | | | | | | |
| | | | | | | | |
| | | | ENERGY – 6.9% | | | | |
| | | | Energy Equipment & Services – 1.7% | | | | |
| | 47,380 | | ProPetro Holding Corp.* | | | 618,309 | |
| | 11,750 | | RPC, Inc.* | | | 109,980 | |
| | 28,710 | | Select Energy Services, Inc. – Class A* | | | 243,174 | |
| | 19,860 | | Solaris Oilfield Infrastructure, Inc. – Class A | | | 267,713 | |
| | 17,800 | | Transocean Ltd.*1 | | | 73,336 | |
| | | | | | | 1,312,512 | |
| | | | | | | | |
| | | | Oil, Gas & Consumable Fuels – 5.2% | | | | |
| | 3,760 | | Arch Resources, Inc. | | | 574,678 | |
| | 35,910 | | Comstock Resources, Inc.* | | | 693,063 | |
| | 16,850 | | CVR Energy, Inc. | | | 580,145 | |
| | 1,850 | | Delek US Holdings, Inc.* | | | 53,946 | |
| | 225,040 | | Gran Tierra Energy, Inc.* | | | 409,573 | |
| | 22,020 | | Kosmos Energy Ltd.* | | | 170,435 | |
| | 9,480 | | Par Pacific Holdings, Inc.* | | | 155,472 | |
| | 14,790 | | PBF Energy Inc. – Class A* | | | 491,028 | |
| | 3,520 | | Range Resources Corp.* | | | 119,504 | |
See accompanying Notes to Financial Statements.
North Square Dynamic Small Cap Fund
SCHEDULE OF INVESTMENTS – Continued
As of May 31, 2022
| Number | | | | | |
| of Shares | | | | Value | |
| | | COMMON STOCKS (Continued) | | | |
| | | | | | |
| | | ENERGY (Continued) | | | |
| | | Oil, Gas & Consumable Fuels (Continued) | | | |
| | 26,700 | | VAALCO Energy, Inc. | | $ | 204,522 | |
| | 99,072 | | W&T Offshore, Inc.* | | | 666,755 | |
| | | | | | | 4,119,121 | |
| | | | TOTAL ENERGY | | | 5,431,633 | |
| | | | | | | | |
| | | | | | | | |
| | | | FINANCIALS – 12.0% | | | | |
| | | | Banks – 7.2% | | | | |
| | 4,550 | | Amalgamated Financial Corp. | | | 98,871 | |
| | 14,000 | | The Bank of NT Butterfield & Son Ltd.1 | | | 442,120 | |
| | 19,980 | | Bank OZK | | | 828,571 | |
| | 3,150 | | Cathay General Bancorp | | | 129,496 | |
| | 3,480 | | Central Pacific Financial Corp. | | | 84,007 | |
| | 2,750 | | Columbia Banking System, Inc. | | | 82,913 | |
| | 10,615 | | Customers Bancorp, Inc.* | | | 438,400 | |
| | 20,980 | | First BanCorp.1 | | | 313,231 | |
| | 25,660 | | First Commonwealth Financial Corp. | | | 359,497 | |
| | 16,718 | | Hanmi Financial Corp. | | | 390,198 | |
| | 9,640 | | Live Oak Bancshares, Inc. | | | 387,142 | |
| | 5,230 | | Midland States Bancorp, Inc. | | | 140,582 | |
| | 3,110 | | National Bank Holdings Corp. – Class A | | | 126,733 | |
| | 8,820 | | OFG Bancorp1 | | | 249,959 | |
| | 3,240 | | Pacific Premier Bancorp, Inc. | | | 105,494 | |
| | 3,000 | | PacWest Bancorp | | | 94,740 | |
| | 5,060 | | Popular, Inc.1 | | | 413,453 | |
| | 1,590 | | Texas Capital Bancshares, Inc.* | | | 89,883 | |
| | 2,350 | | Univest Financial Corp. | | | 62,275 | |
| | 12,650 | | Veritex Holdings, Inc. | | | 435,919 | |
| | 4,970 | | Western Alliance Bancorp | | | 404,409 | |
| | | | | | | 5,677,893 | |
| | | | | | | | |
| | | | Capital Markets – 2.0% | | | | |
| | 182,480 | | BGC Partners, Inc. – Class A | | | 594,885 | |
| | 15,840 | | Cowen Inc. – Class A | | | 420,394 | |
| | 19,940 | | Donnelley Financial Solutions, Inc. | | | 620,333 | |
| | | | | | | 1,635,612 | |
| | | | | | | | |
| | | | Consumer Finance – 0.3% | | | | |
| | 14,120 | | LendingClub Corp.* | | | 221,966 | |
| | | | | | | | |
| | | | Insurance – 2.3% | | | | |
| | 4,690 | | American Equity Investment Life Holding Co. | | | 188,819 | |
| | 1,700 | | Assured Guaranty Ltd.1 | | | 100,045 | |
| | 21,455 | | CNO Financial Group, Inc. | | | 441,329 | |
| | 6,510 | | Fidelity National Financial, Inc. | | | 275,373 | |
| | 22,550 | | James River Group Holdings, Ltd.1 | | | 576,153 | |
| | 16,950 | | Universal Insurance Holdings, Inc. | | | 218,655 | |
| | | | | | | 1,800,374 | |
See accompanying Notes to Financial Statements.
North Square Dynamic Small Cap Fund
SCHEDULE OF INVESTMENTS – Continued
As of May 31, 2022
| Number | | | | | |
| of Shares | | | | Value | |
| | | COMMON STOCKS (Continued) | | | |
| | | | | | |
| | | FINANCIALS (Continued) | | | |
| | | Thrifts & Mortgage Finance – 0.2% | | | |
| | 6,220 | | Enact Holdings, Inc. | | $ | 151,270 | |
| | | | TOTAL FINANCIALS | | | 9,487,115 | |
| | | | | | | | |
| | | | | | | | |
| | | | HEALTH CARE – 15.5% | | | | |
| | | | Biotechnology – 3.8% | | | | |
| | 32,570 | | ACADIA Pharmaceuticals Inc.* | | | 526,005 | |
| | 13,440 | | Alkermes PLC*1 | | | 401,184 | |
| | 34,630 | | Amarin Corp PLC*1 | | | 50,213 | |
| | 12,240 | | BioCryst Pharmaceuticals, Inc.* | | | 113,954 | |
| | 2,930 | | Celldex Therapeutics, Inc.* | | | 68,914 | |
| | 1,470 | | Cytokinetics, Inc.* | | | 58,653 | |
| | 2,950 | | Enanta Pharmaceuticals, Inc.* | | | 117,793 | |
| | 28,370 | | Gossamer Bio, Inc.* | | | 200,009 | |
| | 15,000 | | ImmunoGen, Inc.* | | | 54,900 | |
| | 27,830 | | IVERIC bio, Inc.* | | | 290,545 | |
| | 29,110 | | Kura Oncology, Inc. | | | 383,088 | |
| | 10,910 | | Merus N.V.*1 | | | 202,490 | |
| | 8,410 | | Sage Therapeutics, Inc.* | | | 262,981 | |
| | 15,760 | | Syndax Pharmaceuticals, Inc.* | | | 260,040 | |
| | 1,900 | | Travere Therapeutics, Inc.* | | | 44,289 | |
| | | | | | | 3,035,058 | |
| | | | | | | | |
| | | | Health Care Equipment & Supplies – 4.3% | | | | |
| | 25,240 | | Cardiovascular Systems, Inc.* | | | 410,403 | |
| | 9,022 | | InMode Ltd.*1 | | | 241,880 | |
| | 7,920 | | Lantheus Holdings, Inc.* | | | 542,678 | |
| | 5,170 | | Masimo Corp.* | | | 726,023 | |
| | 4,480 | | Shockwave Medical, Inc.* | | | 735,661 | |
| | 4,330 | | STAAR Surgical Co.* | | | 285,520 | |
| | 6,119 | | Tandem Diabetes Care, Inc.* | | | 417,132 | |
| | | | | | | 3,359,297 | |
| | | | | | | | |
| | | | Health Care Providers & Services – 2.6% | | | | |
| | 12,450 | | AMN Healthcare Services, Inc.* | | | 1,206,405 | |
| | 3,297 | | CorVel Corp.* | | | 491,781 | |
| | 19,580 | | Cross Country Healthcare, Inc.* | | | 345,587 | |
| | | | | | | 2,043,773 | |
| | | | | | | | |
| | | | Health Care Technology – 0.8% | | | | |
| | 9,330 | | Allscripts Healthcare Solutions, Inc.* | | | 159,450 | |
| | 450 | | Inspire Medical Systems, Inc.* | | | 79,573 | |
| | 20,952 | | NextGen Healthcare, Inc.* | | | 379,441 | |
| | | | | | | 618,464 | |
| | | | | | | | |
| | | | Life Sciences Tools & Services – 2.1% | | | | |
| | 34,460 | | Adaptive Biotechnologies Corp.* | | | 269,477 | |
| | 16,510 | | Bruker Corp. | | | 1,031,545 | |
| | 23,457 | | Codexis, Inc.* | | | 250,521 | |
| | 3,300 | | Maravai LifeSciences Holdings, Inc. – Class A* | | | 102,795 | |
| | | | | | | 1,654,338 | |
See accompanying Notes to Financial Statements.
North Square Dynamic Small Cap Fund
SCHEDULE OF INVESTMENTS – Continued
As of May 31, 2022
| Number | | | | | |
| of Shares | | | | Value | |
| | | COMMON STOCKS (Continued) | | | |
| | | | | | |
| | | HEALTH CARE (Continued) | | | |
| | | Pharmaceuticals – 1.9% | | | |
| | 51,940 | | Amneal Pharmaceuticals, Inc.* | | $ | 188,542 | |
| | 18,210 | | Corcept Therapeutics Inc.* | | | 379,496 | |
| | 7,190 | | Harmony Biosciences Holdings, Inc.* | | | 313,484 | |
| | 47,060 | | Nektar Therapeutics* | | | 163,769 | |
| | 12,240 | | Phibro Animal Health Corp. – Class A | | | 235,130 | |
| | 24,670 | | Theravance Biopharma, Inc.*1 | | | 216,603 | |
| | | | | | | 1,497,024 | |
| | | | TOTAL HEALTH CARE | | | 12,207,954 | |
| | | | | | | | |
| | | | | | | | |
| | | | INDUSTRIALS – 20.7% | | | | |
| | | | Aerospace & Defense – 1.0% | | | | |
| | 6,620 | | BWX Technologies, Inc. | | | 338,944 | |
| | 16,520 | | Maxar Technologies Inc. | | | 493,287 | |
| | | | | | | 832,231 | |
| | | | | | | | |
| | | | Airlines – 0.1% | | | | |
| | 5,695 | | Spirit Airlines, Inc.* | | | 119,310 | |
| | | | | | | | |
| | | | Building Products – 3.3% | | | | |
| | 17,490 | | Builders FirstSource, Inc.* | | | 1,138,424 | |
| | 5,640 | | Insteel Industries, Inc. | | | 233,553 | |
| | 6,090 | | Masco Corp. | | | 345,242 | |
| | 11,170 | | UFP Industries, Inc. | | | 862,324 | |
| | | | | | | 2,579,543 | |
| | | | Electrical Equipment – 3.9% | | | | |
| | 13,180 | | Atkore Inc.* | | | 1,435,566 | |
| | 12,930 | | Babcock & Wilcox Enterprises, Inc.* | | | 84,691 | |
| | 12,650 | | Encore Wire Corp. | | | 1,581,503 | |
| | | | | | | 3,101,760 | |
| | | | | | | | |
| | | | Machinery – 0.8% | | | | |
| | 12,220 | | Allison Transmission Holdings, Inc. | | | 488,922 | |
| | 2,420 | | Proto Labs, Inc.* | | | 116,620 | |
| | | | | | | 605,542 | |
| | | | | | | | |
| | | | Marine – 1.0% | | | | |
| | 24,060 | | Genco Shipping & Trading Ltd.1 | | | 607,515 | |
| | 1,950 | | Matson Inc. | | | 175,266 | |
| | | | | | | 782,781 | |
| | | | | | | | |
| | | | Professional Services – 4.0% | | | | |
| | 4,366 | | Heidrick & Struggles International, Inc. | | | 150,889 | |
| | 1,810 | | Insperity, Inc. | | | 181,127 | |
| | 14,229 | | Kforce Inc. | | | 934,561 | |
| | 13,200 | | ManpowerGroup Inc. | | | 1,182,852 | |
| | 1,310 | | Robert Half International, Inc. | | | 118,096 | |
| | 7,830 | | TriNet Group, Inc.* | | | 614,968 | |
| | | | | | | 3,182,493 | |
See accompanying Notes to Financial Statements.
North Square Dynamic Small Cap Fund
SCHEDULE OF INVESTMENTS – Continued
As of May 31, 2022
| Number | | | | | |
| of Shares | | | | Value | |
| | | COMMON STOCKS (Continued) | | | |
| | | | | | |
| | | INDUSTRIALS (Continued) | | | |
| | | Road & Rail – 0.5% | | | |
| | 2,130 | | Landstar System, Inc. | | $ | 322,546 | |
| | 1,430 | | Universal Logistics Holdings, Inc. | | | 39,883 | |
| | | | | | | 362,429 | |
| | | | | | | | |
| | | | Trading Companies & Distributors – 6.1% | | | | |
| | 4,585 | | BlueLinx* | | | 378,996 | |
| | 3,140 | | Boise Cascade Co. | | | 242,785 | |
| | 17,100 | | GMS Inc.* | | | 851,751 | |
| | 6,533 | | McGrath RentCorp | | | 537,078 | |
| | 7,440 | | MRC Global, Inc.* | | | 83,253 | |
| | 8,080 | | NOW, Inc. | | | 89,203 | |
| | 18,240 | | Textainer Group Holdings Ltd.1 | | | 591,706 | |
| | 4,340 | | Triton International Ltd.1 | | | 276,762 | |
| | 30,210 | | Univar Solutions Inc.* | | | 928,051 | |
| | 5,621 | | Veritiv Corp. | | | 817,012 | |
| | | | | | | 4,796,597 | |
| | | | TOTAL INDUSTRIALS | | | 16,362,686 | |
| | | | | | | | |
| | | | | | | | |
| | | | INFORMATION TECHNOLOGY – 14.8% | | | | |
| | | | Communications Equipment – 0.5% | | | | |
| | 14,700 | | Radware Ltd.*1 | | | 354,711 | |
| | | | | | | | |
| | | | Electronic Equipment, Instruments & Components – 2.7% | | | | |
| | 67,440 | | Arlo Technologies, Inc.* | | | 477,475 | |
| | 20,110 | | Avnet, Inc. | | | 974,330 | |
| | 2,270 | | Fabrinet*1 | | | 197,195 | |
| | 1,590 | | PC Connection, Inc. | | | 71,089 | |
| | 9,560 | | ScanSource, Inc.* | | | 370,354 | |
| | | | | | | 2,090,443 | |
| | | | | | | | |
| | | | IT Services – 0.8% | | | | |
| | 24,750 | | LiveRamp Holdings, Inc.* | | | 633,600 | |
| | | | | | | | |
| | | | Semiconductors & Semiconductor Equipment – 1.3% | | | | |
| | 8,200 | | Camtek Ltd.*1 | | | 242,146 | |
| | 5,900 | | Cirrus Logic, Inc.* | | | 481,086 | |
| | 16,010 | | Magnachip Semiconductor Corp.* | | | 312,195 | |
| | | | | | | 1,035,427 | |
| | | | | | | | |
| | | | Software – 6.1% | | | | |
| | 61,980 | | A10 Networks Inc. | | | 955,112 | |
| | 17,928 | | CommVault Systems, Inc.* | | | 1,093,787 | |
| | 57,150 | | Dropbox, Inc. – Class A* | | | 1,191,006 | |
| | 790 | | Qualys, Inc.* | | | 103,237 | |
| | 8,830 | | RingCentral, Inc. – Class A | | | 557,526 | |
| | 15,380 | | Tenable Holdings, Inc.* | | | 773,614 | |
| | 4,530 | | Vertex, Inc. – Class A* | | | 50,102 | |
| | 23,180 | | Yext, Inc.* | | | 117,754 | |
| | | | | | | 4,842,138 | |
See accompanying Notes to Financial Statements.
North Square Dynamic Small Cap Fund
SCHEDULE OF INVESTMENTS – Continued
As of May 31, 2022
| Number | | | | | |
| of Shares | | | | Value | |
| | | COMMON STOCKS (Continued) | | | |
| | | | | | |
| | | INFORMATION TECHNOLOGY (Continued) | | | |
| | | Technology Hardware, Storage & Peripherals – 3.4% | | | |
| | 16,760 | | Avid Technology, Inc.* | | $ | 490,901 | |
| | 39,110 | | Pure Storage, Inc. – Class A* | | | 928,080 | |
| | 24,870 | | Super Micro Computer, Inc.* | | | 1,244,992 | |
| | | | | | | 2,663,973 | |
| | | | TOTAL INFORMATION TECHNOLOGY | | | 11,620,292 | |
| | | | | | | | |
| | | | | | | | |
| | | | MATERIALS – 3.5% | | | | |
| | | | Chemicals – 1.1% | | | | |
| | 3,890 | | LSB Industries, Inc.* | | | 78,267 | |
| | 26,260 | | Orion Engineered Carbons S.A.1 | | | 507,081 | |
| | 2,340 | | Stepan Co. | | | 262,337 | |
| | | | | | | 847,685 | |
| | | | | | | | |
| | | | Metals & Mining – 1.2% | | | | |
| | 20,560 | | Coeur Mining, Inc.* | | | 79,979 | |
| | 19,570 | | Constellium Se1 | | | 330,537 | |
| | 16,810 | | Warrior Met Coal, Inc. | | | 565,152 | |
| | | | | | | 975,668 | |
| | | | | | | | |
| | | | Paper & Forest Products – 1.2% | | | | |
| | 10,550 | | Clearwater Paper Corp.* | | | 362,393 | |
| | 8,440 | | Louisiana-Pacific Corp. | | | 582,866 | |
| | | | | | | 945,259 | |
| | | | TOTAL MATERIALS | | | 2,768,612 | |
| | | | | | | | |
| | | | | | | | |
| | | | UTILITIES – 1.2% | | | | |
| | | | Independent Power and Renewable Electricity Producers – 1.2% | | | | |
| | 9,940 | | Sunnova Energy International Inc.* | | | 198,800 | |
| | 28,320 | | Vistra Corp. | | | 746,798 | |
| | | | | | | 945,598 | |
| | | | TOTAL UTILITIES | | | 945,598 | |
| | | | TOTAL COMMON STOCKS | | | | |
| | | | (Cost $78,101,239) | | | 72,340,699 | |
| | | | | | | | |
| | | | REAL ESTATE INVESTMENT TRUSTS (REITS) – 7.8% | | | | |
| | 5,940 | | AssetMark Financial Holdings, Inc.* | | | 124,087 | |
| | 1,920 | | Centerspace | | | 159,322 | |
| | 3,281 | | Community Healthcare Trust, Inc. | | | 123,628 | |
| | 17,090 | | Equity Commonwealth* | | | 465,703 | |
| | 8,450 | | Essential Properties Realty Trust, Inc. | | | 193,336 | |
| | 42,264 | | Hersha Hospitality Trust* | | | 464,059 | |
| | 8,115 | | National Storage Affiliates Trust | | | 425,632 | |
| | 4,090 | | NexPoint Residential Trust, Inc. | | | 300,533 | |
| | 18,850 | | OUTFRONT Media Inc. | | | 388,875 | |
| | 73,570 | | Paramount Group, Inc. | | | 666,544 | |
| | 13,430 | | Park Hotels & Resorts Inc. | | | 242,546 | |
| | 34,600 | | RLJ Lodging Trust | | | 464,678 | |
See accompanying Notes to Financial Statements.
North Square Dynamic Small Cap Fund
SCHEDULE OF INVESTMENTS – Continued
As of May 31, 2022
| Number | | | | | |
| of Shares | | | | Value | |
| | | REAL ESTATE INVESTMENT TRUSTS (REITS) (Continued) | | | |
| | 46,220 | | RPT Realty | | $ | 562,497 | |
| | 9,490 | | Ryman Hospitality Properties, Inc.* | | | 847,362 | |
| | 7,890 | | Terreno Realty Corp. | | | 479,002 | |
| | 22,430 | | The GEO Group, Inc.* | | | 159,477 | |
| | 9,310 | | Whitestone REIT | | | 114,420 | |
| | | | TOTAL REITS | | | | |
| | | | (Cost $6,618,462) | | | 6,181,701 | |
| | | | | | | | |
| | | | | | | | |
| | | | SHORT-TERM INVESTMENT – 0.6% | | | | |
| | 443,761 | | First American Treasury Obligations Fund – Class X, 0.67%2 | | | 443,761 | |
| | | | TOTAL SHORT-TERM INVESTMENT | | | | |
| | | | (Cost $443,761) | | | 443,761 | |
| | | | TOTAL INVESTMENTS – 100.0% | | | | |
| | | | (Cost $85,163,462) | | | 78,966,161 | |
| | | | Other Assets in Excess of Liabilities – 0.0% | | | 17,145 | |
| | | | TOTAL NET ASSETS – 100.0% | | $ | 78,983,306 | |
| * | Non-Income producing security |
1 | Foreign security denominated in U.S. Dollars. |
2 | The rate is the annualized seven-day yield at period end. |
Investments are classified by industry pursuant to the Global Industry Classification Standard (GICS®), which was developed by and/or is the exclusive property of Morgan Stanley Capital International, Inc. (“MSCI”) and Standard & Poor’s Financial Services LLC (“S&P”). GICS is a service mark of MSCI and S&P and has been licensed for use by U.S. Bancorp Fund Services, LLC.
See accompanying Notes to Financial Statements.
North Square Dynamic Small Cap Fund
SUMMARY OF INVESTMENTS
As of May 31, 2022
| | | Percent of Total |
Security Type/Sector | | Net Assets |
Common Stocks | | | |
Industrials | | | 20.7 | % |
Health Care | | | 15.5 | % |
Information Technology | | | 14.8 | % |
Financials | | | 12.0 | % |
Consumer Discretionary | | | 8.9 | % |
Energy | | | 6.9 | % |
Consumer Staples | | | 4.6 | % |
Communication Services | | | 3.5 | % |
Materials | | | 3.5 | % |
Utilities | | | 1.2 | % |
| Total Common Stocks | | | 91.6 | % |
REITs | | | 7.8 | % |
Short-Term Investment | | | 0.6 | % |
| Total Investments | | | 100.0 | % |
Other Assets in Excess of Liabilities | | | 0.0 | % |
| Total Net Assets | | | 100.0 | % |
See accompanying Notes to Financial Statements.
North Square Advisory Research Small Cap Growth Fund
SCHEDULE OF INVESTMENTS
As of May 31, 2022
| Number | | | | | |
| of Shares | | | | Value | |
| | | COMMON STOCKS – 99.8% | | | |
| | | | | | |
| | | BASIC MATERIALS – 2.9% | | | |
| | | General Mining – 1.3% | | | |
| | 4,220 | | MP Materials Corp.* | | $ | 166,394 | |
| | | | Specialty Chemicals – 1.6% | | | | |
| | 6,273 | | Livent Corp.* | | | 199,419 | |
| | | | TOTAL BASIC MATERIALS | | | 365,813 | |
| | | | | | | | |
| | | | | | | | |
| | | | CONSUMER DISCRETIONARY – 16.3% | | | | |
| | | | Auto Parts – 2.0% | | | | |
| | 2,188 | | Gentherm Inc.* | | | 150,841 | |
| | 967 | | Visteon Corp.* | | | 108,507 | |
| | | | | | | 259,348 | |
| | | | | | | | |
| | | | Consumer Services: Misc. – 2.7% | | | | |
| | 4,288 | | H&R Block, Inc. | | | 151,109 | |
| | 22,105 | | Membership Collective Group Inc. – Class A* | | | 196,513 | |
| | | | | | | 347,622 | |
| | | | | | | | |
| | | | Education Services – 2.4% | | | | |
| | 4,853 | | Stride, Inc.* | | | 189,801 | |
| | 7,459 | | Udemy, Inc.* | | | 110,020 | |
| | | | | | | 299,821 | |
| | | | | | | | |
| | | | Footwear – 0.2% | | | | |
| | 5,430 | | Allbirds, Inc. – Class A* | | | 29,648 | |
| | | | | | | | |
| | | | Home Construction – 0.9% | | | | |
| | 1,037 | | Green Brick Partners, Inc.* | | | 25,220 | |
| | 1,641 | | Skyline Champion Corp.* | | | 87,186 | |
| | | | | | | 112,406 | |
| | | | | | | | |
| | | | Household Furnishings – 2.7% | | | �� | |
| | 9,842 | | The Lovesac Co.* | | | 342,797 | |
| | | | | | | | |
| | | | Recreational Products – 0.7% | | | | |
| | 3,846 | | Callaway Golf Co.* | | | 83,497 | |
| | | | | | | | |
| | | | Recreational Services – 1.7% | | | | |
| | 6,457 | | Life Time Group Holdings, Inc.* | | | 94,595 | |
| | 3,440 | | Lindblad Expeditions Holdings, Inc. * | | | 49,398 | |
| | 991 | | Madison Square Garden Entertainment Corp.* | | | 67,180 | |
| | | | | | | 211,173 | |
| | | | | | | | |
| | | | Restaurants and Bars – 2.5% | | | | |
| | 18,451 | | Arcos Dorados Holdings, Inc. – Class A1 | | | 144,287 | |
| | 5,229 | | Portillo’s Inc. – Class A* | | | 97,102 | |
| | 1,044 | | Texas Roadhouse, Inc. | | | 81,401 | |
| | | | | | | 322,790 | |
| | | | | | | | |
| | | | Specialty Retailers – 0.5% | | | | |
| | 2,242 | | European Wax Center, Inc. – Class A | | | 59,413 | |
| | | | TOTAL CONSUMER DISCRETIONARY | | | 2,068,515 | |
See accompanying Notes to Financial Statements.
North Square Advisory Research Small Cap Growth Fund
SCHEDULE OF INVESTMENTS – Continued
As of May 31, 2022
| Number | | | | | |
| of Shares | | | | Value | |
| | | COMMON STOCKS (Continued) | | | |
| | | | | | |
| | | CONSUMER STAPLES – 3.7% | | | |
| | | Food Products – 1.9% | | | |
| | 6,065 | | The Simply Good Foods Co.* | | $ | 242,357 | |
| | | | Food Retailers and Wholesalers – 1.0% | | | | |
| | 2,885 | | Performance Food Group Co.* | | | 125,036 | |
| | | | Soft Drinks – 0.8% | | | | |
| | 3,399 | | BRC Inc. – Class A* | | | 33,718 | |
| | 928 | | Celsius Holdings, Inc.* | | | 62,260 | |
| | | | | | | 95,978 | |
| | | | TOTAL CONSUMER STAPLES | | | 463,371 | |
| | | | | | | | |
| | | | ENERGY – 9.2% | | | | |
| | | | Offshore Drilling and Other Services – 1.5% | | | | |
| | 5,429 | | Noble Corp. *1 | | | 196,964 | |
| | | | Oil: Crude Producers – 7.7% | | | | |
| | 8,450 | | Denbury Inc. * | | | 618,033 | |
| | 5,800 | | Matador Resources Co. | | | 353,220 | |
| | | | | | | 971,253 | |
| | | | TOTAL ENERGY | | | 1,168,217 | |
| | | | | | | | |
| | | | FINANCIALS – 3.2% | | | | |
| | | | Asset Managers and Custodians – 0.7% | | | | |
| | 1,217 | | PJT Partners, Inc. – Class A | | | 92,298 | |
| | | | Banks – 0.4% | | | | |
| | 1,103 | | BankUnited, Inc. | | | 45,951 | |
| | | | Diversified Financial Services – 2.1% | | | | |
| | 12,753 | | Holley Inc.* | | | 133,779 | |
| | 13,423 | | NuScale Power Corp.* | | | 131,411 | |
| | | | | | | 265,190 | |
| | | | TOTAL FINANCIALS | | | 403,439 | |
| | | | | | | | |
| | | | HEALTH CARE – 25.2% | | | | |
| | | | Biotechnology – 5.8% | | | | |
| | 3,133 | | Cerevel Therapeutics Holdings, Inc.* | | | 81,865 | |
| | 3,634 | | Cytokinetics, Inc.* | | | 144,996 | |
| | 3,646 | | Halozyme Therapeutics, Inc.* | | | 167,643 | |
| | 2,827 | | Intra-Cellular Therapies, Inc.* | | | 162,270 | |
| | 1,361 | | Krystal Biotech, Inc.* | | | 80,136 | |
| | 1,241 | | Mirum Pharmaceuticals, Inc.* | | | 29,027 | |
| | 1,895 | | Twist Bioscience Corp.* | | | 64,506 | |
| | | | | | | 730,443 | |
| | | | Health Care Facilities – 0.6% | | | | |
| | 1,024 | | The Ensign Group, Inc. | | | 83,118 | |
| | | | Health Care Management Services – 1.3% | | | | |
| | 1,526 | | Alignment Healthcare, Inc.* | | | 16,298 | |
| | 4,910 | | Option Care Health, Inc.* | | | 149,067 | |
| | | | | | | 165,365 | |
See accompanying Notes to Financial Statements.
North Square Advisory Research Small Cap Growth Fund
SCHEDULE OF INVESTMENTS – Continued
As of May 31, 2022
| Number | | | | | |
| of Shares | | | | Value | |
| | | COMMON STOCKS (Continued) | | | |
| | | | | | |
| | | HEALTH CARE (Continued) | | | |
| | | Health Care Services – 4.5% | | | |
| | 20,389 | | Evolent Health, Inc. – Class A* | | $ | 573,543 | |
| | | | Health Care: Misc. – 1.3% | | | | |
| | 8,436 | | Agiliti, Inc.* | | | 162,984 | |
| | | | Medical Equipment – 9.8% | | | | |
| | 3,537 | | Axonics, Inc.* | | | 176,850 | |
| | 7,378 | | InMode Ltd.*1 | | | 197,804 | |
| | 3,330 | | Lantheus Holdings, Inc.* | | | 228,172 | |
| | 1,394 | | Merit Medical Systems, Inc.* | | | 85,578 | |
| | 1,013 | | Shockwave Medical, Inc.* | | | 166,345 | |
| | 5,409 | | STAAR Surgical Co.* | | | 356,669 | |
| | 11,409 | | ViewRay Inc.* | | | 32,972 | |
| | | | | | | 1,244,390 | |
| | | | Medical Supplies – 1.0% | | | | |
| | 1,086 | | Establishment Labs Holdings Inc.*1 | | | 67,006 | |
| | 1,695 | | Owens & Minor, Inc. | | | 59,122 | |
| | | | | | | 126,128 | |
| | | | Pharmaceuticals – 0.9% | | | | |
| | 4,164 | | Xenon Pharmaceuticals Inc.*1 | | | 109,721 | |
| | | | TOTAL HEALTH CARE | | | 3,195,692 | |
| | | | | | | | |
| | | | INDUSTRIALS – 20.4% | | | | |
| | | | Aerospace – 1.7% | | | | |
| | 4,814 | | Allegheny Technologies, Inc.* | | | 132,385 | |
| | 7,380 | | RADA Electronic Industries Ltd.*1 | | | 88,855 | |
| | | | | | | 221,240 | |
| | | | Commercial Vehicle-Equipment Leasing – 0.7% | | | | |
| | 14,288 | | Custom Truck One Source, Inc. | | | 85,156 | |
| | | | Containers and Packaging – 1.5% | | | | |
| | 1,538 | | O-I Glass, Inc.* | | | 25,300 | |
| | 1,127 | | Veritiv Corp. * | | | 163,810 | |
| | | | | | | 189,110 | |
| | | | Electrical Components – 1.5% | | | | |
| | 2,793 | | Vicor Corp.* | | | 187,969 | |
| | | | Electronic Equipment: Control and Filter – 0.7% | | | | |
| | 4,296 | | Energy Recovery, Inc.* | | | 86,822 | |
| | | | Engineering and Contracting Services – 3.1% | | | | |
| | 14,126 | | Fluor Corp.* | | | 398,777 | |
| | | | Machinery: Agricultural – 3.8% | | | | |
| | 26,872 | | Titan International, Inc.* | | | 489,339 | |
| | | | Machinery: Industrial – 3.3% | | | | |
| | 1,049 | | Kadant Inc. | | | 194,170 | |
| | 5,277 | | Kornit Digital Ltd.*1 | | | 221,476 | |
| | | | | | | 415,646 | |
See accompanying Notes to Financial Statements.
North Square Advisory Research Small Cap Growth Fund
SCHEDULE OF INVESTMENTS – Continued
As of May 31, 2022
| Number | | | | | |
| of Shares | | | | Value | |
| | | COMMON STOCKS (Continued) | | | |
| | | | | | |
| | | INDUSTRIALS (Continued) | | | |
| | | Machinery: Specialty – 1.5% | | | |
| | 2,216 | | Albany International Corp. – Class A | | $ | 187,030 | |
| | | | Professional Business Support Services – 2.6% | | | | |
| | 2,815 | | Donnelley Financial Solutions, Inc. * | | | 87,575 | |
| | 4,103 | | Franklin Covey Co.* | | | 157,186 | |
| | 1,362 | | Huron Consulting Group Inc.* | | | 81,611 | |
| | | | | | | 326,372 | |
| | | | TOTAL INDUSTRIALS | | | 2,587,461 | |
| | | | | | | | |
| | | | TECHNOLOGY – 18.2% | | | | |
| | | | Computer Services – 3.2% | | | | |
| | 5,511 | | KBR, Inc. | | | 274,227 | |
| | 1,735 | | Workiva Inc.* | | | 126,672 | |
| | | | | | | 400,899 | |
| | | | Consumer Digital Services – 3.7% | | | | |
| | 3,110 | | TechTarget, Inc.* | | | 221,090 | |
| | 7,484 | | Xometry, Inc. – Class A* | | | 254,531 | |
| | | | | | | 475,621 | |
| | | | Electric Components – 0.3% | | | | |
| | 3,069 | | Celestica Inc.*1 | | | 33,851 | |
| | | | Production Technology Equipment – 1.5% | | | | |
| | 4,021 | | Impinj, Inc.* | | | 188,223 | |
| | | | Semiconductors – 3.9% | | | | |
| | 1,205 | | Ambarella, Inc.*1 | | | 102,690 | |
| | 2,807 | | MaxLinear, Inc.* | | | 111,129 | |
| | 397 | | Semtech Corp.* | | | 25,444 | |
| | 1,198 | | Sitime Corp.* | | | 255,174 | |
| | | | | | | 494,437 | |
| | | | Software – 5.6% | | | | |
| | 3,207 | | Amplitude, Inc. – Class A* | | | 60,420 | |
| | 5,081 | | Avid Technology, Inc.* | | | 148,822 | |
| | 6,717 | | Box, Inc. – Class A* | | | 175,381 | |
| | 740 | | Lightspeed Commerce Inc.*1 | | | 19,233 | |
| | 5,574 | | Samsara Inc. – Class A* | | | 62,707 | |
| | 4,601 | | Sprout Social, Inc. – Class A* | | | 234,329 | |
| | 2,533 | | UserTesting, Inc.* | | | 12,944 | |
| | | | | | | 713,836 | |
| | | | TOTAL TECHNOLOGY | | | 2,306,867 | |
| | | | | | | | |
| | | | TELECOMMUNICATIONS – 0.7% | | | | |
| | | | Telecommunications Services – 0.7% | | | | |
| | 4,251 | | Gogo Inc.* | | | 86,125 | |
| | | | TOTAL TELECOMMUNICATIONS | | | 86,125 | |
| | | | TOTAL COMMON STOCKS | | | | |
| | | | (Cost $13,761,347) | | | 12,645,500 | |
See accompanying Notes to Financial Statements.
North Square Advisory Research Small Cap Growth Fund
SCHEDULE OF INVESTMENTS – Continued
As of May 31, 2022
| Number | | | | | |
| of Shares | | | | Value | |
| | | SHORT-TERM INVESTMENT – 0.2% | | | |
| | 28,379 | | First American Treasury Obligations Fund – Class X, 0.67%2 | | $ | 28,379 | |
| | | | TOTAL SHORT-TERM INVESTMENT | | | | |
| | | | (Cost $28,379) | | | 28,379 | |
| | | | TOTAL INVESTMENTS – 100.0% | | | | |
| | | | (Cost $13,789,726) | | | 12,673,879 | |
| | | | Liabilities in Excess of Other Assets – (0.0)% | | | (4,898 | ) |
| | | | TOTAL NET ASSETS – 100.0% | | $ | 12,668,981 | |
ADR – American Depositary Receipt
PLC – Public Limited Company
| * | Non-Income producing security |
1 | Foreign security denominated in U.S. Dollars. |
2 | The rate is annualized seven-day yield at period end. |
See accompanying Notes to Financial Statements.
North Square Advisory Research Small Cap Growth Fund
SUMMARY OF INVESTMENTS
As of May 31, 2022
| | | Percent of Total |
Security Type/Sector | | Net Assets |
Common Stocks | | | |
Health Care | | | 25.2 | % |
Industrials | | | 20.4 | % |
Technology | | | 18.2 | % |
Consumer Discretionary | | | 16.3 | % |
Energy | | | 9.2 | % |
Consumer Staples | | | 3.7 | % |
Financials | | | 3.2 | % |
Basic Materials | | | 2.9 | % |
Telecommunications | | | 0.7 | % |
| Total Common Stocks | | | 99.8 | % |
Short-Term Investment | | | 0.2 | % |
| Total Investments | | | 100.0 | % |
Liabilities in Excess of Other Assets | | | (0.0 | )% |
| Total Net Assets | | | 100.0 | % |
See accompanying Notes to Financial Statements.
North Square Multi Strategy Fund
SCHEDULE OF INVESTMENTS
As of May 31, 2022
| Number | | | | | |
| of Shares | | | | Value | |
| | | EXCHANGE TRADED FUNDS (ETFs) – 39.9% | | | |
| | 35,000 | | AdvisorShares North Square McKee ESG Core Bond ETF1 | | $ | 818,797 | |
| | 24,800 | | iShares® Core S&P 500 ETF | | | 10,288,776 | |
| | 12,200 | | Vanguard® Dividend Appreciation ETF | | | 1,875,750 | |
| | 4,800 | | Vanguard® Growth ETF | | | 1,170,384 | |
| | 34,285 | | Vanguard® Value ETF | | | 4,940,125 | |
| | | | TOTAL ETFs | | | | |
| | | | (Cost $20,689,978) | | | 19,093,832 | |
| | | | | | | | |
| | | | MUTUAL FUNDS – 59.7% | | | | |
| | 161,456 | | North Square Advisory Research Small Cap Growth Fund – Class I1 | | | 2,046,023 | |
| | 240,263 | | North Square Advisory Research Small Cap Value Fund – Class I1 | | | 2,559,638 | |
| | 379,744 | | North Square Altrinsic International Equity Fund – Class I1 | | | 3,775,913 | |
| | 788,212 | | North Square Dynamic Small Cap Fund – Class I1 | | | 8,739,379 | |
| | 152,154 | | North Square McKee Bond Fund – Class I1 | | | 1,389,777 | |
| | 430,479 | | North Square Preferred and Income Securities Fund – Class I1 | | | 9,021,722 | |
| | 117,681 | | North Square Strategic Income Fund – Class I1 | | | 1,076,918 | |
| | | | TOTAL MUTUAL FUNDS | | | | |
| | | | (Cost $26,489,252) | | | 28,609,370 | |
| | | | | | | | |
| | | | SHORT-TERM INVESTMENT – 0.9% | | | | |
| | 415,518 | | First American Treasury Obligations Fund – Class X, 0.67%2 | | | 415,518 | |
| | | | TOTAL SHORT-TERM INVESTMENT | | | | |
| | | | (Cost $415,518) | | | 415,518 | |
| | | | TOTAL INVESTMENTS – 100.5% | | | | |
| | | | (Cost $47,594,748) | | | 48,118,720 | |
| | | | Liabilities in Excess of Other Assets – (0.5)% | | | (220,051 | ) |
| | | | TOTAL NET ASSETS – 100.0% | | $ | 47,898,669 | |
1 | Affiliated Company. See Note 11. |
2 | The rate is the annualized seven-day yield at period end. |
Investments are classified by industry pursuant to the Global Industry Classification Standard (GICS®), which was developed by and/or is the exclusive property of Morgan Stanley Capital International, Inc. (“MSCI”) and Standard & Poor’s Financial Services LLC (“S&P”). GICS is a service mark of MSCI and S&P and has been licensed for use by U.S. Bancorp Fund Services, LLC.
See accompanying Notes to Financial Statements.
North Square Multi Strategy Fund
SUMMARY OF INVESTMENTS
As of May 31, 2022
| | | Percent of Total |
Security Type/Sector | | Net Assets |
ETFs | | | 39.9 | % |
Mutual Funds | | | 59.7 | % |
Short-Term Investment | | | 0.9 | % |
| Total Investments | | | 100.5 | % |
Liabilities in Excess of Other Assets | | | (0.5 | )% |
| Total Net Assets | | | 100.0 | % |
See accompanying Notes to Financial Statements.
North Square Preferred and Income Securities Fund
SCHEDULE OF INVESTMENTS
As of May 31, 2022
| Number | | | | | |
| of Shares | | | | Value | |
| | | PREFERRED STOCKS – 2.9% | | | |
| | | | | | |
| | | FINANCIALS – 2.9% | | | |
| | | Banks – 1.4% | | | |
| | 20,000 | | U.S. Bancorp | | $ | 364,200 | |
| | | | Capital Markets – 1.5% | | | | |
| | 20,000 | | Morgan Stanley | | | 391,200 | |
| | | | TOTAL FINANCIALS | | | 755,400 | |
| | | | TOTAL PREFERRED STOCKS | | | | |
| | | | (Cost $675,200) | | | 755,400 | |
| | | | | | | | |
| | | | CORPORATE BONDS – 94.3% | | | | |
| | | | | | | | |
| | | | CONSUMER DISCRETIONARY – 3.6% | | | | |
| | | | Automobiles – 3.6% | | | | |
| | | | General Motors Financial Co., Inc. | | | | |
| | 1,000,000 | | 5.700% (5 Year CMT Rate + 4.997%), 09/30/21691 | | | 938,750 | |
| | | | TOTAL CONSUMER DISCRETIONARY | | | 938,750 | |
| | | | | | | | |
| | | | ENERGY – 5.6% | | | | |
| | | | Oil, Gas & Consumable Fuels – 5.6% | | | | |
| | | | Enbridge Inc. | | | | |
| | 1,000,000 | | 5.750% (5 Year CMT Rate + 5.314%), 07/15/20801,2 | | | 952,150 | |
| | | | TransCanada Trust | | | | |
| | 500,000 | | 5.600% (5 Year CMT Rate + 3.986%), 03/07/20821,2 | | | 477,500 | |
| | | | TOTAL ENERGY | | | 1,429,650 | |
| | | | | | | | |
| | | | FINANCIALS – 81.6% | | | | |
| | | | Banks – 52.2% | | | | |
| | | | Bank of America Corp. | | | | |
| | 1,000,000 | | 6.300% (3 Month LIBOR USD + 4.553%), 12/29/20491 | | | 1,024,025 | |
| | | | CaixaBank, S.A. | | | | |
| | 1,000,000 | | 6.750% (5 Year Swap Rate EUR + 6.498%), 12/13/21701,2 | | | 1,105,820 | |
| | | | Citigroup Inc. | | | | |
| | 1,000,000 | | 5.000% (SOFR + 3.813%), 03/30/20251 | | | 922,355 | |
| | | | Credit Agricole S.A. | | | | |
| | 500,000 | | 4.750% (5 Year CMT Rate + 3.237%), 12/23/21691,2,3 | | | 428,675 | |
| | | | Huntington Bancshares Inc. | | | | |
| | 1,000,000 | | 4.450% (7 Year CMT Rate + 4.045%), 03/15/21681 | | | 921,916 | |
| | | | ING Groep N.V. | | | | |
| | 1,000,000 | | 6.750% (5 Year Mid Swap Rate USD + 4.204%), 10/16/21691,2 | | | 1,011,875 | |
| | | | JPMorgan Chase & Co. | | | | |
| | 1,000,000 | | 6.750% (3 Month LIBOR USD + 3.780%), 01/29/20501 | | | 1,028,675 | |
| | | | Lloyds Banking Group plc | | | | |
| | 1,000,000 | | 7.500% (5 Year Swap Rate USD + 4.760%), 04/30/20491,2 | | | 1,025,103 | |
| | | | The PNC Financial Services Group, Inc. | | | | |
| | 1,000,000 | | 6.000% (5 Year CMT Rate + 3.000%), 08/15/21701 | | | 1,006,250 | |
| | | | Societe Generale SA | | | | |
| | 1,000,000 | | 7.875% (5 Year Swap Rate USD + 4.979%), 12/29/20491,2 | | | 1,027,866 | |
| | | | Standard Chartered PLC | | | | |
| | 1,000,000 | | 7.750% (5 Year Swap Rate USD + 5.723%), 12/29/20491,2,3 | | | 1,025,457 | |
See accompanying Notes to Financial Statements.
North Square Preferred and Income Securities Fund
SCHEDULE OF INVESTMENTS – Continued
As of May 31, 2022
| Number | | | | | |
| of Shares | | | | Value | |
| | | CORPORATE BONDS (Continued) | | | |
| | | | | | |
| | | FINANCIALS (Continued) | | | |
| | | Banks (Continued) | | | |
| | | SVB Financial Group | | | |
| | 1,000,000 | | 4.000% (5 Year CMT Rate + 3.202%), 11/15/21691 | | $ | 816,250 | |
| | | | Truist Financial Corp. | | | | |
| | 1,000,000 | | 5.100% (10 Year CMT Rate + 4.349%), 03/01/20611 | | | 969,712 | |
| | | | Wells Fargo & Co. | | | | |
| | 1,250,000 | | 3.900% (5 Year CMT Rate + 3.453%), 03/15/21701 | | | 1,151,364 | |
| | | | | | | 13,465,343 | |
| | | | Capital Markets – 14.5% | | | | |
| | | | The Bank of New York Mellon Corp. | | | | |
| | 1,000,000 | | 3.750% (5 Year CMT Rate + 2.630%), 06/20/21701 | | | 872,010 | |
| | | | The Charles Schwab Corp. | | | | |
| | 500,000 | | 5.000% (5 Year CMT Rate + 3.256%), 06/01/21701 | | | 468,876 | |
| | 500,000 | | 5.000% (3 Month LIBOR USD + 2.575%), 06/01/21711 | | | 428,750 | |
| | | | Credit Suisse Group AG | | | | |
| | 500,000 | | 5.250% (5 Year CMT Rate + 4.889%), 08/11/20271,2,3 | | | 431,717 | |
| | 500,000 | | 7.250%, 03/12/21711,2,3 | | | 483,022 | |
| | | | The Goldman Sachs Group Inc. | | | | |
| | 1,250,000 | | 3.650% (5 Year CMT Rate + 2.915%), 02/10/21711 | | | 1,061,725 | |
| | | | | | | 3,746,100 | |
| | | | Consumer Finance – 13.0% | | | | |
| | | | Ally Financial Inc. | | | | |
| | 1,000,000 | | 4.700% (7 Year CMT Rate + 3.481%), 11/15/21691 | | | 801,172 | |
| | | | American Express Co. | | | | |
| | 1,000,000 | | 3.550% (5 Year CMT Rate + 2.854%), 12/15/20261 | | | 852,937 | |
| | | | Capital One Financial Corp. | | | | |
| | 1,000,000 | | 3.950% (5 Year CMT Rate + 3.157%), 12/01/21701 | | | 856,990 | |
| | | | Discover Financial Services | | | | |
| | 1,000,000 | | 5.500% (3 Month LIBOR USD + 3.076%), 04/30/20281 | | | 838,000 | |
| | | | | | | 3,349,099 | |
| | | | Insurance – 1.9% | | | | |
| | | | Prudential Financial, Inc. | | | | |
| | 500,000 | | 5.125% (5 Year CMT Rate + 3.162%), 03/01/20521 | | | 481,252 | |
| | | | TOTAL FINANCIALS | | | 21,041,794 | |
| | | | | | | | |
| | | | INDUSTRIALS – 3.5% | | | | |
| | | | Industrial Conglomerates – 3.5% | | | | |
| | | | General Electric Co. | | | | |
| | 1,000,000 | | 5.159% (3 Month LIBOR USD + 3.330%), 09/15/21691 | | | 910,750 | |
| | | | TOTAL INDUSTRIALS | | | 910,750 | |
| | | | TOTAL CORPORATE BONDS | | | | |
| | | | (Cost $26,510,134) | | | 24,320,944 | |
See accompanying Notes to Financial Statements.
North Square Preferred and Income Securities Fund
SCHEDULE OF INVESTMENTS – Continued
As of May 31, 2022
| Number | | | | | |
| of Shares | | | | Value | |
| | | US GOVERNMENT NOTES/BONDS – 1.4% | | | |
| | | United States Treasury Note/Bond | | | |
| | 350,000 | | 2.875%, 05/15/2032 | | $ | 350,492 | |
| | | | TOTAL US GOVERNMENT NOTES/BONDS | | | | |
| | | | (Cost $348,332) | | | 350,492 | |
| | | | | | | | |
| | | | SHORT-TERM INVESTMENT – 0.9% | | | | |
| | 237,424 | | First American Treasury Obligations Fund – Class X, 0.67%4 | | | 237,424 | |
| | | | TOTAL SHORT-TERM INVESTMENT | | | | |
| | | | (Cost $237,424) | | | 237,424 | |
| | | | TOTAL INVESTMENTS – 99.5% | | | | |
| | | | (Cost $27,771,090) | | | 25,664,260 | |
| | | | Other Assets in Excess of Liabilities – 0.5% | | | 129,002 | |
| | | | TOTAL NET ASSETS – 100.0% | | $ | 25,793,262 | |
CMT – Constant Maturity Rate
LIBOR – London Inter-bank Offered Rate
PLC – Public Limited Company
SOFR – Secured Overnight Financing Rate
1 | Variable rate security based on a reference index and spread. The rate reported is the rate in effect as of May 31, 2022. |
2 | Foreign security denominated in U.S. Dollars. |
3 | Security as defined in Rule 144A under the Securities Act of 1933 and classified as liquid under the Fund’s liquidity risk management program. Purchased in a private placement transaction; resale to the public may require registration or may extend only to qualified institutional buyers. At May 31, 2022, the value of these securities total $2,368,871 which represents 9.18% of total net assets. |
4 | The rate is the annualized seven-day yield at period end. |
Investments are classified by industry pursuant to the Global Industry Classification Standard (GICS®), which was developed by and/or is the exclusive property of Morgan Stanley Capital International, Inc. (“MSCI”) and Standard & Poor’s Financial Services LLC (“S&P”). GICS is a service mark of MSCI and S&P and has been licensed for use by U.S. Bancorp Fund Services, LLC.
See accompanying Noes to Financial Statements.
North Square Preferred and Income Securities Fund
SUMMARY OF INVESTMENTS
As of May 31, 2022
| | | Percent of Total |
Security Type/Sector | | Net Assets |
Preferred Stocks | | | 2.9 | % |
Corporate Bonds | | | | |
Financials | | | 81.6 | % |
Energy | | | 5.6 | % |
Consumer Discretionary | | | 3.6 | % |
Industrials | | | 3.5 | % |
| Total Corporate Bonds | | | 94.3 | % |
U.S. Government Notes/Bonds | | | 1.4 | % |
Short-Term Investment | | | 0.9 | % |
| Total Investments | | | 99.5 | % |
Other Assets in Excess of Liabilities | | | 0.5 | % |
| Total Net Assets | | | 100.0 | % |
See accompanying Notes to Financial Statements.
North Square Tactical Growth Fund
SCHEDULE OF INVESTMENTS
As of May 31, 2022
| Number | | | | | |
| of Shares | | | | Value | |
| | | EXCHANGE TRADED FUNDS (ETFs) – 68.3% | | | |
| | 168,575 | | Invesco QQQ Trust, Series 1 | | $ | 51,968,301 | |
| | 860,709 | | iShares® MSCI Canada ETF | | | 32,560,621 | |
| | 129,440 | | SPDR® S&P 500® ETF Trust | | | 53,449,659 | |
| | 281,887 | | Vanguard® Growth ETF | | | 68,732,507 | |
| | 262,491 | | Vanguard® Mega Cap Value ETF | | | 27,396,186 | |
| | 796,135 | | Vanguard® Short-Term Inflation-Protected Securities ETF | | | 40,555,117 | |
| | 571,498 | | Vanguard® Value ETF | | | 82,347,147 | |
| | | | TOTAL ETFs | | | | |
| | | | (Cost $260,346,680) | | | 357,009,538 | |
| | | | | | | | |
| | | | SHORT-TERM INVESTMENT – 31.7% | | | | |
| | 165,598,161 | | First American Treasury Obligations Fund – Class X, 0.67%1,2 | | | 165,598,161 | |
| | | | TOTAL SHORT-TERM INVESTMENT | | | | |
| | | | (Cost $165,598,161) | | | 165,598,161 | |
| | | | TOTAL INVESTMENTS – 100.0% | | | | |
| | | | (Cost $425,944,841) | | | 522,607,699 | |
| | | | Liabilities in Excess of Other Assets – (0.0)% | | | (244,603 | ) |
| | | | TOTAL NET ASSETS – 100.0% | | $ | 522,363,096 | |
1 | The rate is annualized seven-day yield at period end. |
2 | See Note 13. |
Investments are classified by industry pursuant to the Global Industry Classification Standard (GICS®), which was developed by and/or is the exclusive property of Morgan Stanley Capital International, Inc. (“MSCI”) and Standard & Poor’s Financial Services LLC (“S&P”). GICS is a service mark of MSCI and S&P and has been licensed for use by U.S. Bancorp Fund Services, LLC.
See accompanying Notes to Financial Statements.
North Square Tactical Growth Fund
SUMMARY OF INVESTMENTS
As of May 31, 2022
| | | Percent of Total |
Security Type/Sector | | Net Assets |
ETFs | | | 68.3 | % |
Short-Term Investment | | | 31.7 | % |
| Total Investments | | | 100.0 | % |
Liabilities in Excess of Other Assets | | | (0.0 | )% |
| Total Net Assets | | | 100.0 | % |
See accompanying Notes to Financial Statements.
North Square Tactical Defensive Fund
SCHEDULE OF INVESTMENTS
As of May 31, 2022
| Number | | | | | |
| of Shares | | | | Value | |
| | | SHORT-TERM INVESTMENT – 100.1% | | | |
| | 73,092,219 | | First American Treasury Obligations Fund – Class X, 0.67%1,2 | | $ | 73,092,219 | |
| | | | TOTAL SHORT-TERM INVESTMENT | | | | |
| | | | (Cost $73,092,219) | | | 73,092,219 | |
| | | | TOTAL INVESTMENT – 100.1% | | | | |
| | | | (Cost $73,092,219) | | | 73,092,219 | |
| | | | Liabilities in Excess of Other Assets – (0.1)% | | | (81,159 | ) |
| | | | TOTAL NET ASSETS – 100.0% | | $ | 73,011,060 | |
1 | The rate is annualized seven-day yield at period end. |
2 | See Note 13. |
Investments are classified by industry pursuant to the Global Industry Classification Standard (GICS®), which was developed by and/or is the exclusive property of Morgan Stanley Capital International, Inc. (“MSCI”) and Standard & Poor’s Financial Services LLC (“S&P”). GICS is a service mark of MSCI and S&P and has been licensed for use by U.S. Bancorp Fund Services, LLC.
See accompanying Notes to Financial Statements.
North Square Tactical Defensive Fund
SUMMARY OF INVESTMENTS
As of May 31, 2022
| | | Percent of Total |
Security Type/Sector | | Net Assets |
Short-Term Investment | | | 100.1 | % |
| Total Investment | | | 100.1 | % |
Liabilities in Excess of Other Assets | | | (0.1 | )% |
| Total Net Assets | | | 100.0 | % |
See accompanying Notes to Financial Statements.
North Square Trilogy Alternative Return Fund
SCHEDULE OF INVESTMENTS
As of May 31, 2022
| Number | | | | | |
| of Shares | | | | Value | |
| | | COMMON STOCKS – 33.3% | | | |
| | | | | | |
| | | CONSUMER DISCRETIONARY – 4.1% | | | |
| | | Hotels, Restaurants & Leisure – 1.5% | | | |
| | 2,403 | | McDonald’s Corp. | | $ | 606,060 | |
| | | | Household Durables – 1.3% | | | | |
| | 5,295 | | Garmin Ltd.1 | | | 559,258 | |
| | | | Specialty Retail – 1.3% | | | | |
| | 1,825 | | The Home Depot, Inc. | | | 552,519 | |
| | | | TOTAL CONSUMER DISCRETIONARY | | | 1,717,837 | |
| | | | | | | | |
| | | | CONSUMER STAPLES – 3.4% | | | | |
| | | | Food & Staples Retailing – 2.0% | | | | |
| | 4,523 | | Sysco Corp. | | | 380,746 | |
| | 3,413 | | Walmart Inc. | | | 439,014 | |
| | | | | | | 819,760 | |
| | | | Food Products – 0.6% | | | | |
| | 3,744 | | General Mills, Inc. | | | 261,519 | |
| | | | Household Products – 0.8% | | | | |
| | 2,298 | | Procter & Gamble | | | 339,828 | |
| | | | TOTAL CONSUMER STAPLES | | | 1,421,107 | |
| | | | | | | | |
| | | | FINANCIALS – 4.4% | | | | |
| | | | Banks – 3.2% | | | | |
| | 19,787 | | Fifth Third Bancorp | | | 780,202 | |
| | 10,791 | | Truist Financial Corp. | | | 536,744 | |
| | | | | | | 1,316,946 | |
| | | | Insurance – 1.2% | | | | |
| | 8,647 | | Aflac, Inc. | | | 523,749 | |
| | | | TOTAL FINANCIALS | | | 1,840,695 | |
| | | | | | | | |
| | | | HEALTH CARE – 7.8% | | | | |
| | | | Health Care Equipment & Supplies – 1.3% | | | | |
| | 4,481 | | Abbott Laboratories | | | 526,338 | |
| | | | Pharmaceuticals – 6.5% | | | | |
| | 4,207 | | Eli Lilly and Co. | | | 1,318,642 | |
| | 2,097 | | Johnson & Johnson | | | 376,474 | |
| | 5,288 | | Merck & Co., Inc. | | | 486,655 | |
| | 10,369 | | Pfizer Inc. | | | 549,972 | |
| | | | | | | 2,731,743 | |
| | | | TOTAL HEALTH CARE | | | 3,258,081 | |
| | | | | | | | |
| | | | INDUSTRIALS – 4.8% | | | | |
| | | | Aerospace & Defense – 1.1% | | | | |
| | 1,910 | | L3Harris Technologies, Inc. | | | 460,119 | |
| | | | Commercial Services & Supplies – 1.8% | | | | |
| | 4,719 | | Waste Management, Inc. | | | 748,009 | |
| | | | Machinery – 1.0% | | | | |
| | 2,033 | | Illinois Tool Works Inc. | | | 423,006 | |
See accompanying Notes to Financial Statements.
North Square Trilogy Alternative Return Fund
SCHEDULE OF INVESTMENTS – Continued
As of May 31, 2022
| Number | | | | | |
| of Shares | | | | Value | |
| | | COMMON STOCKS (Continued) | | | |
| | | | | | |
| | | INDUSTRIALS (Continued) | | | |
| | | Trading Companies & Distributors – 0.9% | | | |
| | 756 | | W.W. Grainger, Inc. | | $ | 368,225 | |
| | | | TOTAL INDUSTRIALS | | | 1,999,359 | |
| | | | | | | | |
| | | | INFORMATION TECHNOLOGY – 6.1% | | | | |
| | | | Communications Equipment – 1.4% | | | | |
| | 12,699 | | Cisco Systems, Inc. | | | 572,090 | |
| | | | Software – 2.1% | | | | |
| | 3,202 | | Microsoft Corp. | | | 870,528 | |
| | | | Technology Hardware, Storage & Peripherals – 2.6% | | | | |
| | 7,416 | | Apple Inc. | | | 1,103,797 | |
| | | | TOTAL INFORMATION TECHNOLOGY | | | 2,546,415 | |
| | | | | | | | |
| | | | UTILITIES – 2.7% | | | | |
| | | | Electric Utilities – 2.3% | | | | |
| | 3,195 | | Eversource Energy | | | 294,963 | |
| | 8,526 | | The Southern Co. | | | 645,077 | |
| | | | | | | 940,040 | |
| | | | Multi-Utilities – 0.4% | | | | |
| | 2,211 | | Dominion Energy, Inc. | | | 186,210 | |
| | | | TOTAL UTILITIES | | | 1,126,250 | |
| | | | TOTAL COMMON STOCKS | | | | |
| | | | (Cost $5,505,676) | | | 13,909,744 | |
| | | | | | | | |
| | | | EXCHANGE TRADED FUNDS (ETFS) – 55.3% | | | | |
| | 25,250 | | iShares® Broad USD High Yield Corporate Bond ETF | | | 946,622 | |
| | 26,320 | | iShares® Core Dividend Growth ETF | | | 1,352,322 | |
| | 38,500 | | iShares® MBS ETF | | | 3,818,045 | |
| | 17,382 | | Schwab® US Dividend Equity ETF | | | 1,366,051 | |
| | 200,900 | | SPDR® Portfolio Intermediate Term Corporate Bond ETF | | | 6,698,006 | |
| | 65,900 | | SPDR® Portfolio Long-Term Corporate Bond ETF | | | 1,668,588 | |
| | 133,700 | | SPDR® Portfolio Short-Term Corporate Bond ETF | | | 4,017,685 | |
| | 65,100 | | VanEck Fallen Angel High Yield Bond ETF | | | 1,893,759 | |
| | 8,734 | | Vanguard® Dividend Appreciation ETF | | | 1,342,853 | |
| | | | TOTAL ETFS | | | | |
| | | | (Cost $22,671,694) | | | 23,103,931 | |
See accompanying Notes to Financial Statements.
North Square Trilogy Alternative Return Fund
SCHEDULE OF INVESTMENTS – Continued
As of May 31, 2022
| | | | | Notional | | | | |
| Contracts | | | | Amount | | | Value | |
| | | PURCHASED OPTIONS – 16.5% | | | | | | |
| | | | | | | | | |
| | | CALL OPTIONS – 7.0% | | | | | | |
| | | S&P 500® Index | | | | | | |
| | 10 | | Expiration Date: June 2022, Exercise Price $4,150.00 | | $ | 4,132,150 | | | $ | 75,300 | |
| | 5 | | Expiration Date: June 2022, Exercise Price $4,500.00 | | | — | | | | 738 | |
| | 5 | | Expiration Date: June 2022, Exercise Price $4,600.00 | | | 2,066,075 | | | | 288 | |
| | 10 | | Expiration Date: September 2022, Exercise Price $4,750.00 | | | 4,132,150 | | | | 13,000 | |
| | 10 | | Expiration Date: December 2022, Exercise Price $2,400.00 | | | 4,132,150 | | | | 1,742,950 | |
| | 10 | | Expiration Date: December 2022, Exercise Price $4,600.00 | | | 4,132,150 | | | | 81,850 | |
| | 10 | | Expiration Date: June 2023, Exercise Price $4,200.00 | | | 4,132,150 | | | | 371,950 | |
| | 10 | | Expiration Date: December 2023, Exercise Price $4,000.00 | | | 4,132,150 | | | | 577,250 | |
| | 10 | | Expiration Date: June 2022, Exercise Price $4,350.00 | | | 4,132,150 | | | | 250 | |
| | 10 | | Expiration Date: June 2022, Exercise Price $4,250.00 | | | 4,132,150 | | | | 19,050 | |
| | 10 | | Expiration Date: June 2022, Exercise Price $4,250.00 | | | 4,132,150 | | | | 46,350 | |
| | | | | | | | | | | 2,928,976 | |
| | | | | | | | | | | | |
| | | | PUT OPTIONS – 9.5% | | | | | | | | |
| | | | S&P 500® Index | | | | | | | | |
| | 10 | | Expiration Date: June 2022, Exercise Price $3,800.00 | | | 4,132,150 | | | | 12,600 | |
| | 10 | | Expiration Date: June 2022, Exercise Price $3,900.00 | | | 4,132,150 | | | | 11,150 | |
| | 10 | | Expiration Date: June 2022, Exercise Price $3,900.00 | | | 4,132,150 | | | | 35,000 | |
| | 10 | | Expiration Date: June 2022, Exercise Price $4,000.00 | | | 4,132,150 | | | | 5,900 | |
| | 20 | | Expiration Date: December 2022, Exercise Price $4,000.00 | | | 8,264,300 | | | | 463,000 | |
| | 10 | | Expiration Date: December 2022, Exercise Price $4,025.00 | | | 4,132,150 | | | | 240,200 | |
| | 5 | | Expiration Date: December 2022, Exercise Price $4,225.00 | | | 2,066,075 | | | | 160,250 | |
| | 10 | | Expiration Date: June 2023, Exercise Price $3,500.00 | | | 4,132,150 | | | | 174,450 | |
| | 20 | | Expiration Date: June 2023, Exercise Price $3,975.00 | | | 8,264,300 | | | | 607,800 | |
| | 10 | | Expiration Date: June 2023, Exercise Price $4,000.00 | | | 4,132,150 | | | | 312,600 | |
| | 10 | | Expiration Date: June 2023, Exercise Price $4,025.00 | | | 4,132,150 | | | | 321,150 | |
| | 10 | | Expiration Date: June 2023, Exercise Price $4,175.00 | | | 4,132,150 | | | | 378,200 | |
| | | | SPDR® S&P 500® ETF Trust | | | | | | | | |
| | 100 | | Expiration Date: June 2023, Exercise Price $375.00 | | | 4,129,300 | | | | 240,100 | |
| | 100 | | Expiration Date: June 2023, Exercise Price $385.00 | | | 4,129,300 | | | | 270,100 | |
| | 50 | | Expiration Date: June 2023, Exercise Price $395.00 | | | 2,064,650 | | | | 151,475 | |
| | 50 | | Expiration Date: June 2023, Exercise Price $400.00 | | | 2,064,650 | | | | 160,325 | |
| | 100 | | Expiration Date: December 2023, Exercise Price $405.00 | | | 4,129,300 | | | | 392,950 | |
| | | | | | | | | | | 3,937,250 | |
| | | | TOTAL PURCHASED OPTIONS | | | | | | | | |
| | | | (Cost $5,780,670) | | | | | | | 6,866,226 | |
See accompanying Notes to Financial Statements.
North Square Trilogy Alternative Return Fund
SCHEDULE OF INVESTMENTS – Continued
As of May 31, 2022
| Number | | | | | |
| of Shares | | | | Value | |
| | | SHORT-TERM INVESTMENT – 1.0% | | | |
| | 410,983 | | First American Treasury Obligations Fund – Class X, 0.67%2 | | $ | 410,983 | |
| | | | TOTAL SHORT-TERM INVESTMENT | | | | |
| | | | (Cost $410,983) | | | 410,983 | |
| | | | TOTAL INVESTMENTS – 106.1% | | | | |
| | | | (Cost $34,369,023) | | | 44,290,884 | |
| | | | Liabilities in Excess of Other Assets – (6.1)% | | | (2,538,832 | ) |
| | | | TOTAL NET ASSETS – 100.0% | | $ | 41,752,052 | |
1 | Foreign security denominated in U.S. Dollars. |
2 | The rate is annualized seven-day yield at period end. |
Investments are classified by industry pursuant to the Global Industry Classification Standard (GICS®), which was developed by and/or is the exclusive property of Morgan Stanley Capital International, Inc. (“MSCI”) and Standard & Poor’s Financial Services LLC (“S&P”). GICS is a service mark of MSCI and S&P and has been licensed for use by U.S. Bancorp Fund Services, LLC.
See accompanying Notes to Financial Statements.
North Square Trilogy Alternative Return Fund
SCHEDULE OF OPTIONS WRITTEN
As of May 31, 2022
| | | | | Notional | | | | |
| Contracts | | | | Amount | | | Value | |
| | | CALL OPTIONS – 2.2% | | | | | | |
| | | S&P 500® Index | | | | | | |
| | 10 | | Expiration: June 2022, Exercise Price: $4,200.00 | | $ | 4,200,000 | | | $ | 12,650 | |
| | 10 | | Expiration: June 2022, Exercise Price: $4,100.00 | | | 4,100,000 | | | | 83,650 | |
| | 10 | | Expiration: June 2022, Exercise Price: $4,000.00 | | | 4,000,000 | | | | 171,200 | |
| | 30 | | Expiration: June 2022, Exercise Price: $4,125.00 | | | 12,375,000 | | | | 265,800 | |
| | 10 | | Expiration: June 2022, Exercise Price: $4,100.00 | | | 4,100,000 | | | | 118,150 | |
| | 20 | | Expiration: June 2023, Exercise Price: $5,000.00 | | | 10,000,000 | | | | 136,200 | |
| | 10 | | Expiration: December 2023, Exercise Price: $5,400.00 | | | 5,400,000 | | | | 60,500 | |
| | 10 | | Expiration: December 2023, Exercise Price: $5,500.00 | | | 5,500,000 | | | | 50,300 | |
| | | | | | | | | | | 898,450 | |
| | | | | | | | | | | | |
| | | | PUT OPTIONS – 4.2% | | | | | | | | |
| | | | S&P 500® Index | | | | | | | | |
| | 10 | | Expiration: June 2022, Exercise Price: $4,200.00 | | | 4,200,000 | | | | 84,150 | |
| | 10 | | Expiration: June 2022, Exercise Price: $4,100.00 | | | 4,100,000 | | | | 55,100 | |
| | 10 | | Expiration: June 2022, Exercise Price: $4,000.00 | | | 4,000,000 | | | | 43,900 | |
| | 10 | | Expiration: June 2022, Exercise Price: $4,100.00 | | | 4,100,000 | | | | 89,900 | |
| | 20 | | Expiration: December 2022, Exercise Price: $3,550.00 | | | 7,100,000 | | | | 231,200 | |
| | 10 | | Expiration: December 2022, Exercise Price: $3,575.00 | | | 3,575,000 | | | | 120,250 | |
| | 5 | | Expiration: December 2022, Exercise Price: $3,750.00 | | | 1,875,000 | | | | 79,175 | |
| | 10 | | Expiration: June 2023, Exercise Price: $3,125.00 | | | 3,125,000 | | | | 109,450 | |
| | 20 | | Expiration: June 2023, Exercise Price: $3,525.00 | | | 7,050,000 | | | | 359,600 | |
| | 10 | | Expiration: June 2023, Exercise Price: $3,550.00 | | | 3,550,000 | | | | 185,500 | |
| | 10 | | Expiration: June 2023, Exercise Price: $3,575.00 | | | 3,575,000 | | | | 191,000 | |
| | 10 | | Expiration: June 2023, Exercise Price: $3,700.00 | | | 3,700,000 | | | | 221,700 | |
| | | | | | | | | | | 1,770,925 | |
| | | | TOTAL WRITTEN OPTIONS | | | | | | | | |
| | | | (Premium received $3,576,111) | | | | | | $ | 2,669,375 | |
See accompanying Notes to Financial Statements.
North Square Trilogy Alternative Return Fund
SUMMARY OF INVESTMENTS
As of May 31, 2022
| | Percent of Total |
Security Type/Sector | | Net Assets |
Common Stocks | | | |
Health Care | | | 7.8 | % |
Information Technology | | | 6.1 | % |
Industrials | | | 4.8 | % |
Financials | | | 4.4 | % |
Consumer Discretionary | | | 4.1 | % |
Consumer Staples | | | 3.4 | % |
Utilities | | | 2.7 | % |
| Total Common Stocks | | | 33.3 | % |
ETFs | | | 55.3 | % |
Purchased Options | | | | |
Call Options | | | 7.0 | % |
Put Options | | | 9.5 | % |
| Total Purchased Options | | | 16.5 | % |
Short-Term Investment | | | 1.0 | % |
| Total Investments | | | 106.1 | % |
Liabilities in Excess of Other Assets | | | (6.1 | )% |
| Total Net Assets | | | 100.0 | % |
See accompanying Notes to Financial Statements.
(This Page Intentionally Left Blank.)
STATEMENTS OF ASSETS AND LIABILITIES
As of May 31, 2022
| | | | | | | | | North Square | | | | |
| | | | | | North Square | | | Advisory | | | | |
| | | North Square | | | Dynamic | | | Research | | | North Square | |
| | | Spectrum | | | Small Cap | | | Small Cap | | | Multi Strategy | |
| | | Alpha Fund | | | Fund | | | Growth Fund | | | Fund | |
| Assets: | | | | | | | | | | | | |
| Investments, at cost | | $ | 667,060 | | | $ | 85,163,462 | | | $ | 13,789,726 | | | $ | 21,105,496 | |
| Investments in affiliated issuers, at cost | | | 110,940,563 | | | | — | | | | — | | | | 26,489,252 | |
| Investments, at value | | $ | 667,060 | | | $ | 78,966,161 | | | $ | 12,673,879 | | | $ | 19,509,350 | |
| Investments in affiliated issuers, at value | | | 95,168,084 | | | | — | | | | — | | | | 28,609,370 | |
| Cash | | | — | | | | — | | | | — | | | | — | |
| Receivables: | | | | | | | | | | | | | | | | |
| Dividends and interest | | | 571 | | | | 84,040 | | | | 331 | | | | 197 | |
| Receivable for Investments Sold | | | — | | | | — | | | | 152,205 | | | | — | |
| Fund shares sold | | | 25,296 | | | | 3,757 | | | | — | | | | 2,096 | |
| Prepaid expenses | | | 21,435 | | | | 19,873 | | | | 12,902 | | | | 16,065 | |
| Total assets | | | | | | | | | | | 12,839,317 | | | | 48,137,078 | |
| | | | | | | | | | | | | | | | |
| | | | | | | | | | | | | | | | | |
| Liabilities: | | | | | | | | | | | | | | | | |
| Payables: | | | | | | | | | | | | | | | | |
| Fund shares redeemed | | | 83,064 | | | | — | | | | — | | | | 13,337 | |
| Payable for Investment Securities Purchased | | | — | | | | — | | | | 148,339 | | | | — | |
| Accrued expenses: | | | | | | | | | | | | | | | | |
| Due to Advisor (Note 4) | | | 65,635 | | | | 14,447 | | | | 703 | | | | 180,721 | |
| Fund administration fees | | | 18,572 | | | | 6,625 | | | | 2,121 | | | | 7,379 | |
| Legal fees | | | 11,244 | | | | 34,984 | | | | 4,703 | | | | 6,967 | |
| Transfer agent fees | | | 10,110 | | | | 3,940 | | | | 1,219 | | | | 4,429 | |
| Auditing fees | | | 12,766 | | | | 12,111 | | | | 5,229 | | | | 6,414 | |
| Distribution fees (Note 8) | | | 11,735 | | | | — | | | | — | | | | 7,951 | |
| Shareholder servicing fees (Note 7) | | | 19,967 | | | | — | | | | 469 | | | | 3,350 | |
| Chief Compliance Officer fees | | | 2,543 | | | | 1,296 | | | | 315 | | | | 1,285 | |
| Custody fees | | | 1,208 | | | | 3,868 | | | | 2,758 | | | | 1,125 | |
| Due to Trustees | | | 9,815 | | | | 8,497 | | | | 3,396 | | | | 4,771 | |
| Accrued other expenses | | | 8,722 | | | | 4,757 | | | | 1,084 | | | | 680 | |
| Total liabilities | | | 255,381 | | | | 90,525 | | | | 170,336 | | | | 238,409 | |
| | | | | | | | | | | | | | | | | |
| Net Assets | | $ | 95,627,065 | | | $ | 78,983,306 | | | $ | 12,668,981 | | | $ | 47,898,669 | |
| | | | | | | | | | | | | | | | | |
| Components of Net Assets: | | | | | | | | | | | | | | | | |
| Paid-in capital (par value of $0.01 per share | | | | | | | | | | | | | | | | |
| with an unlimited number of shares authorized) | | $ | 74,806,319 | | | $ | 89,818,949 | | | $ | 13,019,183 | | | $ | 33,402,848 | |
| Total distributable earnings (accumulated deficit) | | | 20,820,746 | | | | (10,835,643 | ) | | | (350,202 | ) | | | 14,495,821 | |
| Net Assets | | $ | 95,627,065 | | | $ | 78,983,306 | | | $ | 12,668,981 | | | $ | 47,898,669 | |
See accompanying Notes to Financial Statements.
STATEMENTS OF ASSETS AND LIABILITIES – Continued
As of May 31, 2022
| | | | | | | | | North Square | | | | |
| | | | | | North Square | | | Advisory | | | | |
| | | North Square | | | Dynamic | | | Research | | | North Square | |
| | | Spectrum | | | Small Cap | | | Small Cap | | | Multi Strategy | |
| | | Alpha Fund | | | Fund | | | Growth Fund | | | Fund | |
| Maximum Offering Price per Share: | |
| Class A Shares: | | | | | | | | | | | | |
| Net assets applicable to shares outstanding | | $ | 56,318,908 | | | $ | — | | | $ | — | | | $ | 37,762,177 | |
| Shares of beneficial interest | | | | | | | | | | | | | | | | |
| issued and outstanding | | | 5,224,892 | | | | — | | | | — | | | | 1,789,336 | |
| Net asset value, redemption | | | | | | | | | | | | | | | | |
| and offering price per share | | | 10.78 | | | | — | | | | — | | | | 21.10 | |
| Maximum sales charge | | | | | | | | | | | | | | | | |
| (5.75% of offering price)* | | | 0.66 | | | | — | | | | — | | | | 1.29 | |
| Maximum offering price to public | | $ | 11.44 | | | $ | — | | | $ | — | | | $ | 22.39 | |
| Class I Shares: | | | | | | | | | | | | | | | | |
| Net assets applicable to shares outstanding | | $ | 39,308,157 | | | $ | 78,983,306 | | | $ | 12,668,981 | | | $ | 10,136,492 | |
| Shares of beneficial interest | | | | | | | | | | | | | | | | |
| issued and outstanding | | | 3,118,918 | | | | 7,123,580 | | | | 999,742 | | | | 453,879 | |
| Net asset value, redemption | | | | | | | | | | | | | | | | |
| and offering price per share | | $ | 12.60 | | | $ | 11.09 | | | $ | 12.67 | | | $ | 22.33 | |
| * | No sales charge applies on investments of $500,000 or more, but a Contingent Deferred Sales Charge (“CDSC”) of 1% will be imposed on certain redemptions of such shares within 12 months of the date of purchase. |
See accompanying Notes to Financial Statements.
STATEMENTS OF ASSETS AND LIABILITIES – Continued
As of May 31, 2022
| | | North Square | | | | | | | | | North Square | |
| | | Preferred | | | North Square | | | North Square | | | Trilogy | |
| | | and Income | | | Tactical | | | Tactical | | | Alternative | |
| | | Securities Fund | | | Growth Fund | | | Defensive Fund | | | Return Fund | |
| Assets: | | | | | | | | | | | | |
| Investments, at cost | | $ | 27,771,090 | | | $ | 425,944,841 | | | $ | 73,092,219 | | | $ | 34,369,023 | |
| Investments, at value | | $ | 25,664,260 | | | | | | | $ | 73,092,219 | | | $ | 44,290,884 | |
| Cash | | | — | | | | 21 | | | | — | | | | — | |
| Receivables: | | | | | | | | | | | | | | | | |
| Dividends and interest | | | 309,051 | | | | 84,024 | | | | 37,569 | | | | 33,075 | |
| Fund shares sold | | | 41,950 | | | | 916,386 | | | | 19,341 | | | | 9,900 | |
| Receivable for Investments Sold | | | 276,644 | | | | — | | | | — | | | | — | |
| Deposit at broker for securities sold short | | | — | | | | — | | | | — | | | | 111,711 | |
| Prepaid expenses | | | | | | | 101,141 | | | | 40,455 | | | | 51,668 | |
| Total assets | | | 26,311,421 | | | | 523,709,271 | | | | 73,189,584 | | | | 44,497,238 | |
| | | | | | | | | | | | | | | | | |
| Liabilities: | | | | | | | | | | | | | | | | |
| Payables: | | | | | | | | | | | | | | | | |
| Fund shares redeemed | | | — | | | | 402,327 | | | | 26,459 | | | | 2,113 | |
| Payable for Investment Securities Purchased | | | 491,080 | | | | — | | | | — | | | | — | |
| Distributions Payable | | | 97 | | | | — | | | | — | | | | — | |
| Broker interest and fees payable | | | — | | | | — | | | | — | | | | — | |
| Written options contracts, at value | | | | | | | | | | | | | | | | |
| (proceeds $3,576,111) | | | — | | | | — | | | | — | | | | 2,669,375 | |
| Accrued expenses: | | | | | | | | | | | | | | | | |
| Due to Advisor (Note 4) | | | 5,499 | | | | 424,837 | | | | 77,908 | | | | 34,384 | |
| Legal fees | | | 6,960 | | | | 85,936 | | | | 11,677 | | | | 6,609 | |
| Fund administration fees | | | 2,789 | | | | 78,132 | | | | 10,108 | | | | 5,976 | |
| Auditing fees | | | 3,344 | | | | 71,325 | | | | 9,480 | | | | 5,475 | |
| Transfer agent fees | | | 1,644 | | | | 45,990 | | | | 5,927 | | | | 3,519 | |
| Custody fees | | | 2,628 | | | | 2,486 | | | | 542 | | | | 525 | |
| Chief Compliance Officer fees | | | 425 | | | | 12,791 | | | | 1,569 | | | | 889 | |
| Distribution fees (Note 8) | | | — | | | | 90,909 | | | | 11,148 | | | | 3,611 | |
| Shareholder servicing fees (Note 7) | | | — | | | | 50,273 | | | | 12,938 | | | | 7,466 | |
| Due to Trustees | | | 2,401 | | | | 52,097 | | | | 6,923 | | | | 4,025 | |
| Accrued other expenses | | | 1,292 | | | | 29,072 | | | | 3,845 | | | | 1,219 | |
| Total liabilities | | | 518,159 | | | | 1,346,175 | | | | 178,524 | | | | 2,745,186 | |
| | | | | | | | | | | | | | | | | |
| Net Assets | | $ | 25,793,262 | | | | | | | $ | 73,011,060 | | | $ | 41,752,052 | |
| | | | | | | | | | | | | | | | | |
| Components of Net Assets: | | | | | | | | | | | | | | | | |
| Paid-in capital (par value of $0.01 per share | | | | | | | | | | | | | | | | |
| with an unlimited number of shares authorized) | | $ | 22,979,868 | | | $ | 392,572,569 | | | $ | 82,756,920 | | | $ | 37,233,566 | |
| Total distributable earnings (accumulated deficit) | | | 2,813,394 | | | | | | | | (9,745,860 | ) | | | 4,518,486 | |
| Net Assets | | $ | 25,793,262 | | | $ | 522,363,096 | | | | | | | $ | 41,752,052 | |
See accompanying Notes to Financial Statements.
STATEMENTS OF ASSETS AND LIABILITIES – Continued
As of May 31, 2022
| | | North Square | | | | | | | | | North Square | |
| | | Preferred | | | North Square | | | North Square | | | Trilogy | |
| | | and Income | | | Tactical | | | Tactical | | | Alternative | |
| | | Securities Fund | | | Growth Fund | | | Defensive Fund | | | Return Fund | |
| Maximum Offering Price per Share: | | | | | | | | | | | | |
| Class A Shares: | | | | | | | | | | | | |
| Net assets applicable to shares outstanding | | $ | — | | | $ | 92,843,362 | | | $ | 23,392,420 | | | $ | 2,224,467 | |
| Shares of beneficial interest | | | | | | | | | | | | | | | | |
| issued and outstanding | | | — | | | | 6,833,872 | | | | 1,457,634 | | | | 202,371 | |
| Net asset value, redemption | | | | | | | | | | | | | | | | |
| and offering price per share | | | — | | | | 13.59 | | | | 16.05 | | | | 10.99 | |
| Maximum sales charge | | | | | | | | | | | | | | | | |
| (5.75% of offering price)* | | | — | | | | 0.82 | | | | 0.98 | | | | 0.67 | |
| Maximum offering price to public | | $ | — | | | $ | 14.41 | | | $ | 17.03 | | | $ | 11.66 | |
| Class C Shares: | | | | | | | | | | | | | | | | |
| Net assets applicable to shares outstanding | | $ | — | | | $ | 84,866,637 | | | $ | 7,265,020 | | | $ | 3,739,185 | |
| Shares of beneficial interest | | | | | | | | | | | | | | | | |
| issued and outstanding | | | — | | | | 6,687,056 | | | | 500,410 | | | | 351,156 | |
| Net asset value, redemption | | | | | | | | | | | | | | | | |
| and offering price per share | | $ | — | | | $ | 12.69 | | | $ | 14.52 | | | $ | 10.65 | |
| Class I Shares: | | | | | | | | | | | | | | | | |
| Net assets applicable to shares outstanding | | $ | 25,793,262 | | | $ | 344,653,097 | | | $ | 42,353,621 | | | $ | 35,788,400 | |
| Shares of beneficial interest | | | | | | | | | | | | | | | | |
| issued and outstanding | | | 1,230,703 | | | | 24,841,882 | | | | 2,572,292 | | | | 3,240,035 | |
| Net asset value, redemption | | | | | | | | | | | | | | | | |
| and offering price per share | | $ | 20.96 | | | $ | 13.87 | | | $ | 16.47 | | | $ | 11.05 | |
| * | No sales charge applies on investments of $500,000 or more, but a Contingent Deferred Sales Charge (“CDSC”) of 1% will be imposed on certain redemptions of such shares within 12 months of the date of purchase. |
See accompanying Notes to Financial Statements.
STATEMENTS OF OPERATIONS
For the Year Ended May 31, 202
| | | | | | | | | North Square | | | | |
| | | | | | North Square | | | Advisory | | | | |
| | | North Square | | | Dynamic | | | Research | | | North Square | |
| | | Spectrum | | | Small Cap | | | Small Cap | | | Multi Strategy | |
| | | Alpha Fund | | | Fund | | | Growth Fund | | | Fund | |
| Investment Income: | | | | | | | | | | | | |
| Dividends (net of foreign withholding taxes and/or | | | | | | | | | | | | |
| issuance fees of $0, $779, $0, and $0, respectively) | | $ | 65,470 | | | $ | 473,877 | | | $ | 49,854 | | | $ | 121,447 | |
| Dividends from affiliated | | | | | | | | | | | | | | | | |
| regulated investment companies | | | — | | | | — | | | | — | | | | 4,938,593 | |
| Interest (net of foreign withholding taxes and/or | | | | | | | | | | | | | | | | |
| issuance fees of $0, $0, $0, and $0, respectively) | | | 1,432 | | | | 455 | | | | 115 | | | | 432 | |
| Total investment income | | | 66,902 | | | | 474,332 | | | | 49,969 | | | | 5,060,472 | |
| Expenses: | | | | | | | | | | | | | | | | |
| Advisory fees (Note 4) | | | 847,058 | | | | 403,637 | | | | 96,121 | | | | 273,357 | |
| Distribution fees – Class A (Note 8) | | | 194,112 | | | | — | | | | — | | | | 109,679 | |
| Fund administration fees | | | 115,769 | | | | 30,101 | | | | 11,832 | | | | 46,737 | |
| Shareholder servicing fees – Class A (Note 7) | | | 71,490 | | | | — | | | | — | | | | 28,444 | |
| Shareholder servicing fees – Class I (Note 7) | | | 62,974 | | | | 30,224 | | | | 12,821 | | | | 7,110 | |
| Transfer agent fees and expenses | | | 65,729 | | | | 18,280 | | | | 6,107 | | | | 27,485 | |
| Legal fees | | | 121,883 | | | | 46,352 | | | | 13,125 | | | | 45,945 | |
| Trustees’ fees and expenses | | | 35,495 | | | | 12,829 | | | | 6,026 | | | | 16,597 | |
| Registration fees | | | 38,690 | | | | 21,169 | | | | 21,623 | | | | 34,562 | |
| Chief Compliance Officer fees (Note 4) | | | 21,551 | | | | 5,030 | | | | 2,031 | | | | 9,239 | |
| Fund accounting fees | | | 11,588 | | | | 2,787 | | | | 960 | | | | 4,557 | |
| Auditing fees | | | 15,828 | | | | 11,226 | | | | 957 | | | | 8,102 | |
| Custody fees | | | 7,738 | | | | 17,725 | | | | 11,566 | | | | 5,845 | |
| Shareholder reporting fees | | | 11,092 | | | | 6,470 | | | | 2,141 | | | | 7,799 | |
| Other expenses | | | 20,548 | | | | 3,336 | | | | 2,501 | | | | 4,344 | |
| Total expenses | | | 1,641,545 | | | | 609,166 | | | | 187,811 | | | | 629,802 | |
| Affiliated fund fees waived (Note 4) | | | — | | | | — | | | | — | | | | (225,003 | ) |
| Less advisory fees waived & expenses reimbursed | | | | | | | | | | | | | | | | |
| Class A | | | 12,734 | | | | — | | | | — | | | | 1,388 | |
| Class I | | | (4,393 | ) | | | (162,452 | ) | | | (57,980 | ) | | | — | |
| Net expenses | | | 1,649,886 | | | | 446,714 | | | | 129,831 | | | | 406,187 | |
| Net Investment income | | | (1,582,984 | ) | | | 27,618 | | | | (79,862 | ) | | | 4,654,285 | |
| Net Realized and Unrealized Gain (Loss): | | | | | | | | | | | | | | | | |
| Net realized gain (loss) on: | | | | | | | | | | | | | | | | |
| Investments | | | 48,947,151 | | | | (3,095,661 | ) | | | 3,662,768 | | | | (197,914 | ) |
| Affiliated issuers | | | (1,059,438 | ) | | | — | | | | — | | | | 5,570,210 | |
| Net realized gain (loss) | | | 47,887,713 | | | | (3,095,661 | ) | | | 3,662,768 | | | | 5,372,296 | |
| Capital gain distributions from | | | | | | | | | | | | | | | | |
| regulated investment companies: | | | | | | | | | | | | | | | | |
| Unaffiliated issuers | | | — | | | | — | | | | — | | | | 11,268 | |
| Affiliated issuers | | | — | | | | — | | | | — | | | | 5,314,047 | |
| Total capital gain distributions | | | — | | | | — | | | | — | | | | 5,325,315 | |
| Net change in unrealized appreciation/depreciation on: | | | | | | | | | | | | | | | | |
| Investments | | | (53,664,808 | ) | | | (8,772,335 | ) | | | (7,458,194 | ) | | | (1,695,990 | ) |
| Affiliated issuers | | | (15,772,479 | ) | | | — | | | | — | | | | (16,019,189 | ) |
| Net change in unrealized | | | | | | | | | | | | | | | | |
| appreciation/depreciation | | | (69,437,287 | ) | | | (8,772,335 | ) | | | (7,458,194 | ) | | | (17,715,179 | ) |
| Net realized and unrealized gain (loss) | | | (21,549,574 | ) | | | (11,867,996 | ) | | | (3,795,426 | ) | | | (7,017,568 | ) |
| Net increase (decrease) in net assets from operations | | $ | (23,132,558 | ) | | $ | (11,840,378 | ) | | $ | (3,875,288 | ) | | $ | (2,363,283 | ) |
See accompanying Notes to Financial Statements.
STATEMENTS OF OPERATIONS – Continued
For the Year Ended May 31, 2022
| | | North Square | | | | | | | | | North Square | |
| | | Preferred | | | North Square | | | North Square | | | Trilogy | |
| | | and Income | | | Tactical | | | Tactical | | | Alternative | |
| | | Securities Fund | | | Growth Fund | | | Defensive Fund | | | Return Fund | |
| Investment Income: | | | | | | | | | | | | |
| Dividends (net of foreign withholding taxes and/or | | | | | | | | | | | | |
| issuance fees of $0, $0, $0, and $0, respectively) | | $ | 198,391 | | | $ | 7,683,554 | | | $ | 878,214 | | | $ | 805,608 | |
| Interest (net of foreign withholding taxes and/or | | | | | | | | | | | | | | | | |
| issuance fees of $0, $0, $0, and $0, respectively) | | | 350,959 | | | | 124,224 | | | | 57,720 | | | | 629 | |
| Total investment income | | | 549,350 | | | | 7,807,778 | | | | 935,934 | | | | 806,237 | |
| Expenses: | | | | | | | | | | | | | | | | |
| Advisory fees (Note 4) | | | 148,717 | | | | 6,057,241 | | | | 960,029 | | | | 558,286 | |
| Fund administration fees | | | 15,169 | | | | 470,191 | | | | 61,605 | | | | 36,011 | |
| Shareholder servicing fees – Class A (Note 7) | | | — | | | | 59,520 | | | | 16,361 | | | | 1,343 | |
| Shareholder servicing fees – Class C (Note 7) | | | — | | | | 67,119 | | | | 7,087 | | | | 3,553 | |
| Shareholder servicing fees – Class I (Note 7) | | | 20,656 | | | | 288,657 | | | | 52,853 | | | | 42,945 | |
| Transfer agent fees and expenses | | | 10,365 | | | | 280,529 | | | | 38,533 | | | | 23,259 | |
| Legal fees | | | 19,297 | | | | 291,361 | | | | 36,680 | | | | 21,204 | |
| Registration fees | | | 10,510 | | | | 22,326 | | | | 22,280 | | | | 19,014 | |
| Custody fees | | | 10,353 | | | | 17,727 | | | | 3,769 | | | | 4,141 | |
| Trustees’ fees and expenses | | | 5,846 | | | | 134,052 | | | | 18,326 | | | | 10,676 | |
| Chief Compliance Officer fees (Note 4) | | | 2,780 | | | | 64,006 | | | | 8,256 | | | | 4,814 | |
| Fund accounting fees | | | 1,528 | | | | 47,572 | | | | 7,911 | | | | 5,474 | |
| Auditing fees | | | 1,569 | | | | 80,464 | | | | 11,122 | | | | 6,645 | |
| Shareholder reporting fees | | | 2,776 | | | | 48,089 | | | | 6,188 | | | | 2,623 | |
| Distribution fees – Class A (Note 8) | | | — | | | | 245,102 | | | | 60,145 | | | | 6,189 | |
| Distribution fees – Class C (Note 8) | | | — | | | | 967,989 | | | | 86,047 | | | | 42,688 | |
| Interest expense | | | — | | | | — | | | | — | | | | 150 | |
| Other expenses | | | 2,462 | | | | 43,693 | | | | 6,525 | | | | 6,365 | |
| Total expenses | | | 252,028 | | | | 9,185,638 | | | | 1,403,717 | | | | 795,380 | |
| Affiliated fund fees waived (Note 4) | | | — | | | | — | | | | — | | | | — | |
| Less advisory fees waived & expenses reimbursed | | | | | | | | | | | | | | | | |
| Class A | | | — | | | | (62,564 | ) | | | — | | | | (5,891 | ) |
| Class C | | | — | | | | (68,850 | ) | | | — | | | | (11,385 | ) |
| Class I | | | (56,691 | ) | | | (298,328 | ) | | | — | | | | (112,731 | ) |
| Net expenses | | | 195,337 | | | | 8,755,896 | | | | 1,403,717 | | | | 665,373 | |
| Net Investment income | | | 354,013 | | | | (948,118 | ) | | | (467,783 | ) | | | 140,864 | |
| Net Realized and Unrealized Gain (Loss): | | | | | | | | | | | | | | | | |
| Net realized gain (loss) on: | | | | | | | | | | | | | | | | |
| Investments | | | 6,631,226 | | | | 37,101,813 | | | | 12,794,769 | | | | 900,526 | |
| Forwards | | | 40,470 | | | | — | | | | — | | | | — | |
| Foreign currency transactions | | | (4,025 | ) | | | — | | | | — | | | | — | |
| Written Options | | | — | | | | — | | | | — | | | | (815,172 | ) |
| Purchased Options | | | — | | | | — | | | | — | | | | (4,174,982 | ) |
| Net realized gain (loss) | | | 6,667,671 | | | | 37,101,813 | | | | 12,794,769 | | | | (4,089,628 | ) |
| Net change in unrealized appreciation/depreciation on: | | | | | | | | | | | | | | | | |
| Investments | | | (8,416,623 | ) | | | (68,776,256 | ) | | | (11,817,085 | ) | | | (2,153,794 | ) |
| Written Options | | | — | | | | — | | | | — | | | | 906,736 | |
| Purchased Options | | | — | | | | — | | | | — | | | | 2,776,240 | |
| FX | | | (64 | ) | | | — | | | | — | | | | — | |
| Net change in unrealized | | | | | | | | | | | | | | | | |
| appreciation/depreciation | | | (8,416,687 | ) | | | (68,776,256 | ) | | | (11,817,085 | ) | | | 1,529,182 | |
| Net realized and unrealized gain (loss) | | | (1,749,016 | ) | | | (31,674,443 | ) | | | 977,684 | | | | (2,560,446 | ) |
| Net increase (decrease) in net assets from operations | | $ | (1,395,003 | ) | | $ | (32,622,561 | ) | | $ | 509,901 | | | $ | (2,419,582 | ) |
See accompanying Notes to Financial Statements.
STATEMENTS OF CHANGES IN NET ASSETS
| | | North Square | | | North Square | |
| | | Spectrum Alpha Fund | | | Dynamic Small Cap Fund | |
| | | Year Ended | | | Year Ended | | | Year Ended | | | Year Ended | |
| | | May 31, 2022 | | | May 31, 2021* | | | May 31, 2022 | | | May 31, 2021 | |
| Increase (Decrease) in Net Assets from: | | | | | | | | | | | | |
| Operations: | | | | | | | | | | | | |
| Net investment income | | $ | (1,582,984 | ) | | $ | (1,577,208 | ) | | | | | | $ | (55,627 | ) |
| Net realized gain on investments | | | | | | | | | | | | | | | | |
| and foreign currency translations | | | 47,887,713 | | | | 32,671,779 | | | | (3,095,661 | ) | | | 6,975,800 | |
| Net change in unrealized appreciation/depreciation | | | | | | | | | | | | | | | | |
| on investments and foreign currency translations | | | (69,437,287 | ) | | | 20,502,102 | | | | (8,772,335 | ) | | | 2,013,661 | |
| Net increase (decrease) in net assets | | | | | | | | | | | | | | | | |
| resulting from operations | | | (23,132,558 | ) | | | 51,596,673 | | | | (11,840,378 | ) | | | 8,933,834 | |
| | | | | | | | | | | | | | | | | |
| Distributions to shareholders | | | | | | | | | | | | | | | | |
| Distributions: | | | | | | | | | | | | | | | | |
| Class A | | | (10,900,819 | ) | | | (10,715,503 | ) | | | — | | | | — | |
| Class C | | | — | | | | — | | | | — | | | | — | |
| Class I | | | (6,492,617 | ) | | | (6,326,766 | ) | | | (6,613,665 | ) | | | (360,974 | ) |
| Class K | | | — | | | | — | | | | — | | | | — | |
| Total | | | (17,393,436 | ) | | | (17,042,269 | ) | | | (6,613,665 | ) | | | (360,974 | ) |
| | | | | | | | | | | | | | | | | |
| Capital Transactions: | | | | | | | | | | | | | | | | |
| Net proceeds from shares sold | | | | | | | | | | | | | | | | |
| Class A | | | 1,901,148 | | | | 6,635,455 | | | | — | | | | — | |
| Class C | | | — | | | | 140,654 | | | | — | | | | — | |
| Class I | | | 3,231,148 | | | | 19,574,442 | | | | 84,613,534 | | | | 458,063 | |
| Class K | | | — | | | | 821,418 | | | | — | | | | — | |
| Reinvestment of distributions | | | | | | | | | | | | | | | | |
| Class A | | | 10,558,384 | | | | 10,275,309 | | | | — | | | | — | |
| Class C | | | — | | | | — | | | | — | | | | — | |
| Class I | | | 6,367,682 | | | | 6,135,604 | | | | 6,613,666 | | | | 360,974 | |
| Class K | | | — | | | | — | | | | — | | | | — | |
| Cost of shares redeemed | | | | | | | | | | | | | | | | |
| Class A | | | (18,787,708 | ) | | | (23,410,067 | ) | | | — | | | | — | |
| Class C | | | — | | | | (10,888,219 | ) | | | — | | | | — | |
| Class I | | | (15,529,593 | ) | | | (16,947,193 | ) | | | (14,158,858 | ) | | | (4,522,752 | ) |
| Class K | | | — | | | | (7,907,186 | ) | | | — | | | | — | |
| Net increase (decrease) in net assets | | | | | | | | | | | | | | | | |
| from capital transactions | | | (12,258,939 | ) | | | (15,569,783 | ) | | | 77,068,342 | | | | (3,703,715 | ) |
| Total increase (decrease) in net assets | | | (52,784,933 | ) | | | 18,984,621 | | | | 58,614,299 | | | | 4,869,145 | |
| | | | | | | | | | | | | | | | | |
| Net Assets: | | | | | | | | | | | | | | | | |
| Beginning of Period | | | | | | | 129,427,377 | | | | 20,369,007 | | | | 15,499,862 | |
| End of Period | | | | | | $ | 148,411,998 | | | $ | 78,983,306 | | | $ | 20,369,007 | |
* At the close of business on October 9, 2020, Class C and Class K shares converted into Class I shares.
See accompanying Notes to Financial Statements.
STATEMENTS OF CHANGES IN NET ASSETS – Continued
| | | North Square | | | North Square | |
| | | Spectrum Alpha Fund | | | Dynamic Small Cap Fund | |
| | | Year Ended | | | Year Ended | | | Year Ended | | | Year Ended | |
| | | May 31, 2022 | | | May 31, 2021* | | | May 31, 2022 | | | May 31, 2021 | |
| Capital Share Transactions: | | | | | | | | | | | | |
| Shares sold | | | | | | | | | | | | |
| Class A | | | 139,253 | | | | 454,711 | | | | — | | | | — | |
| Class C | | | — | | | | 51,042 | | | | — | | | | — | |
| Class I | | | 206,097 | | | | 1,190,853 | | | | 6,563,426 | | | | 28,862 | |
| Class K | | | — | | | | 56,114 | | | | — | | | | — | |
| Shares reinvested | | | | | | | | | | | | | | | | |
| Class A | | | 762,168 | | | | 692,901 | | | | — | | | | — | |
| Class C | | | — | | | | — | | | | — | | | | — | |
| Class I | | | 393,562 | | | | 362,083 | | | | 508,517 | | | | 22,822 | |
| Class K | | | — | | | | — | | | | — | | | | — | |
| Shares redeemed | | | | | | | | | | | | | | | | |
| Class A | | | (1,357,846 | ) | | | (1,595,558 | ) | | | — | | | | — | |
| Class C | | | — | | | | (3,598,192 | ) | | | — | | | | — | |
| Class I | | | (956,296 | ) | | | (1,035,753 | ) | | | (1,063,069 | ) | | | (288,973 | ) |
| Class K | | | — | | | | (529,547 | ) | | | — | | | | — | |
| Net increase (decrease) in | | | | | | | | | | | | | | | | |
| capital share transactions | | | (813,062 | ) | | | (3,951,346 | ) | | | 6,008,874 | | | | (237,289 | ) |
* At the close of business on October 9, 2020, Class C and Class K shares converted into Class I shares.
See accompanying Notes to Financial Statements.
STATEMENTS OF CHANGES IN NET ASSETS – Continued
| | | North Square Advisory Research | | | North Square | |
| | | Small Cap Growth Fund | | | Multi Strategy Fund | |
| | | Year Ended | | | Year Ended | | | Year Ended | | | Year Ended | |
| | | May 31, 2022 | | | May 31, 2021 | | | May 31, 2022 | | | May 31, 2021* | |
| Increase (Decrease) in Net Assets from: | | | | | | | | | | | | |
| Operations: | | | | | | | | | | | | |
| Net investment income | | | | | | | | | | $ | 4,654,285 | | | $ | (175,977 | ) |
| Net realized gain (loss) on investments | | | | | | | | | | | | | | | | |
| and foreign currency translations | | | 3,662,768 | | | | | | | | 5,372,296 | | | | 2,119,225 | |
| Capital gain distributions from | | | | | | | | | | | | | | | | |
| regulated investment companies | | | — | | | | — | | | | | | | | 1,341,947 | |
| Net change in unrealized appreciation/depreciation | | | | | | | | | | | | | | | | |
| on investments and foreign currency translations | | | (7,458,194 | ) | | | 1,982,882 | | | | (17,715,179 | ) | | | 13,507,961 | |
| Net increase (decrease) in net assets | | | | | | | | | | | | | | | | |
| resulting from operations | | | (3,875,288 | ) | | | 4,070,433 | | | | (2,363,283 | ) | | | 16,793,156 | |
| | | | | | | | | | | | | | | | | |
| Distributions to shareholders | | | | | | | | | | | | | | | | |
| Distributions: | | | | | | | | | | | | | | | | |
| Class A | | | — | | | | — | | | | (2,660,146 | ) | | | — | |
| Class C | | | — | | | | — | | | | — | | | | — | |
| Class I | | | (2,964,205 | ) | | | (775,050 | ) | | | (639,389 | ) | | | — | |
| Total | | | (2,964,205 | ) | | | (775,050 | ) | | | (3,299,535 | ) | | | — | |
| | | | | | | | | | | | | | | | | |
| Capital Transactions: | | | | | | | | | | | | | | | | |
| Net proceeds from shares sold | | | | | | | | | | | | | | | | |
| Class A | | | — | | | | — | | | | 1,320,863 | | | | 1,491,365 | |
| Class C | | | — | | | | — | | | | — | | | | 16,998 | |
| Class I | | | 19,020,697 | | | | 58,913 | | | | 1,887,360 | | | | 3,857,218 | |
| Reinvestment of distributions | | | | | | | | | | | | | | | | |
| Class A | | | — | | | | — | | | | 2,511,713 | | | | — | |
| Class C | | | — | | | | — | | | | — | | | | — | |
| Class I | | | 2,964,206 | | | | 775,050 | | | | 599,065 | | | | — | |
| Cost of shares redeemed | | | | | | | | | | | | | | | | |
| Class A | | | — | | | | — | | | | (6,663,587 | ) | | | (5,027,549 | ) |
| Class C | | | — | | | | — | | | | — | | | | (4,034,136 | ) |
| Class I | | | (14,939,435 | ) | | | (3,857,036 | ) | | | (1,826,257 | ) | | | (2,024,440 | ) |
| Net increase (decrease) in net assets | | | | | | | | | | | | | | | | |
| from capital transactions | | | 7,045,468 | | | | (3,023,073 | ) | | | (2,170,843 | ) | | | (5,720,544 | ) |
| Total increase (decrease) in net assets | | | 205,975 | | | | 272,310 | | | | (7,833,661 | ) | | | 11,072,612 | |
| | | | | | | | | | | | | | | | | |
| Net Assets: | | | | | | | | | | | | | | | | |
| Beginning of Period | | | 12,463,006 | | | | 12,190,696 | | | | | | | | 44,659,718 | |
| End of Period | | $ | 12,668,981 | | | $ | 12,463,006 | | | $ | 47,898,669 | | | $ | 55,732,330 | |
* At the close of business on October 9, 2020, Class C shares converted into Class I shares.
See accompanying Notes to Financial Statements.
STATEMENTS OF CHANGES IN NET ASSETS – Continued
| | | North Square Advisory Research | | | North Square | |
| | | Small Cap Growth Fund | | | Multi Strategy Fund | |
| | | Year Ended | | | Year Ended | | | Year Ended | | | Year Ended | |
| | | May 31, 2022 | | | May 31, 2021 | | | May 31, 2022 | | | May 31, 2021* | |
| Capital Share Transactions: | | | | | | | | | | | | |
| Shares sold | | | | | | | | | | | | |
| Class A | | | — | | | | — | | | | 55,109 | | | | 73,292 | |
| Class C | | | — | | | | — | | | | — | | | | 1,210 | |
| Class I | | | 1,111,540 | | | | 2,940 | | | | 77,106 | | | | 188,700 | |
| Shares reinvested | | | | | | | | | | | | | | | | |
| Class A | | | — | | | | — | | | | 105,099 | | | | — | |
| Class C | | | — | | | | — | | | | — | | | | — | |
| Class I | | | 166,850 | | | | 39,968 | | | | 23,713 | | | | — | |
| Shares redeemed | | | | | | | | | | | | | | | | |
| Class A | | | — | | | | — | | | | (285,863 | ) | | | (241,640 | ) |
| Class C | | | — | | | | — | | | | — | | | | (258,716 | ) |
| Class I | | | (874,742 | ) | | | (197,381 | ) | | | (73,567 | ) | | | (92,145 | ) |
| Net increase (decrease) in capital | | | | | | | | | | | | | | | | |
| share transactions | | | 403,648 | | | | (154,473 | ) | | | (98,403 | ) | | | (329,299 | ) |
* At the close of business on October 9, 2020, Class C shares converted into Class I shares.
See accompanying Notes to Financial Statements.
STATEMENTS OF CHANGES IN NET ASSETS – Continued
| | | North Square Preferred and | | | North Square Tactical | |
| | | Income Securities Fund | | | Growth Fund | |
| | | Year Ended | | | Year Ended | | | Year Ended | | | Year Ended | |
| | | May 31, 2022 | | | May 31, 2021 | | | May 31, 2022* | | | May 31, 2021 | |
| Increase (Decrease) in Net Assets from: | | | | | | | | | | | | |
| Operations: | | | | | | | | | | | | |
| Net investment income | | $ | 354,013 | | | $ | 143,886 | | | $ | (948,118 | ) | | $ | (3,697,670 | ) |
| Net realized gain (loss) on investments | | | | | | | | | | | | | | | | |
| and foreign currency translations | | | 6,667,671 | | | | 664,556 | | | | 37,101,813 | | | | 36,306,302 | |
| Net change in unrealized appreciation/depreciation | | | | | | | | | | | | | | | | |
| on investments and foreign currency translations | | | | | | | 3,592,288 | | | | | | | | 101,472,682 | |
| Net increase (decrease) in net assets | | | | | | | | | | | | | | | | |
| resulting from operations | | | (1,395,003 | ) | | | 4,400,730 | | | | (32,622,561 | ) | | | 134,081,314 | |
| | | | | | | | | | | | | | | | | |
| Distributions to shareholders | | | | | | | | | | | | | | | | |
| Distributions: | | | | | | | | | | | | | | | | |
| Class A | | | — | | | | — | | | | (4,656,629 | ) | | | — | |
| Class C | | | — | | | | — | | | | (4,934,549 | ) | | | — | |
| Class I | | | (1,467,649 | ) | | | (369,429 | ) | | | (18,313,294 | ) | | | (76,516 | ) |
| Total | | | (1,467,649 | ) | | | (369,429 | ) | | | (27,904,472 | ) | | | (76,516 | ) |
| | | | | | | | | | | | | | | | | |
| Capital Transactions: | | | | | | | | | | | | | | | | |
| Net proceeds from shares sold | | | | | | | | | | | | | | | | |
| Class A | | | — | | | | — | | | | 19,301,112 | | | | 10,986,542 | |
| Class C | | | — | | | | — | | | | 4,869,429 | | | | 7,496,249 | |
| Class I | | | 18,407,241 | | | | 878,900 | | | | 52,032,697 | | | | 62,970,845 | |
| Reinvestment of distributions | | | | | | | | | | | | | | | | |
| Class A | | | — | | | | — | | | | 4,483,664 | | | | — | |
| Class C | | | — | | | | — | | | | 4,752,313 | | | | — | |
| Class I | | | 1,467,551 | | | | 369,429 | | | | 16,496,351 | | | | 65,650 | |
| Cost of shares redeemed | | | | | | | | | | | | | | | | |
| Class A | | | — | | | | — | | | | (17,620,626 | ) | | | (16,927,016 | ) |
| Class C | | | — | | | | — | | | | (20,051,854 | ) | | | (20,850,022 | ) |
| Class I | | | (7,405,206 | ) | | | (238,986 | ) | | | (76,807,346 | ) | | | (73,760,825 | ) |
| Net increase (decrease) in net assets | | | | | | | | | | | | | | | | |
| from capital transactions | | | 12,469,586 | | | | 1,009,343 | | | | (12,544,260 | ) | | | (30,018,577 | ) |
| Total increase (decrease) in net assets | | | 9,606,934 | | | | 5,040,644 | | | | (73,071,293 | ) | | | 103,986,221 | |
| | | | | | | | | | | | | | | | | |
| Net Assets: | | | | | | | | | | | | | | | | |
| Beginning of Period | | | 16,186,328 | | | | 11,145,684 | | | | 595,434,389 | | | | 491,448,168 | |
| End of Period | | $ | 25,793,262 | | | $ | 16,186,328 | | | $ | 522,363,096 | | | $ | 595,434,389 | |
| * | Effective June 11, 2021, the Stadion Tactical Growth Fund Class A, C, and I converted to the North Square Tactical Growth Fund Class A, C, and I, respectively. See Note 3. |
See accompanying Notes to Financial Statements.
STATEMENTS OF CHANGES IN NET ASSETS – Continued
| | | North Square Preferred and | | | North Square Tactical
| |
| | | Income Securities Fund | | | Growth Fund
| |
| | | Year Ended | | | Year Ended | | | Year Ended | | | Year Ended | |
| | | May 31, 2022 | | | May 31, 2021 | | | May 31, 2022* | | | May 31, 2021 | |
| Capital Share Transactions: | | | | | | | | | | | | |
| Shares sold | | | | | | | | | | | | |
| Class A | | | — | | | | — | | | | 1,291,538 | | | | 801,246 | |
| Class C | | | — | | | | — | | | | 344,419 | | | | 575,511 | |
| Class I | | | 785,761 | | | | 49,284 | | | | 3,413,555 | | | | 4,556,239 | |
| Shares reinvested | | | | | | | | | | | | | | | | |
| Class A | | | — | | | | — | | | | 299,943 | | | | — | |
| Class C | | | — | | | | — | | | | 339,204 | | | | — | |
| Class I | | | 63,102 | | | | 18,325 | | | | 1,081,813 | | | | 4,578 | |
| Shares redeemed | | | | | | | | | | | | | | | | |
| Class A | | | — | | | | — | | | | (1,172,728 | ) | | | (1,285,728 | ) |
| Class C | | | — | | | | — | | | | (1,428,204 | ) | | | (1,623,365 | ) |
| Class I | | | (312,207 | ) | | | (11,455 | ) | | | (5,077,334 | ) | | | (5,366,351 | ) |
| Net increase (decrease) in | | | | | | | | | | | | | | | | |
| capital share transactions | | | 536,656 | | | | 56,154 | | | | (907,794 | ) | | | (2,337,870 | ) |
| * | Effective June 11, 2021, the Stadion Tactical Growth Fund Class A, C, and I converted to the North Square Tactical Growth Fund Class A, C, and I, respectively. See Note 3. |
See accompanying Notes to Financial Statements.
STATEMENTS OF CHANGES IN NET ASSETS – Continued
| | | North Square Tactical | | | North Square Trilogy | |
| | | Defensive Fund | | | Alternative Return Fund | |
| | | Year Ended | | | Year Ended | | | Year Ended | | | Year Ended | |
| | | May 31, 2022* | | | May 31, 2021 | | | May 31, 2022** | | | May 31, 2021 | |
| Increase (Decrease) in Net Assets from: | | | | | | | | | | | | |
| Operations: | | | | | | | | | | | | |
| Net investment income | | $ | (467,783 | ) | | $ | (566,053 | ) | | $ | 140,864 | | | $ | 342,523 | |
| Net realized gain (loss) on investments | | | | | | | | | | | | | | | | |
| and foreign currency translations | | | 12,794,769 | | | | 10,857,938 | | | | (4,089,628 | ) | | | 1,322,888 | |
| Net change in unrealized appreciation/depreciation | | | | | | | | | | | | | | | | |
| on investments and foreign currency translations | | | (11,817,085 | ) | | | 10,359,937 | | | | 1,529,182 | | | | 2,861,240 | |
| Net increase (decrease) in net assets | | | | | | | | | | | | | | | | |
| resulting from operations | | | 509,901 | | | | 20,651,822 | | | | (2,419,582 | ) | | | 4,526,651 | |
| | | | | | | | | | | | | | | | | |
| Distributions to shareholders | | | | | | | | | | | | | | | | |
| Distributions: | | | | | | | | | | | | | | | | |
| Class A | | | — | | | | — | | | | (4,131 | ) | | | (21,638 | ) |
| Class C | | | — | | | | — | | | | — | | | | (14,520 | ) |
| Class I | | | — | | | | — | | | | (98,583 | ) | | | (428,954 | ) |
| Total | | | — | | | | — | | | | (102,714 | ) | | | (465,112 | ) |
| | | | | | | | | | | | | | | | | |
| Capital Transactions: | | | | | | | | | | | | | | | | |
| Net proceeds from shares sold | | | | | | | | | | | | | | | | |
| Class A | | | 5,801,710 | | | | 2,452,935 | | | | 563,694 | | | | 569,284 | |
| Class C | | | 415,782 | | | | 554,748 | | | | 94,647 | | | | 345,710 | |
| Class I | | | 6,484,387 | | | | 3,388,648 | | | | 7,040,756 | | | | 5,491,488 | |
| Reinvestment of distributions | | | | | | | | | | | | | | | | |
| Class A | | | — | | | | — | | | | 3,063 | | | | 19,432 | |
| Class C | | | — | | | | — | | | | — | | | | 14,089 | |
| Class I | | | — | | | | — | | | | 98,507 | | | | 419,858 | |
| Cost of shares redeemed | | | | | | | | | | | | | | | | |
| Class A | | | (4,027,394 | ) | | | (4,581,244 | ) | | | (902,730 | ) | | | (772,998 | ) |
| Class C | | | (4,913,215 | ) | | | (5,685,353 | ) | | | (894,810 | ) | | | (1,397,555 | ) |
| Class I | | | (9,511,742 | ) | | | (16,953,384 | ) | | | (8,778,076 | ) | | | (12,366,573 | ) |
| Net increase (decrease) in net assets | | | | | | | | | | | | | | | | |
| from capital transactions | | | (5,750,472 | ) | | | (20,823,650 | ) | | | (2,774,949 | ) | | | (7,677,265 | ) |
| Total increase (decrease) in net assets | | | (5,240,571 | ) | | | (171,828 | ) | | | (5,297,245 | ) | | | (3,615,726 | ) |
| Net Assets: | | | | | | | | | | | | | | | | |
| Beginning of Period | | | 78,251,631 | | | | 78,423,459 | | | | 47,049,297 | | | | 50,665,023 | |
| End of Period | | $ | 73,011,060 | | | $ | 78,251,631 | | | $ | 41,752,052 | | | $ | 47,049,297 | |
| * | Effective June 11, 2021, the Stadion Tactical Defensive Fund Class A, C, and I converted to the North Square Tactical Defensive Fund Class A, C, and I, respectively. See Note 3. |
| ** | Effective June 11, 2021, the Stadion Trilogy Alternative Return Fund Class A, C, and I converted to the North Square Trilogy Alternative Return Fund Class A, C, and I, respectively. See Note 3. |
See accompanying Notes to Financial Statements.
STATEMENTS OF CHANGES IN NET ASSETS – Continued
| | | North Square Tactical | | | North Square Trilogy | |
| | | Defensive Fund | | | Alternative Return Fund | |
| | | Year Ended | | | Year Ended | | | Year Ended | | | Year Ended | |
| | | May 31, 2022* | | | May 31, 2021 | | | May 31, 2022** | | | May 31, 2021 | |
| Capital Share Transactions: | | | | | | | | | | | | |
| Shares sold | | | | | | | | | | | | |
| Class A | | | 356,113 | | | | 172,123 | | | | 48,173 | | | | 50,787 | |
| Class C | | | 27,992 | | | | 40,693 | | | | 8,645 | | | | 32,676 | |
| Class I | | | 386,496 | | | | 232,382 | | | | 609,527 | | | | 488,813 | |
| Shares reinvested | | | | | | | | | | | | | | | | |
| Class A | | | — | | | | — | | | | 261 | | | | 1,755 | |
| Class C | | | — | | | | — | | | | — | | | | 1,330 | |
| Class I | | | — | | | | — | | | | 8,365 | | | | 37,646 | |
| Shares redeemed | | | | | | | | | | | | | | | | |
| Class A | | | (244,497 | ) | | | (318,633 | ) | | | (78,047 | ) | | | (68,468 | ) |
| Class C | | | (330,222 | ) | | | (429,755 | ) | | | (78,447 | ) | | | (127,285 | ) |
| Class I | | | (560,120 | ) | | | (1,137,019 | ) | | | (754,599 | ) | | | (1,111,480 | ) |
| Net increase (decrease) in capital | | | | | | | | | | | | | | | | |
| share transactions | | | (364,238 | ) | | | (1,440,209 | ) | | | (236,122 | ) | | | (694,226 | ) |
| * | Effective June 11, 2021, the Stadion Tactical Defensive Fund Class A, C, and I converted to the North Square Tactical Defensive Fund Class A, C, and I, respectively. See Note 3. |
| ** | Effective June 11, 2021, the Stadion Trilogy Alternative Return Fund Class A, C, and I converted to the North Square Trilogy Alternative Return Fund Class A, C, and I, respectively. See Note 3. |
See accompanying Notes to Financial Statements.
North Square Spectrum Alpha Fund
FINANCIAL HIGHLIGHTS
Class A
Per share operating performance.
For a capital share outstanding throughout each period.
| | | For the Year Ended May 31, | |
| | | 2022 | | | 2021 | | | 2020 | | | 2019 | | | 2018 | |
| Net asset value, beginning of period | | $ | 15.36 | | | $ | 12.07 | | | $ | 13.89 | | | $ | 16.85 | | | $ | 34.16 | |
| Income from Investment Operations: | | | | | | | | | | | | | | | | | | | | |
| Net investment loss¹ | | | (0.19 | )2 | | | (0.17 | ) | | | (0.15 | ) | | | (0.16 | )2 | | | (0.23 | )2 |
| Net realized and unrealized gain (loss) | | | (2.26 | ) | | | 5.34 | | | | 0.44 | | | | (0.34 | ) | | | 5.69 | |
| Total from investment operations | | | (2.45 | ) | | | 5.17 | | | | 0.29 | | | | (0.50 | ) | | | 5.46 | |
| Less Distributions: | | | | | | | | | | | | | | | | | | | | |
| From net realized gain | | | (2.13 | ) | | | (1.88 | ) | | | (2.11 | ) | | | (2.46 | ) | | | (22.77 | ) |
| Total distributions | | | (2.13 | ) | | | (1.88 | ) | | | (2.11 | ) | | | (2.46 | ) | | | (22.77 | ) |
| Net asset value, end of period | | $ | 10.78 | | | $ | 15.36 | | | $ | 12.07 | | | $ | 13.89 | | | $ | 16.85 | |
Total return3 | | | (19.05 | )% | | | 43.47 | % | | | 1.16 | % | | | (1.96 | )% | | | 23.85 | % |
| Ratios and Supplemental Data: | | | | | | | | | | | | | | | | | | | | |
Net assets, end of period (in thousands) | | $ | 56,319 | | | $ | 87,291 | | | $ | 73,973 | | | $ | 109,749 | | | $ | 162,714 | |
Ratio of expenses to average net assets: | | | | | | | | | | | | | | | | | | | | |
Before fees waived and expenses absorbed4 | | | 1.34 | % | | | 1.75 | % | | | 2.06 | % | | | 1.46 | % | | | 1.40 | % |
After fees waived and expenses absorbed4 | | | 1.36 | %6 | | | 1.39 | % | | | 1.39 | % | | | 1.38 | % | | | 1.38 | %5 |
Ratio of net investment loss to average net assets: | | | | | | | | | | | | | | | | | | | | |
Before fees waived and expenses absorbed4 | | | (1.29 | )% | | | (1.54 | )% | | | (1.78 | )% | | | (1.08 | )% | | | (0.97 | )% |
After fees waived and expenses absorbed4 | | | (1.31 | )% | | | (1.18 | )% | | | (1.11 | )% | | | (1.00 | )% | | | (0.95 | )% |
Portfolio turnover rate | | | 104 | % | | | 33 | % | | | 38 | % | | | 31 | % | | | 39 | % |
| | 1 | Based on average shares outstanding for the period. |
| | 2 | Recognition of net investment income by the Fund is affected by the timing of the declaration of dividends by the underlying investment companies in which the Fund invests. The ratio does not include net investment income of the investment companies in which the Fund invests. |
| | 3 | Total returns would have been lower had expenses not been waived or absorbed by the Advisor. Returns shown do not include payment of a sales load of 5.75% of offering price, which is reduced on sales of $50,000 or more. Returns shown do not include payment of a Contingent Deferred Sales Charge (“CDSC”) of 1% on certain redemptions made within 12 months of the date of purchase. If the sales load and CDSC were included, total returns would be lower. These returns include Rule 12b-1 fees of up to 0.25% and do not reflect the deduction of taxes that a shareholder would pay on Fund distributions or the redemption of Fund shares. |
| | 4 | Does not include expenses of the investment companies in which the Fund invests. |
| | 5 | Effective October 5, 2017, the Advisor had contractually agreed to waive its fees and/or absorb expenses of the Fund to ensure that total fund operating expenses (excluding taxes, leverage interest, brokerage commissions, dividend expenses on short sales, acquired fund fees and expenses as determined in accordance with SEC Form N-1A, expenses incurred in connection with any merger or reorganization, or extraordinary expenses such as litigation) do not exceed 1.39% of average daily net assets of the Fund. Prior to October 5, 2017, the annual fund operating expense limitation was 1.40%. |
| | 6 | Effective January 11, 2022, the expense cap decreased from 1.39% to 1.30%. |
See accompanying Notes to Financial Statements.
North Square Spectrum Alpha Fund
FINANCIAL HIGHLIGHTS
Class I
Per share operating performance.
For a capital share outstanding throughout each period.
| | | For the Year Ended May 31, | |
| | | 2022 | | | 2021 | | | 2020 | | | 2019 | | | 2018 | |
| Net asset value, beginning of period | | $ | 17.59 | | | $ | 13.58 | | | $ | 15.35 | | | $ | 18.29 | | | $ | 35.25 | |
| Income from Investment Operations: | | | | | | | | | | | | | | | | | | | | |
Net investment loss1 | | | (0.17 | )2 | | | (0.15 | ) | | | (0.13 | ) | | | (0.13 | )2 | | | (0.19 | )2 |
| Net realized and unrealized gain (loss) | | | (2.69 | ) | | | 6.04 | | | | 0.47 | | | | (0.35 | ) | | | 6.00 | |
| Total from investment operations | | | (2.86 | ) | | | 5.89 | | | | 0.34 | | | | (0.48 | ) | | | 5.81 | |
| Less Distributions: | | | | | | | | | | | | | | | | | | | | |
| From net realized gain | | | (2.13 | ) | | | (1.88 | ) | | | (2.11 | ) | | | (2.46 | ) | | | (22.77 | ) |
| Total distributions | | | (2.13 | ) | | | (1.88 | ) | | | (2.11 | ) | | | (2.46 | ) | | | (22.77 | ) |
| Net asset value, end of period | | $ | 12.60 | | | $ | 17.59 | | | $ | 13.58 | | | $ | 15.35 | | | $ | 18.29 | |
Total return3 | | | (18.90 | )% | | | 43.92 | % | | | 1.41 | % | | | (1.67 | )% | | | 24.19 | % |
| Ratios and Supplemental Data: | | | | | | | | | | | | | | | | | | | | |
Net assets, end of period (in thousands) | | $ | 39,308 | | | $ | 61,121 | | | $ | 40,165 | | | $ | 64,501 | | | $ | 172,935 | |
Ratio of expenses to average net assets: | | | | | | | | | | | | | | | | | | | | |
Before fees waived and expenses absorbed4 | | | 1.12 | % | | | 1.51 | %6 | | | 1.78 | % | | | 1.22 | % | | | 1.05 | % |
After fees waived and expenses absorbed4 | | | 1.11 | %7 | | | 1.08 | % | | | 1.14 | % | | | 1.14 | % | | | 1.06 | %5 |
Ratio of net investment loss to average net assets: | | | | | | | | | | | | | | | | | | | | |
Before fees waived and expenses absorbed4 | | | (1.07 | )% | | | (1.31 | )%6 | | | (1.50 | )% | | | (0.84 | )% | | | (0.63 | )% |
After fees waived and expenses absorbed4 | | | (1.06 | )% | | | (0.87 | )% | | | (0.86 | )% | | | (0.75 | )% | | | (0.64 | )% |
Portfolio turnover rate | | | 104 | % | | | 33 | % | | | 38 | % | | | 31 | % | | | 39 | % |
| | 1 | Based on average shares outstanding for the period. |
| | 2 | Recognition of net investment income by the Fund is affected by the timing of the declaration of dividends by the underlying investment companies in which the Fund invests. The ratio does not include net investment income of the investment companies in which the Fund invests. |
| | 3 | Total returns would have been lower had expenses not been waived by the Advisor. Returns shown do not reflect the deduction of taxes that a shareholder would pay on Fund distributions or the redemption of Fund shares. |
| | 4 | Does not include expenses of the investment companies in which the Fund invests. |
| | 5 | Effective October 5, 2017, the Advisor had contractually agreed to waive its fees and/or absorb expenses of the Fund to ensure that total fund operating expenses (excluding taxes, leverage interest, brokerage commissions, dividend expenses on short sales, acquired fund fees and expenses as determined in accordance with SEC Form N-1A, expenses incurred or in connection with any merger reorganization, or extraordinary expenses such as litigation) do not exceed 1.14% of average daily net assets of the Fund. Prior to October 5, 2017, the annual fund operating expense limitation was 1.05%. |
| | 6 | Ratios exclude the 12b-1 refund. |
| | 7 | Effective January 11, 2022, the expense cap decreased from 1.14% to 1.05%. |
See accompanying Notes to Financial Statements.
North Square Dynamic Small Cap Fund
FINANCIAL HIGHLIGHTS
Class I
Per share operating performance.
For a capital share outstanding throughout each period.
| | | For the Year Ended May 31, | |
| | | 2022 | | | 2021 | | | 2020 | | | 2019 | | | 2018 | |
| Net asset value, beginning of period | | $ | 18.27 | | | $ | 11.46 | | | $ | 11.54 | | | $ | 15.14 | | | $ | 12.07 | |
| Income from Investment Operations: | | | | | | | | | | | | | | | | | | | | |
Net investment income (loss)1 | | | 0.01 | | | | (0.04 | ) | | | 0.02 | | | | (0.01 | ) | | | — | 2 |
| Net realized and unrealized gain (loss) | | | (1.00 | ) | | | 7.14 | | | | (0.07 | ) | | | (1.31 | ) | | | 3.11 | |
| Total from investment operations | | | (0.99 | ) | | | 7.10 | | | | (0.05 | ) | | | (1.32 | ) | | | 3.11 | |
| Less Distributions: | | | | | | | | | | | | | | | | | | | | |
| From net investment income | | | — | | | | (0.01 | ) | | | (0.03 | ) | | | — | | | | — | |
| From net realized gain | | | (6.19 | ) | | | (0.28 | ) | | | — | | | | (2.28 | ) | | | (0.04 | ) |
| Total distributions | | | (6.19 | ) | | | (0.29 | ) | | | (0.03 | ) | | | (2.28 | ) | | | (0.04 | ) |
| Net asset value, end of period | | $ | 11.09 | | | $ | 18.27 | | | $ | 11.46 | | | $ | 11.54 | | | $ | 15.14 | |
Total return3 | | | (10.43 | )% | | | 62.34 | % | | | (0.44 | )% | | | (8.42 | )% | | | 25.83 | % |
| Ratios and Supplemental Data: | | | | | | | | | | | | | | | | | | | | |
Net assets, end of period (in thousands) | | $ | 78,983 | | | $ | 20,369 | | | $ | 15,500 | | | $ | 20,389 | | | $ | 28,279 | |
Ratio of expenses to average net assets: | | | | | | | | | | | | | | | | | | | | |
| Before fees waived and expenses absorbed | | | 1.36 | % | | | 1.67 | % | | | 2.23 | % | | | 2.02 | % | | | 1.89 | % |
| After fees waived and expenses absorbed | | | 1.00 | %4 | | | 1.15 | % | | | 1.15 | % | | | 1.15 | % | | | 1.15 | % |
Ratio of net investment income (loss) to average net assets: | | | | | | | | | | | | | | | | | | | | |
| Before fees waived and expenses absorbed | | | (0.30 | )% | | | (0.82 | )% | | | (0.91 | )% | | | (0.91 | )% | | | (0.71 | )% |
| After fees waived and expenses absorbed | | | 0.06 | % | | | (0.30 | )% | | | 0.17 | % | | | (0.04 | )% | | | 0.03 | % |
Portfolio turnover rate | | | 177 | % | | | 179 | % | | | 170 | % | | | 133 | % | | | 170 | % |
| | 1 | Based on average shares outstanding for the period. |
| | 2 | Amount represents less than $0.005 per share. |
| | 3 | Total returns would have been lower had expenses not been waived by the Advisor. Returns shown do not reflect the deduction of taxes that a shareholder would pay on Fund distributions or the redemption of Fund shares. |
| | 4 | Effective July 1, 2021, the expense cap decreased from 1.15% to 0.99%. |
See accompanying Notes to Financial Statements.
North Square Advisory Research Small Cap Growth Fund
FINANCIAL HIGHLIGHTS
Class I
Per share operating performance.
For a capital share outstanding throughout each period.
| | | For the Year Ended May 31, | |
| | | 2022 | | | 2021 | | | 2020 | | | 2019 | | | 2018 | |
| Net asset value, beginning of period | | $ | 20.91 | | | $ | 16.24 | | | $ | 13.94 | | | $ | 13.16 | | | $ | 11.03 | |
| Income from Investment Operations: | | | | | | | | | | | | | | | | | | | | |
Net investment income (loss)1 | | | (0.10 | ) | | | (0.06 | ) | | | 0.03 | | | | (0.00 | )2 | | | 0.01 | |
| Net realized and unrealized gain (loss) | | | (1.54 | ) | | | 5.82 | | | | 3.00 | | | | 0.88 | | | | 2.12 | |
| Total from investment operations | | | (1.64 | ) | | | 5.76 | | | | 3.03 | | | | 0.88 | | | | 2.13 | |
| Less Distributions: | | | | | | | | | | | | | | | | | | | | |
| From net investment income | | | — | | | | (0.03 | ) | | | (0.01 | ) | | | — | | | | (0.00 | )2 |
| From net realized gain | | | (6.60 | ) | | | (1.06 | ) | | | (0.72 | ) | | | (0.10 | ) | | | — | |
| Total distributions | | | (6.60 | ) | | | (1.09 | ) | | | (0.73 | ) | | | (0.10 | ) | | | (0.00 | ) |
| Net asset value, end of period | | $ | 12.67 | | | $ | 20.91 | | | $ | 16.24 | | | $ | 13.94 | | | $ | 13.16 | |
Total return3 | | | (16.88 | )% | | | 35.93 | % | | | 22.05 | % | | | 6.80 | % | | | 19.31 | % |
| Ratios and Supplemental Data: | | | | | | | | | | | | | | | | | | | | |
Net assets, end of period (in thousands) | | $ | 12,669 | | | $ | 12,463 | | | $ | 12,191 | | | $ | 13,823 | | | $ | 14,285 | |
Ratio of expenses to average net assets: | | | | | | | | | | | | | | | | | | | | |
| Before fees waived and expenses absorbed | | | 1.37 | % | | | 1.45 | % | | | 1.88 | % | | | 2.04 | % | | | 1.99 | % |
| After fees waived and expenses absorbed | | | 0.95 | %4 | | | 0.95 | % | | | 0.95 | % | | | 0.95 | % | | | 0.95 | % |
Ratio of net investment income (loss) to average net assets: | | | | | | | | | | | | | | | | | | | | |
| Before fees waived and expenses absorbed | | | (1.00 | )% | | | (0.79 | )% | | | (0.74 | )% | | | (1.10 | )% | | | (0.96 | )% |
| After fees waived and expenses absorbed | | | (0.58 | )% | | | (0.29 | )% | | | 0.19 | % | | | (0.01 | )% | | | 0.08 | % |
Portfolio turnover rate | | | 230 | % | | | 9 | % | | | 18 | % | | | 18 | % | | | 74 | % |
| | 1 | Based on average shares outstanding for the period. |
| | 2 | Amount represents less than $0.005 per share. |
| | 3 | Total returns would have been lower had expenses not been waived by the Advisor. Returns shown do not reflect the deduction of taxes that a shareholder would pay on Fund distributions or the redemption of Fund shares. |
| | 4 | Effective January 11, 2022, the expense cap decreased from 0.95% to 0.94%. |
See accompanying Notes to Financial Statements.
North Square Multi Strategy Fund
FINANCIAL HIGHLIGHTS
Class A
Per share operating performance.
For a capital share outstanding throughout each period.
| | | For the Year Ended May 31, | |
| | | 2022 | | | 2021 | | | 2020 | | | 2019 | | | 2018 | |
| Net asset value, beginning of period | | $ | 23.57 | | | $ | 16.93 | | | $ | 16.92 | | | $ | 26.95 | | | $ | 22.81 | |
| Income from Investment Operations: | | | | | | | | | | | | | | | | | | | | |
Net investment income (loss)1,4 | | | 1.98 | | | | (0.09 | ) | | | (0.05 | ) | | | (0.06 | ) | | | (0.16 | ) |
| Net realized and unrealized gain (loss) | | | (2.97 | ) | | | 6.73 | | | | 1.25 | | | | (1.60 | ) | | | 4.30 | |
| Total from investment operations | | | (0.99 | ) | | | 6.64 | | | | 1.20 | | | | (1.66 | ) | | | 4.14 | |
| Less Distributions: | | | | | | | | | | | | | | | | | | | | |
| From net investment income | | | — | | | | — | | | | (1.19 | ) | | | — | | | | — | |
| From net realized gain | | | (1.48 | ) | | | — | | | | — | | | | (8.37 | ) | | | — | |
| Total distributions | | | (1.48 | ) | | | — | | | | (1.19 | ) | | | (8.37 | ) | | | — | |
| Net asset value, end of period | | $ | 21.10 | | | $ | 23.57 | | | $ | 16.93 | | | $ | 16.92 | | | $ | 26.95 | |
Total return2 | | | (4.94 | )% | | | 39.20 | % | | | 6.63 | % | | | (4.88 | )% | | | 18.15 | % |
| Ratios and Supplemental Data: | | | | | | | | | | | | | | | | | | | | |
Net assets, end of period (in thousands) | | $ | 37,762 | | | $ | 45,140 | | | $ | 35,278 | | | $ | 33,287 | | | $ | 41,570 | |
Ratio of expenses to average net assets: | | | | | | | | | | | | | | | | | | | | |
Before fees waived/recovered3 | | | 0.79 | %5 | | | 0.92 | %5 | | | 1.34 | %5 | | | 0.82 | %5 | | | 0.93 | %5 |
After fees waived/recovered3 | | | 0.79 | %5 | | | 1.13 | %5 | | | 1.20 | %5 | | | 1.00 | %5 | | | 1.13 | %5 |
Ratio of net investment income (loss) to average net assets: | | | | | | | | | | | | | | | | | | | | |
Before fees waived/recovered3,4 | | | 8.41 | % | | | (0.23 | )% | | | (0.40 | )% | | | (0.09 | )% | | | (0.43 | )% |
After fees waived/recovered3,4 | | | 8.41 | % | | | (0.44 | )% | | | (0.26 | )% | | | (0.27 | )% | | | (0.63 | )% |
Portfolio turnover rate | | | 65 | % | | | 15 | % | | | 7 | % | | | 17 | % | | | 117 | % |
| | 1 | Based on average shares outstanding for the period. |
| | 2 | Total returns would have been lower had expenses not been waived or absorbed by the Advisor. Returns shown do not include payment of a sales load of 5.75% of offering price, which is reduced on sales of $50,000 or more. Returns shown do not include payment of a Contingent Deferred Sales Charge (“CDSC”) of 1% on certain redemptions made within 12 months of the date of purchase. If the sales load and CDSC were included, total returns would be lower. These returns include Rule 12b-1 fees of up to 0.25% and do not reflect the deduction of taxes that a shareholder would pay on Fund distributions or the redemption of Fund shares. |
| | 3 | Does not include expenses of the investment companies in which the Fund invests. |
| | 4 | Recognition of net investment income by the Fund is affected by the timing of the declaration of dividends by the underlying investment companies in which the Fund invests. The ratio does not include net investment income of the investment companies in which the Fund invests. |
| | 5 | The Advisor does not receive management fees for Fund assets invested in other series of the Trust advised by the Advisor (affiliated investments). |
See accompanying Notes to Financial Statements.
North Square Multi Strategy Fund
FINANCIAL HIGHLIGHTS
Class I
Per share operating performance.
For a capital share outstanding throughout each period.
| | | For the Year Ended May 31, | |
| | | 2022 | | | 2021 | | | 2020 | | | 2019 | | | 2018 | |
| Net asset value, beginning of period | | $ | 24.83 | | | $ | 17.73 | | | $ | 17.59 | | | $ | 27.53 | | | $ | 23.24 | |
| Income from Investment Operations: | | | | | | | | | | | | | | | | | | | | |
Net investment income (loss)1,4 | | | 2.22 | | | | 0.06 | | | | (0.01 | ) | | | 0.02 | | | | (0.10 | ) |
| Net realized and unrealized gain (loss) | | | (3.24 | ) | | | 7.04 | | | | 1.36 | | | | (1.59 | ) | | | 4.39 | |
| Total from investment operations | | | (1.02 | ) | | | 7.10 | | | | 1.35 | | | | (1.57 | ) | | | 4.29 | |
| Less Distributions: | | | | | | | | | | | | | | | | | | | | |
| From net investment income | | | — | | | | — | | | | (1.21 | ) | | | — | | | | — | |
| From net realized gain | | | (1.48 | ) | | | — | | | | — | | | | (8.37 | ) | | | — | |
| Total distributions | | | (1.48 | ) | | | — | | | | (1.21 | ) | | | (8.37 | ) | | | — | |
| Net asset value, end of period | | $ | 22.33 | | | $ | 24.83 | | | $ | 17.73 | | | $ | 17.59 | | | $ | 27.53 | |
Total return2 | | | (4.79 | )% | | | 40.07 | % | | | 7.17 | % | | | (4.23 | )% | | | 18.46 | % |
| Ratios and Supplemental Data: | | | | | | | | | | | | | | | | | | | | |
Net assets, end of period (in thousands) | | $ | 10,136 | | | $ | 10,592 | | | $ | 5,851 | | | $ | 12,919 | | | $ | 12,434 | |
Ratio of expenses to average net assets: | | | | | | | | | | | | | | | | | | | | |
Before fees waived/recovered3 | | | 0.54 | %5 | | | 0.67 | %5,6 | | | 0.92 | %5 | | | 0.44 | %5 | | | 0.72 | %5 |
After fees waived/recovered3 | | | 0.54 | %5 | | | 0.43 | %5 | | | 0.90 | %5 | | | 0.62 | %5 | | | 0.88 | %5 |
Ratio of net investment income (loss) to average net assets: | | | | | | | | | | | | | | | | | | | | |
Before fees waived/recovered3,4 | | | 8.92 | % | | | 0.05 | %6 | | | (0.10 | )% | | | 0.29 | % | | | (0.22 | )% |
After fees waived/recovered3,4 | | | 8.92 | % | | | 0.29 | % | | | (0.08 | )% | | | 0.10 | % | | | (0.38 | )% |
Portfolio turnover rate | | | 65 | % | | | 15 | % | | | 7 | % | | | 17 | % | | | 117 | % |
| | 1 | Based on average shares outstanding for the period. |
| | 2 | Total returns would have been lower had expenses not been waived by the Advisor. Returns shown do not reflect the deduction of taxes that a shareholder would pay on Fund distributions or the redemption of Fund shares. |
| | 3 | Does not include expenses of investment companies in which the Fund invests. |
| | 4 | Recognition of net investment income by the Fund is affected by the timing of the declaration of dividends by the underlying investment companies in which the Fund invests. The ratio does not include net investment income of the investment companies in which the Fund invests. |
| | 5 | The Advisor does not receive management fees for Fund assets invested in other series of the Trust advised by the Advisor (affiliated investments). |
| | 6 | Ratios exclude the 12b-1 refund. |
See accompanying Notes to Financial Statements.
North Square Preferred and Income Securities Fund
FINANCIAL HIGHLIGHTS
Class I
Per share operating performance.
For a capital share outstanding throughout each period.
| | | For the Year Ended May 31, | |
| | | 2022 | | | 2021 | | | 2020 | | | 2019 | | | 2018 | |
| Net asset value, beginning of period | | $ | 23.32 | | | $ | 17.47 | | | $ | 16.25 | | | $ | 15.65 | | | $ | 13.69 | |
| Income from Investment Operations: | | | | | | | | | | | | | | | | | | | | |
Net investment income1 | | | 0.41 | | | | 0.21 | | | | 0.24 | | | | 0.24 | | | | 0.24 | |
| Net realized and unrealized gain (loss) | | | (0.55 | ) | | | 6.18 | | | | 1.28 | | | | 0.82 | | | | 1.93 | |
| Total from investment operations | | | (0.14 | ) | | | 6.39 | | | | 1.52 | | | | 1.06 | | | | 2.17 | |
| Less Distributions: | | | | | | | | | | | | | | | | | | | | |
| From net investment income | | | (0.38 | ) | | | (0.18 | ) | | | (0.25 | ) | | | (0.24 | ) | | | (0.20 | ) |
| From net realized gain | | | (1.84 | ) | | | (0.36 | ) | | | (0.05 | ) | | | (0.22 | ) | | | (0.01 | ) |
| Total distributions | | | (2.22 | ) | | | (0.54 | ) | | | (0.30 | ) | | | (0.46 | ) | | | (0.21 | ) |
| Net asset value, end of period | | $ | 20.96 | | | $ | 23.32 | | | $ | 17.47 | | | $ | 16.25 | | | $ | 15.65 | |
Total return2 | | | (1.49 | )% | | | 37.06 | % | | | 9.35 | % | | | 6.94 | % | | | 15.89 | % |
| Ratios and Supplemental Data: | | | | | | | | | | | | | | | | | | | | |
Net assets, end of period (in thousands) | | $ | 25,793 | | | $ | 16,186 | | | $ | 11,146 | | | $ | 12,014 | | | $ | 10,036 | |
Ratio of expenses to average net assets: | | | | | | | | | | | | | | | | | | | | |
| Before fees waived and expenses absorbed | | | 1.27 | % | | | 1.44 | %3 | | | 1.89 | % | | | 2.38 | % | | | 2.93 | % |
| After fees waived and expenses absorbed | | | 0.99 | %4 | | | 1.00 | % | | | 1.00 | % | | | 1.00 | % | | | 1.00 | % |
Ratio of net investment income to average net assets: | | | | | | | | | | | | | | | | | | | | |
| Before fees waived and expenses absorbed | | | 1.50 | % | | | 0.59 | %3 | | | 0.47 | % | | | 0.18 | % | | | (0.33 | )% |
| After fees waived and expenses absorbed | | | 1.78 | % | | | 1.03 | % | | | 1.36 | % | | | 1.56 | % | | | 1.60 | % |
Portfolio turnover rate | | | 179 | % | | | 28 | % | | | 18 | % | | | 15 | % | | | 30 | % |
| | 1 | Based on average shares outstanding for the period. |
| | 2 | Total returns would have been lower had expenses not been waived by the Advisor. Returns shown do not reflect the deduction of taxes that a shareholder would pay on Fund distributions or the redemption of Fund shares. |
| | 3 | Ratios exclude the 12b-1 refund. |
| | 4 | Effective January 11, 2022, the expense cap decreased from 1.00% to 0.97%. |
See accompanying Notes to Financial Statements.
North Square Tactical Growth Fund
FINANCIAL HIGHLIGHTS
Class A
Per share operating performance.
For a capital share outstanding throughout each period.
| | | For the Year Ended May 31, | |
| | | 20226 | | | 2021 | | | 2020 | | | 2019 | | | 2018 | |
| Net asset value, beginning of period | | $ | 15.15 | | | $ | 11.81 | | | $ | 11.62 | | | $ | 12.33 | | | $ | 11.03 | |
| Income from Investment Operations: | | | | | | | | | | | | | | | | | | | | |
Net investment income (loss)1,2 | | | (0.03 | ) | | | (0.09 | ) | | | 0.05 | | | | (0.01 | ) | | | (0.01 | ) |
| Net realized and unrealized gain (loss) | | | (0.80 | ) | | | 3.43 | | | | 0.72 | | | | (0.40 | ) | | | 1.31 | |
| Total from investment operations | | | (0.83 | ) | | | 3.34 | | | | 0.77 | | | | (0.41 | ) | | | 1.30 | |
| Less Distributions: | | | | | | | | | | | | | | | | | | | | |
| From net investment income | | | — | | | | — | | | | (0.06 | ) | | | — | | | | (0.00 | )4 |
| From net realized gain | | | (0.73 | ) | | | — | | | | (0.52 | ) | | | (0.30 | ) | | | — | |
| Total distributions | | | (0.73 | ) | | | — | | | | (0.58 | ) | | | (0.30 | ) | | | — | |
| Net asset value, end of period | | $ | 13.59 | | | $ | 15.15 | | | $ | 11.81 | | | $ | 11.62 | | | $ | 12.33 | |
Total return3 | | | (5.93 | )% | | | 28.28 | % | | | 6.53 | % | | | (3.22 | )% | | | 11.80 | % |
| Ratios and Supplemental Data: | | | | | | | | | | | | | | | | | | | | |
Net assets, end of period (in thousands) | | $ | 92,843 | | | $ | 97,180 | | | $ | 81,511 | | | $ | 85,250 | | | $ | 109,707 | |
Ratio of expenses to average net assets: | | | | | | | | | | | | | | | | | | | | |
Before fees waived and expenses absorbed5 | | | 1.61 | % | | | 1.55 | % | | | 1.56 | % | | | 1.57 | % | | | 1.61 | % |
After fees waived and expenses absorbed5 | | | 1.55 | % | | | 1.55 | % | | | 1.55 | % | | | 1.55 | % | | | 1.55 | % |
Ratio of net investment income (loss) to average net assets: | | | | | | | | | | | | | | | | | | | | |
Before fees waived and expenses absorbed2 | | | (0.27 | )% | | | (0.70 | )% | | | 0.39 | % | | | (0.07 | )% | | | (0.15 | )% |
After fees waived and expenses absorbed2 | | | (0.21 | )% | | | (0.70 | )% | | | 0.40 | % | | | (0.05 | )% | | | (0.09 | )% |
Portfolio turnover rate | | | 67 | % | | | 79 | % | | | 128 | % | | | 120 | % | | | 82 | % |
| | 1 | Based on average shares outstanding for the period. |
| | 2 | Recognition of net investment income (loss) by the Fund is affected by the timing of the declaration of dividends by the underlying investment companies in which the Fund invested. |
| | 3 | Total returns would have been lower had expenses not been waived by the Advisor. Returns shown do not reflect the deduction of taxes that a shareholder would pay on Fund distributions or the redemption of Fund shares. |
| | 4 | Amount represents less than $0.005 per share. |
| | 5 | Does not include expenses of investment companies in which the Fund invests. |
| | 6 | Effective June 11, 2021 the Stadion Tactical Growth Fund Class A converted to the North Square Tactical Growth Fund Class A. See Note 1. |
See accompanying Notes to Financial Statements.
North Square Tactical Growth Fund
FINANCIAL HIGHLIGHTS
Class C
Per share operating performance.
For a capital share outstanding throughout each period.
| | | For the Year Ended May 31, | |
| | | 20226 | | | 2021 | | | 2020 | | | 2019 | | | 2018 | |
| Net asset value, beginning of period | | $ | 14.30 | | | $ | 11.24 | | | $ | 11.14 | | | $ | 11.92 | | | $ | 10.74 | |
| Income from Investment Operations: | | | | | | | | | | | | | | | | | | | | |
Net investment loss1,2 | | | (0.13 | ) | | | (0.19 | ) | | | (0.04 | )4 | | | (0.10 | )4 | | | (0.10 | ) |
| Net realized and unrealized gain (loss) | | | (0.75 | ) | | | 3.25 | | | | 0.69 | | | | (0.38 | ) | | | 1.28 | |
| Total from investment operations | | | (0.88 | ) | | | 3.06 | | | | 0.65 | | | | (0.48 | ) | | | 1.18 | |
| Less Distributions: | | | | | | | | | | | | | | | | | | | | |
| From net investment income | | | — | | | | — | | | | (0.03 | ) | | | — | | | | — | |
| From net realized gain | | | (0.73 | ) | | | — | | | | (0.52 | ) | | | (0.30 | ) | | | — | |
| Total distributions | | | (0.73 | ) | | | — | | | | (0.55 | ) | | | (0.30 | ) | | | — | |
| Net asset value, end of period | | $ | 12.69 | | | $ | 14.30 | | | $ | 11.24 | | | $ | 11.14 | | | $ | 11.92 | |
Total return3 | | | (6.61 | )% | | | 27.22 | % | | | 5.73 | % | | | (3.92 | )% | | | 10.99 | % |
| Ratios and Supplemental Data: | | | | | | | | | | | | | | | | | | | | |
Net assets, end of period (in thousands) | | $ | 84,867 | | | $ | 106,291 | | | $ | 95,291 | | | $ | 104,812 | | | $ | 99,286 | |
Ratio of expenses to average net assets: | | | | | | | | | | | | | | | | | | | | |
Before fees waived and expenses absorbed5 | | | 2.37 | % | | | 2.31 | % | | | 2.33 | % | | | 2.32 | % | | | 2.35 | % |
After fees waived and expenses absorbed5 | | | 2.30 | % | | | 2.30 | % | | | 2.30 | % | | | 2.30 | % | | | 2.30 | % |
Ratio of net investment loss to average net assets: | | | | | | | | | | | | | | | | | | | | |
Before fees waived and expenses absorbed2 | | | (1.02 | )% | | | (1.46 | )% | | | (0.36 | )% | | | (0.85 | )% | | | (0.88 | )% |
After fees waived and expenses absorbed2 | | | (0.95 | )% | | | (1.45 | )% | | | (0.33 | )% | | | (0.83 | )% | | | (0.83 | )% |
Portfolio turnover rate | | | 67 | % | | | 79 | % | | | 128 | % | | | 120 | % | | | 82 | % |
| | 1 | Based on average shares outstanding for the period. |
| | 2 | Recognition of net investment income (loss) by the Fund is affected by the timing of the declaration of dividends by the underlying investment companies in which the Fund invested. |
| | 3 | Total returns would have been lower had expenses not been waived by the Advisor. Returns shown do not reflect the deduction of taxes that a shareholder would pay on Fund distributions or the redemption of Fund shares. |
| | 4 | The amount shown for a share outstanding throughout the year may not correlate with the Statement of Operations for the year due to the timing of sales and redemptions of Fund shares in relation to income earned, class specific expense structure, and/or fluctuating market value of the investments of the Fund. |
| | 5 | Does not include expenses of investment companies in which the Fund invests. |
| | 6 | Effective June 11, 2021 the Stadion Tactical Growth Fund Class C converted to the North Square Tactical Growth Fund Class C. See Note 1. |
See accompanying Notes to Financial Statements.
North Square Tactical Growth Fund
FINANCIAL HIGHLIGHTS
Class I
Per share operating performance.
For a capital share outstanding throughout each period.
| | | For the Year Ended May 31, | |
| | | 20227 | | | 2021 | | | 2020 | | | 2019 | | | 2018 | |
| Net asset value, beginning of period | | $ | 15.42 | | | $ | 12.00 | | | $ | 11.77 | | | $ | 12.46 | | | $ | 11.12 | |
| Income from Investment Operations: | | | | | | | | | | | | | | | | | | | | |
Net investment income (loss)1,2 | | | 0.01 | | | | (0.06 | ) | | | 0.08 | | | | 0.02 | 5 | | | 0.02 | 5 |
| Net realized and unrealized gain (loss) | | | (0.83 | ) | �� | | 3.48 | | | | 0.74 | | | | (0.41 | ) | | | 1.32 | |
| Total from investment operations | | | (0.82 | ) | | | 3.42 | | | | 0.82 | | | | (0.39 | ) | | | 1.34 | |
| Less Distributions: | | | | | | | | | | | | | | | | | | | | |
| From net investment income | | | — | | | | (0.00 | )4 | | | (0.07 | ) | | | — | | | | (0.00 | )4 |
| From net realized gain | | | (0.73 | ) | | | — | | | | (0.52 | ) | | | (0.30 | ) | | | — | |
| Total distributions | | | (0.73 | ) | | | — | | | | (0.59 | ) | | | (0.30 | ) | | | — | |
| Net asset value, end of period | | $ | 13.87 | | | $ | 15.42 | | | $ | 12.00 | | | $ | 11.77 | | | $ | 12.46 | |
Total return3 | | | (5.71 | )% | | | 28.53 | % | | | 6.88 | % | | | (3.02 | )% | | | 12.09 | % |
| Ratios and Supplemental Data: | | | | | | | | | | | | | | | | | | | | |
Net assets, end of period (in thousands) | | $ | 344,653 | | | $ | 391,964 | | | $ | 314,646 | | | $ | 337,265 | | | $ | 238,052 | |
Ratio of expenses to average net assets: | | | | | | | | | | | | | | | | | | | | |
Before fees waived and expenses absorbed6 | | | 1.38 | % | | | 1.33 | % | | | 1.34 | % | | | 1.33 | % | | | 1.36 | % |
After fees waived and expenses absorbed6 | | | 1.30 | % | | | 1.30 | % | | | 1.30 | % | | | 1.30 | % | | | 1.30 | % |
Ratio of net investment income (loss) to average net assets: | | | | | | | | | | | | | | | | | | | | |
Before fees waived and expenses absorbed2 | | | (0.03 | )% | | | (0.48 | )% | | | 0.62 | % | | | 0.13 | % | | | 0.07 | % |
After fees waived and expenses absorbed2 | | | 0.05 | % | | | (0.45 | )% | | | 0.66 | % | | | 0.16 | % | | | 0.13 | % |
Portfolio turnover rate | | | 67 | % | | | 79 | % | | | 128 | % | | | 120 | % | | | 82 | % |
| | 1 | Based on average shares outstanding for the period. |
| | 2 | Recognition of net investment income (loss) by the Fund is affected by the timing of the declaration of dividends by the underlying investment companies in which the Fund invested. |
| | 3 | Total returns would have been lower had expenses not been waived by the Advisor. Returns shown do not reflect the deduction of taxes that a shareholder would pay on Fund distributions or the redemption of Fund shares. |
| | 4 | Amount represents less than $0.005 per share. |
| | 5 | The amount shown for a share outstanding throughout the year may not correlate with the Statement of Operations for the year due to the timing of sales and redemptions of Fund shares in relation to income earned, class specific expense structure, and/or fluctuating market value of the investments of the Fund. |
| | 6 | Does not include expenses of investment companies in which the Fund invests. |
| | 7 | Effective June 11, 2021 the Stadion Tactical Growth Fund Class I converted to the North Square Tactical Growth Fund Class I. See Note 1. |
See accompanying Notes to Financial Statements.
North Square Tactical Defensive Fund
FINANCIAL HIGHLIGHTS
Class A
Per share operating performance.
For a capital share outstanding throughout each period.
| | | For the Year Ended May 31, | |
| | | 20225 | | | 2021 | | | 2020 | | | 2019 | | | 2018 | |
| Net asset value, beginning of period | | $ | 16.00 | | | $ | 12.41 | | | $ | 13.52 | | | $ | 13.26 | | | $ | 12.58 | |
| Income from Investment Operations: | | | | | | | | | | | | | | | | | | | | |
Net investment income (loss)1,2 | | | (0.11 | ) | | | (0.10 | ) | | | 0.07 | | | | 0.03 | | | | (0.03 | ) |
| Net realized and unrealized gain (loss) | | | 0.16 | | | | 3.69 | | | | (1.12 | ) | | | 0.23 | | | | 1.01 | |
| Total from investment operations | | | 0.05 | | | | 3.59 | | | | (1.05 | ) | | | 0.26 | | | | 0.98 | |
| Less Distributions: | | | | | | | | | | | | | | | | | | | | |
| From net investment income | | | — | | | | — | | | | (0.06 | ) | | | — | | | | (0.02 | ) |
| From net realized gain | | | — | | | | — | | | | — | | | | — | | | | (0.28 | ) |
| Total distributions | | | — | | | | — | | | | (0.06 | ) | | | — | | | | (0.30 | ) |
| Net asset value, end of period | | $ | 16.05 | | | $ | 16.00 | | | $ | 12.41 | | | $ | 13.52 | | | $ | 13.26 | |
Total return3 | | | 0.30 | % | | | 28.93 | % | | | (7.85 | )% | | | 1.96 | % | | | 7.77 | % |
| Ratios and Supplemental Data: | | | | | | | | | | | | | | | | | | | | |
Net assets, end of period (in thousands) | | $ | 23,392 | | | $ | 21,542 | | | $ | 18,526 | | | $ | 24,231 | | | $ | 47,888 | |
Ratio of expenses to average net assets: | | | | | | | | | | | | | | | | | | | | |
Before fees waived and expenses absorbed4 | | | 1.86 | % | | | 1.87 | % | | | 1.85 | % | | | 1.84 | % | | | 1.85 | % |
After fees waived and expenses absorbed4 | | | 1.86 | % | | | 1.87 | % | | | 1.85 | % | | | 1.84 | % | | | 1.85 | % |
Ratio of net investment income (loss) to average net assets: | | | | | | | | | | | | | | | | | | | | |
Before fees waived and expenses absorbed2 | | | (0.65 | )% | | | (0.71 | )% | | | 0.47 | % | | | 0.26 | % | | | (0.23 | )% |
After fees waived and expenses absorbed2 | | | (0.65 | )% | | | (0.71 | )% | | | 0.47 | % | | | 0.26 | % | | | (0.23 | )% |
Portfolio turnover rate | | | 289 | % | | | 350 | % | | | 522 | % | | | 396 | % | | | 335 | % |
| | 1 | Based on average shares outstanding for the period. |
| | 2 | Recognition of net investment income (loss) by the Fund is affected by the timing of the declaration of dividends by the underlying investment companies in which the Fund invested. |
| | 3 | Total return is a measure of the change in value of an investment in the Fund over the years covered, which assumes any dividends or capital gains distributions are reinvested in shares of the Fund. The returns shown do not reflect the deduction of taxes a shareholder would pay on Fund distributions or the redemption of Fund shares. |
| | 4 | Does not include expenses of investment companies in which the Fund invests. |
| | 5 | Effective June 11, 2021 the Stadion Tactical Defensive Fund Class A converted to the North Square Tactical Defensive Fund Class A. See Note 1. |
See accompanying Notes to Financial Statements.
North Square Tactical Defensive Fund
FINANCIAL HIGHLIGHTS
Class C
Per share operating performance.
For a capital share outstanding throughout each period.
| | | For the Year Ended May 31, | |
| | | 20226 | | | 2021 | | | 2020 | | | 2019 | | | 2018 | |
| Net asset value, beginning of period | | $ | 14.59 | | | $ | 11.40 | | | $ | 12.51 | | | $ | 12.36 | | | $ | 11.81 | |
| Income from Investment Operations: | | | | | | | | | | | | | | | | | | | | |
Net investment loss1,2 | | | (0.21 | ) | | | (0.19 | ) | | | (0.03 | )4 | | | (0.08 | )4 | | | (0.12 | ) |
| Net realized and unrealized gain (loss) | | | 0.14 | | | | 3.38 | | | | (1.03 | ) | | | 0.23 | | | | 0.95 | |
| Total from investment operations | | | (0.07 | ) | | | 3.19 | | | | (1.06 | ) | | | 0.15 | | | | 0.83 | |
| Less Distributions: | | | | | | | | | | | | | | | | | | | | |
| From net investment income | | | — | | | | — | | | | (0.05 | ) | | | — | | | | (0.28 | ) |
| From net realized gain | | | — | | | | — | | | | — | | | | — | | | | — | |
| Total distributions | | | — | | | | — | | | | (0.05 | ) | | | — | | | | (0.28 | ) |
| Net asset value, end of period | | $ | 14.52 | | | $ | 14.59 | | | $ | 11.40 | | | $ | 12.51 | | | $ | 12.36 | |
Total return3 | | | (0.49 | )% | | | 27.98 | % | | | (8.54 | )% | | | 1.21 | % | | | 6.97 | % |
| Ratios and Supplemental Data: | | | | | | | | | | | | | | | | | | | | |
Net assets, end of period (in thousands) | | $ | 7,265 | | | $ | 11,711 | | | $ | 13,586 | | | $ | 19,151 | | | $ | 23,178 | |
Ratio of expenses to average net assets: | | | | | | | | | | | | | | | | | | | | |
Before fees waived and expenses absorbed5 | | | 2.62 | % | | | 2.62 | % | | | 2.61 | % | | | 2.59 | % | | | 2.59 | % |
After fees waived and expenses absorbed5 | | | 2.62 | % | | | 2.62 | % | | | 2.61 | % | | | 2.59 | % | | | 2.59 | % |
Ratio of net investment loss to average net assets: | | | | | | | | | | | | | | | | | | | | |
Before fees waived and expenses absorbed2 | | | (1.37 | )% | | | (1.42 | )% | | | (0.24 | )% | | | (0.64 | )% | | | (0.97 | )% |
After fees waived and expenses absorbed2 | | | (1.37 | )% | | | (1.42 | )% | | | (0.24 | )% | | | (0.64 | )% | | | (0.97 | )% |
Portfolio turnover rate | | | 289 | % | | | 350 | % | | | 522 | % | | | 396 | % | | | 335 | % |
| | 1 | Based on average shares outstanding for the period. |
| | 2 | Recognition of net investment income (loss) by the Fund is affected by the timing of the declaration of dividends by the underlying investment companies in which the Fund invested. |
| | 3 | Total returns would have been lower had expenses not been waived by the Advisor. Returns shown do not reflect the deduction of taxes that a shareholder would pay on Fund distributions or the redemption of Fund shares. |
| | 4 | The amount shown for a share outstanding throughout the year may not correlate with the Statement of Operations for the year due to the timing of sales and redemptions of Fund shares in relation to income earned, class specific expense structure, and/or fluctuating market value of the investments of the Fund. |
| | 5 | Does not include expenses of investment companies in which the Fund invests. |
| | 6 | Effective June 11, 2021 the Stadion Tactical Defensive Fund Class C converted to the North Square Tactical Defensive Fund Class C. See Note 1. |
See accompanying Notes to Financial Statements.
North Square Tactical Defensive Fund
FINANCIAL HIGHLIGHTS
Class I
Per share operating performance.
For a capital share outstanding throughout each period.
| | | For the Year Ended May 31, | |
| | | 20226 | | | 2021 | | | 2020 | | | 2019 | | | 2018 | |
| Net asset value, beginning of period | | $ | 16.39 | | | $ | 12.69 | | | $ | 13.79 | | | $ | 13.50 | | | $ | 12.78 | |
| Income from Investment Operations: | | | | | | | | | | | | | | | | | | | | |
Net investment income (loss)1,2 | | | (0.07 | ) | | | (0.07 | ) | | | 0.09 | | | | 0.03 | | | | (0.00 | )4 |
| Net realized and unrealized gain (loss) | | | 0.15 | | | | 3.77 | | | | (1.13 | ) | | | 0.26 | | | | 1.03 | |
| Total from investment operations | | | 0.08 | | | | 3.70 | | | | (1.04 | ) | | | 0.29 | | | | 1.03 | |
| Less Distributions: | | | | | | | | | | | | | | | | | | | | |
| From net investment income | | | — | | | | — | | | | (0.06 | ) | | | — | | | | (0.03 | ) |
| From net realized gain | | | — | | | | — | | | | — | | | | — | | | | (0.28 | ) |
| Total distributions | | | — | | | | — | | | | (0.06 | ) | | | — | | | | (0.31 | ) |
| Net asset value, end of period | | $ | 16.47 | | | $ | 16.39 | | | $ | 12.69 | | | $ | 13.79 | | | $ | 13.50 | |
Total return3 | | | 0.46 | % | | | 29.16 | % | | | (7.61 | )% | | | 2.15 | % | | | 8.03 | % |
| Ratios and Supplemental Data: | | | | | | | | | | | | | | | | | | | | |
Net assets, end of period (in thousands) | | $ | 42,354 | | | $ | 44,999 | | | $ | 46,311 | | | $ | 54,684 | | | $ | 28,953 | |
Ratio of expenses to average net assets: | | | | | | | | | | | | | | | | | | | | |
Before fees waived and expenses absorbed5 | | | 1.66 | % | | | 1.68 | % | | | 1.66 | % | | | 1.64 | % | | | 1.62 | % |
After fees waived and expenses absorbed5 | | | 1.66 | % | | | 1.68 | % | | | 1.66 | % | | | 1.64 | % | | | 1.62 | % |
Ratio of net investment income (loss) to average net assets: | | | | | | | | | | | | | | | | | | | | |
Before fees waived and expenses absorbed2 | | | (0.44 | )% | | | (0.50 | )% | | | 0.65 | % | | | 0.21 | % | | | (0.01 | )% |
After fees waived and expenses absorbed2 | | | (0.44 | )% | | | (0.50 | )% | | | 0.65 | % | | | 0.21 | % | | | (0.01 | )% |
Portfolio turnover rate | | | 289 | % | | | 350 | % | | | 522 | % | | | 396 | % | | | 335 | % |
| | 1 | Based on average shares outstanding for the period. |
| | 2 | Recognition of net investment income (loss) by the Fund is affected by the timing of the declaration of dividends by the underlying investment companies in which the Fund invested. |
| | 3 | Total returns would have been lower had expenses not been waived by the Advisor. Returns shown do not reflect the deduction of taxes that a shareholder would pay on Fund distributions or the redemption of Fund shares. |
| | 4 | Amount represents less than $0.005 per share. |
| | 5 | Does not include expenses of investment companies in which the Fund invests. |
| | 6 | Effective June 11, 2021 the Stadion Tactical Defensive Fund Class I converted to the North Square Tactical Defensive Fund Class I. See Note 1. |
See accompanying Notes to Financial Statements.
North Square Trilogy Alternative Return Fund
FINANCIAL HIGHLIGHTS
Class A
Per share operating performance.
For a capital share outstanding throughout each period.
| | | For the Year Ended May 31, | |
| | | 20226 | | | 2021 | | | 2020 | | | 2019 | | | 2018 | |
| Net asset value, beginning of period | | $ | 11.67 | | | $ | 10.72 | | | $ | 10.37 | | | $ | 10.94 | | | $ | 11.17 | |
| Income from Investment Operations: | | | | | | | | | | | | | | | | | | | | |
Net investment income1,2 | | | 0.02 | | | | 0.06 | | | | 0.13 | | | | 0.17 | | | | 0.11 | |
| Net realized and unrealized gain (loss) | | | (0.68 | ) | | | 0.98 | | | | 0.39 | | | | (0.62 | ) | | | (0.22 | ) |
| Total from investment operations | | | (0.66 | ) | | | 1.04 | | | | 0.52 | | | | (0.45 | ) | | | (0.11 | ) |
| Less Distributions: | | | | | | | | | | | | | | | | | | | | |
| From net investment income | | | (0.02 | ) | | | (0.08 | ) | | | (0.17 | ) | | | (0.12 | ) | | | (0.12 | ) |
| From net realized gain | | | — | | | | (0.01 | ) | | | — | | | | — | | | | — | |
| Total distributions | | | (0.02 | ) | | | (0.09 | ) | | | (0.17 | ) | | | (0.12 | ) | | | (0.12 | ) |
| Net asset value, end of period | | $ | 10.99 | | | $ | 11.67 | | | $ | 10.72 | | | $ | 10.37 | | | $ | 10.94 | |
Total return3 | | | (5.69 | )% | | | 9.74 | % | | | 5.04 | % | | | (4.13 | )% | | | (1.02 | )% |
| Ratios and Supplemental Data: | | | | | | | | | | | | | | | | | | | | |
Net assets, end of period (in thousands) | | $ | 2,224 | | | $ | 2,708 | | | $ | 2,659 | | | $ | 4,733 | | | $ | 23,289 | |
Ratio of expenses to average net assets: | | | | | | | | | | | | | | | | | | | | |
Before fees waived and expenses absorbed5 | | | 1.87 | % | | | 1.97 | % | | | 1.89 | % | | | 1.94 | % | | | 1.84 | % |
After fees waived and expenses absorbed5 | | | 1.63 | % | | | 1.63 | % | | | 1.63 | % | | | 1.63 | % | | | 1.72 | %4 |
Ratio of net investment income to average net assets: | | | | | | | | | | | | | | | | | | | | |
Before fees waived and expenses absorbed2 | | | (0.06 | )% | | | 0.22 | % | | | 0.95 | % | | | 1.27 | % | | | 0.90 | % |
After fees waived and expenses absorbed2 | | | 0.18 | % | | | 0.56 | % | | | 1.21 | % | | | 1.58 | % | | | 1.02 | % |
Portfolio turnover rate | | | 16 | % | | | 11 | % | | | 21 | % | | | 5 | % | | | 55 | % |
| | 1 | Based on average shares outstanding for the period. |
| | 2 | Recognition of net investment income (loss) by the Fund is affected by the timing of the declaration of dividends by the underlying investment companies in which the Fund invested. |
| | 3 | Total returns would have been lower had expenses not been waived by the Advisor. Returns shown do not reflect the deduction of taxes that a shareholder would pay on Fund distributions or the redemption of Fund shares. |
| | 4 | Effective December 31, 2017, the Expense Limitation changed from 1.70% to 1.38% (exclusive of interest, taxes, brokerage commissions, extraordinary expenses, Acquired Fund Fees and Expenses and payments, if any, under the Rule 12b-1 Plan). |
| | 5 | Does not include expenses of investment companies in which the Fund invests. |
| | 6 | Effective June 11, 2021 the Stadion Trilogy Alternative Return Fund Class A converted to the North Square Trilogy Alternative Return Fund Class A. See Note 1. |
See accompanying Notes to Financial Statements.
North Square Trilogy Alternative Return Fund
FINANCIAL HIGHLIGHTS
Class C
Per share operating performance.
For a capital share outstanding throughout each period.
| | | For the Year Ended May 31, | |
| | | 20227 | | | 2021 | | | 2020 | | | 2019 | | | 2018 | |
| Net asset value, beginning of period | | $ | 11.38 | | | $ | 10.47 | | | $ | 10.14 | | | $ | 10.73 | | | $ | 10.95 | |
| Income from Investment Operations: | | | | | | | | | | | | | | | | | | | | |
Net investment income (loss)1,2 | | | (0.06 | ) | | | (0.02 | ) | | | 0.04 | | | | 0.07 | | | | 0.03 | |
| Net realized and unrealized gain (loss) | | | (0.67 | ) | | | 0.96 | | | | 0.40 | | | | (0.59 | ) | | | (0.22 | ) |
| Total from investment operations | | | (0.73 | ) | | | 0.94 | | | | 0.44 | | | | (0.52 | ) | | | (0.19 | ) |
| Less Distributions: | | | | | | | | | | | | | | | | | | | | |
| From net investment income | | | — | | | | (0.03 | ) | | | (0.11 | ) | | | (0.07 | ) | | | (0.03 | ) |
| From net realized gain | | | — | | | | (0.00 | )3 | | | — | | | | — | | | | — | |
| Total distributions | | | — | | | | (0.03 | ) | | | (0.11 | ) | | | (0.07 | ) | | | (0.03 | ) |
| Net asset value, end of period | | $ | 10.65 | | | $ | 11.38 | | | $ | 10.47 | | | $ | 10.14 | | | $ | 10.73 | |
Total return4 | | | (6.41 | )% | | | 8.97 | % | | | 4.34 | % | | | (4.84 | )% | | | (1.75 | )% |
| Ratios and Supplemental Data: | | | | | | | | | | | | | | | | | | | | |
Net assets, end of period (in thousands) | | $ | 3,739 | | | $ | 4,789 | | | $ | 5,384 | | | $ | 7,460 | | | $ | 11,660 | |
Ratio of expenses to average net assets: | | | | | | | | | | | | | | | | | | | | |
Before fees waived and expenses absorbed6 | | | 2.65 | % | | | 2.73 | % | | | 2.68 | % | | | 2.63 | % | | | 2.56 | %5 |
After fees waived and expenses absorbed6 | | | 2.38 | % | | | 2.38 | % | | | 2.38 | % | | | 2.38 | % | | | 2.47 | % |
Ratio of net investment income (loss) to average net assets: | | | | | | | | | | | | | | | | | | | | |
Before fees waived and expenses absorbed2 | | | (0.84 | )% | | | (0.52 | )% | | | 0.13 | % | | | 0.43 | % | | | 0.17 | % |
After fees waived and expenses absorbed2 | | | (0.57 | )% | | | (0.17 | )% | | | 0.43 | % | | | 0.68 | % | | | 0.26 | % |
Portfolio turnover rate | | | 16 | % | | | 11 | % | | | 21 | % | | | 5 | % | | | 55 | % |
| | 1 | Based on average shares outstanding for the period. |
| | 2 | Recognition of net investment income (loss) by the Fund is affected by the timing of the declaration of dividends by the underlying investment companies in which the Fund invested. |
| | 3 | Amount represents less than $0.005 per share. |
| | 4 | Total returns would have been lower had expenses not been waived by the Advisor. Returns shown do not reflect the deduction of taxes that a shareholder would pay on Fund distributions or the redemption of Fund shares. |
| | 5 | Effective December 31, 2017, the Expense Limitation changed from 1.70% to 1.38% (exclusive of interest, taxes, brokerage commissions, extraordinary expenses, Acquired Fund Fees and Expenses and payments, if any, under the Rule 12b-1 Plan). |
| | 6 | Does not include expenses of investment companies in which the Fund invests. |
| | 7 | Effective June 11, 2021 the Stadion Trilogy Alternative Return Fund Class C converted to the North Square Trilogy Alternative Return Fund Class C. See Note 1. |
See accompanying Notes to Financial Statements.
North Square Trilogy Alternative Return Fund
FINANCIAL HIGHLIGHTS
Class I
Per share operating performance.
For a capital share outstanding throughout each period.
| | | For the Year Ended May 31, | |
| | | 20226 | | | 2021 | | | 2020 | | | 2019 | | | 2018 | |
| Net asset value, beginning of period | | $ | 11.71 | | | $ | 10.76 | | | $ | 10.40 | | | $ | 10.97 | | | $ | 11.20 | |
| Income from Investment Operations: | | | | | | | | | | | | | | | | | | | | |
Net investment income1,2 | | | 0.05 | | | | 0.09 | | | | 0.15 | | | | 0.18 | | | | 0.14 | |
| Net realized and unrealized gain (loss) | | | (0.68 | ) | | | 0.98 | | | | 0.41 | | | | (0.60 | ) | | | (0.22 | ) |
| Total from investment operations | | | (0.63 | ) | | | 1.07 | | | | 0.56 | | | | (0.42 | ) | | | (0.08 | ) |
| Less Distributions: | | | | | | | | | | | | | | | | | | | | |
| From net investment income | | | (0.03 | ) | | | (0.11 | ) | | | (0.20 | ) | | | (0.15 | ) | | | (0.15 | ) |
| From net realized gain | | | — | | | | (0.01 | ) | | | — | | | | — | | | | — | |
| Total distributions | | | (0.03 | ) | | | (0.12 | ) | | | (0.20 | ) | | | (0.15 | ) | | | (0.15 | ) |
| Net asset value, end of period | | $ | 11.05 | | | $ | 11.71 | | | $ | 10.76 | | | $ | 10.40 | | | $ | 10.97 | |
Total return3 | | | (5.45 | )% | | | 9.98 | % | | | 5.39 | % | | | (3.90 | )% | | | (0.72 | )% |
| Ratios and Supplemental Data: | | | | | | | | | | | | | | | | | | | | |
Net assets, end of period (in thousands) | | $ | 35,788 | | | $ | 39,552 | | | $ | 42,622 | | | $ | 52,330 | | | $ | 67,545 | |
Ratio of expenses to average net assets: | | | | | | | | | | | | | | | | | | | | |
Before fees waived and expenses absorbed5 | | | 1.68 | % | | | 1.79 | % | | | 1.72 | % | | | 1.65 | % | | | 1.57 | %4 |
After fees waived and expenses absorbed5 | | | 1.38 | % | | | 1.38 | % | | | 1.38 | % | | | 1.38 | % | | | 1.47 | % |
Ratio of net investment income to average net assets: | | | | | | | | | | | | | | | | | | | | |
Before fees waived and expenses absorbed2 | | | 0.13 | % | | | 0.43 | % | | | 1.09 | % | | | 1.39 | % | | | 1.15 | % |
After fees waived and expenses absorbed2 | | | 0.43 | % | | | 0.84 | % | | | 1.43 | % | | | 1.66 | % | | | 1.25 | % |
Portfolio turnover rate | | | 16 | % | | | 11 | % | | | 21 | % | | | 5 | % | | | 55 | % |
| | 1 | Based on average shares outstanding for the period. |
| | 2 | Recognition of net investment income (loss) by the Fund is affected by the timing of the declaration of dividends by the underlying investment companies in which the Fund invested. |
| | 3 | Total returns would have been lower had expenses not been waived by the Advisor. Returns shown do not reflect the deduction of taxes that a shareholder would pay on Fund distributions or the redemption of Fund shares. |
| | 4 | Effective December 31, 2017, the Expense Limitation changed from 1.70% to 1.38% (exclusive of interest, taxes, brokerage commissions, extraordinary expenses, Acquired Fund Fees and Expenses and payments, if any, under the Rule 12b-1 Plan). |
| | 5 | Does not include expenses of investment companies in which the Fund invests. |
| | 6 | Effective June 11, 2021 the Stadion Trilogy Alternative Return Fund Class I converted to the North Square Trilogy Alternative Return Fund Class I. See Note 1. |
See accompanying Notes to Financial Statements.
North Square Funds
NOTES TO FINANCIAL STATEMENTS
May 31, 2022
Note 1 – Organization
North Square Spectrum Alpha Fund (formerly, North Square Oak Ridge Small Cap Growth Fund) (“Spectrum Alpha” or “Spectrum Alpha Fund”), North Square Dynamic Small Cap Fund (“Dynamic Small Cap” or “Dynamic Small Cap Fund”), North Square Advisory Research Small Cap Growth Fund (formerly, North Square Oak Ridge All Cap Growth Fund) (“Small Cap Growth” or “Small Cap Growth Fund”), North Square Multi Strategy Fund (“Multi Strategy” or “Multi Strategy Fund”), North Square Preferred and Income Securities Fund (formerly, North Square Oak Ridge Dividend Growth Fund) (“Preferred and Income Securities” or “Preferred and Income Securities Fund”), North Square Tactical Growth Fund (“Tactical Growth” or “Tactical Growth Fund”), North Square Tactical Defensive Fund (“Tactical Defensive” or “Tactical Defensive Fund”) and North Square Trilogy Alternative Return Fund (“Trilogy Alternative Return” or “Trilogy Alternative Return Fund”) are organized as a series of North Square Investments Trust, a Delaware statutory trust (the “Trust”) which is registered as an open-end management investment company under the Investment Company Act of 1940, as amended (the “1940 Act”). Effective January 11, 2022, the North Square Oak Ridge Small Cap Growth Fund, North Square Oak Ridge All Cap Growth Fund, and North Square Dividend Growth Fund changed names to the North Square Spectrum Alpha Fund, North Square Advisory Research Small Cap Growth Fund, and North Square Preferred and Income Securities Fund, respectively. The Spectrum Alpha Fund, Dynamic Small Cap Fund, Small Cap Growth Fund, Multi Strategy Fund, Preferred and Income Securities Fund, Tactical Growth Fund, Tactical Defensive Fund, and Trilogy Alternative Return Fund are diversified Funds.
The Spectrum Alpha Fund’s primary investment objective is to provide capital appreciation. Effective the close of business on May 10, 2019, the Spectrum Alpha Fund acquired all the assets and assumed the liabilities of the Oak Ridge Small Cap Growth Fund (the “Predecessor Fund”), a series of Investment Managers Series Trust.
The Dynamic Small Cap Fund’s primary investment objective is long-term capital appreciation. Effective the close of business on May 10, 2019, the Dynamic Small Cap Fund acquired all the assets and assumed the liabilities of the Oak Ridge Dynamic Small Cap Fund (the “Predecessor Fund”), a series of Investment Managers Series Trust.
The Small Cap Growth Fund’s primary investment objective is long-term growth of capital. Effective the close of business on May 10, 2019, the Small Cap Growth Fund acquired all the assets and assumed the liabilities of the Oak Ridge All Cap Growth Fund (the “Predecessor Fund”), a series of Investment Managers Series Trust.
The Multi Strategy Fund’s primary investment objective is to provide capital appreciation. Effective the close of business on May 10, 2019, the Multi Strategy Fund acquired all the assets and assumed the liabilities of the Oak Ridge Multi Strategy Fund (the “Predecessor Fund”), a series of Investment Managers Series Trust.
The Preferred and Income Securities Fund’s primary investment objective is to seek total return through current income and capital appreciation. Effective the close of business on May 10, 2019, the Preferred and Income Securities Fund acquired all the assets and assumed the liabilities of the Oak Ridge Dividend Growth Fund (the “Predecessor Fund”), a series of Investment Managers Series Trust.
The Tactical Growth Fund’s primary investment objective is to seek long-term capital appreciation. Effective the close of business on June 11, 2021, the Tactical Growth Fund acquired all the assets and assumed the liabilities of the Stadion Tactical Growth Fund (the “Predecessor Fund”), a series of Stadion Investment Trust.
The Tactical Defensive Fund’s primary investment objective is to seek capital appreciation. Effective the close of business on June 11, 2021, the Tactical Defensive Fund acquired all the assets and assumed the liabilities of the Stadion Tactical Defensive Fund (the “Predecessor Fund”), a series of Stadion Investment Trust.
The Trilogy Alternative Return Fund’s primary investment objective is total return, with an emphasis on lower risk and volatility than the U.S. equity markets. Effective the close of business on June 11, 2021, the Trilogy Alternative Return Fund acquired all the assets and assumed the liabilities of the Stadion Trilogy Alternative Return Fund (the “Predecessor Fund”), a series of Stadion Investment Trust.
North Square Funds
NOTES TO FINANCIAL STATEMENTS – Continued
May 31, 2022
Each conversion was accomplished by the following tax free reorganizations in which each shareholder of the Predecessor Funds received the same aggregated net asset value of their respective Successor Fund as noted below:
| | | | | | | | | | | | Net Unrealized | |
| | | Total | | | Net | | | Net Asset | | | Appreciation | |
| | | Shares | | | Assets | | | Value/Share | | | (Depreciation) | |
| Stadion Tactical Growth Fund | | | | | | | | | | | $ | 173,770,153 | |
Class A | | | 6,410,929 | | | $ | 98,495,889 | | | $ | 15.36 | | | | | |
Class C | | | 7,384,538 | | | $ | 107,093,155 | | | $ | 14.50 | | | | | |
Class I | | | 25,418,887 | | | $ | 397,484,447 | | | $ | 15.64 | | | | | |
| | | | | | | | | | | | | | | | | |
| Stadion Tactical Defensive Fund | | | | | | | | | | | | | | $ | 12,576,951 | |
Class A | | | 1,345,411 | | | $ | 21,823,219 | | | $ | 16.22 | | | | | |
Class C | | | 794,041 | | | $ | 11,739,144 | | | $ | 14.78 | | | | | |
Class I | | | 2,749,540 | | | $ | 45,670,322 | | | $ | 16.61 | | | | | |
| | | | | | | | | | | | | | | | | |
| Stadion Trilogy Alternative Return Fund | | | | | | | | | | | | | | $ | 9,527,252 | |
Class A | | | 229,959 | | | $ | 2,694,917 | | | $ | 11.72 | | | | | |
Class C | | | 420,246 | | | $ | 4,797,827 | | | $ | 11.42 | | | | | |
Class I | | | 3,377,631 | | | $ | 39,717,420 | | | $ | 11.76 | | | | | |
The shares of each class represent an interest in the same portfolio of investments of the Fund and have equal rights as to voting, redemptions, dividends and liquidation, subject to the approval of the Trustees. Income, expenses (other than expenses attributable to a specific class) and realized and unrealized gains and losses on investments are allocated to each class of shares in proportion to their relative shares outstanding. Shareholders of a class that bears distribution and service expenses under the terms of a distribution plan have exclusive voting rights to that distribution plan.
Each Fund is an investment company and accordingly follows the investment company accounting and reporting guidance of the Financial Accounting Standards Board (FASB) Accounting Standard Codification Topic 946 “Financial Services—Investment Companies”.
Note 2 – Accounting Policies
The following is a summary of the significant accounting policies consistently followed by the Funds in the preparation of their financial statements. The preparation of financial statements in conformity with accounting principles generally accepted in the United States of America (“GAAP”) requires management to make estimates and assumptions that affect the reported amounts and disclosures in the financial statements. Actual results could differ from these estimates.
(a) Valuation of Investments
Each Fund values equity securities at the last reported sale price on the principal exchange or in the principal over the counter (“OTC”) market in which such securities are traded, as of the close of regular trading on the NYSE on the day the securities are being valued or, if the last-quoted sales price is not readily available, the securities will be valued at the last bid or the mean between the last available bid and ask price. Securities traded on the NASDAQ are valued at the NASDAQ Official Closing Price (“NOCP”). Investments in open-end investment companies are valued at the daily closing net asset value of the respective investment company. Debt securities are valued by utilizing a price supplied by independent pricing service providers. The independent pricing service providers may use various valuation methodologies including matrix pricing and other analytical pricing models as well as market transactions and dealer quotations. These models generally consider such factors as yields or prices of bonds of comparable quality, type of issue, coupon, maturity, ratings and general market conditions. If a price is not readily available for a portfolio security, the security will be valued at fair value (the amount which the Fund might reasonably expect to receive for the security upon its current sale) as determined in good faith by the Fund’s advisor, subject to review and approval by the Valuation Committee, pursuant to procedures adopted by the Board of Trustees. The actions of the Valuation Committee are subsequently reviewed by the Board at its next regularly scheduled board meeting. The Valuation Committee meets as needed.
Fair value pricing may be applied to foreign securities held by the Funds upon the occurrence of an event after the close of trading on non-U.S. markets but before the close of trading on the NYSE when each Fund’s NAV is determined. If the event may result in a material adjustment to the price of the Fund’s foreign securities once non-U.S. markets open on the following business day (such as, for example, a significant surge or decline in the U.S. market), the Fund may value such foreign securities at fair value, taking into account the effect of such event, in order to calculate the Fund’s NAV. Other types of portfolio securities that the Fund may fair value include, but are not limited to: (1) investments that are illiquid or traded infrequently, including “restricted” securities and private placements for which there is no public market; (2) investments for which, in the judgment of the advisor, the market price is stale; (3) securities of an issuer that has entered into a restructuring; (4) securities for which trading has been halted or suspended; and (5) fixed income securities for which there is not a current market value quotation.
North Square Funds
NOTES TO FINANCIAL STATEMENTS – Continued
May 31, 2022
The global outbreak of COVID-19 (commonly referred to as “coronavirus”) has disrupted economic markets and the prolonged economic impact is uncertain. The ultimate economic fallout from the pandemic, and the long-term impact on economies, markets, industries and individual issuers, are not known. The operational and financial performance of the issuers of securities in which the Funds invest depends on future developments, including the duration and spread of the outbreak, and such uncertainty may in turn adversely affect the value and liquidity of the Funds’ investments, impair the Funds’ ability to satisfy redemption requests, and negatively impact the Funds’ performance.
(b) Deposits with Broker
When trading derivative instruments, such as forward or futures contracts, the Funds are only required to post initial or variation margin with the exchange or clearing broker. The use of margin in trading these instruments has the effect of creating leverage, which can expose the Funds to substantial gains or losses occurring from relatively small price changes in the value of the underlying instrument and can increase the volatility of the Funds’ returns. Volatility is a statistical measure of the dispersion of returns of an investment, where higher volatility generally indicates greater risk.
Upon entering into a futures contract (with the exception of futures contracts traded on the London Metal Exchange (“LME”)), and to maintain the Funds’ open positions in futures contracts, the Fund would be required to deposit with its custodian or futures broker in a segregated account in the name of the futures broker an amount of cash, U.S. government securities, suitable money market instruments, or other liquid securities, known as “initial margin.” The margin required for a particular futures contract is set by the exchange on which the contract is traded, and may be significantly modified from time to time by the exchange during the term of the contract. Futures contracts are customarily purchased and sold on margins that may range upward from less than 5% of the value of the contract being traded.
At May 31, 2022, the North Square Trilogy Alternative Return Fund had $111,711 cash and cash equivalents on deposit with Interactive Brokers, LLC for option contracts which are presented on the Fund’s Statement of Assets and Liabilities.
(c) Investment Transactions, Investment Income and Expenses
Investment transactions are accounted for on the trade date. Realized gains and losses on investments are determined on the identified cost basis. Dividend income is recorded net of applicable withholding taxes on the ex-dividend date and interest income is recorded on an accrual basis. Withholding taxes on foreign dividends, if applicable, are paid (a portion of which may be reclaimable) or provided for in accordance with the applicable country’s tax rules and rates and are disclosed in the Statements of Operations. Withholding tax reclaims are filed in certain countries to recover a portion of the amounts previously withheld. The Funds record a reclaim receivable based on a number of factors, including a jurisdiction’s legal obligation to pay reclaims as well as payment history and market convention. Discounts or premiums on debt securities are accreted or amortized to interest income over the lives of the respective securities using the effective interest method. Income and expenses of the Funds are allocated on a pro rata basis to each class of shares. Expenses incurred by the Trust with respect to more than one fund are allocated in proportion to the net assets of each fund except where allocation of direct expenses to each fund or an alternative allocation method can be more appropriately made. Expenses such as distribution and service fees pursuant to Rule 12b-1, transfer agent fees and expenses with respect to the Funds, that are specific to individual share classes, are accrued directly to the respective share class.
(d) Federal Income Taxes
Each Fund intends to comply with the requirements of Subchapter M of the Internal Revenue Code applicable to regulated investment companies and to distribute substantially all of its net investment income and any net realized gains to its shareholders. Therefore, no provision is made for federal income or excise taxes. Due to the timing of dividend distributions and the differences in accounting for income and realized gains and losses for financial statement and federal income tax purposes, the fiscal year in which amounts are distributed may differ from the year in which the income and realized gains and losses are recorded by the Funds.
Accounting for Uncertainty in Income Taxes (the “Income Tax Statement”) requires an evaluation of tax positions taken (or expected to be taken) in the course of preparing a Fund’s tax returns to determine whether these positions meet a “more-likely-than-not” standard that, based on the technical merits, have a more than fifty percent likelihood of being sustained by a taxing authority upon examination. A tax position that meets the “more-likely-than-not” recognition threshold is measured to determine the amount of benefit to recognize in the financial statements. The Fund recognizes interest and penalties, if any, related to unrecognized tax benefits as income tax expense in the Statement of Operations.
The Income Tax Statement requires management of the Funds to analyze tax positions taken in the prior three open tax years, if any, and tax positions expected to be taken in the Funds’ current tax year, as defined by the IRS statute of limitations for all major jurisdictions, including federal tax authorities and certain state tax authorities. As of and during the open years ended May 31, 2018-2020 the Funds did not have a liability for any unrecognized tax benefits. The Funds have no examination in progress and are not aware of any tax positions for which it is reasonably possible that the total amounts of unrecognized tax benefits will significantly change in the next twelve months.
North Square Funds
NOTES TO FINANCIAL STATEMENTS – Continued
May 31, 2022
(e) Distributions to Shareholders
The Preferred and Income Securities Fund will make distributions of net investment income monthly. The Spectrum Alpha Fund, Dynamic Small Cap Fund, Small Cap Growth Fund, Multi Strategy Fund, Tactical Growth Fund, Tactical Defensive Fund, and Trilogy Alternative Return Fund will make distributions of net investment income, if any, at least annually. Each Fund makes distributions of its net capital gains, if any, at least annually. Distributions to shareholders are recorded on the ex-dividend date. The amount and timing of distributions are determined in accordance with federal income tax regulations, which may differ from GAAP.
The character of distributions made during the year from net investment income or net realized gains may differ from the characterization for federal income tax purposes due to differences in the recognition of income, expense and gain (loss) items for financial statement and tax purposes.
(f) Line of Credit
U.S. Bank, N.A. has made available to the Funds an unsecured line of credit pursuant to a Loan Agreement for the Funds. The line of credit is intended to provide short-term financing, if necessary, subject to certain restrictions, in connection with shareholder redemptions. The Funds may borrow up to the lesser of $50,000,000 or certain percentage amounts based on the net assets of the Funds, or 33.33% of unencumbered assets.
The interest rate paid by the Funds on outstanding borrowings is equal to the Prime Rate. As of May 31, 2022, the Prime Rate was 4.00%. During the year ended May 31, 2022, the Small Cap Growth Fund, Multi Strategy Fund, Preferred and Income Securities Fund and Trilogy Alternative Return Fund had average daily outstanding borrowings under the credit facility of $6,077, $2,570, $9,649, and $2,885, respectively. The maximum amount outstanding during the year ended May 31, 2022 was $1,261,000, $278,000, $867,000, and $1,053,000 for Small Cap Growth Fund, Multi Strategy Fund, Preferred and Income Securities Fund, and Trilogy Alternative Return Fund, respectively. Each Fund paid a weighted average interest rate of 3.25% totaling $200, $85, $318, and $95, respectively. These amounts are included as Custody Fees on the Statement of Operations. None of the other Funds had borrowing under the credit facility during the year ended May 31, 2022. As of May 31, 2022 none of the Funds have any borrowings outstanding under the line of credit.
Note 3 – Reorganization Information
Effective upon the close of business on October 9, 2020, the outstanding Class C and Class K shares of the Small Cap Growth Fund and the Class C shares of the Multi Strategy Fund were converted into Class I shares of their respective funds, as applicable (the “Class Conversion”) pursuant to the Supplement to the Prospectus dated August 10, 2020. The Class Conversion was completed based on the share classes’ relative net asset values on the date of conversion, without the imposition of any sales charge or any other charge as detailed below:
| | | Shares | | | Net | | | NAV | | | Share | |
| Small Cap Growth Fund | | Outstanding | | | Assets | | | per Share | | | Conversion Ratio | |
Class C | | | 3,147,304 | | | $ | 9,634,212 | | | $ | 3.0611 | | | 0.1852 | |
Class K | | | 105,492 | | | $ | 1,719,425 | | | $ | 16.2991 | | | 0.9862 | |
Class I (before conversion) | | | 2,729,370 | | | $ | 45,107,746 | | | $ | 16.5268 | | | | |
Class I (after conversion) | | | 3,416,353 | | | $ | 56,461,383 | | | $ | 16.5268 | | | | |
| | | | | | | | | | | | | |
| | | Shares | | | Net | | | NAV | | | Share | |
| Multi Strategy Fund | | Outstanding | | | Assets | | | per Share | | | Conversion Ratio | |
Class C | | | 218,468 | | | $ | 3,433,793 | | | $ | 15.7176 | | | 0.7701 | |
Class I (before conversion) | | | 319,524 | | | $ | 6,521,801 | | | $ | 20.4110 | | | | |
Class I (after conversion) | | | 487,756 | | | $ | 9,955,594 | | | $ | 20.4110 | | | | |
Note 4 – Investment Advisory and Other Agreements
The Trust, on behalf of the Funds, entered into an Investment Advisory Agreement (the “Agreement”) with North Square Investments, LLC (the “Advisor” or “NSI”). Under the terms of the Agreement, the Funds pay a monthly investment advisory fee to the Advisor based on each Fund’s average daily net assets. Fees paid to the Advisor for the year ended May 31, 2022 are reported on the Statements of Operations. The annual and tiered rates are listed by Fund in the below table:
North Square Funds
NOTES TO FINANCIAL STATEMENTS – Continued
May 31, 2022
| | Investment |
| | Advisory Fees |
Spectrum Alpha Fund | 0.20%2 |
Dynamic Small Cap Fund | 0.90% |
Small Cap Growth Fund | 0.70%2 |
Multi Strategy Fund | 0.00%–0.50%1 |
Preferred and Income Securities Fund | 0.75%2 |
Tactical Growth Fund3 | |
First $150 million | 1.25% |
$150 million up to $500 million | 1.00% |
Thereafter | 0.85% |
Tactical Defensive Fund3 | |
First $150 million | 1.25% |
$150 million up to $500 million | 1.00% |
Thereafter | 0.85% |
Trilogy Alternative Return Fund3 | |
First $150 million | 1.25% |
$150 million up to $500 million | 1.00% |
Thereafter | 0.85% |
1 | The annual advisory fee is calculated as follows: (i) 0.00% for Fund assets invested in other series of the Trust advised by the Advisor (“affiliated investments”) and (ii) 0.50% for Fund assets invested in non-affiliated investments. For the year ended May 31, 2022, the amount of advisory fees waived due to affiliated investments is reported under “Affiliated fund fee waived” on the Statements of Operations. |
2 | Prior to January 11, 2022, the investment advisory fees for the Spectrum Alpha Fund, Small Cap Growth Fund, and Preferred and Income Securities Fund were 0.85% for the first $1 billion and 0.80% therafter, 0.70%, and 0.75%, respectively. |
3 | For the period June 1, 2021 through June 10, 2021, Stadion Money Management, LLC (the Predecessor Advisor) received $187,378, $29,622, and $17,737 in advisory fees for the Tactical Growth Fund, Tactical Defensive Fund, and Trilogy Alternative Return Fund, respectively. For the period June 11, 2021 through May 31, 2022 the Advisor received $5,869,863, $930,407, and $540,549 in advisory fees for the Tactical Growth Fund, Tactical Defensive Fund, and Trilogy Alternative Return Fund, respectively. |
The Advisor engages NSI Retail Advisors, LLC (“NSI Retail”) to manage the Spectrum Alpha Fund, Multi Strategy Fund, Tactical Growth Fund, Tactical Defensive Fund, and Trilogy Alternative Return Fund as sub-advisor, Algert Global LLC (“Algert Global”) to manage the Dynamic Small Cap Fund as sub-advisor, Advisory Research, Inc. (“ARI”) to manage the Small Cap Growth Fund, and Red Cedar Investment Management, LLC (“Red Cedar”) to manage the Preferred and Income Securities Fund.
The Advisor has contractually agreed to waive its fee and, if necessary, to absorb other operating expenses to ensure that total annual operating expenses (excluding taxes, leverage interest, brokerage commissions, dividend and interest expenses on short sales, acquired fund fees and expenses as determined in accordance with Form N-1A, expenses incurred in connection with any merger or reorganization, or extraordinary expenses such as litigation expenses) are limited. The agreements are effective until the dates listed below and may be terminated before those dates only by the Trust’s Board of Trustees. The table below contains the agreement expiration and expense cap by Fund and by Class:
North Square Funds
NOTES TO FINANCIAL STATEMENTS – Continued
May 31, 2022
| | | Total Limit on Annual Operating Expenses |
| | | Class A | Class C | Class I |
| | Agreement Expires | Shares† | Shares† | Shares† |
Spectrum Alpha Fund• | September 30, 2023 | 1.30% | — | 1.05% |
Dynamic Small Cap Fund | September 30, 2029 | — | — | 0.99% |
Small Cap Growth Fund• | September 30, 2029 | 1.19%* | — | 0.94% |
Multi Strategy Fund | September 30, 2029 | 1.20% | — | 1.17% |
Preferred and Income Securities Fund• | September 30, 2029 | — | — | 0.97% |
Tactical Growth Fund | January 19, 2023 | 1.30%° | 1.30%° | 1.30%° |
Tactical Defensive Fund | January 19, 2023 | 1.70%° | 1.70%° | 1.70%° |
Trilogy Alternative Return Fund | January 19, 2023 | 1.38%° | 1.38%° | 1.38%° |
| † | The total limit on annual operating expenses is calculated based on each Fund’s average daily net assets. |
| * | This class is currently not available for purchase. |
| ° | Exclusive of payments under a Rule 12b-1 Distribution Plan. |
| • | Prior to January 11, 2022, the Spectrum Alpha Fund had expense caps of 1.39% and 1.14% for Class A and I shares, respectively, the Small Cap Growth Fund had expense caps of 1.20% and 0.95% for Class A and I shares, respectively, and the Preferred and Income Securities Fund had an expense cap of 1.00% for Class I. |
Each Fund’s advisor is permitted to seek reimbursement from the Fund, subject to certain limitations, of fees waived or payments made to the Fund for a period ending thirty-six months after the date of the waiver or payment. The Multi Strategy Fund includes a maximum reimbursement of 0.20% per fiscal year. This reimbursement may be requested from the Fund if the reimbursement will not cause the Fund’s annual expense ratio to exceed the lesser of (a) the expense limitation amount in effect at the time such fees were waived or payments made, or (b) the expense limitation amount in effect at the time of the reimbursement. For the year ended May 31, 2022, the Spectrum Alpha Fund recouped $140,877 and $88,984 in Class A and Class I, respectively, the Multi Strategy Fund recouped $1,388 in Class A, the Tactical Defensive Fund recouped $385 in Class I, and the Tactical Growth Fund recouped $7,462, $2,593, and $11,160 in Class A, Class C, and Class I, respectively.
The Advisor may recapture all or a portion of this amount no later than the dates stated below:
| | | Spectrum Alpha Fund | |
| | | | |
| | | Class A | | | Class I | | | Total | |
May 31, 2023 | | $ | 540,670 | | | $ | 269,470 | | | $ | 810,140 | |
May 31, 2024 | | $ | 312,918 | | | $ | 166,395 | | | $ | 479,313 | |
May 31, 2025 | | $ | 128,144 | | | $ | 93,377 | | | $ | 221,521 | |
| | | $ | 981,732 | | | $ | 529,242 | | | $ | 1,510,974 | |
| | | | | | | | | | | | |
| | | | | | | | | | | Preferred | |
| | | Dynamic | | |
| | | and Income | |
| | | Small | | | Small Cap | | | Securities | |
| | | Cap Fund | | | Growth Fund | | | Fund | |
May 31, 2023 | | $ | 206,504 | | | $ | 120,773 | | | $ | 119,996 | |
May 31, 2024 | | $ | 98,584 | | | $ | 68,724 | | | $ | 60,057 | |
May 31, 2025 | | $ | 162,452 | | | $ | 57,980 | | | $ | 56,691 | |
| | $ | | | | $ | | | | $
| 236,744 | |
| | | | | | Tactical Growth Fund | | | | |
| | | | | | | | | | |
| | | Class A | | | Class C | | | Class I | | | Total | |
May 31, 2025 | | $ | 64,123 | | | $ | 70,169 | | | $ | 300,815 | | | $ | 435,107 | |
| | | $ | 64,123 | | | $ | 70,169 | | | $ | 300,815 | | | $ | 435,107 | |
| | | | | | | | | | | | |
| | | | | | | Trilogy Alternative Return Fund | | | | | |
| | | | | | | | | | | | |
| | | Class A | | | Class C | | | Class I | | | Total | |
May 31, 2025 | | $ | 5,635 | | | $ | 10,923 | | | $ | 108,017 | | | $ | 124,575 | |
| | | $ | 5,635 | | | $ | 10,923 | | | $ | 108,017 | | | $ | 124,575 | |
North Square Funds
NOTES TO FINANCIAL STATEMENTS – Continued
May 31, 2022
U.S. Bancorp Fund Services, LLC doing business as U.S. Bank Global Fund Services (“GFS”) serves as the Funds’ fund accountant, transfer agent and administrator. U.S. Bank N.A., serves as the Funds’ custodian. The Funds’ allocated fees incurred for fund accounting, transfer agency, fund administration and custody services for the year ended May 31, 2022 are reported on the Statements of Operations.
Prior to June 11, 2021, ALPS Fund Services, Inc. provided administrative, fund accounting and other services to the Tactical Growth Fund, Tactical Defensive Fund, and Trilogy Alternative Return Fund under the Administration, Bookkeeping and Pricing Services Agreement. For the period June 1, 2021 through June 10, 2021, ALPS Fund Services, Inc. received $10,392, $1,422, and $1,121 for providing these services for the Tactical Growth Fund, Tactical Defensive Fund, and Trilogy Alternative Return Fund, respectively. Prior to June 11, 2021, ALPS was transfer, dividend paying and shareholder servicing agent for the Tactical Growth Fund, Tactical Defensive Fund, and Trilogy Alternative Return Fund under Transfer Agency and Service Agreement. For the period June 1, 2021 through June 10, 2021, ALPS received the following amounts for providing these services:
| | | Tactical | | | Tactical | | | Trilogy Alternative | |
| | | Growth Fund | | | Defensive Fund | | | Return Fund | |
Transfer Agent Fees, Common | | | 4,938 | | | | 1,587 | | | | 1,262 | |
Transfer Agent Fees, Class A | | 536 | | | 223 | | | 14 | |
Transfer Agent Fees, Class C | | 970 | | | 113 | | | 32 | |
Transfer Agent Fees, Class I | | | 5,942 | | | | 1,396 | | | | 1,154 | |
Compass Distributors, LLC serves as the Funds’ distributor (the “Distributor”). The Distributor does not receive compensation from the Funds for its distribution services; the Advisor pays the Distributor a fee for its distribution-related services. Prior to June 11, 2021 ALPS Distributors, Inc. acted as the distributor of the Tactical Growth Fund, Tactical Defensive Fund, and Trilogy Alternative Return Fund.
Cipperman Compliance Services provides Chief Compliance Officer (“CCO”) services to the Trust. The Funds’ allocated fees incurred for CCO services for the year ended May 31, 2022, are reported on the Statements of Operations. Prior to June 11, 2021 the Chief Compliance Officer to the Tactical Growth Fund, Tactical Defensive Fund, and Trilogy Alternative Return Fund was an employee of the Predecessor Advisor. For the period June 1, 2021 through June 10, 2021, the chief compliance officer fee was $2,720, $373, and $222 for the Tactical Growth Fund, Tactical Defensive Fund, and Trilogy Alternative Return Fund, respectively.
Note 5 – Federal Income Taxes
At May 31, 2022, gross unrealized appreciation and depreciation of investments, based on cost for federal income tax purposes were as follows:
| | | | | | Dynamic | | | | |
| | | Spectrum | | | Small | | | Small Cap | |
| | | Alpha Fund | | | Cap Fund | | | Growth Fund | |
Cost of investments | | $ | 111,714,303 | | | $ | 85,541,737 | | | $ | 14,399,655 | |
Gross unrealized appreciation | | $ | — | | | $ | 4,074,200 | | | $ | 786,693 | |
Gross unrealized depreciation | | | (15,879,159 | ) | | | (10,649,776 | ) | | | (2,512,469 | ) |
Net unrealized appreciation on investments | | $ | (15,879,159 | ) | | $ | (6,575,576 | ) | | $ | (1,725,776 | ) |
| | | | | | | | | | | | |
| | | | | | | Preferred | | | | | |
| | | Multi Strategy | | | and Income | | | Tactical | |
| | | Fund | | | Securities Fund | | | Growth Fund | |
Cost of investments | | $ | 47,710,899 | | | $ | 27,771,910 | | | $ | 425,944,841 | |
Gross unrealized appreciation | | $ | 3,303,672 | | | $ | 181,577 | | | $ | 99,466,918 | |
Gross unrealized depreciation | | | (2,895,851 | ) | | | (2,289,291 | ) | | | (2,804,060 | ) |
Net unrealized appreciation on investments | | $ | 407,821 | | | $ | (2,107,714 | ) | | $ | 96,662,858 | |
| | | Tactical | | Trilogy Alternative | |
| | | Defensive Fund | | | Return Fund | | |
Cost of investments | | $ | 73,092,219 | | | $ | 35,341,301 | | |
Gross unrealized appreciation | | $ | — | | | $ | 12,591,679 | | |
Gross unrealized depreciation | | | — | | | | (3,642,096 | ) | |
Net unrealized appreciation on investments | | $ | — | | | $ | 8,949,583 | | |
The difference between cost amounts for financial statement and federal income tax purposes is due primarily to timing differences in recognizing certain gains and losses in security transactions.
North Square Funds
NOTES TO FINANCIAL STATEMENTS – Continued
May 31, 2022
GAAP requires that certain components of net assets be reclassified between financial and tax reporting. These reclassifications have no effect on net assets or net asset value per share. For the year ended May 31, 2022, permanent differences in book and tax accounting have been reclassified to paid in capital, accumulated net investment income/loss and accumulated net realized gain/loss as follows:
| | | Increase (Decrease) | |
| | | | | | Total | |
| | | | | | Distributable | |
| | | Paid In Capital | | | Earnings | |
Spectrum Alpha Fund | | $ | 4,673,778 | | | $ | (4,673,778 | ) |
Dynamic Small Cap Fund | | $ | — | | | $ | — | |
Advisory Research Small Cap Growth Fund | | $ | 1,590,964 | | | $ | (1,590,964 | ) |
Multi Strategy Fund | | $ | 1,120,179 | | | $ | (1,120,179 | ) |
Preferred and Income Securities Fund | | $ | 1,043,563 | | | $ | (1,043,563 | ) |
Tactical Growth Fund | | $ | 88,509 | | | $ | (88,509 | ) |
Tactical Defensive Fund | | $ | (503,199 | ) | | $ | 503,199 | |
Trilogy Alternative Return Fund | | $ | — | | | $ | — | |
As of May 31, 2022, the components of accumulated earnings (deficit) on a tax basis for the Funds were as follows:
| | | Spectrum | | | Dynamic | | | Advisory Research | | | Multi Strategy | |
| | | Alpha Fund | | | Small Cap Fund | | | Small Cap Fund | | | Fund | |
Undistributed ordinary income | | $ | — | | | $ | — | | | $ | — | | | $ | 4,507,952 | |
Undistributed long-term gains | | | 37,229,963 | | | | — | | | | 1,422,527 | | | | 9,580,048 | |
Accumulated earnings | | $ | 37,229,963 | | | $ | — | | | $ | 1,422,527 | | | $ | 14,088,000 | |
Accumulated capital and other losses | | $ | (530,058 | ) | | $ | (4,260,067 | ) | | $ | (46,953 | ) | | $ | — | |
Net unrealized appreciation on investments | | | (15,879,159 | ) | | | (6,575,576 | ) | | | (1,725,776 | ) | | | 407,821 | |
Total accumulated earnings | | $ | 20,820,746 | | | $ | (10,835,643 | ) | | $ | (350,202 | ) | | $ | 14,495,821 | |
| | | | | | | | | | | | | | | |
| | | Preferred | | | | | | | | | | | Trilogy | |
| | | and Income | | | Tactical | | | Tactical | | | Alternative | |
| | | Securities Fund | | | Growth Fund | | | Defensive Fund | | | Return Fund | |
Undistributed ordinary income | | $ | — | | | $ | — | | | $ | — | | | $ | 38,150 | |
Undistributed long-term gains | | | 4,921,108 | | | | 34,076,038 | | | | — | | | | — | |
Accumulated earnings | | $ | 4,921,108 | | | $ | 34,076,038 | | | $ | — | | | $ | 38,150 | |
Accumulated capital and other losses | | $ | — | | | $ | (948,369 | ) | | $ | (9,745,860 | ) | | $ | (4,469,247 | ) |
Net unrealized appreciation on investments | | | (2,107,714 | ) | | | 96,662,858 | | | | — | | | | 8,949,583 | |
Total accumulated earnings | | $ | 2,813,394 | | | $ | 129,790,527 | | | $ | (9,745,860 | ) | | $ | 4,518,486 | |
The tax character of distributions paid during the fiscal years ended May 31, 2022 and May 31, 2021 were as follows:
| | | Spectrum | | | Dynamic | | | | | | | |
| | | Alpha Fund | | | Small Cap Fund | | | Small Cap Growth Fund | |
| | | May 31, | | | May 31, | | | May 31, | | | May 31, | | | May 31, | | | May 31, | |
Distributions paid from: | | 2022 | | | 2021 | | | 2022 | | | 2021 | | | 2022 | | | 2021 | |
Ordinary income | | $ | 2,234,423 | | | $ | 2,283,449 | | | $ | 5,391,208 | | | $ | 72,357 | | | $ | 10,604 | | | $ | 16,524 | |
Net long-term capital gains | | | 15,159,013 | | | | 14,758,820 | | | | 1,222,457 | | | | 288,617 | | | | 2,953,601 | | | | 758,526 | |
Total distributions paid | | $ | 17,393,436 | | | $ | 17,042,269 | | | $ | 6,613,665 | | | $ | 360,974 | | | $ | 2,964,205 | | | $ | 775,050 | |
| | | | | | | | | | | | | | | | | | | | | | | | | |
| | | Multi Strategy | | | Preferred and Income | | | | | | | | | |
| | | Fund | | | Securities Fund | | | | Tactical Growth Fund | |
| | | May 31, | | | May 31, | | | May 31, | | | May 31, | | | May 31, | | | May 31, | |
Distributions paid from: | | 2022 | | | 2021 | | | 2022 | | | 2021 | | | 2022 | | | 2021 | |
Ordinary income | | $ | — | | | $ | — | | | $ | 219,870 | | | $ | 125,884 | | | $ | 19,279,397 | | | $ | 76,516 | |
Net long-term capital gains | | | 3,299,535 | | | | — | | | | 1,247,779 | | | | 243,545 | | | | 8,625,075 | | | | — | |
Total distributions paid | | $ | 3,299,535 | | | $ | — | | | $ | 1,467,649 | | | $ | 369,429 | | | $ | 27,904,472 | | | $ | 76,516 | |
North Square Funds
NOTES TO FINANCIAL STATEMENTS – Continued
May 31, 2022
| | | | | | | | | Trilogy Alternative | |
| | | Tactical Defensive Fund | | | Return Fund | |
| | | May 31, | | | May 31, | | | May 31, | | | May 31, | |
Distributions paid from: | | 2022 | | | 2021 | | | 2022 | | | 2021 | |
Ordinary income | | $ | — | | | $ | — | | | $ | 102,714 | | | $ | 422,627 | |
Net long-term capital gains | | | — | | | | — | | | | — | | | | — | |
Tax Return of Capital | | | — | | | | — | | | | — | | | | 42,485 | |
Total distributions paid | | $ | — | | | $ | — | | | $ | 102,714 | | | $ | 465,112 | |
As of May 31, 2022, the Tactical Defensive Fund and Trilogy Alternative Return Fund have $(9,284,980) and $(4,469,247) non-expiring short-term capital loss carryforwards, respectively.
To the extent that a Fund may realize future net capital gains, those gains will be offset by any of its unused capital loss carryforwards. Future capital loss carryover utilization in any given year may be subject ot Internal Revenue Code limitations.
As of May 31, 2022, the Funds had the following qualified late-year ordinary losses and post-October losses which are deferred until fiscal year 2023 for tax purposes. Net late-year losses incurred after December 31, and within the taxable year are deemed to arise on the first day of the Fund’s next taxable year. Capital losses incurred after October 31 within that taxable year are deemed to arise on the first day of the Fund’s next taxable year.
| | | Late Year Losses | | | Post October Losses | |
Spectrum Alpha Fund | | $ | (530,058 | ) | | $ | — | |
Dynamic Small Cap Fund | | $ | — | | | $ | (4,260,067 | ) |
Advisory Research Small Cap Growth Fund | | $ | (46,953 | ) | | $ | — | |
Multi Strategy Fund | | $ | — | | | $ | — | |
Preferred and Income Securities Fund | | $ | — | | | $ | — | |
Tactical Growth Fund | | $ | (948,369 | ) | | $ | — | |
Tactical Defensive Fund | | $ | (460,880 | ) | | $ | — | |
Trilogy Alternative Return Fund | | $ | — | | | $ | — | |
Note 6 – Investment Transactions
For the year ended May 31, 2022, purchases and sales of investments were as follows:
| | | Purchases | | | Sales | |
Spectrum Alpha Fund | | $ | 133,648,806 | | | $ | 164,918,121 | |
Dynamic Small Cap Fund | | $ | 149,556,377 | | | $ | 79,158,729 | |
Advisory Research Small Cap Growth Fund | | $ | 35,421,357 | | | $ | 30,781,975 | |
Multi Strategy Fund | | $ | 40,512,139 | | | $ | 35,178,311 | |
Preferred and Income Securities Fund | | $ | 45,854,367 | | | $ | 34,614,583 | |
Tactical Growth Fund | | $ | 325,526,792 | | | $ | 492,449,813 | |
Tactical Defensive Fund | | $ | 134,479,503 | | | $ | 213,811,178 | |
Trilogy Alternative Return Fund | | $ | 7,835,917 | | | $ | 7,405,229 | |
Note 7 – Shareholder Servicing Plan
The Trust, on behalf of the Funds, has adopted a Shareholder Servicing Plan to pay a fee at an annual rate of up to 0.15% of each Fund’s average daily net assets of shares serviced by shareholder servicing agents who provide administrative and support services to their customers.
For the year ended May 31, 2022, shareholder servicing fees incurred are disclosed on the Statements of Operations.
Note 8 – Distribution Plan
The Trust, on behalf of each Fund, has adopted a Distribution Plan (the “Plan”) pursuant to Rule 12b-1 under the 1940 Act that allows each Fund to pay distribution fees for the sale and distribution of its Class A and Class C shares. The Plan provides for the payment of distribution fees at the annual rate of up to 0.25% of each Fund’s average daily net assets attributable to Class A shares and 1.00% of average daily net assets attributable to Class C shares.
For the year ended May 31, 2022, distribution fees incurred with respect to Class A and Class C shares are disclosed on the Statements of Operations.
North Square Funds
NOTES TO FINANCIAL STATEMENTS – Continued
May 31, 2022
For the period June 1, 2021 through June 11, 2021, Tactical Growth Fund, Tactical Defensive Fund, and Trilogy Alternative Return Fund incurred distribution fees in the following amounts:
| | | Tactical | | | Tactical | | | Trilogy Alternative | |
| | | Growth Fund | | | Defensive Fund | | | Return Fund | |
Distribution Fees – Class A | | | 7,373 | | | | 1,634 | | | 203 | |
Distribution Fees – Class I | | | 24,119 | | | | 2,640 | | | | 1,083 | |
In May of 2021, the Funds’ distributor, Compass Distributors, LLC, returned unused 12b-1 fees from closed share classes. The Preferred and Income Securities Fund (formerly, Dividend Growth Fund) Class A shares closed in May of 2020, the Spectrum Alpha Fund (formerly, Small Cap Growth Fund) Class C shares closed in October of 2020, and the Multi Strategy Fund Class C shares closed in October of 2020. All shareholders of these closed classes were converted into the Class I shares of each respective Fund. The amounts in the table below were returned to the respective Funds during the fiscal year ended May 31, 2021.
| | | Fees Returned | |
Preferred and Income Securities Fund (formerly, Dividend Growth Fund) | | $ | 1,007 | |
Spectrum Alpha Fund (formerly, Small Cap Growth Fund) | | | 79,654 | |
Multi Strategy Fund | | | 20,501 | |
The return of 12b-1 fees by the Distributor is non-recurring and is included in the ratios appearing in the financial highlights of this report. Had the Funds not received the returned 12b-1 fees, the ratios of net expenses to average net assets and net investment income/(loss) to average net assets would have been:
| | | | Ratio of Net | Ratio of Net |
| | Ratio of | Ratio of | Investment | Investment |
| | Expenses to Average | Expenses to average | Income/(Loss) to | Income/(Loss) to |
| | Net Assets Before | Net Assets After | Average Net Assets | Average Net Assets |
| | Fees Waived and | Fees Waived and | Before Fees Waived and | After Fees Waived and |
| | Expenses Absorbed | Expenses Absorbed | Expenses Absorbed | Expenses Absorbed |
| | Year Ended | Year Ended | Year Ended | Year Ended |
| | May 31, 2021 | May 31, 2021 | May 31, 2021 | May 31, 2021 |
| Preferred and Income | | | | |
| Securities Fund (formerly, | | | | |
| Dividend Growth Fund) Class I | 1.44% | 1.01% | 0.59% | 1.02% |
| Spectrum Alpha Fund (formerly, | | | | |
| Small Cap Growth Fund) Class I | 1.51% | 1.23% | (1.31)% | (1.02)% |
| Multi Strategy Fund Class I | 0.66% | 0.66% | 0.05% | 0.05% |
Except for the Fund classes listed below, total return would have been the same for the year ended May 31, 2021, if the Funds had not received the returned 12b-1 fee amounts reported above. Had the Funds not received the 12b-1 fee amounts the total return would have been:
| | Year Ended May 31, 2021 |
Spectrum Alpha Fund (formerly, Small Cap Growth Fund) Class I | 43.73% |
Multi Strategy Fund Class I | 39.80% |
Note 9 – Indemnifications
In the normal course of business, the Funds enter into contracts that contain a variety of representations which provide general indemnifications. The Funds’ maximum exposure under these arrangements is unknown, as this would involve future claims that may be made against the Funds that have not yet occurred. However, the Funds expect the risk of loss to be remote.
Note 10 – Fair Value Measurements and Disclosure
Fair Value Measurements and Disclosures defines fair value, establishes a framework for measuring fair value in accordance with GAAP, and expands disclosure about fair value measurements. It also provides guidance on determining when there has been a significant decrease in the volume and level of activity for an asset or a liability, when a transaction is not orderly, and how that information must be incorporated into a fair value measurement.
Under Fair Value Measurements and Disclosures, various inputs are used in determining the value of the Funds’ investments. These inputs are summarized into three broad Levels as described below:
| • | Level 1 – Unadjusted quoted prices in active markets for identical assets or liabilities that the Fund has the ability to access. |
North Square Funds
NOTES TO FINANCIAL STATEMENTS – Continued
May 31, 2022
| • | Level 2 – Observable inputs other than quoted prices included in Level 1 that are observable for the asset or liability, either directly or indirectly. These inputs may include quoted prices for the identical instrument on an inactive market, prices for similar instruments, interest rates, prepayment speeds, credit risk, yield curves, default rates and similar data. |
| • | Level 3 – Unobservable inputs for the asset or liability, to the extent relevant observable inputs are not available, representing the Fund’s own assumptions about the assumptions a market participant would use in valuing the asset or liability, and would be based on the best information available. |
The availability of observable inputs can vary from security to security and is affected by a wide variety of factors, including for example, the type of security, whether the security is new and not yet established in the marketplace, the liquidity of markets, and other characteristics particular to the security. To the extent that valuation is based on models or inputs that are less observable or unobservable in the market, the determination of fair value requires more judgment. Accordingly, the degree of judgment exercised in determining fair value is greatest for instruments categorized in Level 3.
The inputs to measure fair value may fall into different Levels of the fair value hierarchy. In such cases, for disclosure purposes, the Level in the fair value hierarchy within which the fair value measurement falls in its entirety, is determined based on the lowest Level input that is significant to the fair value measurement in its entirety.
The inputs or methodology used for valuing securities are not an indication of the risk associated with investing in those securities. The following is a summary of the inputs used, as of May 31, 2022, in valuing the Funds’ assets carried at fair value:
| Spectrum Alpha Fund | | Level 1 | | | Level 2* | | | Level 3** | | | Total | |
| Investments | | | | | | | | | | | | |
Mutual Funds | | $ | 95,168,084 | | | $ | — | | | $ | — | | | $ | 95,168,084 | |
Short-Term Investment | | | 667,060 | | | | — | | | | — | | | | 667,060 | |
Total | | $ | 95,835,144 | | | $ | — | | | $ | — | | | $ | 95,835,144 | |
| | | | | | | | | | | | | |
| Dynamic Small Cap Fund | | Level 1 | | | Level 2* | | | Level 3** | | | Total | |
| Investments | | | | | | | | | | | | | | | | |
Common Stocks1 | | $ | 72,340,699 | | | $ | — | | | $ | — | | | $ | 72,340,699 | |
REITs | | | 6,181,701 | | | | — | | | | — | | | | 6,181,701 | |
Short-Term Investment | | | 443,761 | | | | — | | | | — | | | | 443,761 | |
Total | | $ | 78,966,161 | | | $ | — | | | $ | — | | | $ | 78,966,161 | |
| | | | | | | | | | | | | |
| Advisory Research Small Cap Growth Fund | | Level 1 | | | Level 2* | | | Level 3** | | | Total | |
| Investments | | | | | | | | | | | | | | | | |
Common Stocks1 | | $ | 12,645,500 | | | $ | — | | | $ | — | | | $ | 12,645,500 | |
Short-Term Investment | | | 28,379 | | | | — | | | | — | | | | 28,379 | |
Total | | $ | 12,673,879 | | | $ | — | | | $ | — | | | $ | 12,673,879 | |
| | | | | | | | | | | | | |
| Multi Strategy Fund | | Level 1 | | | Level 2* | | | Level 3** | | | Total | |
| Investments | | | | | | | | | | | | | | | | |
ETFs | | $ | 19,093,832 | | | $ | — | | | $ | — | | | $ | 19,093,832 | |
Mutual Funds | | | 28,609,370 | | | | — | | | | — | | | | 28,609,370 | |
Short-Term Investment | | | 415,518 | | | | — | | | | — | | | | 415,518 | |
Total | | $ | 48,118,720 | | | $ | — | | | $ | — | | | $ | 48,118,720 | |
| | | | | | | | | | | | | |
| Preferred and Income Securities Fund | | Level 1 | | | Level 2 | | | Level 3** | | | Total | |
| Investments | | | | | | | | | | | | | | | | |
Preferred Stocks1 | | $ | 755,400 | | | $ | — | | | $ | — | | | $ | 755,400 | |
Corporate Bonds1 | | | — | | | | 24,320,944 | | | | — | | | | 24,320,944 | |
U.S. Government Notes/Bonds | | | — | | | | 350,492 | | | | — | | | | 350,492 | |
Short-Term Investment | | | 237,424 | | | | — | | | | — | | | | 237,424 | |
Total | | $ | 992,824 | | | $ | 24,671,436 | | | $ | — | | | $ | 25,664,260 | |
North Square Funds
NOTES TO FINANCIAL STATEMENTS – Continued
May 31, 2022
| Tactical Growth Fund | | Level 1 | | | Level 2* | | | Level 3** | | | Total | |
| Investment | | | | | | | | | | | | |
ETFs | | $ | 357,009,538 | | | $ | — | | | $ | — | | | $ | 357,009,538 | |
Short-Term Investment | | | 165,598,161 | | | | — | | | | — | | | | 165,598,161 | |
Total | | $ | 522,607,699 | | | $ | — | | | $ | — | | | $ | 522,607,699 | |
| | | | | | | | | | | | | |
| Tactical Defensive Fund | | Level 1 | | | Level 2* | | | Level 3** | | | Total | |
| Investments | | | | | | | | | | | | | | | | |
Short-Term Investment | | $ | 73,092,219 | | | $ | — | | | $ | — | | | $ | 73,092,219 | |
Total | | $ | 73,092,219 | | | $ | — | | | $ | — | | | $ | 73,092,219 | |
| | | | | | | | | | | | | |
| Trilogy Alternative Return Fund | | Level 1 | | | Level 2 | | | Level 3** | | | Total | |
| Investments | | | | | | | | | | | | | | | | |
Common Stocks1 | | $ | 13,909,744 | | | $ | — | | | $ | — | | | $ | 13,909,744 | |
ETFs | | | 23,103,931 | | | | — | | | | — | | | | 23,103,931 | |
Purchased Options | | | — | | | | 6,866,226 | | | | — | | | | 6,866,226 | |
Short-Term Investment | | | 410,983 | | | | — | | | | — | | | | 410,983 | |
Total | | $ | 37,424,658 | | | $ | 6,866,226 | | | $ | — | | | $ | 44,290,844 | |
Written Options | | $ | — | | | $ | 2,669,375 | | | $ | — | | | $ | 2,669,375 | |
1 | | For a detailed break-out of these securities by major sector and industry classification, please refer to the Schedule of Investments. |
* | | The Fund did not hold any Level 2 securities at period end. |
** | | The Fund did not hold any Level 3 securities at period end. |
Note 11 – Investments in Affiliated Issuers
An affiliated issuer is an entity in which the Fund has ownership of at least 5% of the voting securities or any investment in a North Square Fund. Issuers that are affiliates of the Fund at period-end are noted in the Fund’s Schedule of Investments. Additional security purchases and the reduction of certain securities shares outstanding of existing portfolio holdings that were not considered affiliated in prior years may result in the Fund owning in excess of 5% of the outstanding shares at period-end. The table below reflects transactions during the period with entities that are affiliates as of May 31, 2022 and may include acquisitions of new investments, prior year holdings that became affiliated during the period and prior period affiliated holdings that are no longer affiliated as of period-end.
Spectrum Alpha Fund
| | | | | | | | | | | | Change in | | | | | | | | |
| | Value, | | | | | | | Net | | | Unrealized | | | Value, | | | | Capital | |
| | Beginning | | | | Sales | | | Realized | | | Appreciation | | | End | | Dividend | | Gain | |
| | of Period | | Purchases | | Proceeds | | | Gain (Loss) | | | (Depreciation) | | | of Period | | Income | | Distributions | |
| North Square Advisory | | | | | | | | | | | | | | | | | | | |
| Research Small Cap | | | | | | | | | | | | | | | | | | | |
| Growth Fund – Class I* | $ | — | | $ | 19,000,000 | | $ | (4,000,000 | ) | | $ | (727,546 | ) | | $ | (3,672,395 | ) | | $ | 10,600,059 | | $ | — | | $ | — | |
| | | | | | | | | | | | | | | | | | | | | | | | | | | | |
| North Square Advisory | | | | | | | | | | | | | | | | | | | | | | | | | | | |
| Research Small Cap | | | | | | | | | | | | | | | | | | | | | | | | | | | |
| Value Fund – Class I* | | — | | | 19,000,001 | | | — | | | | — | | | | (1,629,506 | ) | | | 17,370,495 | | | — | | | — | |
| | | | | | | | | | | | | | | | | | | | | | | | | | | | |
| North Square Dynamic | | | | | | | | | | | | | | | | | | | | | | | | | | | |
| Small Cap Fund – Class I | | — | | | 82,000,000 | | | (4,000,000 | ) | | | (331,892 | ) | | | (10,470,578 | ) | | | 67,197,530 | | | — | | | — | |
| | $ | — | | $ | 120,000,001 | | $ | (8,000,000 | ) | | $ | (1,059,438 | ) | | $ | (15,772,479 | ) | | $ | 95,168,084 | | $ | — | | $ | — | |
North Square Funds
NOTES TO FINANCIAL STATEMENTS – Continued
May 31, 2022
| | | Shares, | | | | | | | | | Shares, | |
| | | Beginning | | | | | | | | | End | |
| | | of Period | | | Purchases | | | Sales | | | of Period | |
| North Square Advisory | | | | | | | | | | | | |
| Research Small Cap | | | | | | | | | | | | |
| Growth Fund – Class I* | | | — | | | | 1,110,259 | | | | (273,784 | ) | | | 836,475 | |
| | | | | | | | | | | | | | | | | |
| North Square Advisory | | | | | | | | | | | | | | | | |
| Research Small Cap | | | | | | | | | | | | | | | | |
| Value Fund – Class I* | | | — | | | | 1,630,496 | | | | — | | | | 1,630,496 | |
| | | | | | | | | | | | | | | | | |
| North Square Dynamic | | | | | | | | | | | | | | | | |
| Small Cap Fund – Class I | | | — | | | | 6,398,419 | | | | (337,817 | ) | | | 6,060,602 | |
| * | Effective January 11th, 2022, the North Square Oak Ridge Small Cap Growth Fund, North Square Oak Ridge All Cap Growth Fund, North Square Oak Ridge Dividend Growth Fund, and North Square Advisory Research All Cap Value Fund changed names to the North Square Spectrum Alpha Fund, North Square Advisory Research Small Cap Growth Fund, North Square Preferred and Income Securities Fund, and North Square Advisory Research Small Cap Value Fund, respectively. |
Multi Strategy Fund
| | | | | | | | | | | | Change in | | | | | | | | |
| | Value, | | | | | | | Net | | | Unrealized | | | Value, | | | | Capital | |
| | Beginning | | | | Sales | | | Realized | | | Appreciation | | | End | | Dividend | | Gain | |
| | of Period | | Purchases | | Proceeds | | | Gain (Loss) | | | (Depreciation) | | | of Period | | Income | | Distributions | |
| North Square Advisory | | | | | | | | | | | | | | | | | | | |
| Research Small Cap | | | | | | | | | | | | | | | | | | | |
| Growth Fund – Class I* | $ | 11,873,010 | | $ | 2,779,199 | | $ | (10,250,000 | ) | | $ | 2,918,915 | | | $ | (5,275,100 | ) | | $ | 2,046,023 | | $ | 10,380 | | $ | 2,768,818 | |
| | | | | | | | | | | | | | | | | | | | | | | | | | | | |
| North Square Advisory | | | | | | | | | | | | | | | | | | | | | | | | | | | |
| Research Small Cap | | | | | | | | | | | | | | | | | | | | | | | | | | | |
| Value Fund – Class I* | | 3,508,534 | | | 3,491,017 | | | (4,200,000 | ) | | | 219,393 | | | | (459,306 | ) | | | 2,559,638 | | | 63,229 | | | 427,788 | |
| | | | | | | | | | | | | | | | | | | | | | | | | | | | |
| North Square Altrinsic | | | | | | | | | | | | | | | | | | | | | | | | | | | |
| International Equity | | | | | | | | | | | | | | | | | | | | | | | | | | | |
| Fund – Class I | | 1,114,354 | | | 3,020,230 | | | — | | | | — | | | | (358,671 | ) | | | 3,775,913 | | | 20,230 | | | — | |
| | | | | | | | | | | | | | | | | | | | | | | | | | | | |
| North Square Dynamic | | | | | | | | | | | | | | | | | | | | | | | | | | | |
| Small Cap Fund – Class I | | 18,865,796 | | | 5,594,110 | | | (9,500,000 | ) | | | 785,984 | | | | (7,006,511 | ) | | | 8,739,379 | | | 4,560,107 | | | 1,034,005 | |
| | | | | | | | | | | | | | | | | | | | | | | | | | | | |
| North Square McKee | | | | | | | | | | | | | | | | | | | | | | | | | | | |
| Bond Fund – Class R6** | | 1,491,593 | | | 16,407 | | | — | | | | — | | | | (118,223 | ) | | | 1,389,777 | | | 16,407 | | | — | |
| | | | | | | | | | | | | | | | | | | | | | | | | | | | |
| North Square Preferred | | | | | | | | | | | | | | | | | | | | | | | | | | | |
| and Income Securities | | | | | | | | | | | | | | | | | | | | | | | | | | | |
| Fund – Class I* | | 14,480,760 | | | 1,260,375 | | | (5,700,000 | ) | | | 1,673,520 | | | | (2,692,932 | ) | | | 9,021,722 | | | 191,956 | | | 1,068,419 | |
| | | | | | | | | | | | | | | | | | | | | | | | | | | | |
| North Square Strategic | | | | | | | | | | | | | | | | | | | | | | | | | | | |
| Income Fund – Class I | | 1,221,663 | | | 1,091,301 | | | (1,100,000 | ) | | | (27,601 | ) | | | (108,445 | ) | | | 1,076,918 | | | 76,284 | | | 15,017 | |
| | $ | 52,555,710 | | $ | 17,252,639 | | $ | (30,750,000 | ) | | $ | 5,570,210 | | | $ | (16,019,189 | ) | | $ | 28,609,370 | | $ | 4,938,593 | | $ | 5,314,047 | |
North Square Funds
NOTES TO FINANCIAL STATEMENTS – Continued
May 31, 2022
| | | Shares, | | | | | | | | | Shares, | |
| | | Beginning | | | | | | | | | End | |
| | | of Period | | | Purchases | | | Sales | | | of Period | |
| North Square Advisory | | | | | | | | | | | | |
| Research Small Cap Growth | | | | | | | | | | | | |
| Fund – Class I* | | | 567,875 | | | | 156,436 | | | | (562,855 | ) | | | 161,456 | |
| | | | | | | | | | | | | | | | | |
| North Square Advisory | | | | | | | | | | | | | | | | |
| Research Small Cap Value | | | | | | | | | | | | | | | | |
| Fund – Class I* | | | 304,971 | | | | 297,211 | | | | (361,919 | ) | | | 240,263 | |
| | | | | | | | | | | | | | | | | |
| North Square Altrinsic | | | | | | | | | | | | | | | | |
| International Equity | | | | | | | | | | | | | | | | |
| Fund – Class I | | | 100,109 | | | | 279,635 | | | | — | | | | 379,744 | |
| | | | | | | | | | | | | | | | | |
| North Square Dynamic | | | | | | | | | | | | | | | | |
| Small Cap Fund – Class I | | | 1,032,441 | | | | 430,124 | | | | (674,353 | ) | | | 788,212 | |
| | | | | | | | | | | | | | | | | |
| North Square McKee Bond | | | | | | | | | | | | | | | | |
| Fund – Class R6** | | | 150,441 | | | | 1,713 | | | | — | | | | 152,154 | |
| | | | | | | | | | | | | | | | | |
| North Square Preferred | | | | | | | | | | | | | | | | |
| and Income Securities | | | | | | | | | | | | | | | | |
| Fund – Class I* | | | 620,914 | | | | 53,632 | | | | (244,066 | ) | | | 430,479 | |
| | | | | | | | | | | | | | | | | |
| North Square Strategic | | | | | | | | | | | | | | | | |
| Income Fund – Class I | | | 121,291 | | | | 108,319 | | | | (111,929 | ) | | | 117,681 | |
| | | | | | | | | | | | | | | | 2,269,989 | |
* | | Effective January 11th, 2022, the North Square Oak Ridge Small Cap Growth Fund, North Square Oak Ridge All Cap Growth Fund, North Square Oak Ridge Dividend Growth Fund, and North Square Advisory Research All Cap Value Fund changed names to the North Square Spectrum Alpha Fund, North Square Advisory Research Small Cap Growth Fund, North Square Preferred and Income Securities Fund, and North Square Advisory Research Small Cap Value Fund, respectively. |
** | | Effective December 1, 2021, North Square McKee Bond Fund Class I and Class Y were reclassified to Class R6 and Class I, respectively. |
Note 12 – Derivative and Other Financial Instruments
At May 31, 2022, the North Square Trilogy Alternative Return Fund held derivative and other financial instruments which are not subject to a master netting arrangement.
The following table presents the fair value of derivative instruments for the North Square Trilogy Alternative Return Fund as of May 31, 2022 as presented on the Fund’s Statement of Assets and Liabilities:
| | |
| | | Fair Value | |
| Derivatives Not Accounted for | | Statement of Assets | | | | | | |
| as Hedging Instruments | | and Liabilities Location | | Assets | | | Liabilities | |
| North Square Trilogy Alternative Return Fund | | | | | | | | |
Option Contracts | | | | | | | | |
Equity Contracts (Purchased Options) | | Investments, at value | | $ | 6,866,226 | | | $ | — | |
Equity Contracts (Written Options) | | Written options contracts, at value | | | — | | | | 2,669,375 | |
Total Option Contracts | | | | $ | 6,866,226 | | | $ | 2,669,375 | |
The following table presents the results of the derivative trading and information related to volume for the year ended May 31, 2022 for the North Square Trilogy Alternative Return Fund. The below captions of “Net Realized” and “Net Change in Unrealized” correspond to the captions in the Fund’s Statement of Operations.
| | | Gain (Loss) from Trading | |
| | | | | | Net Change | |
| Fund and Type of Derivative Instrument | | Net Realized | | | in Unrealized | |
| North Square Trilogy Alternative Return Fund | | | | | | |
Option Contracts | | | | | | |
Equity Contracts (Purchased Options) | | $ | (4,174,982 | ) | | $ | 2,776,240 | |
Equity Contracts (Written Options) | | | (815,172 | ) | | | 906,736 | |
Total Option Contracts | | $ | (4,990,154 | ) | | $ | 3,682,976 | |
North Square Funds
NOTES TO FINANCIAL STATEMENTS – Continued
May 31, 2022
The average monthly notional amount is shown as an indicator of volume. The average monthly notional amounts held in the Trilogy Alternative Return Fund during the year ended May 31, 2022 were:
| | Average Notional | |
| | Long | Short | |
Option contracts | $6,296,943 | $(2,385,268) | |
Please refer to the Fund’s prospectus for a full listing of risks associated with these investments.
Note 13 – Underlying Investment in Other Investment Companies
As of May 31, 2022, the Tactical Growth Fund and Tactical Defensive Fund currently invest 31.7% and 100.1%, respectively, of its net assets in First American Treasury Obligations Fund – Class X. The Tactical Growth investment and Tactical Defensive investment in First American Treasury Obligations Fund – Class X represent approximately 2.36% and 1.04%, respectively, of First American Treasury Obligations Fund – Class X net assets, which was approximately $7,019,929,322 at May 31, 2022. If the Advisor determines that it is in the best interest of the Funds and their shareholders, it may redeem its investment.
The performance of the Funds may be directly affected by the performance of the First American Treasury Obligations Fund – Class X. The investment strategy of First American Treasury Obligations Fund – Class X: invest exclusively in short-term U.S. Treasury obligations, including repurchase agreements secured by U.S. Treasury obligations. The net expense ratio per the October 29, 2021 Prospectus of the First American Treasury Obligations Fund – Class X was 0.14%. The financial statements of the First American Treasury Obligations Fund – Class X can be found at the First American website www.firstamericanfunds.com or the Securities and Exchange Commission’s website www.sec.gov and should be read in conjunction with the Fund’s financial statements.
Note 14 – Accounting Regulations
Rule 18f-4
In October 2020, the SEC adopted new regulations governing the use of derivatives by registered investment companies (“Rule 18f-4”). Rule 18f-4 will impose limits on the amount of derivatives a Fund can enter into, eliminate the asset segregation framework currently used by funds to comply with Section 18 of the 1940 Act, and require funds whose use of derivatives is greater than a limited specified amount to establish and maintain a comprehensive derivatives risk management program and appoint a derivatives risk manager. Funds will be required to comply with Rule 18f-4 by August 19, 2022. It is not currently clear what impact, if any, Rule 18f-4 will have on the availability, liquidity or performance of derivatives. Management has evaluated the potential impact of Rule 18f-4 on the Fund(s) and does not anticipate any changes in how a Fund uses derivatives.
Rule 2a-5
In December 2020, the SEC adopted a new rule providing a framework for fund valuation practices (“Rule 2a-5”). Rule 2a-5 establishes requirements for determining fair value in good faith for purposes of the 1940 Act. Rule 2a-5 will permit fund boards to designate certain parties to perform fair value determinations, subject to board oversight and certain other conditions. Rule 2a-5 also defines when market quotations are “readily available” for purposes of the 1940 Act and the threshold for determining whether a fund must fair value a security. In connection with Rule 2a-5, the SEC also adopted related recordkeeping requirements and is rescinding previously issued guidance, including with respect to the role of a board in determining fair value and the accounting and auditing of fund investments. The Funds will be required to comply with the rules by September 8, 2022. Management is currently assessing the potential impact of the new rules on the Funds’ financial statements.
Rule 12d1-4
The SEC adopted new Rule 12d1-4, which will allow registered investment companies (including business development companies (“BDCs”), unit investment trusts (“UITs”), closed-end funds, exchange-traded funds (“ETFs”), and exchange-traded managed funds (“ETMFs”) (an “acquiring” fund), to invest in other investment companies (an “acquired fund”), including private funds under a specific exception, beyond the limits of Section 12(d)(1), subject to the conditions of the rule. Rule 12d1-4 became effective January 19, 2021.
London Interbank Offered Rate (“LIBOR”)
In March 2020, FASB issued ASU 2020-04, Reference Rate Reform: Facilitation of the Effects of Reference Rate Reform on Financial Reporting. The main objective of the new guidance is to provide relief to companies that will be impacted by the expected change in benchmark interest rates at the end of 2021, when participating banks will no longer be required to submit London Interbank Offered Rate (“LIBOR”) quotes by the UK Financial Conduct Authority. The new guidance allows companies to, provided the only change to existing contracts are a change to an approved benchmark interest rate, account for modifications as a continuance of the existing
North Square Funds
NOTES TO FINANCIAL STATEMENTS – Continued
May 31, 2022
contract without additional analysis. In addition, derivative contracts that qualified for hedge accounting prior to modification, will be allowed to continue to receive such treatment, even if critical terms change due to a change in the benchmark interest rate. For new and existing contracts, the Funds may elect to apply the amendments as of March 12, 2020 through December 31, 2022. Management is currently assessing the impact of the ASU’s adoption to the Funds’ financial statements and various filings.
Note 15 – Events Subsequent to the Fiscal Period End
The Funds have adopted financial reporting rules regarding subsequent events which require an entity to recognize in the financial statements the effects of all subsequent events that provide additional evidence about conditions that existed at the date of the balance sheet. Management has evaluated the Funds’ related events and transactions that occurred through the date of issuance of the Funds’ financial statements.
REPORT OF INDEPENDENT REGISTERED PUBLIC ACCOUNTING FIRM
To the Board of Trustees and Shareholders of North Square Investments Trust
Opinion on the Financial Statements
We have audited the accompanying statements of assets and liabilities of the North Square Spectrum Alpha Fund (Formerly, North Square Oak Ridge Small Cap Growth Fund), North Square Dynamic Small Cap Fund, North Square Advisory Research Small Cap Growth Fund (Formerly, North Square Oak Ridge All Cap Growth Fund), North Square Multi Strategy Fund, North Square Preferred and Income Securities Fund (Formerly, North Square Oak Ridge Dividend Growth Fund), North Square Tactical Growth Fund, North Square Tactical Defensive Fund and North Square Trilogy Alternative Return Fund (the “Funds”), each a series of North Square Investments Trust (the “Trust”), including the schedules of investments, as of May 31, 2022, the related statements of operations, the statements of changes in net assets, and the financial highlights for each of the periods indicated in the table below, and the related notes (collectively referred to as the “financial statements”). In our opinion, the financial statements and financial highlights referred to above present fairly, in all material respects, the financial position of the Funds as of May 31, 2022, the results of their operations, the changes in their net assets, and their financial highlights for the periods indicated in the table below, in conformity with accounting principles generally accepted in the United States of America.
| Individual Funds | | | |
| Constituting | | | |
| North Square | Statement of | Statements of | |
| Investments Trust | Operations | Changes in Net Assets | Financial Highlights |
| North Square Spectrum Alpha Fund, | For the year ended | For each of the two years in the | For each of the five years in the |
| North Square Dynamic Small Cap Fund, | May 31, 2022 | period ended May 31, 2022 | period ended May 31, 2022 |
| North Square Advisory Research Small | | | |
| Cap Growth Fund, North Square Multi | | | |
| Strategy Fund, North Square Preferred | | | |
| and Income Securities Fund | | | |
| | | | |
| North Square Tactical Growth Fund, | For the year ended | For the year ended | For the year ended May 31, 2022 |
| North Square Tactical Defensive Fund, | May 31, 2022 | May 31, 2022 | |
| North Square Trilogy Alternative | | | |
| Return Fund | | | |
With respect to the North Square Tactical Growth Fund, North Square Tactical Defensive Fund and North Square Trilogy Alternative Return Fund, the statement of changes in net assets for the year ended May 31, 2021 and the financial highlights for each of the four years in the period ended May 31, 2021 were audited by other auditors, and in their opinion dated July 29, 2021 they expressed an unqualified opinion on said financial statements and financial highlights.
Basis for Opinion
These financial statements are the responsibility of the Funds’ management. Our responsibility is to express an opinion on the Funds’ financial statements based on our audits. We are a public accounting firm registered with the Public Company Accounting Oversight Board (United States) (“PCAOB”) and are required to be independent with respect to the Funds in accordance with the U.S. federal securities laws and the applicable rules and regulations of the Securities and Exchange Commission and the PCAOB. We have served as the auditor of one or more of the funds in the Trust since 2013.
We conducted our audits in accordance with the standards of the PCAOB. Those standards require that we plan and perform the audits to obtain reasonable assurance about whether the financial statements are free of material misstatement, whether due to error or fraud. The Funds are not required to have, nor were we engaged to perform, an audit of the Funds’ internal control over financial reporting. As part of our audits we are required to obtain an understanding of internal control over financial reporting, but not for the purpose of expressing an opinion on the effectiveness of the Funds’ internal control over financial reporting. Accordingly, we express no such opinion.
Our audits included performing procedures to assess the risks of material misstatement of the financial statements, whether due to error or fraud, and performing procedures that respond to those risks. Such procedures included examining, on a test basis, evidence regarding the amounts and disclosures in the financial statements. Our audits also included evaluating the accounting principles used and significant estimates made by management, as well as evaluating the overall presentation of the financial statements. Our procedures included confirmation of securities owned as of May 31, 2022 by correspondence with the custodian and brokers or by other appropriate auditing procedures where replies from broker were not received. We believe that our audits provide a reasonable basis for our opinion.
TAIT, WELLER & BAKER LLP
Philadelphia, Pennsylvania
July 29, 2022
North Square Funds
SUPPLEMENTAL INFORMATION (Unaudited)
Corporate Dividends Received Deduction
For corporate shareholders, the percent of ordinary income distributions qualifying for the corporate dividends received deduction for the fiscal year ended May 31, 2022 was as follows:
| Spectrum Alpha Fund | | | 3.16 | % | | Preferred and Income Securities Fund | | | 89.11 | % |
| Dynamic Small Cap Fund | | | 9.77 | % | | Tactical Growth Fund | | | 19.89 | % |
| Advisory Research Small Cap Growth Fund | | | 100.00 | % | | Tactical Defensive Fund | | | 0.00 | % |
| Multi Strategy Fund | | | 0.00 | % | | Trilogy Alternative Return Fund | | | 100.00 | % |
Qualified Dividend Income
For the fiscal year ended May 31, 2022, certain dividends paid by the Funds may be subject to a maximum tax rate of 23.8%, as provided for by the Jobs and Growth Tax Relief Reconciliation Act of 2003. The percentage of dividends declared from ordinary income designated as qualified dividend income was as follows:
| Spectrum Alpha Fund | | | 3.24 | % | | Preferred and Income Securities Fund | | | 93.02 | % |
| Dynamic Small Cap Fund | | | 9.53 | % | | Tactical Growth Fund | | | 19.92 | % |
| Advisory Research Small Cap Growth Fund | | | 100.00 | % | | Tactical Defensive Fund | | | 0.00 | % |
| Multi Strategy Fund | | | 0.00 | % | | Trilogy Alternative Return Fund | | | 100.00 | % |
Long-Term Capital Gain Designation
For the fiscal year ended May 31, 2022, the Funds designate a portion of distributions as 20.00% rate gain distributions for the purposed of the dividends paid deduction. The dollar amount by fund was as follows:
| Spectrum Alpha Fund | | $ | 15,159,012.53 | | | Preferred and Income Securities Fund | | $ | 1,103,422.50 | |
| Dynamic Small Cap Fund | | $ | 1,222,457.25 | | | Tactical Growth Fund | | $ | 8,625,075.04 | |
| Advisory Research Small Cap Growth Fund | | $ | 2,953,134.43 | | | Tactical Defensive Fund | | $ | — | |
| Multi Strategy Fund | | $ | 3,299,536.77 | | | Trilogy Alternative Return Fund | | $ | — | |
Trustees and Officers Information
Additional information about the Trustees is included in each Fund’s Statement of Additional Information which is available, without charge, upon request by calling (855) 551-5521 or on the Funds’ website at www.northsquareinvest.com. The Trustees and officers of each Fund and their principal occupations during the past five years are as follows:
| | | | | Number of | |
| | | | | Portfolios | |
| | | | | in Fund | Other Directorship/ |
Name, Addressa, | | | | Complex | Trusteeship |
| Year of Birth and | | Term of Office | | Overseen | Positions held by |
| Position(s) with | Position with | and Length of | Principal Occupations During | by | Trustee During |
| the Trust | the Trust | Time Servedb | the Past Five Years or Longer | Trusteec | the Past 5 Years |
| Independent Trustees | | | | | |
| David B. Boon | Trustee | 08/2018 to present | Chief Financial Officer and Managing | 12 | None |
| (1960) | | | Director, Eagle Capital Management, LLC | | |
| | | | (since 2018); Chief Financial Officer and | | |
| | | | Partner, Cedar Capital, LLC (2013 – 2018). | | |
North Square Funds
SUPPLEMENTAL INFORMATION (Unaudited) – Continued
| | | | | Number of | |
| | | | | Portfolios | |
| | | | | in Fund | Other Directorship/ |
Name, Addressa, | | | | Complex | Trusteeship |
| Year of Birth and | | Term of Office | | Overseen | Positions held by |
| Position(s) with | Position with | and Length of | Principal Occupations During | by | Trustee During |
| the Trust | the Trust | Time Servedb | the Past Five Years or Longer | Trusteec | the Past 5 Years |
| Donald J. Herrema | Chairman of the | 08/2018 to present | Vice Chair and Chief Investment Officer, | 12 | Chairman and Director |
| (1952) | Board and Trustee | | Independent Life Insurance Company | | Emeritus, TD Funds |
| | | | (since 2018); Financial Services Executive, | | USA (2009 – 2019) |
| | | | Advisor and Founder of BlackSterling | | Director, Abel Noser |
| | | | Partners, LLC (private investments and | | Holdings, LLC (since |
| | | | advisory firm) (since 2004); Executive Vice | | 2016); Member, USC |
| | | | Chairman and Senior Advisor at Kennedy | | Marshall Business School |
| | | | Wilson (real estate investment company) | | Board (since 2010); |
| | | | (2009 – 2016). | | President and Trustee, |
| | | | | | Christ Church |
| | | | | | (2008 – 2016); Director, |
| | | | | | Lepercq de Neuflize |
| | | | | | (2009 – 2016); Chairman |
| | | | | | and Trustee Emeritus |
| | | | | | (since 2014), Director, |
| | | | | | FEG Investment Advisors |
| | | | | | (since 2017); Director, |
| | | | | | Independent Life |
| | | | | | Insurance Company |
| | | | | | (since 2018). |
| Catherine A. Zaharis | Trustee | 08/2018 to present | Professor of Practice (since 2019), Director, | 12 | Director, The |
| (1960) | | | Professional/Employer Development, | | Vantagepoint Funds |
| | | | Finance Department (2015 – 2019), Adjunct | | (2015 – 2016). |
| | | | Lecturer (2010 – 2019), and Business Director, | | |
| | | | MBA Finance Career Academy (2008 – 2015), | | |
| | | | University of Iowa, Tippie College of Business; | | |
| | | | Chair (2013 – 2016), Director (1999 – 2016), | | |
| | | | and Investment Committee Member (1999 – | | |
| | | | 2013) and Chair (2003 – 2013), | | |
| | | | University of Iowa Foundation. | | |
Interested Trusteesd | | | | | |
| Mark D. Goodwin | Trustee and | 08/2018 to present | Chief Executive Officer, North Square | 12 | None |
| (1964) | President | | Investments LLC (since July 2018); President | | |
| | | | and Chief Operating Officer (2015 – July 2018) | | |
| | | | and Executive Vice President (2014 – 2015), | | |
| | | | Oak Ridge Investments, LLC. | | |
North Square Funds
SUPPLEMENTAL INFORMATION (Unaudited) – Continued
| | | | | Number of | |
| | | | | Portfolios | |
| | | | | in Fund | Other Directorship/ |
Name, Addressa, | | | | Complex | Trusteeship |
| Year of Birth and | | Term of Office | | Overseen | Positions held by |
| Position(s) with | Position with | and Length of | Principal Occupations During | by | Trustee During |
| the Trust | the Trust | Time Servedb | the Past Five Years or Longer | Trusteec | the Past 5 Years |
| Officers of the Trust: | | | | | |
| Alan E. Molotsky | Treasurer | 08/2018 to present | Chief Financial Officer, Chief Compliance Officer | N/A | N/A |
| (1956) | and | | (July 2018 – March 2021), General Counsel and | | |
| | Secretary | | Senior Managing Director, North Square | | |
| | | | Investments, LLC (since July 2018); Chief | | |
| | | | Financial Officer, Chief Compliance Officer, | | |
| | | | General Counsel and Executive Vice President, | | |
| | | | Oak Ridge Investments LLC (2004 – July 2018). | | |
| David J. Gaspar | Vice | 08/2018 to present | Chief Operations and Information Officer and | N/A | N/A |
| (1954) | President | | Senior Managing Director, North Square | | |
| | | | Investments, LLC (since July 2018); Chief | | |
| | | | Operations Officer, Chief Information Officer, | | |
| | | | Chief Information Security Officer and Executive | | |
| | | | Vice President, Oak Ridge Investments, LLC | | |
| | | | (2000 – July 2018). | | |
| Douglas N. Tyre | Chief | 09/2018 to present | Assistant Compliance Director, Cipperman | N/A | N/A |
| (1980) | Compliance | | Compliance Services, LLC (since 2014). | | |
| | Officer | | | | |
| a. | The business address of each Trustee and officer is c/o North Square Investments, LLC, 10 South LaSalle Street, Suite 1925, Chicago, Illinois 60603. |
| b. | Trustees and officers serve until their successors are duly elected and qualified. |
| c. | The term “Fund Complex” applies to the nine portfolios that currently comprise the Trust, which consists of the five Funds, the North Square Advisory Research Small Cap Value Fund, and the North Square Strategic Income Fund, the North Square Altrinsic International Equity Fund, and the North Square McKee Bond Fund. |
| d. | Mr. Goodwin is considered to be an “interested person” of the Trust as that term is defined in the 1940 Act by virtue of his positions with the Adviser. |
North Square Funds
SUPPLEMENTAL INFORMATION (Unaudited) – Continued
Liquidity Risk Management Program
In accordance with Rule 22e-4 under the Investment Company Act of 1940, as amended (the “Liquidity Rule”), the North Square Investments Trust (the “Trust”) has adopted and implemented a liquidity risk management program (the “Program”) for the funds within the Trust (the “Funds”). The Program seeks to assess and manage each Funds’ liquidity risk. “Liquidity risk” is defined under the Liquidity Rule as the risk that each Fund is unable to meet redemption requests without significantly diluting remaining investors’ interests in the Fund. The Trust’s Board of Trustees (the “Board”) has approved the designation of the Funds’ investment adviser as the administrator for the Program (the “Trust Program Administrator”).
At its meeting on December 8-9, 2021, the Board received and reviewed a written report (the “Report”) from the Trust’s Vice President, on behalf of the Trust Program Administrator, concerning the operation of the Program for the period of October 1, 2020 through September 30, 2021 (the “Period”). The Report noted that the Program complied with the key factors for consideration under the Liquidity Rule for assessing, managing and periodically reviewing a Fund’s liquidity risk, including the following: (1) the periodic assessment (no less frequently than annually) of certain factors that influence each Fund’s liquidity risk; (2) the periodic classification (no less frequently than monthly) of the Fund’s investments into one of four liquidity categories that reflect an estimate of their liquidity under current market conditions; (3) a 15% limit on the acquisition of “illiquid investments” (as defined under the Liquidity Rule); (4) to the extent a Fund does not invest primarily in “highly liquid investments” (as defined under the Liquidity Rule), the determination of a minimum percentage of the Fund’s assets that generally will be invested in highly liquid investments (an “HLIM”); (5) if a Fund has established an HLIM, the periodic review (no less frequently than annually) of the HLIM and the adoption of policies and procedures for responding to a shortfall of the Fund’s highly liquid investments below its HLIM; and (6) periodic reporting to the Board.
The Report summarized the operation of the Program and the information and factors considered by the Trust Program Administrator in assessing whether the Program has been adequately and effectively implemented with respect to the Funds. The Report considered each Fund’s liquidity risk under both normal and reasonably foreseeable stressed market conditions using certain factors required by the Rule and the Program, to the extent deemed appropriate by the Trust Program Administrator. The Report stated that the Funds have retained ICE Data Services, a third-party vendor, to provide a liquidity risk classification specified by the Rule. The Report also noted that each Fund primarily held investments that were classified as highly liquid during the review period and that each Fund’s portfolio is expected to continue to primarily hold highly liquid investments. Thus, the Trust Program Administrator concluded in the Report that each Fund is considered a “primarily highly liquid fund” (as defined in the Rule and Program) and each Fund can therefore rely on the exclusion in the Rule from the requirements to establish an HLIM and to adopt policies and procedures for responding to a HLIM shortfall. There were no material changes to the Program during the Period.
Based on its review, the Report of the Trust Program Administrator concluded that the Program is reasonably designed to assess and manage liquidity risk and has been and continues to be adequately and effectively implemented to monitor and, as applicable, respond to each Funds’ liquidity developments.
North Square Funds
EXPENSE EXAMPLES
For the Six Months Ended May 31, 2022 (Unaudited)
Expense Examples
As a shareholder of the Funds, you incur two types of costs: (1) transaction costs, including sales charges (loads) on purchase payments (Class A only); and redemption fees; and (2) ongoing costs, including management fees; distribution and/or service (12b-1) fees (Class A and C only); and other Fund expenses. The examples below are intended to help you understand your ongoing costs (in dollars) of investing in the Funds and to compare these costs with the ongoing costs of investing in other mutual funds.
These examples are based on an investment of $1,000 invested at the beginning of the period and held for the entire six month period from December 1, 2021 to May 31, 2022.
Actual Expenses
The information in the row titled “Actual Performance” of the table below provides actual account values and actual expenses. You may use the information in these columns, together with the amount you invested, to estimate the expenses that you paid over the period. Simply divide your account value by $1,000 (for example, an $8,600 account value divided by $1,000 = 8.6), then multiply the result by the number in the appropriate row for your share class, in the column titled “Expenses Paid During Period” to estimate the expenses you paid on your account during this period.
Hypothetical Example for Comparison Purposes
The information in the row titled “Hypothetical (5% annual return before expenses)” of the table below provides hypothetical account values and hypothetical expenses based on each Fund’s actual expense ratios and an assumed rate of return of 5% per year before expenses, which is not the Fund’s actual return. The hypothetical account values and expenses may not be used to estimate the actual ending account balance or expenses you paid for the period. You may use this information to compare the ongoing costs of investing in the Fund and other funds. To do so, compare these 5% hypothetical examples with the 5% hypothetical examples that appear in the shareholder reports of the other funds.
Please note that the expenses shown in the table are meant to highlight your ongoing costs only and do not reflect any transaction costs, such as sales charges (loads) or redemption fees. Therefore, the information in the row titled “Hypothetical (5% annual return before expenses)” is useful in comparing ongoing costs only, and will not help you determine the relative total costs of owning different funds. In addition, if these transactional costs were included, your costs would have been higher.
| | | Beginning | Ending | Expense Paid |
| | | Account | Account | During |
| | | Value | Value | Period* |
| Spectrum Alpha Fund | | | 11/30/21 – 5/31/22 |
Class A | Actual Performance | $1,000.00 | $ 775.60 | $5.86 |
| | Hypothetical (5% annual return before expenses) | $1,000.00 | $1,018.33 | $6.66 |
Class I | Actual Performance | $1,000.00 | $ 776.60 | $4.76 |
| | Hypothetical (5% annual return before expenses) | $1,000.00 | $1,019.57 | $5.41 |
| * | Expenses are equal to the Fund’s annualized expense ratios of 1.32%, and 1.07% for Class A and Class I, respectively, multiplied by the average account values over the period, multiplied by 182/365 (to reflect the six month period). The expense ratios reflect an expense waiver. Assumes all dividends and distributions were reinvested. |
| | | Beginning | Ending | Expense Paid |
| | | Account | Account | During |
| | | Value | Value | Period* |
| Dynamic Small Cap Fund | | | 11/30/21 – 5/31/22 |
Class I | Actual Performance | $1,000.00 | $ 870.70 | $4.62 |
| | Hypothetical (5% annual return before expenses) | $1,000.00 | $1,020.00 | $4.99 |
| * | Expenses are equal to the Fund’s annualized expense ratio of 0.99%, multiplied by the average account values over the period, multiplied by 182/365 (to reflect the six month period). The expense ratio reflects an expense waiver. Assumes all dividends and distributions were reinvested. |
North Square Funds
EXPENSE EXAMPLES – Continued
For the Six Months Ended May 31, 2022 (Unaudited)
| | | Beginning | Ending | Expense Paid |
| | | Account | Account | During |
| | | Value | Value | Period* |
| Small Cap Growth Fund | | | 11/30/21 – 5/31/22 |
Class I | Actual Performance | $1,000.00 | $ 727.80 | $4.05 |
| | Hypothetical (5% annual return before expenses) | $1,000.00 | $1,020.24 | $4.73 |
| * | Expenses are equal to the Fund’s annualized expense ratio of 0.94%, multiplied by the average account values over the period, multiplied by 182/365 (to reflect the six month period). The expense ratio reflects an expense waiver. Assumes all dividends and distributions were reinvested. |
| | | Beginning | Ending | Expense Paid |
| | | Account | Account | During |
| | | Value | Value | Period* |
| Multi Strategy Fund | | | 11/30/21 – 5/31/22 |
Class A | Actual Performance | $1,000.00 | $ 905.20 | $3.80 |
| | Hypothetical (5% annual return before expenses) | $1,000.00 | $1,020.94 | $4.03 |
Class I | Actual Performance | $1,000.00 | $ 906.20 | $2.62 |
| | Hypothetical (5% annual return before expenses) | $1,000.00 | $1,022.19 | $2.78 |
| * | Expenses are equal to the Fund’s annualized expense ratios of 0.80% and 0.55% for Class A and Class I, respectively, multiplied by the average account values over the period, multiplied by 182/365 (to reflect the six month period). The expense ratios reflect a recovery of previously waived fees. Assumes all dividends and distributions were reinvested. |
| | | Beginning | Ending | Expense Paid |
| | | Account | Account | During |
| | | Value | Value | Period* |
| Preferred and Income Securities Fund | | | 11/30/21 – 5/31/22 |
Class I | Actual Performance | $1,000.00 | $ 922.90 | $4.65 |
| | Hypothetical (5% annual return before expenses) | $1,000.00 | $1,020.09 | $4.89 |
| * | Expenses are equal to the Fund’s annualized expense ratio of 0.97%, multiplied by the average account values over the period, multiplied by 182/365 (to reflect the six month period). The expense ratio reflects an expense waiver. Assumes all dividends and distributions were reinvested. |
| | | Beginning | Ending | Expense Paid |
| | | Account | Account | During |
| | | Value | Value | Period* |
| Tactical Defensive Fund | | | 11/30/21 – 5/31/22 |
Class A | Actual Performance | $1,000.00 | $ 956.90 | $ 9.15 |
| | Hypothetical (5% annual return before expenses) | $1,000.00 | $1,015.58 | $ 9.42 |
Class C | Actual Performance | $1,000.00 | $ 953.30 | $12.82 |
| Hypothetical (5% annual return before expenses) | | | $13.20 |
Class I | Actual Performance | $1,000.00 | $ 957.90 | $ 8.14 |
| | Hypothetical (5% annual return before expenses) | $1,000.00 | $1,016.61 | $ 8.39 |
| * | Expenses are equal to the Fund’s annualized expense ratios of 1.87%, 2.63% and 1.67% for Class A, Class C and Class I, respectively, multiplied by the average account values over the period, multiplied by 182/365 (to reflect the six month period). The expense ratios reflect a recovery of previously waived fees. Assumes all dividends and distributions were reinvested. |
North Square Funds
EXPENSE EXAMPLES – Continued
For the Six Months Ended May 31, 2022 (Unaudited)
| | | Beginning | Ending | Expense Paid |
| | | Account | Account | During |
| | | Value | Value | Period* |
| Tactical Growth Fund | | | 11/30/21 – 5/31/22 |
Class A | Actual Performance | $1,000.00 | $ 919.50 | $ 7.42 |
| | Hypothetical (5% annual return before expenses) | $1,000.00 | $1,017.20 | $ 7.80 |
Class C | Actual Performance | $1,000.00 | $ 916.00 | $10.99 |
| | Hypothetical (5% annual return before expenses) | $1,000.00 | $1,013.46 | $11.55 |
Class I | Actual Performance | $1,000.00 | $ 920.60 | $ 6.22 |
| | Hypothetical (5% annual return before expenses) | $1,000.00 | $1,018.45 | $ 6.54 |
| * | Expenses are equal to the Fund’s annualized expense ratios of 1.55%, 2.30% and 1.30% for Class A, Class C and Class I, respectively, multiplied by the average account values over the period, multiplied by 182/365 (to reflect the six month period). The expense ratios reflect a recovery of previously waived fees. Assumes all dividends and distributions were reinvested. |
| | | Beginning | Ending | Expense Paid |
| | | Account | Account | During |
| | | Value | Value | Period* |
| Trilogy Alternative Return Fund | | | 11/30/21 – 5/31/22 |
Class A | Actual Performance | $1,000.00 | $ 946.50 | $ 7.91 |
| | Hypothetical (5% annual return before expenses) | $1,000.00 | $1,016.80 | $ 8.20 |
Class C | Actual Performance | $1,000.00 | $ 942.90 | $11.53 |
| | Hypothetical (5% annual return before expenses) | $1,000.00 | $1,013.06 | $11.94 |
Class I | Actual Performance | $1,000.00 | $ 947.60 | $ 6.70 |
| | Hypothetical (5% annual return before expenses) | $1,000.00 | $1,018.05 | $ 6.94 |
| * | Expenses are equal to the Fund’s annualized expense ratios of 1.63%, 2.38% and 1.38% for Class A, Class C and Class I, respectively, multiplied by the average account values over the period, multiplied by 182/365 (to reflect the six month period). The expense ratios reflect a recovery of previously waived fees. Assumes all dividends and distributions were reinvested. |
(This Page Intentionally Left Blank.)
North Square Funds
Advisor
North Square Investments, LLC
10 South LaSalle Street, Suite 1925
Chicago, Illinois 60603
| Sub-Advisor | Sub-Advisor |
| Algert Global LLC | NSI Retail Advisors, LLC |
| 101 California Street, Suite 4225 | One Gateway Center |
| San Francisco, California 94111 | Pittsburgh, Pennsylvania 15222 |
| | |
| | |
| Sub-Advisor | Sub-Advisor |
| Red Cedar Investment Management, LLC | Advisor Research Inc. |
| 333 Bridge Street NW, Suite 601 | 180 North Stetson Avenue, Suite 5500 |
| Grand Rapids, Michigan 49504 | Chicago, Illinois 60601 |
| | |
Independent Registered Public Accounting Firm
Tait, Weller & Baker LLP
50 South 16th Street, Suite 2900
Philadelphia, Pennsylvania 19102
Custodian
U.S. Bank, N.A.
1555 North RiverCenter Drive, Suite 300
Milwaukee, Wisconsin 53212
Fund Administrator, Transfer Agent and Fund Accountant
U.S. Bank Global Fund Services
615 East Michigan Street
Milwaukee, Wisconsin 53202
Distributor
Compass Distributors LLC
Three Canal Plaza, Suite 100
Portland, Maine 04101
www.foreside.com
FUND INFORMATION
| Fund Name | | Ticker | CUSIP |
North Square Spectrum Alpha Fund | Class A | ORIGX | 66263L304 |
North Square Spectrum Alpha Fund | Class I | ORIYX | 66263L858 |
North Square Dynamic Small Cap Fund | Class I | ORSIX | 66263L825 |
North Square Advisory Research Small Cap Growth Fund | Class I | ODGIX | 66263L601 |
North Square Multi Strategy Fund | Class A | ORILX | 66263L700 |
North Square Multi Strategy Fund | Class I | PORYX | 66263L833 |
North Square Preferred and Income Securities Fund | Class I | ORDNX | 66263L882 |
North Square Tactical Growth Fund | Class A | ETFAX | 66263L734 |
North Square Tactical Growth Fund | Class C | ETFCX | 66263L742 |
North Square Tactical Growth Fund | Class I | ETFOX | 66263L726 |
North Square Tactical Defensive Fund | Class A | ETFRX | 66263L718 |
North Square Tactical Defensive Fund | Class C | ETFZX | 66263L692 |
North Square Tactical Defensive Fund | Class I | ETFWX | 66263L684 |
North Square Trilogy Alternative Return Fund | Class A | STTGX | 66263L650 |
North Square Trilogy Alternative Return Fund | Class C | STTCX | 66263L668 |
North Square Trilogy Alternative Return Fund | Class I | STTIX | 66263L676 |
Privacy Principles of the North Square Funds for Shareholders
The Funds are committed to maintaining the privacy of their shareholders and to safeguarding their non-public personal information. The following information is provided to help you understand what personal information the Funds collect, how we protect that information and why, in certain cases, we may share information with select other parties.
Generally, the Funds do not receive any non-public personal information relating to their shareholders, although certain non-public personal information of their shareholders may become available to the Funds. The Funds do not disclose any non-public personal information about their shareholders or former shareholders to anyone, except as permitted by law or as is necessary in order to service shareholder accounts (for example, to a transfer agent or third party administrator).
This report is sent to shareholders of the North Square Funds for their information. It is not a Prospectus, circular or representation intended for use in the purchase or sale of shares of the Funds or of any securities mentioned in this report.
Proxy Voting Policies and Procedures
A description of the Funds’ proxy voting policies and procedures related to portfolio securities is available without charge, upon request, by calling the Funds at (855) 551-5521 or on the U.S. Securities and Exchange Commission’s (“SEC”) website at www.sec.gov.
Proxy Voting Record
Information regarding how the Funds voted proxies for portfolio securities, if applicable, during the most recent 12-month period ended June 30, is also available, without charge and upon request by calling (855) 551-5521 or by accessing the Funds’ Form N-PX on the SEC’s website at www.sec.gov.
Portfolio Holdings Disclosure
The Funds file a complete schedule of portfolio holdings with the U.S. Securities and Exchange Commission (the “SEC”) for the first and third quarters of each fiscal year on Form N-Q or Part F of Form N-PORT (beginning with filings after March 31, 2020). The Funds’ Forms N-Q or Part F of Form N-PORT are available on the SEC’s website at www.sec.gov and may be reviewed and copied at the SEC’s Public Reference Room in Washington, D.C. Information on the operation of the Public Reference Room may be obtained by calling (800) 732-0330. The Funds’ Forms N-Q or Part F of Form N-PORT may also be obtained by calling toll-free (855) 551-5521 or by visiting the Funds’ website at www.northsquareinvest.com/fund-reports-holdings.
Householding
The Funds will mail only one copy of shareholder documents, including prospectuses, annual and semi-annual reports and proxy statements, to shareholders with multiple accounts at the same address. This practice is commonly called “householding” and is intended to reduce expenses and eliminate duplicate mailings of shareholder documents. Mailings of your shareholder documents may be householded indefinitely unless you instruct us otherwise. If you do not want the mailing of these documents to be combined with those for other members of your household, please call the Funds at (855) 551-5521.
North Square Funds
c/o U.S. Bancorp Fund Services, LLC
P.O. Box 701
Milwaukee, Wisconsin 53201
1-855-551-5521
Item 2. Code of Ethics.
The Registrant has adopted a code of ethics that applies to the Registrant’s principal executive officer and principal financial officer. The Registrant has not made any substantive amendments to its code of ethics during the period covered by this report. The Registrant has not granted any waivers from any provisions of the code of ethics during the period covered by this report.
A copy of the Registrant’s Code of Ethics is filed herewith.
Item 3. Audit Committee Financial Expert.
The Registrant’s Board of Directors has determined that there is at least one audit committee financial expert serving on its audit committee. David B. Boon is the “audit committee financial expert” and is considered to be “independent” as each term is defined in Item 3 of Form N‑CSR.
Item 4. Principal Accountant Fees and Services.
The Registrant has engaged its principal accountant to perform audit services, audit-related services, tax services and other services during the past two fiscal years. “Audit services” refer to performing an audit of the Registrant's annual financial statements or services that are normally provided by the accountant in connection with statutory and regulatory filings or engagements for those fiscal years. “Audit-related services” refer to the assurance and related services by the principal accountant that are reasonably related to the performance of the audit. “Tax services” refer to professional services rendered by the principal accountant for tax compliance, tax advice, and tax planning. The following table details the aggregate fees billed or expected to be billed for each of the last two fiscal years for audit fees, audit-related fees, tax fees and other fees by the principal accountant.
| | FYE 5/31/2022 | FYE 5/31/2021 |
| ( a ) Audit Fees | $119,760 | $84,900 |
| ( b ) Audit-Related Fees | $0 | $0 |
| ( c ) Tax Fees | $20,000 | $12,500 |
| ( d ) All Other Fees | $0 | $0 |
The Audit Committee has adopted pre-approval policies and procedures that require the Audit Committee to pre‑approve all audit and non‑audit services of the Registrant, including services provided to any entity affiliated with the Registrant.
The percentage of fees billed by Tait, Weller & Baker LLP applicable to non-audit services pursuant to waiver of pre-approval requirement were as follows:
| | FYE 5/31/2022 | FYE 5/31/2021 |
Audit-Related Fees | 0% | 0% |
Tax Fees | 0% | 0% |
All Other Fees | 0% | 0% |
All of the principal accountant’s hours spent on auditing the Registrant’s financial statements were attributed to work performed by full‑time permanent employees of the principal accountant.
The Registrant has not been identified by the U.S. Securities and Exchange Commission as having filed an annual report issued by a registered public accounting firm branch or office that is located in a foreign jurisdiction where the Public Company Accounting Oversight Board is unable to inspect or completely investigate because of a position taken by an authority in that jurisdiction.
The Registrant is not a foreign issuer.
Item 5. Audit Committee of Listed Registrants.
Not applicable to Registrants who are not listed issuers (as defined in Rule 10A-3 under the Securities Exchange Act of 1934).
Item 6. Investments.
(a) Schedule of Investments is included as part of the report to shareholders filed under Item 1 of this Form.
(b) Not Applicable.
Item 7. Disclosure of Proxy Voting Policies and Procedures for Closed-End Management Investment Companies.
Not applicable to open-end investment companies.
Item 8. Portfolio Managers of Closed-End Management Investment Companies.
Not applicable to open-end investment companies.
Item 9. Purchases of Equity Securities by Closed‑End Management Investment Company and Affiliated Purchasers.
Not applicable to open-end investment companies.
Item 10. Submission of Matters to a Vote of Security Holders.
There have been no material changes to the procedures by which shareholders may recommend nominees to the Registrant’s Board of Directors.
Item 11. Controls and Procedures.
(a) | The Registrant’s President and Treasurer have reviewed the Registrant's disclosure controls and procedures (as defined in Rule 30a-3(c) under the Investment Company Act of 1940 (the “Act”)) as of a date within 90 days of the filing of this report, as required by Rule 30a-3(b) under the Act and Rules 13a-15(b) or 15d‑15(b) under the Securities Exchange Act of 1934. Based on their review, such officers have concluded that the disclosure controls and procedures are effective in ensuring that information required to be disclosed in this report is appropriately recorded, processed, summarized and reported and made known to them by others within the Registrant and by the Registrant’s service provider. |
(b) | There were no changes in the Registrant's internal control over financial reporting (as defined in Rule 30a-3(d) under the Act) that occurred during the period covered by this report that have materially affected, or are reasonably likely to materially affect, the Registrant's internal control over financial reporting. |
Item 12. Disclosure of Securities Lending Activities for Closed-End Management Investment Companies
Not applicable to open-end investment companies.
Item 13. Exhibits.
(3) Not applicable to open-end investment companies.
| (4) | Change in the Registrant’s public accountant. There was no change in the Registrant’s independent public accountant for the period covered by this report. |
SIGNATURES
Pursuant to the requirements of the Securities Exchange Act of 1934 and the Investment Company Act of 1940, the Registrant has duly caused this report to be signed on its behalf by the undersigned, thereunto duly authorized.
North Square Investments Trust
By: /s/ Mark D. Goodwin
Mark D. Goodwin,
President
Date: August 4, 2022
Pursuant to the requirements of the Securities Exchange Act of 1934 and the Investment Company Act of 1940, this report has been signed below by the following persons on behalf of the Registrant and in the capacities and on the dates indicated.
By: /s/ Mark D. Goodwin
Mark D. Goodwin,
President
Date: August 4, 2022
By: /s/ Alan E. Molotsky
Alan E. Molotsky,
Treasurer
Date: August 4, 2022