UNITED STATES
SECURITIES AND EXCHANGE COMMISSION
Washington, D.C. 20549
FORM N-CSR
CERTIFIED SHAREHOLDER REPORT OF REGISTERED
MANAGEMENT INVESTMENT COMPANIES
Investment Company Act file number: 811-23417
X-Square Balanced Fund, LLC
(Exact name of Registrant as specified in charter)
Centro Internacional de Mercadeo II
90 Carr 165, Suite 803
Guaynabo, PR 00968
(Address of Principal Executive Offices) (Zip code)
Andrew Davalla
Thompson Hine, LLP
3900 Key Center
127 Public Square
Cleveland, OH 4414-1291
(Name and Address of Agent for Service)
Registrant’s Telephone Number, including Area Code: (216) 566-5500
Date of fiscal year end: December 31
Date of reporting period: January 1, 2022 - December 31, 2022
| Item 1. | Report to Stockholders. |
Table of Contents
| Shareholder Letter | 1 |
| Management Discussion of Fund Performance and Portfolio Update | 4 |
| Disclosure of Fund Expenses | 7 |
| Schedule of Investments | 9 |
| Statement of Assets and Liabilities | 12 |
| Statement of Operations | 14 |
| Statement of Changes in Net Assets | 15 |
| Financial Highlights | 17 |
| Notes to Financial Statements | 23 |
| Report of Independent Registered Public Accounting Firm | 30 |
| Additional Information | 31 |
| Managers and Officers | 34 |
| X-Square Balanced Fund | Shareholder Letter |
| | December 31, 2022 (Unaudited) |
Dear Shareholder:
The X-Square Balanced Fund (the “Fund”) registered a 10.88% net loss for its fiscal year ended December 31, 2022 while the 60/40 benchmark portfolio (S&P 500 Index with the Bloomberg US Aggregate Bond Index) lost 15.79% for the period.
Contrary to year 2021, 2022 was characterized by consistent bouts of volatility as measured by the SPX Volatility Index (“VIX”), also known as the fear index. The VIX oscillated aggressively throughout the year between the low 20s and mid 30s. In our opinion, anything above 20 is considered volatile. Volatility was not contained to equities. The MOVE Index, which measures the volatility within the Treasury market, greatly increased relative to 2021 levels. The year was further characterized by wild price swings to the upside and downside across all asset classes. By the second quarter of the year, all three main U.S. indices, the S&P500 Index (“SPX”), the Nasdaq Composite Index (“Nasdaq”), and the Dow Jones Industrial Average Index (“Dow”) were in bear market territory. This is defined as a drop of 20% or more from its previous high. The bear market was not contained to equities nor U.S. markets. European indices, China as well as other asset classes, such as bonds, also descended into bear market territory. Nonetheless, there were assets that acted as havens and appreciated in value during 2022, such as the U.S. dollar (“USD”) and energy companies.
The main driver behind the worst year since the financial crisis was the sharp policy reversal on behalf of the Fed and other main central banks, aside from China. The Federal Reserve, in its battle against inflation, quickly increased rates by 425 basis points during a 9-month period. This has been the most aggressive tightening cycle, in absolute terms, since the 1980s. In addition, the Fed, began to shrink its balance sheet via quantitative tightening at a pace of about $90bn per month, exacerbating the tightening in financial conditions. This aggressive campaign triggered a dollar funding shortage, leading to poor liquidity, mainly within the treasury market, a surge in the USD, a meteoric rise in mortgage rates, while exerting downward pressure on other financial markets and asset prices.
While the U.S. economy did not enter a recession in 2022, there has been a substantial slowdown mainly due to higher rates, and the sunset of fiscal spending measures that were in place for the Covid emergency. Leading economic indices, such as Purchasing Managers’ Index (PMIs) and ISMs, have already entered contraction territory and are at levels that are usually coincident with an economic recession. In addition, the U.S. Treasury curve, which, in the past, has served amongst the most accurate recession predictors, has been consistently flashing warning signs throughout the year. The curve is still inverted, across many maturities, as this letter goes to print. While the short-end of the curve mostly reflects the Fed’s monetary policy, the Treasury inversion signals that there is more risk in the short-term, mainly due to over tightness, than in 20-30 years and, hence, the inversion. The recession fears have increased to the point that even crude oil, once a haven in 2022, has seen its price drop by more than 40% during the second half of 2022. The rapid rise in interest rates across the globe has been so violent that trillions of dollars worth of negative-yielding debt, mainly in Europe, is now positive-yielding. In addition, the violent sell-off in sovereign bonds extended into the mortgage markets, causing affordability to crater as many individuals no longer qualify for mortgages due to material increase in interest costs. We suspect that a significant adjustment in housing prices is in order.
Past performance does not guarantee future results.
| Annual Report | December 31, 2022 | 1 |
| X-Square Balanced Fund | Shareholder Letter |
| | December 31, 2022 (Unaudited) |
Poor and tight financial conditions have caused equity valuations to come down significantly. Companies with poor fundamentals that traded at very high multiples have suffered the most. These companies tend to project distant future cashflows should their expected growth materialize. When the economy turns sour and access to credit becomes expensive and limited, their projected future cashflows become highly jeopardized. Thus, making the company’s valuation very susceptible and sensitive to an increase in interest rates. Contagion has shown that the private markets are no exception. In addition, many cyclical companies sensitive to the economic cycle have seen their earnings deteriorate rapidly, causing their valuations to follow. However, the energy sector benefited from record profits due to rising commodity prices during the first half of the year.
While consumers have pushed back on their spending habits relative to 2021 and many companies have reduced their capital expenditure programs, in light of inflation and recession fears, the labor market has yet to show signs of cracks. While the labor force tightness has been acting as a tailwind for the economy, it has acted as a headwind for U.S. equities. The labor market strength enables the Fed to maintain rates higher for longer than the market anticipates. A phenomenon that has not occurred since the 1980s. Moreover, when recession risks become imminent, banks become more reluctant to extend credit and instead focus on increasing their capital buffers to better fight a potential wave of defaults. Many banks have also halted their shares buyback programs.
We expect the first half of 2023 to be as turbulent as 2022. While inflation has come down significantly from its peak, the Fed has communicated its intentions to at least seeing consistent inflation prints around their target of 2-3%. Thus, they have more work to do as certain components remain extremely sticky. On the other hand, China, the second largest economy, is transitioning from its zero-covid policy and stimulating its economy both monetarily and fiscally, which should act as a tailwind for assets, mainly commodities, globally. Should the Fed successfully control inflation without disrupting the labor market, we believe some stability should materialize towards the second half of the year. Should this happen, we could expect the forward-looking market to discount rate cuts of 2024 at some point this year. Thus, triggering a bounce across asset classes. Furthermore, this should allow companies to continue with their capital expenditure programs and with access to credit and equity at better terms. In the process we will carefully monitor market conditions and take advantage of any opportunities that could result in the creation of shareholder value for the Fund.
Best regards,
X-Square Capital, LLC
| X-Square Balanced Fund | Shareholder Letter |
| | December 31, 2022 (Unaudited) |
Glossary
S&P 500 Index – the SPX is widely regarded as the best single gauge of large-cap U.S. equities and serves as the foundation for a wide range of investment products. The SPX includes 500 leading companies and captures approximately 80% coverage of available market capitalization.
Gross Domestic Product – measures the final market value of all goods and services produced within a country. It is the most frequently used indicator of economic activity.
VIX Index – the VIX is a financial benchmark designed to be an up-to-the-minute market estimate of the expected volatility of the SPX, and is calculated by using the midpoint of real-time SPX option bid/ask quotes.
Nasdaq Composite Index – the NASDAQ Composite Index is a broad-based capitalization-weighted index of stocks in all three NASDAQ tiers: Global Select, Global Market and Capital Markets. The index was developed with a base level of 100 as of February 5, 1971.
Dow Jones Industrial Average – the Dow Jones Industrial Average is a price-weighted average of 30 blue-chip stocks that are generally the leaders in their industry. It has been a widely followed indicator of the stock market since October 1, 1928.
US Aggregate Bond Index – the Bloomberg US Aggregate Bond Index is a broad-based flagship benchmark that measures the investment grade, US dollar-denominated, fixed-rate taxable bond market. The index includes Treasuries, government-related and corporate securities, MBS (agency fixed-rate pass-throughs), ABS and CMBS (agency and non-agency).
Yield – yield refers to the return an investor gets on an investment over a certain period of time.
Purchasing Managers’ Index – an economic indicator that measures the activity level of purchasing managers in a specific sector or economy. It provides insight into current business conditions by tracking changes in variables such as new orders, production, employment, supplier deliveries, and inventories. A score of 50 or above typically indicates expansion in the sector, while a score below 50 suggests contraction.
Institute for Supply Management Index – also known as the ISM Purchasing Managers’ index, is a monthly economic indicator that measures the level of activity in the manufacturing sector in the United States. The Institute surveys purchasing managers from a variety of industries to collect data on variables such as new orders, production, employment, supplier deliveries, and inventories. A score of 50 or above typically indicates expansion in the manufacturing sector, while a score below 50 suggests contraction.
| Annual Report | December 31, 2022 | 3 |
| X-Square Balanced Fund | Management Discussion of Fund
Performance and Portfolio Update |
| | December 31, 2022 (Unaudited) |
Average Annual Total Returns (as of December 31, 2022)
| | 1 Year | 3 Year | Since Inception* |
| X- Square Balanced Fund - A - NAV | -10.88% | 2.94% | 3.97% |
| X- Square Balanced Fund - A - LOAD | -14.22% | 1.65% | 2.72% |
| X- Square Balanced Fund - C - NAV | -11.56% | 2.17% | 3.17% |
| X- Square Balanced Fund - C - LOAD | -12.43% | 2.17% | 3.17% |
| X- Square Balanced Fund - Institutional - NAV | -10.66%** | 3.21% | 4.23% |
| S&P 500 Total Return Index(a) | -18.11% | 7.66% | 9.15% |
| 60% S&P 500 and 40% Bloomberg Barclays US Aggregate(b) | -15.79% | 3.83% | 4.74% |
The performance data quoted above represents past performance. Past performance is not a guarantee of future results. Investment return and value of the X-Square Balanced Fund (the "Fund”) shares will fluctuate so that an investor’s shares, when sold or redeemed, may be worth more or less than their original cost. The table shown above does not reflect the dedication of taxes that a Shareholder would pay on Fund distributions or the redemption of Fund shares but does reflect the reinvestment of all dividends and distributions. Performance may be lower or higher than performance data quoted. Fund performance current to the most recent month-end is available by calling (787) 282-1621 or by visiting www.xsquarecapital.com.
Fund performance reflects contractual reimbursements in effect. In their absence, performance would be reduced. X-Square Capital, LLC (the “Adviser”) has contractually agreed to reduce its fees and/or absorb expenses of the Fund through at least April 30, 2023, to ensure that Net Annual Operating Expenses will not exceed 2.75%, 3.50% and 2.50% of the Fund’s average daily net assets for Class A, Class C and Institutional Class, respectively. The Adviser may not terminate this waiver arrangement without the approval of the Fund’s Board of Managers.
| * | Fund’s inception date is November 1, 2019. |
| ** | Excludes adjustments in accordance with accounting principles generally accepted in the United States of America and as such, the net asset value and total return for shareholder transactions reported to the market may differ from the net asset value for financial reporting purposes. |
| (a) | S&P 500® Total Return Index: the Standard & Poor’s composite index of 500 stocks, a widely recognized, unmanaged index of common stock prices. Total return assumes reinvestment of any dividends and distributions realized during a given time period. This index does not incur expenses and is not available for direct investment. |
| (b) | The 60/40 blend is composed of 60% Standard & Poor’s 500 Index (S&P) and 40% Bloomberg Barclays U.S. Aggregate Bond Index (BC Agg) and assumes monthly rebalancing. The S&P is an unmanaged index that is widely regarded as the standard for measuring large-cap U.S. stock market performance. The BC Agg is an unmanaged index that is widely regarded as a standard for measuring U.S. investment grade bond market performance. These indices do not incur expenses and are not available for direct investment. These indices include reinvestment of dividends and/or interest income. |
| X-Square Balanced Fund | Management Discussion of Fund
Performance and Portfolio Update |
| | December 31, 2022 (Unaudited) |
Growth of $10,000 (as of December 31, 2022)
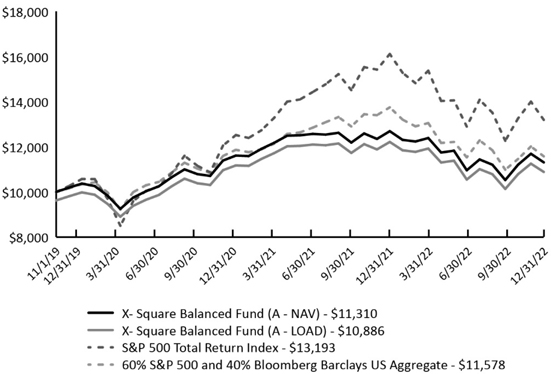
The chart above represents historical performance of a hypothetical investment of $10,000 in the Fund since inception. Past performance does not guarantee future results. This chart does not reflect the deduction of taxes that a shareholder would pay on Fund distributions or the redemption of Fund shares.
Investing in the Fund is subject to investment risks, including possible loss of the principal amount invested.
| Annual Report | December 31, 2022 | 5 |
| X-Square Balanced Fund | Management Discussion of Fund
Performance and Portfolio Update |
| | December 31, 2022 (Unaudited) |
Top Ten Holdings (as a % of Net Assets)* as of December 31, 2022
| U.S. Treasury Note, 2.25%, 03/31/2024 | | | 22.68 | % |
| U.S. Treasury Note, 0.63%, 10/15/2024 | | | 4.29 | % |
| U.S. Treasury Bond, 2.75%, 08/15/2032 | | | 2.89 | % |
| Suncor Energy, Inc. | | | 2.81 | % |
| Diamondback Energy, Inc. | | | 2.27 | % |
| Glencore PLC | | | 2.00 | % |
| Activision Blizzard, Inc. | | | 1.86 | % |
| General Dynamics Corp. | | | 1.82 | % |
| Lockheed Martin Corp. | | | 1.68 | % |
| TJX Cos., Inc. | | | 1.67 | % |
| Top Ten Holdings | | | 43.97 | % |
Portfolio Composition (as a % of Net Assets)* as of December 31, 2022
| Common Stock - US | | | 53.87 | % |
| Common Stock - Foreign | | | 15.12 | % |
| Government Bond | | | 30.32 | % |
| Other Assets in Excess of Liabilities | | | 0.69 | % |
| Net Assets | | | 100.00 | % |
| * | Holdings are subject to change, and may not reflect the current or future position of the portfolio. Tables present indicative values only. |
| X-Square Balanced Fund | Disclosure of Fund Expenses |
| | December 31, 2022 (Unaudited) |
Examples. As a shareholder of the X-Square Balanced Fund (the “Fund”), you incur two types of costs: (1) transaction costs, including applicable redemption fees; and (2) ongoing costs, including management fees, distribution and service (12b-1) fees and other Fund expenses. The following examples are intended to help you understand your ongoing costs (in dollars) of investing in the Fund and to compare these costs with the ongoing costs of investing in other mutual funds. The examples are based on an investment of $1,000 invested on July 1, 2022 and held through December 31, 2022.
Actual Expenses. The first line under each class in the table below provides information about actual account values and actual expenses. You may use the information in this line, together with the amount you invested, to estimate the expenses that you paid over the period. Simply divide your account value by $1,000 (for example, an $8,600 account value divided by $1,000 = 8.6), then multiply the result by the number in the first line under the heading “Expenses Paid During Period 7/1/22 to 12/31/22” to estimate the expenses you paid on your account during this period.
Hypothetical Example for Comparison Purposes. The second line under each class in the table below provides information about hypothetical account values and hypothetical expenses based on the Fund’s actual expense ratio and an assumed rate of return of 5% per year before expenses, which is not the Fund’s actual return. The hypothetical account values and expenses may not be used to estimate the actual ending account balance or expenses you paid for the period. You may use this information to compare the ongoing costs of investing in the Fund and other mutual funds. To do so, compare this 5% hypothetical example with the 5% hypothetical examples that appear in the shareholder reports of the other funds.
Please note that the expenses shown in the table are meant to highlight your ongoing Fund costs only and do not reflect any transactional costs, such as redemption fees. Therefore, the second line under each class in the table below is useful in comparing ongoing costs only and will not help you determine the relative total costs of owning different funds. In addition, if these transactional costs were included, your costs would have been higher.
| Annual Report | December 31, 2022 | 7 |
| X-Square Balanced Fund | Disclosure of Fund Expenses |
| | December 31, 2022 (Unaudited) |
| | Beginning Account Value 7/1/2022 | Ending Account Value 12/31/22 | Expense Ratio | Expenses Paid During period 7/1/22 to 12/31/22(a) |
| Class A: | | | | |
| Actual Fund Return | $1,000.00 | $1,031.90 | 2.75% | $14.08 |
| Hypothetical Fund Return | $1,000.00 | $1,011.34 | 2.75% | $13.94 |
| Class C: | | | | |
| Actual Fund Return | $1,000.00 | $1,027.80 | 3.50% | $17.89 |
| Hypothetical Fund Return | $1,000.00 | $1,007.56 | 3.50% | $17.71 |
| Institutional Class: | | | | |
| Actual Fund Return | $1,000.00 | $1,033.60 | 2.50% | $12.81 |
| Hypothetical Fund Return | $1,000.00 | $1,012.60 | 2.50% | $12.68 |
| (a) | Expenses are equal to the Fund's annualized expense ratio multiplied by the average account values over the period, multiplied by the number of days in the most recent fiscal half year (184), then divided by 365. |
| X-Square Balanced Fund | Schedule of Investments |
| | December 31, 2022 |
| Description | | Shares | | | Value | |
| COMMON STOCKS (68.99%) | | | | | | | | |
| COMMUNICATIONS (3.95%) | | | | | | | | |
| Activision Blizzard, Inc. | | | 8,419 | | | $ | 644,473 | |
| Alphabet, Inc., Class C(a) | | | 4,762 | | | | 422,533 | |
| Meta Platforms, Inc., Class A(a) | | | 1,798 | | | | 216,371 | |
| Zillow Group, Inc., Class C(a) | | | 2,688 | | | | 86,580 | |
| | | | | | | | 1,369,957 | |
| | | | | | | | | |
| CONSUMER DISCRETIONARY (12.43%) | | | | | | | | |
| Alibaba Group Holding, Ltd., Sponsored ADR(a) | | | 1,650 | | | | 145,349 | |
| Amazon.com, Inc.(a) | | | 3,066 | | | | 257,544 | |
| Chipotle Mexican Grill, Inc.(a) | | | 91 | | | | 126,262 | |
| Copart, Inc.(a) | | | 7,202 | | | | 438,529 | |
| Domino's Pizza, Inc. | | | 297 | | | | 102,881 | |
| General Motors Co. | | | 8,598 | | | | 289,237 | |
| Home Depot, Inc. | | | 1,344 | | | | 424,516 | |
| Lennar Corp., Class A | | | 4,642 | | | | 420,101 | |
| MercadoLibre, Inc., Sponsored ADR(a) | | | 369 | | | | 312,263 | |
| PulteGroup, Inc. | | | 7,635 | | | | 347,622 | |
| TJX Cos., Inc. | | | 7,250 | | | | 577,099 | |
| Tractor Supply Co. | | | 2,487 | | | | 559,500 | |
| Vipshop Holdings, Ltd., ADR(a) | | | 22,355 | | | | 304,922 | |
| | | | | | | | 4,305,825 | |
| | | | | | | | | |
| CONSUMER STAPLES (8.93%) | | | | | | | | |
| Altria Group, Inc. | | | 8,899 | | | | 406,773 | |
| Calavo Growers, Inc. | | | 4,002 | | | | 117,659 | |
| Costco Wholesale Corp. | | | 1,158 | | | | 528,627 | |
| Dollar General Corp. | | | 2,228 | | | | 548,645 | |
| Mission Produce, Inc.(a) | | | 10,641 | | | | 123,648 | |
| Philip Morris International, Inc. | | | 5,101 | | | | 516,273 | |
| Target Corp. | | | 2,502 | | | | 372,898 | |
| Walmart, Inc. | | | 3,339 | | | | 473,437 | |
| | | | | | | | 3,087,960 | |
| | | | | | | | | |
| ENERGY (7.76%) | | | | | | | | |
| Chesapeake Energy Corp. | | | 5,353 | | | | 505,163 | |
| Diamondback Energy, Inc. | | | 5,758 | | | | 787,579 | |
| EOG Resources, Inc. | | | 3,270 | | | | 423,530 | |
| See Notes to Financial Statements. | |
| Annual Report | December 31, 2022 | 9 |
| X-Square Balanced Fund | Schedule of Investments |
| | December 31, 2022 |
| Description | | Shares | | | Value | |
| ENERGY (continued) | | | | | | | | |
| Suncor Energy, Inc. | | | 30,664 | | | $ | 972,969 | |
| | | | | | | | 2,689,241 | |
| | | | | | | | | |
| FINANCIALS (8.67%) | | | | | | | | |
| Ally Financial, Inc. | | | 11,630 | | | | 284,354 | |
| Berkshire Hathaway, Inc., Class B(a) | | | 1,775 | | | | 548,298 | |
| Chubb, Ltd. | | | 2,530 | | | | 558,118 | |
| Intercontinental Exchange, Inc. | | | 1,390 | | | | 142,600 | |
| JPMorgan Chase & Co. | | | 3,458 | | | | 463,718 | |
| Marsh & McLennan Cos., Inc. | | | 3,048 | | | | 504,383 | |
| OFG Bancorp | | | 3,525 | | | | 97,149 | |
| Popular, Inc. | | | 1,151 | | | | 76,334 | |
| Truist Financial Corp. | | | 7,660 | | | | 329,610 | |
| | | | | | | | 3,004,564 | |
| | | | | | | | | |
| HEALTH CARE (4.44%) | | | | | | | | |
| Amgen, Inc. | | | 1,949 | | | | 511,885 | |
| Bausch Health Cos., Inc.(a) | | | 11,163 | | | | 70,104 | |
| Johnson & Johnson | | | 2,863 | | | | 505,749 | |
| Teva Pharmaceutical Industries, Ltd., Sponsored ADR(a) | | | 49,253 | | | | 449,187 | |
| | | | | | | | 1,536,925 | |
| | | | | | | | | |
| INDUSTRIALS (6.95%) | | | | | | | | |
| Fastenal Co. | | | 8,038 | | | | 380,358 | |
| General Dynamics Corp. | | | 2,540 | | | | 630,199 | |
| Lockheed Martin Corp. | | | 1,197 | | | | 582,329 | |
| RXO, Inc.(a) | | | 6,715 | | | | 115,498 | |
| United Rentals, Inc.(a) | | | 1,395 | | | | 495,811 | |
| XPO Logistics, Inc.(a) | | | 6,228 | | | | 207,330 | |
| | | | | | | | 2,411,525 | |
| | | | | | | | | |
| MATERIALS (4.99%) | | | | | | | | |
| Freeport-McMoRan, Inc. | | | 8,154 | | | | 309,852 | |
| Glencore PLC, ADR | | | 51,895 | | | | 691,241 | |
| Rio Tinto PLC, ADR | | | 3,999 | | | | 284,729 | |
| Tecnoglass, Inc. | | | 4,927 | | | | 151,604 | |
| Vale SA, ADR | | | 17,082 | | | | 289,882 | |
| | | | | | | | 1,727,308 | |
| See Notes to Financial Statements. | |
| 10 | www.xsquarecapital.com |
| X-Square Balanced Fund | Schedule of Investments |
| | December 31, 2022 |
| Description | | Shares | | | Value | |
| TECHNOLOGY (9.77%) | | | | | | |
| Advanced Micro Devices, Inc.(a) | | | 5,647 | | | $ | 365,756 | |
| Akamai Technologies, Inc.(a) | | | 2,831 | | | | 238,653 | |
| Apple, Inc. | | | 2,843 | | | | 369,391 | |
| Booz Allen Hamilton Holding Corp. | | | 1,728 | | | | 180,611 | |
| Fortinet, Inc.(a) | | | 6,038 | | | | 295,198 | |
| Garmin, Ltd. | | | 3,879 | | | | 357,993 | |
| MarketAxess Holdings, Inc. | | | 943 | | | | 262,993 | |
| Mastercard, Inc., Class A | | | 1,102 | | | | 383,198 | |
| Micron Technology, Inc. | | | 7,007 | | | | 350,210 | |
| N-able, Inc.(a) | | | 5,242 | | | | 53,888 | |
| PayPal Holdings, Inc.(a) | | | 2,852 | | | | 203,119 | |
| Shopify, Inc., Class A(a) | | | 4,761 | | | | 165,254 | |
| SolarWinds Corp.(a) | | | 16,199 | | | | 151,623 | |
| | | | | | | | 3,377,887 | |
| | | | | | | | | |
| UTILITIES (1.10%) | | | | | | | | |
| Iberdrola SA, Sponsored ADR | | | 8,151 | | | | 381,141 | |
| | | | | | | | | |
| TOTAL COMMON STOCKS (Cost $24,903,834) | | | | | | | 23,892,333 | |
| | | Principal Amount | | | Value | |
| GOVERNMENT BONDS (30.32%) | | | | | | | | |
| U.S. Treasury Bond | | | | | | | | |
| 08/15/32, 2.75% | | $ | 1,100,000 | | | $ | 1,001,688 | |
| U.S. Treasury Notes | | | | | | | | |
| 10/15/24, 0.63% | | | 1,590,000 | | | | 1,484,849 | |
| 01/31/25, 1.38% | | | 126,500 | | | | 118,890 | |
| 10/31/26, 1.63% | | | 45,600 | | | | 41,622 | |
| 03/31/24, 2.25% | | | 8,095,000 | | | | 7,854,047 | |
| | | | | | | | 9,499,408 | |
| | | | | | | | | |
| | | | | | | | | |
| TOTAL GOVERNMENT BONDS (Cost $10,801,802) | | | | | | | 10,501,096 | |
| | | | | | | | | |
| TOTAL INVESTMENTS (99.31%) (Cost $35,705,636) | | | | | | | 34,393,429 | |
| Other Assets In Excess Of Liabilities (0.69%) | | | | | | | 240,509 | |
| NET ASSETS (100.00%) | | | | | | $ | 34,633,938 | |
| (a) | Non-income producing security. |
| See Notes to Financial Statements. | |
| Annual Report | December 31, 2022 | 11 |
| X-Square Balanced Fund | Statement of Assets and Liabilities |
| | December 31, 2022 |
| ASSETS: | | | |
| Investments, at fair value (Cost $35,705,636) | | $ | 34,393,429 | |
| Cash | | | 160,645 | |
| Dividend and interest receivable | | | 84,165 | |
| Tax reclaim receivable | | | 858 | |
| Receivable due from advisor | | | 38,893 | |
| Capital shares sold receivable | | | 365,778 | |
| Prepaid expenses and other assets | | | 7,299 | |
| Total Assets | | | 35,051,067 | |
| | | | | |
| LIABILITIES: | | | | |
| Payable for investment securities purchased | | | 256,716 | |
| Accrued chief compliance officer fees payable | | | 3,216 | |
| Accrued fund investment and administration fees payable | | | 4,523 | |
| Accrued distribution fees payable | | | 9,515 | |
| Accrued professional fees payable | | | 44,050 | |
| Capital shares redeemed payable | | | 87,266 | |
| Other payables and accrued expenses | | | 11,843 | |
| Total Liabilities | | | 417,129 | |
| Net Assets | | $ | 34,633,938 | |
| | | | | |
| COMPOSITION OF NET ASSETS ATTRIBUTABLE TO SHARES: | | | | |
| Paid-in capital | | $ | 36,294,936 | |
| Total distributed earnings/(deficit) | | | (1,660,998 | ) |
| Net Assets | | $ | 34,633,938 | |
| See Notes to Financial Statements. | |
| 12 | www.xsquarecapital.com |
| X-Square Balanced Fund | Statement of Assets and Liabilities |
| | December 31, 2022 |
| NET ASSET VALUE | | | |
| Class A: | | | |
| Net assets | | $ | 29,014,363 | |
| Shares outstanding (unlimited shares authorized, no par value) | | | 2,645,402 | |
| Net Asset Value per Share | | $ | 10.97 | |
| Maximum offering price per share (NAV/0.945, based on maximum sales charge of 5.50% of the offering price) | | $ | 11.61 | |
| Class C: | | | | |
| Net assets | | | 4,205,318 | |
| Shares outstanding (unlimited shares authorized, no par value) | | | 392,989 | |
| Net Asset Value per Share | | | 10.70 | |
| Institutional Class: | | | | |
| Net assets | | | 1,414,257 | |
| Shares outstanding (unlimited shares authorized, no par value) | | | 127,916 | |
| Net Asset Value per Share | | | 11.06 | |
| See Notes to Financial Statements. | |
| Annual Report | December 31, 2022 | 13 |
| X-Square Balanced Fund | Statement of Operations |
| | For the Year Ended December 31, 2022 |
| INVESTMENT INCOME: | | | |
| Dividends (net of foreign withholding tax $15,056) | | $ | 520,511 | |
| Interest | | | 192,091 | |
| Total Investment Income | | | 712,602 | |
| | | | | |
| EXPENSES: | | | | |
| Investment advisory fee (see Note 4) | | | 330,410 | |
| Fund accounting, administration and compliance fees | | | 191,667 | |
| Distribution fees | | | | |
| Class A | | | 69,025 | |
| Class C | | | 39,837 | |
| Professional fees | | | 375,433 | |
| Trustees' fees and expenses | | | 32,999 | |
| Transfer agent fees | | | 41,635 | |
| Other expenses | | | 28,888 | |
| Total Expenses | | | 1,109,894 | |
| Less fees reimbursed by Adviser (See Note 4) | | | | |
| Class A | | | (146,429 | ) |
| Class C | | | (20,782 | ) |
| Institutional Class | | | (7,432 | ) |
| Net Expenses | | | 935,251 | |
| Net Investment Loss | | | (222,649 | ) |
| | | | | |
| REALIZED AND UNREALIZED GAIN/(LOSS) ON INVESTMENTS: | | | | |
| Net realized gain/(loss) on: | | | | |
| Investment securities | | | 73,907 | |
| Foreign currency transactions | | | (691 | ) |
| Net realized gain: | | | 73,216 | |
| Change in unrealized appreciation/(depreciation) on: | | | | |
| Investment securities | | | (3,724,982 | ) |
| Foreign currency transactions | | | (22 | ) |
| Net change in unrealized appreciation/ (depreciation) | | | (3,725,004 | ) |
| Net Realized and Unrealized Loss on Investments | | | (3,651,788 | ) |
| Net Decrease in Net Assets Resulting from Operations | | $ | (3,874,437 | ) |
| See Notes to Financial Statements. | |
| 14 | www.xsquarecapital.com |
| X-Square Balanced Fund | Statement of Changes in Net Assets |
| | | For the Year Ended December 31, 2022 | | | For the Year Ended December 31, 2021 | |
| FROM OPERATIONS: | | | | | | | | |
| Net investment loss | | $ | (222,649 | ) | | $ | (371,075 | ) |
| Net realized gain | | | 73,216 | | | | 319,337 | |
| Net change in unrealized appreciation/(depreciation) | | | (3,725,004 | ) | | | 1,526,458 | |
| Net Increase/(Decrease) in Net Assets from Operations | | | (3,874,437 | ) | | | 1,474,720 | |
| | | | | | | | | |
| DISTRIBUTIONS TO SHAREHOLDERS: | | | | | | | | |
| From distributable earnings | | | | | | | | |
| Class A: | | | – | | | | (180,802 | ) |
| Class C: | | | – | | | | (27,272 | ) |
| Institutional Class: | | | – | | | | (11,807 | ) |
| From return of capital | | | | | | | | |
| Class A: | | | (564,899 | ) | | | – | |
| Class C: | | | (84,245 | ) | | | – | |
| Institutional Class: | | | (30,368 | ) | | | – | |
| Net Decrease in Net Assets from Distributions to Shareholders | | | (679,512 | ) | | | (219,881 | ) |
| | | | | | | | | |
| CAPITAL SHARE TRANSACTIONS: | | | | | | | | |
| Proceeds from sale of shares | | | | | | | | |
| Class A: | | | 8,489,218 | | | | 17,426,292 | |
| Class C: | | | 713,670 | | | | 2,909,207 | |
| Institutional Class: | | | 58,414 | | | | 490,018 | |
| Reinvestment of distributions | | | | | | | | |
| Class A: | | | 336,473 | | | | 100,540 | |
| Class C: | | | 41,365 | | | | 12,003 | |
| Institutional Class: | | | 24,451 | | | | 10,977 | |
| Cost of shares redeemed | | | | | | | | |
| Class A: | | | (2,297,828 | ) | | | (1,050,043 | ) |
| Class C: | | | (314,326 | ) | | | (137,689 | ) |
| Institutional Class: | | | (61,093 | ) | | | (42,792 | ) |
| Redemption fees | | | | | | | | |
| Class A: | | | 769 | | | | – | |
| Class C: | | | – | | | | 683 | |
| Net Increase from Capital Share Transactions | | | 6,991,113 | | | | 19,719,196 | |
| Net Increase in Net Assets | | $ | 2,437,164 | | | $ | 20,974,035 | |
| See Notes to Financial Statements. | |
| Annual Report | December 31, 2022 | 15 |
| X-Square Balanced Fund | Statement of Changes in Net Assets |
| | | For the Year Ended December 31, 2022 | | | For the Year Ended December 31, 2021 | |
| NET ASSETS: | | | | | | | | |
| Beginning of period | | | 32,196,774 | | | | 11,222,739 | |
| End of period | | $ | 34,633,938 | | | $ | 32,196,774 | |
| | | | | | | | | |
| OTHER INFORMATION: | | | | | | | | |
| Capital Share Transactions: | | | | | | | | |
| Class A: | | | | | | | | |
| Beginning shares | | | 2,090,027 | | | | 754,096 | |
| Shares sold | | | 723,685 | | | | 1,412,272 | |
| Shares issued as reinvestment of dividends | | | 29,780 | | | | 8,076 | |
| Shares redeemed | | | (198,090 | ) | | | (84,417 | ) |
| Ending Shares | | | 2,645,402 | | | | 2,090,027 | |
| Class C: | | | | | | | | |
| Beginning shares | | | 351,564 | | | | 124,409 | |
| Shares sold | | | 64,031 | | | | 237,532 | |
| Shares issued as reinvestment of dividends | | | 3,716 | | | | 977 | |
| Shares redeemed | | | (26,322 | ) | | | (11,354 | ) |
| Ending Shares | | | 392,989 | | | | 351,564 | |
| Institutional Class: | | | | | | | | |
| Beginning shares | | | 125,856 | | | | 88,869 | |
| Shares sold | | | 5,228 | | | | 39,517 | |
| Shares issued as reinvestment of dividends | | | 2,127 | | | | 878 | |
| Shares redeemed | | | (5,295 | ) | | | (3,408 | ) |
| Ending Shares | | | 127,916 | | | | 125,856 | |
| See Notes to Financial Statements. | |
| 16 | www.xsquarecapital.com |
| X-Square Balanced Fund – Class A | Financial Highlights |
| | For a Share Outstanding Throughout the Periods Presented |
| | | For the Year Ended December 31, 2022 | | | For the Year Ended December 31, 2021 | | | For the Year Ended December 31, 2020 | | | For the Period November 4, 2019 (Commencement of Operations) to December 31, 2019 | |
| PER SHARE OPERATING PERFORMANCE: | | | | | | | |
| Net asset value - beginning of period | | $ | 12.57 | | | $ | 11.61 | | | $ | 10.37 | | | $ | 10.00 | |
| INCOME/(LOSS) FROM INVESTMENT OPERATIONS: | | | | | | | | | | | | | | | | |
| Net investment loss(a) | | | (0.07 | ) | | | (0.20 | ) | | | (0.14 | ) | | | (0.00 | )(b)(c) |
| Net realized and unrealized gain/(loss) on investments | | | (1.29 | ) | | | 1.28 | | | | 1.38 | | | | 0.37 | |
| Net increase/(decrease) in Net Asset Value |
|
|
(1.36 |
) |
|
|
1.08 |
|
|
|
1.24 |
|
|
|
0.37 |
|
| | | | | | | | | | | | | | | | | |
| DISTRIBUTIONS TO COMMON SHAREHOLDERS: | | | | | | | | | | | |
| From net investment income | | | – | | | | (0.12 | ) | | | – | | | | – | |
| From return of capital | | | (0.24 | ) | | | – | | | | – | | | | – | |
| Total Distributions to Common Shareholders | | | (0.24 | ) | | | (0.12 | ) | | | – | | | | – | |
| | | | | | | | | | | | | | | | | |
| Net asset value per share - end of period | | $ | 10.97 | | | $ | 12.57 | | | $ | 11.61 | | | $ | 10.37 | |
| | | | | | | | | | | | | | | | | |
| Total Investment Return - Net Asset Value(d) | | | (10.88 | %) | | | 9.31 | % | | | 11.96 | % | | | 3.70 | % |
| | | | | | | | | | | | | | | | | |
| RATIOS AND SUPPLEMENTAL DATA: | | | | | | | | | | | |
| Net assets attributable to shares, end of period (000s) | | $ | 29,014 | | | $ | 26,262 | | | $ | 8,756 | | | $ | 779 | |
| Ratio of actual expenses to average net assets including fee waivers and reimbursements | | | 2.75 | % | | | 2.75 | % | | | 2.75 | % | | | 2.75 | %(e) |
| Ratio of actual expenses to average net assets excluding fee waivers and reimbursements | | | 3.28 | % | | | 3.50 | % | | | 13.07 | % | | | 115.61 | %(e) |
| Ratio of net investment loss to average net assets | | | (0.59 | %) | | | (1.59 | %) | | | (1.26 | %) | | | (0.19 | %) |
| Portfolio turnover rate | | | 51.37 | % | | | 18.40 | % | | | 20.14 | % | | | 0.00 | % |
| (a) | Calculated using average shares outstanding. |
| See Notes to Financial Statements. | |
| Annual Report | December 31, 2022 | 17 |
| X-Square Balanced Fund – Class A | Financial Highlights |
| | For a Share Outstanding Throughout the Periods Presented |
| (b) | Less than $0.005 per share. |
| (d) | Total investment return is calculated assuming a purchase of shares at the opening on the first day and a sale at closing on the last day of the period reported. Dividends and distributions are assumed for purposes of this calculation to be reinvested at prices obtained under the Fund's dividend reinvestment plan. Total investment returns do not reflect brokerage commissions, if any, and are not annualized. |
| (e) | These ratios to average net assets have been annualized except the non-recurring offering costs, which have not been annualized. |
| See Notes to Financial Statements. | |
| 18 | www.xsquarecapital.com |
| X-Square Balanced Fund – Class C | Financial Highlights |
| | For a Share Outstanding Throughout the Periods Presented |
| | | For the Year Ended December 31, 2022 | | | For the Year Ended December 31, 2021 | | | For the Year Ended December 31, 2020 | | | For the Period November 4, 2019 (Commencement of Operations) to December 31, 2019 | |
| PER SHARE OPERATING PERFORMANCE: | | | | | | | |
| Net asset value - beginning of period | | $ | 12.36 | | | $ | 11.50 | | | $ | 10.35 | | | $ | 10.00 | |
| INCOME/(LOSS) FROM INVESTMENT OPERATIONS: | | | | | | | | | | | | | | | | |
| Net investment loss(a) | | | (0.15 | ) | | | (0.29 | ) | | | (0.21 | ) | | | (0.02 | )(b) |
| Net realized and unrealized gain/(loss) on investments | | | (1.27 | ) | | | 1.27 | | | | 1.36 | | | | 0.37 | |
| Net increase/(decrease) in Net Asset Value | | | (1.42 | ) | | | 0.98 | | | | 1.15 | | | | 0.35 | |
| | | | | | | | | | | | | | | | | |
| DISTRIBUTIONS TO COMMON SHAREHOLDERS: | | | | | | | | | | | |
| From net investment income | | | – | | | | (0.12 | ) | | | – | | | | – | |
| From return of capital | | | (0.24 | ) | | | – | | | | – | | | | – | |
| Total Distributions to Common Shareholders | | | (0.24 | ) | | | (0.12 | ) | | | – | | | | – | |
| Net asset value per share - end of period | | $ | 10.70 | | | $ | 12.36 | | | $ | 11.50 | | | $ | 10.35 | |
| | | | | | | | | | | | | | | | | |
| Total Investment Return - Net Asset Value(c) | | | (11.56 | %) | | | 8.53 | % | | | 11.11 | % | | | 3.50 | % |
| | | | | | | | | | | | | | | | | |
| RATIOS AND SUPPLEMENTAL DATA: | | | | | | | | | | | |
| Net assets attributable to shares, end of period (000s) | | $ | 4,205 | | | $ | 4,345 | | | $ | 1,431 | | | $ | 113 | |
| Ratio of actual expenses to average net assets including fee waivers and reimbursements | | | 3.50 | % | | | 3.50 | % | | | 3.50 | % | | | 3.50 | %(d) |
| Ratio of actual expenses to average net assets excluding fee waivers and reimbursements | | | 4.02 | % | | | 4.23 | % | | | 14.81 | % | | | 161.50 | %(d) |
| Ratio of net investment loss to average net assets | | | (1.35 | %) | | | (2.34 | %) | | | (1.95 | %) | | | (0.99 | %) |
| Portfolio turnover rate | | | 51.37 | % | | | 18.40 | % | | | 20.14 | % | | | 0.00 | % |
| (a) | Calculated using average shares outstanding. |
| See Notes to Financial Statements. | |
| Annual Report | December 31, 2022 | 19 |
| X-Square Balanced Fund – Class C | Financial Highlights |
| | For a Share Outstanding Throughout the Periods Presented |
| (c) | Total investment return is calculated assuming a purchase of shares at the opening on the first day and a sale at closing on the last day of the period reported. Dividends and distributions are assumed for purposes of this calculation to be reinvested at prices obtained under the Fund's dividend reinvestment plan. Total investment returns do not reflect brokerage commissions, if any, and are not annualized. |
| (d) | These ratios to average net assets have been annualized except the non-recurring offering costs, which have not been annualized. |
| See Notes to Financial Statements. | |
| 20 | www.xsquarecapital.com |
| X-Square Balanced Fund – Institutional Class | Financial Highlights |
| | For a Share Outstanding Throughout the Periods Presented |
| | | For the Year Ended December 31, 2022 | | | For the Year Ended December 31, 2021 | | | For the Year Ended December 31, 2020 | | | For the Period November 4, 2019 (Commencement of Operations) to December 31, 2019 | |
| PER SHARE OPERATING PERFORMANCE: | | | | | | | |
| Net asset value - beginning of period | | $ | 12.63 | | | $ | 11.65 | | | $ | 10.37 | | | $ | 10.00 | |
| INCOME/(LOSS) FROM INVESTMENT OPERATIONS: | | | | | | | | | | | |
| Net investment loss(a) | | | (0.04 | ) | | | (0.17 | ) | | | (0.11 | ) | | | (0.00 | )(b)(c) |
| Net realized and unrealized gain/(loss) on investments | | | (1.29 | ) | | | 1.27 | | | | 1.39 | | | | 0.37 | |
| Net increase/(decrease) in Net Asset Value | | | (1.33 | ) | | | 1.10 | | | | 1.28 | | | | 0.37 | |
| | | | | | | | | | | | | | | | | |
| DISTRIBUTIONS TO COMMON SHAREHOLDERS: | | | | | | | | | | | |
| From net investment income | | | – | | | | (0.12 | ) | | | – | | | | – | |
| From return of capital | | | (0.24 | ) | | | – | | | | – | | | | – | |
| Total Distributions to Common Shareholders | | | (0.24 | ) | | | (0.12 | ) | | | – | | | | – | |
| Net asset value per share - end of period | | $ | 11.06 | | | $ | 12.63 | | | $ | 11.65 | | | $ | 10.37 | |
| | | | | | | | | | | | | | | | | |
| Total Investment Return - Net Asset Value(d) | | | (10.59 | %) | | | 9.45 | % | | | 12.34 | % | | | 3.70 | % |
| | | | | | | | | | | | | | | | | |
| RATIOS AND SUPPLEMENTAL DATA: | | | | | | | | | | | |
| Net assets attributable to shares, end of period (000s) | | $ | 1,414 | | | $ | 1,590 | | | $ | 1,035 | | | $ | 41 | |
| Ratio of actual expenses to average net assets including fee waivers and reimbursements | | | 2.50 | % | | | 2.50 | % | | | 2.50 | % | | | 2.50 | %(e) |
| Ratio of actual expenses to average net assets excluding fee waivers and reimbursements | | | 3.01 | % | | | 3.37 | % | | | 12.00 | % | | | 239.72 | %(e) |
| Ratio of net investment loss to average net assets | | | (0.36 | %) | | | (1.37 | %) | | | (1.00 | %) | | | (0.21 | %) |
| Portfolio turnover rate | | | 51.37 | % | | | 18.40 | % | | | 20.14 | % | | | 0.00 | % |
| (a) | Calculated using average shares outstanding. |
| See Notes to Financial Statements. | |
| Annual Report | December 31, 2022 | 21 |
| X-Square Balanced Fund – Institutional Class | Financial Highlights |
| | For a Share Outstanding Throughout the Periods Presented |
| (b) | Less than $0.005 per share. |
| (d) | Total investment return is calculated assuming a purchase of shares at the opening on the first day and a sale at closing on the last day of the period reported. Dividends and distributions are assumed for purposes of this calculation to be reinvested at prices obtained under the Fund's dividend reinvestment plan. Total investment returns do not reflect brokerage commissions, if any, and are not annualized. |
| (e) | These ratios to average net assets have been annualized except the non-recurring offering costs, which have not been annualized. |
| See Notes to Financial Statements. | |
| 22 | www.xsquarecapital.com |
| X-Square Balanced Fund | Notes to Financial Statements |
| | December 31, 2022 |
NOTE 1 — ORGANIZATION AND REGISTRATION
X-Square Balanced Fund, LLC (the "Fund") is an open-end investment company registered under the Investment Company Act of 1940, as amended (the “1940 Act”). The Fund is a non-diversified investment company with an investment objective which seeks conservation of capital, current income and long-term growth of capital and income. The Fund currently offers Class A, Class C and Institutional Class Shares. Each share class of the Fund represents an investment in the same portfolio of securities, but each share class has its own expense structures. The Fund’s Investment Adviser is X-Square Capital, LLC (the “Adviser”). The Fund is a related party to the Adviser.
Subject to certain exceptions, investments in Class C shares are subject to a 1.00% contingent deferred sales charge if shares are sold within 12 months of purchase. The contingent deferred sales charge is expected to be calculated based on the lesser of the offering price and market value of shares being sold.
NOTE 2 — SIGNIFICANT ACCOUNTING POLICIES
The following is a summary of significant accounting policies consistently followed by the Fund in the preparation of its financial statements. The financial statements are prepared in United States Dollars and in conformity with accounting principles generally accepted in the United States of America (“GAAP”), which requires management to make certain estimates and assumptions that affect the reported amounts of assets and liabilities, disclosure of contingent assets and liabilities at the date of the financial statements, and the reported amounts of income and expenses during the reporting period. Actual results may differ from these estimates. The Fund is considered an investment company under GAAP and follows the accounting and reporting guidance applicable to investment companies in the Financial Accounting Standards Board Accounting Standards Codification Topic 946. The financial statements have been prepared as of the close of the New York Stock Exchange (“NYSE”) as of the fiscal year end of the Fund.
Portfolio Valuation: The net asset value (“NAV”) per common share of the Fund is determined daily, on each day that there is a regular trading session on the NYSE as of the close of regular trading. The Fund’s NAV per common share is calculated by dividing the value of the Fund’s total assets, less its liabilities, by the number of shares outstanding and rounding the result to the nearest full cent.
The Fund generally values its securities based on market prices determined at the close of regular trading on the NYSE (normally, 4 p.m. Eastern time) on each business day (Monday through Friday). The Fund will not value its securities on any day that the NYSE is closed, including the following observed holidays: New Year’s Day, Martin Luther King, Jr. Day, Washington’s Birthday, Good Friday, Memorial Day, Independence Day, Labor Day, Thanksgiving Day and Christmas Day. The Fund’s currency valuations are done as of the close of regular trading on the NYSE (normally, 4 p.m. Eastern time).
For equity securities that are traded on an exchange, the market price is usually the closing sale or official closing price on that exchange, provided such price is not deemed stale, and that it represents fair value. In the case of securities not traded on an exchange, or if such closing prices are not otherwise available, the market price is typically determined by independent third party pricing vendors approved by the Fund’s Board of Managers (“the Board”) using a variety of pricing techniques and methodologies.
| Annual Report | December 31, 2022 | 23 |
| X-Square Balanced Fund | Notes to Financial Statements |
| | December 31, 2022 |
The market price for debt obligations (including short-term debt obligations with remaining maturities of 60 days or less) is generally the price supplied by an independent third-party pricing service approved by the Board, which may use a matrix, formula or other objective method that takes into consideration market indices, yield curves and other specific adjustments. In certain circumstances, bid and ask prices may be obtained from: (i) a broker/ dealer specified and deemed reliable by the Adviser, (ii) pink sheets, yellow sheets or the blue list, or (iii) a pricing agent that obtains quotations from broker/dealers or evaluates the value of the respective bid and ask prices. If vendors are unable to supply a price, or if the price supplied is deemed to be unreliable, the market price may be determined using quotations received from one or more brokers/dealers that make a market in the security.
When such prices or quotations are not available, or when the Adviser believes that they are unreliable, securities may be priced using fair value procedures approved by the Board. The Fund may also use fair value procedures if the Adviser determines that a significant event has occurred between the time at which a market price is determined and the time at which the Fund NAV is calculated. In particular, the value of foreign securities may be materially affected by events occurring after the close of the market on which they are traded, but before the Fund prices its shares.
The Fund may determine the fair value of investments based on information provided by pricing services and other third-party vendors, which may recommend fair value prices or adjustments with reference to other securities, indices or assets. In considering whether fair value pricing is required and in determining fair values, the Fund may, among other things, consider significant events (which may be considered to include changes in the value of U.S. securities or securities indices) that occur after the close of the relevant market and before the Fund values its securities. In addition, the Fund may utilize modeling tools provided by third-party vendors to determine fair values of foreign securities.
Valuing securities at fair value involves greater reliance on judgment than valuation of securities based on readily available market quotations. A fund that uses fair value to price securities may value those securities higher or lower than another fund using market quotations or its own fair value methodologies to price the same securities. There can be no assurance that the Fund could obtain the fair value assigned to a security if it were to sell the security at approximately the time at which the Fund determines its NAV.
The information above is not intended to reflect an exhaustive list of the methodologies that may be used to value portfolio investments. The Fund’s valuation procedures permit the use of a variety of valuation methodologies in connection with valuing portfolio investments. The methodology used for a specific type of investment may vary based on the market data available or other considerations. The methodologies summarized above may not represent the specific means by which portfolio investments are valued on any particular business day.
Cash and Cash Equivalents: Idle cash may be swept into various overnight demand deposits and is classified as cash and cash equivalents on the Statements of Assets and Liabilities. The Fund maintains cash in bank deposit accounts which, at times, may exceed United States federally insured limits. Amounts swept overnight are available on the next business day.
| X-Square Balanced Fund | Notes to Financial Statements |
| | December 31, 2022 |
Securities Transactions and Investment Income: Investment security transactions are accounted for on a trade date basis. Dividend income is recorded on the ex-dividend date. Realized gains and losses from securities transactions and unrealized appreciation and depreciation of securities are determined using the identified cost basis method for financial reporting purposes. Dividends are recorded net of foreign withholding taxes. Interest income is recorded on an accrual basis.
Expenses: Some expenses of the Fund can be directly attributed to a Fund specific share class. Expenses that cannot be directly attributed are apportioned among all share classes based on average net assets. Expenses are recognized when incurred.
Income Taxes: The Fund is taxed under the dispositions applicable to Registered Investment Companies established by the Puerto Rico Internal Revenue Code of 2011, as amended ("the Code"), its regulations and the administrative pronouncements promulgated thereunder. The Code states that every registered investment company will be exempt from Puerto Rico income tax for a taxable year if it distributes to its stockholders at least 90% of its taxable net investment income for such taxable year. The Fund intends to meet the 90% distribution requirement on a yearly basis to maintain the income tax exemption.
For U.S. federal income taxes, the Fund will be treated as a foreign corporation not engaged in a trade or business in the United States for purposes of the U.S. Internal Revenue Code of 1986, as amended (the “U.S. Code”) and does not intend to derive income treated as effectively connected with a trade or business in the United States. As a foreign corporation not engaged in a trade or business in the United States, the Fund will only be subject to United States federal income taxes if it realizes certain items of U.S. source income of a fixed or determinable annual or periodic nature, in which case the Fund will be subject to withholding of United States federal income tax at a 30% gross rate on such U.S. source income (not including interest received by the Fund on certain registered obligations).
Temporary differences between book-basis and tax-basis components of total distributable earnings arise when certain items, of income gain, or loss are recognized in different periods for financial statement and tax purposes; these differences will reverse at some time in the future. As of period end, the tax-basis component of total distributable earnings are detailed as follows:
| Undistributed ordinary loss: | ($648,880) |
| Undistributed capital gains: | $300,112 |
| Unrealized depreciation: | ($1,312,207) |
The Puerto Rico income tax basis of the Fund's investments at December 31, 2022, was $35,705,636, and net unrealized depreciation for income tax purposes was $1,312,207 (gross unrealized appreciation $2,581,419; gross unrealized depreciation ($3,893,626)).
The Fund recognizes the tax benefits of uncertain tax positions only when the position is more likely than not to be sustained, assuming examination by tax authorities. Management has analyzed the Fund's tax positions and concluded that no liability for unrecognized tax benefits should be recorded related to uncertain tax positions expected to be taken in the Fund's 2022 tax returns. The Fund identifies its major tax jurisdictions as Commonwealth of Puerto Rico; however, the Fund is not aware of any tax positions for which it is reasonably possible that the total amounts of unrecognized tax benefits will change materially in the next 12 months. The Fund remains subject to income tax examinations for its PR income taxes generally for the years 2019 through 2022.
| Annual Report | December 31, 2022 | 25 |
| X-Square Balanced Fund | Notes to Financial Statements |
| | December 31, 2022 |
The Fund distributed to shareholders $679,512 as return of capital from January 1, 2022 through December 31, 2022.
Indemnification: The Fund indemnifies its officers and managers for certain liabilities that may arise from the performance of their duties to the Fund. Additionally, in the normal course of business, the Fund enters into contracts that contain a variety of representations and warranties that provide general indemnities. The Fund’s maximum exposure under these arrangements is unknown, as this would involve future claims that may be made against the Fund that have not yet occurred. However, the Fund expects the risk of loss due to these warranties and indemnities to be remote.
NOTE 3 — FAIR VALUE MEASUREMENTS
The Fund discloses the classification of its fair value measurements following a three-tier hierarchy based on the inputs used to measure fair value. Inputs refer broadly to the assumptions that market participants would use in pricing the asset or liability, including assumptions about risk. Inputs may be observable or unobservable. Observable inputs reflect the assumptions market participants would use in pricing the asset or liability that are developed based on market data obtained from sources independent of the reporting entity. Unobservable inputs reflect the reporting entity’s own assumptions about the assumptions market participants would use in pricing the asset or liability that are developed based on the best information available.
Various inputs are used in determining the value of the Fund’s investments as of the end of the reporting period. When inputs used fall into different levels of the fair value hierarchy, the level in the hierarchy within which the fair value measurement falls is determined based on the lowest level input that is significant to the fair value measurement in its entirety. The designated input levels are not necessarily an indication of the risk or liquidity associated with these investments.
These inputs are categorized in the following hierarchy under applicable financial accounting standards:
| Level 1 – | Unadjusted quoted prices in active markets for identical investments, unrestricted assets or liabilities that the Fund has the ability to access at the measurement date; |
| Level 2 – | Quoted prices which are not active, quoted prices for similar assets or liabilities in active markets or inputs other than quoted prices that are observable (either directly or indirectly) for substantially the full term of the asset or liability; and |
| Level 3 – | Significant unobservable prices or inputs (including the Fund’s own assumptions in determining the fair value of investments) where there is little or no market activity for the asset or liability at the measurement date. |
| X-Square Balanced Fund | Notes to Financial Statements |
| | December 31, 2022 |
The following is a summary of the inputs used to value the Fund’s investments as of December 31, 2022:
| Investments in Securities at Value | | Level 1 | | | Level 2 | | | Level 3 | | | Total | |
| Common Stocks(a) | | $ | 23,892,333 | | | $ | – | | | $ | – | | | $ | 23,892,333 | |
| Government Bonds | | | 10,501,096 | | | | – | | | | – | | | | 10,501,096 | |
| Total | | $ | 34,393,429 | | | $ | – | | | $ | – | | | $ | 34,393,429 | |
| (a) | For a detailed sector breakdown, see the accompanying Schedule of Investments. |
There were no Level 3 securities held in the Fund at December 31, 2022. There were no transfers in or out from Level 3 as of and for the year ended December 31, 2022.
NOTE 4 — INVESTMENT ADVISORY AGREEMENT
As compensation for its services, the Fund pays to the Adviser a monthly management fee at an annual rate of 1.00% of its average daily net assets.
The Adviser, a related party to the Fund, pursuant to an Amended and Restated Expense Reimbursement Agreement (the “Agreement”), has contractually agreed to reduce its fees and/or absorb expenses of the Fund, at least until one year from the date of the Fund’s prospectus (through April 30, 2022), to ensure that Net Annual Operating Expenses (excluding taxes, extraordinary expenses, reorganization expenses, brokerage commissions, interest, other expenditures that are not capitalized in accordance with generally accepted accounting principles, and other extraordinary expenses not incurred in the ordinary course of the Fund’s business) will not exceed 2.75%, 3.50% and 2.50% of the Fund’s average daily net assets, respectively for Class A, Class C and Institutional Class, respectively. The Adviser will be permitted to recover, on a class-by-class basis, any fees waived and/or expenses reimbursed pursuant to the Agreement described above to the extent that the Fund expenses in later periods fall below the lesser of (i) the expense limitation in effect at the time the fees and/or expenses to be recovered were waived and/or reimbursed and (ii) the expense limitation in effect at the time the Adviser seeks to recover the fees or expenses. The Adviser will not be entitled to recover any such waived or reimbursed fees and expenses more than three years after the date on which the fees were waived or expenses were reimbursed. The termination date of this Agreement is April 30, 2022 (the “Initial Term”). This Agreement shall continue automatically for periods of one year (each such one year period, a “Renewal Year”). This Agreement may be terminated, as to any succeeding Renewal Year, by either party upon 60 days’ written notice prior to the end of the current Initial Term or then current Renewal Year. Notwithstanding the foregoing, this Agreement may be terminated by the Fund’s Board of Managers at any time if it determines that such termination is in the best interest of the Fund and its members. The Adviser may not terminate this waiver arrangement without the approval of the Fund’s Board of Managers.
| Annual Report | December 31, 2022 | 27 |
| X-Square Balanced Fund | Notes to Financial Statements |
| | December 31, 2022 |
As of December 31, 2022, the following amounts were available for recoupment by the Adviser based upon their potential expiration date:
| | | Expiring in 2023 | | | Expiring in 2024 | | | Expiring in 2025 | |
| Class A | | $ | 361,637 | | | $ | 135,149 | | | $ | 146,429 | |
| Class C | | | 30,046 | | | | 21,133 | | | | 20,782 | |
| Institutional | | | 53,037 | | | | 10,793 | | | | 7,432 | |
NOTE 5 — OTHER AGREEMENTS
Distribution and Services Agreement
The Fund has adopted a Distribution and Shareholder Servicing Plan pursuant to Rule 12b-1 under the 1940 Act (the “Plan”). Under the Plan, the Fund is authorized to pay distribution fees in connection with the sale and distribution of its shares and pay service fees in connection with the provision of ongoing services to shareholders of each class and the maintenance of shareholder accounts in an amount up to 0.25% of its average daily net assets each year with respect to Class A Shares, 0.00% with respect to Institutional Class shares and 1.00% with respect to Class C shares. The Class C distribution fee includes a distribution fee of up to 0.75% and a service fee of up to 0.25%.
ALPS Distributors, Inc. (the “Distributor”) serves as the Fund’s distributor. The Distributor acts as an agent for the Fund and the distributor of the Fund’s shares.
Administration, Bookkeeping and Pricing Agreement
ALPS Fund Services, Inc. (“ALPS”) serves as the administrator to the Fund. The Fund has agreed to pay expenses incurred in connection with ALPS administrative activities. Pursuant to the Administration, Bookkeeping and Pricing Services Agreement, ALPS will provide operational services to the Fund including, but not limited to fund accounting and fund administration and generally assist in the Fund operations.
Transfer Agency Agreement
ALPS also serves as the Transfer Agent to the Fund. Under the Transfer Agency Agreement, ALPS is responsible for maintaining all shareholder records of the Fund.
NOTE 6 — INVESTMENT TRANSACTIONS
Investment transactions for the year ended December 31, 2022, excluding U.S. Government Obligations and short-term investments, were as follows:
| | | Cost of Investments Purchased | | | Proceeds from Investments Sold | |
| | $ | 5,887,715 | | | $ | 931,474 | |
| X-Square Balanced Fund | Notes to Financial Statements |
| | December 31, 2022 |
Purchases and sales of U.S. Government Obligations for the year ended December 31, 2022 were as follows:
| | | Cost of Investments Purchased | | | Proceeds from Investments Sold | |
| | $ | 17,091,973 | | | $ | 16,019,338 | |
NOTE 7 — LINE OF CREDIT
As of December 31, 2022, the Fund had secured a bank line of credit through U.S. Bank, subject to the limitations of the 1940 Act for borrowings. The line of credit bears interest at 7.5% as of December 31, 2022. During the year ended December 31, 2022, the Fund had outstanding borrowings for six days and incurred $65 of interest expense related to its outstanding borrowings. For the six days during which the Fund had outstanding borrowings, average borrowings were $55,167. As of December 31, 2022, there were no outstanding borrowings under the US Bank arrangement.
NOTE 8 — RISKS AND UNCERTAINTIES
The ongoing war in Ukraine posses a risk to global stability. Supply chains including crops such as wheat could be further disrupted by the conflict, thus putting incremental pressure on prices. In addition, energy security and markets will continue to experience instability as Ukraine is a major gas corridor and Russia supplies more than 10% of global energy consumption. The net result of this environment is inflation which has a negative impact on margins, consumption and Central Bank reaction function which is to deliver higher rates for longer.
NOTE 9 — SUBSEQUENT EVENTS
The Adviser has evaluated subsequent events through the date of issuance of the financial statements included herein. There have been no subsequent events that occurred during such period that would require disclosure or would be required to be recognized in the financial statements.
| Annual Report | December 31, 2022 | 29 |
| X-Square Balanced Fund | Report of Independent Registered
Public Accounting Firm |
To the Shareholders and Board of Managers of
X-Square Balanced Fund, LLC:
Opinion on the financial statements
We have audited the accompanying statement of assets and liabilities of X-Square Balanced Fund, LLC (the “Fund”) including the schedule of investments as of December 31, 2022, the related statement of operations for the year ended December 31, 2022, the statement changes in net assets and the financial highlights for each of the two years in the period ended December 31, 2022, and the related notes (collectively referred to as the “financial statements”). In our opinion, the financial statements present fairly, in all material respects, the financial position of the Fund as of December 31, 2022, the results of its operations for the year then ended, and the changes in net assets and the financial highlights for each of the two years in the period ended December 31, 2022 in conformity with accounting principles generally accepted in the United States of America. The financial statements of the Fund for the year ended December 31, 2020 and for the period from November 4, 2019 to December 31, 2019 were audited by other auditors. Those auditors expressed an unqualified opinion on those financial statements in their report dated February 24, 2021.
Basis for opinion
These financial statements are the responsibility of the Fund’s management. Our responsibility is to express an opinion on the Fund’s financial statements based on our audits. We are a public accounting firm registered with the Public Company Accounting Oversight Board (United States) (“PCAOB”) and are required to be independent with respect to the Fund in accordance with the U.S. federal securities laws and the applicable rules and regulations of the Securities and Exchange Commission and the PCAOB. We conducted our audits in accordance with the standards of the PCAOB.
Those standards require that we plan and perform the audit to obtain reasonable assurance about whether the financial statements are free of material misstatement, whether due to error or fraud. The Fund is not required to have, nor were we engaged to perform, an audit of its internal control over financial reporting. As part of our audits, we are required to obtain an understanding of internal control over financial reporting but not for the purpose of expressing an opinion on the effectiveness of the Fund’s internal control over financial reporting. Accordingly, we express no such opinion.
Our audits included performing procedures to assess the risks of material misstatement of the financial statements, whether due to error or fraud, and performing procedures that respond to those risks. Such procedures included examining, on a test basis, evidence regarding the amounts and disclosures in the financial statements. Our procedures included confirmation of securities owned as of December 31, 2022, by correspondence with the custodian. Our audits also included evaluating the accounting principles used and significant estimates made by management, as well as evaluating the overall presentation of the financial statements. We believe that our audit provides a reasonable basis for our opinion.
We have served as the Fund’s auditor since 2021.
| /s/ Kevane Grant Thornton, LLP | |
| San Juan, Puerto Rico | |
| February 24, 2023. | |
Certified Public Accountants (of Puerto Rico) License 217 Expires December 1, 2025 Stamp E520364 of the Puerto Rico Society of CPAS was affixed to the file copy of this report
| X-Square Balanced Fund | Additional Information |
| | December 31, 2022 (Unaudited) |
PORTFOLIO HOLDINGS
The Fund files a complete schedule of portfolio holdings with the U.S. Securities and Exchange Commission (“SEC”) for the first and third quarters of each fiscal year on Form N-PORT within 60 days after the end of the period. Copies of the Fund’s Form N-PORT are available without a charge, upon request, by contacting the Fund at 1-787-282-1621 and on the SEC’s website at http://www.sec.gov.
PROXY VOTING
A description of the Fund’s proxy voting policies and procedures is available (1) without charge, upon request, by calling 1-787-282-1621, (2) on the Fund’s website located at http://www.xsquarecapital.com, or (3) on the SEC’s website at http://www.sec.gov. Information regarding how the Fund voted proxies relating to portfolio securities during the twelve-month period ended June 30 will be available on the SEC’s website at http://www.sec.gov.
BOARD CONSIDERATION AND APPROVAL OF THE INVESTMENT ADVISORY CONTRACT
The Investment Company Act of 1940 requires that the Board of Trustees of the X-Square Balanced Fund (the “Board” or “Managers”), including all of the Trustees who are not “interested persons” of the Fund (“Independent Trustees”), review the Fund’s investment advisory agreement and consider whether or not to approve such an agreement. The Trustees met on November 18, 2022 to discuss the approval of the renewal of the investment advisory agreement. At that meeting, the Board, including a majority of the Independent Trustees, considered whether to approve the renewal of the investment advisory agreement. At that time, the Board reviewed information furnished by X-Square Capital, LLC (the “Adviser” or “X-Square”) regarding the terms of the investment advisory agreement. The Independent Trustees then considered management’s recommendation as to the approval of the Agreement.
As part of the process to consider these matters on behalf of the Independent Trustees, legal counsel to the Independent Trustees requested certain information from the Adviser. In response to these requests, the Independent Trustees received information from the Adviser that addressed specific factors designed to inform the Board’s consideration of the Agreement. Counsel also provided the Independent Trustees and the Board with a memorandum detailing their responsibilities pertaining to the approval of the Agreement.
In voting to approve the Agreement, the Board did not identify any single factor as all-important or controlling. The following summary does not detail all the matters considered by the Board, but provides a summary of the material matters it considered. The Board considered whether the Agreement would be in the best interests of the Fund and its shareholders, an evaluation based on: (1) the nature, quality and extent of services provided to the Fund; (2) the performance of the Fund; (3) the level of the Fund’s management fees and expense ratios; (4) the costs of the services provided and profits realized by the Adviser and their respective affiliates from their relationships with the Fund; (5) the extent to which economies of scale would be realized as the Fund grows and whether fee levels will reflect economies of scale for the benefit of shareholders; (6) the “fall-out” benefits to the Adviser and their respective affiliates (i.e., any direct or indirect benefits to be derived by the Adviser and their respective affiliates from their relationships with the Fund); and (7) other general information about the Adviser. The following is a summary of the Board’s discussion and conclusions regarding these matters.
| Annual Report | December 31, 2022 | 31 |
| X-Square Balanced Fund | Additional Information |
| | December 31, 2022 (Unaudited) |
Nature, Extent, and Quality of the Services under the Investment Advisory Agreement: The Managers received and considered information regarding the nature, extent, and quality of services provided to the Fund by X-Square under the Investment Advisory Agreement. The Managers also reviewed and considered the nature and extent of any non-advisory administrative services provided by the Adviser to the Fund.
The Managers reviewed and considered X-Square’s investment advisory personnel, compensation and the Fund’s performance. The Managers considered the background and experience of X-Square’s management in connection with the Fund, including reviewing the qualifications, backgrounds, and responsibilities of the management team primarily responsible for the day-to-day portfolio management of the Fund and the extent of the resources devoted to research and analysis of actual and potential investments. The Managers also reviewed the research and decision-making processes utilized by X-Square, including the methods adopted to seek to achieve compliance with the investment strategies and policies of the Fund. The Managers also reviewed, among other things, X-Square’s compliance policies and procedures, including its disaster recovery plan cybersecurity standards.
After extensive discussion, the Board concluded that the nature, extent and quality of advisory services provided to the Fund by X-Square pursuant to the Investment Advisory Agreement were satisfactory.
Performance: The Managers reviewed performance information for the Fund for the period from November 1, 2021 to October 31, 2022 and considered the comparison of the Fund’s performance to the performance of comparable funds provided by X-Square, noting that the Fund outperformed those comparable funds during that period.
Breakpoints and Economies of Scale: The Managers reviewed the advisory fee rates and gross and net total expense ratio of the Fund, noting that X-Square had waived fees and/or reimbursed expenses of the Fund pursuant to a contractual expense reimbursement agreement. The Managers noted that the Adviser currently does not manage comparable funds or accounts, but considered certain information provided by X-Square including fees charged by funds utilizing a strategy similar to that employed by the Fund.
The Managers noted that the Fund continues to seek economies of scale and would be realized as the Fund grows.
Profitability: The Managers considered the costs of the services provided by X-Square to the Fund and the compensation and benefits received by X-Square in providing services to the Fund. The Managers reviewed the financial statements of X-Square and considered any direct or indirect revenues that could be received by X-Square. The Board concluded that X-Square’s fees were reasonable in relation to the nature and quality of the services provided to the Fund, taking into account the fees charged by other advisers for managing comparable funds. The Independent Managers also concluded that the overall expense ratio of the Fund was reasonable, taking into account the size of the Fund, the expense waivers, and the quality of services provided by X-Square.
Other Benefits to the Adviser: The Managers also discussed other benefits received by X-Square from its management of the Fund, including, without limitation, the ability to market its advisory services for similar products in the future and the potential growth of X-Square’s assets under management, which could allow the Adviser to enter into a wider distribution network. After discussion, the Board concluded that the advisory fees were reasonable in light of these fall-out benefits.
| X-Square Balanced Fund | Additional Information |
| | December 31, 2022 (Unaudited) |
The Board concluded, based on consideration of all factors that it deemed material, and assisted by the advice of counsel, that it would be in the best interest of the Fund and its shareholders to approve the continuation of the Investment Advisory Agreement for an additional one-year term. In making such determination, the Managers considered all factors and no one factor alone was deemed dispositive.
| Annual Report | December 31, 2022 | 33 |
| X-Square Balanced Fund | Managers and Officers |
| | December 31, 2022 (Unaudited) |
Overall responsibility for management of the Fund rests with the members of the Board (the “Managers”), who are elected by the shareholders of the Fund, unless appointed to fill a vacancy in accordance with the limited liability company agreement of the Fund and the 1940 Act. The Fund is managed by the Board in accordance with the laws of the Commonwealth of Puerto Rico. There are currently three (3) Managers, two (2) of whom are not “interested persons” (as defined in the 1940 Act) of the Fund (the “Independent Managers”). The Managers, in turn, elect the officers of the Fund to supervise actively its day-to-day operations.
The following table lists each Manager, his or her year of birth, position with the Fund, principal occupations during the past five years, and other directorships. Each Manager oversees the Fund. There is no defined term of office, and each Manager serves until the earlier of his resignation, retirement, removal, death, or the election of a qualified successor. Each Manager’s address is c/o X-Square Balanced Fund, Popular Center Building, 209 Munoz Rivera, Suite 1111, San Juan, Puerto Rico 00918.
INDEPENDENT MANAGERS
| Name, Address and YOB | | Positions Held with the Fund and Length of Time Served | | Principal Occupation During the Past Five Years | | Number of Portfolios in Fund Complex* Overseen by Manager | | Other Directorships held by Manager During Last Five Years |
Ramon Ponte
(1958) | | Manager since March 2022 | | Independent consultant. Partner with PricewaterhouseCoopers until 2011. | | 1 | | Puerto Rico CPA Foundation, Fundacion Intellectus |
Denisse Rodriguez
(1984) | | Manager since March 2022 | | Executive Director, Colmena66 at the Puerto Rico Science Technology & Research Trust since 2016 | | 1 | | None |
Luis Roig
(1959) | | Manager since June 2019 | | Managing Director and CFO, Santander Securities LLC from 2013 until 2016; Chief Financial Officer, Americas Leading Finance LLC since 2016. | | 1 | | None |
| X-Square Balanced Fund | Managers and Officers |
| | December 31, 2022 (Unaudited) |
INTERESTED MANAGERS
| Name, Address and YOB | | Positions Held with the Fund and Length of Time Served | | Principal Occupation During the Past Five Years | | Number of Portfolios in Fund Complex* Overseen by Trustee | | Other Directorships held by Trustee During Last Five Years |
Ignacio Canto**
(1983) | | President, since January 2019 | | President of X-Square Capital, LLC since 2013. | | 1 | | Director of X2 Alternative Dividend Alpha Fund, Inc. |
| * | The “Fund Complex” consists of the Fund. |
| ** | An “interested person,” as defined by the 1940 Act. Mr. Canto is deemed to be an “interested” Manager because he is the owner of all membership interests of the Adviser and also serves as its President, Treasurer and sole director. |
| Annual Report | December 31, 2022 | 35 |
| X-Square Balanced Fund | Managers and Officers |
| | December 31, 2022 (Unaudited) |
OFFICERS
| Name, Address and YOB | | Position/Term of Office* | | Principal Occupation During the Past Five Years |
Ignacio Canto
(1983) | | President since January 2019 | | President of X-Square Capital, LLC since 2013. |
Cristina Perez
(1976) | | Treasurer since May 2022 | | Chief Compliance Officer and Head of Operations at X-Square Capital since 2022. Banco Popular de Puerto Rico Mutual Fund’s Administration from 1999 to 2022. |
Gabriel Medina
(1989) | | Secretary since January 2019 | | Portfolio Manager of X-Square Capital, LLC since 2018. Chief Compliance Officer of X-Square Capital, LLC from 2015 to 2018. Analyst at Accenture from 2014 to 2015. |
Ivana Kovačić
(1977) | | Chief Compliance Officer, since 2022 | | Deputy Chief Compliance Officer, ALPS Fund Services, Inc. since October 2021. Ms. Kovačić joined ALPS in March 2020 as a Regulatory Compliance Manager. Prior to her current role, Ms. Kovačić served as Senior Compliance Analyst at Jennison Associates (August 2013 – January 2019). |
The Statement of Additional Information includes additional information about the Managers and is available, without charge, upon request, by calling (toll-free) 1-787-282-1621.

Must be accompanied or preceded by a Prospectus.
ALPS Distributors, Inc. is the Distributor for the X-Square Balanced Fund.
| (a) | The Registrant, as of the end of the period covered by this report, has adopted a code of ethics that applies to the Registrant’s principal executive officer, principal financial officer, principal accounting officer or controller or any persons performing similar functions on behalf of the Registrant. |
| (c) | During the period covered by this report, no amendments to the provisions of the code of ethics referred to above in Item 2(a) were made. |
| (d) | During the period covered by this report, no implicit or explicit waivers to the provisions of the code of ethics referred to above in Item 2(a) were granted. |
| (f) | The Registrant’s Code of Ethics is attached as Exhibit 13(a)(1) hereto. |
| Item 3. | Audit Committee Financial Expert. |
The Board of Managers (“Board”) of the Registrant has determined that the Registrant has at least one Audit Committee Financial Expert serving on its audit committee. The Board has designated Ramond Ponte and Luis Roig as the Registrant’s Audit Committee Financial Experts. Messrs. Ponte and Roig are “independent” as that term is defined in paragraph (a)(2) of Item 3 to Form N-CSR.
| Item 4. | Principal Accountant Fees and Services |
| (a) | Audit Fees: Audit fees are fees related to the audit of and review of the Fund’s financial statements included in annual reports and registration statements and other services that are normally provided by the independent registered public accounting firm in connection with statutory and regulatory filings or engagements. The aggregate fees billed for each of the last two fiscal years for professional services rendered by Kevane Grant Thornton for the audit of the Fund’s annual financial statements or services that are normally provided by the accountant in connection with statutory and regulatory filings or engagements for those fiscal years were $49,800 and $39,350 for fiscal year ended December 31, 2022 and fiscal year ended December 31, 2021, respectively. |
| (b) | Audit-Related Fees: Audit-related fees are fees for assurance and related services that are reasonably related to the performance of the audit or review of financial statements, but are not reported as audit fees. The aggregate fees billed in each of the last two fiscal years for assurance and related services by Kevane Grant Thornton that are reasonably related to the performance of the audit of the Fund’s financial statements were $0 and $0 for the fiscal years ended December 31, 2022 and fiscal year ended December 31, 2021, respectively. |
| (c) | Tax Fees: Tax fees are fees associated with tax compliance, tax advice and tax planning. The aggregate fees billed in each of the last two fiscal years for professional services rendered by Kevane Grant Thornton for tax compliance were $4,095 and $3,750 for the fiscal years ended December 31, 2022 and fiscal year ended December 31, 2021, respectively. |
| (d) | All Other Fees: No fees were billed by Kevane Grant Thornton for products and services provided to the Fund other than the services reported in “Audit Fees,” “Audit-Related Fees,” and “Tax Fees” above for the fiscal years ended December 31, 2022 and fiscal year ended December 31, 2021, respectively. |
| (e) | (e)(1) Audit Committee Pre-Approval Policies and Procedures: All services to be performed by the Registrant's principal accountant must be pre-approved by the Registrant's Audit Committee. |
| (e)(2) | No services described in paragraphs (b) through (d) of this Item 4 were approved by the Registrant’s audit committee pursuant to paragraph (c)(7)(i)(C) of Rule 2-01 of Regulation S-X. |
| Item 5. | Audit Committee of Listed Registrants. |
| (a) | Not applicable to the Registrant. |
| (b) | Not applicable to the Registrant |
| (a) | Schedule of Investments (as set forth in 17 CFR 210.12-12) is included as part of the Report to Stockholders filed under Item 1 of this Form N-CSR. |
| (b) | Not applicable to the Registrant. |
| Item 7. | Disclosure of Proxy Voting Policies and Procedures for Closed-End Management Investment Companies. |
Not applicable to the Registrant.
| Item 8. | Portfolio Managers of Closed-End Management Investment Companies. |
Not applicable to the Registrant.
| Item 9. | Purchases of Equity Securities by Closed-End Management Investment Company and Affiliated Purchasers. |
Not applicable to the Registrant.
| Item 10. | Submission of Matters to Vote of Security Holders. |
There have been no material changes to the procedures by which shareholders may recommend nominees to the Registrant’s Board of Managers, where those changes were implemented after the Registrant last provided disclosure in response to the requirements of Item 407(c)(2)(iv) of Regulation S-K (17 CFR 229.407) (as required by Item 22(b)(15) of Schedule 14A (17 CFR 240.14a-101)), or this Item.
| Item 11. | Controls and Procedures. |
| (a) | The Registrant’s principal executive officer and principal financial officer have concluded that the Registrant’s disclosure controls and procedures (as defined in Rule 30a-3(c) under the Investment Company Act of 1940, as amended) are effective based on their evaluation of these controls and procedures as of a date within 90 days of the filing date of this report. |
| (b) | There was no change in the Registrant's internal control over financial reporting (as defined in Rule 30a-3(d) under the Investment Company Act of 1940, as amended) during the period covered by this report that has materially affected, or is reasonably likely to materially affect, the Registrant's internal control over financial reporting. |
| Item 12. | Disclosure of Securities Lending Activities for Closed-end Management Investment Companies. |
Not applicable to the Registrant.
SIGNATURES
Pursuant to the requirements of the Securities Exchange Act of 1934 and the Investment Company Act of 1940, the Registrant has duly caused this Report to be signed on its behalf by the undersigned, thereunto duly authorized.
| | X-Square Balanced Fund, LLC |
| | | |
| | By: | /s/ Ignacio Canto |
| | | Ignacio Canto |
| | | Principal Executive Officer/President |
| | | |
| | Date: | March 2, 2023 |
Pursuant to the requirements of the Securities Exchange Act of 1934 and the Investment Company Act of 1940, this Report has been signed below by the following persons on behalf of the Registrant and in the capacities and on the dates indicated.
| | X-Square Balanced Fund, LLC |
| | | |
| | By: | /s/ Ignacio Canto |
| | | Ignacio Canto |
| | | Principal Executive Officer/President |
| | | |
| | Date: March 2, 2023 |
| | | |
| | By: | /s/ Cristina Perez |
| | | Cristina Perez |
| | | Principal Financial Officer/Treasurer |
| | | |
| | Date: | March 2, 2023 |