UNITED STATES
SECURITIES AND EXCHANGE COMMISSION
Washington, D.C. 20549
FORM N-CSR
CERTIFIED SHAREHOLDER REPORT OF REGISTERED
MANAGEMENT INVESTMENT COMPANIES
Investment Company Act file number: 811-23417
X-Square Balanced Fund, LLC
(Exact name of Registrant as specified in charter)
Centro Internacional de Mercadeo II
90 Carr 165, Suite 803
Guaynabo, PR 00968
(Address of Principal Executive Offices) (Zip code)
X-Square Capital, LLC
Centro Internacional de Mercadeo II
90 Carr 165, Suite 803
Guaynabo, PR 00968
(Name and Address of Agent for Service)
With a copy to:
Andrew Davalla
Thompson Hine LLP
41 South High Street, Suite 1700
Columbus, Ohio 43215
Registrant’s Telephone Number, including Area Code: (787) 282-1621
Date of fiscal year end: December 31
Date of reporting period: January 1, 2023 - December 31, 2023
| Item 1. | Report to Stockholders. |

| Shareholder Letter | 1 |
| Management Discussion of Fund | |
| Performance and Portfolio Update | 5 |
| Disclosure of Fund Expenses | 8 |
| Schedule of Investments . | 10 |
| Statement of Assets and Liabilities | 14 |
| Statement of Operations | 16 |
| Statement of Changes in Net Assets . | 17 |
| Financial Highlights . | 20 |
| Notes to Financial Statements . | 26 |
| Report of Independent Registered | |
| Public Accounting Firm | 33 |
| Additional Information | 34 |
| Managers and Officers | 36 |
| X-Square Balanced Fund | Shareholder Letter |
| | December 31, 2023 (Unaudited) |
Dear Shareholder:
The year 2023 was one of transition. The world transitioned from a high inflationary environment characterized by supply chain disruptions, towards normalization, abundant supplies, less manufacturing and shipping bottlenecks, hence lower and downward slopping inflationary pressures.
Given one of the fastest tightening campaigns on record on behalf of the Federal Reserve (the “Fed”), expectations were dire for 2023. However, too much pessimism on behalf of analysts and market participants translated into a stellar year for equity markets, as reflected in all three main U.S. indices, the S&P500 Index (“SPX”), the Nasdaq Composite Index (“Nasdaq”), and the Dow Jones Industrial Average Index (“Dow”). The journey, though, wasn’t a straight line. Bouts of volatility, as measured by the SPX Volatility Index (“VIX”), also known as the fear index, unfolded during the regional banking crisis in March and during September and October, the latter months being notorious for being seasonally poor months. The VIX, nonetheless, managed to record a pre-Covid low. The MOVE Index, which is the VIX’s counterpart for U.S. bonds, reached its highest point since the Great Financial Crisis as the regional banks crisis was unfolding. Regardless, in the fixed income markets, bonds, as measured by the U.S Bloomberg Aggregate Bond Index, swung into a yearly gain given the historic bond rally, something not seen in the last four decades, that was unleashed in November and December. All these factors helped the X-Square Balanced Fund (the “Fund”) registered a 14.79%, 14.03% and 15.13% net gain for Class A, Class C, and Institutional Class, respectively, during fiscal year ended December 31, 2023 while the 60/40 benchmark portfolio (S&P 500 Index with the Bloomberg US Aggregate Bond Index) gained 17.99% for the period.
We believe the main drivers behind the 2023 stellar performance across major asset classes, except for the U.S. dollar, were the resilient consumer, tight labor market and a great advancement in bringing inflation down. After the Fed had hiked 550bps in a span of 15 months and reduced its balance sheet by more than $1 trillion dollars, there was consensus that the consumer would falter or a financial crisis would emerge, either of these potentially triggering a recession. Although there was a slowdown from the 2021 sugar-high fueled by all the Covid-19 (“Covid”) stimulus programs, no recession materialized. However, some corners of the markets did suffer some severe stresses, such as Silicon Valley Bank and First Republic Bank, which were forced to liquidate or be acquired by their larger counterparts due to a flight in deposits seeking higher yielding safe heavens such as treasury bills. The losses were estimated in the hundreds of billions of dollars. Although these collapses would probably not have happened should the Fed not increased rates, the main culprit, in our opinion, was poor treasury management on behalf of those banks. Thankfully, the Fed, having learned from previous crises, was more than proactive with its toolbox in order to contain the damage and avoid a system-wide event.
The tightness of the labor market also caught everyone by surprise in 2023. It was the third consecutive year of jobs creation, although at a slower pace. In addition, productivity reached a multi-decade high. While the reasons behind the improvement are still unknown, we believe some of this behavior can be attributed to artificial intelligence (“AI”). AI is probably the reason that equity markets began 2023 in an upbeat note. By the end of 2022 the SPX was still in a bear market, more than 20% off its all-time high set in 2021. However, the mania behind AI was of such magnitude that by the end of January 2023, the SPX had already climbed 6.28% in just one month. NVIDIA, the leader, by a wide margin, in providing the extensive computing power demanded by AI algorithms, was the canary in the coalmine of what AI, among other factors, would cause to the market performance of technology companies, mainly mega caps, in 2023. The largest 7 technology companies were responsible for approximately 60% of the returns of the SPX during 2023. In comparison, the S&P500 Equal Weight Index returned 13.84% during the same period. This lack of breadth in the markets has been frowned upon historically.
| Annual Report | December 31, 2023 | 1 |
| X-Square Balanced Fund | Shareholder Letter |
| | December 31, 2023 (Unaudited) |
The markets, across all asset classes, experienced significant volatility throughout late summer and into October. The SPX dropped slightly more than 10%, causing many flashbacks of 2022. The velocity and strength of the drop were very violent, and pessimism was once again the narrative given the “higher for longer” mantra. This mantra means keeping higher rates for a longer period than markets anticipate. However, November went into history as one of the best November’s on record and markets continued to rally into late December. The Fed’s main inflation gauge, the core PCE (U.S. Personal Consumption Expenditure Index), kept collapsing throughout October and November. Then, in December, Fed Chairman Powell for the first time since rate hikes started, alluded to rate cuts at some point in 2024. It caught everyone off guard because just a few weeks earlier, Powell was talking about leaving rates higher for a longer period in order to tame inflation. This caused swaps and future markets to begin aggressively pricing rate cuts as early as March 2024, for a total of 150bps of rate cuts in 2024. Consequently, markets skyrocketed, valuations increased, and volatility and the U.S. dollar collapsed. Fortunately, this caused the market breadth to greatly improve, causing more cyclical sectors to outperform. For perspective, the Fed’s dot-plot only contemplates a total of 75bps worth of cuts as this letter goes to writing.
Although the markets tend to exaggerate moves to either side, the fact that Powell acknowledged that peak rates are behind us has great implications across markets, mainly other market participants and both companies and individuals. Other central banks across developed and developing nations tend to follow the Fed’s path. Many developing nations borrow in U.S. Dollars, usually because there’s more liquidity which results in lower borrowing rates. Knowing that the Fed is about to cut rates brings certainty. Businesses need certainty to better map out their capital expenditure programs into the future. Similarly, businesses looking to issue debt or equity, engage in M&A activity or go public via an IPO, are also incentivized to do so in a more stable market. Furthermore, individuals, when borrowing large sums of money for large purchases, are better off when there is less uncertainty. Thus, knowing that rates will decrease in 2024 brought a sigh of relief to all consumers, especially those that rely on leverage. Another relief, for both consumers and businesses, is the fact that inflation is within striking distance of the Fed’s objective.
The Fund is positioned to benefit from a “soft landing”, that is, bringing inflation down through a monetary tightening campaign without having to endure an economic recession. The fixed income portion of the portfolio is allocated almost equally in between Ginnie Maes, pools of mortgage-backed securities, and Treasury securities ranging from Treasury bills to notes. The mortgages are low coupons in order to minimize prepayment and refinance risk. In addition, the increase in the duration of the fixed income portfolio should act as a tailwind once the Fed begins to materialize its rate cuts. The Fund is diversified throughout different industries and sectors and its overweight towards consumer sensitive stocks which should help the Fund outperform in a no-recession scenario. While banks profitability tends to go down in a rate cuts cycle, the damage caused by the regional banking crises has been to such extent that regional banks valuations remain depressed relative to their largest counterparts. In addition, industrials, materials, utilities, and energy-related companies are sectors the Fund has exposure to that should benefit from a cyclical pick up in activity triggered by easier monetary conditions. These economic-sensitive sectors tend to outperform in an expanding economy and a rates-decreasing scenario. Moreover, energy and the defense sector should also act as hedges should geopolitical tensions continue in the Middle East and Ukraine. In addition, the Fund’s strategy is mainly focused on robust balance sheets and strong free cash flow generating ability. These attributes help companies navigate a downturn in the economy. Also, the Fund is exposed to tourism and travel-related companies. As the dollar keeps receding and middle-classes across developing nations keep growing, tourism is a sector that should keep benefiting and growing throughout the years. Furthermore, the Fund is also exposed to AI-related and technology companies. Semiconductors, or chip stocks, are set to keep capitalizing on the energy-consuming AI algorithms. Super computers are needed to perform AI-related computations and commands, and chip stocks provide many of the hardware needed to do this. Also, semiconductors companies should keep benefitting from a more digital economy, a growing cloud, and the crypto currency space. Thus, we believe this sector is on a secular uptrend that should keep growing into the future. As mentioned, cyclical stocks have lagged behind the main U.S. indices in 2023 and should outperform this year should the economy avoid tipping into a recession.
| X-Square Balanced Fund | Shareholder Letter |
| | December 31, 2023 (Unaudited) |
Despite the fact that a couple of leading economic indicators point to an economic slowdown, consumers and a tight labor market have been responsible for keeping the economy in check, while lower energy prices provide relief for U.S. consumers. Thus, we believe 2024 will be a positive year across equities and fixed income globally at the expense of the U.S. dollar. Absent an exogenous event or a Fed mistake, asset classes should continue their positive trajectory, bond spreads should continue to compress while M&A activity heats up.
The first weeks thus far in 2024 have been very volatile. The continuation in the reduction of the Fed’s balance sheet, decades-low office space occupancy rate, and heightened geopolitical tensions are a few risks that could act as obstacles to risk assets throughout the year. However, the consumer’s resilience, massive fiscal spending and a more certain future should all act as stabilizers in the economy. Furthermore, record share buybacks in the U.S. should also help bring stability to equity securities. As always, we remain focused on the risk exposures of the portfolio, and we will continue to capitalize on opportunities that we believe will create shareholder value.
Best regards,
X-Square Capital, LLC
| Annual Report | December 31, 2023 | 3 |
| X-Square Balanced Fund | Shareholder Letter |
| | December 31, 2023 (Unaudited) |
Glossary
S&P 500 Index – the SPX is widely regarded as the best single gauge of large-cap U.S. equities and serves as the foundation for a wide range of investment products. The SPX includes 500 leading companies and captures approximately 80% coverage of available market capitalization.
Gross Domestic Product – measures the final market value of all goods and services produced within a country. It is the most frequently used indicator of economic activity.
VIX Index – the VIX is a financial benchmark designed to be an up-to-the-minute market estimate of the expected volatility of the SPX, and is calculated by using the midpoint of real-time SPX option bid/ask quotes.
Nasdaq Composite Index – the NASDAQ Composite Index is a broad-based capitalization-weighted index of stocks in all three NASDAQ tiers: Global Select, Global Market and Capital Markets. The index was developed with a base level of 100 as of February 5, 1971.
Dow Jones Industrial Average – the Dow Jones Industrial Average is a price-weighted average of 30 blue-chip stocks that are generally the leaders in their industry. It has been a widely followed indicator of the stock market since October 1, 1928.
US Aggregate Bond Index – the Bloomberg US Aggregate Bond Index is a broad-based flagship benchmark that measures the investment grade, US dollar-denominated, fixed-rate taxable bond market. The index includes Treasuries, government-related and corporate securities, MBS (agency fixed-rate pass-throughs), ABS and CMBS (agency and non-agency).
Yield – yield refers to the return an investor gets on an investment over a certain period of time.
| | Management Discussion of Fund |
| X-Square Balanced Fund | Performance and Portfolio Update |
| | December 31, 2023 (Unaudited) |
Average Annual Total Returns (as of December 31, 2023)
| | 1 Year | 3 Year | Since Inception* |
| X- Square Balanced Fund - A - NAV | 14.79% | 3.80% | 6.47% |
| X- Square Balanced Fund - A - LOAD | 10.46% | 2.49% | 5.50% |
| X- Square Balanced Fund - C - NAV | 14.03% | 3.06% | 5.68% |
| X- Square Balanced Fund - C - LOAD | 13.03% | 3.06% | 5.68% |
| X- Square Balanced Fund - Institutional - NAV | 15.13% | 4.06% | 6.75% |
| S&P 500 Total Return Index(a) | 26.29% | 10.00% | 13.04% |
| 60% S&P 500 and 40% Bloomberg Barclays US Aggregate(b) | 17.67% | 4.71% | 7.71% |
| | | |
The performance data quoted above represents past performance. Past performance is not a guarantee of future results. Investment return and value of the X-Square Balanced Fund (the "Fund”) shares will fluctuate so that an investor’s shares, when sold or redeemed, may be worth more or less than their original cost. The table shown above does not reflect the dedication of taxes that a Shareholder would pay on Fund distributions or the redemption of Fund shares but does reflect the reinvestment of all dividends and distributions. Performance may be lower or higher than performance data quoted. Fund performance current to the most recent month-end is available by calling (787) 282-1621 or by visiting www.xsquarecapital.com.
Fund performance reflects contractual reimbursements in effect. In their absence, performance would be reduced. X-Square Capital, LLC (the “Adviser”) has contractually agreed to reduce its fees and/or absorb expenses of the Fund through at least April 30, 2024, to ensure that Net Annual Operating Expenses will not exceed 2.75%, 3.50% and 2.50% of the Fund’s average daily net assets for Class A, Class C and Institutional Class shares, respectively. The Adviser may not terminate this waiver arrangement without the approval of the Fund’s Board of Managers.
| * | Fund’s inception date is November 1, 2019. |
| (a) | S&P 500® Total Return Index: the Standard & Poor’s composite index of 500 stocks, a widely recognized, unmanaged index of common stock prices. Total return assumes reinvestment of any dividends and distributions realized during a given time period. This index does not incur expenses and is not available for direct investment. |
| (b) | The 60/40 blend is composed of 60% Standard & Poor’s 500 Index (S&P) and 40% Bloomberg Barclays U.S. Aggregate Bond Index (BC Agg) and assumes monthly rebalancing. The S&P is an unmanaged index that is widely regarded as the standard for measuring large-cap U.S. stock market performance. The BC Agg is an unmanaged index that is widely regarded as a standard for measuring U.S. investment grade bond market performance. These indices do not incur expenses and are not available for direct investment. These indices include reinvestment of dividends and/or interest income. |
| Annual Report | December 31, 2023 | 5 |
| | Management Discussion of Fund |
| X-Square Balanced Fund | Performance and Portfolio Update |
| | December 31, 2023 (Unaudited) |
Growth of $10,000 (as of December 31, 2023)
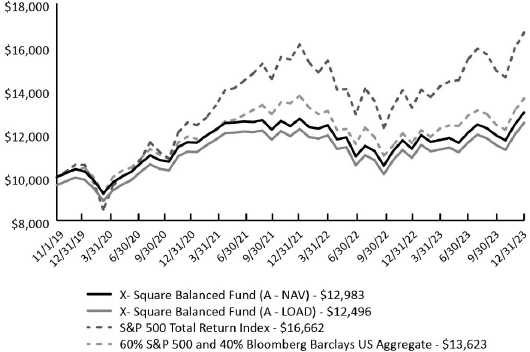
The chart above represents historical performance of a hypothetical investment of $10,000 in the Fund since inception. Past performance does not guarantee future results. This chart does not reflect the deduction of taxes that a shareholder would pay on Fund distributions or the redemption of Fund shares.
Investing in the Fund is subject to investment risks, including possible loss of the principal amount invested.
| | Management Discussion of Fund |
| X-Square Balanced Fund | Performance and Portfolio Update |
| | December 31, 2023 (Unaudited) |
Top Ten Holdings (as a % of Net Assets)* as of December 31, 2023
| Ginnie Mae II Pool, 2.00%, 08/20/2051 | | | 10.70 | % |
| U.S. Treasury Note, 2.25%, 03/31/2024 | | | 8.44 | % |
| Ginnie Mae II Pool, 2.00%, 11/20/2051 | | | 6.10 | % |
| U.S. Treasury Note, 0.625%, 10/15/2024 | | | 3.61 | % |
| U.S. Treasury Bond, 2.75%, 08/15/2032 | | | 3.55 | % |
| United States Treasury Bill, 5.18%, 03/21/24 | | | 3.40 | % |
| Suncor Energy, Inc. | | | 2.21 | % |
| Diamondback Energy, Inc. | | | 1.99 | % |
| PulteGroup, Inc. | | | 1.85 | % |
| Advanced Micro Devices, Inc. | | | 1.75 | % |
| Top Ten Holdings | | | 43.60 | % |
Portfolio Composition (as a % of Net Assets)* as of December 31, 2023
| Common Stock - US | | | 51.72 | % |
| Common Stock - Foreign | | | 11.06 | % |
| Government Bond | | | 19.86 | % |
| Mortgage-Backed Securities | | | 16.80 | % |
| Other Assets in Excess of Liabilities | | | 0.56 | % |
| Net Assets | | | 100.00 | % |
| * | Holdings are subject to change, and may not reflect the current or future position of the portfolio. Tables present indicative values only. |
| Annual Report | December 31, 2023 | 7 |
| X-Square Balanced Fund | Disclosure of Fund Expenses |
| | December 31, 2023 (Unaudited) |
Examples. As a shareholder of the X-Square Balanced Fund (the “Fund”), you incur two types of costs: (1) transaction costs, including applicable redemption fees; and (2) ongoing costs, including management fees, distribution and service (12b-1) fees and other Fund expenses. The following examples are intended to help you understand your ongoing costs (in dollars) of investing in the Fund and to compare these costs with the ongoing costs of investing in other mutual funds. The examples are based on an investment of $1,000 invested on January 1, 2023 and held through June 30, 2023.
Actual Expenses. The first line under each class in the table below provides information about actual account values and actual expenses. You may use the information in this line, together with the amount you invested, to estimate the expenses that you paid over the period. Simply divide your account value by $1,000 (for example, an $8,600 account value divided by $1,000 = 8.6), then multiply the result by the number in the first line under the heading “Expenses Paid During Period 1/1/23 to 6/30/23" to estimate the expenses you paid on your account during this period.
Hypothetical Example for Comparison Purposes. The second line under each class in the table below provides information about hypothetical account values and hypothetical expenses based on the Fund’s actual expense ratio and an assumed rate of return of 5% per year before expenses, which is not the Fund’s actual return. The hypothetical account values and expenses may not be used to estimate the actual ending account balance or expenses you paid for the period. You may use this information to compare the ongoing costs of investing in the Fund and other mutual funds. To do so, compare this 5% hypothetical example with the 5% hypothetical examples that appear in the shareholder reports of the other funds.
Please note that the expenses shown in the table are meant to highlight your ongoing Fund costs only and do not reflect any transactional costs, such as redemption fees. Therefore, the second line under each class in the table below is useful in comparing ongoing costs only and will not help you determine the relative total costs of owning different funds. In addition, if these transactional costs were included, your costs would have been higher.
| X-Square Balanced Fund | Disclosure of Fund Expenses |
| | December 31, 2023 (Unaudited) |
| | | Beginning
Account
Value 7/1/2023 | | Ending Account
Value 12/31/23 | | Expense Ratio | | Expenses Paid
During Period
7/1/23 to
12/31/23(a) |
| Class A: | | | | | | | | | | | | | | | | |
| Actual Fund Return | | $ | 1,000.00 | | | $ | 1,078.00 | | | | 2.75 | % | | $ | 14.40 | |
| Hypothetical Fund Return | | $ | 1,000.00 | | | $ | 1,011.34 | | | | 2.75 | % | | $ | 13.94 | |
| Class C: | | | | | | | | | | | | | | | | |
| Actual Fund Return | | $ | 1,000.00 | | | $ | 1,074.00 | | | | 3.50 | % | | $ | 18.30 | |
| Hypothetical Fund Return | | $ | 1,000.00 | | | $ | 1,007.56 | | | | 3.50 | % | | $ | 17.71 | |
| Institutional Class: | | | | | | | | | | | | | | | | |
| Actual Fund Return | | $ | 1,000.00 | | | $ | 1,079.80 | | | | 2.50 | % | | $ | 13.11 | |
| Hypothetical Fund Return | | $ | 1,000.00 | | | $ | 1,012.60 | | | | 2.50 | % | | $ | 12.68 | |
| (a) | Expenses are equal to the Fund's annualized expense ratio multiplied by the average account values over the period, multiplied by the number of days in the most recent fiscal half year (184), then divided by 365. |
| Annual Report | December 31, 2023 | 9 |
| X-Square Balanced Fund | Schedule of Investments |
| | December 31, 2023 |
| Description | | Shares | | Value |
| COMMON STOCKS (62.78%) | | | | |
| COMMUNICATIONS (3.03%) | | | | |
| Alphabet, Inc., Class C(a) | | | 4,300 | | | $ | 605,999 | |
| Meta Platforms, Inc., Class A(a) | | | 1,494 | | | | 528,816 | |
| Zillow Group, Inc., Class C(a) | | | 2,688 | | | | 155,528 | |
| | | | | | | | 1,290,343 | |
| | | | | | | | | |
| CONSUMER DISCRETIONARY (14.37%) | | | | | | | | |
| Alibaba Group Holding, Ltd., Sponsored ADR | | | 1,650 | | | | 127,892 | |
| Amazon.com, Inc.(a) | | | 2,607 | | | | 396,108 | |
| Chipotle Mexican Grill, Inc.(a) | | | 180 | | | | 411,653 | |
| Copart, Inc. | | | 13,038 | | | | 638,862 | |
| Domino's Pizza, Inc. | | | 167 | | | | 68,842 | |
| Home Depot, Inc. | | | 1,197 | | | | 414,820 | |
| Lennar Corp., Class A | | | 4,185 | | | | 623,732 | |
| MercadoLibre, Inc.(a) | | | 332 | | | | 521,751 | |
| PulteGroup, Inc. | | | 7,635 | | | | 788,085 | |
| RH(a) | | | 1,450 | | | | 422,646 | |
| Skechers USA, Inc., Class A(a) | | | 9,350 | | | | 582,879 | |
| TJX Cos., Inc. | | | 6,691 | | | | 627,683 | |
| Tractor Supply Co. | | | 2,285 | | | | 491,344 | |
| | | | | | | | 6,116,297 | |
| | | | | | | | | |
| CONSUMER STAPLES (5.72%) | | | | | | | | |
| Altria Group, Inc. | | | 7,863 | | | | 317,193 | |
| Costco Wholesale Corp. | | | 1,067 | | | | 704,304 | |
| Dollar General Corp. | | | 2,033 | | | | 276,386 | |
| Philip Morris International, Inc. | | | 4,659 | | | | 438,319 | |
| Walmart, Inc. | | | 4,400 | | | | 693,660 | |
| | | | | | | | 2,429,862 | |
| | | | | | | | | |
| ENERGY (6.73%) | | | | | | | | |
| Chesapeake Energy Corp. | | | 4,824 | | | | 371,159 | |
| Diamondback Energy, Inc. | | | 5,452 | | | | 845,496 | |
| EOG Resources, Inc. | | | 2,930 | | | | 354,384 | |
| New Fortress Energy, Inc. | | | 9,300 | | | | 350,889 | |
| Suncor Energy, Inc. | | | 29,339 | | | | 940,021 | |
| | | | | | | | 2,861,949 | |
| See Notes to Financial Statements. | |
| 10 | www.xsquarecapital.com |
| X-Square Balanced Fund | Schedule of Investments |
| | December 31, 2023 |
| Description | | Shares | | Value |
| FINANCIALS (7.34%) | | | | |
| Ally Financial, Inc. | | | 10,226 | | | $ | 357,092 | |
| Berkshire Hathaway, Inc., Class B(a) | | | 1,626 | | | | 579,929 | |
| Chubb, Ltd. | | | 2,330 | | | | 526,580 | |
| Intercontinental Exchange, Inc. | | | 963 | | | | 123,678 | |
| JPMorgan Chase & Co. | | | 3,131 | | | | 532,583 | |
| Marsh & McLennan Cos., Inc. | | | 2,785 | | | | 527,674 | |
| OFG Bancorp | | | 3,525 | | | | 132,117 | |
| Popular, Inc. | | | 1,151 | | | | 94,463 | |
| Truist Financial Corp. | | | 6,725 | | | | 248,287 | |
| | | | | | | | 3,122,403 | |
| | | | | | | | | |
| HEALTH CARE (3.95%) | | | | | | | | |
| AbbVie, Inc. | | | 1,340 | | | | 207,660 | |
| Amgen, Inc. | | | 1,767 | | | | 508,931 | |
| Bausch Health Cos., Inc. | | | 11,163 | | | | 89,527 | |
| Johnson & Johnson | | | 2,589 | | | | 405,800 | |
| Teva Pharmaceutical Industries, Ltd., Sponsored ADR(a) | | | 44,770 | | | | 467,399 | |
| | | | | | | | 1,679,317 | |
| | | | | | | | | |
| INDUSTRIALS (8.04%) | | | | | | | | |
| Fastenal Co. | | | 7,118 | | | | 461,033 | |
| Generac Holdings, Inc.(a) | | | 2,305 | | | | 297,898 | |
| General Dynamics Corp. | | | 2,338 | | | | 607,109 | |
| Lockheed Martin Corp. | | | 1,097 | | | | 497,204 | |
| RXO, Inc.(a) | | | 4,132 | | | | 96,110 | |
| Southwest Airlines Co. | | | 9,820 | | | | 283,602 | |
| United Rentals, Inc. | | | 1,289 | | | | 739,139 | |
| XPO, Inc.(a) | | | 5,034 | | | | 440,928 | |
| | | | | | | | 3,423,023 | |
| | | | | | | | | |
| MATERIALS (3.61%) | | | | | | | | |
| Freeport-McMoRan, Inc. | | | 7,145 | | | | 304,163 | |
| Glencore PLC, ADR | | | 48,494 | | | | 580,957 | |
| Rio Tinto PLC, ADR | | | 3,425 | | | | 255,026 | |
| Tecnoglass, Inc. | | | 3,574 | | | | 163,368 | |
| Vale SA, ADR | | | 14,665 | | | | 232,587 | |
| | | | | | | | 1,536,101 | |
| See Notes to Financial Statements. | |
| Annual Report | December 31, 2023 | 11 |
| X-Square Balanced Fund | Schedule of Investments |
| | December 31, 2023 |
| Description | | Shares | | Value |
| TECHNOLOGY (9.99%) | | | | |
| Advanced Micro Devices, Inc.(a) | | | 5,043 | | | $ | 743,388 | |
| Akamai Technologies, Inc.(a) | | | 2,305 | | | | 272,796 | |
| Apple, Inc. | | | 2,527 | | | | 486,524 | |
| Booz Allen Hamilton Holding Corp. | | | 1,251 | | | | 160,015 | |
| Fortinet, Inc.(a) | | | 5,176 | | | | 302,951 | |
| Garmin, Ltd. | | | 3,412 | | | | 438,578 | |
| MarketAxess Holdings, Inc. | | | 820 | | | | 240,137 | |
| Mastercard, Inc., Class A | | | 980 | | | | 417,980 | |
| Micron Technology, Inc. | | | 6,285 | | | | 536,362 | |
| N-able, Inc.(a) | | | 5,242 | | | | 69,457 | |
| PayPal Holdings, Inc.(a) | | | 2,282 | | | | 140,138 | |
| Shopify, Inc., Class A(a) | | | 3,827 | | | | 298,123 | |
| SolarWinds Corp.(a) | | | 11,606 | | | | 144,959 | |
| | | | | | | | 4,251,408 | |
| | | | | | | | | |
| TOTAL COMMON STOCKS (Cost $22,378,520) | | | | | | | 26,710,703 | |
| | | Principal | | |
| | | Amount | | Value |
| MORTGAGE-BACKED SECURITIES (16.80%) | | | | | | | | |
| | | | | | | | | |
| Residential (16.80%) | | | | | | | | |
| Ginnie Mae II Pool, Series | | | | | | | | |
| MA7533 - 2021 | | | | | | | | |
| 08/20/51, 2.00% | | $ | 5,377,029 | | | $ | 4,553,352 | |
| Ginnie Mae II Pool, Series | | | | | | | | |
| MA7704 - 2021 | | | | | | | | |
| 11/20/51, 2.00% | | | 3,069,445 | | | | 2,596,846 | |
| | | | | | | | | |
| TOTAL MORTGAGE-BACKED SECURITIES (Cost $7,091,975) | | | | | | | 7,150,198 | |
| GOVERNMENT BONDS (16.00%) | | | | |
| U.S. Treasury Bond | | | | |
| 08/15/32, 2.75% | | | 1,650,000 | | | | 1,511,039 | |
| U.S. Treasury Notes | | | | | | | | |
| 10/15/24, 0.63% | | | 1,590,000 | | | | 1,537,828 | |
| 01/31/25, 1.38% | | | 126,500 | | | | 122,048 | |
| 10/31/26, 1.63% | | | 45,600 | | | | 42,691 | |
| 03/31/24, 2.25% | | | 3,620,000 | | | | 3,592,992 | |
| See Notes to Financial Statements. | |
| 12 | www.xsquarecapital.com |
| X-Square Balanced Fund | Schedule of Investments |
| | December 31, 2023 |
| | | Principal | | |
| | | Amount | | Value |
| GOVERNMENT BONDS (continued) | | | | | | | | |
| | | | | | | | 5,295,559 | |
| | | | | | | | | |
| TOTAL GOVERNMENT BONDS (Cost $6,882,683) | | | | | | | 6,806,598 | |
| | | | | | | | | |
| SHORT-TERM INVESTMENTS (3.86%) | | | | | | | | |
| U.S. Treasury Bills | | | | | | | | |
| 03/21/24, 4.68% | | $ | 200,000 | | | $ | 197,721 | |
| 02/08/24, 5.18% | | | 1,455,000 | | | | 1,447,120 | |
| | | | | | | | 1,644,841 | |
| | | | | | | | | |
| TOTAL SHORT-TERM INVESTMENTS (Cost $1,636,296) | | | | | | | 1,644,841 | |
| | | | | | | | | |
| TOTAL INVESTMENTS (99.44%) (Cost $37,989,474) | | | | | | | 42,312,340 | |
| Other Assets In Excess Of Liabilities (0.56%) | | | | | | | 237,996 | |
| NET ASSETS (100.00%) | | | | | | $ | 42,550,336 | |
| (a) | Non-income producing security. |
| See Notes to Financial Statements. | |
| Annual Report | December 31, 2023 | 13 |
| X-Square Balanced Fund | Statement of Assets and Liabilities |
| | December 31, 2023 |
| ASSETS: | | |
| Investments, at fair value (Cost $37,989,474) | | $ | 42,312,340 | |
| Cash | | | 212,680 | |
| Dividend and interest receivable | | | 96,493 | |
| Tax reclaim receivable | | | 1,114 | |
| Capital shares sold receivable | | | 78,103 | |
| Prepaid expenses and other assets | | | 16,992 | |
| Total Assets | | | 42,717,722 | |
| | | | | |
| LIABILITIES: | | | | |
| Accrued chief compliance officer fees payable | | | 3,010 | |
| Payable due to advisor | | | 82,335 | |
| Accrued distribution fees payable | | | 11,320 | |
| Accrued professional fees payable | | | 36,529 | |
| Accrued trustees' fees payable | | | 901 | |
| Other payables and accrued expenses | | | 33,291 | |
| Total Liabilities | | | 167,386 | |
| Net Assets | | $ | 42,550,336 | |
| | | | | |
| COMPOSITION OF NET ASSETS ATTRIBUTABLE TO SHARES: | | | | |
| Paid-in capital | | $ | 38,621,841 | |
| Total distributable earnings/(deficit) | | | 3,928,495 | |
| Net Assets | | $ | 42,550,336 | |
| See Notes to Financial Statements. | |
| 14 | www.xsquarecapital.com |
| X-Square Balanced Fund | Statement of Assets and Liabilities |
| | December 31, 2023 |
| NET ASSET VALUE | | |
| Class A: | | | | |
| Net assets | | $ | 35,923,878 | |
| Shares outstanding (unlimited shares authorized, no par value) | | | 2,912,534 | |
| Net Asset Value per Share | | $ | 12.33 | |
| Maximum offering price per share (NAV/0.945, based on maximum sales charge of 5.50% of the offering price) | | $ | 13.05 | |
| Class C: | | | | |
| Net assets | | $ | 4,777,510 | |
| Shares outstanding (unlimited shares authorized, no par value) | | | 400,200 | |
| Net Asset Value per Share | | $ | 11.94 | |
| Institutional Class: | | | | |
| Net assets | | $ | 1,848,948 | |
| Shares outstanding (unlimited shares authorized, no par value) | | | 148,239 | |
| Net Asset Value per Share | | $ | 12.47 | |
| See Notes to Financial Statements. | |
| Annual Report | December 31, 2023 | 15 |
| X-Square Balanced Fund | Statement of Operations |
| | For the Year Ended December 31, 2023 |
| INVESTMENT INCOME: | | |
| Dividends (net of foreign withholding tax $12,289) | | $ | 506,338 | |
| Interest | | | 383,564 | |
| Total Investment Income | | | 889,902 | |
| | | | | |
| EXPENSES: | | | | |
| Investment advisory fee (see Note 4) | | | 372,690 | |
| Fund accounting, administration and compliance fees | | | 215,062 | |
| Distribution fees | | | | |
| Class A | | | 78,376 | |
| Class C | | | 43,449 | |
| Professional fees | | | 89,649 | |
| Trustees' fees and expenses | | | 36,001 | |
| Transfer agent fees | | | 55,722 | |
| Recoupment of previously waived fees | | | | |
| Class A | | | 116,113 | |
| Class C | | | 15,947 | |
| Institutional Class | | | 5,763 | |
| Other expenses | | | 43,024 | |
| Total Expenses | | | 1,071,796 | |
| Less fees reimbursed by Adviser (See Note 4) | | | | |
| Class A | | | (13,945 | ) |
| Class C | | | (2,024 | ) |
| Institutional Class | | | (671 | ) |
| Net Expenses | | | 1,055,156 | |
| Net Investment Loss | | | (165,254 | ) |
| | | | | |
| REALIZED AND UNREALIZED GAIN/(LOSS) ON INVESTMENTS: | | |
| Net realized gain/(loss) on: | | |
| Investment securities | | | (173,504 | ) |
| Foreign currency transactions | | | 302 | |
| Net realized loss: | | | (173,202 | ) |
| Change in unrealized appreciation/(depreciation) on: | | | | |
| Investment securities | | | 5,635,073 | |
| Foreign currency transactions | | | 7 | |
| Net change in unrealized appreciation/ (depreciation) | | | 5,635,080 | |
| Net Realized and Unrealized Gain on Investments | | | 5,461,878 | |
| Net Increase in Net Assets Resulting from Operations | | $ | 5,296,624 | |
| See Notes to Financial Statements. | |
| 16 | www.xsquarecapital.com |
| X-Square Balanced Fund | Statements of Changes in Net Assets |
| | | For the | | For the |
| | | Year Ended | | Year Ended |
| | | December 31, 2023 | | December 31, 2022 |
| FROM OPERATIONS: | | | | | | | | |
| Net investment loss | | $ | (165,254 | ) | | $ | (222,649 | ) |
| Net realized gain/(loss) | | | (173,202 | ) | | | 73,216 | |
| Net change in unrealized appreciation/(depreciation) | | | 5,635,080 | | | | (3,725,004 | ) |
| Net Increase/(Decrease) in Net Assets from Operations | | | 5,296,624 | | | | (3,874,437 | ) |
| | | | | | | | | |
| DISTRIBUTIONS TO SHAREHOLDERS: | | | | | | | | |
| From return of capital | | | | | | | | |
| Class A: | | | (649,532 | ) | | | (564,899 | ) |
| Class C: | | | (93,638 | ) | | | (84,245 | ) |
| Institutional Class: | | | (31,980 | ) | | | (30,368 | ) |
| Net Decrease in Net Assets from Distributions to Shareholders | | | (775,150 | ) | | | (679,512 | ) |
| | | | | | | | | |
| CAPITAL SHARE TRANSACTIONS: | | | | | | | | |
| Proceeds from sale of shares | | | | | | | | |
| Class A: | | | 5,594,255 | | | | 8,489,218 | |
| Class C: | | | 334,500 | | | | 713,670 | |
| Institutional Class: | | | 383,800 | | | | 58,414 | |
| Reinvestment of distributions | | | | | | | | |
| Class A: | | | 413,261 | | | | 336,473 | |
| Class C: | | | 41,727 | | | | 41,365 | |
| Institutional Class: | | | 24,922 | | | | 24,451 | |
| Cost of shares redeemed | | | | | | | | |
| Class A: | | | (2,941,433 | ) | | | (2,297,828 | ) |
| Class C: | | | (286,672 | ) | | | (314,326 | ) |
| Institutional Class: | | | (170,056 | ) | | | (61,093 | ) |
| Redemption fees | | | | | | | | |
| Class A: | | | – | | | | 769 | |
| Institutional Class: | | | 620 | | | | – | |
| Net Increase from Capital Share Transactions | | | 3,394,924 | | | | 6,991,113 | |
| Net Increase in Net Assets | | $ | 7,916,398 | | | $ | 2,437,164 | |
| | | | | | | | | |
| NET ASSETS: | | | | | | | | |
| Beginning of period | | | 34,633,938 | | | | 32,196,774 | |
| See Notes to Financial Statements. | |
| Annual Report | December 31, 2023 | 17 |
| X-Square Balanced Fund | Statements of Changes in Net Assets |
| | | For the | | For the |
| | | Year Ended | | Year Ended |
| | | December 31, 2023 | | December 31, 2022 |
| End of period | | $ | 42,550,336 | | | $ | 34,633,938 | |
| | | | | | | | | |
| OTHER INFORMATION: | | | | | | | | |
| Capital Share Transactions: | | | | | | | | |
| Class A: | | | | | | | | |
| Beginning shares | | | 2,645,402 | | | | 2,090,027 | |
| Shares sold | | | 487,050 | | | | 723,685 | |
| Shares issued as reinvestment of dividends | | | 36,406 | | | | 29,780 | |
| Shares redeemed | | | (256,324 | ) | | | (198,090 | ) |
| Ending Shares | | | 2,912,534 | | | | 2,645,402 | |
| Class C: | | | | | | | | |
| Beginning shares | | | 392,989 | | | | 351,564 | |
| Shares sold | | | 29,552 | | | | 64,031 | |
| Shares issued as reinvestment of dividends | | | 3,779 | | | | 3,716 | |
| Shares redeemed | | | (26,120 | ) | | | (26,322 | ) |
| Ending Shares | | | 400,200 | | | | 392,989 | |
| Institutional Class: | | | | | | | | |
| Beginning shares | | | 127,916 | | | | 125,856 | |
| Shares sold | | | 32,966 | | | | 5,228 | |
| Shares issued as reinvestment of dividends | | | 2,176 | | | | 2,127 | |
| Shares redeemed | | | (14,819 | ) | | | (5,295 | ) |
| Ending Shares | | | 148,239 | | | | 127,916 | |
| See Notes to Financial Statements. | |
| 18 | www.xsquarecapital.com |
Intentionally Left Blank
| X-Square Balanced Fund – Class A | Financial Highlights |
| For a Share Outstanding Throughout the Periods Presented |
| | For the
Year Ended
December
31, 2023 | | | For the
Year Ended
December
31, 2022 | | | For the
Year Ended
December
31, 2021 | | | For the
Year Ended
December
31, 2020 | | | For the Period
November 4,
2019
(Commencement
of Operations) to
December 31,
2019 | |
| PER SHARE OPERATING PERFORMANCE: | | | | | | | | | | | | | | | |
| Net asset value - beginning of period | | $ | 10.97 | | | $ | 12.57 | | | $ | 11.61 | | | $ | 10.37 | | | $ | 10.00 | |
| INCOME/(LOSS) FROM INVESTMENT OPERATIONS: | | | | | | | | | | | | | | | | | | | | |
| Net investment loss(a) | | | (0.04 | ) | | | (0.07 | ) | | | (0.20 | ) | | | (0.14 | ) | | | (0.00 | )(b)(c) |
| Net realized and unrealized gain/(loss) on investments | | | 1.64 | | | | (1.29 | ) | | | 1.28 | | | | 1.38 | | | | 0.37 | |
| Net increase/(decrease) in Net Asset Value | | | 1.60 | | | | (1.36 | ) | | | 1.08 | | | | 1.24 | | | | 0.37 | |
| | | | | | | | | | | | | | | | | | | | | |
| DISTRIBUTIONS TO COMMON SHAREHOLDERS: | | | | | | | | | | | | | | | | | | | | |
| From net investment income | | | – | | | | – | | | | (0.12 | ) | | | – | | | | – | |
| From return of capital | | | (0.24 | ) | | | (0.24 | ) | | | – | | | | – | | | | – | |
| Total Distributions to Common Shareholders | | | (0.24 | ) | | | (0.24 | ) | | | (0.12 | ) | | | – | | | | – | |
| | | | | | | | | | | | | | | | | | | | | |
| Net asset value per share - end of period | | $ | 12.33 | | | $ | 10.97 | | | $ | 12.57 | | | $ | 11.61 | | | $ | 10.37 | |
| | | | | | | | | | | | | | | | | | | | | |
| Total Investment Return - Net Asset Value(d) | | | 14.79 | % | | | (10.88 | %) | | | 9.31 | % | | | 11.96 | % | | | 3.70 | % |
| | | | | | | | | | | | | | | | | | | | | |
| RATIOS AND SUPPLEMENTAL DATA: | | | | | | | | | | | | | | | | | | | | |
| Net assets attributable to shares, end of period (000s) | | $ | 35,924 | | | $ | 29,014 | | | $ | 26,262 | | | $ | 8,756 | | | $ | 779 | |
| Ratio of actual expenses to average net assets including fee waivers and reimbursements | | | 2.75 | % | | | 2.75 | % | | | 2.75 | % | | | 2.75 | % | | | 2.75 | %(e) |
| See Notes to Financial Statements. | |
| 20 | www.xsquarecapital.com |
| X-Square Balanced Fund – Class A | Financial Highlights |
| For a Share Outstanding Throughout the Periods Presented |
| | For the
Year Ended
December
31, 2023 | | | For the
Year Ended
December
31, 2022 | | | For the
Year Ended
December
31, 2021 | | | For the
Year Ended
December
31, 2020 | | | For the Period
November 4,
2019
(Commencement
of Operations) to
December
31, 2019 | |
| Ratio of actual expenses to average net assets excluding fee waivers and reimbursements | | | 2.80 | % | | | 3.28 | % | | | 3.50 | % | | | 13.07 | % | | | 115.61 | %(e) |
| Ratio of net investment loss to average net assets | | | (0.37 | %) | | | (0.59 | %) | | | (1.59 | %) | | | (1.26 | %) | | | (0.19 | %) |
| Portfolio turnover rate | | | 30.18 | % | | | 51.37 | % | | | 18.40 | % | | | 20.14 | % | | | 0.00 | % |
| (a) | Calculated using average shares outstanding. |
| (b) | Less than $0.005 per share. |
| (d) | Total investment return is calculated assuming a purchase of shares at the opening on the first day and a sale at closing on the last day of the period reported. Dividends and distributions are assumed for purposes of this calculation to be reinvested at prices obtained under the Fund's dividend reinvestment plan. Total investment returns do not reflect brokerage commissions, if any, and are not annualized. |
| (e) | These ratios to average net assets have been annualized except the non-recurring offering costs, which have not been annualized. |
| See Notes to Financial Statements. | |
| Annual Report | December 31, 2023 | 21 |
| X-Square Balanced Fund – Class C | Financial Highlights |
| For a Share Outstanding Throughout the Periods Presented |
| | | For the
Year Ended
December
31, 2023 | | | For the
Year Ended
December
31, 2022 | | | For the
Year Ended
December
31, 2021 | | | For the
Year Ended
December
31, 2020 | | | For the Period
November 4,
2019
(Commencement
of Operations) to
December 31,2019 | |
| PER SHARE OPERATING PERFORMANCE: | | | | | | | | | | | | | | | |
| Net asset value - beginning of period | | $ | 10.70 | | | $ | 12.36 | | | $ | 11.50 | | | $ | 10.35 | | | $ | 10.00 | |
| INCOME/(LOSS) FROM INVESTMENT OPERATIONS: | | | | | | | | | | | | | | | | | | | | |
| Net investment loss(a) | | | (0.12 | ) | | | (0.15 | ) | | | (0.29 | ) | | | (0.21 | ) | | | (0.02 | )(b) |
| Net realized and unrealized gain/(loss) on investments | | | 1.60 | | | | (1.27 | ) | | | 1.27 | | | | 1.36 | | | | 0.37 | |
| Net increase/(decrease) in Net Asset Value | | | 1.48 | | | | (1.42 | ) | | | 0.98 | | | | 1.15 | | | | 0.35 | |
| | | | | | | | | | | | | | | | | | | | | |
| DISTRIBUTIONS TO COMMON SHAREHOLDERS: | | | | | | | | | | | | | | | | | | | | |
| From net investment income | | | – | | | | – | | | | (0.12 | ) | | | – | | | | – | |
| From return of capital | | | (0.24 | ) | | | (0.24 | ) | | | – | | | | – | | | | – | |
| Total Distributions to Common Shareholders | | | (0.24 | ) | | | (0.24 | ) | | | (0.12 | ) | | | – | | | | – | |
| | | | | | | | | | | | | | | | | | | | | |
| Net asset value per share - end of period | | $ | 11.94 | | | $ | 10.70 | | | $ | 12.36 | | | $ | 11.50 | | | $ | 10.35 | |
| | | | | | | | | | | | | | | | | | | | | |
| Total Investment Return - Net Asset Value(c) | | | 14.03 | % | | | (11.56 | %) | | | 8.53 | % | | | 11.11 | % | | | 3.50 | % |
| | | | | | | | | | | | | | | | | | | | | |
| RATIOS AND SUPPLEMENTAL DATA: | | | | | | | | | | | | | | | | | | | | |
| Net assets attributable to shares, end of period (000s) | | $ | 4,778 | | | $ | 4,205 | | | $ | 4,345 | | | $ | 1,431 | | | $ | 113 | |
| Ratio of actual expenses to average net assets including fee waivers and reimbursements | | | 3.50 | % | | | 3.50 | % | | | 3.50 | % | | | 3.50 | % | | | 3.50 | %(d) |
| See Notes to Financial Statements. | |
| 22 | www.xsquarecapital.com |
| X-Square Balanced Fund – Class C | Financial Highlights |
| For a Share Outstanding Throughout the Periods Presented |
| | | For the
Year Ended
December
31, 2023 | | | For the
Year Ended
December
31, 2022 | | | For the
Year Ended
December
31, 2021 | | | For the
Year Ended
December
31, 2020 | | | For the Period
November 4,
2019
(Commencement
of Operations) to
December 31,
2019 | |
| Ratio of actual expenses to average net assets excluding fee waivers and reimbursements | | | 3.55 | % | | | 4.02 | % | | | 4.23 | % | | | 14.81 | % | | | 161.50 | %(d) |
| Ratio of net investment loss to average net assets | | | (1.12 | %) | | | (1.35 | %) | | | (2.34 | %) | | | (1.95 | %) | | | (0.99 | %) |
| Portfolio turnover rate | | | 30.18 | % | | | 51.37 | % | | | 18.40 | % | | | 20.14 | % | | | 0.00 | % |
| (a) | Calculated using average shares outstanding. |
| (c) | Total investment return is calculated assuming a purchase of shares at the opening on the first day and a sale at closing on the last day of the period reported. Dividends and distributions are assumed for purposes of this calculation to be reinvested at prices obtained under the Fund's dividend reinvestment plan. Total investment returns do not reflect brokerage commissions, if any, and are not annualized. |
| (d) | These ratios to average net assets have been annualized except the non-recurring offering costs, which have not been annualized. |
| See Notes to Financial Statements. | |
| Annual Report | December 31, 2023 | 23 |
| X-Square Balanced Fund – Institutional Class | Financial Highlights |
| For a Share Outstanding Throughout the Periods Presented |
| | | For the
Year Ended
December
31, 2023 | | | For the
Year Ended
December
31, 2022 | | | For the
Year Ended
December
31, 2021 | | | For the
Year Ended
December
31, 2020 | | | For the Period
November 4,
2019
(Commencement
of Operations) to
December 31,
2019 | |
| PER SHARE OPERATING PERFORMANCE: | | | | | | | | | | | | | | | |
| Net asset value - beginning of period | | $ | 11.06 | | | $ | 12.63 | | | $ | 11.65 | | | $ | 10.37 | | | $ | 10.00 | |
| INCOME/(LOSS) FROM INVESTMENT OPERATIONS: | | | | | | | | | | | | | | | | | | | | |
| Net investment loss(a) | | | (0.01 | ) | | | (0.04 | ) | | | (0.17 | ) | | | (0.11 | ) | | | (0.00 | )(b)(c) |
| Net realized and unrealized gain/(loss) on investments | | | 1.66 | | | | (1.29 | ) | | | 1.27 | | | | 1.39 | | | | 0.37 | |
| Net increase/(decrease) in Net Asset Value | | | 1.65 | | | | (1.33 | ) | | | 1.10 | | | | 1.28 | | | | 0.37 | |
| | | | | | | | | | | | | | | | | | | | | |
| DISTRIBUTIONS TO COMMON SHAREHOLDERS: | | | | | | | | | | | | | | | | | | | | |
| From net investment income | | | – | | | | – | | | | (0.12 | ) | | | – | | | | – | |
| From return of capital | | | (0.24 | ) | | | (0.24 | ) | | | – | | | | – | | | | – | |
| Total Distributions to Common Shareholders | | | (0.24 | ) | | | (0.24 | ) | | | (0.12 | ) | | | – | | | | – | |
| | | | | | | | | | | | | | | | | | | | | |
| Net asset value per share - end of period | | $ | 12.47 | | | $ | 11.06 | | | $ | 12.63 | | | $ | 11.65 | | | $ | 10.37 | |
| | | | | | | | | | | | | | | | | | | | | |
| Total Investment Return - Net Asset Value(d) | | | 15.13 | % | | | (10.59 | %) | | | 9.45 | % | | | 12.34 | % | | | 3.70 | % |
| | | | | | | | | | | | | | | | | | | | | |
| RATIOS AND SUPPLEMENTAL DATA: | | | | | | | | | | | | | | | | | | | | |
| Net assets attributable to shares, end of period (000s) | | $ | 1,849 | | | $ | 1,414 | | | $ | 1,590 | | | $ | 1,035 | | | $ | 41 | |
| Ratio of actual expenses to average net assets including fee waivers and reimbursements | | | 2.50 | % | | | 2.50 | % | | | 2.50 | % | | | 2.50 | % | | | 2.50 | %(e) |
| See Notes to Financial Statements. | |
| 24 | www.xsquarecapital.com |
| X-Square Balanced Fund – Institutional Class | Financial Highlights |
| For a Share Outstanding Throughout the Periods Presented |
| | | For the
Year Ended
December
31, 2023 | | | For the
Year Ended
December
31, 2022 | | | For the
Year Ended
December
31, 2021 | | | For the
Year Ended December
31, 2020 | | | For the Period November 4,
2019
(Commencement
of Operations) to
December 31,
2019 | |
| Ratio of actual expenses to average net assets excluding fee waivers and reimbursements | | | 2.55 | % | | | 3.01 | % | | | 3.37 | % | | | 12.00 | % | | | 239.72 | %(e) |
| Ratio of net investment loss to average net assets | | | (0.12 | %) | | | (0.36 | %) | | | (1.37 | %) | | | (1.00 | %) | | | (0.21 | %) |
| Portfolio turnover rate | | | 30.18 | % | | | 51.37 | % | | | 18.40 | % | | | 20.14 | % | | | 0.00 | % |
| (a) | Calculated using average shares outstanding. |
| (b) | Less than $0.005 per share. |
| (d) | Total investment return is calculated assuming a purchase of shares at the opening on the first day and a sale at closing on the last day of the period reported. Dividends and distributions are assumed for purposes of this calculation to be reinvested at prices obtained under the Fund's dividend reinvestment plan. Total investment returns do not reflect brokerage commissions, if any, and are not annualized. |
| (e) | These ratios to average net assets have been annualized except the non-recurring offering costs, which have not been annualized. |
| See Notes to Financial Statements. | |
| Annual Report | December 31, 2023 | 25 |
| X-Square Balanced Fund | Notes to Financial Statements |
| | December 31, 2023 |
NOTE 1 — ORGANIZATION AND REGISTRATION
X-Square Balanced Fund, LLC (the "Fund") is an open-end investment company registered under the Investment Company Act of 1940, as amended (the “1940 Act”). The Fund is a non-diversified investment company with an investment objective which seeks conservation of capital, current income and long-term growth of capital and income. The Fund currently offers Class A, Class C and Institutional Class Shares. Each share class of the Fund represents an investment in the same portfolio of securities, but each share class has its own expense structures. The Fund’s Investment Adviser is X-Square Capital, LLC (the “Adviser”). The Fund is a related party to the Adviser.
Subject to certain exceptions, investments in Class C shares are subject to a 1.00% contingent deferred sales charge if shares are sold within 12 months of purchase. The contingent deferred sales charge is expected to be calculated based on the lesser of the offering price and market value of shares being sold.
NOTE 2 — SIGNIFICANT ACCOUNTING POLICIES
The following is a summary of significant accounting policies consistently followed by the Fund in the preparation of its financial statements. The financial statements are prepared in United States Dollars and in conformity with accounting principles generally accepted in the United States of America (“GAAP”), which requires management to make certain estimates and assumptions that affect the reported amounts of assets and liabilities, disclosure of contingent assets and liabilities at the date of the financial statements, and the reported amounts of income and expenses during the reporting period. Actual results may differ from these estimates. The Fund is considered an investment company under GAAP and follows the accounting and reporting guidance applicable to investment companies in the Financial Accounting Standards Board Accounting Standards Codification Topic 946. The financial statements have been prepared as of the close of the New York Stock Exchange (“NYSE”) as of the fiscal year end of the Fund.
Portfolio Valuation: The net asset value (“NAV”) per common share of the Fund is determined daily, on each day that there is a regular trading session on the NYSE as of the close of regular trading. The Fund’s NAV per common share is calculated by dividing the value of the Fund’s total assets, less its liabilities, by the number of shares outstanding and rounding the result to the nearest full cent.
The Fund generally values its securities based on market prices determined at the close of regular trading on the NYSE (normally, 4 p.m. Eastern time) on each business day (Monday through Friday). The Fund will not value its securities on any day that the NYSE is closed, including the following observed holidays: New Year’s Day, Martin Luther King, Jr. Day, Washington’s Birthday, Good Friday, Memorial Day, Independence Day, Labor Day, Thanksgiving Day and Christmas Day. The Fund’s currency valuations are done as of the close of regular trading on the NYSE (normally, 4 p.m. Eastern time).
For equity securities that are traded on an exchange, the market price is usually the closing sale or official closing price on that exchange, provided such price is not deemed stale, and that it represents fair value. In the case of securities not traded on an exchange, or if such closing prices are not otherwise available, the market price is typically determined by independent third party pricing vendors approved by the Fund’s Board of Managers (“the Board”) using a variety of pricing techniques and methodologies.
| X-Square Balanced Fund | Notes to Financial Statements |
| | December 31, 2023 |
The market price for debt obligations (including short-term debt obligations with remaining maturities of 60 days or less) is generally the price supplied by an independent third-party pricing service approved by the Board, which may use a matrix, formula or other objective method that takes into consideration market indices, yield curves and other specific adjustments. In certain circumstances, bid and ask prices may be obtained from: (i) a broker/ dealer specified and deemed reliable by the Adviser, (ii) pink sheets, yellow sheets or the blue list, or (iii) a pricing agent that obtains quotations from broker/dealers or evaluates the value of the respective bid and ask prices. If vendors are unable to supply a price, or if the price supplied is deemed to be unreliable, the market price may be determined using quotations received from one or more brokers/dealers that make a market in the security.
When such prices or quotations are not available, or when the Adviser believes that they are unreliable, securities may be priced using fair value procedures approved by the Board. The Fund may also use fair value procedures if the Adviser determines that a significant event has occurred between the time at which a market price is determined and the time at which the Fund NAV is calculated. In particular, the value of foreign securities may be materially affected by events occurring after the close of the market on which they are traded, but before the Fund prices its shares.
The Fund may determine the fair value of investments based on information provided by pricing services and other third-party vendors, which may recommend fair value prices or adjustments with reference to other securities, indices or assets. In considering whether fair value pricing is required and in determining fair values, the Fund may, among other things, consider significant events (which may be considered to include changes in the value of U.S. securities or securities indices) that occur after the close of the relevant market and before the Fund values its securities. In addition, the Fund may utilize modeling tools provided by third-party vendors to determine fair values of foreign securities.
Valuing securities at fair value involves greater reliance on judgment than valuation of securities based on readily available market quotations. A fund that uses fair value to price securities may value those securities higher or lower than another fund using market quotations or its own fair value methodologies to price the same securities. There can be no assurance that the Fund could obtain the fair value assigned to a security if it were to sell the security at approximately the time at which the Fund determines its NAV.
The information above is not intended to reflect an exhaustive list of the methodologies that may be used to value portfolio investments. The Fund’s valuation procedures permit the use of a variety of valuation methodologies in connection with valuing portfolio investments. The methodology used for a specific type of investment may vary based on the market data available or other considerations. The methodologies summarized above may not represent the specific means by which portfolio investments are valued on any particular business day.
Cash and Cash Equivalents: Idle cash may be swept into various overnight demand deposits and is classified as cash and cash equivalents on the Statements of Assets and Liabilities. The Fund maintains cash in bank deposit accounts which, at times, may exceed United States federally insured limits. Amounts swept overnight are available on the next business day.
| Annual Report | December 31, 2023 | 27 |
| X-Square Balanced Fund | Notes to Financial Statements |
| | December 31, 2023 |
Securities Transactions and Investment Income: Investment security transactions are accounted for on a trade date basis. Dividend income is recorded on the ex-dividend date. Realized gains and losses from securities transactions and unrealized appreciation and depreciation of securities are determined using the identified cost basis method for financial reporting purposes. Dividends are recorded net of foreign withholding taxes. Interest income is recorded on an accrual basis.
Expenses: Some expenses of the Fund can be directly attributed to a Fund specific share class. Expenses that cannot be directly attributed are apportioned among all share classes based on average net assets. Expenses are recognized when incurred.
Income Taxes: The Fund is taxed under the dispositions applicable to Registered Investment Companies established by the Puerto Rico Internal Revenue Code of 2011, as amended ("the Code"), its regulations and the administrative pronouncements promulgated thereunder. The Code states that every registered investment company will be exempt from Puerto Rico income tax for a taxable year if it distributes to its stockholders at least 90% of its taxable net investment income for such taxable year. The Fund intends to meet the 90% distribution requirement on a yearly basis to maintain the income tax exemption.
For U.S. federal income taxes, the Fund will be treated as a foreign corporation not engaged in a trade or business in the United States for purposes of the U.S. Internal Revenue Code of 1986, as amended (the “U.S. Code”) and does not intend to derive income treated as effectively connected with a trade or business in the United States. As a foreign corporation not engaged in a trade or business in the United States, the Fund will only be subject to United States federal income taxes if it realizes certain items of U.S. source income of a fixed or determinable annual or periodic nature, in which case the Fund will be subject to withholding of United States federal income tax at a 30% gross rate on such U.S. source income (not including interest received by the Fund on certain registered obligations).
Temporary differences between book-basis and tax-basis components of total distributable earnings arise when certain items, of income gain, or loss are recognized in different periods for financial statement and tax purposes; these differences will reverse at some time in the future. As of period end, the tax-basis component of total distributable earnings are detailed as follows:
| Undistributed ordinary loss: | ($520,961) |
| Undistributed capital gains: | $126,606 |
| Unrealized appreciation: | $4,322,866 |
The Puerto Rico income tax basis of the Fund's investments at December 31, 2023, was $37,989,474, and net unrealized appreciation for income tax purposes was $4,322,866 (gross unrealized appreciation $5,761,732; gross unrealized depreciation $1,438,866).
The Fund recognizes the tax benefits of uncertain tax positions only when the position is more likely than not to be sustained, assuming examination by tax authorities. Management has analyzed the Fund's tax positions and concluded that no liability for unrecognized tax benefits should be recorded related to uncertain tax positions expected to be taken in the Fund's 2023 tax returns. The Fund identifies its major tax jurisdictions as Commonwealth of Puerto Rico; however, the Fund is not aware of any tax positions for which it is reasonably possible that the total amounts of unrecognized tax benefits will change materially in the next 12 months. The Fund remains subject to income tax examinations for its PR income taxes generally for the years 2019 through 2024.
| X-Square Balanced Fund | Notes to Financial Statements |
| | December 31, 2023 |
The Fund distributed to shareholders $775,150 as a return of capital for the year ended December 31, 2023.
Indemnification: The Fund indemnifies its officers and managers for certain liabilities that may arise from the performance of their duties to the Fund. Additionally, in the normal course of business, the Fund enters into contracts that contain a variety of representations and warranties that provide general indemnities. The Fund’s maximum exposure under these arrangements is unknown, as this would involve future claims that may be made against the Fund that have not yet occurred. However, the Fund expects the risk of loss due to these warranties and indemnities to be remote.
NOTE 3 — FAIR VALUE MEASUREMENTS
The Fund discloses the classification of its fair value measurements following a three-tier hierarchy based on the inputs used to measure fair value. Inputs refer broadly to the assumptions that market participants would use in pricing the asset or liability, including assumptions about risk. Inputs may be observable or unobservable. Observable inputs reflect the assumptions market participants would use in pricing the asset or liability that are developed based on market data obtained from sources independent of the reporting entity. Unobservable inputs reflect the reporting entity’s own assumptions about the assumptions market participants would use in pricing the asset or liability that are developed based on the best information available.
Various inputs are used in determining the value of the Fund’s investments as of the end of the reporting period. When inputs used fall into different levels of the fair value hierarchy, the level in the hierarchy within which the fair value measurement falls is determined based on the lowest level input that is significant to the fair value measurement in its entirety. The designated input levels are not necessarily an indication of the risk or liquidity associated with these investments.
These inputs are categorized in the following hierarchy under applicable financial accounting standards:
| Level 1 – | Unadjusted quoted prices in active markets for identical investments, unrestricted assets or liabilities that the Fund has the ability to access at the measurement date; |
| Level 2 – | Quoted prices which are not active, quoted prices for similar assets or liabilities in active markets or inputs other than quoted prices that are observable (either directly or indirectly) for substantially the full term of the asset or liability; and |
| Level 3 – | Significant unobservable prices or inputs (including the Fund’s own assumptions in determining the fair value of investments) where there is little or no market activity for the asset or liability at the measurement date. |
| Annual Report | December 31, 2023 | 29 |
| X-Square Balanced Fund | Notes to Financial Statements |
| | December 31, 2023 |
The following is a summary of the inputs used to value the Fund’s investments as of December 31, 2023:
| Investments in Securities at Value | | Level 1 | | Level 2 | | Level 3 | | Total |
| Common Stocks(a) | | $ | 26,710,703 | | | $ | – | | | $ | – | | | $ | 26,710,703 | |
| Government Bonds | | | 6,806,598 | | | | – | | | | – | | | | 6,806,598 | |
| Mortgage-Backed Securities | | | – | | | | 7,150,198 | | | | – | | | | 7,150,198 | |
| Short-Term Investments | | | 1,644,841 | | | | – | | | | – | | | | 1,644,841 | |
| Total | | $ | 35,162,142 | | | $ | 7,150,198 | | | $ | – | | | $ | 42,312,340 | |
| (a) | For a detailed sector breakdown, see the accompanying Schedule of Investments. |
There were no Level 3 securities held in the Fund at December 31, 2023. There were no transfers in or out from Level 3 as of and for the year ended December 31, 2023.
NOTE 4 — INVESTMENT ADVISORY AGREEMENT
As compensation for its services, the Fund pays to the Adviser a monthly management fee at an annual rate of 1.00% of its average daily net assets.
The Adviser, a related party to the Fund, pursuant to an Amended and Restated Expense Reimbursement Agreement (the “Agreement”), has contractually agreed to reduce its fees and/or absorb expenses of the Fund, at least until one year from the date of the Fund’s prospectus (through April 30, 2024), to ensure that Net Annual Operating Expenses (excluding taxes, extraordinary expenses, reorganization expenses, brokerage commissions, interest, other expenditures that are not capitalized in accordance with generally accepted accounting principles, and other extraordinary expenses not incurred in the ordinary course of the Fund’s business) will not exceed 2.75%, 3.50% and 2.50% of the Fund’s average daily net assets, respectively for Class A, Class C and Institutional Class Shares, respectively. The Adviser will be permitted to recover, on a class-by-class basis, any fees waived and/or expenses reimbursed pursuant to the Agreement described above to the extent that the Fund expenses in later periods fall below the lesser of (i) the expense limitation in effect at the time the fees and/or expenses to be recovered were waived and/or reimbursed and (ii) the expense limitation in effect at the time the Adviser seeks to recover the fees or expenses. The Adviser will not be entitled to recover any such waived or reimbursed fees and expenses more than three years after the date on which the fees were waived or expenses were reimbursed. This Agreement will renew automatically for periods of one year (each such one year period, a “Renewal Year”). This Agreement may be terminated, as to any succeeding Renewal Year, by either party upon 60 days’ written notice prior to the end of the then current Renewal Year. Notwithstanding the foregoing, this Agreement may be terminated by the Fund’s Board of Managers at any time if it determines that such termination is in the best interest of the Fund and its Members. The Adviser may not terminate this waiver arrangement without the approval of the Fund’s Board of Managers.
| X-Square Balanced Fund | Notes to Financial Statements |
| | December 31, 2023 |
As of December 31, 2023, the following amounts were available for recoupment by the Adviser based upon their potential expiration date:
| | | Expiring in 2024 | | Expiring in 2025 | | Expiring in 2026 |
| Class A | | $ | 135,149 | | | $ | 146,429 | | | $ | 13,945 | |
| Class C | | | 21,133 | | | | 20,782 | | | | 2,024 | |
| Institutional | | | 10,793 | | | | 7,432 | | | | 671 | |
NOTE 5 — OTHER AGREEMENTS
Distribution and Services Agreement
The Fund has adopted a Distribution and Shareholder Servicing Plan pursuant to Rule 12b-1 under the 1940 Act (the “Plan”). Under the Plan, the Fund is authorized to pay distribution fees in connection with the sale and distribution of its shares and pay service fees in connection with the provision of ongoing services to shareholders of each class and the maintenance of shareholder accounts in an amount up to 0.25% of its average daily net assets each year with respect to Class A Shares, 0.00% with respect to Institutional Class shares and 1.00% with respect to Class C shares. The Class C distribution fee includes a distribution fee of up to 0.75% and a service fee of up to 0.25%.
ALPS Distributors, Inc. (the “Distributor”) serves as the Fund’s distributor. The Distributor acts as an agent for the Fund and the distributor of the Fund’s shares.
Administration, Bookkeeping and Pricing Agreement
ALPS Fund Services, Inc. (“ALPS”) serves as the administrator to the Fund. The Fund has agreed to pay expenses incurred in connection with ALPS administrative activities. Pursuant to the Administration, Bookkeeping and Pricing Services Agreement, ALPS will provide operational services to the Fund including, but not limited to fund accounting and fund administration and generally assist in the Fund operations.
Transfer Agency Agreement
ALPS also serves as the Transfer Agent to the Fund. Under the Transfer Agency Agreement, ALPS is responsible for maintaining all shareholder records of the Fund.
NOTE 6 — INVESTMENT TRANSACTIONS
Investment transactions for the year ended December 31, 2023, excluding U.S. Government Obligations and short-term investments, were as follows:
| | | Cost of Investments | | | Proceeds from | |
| | | Purchased | | | Investments Sold | |
| | | $ | 10,718,474 | | | $ | 9,958,964 | |
| Annual Report | December 31, 2023 | 31 |
| X-Square Balanced Fund | Notes to Financial Statements |
| | December 31, 2023 |
Purchases and sales of U.S. Government Obligations for the year ended December 31, 2023 were as follows:
| | | Cost of Investments | | | Proceeds from | |
| | | Purchased | | | Investments Sold | |
| | | $ | 501,875 | | | $ | 4,418,096 | |
NOTE 7 — LINE OF CREDIT
As of December 31, 2023, the Fund had secured a bank line of credit through U.S. Bank, subject to the limitations of the 1940 Act for borrowings. As of the year ended December 31, 2023, the Fund had no outstanding borrowings.
NOTE 8 — RISKS AND UNCERTAINTIES
The ongoing war in Ukraine posses a risk to global stability. Supply chains including crops such as wheat could be further disrupted by the conflict, thus putting incremental pressure on prices. In addition, energy security and markets will continue to experience instability as Ukraine is a major gas corridor and Russia supplies more than 10% of global energy consumption. The net result of this environment is inflation which has a negative impact on margins, consumption and Central Bank reaction function which is to deliver higher rates for longer.
NOTE 9 — SUBSEQUENT EVENTS
The Adviser has evaluated subsequent events through the date of issuance of the financial statements included herein. There have been no subsequent events that occurred during such period that would require disclosure or would be required to be recognized in the financial statements.
| X-Square Balanced Fund | Report of Independent Registered
Public Accounting Firm |
| |
To the Shareholders and Board of Managers of
X-Square Balanced Fund, LLC:
Opinion on the financial statements
We have audited the accompanying statement of assets and liabilities, including the schedule of investments, of X-Square Balanced Fund, LLC (“the Fund”) as of December 31, 2023, the related statement of operations for the year ended December 31, 2023, the statement of changes in net assets for the two years in the period ended December 31, 2023, and the financial highlights for each of the three years in the period ended December 31, 2023, and the related notes (collectively referred to as the “financial statements”). In our opinion, the financial statements present fairly, in all material respects, the financial position of the Fund as of December 31, 2023, the results of its operations for the year then ended, the changes in net assets for each of the two years in the period ended December 31, 2023 and the financial highlights for each of the three years in the period ended December 31, 2023, in conformity with accounting principles generally accepted in the United States of America. The Fund’s financial statements and the financial highlights for the year ended December 31, 2020, and prior were audited by other auditors whose report dated February 24, 2021, expressed an unqualified opinion on those financial statements and financial highlights.
Basis for opinion
These financial statements are the responsibility of the Fund’s management. Our responsibility is to express an opinion on the Fund’s financial statements based on our audits. We are a public accounting firm registered with the Public Company Accounting Oversight Board (United States) (“PCAOB”) and are required to be independent with respect to the Fund in accordance with the U.S. federal securities laws and the applicable rules and regulations of the Securities and Exchange Commission and the PCAOB.
We conducted our audits of these financial statements in accordance with the standards of the PCAOB. Those standards require that we plan and perform the audit to obtain reasonable assurance about whether the financial statements are free of material misstatement, whether due to error or fraud. The Fund is not required to have, nor were we engaged to perform, an audit of its internal control over financial reporting. As part of our audits, we are required to obtain an understanding of internal control over financial reporting but not for the purpose of expressing an opinion on the effectiveness of the Fund’s internal control over financial reporting. Accordingly, we express no such opinion.
Our audits included performing procedures to assess the risks of material misstatement of the financial statements, whether due to error or fraud, and performing procedures that respond to those risks. Such procedures included examining, on a test basis, evidence regarding the amounts and disclosures in the financial statements. Our procedures included confirmation of securities owned as of December 31, 2023, by correspondence with the custodian. Our audit also included evaluating the accounting principles used and significant estimates made by management, as well as evaluating the overall presentation of the financial statements. We believe that our audit provides a reasonable basis for our opinion.
We have served as the Fund’s auditor since 2021.
/s/ Kevane Grant Thornton, LLP
San Juan, Puerto Rico
February 26, 2024.
Certified Public Accountants (of Puerto Rico) License 217 Expires December 1, 2025 Stamp E544920 of the Puerto Rico Society of CPA's was affixed to the file copy of this report
| Annual Report | December 31, 2023 | 33 |
| X-Square Balanced Fund | Additional Information |
| | December 31, 2023 (Unaudited) |
PORTFOLIO HOLDINGS
The Fund files a complete schedule of portfolio holdings with the U.S. Securities and Exchange Commission (“SEC”) for the first and third quarters of each fiscal year on Form N-PORT within 60 days after the end of the period. Copies of the Fund’s Form N-PORT are available without a charge, upon request, by contacting the Fund at 1-787-282-1621 and on the SEC’s website at http://www.sec.gov.
PROXY VOTING
A description of the Fund’s proxy voting policies and procedures is available (1) without charge, upon request, by calling 1-787-282-1621, (2) on the Fund’s website located at http://www.xsquarecapital.com, or (3) on the SEC’s website at http://www.sec.gov. Information regarding how the Fund voted proxies relating to portfolio securities during the twelve-month period ended June 30 will be available on the SEC’s website at http://www.sec.gov.
BOARD CONSIDERATION AND APPROVAL OF THE INVESTMENT ADVISORY CONTRACT
In connection with a meeting held on November 17, 2023, the Board of Managers (the “Managers” or the “Board”) of X-Square Balanced Fund, LLC (the “Fund”), including a majority of the Managers who are not “interested persons,” as that term is defined in the Investment Company Act of 1940, as amended, discussed the renewal of the investment advisory agreement (the “Advisory Agreement”) between X-Square Capital, LLC (“X2”) and the Fund. In considering the renewal of the Advisory Agreement, the Board received materials specifically relating to the Advisory Agreement.
The Managers relied upon the advice of independent legal counsel and their own business judgment in determining the material factors to be considered in evaluating the Advisory Agreement and the weight to be given to each such factor. The conclusions reached by the Managers were based on a comprehensive evaluation of all of the information provided and were not the result of any one factor. Moreover, each Manager may have afforded different weight to the various factors in reaching his or her conclusions with respect to the Advisory Agreement.
Nature, Extent and Quality of Services. The Board noted that X2 was a registered investment adviser since 2015 and that X2 managed approximately $277 million in assets as of September 30, 2023. The Board reviewed the background information of X2’s key investment professionals servicing the Fund, noting their educations and wide range of industry experience. The Board acknowledged that X2’s specialty was identifying unique investment opportunities based on their extensive knowledge of idiosyncratic themes, industry and market fundamentals, coupled with a strong liability and risk management framework. They considered X2’s efforts and resources required to effectively allocate 60% of assets towards U.S. equity securities and a 40% towards fixed-income securities. The Board noted that X2 selects broker-dealers based on best execution at the most favorable price and several other factors, and that X2 has a Best Execution Committee that meets annually to assess factors influencing the execution of trades. The Board considered X2’s cybersecurity policies and acknowledged Mr. Canto’s assertion that X2’s back-up systems and disaster recovery plan had proven effective in various circumstances. The Board noted that it appeared that the Adviser’s compliance program was working well and that the Adviser did not report any compliance, regulatory or litigation issues in their responses. The Board concluded X2 had provided quality service to the Fund and its shareholders and was expected to continue to do so.
| X-Square Balanced Fund | Additional Information |
| | December 31, 2023 (Unaudited) |
Performance. The Board reviewed the performance of the Fund for various periods ended September 30, 2023, compared to peer group of comparable balanced funds, the S&P 500 Index, and 60% S&P 500 and 40% Bloomberg U.S. Aggregate Bond Index. The Board noted that the peer group constructed by X2 was composed of funds with a similar investment mandate and local characteristic similar to that of Puerto Rico with respect to the Fund. The Managers acknowledged X2’s explanation that despite the Fund’s outperformance relative to the peer group over the 1-year, 3-year, and since inception periods, its performance is hindered due to the size of the Fund and expenses as a percentage of assets under management. The Board discussed that X2 was working to raise additional assets to mitigate the drag on performance. After discussion, the Board concluded that X2 had provided reasonable returns for the Fund and its shareholders.
Fees and Expenses. The Board acknowledged that X2’s advisory fee for the Fund was higher than the average of its peer group below the peer group high. The Board noted that the X2’s net expense ratio was higher than its peer group. The Board discussed the impact of the expense limitation agreement, and further recognized X2’s explanation that many of the funds in its peer group had much larger assets than the Fund or were part of a larger fund family. Given these and other considerations, the Board concluded that X2’s advisory fee for the Fund was not unreasonable.
Profitability. The Board reviewed X2’s profitability analysis in connection with its management of the Fund and acknowledged that X2 was not earning a profit. The Board concluded that excessive profitability was not an issue for X2 at this time.
Economies of Scale. The Board discussed the asset size of the Fund and its prospects for continued growth, concluding that it had not yet achieved meaningful economies that would necessitate the establishment of breakpoints. The Board recognized that X2 agreed to discuss the implementation of breakpoints as the Fund’s assets grew and X2 achieved material economies of scale related to its operation. The Board agreed to monitor and revisit the issue at the appropriate time.
Conclusion. Having requested and received such information from X2 as the Board believed to be reasonably necessary to evaluate the terms of the Advisory Agreement, and as assisted by the advice of counsel, concluded that renewal of the Advisory Agreement was in the best interests of the Fund and its shareholders.
| * | Due to timing of the contract renewal schedule, these deliberations may or may not relate to the current performance results of the Fund. |
| Annual Report | December 31, 2023 | 35 |
| X-Square Balanced Fund | Managers and Officers |
| | December 31, 2023 (Unaudited) |
Overall responsibility for management of the Fund rests with the members of the Board (the “Managers”), who are elected by the shareholders of the Fund, unless appointed to fill a vacancy in accordance with the limited liability company agreement of the Fund and the 1940 Act. The Fund is managed by the Board in accordance with the laws of the Commonwealth of Puerto Rico. There are currently three (3) Managers, two (2) of whom are not “interested persons” (as defined in the 1940 Act) of the Fund (the “Independent Managers”). The Managers, in turn, elect the officers of the Fund to supervise actively its day-to-day operations.
The following table lists each Manager, his or her year of birth, position with the Fund, principal occupations during the past five years, and other directorships. Each Manager oversees the Fund. There is no defined term of office, and each Manager serves until the earlier of his resignation, retirement, removal, death, or the election of a qualified successor. Each Manager’s address is c/o X-Square Balanced Fund, Centro Internacional de Mercadeo II, 90 Carr. 165, Suite 803, Guaynabo, Puerto Rico 00968.
INDEPENDENT MANAGERS
Name,
Address and YOB | Positions Held with the Fund and Length of Time Served | Principal Occupation During the Past Five Years | Number of Portfolios in Fund Complex* Overseen by Manager | Other Directorships held by Manager During Last Five Years |
Luis Roig
(1959) | Manager since June 2019 | Managing Director and CFO, Santander Securities LLC from 2013 until 2016; Chief Financial Officer, Americas Leading Finance LLC since 2016. | 2 | Director of X-Square Series Trust since 2022 |
| Denisse Rodriguez (1984) | Manager since March 2022 | Executive Director, Puerto Rico Science Technology & Research Trust, since 2015. | 2 | Director of X-Square Series Trust since 2022 |
Ramon Ponte
(1958) | Manager since March 2022 | Consultant, Self-Employed, since 2011; Fund Director of Intellectus Foundation since May 2020; Director and Chair of the Puerto Rico CPA Society Foundation since November 2019; and Director and Audit Committee Chair of Bancredito International Bank since May 2014 | 2 | Puerto Rico CPA Foundation, Fundacion Intellectus and Director of X-Square Series Trust since 2022. |
| X-Square Balanced Fund | Managers and Officers |
| | December 31, 2023 (Unaudited) |
INTERESTED MANAGERS
Name, Address and YOB | Positions Held with the Fund and Length of Time Served | Principal Occupation During the Past Five Years | Number of Portfolios in Fund Complex* Overseen by Trustee | Other Directorships held by Trustee During Last Five Years |
Ignacio Canto **
(1983) | President, since 2019 | President of X-Square Capital, LLC since 2013. | 2 | Director of X2 Alternative Dividend Alpha Fund, Inc. and Interested Trustee of X-Square Series Trust |
| * | The “Fund Complex”consists of the Fund and of all the series of the X-Square Series Trust. |
| ** | An “interested person,” as defined by the 1940 Act. Mr. Canto is deemed to be an “interested” Manager because he is the owner of all membership interests of the Adviser and also serves as its President, Treasurer and sole director |
| Annual Report | December 31, 2023 | 37 |
| X-Square Balanced Fund | Managers and Officers |
| | December 31, 2023 (Unaudited) |
OFFICERS
Name, Address and YOB | Position/Term of Office* | Principal Occupation During the Past Five Years |
Ignacio Canto
(1983) | President since January 2019 | President of X-Square Capital, LLC since 2013. |
Cristina Perez (1976) | Treasurer since May 2022 | Chief Compliance Officer and Head of Operations at X-Square Capital since 2022. Banco Popular de Puerto Rico Mutual Fund’s Administration from 1999- 2022.Treasurer of the X-Square Municipal Income ETF since May 2023. |
Gabriel Medina
(1989) | Secretary since January 2019 | Portfolio Manager of X-Square Capital, LLC since 2018. Chief Compliance Officer of X-Square Capital, LLC from 2015 to 2018. Secretary of the X-Square Municipal Income ETF since May 2023. |
Ivana Kovačić
(1977) | Chief Compliance Officer since 2022 | Deputy Chief Compliance Officer, ALPS Fund Servies, Inc. since October 2021. Ms. Kovačić joined ALPS in March 2020 as a Regulatory Compliance Manager. Prior to her current role, Ms. Kovačić served as Senior Compliance Analyst at Jennison Associates (August 2013- January 2019.) |
Intentionally Left Blank

| | (a) | The Registrant, as of the end of the period covered by this report, has adopted a code of ethics that applies to the Registrant’s principal executive officer, principal financial officer, principal accounting officer or controller or any persons performing similar functions on behalf of the Registrant. |
| | (c) | During the period covered by this report, no amendments to the provisions of the code of ethics referred to above in Item 2(a) were made. |
| | (d) | During the period covered by this report, no implicit or explicit waivers to the provisions of the code of ethics referred to above in Item 2(a) were granted. |
| | (f) | The Registrant’s Code of Ethics is attached as Exhibit 13(a)(1) hereto. |
| Item 3. | Audit Committee Financial Expert. |
The Board of Managers (“Board”) of the Registrant has determined that the Registrant has at least one Audit Committee Financial Expert serving on its audit committee. The Board has designated Ramon Ponte and Luis Roig as the Registrant’s Audit Committee Financial Experts. Mr. Ponte and Roig are “independent” as that term is defined in paragraph (a)(2) of Item 3 to Form N-CSR.
| Item 4. | Principal Accountant Fees and Services |
| | (a) | Audit Fees: Audit fees are fees related to the audit of and review of the Fund’s financial statements included in annual reports and registration statements and other services that are normally provided by the independent registered public accounting firm in connection with statutory and regulatory filings or engagements. The aggregate fees billed for each of the last two fiscal years for professional services rendered by Kevane Grant Thornton, LLP for the audit of the Fund’s annual financial statements or services that are normally provided by the accountant in connection with statutory and regulatory filings or engagements for those fiscal years were $49,800 and $46,400 for fiscal year ended December 31, 2022 and fiscal year ended December 31, 2023, respectively. |
| | (b) | Audit-Related Fees: Audit-related fees are fees for assurance and related services that are reasonably related to the performance of the audit or review of financial statements, but are not reported as audit fees. The aggregate fees billed in each of the last two fiscal years for assurance and related services by Kevane Grant Thornton, LLP that are reasonably related to the performance of the audit of the Fund’s financial statements were $0 and $0 for the fiscal years ended December 31, 2022 and fiscal year ended December 31, 2023, respectively. |
| | (c) | Tax Fees: Tax fees are fees associated with tax compliance, tax advice and tax planning. The aggregate fees billed in each of the last two fiscal years for professional services rendered by Kevane Grant Thornton, LLP for tax compliance were $4,095 and $6,700 for the fiscal years ended December 31, 2022 and fiscal year ended December 31, 2023, respectively. |
| | (d) | All Other Fees: No fees were billed by Kevane Grant Thornton, LLP for products and services provided to the Fund other than the services reported in “Audit Fees,” “Audit-Related Fees,” and “Tax Fees” above for the fiscal years ended December 31, 2022 and fiscal year ended December 31, 2023, respectively. |
| | (e)(1) | Audit Committee Pre-Approval Policies and Procedures: All services to be performed by the Registrant's principal accountant must be pre-approved by the Registrant's Audit Committee. |
| | (e)(2) | No services described in paragraphs (b) and (d) of this Item 4 were approved by the Registrant’s audit committee pursuant to paragraph (c)(7)(i)(C) of Rule 2-01 of Regulation S-X. |
| Item 5. | Audit Committee of Listed Registrants. |
| | (a) | Not applicable to the Registrant. |
| | (b) | Not applicable to the Registrant |
| | (a) | Schedule of Investments (as set forth in 17 CFR 210.12-12) is included as part of the Report to Stockholders filed under Item 1 of this Form N-CSR. |
| | (b) | Not applicable to the Registrant. |
| Item 7. | Disclosure of Proxy Voting Policies and Procedures for Closed-End Management Investment Companies. |
Not applicable to the Registrant.
| Item 8. | Portfolio Managers of Closed-End Management Investment Companies. |
Not applicable to the Registrant.
| Item 9. | Purchases of Equity Securities by Closed-End Management Investment Company and Affiliated Purchasers. |
Not applicable to the Registrant.
| Item 10. | Submission of Matters to Vote of Security Holders. |
There have been no material changes to the procedures by which shareholders may recommend nominees to the Registrant’s Board of Managers, where those changes were implemented after the Registrant last provided disclosure in response to the requirements of Item 407(c)(2)(iv) of Regulation S-K (17 CFR 229.407) (as required by Item 22(b)(15) of Schedule 14A (17 CFR 240.14a-101)), or this Item.
| Item 11. | Controls and Procedures. |
| | (a) | The Registrant’s principal executive officer and principal financial officer have concluded that the Registrant’s disclosure controls and procedures (as defined in Rule 30a-3(c) under the Investment Company Act of 1940, as amended) are effective based on their evaluation of these controls and procedures as of a date within 90 days of the filing date of this report. |
| | (b) | There was no change in the Registrant's internal control over financial reporting (as defined in Rule 30a-3(d) under the Investment Company Act of 1940, as amended) during the period covered by this report that has materially affected, or is reasonably likely to materially affect, the Registrant's internal control over financial reporting. |
| Item 12. | Disclosure of Securities Lending Activities for Closed-end Management Investment Companies. |
Not applicable to the Registrant.
SIGNATURES
Pursuant to the requirements of the Securities Exchange Act of 1934 and the Investment Company Act of 1940, the Registrant has duly caused this Report to be signed on its behalf by the undersigned, thereunto duly authorized.
| | X-Square Balanced Fund, LLC |
| | | |
| | By: | /s/ Ignacio Canto |
| | | Ignacio Canto |
| | | Principal Executive Officer/President |
| | | |
| | Date: | March 6, 2024 |
Pursuant to the requirements of the Securities Exchange Act of 1934 and the Investment Company Act of 1940, this Report has been signed below by the following persons on behalf of the Registrant and in the capacities and on the dates indicated.
| | X-Square Balanced Fund, LLC |
| | | |
| | By: | /s/ Ignacio Canto |
| | | Ignacio Canto |
| | | Principal Executive Officer/President |
| | | |
| | Date: March 6, 2024 |
| | | |
| | By: | /s/ Cristina Perez |
| | | Cristina Perez |
| | | Principal Financial Officer/Treasurer |
| | | |
| | Date: | March 6, 2024 |