UNITED STATES
SECURITIES AND EXCHANGE COMMISSION
Washington, D.C. 20549
FORM N-CSR
CERTIFIED SHAREHOLDER REPORT OF REGISTERED
MANAGEMENT INVESTMENT COMPANIES
Investment Company Act File Number: 811-23494
T. Rowe Price Exchange-Traded Funds, Inc.
(Exact name of registrant as specified in charter)
100 East Pratt Street, Baltimore, MD 21202
(Address of principal executive offices)
David Oestreicher
100 East Pratt Street, Baltimore, MD 21202
(Name and address of agent for service)
Registrant’s telephone number, including area code: (410) 345-2000
Date of fiscal year end: May 31
Date of reporting period: May 31, 2023
Item 1. Reports to Shareholders
(a) Report pursuant to Rule 30e-1
ANNUAL REPORT
May 31, 2023
| | T. ROWE PRICE |
| TBUX | Ultra Short-Term Bond ETF |
| | For more insights from T. Rowe Price investment professionals, go to troweprice.com. |
T. ROWE PRICE ULTRA SHORT-TERM BOND ETF
HIGHLIGHTS
| ■ | The fund outperformed its benchmark and its Lipper peer group average over the 12-month period ended May 31, 2023. |
| ■ | Short-term fixed income markets remained volatile over the past 12 months as market participants struggled to balance a resilient economy against considerable tightening from the Federal Reserve. |
| ■ | From a credit risk standpoint, the fund remained defensively positioned with credit exposure below strategy-level, long-term averages. However, we opportunistically added to investment-grade corporate exposure in the first quarter of 2023 when credit spreads prematurely reflected a more recessionary outlook, in our view. |
| ■ | Front-end volatility is likely to persist in both yields and credit spreads, which should offer opportunities for the fund to supplement the already healthy yield embedded in the portfolio. |
Sign up for e-delivery of your statements, confirmations, and prospectuses or shareholder reports.
If you invest directly with T. Rowe Price, go to troweprice.com/paperless.
If you invest through an investment advisor, a bank, or a brokerage firm, please contact that organization and ask if it can provide electronic documentation.
It’s fast—receive your statements and
confirmations faster than U.S. mail.
It’s convenient—access your important account documents whenever you need them.
It’s secure—we protect your online accounts using “True Identity” to confirm new accounts and make verification faster and more secure.
It can save you money—where applicable,
T. Rowe Price passes on the cost savings to
fund holders.*
Log in to your account at troweprice.com for more information.
*Certain mutual fund accounts that are assessed an annual account service fee can also save money by switching to e-delivery.
T. ROWE PRICE ULTRA SHORT-TERM BOND ETF
Market Commentary
Dear Shareholder
Major global stock and bond indexes produced mixed returns during your fund’s fiscal year, the 12-month period ended May 31, 2023. Rising interest rates weighed on returns in the first half of the period, but many sectors rebounded over the past six months as growth remained positive in the major economies and corporate earnings results came in stronger than expected.
For the 12-month period, growth stocks outperformed value shares, and developed market shares generally outpaced their emerging market counterparts. In the U.S., the Russell 1000 Growth Index and Nasdaq Composite Index performed the best. Most currencies weakened versus the U.S. dollar over the period, which weighed on returns for U.S. investors in international securities.
Within the S& P 500 Index, the information technology sector had, by far, the strongest returns. Big tech companies rebounded strongly at the start of 2023, helped in part by growing investor enthusiasm for artificial intelligence applications. Meanwhile, falling prices for various commodities weighed on returns for the materials and energy sectors, and turmoil in the banking sector, which included the failure of three large regional banks, hurt the financials segment. Real estate stocks also came under pressure amid concerns about the ability of some commercial property owners to refinance their debt.
Cheaper oil contributed to slowing inflation during the period, although core inflation readings—which exclude volatile food and energy prices—remained stubbornly high. April’s consumer price index data (the latest available in our reporting period) showed a headline inflation rate of 4.9% on a 12-month basis, down from more than 8% at the start of the period but still well above the Fed’s long-term 2% inflation target.
In response to persistent inflation, the Fed raised its short-term lending benchmark rate from around 1.00% at the start of the period to a range of 5.00% to 5.25% by the end of May, the highest level since 2007. However, Fed officials have recently suggested that they might soon be ready to pause additional rate hikes as they wait to see how the economy is progressing.
Bond yields increased considerably across the U.S. Treasury yield curve as the Fed tightened monetary policy, with the yield on the benchmark 10-year note climbing from 2.85% at the start of the period to 3.64% at the end of May.
T. ROWE PRICE ULTRA SHORT-TERM BOND ETF
Significant inversions in the yield curve, which are often considered a warning sign of a coming recession, occurred during the period as shorter-maturity Treasuries experienced the largest yield increases. At the end of May, the yield on the three-month Treasury bill was 188 basis points (1.88 percentage point) higher than the yield on the 10-year Treasury note. Increasing yields led to weak results across most of the fixed income market, although high yield bonds, which are less sensitive to rising rates, held up relatively well.
Global economies and markets showed surprising resilience in recent months, but, moving into the second half of 2023, we believe investors could face potential challenges. The economic impact of the Fed’s rate hikes has yet to be fully felt in the economy, and while the regional banking turmoil appears to have been contained by the swift actions of regulators, it could continue to have an impact on credit conditions. Moreover, the market consensus still seems to forecast a global recession starting later this year or in early 2024, although it could be a mild downturn.
We believe this environment makes skilled active management a critical tool for identifying risks and opportunities, and our investment teams will continue to use fundamental research to identify securities that can add value to your portfolio over the long term.
Thank you for your continued confidence in T. Rowe Price.
Sincerely,
Robert Sharps
CEO and President
T. ROWE PRICE ULTRA SHORT-TERM BOND ETF
Management’s Discussion of Fund Performance
INVESTMENT OBJECTIVE
The fund seeks a high level of income consistent with low volatility of principal value.
FUND COMMENTARY
How did the fund perform in the past 12 months?
The fund returned 3.15% in the 12-month period ended May 31, 2023, outperforming its benchmark, the Bloomberg Short-Term Government/Corporate Index, as well as its Lipper peer group average. (Past performance cannot guarantee future results.)
What factors influenced the fund’s performance?
Short-term fixed income markets remained volatile over the past 12 months as market participants struggled to balance a resilient economy against considerable tightening from the Federal Reserve (Fed). During the reporting period, shifts in
PERFORMANCE COMPARISON
| | Total Return |
| Periods Ended 5/31/23 | 6 Months | 12 months |
| Ultra Short-Term Bond ETF (Based on Net Asset Value) | 2.82% | 3.15% |
| Ultra Short-Term Bond ETF (At Market Price)* | 2.74 | 3.05 |
| Bloomberg Short-Term Government/Corporate Index | 2.20 | 2.63 |
| Lipper Ultra-Short Obligations Funds Average | 2.53 | 2.99 |
*Market returns are based on the midpoint of the bid/ask spread at market close (typically, 4 p.m. ET) and do not represent returns an investor would have received if shares were traded at other times.
T. ROWE PRICE ULTRA SHORT-TERM BOND ETF
market expectations for monetary policy contributed to notable volatility in Treasury yields. The two-year Treasury note yield began the period at 2.53%, reached an intraperiod high of over 5% in March 2023, and moderated to end the period at 4.40%. The high end of this range was driven by market expectations for the Fed’s terminal rate rising to nearly 6% amid hawkish rhetoric, which uncovered solvency concerns within the banking sector and abruptly pushed Treasury yields lower.
Alongside the banking sector turmoil that surfaced in March 2023, credit spreads on one- to three-year corporate bonds more than doubled and peaked just above 130 basis points (bps) as the financials sector priced in a recessionary environment. Credit spreads subsequently tightened but still ended the period approximately 15 bps wider than 12 months prior. (Credit spreads are a measure of the additional yield offered by bonds that have credit risk compared with U.S. Treasuries with similar maturities.)
Despite both Treasury rates and credit spreads ending the period higher than they started, the Ultra Short-Term Bond ETF delivered a positive total return, as the higher yields offered by securities within the portfolio provided a considerable cushion against negative market impacts.
Sector allocations contributed to the fund’s relative performance in aggregate. An overweight to investment-grade corporate bonds and a corresponding underweight to U.S. Treasuries helped relative performance as generally supportive corporate earnings and hopes for a dovish pivot from the Fed led to bouts of improved risk sentiment. An out-of-benchmark allocation to asset-backed securities (ABS) was also constructive as attractive relative valuations at the start of 2023, healthy liquidity, and low levels of issuance all contributed to the sector’s outperformance. Conversely, an out-of-benchmark allocation to residential mortgage-backed securities (RMBS) negated some relative gains, as the interest rate-sensitive sector was dragged down by rising rates and periods of thin liquidity.
Security selection within investment-grade corporate bonds aided relative performance. Cyclical exposures within European banks and automotive bonds were among the strongest contributors. Relative performance was also supported by our incremental additions to U.S. corporates during the volatility surrounding U.S. regional banks in March 2023.
Interest rate management contributed in aggregate, led upward by constructive positioning across key rates. In particular, a slight underweight to the six-month key rate and a modest overweight to the two-year key rate helped relative performance as the yield on the six-month Treasury bill increased more than the
T. ROWE PRICE ULTRA SHORT-TERM BOND ETF
yield on the two-year Treasury note. Conversely, the fund’s modestly longer-than-benchmark average duration profile detracted as Treasury yields rose broadly across the yield curve.
In addition, while we are primarily a cash bond manager, we employ the limited use of derivatives in our strategy for hedging purposes. Derivatives may include futures and options, as well as credit default and interest rate swaps. During the reporting period, our use of derivatives—particularly Treasury futures—contributed to absolute performance.
How is the fund positioned?
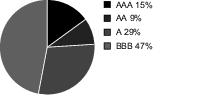
CREDIT QUALITY DIVERSIFICATION
Based on net assets as of 5/31/23.
Sources: Credit ratings for the securities held in the fund are provided by Moody’s, Standard & Poor’s, and Fitch and are converted to the Standard & Poor’s nomenclature. A rating of AAA represents the highest-rated securities, and a rating of D represents the lowest-rated securities. If the rating agencies differ, the highest rating is applied to the security. If a rating is not available, the security is classified as Not Rated (NR). T. Rowe Price uses the rating of the underlying investment vehicle to determine the creditworthiness of credit default swaps. The fund is not rated by any agency. Securities that have not been rated by any rating agency totaled 0.02% of the portfolio at the end of the reporting period.
T. ROWE PRICE ULTRA SHORT-TERM BOND ETF
Duration fell initially and remained near or below the low end of the fund’s usual half- to one-year target range through the first half of the reporting period. The fund then added duration as interest rates increased during early 2023, and duration slowly but steadily rose through the end of the period. This decision to modestly extend duration was in line with our view that the risks around Treasury yields became slightly more balanced following the one-way trade of rising rates in 2022. However, overall duration positioning stayed below long-term averages of the strategy since inflation did not decline to a level that would precipitate cuts to the policy rate.
From a credit risk standpoint, the fund remained defensively positioned with credit exposure below strategy-level, long-term averages. However, we opportunistically added to investment-grade corporate exposure when credit spreads prematurely reflected a more recessionary outlook, in our view. The spread volatility seen over the period presented many opportunities for our research team to identify bonds where credit spreads were divorced from fundamentals, which incrementally pushed credit risk higher. Non-commercial-paper investment-grade corporate bond holdings continued to be the largest exposure for the fund, representing over 60% of the fund’s net assets at period-end.
We continued to hold out-of-benchmark positions in ABS, RMBS, and commercial mortgage-backed securities to provide diversified sources of what we believe to be high-quality yield. However, our allocation to RMBS trended lower through a combination of bond amortization and actively selling bonds. ABS continued to be a steady allocation as our analyst team identified a variety of opportunities within automotive and industrial equipment securities.
Nearly half of the fund’s holdings continued to be in the zero to one-year maturity bucket, reflecting the higher yields of an inverted interest rate curve and our expectation that the Fed would continue to tighten monetary policy as inflation and growth continued to exceed expectations.
What is portfolio management’s outlook?
The U.S. economy continues to outperform expectations despite weathering an inflationary backdrop and regional banking turmoil. Some signs of concern have appeared on the edges, such as negative profit growth and softening in labor market surveys, but growth remains resilient, which implies the economy is more likely to steadily slow to trend levels of growth. Somewhat contrary to this view, credit spreads are pricing in a material chance of an economic slowdown, which continues to present opportunities to incrementally add credit risk, but within the context of a below-average level versus the fund’s long-term range.
T. ROWE PRICE ULTRA SHORT-TERM BOND ETF
Inflation remains too far above tolerance levels, and it’s unclear if the current level of monetary policy is restrictive enough to bring 2% inflation into the conversation. This will keep the Fed in play and prevent the market from confidently saying the peak in yields for this cycle has been reached. While it’s true that rising yields were a factor behind the banking turmoil in March, the weaker players have been addressed, and the sector has a variety of tools at its disposal to help weather a less-than-ideal operating environment.
Putting all this together, front-end volatility is likely to persist in both yields and credit spreads, which should offer opportunities for the fund to supplement the already healthy yield embedded in the portfolio. In the current environment of heightened volatility, active management can play an even more instrumental part in achieving investor objectives. Our continued goal is to provide high-quality, consistent yield and income appropriate for an ultra short-term bond strategy with modest credit and duration risk. Using the breadth and depth of our global research platform, we will look to selectively add to high-conviction positions as volatility creates attractive entry points.
The views expressed reflect the opinions of T. Rowe Price as of the date of this report and are subject to change based on changes in market, economic, or other conditions. These views are not intended to be a forecast of future events and are no guarantee of future results.
T. ROWE PRICE ULTRA SHORT-TERM BOND ETF
RISK OF BOND INVESTING
The value of the fund’s investments may decrease, sometimes rapidly or unexpectedly, due to factors affecting an issuer held by the fund, particular industries, or the overall securities markets. The prices of, and the income generated by, debt instruments held by the fund may be affected by changes in interest rates. The fund is subject to prepayment risks because the principal on mortgage-backed securities, other asset-backed securities, or any debt instrument with an embedded call option may be prepaid at any time, which could reduce the security’s yield and market value. An issuer of a debt instrument could suffer an adverse change in financial condition that results in a payment default (failure to make scheduled interest or principal payments), rating downgrade, or inability to meet a financial obligation.
BENCHMARK INFORMATION
Note: Bloomberg® and Bloomberg Short-Term Government/Corporate Index are service marks of Bloomberg Finance L.P. and its affiliates, including Bloomberg Index Services Limited (“BISL”), the administrator of the index (collectively, “Bloomberg”) and have been licensed for use for certain purposes by T. Rowe Price. Bloomberg is not affiliated with T. Rowe Price, and Bloomberg does not approve, endorse, review, or recommend its products. Bloomberg does not guarantee the timeliness, accurateness, or completeness of any data or information relating to its products.
Note: Copyright © 2023 Fitch Ratings, Inc., Fitch Ratings Ltd. and its subsidiaries.
Note: Portions of the mutual fund information contained in this report was supplied by Lipper, a Refinitiv Company, subject to the following: Copyright 2023 © Refinitiv. All rights reserved. Any copying, republication or redistribution of Lipper content is expressly prohibited without the prior written consent of Lipper. Lipper shall not be liable for any errors or delays in the content, or for any actions taken in reliance thereon.
Note: © 2023, Moody’s Corporation, Moody’s Investors Service, Inc., Moody’s Analytics, Inc. and/or their licensors and affiliates (collectively, “Moody’s”). All rights reserved. Moody’s ratings and other information (“Moody’s Information”) are proprietary to Moody’s and/or its licensors and are protected by copyright and other intellectual property laws. Moody’s Information is licensed to Client by Moody’s. MOODY’S INFORMATION MAY NOT BE COPIED OR OTHERWISE REPRODUCED, REPACKAGED, FURTHER TRANSMITTED,
T. ROWE PRICE ULTRA SHORT-TERM BOND ETF
TRANSFERRED, DISSEMINATED, REDISTRIBUTED OR RESOLD, OR STORED FOR SUBSEQUENT USE FOR ANY SUCH PURPOSE, IN WHOLE OR IN PART, IN ANY FORM OR MANNER OR BY ANY MEANS WHATSOEVER, BY ANY PERSON WITHOUT MOODY’S PRIOR WRITTEN CONSENT. Moody's® is a registered trademark.
Note: Copyright © 2023, S&P Global Market Intelligence (and its affiliates, as applicable). Reproduction of any information, data or material, including ratings (“Content”) in any form is prohibited except with the prior written permission of the relevant party. Such party, its affiliates and suppliers (“Content Providers”) do not guarantee the accuracy, adequacy, completeness, timeliness or availability of any Content and are not responsible for any errors or omissions (negligent or otherwise), regardless of the cause, or for the results obtained from the use of such Content. In no event shall Content Providers be liable for any damages, costs, expenses, legal fees, or losses (including lost income or lost profit and opportunity costs) in connection with any use of the Content. A reference to a particular investment or security, a rating or any observation concerning an investment that is part of the Content is not a recommendation to buy, sell or hold such investment or security, does not address the appropriateness of an investment or security and should not be relied on as investment advice. Credit ratings are statements of opinions and are not statements of fact.
T. ROWE PRICE ULTRA SHORT-TERM BOND ETF
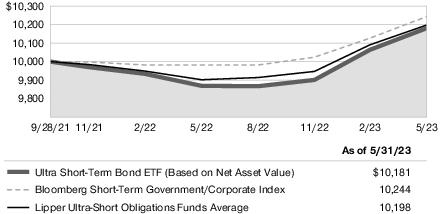
GROWTH OF $10,000
This chart shows the value of a hypothetical $10,000 investment in the fund over the past 10 fiscal year periods or since inception (for funds lacking 10-year records). The result is compared with benchmarks, which include a broad-based market index and may also include a peer group average or index. Market indexes do not include expenses, which are deducted from fund returns as well as mutual fund averages and indexes.
Ultra Short-Term Bond ETF
Note: See the Average Annual Compound Total Return table.
AVERAGE ANNUAL COMPOUND TOTAL RETURN
| Periods Ended 5/31/23 | One Year | Since
Inception
9/28/21 |
| Ultra Short-Term Bond ETF (Based on Net Asset Value) | 3.15% | 1.08% |
| Ultra Short-Term Bond ETF (At Market Price) | 3.05 | 1.04 |
This table shows how the fund would have performed each year if its actual (or cumulative) returns for the periods shown had been earned at a constant rate. Average annual total return figures include changes in principal value, reinvested dividends, and capital gain distributions. Returns do not reflect taxes that the shareholder may pay on fund distributions or the redemption of fund shares. When assessing performance, investors should consider both short- and long-term returns. Past performance cannot guarantee future results. Market returns are based on the midpoint of the bid/ask spread at market close (typically, 4 p.m. ET) and do not represent returns an investor would have received if shares were traded at other times.
T. ROWE PRICE ULTRA SHORT-TERM BOND ETF
PREMIUM/DISCOUNT INFORMATION
The frequency at which the daily market prices were at a discount or premium to the fund’s net asset value is available on the fund’s website (troweprice.com).
EXPENSE RATIO
| Ultra Short-Term Bond ETF | 0.17% |
The expense ratio shown is as of the fund’s most recent prospectus. This number may vary from the expense ratio shown elsewhere in this report because it is based on a different time period and, if applicable, includes acquired fund fees and expenses but does not include fee or expense waivers.
T. ROWE PRICE ULTRA SHORT-TERM BOND ETF
FUND EXPENSE EXAMPLE
As a shareholder, you may incur two types of costs: (1) transaction costs, such as brokerage commissions on purchases and sales, and (2) ongoing costs, including management fees and other fund expenses. The following example is intended to help you understand your ongoing costs (in dollars) of investing in the fund and to compare these costs with the ongoing costs of investing in other funds. The example is based on an investment of $1,000 invested at the beginning of the most recent six-month period and held for the entire period.
Actual Expenses
The first line of the following table (Actual) provides information about actual account values and expenses based on the fund’s actual returns. You may use the information on this line, together with your account balance, to estimate the expenses that you paid over the period. Simply divide your account value by $1,000 (for example, an $8,600 account value divided by $1,000 = 8.6), then multiply the result by the number on the first line under the heading “Expenses Paid During Period” to estimate the expenses you paid on your account during this period.
Hypothetical Example for Comparison Purposes
The information on the second line of the table (Hypothetical) is based on hypothetical account values and expenses derived from the fund’s actual expense ratio and an assumed 5% per year rate of return before expenses (not the fund’s actual return). You may compare the ongoing costs of investing in the fund with other funds by contrasting this 5% hypothetical example and the 5% hypothetical examples that appear in the shareholder reports of the other funds. The hypothetical account values and expenses may not be used to estimate the actual ending account balance or expenses you paid for the period.
You should also be aware that the expenses shown in the table highlight only your ongoing costs and do not reflect any transaction costs, such as brokerage commissions paid on purchases and sales of shares. Therefore, the second line of the table is useful in comparing ongoing costs only and will not help you determine the relative total costs of owning different funds. To the extent a fund charges transaction costs, however, the total cost of owning that fund is higher.
T. ROWE PRICE ULTRA SHORT-TERM BOND ETF
Ultra Short-Term Bond ETF
| | Beginning
Account Value
12/1/22 | Ending
Account Value
5/31/23 | Expenses Paid
During Period*
12/1/22 to 5/31/23 |
| Actual | $1,000.00 | $1,028.20 | $0.86 |
| Hypothetical (assumes 5% return before expenses) | 1,000.00 | 1,024.08 | 0.86 |
| * | Expenses are equal to the fund’s annualized expense ratio for the 6-month period (0.17%), multiplied by the average account value over the period, multiplied by the number of days in the most recent fiscal half year (182), and divided by the days in the year (365) to reflect the half-year period. |
T. ROWE PRICE ULTRA SHORT-TERM BOND ETF
QUARTER-END RETURNS
| Periods Ended 3/31/23 | One Year | Since
Inception
9/28/21 |
| Ultra Short-Term Bond ETF (Based on Net Asset Value) | 2.09% | 0.60% |
| Ultra Short-Term Bond ETF (At Market Price) | 2.09 | 0.65 |
The fund’s performance information represents only past performance and is not necessarily an indication of future results. Current performance may be lower or higher than the performance data cited. Share price, principal value, and return will vary, and you may have a gain or loss when you sell your shares. Market returns are based on the midpoint of the bid/ask spread at market close (typically, 4 p.m. ET) and do not represent returns an investor would receive if shares were traded at other times. For the most recent month-end performance, please visit our website (troweprice.com) or contact a T. Rowe Price representative at 1-800-225-5132.
This table provides returns through the most recent calendar quarter-end rather than through the end of the fund’s fiscal period. It shows how the fund would have performed each year if its actual (or cumulative) returns for the periods shown had been earned at a constant rate. Average annual total return figures include changes in principal value, reinvested dividends, and capital gain distributions. Returns do not reflect taxes that the shareholder may pay on fund distributions or the redemption of fund shares. When assessing performance, investors should consider both short- and long-term returns.
T. ROWE PRICE ULTRA SHORT-TERM BOND ETF
For a share outstanding throughout each period
| | Year
Ended | 9/28/21 (1)
Through |
| | 5/31/23 | 5/31/22 |
| NET ASSET VALUE | | |
| Beginning of period | $ 49.07 | $ 50.00 |
| Investment activities | | |
| Net investment income(2) (3) | 1.63 | 0.31 |
| Net realized and unrealized gain/loss | (0.13) | (0.94) |
| Total from investment activities | 1.50 | (0.63) |
| Distributions | | |
| Net investment income | (1.69) | (0.27) |
| Net realized gain | (0.21) | (0.03) |
| Total distributions to shareholders | (1.90) | (0.30) |
| NET ASSET VALUE | | |
| End of period | $ 48.67 | $ 49.07 |
| Ratios/Supplemental Data |
| Total return, based on NAV(3) (4) | 3.15% | (1.31)% |
Ratios to average net
assets:(3) | | |
Gross expenses before
waivers/payments by
Price Associates | 0.17% | 0.17% (5) |
Net expenses after
waivers/payments by
Price Associates | 0.17% | 0.17% (5) |
| Net investment income | 3.34% | 0.94% (5) |
| Portfolio turnover rate(6) | 61.2% | 12.5% |
Net assets, end of period
(in thousands) | $ 54,755 | $ 36,801 |
| (1) | Inception date |
| (2) | Per share amounts calculated using average shares outstanding method. |
| (3) | See Note 6 for details to expense-related arrangements with Price Associates. |
| (4) | Total return reflects the rate that an investor would have earned on an investment in the fund during each each period, assuming reinvestment of all distributions. Total return is not annualized for periods less than one year. |
| (5) | Annualized |
| (6) | Portfolio turnover excludes securities received or delivered through in-kind share transactions. |
The accompanying notes are an integral part of these financial statements.
T. ROWE PRICE ULTRA SHORT-TERM BOND ETF
May 31, 2023
| PORTFOLIO OF INVESTMENTS‡ | Par/Shares | $ Value |
| (Amounts in 000s) | | |
| ASSET-BACKED SECURITIES 15.7% |
| Auto Backed 9.4% | | |
| AmeriCredit Automobile Receivables Trust, Series 2020-3, Class C, 1.06%, 8/18/26 | 100 | 94 |
| ARI Fleet Lease Trust, Series 2020-A, Class B, 2.06%, 11/15/28 (1) | 100 | 99 |
| ARI Fleet Lease Trust, Series 2019-A, Class A3, 2.53%, 11/15/27 (1) | 119 | 118 |
| Avis Budget Rental Car Funding AESOP, Series 2018-1A, Class D, 5.25%, 9/20/24 (1) | 67 | 66 |
| Avis Budget Rental Car Funding AESOP, Series 2018-1A, Class B, 4.00%, 9/20/24 (1) | 133 | 133 |
| CarMax Auto Owner Trust, Series 2020-4, Class B, 0.85%, 6/15/26 | 100 | 93 |
| Carvana Auto Receivables Trust, Series 2021-N4, Class B, 1.24%, 9/11/28 | 12 | 11 |
| Carvana Auto Receivables Trust, Series 2022-N1, Class A1, 2.31%, 12/11/28 (1) | 58 | 57 |
| Carvana Auto Receivables Trust, Series 2023-N1, Class A, 6.36%, 4/12/27 (1) | 106 | 106 |
| Enterprise Fleet Financing, Series 2020-2, Class A2, 0.61%, 7/20/26 (1) | 29 | 28 |
| Enterprise Fleet Financing, Series 2020-1, Class A3, 1.86%, 12/22/25 (1) | 50 | 50 |
| Enterprise Fleet Financing, Series 2023-2, Class A2, 5.56%, 4/22/30 (1) | 400 | 400 |
| Exeter Automobile Receivables Trust, Series 2021-3A, Class B, 0.69%, 1/15/26 | 116 | 115 |
| Exeter Automobile Receivables Trust, Series 2022-2A, Class A3, 2.80%, 11/17/25 | 124 | 123 |
| Exeter Automobile Receivables Trust, Series 2022-4A, Class B, 4.57%, 1/15/27 | 250 | 246 |
| Exeter Automobile Receivables Trust, Series 2022-3A, Class B, 4.86%, 12/15/26 | 100 | 99 |
| Exeter Automobile Receivables Trust, Series 2022-5A, Class B, 5.97%, 3/15/27 | 200 | 199 |
| Exeter Automobile Receivables Trust, Series 2022-6A, Class A3, 5.70%, 8/17/26 | 25 | 25 |
T. ROWE PRICE ULTRA SHORT-TERM BOND ETF
| | Par/Shares | $ Value |
| (Amounts in 000s) | | |
| Exeter Automobile Receivables Trust, Series 2023-1A, Class B, 5.72%, 4/15/27 | 310 | 308 |
| Ford Credit Auto Lease Trust, Series 2023-A, Class B, 5.29%, 6/15/26 | 120 | 119 |
| Ford Credit Floorplan Master Owner Trust, Series 2020-1, Class B, 0.98%, 9/15/25 | 60 | 59 |
| Ford Credit Floorplan Master Owner Trust, Series 2023-1, Class B, 5.31%, 5/15/28 (1) | 100 | 99 |
| GM Financial Automobile Leasing Trust, Series 2023-2, Class B, 5.54%, 5/20/27 | 80 | 80 |
| GMF Floorplan Owner Revolving Trust, Series 2020-1, Class B, 1.03%, 8/15/25 (1) | 300 | 297 |
| GMF Floorplan Owner Revolving Trust, Series 2020-1, Class C, 1.48%, 8/15/25 (1) | 200 | 198 |
| HPEFS Equipment Trust, Series 2023-1A, Class A2, 5.43%, 8/20/25 (1) | 150 | 149 |
| Hyundai Auto Lease Securitization Trust, Series 2021-A, Class B, 0.61%, 10/15/25 (1) | 300 | 298 |
| JPMorgan Chase, Series 2021-2, Class C, 0.969%, 12/26/28 (1) | 77 | 74 |
| JPMorgan Chase, Series 2021-3, Class B, 0.76%, 2/26/29 (1) | 96 | 91 |
| JPMorgan Chase, Series 2021-2, Class B, 0.889%, 12/26/28 (1) | 76 | 73 |
| JPMorgan Chase, Series 2021-1, Class B, 0.875%, 9/25/28 (1) | 63 | 61 |
| Octane Receivables Trust, Series 2023-1A, Class A, 5.87%, 5/21/29 (1) | 88 | 88 |
| Octane Receivables Trust, Series 2023-1A, Class B, 5.96%, 7/20/29 (1) | 200 | 199 |
| Santander Consumer Auto Receivables Trust, Series 2021-BA, Class B, 1.45%, 10/16/28 (1) | 6 | 6 |
| Santander Drive Auto Receivables Trust, Series 2020-3, Class C, 1.12%, 1/15/26 | 2 | 2 |
| Santander Drive Auto Receivables Trust, Series 2022-5, Class B, 4.43%, 3/15/27 | 250 | 245 |
| Santander Drive Auto Receivables Trust, Series 2022-7, Class A2, 5.81%, 1/15/26 | 71 | 71 |
| Santander Drive Auto Receivables Trust, Series 2022-6, Class B, 4.72%, 6/15/27 | 150 | 147 |
T. ROWE PRICE ULTRA SHORT-TERM BOND ETF
| | Par/Shares | $ Value |
| (Amounts in 000s) | | |
| Santander Drive Auto Receivables Trust, Series 2023-1, Class B, 4.98%, 2/15/28 | 85 | 84 |
| World Omni Auto Receivables Trust, Series 2021-A, Class B, 0.64%, 12/15/26 | 25 | 23 |
| World Omni Automobile Lease Securitization Trust, Series 2022-A, Class A2, 2.63%, 10/15/24 | 97 | 96 |
| World Omni Select Auto Trust, Series 2020-A, Class B, 0.84%, 6/15/26 | 200 | 195 |
| | | 5,124 |
| Collaterized Debt Obligations 0.8% | | |
| BlueMountain, Series 2015-3A, Class A1R, CLO, FRN, 3M USD LIBOR + 1.00%, 6.251%, 4/20/31 (1) | 250 | 246 |
| Symphony Static, Series 2021-1A, Class A, CLO, FRN, FRN, 3M USD LIBOR + 0.83%, 6.085%, 10/25/29 (1) | 207 | 204 |
| | | 450 |
| Equipment Lease Heavy Duty 0.6% | | |
| MMAF Equipment Finance, Series 2020-A, Class A3, 0.97%, 4/9/27 (1) | 246 | 230 |
| MMAF Equipment Finance, Series 2020-BA, Class A5, 0.85%, 4/14/42 (1) | 100 | 92 |
| | | 322 |
| Other Asset-Backed Securities 4.1% | | |
| ARI Fleet Lease Trust, Series 2021-A, Class A2, 0.37%, 3/15/30 (1) | 65 | 64 |
| Axis, Series 2022-1A, Class A2, 1.64%, 10/20/27 (1) | 128 | 123 |
| Axis, Series 2021-1A, Class A2, 0.75%, 11/20/26 | 35 | 34 |
| DLLAD, Series 2023-1A, Class A2, 5.19%, 4/20/26 (1) | 280 | 278 |
| Elara HGV Timeshare Issuer, Series 2017-A, Class A, 2.69%, 3/25/30 (1) | 14 | 14 |
| Hilton Grand Vacations Trust, Series 2017-AA, Class A, 2.66%, 12/26/28 (1) | 85 | 84 |
| MVW, Series 2021-1WA, Class A, 1.14%, 1/22/41 (1) | 52 | 47 |
| MVW, Series 2020-1A, Class A, 1.74%, 10/20/37 (1) | 98 | 90 |
T. ROWE PRICE ULTRA SHORT-TERM BOND ETF
| | Par/Shares | $ Value |
| (Amounts in 000s) | | |
| Navient Private Education Refi Loan Trust, Series 2021-CA, Class A, 1.06%, 10/15/69 (1) | 66 | 57 |
| Nelnet Student Loan Trust, Series 2021-DA, Class AFL, FRN, 1M USD LIBOR + 0.69%, 5.839%, 4/20/62 (1) | 68 | 66 |
| Octane Receivables Trust, Series 2021-1A, Class A, 0.93%, 3/22/27 (1) | 32 | 31 |
| Octane Receivables Trust, Series 2021-2A, Class A, 1.21%, 9/20/28 (1) | 89 | 85 |
| Octane Receivables Trust, Series 2022-1A, Class A2, 4.18%, 3/20/28 (1) | 63 | 62 |
| Octane Receivables Trust, Series 2022-2A, Class A, 5.11%, 2/22/28 (1) | 77 | 76 |
| Octane Receivables Trust, Series 2023-2A, Class A2, 5.88%, 6/20/31 (1) | 175 | 175 |
| Santander Bank Auto Credit-Linked Notes, Series 2022-A, Class B, 5.281%, 5/15/32 (1) | 250 | 245 |
| Santander Bank NA, Series 2021-1A, Class B, 1.833%, 12/15/31 (1) | 96 | 93 |
| Santander Bank NA, Series 2022-B, Class B, 5.721%, 8/16/32 (1) | 158 | 157 |
| Santander Retail Auto Lease Trust, Series 2020-A, Class B, 1.61%, 1/20/26 (1) | 180 | 170 |
| Sierra Timeshare Receivables Funding, Series 2020-2A, Class A, 1.33%, 7/20/37 (1) | 45 | 41 |
| Verizon Master Trust, Series 2021-1, Class B, 0.69%, 5/20/27 | 189 | 179 |
| Verizon Master Trust, Series 2023-2, Class A, 4.89%, 4/13/28 | 70 | 70 |
| | | 2,241 |
| Student Loan 0.8% | | |
| Navient Private Education Refi Loan Trust, Series 2019-A, Class A2I, 3.42%, 1/15/43 (1) | 86 | 83 |
| Navient Private Education Refi Loan Trust, Series 2020-HA, Class A, 1.31%, 1/15/69 (1) | 104 | 95 |
| Navient Private Education Refi Loan Trust, Series 2020-GA, Class A, 1.17%, 9/16/69 (1) | 79 | 71 |
| Navient Private Education Refi Loan Trust, Series 2020-FA, Class A, 1.22%, 7/15/69 (1) | 69 | 62 |
T. ROWE PRICE ULTRA SHORT-TERM BOND ETF
| | Par/Shares | $ Value |
| (Amounts in 000s) | | |
| Navient Private Education Refi Loan Trust, Series 2021-GA, Class A, 1.58%, 4/15/70 (1) | 81 | 70 |
| SMB Private Education Loan Trust, Series 2016-B, Class A2B, FRN, 1M USD LIBOR + 1.45%, 6.557%, 2/17/32 (1) | 48 | 48 |
| | | 429 |
Total Asset-Backed Securities
(Cost $8,677) | | 8,566 |
| CORPORATE BONDS 64.5% |
| Advertising 0.5% | | |
| WPP Finance, 3.75%, 9/19/24 | 300 | 291 |
| | | 291 |
| Airlines 0.7% | | |
| SMBC Aviation Capital Finance, 4.125%, 7/15/23 (1) | 200 | 199 |
| SMBC Aviation Capital Finance, 3.55%, 4/15/24 (1) | 200 | 196 |
| | | 395 |
| Automotive 3.3% | | |
| Daimler Trucks Finance North America, FRN, SOFR+ 0.75%, 5.671%, 12/13/24 (1) | 300 | 300 |
| Daimler Trucks Finance North America, 5.20%, 1/17/25 (1) | 150 | 149 |
| Hyundai Capital America, 1.80%, 10/15/25 (1) | 150 | 138 |
| Hyundai Capital America, 1.00%, 9/17/24 (1) | 210 | 197 |
| Hyundai Capital America, 5.50%, 3/30/26 (1) | 35 | 35 |
| LeasePlan, 2.875%, 10/24/24 (1) | 200 | 191 |
| Mercedes-Benz Finance North America, 4.95%, 3/30/25 (1) | 150 | 150 |
| Mercedes-Benz Finance North America, 4.80%, 3/30/26 (1) | 150 | 150 |
| Nissan Motor Acceptance, 3.875%, 9/21/23 (1) | 100 | 99 |
| Nissan Motor Acceptance, 1.125%, 9/16/24 (1) | 200 | 186 |
| Volkswagen Group of America Finance, FRN, TSFR + 0.95%, 5.814%, 6/7/24 (1) | 200 | 200 |
| | | 1,795 |
| Banking 17.0% | | |
| AIB Group, 4.75%, 10/12/23 (1) | 200 | 199 |
T. ROWE PRICE ULTRA SHORT-TERM BOND ETF
| | Par/Shares | $ Value |
| (Amounts in 000s) | | |
| Australia & New Zealand Banking Group, 4.50%, 3/19/24 (1) | 200 | 197 |
| Banco Santander, 5.147%, 8/18/25 | 200 | 197 |
| Bank of America, VR, 0.523%, 6/14/24 (2) | 150 | 149 |
| Bank of America, FRN, TSFR + 0.66%, 5.751%, 2/4/25 | 100 | 99 |
| Bank of America, VR, 4.827%, 7/22/26 (2) | 100 | 99 |
| Bank of America, VR, 5.08%, 1/20/27 (2) | 100 | 99 |
| Bank of Ireland Group, VR, 6.253%, 9/16/26 (1)(2) | 200 | 199 |
| Bank of Montreal, 5.30%, 6/5/26 (3) | 275 | 275 |
| Bank of Nova Scotia, FRN, TSFR + 0.38%, 5.448%, 7/31/24 | 125 | 124 |
| Banque Federative du Credit Mutuel, 4.935%, 1/26/26 (1) | 200 | 198 |
| Barclays, 4.375%, 9/11/24 | 200 | 195 |
| Barclays, VR, 5.304%, 8/9/26 (2) | 200 | 197 |
| BNP Paribas SA, 4.25%, 10/15/24 | 250 | 244 |
| BPCE SA, 5.70%, 10/22/23 (1) | 250 | 248 |
| BPCE SA, 2.375%, 1/14/25 (1) | 250 | 236 |
| Candian Imperial Bank of Commerce, FRN, SOFR+ 0.40%, 5.308%, 12/14/23 | 150 | 150 |
| Capital One Financial, 4.25%, 4/30/25 (4) | 80 | 77 |
| Capital One Financial, VR, 1.343%, 12/6/24 (2) | 200 | 194 |
| Capital One Financial, FRN, TSFR + 1.35%, 6.441%, 5/9/25 | 100 | 98 |
| Credit Agricole SA, 3.25%, 10/4/24 (1) | 250 | 242 |
| Credit Suisse Group, VR, 4.207%, 6/12/24 (1)(2) | 250 | 247 |
| Credit Suisse Group AG, 3.75%, 3/26/25 | 250 | 235 |
| Danske Bank, VR, 3.773%, 3/28/25 (1)(2) | 200 | 196 |
| Danske Bank , 3.875%, 9/12/23 (1) | 200 | 198 |
| Deutsche Bank, 3.70%, 5/30/24 | 100 | 97 |
| Deutsche Bank, VR, 2.222%, 9/18/24 (2) | 150 | 147 |
| Discover Bank, 2.45%, 9/12/24 | 250 | 236 |
| Goldman Sachs Group, FRN, SOFR+ 0.50%, 5.392%, 9/10/24 | 100 | 99 |
| Goldman Sachs Group, FRN, SOFR+ 0.70%, 5.751%, 1/24/25 | 300 | 298 |
| Goldman Sachs Group, FRN, SOFR+ 1.39%, 6.311%, 3/15/24 | 50 | 50 |
| Hana Bank, 4.625%, 10/24/23 | 250 | 249 |
| HSBC Holdings, 4.25%, 3/14/24 | 400 | 394 |
| ING Bank NV, 5.80%, 9/25/23 (1) | 200 | 199 |
T. ROWE PRICE ULTRA SHORT-TERM BOND ETF
| | Par/Shares | $ Value |
| (Amounts in 000s) | | |
| Intesa Sanpaolo, 5.25%, 1/12/24 | 400 | 397 |
| Mitsubishi UFJ Financial Group, VR, 5.063%, 9/12/25 (2) | 200 | 198 |
| Mitsubishi UFJ Financial Group, VR, 5.719%, 2/20/26 (2) | 200 | 200 |
| Morgan Stanley, VR, 5.05%, 1/28/27 (2) | 115 | 115 |
| NatWest Group, 6.10%, 6/10/23 | 100 | 100 |
| NatWest Group, VR, 5.847%, 3/2/27 (2) | 200 | 201 |
| Northern Trust Corp, 3.95%, 10/30/25 | 70 | 68 |
| PNC Bank NA, 3.875%, 4/10/25 | 250 | 239 |
| Santander U.K. Group Holdings, VR, 1.089%, 3/15/25 (2) | 200 | 191 |
| Siam Commercial Bank, 3.90%, 2/11/24 | 200 | 197 |
| Societe Generale, 5.00%, 1/17/24 (1) | 200 | 196 |
| Standard Chartered, 5.20%, 1/26/24 (1) | 200 | 198 |
| State Bank of India, 4.50%, 9/28/23 | 200 | 199 |
| Truist Financial, FRN, SOFR+ 0.40%, 5.287%, 6/9/25 | 245 | 236 |
| US Bancorp, 3.60%, 9/11/24 | 100 | 96 |
| US Bancorp, VR, 5.727%, 10/21/26 (2) | 140 | 139 |
| | | 9,331 |
| Broadcasting 0.4% | | |
| Interpublic Group, 4.20%, 4/15/24 (4) | 200 | 197 |
| | | 197 |
| Building & Real Estate 0.4% | | |
| EMG SUKUK, 4.564%, 6/18/24 | 200 | 198 |
| | | 198 |
| Cable Operators 0.6% | | |
| Charter Communications Operating, 4.908%, 7/23/25 | 260 | 256 |
| Cox Communications, 3.15%, 8/15/24 (1) | 100 | 97 |
| | | 353 |
| Chemicals 0.5% | | |
| Celanese US Holdings, 5.90%, 7/5/24 | 300 | 300 |
| | | 300 |
T. ROWE PRICE ULTRA SHORT-TERM BOND ETF
| | Par/Shares | $ Value |
| (Amounts in 000s) | | |
| Computer Service & Software 0.4% | | |
| Oracle Corp, 2.50%, 4/1/25 | 250 | 238 |
| | | 238 |
| Drugs 2.3% | | |
| AbbVie, 3.80%, 3/15/25 | 525 | 513 |
| Pfizer Investment Enterprises, 4.65%, 5/19/25 | 250 | 249 |
| Pfizer Investment Enterprises, 4.45%, 5/19/26 | 250 | 249 |
| Viatris, 1.65%, 6/22/25 | 265 | 245 |
| | | 1,256 |
| Electric Utilities 0.4% | | |
| Israel Electric, 5.00%, 11/12/24 | 200 | 198 |
| | | 198 |
| Energy 6.4% | | |
| DCP Midstream Operating, 5.375%, 7/15/25 | 475 | 470 |
| Devon Energy, 8.25%, 8/1/23 | 250 | 250 |
| Ecopetrol, 5.875%, 9/18/23 | 200 | 200 |
| EQT, 6.125%, 2/1/25 | 250 | 250 |
| Gray Oak Pipeline, 2.00%, 9/15/23 (1) | 325 | 321 |
| Kinder Morgan, 5.625%, 11/15/23 (1) | 350 | 348 |
| MPLX, 4.875%, 6/1/25 | 100 | 99 |
| Occidental Petroleum, 5.55%, 3/15/26 | 75 | 75 |
| Occidental Petroleum, 8.50%, 7/15/27 | 50 | 55 |
| Occidental Petroleum, 5.875%, 9/1/25 | 200 | 200 |
| Pioneer Natural Resources, 5.10%, 3/29/26 | 55 | 55 |
| Reliance Industries, 4.125%, 1/28/25 | 250 | 246 |
| Sabine Pass Liquefaction, 5.75%, 5/15/24 | 450 | 449 |
| Western Midstream Operating, 3.35%, 2/1/25 | 172 | 164 |
| Williams, 4.50%, 11/15/23 | 150 | 149 |
| Williams, 5.40%, 3/2/26 | 190 | 191 |
| | | 3,522 |
T. ROWE PRICE ULTRA SHORT-TERM BOND ETF
| | Par/Shares | $ Value |
| (Amounts in 000s) | | |
| Exploration & Production 0.7% | | |
| Eni, 4.00%, 9/12/23 (1) | 250 | 248 |
| Ovintiv, 5.65%, 5/15/25 | 120 | 119 |
| | | 367 |
| Financial 5.1% | | |
| AerCap Ireland Capital, 3.15%, 2/15/24 | 150 | 146 |
| Air Lease, 4.25%, 2/1/24 | 100 | 98 |
| Ally Financial, 5.125%, 9/30/24 | 100 | 97 |
| Ally Financial, 4.625%, 3/30/25 | 100 | 96 |
| Ally Financial, 3.875%, 5/21/24 | 100 | 97 |
| Fab Sukuk Co, 3.875%, 1/22/24 | 200 | 198 |
| General Motors Financial, 4.15%, 6/19/23 | 50 | 50 |
| General Motors Financial, FRN, SOFR + 0.76%, 5.641%, 3/8/24 | 190 | 189 |
| General Motors Financial, 6.05%, 10/10/25 | 150 | 151 |
| Global Payments, 3.75%, 6/1/23 | 200 | 200 |
| Indian Railway Finance, 3.73%, 3/29/24 | 200 | 197 |
| Jackson Financial, 1.125%, 11/22/23 | 350 | 343 |
| LSEGA Financing, 0.65%, 4/6/24 (1) | 400 | 382 |
| QNB Finance, 3.50%, 3/28/24 | 200 | 197 |
| Western Union, 4.25%, 6/9/23 | 100 | 100 |
| Western Union, 2.85%, 1/10/25 | 260 | 249 |
| | | 2,790 |
| Food/Tobacco 1.5% | | |
| BAT International Finance, 3.95%, 6/15/25 (1) | 300 | 290 |
| Imperial Brands Finance, 3.125%, 7/26/24 (1) | 200 | 193 |
| Imperial Brands Finance, 4.25%, 7/21/25 (1) | 200 | 193 |
| Reynolds American, 4.45%, 6/12/25 | 125 | 122 |
| | | 798 |
T. ROWE PRICE ULTRA SHORT-TERM BOND ETF
| | Par/Shares | $ Value |
| (Amounts in 000s) | | |
| Forest Products 0.4% | | |
| Celulosa Arauco Constitucion, 4.50%, 8/1/24 | 200 | 198 |
| | | 198 |
| Gas & Gas Transmission 0.2% | | |
| Kinder Morgan Energy, 4.25%, 9/1/24 | 100 | 98 |
| | | 98 |
| Health Care 2.3% | | |
| Baxter International, FRN, TSFR + 0.44%, 5.532%, 11/29/24 | 250 | 246 |
| HCA, 5.375%, 2/1/25 | 450 | 447 |
| PerkinElmer, 0.85%, 9/15/24 | 190 | 178 |
| PerkinElmer, 0.55%, 9/15/23 | 100 | 99 |
| Thermo Fisher Scientific, FRN, SOFRINDX + 0.53%, 5.563%, 10/18/24 | 85 | 85 |
| Utah Acquisition Sub, 3.95%, 6/15/26 | 220 | 209 |
| | | 1,264 |
| Information Technology 2.8% | | |
| Amphenol, 3.20%, 4/1/24 | 100 | 98 |
| Amphenol Corp, 4.75%, 3/30/26 | 35 | 35 |
| Baidu, 3.875%, 9/29/23 | 200 | 199 |
| Equifax, 3.95%, 6/15/23 | 200 | 200 |
| Marvell Technology, 4.20%, 6/22/23 | 265 | 265 |
| Microchip Technology, 4.333%, 6/1/23 | 100 | 100 |
| Microchip Technology, 0.972%, 2/15/24 | 250 | 241 |
| Micron Technology, 4.975%, 2/6/26 | 225 | 222 |
| NXP, 4.875%, 3/1/24 | 200 | 198 |
| | | 1,558 |
| Insurance 5.7% | | |
| Athene Global Funding, FRN, SOFRINDX + 0.72%, 5.723%, 1/7/25 (1) | 200 | 195 |
| Athene Global Funding, 1.20%, 10/13/23 (1) | 60 | 59 |
| Athene Global Funding, 2.514%, 3/8/24 (1) | 150 | 145 |
T. ROWE PRICE ULTRA SHORT-TERM BOND ETF
| | Par/Shares | $ Value |
| (Amounts in 000s) | | |
| Brighthouse Financial Global Funding, 1.00%, 4/12/24 (1) | 50 | 48 |
| Brighthouse Financial Global Funding, FRN, SOFR + 0.76%, 5.782%, 4/12/24 (1) | 245 | 242 |
| Brighthouse Financial Global Funding, 1.20%, 12/15/23 (1) | 150 | 146 |
| Brown & Brown, 4.20%, 9/15/24 | 150 | 147 |
| Cigna, FRN, 3M USD LIBOR + 0.89%, 6.15%, 7/15/23 | 250 | 250 |
| CNO Global Funding, 1.65%, 1/6/25 (1) | 400 | 373 |
| Corebridge Financial, 3.50%, 4/4/25 | 350 | 334 |
| Equitable Financial Life Global Funding, 1.40%, 7/7/25 (1) | 85 | 77 |
| Equitable Financial Life Global Funding, 5.50%, 12/2/25 (1) | 300 | 301 |
| First American Financial, 4.60%, 11/15/24 | 200 | 196 |
| Liberty Mutual Group, 4.25%, 6/15/23 (1) | 350 | 350 |
| Principal Financial Group, 3.40%, 5/15/25 | 250 | 240 |
| | | 3,103 |
| Investment Dealers 0.1% | | |
| Ameriprise Financial, 3.00%, 4/2/25 | 35 | 33 |
| | | 33 |
| Media & Communications 0.7% | | |
| Warnermedia Holdings, 3.638%, 3/15/25 | 289 | 279 |
| Warnermedia Holdings, 3.528%, 3/15/24 | 30 | 29 |
| Warnermedia Holdings, 3.428%, 3/15/24 | 10 | 10 |
| Warnermedia Holdings, FRN, SOFRINDX + 1.78%, 6.665%, 3/15/24 | 75 | 75 |
| | | 393 |
| Media & Entertainment 0.5% | | |
| Take-Two Interactive Software, 5.00%, 3/28/26 | 250 | 250 |
| | | 250 |
| Oil Field Services 0.6% | | |
| Energy Transfer, 5.875%, 1/15/24 | 250 | 249 |
| Energy Transfer, 4.50%, 4/15/24 | 100 | 99 |
| | | 348 |
T. ROWE PRICE ULTRA SHORT-TERM BOND ETF
| | Par/Shares | $ Value |
| (Amounts in 000s) | | |
| Other Telecommunications 0.7% | | |
| British Telecommunications, 4.50%, 12/4/23 | 400 | 397 |
| | | 397 |
| Petroleum 1.0% | | |
| Aker BP, 3.00%, 1/15/25 (1) | 300 | 286 |
| Enbridge, FRN, SOFRINDX+ 0.63%, 5.722%, 2/16/24 | 250 | 250 |
| | | 536 |
| Real Estate Investment Trust Securities 1.6% | | |
| Brixmor Operating Partnership, 3.65%, 6/15/24 | 220 | 213 |
| Public Storage, FRN, SOFR + 0.47%, 5.521%, 4/23/24 | 65 | 65 |
| Scentre Group Trust, 3.50%, 2/12/25 (1) | 450 | 434 |
| WP Carey, 4.60%, 4/1/24 | 200 | 195 |
| | | 907 |
| Retail 0.6% | | |
| 7-Eleven, 0.80%, 2/10/24 (1) | 95 | 92 |
| Advance Auto Parts, 5.90%, 3/9/26 | 40 | 40 |
| Nordstrom, 2.30%, 4/8/24 | 85 | 81 |
| QVC, 4.85%, 4/1/24 | 100 | 95 |
| | | 308 |
| Transportation 0.9% | | |
| Penske Truck Leasing, 3.45%, 7/1/24 (1) | 200 | 194 |
| Penske Truck Leasing, 2.70%, 11/1/24 (1) | 100 | 96 |
| Penske Truck Leasing, 3.95%, 3/10/25 (1) | 100 | 97 |
| Triton Container International, 0.80%, 8/1/23 (1) | 100 | 98 |
| | | 485 |
| Transportation Service 0.3% | | |
| HPHT Finance, 2.875%, 11/5/24 | 200 | 193 |
| | | 193 |
T. ROWE PRICE ULTRA SHORT-TERM BOND ETF
| | Par/Shares | $ Value |
| (Amounts in 000s) | | |
| Utilities 4.4% | | |
| American Electric Power, 5.699%, 8/15/25 | 160 | 146 |
| Constellation Energy Generation, 3.25%, 6/1/25 | 400 | 383 |
| Enel Finance International NV, 6.80%, 10/14/25 (1) | 200 | 205 |
| NextEra Energy Capital Holdings, FRN, SOFRINDX + 0.40%, 5.482%, 11/3/23 | 200 | 200 |
| NextEra Energy Capital Holdings, 6.051%, 3/1/25 | 200 | 202 |
| NRG Energy, 3.75%, 6/15/24 (1) | 200 | 194 |
| Pacific Gas and Electric, 4.25%, 8/1/23 | 110 | 110 |
| Pacific Gas and Electric, 1.70%, 11/15/23 | 150 | 147 |
| Pacific Gas and Electric, 4.95%, 6/8/25 | 100 | 98 |
| Southern, 4.475%, 8/1/24 | 245 | 241 |
| Southern California Edison, FRN, SOFRINDX + 0.83%, 5.824%, 4/1/24 | 25 | 25 |
| Spectra Energy Partners, 4.75%, 3/15/24 | 100 | 99 |
| Vistra Operations, 3.55%, 7/15/24 (1) | 345 | 333 |
| Vistra Operations, 5.125%, 5/13/25 (1) | 35 | 34 |
| | | 2,417 |
| Wireless Communications 1.5% | | |
| Rogers Communications, 2.95%, 3/15/25 (1) | 475 | 453 |
| Sprint, 7.125%, 6/15/24 | 350 | 353 |
| | | 806 |
Total Corporate Bonds
(Cost $35,706) | | 35,323 |
| FOREIGN GOVERNMENT OBLIGATIONS & MUNICIPALITIES 0.8% |
| Foreign Govt & Muni (Excl Canadian) 0.8% | | |
| Japan Treasury Discount Bill, (0.202)%, 8/14/23 (JPY) | 36,050 | 259 |
| Korea Hydro & Nuclear, 3.75%, 7/25/23 | 200 | 199 |
| | | 458 |
Total Foreign Government Obligations & Municipalities
(Cost $466) | | 458 |
T. ROWE PRICE ULTRA SHORT-TERM BOND ETF
| | Par/Shares | $ Value |
| (Amounts in 000s) | | |
| MUNICIPAL SECURITIES 0.2% |
| California 0.2% | | |
| Golden St Tobacco Securitization, Series B, 0.672%, 6/1/23 | 100 | 100 |
| | | 100 |
Total Municipal Securities
(Cost $100) | | 100 |
| NON-U.S. GOVERNMENT MORTGAGE-BACKED SECURITIES 6.9% |
| Commercial Mortgage-Backed Securities 0.7% | | |
| BX Trust, Series 2021-ARIA, Class A, ARM, 1M USD LIBOR + 0.90%, 6.006%, 10/15/36 (1) | 65 | 63 |
| Great Wolf Trust, Series 2019-WOLF, Class A, ARM, 1M TSFR +1.15%, 6.208%, 12/15/36 (1) | 225 | 222 |
| ONE Mortgage Trust, Series 2021-PARK, Class A, ARM, 1M TSFR + 0.81%, 5.873%, 3/15/36 (1) | 115 | 108 |
| | | 393 |
| Whole Loans Backed 6.2% | | |
| Angel Oak Mortgage Trust, Series 2019-5, Class A1, CMO, ARM, 2.593%, 10/25/49 (1) | 64 | 61 |
| Angel Oak Mortgage Trust, Series 2021-2, Class A1, CMO, ARM, 0.985%, 4/25/66 (1) | 100 | 83 |
| Angel Oak Mortgage Trust, Series 2021-5, Class A1, CMO, ARM, 0.951%, 7/25/66 (1) | 128 | 105 |
| Angel Oak Mortgage Trust, Series 2022-1, Class A1, CMO, ARM, 2.881%, 12/25/66 (1) | 102 | 89 |
| Bellemeade Re, Series 2022-1, Class M1A, CMO, ARM, SOFR30A + 1.75%, 6.723%, 1/26/32 (1) | 150 | 150 |
| BINOM Securitization Trust, Series 2021-INV1, Class A1, CMO, ARM, 2.034%, 6/25/56 (1) | 72 | 62 |
| COLT Funding, Series 2021-4, Class A1, CMO, ARM, 1.397%, 10/25/66 (1) | 82 | 65 |
| Connecticut Avenue Securities Trust, Series 2021-R01, Class 1M1, CMO, ARM, SOFR30A + 0.75%, 5.723%, 10/25/41 (1) | 3 | 3 |
| Connecticut Avenue Securities Trust, Series 2021-R03, Class 1M1, CMO, ARM, SOFR30A + 0.85%, 5.823%, 12/25/41 (1) | 67 | 67 |
T. ROWE PRICE ULTRA SHORT-TERM BOND ETF
| | Par/Shares | $ Value |
| (Amounts in 000s) | | |
| Connecticut Avenue Securities Trust, Series 2023-R02, Class 1M1, CMO, ARM, SOFR30A + 2.30%, 7.273%, 1/25/43 (1) | 168 | 169 |
| Connecticut Avenue Securities Trust, Series 2023-R01, Class 1M1, CMO, ARM, SOFR30A + 2.40%, 7.381%, 12/25/42 (1) | 237 | 238 |
| Eagle RE, Series 2021-2, Class M1A, CMO, ARM, SOFR30A + 1.55%, 6.523%, 4/25/34 (1) | 92 | 92 |
| Ellington Financial Mortgage Trust, Series 2023-1, Class A1, CMO, ARM, 5.732%, 2/25/68 (1) | 180 | 179 |
| Freddie Mac STACR REMIC Trust, Series 2022-DNA1, Class M1A, CMO, ARM, SOFR30A + 1.00%, 5.973%, 1/25/42 (1) | 165 | 162 |
| Freddie Mac STACR REMIC Trust, Series 2022-DNA2, Class M1A, CMO, ARM, SOFR30A + 1.30%, 6.273%, 2/25/42 (1) | 230 | 229 |
| Freddie Mac STACR REMIC Trust, Series 2022-DNA5, Class M1A, CMO, ARM, SOFR30A + 2.95%, 7.923%, 6/25/42 (1) | 229 | 232 |
| OBX Trust, Series 2022-NQM1, Class A1, CMO, ARM, 2.305%, 11/25/61 (1) | 164 | 139 |
| Verus Securitization Trust, Series 2019-INV3, Class A1, CMO, ARM, 2.692%, 11/25/59 (1) | 113 | 108 |
| Verus Securitization Trust, Series 2021-R3, Class A1, CMO, ARM, 1.02%, 4/25/64 (1) | 82 | 72 |
| Verus Securitization Trust, Series 2021-2, Class A1, CMO, ARM, 1.031%, 2/25/66 (1) | 107 | 92 |
| Verus Securitization Trust, Series 2021-4, Class A1, CMO, ARM, 0.938%, 7/25/66 (1) | 105 | 84 |
| Verus Securitization Trust, Series 2021-5, Class A1, CMO, ARM, 1.013%, 9/25/66 (1) | 144 | 117 |
| Verus Securitization Trust, Series 2023-INV1, Class A1, CMO, ARM, 5.999%, 2/25/68 (1) | 144 | 144 |
| Verus Securitization Trust, Series 2023-3, Class A1, CMO, ARM, 5.93%, 3/25/68 (1) | 329 | 329 |
| Verus Securitization Trust, Series 2021-3, Class A1, CMO, ARM, 1.046%, 6/25/66 (1) | 296 | 246 |
T. ROWE PRICE ULTRA SHORT-TERM BOND ETF
| | Par/Shares | $ Value |
| (Amounts in 000s) | | |
| Vista Point Securitization Trust, Series 2020-2, Class A1, CMO, ARM, 1.475%, 4/25/65 (1) | 80 | 71 |
| | | 3,388 |
Total Non-U.S. Government Mortgage-Backed Securities
(Cost $3,998) | | 3,781 |
| U.S. GOVERNMENT AGENCY OBLIGATIONS (EXCLUDING MORTGAGE-BACKED) 2.2% |
| U.S. Treasury Obligations 2.2% | | |
| U. S Treasury Bill, 4.695%, 1/25/24 (5) | 480 | 465 |
| U.S. Treasury Bill, 5.43%, 11/9/23 | 565 | 551 |
| U.S. Treasury Notes, 3.875%, 3/31/25 | 200 | 198 |
| | | 1,214 |
Total U.S. Government Agency Obligations (Excluding Mortgage-Backed)
(Cost $1,216) | | 1,214 |
| SHORT-TERM INVESTMENTS 10.5% |
| Commercial Paper 10.5% | | |
| Arrow Electronics, 5.82%,6/15/23 (6) | 400 | 399 |
| Bacardi-Martini BV, 5.782%,6/21/23 (6) | 400 | 399 |
| Canadian Natural Resources, 5.926%,6/26/23 (6) | 450 | 448 |
| Crown Castle, 5.968%,6/20/23 (6) | 400 | 399 |
| CVS Health, 5.261%,6/1/23 (6) | 600 | 600 |
| Energy Transfer, 5.752%,6/1/23 (6) | 300 | 300 |
| International Flavors & Fragrances, 5.966%,6/2/23 (6) | 450 | 450 |
| Motorola Solutions, 5.765%,6/5/23 | 450 | 450 |
| Paramount Global, 5.781%,6/22/23 (6) | 350 | 349 |
| Quanta Services, 5.851%,6/1/23 | 350 | 350 |
| Quanta Services, 5.86%,6/2/23 | 400 | 400 |
| Syngenta Wilmington, 5.977%,6/20/23 (6) | 425 | 423 |
| Targa Resources, 5.978%,6/23/23 (6) | 400 | 399 |
| Walgreens Boots Alliance, 5.92%,6/22/23 (6) | 400 | 398 |
| | | 5,764 |
T. ROWE PRICE ULTRA SHORT-TERM BOND ETF
| | Par/Shares | $ Value |
| (Amounts in 000s) | | |
| Money Market Funds 0.0% | | |
| T. Rowe Price Government Reserve Fund, 5.11%(7)(8) | 1 | 1 |
Total Short-Term Investments
(Cost $5,765) | | 5,765 |
| SECURITIES LENDING COLLATERAL 0.2% |
| Investments in a Pooled Account through Securities Lending Program with State Street Bank 0.2% | | |
| Money Market Funds 0.2% | | |
| T. Rowe Price Government Reserve Fund, 5.11% (7)(8) | 85 | 85 |
| Total Investments in a Pooled Account through Securities Lending Program with State Street Bank | | 85 |
Total Securities Lending Collateral
(Cost $85) | | 85 |
T. ROWE PRICE ULTRA SHORT-TERM BOND ETF
(Amount in 000s, except for contracts)
| Options Purchased 0.0% |
| Exchange-Traded Options Purchased 0.0% |
| Description | Contracts | Notional
Amount | $ Value |
| U.S. Treasury two year futures contracts, Call, 06/23/23 @ $103.50 (9) | 10 | 1,029 | 1 |
| Total Options Purchased (Cost $2) | | $1 |
Total Investments in Securities
101.0% of Net Assets (Cost $56,015) | | $55,293 |
| ‡ | Par/Shares and Notional Amount are denominated in U.S. dollars unless otherwise noted. |
| (1) | Security was purchased pursuant to Rule 144A under the Securities Act of 1933 and may be resold in transactions exempt from registration only to qualified institutional buyers. Total value of such securities at period-end amounts to $21,097 and represents 38.5% of net assets. |
| (2) | Security is a fix-to-float security, which carries a fixed coupon until a certain date, upon which it switches to a floating rate. Reference rate and spread are provided if the rate is currently floating. |
| (3) | When-issued security. |
| (4) | All or a portion of this security is on loan at May 31, 2023. See Note 4. |
| (5) | At May 31, 2023, all or a portion of this security is pledged as collateral and/or margin deposit to cover future funding obligations. |
| (6) | Commercial paper exempt from registration under Section 4(2) of the Securities Act of 1933 and may be resold in transactions exempt from registration only to dealers in that program or other "accredited investors" -- total value of such securities at period-end amounts to $4,564 and represents 8.3% of net assets. |
| (7) | Seven-day yield |
| (8) | Affiliated Companies |
| (9) | Non-income producing. |
| 1M USD LIBOR | One month USD LIBOR (London interbank offered rate) |
| 1M TSFR | One month term SOFR (Secured overnight financing rate) |
| 3M USD LIBOR | Three month USD LIBOR (London interbank offered rate) |
| ARM | Adjustable Rate Mortgage (ARM); rate shown is effective rate at period-end. The rates for certain ARMs are not based on a published reference rate and spread but may be determined using a formula based on the rates of the underlying loans. |
| CLO | Collateralized Loan Obligation |
| CMO | Collateralized Mortgage Obligation |
T. ROWE PRICE ULTRA SHORT-TERM BOND ETF
| FRN | Floating Rate Note |
| JPY | Japanese Yen |
| SOFR | Secured overnight financing rate |
| SOFR30A | 30-day Average term SOFR (Secured Overnight Financing Rate) |
| SOFRINDX | SOFR (Secured overnight financing rate) Index |
| TSFR | Term SOFR (Secured Overnight Financing Rate) |
| USD | U.S. Dollar |
| VR | Variable Rate; rate shown is effective rate at period-end. The rates for certain variable rate securities are not based on a published reference rate and spread but are determined by the issuer or agent and based on current market conditions. |
T. ROWE PRICE ULTRA SHORT-TERM BOND ETF
(Amounts in 000s, except for contracts)
| OPTIONS WRITTEN 0.0% |
| Exchange-Traded Options Written 0.0% |
| Description | Contracts | Notional
Amount | $ Value |
| U.S. Treasury two year futures contracts, Call, 06/23/23 @ $105.30 | 12 | 1,235 | — |
| U.S. Treasury two year futures contracts, Put, 06/23/23 @ $102.80 | 12 | 1,235 | (4) |
| U.S. Treasury two year futures contracts, Put, 06/23/23 @ $101.30 | 18 | 1,852 | (1) |
| Total Exchange-Traded Options Written (Premiums $(2)) | (5) |
T. ROWE PRICE ULTRA SHORT-TERM BOND ETF
| Description | Notional
Amount | $ Value | Upfront
Payments/
$ (Receipts) | Unrealized
$ Gain/(Loss) |
| BILATERAL SWAPS 0.0% |
| Credit Default Swaps, Protection Sold 0.0% |
| Barclays Bank, Protection Sold (Relevant Credit: AT&T, Baa2*), Receive 1.00% Quarterly, Pay upon credit default 06/20/23 | 125 | — | — | — |
| Total Bilateral Swaps | | — | — |
| Description | Notional
Amount | $ Value | Initial
$ Value | Unrealized
$ Gain/(Loss) |
| CENTRALLY CLEARED SWAPS 0.0% |
| Credit Default Swaps, Protection Sold 0.0% |
| Protection Sold (Relevant Credit: AT&T, Baa2*), Receive 1.00% Quarterly, Pay upon credit default 12/20/23 | 125 | — | — | — |
| Protection Sold (Relevant Credit: Citigroup, A3*), Receive 1.00% Quarterly, Pay upon credit default 12/20/23 | 60 | — | — | — |
| Protection Sold (Relevant Credit: Bank of America, A1*), Receive 1.00% Quarterly, Pay upon credit default 12/20/23 | 60 | — | — | — |
T. ROWE PRICE ULTRA SHORT-TERM BOND ETF
| Description | Notional
Amount | $ Value | Initial
$ Value | Unrealized
$ Gain/(Loss) |
| Protection Sold (Relevant Credit: Verizon Communications, Baa1*), Receive 1.00% Quarterly, Pay upon credit default 12/20/23 | 125 | 1 | 1 | — |
| Protection Sold (Relevant Credit: T-Mobile USA, Baa2*), Receive 5.00% Quarterly, Pay upon credit default 6/20/23 | 100 | — | — | — |
| Protection Sold (Relevant Credit: Lennar, Baa2*), Receive 5.00% Quarterly, Pay upon credit default 6/20/23 | 100 | — | — | — |
| Protection Sold (Relevant Credit: Devon Energy, Baa2*), Receive 1.00% Quarterly, Pay upon credit default 6/20/23 | 100 | — | — | — |
| Protection Sold (Relevant Credit: Freeport-McMoran, BBB*), Receive 1.00% Quarterly, Pay upon credit default 6/20/24 | 200 | 1 | — | 1 |
| Protection Sold (Relevant Credit: Hess, Baa3*), Receive 1.00% Quarterly, Pay upon credit default 6/20/24 | 100 | 1 | 1 | — |
T. ROWE PRICE ULTRA SHORT-TERM BOND ETF
| Description | Notional
Amount | $ Value | Initial
$ Value | Unrealized
$ Gain/(Loss) |
| Protection Sold (Relevant Credit: Devon Energy, Baa2*), Receive 1.00% Quarterly, Pay upon credit default 6/20/24 | 100 | 1 | 1 | — |
| Total Centrally Cleared Credit Default Swaps, Protection Sold | 1 |
| Net payments (receipts) of variation margin to date | $(1) |
| Variation margin receivable (payable) on centrally cleared swaps | $ — |
| * | Credit ratings as of May 31, 2023. Ratings shown are from Moody’s Investors Service and if Moody’s does not rate a security, then Standard & Poor’s (S&P) is used. Fitch is used for securities that are not rated by either Moody’s or S&P. |
T. ROWE PRICE ULTRA SHORT-TERM BOND ETF
| FORWARD CURRENCY EXCHANGE CONTRACTS |
| Counterparty | Settlement | Receive | | Deliver | | Unrealized
Gain/(Loss) |
| Bank of America, N.A. | 8/14/23 | USD | 272 | JPY | 36,050 | $10 |
Net unrealized gain (loss) on open forward
currency exchange contracts | $10 |
T. ROWE PRICE ULTRA SHORT-TERM BOND ETF
| | Expiration
Date | Notional
Amount | Value and
Unrealized
Gain (Loss) |
| Short, 13 U.S. Treasury Notes five year contracts | 09/23 | (1,419) | $ 1 |
| Short, 3 U.S. Treasury Notes ten year contracts | 09/23 | (343) | (1) |
| Short, 25 U.S. Treasury Notes two year contracts | 09/23 | (5,156) | 11 |
| Short, 1 Ultra U.S. Treasury Notes ten year contracts | 09/23 | (120) | (1) |
| Net payments (receipts) of variation margin to date | (30) |
| Variation margin receivable (payable) on open futures contracts | $(20) |
T. ROWE PRICE ULTRA SHORT-TERM BOND ETF
AFFILIATED COMPANIES
($000s)
The fund may invest in certain securities that are considered affiliated companies. As defined by the 1940 Act, an affiliated company is one in which the fund owns 5% or more of the outstanding voting securities, or a company that is under common ownership or control. The following securities were considered affiliated companies for all or some portion of the year ended May 31, 2023. Net realized gain (loss), investment income, change in net unrealized gain/loss, and purchase and sales cost reflect all activity for the period then ended.
| Affiliate | Net Realized Gain
(Loss) | Changes in Net
Unrealized
Gain/Loss | Investment
Income |
| T. Rowe Price Government Reserve Fund | $ — | $— | $2++ |
| Totals | $—# | $— | $ 2+ |
| Supplementary Investment Schedule |
| Affiliate | Value
5/31/22 | Purchase
Cost | Sales
Cost | Value
5/31/23 |
| T. Rowe Price Government Reserve Fund | $1,170 | ¤ | ¤ | $ 86 |
| | Total | | | $86^ |
| ++ | Excludes earnings on securities lending collateral, which are subject to rebates and fees as described in Note 4. |
| # | Capital gain distributions from mutual funds represented $0 of the net realized gain (loss). |
| + | Investment income comprised $2 of dividend income and $0 of interest income. |
| ¤ | Purchase and sale information not shown for cash management funds. |
| ^ | The cost basis of investments in affiliated companies was $86. |
The accompanying notes are an integral part of these financial statements.
T. ROWE PRICE ULTRA SHORT-TERM BOND ETF
May 31, 2023
STATEMENT OF ASSETS AND LIABILITIES
($000s, except shares and per share amounts)
| Assets | |
| Investments in securities, at value (cost $56,015) | $ 55,293 |
| Receivable for investment securities sold | 1,202 |
| Interest and dividends receivable | 402 |
| Unrealized gain on forward currency exchange contracts | 10 |
| Total assets | 56,907 |
| Liabilities | |
| Payable for investment securities purchased | 1,900 |
| Due to custodian | 134 |
| Obligation to return securities lending collateral | 85 |
| Variation margin payable on futures contracts | 20 |
| Investment management and administrative fees payable | 8 |
| Options written (premiums $2) | 5 |
| Total liabilities | 2,152 |
| NET ASSETS | $ 54,755 |
| Net assets consists of: | |
| Total distributable earnings (loss) | $ (877) |
Paid-in capital applicable to 1,125,000 shares of $0.0001 par value
capital stock outstanding; 4,000,000,000 shares authorized | 55,632 |
| NET ASSETS | $54,755 |
| NET ASSET VALUE PER SHARE | $ 48.67 |
The accompanying notes are an integral part of these financial statements.
T. ROWE PRICE ULTRA SHORT-TERM BOND ETF
STATEMENT OF OPERATIONS
($000s)
| | Year Ended |
| | 5/31/23 |
| Investment Income (Loss) | |
| Income | |
| Interest | $ 1,763 |
| Dividend | 2 |
| Total income | 1,765 |
| Investment management and administrative expense | 85 |
| Net investment income | 1,680 |
| Realized and Unrealized Gain / Loss | |
| Net realized gain (loss) | |
| Securities | (369) |
| Futures | 252 |
| Swaps | 8 |
| Options written | 1 |
| Forward currency exchange contracts | 85 |
| Foreign currency transactions | (2) |
| Net realized loss | (25) |
| Change in net unrealized gain / loss | |
| Securities | 3 |
| Futures | 11 |
| Swaps | 2 |
| Options written | (3) |
| Forward currency exchange contracts | (20) |
| Change in unrealized gain / loss | (7) |
| Net realized and unrealized gain / loss | (32) |
| INCREASE IN NET ASSETS FROM OPERATIONS | $1,648 |
The accompanying notes are an integral part of these financial statements.
T. ROWE PRICE ULTRA SHORT-TERM BOND ETF
STATEMENT OF CHANGES IN NET ASSETS
($000s)
| | Year
Ended | | 9/28/21
Through |
| | 5/31/23 | | 5/31/22 |
| Increase (Decrease) in Net Assets | | | |
| Operations | | | |
| Net investment income | $ 1,680 | | $ 177 |
| Net realized gain (loss) | (25) | | 138 |
| Change in net unrealized gain / loss | (7) | | (697) |
| Increase (Decrease) in net assets from operations | 1,648 | | (382) |
| Distributions to shareholders | | | |
| Net earnings | (1,976) | | (174) |
| Capital share transactions* | | | |
| Shares sold | 26,775 | | 37,357 |
| Shares redeemed | (8,493) | | — |
| Increase in net assets from capital share transactions | 18,282 | | 37,357 |
| Net Assets | | | |
| Increase during period | 17,954 | | 36,801 |
| Beginning of period | 36,801 | | - |
| End of period | $54,755 | | $36,801 |
| *Share information | | | |
| Shares sold | 550 | | 750 |
| Shares redeemed | (175) | | — |
| Increase in shares outstanding | 375 | | 750 |
The accompanying notes are an integral part of these financial statements.
T. ROWE PRICE ULTRA SHORT-TERM BOND ETF
NOTES TO FINANCIAL STATEMENTS
T. Rowe Price Exchange-Traded Funds, Inc. (the corporation) is registered under the Investment Company Act of 1940 (the 1940 Act). The Ultra Short-Term Bond ETF (the fund) is a diversified, open-end management investment company established by the corporation. The fund incepted on September 28, 2021. The fund seeks a high level of income consistent with low volatility of principal value.
NOTE 1 – SIGNIFICANT ACCOUNTING POLICIES
Basis of Preparation
The fund is an investment company and follows accounting and reporting guidance in the Financial Accounting Standards Board (FASB) Accounting Standards Codification Topic 946 (ASC 946). The accompanying financial statements were prepared in accordance with accounting principles generally accepted in the United States of America (GAAP), including, but not limited to, ASC 946. GAAP requires the use of estimates made by management. Management believes that estimates and valuations are appropriate; however, actual results may differ from those estimates, and the valuations reflected in the accompanying financial statements may differ from the value ultimately realized upon sale or maturity.
Investment Transactions, Investment Income, and Distributions
Investment transactions are accounted for on the trade date basis. Income and expenses are recorded on the accrual basis. Realized gains and losses are reported on the identified cost basis. Premiums and discounts on debt securities are amortized for financial reporting purposes. Paydown gains and losses are recorded as an adjustment to interest income. Income tax-related interest and penalties, if incurred, are recorded as income tax expense. Dividends received from other investment companies are reflected as dividend income; capital gain distributions are reflected as realized gain/loss. Dividend income and capital gain distributions are recorded on the ex-dividend date. Non-cash dividends, if any, are recorded at the fair market value of the asset received. Distributions to shareholders are recorded on the ex-dividend date. Income distributions, if any, are declared and paid monthly. A capital gain distribution, if any, may also be declared and paid by the fund annually. Dividends and distributions cannot be automatically reinvested in additional shares of the fund.
T. ROWE PRICE ULTRA SHORT-TERM BOND ETF
Currency Translation
Assets, including investments, and liabilities denominated in foreign currencies are translated into U.S. dollar values each day at the prevailing exchange rate, using the mean of the bid and asked prices of such currencies against U.S. dollars as provided by an outside pricing service. Purchases and sales of securities, income, and expenses are translated into U.S. dollars at the prevailing exchange rate on the respective date of such transaction. The effect of changes in foreign currency exchange rates on realized and unrealized security gains and losses is not bifurcated from the portion attributable to changes in market prices.
Capital Transactions
The fund issues and redeems shares at its net asset value (NAV) only with Authorized Participants and only in large blocks of 25,000 shares (each, a “Creation Unit”). The fund’s NAV per share is computed at the close of the New York Stock Exchange (NYSE). However, the NAV per share may be calculated at a time other than the normal close of the NYSE if trading on the NYSE is restricted, if the NYSE closes earlier, or as may be permitted by the SEC. Individual fund shares may not be purchased or redeemed directly with the fund. An Authorized Participant may purchase or redeem a Creation Unit of the fund each business day that the fund is open in exchange for the delivery of a designated portfolio of in-kind securities and/or cash. When purchasing or redeeming Creation Units, Authorized Participants are also required to pay a fixed and/or variable purchase or redemption transaction fee as well as any applicable additional variable charge to defray the transaction cost to a fund.
Individual fund shares may be purchased and sold only on a national securities exchange through brokers. Shares are listed for trading on NYSE Arca, Inc. (NYSE Arca) and because the shares will trade at market prices rather than NAV, shares may trade at prices greater than NAV (at a premium), at NAV, or less than NAV (at a discount). The fund’s shares are ordinarily valued as of the close of regular trading (normally 4:00 p.m. Eastern time) on each day that the NYSE Arca is open.
New Accounting Guidance
The FASB issued Accounting Standards Update (ASU), ASU 2020-04, Reference Rate Reform (Topic 848) – Facilitation of the Effects of Reference Rate Reform on Financial Reporting in March 2020 and ASU 2021-01 in January 2021 which provided further amendments and clarifications to Topic 848. These ASUs provide optional, temporary relief with respect to the financial reporting of contracts subject to certain types of modifications due to the planned discontinuation of the London Interbank Offered Rate (LIBOR), and other interbank-offered based reference rates, through December 31, 2022. In December 2022, FASB issued ASU 2022-06 which defers the sunset date of Topic 848 from December 31, 2022 to December 31, 2024, after which entities will no longer be
T. ROWE PRICE ULTRA SHORT-TERM BOND ETF
permitted to apply the relief in Topic 848. Management intends to rely upon the relief provided under Topic 848, which is not expected to have a material impact on the fund’s financial statements.
Indemnification
In the normal course of business, the fund may provide indemnification in connection with its officers and directors, service providers, and/or private company investments. The fund’s maximum exposure under these arrangements is unknown; however, the risk of material loss is currently considered to be remote.
NOTE 2 – VALUATION
Fair Value
The fund’s financial instruments are valued at the close of the NYSE and are reported at fair value, which GAAP defines as the price that would be received to sell an asset or paid to transfer a liability in an orderly transaction between market participants at the measurement date. The fund’s Board of Directors (the Board) has designated T. Rowe Price Associates, Inc. as the fund’s valuation designee (Valuation Designee). Subject to oversight by the Board, the Valuation Designee performs the following functions in performing fair value determinations: assesses and manages valuation risks; establishes and applies fair value methodologies; tests fair value methodologies; and evaluates pricing vendors and pricing agents. The duties and responsibilities of the Valuation Designee are performed by its Valuation Committee. The Valuation Designee provides periodic reporting to the Board on valuation matters.
Various valuation techniques and inputs are used to determine the fair value of financial instruments. GAAP establishes the following fair value hierarchy that categorizes the inputs used to measure fair value:
Level 1 – quoted prices (unadjusted) in active markets for identical financial instruments that the fund can access at the reporting date
Level 2 – inputs other than Level 1 quoted prices that are observable, either directly or indirectly (including, but not limited to, quoted prices for similar financial instruments in active markets, quoted prices for identical or similar financial instruments in inactive markets, interest rates and yield curves, implied volatilities, and credit spreads)
Level 3 – unobservable inputs (including the Valuation Designee’s assumptions in determining fair value)
T. ROWE PRICE ULTRA SHORT-TERM BOND ETF
Observable inputs are developed using market data, such as publicly available information about actual events or transactions, and reflect the assumptions that market participants would use to price the financial instrument. Unobservable inputs are those for which market data are not available and are developed using the best information available about the assumptions that market participants would use to price the financial instrument. GAAP requires valuation techniques to maximize the use of relevant observable inputs and minimize the use of unobservable inputs. When multiple inputs are used to derive fair value, the financial instrument is assigned to the level within the fair value hierarchy based on the lowest-level input that is significant to the fair value of the financial instrument. Input levels are not necessarily an indication of the risk or liquidity associated with financial instruments at that level but rather the degree of judgment used in determining those values.
Valuation Techniques
Debt securities generally are traded in the over-the-counter (OTC) market and are valued at prices furnished by independent pricing services or by broker dealers who make markets in such securities. When valuing securities, the independent pricing services consider factors such as, but not limited to, the yield or price of bonds of comparable quality, coupon, maturity, and type, as well as prices quoted by dealers who make markets in such securities.
Investments in mutual funds are valued at the mutual fund’s closing NAV per share on the day of valuation. Listed options, and OTC options with a listed equivalent, are valued at the mean of the closing bid and asked prices and exchange-traded options on futures contracts are valued at closing settlement prices. Swaps are valued at prices furnished by an independent pricing service or independent swap dealers. Forward currency exchange contracts are valued using the prevailing forward exchange rate. Futures contracts are valued at closing settlement prices. Assets and liabilities other than financial instruments, including short-term receivables and payables, are carried at cost, or estimated realizable value, if less, which approximates fair value.
Investments for which market quotations are not readily available or deemed unreliable are valued at fair value as determined in good faith by the Valuation Designee. The Valuation Designee has adopted methodologies for determining the fair value of investments for which market quotations are not readily available or deemed unreliable, including the use of other pricing sources. Factors used in determining fair value vary by type of investment and may include market or investment specific considerations. The Valuation Designee typically will afford greatest weight to actual prices in arm’s length transactions, to the extent they represent orderly transactions between market participants, transaction information can be reliably obtained, and prices are deemed representative of fair value. However, the Valuation Designee may also consider other valuation methods such as
T. ROWE PRICE ULTRA SHORT-TERM BOND ETF
market-based valuation multiples; a discount or premium from market value of a similar, freely traded security of the same issuer; discounted cash flows; yield to maturity; or some combination. Fair value determinations are reviewed on a regular basis. Because any fair value determination involves a significant amount of judgment, there is a degree of subjectivity inherent in such pricing decisions. Fair value prices determined by the Valuation Designee could differ from those of other market participants, and it is possible that the fair value determined for a security may be materially different from the value that could be realized upon the sale of that security.
Valuation Inputs
The following table summarizes the fund’s financial instruments, based on the inputs used to determine their fair values on May 31, 2023 (for further detail by category, please refer to the accompanying Portfolio of Investments):
| ($000s) | Level 1 | Level 2 | Level 3 | Total Value |
| Assets | | | | |
| Fixed Income1 | $ — | $49,442 | $— | $49,442 |
| Short-Term Investments | 1 | 5,764 | — | 5,765 |
| Securities Lending Collateral | 85 | — | — | 85 |
| Options Purchased | 1 | — | — | 1 |
| Total Securities | 87 | 55,206 | — | 55,293 |
| Swaps* | — | 1 | — | 1 |
| Forward Currency Exchange Contracts | — | 10 | — | 10 |
| Futures Contracts* | 12 | — | — | 12 |
| Total | $99 | $55,217 | $— | $55,316 |
| Liabilties | | | | |
| Options Written | $ 5 | $ — | $— | $ 5 |
| Futures Contracts* | 2 | — | — | 2 |
| Total | $ 7 | $ — | $— | $ 7 |
| 1 | Includes Asset-Backed Securities, Corporate Bonds, Foreign Government Obligations & Municipalities, Municipal Securities, Non-U.S. Government Mortgage-Backed Securities and U.S. Government Agency Obligations (Excluding Mortgage-Backed). |
| * | The fair value presented includes cumulative gain (loss) on open futures contracts and centrally cleared swaps; however, the net value reflected on the accompanying Portfolio of Investments is only the unsettled variation margin receivable (payable) at that date. |
T. ROWE PRICE ULTRA SHORT-TERM BOND ETF
NOTE 3 – DERIVATIVE INSTRUMENTS
During the year ended May 31, 2023, the fund invested in derivative instruments. As defined by GAAP, a derivative is a financial instrument whose value is derived from an underlying security price, foreign exchange rate, interest rate, index of prices or rates, or other variable; it requires little or no initial investment and permits or requires net settlement. The fund invests in derivatives only if the expected risks and rewards are consistent with its investment objectives, policies, and overall risk profile, as described in its prospectus and Statement of Additional Information. The fund may use derivatives for a variety of purposes and may use them to establish both long and short positions within the fund’s portfolio. Potential uses include to hedge against declines in principal value, increase yield, invest in an asset with greater efficiency and at a lower cost than is possible through direct investment, to enhance return, or to adjust portfolio duration and credit exposure. The risks associated with the use of derivatives are different from, and potentially much greater than, the risks associated with investing directly in the instruments on which the derivatives are based.
The fund values its derivatives at fair value and recognizes changes in fair value currently in its results of operations. Accordingly, the fund does not follow hedge accounting, even for derivatives employed as economic hedges. Generally, the fund accounts for its derivatives on a gross basis. It does not offset the fair value of derivative liabilities against the fair value of derivative assets on its financial statements, nor does it offset the fair value of derivative instruments against the right to reclaim or obligation to return collateral. The following table summarizes the fair value of the fund’s derivative instruments held as of May 31, 2023, and the related location on the accompanying Statement of Assets and Liabilities, presented by primary underlying risk exposure:
| ($000s) | Location on Statement of
Assets and Liabilities | Fair Value |
| Assets | | |
| Interest rate derivatives | Futures * and Securities^ | $13 |
| Foreign exchange derivatives | Forwards | 10 |
| Credit derivatives | Bilateral swaps and Centrally cleared swaps* | 1 |
| Total | | $24 |
| Liabilities | | |
| Interest rate derivatives | Written Options, Futures* | $ 7 |
T. ROWE PRICE ULTRA SHORT-TERM BOND ETF
| * | The fair value presented includes cumulative gain (loss) on open futures contracts and centrally cleared swaps; however, the value reflected on the accompanying Statement of Assets and Liabilities is only the unsettled variation margin receivable (payable) at that date. |
| ^ | Options purchased are reported as securities and are reflected in the accompanying Portfolio of Investments. |
Additionally, the amount of gains and losses on derivative instruments recognized in fund earnings during the year ended May 31, 2023, and the related location on the accompanying Statement of Operations is summarized in the following table by primary underlying risk exposure:
| ($000s) | Location of Gain (Loss) on Statement of Operations |
| | Securities^ | Options
Written | Futures | Forward
Currency
Exchange
Contracts | Swaps | Total |
| Realized Gain (Loss) | | | | | | |
| Interest rate derivatives | $ 2 | $ 1 | $252 | $ — | $— | $255 |
| Foreign exchange derivatives | — | — | — | 85 | — | 85 |
| Credit derivatives | — | — | — | — | 8 | 8 |
| Total | $ 2 | $ 1 | $252 | $ 85 | $ 8 | $348 |
| Change in Unrealized Gain (Loss) | | | | | | |
| Interest rate derivative | $(1) | $(3) | $ 11 | $ — | $— | $ 7 |
| Foreign exchange derivatives | — | — | — | (20) | — | (20) |
| Credit derivatives | — | — | — | — | 2 | 2 |
| Total | $(1) | $(3) | $ 11 | $(20) | $ 2 | $ (11) |
| | |
| ^ | Options purchased are reported as securities and are reflected in the accompanying Portfolio of Investments. |
Counterparty Risk and Collateral
The fund invests in derivatives in various markets, which expose it to differing levels of counterparty risk. Counterparty risk on exchange-traded and centrally cleared derivative contracts, such as futures, exchange-traded options, and centrally cleared swaps, is
T. ROWE PRICE ULTRA SHORT-TERM BOND ETF
minimal because the clearinghouse provides protection against counterparty defaults. For futures and centrally cleared swaps, the fund is required to deposit collateral in an amount specified by the clearinghouse and the clearing firm (margin requirement), and the margin requirement must be maintained over the life of the contract. Each clearinghouse and clearing firm, in its sole discretion, may adjust the margin requirements applicable to the fund.
Derivatives, such as non-cleared bilateral swaps, forward currency exchange contracts, and OTC options, that are transacted and settle directly with a counterparty (bilateral derivatives) may expose the fund to greater counterparty risk. To mitigate this risk, the fund has entered into master netting arrangements (MNAs) with certain counterparties that permit net settlement under specified conditions and, for certain counterparties, also require the exchange of collateral to cover mark-to-market exposure. MNAs may be in the form of International Swaps and Derivatives Association master agreements (ISDAs) or foreign exchange letter agreements (FX letters).
MNAs provide the ability to offset amounts the fund owes a counterparty against amounts the counterparty owes the fund (net settlement). Both ISDAs and FX letters generally allow termination of transactions and net settlement upon the occurrence of contractually specified events, such as failure to pay or bankruptcy. In addition, ISDAs specify other events, the occurrence of which would allow one of the parties to terminate. For example, a downgrade in credit rating of a counterparty below a specified rating would allow the fund to terminate, while a decline in the fund’s net assets of more than a specified percentage would allow the counterparty to terminate. Upon termination, all transactions with that counterparty would be liquidated and a net termination amount settled. ISDAs typically include collateral agreements whereas FX letters do not. Collateral requirements are determined daily based on the net aggregate unrealized gain or loss on all bilateral derivatives with a counterparty, subject to minimum transfer amounts that typically range from $100,000 to $250,000. Any additional collateral required due to changes in security values is typically transferred the next business day.
Collateral may be in the form of cash or debt securities issued by the U.S. government or related agencies, although other securities may be used depending on the terms outlined in the applicable MNA. Cash posted by the fund is reflected as cash deposits in the accompanying financial statements and generally is restricted from withdrawal by the fund; securities posted by the fund are so noted in the accompanying Portfolio of Investments; both remain in the fund’s assets. Collateral pledged by counterparties is not included in the fund’s assets because the fund does not obtain effective control over those assets. For bilateral derivatives, collateral posted or received by the fund is held in a segregated account at the fund’s custodian. While typically not sold in the same manner as equity or fixed income securities, exchange-traded or centrally cleared derivatives may be closed out only on the exchange or clearinghouse where the contracts were cleared, and
T. ROWE PRICE ULTRA SHORT-TERM BOND ETF
OTC and bilateral derivatives may be unwound with counterparties or transactions assigned to other counterparties to allow the fund to exit the transaction. This ability is subject to the liquidity of underlying positions. As of May 31, 2023, no collateral was pledged by either the fund or counterparties for bilateral derivatives. As of May 31, 2023, securities valued at $300,000 had been posted by the fund for exchange-traded and/or centrally cleared derivatives.
Forward Currency Exchange Contracts
The fund is subject to foreign currency exchange rate risk in the normal course of pursuing its investment objectives. It may use forward currency exchange contracts (forwards) primarily to protect its non-U.S. dollar-denominated securities from adverse currency movements or to increase exposure to a particular foreign currency, to shift the fund's foreign currency exposure from one country to another, or to enhance the fund's return. A forward involves an obligation to purchase or sell a fixed amount of a specific currency on a future date at a price set at the time of the contract. Although certain forwards may be settled by exchanging only the net gain or loss on the contract, most forwards are settled with the exchange of the underlying currencies in accordance with the specified terms. Forwards are valued at the unrealized gain or loss on the contract, which reflects the net amount the fund either is entitled to receive or obligated to deliver, as measured by the difference between the forward exchange rates at the date of entry into the contract and the forward rates at the reporting date. Appreciated forwards are reflected as assets and depreciated forwards are reflected as liabilities on the accompanying Statement of Assets and Liabilities. Risks related to the use of forwards include the possible failure of counterparties to meet the terms of the agreements; that anticipated currency movements will not occur, thereby reducing the fund’s total return; and the potential for losses in excess of the fund’s initial investment. During the year ended May 31, 2023, the volume of the fund’s activity in forwards, based on underlying notional amounts, was generally between 0% and 3% of net assets.
Futures Contracts
The fund is subject to interest rate risk in the normal course of pursuing its investment objectives and uses futures contracts to help manage such risk. The fund may enter into futures contracts to manage exposure to interest rate and yield curve movements, security prices, foreign currencies, credit quality, and mortgage prepayments; as an efficient means of adjusting exposure to all or part of a target market; to enhance income; as a cash management tool; or to adjust portfolio duration and credit exposure. A futures contract provides for the future sale by one party and purchase by another of a specified amount of a specific underlying financial instrument at an agreed-upon price, date, time, and place. The fund currently invests only in exchange-traded futures, which generally are standardized as to maturity date, underlying financial instrument, and other contract terms. Payments are made or received by the fund each day to settle daily fluctuations in
T. ROWE PRICE ULTRA SHORT-TERM BOND ETF
the value of the contract (variation margin), which reflect changes in the value of the underlying financial instrument. Variation margin is recorded as unrealized gain or loss until the contract is closed. The value of a futures contract included in net assets is the amount of unsettled variation margin; net variation margin receivable is reflected as an asset and net variation margin payable is reflected as a liability on the accompanying Statement of Assets and Liabilities. Risks related to the use of futures contracts include possible illiquidity of the futures markets, contract prices that can be highly volatile and imperfectly correlated to movements in hedged security values and/or interest rates, and potential losses in excess of the fund’s initial investment. During the year ended May 31, 2023, the volume of the fund’s activity in futures, based on underlying notional amounts, was generally between 6% and 19% of net assets.
Options
The fund is subject to interest rate risk in the normal course of pursuing its investment objectives and uses options to help manage such risk. The fund may use options to manage exposure to security prices, interest rates, foreign currencies, and credit quality; as an efficient means of adjusting exposure to all or a part of a target market; to enhance income; as a cash management tool; or to adjust credit exposure. Options are included in net assets at fair value, options purchased are included in Investments in Securities, and Options written are separately reflected as a liability on the accompanying Statement of Assets and Liabilities. Premiums on unexercised, expired options are recorded as realized gains or losses; premiums on exercised options are recorded as an adjustment to the proceeds from the sale or cost of the purchase. The difference between the premium and the amount received or paid in a closing transaction is also treated as realized gain or loss. In return for a premium paid, call and put options on futures give the holder the right, but not the obligation, to purchase or sell, respectively, a position in a particular futures contract at a specified exercise price. Risks related to the use of options include possible illiquidity of the options markets; trading restrictions imposed by an exchange or counterparty; possible failure of counterparties to meet the terms of the agreements; movements in the underlying asset values and interest rates, and for options written, the potential for losses to exceed any premium received by the fund. During the year ended May 31, 2023, the volume of the fund’s activity in options, based on underlying notional amounts, was approximately 10% of net assets.
Swaps
The fund is subject to credit risk in the normal course of pursuing its investment objectives and uses swap contracts to help manage such risk. The fund may use swaps in an effort to manage both long and short exposure to changes in interest rates, inflation rates, and credit quality; to adjust overall exposure to certain markets; to enhance total return or protect the value of portfolio securities; to serve as a cash management tool; or to adjust portfolio duration and credit exposure. Swap agreements can be settled either directly with
T. ROWE PRICE ULTRA SHORT-TERM BOND ETF
the counterparty (bilateral swap) or through a central clearinghouse (centrally cleared swap). Fluctuations in the fair value of a contract are reflected in unrealized gain or loss and are reclassified to realized gain or loss upon contract termination or cash settlement. Net periodic receipts or payments required by a contract increase or decrease, respectively, the value of the contract until the contractual payment date, at which time such amounts are reclassified from unrealized to realized gain or loss. For bilateral swaps, cash payments are made or received by the fund on a periodic basis in accordance with contract terms; unrealized gain on contracts and premiums paid are reflected as assets and unrealized loss on contracts and premiums received are reflected as liabilities on the accompanying Statement of Assets and Liabilities. For bilateral swaps, premiums paid or received are amortized over the life of the swap and are recognized as realized gain or loss in the Statement of Operations. For centrally cleared swaps, payments are made or received by the fund each day to settle the daily fluctuation in the value of the contract (variation margin). Accordingly, the value of a centrally cleared swap included in net assets is the unsettled variation margin; net variation margin receivable is reflected as an asset and net variation margin payable is reflected as a liability on the accompanying Statement of Assets and Liabilities.
Credit default swaps are agreements where one party (the protection buyer) agrees to make periodic payments to another party (the protection seller) in exchange for protection against specified credit events, such as certain defaults and bankruptcies related to an underlying credit instrument, or issuer or index of such instruments. Upon occurrence of a specified credit event, the protection seller is required to pay the buyer the difference between the notional amount of the swap and the value of the underlying credit, either in the form of a net cash settlement or by paying the gross notional amount and accepting delivery of the relevant underlying credit. For credit default swaps where the underlying credit is an index, a specified credit event may affect all or individual underlying securities included in the index and will be settled based upon the relative weighting of the affected underlying security(ies) within the index. Generally, the payment risk for the seller of protection is inversely related to the current market price or credit rating of the underlying credit or the market value of the contract relative to the notional amount, which are indicators of the markets’ valuation of credit quality. As of May 31, 2023, the notional amount of protection sold by the fund totaled $1,195,000 (2.2% of net assets), which reflects the maximum potential amount the fund could be required to pay under such contracts. Risks related to the use of credit default swaps include the possible inability of the fund to accurately assess the current and future creditworthiness of underlying issuers, the possible failure of a counterparty to perform in accordance with the terms of the swap agreements, potential government regulation that could adversely affect the fund’s swap investments, and potential losses in excess of the fund’s initial investment.
T. ROWE PRICE ULTRA SHORT-TERM BOND ETF
During the year ended May 31, 2023, the volume of the fund’s activity in swaps, based on underlying notional amounts, was generally between 2% and 4% of net assets.
NOTE 4 – OTHER INVESTMENT TRANSACTIONS
Consistent with its investment objective, the fund engages in the following practices to manage exposure to certain risks and/or to enhance performance. The investment objective, policies, program, and risk factors of the fund are described more fully in the fund’s prospectus and Statement of Additional Information.
Restricted Securities
The fund invests in securities that are subject to legal or contractual restrictions on resale. Prompt sale of such securities at an acceptable price may be difficult and may involve substantial delays and additional costs.
Collateralized Loan Obligations
The fund invests in collateralized loan obligations (CLOs) which are entities backed by a diversified pool of syndicated bank loans. The cash flows of the CLO can be split into multiple segments, called “tranches” or “classes”, which will vary in risk profile and yield. The riskiest segments, which are the subordinate or “equity” tranches, bear the greatest risk of loss from defaults in the underlying assets of the CLO and serve to protect the other, more senior, tranches. Senior tranches will typically have higher credit ratings and lower yields than the securities underlying the CLO. Despite the protection from the more junior tranches, senior tranches can experience substantial losses.
Mortgage-Backed Securities
The fund invests in mortgage-backed securities (MBS or pass-through certificates) that represent an interest in a pool of specific underlying mortgage loans and entitle the fund to the periodic payments of principal and interest from those mortgages. MBS may be issued by government agencies or corporations, or private issuers. Most MBS issued by government agencies are guaranteed; however, the degree of protection differs based on the issuer. MBS are sensitive to changes in economic conditions that affect the rate of prepayments and defaults on the underlying mortgages; accordingly, the value, income, and related cash flows from MBS may be more volatile than other debt instruments.
When-Issued Securities
The fund enters into when-issued purchase or sale commitments, pursuant to which it agrees to purchase or sell, respectively, an authorized but not yet issued security for a fixed unit price, with payment and delivery not due until issuance of the security on a scheduled future date. When-issued securities may be new securities or securities issued through a
T. ROWE PRICE ULTRA SHORT-TERM BOND ETF
corporate action, such as a reorganization or restructuring. Until settlement, the fund maintains liquid assets sufficient to settle its commitment to purchase a when-issued security or, in the case of a sale commitment, the fund maintains an entitlement to the security to be sold. Amounts realized on when-issued transactions are included in realized gain/loss on securities in the accompanying financial statements.
LIBOR Transition
The fund may invest in instruments that are tied to reference rates, including the London Interbank Offered Rate (LIBOR). Over the course of the last several years, global regulators have indicated an intent to phase out the use of LIBOR and similar interbank offered rates (IBOR). There remains uncertainty regarding the future utilization of LIBOR and the nature of any replacement rate. Any potential effects of the transition away from LIBOR on the fund, or on certain instruments in which the fund invests, cannot yet be determined. The transition process may result in, among other things, an increase in volatility or illiquidity of markets for instruments that currently rely on LIBOR, a reduction in the value of certain instruments held by the fund, or a reduction in the effectiveness of related fund transactions such as hedges. Any such effects could have an adverse impact on the fund’s performance.
Securities Lending
The fund may lend its securities to approved borrowers to earn additional income. Its securities lending activities are administered by a lending agent in accordance with a securities lending agreement. Security loans generally do not have stated maturity dates, and the fund may recall a security at any time. The fund receives collateral in the form of cash or U.S. government securities. Collateral is maintained over the life of the loan in an amount not less than the value of loaned securities; any additional collateral required due to changes in security values is delivered to the fund the next business day. Cash collateral is invested in accordance with investment guidelines approved by fund management. Additionally, the lending agent indemnifies the fund against losses resulting from borrower default. Although risk is mitigated by the collateral and indemnification, the fund could experience a delay in recovering its securities and a possible loss of income or value if the borrower fails to return the securities, collateral investments decline in value, and the lending agent fails to perform. Securities lending revenue consists of earnings on invested collateral and borrowing fees, net of any rebates to the borrower, compensation to the lending agent, and other administrative costs. In accordance with GAAP, investments made with cash collateral are reflected in the accompanying financial statements, but collateral received in the form of securities is not. At May 31, 2023, the value of loaned securities was $84,000; the value of cash collateral and related investments was $85,000.
T. ROWE PRICE ULTRA SHORT-TERM BOND ETF
Other
Purchases and sales of portfolio securities excluding in-kind transactions and short-term and U.S. government securities aggregated $38,620,000 and $19,644,000, respectively, for the year ended May 31, 2023. Purchases and sales of U.S. government securities, excluding in-kind transactions and short-term securities, aggregated $5,733,000 and $5,771,000, respectively, for the year ended May 31, 2023.
NOTE 5 – FEDERAL INCOME TAXES
Generally, no provision for federal income taxes is required since the fund intends to continue to qualify as a regulated investment company under Subchapter M of the Internal Revenue Code and distribute to shareholders all of its taxable income and gains. Distributions determined in accordance with federal income tax regulations may differ in amount or character from net investment income and realized gains for financial reporting purposes.
The fund files U.S. federal, state, and local tax returns as required. The fund’s tax returns are subject to examination by the relevant tax authorities until expiration of the applicable statute of limitations, which is generally three years after the filing of the tax return but which can be extended to six years in certain circumstances. Tax returns for open years have incorporated no uncertain tax positions that require a provision for income taxes.
Capital accounts within the financial reporting records are adjusted for permanent book/tax differences to reflect tax character but are not adjusted for temporary differences. The permanent book/tax adjustments, if any, have no impact on results of operations or net assets. The permanent book/tax adjustments relate primarily to the recharacterization of distribtuions
The tax character of distributions paid for the periods presented was as follows:
| ($000s) | | |
| | May 31, | May 31, |
| | 2023 | 2022 |
| Ordinary income (including short-term capital gains, if any) | $1,764 | $164 |
| Long-term capital gain | 212 | 10 |
| Total distribution | $1,976 | $174 |
T. ROWE PRICE ULTRA SHORT-TERM BOND ETF
At May 31, 2023, the tax-basis cost of investments, (including derivatives, if any) and gross unrealized appreciation and depreciation were as follows:
| ($000s) | |
| Cost of investments | $56,015 |
| Unrealized appreciation | $ 57 |
| Unrealized depreciation | (779) |
| Net unrealized appreciation (depreciation) | $ (722) |
At May 31, 2023, the tax-basis components of accumulated net earnings (loss) were as follows:
| ($000s) | |
| Net unrealized appreciation (depreciation) | $(722) |
| Loss carryforwards and deferrals | (155) |
| Total distributable earnings (loss) | $(877) |
Temporary differences between book-basis and tax-basis components of total distributable earnings (loss) arise when certain items of income, gain, or loss are recognized in different periods for financial statement purposes versus for tax purposes; these differences will reverse in a subsequent reporting period. The temporary differences relate primarily to the deferral of losses from wash sales. The loss carryforwards and deferrals primarily relate to post-October loss deferrals. The fund has elected to defer certain losses to the first day of the following fiscal year for post-October capital loss defferals.
NOTE 6 – RELATED PARTY TRANSACTIONS
The fund is managed by T. Rowe Price Associates, Inc. (Price Associates), a wholly owned subsidiary of T. Rowe Price Group, Inc. (Price Group). Price Associates has entered into a sub-advisory agreement(s) with one or more of its wholly owned subsidiaries, to provide investment advisory services to the fund. The investment management and administrative agreement between the fund and Price Associates provides for an all-inclusive annual fee equal to 0.17% of the fund’s average daily net assets. The fee is computed daily and paid monthly. The all-inclusive fee covers investment management services and ordinary, recurring operating expenses, but does not cover interest and borrowing expenses; taxes; brokerage commissions and other transaction costs; fund proxy expenses; and nonrecurring and extraordinary expenses.
T. ROWE PRICE ULTRA SHORT-TERM BOND ETF
The fund may invest its cash reserves in certain open-end management investment companies managed by Price Associates and considered affiliates of the fund: the T. Rowe Price Government Reserve Fund or the T. Rowe Price Treasury Reserve Fund, organized as money market funds (together, the Price Reserve Funds). The Price Reserve Funds are offered as short-term investment options to mutual funds, trusts, and other accounts managed by Price Associates or its affiliates and are not available for direct purchase by members of the public. Cash collateral from securities lending, if any, is invested in the T. Rowe Price Government Reserve Fund. The Price Reserve Funds pay no investment management fees.
As of May 31, 2023, T. Rowe Price Group, Inc., or its wholly owned subsidiaries, owned 400,000 shares of the fund, representing 36% of the fund’s net assets.
The fund may participate in securities purchase and sale transactions with other funds or accounts advised by Price Associates (cross trades), in accordance with procedures adopted by the fund’s Board and Securities and Exchange Commission rules, which require, among other things, that such purchase and sale cross trades be effected at the independent current market price of the security. During the year ended May 31, 2023, the fund had no purchases or sales cross trades with other funds or accounts advised by Price Associates.
NOTE 7 – BORROWING
At May 31, 2023, the fund had outstanding borrowings from State Street Bank of $134,000 at an annual rate of 8.36%.
NOTE 8 – OTHER MATTERS
Unpredictable events such as environmental or natural disasters, war, terrorism, pandemics, outbreaks of infectious diseases, and similar public health threats may significantly affect the economy and the markets and issuers in which the fund invests. Certain events may cause instability across global markets, including reduced liquidity and disruptions in trading markets, while some events may affect certain geographic regions, countries, sectors, and industries more significantly than others, and exacerbate other pre-existing political, social, and economic risks.
Since 2020, a novel strain of coronavirus (COVID-19) has resulted in disruptions to global business activity and caused significant volatility and declines in global financial markets.
T. ROWE PRICE ULTRA SHORT-TERM BOND ETF
In February 2022, Russian forces entered Ukraine and commenced an armed conflict leading to economic sanctions being imposed on Russia and certain of its citizens, creating impacts on Russian-related stocks and debt and greater volatility in global markets.
In March 2023, the collapse of some US regional and global banks as well as overall concerns around the soundness and stability of the global banking sector has sparked concerns of a broader financial crisis impacting the overall global banking sector. In certain cases, government agencies have assumed control or otherwise intervened in the operations of certain banks due to liquidity and solvency concerns. The extent of impact of these events on the US and global markets is highly uncertain.
These are recent examples of global events which may have a negative impact on the values of certain portfolio holdings or the fund’s overall performance. Management is actively monitoring the risks and financial impacts arising from these events.
T. ROWE PRICE ULTRA SHORT-TERM BOND ETF
REPORT OF INDEPENDENT REGISTERED PUBLIC ACCOUNTING FIRM
To the Board of Directors of T. Rowe Price Exchange-Traded Funds, Inc. and Shareholders of T. Rowe Price Ultra Short-Term Bond ETF
Opinion on the Financial Statements
We have audited the accompanying statement of assets and liabilities, including the portfolio of investments, of T. Rowe Price Ultra Short-Term Bond ETF (one of the funds constituting T. Rowe Price Exchange-Traded Funds, Inc., referred to hereafter as the "Fund") as of May 31, 2023, the related statement of operations for the year ended May 31, 2023 and the statement of changes in net assets and the financial highlights for the year ended May 31, 2023 and for the period September 28, 2021 (Inception) through May 31, 2022, including the related notes (collectively referred to as the “financial statements”). In our opinion, the financial statements present fairly, in all material respects, the financial position of the Fund as of May 31, 2023, the results of its operations for the year ended May 31, 2023 and the changes in its net assets and the financial highlights for the year ended May 31, 2023 and for the period September 28, 2021 (Inception) through May 31, 2022, in conformity with accounting principles generally accepted in the United States of America.
Basis for Opinion
These financial statements are the responsibility of the Fund’s management. Our responsibility is to express an opinion on the Fund’s financial statements based on our audits. We are a public accounting firm registered with the Public Company Accounting Oversight Board (United States) (PCAOB) and are required to be independent with respect to the Fund in accordance with the U.S. federal securities laws and the applicable rules and regulations of the Securities and Exchange Commission and the PCAOB.
We conducted our audits of these financial statements in accordance with the standards of the PCAOB. Those standards require that we plan and perform the audit to obtain reasonable assurance about whether the financial statements are free of material misstatement, whether due to error or fraud.
T. ROWE PRICE ULTRA SHORT-TERM BOND ETF
REPORT OF INDEPENDENT REGISTERED PUBLIC ACCOUNTING FIRM
(CONTINUED)
Our audits included performing procedures to assess the risks of material misstatement of the financial statements, whether due to error or fraud, and performing procedures that respond to those risks. Such procedures included examining, on a test basis, evidence regarding the amounts and disclosures in the financial statements. Our audits also included evaluating the accounting principles used and significant estimates made by management, as well as evaluating the overall presentation of the financial statements. Our procedures included confirmation of securities owned as of May 31, 2023 by correspondence with the custodian, transfer agent and brokers; when replies were not received from brokers, we performed other auditing procedures. We believe that our audits provide a reasonable basis for our opinion.
/s/ PricewaterhouseCoopers LLP
Baltimore, Maryland
July 20, 2023
We have served as the auditor of one or more investment companies in the T. Rowe Price group of investment companies since 1973.
T. ROWE PRICE ULTRA SHORT-TERM BOND ETF
TAX INFORMATION (UNAUDITED) FOR THE TAX YEAR ENDED 05/31/23
We are providing this information as required by the Internal Revenue Code. The amounts shown may differ from those elsewhere in this report because of differences between tax and financial reporting requirements. The fund’s distributions to shareholders included:
For nonresident alien shareholders, $1,209,000 of income dividends are interest-related dividends.
For shareholders subject to interest expense deduction limitation under Section 163(j), $1,771,000 of the fund’s income qualifies as a Section 163(j) interest dividend and can be treated as interest income for purposes of Section 163(j), subject to holding period requirements and other limitations.
$34,000 from short-term capital gain.
The fund's distributions to shareholders included $212,000 from long-term capital gains, subject to a long-term capital gains tax rate of not greater than 20%.
INFORMATION ON PROXY VOTING POLICIES, PROCEDURES, AND RECORDS
A description of the policies and procedures used by T. Rowe Price funds and portfolios to determine how to vote proxies relating to portfolio securities is available in each fund’s Statement of Additional Information. You may request this document by calling 1-800-638-5660 or by accessing the SEC’s website, sec.gov.
The description of our proxy voting policies and procedures is also available on our corporate website. To access it, please visit the following Web page:
https://www.troweprice.com/corporate/en/utility/policies.html
Scroll down to the section near the bottom of the page that says, “Proxy Voting Policies.” Click on the Proxy Voting Policies link in the shaded box.
Each fund’s most recent annual proxy voting record is available on our website and through the SEC’s website. To access it through T. Rowe Price, visit the website location shown above, and scroll down to the section near the bottom of the page that says, “Proxy Voting Records.” Click on the Proxy Voting Records link in the shaded box.
HOW TO OBTAIN QUARTERLY PORTFOLIO HOLDINGS
The fund files a complete schedule of portfolio holdings with the Securities and Exchange Commission (SEC) for the first and third quarters of each fiscal year as an exhibit to its reports on Form N-PORT. The fund’s Form N-PORT is available electronically on the SEC’s website (sec.gov).
T. ROWE PRICE ULTRA SHORT-TERM BOND ETF
Approval of Investment Management Agreement and Subadvisory Agreements
Each year, the fund’s Board of Directors (Board) considers the continuation of the investment management agreement (Advisory Contract) between the fund and its investment adviser, T. Rowe Price Associates, Inc. (Adviser), as well as the investment subadvisory agreements (Subadvisory Contracts) that the Adviser has entered into with T. Rowe Price International Ltd and T. Rowe Price Hong Kong Limited (Subadvisers) on behalf of the fund. In that regard, at a meeting held on March 6–7, 2023 (Meeting), the Board, including all of the fund’s independent directors, approved the continuation of the fund’s Advisory Contract and Subadvisory Contracts. At the Meeting, the Board considered the factors and reached the conclusions described below relating to the selection of the Adviser and Subadvisers and the approval of the Advisory Contract and Subadvisory Contracts. The independent directors were assisted in their evaluation of the Advisory Contract and Subadvisory Contracts by independent legal counsel from whom they received separate legal advice and with whom they met separately.
In providing information to the Board, the Adviser was guided by a detailed set of requests for information submitted by independent legal counsel on behalf of the independent directors. In considering and approving the continuation of the Advisory Contract and Subadvisory Contracts, the Board considered the information it believed was relevant, including, but not limited to, the information discussed below. The Board considered not only the specific information presented in connection with the Meeting but also the knowledge gained over time through interaction with the Adviser and Subadvisers about various topics. The Board meets regularly and, at each of its meetings, covers an extensive agenda of topics and materials and considers factors that are relevant to its annual consideration of the renewal of the T. Rowe Price funds’ advisory contracts, including performance and the services and support provided to the funds and their shareholders.
Services Provided by the Adviser and Subadvisers
The Board considered the nature, quality, and extent of the services provided to the fund by the Adviser and Subadvisers. These services included, but were not limited to, directing the fund’s investments in accordance with its investment program and the overall management of the fund’s portfolio, as well as a variety of related activities such as financial, investment operations, and administrative services; compliance; maintaining the fund’s records and registrations; and shareholder communications. The Board also reviewed the background and experience of the Adviser’s and Subadvisers’ senior management teams and investment personnel involved in the management of the fund, as well as the Adviser’s compliance record. The Board concluded that the information it considered with respect to the nature, quality, and extent of the services provided by the Adviser and Subadvisers, as well as the other factors considered at the Meeting, supported the Board’s approval of the continuation of the Advisory Contract and Subadvisory Contracts.
T. ROWE PRICE ULTRA SHORT-TERM BOND ETF
Investment Performance of the Fund
The Board took into account discussions with the Adviser and detailed reports that it regularly receives throughout the year on relative and absolute performance for the T. Rowe Price funds. In connection with the Meeting, the Board reviewed information provided by the Adviser that compared the fund’s total returns, as well as a wide variety of other previously agreed-upon performance measures and market data, against relevant benchmark indexes and peer groups of funds with similar investment programs for various periods through December 31, 2022. Additionally, the Board reviewed the fund’s relative performance information as of September 30, 2022, which ranked the returns of the fund for various periods against a universe of funds with similar investment programs selected by Broadridge, an independent provider of mutual fund data. In the course of its deliberations, the Board considered performance information provided throughout the year and in connection with the Advisory Contract review at the Meeting, as well as information provided during investment review meetings conducted with portfolio managers and senior investment personnel during the course of the year regarding the fund’s performance. The Board also considered relevant factors, such as overall market conditions and trends that could adversely impact the fund’s performance, length of the fund’s performance track record, and how closely the fund’s strategies align with its benchmarks and peer groups. The Board concluded that the information it considered with respect to the fund’s performance, as well as the other factors considered at the Meeting, supported the Board’s approval of the continuation of the Advisory Contract and Subadvisory Contracts.
Costs, Benefits, Profits, and Economies of Scale
The Board reviewed detailed information regarding the revenues received by the Adviser under the Advisory Contract and other direct and indirect benefits that the Adviser (and its affiliates) may have realized from its relationship with the fund. In considering soft-dollar arrangements pursuant to which research may be received from broker-dealers that execute the fund’s portfolio transactions, the Board noted that the Adviser bears the cost of research services for all client accounts that it advises, including the T. Rowe Price funds. The Board received information on the estimated costs incurred and profits realized by the Adviser from managing the T. Rowe Price funds. While the Board did not review information regarding profits realized from managing the fund in particular because the fund had either not achieved sufficient portfolio asset size or not recognized sufficient revenues to produce meaningful profit margin percentages, the Board concluded that the Adviser’s profits were reasonable in light of the services provided to the T. Rowe Price mutual funds and ETFs.
The Board also considered whether the fund benefits under the fee levels set forth in the Advisory Contract or otherwise from any economies of scale realized by the Adviser. Under the Advisory Contract, the fund pays the Adviser an all-inclusive management fee, which is based on the fund’s average daily net assets. The all-inclusive management fee includes investment management services and provides for the Adviser to pay all of the fund’s ordinary, recurring operating expenses except for interest and borrowing expenses, taxes, brokerage commissions and other transaction costs, fund proxy expenses, and any nonrecurring extraordinary expenses. Under each Subadvisory Contract, the Adviser may pay the Subadviser up to 60% of the advisory fees that the Adviser receives from the fund.
T. ROWE PRICE ULTRA SHORT-TERM BOND ETF
The Adviser has generally implemented an all-inclusive management fee structure in situations where a fixed total expense ratio is useful for purposes of providing certainty of fees and expenses for investors and such a fee structure is typically used by other ETFs offered by competitors. The Adviser has historically sought to set the initial all-inclusive management fee rate at levels below the expense ratios of comparable funds to take into account potential future economies of scale. In addition, the assets of the fund are included in the calculation of the group fee rate, which serves as a component of the management fee for many T. Rowe Price funds and declines at certain asset levels based on the combined average net assets of most of the T. Rowe Price mutual funds and ETFs (including the fund). Although the fund does not have a group fee component to its management fee, its assets are included in the calculation because certain resources utilized to operate the fund are shared with other T. Rowe Price funds.
In addition, the Board noted that the fund potentially shares in indirect economies of scale through the Adviser’s ongoing investments in its business in support of the T. Rowe Price funds, including investments in trading systems, technology, and regulatory support enhancements, and the ability to possibly negotiate lower fee arrangements with third-party service providers. The Board concluded that the advisory fee structure for the fund provides for a reasonable sharing of benefits from any economies of scale with the fund’s investors.
Fees and Expenses
The Board was provided with information regarding industry trends in management fees and expenses. Among other things, the Board reviewed data for peer groups that were compiled by Broadridge, which compared: (i) actual management fees, nonmanagement expenses, and total expenses of the fund with a group of competitor funds selected by Broadridge (Expense Group) and (ii) actual management fees, nonmanagement expenses, and total expenses of the fund with a broader set of funds within the Lipper investment classification (Expense Universe). The Board considered the fund’s actual management fee rate (which reflects the management fees actually received from the fund by the Adviser after deducting the fund’s operating expenses), operating expenses, and total expenses (which reflect the fund’s all-inclusive management fee rate) in comparison with the information for the Broadridge peer groups. Broadridge generally constructed the peer groups by seeking the most comparable funds based on similar investment classifications and objectives, expense structure, asset size, and operating components and attributes and ranked funds into quintiles, with the first quintile representing the funds with the lowest relative expenses and the fifth quintile representing the funds with the highest relative expenses. The information provided to the Board indicated that the fund’s actual management fee rate ranked in the first quintile (Expense Group and Expense Universe) and the fund’s total expenses ranked in the first quintile (Expense Group and Expense Universe).
The Board also reviewed the fee schedules for other investment portfolios with similar mandates that are advised or subadvised by the Adviser and its affiliates, including separately managed accounts for institutional and individual investors; subadvised funds; and other sponsored investment portfolios, including collective investment trusts and pooled vehicles organized and offered to investors outside the United States. Management
T. ROWE PRICE ULTRA SHORT-TERM BOND ETF
provided the Board with information about the Adviser’s responsibilities and services provided to subadvisory and other institutional account clients, including information about how the requirements and economics of the institutional business are fundamentally different from those of the proprietary mutual fund business. The Board considered information showing that the Adviser’s mutual fund business is generally more complex from a business and compliance perspective than its institutional account business and considered various relevant factors, such as the broader scope of operations and oversight, more extensive shareholder communication infrastructure, greater asset flows, heightened business risks, and differences in applicable laws and regulations associated with the Adviser’s proprietary mutual fund business. In assessing the reasonableness of the fund’s management fee rate, the Board considered the differences in the nature of the services required for the Adviser to manage its mutual fund business versus managing a discrete pool of assets as a subadviser to another institution’s mutual fund or for an institutional account and that the Adviser generally performs significant additional services and assumes greater risk in managing the fund and other T. Rowe Price funds than it does for institutional account clients, including subadvised funds.
On the basis of the information provided and the factors considered, the Board concluded that the fees paid by the fund under the Advisory Contract are reasonable.
Approval of the Advisory Contract and Subadvisory Contracts
As noted, the Board approved the continuation of the Advisory Contract and Subadvisory Contracts. No single factor was considered in isolation or to be determinative to the decision. Rather, the Board concluded, in light of a weighting and balancing of all factors considered, that it was in the best interests of the fund and its shareholders for the Board to approve the continuation of the Advisory Contract and Subadvisory Contracts (including the fees to be charged for services thereunder).
T. ROWE PRICE ULTRA SHORT-TERM BOND ETF
ABOUT THE FUND’S DIRECTORS AND OFFICERS
Your fund is overseen by a Board of Directors (Board) that meets regularly to review a wide variety of matters affecting or potentially affecting the fund, including performance, investment programs, compliance matters, advisory fees and expenses, service providers, and business and regulatory affairs. The Board elects the fund’s officers, who are listed in the final table. The directors who are also employees or officers of T. Rowe Price are considered to be “interested” directors as defined in Section 2(a)(19) of the 1940 Act because of their relationships with T. Rowe Price Associates, Inc. (T. Rowe Price), and its affiliates. The business address of each director and officer is 100 East Pratt Street, Baltimore, Maryland 21202. The Statement of Additional Information includes additional information about the fund directors and is available without charge by calling a T. Rowe Price representative at 1-800-638-5660.
INDEPENDENT DIRECTORS(a)
Name
(Year of Birth)
Year Elected
[Number of T. Rowe Price
Portfolios Overseen] | Principal Occupation(s) and Directorships of Public Companies and
Other Investment Companies During the Past Five Years |
Teresa Bryce Bazemore
(1959)
2019
[210] | President and Chief Executive Officer, Federal Home Loan
Bank of San Francisco (2021 to present); Chief Executive Officer,
Bazemore Consulting LLC (2018 to 2021); Director, Chimera
Investment Corporation (2017 to 2021); Director, First Industrial
Realty Trust (2020 to present); Director, Federal Home Loan Bank of
Pittsburgh (2017 to 2019) |
Melody Bianchetto
(1966)
2023
[210] | Advisory Board Member; Vice President for Finance, University of
Virginia (2015 to 2023) |
Bruce W. Duncan
(1951)
2019
[210] | President, Chief Executive Officer, and Director, CyrusOne, Inc. (2020 to
2021); Chair of the Board (2016 to 2020) and President (2009 to 2016),
First Industrial Realty Trust, owner and operator of industrial properties;
Member, Investment Company Institute Board of Governors (2017 to
2019); Member, Independent Directors Council Governing Board (2017
to 2019); Senior Advisor, KKR (2018 to 2022); Director, Boston
Properties (2016 to present); Director, Marriott International, Inc. (2016 to
2020) |
Robert J. Gerrard, Jr.
(1952)
2019
[210] | Chair of the Board, all funds (July 2018 to present) |
T. ROWE PRICE ULTRA SHORT-TERM BOND ETF
INDEPENDENT DIRECTORS(a) (continued)
Name
(Year of Birth)
Year Elected
[Number of T. Rowe Price
Portfolios Overseen] | Principal Occupation(s) and Directorships of Public Companies and
Other Investment Companies During the Past Five Years |
Paul F. McBride
(1956)
2019
[210] | Advisory Board Member, Vizzia Technologies (2015 to present); Board
Member, Dunbar Armored (2012 to 2018) |
Mark J. Parrell
(1966)
2023
[210] | Advisory Board Member; Board of Trustees Member and Chief Executive
Officer (2019 to present), President (2018 to present), Executive Vice
President and Chief Financial Officer (2007 to 2018), and Senior Vice
President and Treasurer (2005 to 2007), EQR; Member and Chair, Nareit
Dividends Through Diversity, Equity & Inclusion CEO Council, Nareit
2021 Audit and Investment Committee (2021); Advisory Board, Ross
Business School at University of Michigan (2015 to 2016); Member and
Chair of the Finance Committee, National Multifamily Housing Council
(2015 to 2016); Member, Economic Club of Chicago; Director,
Brookdale Senior Living, Inc. (2015 to 2017); Director, Aviv REIT, Inc.
(2013 to 2015); Director, Real Estate Roundtable (July 2021 to present)
and the 2022 Executive Board Nareit (November 2021 to present); Board
of Directors and Chair of the Finance Committee, Greater Chicago Food
Depository (July 2017 to present) |
Kellye L. Walker
(1966)
2021
[210] | Executive Vice President and Chief Legal Officer, Eastman Chemical
Company (April 2020 to present); Executive Vice President and Chief
Legal Officer, Huntington Ingalls Industries, Inc. (January 2015 to March
2020); Director, Lincoln Electric Company (October 2020 to present) |
(a)All information about the independent directors was current as of December 31, 2022, unless otherwise indicated, except for the number of portfolios overseen, which is current as of the date of this report.
T. ROWE PRICE ULTRA SHORT-TERM BOND ETF
INTERESTED DIRECTORS(a)
Name
(Year of Birth)
Year Elected
[Number of T. Rowe Price
Portfolios Overseen] | Principal Occupation(s) and Directorships of Public Companies and
Other Investment Companies During the Past Five Years |
David Oestreicher
(1967)
2019
[210] | Director, Vice President, and Secretary, T. Rowe Price, T. Rowe Price
Investment Services, Inc., T. Rowe Price Retirement Plan Services,
Inc., and T. Rowe Price Services, Inc.; Director and Secretary,
T. Rowe Price Investment Management, Inc. (Price Investment
Management); Vice President and Secretary, T. Rowe Price
International (Price International); Vice President, T. Rowe Price Hong
Kong (Price Hong Kong), T. Rowe Price Japan (Price Japan), and
T. Rowe Price Singapore (Price Singapore); General Counsel, Vice
President, and Secretary, T. Rowe Price Group, Inc.; Chair of the
Board, Chief Executive Officer, President, and Secretary, T. Rowe
Price Trust Company; Principal Executive Officer and Executive Vice
President, all funds |
Eric L. Veiel, CFA
(1972)
2022
[210] | Director and Vice President, T. Rowe Price; Vice President, T. Rowe
Price Group, Inc., and T. Rowe Price Trust Company; Vice President,
Global Funds |
(a)All information about the interested directors was current as of December 31, 2022, unless otherwise indicated, except for the number of portfolios overseen, which is current as of the date of this report.
OFFICERS
Name (Year of Birth)
Position Held With Fixed Income ETFs | Principal Occupation(s) |
Christopher P. Brown, CFA (1977)
Executive Vice President | Vice President, T. Rowe Price and T. Rowe Price Group, Inc. |
Armando (Dino) Capasso (1974)
Chief Compliance Officer | Chief Compliance Officer and Vice President, T. Rowe Price and Price Investment Management; Vice President, T. Rowe Price Group, Inc.; formerly, Chief Compliance Officer, PGIM Investments LLC and AST Investment Services, Inc. (ASTIS) (to 2022); Chief Compliance Officer, PGIM Retail Funds complex and Prudential Insurance Funds (to 2022); Vice President and Deputy Chief Compliance Officer, PGIM Investments LLC and ASTIS (to 2019) |
David Corris (1975)
Executive Vice President | Vice President, T. Rowe Price and T. Rowe Price Group, Inc.; formerly, Head of Disciplined Equities and Portfolio Manager, Bank of Montreal Global Asset Management (to 2021) |
T. ROWE PRICE ULTRA SHORT-TERM BOND ETF
OFFICERS (continued)
Name (Year of Birth)
Position Held With Fixed Income ETFs | Principal Occupation(s) |
Timothy Coyne (1967)
Executive Vice President | Vice President, T. Rowe Price and T. Rowe Price Group, Inc. |
Vincent Michael DeAugustino (1983)
Executive Vice President | Vice President, T. Rowe Price and T. Rowe Price Group, Inc. |
Anna Alexandra Dreyer, Ph.D., CFA (1981)
Executive Vice President | Vice President, T. Rowe Price and T. Rowe Price Group, Inc. |
Shawn T. Driscoll (1975)
Executive Vice President | Vice President, T. Rowe Price, T. Rowe Price Group, Inc., and T. Rowe Price Trust Company |
Alan S. Dupski, CPA (1982)
Principal Financial Officer, Vice
President, and Treasurer | Vice President, Price Investment Management, T. Rowe Price, T. Rowe Price Group, Inc., and T. Rowe Price Trust Company |
Joseph B. Fath, CPA (1971)
Executive Vice President | Vice President, T. Rowe Price, T. Rowe Price Group, Inc., and T. Rowe Price Trust Company |
Gary J. Greb (1961)
Vice President | Vice President, Price Investment Management, T. Rowe Price, Price International, and T. Rowe Price Trust Company |
Paul Greene II (1978)
Executive Vice President | Vice President, T. Rowe Price, T. Rowe Price Group, Inc., and T. Rowe Price Trust Company |
Cheryl Hampton, CPA (1969)
Vice President | Vice President, T. Rowe Price; formerly, Tax Director, Invesco Ltd. (to 2021); Vice President, Oppenheimer
Funds, Inc. (to 2019) |
Ann M. Holcomb, CFA (1972)
Executive Vice President | Vice President, T. Rowe Price, T. Rowe Price Group, Inc., and T. Rowe Price Trust Company |
Thomas J. Huber, CFA (1966)
Executive Vice President | Vice President, T. Rowe Price, T. Rowe Price Group, Inc., and T. Rowe Price Trust Company |
Prashant G. Jeyaganesh (1983)
Executive Vice President | Vice President, T. Rowe Price and T. Rowe Price Group, Inc. |
Vidya Kadiyam (1980)
Executive Vice President | Vice President, T. Rowe Price and T. Rowe Price Group, Inc. |
Benjamin Kersse, CPA (1989)
Vice President | Vice President, T. Rowe Price |
Paul J. Krug, CPA (1964)
Vice President | Vice President, T. Rowe Price, T. Rowe Price Group, Inc., and T. Rowe Price Trust Company |
Robert M Larkins, CFA (1973)
Executive Vice President | Vice President, T. Rowe Price, T. Rowe Price Group, Inc., and T. Rowe Price Trust Company |
John D. Linehan, CFA (1965)
Executive Vice President | Vice President, T. Rowe Price, T. Rowe Price Group, Inc., and T. Rowe Price Trust Company |
T. ROWE PRICE ULTRA SHORT-TERM BOND ETF
OFFICERS (continued)
Name (Year of Birth)
Position Held With Fixed Income ETFs | Principal Occupation(s) |
Jodi Love (1977)
Executive Vice President | Vice President, Price Investment Management and T. Rowe Price Group, Inc.; formerly, Managing Director, Jennison Associates LLC (to 2019) |
Paul M. Massaro, CFA (1975)
Executive Vice President | Vice President, T. Rowe Price, T. Rowe Price Group, Inc., and T. Rowe Price Trust Company |
Colin McQueen (1967)
Executive Vice President | Vice President, Price Investment Management and T. Rowe Price Group, Inc.; formerly, Senior Investment Manager, Global Equities, Sanlam FOUR Investments UK Limited (to 2019) |
Jason Nogueira, CFA (1974)
Executive Vice President | Vice President, T. Rowe Price and T. Rowe Price Group, Inc. |
Alexander S. Obaza (1981)
Executive Vice President | Vice President, T. Rowe Price, T. Rowe Price Group, Inc., and T. Rowe Price Trust Company |
Donald J. Peters (1959)
Executive Vice President | Vice President, T. Rowe Price and T. Rowe Price Group, Inc. |
Fran M. Pollack-Matz (1961)
Vice President and Secretary | Vice President, T. Rowe Price, T. Rowe Price Group, Inc., T. Rowe Price Investment Services, Inc., and T. Rowe Price Services, Inc. |
Jason Benjamin Polun, CFA (1974)
Executive Vice President | Vice President, T. Rowe Price, T. Rowe Price Group, Inc., and T. Rowe Price Trust Company |
Jordan S. Pryor (1991)
Executive Vice President | Vice President, T. Rowe Price and T. Rowe Price Group, Inc. |
Shannon H. Rauser (1987)
Assistant Secretary | Assistant Vice President, T. Rowe Price |
Sebastian Schrott (1977)
Executive Vice President | Vice President, T. Rowe Price Group, Inc., and Price International |
Richard Sennett, CPA (1970)
Assistant Treasurer | Vice President, T. Rowe Price, T. Rowe Price Group, Inc., and T. Rowe Price Trust Company |
Gabriel Solomon (1977)
Executive Vice President | Vice President, T. Rowe Price and T. Rowe Price Group, Inc. |
Peter Stournaras (1973)
Executive Vice President | Vice President, T. Rowe Price and T. Rowe Price Group, Inc.; formerly, Managing Director, Chief Portfolio Strategist JP Morgan Private Bank (to 2020); Private Consultant and Advisor, Pteleos Consulting (to 2018) |
Megan Warren (1968)
Vice President | OFAC Sanctions Compliance Officer and Vice President, Price Investment Management; Vice President, T. Rowe Price, T. Rowe Price Group, Inc., T. Rowe Price Retirement Plan Services, Inc., T. Rowe Price Services, Inc., and T. Rowe Price Trust Company |
T. ROWE PRICE ULTRA SHORT-TERM BOND ETF
OFFICERS (continued)
Name (Year of Birth)
Position Held With Fixed Income ETFs | Principal Occupation(s) |
Taymour R. Tamaddon (1976)
Executive Vice President | Vice President, T. Rowe Price and T. Rowe Price Group, Inc. |
Unless otherwise noted, officers have been employees of T. Rowe Price or Price International for at least 5 years.
This page intentionally left blank.
This page intentionally left blank.
This page intentionally left blank.
100 East Pratt Street
Baltimore, MD 21202
Call 1-800-638-5660 to request a prospectus or summary prospectus; each includes investment objectives, risks, fees, expenses, and other information that you should read and consider carefully before investing.
T. Rowe Price Investment Services, Inc.
Item 1. (b) Notice pursuant to Rule 30e-3.
Not applicable.
Item 2. Code of Ethics.
The registrant has adopted a code of ethics, as defined in Item 2 of Form N-CSR, applicable to its principal executive officer, principal financial officer, principal accounting officer or controller, or persons performing similar functions. A copy of this code of ethics is filed as an exhibit to this Form N-CSR. No substantive amendments were approved or waivers were granted to this code of ethics during the period covered by this report.
Item 3. Audit Committee Financial Expert.
The registrant’s Board of Directors has determined that Ms. Teresa Bryce Bazemore qualifies as an audit committee financial expert, as defined in Item 3 of Form N-CSR. Ms. Bazemore is considered independent for purposes of Item 3 of Form N-CSR.
Item 4. Principal Accountant Fees and Services.
(a) – (d) Aggregate fees billed for the last two fiscal years for professional services rendered to, or on behalf of, the registrant by the registrant’s principal accountant were as follows:
| | | | | | | | | | | | | | |
| | | | | 2023 | | | | | | 2022 | |
| | Audit Fees | | $ | 31,609 | | | | | | | $ | 29,899 | |
| | Audit-Related Fees | | | - | | | | | | | | - | |
| | Tax Fees | | | 6,939 | | | | | | | | 6,563 | |
| | All Other Fees | | | - | | | | | | | | - | |
Audit fees include amounts related to the audit of the registrant’s annual financial statements and services normally provided by the accountant in connection with statutory and regulatory filings. Audit-related fees include amounts reasonably related to the performance of the audit of the registrant’s financial statements and specifically include the issuance of a report on internal controls and, if applicable, agreed-upon procedures related to fund acquisitions. Tax fees include amounts related to services for tax compliance, tax planning, and tax advice. The nature of these services specifically includes the review of distribution calculations and the preparation of Federal, state, and excise tax returns. All other fees include the registrant’s pro-rata share of amounts for agreed-upon procedures in conjunction with service contract approvals by the registrant’s Board of Directors/Trustees.
(e)(1) The registrant’s audit committee has adopted a policy whereby audit and non-audit services performed by the registrant’s principal accountant for the registrant, its investment adviser, and any entity controlling, controlled by, or under common control with the investment adviser that provides ongoing services to the registrant require pre-approval in advance at regularly scheduled audit committee meetings. If such a service is required between regularly scheduled audit committee meetings, pre-approval may be authorized by one audit committee member with ratification at the next scheduled audit committee meeting. Waiver of pre-approval for audit or non-audit services requiring fees of a de minimis amount is not permitted.
(2) No services included in (b) – (d) above were approved pursuant to paragraph (c)(7)(i)(C) of Rule 2-01 of Regulation S-X.
(f) Less than 50 percent of the hours expended on the principal accountant’s engagement to audit the registrant’s financial statements for the most recent fiscal year were attributed to work performed by persons other than the principal accountant’s full-time, permanent employees.
(g) The aggregate fees billed for the most recent fiscal year and the preceding fiscal year by the registrant’s principal accountant for non-audit services rendered to the registrant, its investment adviser, and any entity controlling, controlled by, or under common control with the investment adviser that provides ongoing services to the registrant were $1,521,000 and $2,959,000, respectively.
(h) All non-audit services rendered in (g) above were pre-approved by the registrant’s audit committee. Accordingly, these services were considered by the registrant’s audit committee in maintaining the principal accountant’s independence.
Item 5. Audit Committee of Listed Registrants.
Not applicable.
Item 6. Investments.
(a) Not applicable. The complete schedule of investments is included in Item 1 of this Form N-CSR.
(b) Not applicable.
Item 7. Disclosure of Proxy Voting Policies and Procedures for Closed-End Management Investment Companies.
Not applicable.
Item 8. Portfolio Managers of Closed-End Management Investment Companies.
Not applicable.
Item 9. Purchases of Equity Securities by Closed-End Management Investment Company and Affiliated Purchasers.
Not applicable.
Item 10. Submission of Matters to a Vote of Security Holders.
There has been no change to the procedures by which shareholders may recommend nominees to the registrant’s board of directors.
Item 11. Controls and Procedures.
(a) The registrant’s principal executive officer and principal financial officer have evaluated the registrant’s disclosure controls and procedures within 90 days of this filing and have concluded that the registrant’s disclosure controls and procedures were effective, as of that date, in ensuring that information required to be disclosed by the registrant in this Form N-CSR was recorded, processed, summarized, and reported timely.
(b) The registrant’s principal executive officer and principal financial officer are aware of no change in the registrant’s internal control over financial reporting that occurred during the period covered by this report that has materially affected, or is reasonably likely to materially affect, the registrant’s internal control over financial reporting.
Item 12. Disclosure of Securities Lending Activities for Closed-End Management Investment Companies.
Not applicable.
Item 13. Exhibits.
SIGNATURES
Pursuant to the requirements of the Securities Exchange Act of 1934 and the Investment Company Act of 1940, the registrant has duly caused this report to be signed on its behalf by the undersigned, thereunto duly authorized.
| | | | |
| T. Rowe Price Exchange-Traded Funds, Inc. |
| | |
| By | | /s/ David Oestreicher | | |
| | David Oestreicher | | |
| | Principal Executive Officer | | |
| | |
| Date | | July 20, 2023 | | |
Pursuant to the requirements of the Securities Exchange Act of 1934 and the Investment Company Act of 1940, this report has been signed below by the following persons on behalf of the registrant and in the capacities and on the dates indicated.
| | | | |
| By | | /s/ David Oestreicher | | |
| | David Oestreicher | | |
| | Principal Executive Officer | | |
| | |
| Date | | July 20, 2023 | | |
| | |
| By | | /s/ Alan S. Dupski | | |
| | Alan S. Dupski | | |
| | Principal Financial Officer | | |
| | |
| Date | | July 20, 2023 | | |