UNITED STATES
SECURITIES AND EXCHANGE COMMISSION
Washington, D.C. 20549
FORM N-CSR
CERTIFIED SHAREHOLDER REPORT OF REGISTERED
MANAGEMENT INVESTMENT COMPANIES
Investment Company Act File Number: 811-23494
T. Rowe Price Exchange-Traded Funds, Inc.
(Exact name of registrant as specified in charter)
100 East Pratt Street, Baltimore, MD 21202
(Address of principal executive offices)
David Oestreicher
100 East Pratt Street, Baltimore, MD 21202
(Name and address of agent for service)
Registrant’s telephone number, including area code: (410) 345-2000
Date of fiscal year end: October 31
Date of reporting period: October 31, 2023
Item 1. Reports to Shareholders
(a) Report pursuant to Rule 30e-1
ANNUAL REPORT
October 31, 2023
| | T. ROWE PRICE |
| TAGG | QM U.S. Bond ETF |
| | For more insights from T. Rowe Price investment professionals, go to troweprice.com. |
T. ROWE PRICE QM U.S. BOND ETF
HIGHLIGHTS
| ■ | The QM U.S. Bond ETF generated modestly positive returns and performed in line with its benchmark, based on market price, for the reporting period. |
| ■ | Security selection and sector allocations both added value while interest rate volatility weighed on performance. A slight average duration overweight also dragged on relative results. |
| ■ | With our view that rates have likely peaked and that companies have yet to fully feel the effects of financial tightening, we believe it is beneficial to have ample liquidity, while earning yield, to take advantage of future opportunities should market volatility increase. |
| ■ | We believe that additional interest rate hikes are unlikely, and absent a significant reacceleration of economic data or fall in long-term yields, a resumption of rate increases next year is improbable. The Federal Reserve is more likely to rely on higher-for-longer messaging to further tighten financial conditions if necessary. |
Go Paperless
Going paperless offers a host of benefits, which include:
| ■ | Timely delivery of important documents |
| ■ | Convenient access to your documents anytime, anywhere |
| ■ | Strong security protocols to safeguard sensitive data |
If you invest through a financial intermediary such as an investment advisor, a bank, or a brokerage firm, please contact that organization and ask if it can provide electronic documentation.
Log in to your account at troweprice.com for more information.
T. ROWE PRICE QM U.S. BOND ETF
Market Commentary
Dear Shareholder
Most major global stock and bond indexes produced positive results during your fund’s fiscal year, the 12-month period ended October 31, 2023, although a downturn over the past six months offset some of the strong gains recorded in the first half of the period. Global economies managed to avoid the recession that was widely predicted at the start of 2023, but signs that central banks might need to keep interest rates higher for longer than previously expected weighed on market sentiment.
Growth stocks outperformed value shares over the 12-month period, and stocks in developed markets generally outpaced their counterparts in emerging markets. Currency movements were mixed over the period, although a weaker dollar versus major European currencies was beneficial for U.S. investors in European securities.
Technology companies benefited from investor enthusiasm for artificial intelligence developments and produced some of the strongest results in the equity market. Within the S&P 500 Index, the communication services and information technology sectors were lifted by the rally in tech-related companies and recorded significant gains. The financials sector partly recovered from the failure of three large regional banks during the period but still finished in negative territory.
Corporate fundamentals were broadly supportive. Although year-over-year earnings growth contracted in the first and second quarters of 2023, results were better than expected, and preliminary estimates pointed to a resumption of growth in the third quarter.
The U.S. economy was the strongest among the major markets during the period, with gross domestic product growth coming in at 4.9% in the third quarter’s initial estimate, the highest since the end of 2021. Growth in Europe and Japan was more sluggish, and China’s economy was beset by worries about its property sector after an initial boost from its decision at the end of 2022 to lift most of its pandemic-related restrictions. A protracted debt ceiling standoff in the U.S., the ongoing conflict between Ukraine and Russia, and the outbreak of war in the Middle East following the attack on Israel by Hamas produced headwinds for markets at various times.
Investors also remained focused on inflation as price increases moderated but remained well above the Federal Reserve’s 2% target. In response, the Fed continued to raise its short-term lending benchmark rate, lifting it to a target range of 5.25% to 5.50% by the end of July, the highest level since March 2001.
T. ROWE PRICE QM U.S. BOND ETF
U.S. Treasury yields increased as the Fed tightened monetary policy and investors priced in the possibility that the central bank may have to keep rates higher for longer than previously anticipated. In addition, Treasuries were pressured by Fitch Ratings’ decision to downgrade the credit rating of U.S. government debt from the highest level, AAA, to AA+ along with expectations for higher levels of borrowing by the Treasury Department. The yield on the benchmark 10-year Treasury note briefly reached 5.00% in October for the first time since late 2007 before falling back to 4.88% by period-end.
Increasing yields over the past six months led to weak results across most of the fixed income market, although high yield bonds, which are less sensitive to rising rates, held up relatively well as default rates remained low by historical standards.
Global economies and markets showed surprising resilience in 2023, but considerable uncertainty remains as we look ahead to 2024. Geopolitical events, the path of monetary policy, and the impact of the Fed’s rate hikes on the economy all raise the potential for additional volatility. We believe this environment makes skilled active management a critical tool for identifying risks and opportunities, and our investment teams will continue to use fundamental research to identify securities that have the potential to add value to your portfolio over the long term.
Thank you for your continued confidence in T. Rowe Price.
Sincerely,
Robert Sharps
CEO and President
T. ROWE PRICE QM U.S. BOND ETF
Management’s Discussion of Fund Performance
INVESTMENT OBJECTIVE
The fund seeks to provide a total return that exceeds the performance of the U.S. investment-grade bond market.
FUND COMMENTARY
How did the fund perform in the past 12 months?
The QM U.S. Bond ETF returned 0.45% (based on net asset value) and 0.34% (at market price) for the 12 months through October 31, 2023, compared with 0.36% for the Bloomberg U.S. Aggregate Bond Index, as shown in the Performance Comparison table. (Past performance cannot guarantee future results.)
What factors influenced the fund’s performance?
The fund recorded a modest gain for the one-year period despite a sharp rise in U.S. Treasury yields, benefiting from higher coupon return. Shorter-maturity yields rose the most as the Federal Reserve hiked policy rates six times during the period, raising the upper end of the target range to 5.5%, but intermediate- and
PERFORMANCE COMPARISON
| | Total Return |
| Periods Ended 10/31/23 | 6 Months | 12 months |
| QM U.S. Bond ETF (Based on Net Asset Value) | -6.21% | 0.45% |
| QM U.S. Bond ETF (At Market Price)* | -6.53 | 0.34 |
| Bloomberg U.S. Aggregate Bond Index | -6.13 | 0.36 |
*Market returns are based on the midpoint of the bid/ask spread at market close (typically, 4 p.m. ET) and do not represent returns an investor would have received if shares were traded at other times.
T. ROWE PRICE QM U.S. BOND ETF
longer-term Treasury yields also climbed higher as the market increasingly expected the Fed to keep rates “higher for longer.” In addition, supply pressures weighed on longer-term debt prices.
Security selection and sector allocations added value versus the benchmark for the period. Security selection within U.S. Treasuries was positive as exposure to longer-term U.S. Treasury securities helped. Out-of-benchmark exposure to non-agency residential mortgage-backed securities (MBS) contributed as the sector benefited from light supply, a rebound in national home prices, and increased risk appetite on fading recession concerns. While modestly underweighting investment-grade (IG) corporate bonds, on a risk-adjusted basis, weighed on relative performance, the fund’s risk overweight in the government-related sector, expressed mostly through taxable municipal securities, boosted performance. Overweight exposure in asset-backed securities (ABS) and commercial mortgage-backed securities also benefited the fund as these sectors outperformed on a risk-adjusted basis for the year, benefiting from their yield advantage versus Treasuries.
However, elevated interest rate volatility was a headwind for the fund, and duration positioning also dragged on relative results. (Duration is a measure of a bond’s or a bond portfolio’s sensitivity to interest rate changes.) Though duration was taken short relative to the benchmark in certain periods, the fund’s structural preference for a small duration overweight relative to the benchmark detracted in the rising rate environment. The fund’s cash holdings and overweight at the front end of the curve, however, provided beneficial carry with the yield curve inverted. (Carry is the excess income earned from holding a higher-yielding security relative to another.)
How is the fund positioned?
Most nominal sector allocations were generally steady over the year, but we added to U.S. Treasury securities at attractive yields, while our notional corporate exposure slightly ticked down. The fund held a sizable portion of assets in agency mortgage-backed securities, which can offer attractive yield and liquidity benefits. Spreads also gapped wider in September, and we believe agency MBS spreads could benefit once interest rate volatility subsides. We also trimmed our taxable municipal exposure.
The fund maintained an underweight in the IG corporate sector on a risk-weighted basis, which can help dampen volatility. While corporate credit spreads have the potential to tighten through the remainder of 2023 based on seasonal factors, and corporate fundamentals have been resilient, we believe longer-term concerns remain around the lagged effects of tighter monetary
T. ROWE PRICE QM U.S. BOND ETF
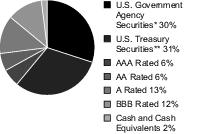
CREDIT QUALITY DIVERSIFICATION
Based on net assets as of 10/31/23.
Sources: Credit ratings for the securities held in the fund are provided by Moody’s, Standard & Poor’s, and Fitch and are converted to the Standard & Poor’s nomenclature. A rating of AAA represents the highest-rated securities, and a rating of D represents the lowest-rated securities. If the rating agencies differ, the highest rating is applied to the security. If a rating is not available, the security is classified as Not Rated. T. Rowe Price uses the rating of the underlying investment vehicle to determine the creditworthiness of credit default swaps. The fund is not rated by any agency.
*U.S. government agency securities are issued or guaranteed by a U.S. government agency and may include conventional pass-through securities and collateralized mortgage obligations; unlike Treasuries, government agency securities are not issued directly by the U.S. government and are generally unrated but may have credit support from the U.S. Treasury (e.g., FHLMC and FNMA issues) or a direct government guarantee (e.g., GNMA issues). Therefore, this category may include rated and unrated securities.
**U.S. Treasury securities are issued by the U.S. Treasury and are backed by the full faith and credit of the U.S. government. The ratings of U.S. Treasury securities are derived from the ratings on the U.S. government.
T. ROWE PRICE QM U.S. BOND ETF
policy on corporate earnings. If the economy slows, as the Fed desires to control inflation, corporates could experience increased rating downgrades as the cost of borrowing increases.
With our view that rates have likely peaked in the U.S., and that companies have yet to fully feel the effects of financial tightening, we believe it is beneficial to have ample liquidity, while earning yield, to take advantage of future opportunities should market volatility increase.
Though we made tactical shifts in duration over the year, the fund maintained a neutral- to long duration posture versus the benchmark for most of the period as we believe overweighting duration can be complementary to the fund’s holdings in credit sectors. We held more conviction in a longer-duration stance after Treasury yields sold off meaningfully and the Federal Reserve appeared to be nearing the end of its policy tightening.
What is portfolio management’s outlook?
Core inflation has gradually slowed, and the labor market has been loosening in an orderly fashion, giving the Federal Reserve greater flexibility with monetary policy. We believe that additional interest rate hikes are unlikely, and absent a significant reacceleration of economic data or fall in long-term yields, a resumption of rate increases next year is improbable. The Federal Reserve is more likely to rely on higher-for-longer messaging to further tighten financial conditions if necessary.
While the risk environment remains supportive for now, we are concerned that we have yet to feel the full force of monetary policy tightening. Moreover, bank funding conditions remain fragile, and while banking system stress has dissipated since March, ongoing quantitative tightening and deposit outflows are likely to cause more funding stress for regional banks. This could further impede the flow of credit to the economy and contribute to higher risk-asset volatility. Some of our longer-term quantitative models are also sending bearish signals for corporate credit.
We continue to look to earn yield in the portfolio above the benchmark and to use our research capabilities to take advantage of the structural inefficiencies that are prevalent in fixed income markets and benchmarks. We remain confident in our investment approach, which is built on a foundation of quantitative portfolio construction elements, augmented with fundamental insights from our deep global credit research platform.
T. ROWE PRICE QM U.S. BOND ETF
RISKS OF INVESTING IN FIXED INCOME SECURITIES
Funds that invest in fixed income securities are subject to price declines due to rising interest rates, with long-term securities generally most sensitive to rate fluctuations. Other risks include credit rating downgrades and defaults on scheduled interest and principal payments. Mortgage-backed securities are subject to prepayment risk, particularly if falling rates lead to heavy refinancing activity, and extension risk, which results from an increase in interest rates that causes a mortgage bond’s average maturity to lengthen unexpectedly due to a drop in mortgage prepayments. This would increase the fund’s sensitivity to rising interest rates and its potential for price declines.
BENCHMARK INFORMATION
Note: Bloomberg® and the Bloomberg U.S. Aggregate Bond Index are service marks of Bloomberg Finance L.P. and its affiliates, including Bloomberg Index Services Limited (“BISL”), the administrator of the index (collectively, “Bloomberg”) and have been licensed for use for certain purposes by T. Rowe Price. Bloomberg is not affiliated with T. Rowe Price, and Bloomberg does not approve, endorse, review, or recommend its products. Bloomberg does not guarantee the timeliness, accurateness, or completeness of any data or information relating to its products.
Note: Copyright © 2023 Fitch Ratings, Inc., Fitch Ratings Ltd. and its subsidiaries.
Note: © 2023, Moody’s Corporation, Moody’s Investors Service, Inc., Moody’s Analytics, Inc. and/or their licensors and affiliates (collectively, “Moody’s”). All rights reserved. Moody’s ratings and other information (“Moody’s Information”) are proprietary to Moody’s and/or its licensors and are protected by copyright and other intellectual property laws. Moody’s Information is licensed to Client by Moody’s. MOODY’S INFORMATION MAY NOT BE COPIED OR OTHERWISE REPRODUCED, REPACKAGED, FURTHER TRANSMITTED, TRANSFERRED, DISSEMINATED, REDISTRIBUTED OR RESOLD, OR STORED FOR SUBSEQUENT USE FOR ANY SUCH PURPOSE, IN WHOLE OR IN PART, IN ANY FORM OR MANNER OR BY ANY MEANS WHATSOEVER, BY ANY PERSON WITHOUT MOODY’S PRIOR WRITTEN CONSENT. Moody’s ® is a registered trademark.
The views expressed reflect the opinions of T. Rowe Price as of the date of this report and are subject to change based on changes in market, economic, or other conditions. These views are not intended to be a forecast of future events and are no guarantee of future results.
T. ROWE PRICE QM U.S. BOND ETF
Note: Copyright © 2023, S&P Global Market Intelligence (and its affiliates, as applicable). Reproduction of any information, data or material, including ratings (“Content”) in any form is prohibited except with the prior written permission of the relevant party. Such party, its affiliates and suppliers (“Content Providers”) do not guarantee the accuracy, adequacy, completeness, timeliness or availability of any Content and are not responsible for any errors or omissions (negligent or otherwise), regardless of the cause, or for the results obtained from the use of such Content. In no event shall Content Providers be liable for any damages, costs, expenses, legal fees, or losses (including lost income or lost profit and opportunity costs) in connection with any use of the Content. A reference to a particular investment or security, a rating or any observation concerning an investment that is part of the Content is not a recommendation to buy, sell or hold such investment or security, does not address the appropriateness of an investment or security and should not be relied on as investment advice. Credit ratings are statements of opinions and are not statements of fact.
T. ROWE PRICE QM U.S. BOND ETF
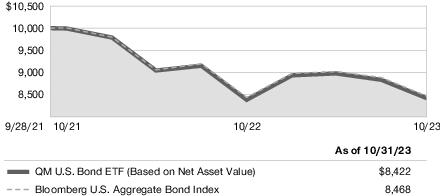
GROWTH OF $10,000
This chart shows the value of a hypothetical $10,000 investment in the fund over the past 10 fiscal year periods or since inception (for funds lacking 10-year records). The result is compared with benchmarks, which include a broad-based market index and may also include a peer group average or index. Market indexes do not include expenses, which are deducted from fund returns as well as mutual fund averages and indexes.
QM U.S. Bond ETF
Note: See the Average Annual Compound Total Return table.
AVERAGE ANNUAL COMPOUND TOTAL RETURN
| Periods Ended 10/31/23 | One Year | Since
Inception
9/28/21 |
| QM U.S. Bond ETF (Based on Net Asset Value) | 0.45% | -7.89% |
| QM U.S. Bond ETF (At Market Price) | 0.34 | -8.01 |
This table shows how the fund would have performed each year if its actual (or cumulative) returns for the periods shown had been earned at a constant rate. Average annual total return figures include changes in principal value, reinvested dividends, and capital gain distributions. Returns do not reflect taxes that the shareholder may pay on fund distributions or the redemption of fund shares. When assessing performance, investors should consider both short- and long-term returns. Past performance cannot guarantee future results. Market returns are based on the midpoint of the bid/ask spread at market close (typically, 4 p.m. ET) and do not represent returns an investor would have received if shares were traded at other times.
T. ROWE PRICE QM U.S. BOND ETF
PREMIUM/DISCOUNT INFORMATION
The frequency at which the daily market prices were at a discount or premium to the fund’s net asset value is available on the fund’s website (troweprice.com).
EXPENSE RATIO
The expense ratio shown is as of the fund’s most recent prospectus. This number may vary from the expense ratio shown elsewhere in this report because it is based on a different time period and, if applicable, includes acquired fund fees and expenses but does not include fee or expense waivers.
T. ROWE PRICE QM U.S. BOND ETF
FUND EXPENSE EXAMPLE
As a shareholder, you may incur two types of costs: (1) transaction costs, such as brokerage commissions on purchases and sales, and (2) ongoing costs, including management fees and other fund expenses. The following example is intended to help you understand your ongoing costs (in dollars) of investing in the fund and to compare these costs with the ongoing costs of investing in other funds. The example is based on an investment of $1,000 invested at the beginning of the most recent six-month period and held for the entire period.
Actual Expenses
The first line of the following table (Actual) provides information about actual account values and expenses based on the fund’s actual returns. You may use the information on this line, together with your account balance, to estimate the expenses that you paid over the period. Simply divide your account value by $1,000 (for example, an $8,600 account value divided by $1,000 = 8.6), then multiply the result by the number on the first line under the heading “Expenses Paid During Period” to estimate the expenses you paid on your account during this period.
Hypothetical Example for Comparison Purposes
The information on the second line of the table (Hypothetical) is based on hypothetical account values and expenses derived from the fund’s actual expense ratio and an assumed 5% per year rate of return before expenses (not the fund’s actual return). You may compare the ongoing costs of investing in the fund with other funds by contrasting this 5% hypothetical example and the 5% hypothetical examples that appear in the shareholder reports of the other funds. The hypothetical account values and expenses may not be used to estimate the actual ending account balance or expenses you paid for the period.
You should also be aware that the expenses shown in the table highlight only your ongoing costs and do not reflect any transaction costs, such as brokerage commissions paid on purchases and sales of shares. Therefore, the second line of the table is useful in comparing ongoing costs only and will not help you determine the relative total costs of owning different funds. To the extent a fund charges transaction costs, however, the total cost of owning that fund is higher.
T. ROWE PRICE QM U.S. BOND ETF
QM U.S. Bond ETF
| | Beginning
Account Value
5/1/23 | Ending
Account Value
10/31/23 | Expenses Paid
During Period*
5/1/23 to 10/31/23 |
| Actual | $1,000.00 | $937.90 | $0.39 |
| Hypothetical (assumes 5% return before expenses) | 1,000.00 | 1,024.80 | 0.41 |
| * | Expenses are equal to the fund’s annualized expense ratio for the 6-month period (0.08%), multiplied by the average account value over the period, multiplied by the number of days in the most recent fiscal half year (184), and divided by the days in the year (365) to reflect the half-year period. |
T. ROWE PRICE QM U.S. BOND ETF
QUARTER-END RETURNS
| Periods Ended 9/30/23 | One Year | Since
Inception
9/28/21 |
| QM U.S. Bond ETF (Based on Net Asset Value) | 0.55% | -7.46% |
| QM U.S. Bond ETF (At Market Price) | 0.52 | -7.49 |
The fund’s performance information represents only past performance and is not necessarily an indication of future results. Current performance may be lower or higher than the performance data cited. Share price, principal value, and return will vary, and you may have a gain or loss when you sell your shares. Market returns are based on the midpoint of the bid/ask spread at market close (typically, 4 p.m. ET) and do not represent returns an investor would receive if shares were traded at other times. For the most recent month-end performance, please visit our website (troweprice.com) or contact a T. Rowe Price representative at 1-800-225-5132.
This table provides returns through the most recent calendar quarter-end rather than through the end of the fund’s fiscal period. It shows how the fund would have performed each year if its actual (or cumulative) returns for the periods shown had been earned at a constant rate. Average annual total return figures include changes in principal value, reinvested dividends, and capital gain distributions. Returns do not reflect taxes that the shareholder may pay on fund distributions or the redemption of fund shares. When assessing performance, investors should consider both short- and long-term returns.
T. ROWE PRICE QM U.S. BOND ETF
For a share outstanding throughout each period
| | Year
Ended | Year
Ended | 9/28/21 (1)
Through |
| | 10/31/23 | 10/31/22 | 10/31/21 |
| NET ASSET VALUE | | | |
| Beginning of period | $ 41.11 | $ 49.96 | $ 50.00 |
| Investment activities | | | |
| Net investment income(2) (3) | 1.54 | 0.90 | 0.06 |
| Net realized and unrealized gain/loss | (1.31) | (8.87) | (0.07) |
| Total from investment activities | 0.23 | (7.97) | (0.01) (4) |
| Distributions | | | |
| Net investment income | (1.41) | (0.87) | (0.03) |
| Net realized gain | - | (0.01) | - |
| Total distributions | (1.41) | (0.88) | (0.03) |
| NET ASSET VALUE | | | |
| End of period | $ 39.93 | $ 41.11 | $ 49.96 |
T. ROWE PRICE QM U.S. BOND ETF
For a share outstanding throughout each period
| | Year
Ended | Year
Ended | 9/28/21 (1)
Through |
| | 10/31/23 | 10/31/22 | 10/31/21 |
| Ratios/Supplemental Data |
| Total return, based on NAV(3) (5) | 0.45% | (16.09)% | (0.08)% |
Ratios to average net
assets:(3) | | | |
Gross expenses before
waivers/payments by
Price Associates | 0.08% | 0.08% | 0.08% (6) |
Net expenses after
waivers/payments by
Price Associates | 0.08% | 0.08% | 0.08% (6) |
| Net investment income | 3.66% | 1.96% | 1.29% (6) |
| Portfolio turnover rate(7) | 211.9% | 403.7% | 50.9% |
| Portfolio turnover rate, excluding mortgage dollar roll transactions | 41.7% | 35.1% | 11.7% |
Net assets, end of period
(in thousands) | $ 103,819 | $ 35,973 | $ 27,477 |
| (1) | Inception date |
| (2) | Per share amounts calculated using average shares outstanding method. |
| (3) | See Note 6 for details to expense-related arrangements with Price Associates. |
| (4) | The amount presented is inconsistent with the fund's results of operations because of the timing of redemptions of fund shares in relation to fluctuating market values for the investment portfolio. |
| (5) | Total return reflects the rate that an investor would have earned on an investment in the fund during each period, assuming reinvestment of all distributions. Total return is not annualized for periods less than one year. |
| (6) | Annualized |
| (7) | See Note 4. The portfolio turnover rate calculation includes purchases and sales from the mortgage dollar roll transactions. |
The accompanying notes are an integral part of these financial statements.
T. ROWE PRICE QM U.S. BOND ETF
October 31, 2023
| PORTFOLIO OF INVESTMENTS‡ | Par/Shares | $ Value |
| (Amounts in 000s) | | |
| ASSET-BACKED SECURITIES 3.9% |
| Car Loan 1.5% | | |
| AmeriCredit Automobile Receivables Trust, Series 2020-1, Class C, 1.59%, 10/20/25 | 55 | 54 |
| CarMax Auto Owner Trust, Series 2021-1, Class D, 1.28%, 7/15/27 | 100 | 93 |
| CarMax Auto Owner Trust, Series 2023-3, Class A3, 5.28%, 5/15/28 | 75 | 74 |
| CarMax Auto Owner Trust, Series 2023-3, Class B, 5.47%, 2/15/29 | 65 | 63 |
| Carvana Auto Receivables Trust, Series 2021-P4, Class C, 2.33%, 2/10/28 | 45 | 39 |
| Chase Auto Credit Linked Notes, Series 2021-3, Class B, 0.76%, 2/26/29 (1) | 230 | 221 |
| Enterprise Fleet Financing, Series 2021-2, Class A3, 0.74%, 5/20/27 (1) | 300 | 279 |
| Enterprise Fleet Financing, Series 2023-2, Class A2, 5.56%, 4/22/30 (1) | 105 | 104 |
| Exeter Automobile Receivables Trust, Series 2021-4A, Class C, 1.46%, 10/15/27 | 65 | 63 |
| Ford Credit Auto Owner Trust, Series 2020-1, Class C, 2.54%, 8/15/31 (1) | 300 | 284 |
| Ford Credit Auto Owner Trust, Series 2023-1, Class A, 4.85%, 8/15/35 (1) | 100 | 96 |
| GM Financial Automobile Leasing Trust, Series 2023-1, Class C, 5.76%, 1/20/27 | 75 | 74 |
| Santander Drive Auto Receivables Trust, Series 2022-3, Class C, 4.49%, 8/15/29 | 40 | 38 |
| | | 1,482 |
| Credit Card 0.1% | | |
| Synchrony Card Funding, Series 2023-A1, Class A, 5.54%, 7/15/29 | 115 | 114 |
| | | 114 |
T. ROWE PRICE QM U.S. BOND ETF
| | Par/Shares | $ Value |
| (Amounts in 000s) | | |
| Other Asset-Backed Securities 2.0% | | |
| CIFC Funding, Series 2021-4A, Class A, CLO, FRN, 3M TSFR + 1.31%, 6.705%, 7/15/33 (1) | 280 | 277 |
| DLLAA, Series 2023-1A, Class A3, 5.64%, 2/22/28 (1) | 60 | 59 |
| DLLAA, Series 2023-1A, Class A4, 5.73%, 10/20/31 (1) | 70 | 68 |
| Elara HGV Timeshare, Series 2023-A, Class A, 6.16%, 2/25/38 (1) | 100 | 99 |
| Elara HGV Timeshare, Series 2023-A, Class B, 6.53%, 2/25/38 (1) | 100 | 100 |
| FirstKey Homes Trust, Series 2020-SFR2, Class B, 1.567%, 10/19/37 (1) | 310 | 281 |
| HPEFS Equipment Trust, Series 2021-1A, Class D, 1.03%, 3/20/31 (1) | 265 | 260 |
| MMAF Equipment Finance, Series 2022-A, Class A4, 3.32%, 6/13/44 (1) | 100 | 94 |
| MMAF Equipment Finance, Series 2022-B, Class A3, 5.61%, 7/10/28 (1) | 169 | 168 |
| Octane Receivables Trust, Series 2023-1A, Class A, 5.87%, 5/21/29 (1) | 70 | 70 |
| Progress Residential Trust, Series 2020-SFR1, Class C, 2.183%, 4/17/37 (1) | 100 | 94 |
| Symphony Static, Series 2021-1A, Class A, CLO, FRN, 3M TSFR + 1.09%, 6.47%, 10/25/29 (1) | 181 | 180 |
| Tricon American Homes, Series 2019-SFR1, Class D, 3.198%, 3/17/38 (1) | 230 | 212 |
| Verdant Receivables, Series 2023-1A, Class A2, 6.24%, 1/13/31 (1) | 130 | 129 |
| | | 2,091 |
| Student Loan 0.3% | | |
| Navient Private Education Refi Loan Trust, Series 2019-CA, Class A2, 3.13%, 2/15/68 (1) | 84 | 80 |
| Navient Private Education Refi Loan Trust, Series 2020-A, Class A2A, 2.46%, 11/15/68 (1) | 122 | 112 |
| Nelnet Student Loan Trust, Series 2021-CA, Class AFX, 1.32%, 4/20/62 (1) | 56 | 49 |
T. ROWE PRICE QM U.S. BOND ETF
| | Par/Shares | $ Value |
| (Amounts in 000s) | | |
| Nelnet Student Loan Trust, Series 2021-DA, Class AFX, 1.63%, 4/20/62 (1) | 83 | 74 |
| | | 315 |
Total Asset-Backed Securities
(Cost $4,069) | | 4,002 |
| CORPORATE BONDS 26.3% |
| FINANCIAL INSTITUTIONS 10.2% | | |
| Banking 7.0% | | |
| Ally Financial, 2.20%, 11/2/28 (2) | 35 | 27 |
| Bank of America, VR, 0.976%, 4/22/25 (3) | 100 | 97 |
| Bank of America, VR, 2.572%, 10/20/32 (3) | 65 | 49 |
| Bank of America, VR, 2.592%, 4/29/31 (3) | 310 | 245 |
| Bank of America, VR, 2.676%, 6/19/41 (3) | 230 | 140 |
| Bank of America, VR, 3.824%, 1/20/28 (3) | 215 | 198 |
| Bank of America, 4.00%, 1/22/25 | 70 | 68 |
| Bank of America, VR, 4.244%, 4/24/38 (3) | 15 | 12 |
| Bank of America, 5.875%, 2/7/42 | 15 | 14 |
| Bank of Montreal, 2.65%, 3/8/27 | 70 | 62 |
| Banque Federative du Credit Mutuel, 4.935%, 1/26/26 (1) | 300 | 291 |
| Barclays, VR, 2.279%, 11/24/27 (3) | 200 | 175 |
| Barclays, VR, 2.852%, 5/7/26 (3) | 200 | 189 |
| Capital One Financial, VR, 2.359%, 7/29/32 (3) | 50 | 33 |
| Capital One Financial, 3.65%, 5/11/27 | 155 | 140 |
| Capital One Financial, 3.90%, 1/29/24 (2) | 85 | 84 |
| Capital One Financial, 4.20%, 10/29/25 | 25 | 24 |
| Citigroup, VR, 3.106%, 4/8/26 (3) | 25 | 24 |
| Citigroup, VR, 3.887%, 1/10/28 (3) | 430 | 399 |
| Citigroup, 4.65%, 7/30/45 | 15 | 12 |
| Citigroup, 5.875%, 1/30/42 | 95 | 87 |
| Danske Bank, VR, 3.244%, 12/20/25 (1)(3) | 255 | 244 |
| Danske Bank, VR, 4.298%, 4/1/28 (1)(3) | 200 | 184 |
| Discover Financial Services, 3.75%, 3/4/25 | 105 | 101 |
| Fifth Third Bancorp, VR, 6.339%, 7/27/29 (3) | 45 | 44 |
T. ROWE PRICE QM U.S. BOND ETF
| | Par/Shares | $ Value |
| (Amounts in 000s) | | |
| Goldman Sachs Group, VR, 1.948%, 10/21/27 (3) | 65 | 57 |
| Goldman Sachs Group, VR, 2.615%, 4/22/32 (3) | 150 | 114 |
| Goldman Sachs Group, VR, 3.272%, 9/29/25 (3) | 220 | 214 |
| Goldman Sachs Group, 3.50%, 1/23/25 | 85 | 82 |
| Goldman Sachs Group, 3.80%, 3/15/30 (2) | 140 | 121 |
| Goldman Sachs Group, 4.25%, 10/21/25 | 25 | 24 |
| Goldman Sachs Group, 6.75%, 10/1/37 | 15 | 15 |
| HSBC Holdings, VR, 1.162%, 11/22/24 (3) | 200 | 199 |
| HSBC Holdings, VR, 2.013%, 9/22/28 (3) | 265 | 222 |
| ING Groep, VR, 6.114%, 9/11/34 (3) | 200 | 187 |
| JPMorgan Chase, VR, 1.578%, 4/22/27 (3) | 125 | 111 |
| JPMorgan Chase, VR, 2.956%, 5/13/31 (3) | 275 | 222 |
| JPMorgan Chase, VR, 3.109%, 4/22/51 (3) | 15 | 9 |
| JPMorgan Chase, VR, 3.54%, 5/1/28 (2)(3) | 15 | 14 |
| JPMorgan Chase, VR, 3.782%, 2/1/28 (3) | 95 | 88 |
| JPMorgan Chase, VR, 3.882%, 7/24/38 (3) | 265 | 204 |
| Morgan Stanley, VR, 2.188%, 4/28/26 (3) | 125 | 117 |
| Morgan Stanley, 3.125%, 7/27/26 | 135 | 125 |
| Morgan Stanley, VR, 3.217%, 4/22/42 (3) | 205 | 135 |
| Morgan Stanley, VR, 3.622%, 4/1/31 (3) | 10 | 8 |
| Morgan Stanley, 4.30%, 1/27/45 | 15 | 11 |
| PNC Financial Services, VR, 4.758%, 1/26/27 (3) | 180 | 173 |
| PNC Financial Services Group, VR, 4.626%, 6/6/33 (3) | 110 | 91 |
| Royal Bank of Canada, 2.30%, 11/3/31 | 50 | 37 |
| Santander Holdings USA, VR, 6.499%, 3/9/29 (3) | 80 | 77 |
| Standard Chartered, VR, 1.822%, 11/23/25 (1)(3) | 200 | 189 |
| State Street, VR, 4.857%, 1/26/26 (3) | 55 | 54 |
| Sumitomo Mitsui Financial Group, 5.464%, 1/13/26 | 200 | 197 |
| Toronto-Dominion Bank, 1.15%, 6/12/25 | 185 | 171 |
| Toronto-Dominion Bank, 4.456%, 6/8/32 (2) | 95 | 83 |
| UBS Group, VR, 1.364%, 1/30/27 (1)(3) | 200 | 177 |
| UBS Group, VR, 2.193%, 6/5/26 (1)(3) | 250 | 233 |
| Wells Fargo, VR, 2.188%, 4/30/26 (3) | 185 | 174 |
T. ROWE PRICE QM U.S. BOND ETF
| | Par/Shares | $ Value |
| (Amounts in 000s) | | |
| Wells Fargo, VR, 2.393%, 6/2/28 (3) | 430 | 375 |
| | | 7,253 |
| Brokerage Asset Managers Exchanges 0.0% | | |
| Intercontinental Exchange, 1.85%, 9/15/32 (2) | 15 | 11 |
| Nasdaq, 5.95%, 8/15/53 (2) | 15 | 13 |
| | | 24 |
| Finance Companies 0.7% | | |
| AerCap Ireland Capital, 2.45%, 10/29/26 | 150 | 133 |
| AerCap Ireland Capital DAC / AerCap Global Aviation Trust, 5.75%, 6/6/28 | 150 | 144 |
| AerCap Ireland Capital DAC/AerCap Global Aviation Trust, 6.15%, 9/30/30 | 150 | 143 |
| Avolon Holdings Funding, 3.95%, 7/1/24 (1) | 75 | 73 |
| Avolon Holdings Funding, 6.375%, 5/4/28 (1) | 150 | 145 |
| Park Aerospace Holdings, 5.50%, 2/15/24 (1) | 45 | 45 |
| | | 683 |
| Insurance 1.5% | | |
| American International Group, 3.875%, 1/15/35 (2) | 40 | 32 |
| Anthem, 2.25%, 5/15/30 | 60 | 48 |
| Anthem, 4.101%, 3/1/28 | 15 | 14 |
| Anthem, 4.55%, 3/1/48 | 30 | 23 |
| Anthem, 4.65%, 1/15/43 | 85 | 68 |
| Aon, 3.875%, 12/15/25 | 135 | 129 |
| Brighthouse Financial Global Funding, 1.00%, 4/12/24 (1) | 50 | 49 |
| Chubb INA Holdings, 3.35%, 5/15/24 | 85 | 84 |
| Fidelity National Financial, 4.50%, 8/15/28 | 70 | 64 |
| First American Financial, 4.60%, 11/15/24 | 70 | 69 |
| Health Care Service, 2.20%, 6/1/30 (1) | 15 | 12 |
| Humana, 2.15%, 2/3/32 | 85 | 63 |
| Humana, 3.70%, 3/23/29 (2) | 20 | 18 |
| Jackson Financial, 1.125%, 11/22/23 | 65 | 65 |
| Marsh & McLennan, 3.50%, 6/3/24 | 20 | 20 |
T. ROWE PRICE QM U.S. BOND ETF
| | Par/Shares | $ Value |
| (Amounts in 000s) | | |
| New York Life Insurance, 3.75%, 5/15/50 (1) | 20 | 13 |
| Principal Financial Group, 2.125%, 6/15/30 (2) | 215 | 166 |
| Principal Financial Group, 3.40%, 5/15/25 | 10 | 10 |
| Principal Financial Group, 3.70%, 5/15/29 | 75 | 67 |
| Principal Life Global Funding II, 0.75%, 4/12/24 (1) | 70 | 68 |
| Teachers Insurance & Annuity Association of America, 4.27%, 5/15/47 (1) | 20 | 14 |
| UnitedHealth Group, 2.00%, 5/15/30 | 10 | 8 |
| UnitedHealth Group, 3.50%, 8/15/39 | 320 | 234 |
| UnitedHealth Group, 3.75%, 7/15/25 | 40 | 39 |
| UnitedHealth Group, 4.20%, 1/15/47 | 35 | 26 |
| UnitedHealth Group, 4.75%, 7/15/45 | 150 | 122 |
| | | 1,525 |
| Real Estate Investment Trusts 1.0% | | |
| Alexandria Real Estate Equities, 3.95%, 1/15/27 | 40 | 37 |
| Alexandria Real Estate Equities, 4.00%, 2/1/50 | 40 | 26 |
| Brixmor Operating Partnership, 3.85%, 2/1/25 | 60 | 58 |
| Brixmor Operating Partnership, 3.90%, 3/15/27 | 15 | 14 |
| Brixmor Operating Partnership, 4.05%, 7/1/30 | 85 | 73 |
| Essex Portfolio, 2.65%, 3/15/32 (2) | 35 | 27 |
| Essex Portfolio, 3.875%, 5/1/24 (2) | 45 | 45 |
| Essex Portfolio, 4.50%, 3/15/48 | 20 | 15 |
| Extra Space Storage, 4.00%, 6/15/29 | 15 | 13 |
| GAIF Bond Issuer, 3.40%, 9/30/26 (1) | 15 | 14 |
| Healthpeak Properties, 2.125%, 12/1/28 | 15 | 12 |
| Healthpeak Properties, 2.875%, 1/15/31 | 15 | 12 |
| Kilroy Realty, 3.45%, 12/15/24 | 35 | 34 |
| Kilroy Realty, 4.25%, 8/15/29 | 150 | 125 |
| Kilroy Realty, 4.375%, 10/1/25 | 65 | 62 |
| Physicians Realty, 2.625%, 11/1/31 | 15 | 11 |
| Prologis, 4.00%, 9/15/28 | 35 | 32 |
| Public Storage, 1.95%, 11/9/28 | 35 | 29 |
| Public Storage, 5.35%, 8/1/53 | 40 | 34 |
T. ROWE PRICE QM U.S. BOND ETF
| | Par/Shares | $ Value |
| (Amounts in 000s) | | |
| Realty Income, 3.95%, 8/15/27 | 25 | 23 |
| Realty Income, 4.625%, 11/1/25 | 240 | 234 |
| Regency Centers, 3.60%, 2/1/27 | 40 | 37 |
| Simon Property Group, 3.375%, 10/1/24 (2) | 110 | 107 |
| Simon Property Group, 3.80%, 7/15/50 | 35 | 22 |
| | | 1,096 |
| Total Financial Institutions | | 10,581 |
| INDUSTRIAL 14.6% | | |
| Basic Industry 0.2% | | |
| LYB International Finance II, 3.50%, 3/2/27 | 25 | 23 |
| Westlake, 3.375%, 6/15/30 | 150 | 125 |
| Yara International, 7.378%, 11/14/32 (1)(2) | 100 | 102 |
| | | 250 |
| Capital Goods 0.5% | | |
| General Dynamics, 3.25%, 4/1/25 | 10 | 10 |
| John Deere Capital, 2.125%, 3/7/25 | 50 | 48 |
| John Deere Capital, 2.65%, 6/10/26 (2) | 15 | 14 |
| L3Harris Technologies, 3.832%, 4/27/25 | 60 | 58 |
| Mohawk Industries, 5.85%, 9/18/28 (2) | 125 | 123 |
| Northrop Grumman, 3.85%, 4/15/45 | 15 | 10 |
| Parker-Hannifin, 4.50%, 9/15/29 (2) | 25 | 23 |
| Republic Services, 2.50%, 8/15/24 | 70 | 68 |
| Republic Services, 3.375%, 11/15/27 | 65 | 60 |
| Republic Services, 5.00%, 4/1/34 | 15 | 14 |
| Waste Connections, 3.20%, 6/1/32 | 65 | 52 |
| | | 480 |
| Communications 3.4% | | |
| America Movil SAB de CV, 2.875%, 5/7/30 | 200 | 164 |
| America Movil SAB de CV, 6.375%, 3/1/35 | 85 | 86 |
| American Tower, 2.40%, 3/15/25 | 115 | 109 |
| American Tower, 5.00%, 2/15/24 | 60 | 60 |
T. ROWE PRICE QM U.S. BOND ETF
| | Par/Shares | $ Value |
| (Amounts in 000s) | | |
| AT&T, 2.25%, 2/1/32 (2) | 590 | 436 |
| Charter Communications Operating, 2.80%, 4/1/31 | 245 | 187 |
| Charter Communications Operating, 3.70%, 4/1/51 | 255 | 140 |
| Charter Communications Operating, 4.50%, 2/1/24 | 60 | 60 |
| Charter Communications Operating, 4.908%, 7/23/25 | 220 | 215 |
| Comcast, 2.65%, 2/1/30 | 40 | 33 |
| Comcast, 3.95%, 10/15/25 | 225 | 218 |
| Cox Communications, 3.15%, 8/15/24 (1) | 15 | 15 |
| Crown Castle International, 2.25%, 1/15/31 | 25 | 19 |
| Crown Castle International, 2.90%, 3/15/27 | 10 | 9 |
| Crown Castle International, 3.70%, 6/15/26 | 80 | 75 |
| Crown Castle International, 4.45%, 2/15/26 | 60 | 58 |
| Meta Platforms, 5.60%, 5/15/53 (2) | 300 | 270 |
| Rogers Communications, 3.625%, 12/15/25 | 40 | 38 |
| Rogers Communications, 4.50%, 3/15/42 | 85 | 63 |
| Time Warner Cable, 6.55%, 5/1/37 | 50 | 44 |
| Time Warner Cable, 6.75%, 6/15/39 | 110 | 96 |
| T-Mobile USA, 2.25%, 11/15/31 | 15 | 11 |
| T-Mobile USA, 3.75%, 4/15/27 | 395 | 366 |
| Verizon Communications, 2.355%, 3/15/32 | 150 | 112 |
| Verizon Communications, 2.65%, 11/20/40 | 415 | 250 |
| Verizon Communications, 2.987%, 10/30/56 | 15 | 8 |
| Verizon Communications, 4.00%, 3/22/50 | 10 | 7 |
| Walt Disney, 3.70%, 10/15/25 | 40 | 39 |
| Warnermedia Holdings, 5.05%, 3/15/42 | 305 | 225 |
| WPP Finance, Series 2010, 3.75%, 9/19/24 | 75 | 73 |
| | | 3,486 |
| Consumer Cyclical 2.4% | | |
| 7-Eleven, 0.80%, 2/10/24 (1)(2) | 25 | 25 |
| Amazon.com, 3.875%, 8/22/37 | 115 | 94 |
| AutoZone, 1.65%, 1/15/31 | 30 | 22 |
| AutoZone, 3.125%, 4/18/24 | 45 | 44 |
| AutoZone, 3.75%, 6/1/27 | 30 | 28 |
T. ROWE PRICE QM U.S. BOND ETF
| | Par/Shares | $ Value |
| (Amounts in 000s) | | |
| AutoZone, 5.05%, 7/15/26 | 250 | 245 |
| Best Buy, 1.95%, 10/1/30 | 100 | 76 |
| General Motors, 4.00%, 4/1/25 | 125 | 121 |
| Home Depot, 5.875%, 12/16/36 | 90 | 89 |
| Hyundai Capital America, 2.65%, 2/10/25 (1)(2) | 15 | 14 |
| Hyundai Capital America, 4.30%, 2/1/24 (1) | 60 | 60 |
| Hyundai Capital America, 5.50%, 3/30/26 (1) | 80 | 79 |
| Lowe's, 5.00%, 4/15/33 (2) | 250 | 227 |
| McDonald's, 3.30%, 7/1/25 | 50 | 48 |
| McDonald's, 5.45%, 8/14/53 | 150 | 132 |
| Mercedes-Benz Finance North America, 4.80%, 3/30/26 (1) | 180 | 176 |
| Mercedes-Benz Finance North America, 5.05%, 8/3/33 (1) | 200 | 183 |
| O'Reilly Automotive, 3.60%, 9/1/27 | 30 | 28 |
| O'Reilly Automotive, 3.90%, 6/1/29 | 285 | 258 |
| PACCAR Financial, 0.90%, 11/8/24 | 85 | 81 |
| Priceline Group, 3.65%, 3/15/25 | 85 | 83 |
| Ross Stores, 1.875%, 4/15/31 | 10 | 8 |
| Ross Stores, 4.60%, 4/15/25 | 335 | 328 |
| TJX, 1.60%, 5/15/31 | 30 | 23 |
| | | 2,472 |
| Consumer Non-Cyclical 3.8% | | |
| Abbott Laboratories, 1.15%, 1/30/28 (2) | 10 | 8 |
| Abbott Laboratories, 4.75%, 11/30/36 | 245 | 222 |
| AbbVie, 3.20%, 5/14/26 | 15 | 14 |
| AbbVie, 3.20%, 11/21/29 | 15 | 13 |
| AbbVie, 4.45%, 5/14/46 | 40 | 31 |
| AbbVie, 4.50%, 5/14/35 | 125 | 109 |
| AbbVie, 4.70%, 5/14/45 | 230 | 187 |
| Anheuser-Busch InBev Finance, 4.90%, 2/1/46 | 15 | 12 |
| Anheuser-Busch InBev Worldwide, 4.75%, 4/15/58 | 25 | 20 |
| Anheuser-Busch InBev Worldwide, 5.45%, 1/23/39 | 15 | 14 |
| Anheuser-Busch InBev Worldwide, 5.55%, 1/23/49 | 60 | 54 |
| AstraZeneca, 1.375%, 8/6/30 | 15 | 11 |
T. ROWE PRICE QM U.S. BOND ETF
| | Par/Shares | $ Value |
| (Amounts in 000s) | | |
| AstraZeneca, 4.00%, 9/18/42 | 50 | 39 |
| Astrazeneca Finance, 4.875%, 3/3/28 | 220 | 215 |
| Astrazeneca Finance, 4.875%, 3/3/33 | 100 | 94 |
| BAT Capital, 2.789%, 9/6/24 | 15 | 15 |
| BAT Capital, 3.557%, 8/15/27 | 18 | 16 |
| BAT Capital, 4.39%, 8/15/37 | 180 | 130 |
| BAT Capital, 7.079%, 8/2/43 | 90 | 82 |
| Becton Dickinson & Company, 2.823%, 5/20/30 | 245 | 202 |
| Becton Dickinson & Company, 3.70%, 6/6/27 | 145 | 135 |
| Biogen, 2.25%, 5/1/30 | 350 | 275 |
| Biogen, 3.15%, 5/1/50 | 15 | 9 |
| Bristol-Myers Squibb, 3.40%, 7/26/29 | 7 | 6 |
| Bristol-Myers Squibb, 4.25%, 10/26/49 | 15 | 11 |
| Cigna, 4.125%, 11/15/25 | 60 | 58 |
| CommonSpirit Health, 2.76%, 10/1/24 | 50 | 49 |
| CommonSpirit Health, 2.782%, 10/1/30 | 20 | 16 |
| CVS Health, 1.875%, 2/28/31 | 15 | 11 |
| CVS Health, 2.70%, 8/21/40 | 275 | 166 |
| CVS Health, 3.25%, 8/15/29 | 50 | 43 |
| CVS Health, 5.125%, 7/20/45 | 145 | 116 |
| CVS Health, 6.00%, 6/1/63 | 75 | 65 |
| Hackensack Meridian Health, 4.211%, 7/1/48 (2) | 85 | 64 |
| Hasbro, 3.00%, 11/19/24 | 25 | 24 |
| Hasbro, 3.55%, 11/19/26 | 205 | 189 |
| HCA, 4.125%, 6/15/29 | 200 | 177 |
| HCA, 4.375%, 3/15/42 | 20 | 14 |
| Mars, 4.75%, 4/20/33 (1) | 100 | 92 |
| McKesson, 5.25%, 2/15/26 | 300 | 296 |
| MedStar Health, Series 20A, 3.626%, 8/15/49 | 30 | 19 |
| Memorial Sloan-Kettering Cancer Center, Series 2015, 4.20%, 7/1/55 | 10 | 7 |
| Nestle Holdings, 4.85%, 3/14/33 (1) | 300 | 281 |
| Northwell Healthcare, 3.979%, 11/1/46 | 20 | 14 |
| NYU Langone Hospitals, 4.368%, 7/1/47 | 15 | 12 |
T. ROWE PRICE QM U.S. BOND ETF
| | Par/Shares | $ Value |
| (Amounts in 000s) | | |
| Perrigo Finance Unlimited, 4.65%, 6/15/30 | 200 | 167 |
| Reynolds American, 4.45%, 6/12/25 | 13 | 13 |
| Smithfield Foods, 5.20%, 4/1/29 (1) | 15 | 14 |
| Stanford Health Care, Series 2018, 3.795%, 11/15/48 | 10 | 7 |
| Takeda Pharmaceutical, 2.05%, 3/31/30 (2) | 200 | 158 |
| | | 3,996 |
| Energy 1.6% | | |
| Amerada Hess, 7.125%, 3/15/33 | 50 | 54 |
| Boardwalk Pipelines, 3.40%, 2/15/31 | 25 | 20 |
| Boardwalk Pipelines, 4.95%, 12/15/24 | 25 | 25 |
| BP Capital Markets America, 3.41%, 2/11/26 | 45 | 43 |
| Cameron LNG, 3.701%, 1/15/39 (1) | 40 | 29 |
| Canadian Natural Resources, 2.95%, 7/15/30 | 20 | 16 |
| Enbridge Energy Partners, 5.50%, 9/15/40 (2) | 10 | 8 |
| Energy Transfer, 5.25%, 4/15/29 | 120 | 114 |
| Energy Transfer, 5.40%, 10/1/47 | 15 | 12 |
| Energy Transfer, 6.50%, 2/1/42 | 25 | 23 |
| Energy Transfer Operating, 3.75%, 5/15/30 | 70 | 60 |
| Enterprise Products Operating, 5.35%, 1/31/33 | 100 | 95 |
| Kinder Morgan, 5.20%, 6/1/33 | 195 | 176 |
| MPLX, 5.65%, 3/1/53 (2) | 350 | 286 |
| ONEOK, 6.625%, 9/1/53 | 200 | 187 |
| Pioneer Natural Resources, 1.125%, 1/15/26 | 10 | 9 |
| Sabine Pass Liquefaction, 4.20%, 3/15/28 | 70 | 64 |
| Sabine Pass Liquefaction, 4.50%, 5/15/30 | 85 | 76 |
| TotalEnergies Capital International, 2.434%, 1/10/25 | 40 | 39 |
| TotalEnergies Capital International, 2.986%, 6/29/41 | 60 | 40 |
| TransCanada PipeLines, 6.203%, 3/9/26 | 300 | 299 |
| Transcontinental Gas Pipe Line, 4.60%, 3/15/48 | 10 | 8 |
| Woodside Finance, 4.50%, 3/4/29 (1) | 20 | 18 |
| | | 1,701 |
T. ROWE PRICE QM U.S. BOND ETF
| | Par/Shares | $ Value |
| (Amounts in 000s) | | |
| Industrial Other 0.0% | | |
| Northwestern University, Series 2020, 2.64%, 12/1/50 | 20 | 11 |
| | | 11 |
| Technology 2.3% | | |
| Apple, 3.20%, 5/13/25 (2) | 40 | 39 |
| Apple, 3.20%, 5/11/27 | 15 | 14 |
| Apple, 3.35%, 2/9/27 | 165 | 156 |
| Apple, 4.85%, 5/10/53 | 300 | 261 |
| CDW, 4.25%, 4/1/28 | 45 | 41 |
| Fiserv, 3.20%, 7/1/26 | 40 | 37 |
| Fiserv, 5.60%, 3/2/33 | 200 | 188 |
| Intuit, 5.125%, 9/15/28 | 260 | 256 |
| Keysight Technologies, 3.00%, 10/30/29 | 50 | 42 |
| Keysight Technologies, 4.55%, 10/30/24 | 10 | 10 |
| Micron Technology, 4.185%, 2/15/27 | 70 | 65 |
| Moody's, 2.00%, 8/19/31 | 180 | 136 |
| NXP, 2.50%, 5/11/31 | 65 | 50 |
| NXP, 3.15%, 5/1/27 | 125 | 113 |
| NXP, 3.40%, 5/1/30 | 15 | 13 |
| Oracle, 3.60%, 4/1/40 | 15 | 10 |
| RELX Capital, 3.00%, 5/22/30 | 25 | 21 |
| Roper Technologies, 2.95%, 9/15/29 | 25 | 21 |
| Roper Technologies, 3.80%, 12/15/26 | 25 | 24 |
| ServiceNow, 1.40%, 9/1/30 | 310 | 234 |
| Texas Instruments, 1.375%, 3/12/25 | 70 | 66 |
| Texas Instruments, 5.05%, 5/18/63 | 90 | 75 |
| Visa, 2.70%, 4/15/40 | 35 | 23 |
| VMware, 1.40%, 8/15/26 | 95 | 83 |
| Western Union, 2.85%, 1/10/25 | 50 | 48 |
| Western Union, 6.20%, 11/17/36 | 340 | 319 |
| | | 2,345 |
T. ROWE PRICE QM U.S. BOND ETF
| | Par/Shares | $ Value |
| (Amounts in 000s) | | |
| Transportation 0.4% | | |
| American Airlines PTT, Series 2014-1, Class A, 3.70%, 10/1/26 | 8 | 7 |
| Canadian Pacific Railway, 1.75%, 12/2/26 | 95 | 85 |
| Canadian Pacific Railway, 2.875%, 11/15/29 | 120 | 101 |
| Canadian Pacific Railway, 3.50%, 5/1/50 | 15 | 10 |
| Canadian Pacific Railway, 4.70%, 5/1/48 | 10 | 8 |
| ERAC USA Finance, 4.50%, 2/15/45 (1) | 10 | 8 |
| ERAC USA Finance, 4.90%, 5/1/33 (1)(2) | 185 | 168 |
| Transurban Finance, 2.45%, 3/16/31 (1) | 30 | 23 |
| Transurban Finance, 4.125%, 2/2/26 (1) | 15 | 14 |
| | | 424 |
| Total Industrial | | 15,165 |
| UTILITY 1.5% | | |
| Electric 1.2% | | |
| AEP Texas, 4.70%, 5/15/32 | 30 | 27 |
| Berkshire Hathaway Energy, 6.125%, 4/1/36 | 65 | 64 |
| Duke Energy, 3.75%, 9/1/46 | 55 | 36 |
| Duke Energy Indiana, 5.40%, 4/1/53 | 40 | 34 |
| Exelon, 3.40%, 4/15/26 | 175 | 166 |
| Georgia Power, 4.95%, 5/17/33 | 100 | 91 |
| IPALCO Enterprises, 3.70%, 9/1/24 | 30 | 29 |
| Metropolitan Edison, 4.30%, 1/15/29 (1) | 75 | 69 |
| Mid-Atlantic Interstate Transmission, 4.10%, 5/15/28 (1) | 15 | 14 |
| NextEra Energy Capital Holdings, 5.749%, 9/1/25 | 130 | 129 |
| Pacific Gas & Electric, 2.10%, 8/1/27 | 215 | 182 |
| Pacific Gas and Electric, 6.15%, 1/15/33 | 100 | 93 |
| Southern, 4.40%, 7/1/46 | 300 | 221 |
| Vistra Operations, 3.55%, 7/15/24 (1) | 110 | 107 |
| | | 1,262 |
| Natural Gas 0.3% | | |
| APT Pipelines, 4.25%, 7/15/27 (1) | 10 | 9 |
T. ROWE PRICE QM U.S. BOND ETF
| | Par/Shares | $ Value |
| (Amounts in 000s) | | |
| NiSource, 1.70%, 2/15/31 | 160 | 117 |
| NiSource, 5.65%, 2/1/45 | 15 | 13 |
| NiSource , 3.95%, 3/30/48 | 45 | 31 |
| NiSource Finance, 3.49%, 5/15/27 | 55 | 51 |
| Southern Co Gas Capital, 5.15%, 9/15/32 | 100 | 92 |
| | | 313 |
| Total Utility | | 1,575 |
Total Corporate Bonds
(Cost $30,178) | | 27,321 |
| FOREIGN GOVERNMENT OBLIGATIONS & MUNICIPALITIES 0.8% |
| Local Authorities 0.3% | | |
| Province of British Columbia Canada, 4.20%, 7/6/33 | 98 | 89 |
| Province of Manitoba Canada, 4.30%, 7/27/33 | 250 | 230 |
| | | 319 |
| Owned No Guarantee 0.2% | | |
| Corp Nacional del Cobre de Chile, 3.75%, 1/15/31 (1) | 200 | 166 |
| | | 166 |
| Sovereign 0.3% | | |
| Panama Government International Bond, 3.298%, 1/19/33 | 200 | 149 |
| United Mexican States, 4.75%, 3/8/44 | 300 | 223 |
| | | 372 |
Total Foreign Government Obligations & Municipalities
(Cost $973) | | 857 |
| MUNICIPAL SECURITIES 1.7% |
| California 0.5% | | |
| Bay Area Toll Auth., Series S-10, 3.176%, 4/1/41 | 50 | 34 |
| California St, 5.20%, 3/1/43 | 200 | 175 |
| California State University, 6.484%, 11/1/41 | 250 | 254 |
| Univ. of California Regents, Build America, 5.77%, 5/15/43 | 50 | 48 |
| | | 511 |
T. ROWE PRICE QM U.S. BOND ETF
| | Par/Shares | $ Value |
| (Amounts in 000s) | | |
| District Of Columbia 0.2% | | |
| Metropolitan Washington Airports Authority Dulles Toll Road Revenue, 7.462%, 10/1/46 | 225 | 251 |
| | | 251 |
| Georgia 0.0% | | |
| Municipal Electric Auth. of Georgia, Build America, Vogtle Units, Series A, 6.637%, 4/1/57 | 40 | 41 |
| | | 41 |
| Illinois 0.3% | | |
| Chicago O'Hare Int'l Airport, Build America, 6.395%, 1/1/40 | 250 | 259 |
| Cook County, 6.36%, 11/15/33 | 25 | 26 |
| | | 285 |
| Louisiana 0.1% | | |
| Louisiana Local Government Environmental Facilities & Community Development Auth, Series A, 4.475%, 8/1/39 | 60 | 52 |
| | | 52 |
| Maryland 0.0% | | |
| Maryland Health & Higher Educational Facilities Auth., Series B, 4.815%, 7/1/43 | 40 | 33 |
| | | 33 |
| New York 0.1% | | |
| New York State Urban Dev. Sales Tax Revenue, Series B, 2.59%, 3/15/35 | 70 | 51 |
| | | 51 |
| Tennessee 0.0% | | |
| Metropolitan Government of Nashville & Davidson County, Series B, 3.235%, 7/1/52 | 75 | 42 |
| | | 42 |
T. ROWE PRICE QM U.S. BOND ETF
| | Par/Shares | $ Value |
| (Amounts in 000s) | | |
| Texas 0.4% | | |
| Central Texas Regional Mobility Auth., Series E, 3.167%, 1/1/41 | 75 | 52 |
| Dallas/Fort Worth Int'l Airport, Series C, 2.843%, 11/1/46 | 65 | 42 |
| Dallas/Fort Worth Int'l Airport, Series A, 5.045%, 11/1/47 | 250 | 220 |
| Texas Natural Gas Securitiztn Fin Corp, 5.169%, 4/1/41 | 30 | 28 |
| Texas Private Activity Bond Surface Transportation, North Tarrant, Express, Series B, 3.922%, 12/31/49 | 30 | 21 |
| | | 363 |
| Virginia 0.1% | | |
| Univ. of Virginia, Series B, 2.584%, 11/1/51 | 75 | 43 |
| Virginia Commonwealth Transportation Board, Build America, Series B, 5.35%, 5/15/35 | 50 | 48 |
| | | 91 |
| Wisconsin 0.0% | | |
| Public Finance Auth., Series B, 3.405%, 7/1/51 | 70 | 43 |
| | | 43 |
Total Municipal Securities
(Cost $2,202) | | 1,763 |
| NON-U.S. GOVERNMENT MORTGAGE-BACKED SECURITIES 4.7% |
| Collateralized Mortgage Obligations 2.3% | | |
| Angel Oak Mortgage Trust, Series 2019-5, Class A1, CMO, ARM, 2.593%, 10/25/49 (1) | 24 | 23 |
| Angel Oak Mortgage Trust, Series 2021-6, Class A3, CMO, ARM, 1.714%, 9/25/66 (1) | 69 | 52 |
| Angel Oak Mortgage Trust, Series 2022-6, Class A1, CMO, ARM, 4.30%, 7/25/67 (1) | 317 | 287 |
| Angel Oak Mortgage Trust, Series 2023-3, Class A1, CMO, ARM, 4.80%, 9/26/67 (1) | 49 | 45 |
| Barclays Mortgage Loan Trust, Series 2021-NQM1, Class A3, CMO, ARM, 2.189%, 9/25/51 (1) | 57 | 47 |
| Bayview MSR Opportunity Master Fund Trust, Series 2021-5, Class A20, CMO, ARM, 2.50%, 11/25/51 (1) | 113 | 81 |
T. ROWE PRICE QM U.S. BOND ETF
| | Par/Shares | $ Value |
| (Amounts in 000s) | | |
| BRAVO Residential Funding Trust, Series 2021-NQM3, Class A1, CMO, ARM, 1.699%, 4/25/60 (1) | 48 | 41 |
| Chase Home Lending Mortgage Trust, Series 2023-RPL1, Class A1, CMO, ARM, 3.50%, 6/25/62 (1) | 311 | 270 |
| COLT Mortgage Trust, Series 2022-3, Class A1, CMO, ARM, 3.901%, 2/25/67 (1) | 85 | 75 |
| Connecticut Avenue Securities Trust, Series 2022-R01, Class 1M1, FRN, SOFR30A + 1.00%, 6.321%, 12/25/41 (1) | 13 | 12 |
| Connecticut Avenue Securities Trust, Series 2023-R04, Class 1M1, FRN, SOFR30A + 2.30%, 7.621%, 5/25/43 (1) | 65 | 66 |
| Ellington Financial Mortgage Trust, Series 2021-3, Class M1, CMO, ARM, 2.53%, 9/25/66 (1) | 100 | 51 |
| Freddie Mac STACR REMIC Trust, Series 2021-DNA7, Class M1, FRN, SOFR30A + 0.85%, 6.171%, 11/25/41 (1) | 42 | 42 |
| GCAT, Series 2021-NQM5, Class A1, CMO, ARM, 1.262%, 7/25/66 (1) | 68 | 52 |
| GCAT Trust, Series 2023-INV1, Class A1, CMO, ARM, 6.00%, 8/25/53 (1) | 222 | 212 |
| JP Morgan Mortgage Trust, Series 2023-DSC2, Class A1, CMO, ARM, 5.25%, 11/25/63 (1) | 242 | 223 |
| Morgan Stanley Residential Mortgage Loan Trust, Series 2023-NQM1, Class A2, 7.53%, 9/25/68 (1) | 100 | 100 |
| New Residential Mortgage Loan Trust, Series 2022-INV1, Class A4, CMO, ARM, 3.00%, 3/25/52 (1) | 89 | 66 |
| OBX Trust, Series 2023-NQM9, Class A2, 7.318%, 10/25/63 (1) | 100 | 100 |
| Verus Securitization Trust, Series 2019-INV3, Class A1, CMO, ARM, 2.692%, 11/25/59 (1) | 64 | 62 |
| Verus Securitization Trust, Series 2021-7, Class A1, CMO, ARM, 1.829%, 10/25/66 (1) | 75 | 62 |
| Verus Securitization Trust, Series 2023-6, Class A2, 6.939%, 9/25/68 (1) | 203 | 201 |
| Verus Securitization Trust, Series 2023-7, Class A2, 7.272%, 10/25/68 (1) | 145 | 145 |
| Verus Securitization Trust, Series 2023-INV1, Class A1, CMO, ARM, 5.999%, 2/25/68 (1) | 89 | 87 |
| | | 2,402 |
T. ROWE PRICE QM U.S. BOND ETF
| | Par/Shares | $ Value |
| (Amounts in 000s) | | |
| Commercial Mortgage-Backed Securities 2.4% | | |
| Benchmark Mortgage Trust, Series 2023-V3, Class A3, ARM, 6.363%, 7/15/56 | 265 | 265 |
| Big Trust, Series 2022-BIG, Class A, FRN, 1M TSFR + 1.34%, 6.676%, 2/15/39 (1) | 100 | 98 |
| BWAY Trust, Series 2022-26BW, Class A, ARM, 3.402%, 2/10/44 (1) | 100 | 70 |
| BX Trust, Series 2020-VKNG, Class A, FRN, 1M TSFR + 1.04%, 6.379%, 10/15/37 (1) | 301 | 298 |
| BX Trust, Series 2021-ARIA, Class B, FRN, 1M TSFR + 1.41%, 6.745%, 10/15/36 (1) | 105 | 101 |
| BX Trust, Series 2021-ARIA, Class A, FRN, 1M TSFR + 1.01%, 6.348%, 10/15/36 (1) | 315 | 305 |
| BX Trust, Series 2022-CSMO, Class A, FRN, 1M TSFR + 2.11%, 7.449%, 6/15/27 (1) | 176 | 176 |
| BX Trust, Series 2022-LP2, Class C, FRN, 1M TSFR + 1.56%, 6.896%, 2/15/39 (1) | 81 | 78 |
| BX Trust, Series 2023-LIFE, Class B, 5.39%, 2/15/28 (1) | 100 | 92 |
| COMM Trust, Series 2015-CR23, Class A3, 3.23%, 5/10/48 | 35 | 33 |
| Five Mortgage Trust, Series 2023-V1, Class A3, ARM, 5.668%, 2/10/56 | 50 | 48 |
| Great Wolf Trust, Series 2019-WOLF, Class A, FRN, 1M TSFR + 1.15%, 6.482%, 12/15/36 (1) | 285 | 283 |
| J.P. Morgan Chase Commercial Mortgage Securities Trust, Series 2022-OPO, Class B, ARM, 3.376%, 1/5/39 (1) | 100 | 75 |
| JPMBB Commercial Mortgage Securities Trust, Series 2015-C31, Class A3, 3.801%, 8/15/48 | 160 | 151 |
| MHC Commercial Mortgage Trust, Series 2021-MHC, Class B, FRN, 1M TSFR + 1.22%, 6.549%, 4/15/38 (1) | 92 | 90 |
| Morgan Stanley Capital I Trust, Series 2018-H4, Class A4, 4.31%, 12/15/51 | 175 | 159 |
| NYO Commercial Mortgage Trust, Series 2021-1290, Class C, FRN, 1M TSFR + 2.11%, 7.444%, 11/15/38 (1) | 90 | 68 |
T. ROWE PRICE QM U.S. BOND ETF
| | Par/Shares | $ Value |
| (Amounts in 000s) | | |
| Wells Fargo Commercial Mortgage Trust, Series 2019-JWDR, Class A, ARM, 2.501%, 9/15/31 (1) | 100 | 89 |
| | | 2,479 |
Total Non-U.S. Government Mortgage-Backed Securities
(Cost $5,285) | | 4,881 |
| U.S. GOVERNMENT & AGENCY MORTGAGE-BACKED SECURITIES 29.6% |
| U.S. Government Agency Obligations 22.4% | | |
| Fannie Mae Pool | | |
| 2.00%, 5/1/36 - 11/1/51 | 2,240 | 1,718 |
| 2.50%, 4/1/37 - 5/1/52 | 1,798 | 1,430 |
| 3.00%, 7/1/40 - 3/1/52 | 1,149 | 951 |
| 3.50%, 1/1/33 | 102 | 95 |
| 4.00%, 7/1/48 | 68 | 60 |
| 4.50%, 3/1/50 - 7/1/53 | 652 | 585 |
| 5.00%, 7/1/53 | 90 | 83 |
| 5.50%, 3/1/53 | 65 | 61 |
| 6.00%, 9/1/53 | 64 | 63 |
| Federal Home Loan Mortgage, ARM | | |
| 3.71%, 9/25/32 | 165 | 143 |
| 4.43%, 2/25/33 | 125 | 114 |
| Federal National Mortgage Assn. | | |
| 1.50%, 4/1/37 - 1/1/42 | 322 | 260 |
| 2.00%, 4/1/37 - 4/1/52 | 5,890 | 4,372 |
| 2.50%, 7/1/30 - 5/1/52 | 1,678 | 1,333 |
| 3.00%, 1/1/33 - 6/1/52 | 1,739 | 1,438 |
| 3.50%, 12/1/33 - 4/1/52 | 996 | 847 |
| 4.00%, 2/1/47 - 9/1/52 | 809 | 707 |
| 4.50%, 4/1/41 - 8/1/52 | 403 | 366 |
| 5.00%, 11/1/44 - 9/1/52 | 130 | 124 |
| 5.50%, 5/1/44 | 70 | 69 |
| 6.00%, 1/1/53 - 2/1/53 | 164 | 161 |
| Freddie Mac Multifamily Structured Pass Through Certificates, 2.347%, 11/25/31 | 390 | 307 |
T. ROWE PRICE QM U.S. BOND ETF
| | Par/Shares | $ Value |
| (Amounts in 000s) | | |
| Freddie Mac Pool | | |
| 1.50%, 2/1/36 - 4/1/41 | 684 | 552 |
| 2.00%, 8/1/36 - 4/1/52 | 408 | 320 |
| 2.50%, 6/1/42 - 4/1/52 | 2,664 | 2,059 |
| 3.00%, 9/1/32 - 1/1/52 | 1,086 | 915 |
| 3.50%, 8/1/49 - 4/1/50 | 949 | 810 |
| 4.00%, 7/1/49 | 720 | 635 |
| 5.00%, 5/1/53 | 23 | 21 |
| 5.50%, 8/1/53 | 206 | 195 |
| 6.00%, 2/1/53 | 350 | 342 |
| UMBS, TBA (4) | | |
| 2.00%, 11/1/38 | 490 | 415 |
| 3.50%, 11/1/53 | 125 | 104 |
| 5.00%, 11/1/53 | 820 | 756 |
| 5.50%, 11/1/53 | 280 | 266 |
| 6.00%, 11/1/53 | 150 | 146 |
| 6.50%, 11/1/53 | 465 | 462 |
| | | 23,285 |
| U.S. Government Obligations 7.2% | | |
| Ginnie Mae II Pool | | |
| 2.00%, 12/20/51 | 149 | 115 |
| 7.00%, 8/20/53 - 9/20/53 | 30 | 30 |
| Government National Mortgage Assn. | | |
| 1.50%, 5/20/37 | 45 | 37 |
| 2.00%, 3/20/51 - 3/20/52 | 1,636 | 1,264 |
| 2.50%, 8/20/50 - 1/20/52 | 1,710 | 1,362 |
| 3.00%, 6/20/45 - 6/20/52 | 1,329 | 1,109 |
| 3.50%, 6/20/46 - 10/20/50 | 1,025 | 884 |
| 4.00%, 10/20/40 - 10/20/52 | 740 | 653 |
| 4.50%, 10/20/47 - 10/20/52 | 537 | 487 |
| 5.00%, 8/20/47 - 8/20/52 | 182 | 172 |
| Government National Mortgage Assn., TBA (4) | | |
| 5.00%, 11/20/53 | 230 | 214 |
T. ROWE PRICE QM U.S. BOND ETF
| | Par/Shares | $ Value |
| (Amounts in 000s) | | |
| 5.50%, 11/20/53 | 815 | 779 |
| 6.00%, 11/20/53 | 190 | 186 |
| 6.50%, 11/20/53 | 195 | 195 |
| | | 7,487 |
Total U.S. Government & Agency Mortgage-Backed Securities
(Cost $34,096) | | 30,772 |
| U.S. GOVERNMENT AGENCY OBLIGATIONS (EXCLUDING MORTGAGE-BACKED) 32.2% |
| U.S. Treasury Obligations 32.2% | | |
| U.S. Treasury Bills, 5.379%, 1/11/24 | 2,040 | 2,019 |
| U.S. Treasury Bonds, 1.75%, 8/15/41 | 2,110 | 1,251 |
| U.S. Treasury Bonds, 2.00%, 8/15/51 | 1,665 | 900 |
| U.S. Treasury Bonds, 2.25%, 2/15/52 | 350 | 201 |
| U.S. Treasury Bonds, 3.375%, 8/15/42 | 115 | 89 |
| U.S. Treasury Bonds, 3.625%, 2/15/53 | 205 | 160 |
| U.S. Treasury Bonds, 3.625%, 5/15/53 | 3,360 | 2,618 |
| U.S. Treasury Bonds, 3.875%, 2/15/43 | 140 | 116 |
| U.S. Treasury Bonds, 3.875%, 5/15/43 | 3,165 | 2,627 |
| U.S. Treasury Notes, 0.75%, 8/31/26 | 4,580 | 4,080 |
| U.S. Treasury Notes, 1.25%, 8/15/31 | 590 | 452 |
| U.S. Treasury Notes, 1.875%, 2/28/27 | 830 | 754 |
| U.S. Treasury Notes, 3.375%, 5/15/33 | 1,615 | 1,428 |
| U.S. Treasury Notes, 3.50%, 2/15/33 | 200 | 179 |
| U.S. Treasury Notes, 3.50%, 1/31/28 | 385 | 365 |
| U.S. Treasury Notes, 3.625%, 5/31/28 | 800 | 761 |
| U.S. Treasury Notes, 4.00%, 2/29/28 | 1,130 | 1,093 |
| U.S. Treasury Notes, 4.00%, 6/30/28 (5) | 8,155 | 7,872 |
| U.S. Treasury Notes, 4.125%, 1/31/25 | 300 | 296 |
| U.S. Treasury Notes, 4.125%, 10/31/27 | 530 | 516 |
| U.S. Treasury Notes, 4.25%, 10/15/25 | 200 | 197 |
T. ROWE PRICE QM U.S. BOND ETF
| | Par/Shares | $ Value |
| (Amounts in 000s) | | |
| U.S. Treasury Notes, 4.625%, 6/30/25 | 5,495 | 5,448 |
| | | 33,422 |
Total U.S. Government Agency Obligations (Excluding Mortgage-Backed)
(Cost $37,108) | | 33,422 |
| SHORT-TERM INVESTMENTS 2.8% |
| Money Market Funds 2.8% | | |
| T. Rowe Price Government Reserve Fund, 5.42% (6)(7) | 2,912 | 2,912 |
Total Short-Term Investments
(Cost $2,912) | | 2,912 |
| SECURITIES LENDING COLLATERAL 2.5% |
| Investments in a Pooled Account through Securities Lending Program with State Street Bank 2.5% | | |
| Money Market Funds 2.5% | | |
| T. Rowe Price Government Reserve Fund, 5.42% (6)(7) | 2,522 | 2,522 |
| Total Investments in a Pooled Account through Securities Lending Program with State Street Bank | | 2,522 |
Total Securities Lending Collateral
(Cost $2,522) | | 2,522 |
Total Investments
104.5% of Net Assets (Cost $119,345) | | $108,452 |
| ‡ | Par/Shares and Notional Amount are denominated in U.S. dollars unless otherwise noted. |
| (1) | Security was purchased pursuant to Rule 144A under the Securities Act of 1933 and may be resold in transactions exempt from registration only to qualified institutional buyers. Total value of such securities at period-end amounts to $11,032 and represents 10.6% of net assets. |
| (2) | All or a portion of this security is on loan at October 31, 2023. See Note 4. |
| (3) | Security is a fix-to-float security, which carries a fixed coupon until a certain date, upon which it switches to a floating rate. Reference rate and spread are provided if the rate is currently floating. |
| (4) | To-Be-Announced purchase commitment. Total value of such securities at period-end amounts to $3,523 and represents 3.4% of net assets. |
T. ROWE PRICE QM U.S. BOND ETF
| (5) | At October 31, 2023, all or a portion of this security is pledged as collateral and/or margin deposit to cover future funding obligations. |
| (6) | Seven-day yield |
| (7) | Affiliated Companies |
| 1M TSFR | One month term SOFR (Secured overnight financing rate) |
| 3M TSFR | Three month term SOFR (Secured overnight financing rate) |
| ARM | Adjustable Rate Mortgage (ARM); rate shown is effective rate at period-end. The rates for certain ARMs are not based on a published reference rate and spread but may be determined using a formula based on the rates of the underlying loans. |
| CLO | Collateralized Loan Obligation |
| CMO | Collateralized Mortgage Obligation |
| FRN | Floating Rate Note |
| PTT | Pass-Through Trust |
| SOFR30A | 30-day Average term SOFR (Secured Overnight Financing Rate) |
| TBA | To-Be-Announced |
| UMBS | Uniform Mortgage-Backed Securities |
| VR | Variable Rate; rate shown is effective rate at period-end. The rates for certain variable rate securities are not based on a published reference rate and spread but are determined by the issuer or agent and based on current market conditions. |
T. ROWE PRICE QM U.S. BOND ETF
| | Expiration
Date | Notional
Amount | Value and
Unrealized
Gain (Loss) |
| Long, 1 Ultra U.S. Treasury Bonds contracts | 12/23 | 127 | $ (15) |
| Long, 68 U.S. Treasury Notes five year contracts | 12/23 | 7,211 | (107) |
| Long, 3 U.S. Treasury Notes ten year contracts | 12/23 | 330 | (11) |
| Long, 5 U.S. Treasury Notes two year contracts | 12/23 | 1,014 | (1) |
| Net payments (receipts) of variation margin to date | 129 |
| Variation margin receivable (payable) on open futures contracts | $ (5) |
T. ROWE PRICE QM U.S. BOND ETF
AFFILIATED COMPANIES
($000s)
The fund may invest in certain securities that are considered affiliated companies. As defined by the 1940 Act, an affiliated company is one in which the fund owns 5% or more of the outstanding voting securities, or a company that is under common ownership or control. The following securities were considered affiliated companies for all or some portion of the year ended October 31, 2023. Net realized gain (loss), investment income, change in net unrealized gain/loss, and purchase and sales cost reflect all activity for the period then ended.
| Affiliate | Net Realized Gain
(Loss) | Changes in Net
Unrealized
Gain/Loss | Investment
Income |
| T. Rowe Price Government Reserve Fund | $ — | $— | $159++ |
| Totals | $—# | $— | $ 159+ |
| Supplementary Investment Schedule |
| Affiliate | Value
10/31/22 | Purchase
Cost | Sales
Cost | Value
10/31/23 |
| T. Rowe Price Government Reserve Fund | $1,003 | ¤ | ¤ | $ 5,434 |
| | Total | | | $5,434^ |
| ++ | Excludes earnings on securities lending collateral, which are subject to rebates and fees. |
| # | Capital gain distributions from mutual funds represented $0 of the net realized gain (loss). |
| + | Investment income comprised $159 of dividend income and $0 of interest income. |
| ¤ | Purchase and sale information not shown for cash management funds. |
| ^ | The cost basis of investments in affiliated companies was $5,434. |
The accompanying notes are an integral part of these financial statements.
T. ROWE PRICE QM U.S. BOND ETF
October 31, 2023
STATEMENT OF ASSETS AND LIABILITIES
($000s, except shares and per share amounts)
| Assets | |
| Investments in securities, at value (cost $119,345) | $ 108,452 |
| Receivable for investment securities sold | 896 |
| Interest and dividends receivable | 877 |
| Cash | 1 |
| Total assets | 110,226 |
| Liabilities | |
| Payable for investment securities purchased | 3,873 |
| Obligation to return securities lending collateral | 2,522 |
| Investment management and administrative fees payable | 7 |
| Variation margin payable on futures contracts | 5 |
| Total liabilities | 6,407 |
| NET ASSETS | $ 103,819 |
| Net assets consists of: | |
| Total distributable earnings (loss) | $ (13,117) |
Paid-in capital applicable to 2,600,000 shares of $0.0001 par value
capital stock outstanding; 4,000,000,000 shares authorized | 116,936 |
| NET ASSETS | $103,819 |
| NET ASSET VALUE PER SHARE | $ 39.93 |
The accompanying notes are an integral part of these financial statements.
T. ROWE PRICE QM U.S. BOND ETF
STATEMENT OF OPERATIONS
($000s)
| | Year Ended |
| | 10/31/23 |
| Investment Income (Loss) | |
| Income | |
| Interest | $ 2,111 |
| Dividend | 159 |
| Securities lending | 3 |
| Total income | 2,273 |
| Expenses | |
| Investment management and administrative expense | 48 |
| Miscellaneous expense | 1 |
| Total expenses | 49 |
| Net investment income | 2,224 |
| Realized and Unrealized Gain / Loss | |
| Net realized gain (loss) | |
| Securities | (1,017) |
| Futures | (232) |
| Swaps | 20 |
| Net realized loss | (1,229) |
| Change in net unrealized gain / loss | |
| Securities | (4,478) |
| Futures | (16) |
| Change in unrealized gain / loss | (4,494) |
| Net realized and unrealized gain / loss | (5,723) |
| DECREASE IN NET ASSETS FROM OPERATIONS | $(3,499) |
The accompanying notes are an integral part of these financial statements.
T. ROWE PRICE QM U.S. BOND ETF
STATEMENT OF CHANGES IN NET ASSETS
($000s)
| | Year
Ended | | Year
Ended |
| | 10/31/23 | | 10/31/22 |
| Increase (Decrease) in Net Assets | | | |
| Operations | | | |
| Net investment income | $ 2,224 | | $ 741 |
| Net realized loss | (1,229) | | (851) |
| Change in net unrealized gain / loss | (4,494) | | (6,530) |
| Decrease in net assets from operations | (3,499) | | (6,640) |
| Distributions to shareholders | | | |
| Net earnings | (2,246) | | (741) |
| Capital share transactions* | | | |
| Shares sold | 76,693 | | 16,978 |
| Shares redeemed | (3,102) | | (1,101) |
| Increase in net assets from capital share transactions | 73,591 | | 15,877 |
| Net Assets | | | |
| Increase during period | 67,846 | | 8,496 |
| Beginning of period | 35,973 | | 27,477 |
| End of period | $103,819 | | $35,973 |
| *Share information | | | |
| Shares sold | 1,800 | | 350 |
| Shares redeemed | (75) | | (25) |
| Increase in shares outstanding | 1,725 | | 325 |
The accompanying notes are an integral part of these financial statements.
T. ROWE PRICE QM U.S. BOND ETF
NOTES TO FINANCIAL STATEMENTS
T. Rowe Price Exchange-Traded Funds, Inc. (the corporation) is registered under the Investment Company Act of 1940 (the 1940 Act). The QM U.S. Bond ETF (the fund) is a diversified, open-end management investment company established by the corporation. The fund seeks to provide a total return that exceeds the performance of the U.S. investment-grade bond market.
NOTE 1 – SIGNIFICANT ACCOUNTING POLICIES
Basis of Preparation
The fund is an investment company and follows accounting and reporting guidance in the Financial Accounting Standards Board (FASB) Accounting Standards Codification Topic 946 (ASC 946). The accompanying financial statements were prepared in accordance with accounting principles generally accepted in the United States of America (GAAP), including, but not limited to, ASC 946. GAAP requires the use of estimates made by management. Management believes that estimates and valuations are appropriate; however, actual results may differ from those estimates, and the valuations reflected in the accompanying financial statements may differ from the value ultimately realized upon sale or maturity.
Investment Transactions, Investment Income, and Distributions
Investment transactions are accounted for on the trade date basis. Income and expenses are recorded on the accrual basis. Realized gains and losses are reported on the identified cost basis. Premiums and discounts on debt securities are amortized for financial reporting purposes. Paydown gains and losses are recorded as an adjustment to interest income. Income tax-related interest and penalties, if incurred, are recorded as income tax expense. Dividends received from other investment companies are reflected as dividend income; capital gain distributions are reflected as realized gain/loss. Dividend income and capital gain distributions are recorded on the ex-dividend date. Non-cash dividends, if any, are recorded at the fair market value of the asset received. Distributions to shareholders are recorded on the ex-dividend date. Income distributions, if any, are declared and paid monthly. A capital gain distribution, if any, may also be declared and paid by the fund annually. Dividends and distributions cannot be automatically reinvested in additional shares of the fund.
T. ROWE PRICE QM U.S. BOND ETF
Capital Transactions
The fund issues and redeems shares at its net asset value (NAV) only with Authorized Participants and only in large blocks of 25,000 shares (each, a “Creation Unit”). The fund’s NAV per share is computed at the close of the New York Stock Exchange (NYSE). However, the NAV per share may be calculated at a time other than the normal close of the NYSE if trading on the NYSE is restricted, if the NYSE closes earlier, or as may be permitted by the SEC. Individual fund shares may not be purchased or redeemed directly with the fund. An Authorized Participant may purchase or redeem a Creation Unit of the fund each business day that the fund is open in exchange for the delivery of a designated portfolio of in-kind securities and/or cash. When purchasing or redeeming Creation Units, Authorized Participants are also required to pay a fixed and/or variable purchase or redemption transaction fee as well as any applicable additional variable charge to defray the transaction cost to a fund.
Individual fund shares may be purchased and sold only on a national securities exchange through brokers. Shares are listed for trading on NYSE Arca, Inc. (NYSE Arca) and because the shares will trade at market prices rather than NAV, shares may trade at prices greater than NAV (at a premium), at NAV, or less than NAV (at a discount). The fund’s shares are ordinarily valued as of the close of regular trading (normally 4:00 p.m. Eastern time) on each day that the NYSE Arca is open.
New Accounting Guidance
The FASB issued Accounting Standards Update (ASU), ASU 2020-04, Reference Rate Reform (Topic 848) – Facilitation of the Effects of Reference Rate Reform on Financial Reporting in March 2020 and ASU 2021-01 in January 2021 which provided further amendments and clarifications to Topic 848. These ASUs provide optional, temporary relief with respect to the financial reporting of contracts subject to certain types of modifications due to the planned discontinuation of the London Interbank Offered Rate (LIBOR), and other interbank-offered based reference rates, through December 31, 2022. In December 2022, FASB issued ASU 2022-06 which defers the sunset date of Topic 848 from December 31, 2022 to December 31, 2024, after which entities will no longer be permitted to apply the relief in Topic 848. Management intends to rely upon the relief provided under Topic 848, which is not expected to have a material impact on the fund’s financial statements.
Indemnification
In the normal course of business, the fund may provide indemnification in connection with its officers and directors, service providers, and/or private company investments. The fund’s maximum exposure under these arrangements is unknown; however, the risk of material loss is currently considered to be remote.
T. ROWE PRICE QM U.S. BOND ETF
NOTE 2 – VALUATION
Fair Value
The fund’s financial instruments are valued at the close of the NYSE and are reported at fair value, which GAAP defines as the price that would be received to sell an asset or paid to transfer a liability in an orderly transaction between market participants at the measurement date. The fund’s Board of Directors (the Board) has designated T. Rowe Price Associates, Inc. as the fund’s valuation designee (Valuation Designee). Subject to oversight by the Board, the Valuation Designee performs the following functions in performing fair value determinations: assesses and manages valuation risks; establishes and applies fair value methodologies; tests fair value methodologies; and evaluates pricing vendors and pricing agents. The duties and responsibilities of the Valuation Designee are performed by its Valuation Committee. The Valuation Designee provides periodic reporting to the Board on valuation matters.
Various valuation techniques and inputs are used to determine the fair value of financial instruments. GAAP establishes the following fair value hierarchy that categorizes the inputs used to measure fair value:
Level 1 – quoted prices (unadjusted) in active markets for identical financial instruments that the fund can access at the reporting date
Level 2 – inputs other than Level 1 quoted prices that are observable, either directly or indirectly (including, but not limited to, quoted prices for similar financial instruments in active markets, quoted prices for identical or similar financial instruments in inactive markets, interest rates and yield curves, implied volatilities, and credit spreads)
Level 3 – unobservable inputs (including the Valuation Designee’s assumptions in determining fair value)
Observable inputs are developed using market data, such as publicly available information about actual events or transactions, and reflect the assumptions that market participants would use to price the financial instrument. Unobservable inputs are those for which market data are not available and are developed using the best information available about the assumptions that market participants would use to price the financial instrument. GAAP requires valuation techniques to maximize the use of relevant observable inputs and minimize the use of unobservable inputs. When multiple inputs are used to derive fair value, the financial instrument is assigned to the level within the fair value hierarchy based
T. ROWE PRICE QM U.S. BOND ETF
on the lowest-level input that is significant to the fair value of the financial instrument. Input levels are not necessarily an indication of the risk or liquidity associated with financial instruments at that level but rather the degree of judgment used in determining those values.
Valuation Techniques
Debt securities generally are traded in the over-the-counter (OTC) market and are valued at prices furnished by independent pricing services or by broker dealers who make markets in such securities. When valuing securities, the independent pricing services consider factor such as, but not limited to, the yield or price of bonds of comparable quality, coupon, maturity, and type, as well as prices quoted by dealers who make markets in such securities.
Investments in mutual funds are valued at the mutual fund’s closing NAV per share on the day of valuation. Futures contracts are valued at closing settlement prices. Assets and liabilities other than financial instruments, including short-term receivables and payables, are carried at cost, or estimated realizable value, if less, which approximates fair value.
Investments for which market quotations are not readily available or deemed unreliable are valued at fair value as determined in good faith by the Valuation Designee. The Valuation Designee has adopted methodologies for determining the fair value of investments for which market quotations are not readily available or deemed unreliable, including the use of other pricing sources. Factors used in determining fair value vary by type of investment and may include market or investment specific considerations. The Valuation Designee typically will afford greatest weight to actual prices in arm’s length transactions, to the extent they represent orderly transactions between market participants, transaction information can be reliably obtained, and prices are deemed representative of fair value. However, the Valuation Designee may also consider other valuation methods such as market-based valuation multiples; a discount or premium from market value of a similar, freely traded security of the same issuer; discounted cash flows; yield to maturity; or some combination. Fair value determinations are reviewed on a regular basis. Because any fair value determination involves a significant amount of judgment, there is a degree of subjectivity inherent in such pricing decisions. Fair value prices determined by the Valuation Designee could differ from those of other market participants, and it is possible that the fair value determined for a security may be materially different from the value that could be realized upon the sale of that security.
Valuation Inputs
The following table summarizes the fund’s financial instruments, based on the inputs used to determine their fair values on October 31, 2023 (for further detail by category, please refer to the accompanying Portfolio of Investments):
T. ROWE PRICE QM U.S. BOND ETF
| ($000s) | Level 1 | Level 2 | Level 3 | Total Value |
| Assets | | | | |
| Fixed Income1 | $ — | $103,018 | $— | $103,018 |
| Short-Term Investments | 2,912 | — | — | 2,912 |
| Securities Lending Collateral | 2,522 | — | — | 2,522 |
| Total | $5,434 | $103,018 | $— | $108,452 |
| Liabilities | | | | |
| Futures Contracts* | $ 134 | $ — | $— | $ 134 |
| 1 | Includes Asset-Backed Securities, Corporate Bonds, Foreign Government Obligations & Municipalities, Municipal Securities, Non-U.S. Government Mortgage-Backed Securities, U.S. Government & Agency Mortgage-Backed Securities and U.S. Government Agency Obligations (Excluding Mortgage-Backed). |
| * | The fair value presented includes cumulative gain (loss) on open futures contracts; however, the net value reflected on the accompanying Portfolio of Investments is only the unsettled variation margin receivable (payable) at that date. |
NOTE 3 – DERIVATIVE INSTRUMENTS
During the year ended October 31, 2023, the fund invested in derivative instruments. As defined by GAAP, a derivative is a financial instrument whose value is derived from an underlying security price, foreign exchange rate, interest rate, index of prices or rates, or other variable; it requires little or no initial investment and permits or requires net settlement. The fund invests in derivatives only if the expected risks and rewards are consistent with its investment objectives, policies, and overall risk profile, as described in its prospectus and Statement of Additional Information. The fund may use derivatives for a variety of purposes and may use them to establish both long and short positions within the fund’s portfolio. Potential uses include to hedge against declines in principal value, increase yield, invest in an asset with greater efficiency and at a lower cost than is possible through direct investment, to enhance return, or to adjust portfolio duration and credit exposure. The risks associated with the use of derivatives are different from, and potentially much greater than, the risks associated with investing directly in the instruments on which the derivatives are based.
The fund values its derivatives at fair value and recognizes changes in fair value currently in its results of operations. Accordingly, the fund does not follow hedge accounting, even for derivatives employed as economic hedges. Generally, the fund accounts for its derivatives on a gross basis. It does not offset the fair value of derivative liabilities against
T. ROWE PRICE QM U.S. BOND ETF
the fair value of derivative assets on its financial statements, nor does it offset the fair value of derivative instruments against the right to reclaim or obligation to return collateral. The following table summarizes the fair value of the fund’s derivative instruments held as of October 31, 2023, and the related location on the accompanying Statement of Assets and Liabilities, presented by primary underlying risk exposure:
| ($000s) | Location on Statement of
Assets and Liabilities | Fair Value |
| Liabilities | | |
| Interest rate derivatives | Futures* | $134 |
| | |
| * | The fair value presented includes cumulative gain (loss) on open futures contracts; however, the value reflected on the accompanying Statement of Assets and Liabilities is only the unsettled variation margin receivable (payable) at that date. |
Additionally, the amount of gains and losses on derivative instruments recognized in fund earnings during the ended October 31, 2023, and the related location on the accompanying Statement of Operations is summarized in the following table by primary underlying risk exposure:
| ($000s) | Location of Gain (Loss) on Statement of Operations |
| | Futures | Swaps | Total |
| Realized Gain (Loss) | | | |
| Interest rate derivatives | $(232) | $ — | $(232) |
| Credit derivatives | — | 20 | 20 |
| Total | $(232) | $20 | $(212) |
| Change in Unrealized Gain (Loss) | | | |
| Interest rate derivatives | $ (16) | $ — | $ (16) |
Counterparty Risk and Collateral
The fund invests in exchange-traded and/or centrally cleared derivative contracts, such as futures, exchange-traded options, and centrally cleared swaps. Counterparty risk on such derivatives is minimal because the clearinghouse provides protection against counterparty defaults. For futures and centrally cleared swaps, the fund is required to deposit collateral in an amount specified by the clearinghouse and the clearing firm (margin requirement),
T. ROWE PRICE QM U.S. BOND ETF
and the margin requirement must be maintained over the life of the contract. Each clearinghouse and clearing firm, in its sole discretion, may adjust the margin requirements applicable to the fund.
Collateral may be in the form of cash or debt securities issued by the U.S. government or related agencies. Cash posted by the fund is reflected as cash deposits in the accompanying financial statements and generally is restricted from withdrawal by the fund; securities posted by the fund are so noted in the accompanying Portfolio of Investments; both remain in the fund’s assets. While typically not sold in the same manner as equity or fixed income securities, exchange-traded or centrally cleared derivatives may be closed out only on the exchange or clearinghouse where the contracts were cleared. This ability is subject to the liquidity of underlying positions. As of October 31, 2023, securities valued at $116,000 had been posted by the fund for exchange-traded and/or centrally cleared derivatives.
Futures Contracts
The fund is subject to interest rate risk in the normal course of pursuing its investment objectives and uses futures contracts to help manage such risk. The fund may enter into futures contracts to manage exposure to interest rate and yield curve movements, security prices, foreign currencies, credit quality, and mortgage prepayments; as an efficient means of adjusting exposure to all or part of a target market; to enhance income; as a cash management tool; or to adjust portfolio duration and credit exposure. A futures contract provides for the future sale by one party and purchase by another of a specified amount of a specific underlying financial instrument at an agreed-upon price, date, time, and place. The fund currently invests only in exchange-traded futures, which generally are standardized as to maturity date, underlying financial instrument, and other contract terms. Payments are made or received by the fund each day to settle daily fluctuations in the value of the contract (variation margin), which reflect changes in the value of the underlying financial instrument. Variation margin is recorded as unrealized gain or loss until the contract is closed. The value of a futures contract included in net assets is the amount of unsettled variation margin; net variation margin receivable is reflected as an asset and net variation margin payable is reflected as a liability on the accompanying Statement of Assets and Liabilities. When a contract is closed, a realized gain or loss is recorded on the accompanying Statement of Operations. Risks related to the use of futures contracts include possible illiquidity of the futures markets, contract prices that can be highly volatile and imperfectly correlated to movements in hedged security values and/or interest rates, and potential losses in excess of the fund’s initial investment. During the year ended October 31, 2023, the volume of the fund’s activity in futures, based on underlying notional amounts, was generally between 5% and 9% of net assets.
T. ROWE PRICE QM U.S. BOND ETF
Swaps
The fund is subject to credit risk in the normal course of pursuing its investment objectives and uses swap contracts to help manage such risk. The fund may use swaps in an effort to manage both long and short exposure to changes in interest rates, inflation rates, and credit quality; to adjust overall exposure to certain markets; to enhance total return or protect the value of portfolio securities; to serve as a cash management tool; or to adjust portfolio duration and credit exposure. Swap agreements can be settled either directly with the counterparty (bilateral swap) or through a central clearinghouse (centrally cleared swap). Fluctuations in the fair value of a contract are reflected in unrealized gain or loss and are reclassified to realized gain or loss on the accompanying Statement of Operations upon contract termination or cash settlement. Net periodic receipts or payments required by a contract increase or decrease, respectively, the value of the contract until the contractual payment date, at which time such amounts are reclassified from unrealized to realized gain or loss on the accompanying Statement of Operations. For bilateral swaps, cash payments are made or received by the fund on a periodic basis in accordance with contract terms; unrealized gain on contracts and premiums paid are reflected as assets and unrealized loss on contracts and premiums received are reflected as liabilities on the accompanying Statement of Assets and Liabilities. For bilateral swaps, premiums paid or received are amortized over the life of the swap and are recognized as realized gain or loss on the accompanying Statement of Operations. For centrally cleared swaps, payments are made or received by the fund each day to settle the daily fluctuation in the value of the contract (variation margin). Accordingly, the value of a centrally cleared swap included in net assets is the unsettled variation margin; net variation margin receivable is reflected as an asset and net variation margin payable is reflected as a liability on the accompanying Statement of Assets and Liabilities.
Credit default swaps are agreements where one party (the protection buyer) agrees to make periodic payments to another party (the protection seller) in exchange for protection against specified credit events, such as certain defaults and bankruptcies related to an underlying credit instrument, or issuer or index of such instruments. Upon occurrence of a specified credit event, the protection seller is required to pay the buyer the difference between the notional amount of the swap and the value of the underlying credit, either in the form of a net cash settlement or by paying the gross notional amount and accepting delivery of the relevant underlying credit. For credit default swaps where the underlying credit is an index, a specified credit event may affect all or individual underlying securities included in the index and will be settled based upon the relative weighting of the affected underlying security(ies) within the index. Risks related to the use of credit default swaps include the possible inability of the fund to accurately assess the current and future creditworthiness of underlying issuers, the possible failure of a counterparty to perform in
T. ROWE PRICE QM U.S. BOND ETF
accordance with the terms of the swap agreements, potential government regulation that could adversely affect the fund’s swap investments, and potential losses in excess of the fund’s initial investment.
During the year ended October 31, 2023, the volume of the fund’s activity in swaps, based on underlying notional amounts, was generally between 0% and 5% of net assets.
NOTE 4 – OTHER INVESTMENT TRANSACTIONS
Consistent with its investment objective, the fund engages in the following practices to manage exposure to certain risks and/or to enhance performance. The investment objective, policies, program, and risk factors of the fund are described more fully in the fund’s prospectus and Statement of Additional Information.
Restricted Securities
The fund invests in securities that are subject to legal or contractual restrictions on resale. Prompt sale of such securities at an acceptable price may be difficult and may involve substantial delays and additional costs.
Collateralized Loan Obligations
The fund invests in collateralized loan obligations (CLOs) which are entities backed by a diversified pool of syndicated bank loans. The cash flows of the CLO can be split into multiple segments, called “tranches” or “classes”, which will vary in risk profile and yield. The riskiest segments, which are the subordinate or “equity” tranches, bear the greatest risk of loss from defaults in the underlying assets of the CLO and serve to protect the other, more senior, tranches. Senior tranches will typically have higher credit ratings and lower yields than the securities underlying the CLO. Despite the protection from the more junior tranches, senior tranches can experience substantial losses.
Mortgage-Backed Securities
The fund invests in mortgage-backed securities (MBS or pass-through certificates) that represent an interest in a pool of specific underlying mortgage loans and entitle the fund to the periodic payments of principal and interest from those mortgages. MBS may be issued by government agencies or corporations, or private issuers. Most MBS issued by government agencies are guaranteed; however, the degree of protection differs based on the issuer. MBS are sensitive to changes in economic conditions that affect the rate of prepayments and defaults on the underlying mortgages; accordingly, the value, income, and related cash flows from MBS may be more volatile than other debt instruments.
T. ROWE PRICE QM U.S. BOND ETF
TBA Purchase, Sale Commitments and Forward Settling Mortgage Obligations
The fund enters into to-be-announced (TBA) purchase or sale commitments (collectively, TBA transactions), pursuant to which it agrees to purchase or sell, respectively, mortgage-backed securities for a fixed unit price, with payment and delivery at a scheduled future date beyond the customary settlement period for such securities. With TBA transactions, the particular securities to be received or delivered by the fund are not identified at the trade date; however, the securities must meet specified terms, including rate and mortgage term, and be within industry-accepted “good delivery” standards. The fund may enter into TBA transactions with the intention of taking possession of or relinquishing the underlying securities, may elect to extend the settlement by “rolling” the transaction, and/or may use TBA transactions to gain or reduce interim exposure to underlying securities.
To mitigate counterparty risk, the fund has entered into Master Securities Forward Transaction Agreements (MSFTA) with counterparties that provide for collateral and the right to offset amounts due to or from those counterparties under specified conditions. Subject to minimum transfer amounts, collateral requirements are determined and transfers made based on the net aggregate unrealized gain or loss on all TBA commitments and other forward settling mortgage obligations with a particular counterparty (collectively, MSFTA Transactions). At any time, the fund’s risk of loss from a particular counterparty related to its MSFTA Transactions is the aggregate unrealized gain on appreciated MSFTA Transactions in excess of unrealized loss on depreciated MSFTA Transactions and collateral received, if any, from such counterparty. As of October 31, 2023, no collateral was pledged by the fund or counterparties for MSFTA Transactions.
Dollar Rolls
The fund enters into dollar roll transactions, pursuant to which it sells a mortgage-backed TBA or security and simultaneously agrees to purchase a similar, but not identical, TBA with the same issuer, rate, and terms on a later date at a set price from the same counterparty. The fund may execute a “roll” to obtain better underlying mortgage securities or to enhance returns. While the fund may enter into dollar roll transactions with the intention of taking possession of the underlying mortgage securities, it may also close a contract prior to settlement or “roll” settlement to a later date if deemed to be in the best interest of shareholders. Actual mortgages received by the fund may be less favorable than those anticipated. The fund accounts for dollar roll transactions as purchases and sales, which has the effect of increasing its portfolio turnover rate.
Securities Lending
The fund may lend its securities to approved borrowers to earn additional income. Its securities lending activities are administered by a lending agent in accordance with a securities lending agreement. Security loans generally do not have stated maturity dates,
T. ROWE PRICE QM U.S. BOND ETF
and the fund may recall a security at any time. The fund receives collateral in the form of cash or U.S. government securities. Collateral is maintained over the life of the loan in an amount not less than the value of loaned securities; any additional collateral required due to changes in security values is delivered to the fund the next business day. Cash collateral is invested in accordance with investment guidelines approved by fund management. Additionally, the lending agent indemnifies the fund against losses resulting from borrower default. Although risk is mitigated by the collateral and indemnification, the fund could experience a delay in recovering its securities and a possible loss of income or value if the borrower fails to return the securities, collateral investments decline in value, and the lending agent fails to perform. Securities lending revenue consists of earnings on invested collateral and borrowing fees, net of any rebates to the borrower, compensation to the lending agent, and other administrative costs. In accordance with GAAP, investments made with cash collateral are reflected in the accompanying financial statements, but collateral received in the form of securities is not. At October 31, 2023, the value of loaned securities was $2,468,000; the value of cash collateral and related investments was $2,522,000.
Other
Purchases and sales of portfolio securities excluding in-kind transactions and short-term and U.S. government securities aggregated $28,024,000 and $2,836,000, respectively, for the year ended October 31, 2023. Purchases and sales of U.S. government securities, excluding in-kind transactions and short-term securities, aggregated $168,774,000 and $123,313,000, respectively, for the year ended October 31, 2023.
NOTE 5 – FEDERAL INCOME TAXES
Generally, no provision for federal income taxes is required since the fund intends to continue to qualify as a regulated investment company under Subchapter M of the Internal Revenue Code and distribute to shareholders all of its taxable income and gains. Distributions determined in accordance with federal income tax regulations may differ in amount or character from net investment income and realized gains for financial reporting purposes.
The fund files U.S. federal, state, and local tax returns as required. The fund’s tax returns are subject to examination by the relevant tax authorities until expiration of the applicable statute of limitations, which is generally three years after the filing of the tax return but which can be extended to six years in certain circumstances. Tax returns for open years have incorporated no uncertain tax positions that require a provision for income taxes.
T. ROWE PRICE QM U.S. BOND ETF
Capital accounts within the financial reporting records are adjusted for permanent book/tax differences to reflect tax character but are not adjusted for temporary differences. The permanent book/tax adjustments have no impact on results of operations or net assets and relate primarily to character of income on swaps.
The tax character of distributions paid for the periods presented was as follows:
| ($000s) | | |
| | October 31, | October 31, |
| | 2023 | 2022 |
| Ordinary income (including short-term capital gains, if any) | $2,246 | $741 |
At October 31, 2023, the tax-basis cost of investments, (including derivatives, if any) and gross unrealized appreciation and depreciation were as follows:
| ($000s) | |
| Cost of investments | $119,441 |
| Unrealized appreciation | $ 7 |
| Unrealized depreciation | (10,996) |
| Net unrealized appreciation (depreciation) | $ (10,989) |
At October 31, 2023, the tax-basis components of accumulated net earnings (loss) were as follows:
| ($000s) | |
| Undistributed ordinary income | $ 8 |
| Net unrealized appreciation (depreciation) | (10,989) |
| Loss carryforwards and deferrals | (2,136) |
| Total distributable earnings (loss) | $(13,117) |
Temporary differences between book-basis and tax-basis components of total distributable earnings (loss) arise when certain items of income, gain, or loss are recognized in different periods for financial statement purposes versus for tax purposes; these differences will reverse in a subsequent reporting period. The temporary differences relate primarily to the deferral of losses from wash sales and the realization of gains/losses on certain open derivative contracts. The loss carryforwards and deferrals primarily relate to capital loss carryforwards. Capital loss carryforwards are available indefinitely to offset future realized capital gains.
T. ROWE PRICE QM U.S. BOND ETF
NOTE 6 – RELATED PARTY TRANSACTIONS
The fund is managed by T. Rowe Price Associates, Inc. (Price Associates), a wholly owned subsidiary of T. Rowe Price Group, Inc. (Price Group). The investment management and administrative agreement between the fund and Price Associates provides for an all-inclusive annual fee equal to 0.08% of the fund’s average daily net assets. The fee is computed daily and paid monthly. The all-inclusive fee covers investment management services and ordinary, recurring operating expenses, but does not cover interest and borrowing expenses; taxes; brokerage commissions and other transaction costs; fund proxy expenses; and nonrecurring and extraordinary expenses.
T. Rowe Price Investment Services, Inc. (Investment Services) serves as distributor to the fund. Pursuant to an underwriting agreement, no compensation for any distribution services provided is paid to Investment Services by the fund.
The fund may invest its cash reserves in certain open-end management investment companies managed by Price Associates and considered affiliates of the fund: the T. Rowe Price Government Reserve Fund or the T. Rowe Price Treasury Reserve Fund, organized as money market funds (together, the Price Reserve Funds). The Price Reserve Funds are offered as short-term investment options to mutual funds, trusts, and other accounts managed by Price Associates or its affiliates and are not available for direct purchase by members of the public. Cash collateral from securities lending, if any, is invested in the T. Rowe Price Government Reserve Fund. The Price Reserve Funds pay no investment management fees.
As of October 31, 2023, T. Rowe Price Group, Inc., or its wholly owned subsidiaries, owned 1,927,000 shares of the fund, representing 74% of the fund’s net assets.
The fund may participate in securities purchase and sale transactions with other funds or accounts advised by Price Associates (cross trades), in accordance with procedures adopted by the fund’s Board and Securities and Exchange Commission rules, which require, among other things, that such purchase and sale cross trades be effected at the independent current market price of the security. During the year ended October 31, 2023, the fund had no purchases or sales cross trades with other funds or accounts advised by Price Associates.
NOTE 7 – OTHER MATTERS
Unpredictable events such as environmental or natural disasters, war and conflict, terrorism, geopolitical events, and public health epidemics, and similar public health threats may significantly affect the economy and the markets and issuers in which the fund invests. Certain events may cause instability across global markets, including reduced
T. ROWE PRICE QM U.S. BOND ETF
liquidity and disruptions in trading markets, while some events may affect certain geographic regions, countries, sectors, and industries more significantly than others, and exacerbate other pre-existing political, social, and economic risks.
The global outbreak of COVID-19 and related governmental and public responses have led and may continue to lead to increased market volatility and the potential for illiquidity in certain classes of securities and sectors of the market either in specific countries or worldwide.
In February 2022, Russian forces entered Ukraine and commenced an armed conflict, leading to economic sanctions being on Russia that target certain of its citizens and issuers and sectors of the Russian economy, creating impacts on Russian-related stocks and debt and greater volatility in global markets.
In March 2023, the banking industry experienced heightened volatility, which sparked concerns of potential broader adverse market conditions. The extent of impact of these events on the US and global markets is highly uncertain.
These are recent examples of global events which may have a negative impact on the values of certain portfolio holdings or the fund’s overall performance. Management is actively monitoring the risks and financial impacts arising from these events.
T. ROWE PRICE QM U.S. BOND ETF
REPORT OF INDEPENDENT REGISTERED PUBLIC ACCOUNTING FIRM
To the Board of Directors of T. Rowe Price Exchange-Traded Funds, Inc. and Shareholders of T. Rowe Price QM U.S. Bond ETF
Opinion on the Financial Statements
We have audited the accompanying statement of assets and liabilities, including the portfolio of investments, of T. Rowe Price QM U.S. Bond ETF (one of the funds constituting T. Rowe Price Exchange-Traded Funds, Inc., referred to hereafter as the "Fund") as of October 31, 2023, the related statement of operations for the year ended October 31, 2023, the statement of changes in net assets for each of the two years in the period ended October 31, 2023, including the related notes, and the financial highlights for each of the years ended October 31, 2023 and 2022, and for the period September 28, 2021 (inception) through October 31, 2021 (collectively referred to as the “financial statements”). In our opinion, the financial statements present fairly, in all material respects, the financial position of the Fund as of October 31, 2023, the results of its operations for the year then ended, the changes in its net assets for each of the two years in the period ended October 31, 2023 and the financial highlights for each of the years ended October 31, 2023 and 2022, and for the period September 28, 2021 (inception) through October 31, 2021 in conformity with accounting principles generally accepted in the United States of America.
Basis for Opinion
These financial statements are the responsibility of the Fund’s management. Our responsibility is to express an opinion on the Fund’s financial statements based on our audits. We are a public accounting firm registered with the Public Company Accounting Oversight Board (United States) (PCAOB) and are required to be independent with respect to the Fund in accordance with the U.S. federal securities laws and the applicable rules and regulations of the Securities and Exchange Commission and the PCAOB.
We conducted our audits of these financial statements in accordance with the standards of the PCAOB. Those standards require that we plan and perform the audit to obtain reasonable assurance about whether the financial statements are free of material misstatement, whether due to error or fraud.
T. ROWE PRICE QM U.S. BOND ETF
REPORT OF INDEPENDENT REGISTERED PUBLIC ACCOUNTING FIRM
(CONTINUED)
Our audits included performing procedures to assess the risks of material misstatement of the financial statements, whether due to error or fraud, and performing procedures that respond to those risks. Such procedures included examining, on a test basis, evidence regarding the amounts and disclosures in the financial statements. Our audits also included evaluating the accounting principles used and significant estimates made by management, as well as evaluating the overall presentation of the financial statements. Our procedures included confirmation of securities owned as of October 31, 2023 by correspondence with the custodian and brokers; when replies were not received from brokers, we performed other auditing procedures. We believe that our audits provide a reasonable basis for our opinion.
/s/ PricewaterhouseCoopers LLP
Baltimore, Maryland
December 19, 2023
We have served as the auditor of one or more investment companies in the T. Rowe Price group of investment companies since 1973.
T. ROWE PRICE QM U.S. BOND ETF
TAX INFORMATION (UNAUDITED) FOR THE TAX YEAR ENDED 10/31/23
We are providing this information as required by the Internal Revenue Code. The amounts shown may differ from those elsewhere in this report because of differences between tax and financial reporting requirements.
For nonresident alien shareholders, $2,246,000 of income dividends are interest-related dividends.
For shareholders subject to interest expense deduction limitation under Section 163(j), $2,012,000 of the fund’s income qualifies as a Section 163(j) interest dividend and can be treated as interest income for purposes of Section 163(j), subject to holding period requirements and other limitations.
INFORMATION ON PROXY VOTING POLICIES, PROCEDURES, AND RECORDS
A description of the policies and procedures used by T. Rowe Price funds and portfolios to determine how to vote proxies relating to portfolio securities is available in each fund’s Statement of Additional Information. You may request this document by calling 1-800-638-5660 or by accessing the SEC’s website, sec.gov.
The description of our proxy voting policies and procedures is also available on our corporate website. To access it, please visit the following Web page:
https://www.troweprice.com/corporate/en/utility/policies.html
Scroll down to the section near the bottom of the page that says, “Proxy Voting Policies.” Click on the Proxy Voting Policies link in the shaded box.
Each fund’s most recent annual proxy voting record is available on our website and through the SEC’s website. To access it through T. Rowe Price, visit the website location shown above, and scroll down to the section near the bottom of the page that says, “Proxy Voting Records.” Click on the Proxy Voting Records link in the shaded box.
RESULTS OF PROXY VOTING
A Special Meeting of Shareholders was held on July 24, 2023 for shareholders of record on April 27, 2023, to elect the following director-nominees to serve on the Board of all Price Funds. The newly elected Directors took office effective July 24, 2023.
The results of the voting were as follows:
| | Votes For | Votes Withheld |
| Melody Bianchetto | 13,058,976 | 207,279 |
| Mark J. Parrell | 13,008,567 | 257,689 |
| Eric L. Veiel | 13,038,692 | 227,564 |
| Kellye L. Walker | 13,058,746 | 207,511 |
| | | |
T. ROWE PRICE QM U.S. BOND ETF
Teresa Bryce Bazemore, Bruce W. Duncan, Robert J. Gerrard, Jr., Paul F. McBride and David Oestreicher continue to serve as Directors on the Board of all Price Funds.
HOW TO OBTAIN QUARTERLY PORTFOLIO HOLDINGS
The fund files a complete schedule of portfolio holdings with the Securities and Exchange Commission (SEC) for the first and third quarters of each fiscal year as an exhibit to its reports on Form N-PORT. The fund’s Form N-PORT is available electronically on the SEC’s website (sec.gov). In addition, most T. Rowe Price funds disclose their first and third fiscal quarter-end holdings at troweprice.com.
TAILORED SHAREHOLDER REPORTS FOR MUTUAL FUNDS AND EXCHANGE TRADED FUNDS
In October 2022, the Securities and Exchange Commission (SEC) adopted rule and form amendments requiring Mutual Funds and Exchange-Traded Funds to transmit concise and visually engaging streamlined annual and semiannual reports that highlight key information to shareholders. Other information, including financial statements, will no longer appear in the funds’ shareholder reports but will be available online, delivered free of charge upon request, and filed on a semiannual basis on Form N-CSR. The rule and form amendments have a compliance date of July 24, 2024.
T. ROWE PRICE QM U.S. BOND ETF
Liquidity Risk Management Program
In accordance with Rule 22e-4 (Liquidity Rule) under the Investment Company Act of 1940, as amended, the fund has established a liquidity risk management program (Liquidity Program) reasonably designed to assess and manage the fund’s liquidity risk, which generally represents the risk that the fund would not be able to meet redemption requests without significant dilution of remaining investors’ interests in the fund. The fund’s Board of Directors (Board) has appointed the fund’s investment adviser, T. Rowe Price Associates, Inc. (Adviser), as the administrator of the Liquidity Program. As administrator, the Adviser is responsible for overseeing the day-to-day operations of the Liquidity Program and, among other things, is responsible for assessing, managing, and reviewing with the Board at least annually the liquidity risk of each T. Rowe Price fund. The Adviser has delegated oversight of the Liquidity Program to a Liquidity Risk Committee (LRC), which is a cross-functional committee composed of personnel from multiple departments within the Adviser.
The Liquidity Program’s principal objectives include supporting the T. Rowe Price funds’ compliance with limits on investments in illiquid assets and mitigating the risk that the fund will be unable to timely meet its redemption obligations. The Liquidity Program also includes a number of elements that support the management and assessment of liquidity risk, including an annual assessment of factors that influence the fund’s liquidity and the periodic classification and reclassification of a fund’s investments into categories that reflect the LRC’s assessment of their relative liquidity under current market conditions. Under the Liquidity Program, every investment held by the fund is classified at least monthly into one of four liquidity categories based on estimations of the investment’s ability to be sold during designated time frames in current market conditions without significantly changing the investment’s market value.
As required by the Liquidity Rule, at a meeting held on July 24, 2023, the Board was presented with an annual assessment that was prepared by the LRC on behalf of the Adviser and addressed the operation of the Liquidity Program and assessed its adequacy and effectiveness of implementation, including any material changes to the Liquidity Program and the determination of each fund’s Highly Liquid Investment Minimum (HLIM). The annual assessment included consideration of the following factors, as applicable: the fund’s investment strategy and liquidity of portfolio investments during normal and reasonably foreseeable stressed conditions, including whether the investment strategy is appropriate for an open-end fund, the extent to which the strategy involves a relatively concentrated portfolio or large positions in particular issuers, and the use of borrowings for investment purposes and derivatives; short-term and long-term cash flow projections covering both normal and reasonably foreseeable stressed conditions; and holdings of cash and cash equivalents, as well as available borrowing arrangements.
For the fund and other T. Rowe Price funds, the annual assessment incorporated a report related to a fund’s holdings, shareholder and portfolio concentration, any borrowings during the period, cash flow projections, and other relevant data for the period of April 1, 2022, through March 31, 2023. The report described the methodology for classifying a fund’s investments (including any derivative transactions) into one of four liquidity
T. ROWE PRICE QM U.S. BOND ETF
Liquidity Risk Management Program (continued)
categories, as well as the percentage of a fund’s investments assigned to each category. It also explained the methodology for establishing a fund’s HLIM and noted that the LRC reviews the HLIM assigned to each fund no less frequently than annually.
During the period covered by the annual assessment, the LRC has concluded, and reported to the Board, that the Liquidity Program continues to operate adequately and effectively and is reasonably designed to assess and manage the fund’s liquidity risk.
T. ROWE PRICE QM U.S. BOND ETF
ABOUT THE FUND’S DIRECTORS AND OFFICERS
Your fund is overseen by a Board of Directors (Board) that meets regularly to review a wide variety of matters affecting or potentially affecting the fund, including performance, investment programs, compliance matters, advisory fees and expenses, service providers, and business and regulatory affairs. The Board elects the fund’s officers, who are listed in the final table. The directors who are also employees or officers of T. Rowe Price are considered to be “interested” directors as defined in Section 2(a)(19) of the 1940 Act because of their relationships with T. Rowe Price Associates, Inc. (T. Rowe Price), and its affiliates. The business address of each director and officer is 100 East Pratt Street, Baltimore, Maryland 21202. The Statement of Additional Information includes additional information about the fund directors and is available without charge by calling a T. Rowe Price representative at 1-800-638-5660.
INDEPENDENT DIRECTORS(a)
Name
(Year of Birth)
Year Elected
[Number of T. Rowe Price
Portfolios Overseen] | Principal Occupation(s) and Directorships of Public Companies and
Other Investment Companies During the Past Five Years |
Teresa Bryce Bazemore
(1959)
2019
[209] | President and Chief Executive Officer, Federal Home Loan
Bank of San Francisco (2021 to present); Chief Executive Officer,
Bazemore Consulting LLC (2018 to 2021); Director, Chimera
Investment Corporation (2017 to 2021); Director, First Industrial
Realty Trust (2020 to present); Director, Federal Home Loan Bank of
Pittsburgh (2017 to 2019) |
Melody Bianchetto
(1966)
2023
[209] | Vice President for Finance, University of Virginia (2015 to 2023)
|
Bruce W. Duncan
(1951)
2019
[209] | President, Chief Executive Officer, and Director, CyrusOne, Inc. (2020 to
2021); Chair of the Board (2016 to 2020) and President (2009 to 2016),
First Industrial Realty Trust, owner and operator of industrial properties;
Member, Investment Company Institute Board of Governors (2017 to
2019); Member, Independent Directors Council Governing Board (2017
to 2019); Senior Advisor, KKR (2018 to 2022); Director, Boston
Properties (2016 to present); Director, Marriott International, Inc. (2016 to
2020) |
Robert J. Gerrard, Jr.
(1952)
2019
[209] | Chair of the Board, all funds (July 2018 to present)
|
T. ROWE PRICE QM U.S. BOND ETF
INDEPENDENT DIRECTORS(a) (continued)
Name
(Year of Birth)
Year Elected
[Number of T. Rowe Price
Portfolios Overseen] | Principal Occupation(s) and Directorships of Public Companies and
Other Investment Companies During the Past Five Years |
Paul F. McBride
(1956)
2019
[209] | Advisory Board Member, Vizzia Technologies (2015 to present); Board
Member, Dunbar Armored (2012 to 2018)
|
Mark J. Parrell
(1956)
2019
[209] | Board of Trustees Member and Chief Executive Officer (2019 to
present), President (2018 to present), Executive Vice President and
Chief Financial Officer (2007 to 2018), and Senior Vice President and
Treasurer (2005 to 2007), EQR; Member, Nareit Dividends Through
Diversity, Equity & Inclusion CEO Council and Chair, Nareit 2021 Audit
and Investment Committee (2021); Advisory Board, Ross Business
School at University of Michigan (2015 to 2016); Member, National
Multifamily Housing Council and served as Chair of the Finance
Committee (2015 to 2016); Member, Economic Club of Chicago;
Director, Brookdale Senior Living, Inc. (2015 to 2017); Director, Aviv
REIT, Inc. (2013 to 2015); Director, Real Estate Roundtable and the
2022 Executive Board Nareit; Board of Directors and Chair of the
Finance Committee, Greater Chicago Food Depository |
Kellye L. Walker
(1966)
2021
[209] | Executive Vice President and Chief Legal Officer, Eastman Chemical
Company (April 2020 to present); Executive Vice President and Chief
Legal Officer, Huntington Ingalls Industries, Inc. (January 2015 to March
2020); Director, Lincoln Electric Company (October 2020 to present) |
(a)All information about the independent directors was current as of December 31, 2022, unless otherwise indicated, except for the number of portfolios overseen, which is current as of the date of this report.
T. ROWE PRICE QM U.S. BOND ETF
INTERESTED DIRECTORS(a)
Name
(Year of Birth)
Year Elected
[Number of T. Rowe Price
Portfolios Overseen] | Principal Occupation(s) and Directorships of Public Companies and
Other Investment Companies During the Past Five Years |
David Oestreicher
(1967)
2020
[205] | Director, Vice President, and Secretary, T. Rowe Price, T. Rowe Price
Investment Services, Inc., T. Rowe Price Retirement Plan Services,
Inc., and T. Rowe Price Services, Inc.; Director and Secretary,
T. Rowe Price Investment Management, Inc. (Price Investment
Management); Vice President and Secretary, T. Rowe Price
International (Price International); Vice President, T. Rowe Price Hong
Kong (Price Hong Kong), T. Rowe Price Japan (Price Japan), and T.
Rowe Price Singapore (Price Singapore); General Counsel, Vice
President, and Secretary, T. Rowe Price Group, Inc.; Chair of the
Board, Chief Executive Officer, President, and Secretary, T. Rowe
Price Trust Company; Principal Executive Officer and Executive Vice
President, all funds |
Eric L. Veiel, CFA
(1972)
2022
[205] | Director and Vice President, T. Rowe Price; Vice President, T. Rowe
Price Group, Inc., and T. Rowe Price Trust Company; Vice President,
Global Funds |
(a)All information about the interested directors was current as of December 31, 2022, unless otherwise indicated, except for the number of portfolios overseen, which is current as of the date of this report.
OFFICERS
Name (Year of Birth)
Position Held With Exchange-Traded Funds | Principal Occupation(s) |
Christopher P. Brown (1977)
Executive Vice President | Vice President, T. Rowe Price and T. Rowe Price Group, Inc. |
Armando (Dino) Capasso (1974)
Chief Compliance Officer and Vice
President | Chief Compliance Officer and Vice President, T. Rowe Price and Price Investment Management; Vice President, T. Rowe Price Group, Inc.; formerly, Chief Compliance Officer, PGIM Investments LLC and AST Investment Services, Inc. (ASTIS) (to 2022); Chief Compliance Officer, PGIM Retail Funds complex and Prudential Insurance Funds (to 2022); Vice President and Deputy Chief Compliance Officer, PGIM Investments LLC and ASTIS (to 2019) |
Timothy Coyne (1967)
Executive Vice President | Vice President, T. Rowe Price and T. Rowe Price Group, Inc. |
Vincent Michael DeAugustino (1983)
Executive Vice President | Vice President, T. Rowe Price and T. Rowe Price Group, Inc. |
T. ROWE PRICE QM U.S. BOND ETF
OFFICERS (continued)
Name (Year of Birth)
Position Held With Exchange-Traded Funds | Principal Occupation(s) |
Anna Alexandra Dreyer, Ph.D., CFA (1981)
Executive Vice President | Vice President, T. Rowe Price and T. Rowe Price Group, Inc. |
Alan S. Dupski, CPA (1982)
Principal Financial Officer, Vice
President, and Treasurer | Vice President, Price Investment Management, T. Rowe Price, T. Rowe Price Group, Inc., and T. Rowe Price Trust Company |
Cheryl Emory (1963)
Assistant Secretary | Assistant Vice President and Assistant Secretary, T. Rowe Price; Assistant Secretary, T. Rowe Price Group, Inc., Price Investment Management, Price International, Price Hong Kong, Price Singapore, T. Rowe Price Investment Services,
Inc., T. Rowe Price Retirement Plan Services, Inc., and T.
Rowe Price Trust Company |
Joseph B. Fath, CPA (1971)
Executive Vice President | Vice President, T. Rowe Price, T. Rowe Price Group, Inc., and T. Rowe Price Trust Company |
Paul Greene II (1978)
Executive Vice President | Vice President, T. Rowe Price, T. Rowe Price Group, Inc., and T. Rowe Price Trust Company |
Cheryl Hampton, CPA (1969)
Vice President | Vice President, T. Rowe Price, T. Rowe Price Group, Inc., and T. Rowe Price Trust Company; formerly, Tax Director, Invesco Ltd. (to 2021); Vice President, Oppenheimer Funds, Inc. (to 2019) |
Ann M. Holcomb, CFA (1972)
Executive Vice President | Vice President, T. Rowe Price, T. Rowe Price Group, Inc., and T. Rowe Price Trust Company |
Thomas J. Huber, CFA (1966)
Executive Vice President | Vice President, T. Rowe Price, T. Rowe Price Group, Inc., and T. Rowe Price Trust Company |
Benjamin Kersse, CPA (1989)
Vice President | Vice President, T. Rowe Price and T. Rowe Price Trust
Company |
Paul J. Krug, CPA (1964)
Vice President | Vice President, T. Rowe Price, T. Rowe Price Group, Inc., and T. Rowe Price Trust Company |
Robert M. Larkins, CFA (1973)
Executive Vice President | Vice President, T. Rowe Price, T. Rowe Price Group, Inc., and T. Rowe Price Trust Company |
John D. Linehan, CFA (1965)
Executive Vice President | Vice President, T. Rowe Price, T. Rowe Price Group, Inc., and T. Rowe Price Trust Company |
Jodi Love (1977)
Executive Vice President | Vice President, Price Investment Management and T. Rowe Price Group, Inc.; formerly, Managing Director, Jennison Associates LLC (to 2019) |
Paul M. Massaro, CFA (1975)
Executive Vice President | Vice President, T. Rowe Price, T. Rowe Price Group, Inc., and T. Rowe Price Trust Company |
T. ROWE PRICE QM U.S. BOND ETF
OFFICERS (continued)
Name (Year of Birth)
Position Held With Exchange-Traded Funds | Principal Occupation(s) |
Colin McQueen (1967)
Executive Vice President | Vice President, Price Investment Management and T. Rowe
Price Group, Inc.; formerly, Senior Investment Manager,
Global Equities, Sanlam FOUR Investments UK Limited (to
2019) |
Joshua Nelson (1977)
President | Vice President, T. Rowe Price, T. Rowe Price Group, Inc., Price International, and T. Rowe Price Trust Company |
Jason Nogueira (1974)
Executive Vice President | Vice President, T. Rowe Price and T. Rowe Price Group, Inc. |
Alexander S. Obaza (1981)
Executive Vice President | Vice President, T. Rowe Price, T. Rowe Price Group, Inc., and T. Rowe Price Trust Company |
Donald J. Peters (1959)
Executive Vice President | Vice President, T. Rowe Price and T. Rowe Price Group,
Inc. |
Fran M. Pollack-Matz (1961)
Vice President and Secretary | Vice President, T. Rowe Price, T. Rowe Price Group, Inc., T. Rowe Price Investment Services, Inc., T. Rowe Price Services, Inc., and T. Rowe Price Trust Company |
Jason Benjamin Polun, CFA (1974)
Executive Vice President | Vice President, T. Rowe Price, T. Rowe Price Group, Inc., and T. Rowe Price Trust Company |
Sebastian Schrott (1977)
Executive Vice President | Vice President, T. Rowe Price Group, Inc., and Price
International |
Richard Sennett, CPA (1970)
Assistant Treasurer | Vice President, T. Rowe Price, T. Rowe Price Group, Inc.,
and T. Rowe Price Trust Company |
Gabriel Solomon (1977)
Executive Vice President | Vice President, T. Rowe Price and T. Rowe Price Group,
Inc. |
Peter Stournaras (1973)
Executive Vice President | Vice President, T. Rowe Price and T. Rowe Price Group,
Inc.; formerly, Managing Director and Chief Portfolio
Strategist JP Morgan Private Bank (to 2020); Private
Consultant and Advisor, Pteleos Consulting (to 2018) |
Taymour R. Tamaddon, CFA (1976)
Executive Vice President | Vice President, T. Rowe Price, T. Rowe Price Group, Inc.,
and T. Rowe Price Trust Company |
T. ROWE PRICE QM U.S. BOND ETF
OFFICERS (continued)
Name (Year of Birth)
Position Held With Exchange-Traded Funds | Principal Occupation(s) |
Megan Warren (1968)
Vice President | OFAC Sanctions Compliance Officer and Vice President, Price Investment Management; Vice President, T. Rowe Price, T. Rowe Price Group, Inc., T. Rowe Price Retirement Plan Services, Inc., T. Rowe Price Services, Inc., and T.
Rowe Price Trust Company |
Ellen York (1988)
Vice President | Vice President, Price Investment Management and T. Rowe
Price |
Unless otherwise noted, officers have been employees of T. Rowe Price or Price International for at least 5 years.
100 East Pratt Street
Baltimore, MD 21202
Call 1-800-638-5660 to request a prospectus or summary prospectus; each includes investment objectives, risks, fees, expenses, and other information that you should read and consider carefully before investing.
T. Rowe Price Investment Services, Inc.
Item 1. (b) Notice pursuant to Rule 30e-3.
Not applicable.
Item 2. Code of Ethics.
The registrant has adopted a code of ethics, as defined in Item 2 of Form N-CSR, applicable to its principal executive officer, principal financial officer, principal accounting officer or controller, or persons performing similar functions. A copy of this code of ethics is filed as an exhibit to this Form N-CSR. No substantive amendments were approved or waivers were granted to this code of ethics during the period covered by this report.
Item 3. Audit Committee Financial Expert.
The registrant’s Board of Directors has determined that Ms. Teresa Bryce Bazemore qualifies as an audit committee financial expert, as defined in Item 3 of Form N-CSR. Ms. Bazemore is considered independent for purposes of Item 3 of Form N-CSR.
Item 4. Principal Accountant Fees and Services.
(a) – (d) Aggregate fees billed for the last two fiscal years for professional services rendered to, or on behalf of, the registrant by the registrant’s principal accountant were as follows:
| | | | | | | | | | |
| | | | 2023 | | | 2022 | |
| | Audit Fees | | $ | 32,851 | | | $ | 36,462 | |
| | Audit-Related Fees | | | - | | | | - | |
| | Tax Fees | | | - | | | | 6,563 | �� |
| | All Other Fees | | | - | | | | - | |
Audit fees include amounts related to the audit of the registrant’s annual financial statements and services normally provided by the accountant in connection with statutory and regulatory filings. Audit-related fees include amounts reasonably related to the performance of the audit of the registrant’s financial statements and specifically include the issuance of a report on internal controls and, if applicable, agreed-upon procedures related to fund acquisitions. Tax fees include amounts related to services for tax compliance, tax planning, and tax advice. The nature of these services specifically includes the review of distribution calculations and the preparation of Federal, state, and excise tax returns. All other fees include the registrant’s pro-rata share of amounts for agreed-upon procedures in conjunction with service contract approvals by the registrant’s Board of Directors/Trustees.
(e)(1) The registrant’s audit committee has adopted a policy whereby audit and non-audit services performed by the registrant’s principal accountant for the registrant, its investment adviser, and any entity controlling, controlled by, or under common control with the investment adviser that provides ongoing services to the registrant require pre-approval in advance at regularly scheduled audit committee meetings. If such a service is required between regularly scheduled audit committee meetings, pre-approval may be authorized by one audit committee member with ratification at the next scheduled audit committee meeting. Waiver of pre-approval for audit or non-audit services requiring fees of a de minimis amount is not permitted.
(2) No services included in (b) – (d) above were approved pursuant to paragraph (c)(7)(i)(C) of Rule 2-01 of Regulation S-X.
(f) Less than 50 percent of the hours expended on the principal accountant’s engagement to audit the registrant’s financial statements for the most recent fiscal year were attributed to work performed by persons other than the principal accountant’s full-time, permanent employees.
(g) The aggregate fees billed for the most recent fiscal year and the preceding fiscal year by the registrant’s principal accountant for non-audit services rendered to the registrant, its investment adviser, and any entity controlling, controlled by, or under common control with the investment adviser that provides ongoing services to the registrant were $1,584,000 and $2,760,000, respectively.
(h) All non-audit services rendered in (g) above were pre-approved by the registrant’s audit committee. Accordingly, these services were considered by the registrant’s audit committee in maintaining the principal accountant’s independence.
Item 5. Audit Committee of Listed Registrants.
Not applicable.
Item 6. Investments.
(a) Not applicable. The complete schedule of investments is included in Item 1 of this Form N-CSR.
(b) Not applicable.
Item 7. Disclosure of Proxy Voting Policies and Procedures for Closed-End Management Investment Companies.
Not applicable.
Item 8. Portfolio Managers of Closed-End Management Investment Companies.
Not applicable.
Item 9. Purchases of Equity Securities by Closed-End Management Investment Company and Affiliated Purchasers.
Not applicable.
Item 10. Submission of Matters to a Vote of Security Holders.
There has been no change to the procedures by which shareholders may recommend nominees to the registrant’s board of directors.
Item 11. Controls and Procedures.
(a) The registrant’s principal executive officer and principal financial officer have evaluated the registrant’s disclosure controls and procedures within 90 days of this filing and have concluded that the registrant’s disclosure controls and procedures were effective, as of that date, in ensuring that information required to be disclosed by the registrant in this Form N-CSR was recorded, processed, summarized, and reported timely.
(b) The registrant’s principal executive officer and principal financial officer are aware of no change in the registrant’s internal control over financial reporting that occurred during the period covered by this report that has materially affected, or is reasonably likely to materially affect, the registrant’s internal control over financial reporting.
Item 12. Disclosure of Securities Lending Activities for Closed-End Management Investment Companies.
Not applicable.
Item 13. Exhibits.
SIGNATURES
Pursuant to the requirements of the Securities Exchange Act of 1934 and the Investment Company Act of 1940, the registrant has duly caused this report to be signed on its behalf by the undersigned, thereunto duly authorized.
| | | | |
| T. Rowe Price Exchange-Traded Funds, Inc. |
| | |
| By | | /s/ David Oestreicher | | |
| | David Oestreicher | | |
| | Principal Executive Officer | | |
| | |
| Date | | December 19, 2023 | | |
Pursuant to the requirements of the Securities Exchange Act of 1934 and the Investment Company Act of 1940, this report has been signed below by the following persons on behalf of the registrant and in the capacities and on the dates indicated.
| | | | |
| By | | /s/ David Oestreicher | | |
| | David Oestreicher | | |
| | Principal Executive Officer | | |
| | |
| Date | | December 19, 2023 | | |
| | | | |
| By | | /s/ Alan S. Dupski | | |
| | Alan S. Dupski | | |
| | Principal Financial Officer | | |
| | |
| Date | | December 19, 2023 | | |