UNITED STATES
SECURITIES AND EXCHANGE COMMISSION
Washington, D.C. 20549
FORM N-CSR
CERTIFIED SHAREHOLDER REPORT OF REGISTERED
MANAGEMENT INVESTMENT COMPANIES
Investment Company Act File Number: 811-23494
T. Rowe Price Exchange-Traded Funds, Inc.
(Exact name of registrant as specified in charter)
100 East Pratt Street, Baltimore, MD 21202
(Address of principal executive offices)
David Oestreicher
100 East Pratt Street, Baltimore, MD 21202
(Name and address of agent for service)
Registrant’s telephone number, including area code: (410) 345-2000
Date of fiscal year end: May 31
Date of reporting period: May 31, 2023
Item 1. Reports to Shareholders
(a) Report pursuant to Rule 30e-1
ANNUAL REPORT
May 31, 2023
| | T. ROWE PRICE |
| THYF | U.S. High Yield ETF |
| | For more insights from T. Rowe Price investment professionals, go to troweprice.com. |
T. ROWE PRICE U.S. HIGH YIELD ETF
HIGHLIGHTS
| ■ | The fund generated positive returns from its inception through May 31, 2023, although it underperformed the benchmark ICE BofA US High Yield Constrained Index and marginally lagged its Lipper peer group average. |
| ■ | The high yield asset class rallied during the final months of last year and was one of the top-performing fixed income segments year-to-date. |
| ■ | We maintained our credit quality positioning with an overweight in the CCC rating tier relative to the index and reduced our exposure to energy, which remains our largest industry overweight. |
| ■ | Although credit spreads remain near historical averages, the high yield asset class appears poised to generate strong total returns as its low dollar prices provide capital appreciation potential and yields are near decade-high levels. |
Sign up for e-delivery of your statements, confirmations, and prospectuses or shareholder reports.
If you invest directly with T. Rowe Price, go to troweprice.com/paperless.
If you invest through an investment advisor, a bank, or a brokerage firm, please contact that organization and ask if it can provide electronic documentation.
It’s fast—receive your statements and
confirmations faster than U.S. mail.
It’s convenient—access your important account documents whenever you need them.
It’s secure—we protect your online accounts using “True Identity” to confirm new accounts and make verification faster and more secure.
It can save you money—where applicable,
T. Rowe Price passes on the cost savings to
fund holders.*
Log in to your account at troweprice.com for more information.
*Certain mutual fund accounts that are assessed an annual account service fee can also save money by switching to e-delivery.
T. ROWE PRICE U.S. HIGH YIELD ETF
Market Commentary
Dear Shareholder
Major global stock and bond indexes produced mixed returns during your fund’s fiscal year, the 12-month period ended May 31, 2023. Rising interest rates weighed on returns in the first half of the period, but many sectors rebounded over the past six months as growth remained positive in the major economies and corporate earnings results came in stronger than expected.
For the 12-month period, growth stocks outperformed value shares, and developed market shares generally outpaced their emerging market counterparts. In the U.S., the Russell 1000 Growth Index and Nasdaq Composite Index performed the best. Most currencies weakened versus the U.S. dollar over the period, which weighed on returns for U.S. investors in international securities.
Within the S& P 500 Index, the information technology sector had, by far, the strongest returns. Big tech companies rebounded strongly at the start of 2023, helped in part by growing investor enthusiasm for artificial intelligence applications. Meanwhile, falling prices for various commodities weighed on returns for the materials and energy sectors, and turmoil in the banking sector, which included the failure of three large regional banks, hurt the financials segment. Real estate stocks also came under pressure amid concerns about the ability of some commercial property owners to refinance their debt.
Cheaper oil contributed to slowing inflation during the period, although core inflation readings—which exclude volatile food and energy prices—remained stubbornly high. April’s consumer price index data (the latest available in our reporting period) showed a headline inflation rate of 4.9% on a 12-month basis, down from more than 8% at the start of the period but still well above the Fed’s long-term 2% inflation target.
In response to persistent inflation, the Fed raised its short-term lending benchmark rate from around 1.00% at the start of the period to a range of 5.00% to 5.25% by the end of May, the highest level since 2007. However, Fed officials have recently suggested that they might soon be ready to pause additional rate hikes as they wait to see how the economy is progressing.
Bond yields increased considerably across the U.S. Treasury yield curve as the Fed tightened monetary policy, with the yield on the benchmark 10-year note climbing from 2.85% at the start of the period to 3.64% at the end of May.
T. ROWE PRICE U.S. HIGH YIELD ETF
Significant inversions in the yield curve, which are often considered a warning sign of a coming recession, occurred during the period as shorter-maturity Treasuries experienced the largest yield increases. At the end of May, the yield on the three-month Treasury bill was 188 basis points (1.88 percentage point) higher than the yield on the 10-year Treasury note. Increasing yields led to weak results across most of the fixed income market, although high yield bonds, which are less sensitive to rising rates, held up relatively well.
Global economies and markets showed surprising resilience in recent months, but, moving into the second half of 2023, we believe investors could face potential challenges. The economic impact of the Fed’s rate hikes has yet to be fully felt in the economy, and while the regional banking turmoil appears to have been contained by the swift actions of regulators, it could continue to have an impact on credit conditions. Moreover, the market consensus still seems to forecast a global recession starting later this year or in early 2024, although it could be a mild downturn.
We believe this environment makes skilled active management a critical tool for identifying risks and opportunities, and our investment teams will continue to use fundamental research to identify securities that can add value to your portfolio over the long term.
Thank you for your continued confidence in T. Rowe Price.
Sincerely,
Robert Sharps
CEO and President
T. ROWE PRICE U.S. HIGH YIELD ETF
Management’s Discussion of Fund Performance
INVESTMENT OBJECTIVE
The fund seeks total return, and secondarily, current income.
FUND COMMENTARY
How did the fund perform since its inception?
The fund returned 4.36% from its inception on October 25, 2022, through May 31, 2023. The fund underperformed its benchmark, the ICE BofA US High Yield Constrained Index, and marginally lagged its Lipper peer group average. (Past performance cannot guarantee future results.)
What factors influenced the fund’s performance?
High yield bonds rallied during the reporting period as easing inflation concerns supported hopes that the Federal Reserve would moderate the pace of its interest rate increases. Risk sentiment also improved as near-term recession risks faded,
PERFORMANCE COMPARISON
| | Total Return |
| Periods Ended 5/31/23 | 6 Months | Since
Inception
10/25/22 |
| U.S. High Yield ETF (Based on Net Asset Value) | 2.14% | 4.36% |
| U.S. High Yield ETF (At Market Price)* | 1.16 | 4.98 |
| ICE BofA US High Yield Constrained Index | 2.95 | 6.10 |
| Lipper High Yield Funds Average** | 2.42 | 4.49 |
*Market returns are based on the midpoint of the bid/ask spread at market close (typically, 4 p.m. ET) and do not represent returns an investor would have received if shares were traded at other times.
**As of 10/31/22.
T. ROWE PRICE U.S. HIGH YIELD ETF
providing a tailwind for high yield bonds. The asset class was one of the top-performing fixed income segments year-to-date and proved resilient in March despite turmoil in the banking industry that sparked significant volatility.
In a reversal of last year’s trends, the CCC rating tier outperformed BB and B rated credits during the reporting period. In terms of the fund’s relative performance by credit quality, selection among B rated bonds was the most notable relative performance detractor.
At the industry level, the fund posted its weakest relative results in the services, telecommunications, and energy segments. In terms of performance by individual issuers, Sabre, a software and technology company that powers the global travel industry, was a notable detractor. The bonds sold off after Sabre’s fourth-quarter and fiscal year 2022 results missed consensus expectations. We are maintaining our conviction, however, as the company should begin to realize cost efficiencies from its migration to cloud infrastructure in 2024 and 2025 and also benefit from a delayed recovery in business and international travel post-pandemic. Bonds issued by international communications company Level 3 Communications (LVLT) came under pressure and weighed on the fund’s relative performance amid a distressed debt exchange from Lumen Technologies'—which acquired LVLT in 2017—unsecured bonds to secured LVLT bonds. We are maintaining our position in the company as it continues to generate steady free cash flow and given our belief that current discounts offer some margin of safety against further material price degradation. Satellite television company DISH Network underperformed during the period amid concerns about its capital structure and due to the fallout from a cyber attack that impacted its operations during the first quarter of 2023. (Please refer to the fund’s portfolio of investments for a complete list of holdings and the amount each represents in the portfolio.)
The portfolio recorded its best results in the leisure, automotive, and capital goods segments. At the issuer level, Studio City, a Macau-based casino operator, was a leading contributor after it was awarded an extension of its casino licenses, and robust pent-up demand following the reversal of China’s zero-COVID policy supported results. Our holdings of automobile manufacturer Jaguar Land Rover traded higher. The company ended its fiscal year 2023 with results that surpassed expectations on nearly every metric as production significantly improved, and diminishing supply chain headwinds supported bullish fiscal year 2024 guidance. Low-cost copper producer Ero Copper was another meaningful contributor amid secular tailwinds driving demand for copper. The company is scheduled to commence production at a third mine in late 2024 or early 2025, which is expected to increase its copper output by roughly 60%. Avoiding troubled credits was also an important driver of relative results, and the
T. ROWE PRICE U.S. HIGH YIELD ETF
portfolio’s zero weight in cable television provider Altice USA added value. While the company faced the same secular challenges as the cable industry overall, we had additional concerns about its high leverage, neutral free cash flow generation, and ability to meet upcoming debt maturities.
How is the fund positioned?
We maintained the fund’s relative overweight in the CCC rating tier, which has benefited from increased liquidity as the new issue market has been ramping back up in 2023. The reversal of last year’s lower-quality sell-off—which we believe was somewhat overdone—has created a technical tailwind for CCC rated bonds, and the broadly under-risked market could provide opportunities. We
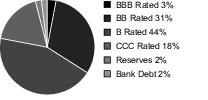
CREDIT QUALITY DIVERSIFICATION
Based on net assets as of 5/31/23.
Sources: Credit ratings for the securities held in the fund are provided by Moody’s, Standard & Poor’s, and Fitch and are converted to the Standard & Poor’s nomenclature. A rating of AAA represents the highest-rated securities, and a rating of D represents the lowest-rated securities. When a rating is available from all three agencies, the median rating is used. If there are two ratings, the lower rating is used, and if only one rating is available, that rating is used. If a rating is not available, the security is classified as Not Rated (NR). The rating of the underlying investment vehicle is used to determine the creditworthiness of credit default swaps and sovereign securities. The fund/portfolio is not rated by any agency. Securities that have not been rated by any rating agency totaled 0% of the portfolio at the end of the reporting period.
T. ROWE PRICE U.S. HIGH YIELD ETF
take a prudent approach to evaluating credits and, within CCCs, tend to tilt our positioning to the higher-quality portion of the market and/or to issuers that we believe are mis-rated. The names we do hold have been heavily researched and generally offer long maturity runways and healthy liquidity, in our view. Additionally, we continue to take advantage of opportunities to engage with the management teams and sponsors of our portfolio holdings.
Retail, energy, and consumer goods are the fund’s largest industry overweights relative to the index. In the retail segment, we favor companies with manageable leverage, strong liquidity positions, and lengthy debt runways that we believe could help them weather a near-term downturn. Energy remains the fund’s largest absolute industry allocation. However, we trimmed our energy exposure during the reporting period as valuations became somewhat rich. Additionally, a few rising stars—issuers upgraded to investment-grade status—with large capital structures exiting the high yield market will reduce the industry’s weight within the index. In the consumer goods segment, our holdings are largely concentrated in companies specializing in personal care products, demand for which tends to be resilient through economic cycles due to their nondiscretionary nature.
The fund’s largest relative underweight allocations are in the health care, basic industry, and services segments, reflecting our view that more attractive valuations and opportunities can be found in other areas of the high yield market.
What is portfolio management’s outlook?
We remain generally constructive in our expectations for high yield bonds. Although credit spreads—a measure of the additional yield offered by bonds that have credit risk compared with U.S. Treasuries with similar maturities—remain near historical averages, the asset class appears poised to generate strong total returns as its low dollar prices provide meaningful opportunity for capital appreciation and yields are near decade-high levels. Companies in our market have entered into the current environment from a position of strength and continue to exhibit relatively strong fundamentals. The overall quality of the asset class has also improved in recent years as approximately half the high yield market is now composed of BB rated bonds.
Although defaults have been gradually trending higher from extremely low levels, we expect the default rate to end 2023 roughly in line with its long-term average of just over 3%. The new issue calendar has opened up considerably since the start of the year, with a steady stream of new issues coming to market. This dynamic has helped facilitate refinancing activity, which reduces some of
T. ROWE PRICE U.S. HIGH YIELD ETF
the market’s near-term default risk, but we remain vigilant on a company-by-company basis. Additionally, high yield issuers are not facing any major maturity walls until 2025 and 2026, which further reduces near-term default risk.
We continue to view high yield as a strategic long-term investment and a mainstay allocation in a diversified portfolio. History has demonstrated that much of the asset class’s long-term value can be realized simply by remaining invested and taking advantage of the compounding effect of regular coupon payments. High coupons also provide a cushion against potential price volatility, which has historically resulted in attractive risk-adjusted returns for high yield bonds relative to equities. Credit selection remains the cornerstone of our process and portfolio construction, and we expect it to be the primary driver of alpha in the year ahead as it has been for us over the long term. Although we remain optimistic in our expectations for high yield bonds, risks remain. We continue to look to invest in companies that are better positioned to withstand persistent inflation and higher rates. Additionally, given continued risks around the potential for a recession, we continue to stress-test credits for their resiliency in such an environment. We are also cognizant of the fact that as future maturity walls begin to come due, companies will likely be forced to refinance their debt at much higher rates. We are monitoring for the impact of this as we review individual credits.
The views expressed reflect the opinions of T. Rowe Price as of the date of this report and are subject to change based on changes in market, economic, or other conditions. These views are not intended to be a forecast of future events and are no guarantee of future results.
T. ROWE PRICE U.S. HIGH YIELD ETF
RISKS OF BOND INVESTING
An issuer of a debt instrument could suffer an adverse change in financial condition that results in a payment default (failure to make scheduled interest or principal payments), a rating downgrade, or an inability to meet a financial obligation. Investments in bonds that are rated below investment grade, commonly referred to as junk bonds, and loans that are rated below investment grade, expose the fund to greater volatility and credit risk than investments in securities that are rated investment grade. Securities that are rated below investment grade carry greater risk of default and should be considered speculative. Investments in bank loans expose the fund to additional risks beyond those normally associated with more traditional debt instruments.
The value of the fund’s investments may decrease, sometimes rapidly or unexpectedly, due to factors affecting an issuer held by the fund, particular industries, or the overall securities markets. The prices of, and the income generated by, debt instruments held by the fund may be affected by changes in interest rates. The fund’s investments in foreign holdings may be adversely affected by local, political, social, and economic conditions overseas; greater volatility; reduced liquidity; or decreases in foreign currency values relative to the U.S. dollar.
BENCHMARK INFORMATION
Note: ICE Data Indices, LLC (“ICE DATA”), is used with permission. ICE DATA, ITS AFFILIATES AND THEIR RESPECTIVE THIRD-PARTY SUPPLIERS DISCLAIM ANY AND ALL WARRANTIES AND REPRESENTATIONS, EXPRESS AND/OR IMPLIED, INCLUDING ANY WARRANTIES OF MERCHANTABILITY OR FITNESS FOR A PARTICULAR PURPOSE OR USE, INCLUDING THE INDICES, INDEX DATA AND ANY DATA INCLUDED IN, RELATED TO, OR DERIVED THEREFROM. NEITHER ICE DATA, ITS AFFILIATES NOR THEIR RESPECTIVE THIRD-PARTY SUPPLIERS SHALL BE SUBJECT TO ANY DAMAGES OR LIABILITY WITH RESPECT TO THE ADEQUACY, ACCURACY, TIMELINESS OR COMPLETENESS OF THE INDICES OR THE INDEX DATA OR ANY COMPONENT THEREOF, AND THE INDICES AND INDEX DATA AND ALL COMPONENTS THEREOF ARE PROVIDED ON AN “AS IS” BASIS AND YOUR USE IS AT YOUR OWN RISK. ICE DATA, ITS AFFILIATES AND THEIR RESPECTIVE THIRD-PARTY SUPPLIERS DO NOT SPONSOR, ENDORSE, OR RECOMMEND T. ROWE PRICE OR ANY OF ITS PRODUCTS OR SERVICES.
T. ROWE PRICE U.S. HIGH YIELD ETF
ICE Benchmark Administration Limited makes no warranty, express or implied, either as to the results to be obtained from the use of ICE LIBOR and/or the figure at which ICE LIBOR stands at any particular time on any particular day or otherwise. ICE Benchmark Administration Limited makes no express or implied warranties of merchantability or fitness for a particular purpose in respect of any use of ICE LIBOR.
Note: Copyright © 2023 Fitch Ratings, Inc., Fitch Ratings Ltd. and its subsidiaries.
Note: Portions of the mutual fund information contained in this report were supplied by Lipper, a Refinitiv Company, subject to the following: Copyright 2023 © Refinitiv. All rights reserved. Any copying, republication, or redistribution of Lipper content is expressly prohibited without the prior written consent of Lipper. Lipper shall not be liable for any errors or delays in the content, or for any actions taken in reliance thereon.
Note: © 2023, Moody’s Corporation, Moody’s Investors Service, Inc., Moody’s Analytics, Inc. and/or their licensors and affiliates (collectively, “Moody’s”). All rights reserved. Moody’s ratings and other information (“Moody’s Information”) are proprietary to Moody’s and/or its licensors and are protected by copyright and other intellectual property laws. Moody’s Information is licensed to Client by Moody’s. MOODY’S INFORMATION MAY NOT BE COPIED OR OTHERWISE REPRODUCED, REPACKAGED, FURTHER TRANSMITTED, TRANSFERRED, DISSEMINATED, REDISTRIBUTED OR RESOLD, OR STORED FOR SUBSEQUENT USE FOR ANY SUCH PURPOSE, IN WHOLE OR IN PART, IN ANY FORM OR MANNER OR BY ANY MEANS WHATSOEVER, BY ANY PERSON WITHOUT MOODY’S PRIOR WRITTEN CONSENT. Moody's® is a registered trademark.
Note: Copyright © 2023, S&P Global Market Intelligence (and its affiliates, as applicable). Reproduction of any information, data or material, including ratings (“Content”) in any form is prohibited except with the prior written permission of the relevant party. Such party, its affiliates and suppliers (“Content Providers”) do not guarantee the accuracy, adequacy, completeness, timeliness or availability of any Content and are not responsible for any errors or omissions (negligent or otherwise), regardless of the cause, or for the results obtained from the use of such Content. In no event shall Content Providers be liable for any damages, costs, expenses, legal fees, or losses (including lost income or lost profit and opportunity costs) in connection with any use of the Content. A reference to a particular investment or security, a rating or any observation concerning an investment that is part of the Content is not a recommendation to buy, sell or
T. ROWE PRICE U.S. HIGH YIELD ETF
hold such investment or security, does not address the appropriateness of an investment or security and should not be relied on as investment advice. Credit ratings are statements of opinions and are not statements of fact.
T. ROWE PRICE U.S. HIGH YIELD ETF
PORTFOLIO HIGHLIGHTS
TWENTY-FIVE LARGEST ISSUERS
| | Percent of
Net Assets |
| | 5/31/23 |
| Carnival | 2.1 % |
| LSF9 Atlantis Holdings/Victra Finance | 1.7 |
| L Brands | 1.6 |
| American Airlines/AAdvantage Loyalty IP | 1.6 |
| Sunoco LP/Sunoco Finance | 1.5 |
| Ford Motor Credit | 1.4 |
| eG Global Finance | 1.4 |
| Eqm Midstream Partners | 1.3 |
| Staples | 1.3 |
| Dornoch debt Merger Sub | 1.3 |
| White Cap Parent | 1.3 |
| AssuredPartners | 1.3 |
| BroadStreet Partners | 1.3 |
| VICI Properties LP/VICI Note | 1.3 |
| Sabre GLBL | 1.3 |
| FirstCash | 1.3 |
| Triton Water Holdings | 1.3 |
| Element Solutions | 1.2 |
| Adient Global Holdings | 1.2 |
| Hess Midstream Operations | 1.2 |
| Bombardier | 1.2 |
| GrafTech Finance | 1.2 |
| CCO Holdings/CCO Holdings Capital | 1.1 |
| NRG Energy | 1.1 |
| Advisor Group Holdings | 1.1 |
| Total | 33.6% |
Note: The information shown does not reflect any exchange-traded funds (ETFs), cash reserves, or collateral for securities lending that may be held in the portfolio. Holdings of the issuers are combined and may be shown in the Portfolio of Investments under their subsidiaries.
T. ROWE PRICE U.S. HIGH YIELD ETF
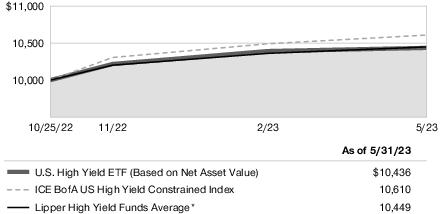
GROWTH OF $10,000
This chart shows the value of a hypothetical $10,000 investment in the fund over the past 10 fiscal year periods or since inception (for funds lacking 10-year records). The result is compared with benchmarks, which include a broad-based market index and may also include a peer group average or index. Market indexes do not include expenses, which are deducted from fund returns as well as mutual fund averages and indexes.
U.S. High Yield ETF
Note: See the Average Annual Compound Total Return table.
*As of 10/31/22.
T. ROWE PRICE U.S. HIGH YIELD ETF
AVERAGE ANNUAL COMPOUND TOTAL RETURN
| Period Ended 5/31/23 | Since
Inception
10/25/22 |
| U.S. High Yield ETF (Based on Net Asset Value) | 4.36%* |
| U.S. High Yield ETF (At Market Price) | 4.98* |
This table shows how the fund would have performed each year if its actual (or cumulative) returns for the periods shown had been earned at a constant rate. Average annual total return figures include changes in principal value, reinvested dividends, and capital gain distributions. Returns do not reflect taxes that the shareholder may pay on fund distributions or the redemption of fund shares. When assessing performance, investors should consider both short- and long-term returns. Past performance cannot guarantee future results. Market returns are based on the midpoint of the bid/ask spread at market close (typically, 4 p.m. ET) and do not represent returns an investor would have received if shares were traded at other times.
*Returns for periods of less than one year are not annualized.
PREMIUM/DISCOUNT INFORMATION
The frequency at which the daily market prices were at a discount or premium to the fund’s net asset value is available on the fund’s website (troweprice.com).
EXPENSE RATIO
The expense ratio shown is as of the fund’s most recent prospectus. This number may vary from the expense ratio shown elsewhere in this report because it is based on a different time period and, if applicable, includes acquired fund fees and expenses but does not include fee or expense waivers.
T. ROWE PRICE U.S. HIGH YIELD ETF
FUND EXPENSE EXAMPLE
As a shareholder, you may incur two types of costs: (1) transaction costs, such as brokerage commissions on purchases and sales, and (2) ongoing costs, including management fees and other fund expenses. The following example is intended to help you understand your ongoing costs (in dollars) of investing in the fund and to compare these costs with the ongoing costs of investing in other funds. The example is based on an investment of $1,000 invested at the beginning of the most recent six-month period and held for the entire period.
Actual Expenses
The first line of the following table (Actual) provides information about actual account values and expenses based on the fund’s actual returns. You may use the information on this line, together with your account balance, to estimate the expenses that you paid over the period. Simply divide your account value by $1,000 (for example, an $8,600 account value divided by $1,000 = 8.6), then multiply the result by the number on the first line under the heading “Expenses Paid During Period” to estimate the expenses you paid on your account during this period.
Hypothetical Example for Comparison Purposes
The information on the second line of the table (Hypothetical) is based on hypothetical account values and expenses derived from the fund’s actual expense ratio and an assumed 5% per year rate of return before expenses (not the fund’s actual return). You may compare the ongoing costs of investing in the fund with other funds by contrasting this 5% hypothetical example and the 5% hypothetical examples that appear in the shareholder reports of the other funds. The hypothetical account values and expenses may not be used to estimate the actual ending account balance or expenses you paid for the period.
You should also be aware that the expenses shown in the table highlight only your ongoing costs and do not reflect any transaction costs, such as brokerage commissions paid on purchases and sales of shares. Therefore, the second line of the table is useful in comparing ongoing costs only and will not help you determine the relative total costs of owning different funds. To the extent a fund charges transaction costs, however, the total cost of owning that fund is higher.
T. ROWE PRICE U.S. HIGH YIELD ETF
U.S. High Yield ETF
| | Beginning
Account Value
12/1/22 | Ending
Account Value
5/31/23 | Expenses Paid
During Period*
12/1/22 to 5/31/23 |
| Actual | $1,000.00 | $1,021.40 | $2.82 |
| Hypothetical (assumes 5% return before expenses) | 1,000.00 | 1,022.14 | 2.82 |
| * | Expenses are equal to the fund’s annualized expense ratio for the 6-month period (0.56%), multiplied by the average account value over the period, multiplied by the number of days in the most recent fiscal half year (182), and divided by the days in the year (365) to reflect the half-year period. |
QUARTER-END RETURNS
| Period Ended 3/31/23 | Since
Inception
10/25/22 |
| U.S. High Yield ETF (Based on Net Asset Value) | 4.42%* |
| U.S. High Yield ETF (At Market Price) | 5.91* |
The fund's performance information represents only past performance and is not necessarily an indication of future results. Current performance may be lower or higher than the performance data cited. Share price, principal value, and return will vary, and you may have a gain or loss when you sell your shares. Market returns are based on the midpoint of the bid/ask spread at market close (typically, 4 p.m. ET) and do not represent returns an investor would receive if shares were traded at other times. For the most recent month-end performance, please visit our website (troweprice.com) or contact a T. Rowe Price representative at 1-800-225-5132.
This table provides returns through the most recent calendar quarter-end rather than through the end of the fund’s fiscal period. It shows how the fund would have performed each year if its actual (or cumulative) returns for the periods shown had been earned at a constant rate. Average annual total return figures include changes in principal value, reinvested dividends, and capital gain distributions. Returns do not reflect taxes that the shareholder may pay on fund distributions or the redemption of fund shares. When assessing performance, investors should consider both short- and long-term returns.
*Returns for periods of less than one year are not annualized.
T. ROWE PRICE U.S. HIGH YIELD ETF
For a share outstanding throughout the period
| | 10/25/22 (1)
Through |
| | 5/31/23 |
| NET ASSET VALUE | |
| Beginning of period | $ 50.00 |
| Investment activities | |
| Net investment income(2) (3) | 2.62 |
| Net realized and unrealized gain/loss | (0.45) |
| Total from investment activities | 2.17 |
| Distributions | |
| Net investment income | (2.60) |
| NET ASSET VALUE | |
| End of period | $ 49.57 |
| Ratios/Supplemental Data |
| Total return, based on NAV(3) (4) | 4.36% |
Ratios to average net
assets:(3) | |
Gross expenses before
waivers/payments by
Price Associates | 0.56% (5) |
Net expenses after
waivers/payments by
Price Associates | 0.56% (5) |
| Net investment income | 8.61% (5) |
| Portfolio turnover rate | 25.6% |
Net assets, end of period
(in thousands) | $ 22,306 |
| (1) | Inception date |
| (2) | Per share amounts calculated using average shares outstanding method. |
| (3) | See Note 5 for details to expense-related arrangements with Price Associates. |
| (4) | Total return reflects the rate that an investor would have earned on an investment in the fund during each period, assuming reinvestment of all distributions. Total return is not annualized for periods less than one year. |
| (5) | Annualized |
The accompanying notes are an integral part of these financial statements.
T. ROWE PRICE U.S. HIGH YIELD ETF
May 31, 2023
| PORTFOLIO OF INVESTMENTS‡ | Par/Shares | $ Value |
| (Amounts in 000s) | | |
| BANK LOANS 1.7% |
| Consumer Goods 0.7% | | |
| Naked Juice, FRN, 3M TSFR + 6.00%, 11.00%, 1/24/30 | 200 | 150 |
| | | 150 |
| Energy 0.3% | | |
| Prairie ECI Acquiror, FRN, 1M USD LIBOR + 4.75%, 9.90%, 3/11/26 | 80 | 78 |
| | | 78 |
| Services 0.7% | | |
| Staples, FRN, 3M USD LIBOR + 5.00%, 10.30%, 4/16/26 | 174 | 148 |
| | | 148 |
Total Bank Loans
(Cost $410) | | 376 |
| CORPORATE BONDS 94.3% |
| Automotive 3.8% | | |
| Adient Global Holdings, 4.875%, 8/15/26 (1) | 275 | 261 |
| Ford Motor Credit, 4.00%, 11/13/30 | 375 | 315 |
| Jaguar Land Rover Automotive, 5.50%, 7/15/29 (1) | 275 | 233 |
| Wheel Pros, 6.50%, 5/15/29 (1) | 70 | 30 |
| | | 839 |
| Basic Industry 4.9% | | |
| Camelot Return Merger Sub, 8.75%, 8/1/28 (1) | 220 | 207 |
| Element Solutions, 3.875%, 9/1/28 (1) | 305 | 266 |
| ERO Copper, 6.50%, 2/15/30 (1) | 250 | 216 |
| Novelis, 3.875%, 8/15/31 (1) | 250 | 205 |
| SCIH Salt Holdings, 6.625%, 5/1/29 (1) | 250 | 207 |
| | | 1,101 |
| Capital Goods 6.5% | | |
| ARD Finance, 6.50%, 6/30/27, (6.50% Cash or 7.25% PIK) (1)(2) | 275 | 213 |
T. ROWE PRICE U.S. HIGH YIELD ETF
| | Par/Shares | $ Value |
| (Amounts in 000s) | | |
| Ball, 6.00%, 6/15/29 | 226 | 225 |
| Bombardier, 7.875%, 4/15/27 (1) | 260 | 257 |
| Dornoch Debt Merger Sub, 6.625%, 10/15/29 (1) | 384 | 288 |
| GrafTech Finance, 4.625%, 12/15/28 (1) | 315 | 252 |
| TransDigm, 5.50%, 11/15/27 | 225 | 212 |
| | | 1,447 |
| Consumer Goods 5.3% | | |
| HFC Prestige, 4.75%, 1/15/29 (1) | 240 | 220 |
| HLF Financing, 4.875%, 6/1/29 (1) | 295 | 201 |
| MajorDrive Holdings IV, 6.375%, 6/1/29 (1) | 200 | 153 |
| Mattel, 3.75%, 4/1/29 (1) | 250 | 218 |
| Tempur Sealy International, 3.875%, 10/15/31 (1) | 150 | 120 |
| Triton Water Holdings, 6.25%, 4/1/29 (1) | 330 | 276 |
| | | 1,188 |
| Container 0.4% | | |
| Berry Global, 5.625%, 7/15/27 (1) | 100 | 99 |
| | | 99 |
| Energy 13.8% | | |
| Ascent Resources Utica Holdings, 8.25%, 12/31/28 (1) | 200 | 192 |
| Citgo Holding, 9.25%, 8/1/24 (1) | 155 | 155 |
| Colgate Energy, 5.875%, 7/1/29 (1) | 225 | 209 |
| Comstock Resources, 6.75%, 3/1/29 (1) | 240 | 211 |
| Encino Acquisition Partners Holdings, 8.50%, 5/1/28 (1) | 235 | 216 |
| EQM Midstream Partners, 4.50%, 1/15/29 (1) | 160 | 140 |
| EQM Midstream Partners, 4.75%, 1/15/31 (1) | 180 | 155 |
| Gulfport Energy, 8.00%, 5/17/26 (1) | 200 | 200 |
| Harvest Midstream I, 7.50%, 9/1/28 (1) | 140 | 133 |
| Hess Midstream Operations, 4.25%, 2/15/30 (1) | 300 | 259 |
| Howard Midstream Energy Partners, 6.75%, 1/15/27 (1) | 225 | 207 |
| NGL Energy Operating, 7.50%, 2/1/26 (1) | 225 | 215 |
| Sunoco LP/Finance, 4.50%, 5/15/29 | 190 | 169 |
T. ROWE PRICE U.S. HIGH YIELD ETF
| | Par/Shares | $ Value |
| (Amounts in 000s) | | |
| Sunoco LP/Finance, 4.50%, 4/30/30 | 195 | 171 |
| Tallgrass Energy Partners/Tallgrass Energy Finance, 6.00%, 12/31/30 (1) | 260 | 225 |
| Weatherford International, 8.625%, 4/30/30 (1) | 225 | 226 |
| | | 3,083 |
| Financial Services 5.7% | | |
| Advisor Group Holdings, 10.75%, 8/1/27 (1) | 250 | 241 |
| AG TTMT Escrow Issuer, 8.625%, 9/30/27 (1) | 50 | 51 |
| FirstCash, 5.625%, 1/1/30 (1) | 300 | 272 |
| LPL Holdings, 4.00%, 3/15/29 (1) | 15 | 13 |
| LPL Holdings, 4.375%, 5/15/31 (1) | 90 | 78 |
| PennyMac Financial Services, 4.25%, 2/15/29 (1) | 260 | 208 |
| PRA Group, 5.00%, 10/1/29 (1) | 231 | 173 |
| Rocket Mortgage, 4.00%, 10/15/33 (1) | 295 | 223 |
| | | 1,259 |
| Health Care 3.7% | | |
| Bausch Health, 6.125%, 2/1/27 (1) | 300 | 195 |
| CHS/Community Health Systems, 5.25%, 5/15/30 (1) | 125 | 93 |
| Consensus Cloud Solutions, 6.50%, 10/15/28 (1) | 235 | 204 |
| Mednax, 5.375%, 2/15/30 (1) | 175 | 161 |
| Organon Finance, 4.125%, 4/30/28 (1) | 200 | 178 |
| | | 831 |
| Insurance 3.1% | | |
| Alliant Holdings Intermediate, 5.875%, 11/1/29 (1) | 30 | 26 |
| Assured Partners, 5.625%, 1/15/29 (1) | 325 | 279 |
| BroadStreet Partners, 5.875%, 4/15/29 (1) | 325 | 281 |
| Hub International, 5.625%, 12/1/29 (1) | 125 | 111 |
| | | 697 |
| Leisure 7.7% | | |
| Carnival, 5.75%, 3/1/27 (1) | 375 | 320 |
| Carnival, 6.00%, 5/1/29 (1) | 175 | 145 |
T. ROWE PRICE U.S. HIGH YIELD ETF
| | Par/Shares | $ Value |
| (Amounts in 000s) | | |
| Carnival Holdings Bermuda, 10.375%, 5/1/28 (1) | 100 | 108 |
| Hilton Domestic Operating, 3.625%, 2/15/32 (1) | 265 | 219 |
| Life Time, 5.75%, 1/15/26 (1) | 225 | 218 |
| NCL, 8.375%, 2/1/28 (1) | 215 | 221 |
| Sabre GLBL, 11.25%, 12/15/27 (1) | 340 | 261 |
| Studio City Finance, 5.00%, 1/15/29 (1) | 310 | 226 |
| | | 1,718 |
| Media 8.3% | | |
| CCO Holdings/CCO Holdings Capital, 4.50%, 5/1/32 | 325 | 254 |
| Centerfield Media Parent, 6.625%, 8/1/26 (1) | 75 | 51 |
| Deluxe, 8.00%, 6/1/29 (1) | 300 | 229 |
| DISH DBS, 7.375%, 7/1/28 | 350 | 175 |
| DISH Network, 11.75%, 11/15/27 (1) | 70 | 67 |
| Lamar Media, 4.00%, 2/15/30 | 225 | 197 |
| Radiate Holdco, 6.50%, 9/15/28 (1) | 375 | 188 |
| Scripps Escrow II, 3.875%, 1/15/29 (1) | 250 | 193 |
| Sinclair Television Group, 4.125%, 12/1/30 (1) | 195 | 127 |
| Terrier Media Buyer, 8.875%, 12/15/27 (1) | 250 | 161 |
| Urban One, 7.375%, 2/1/28 (1) | 225 | 203 |
| | | 1,845 |
| Real Estate 3.0% | | |
| Brookfield Property REIT, 4.50%, 4/1/27 (1) | 250 | 200 |
| Outfront Media Capital, 4.25%, 1/15/29 (1) | 250 | 203 |
| VICI Properties/VICI Note, 4.125%, 8/15/30 (1) | 315 | 276 |
| | | 679 |
| Retail 9.4% | | |
| Asbury Automotive Group, 4.75%, 3/1/30 | 250 | 219 |
| Bath & Body Works, 5.25%, 2/1/28 | 300 | 285 |
| Bath & Body Works, 6.625%, 10/1/30 (1) | 58 | 55 |
| EG Global Finance, 6.75%, 2/7/25 (1) | 325 | 311 |
| LSF9 Atlantis Holdings/Victra Finance, 7.75%, 2/15/26 (1) | 404 | 374 |
T. ROWE PRICE U.S. HIGH YIELD ETF
| | Par/Shares | $ Value |
| (Amounts in 000s) | | |
| Michaels Cos, 7.875%, 5/1/29 (1) | 275 | 170 |
| NMG Holding, 7.125%, 4/1/26 (1) | 245 | 219 |
| Victoria's Secret, 4.625%, 7/15/29 (1) | 316 | 242 |
| Yum! Brands, 3.625%, 3/15/31 | 250 | 214 |
| | | 2,089 |
| Services 4.3% | | |
| Herc Holdings, 5.50%, 7/15/27 (1) | 215 | 204 |
| PECF USS Intermediate Holdings, 8.00%, 11/15/29 (1) | 243 | 128 |
| Ritchie Bros Holdings, 6.75%, 3/15/28 (1) | 100 | 101 |
| Ritchie Bros Holdings, 7.75%, 3/15/31 (1) | 85 | 88 |
| Staples, 7.50%, 4/15/26 (1) | 180 | 148 |
| White Cap Parent, 8.25%, 3/15/26, (8.25% Cash or 9.00% PIK) (1)(2) | 300 | 283 |
| | | 952 |
| Technology & Electronics 4.4% | | |
| CommScope Finance, 8.25%, 3/1/27 (1) | 225 | 175 |
| Go Daddy Operating, 3.50%, 3/1/29 (1) | 240 | 207 |
| ION Trading Technologies, 5.75%, 5/15/28 (1) | 250 | 208 |
| Sensata Technologies, 4.00%, 4/15/29 (1) | 240 | 213 |
| Veritas US, 7.50%, 9/1/25 (1) | 250 | 187 |
| | | 990 |
| Telecommunications 4.2% | | |
| Consolidated Communications, 6.50%, 10/1/28 (1) | 250 | 187 |
| Frontier Communications Holdings, 5.875%, 11/1/29 | 125 | 88 |
| Frontier Communications Holdings, 6.00%, 1/15/30 (1) | 125 | 88 |
| LCPR Senior Secured Financing DAC, 6.75%, 10/15/27 (1) | 200 | 185 |
| Level 3 Financing, 3.625%, 1/15/29 (1) | 325 | 175 |
| Viasat, 6.50%, 7/15/28 (1) | 250 | 203 |
| | | 926 |
| Transportation 2.5% | | |
| American Airlines, 5.75%, 4/20/29 (1) | 360 | 344 |
T. ROWE PRICE U.S. HIGH YIELD ETF
| | Par/Shares | $ Value |
| (Amounts in 000s) | | |
| US Airways Pass-Through Trust, 3.95%, 5/15/27 | 46 | 43 |
| VistaJet Malta Finance, 6.375%, 2/1/30 (1) | 225 | 179 |
| | | 566 |
| Utilities 3.3% | | |
| Clearway Energy Operating, 3.75%, 2/15/31 (1) | 250 | 209 |
| NRG Energy, VR, 10.25%, (1)(3)(4) | 262 | 248 |
| Talen Energy Supply, 8.625%, 6/1/30 (1) | 180 | 184 |
| Vistra, VR, 8.00%, (1)(3)(4) | 95 | 89 |
| | | 730 |
Total Corporate Bonds
(Cost $21,319) | | 21,039 |
| SHORT-TERM INVESTMENTS 2.1% |
| Money Market Funds 2.1% | | |
| T. Rowe Price Government Reserve Fund, 5.11%(5)(6) | 476 | 476 |
Total Short-Term Investments
(Cost $476) | | 476 |
Total Investments in Securities
98.1% of Net Assets (Cost $22,205) | | $21,891 |
| ‡ | Par/Shares are denominated in U.S. dollars unless otherwise noted. |
| (1) | Security was purchased pursuant to Rule 144A under the Securities Act of 1933 and may be resold in transactions exempt from registration only to qualified institutional buyers. Total value of such securities at period-end amounts to $18,472 and represents 82.8% of net assets. |
| (2) | Security has the ability to pay in-kind or pay in cash. When applicable, separate rates of such payments are disclosed. |
| (3) | Security is a fix-to-float security, which carries a fixed coupon until a certain date, upon which it switches to a floating rate. Reference rate and spread are provided if the rate is currently floating. |
| (4) | Perpetual security with no stated maturity date. |
| (5) | Seven-day yield |
| (6) | Affiliated Companies |
| 1M USD LIBOR | One month USD LIBOR (London interbank offered rate) |
| 3M TSFR | Three month term SOFR (Secured overnight financing rate) |
| 3M USD LIBOR | Three month USD LIBOR (London interbank offered rate) |
T. ROWE PRICE U.S. HIGH YIELD ETF
| FRN | Floating Rate Note |
| PIK | Payment-in-kind |
| USD | U.S. Dollar |
| VR | Variable Rate; rate shown is effective rate at period-end. The rates for certain variable rate securities are not based on a published reference rate and spread but are determined by the issuer or agent and based on current market conditions. |
T. ROWE PRICE U.S. HIGH YIELD ETF
AFFILIATED COMPANIES
($000s)
The fund may invest in certain securities that are considered affiliated companies. As defined by the 1940 Act, an affiliated company is one in which the fund owns 5% or more of the outstanding voting securities, or a company that is under common ownership or control. The following securities were considered affiliated companies for all or some portion of the period ended May 31, 2023. Net realized gain (loss), investment income, change in net unrealized gain/loss, and purchase and sales cost reflect all activity for the period then ended.
| Affiliate | Net Realized Gain
(Loss) | Changes in Net
Unrealized
Gain/Loss | Investment
Income |
| T. Rowe Price Government Reserve Fund | $ — | $— | $ 16 |
| Totals | $—# | $— | $16+ |
| Supplementary Investment Schedule |
| Affiliate | Value
5/31/22 | Purchase
Cost | Sales
Cost | Value
5/31/23 |
| T. Rowe Price Government Reserve Fund | $ — | ¤ | ¤ | $ 476 |
| | Total | | | $476^ |
| # | Capital gain distributions from mutual funds represented $0 of the net realized gain (loss). |
| + | Investment income comprised $16 of dividend income and $0 of interest income. |
| ¤ | Purchase and sale information not shown for cash management funds. |
| ^ | The cost basis of investments in affiliated companies was $476. |
The accompanying notes are an integral part of these financial statements.
T. ROWE PRICE U.S. HIGH YIELD ETF
May 31, 2023
STATEMENT OF ASSETS AND LIABILITIES
($000s, except shares and per share amounts)
| Assets | |
| Investments in securities, at value (cost $22,205) | $ 21,891 |
| Interest and dividends receivable | 416 |
| Receivable for investment securities sold | 9 |
| Cash | 1 |
| Total assets | 22,317 |
| Liabilities | |
| Investment management and administrative fees payable | 11 |
| Total liabilities | 11 |
| NET ASSETS | $ 22,306 |
| Net assets consists of: | |
| Total distributable earnings (loss) | $ (217) |
Paid-in capital applicable to 450,000 shares of $0.0001 par value
capital stock outstanding; 4,000,000,000 shares authorized | 22,523 |
| NET ASSETS | $22,306 |
| NET ASSET VALUE PER SHARE | $ 49.57 |
The accompanying notes are an integral part of these financial statements.
T. ROWE PRICE U.S. HIGH YIELD ETF
STATEMENT OF OPERATIONS
($000s)
| | 10/25/22 Through |
| | 5/31/23 |
| Investment Income (Loss) | |
| Income | |
| Interest | $ 1,180 |
| Dividend | 16 |
| Total income | 1,196 |
| Investment management and administrative expense | 73 |
| Net investment income | 1,123 |
| Realized and Unrealized Gain / Loss | |
| Net realized gain on securities | 96 |
| Change in net unrealized gain / loss on securities | (314) |
| Net realized and unrealized gain / loss | (218) |
| INCREASE IN NET ASSETS FROM OPERATIONS | $ 905 |
The accompanying notes are an integral part of these financial statements.
T. ROWE PRICE U.S. HIGH YIELD ETF
STATEMENT OF CHANGES IN NET ASSETS
($000s)
| | 10/25/22
Through |
| | 5/31/23 |
| Increase (Decrease) in Net Assets | |
| Operations | |
| Net investment income | $ 1,123 |
| Net realized gain | 96 |
| Change in net unrealized gain / loss | (314) |
| Increase in net assets from operations | 905 |
| Distributions to shareholders | |
| Net earnings | (1,122) |
| Capital share transactions* | |
| Shares sold | 22,523 |
| Increase in net assets from capital share transactions | 22,523 |
| Net Assets | |
| Increase during period | 22,306 |
| Beginning of period | - |
| End of period | $22,306 |
| *Share information | |
| Shares sold | 450 |
| Increase in shares outstanding | 450 |
The accompanying notes are an integral part of these financial statements.
T. ROWE PRICE U.S. HIGH YIELD ETF
NOTES TO FINANCIAL STATEMENTS
T. Rowe Price Exchange-Traded Funds, Inc. (the corporation) is registered under the Investment Company Act of 1940 (the 1940 Act). The U.S. High Yield ETF (the fund) is a diversified, open-end management investment company established by the corporation. The fund incepted on October 25, 2022. The fund seeks total return, and secondarily, current income.
NOTE 1 – SIGNIFICANT ACCOUNTING POLICIES
Basis of Preparation
The fund is an investment company and follows accounting and reporting guidance in the Financial Accounting Standards Board (FASB) Accounting Standards Codification Topic 946 (ASC 946). The accompanying financial statements were prepared in accordance with accounting principles generally accepted in the United States of America (GAAP), including, but not limited to, ASC 946. GAAP requires the use of estimates made by management. Management believes that estimates and valuations are appropriate; however, actual results may differ from those estimates, and the valuations reflected in the accompanying financial statements may differ from the value ultimately realized upon sale or maturity.
Investment Transactions, Investment Income, and Distributions
Investment transactions are accounted for on the trade date basis. Income and expenses are recorded on the accrual basis. Realized gains and losses are reported on the identified cost basis. Premiums and discounts on debt securities are amortized for financial reporting purposes. Income tax-related interest and penalties, if incurred, are recorded as income tax expense. Dividend income and capital gain distributions are recorded on the ex-dividend
date.Non-cash dividends, if any, are recorded at the fair market value of the asset received. Distributions to shareholders are recorded on the ex-dividend date. Income distributions, if any, are declared and paid monthly. A capital gain distribution, if any, may also be declared and paid by the fund annually. Dividends and distributions cannot be automatically reinvested in additional shares of the fund.
Capital Transactions
The fund issues and redeems shares at its net asset value (NAV) only with Authorized Participants and only in large blocks of 25,000 shares (each, a “Creation Unit”). The fund’s NAV per share is computed at the close of the New York Stock Exchange (NYSE). However, the NAV per share may be calculated at a time other than the normal close of the NYSE if trading on the NYSE is restricted, if the NYSE closes earlier, or as may be
T. ROWE PRICE U.S. HIGH YIELD ETF
permitted by the SEC. Individual fund shares may not be purchased or redeemed directly with the fund. An Authorized Participant may purchase or redeem a Creation Unit of the fund each business day that the fund is open in exchange for the delivery of a designated portfolio of in-kind securities and/or cash. When purchasing or redeeming Creation Units, Authorized Participants are also required to pay a fixed and/or variable purchase or redemption transaction fee as well as any applicable additional variable charge to defray the transaction cost to a fund.
Individual fund shares may be purchased and sold only on a national securities exchange through brokers. Shares are listed for trading on NYSE Arca, Inc. (NYSE Arca) and because the shares will trade at market prices rather than NAV, shares may trade at prices greater than NAV (at a premium), at NAV, or less than NAV (at a discount). The fund’s shares are ordinarily valued as of the close of regular trading (normally 4:00 p.m. Eastern time) on each day that the NYSE Arca is open.
New Accounting Guidance
The FASB issued Accounting Standards Update (ASU), ASU 2020-04, Reference Rate Reform (Topic 848) – Facilitation of the Effects of Reference Rate Reform on Financial Reporting in March 2020 and ASU 2021-01 in January 2021 which provided further amendments and clarifications to Topic 848. These ASUs provide optional, temporary relief with respect to the financial reporting of contracts subject to certain types of modifications due to the planned discontinuation of the London Interbank Offered Rate (LIBOR), and other interbank-offered based reference rates, through December 31, 2022. In December 2022, FASB issued ASU 2022-06 which defers the sunset date of Topic 848 from December 31, 2022 to December 31, 2024, after which entities will no longer be permitted to apply the relief in Topic 848. Management intends to rely upon the relief provided under Topic 848, which is not expected to have a material impact on the fund’s financial statements.
Indemnification
In the normal course of business, the fund may provide indemnification in connection with its officers and directors, service providers, and/or private company investments. The fund’s maximum exposure under these arrangements is unknown; however, the risk of material loss is currently considered to be remote.
T. ROWE PRICE U.S. HIGH YIELD ETF
NOTE 2 – VALUATION
Fair Value
The fund’s financial instruments are valued at the close of the NYSE and are reported at fair value, which GAAP defines as the price that would be received to sell an asset or paid to transfer a liability in an orderly transaction between market participants at the measurement date. The fund’s Board of Directors (the Board) has designated T. Rowe Price Associates, Inc. as the fund’s valuation designee (Valuation Designee). Subject to oversight by the Board, the Valuation Designee performs the following functions in performing fair value determinations: assesses and manages valuation risks; establishes and applies fair value methodologies; tests fair value methodologies; and evaluates pricing vendors and pricing agents. The duties and responsibilities of the Valuation Designee are performed by its Valuation Committee. The Valuation Designee provides periodic reporting to the Board on valuation matters.
Various valuation techniques and inputs are used to determine the fair value of financial instruments. GAAP establishes the following fair value hierarchy that categorizes the inputs used to measure fair value:
Level 1 – quoted prices (unadjusted) in active markets for identical financial instruments that the fund can access at the reporting date
Level 2 – inputs other than Level 1 quoted prices that are observable, either directly or indirectly (including, but not limited to, quoted prices for similar financial instruments in active markets, quoted prices for identical or similar financial instruments in inactive markets, interest rates and yield curves, implied volatilities, and credit spreads)
Level 3 – unobservable inputs (including the Valuation Designee’s assumptions in determining fair value)
Observable inputs are developed using market data, such as publicly available information about actual events or transactions, and reflect the assumptions that market participants would use to price the financial instrument. Unobservable inputs are those for which market data are not available and are developed using the best information available about the assumptions that market participants would use to price the financial instrument. GAAP requires valuation techniques to maximize the use of relevant observable inputs and minimize the use of unobservable inputs. When multiple inputs are used to derive fair value, the financial instrument is assigned to the level within the fair value hierarchy based
T. ROWE PRICE U.S. HIGH YIELD ETF
on the lowest-level input that is significant to the fair value of the financial instrument. Input levels are not necessarily an indication of the risk or liquidity associated with financial instruments at that level but rather the degree of judgment used in determining those values.
Valuation Techniques
Debt securities generally are traded in the over-the-counter (OTC) market and are valued at prices furnished by independent pricing services or by broker dealers who make markets in such securities. When valuing securities, the independent pricing services consider factors such as, but not limited to, the yield or price of bonds of comparable quality, coupon, maturity, and type, as well as prices quoted by dealers who make markets in such securities.
Investments in mutual funds are valued at the mutual fund’s closing NAV per share on the day of valuation. Assets and liabilities other than financial instruments, including short-term receivables and payables, are carried at cost, or estimated realizable value, if less, which approximates fair value.
Investments for which market quotations are not readily available or deemed unreliable are valued at fair value as determined in good faith by the Valuation Designee. The Valuation Designee has adopted methodologies for determining the fair value of investments for which market quotations are not readily available or deemed unreliable, including the use of other pricing sources. Factors used in determining fair value vary by type of investment and may include market or investment specific considerations. The Valuation Designee typically will afford greatest weight to actual prices in arm’s length transactions, to the extent they represent orderly transactions between market participants, transaction information can be reliably obtained, and prices are deemed representative of fair value. However, the Valuation Designee may also consider other valuation methods such as market-based valuation multiples; a discount or premium from market value of a similar, freely traded security of the same issuer; discounted cash flows; yield to maturity; or some combination. Fair value determinations are reviewed on a regular basis. Because any fair value determination involves a significant amount of judgment, there is a degree of subjectivity inherent in such pricing decisions. Fair value prices determined by the Valuation Designee could differ from those of other market participants, and it is possible that the fair value determined for a security may be materially different from the value that could be realized upon the sale of that security.
Valuation Inputs
The following table summarizes the fund’s financial instruments, based on the inputs used to determine their fair values on May 31, 2023 (for further detail by category, please refer to the accompanying Portfolio of Investments):
T. ROWE PRICE U.S. HIGH YIELD ETF
| ($000s) | Level 1 | Level 2 | Level 3 | Total Value |
| Assets | | | | |
| Fixed Income1 | $ — | $21,415 | $— | $21,415 |
| Short-Term Investments | 476 | — | — | 476 |
| Total | $476 | $21,415 | $— | $21,891 |
| 1 | Includes Corporate Bonds and Bank Loans. |
NOTE 3 – OTHER INVESTMENT TRANSACTIONS
Consistent with its investment objective, the fund engages in the following practices to manage exposure to certain risks and/or to enhance performance. The investment objective, policies, program, and risk factors of the fund are described more fully in the fund’s prospectus and Statement of Additional Information.
Noninvestment-Grade Debt
The fund invests, either directly or through its investment in other T. Rowe Price funds, in noninvestment-grade debt, including “high yield” or “junk” bonds or leveraged loans. Noninvestment-grade debt issuers are more likely to suffer an adverse change in financial condition that would result in the inability to meet a financial obligation. The noninvestment-grade debt market may experience sudden and sharp price swings due to a variety of factors that may decrease the ability of issuers to make principal and interest payments and adversely affect the liquidity or value, or both, of such securities. Accordingly, securities issued by such companies carry a higher risk of default and should be considered speculative.
Restricted Securities
The fund invests in securities that are subject to legal or contractual restrictions on resale. Prompt sale of such securities at an acceptable price may be difficult and may involve substantial delays and additional costs.
Bank Loans
The fund invests in bank loans, which represent an interest in amounts owed by a borrower to a syndicate of lenders. Bank loans are generally noninvestment grade and often involve borrowers whose financial condition is highly leveraged. The fund may invest in fixed and floating rate loans, which may include senior floating rate loans; secured and unsecured loans, second lien or more junior loans; and bridge loans or bridge facilities. Certain bank loans may be revolvers which are a form of senior bank debt, where the
T. ROWE PRICE U.S. HIGH YIELD ETF
borrower can draw down the credit of the revolver when it needs cash and repays the credit when the borrower has excess cash. Certain loans may be “covenant-lite” loans, which means the loans contain fewer maintenance covenants than other loans (in some cases, none) and do not include terms which allow the lender to monitor the performance of the borrower and declare a default if certain criteria are breached. As a result of these risks, the fund’s exposure to losses may be increased.
Bank loans may be in the form of either assignments or participations. A loan assignment transfers all legal, beneficial, and economic rights to the buyer, and transfer typically requires consent of both the borrower and agent. In contrast, a loan participation generally entitles the buyer to receive the cash flows from principal, interest, and any fee payments on a portion of a loan; however, the seller continues to hold legal title to that portion of the loan. As a result, the buyer of a loan participation generally has no direct recourse against the borrower and is exposed to credit risk of both the borrower and seller of the participation.
Bank loans often have extended settlement periods, generally may be repaid at any time at the option of the borrower, and may require additional principal to be funded at the borrowers’ discretion at a later date (e.g., unfunded commitments and revolving debt instruments). Until settlement, the fund maintains liquid assets sufficient to settle its unfunded loan commitments. The fund reflects both the funded portion of a bank loan as well as its unfunded commitment in the Portfolio of Investments. However, if a credit agreement provides no initial funding of a tranche, and funding of the full commitment at a future date(s) is at the borrower’s discretion and considered uncertain, a loan is reflected in the Portfolio of Investments only if, and only to the extent that, the fund has actually settled a funding commitment.
LIBOR Transition
The fund may invest in instruments that are tied to reference rates, including the London Interbank Offered Rate (LIBOR). Over the course of the last several years, global regulators have indicated an intent to phase out the use of LIBOR and similar interbank offered rates (IBOR). There remains uncertainty regarding the future utilization of LIBOR and the nature of any replacement rate. Any potential effects of the transition away from LIBOR on the fund, or on certain instruments in which the fund invests, cannot yet be determined. The transition process may result in, among other things, an increase in volatility or illiquidity of markets for instruments that currently rely on LIBOR, a reduction in the value of certain instruments held by the fund, or a reduction in the effectiveness of related fund transactions such as hedges. Any such effects could have an adverse impact on the fund’s performance.
T. ROWE PRICE U.S. HIGH YIELD ETF
Other
Purchases and sales of portfolio securities excluding in-kind transactions and short-term and U.S. government securities aggregated $26,714,000 and $5,386,000, respectively, for the period ended May 31, 2023.
NOTE 4 – FEDERAL INCOME TAXES
Generally, no provision for federal income taxes is required since the fund intends to qualify as a regulated investment company under Subchapter M of the Internal Revenue Code and distribute to shareholders all of its taxable income and gains. Distributions determined in accordance with federal income tax regulations may differ in amount or character from net investment income and realized gains for financial reporting purposes.
The fund files U.S. federal, state, and local tax returns as required. The fund’s tax returns are subject to examination by the relevant tax authorities until expiration of the applicable statute of limitations, which is generally three years after the filing of the tax return but which can be extended to six years in certain circumstances.
Capital accounts within the financial reporting records are adjusted for permanent book/tax differences to reflect tax character but are not adjusted for temporary differences. The permanent book/tax adjustments, if any, have no impact on results of operations or net assets.
The tax character of distributions paid for the periods presented was as follows:
| ($000s) | |
| | May 31, |
| | 2023 |
| Ordinary income (including short-term capital gains, if any) | $1,122 |
At May 31, 2023, the tax-basis cost of investments, (including derivatives, if any) and gross unrealized appreciation and depreciation were as follows:
| ($000s) | |
| Cost of investments | $22,205 |
| Unrealized appreciation | $ 461 |
| Unrealized depreciation | (775) |
| Net unrealized appreciation (depreciation) | $ (314) |
T. ROWE PRICE U.S. HIGH YIELD ETF
At May 31, 2023, the tax-basis components of accumulated net earnings (loss) were as follows:
| ($000s) | |
| Undistributed ordinary income | $ 97 |
| Net unrealized appreciation (depreciation) | (314) |
| Total distributable earnings (loss) | $(217) |
Temporary differences between book-basis and tax-basis components of total distributable earnings (loss) arise when certain items of income, gain, or loss are recognized in different periods for financial statement purposes versus for tax purposes; these differences will reverse in a subsequent reporting period.
NOTE 5 – RELATED PARTY TRANSACTIONS
The fund is managed by T. Rowe Price Associates, Inc. (Price Associates), a wholly owned subsidiary of T. Rowe Price Group, Inc. (Price Group). Price Associates has entered into a sub-advisory agreement(s) with one or more of its wholly owned subsidiaries, to provide investment advisory services to the fund. The investment management and administrative agreement between the fund and Price Associates provides for an all-inclusive annual fee equal to 0.56% of the fund’s average daily net assets. The fee is computed daily and paid monthly. The all-inclusive fee covers investment management services and ordinary, recurring operating expenses, but does not cover interest and borrowing expenses; taxes; brokerage commissions and other transaction costs; fund proxy expenses; and nonrecurring and extraordinary expenses. All costs related to organization and offering of the fund are borne by Price Associates.
The fund may invest its cash reserves in certain open-end management investment companies managed by Price Associates and considered affiliates of the fund: the T. Rowe Price Government Reserve Fund or the T. Rowe Price Treasury Reserve Fund, organized as money market funds (together, the Price Reserve Funds). The Price Reserve Funds are offered as short-term investment options to mutual funds, trusts, and other accounts managed by Price Associates or its affiliates and are not available for direct purchase by members of the public.
As of May 31, 2023, T. Rowe Price Group, Inc., or its wholly owned subsidiaries, owned 400,000 shares of the fund, representing 89% of the fund’s net assets.
T. ROWE PRICE U.S. HIGH YIELD ETF
The fund may participate in securities purchase and sale transactions with other funds or accounts advised by Price Associates (cross trades), in accordance with procedures adopted by the fund’s Board and Securities and Exchange Commission rules, which require, among other things, that such purchase and sale cross trades be effected at the independent current market price of the security. During the period ended May 31, 2023, the fund had no purchases or sales cross trades with other funds or accounts advised by Price Associates.
NOTE 6 – OTHER MATTERS
Unpredictable events such as environmental or natural disasters, war, terrorism, pandemics, outbreaks of infectious diseases, and similar public health threats may significantly affect the economy and the markets and issuers in which the fund invests. Certain events may cause instability across global markets, including reduced liquidity and disruptions in trading markets, while some events may affect certain geographic regions, countries, sectors, and industries more significantly than others, and exacerbate other pre-existing political, social, and economic risks.
Since 2020, a novel strain of coronavirus (COVID-19) has resulted in disruptions to global business activity and caused significant volatility and declines in global financial markets.
In February 2022, Russian forces entered Ukraine and commenced an armed conflict leading to economic sanctions being imposed on Russia and certain of its citizens, creating impacts on Russian-related stocks and debt and greater volatility in global markets.
In March 2023, the collapse of some US regional and global banks as well as overall concerns around the soundness and stability of the global banking sector has sparked concerns of a broader financial crisis impacting the overall global banking sector. In certain cases, government agencies have assumed control or otherwise intervened in the operations of certain banks due to liquidity and solvency concerns. The extent of impact of these events on the US and global markets is highly uncertain.
These are recent examples of global events which may have a negative impact on the values of certain portfolio holdings or the fund’s overall performance. Management is actively monitoring the risks and financial impacts arising from these events.
T. ROWE PRICE U.S. HIGH YIELD ETF
REPORT OF INDEPENDENT REGISTERED PUBLIC ACCOUNTING FIRM
To the Board of Directors of T. Rowe Price Exchange-Traded Funds, Inc. and Shareholders of T. Rowe Price U.S. High Yield ETF
Opinion on the Financial Statements
We have audited the accompanying statement of assets and liabilities, including the portfolio of investments, of T. Rowe Price U.S. High Yield ETF (one of the funds constituting T. Rowe Price Exchange-Traded Funds, Inc., referred to hereafter as the "Fund") as of May 31, 2023, and the related statements of operations and changes in net assets, including the related notes, and the financial highlights for the period October 25, 2022 (Inception) through May 31, 2023 (collectively referred to as the “financial statements”). In our opinion, the financial statements present fairly, in all material respects, the financial position of the Fund as of May 31, 2023, and the results of its operations, changes in its net assets, and the financial highlights for the period October 25, 2022 (Inception) through May 31, 2023, in conformity with accounting principles generally accepted in the United States of America.
Basis for Opinion
These financial statements are the responsibility of the Fund’s management. Our responsibility is to express an opinion on the Fund’s financial statements based on our audit. We are a public accounting firm registered with the Public Company Accounting Oversight Board (United States) (PCAOB) and are required to be independent with respect to the Fund in accordance with the U.S. federal securities laws and the applicable rules and regulations of the Securities and Exchange Commission and the PCAOB.
We conducted our audit of these financial statements in accordance with the standards of the PCAOB. Those standards require that we plan and perform the audit to obtain reasonable assurance about whether the financial statements are free of material misstatement, whether due to error or fraud.
T. ROWE PRICE U.S. HIGH YIELD ETF
REPORT OF INDEPENDENT REGISTERED PUBLIC ACCOUNTING FIRM
(CONTINUED)
Our audit included performing procedures to assess the risks of material misstatement of the financial statements, whether due to error or fraud, and performing procedures that respond to those risks. Such procedures included examining, on a test basis, evidence regarding the amounts and disclosures in the financial statements. Our audit also included evaluating the accounting principles used and significant estimates made by management, as well as evaluating the overall presentation of the financial statements. Our procedures included confirmation of securities owned as of May 31, 2023 by correspondence with the custodian and transfer agent. We believe that our audit provides a reasonable basis for our opinion.
/s/PricewaterhouseCoopers LLP
Baltimore, Maryland
July 20, 2023
We have served as the auditor of one or more investment companies in the T. Rowe Price group of investment companies since 1973.
T. ROWE PRICE U.S. HIGH YIELD ETF
TAX INFORMATION (UNAUDITED) FOR THE TAX YEAR ENDED 05/31/23
We are providing this information as required by the Internal Revenue Code. The amounts shown may differ from those elsewhere in this report because of differences between tax and financial reporting requirements. The fund’s distributions to shareholders included:
For nonresident alien shareholders, $887,000 of income dividends are interest-related dividends.
INFORMATION ON PROXY VOTING POLICIES, PROCEDURES, AND RECORDS
A description of the policies and procedures used by T. Rowe Price funds and portfolios to determine how to vote proxies relating to portfolio securities is available in each fund’s Statement of Additional Information. You may request this document by calling 1-800-638-5660 or by accessing the SEC’s website, sec.gov.
The description of our proxy voting policies and procedures is also available on our corporate website. To access it, please visit the following Web page:
https://www.troweprice.com/corporate/en/utility/policies.html
Scroll down to the section near the bottom of the page that says, “Proxy Voting Policies.” Click on the Proxy Voting Policies link in the shaded box.
Each fund’s most recent annual proxy voting record is available on our website and through the SEC’s website. To access it through T. Rowe Price, visit the website location shown above, and scroll down to the section near the bottom of the page that says, “Proxy Voting Records.” Click on the Proxy Voting Records link in the shaded box.
HOW TO OBTAIN QUARTERLY PORTFOLIO HOLDINGS
The fund files a complete schedule of portfolio holdings with the Securities and Exchange Commission (SEC) for the first and third quarters of each fiscal year as an exhibit to its reports on Form N-PORT. The fund’s Form N-PORT is available electronically on the SEC’s website (sec.gov).
T. ROWE PRICE U.S. HIGH YIELD ETF
Approval of Investment Management Agreement and Subadvisory Agreement
Each year, the fund’s Board of Directors (Board) considers the continuation of the investment management agreement (Advisory Contract) between the fund and its investment adviser, T. Rowe Price Associates, Inc. (Adviser), as well as the investment subadvisory agreement (Subadvisory Contract) that the Adviser has entered into with T. Rowe Price Investment Management, Inc. (Subadviser), on behalf of the fund. In that regard, at a meeting held on March 6–7, 2023 (Meeting), the Board, including all of the fund’s independent directors, approved the continuation of the fund’s Advisory Contract and Subadvisory Contract. At the Meeting, the Board considered the factors and reached the conclusions described below relating to the selection of the Adviser and Subadviser and the approval of the Advisory Contract and Subadvisory Contract. The independent directors were assisted in their evaluation of the Advisory Contract and Subadvisory Contract by independent legal counsel from whom they received separate legal advice and with whom they met separately.
In providing information to the Board, the Adviser was guided by a detailed set of requests for information submitted by independent legal counsel on behalf of the independent directors. In considering and approving the continuation of the Advisory Contract and Subadvisory Contract, the Board considered the information it believed was relevant, including, but not limited to, the information discussed below. The Board considered not only the specific information presented in connection with the Meeting but also the knowledge gained over time through interaction with the Adviser and Subadviser about various topics. The Board also considered that the Subadviser has its own investment platform and investment management leadership, and the Adviser and Subadviser have implemented information barriers restricting the sharing of investment information and voting activity. The Board meets regularly and, at each of its meetings, covers an extensive agenda of topics and materials and considers factors that are relevant to its annual consideration of the renewal of the T. Rowe Price funds’ advisory contracts, including performance and the services and support provided to the funds and their shareholders.
Services Provided by the Adviser and Subadviser
The Board considered the nature, quality, and extent of the services provided to the fund by the Adviser and Subadviser. These services included, but were not limited to, directing the fund’s investments in accordance with its investment program and the overall management of the fund’s portfolio, as well as a variety of related activities such as financial, investment operations, and administrative services; compliance; maintaining the fund’s records and registrations; and shareholder communications. However, the Board noted that there are information barriers between investment personnel of the Adviser and Subadviser that restrict the sharing of certain information, such as investment research, trading, and proxy voting. The Board also reviewed the background and experience of the Adviser’s and Subadviser’s senior management teams and investment personnel involved in the management of the fund, as well as the Adviser’s compliance record. The Board concluded that the information it considered with respect to the nature, quality, and extent of the
T. ROWE PRICE U.S. HIGH YIELD ETF
services provided by the Adviser and Subadviser, as well as the other factors considered at the Meeting, supported the Board’s approval of the continuation of the Advisory Contract and Subadvisory Contract.
Investment Performance of the Fund
The Board did not review the fund’s performance since the fund only recently incepted in October 2022.
Costs, Benefits, Profits, and Economies of Scale
The Board reviewed detailed information regarding the revenues received by the Adviser under the Advisory Contract and other direct and indirect benefits that the Adviser (and its affiliates) may have realized from its relationship with the fund. In considering soft-dollar arrangements pursuant to which research may be received from broker-dealers that execute the fund’s portfolio transactions, the Board noted that the Adviser bears the cost of research services for all client accounts that it advises, including the T. Rowe Price funds. The Board received information on the estimated costs incurred and profits realized by the Adviser from managing the T. Rowe Price funds. While the Board did not review information regarding profits realized from managing the fund in particular because the fund had either not achieved sufficient portfolio asset size or not recognized sufficient revenues to produce meaningful profit margin percentages, the Board concluded that the Adviser’s profits were reasonable in light of the services provided to the T. Rowe Price mutual funds and ETFs.
The Board also considered whether the fund benefits under the fee levels set forth in the Advisory Contract or otherwise from any economies of scale realized by the Adviser. Under the Advisory Contract, the fund pays the Adviser an all-inclusive management fee, which is based on the fund’s average daily net assets. The all-inclusive management fee includes investment management services and provides for the Adviser to pay all of the fund’s ordinary, recurring operating expenses except for interest and borrowing expenses, taxes, brokerage commissions and other transaction costs, fund proxy expenses, and any nonrecurring extraordinary expenses. Under each Subadvisory Contract, the Adviser may pay the Subadviser up to 60% of the advisory fees that the Adviser receives from the fund. The Adviser has generally implemented an all-inclusive management fee structure in situations where a fixed total expense ratio is useful for purposes of providing certainty of fees and expenses for investors and such a fee structure is typically used by other ETFs offered by competitors. The Adviser has historically sought to set the initial all-inclusive management fee rate at levels below the expense ratios of comparable funds to take into account potential future economies of scale. In addition, the assets of the fund are included in the calculation of the group fee rate, which serves as a component of the management fee for many T. Rowe Price funds and declines at certain asset levels based on the combined average net assets of most of the T. Rowe Price mutual funds and ETFs (including the fund). Although the fund does not have a group fee component to its management fee, its assets are included in the calculation because certain resources utilized to operate the fund are shared with other T. Rowe Price funds.
T. ROWE PRICE U.S. HIGH YIELD ETF
In addition, the Board noted that the fund potentially shares in indirect economies of scale through the Adviser’s ongoing investments in its business in support of the T. Rowe Price funds, including investments in trading systems, technology, and regulatory support enhancements, and the ability to possibly negotiate lower fee arrangements with third-party service providers. The Board concluded that the advisory fee structure for the fund provides for a reasonable sharing of benefits from any economies of scale with the fund’s investors.
Fees and Expenses
The Board was provided with information regarding industry trends in management fees and expenses. Among other things, the Board reviewed data for peer groups that were compiled by Broadridge, which compared: (i) actual management fees, nonmanagement expenses, and total expenses of the fund with a group of competitor funds selected by Broadridge (Expense Group) and (ii) actual management fees, nonmanagement expenses, and total expenses of the fund with a broader set of funds within the Lipper investment classification (Expense Universe). The Board considered the fund’s actual management fee rate (which reflect the fund’s all-inclusive management fee rate), operating expenses, and total expenses (which reflect the fund’s all-inclusive management fee rate) in comparison with the information for the Broadridge peer groups. Broadridge generally constructed the peer groups by seeking the most comparable funds based on similar investment classifications and objectives, expense structure, asset size, and operating components and attributes and ranked funds into quintiles, with the first quintile representing the funds with the lowest relative expenses and the fifth quintile representing the funds with the highest relative expenses. The information provided to the Board indicated that the fund’s actual management fee rate ranked in the fourth quintile (Expense Group and Expense Universe) and the fund’s total expenses ranked in the fourth quintile (Expense Group and Expense Universe).
The Adviser provided the Board with additional information with respect to the fund’s relative management fees and total expenses ranking in the fourth quintile. The Board reviewed and considered the information provided relating to the fund, including other funds in the peer group, and other factors that the Board determined to be relevant.
The Board also reviewed the fee schedules for other investment portfolios with similar mandates that are advised or subadvised by the Adviser and its affiliates, including separately managed accounts for institutional and individual investors; subadvised funds; and other sponsored investment portfolios, including collective investment trusts and pooled vehicles organized and offered to investors outside the United States. Management provided the Board with information about the Adviser’s responsibilities and services provided to subadvisory and other institutional account clients, including information about how the requirements and economics of the institutional business are fundamentally different from those of the proprietary mutual fund business. The Board considered information showing that the Adviser’s mutual fund business is generally more complex from a business and compliance perspective than its institutional account business and considered various relevant factors, such as the broader scope of operations and oversight, more extensive shareholder communication infrastructure, greater asset flows, heightened business risks, and differences in applicable laws and regulations associated with the
T. ROWE PRICE U.S. HIGH YIELD ETF
Adviser’s proprietary mutual fund business. In assessing the reasonableness of the fund’s management fee rate, the Board considered the differences in the nature of the services required for the Adviser to manage its mutual fund business versus managing a discrete pool of assets as a subadviser to another institution’s mutual fund or for an institutional account and that the Adviser generally performs significant additional services and assumes greater risk in managing the fund and other T. Rowe Price funds than it does for institutional account clients, including subadvised funds.
On the basis of the information provided and the factors considered, the Board concluded that the fees paid by the fund under the Advisory Contract are reasonable.
Approval of the Advisory Contract and Subadvisory Contract
As noted, the Board approved the continuation of the Advisory Contract and Subadvisory Contract. No single factor was considered in isolation or to be determinative to the decision. Rather, the Board concluded, in light of a weighting and balancing of all factors considered, that it was in the best interests of the fund and its shareholders for the Board to approve the continuation of the Advisory Contract and Subadvisory Contract (including the fees to be charged for services thereunder).
T. ROWE PRICE U.S. HIGH YIELD ETF
ABOUT THE FUND’S DIRECTORS AND OFFICERS
Your fund is overseen by a Board of Directors (Board) that meets regularly to review a wide variety of matters affecting or potentially affecting the fund, including performance, investment programs, compliance matters, advisory fees and expenses, service providers, and business and regulatory affairs. The Board elects the fund’s officers, who are listed in the final table. The directors who are also employees or officers of T. Rowe Price are considered to be “interested” directors as defined in Section 2(a)(19) of the 1940 Act because of their relationships with T. Rowe Price Associates, Inc. (T. Rowe Price), and its affiliates. The business address of each director and officer is 100 East Pratt Street, Baltimore, Maryland 21202. The Statement of Additional Information includes additional information about the fund directors and is available without charge by calling a T. Rowe Price representative at 1-800-638-5660.
INDEPENDENT DIRECTORS(a)
Name
(Year of Birth)
Year Elected
[Number of T. Rowe Price
Portfolios Overseen] | Principal Occupation(s) and Directorships of Public Companies and
Other Investment Companies During the Past Five Years |
Teresa Bryce Bazemore
(1959)
2019
[210] | President and Chief Executive Officer, Federal Home Loan
Bank of San Francisco (2021 to present); Chief Executive Officer,
Bazemore Consulting LLC (2018 to 2021); Director, Chimera
Investment Corporation (2017 to 2021); Director, First Industrial
Realty Trust (2020 to present); Director, Federal Home Loan Bank of
Pittsburgh (2017 to 2019) |
Melody Bianchetto
(1966)
2023
[210] | Advisory Board Member; Vice President for Finance, University of
Virginia (2015 to 2023) |
Bruce W. Duncan
(1951)
2019
[210] | President, Chief Executive Officer, and Director, CyrusOne, Inc. (2020 to
2021); Chair of the Board (2016 to 2020) and President (2009 to 2016),
First Industrial Realty Trust, owner and operator of industrial properties;
Member, Investment Company Institute Board of Governors (2017 to
2019); Member, Independent Directors Council Governing Board (2017
to 2019); Senior Advisor, KKR (2018 to 2022); Director, Boston
Properties (2016 to present); Director, Marriott International, Inc. (2016 to
2020) |
Robert J. Gerrard, Jr.
(1952)
2019
[210] | Chair of the Board, all funds (July 2018 to present) |
T. ROWE PRICE U.S. HIGH YIELD ETF
INDEPENDENT DIRECTORS(a) (continued)
Paul F. McBride
(1956)
2019
[210] | Advisory Board Member, Vizzia Technologies (2015 to present); Board
Member, Dunbar Armored (2012 to 2018) |
Mark J. Parrell
(1966)
2019
[210] | Advisory Board Member; Board of Trustees Member and Chief Executive
Officer (2019 to present), President (2018 to present), Executive Vice
President and Chief Financial Officer (2007 to 2018), and Senior Vice
President and Treasurer (2005 to 2007), EQR; Member and Chair, Nareit
Dividends Through Diversity, Equity & Inclusion CEO Council, Nareit
2021 Audit and Investment Committee (2021); Advisory Board, Ross
Business School at University of Michigan (2015 to 2016); Member and
Chair of the Finance Committee, National Multifamily Housing Council
(2015 to 2016); Member, Economic Club of Chicago; Director, Brookdale
Senior Living, Inc. (2015 to 2017); Director, Aviv REIT, Inc. (2013 to
2015); Director, Real Estate Roundtable and the 2022 Executive Board
Nareit; Board of Directors and Chair of the Finance Committee, Greater
Chicago Food Depository |
Kellye L. Walker
(1966)
2021
[210] | Executive Vice President and Chief Legal Officer, Eastman Chemical
Company (April 2020 to present); Executive Vice President and Chief
Legal Officer, Huntington Ingalls Industries, Inc. (January 2015 to March
2020); Director, Lincoln Electric Company (October 2020 to present) |
(a)All information about the interested directors was current as of December 31, 2022, unless otherwise indicated, except for the number of portfolios overseen, which is current as of the date of this report.
T. ROWE PRICE U.S. HIGH YIELD ETF
INTERESTED DIRECTORS(a)
Name
(Year of Birth)
Year Elected
[Number of T. Rowe Price
Portfolios Overseen] | Principal Occupation(s) and Directorships of Public Companies and
Other Investment Companies During the Past Five Years |
David Oestreicher
(1967)
2019
[210] | Investment Services, Inc., T. Rowe Price Retirement Plan Services,
Inc., and T. Rowe Price Services, Inc.; Director and Secretary,
T. Rowe Price Investment Management, Inc. (Price Investment
Management); Vice President and Secretary, T. Rowe Price
International (Price International); Vice President, T. Rowe Price Hong
Kong (Price Hong Kong), T. Rowe Price Japan (Price Japan), and T.
Rowe Price Singapore (Price Singapore); General Counsel, Vice
President, and Secretary, T. Rowe Price Group, Inc.; Chair of the
Board, Chief Executive Officer, President, and Secretary, T. Rowe
Price Trust Company; Principal Executive Officer and Executive Vice
President, all funds |
Eric L. Veiel, CFA
(1972)
2022
[210] | Director and Vice President, T. Rowe Price; Vice President, T. Rowe
Price Group, Inc., and T. Rowe Price Trust Company; Vice President,
Global Funds |
(a)All information about the interested directors was current as of December 31, 2022, unless otherwise indicated, except for the number of portfolios overseen, which is current as of the date of this report.
OFFICERS
Name (Year of Birth)
Position Held With 6c-11 ETFs | Principal Occupation(s) |
Armando (Dino) Capasso (1974)
Chief Compliance Officer | Chief Compliance Officer and Vice President, T. Rowe Price and Price Investment Management; Vice President, T. Rowe Price Group, Inc.; formerly, Chief Compliance Officer, PGIM Investments LLC and AST Investment Services, Inc. (ASTIS) (to 2022); Chief Compliance Officer, PGIM Retail Funds complex and Prudential Insurance Funds (to 2022); Vice President and Deputy Chief Compliance Officer, PGIM Investments LLC and ASTIS (to 2019) |
Alan S. Dupski, CPA (1982)
Principal Financial Officer, Vice
President, and Treasurer | Vice President, Price Investment Management, T. Rowe Price, T. Rowe Price Group, Inc., and T. Rowe Price Trust Company |
David R. Giroux (1975)
Executive Vice President | Vice President, Price Investment Management, T. Rowe Price Group, Inc., and T. Rowe Price Trust Company |
Gary J. Greb (1961)
Vice President | Vice President, Price Investment Management, T. Rowe Price, Price International, and T. Rowe Price Trust Company |
T. ROWE PRICE U.S. HIGH YIELD ETF
OFFICERS (continued)
Name (Year of Birth)
Position Held With 6c-11 ETFs | Principal Occupation(s) |
Cheryl Hampton, CPA (1969)
Vice President | Vice President, T. Rowe Price; formerly, Tax Director, Invesco Ltd. (to 2021); Vice President, Oppenheimer Funds, Inc. (to 2019) |
Stephon Jackson, CFA (1962)
President | Director and President, Price Investment Management; Vice President, T. Rowe Price Group, Inc. |
Benjamin Kersse, CPA (1989)
Vice President | Vice President, T. Rowe Price |
Paul J. Krug, CPA (1964)
Vice President | Vice President, T. Rowe Price, T. Rowe Price Group, Inc., and T. Rowe Price Trust Company |
Kevin Patrick Loome, CFA (1967)
Executive Vice President | Vice President, Price Investment Management and T. Rowe Price Group, Inc. |
Fran M. Pollack-Matz (1961)
Vice President and Secretary | Vice President, T. Rowe Price, T. Rowe Price Group, Inc., T. Rowe Price Investment Services, Inc., and T. Rowe Price Services, Inc. |
Shannon H. Rauser (1987)
Assistant Secretary | Assistant Vice President, T. Rowe Price |
Richard Sennett, CPA (1970)
Assistant Treasurer | Vice President, T. Rowe Price, T. Rowe Price Group, Inc., and T. Rowe Price Trust Company |
Megan Warren (1968)
Vice President | OFAC Sanctions Compliance Officer and Vice President, Price Investment Management; Vice President, T. Rowe Price, T. Rowe Price Group, Inc., T. Rowe Price Retirement Plan Services, Inc., T. Rowe Price Services, Inc., and T. Rowe Price Trust Company |
Unless otherwise noted, officers have been employees of T. Rowe Price or Price International for at least 5 years.
This page intentionally left blank.
This page intentionally left blank.
This page intentionally left blank.
This page intentionally left blank.
This page intentionally left blank.
This page intentionally left blank.
100 East Pratt Street
Baltimore, MD 21202
Call 1-800-638-5660 to request a prospectus or summary prospectus; each includes investment objectives, risks, fees, expenses, and other information that you should read and consider carefully before investing.
T. Rowe Price Investment Services, Inc.
Item 1. (b) Notice pursuant to Rule 30e-3.
Not applicable.
Item 2. Code of Ethics.
The registrant has adopted a code of ethics, as defined in Item 2 of Form N-CSR, applicable to its principal executive officer, principal financial officer, principal accounting officer or controller, or persons performing similar functions. A copy of this code of ethics is filed as an exhibit to this Form N-CSR. No substantive amendments were approved or waivers were granted to this code of ethics during the period covered by this report.
Item 3. Audit Committee Financial Expert.
The registrant’s Board of Directors has determined that Ms. Teresa Bryce Bazemore qualifies as an audit committee financial expert, as defined in Item 3 of Form N-CSR. Ms. Bazemore is considered independent for purposes of Item 3 of Form N-CSR.
Item 4. Principal Accountant Fees and Services.
(a) – (d) Aggregate fees billed for the last two fiscal years for professional services rendered to, or on behalf of, the registrant by the registrant’s principal accountant were as follows:
| | | | | | | | | | |
| | | | | 2023 | | | 2022 | |
| | Audit Fees | | $ | 34,209 | | | | $- | |
| | Audit-Related Fees | | | - | | | | - | |
| | Tax Fees | | | 6,939 | | | | - | |
| | All Other Fees | | | - | | | | - | |
Audit fees include amounts related to the audit of the registrant’s annual financial statements and services normally provided by the accountant in connection with statutory and regulatory filings. Audit-related fees include amounts reasonably related to the performance of the audit of the registrant’s financial statements and specifically include the issuance of a report on internal controls and, if applicable, agreed-upon procedures related to fund acquisitions. Tax fees include amounts related to services for tax compliance, tax planning, and tax advice. The nature of these services specifically includes the review of distribution calculations and the preparation of Federal, state, and excise tax returns. All other fees include the registrant’s pro-rata share of amounts for agreed-upon procedures in conjunction with service contract approvals by the registrant’s Board of Directors/Trustees.
(e)(1) The registrant’s audit committee has adopted a policy whereby audit and non-audit services performed by the registrant’s principal accountant for the registrant, its investment adviser, and any entity controlling, controlled by, or under common control with the investment adviser that provides ongoing services to the registrant require pre-approval in advance at regularly scheduled audit committee meetings. If such a service is required between regularly scheduled audit committee meetings, pre-approval may be authorized by one audit committee member with ratification at the next scheduled audit committee meeting. Waiver of pre-approval for audit or non-audit services requiring fees of a de minimis amount is not permitted.
(2) No services included in (b) – (d) above were approved pursuant to paragraph (c)(7)(i)(C) of Rule 2-01 of Regulation S-X.
(f) Less than 50 percent of the hours expended on the principal accountant’s engagement to audit the registrant’s financial statements for the most recent fiscal year were attributed to work performed by persons other than the principal accountant’s full-time, permanent employees.
(g) The aggregate fees billed for the most recent fiscal year and the preceding fiscal year by the registrant’s principal accountant for non-audit services rendered to the registrant, its investment adviser, and any entity controlling, controlled by, or under common control with the investment adviser that provides ongoing services to the registrant were $1,521,000 and $2,959,000, respectively.
(h) All non-audit services rendered in (g) above were pre-approved by the registrant’s audit committee. Accordingly, these services were considered by the registrant’s audit committee in maintaining the principal accountant’s independence.
Item 5. Audit Committee of Listed Registrants.
Not applicable.
Item 6. Investments.
(a) Not applicable. The complete schedule of investments is included in Item 1 of this Form N-CSR.
(b) Not applicable.
Item 7. Disclosure of Proxy Voting Policies and Procedures for Closed-End Management Investment Companies.
Not applicable.
Item 8. Portfolio Managers of Closed-End Management Investment Companies.
Not applicable.
Item 9. Purchases of Equity Securities by Closed-End Management Investment Company and Affiliated Purchasers.
Not applicable.
Item 10. Submission of Matters to a Vote of Security Holders.
There has been no change to the procedures by which shareholders may recommend nominees to the registrant’s board of directors.
Item 11. Controls and Procedures.
(a) The registrant’s principal executive officer and principal financial officer have evaluated the registrant’s disclosure controls and procedures within 90 days of this filing and have concluded that the registrant’s disclosure controls and procedures were effective, as of that date, in ensuring that information required to be disclosed by the registrant in this Form N-CSR was recorded, processed, summarized, and reported timely.
(b) The registrant’s principal executive officer and principal financial officer are aware of no change in the registrant’s internal control over financial reporting that occurred during the period covered by this report that has materially affected, or is reasonably likely to materially affect, the registrant’s internal control over financial reporting.
Item 12. Disclosure of Securities Lending Activities for Closed-End Management Investment Companies.
Not applicable.
Item 13. Exhibits.
SIGNATURES
Pursuant to the requirements of the Securities Exchange Act of 1934 and the Investment Company Act of 1940, the registrant has duly caused this report to be signed on its behalf by the undersigned, thereunto duly authorized.
| | | | |
| T. Rowe Price Exchange-Traded Funds, Inc. |
| | |
| By | | /s/ David Oestreicher | | |
| | David Oestreicher | | |
| | Principal Executive Officer | | |
| | |
| Date | | July 20, 2023 | | |
Pursuant to the requirements of the Securities Exchange Act of 1934 and the Investment Company Act of 1940, this report has been signed below by the following persons on behalf of the registrant and in the capacities and on the dates indicated.
| | | | |
| By | | /s/ David Oestreicher | | |
| | David Oestreicher | | |
| | Principal Executive Officer | | |
| | |
| Date | | July 20, 2023 | | |
| | | | |
| By | | /s/ Alan S. Dupski | | |
| | Alan S. Dupski | | |
| | Principal Financial Officer | | |
| | |
| Date | | July 20, 2023 | | |