UNITED STATES
SECURITIES AND EXCHANGE COMMISSION
Washington, D.C. 20549
FORM N-CSR
CERTIFIED SHAREHOLDER REPORT OF REGISTERED
MANAGEMENT INVESTMENT COMPANIES
Investment Company Act File Number: 811-23494
T. Rowe Price Exchange-Traded Funds, Inc.
(Exact name of registrant as specified in charter)
100 East Pratt Street, Baltimore, MD 21202
(Address of principal executive offices)
David Oestreicher
100 East Pratt Street, Baltimore, MD 21202
(Name and address of agent for service)
Registrant’s telephone number, including area code: (410) 345-2000
Date of fiscal year end: December 31
Date of reporting period: December 31, 2023
Item 1. Reports to Shareholders
(a) Report pursuant to Rule 30e-1

| T. ROWE PRICE | |
| TCAF | Capital Appreciation Equity ETF |
| For more insights from T. Rowe Price investment professionals, go to troweprice.com. |
| ■ | Markets were dominated by two main themes in 2023: artificial intelligence and a complete reversal in the macroeconomic, stock market, and fixed income consensus. |
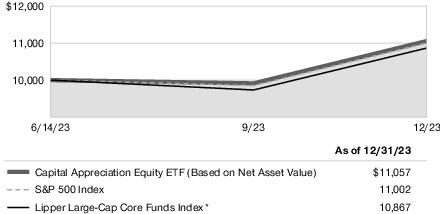
| ■ | Your fund generated a total return of 10.57% versus the S&P 500 Index's total return of 10.02% since our launch. |
| ■ | Following a resurgent year for equities, cyclicals are no longer cheap, and the macroeconomic consensus is that we will have a soft landing and no recession. That very well may be right, but given where valuations are for cyclicals and the market, it almost has to be in order for stocks and cyclicals to continue moving higher in 2024. The risk/reward trade-off now has a more negative skew to it. |
| ■ | We see pockets of value in cyclical and "growth at a reasonable price" stocks, as well as in the utilities sector and in select software, health care, and energy names. |
| ■ | Timely delivery of important documents |
| ■ | Convenient access to your documents anytime, anywhere |
| ■ | Strong security protocols to safeguard sensitive data |

| ■ | We aim to outperform the S&P 500, hopefully by a reasonable margin over time. |
| ■ | We aim to have a lower-beta and lower-risk profile than the S&P 500. |
| ■ | We will aim to be even more tax-efficient than the S&P 500 over time as we will minimize capital gain distributions and plan to have a lower dividend yield than that of the S&P 500. |
| ■ | Poor capital allocation |
| ■ | Extreme valuations |
| ■ | Poor management teams |
| ■ | Secular risk |
| ■ | An inability to generate a total return algorithm (earnings per share (EPS) growth + dividend yield) at least in the high single digits. |
| ■ | If you break apart the S&P 500, we believe 365 to 375 of the 500 companies in the S&P 500 have one or more of these fatal flaws, and by simply removing these companies, we will create a lot of value over time. |
| Total Return | ||
| Periods Ended 12/31/23 | 6 Months | Since Inception 6/14/23 |
| Capital Appreciation Equity ETF (Based on Net Asset Value) | 8.31% | 10.57% |
| Capital Appreciation Equity ETF (At Market Price)* | 8.51 | 10.81 |
| S&P 500 Index | 8.04 | 10.02 |
| Lipper Large-Cap Core Funds Index | 8.67 | 10.64 |
| Percent of Net Assets | ||
| 6/30/23 | 12/31/23 | |
| Information Technology | 27.3% | 27.3% |
| Health Care | 18.3 | 17.3 |
| Industrials and Business Services | 13.1 | 14.6 |
| Financials | 11.2 | 10.7 |
| Consumer Discretionary | 8.5 | 9.1 |
| Utilities | 7.4 | 7.0 |
| Communication Services | 5.0 | 6.4 |
| Energy | 2.2 | 2.4 |
| Materials | 1.9 | 2.0 |
| Real Estate | 1.4 | 1.7 |
| Consumer Staples | 3.4 | 1.2 |
| Other and Reserves | 0.3 | 0.3 |
| Total | 100.0% | 100.0% |

| Percent of Net Assets | |
| 12/31/23 | |
| Microsoft | 7.9% |
| Apple | 5.6 |
| Alphabet | 4.7 |
| Amazon.com | 3.8 |
| NVIDIA | 2.9 |
| UnitedHealth Group | 2.5 |
| Revvity | 2.1 |
| Becton, Dickinson & Company | 1.9 |
| Waste Connections | 1.9 |
| Fortive | 1.7 |
| Linde | 1.7 |
| Meta Platforms | 1.7 |
| Ameren | 1.5 |
| Danaher | 1.5 |
| Intuit | 1.5 |
| Visa | 1.5 |
| AbbVie | 1.4 |
| MasterCard | 1.4 |
| McDonald's | 1.4 |
| Roper Technologies | 1.4 |
| Salesforce | 1.4 |
| Veralto | 1.4 |
| Republic Services | 1.3 |
| RTX | 1.3 |
| Yum! Brands | 1.3 |
| Total | 56.7% |
| Period Ended 12/31/23 | Since Inception 6/14/23 |
| Capital Appreciation Equity ETF (Based on Net Asset Value) | 10.57%* |
| Capital Appreciation Equity ETF (At Market Price) | 10.81* |
| Capital Appreciation Equity ETF | 0.31% |
| Beginning Account Value 7/1/23 | Ending Account Value 12/31/23 | Expenses Paid During Period* 7/1/23 to 12/31/23 | |
| Actual | $1,000.00 | $1,083.10 | $1.63 |
| Hypothetical (assumes 5% return before expenses) | 1,000.00 | 1,023.64 | 1.58 |
| * | Expenses are equal to the fund’s annualized expense ratio for the 6-month period (0.31%), multiplied by the average account value over the period, multiplied by the number of days in the most recent fiscal half year (184), and divided by the days in the year (365) to reflect the half-year period. |
| 6/14/23 (1) Through | |
| 12/31/23 | |
| NET ASSET VALUE | |
| Beginning of period | $ 25.00 |
| Investment activities | |
| Net investment income(2) (3) | 0.15 |
| Net realized and unrealized gain/loss | 2.49 |
| Total from investment activities | 2.64 |
| Distributions | |
| Net investment income | (0.07) |
| NET ASSET VALUE | |
| End of period | $ 27.57 |
| Ratios/Supplemental Data | |
| Total return, based on NAV(3) (4) | 10.57% |
| Ratios to average net assets:(3) | |
| Gross expenses before waivers/payments by Price Associates | 0.31% (5) |
| Net expenses after waivers/payments by Price Associates | 0.31% (5) |
| Net investment income | 1.04% (5) |
| Portfolio turnover rate(6) | 18.5% |
| Net assets, end of period (in thousands) | $ 669,903 |
| (1) | Inception date |
| (2) | Per share amounts calculated using average shares outstanding method. |
| (3) | See Note 6 for details to expense-related arrangements with Price Associates. |
| (4) | Total return reflects the rate that an investor would have earned on an investment in the fund during the period, assuming reinvestment of all distributions. Total return is not annualized for periods less than one year. |
| (5) | Annualized |
| (6) | Portfolio turnover excludes securities received or delivered through in-kind share transactions. |
| PORTFOLIO OF INVESTMENTS‡ | Shares | $ Value |
| (Cost and value in $000s) | ||
| COMMON STOCKS 99.7% | ||
| COMMUNICATION SERVICES 6.4% | ||
| Interactive Media & Services 6.4% | ||
| Alphabet, Class A (1) | 224,455 | 31,354 |
| Meta Platforms, Class A (1) | 32,230 | 11,408 |
| Total Communication Services | 42,762 | |
| CONSUMER DISCRETIONARY 9.1% | ||
| Automobile Components 0.4% | ||
| Mobileye Global, Class A (1) | 58,613 | 2,539 |
| 2,539 | ||
| Broadline Retail 3.8% | ||
| Amazon.com (1) | 168,093 | 25,540 |
| 25,540 | ||
| Hotels Restaurants & Leisure 4.5% | ||
| Chipotle Mexican Grill (1) | 489 | 1,118 |
| Hilton Worldwide Holdings | 40,309 | 7,340 |
| Marriott International, Class A | 12,642 | 2,851 |
| McDonald's | 30,763 | 9,122 |
| Starbucks | 9,655 | 927 |
| Yum! Brands | 69,168 | 9,037 |
| 30,395 | ||
| Textiles, Apparel & Luxury Goods 0.4% | ||
| NIKE, Class B | 21,875 | 2,375 |
| 2,375 | ||
| Total Consumer Discretionary | 60,849 | |
| Shares | $ Value | |
| (Cost and value in $000s) | ||
| CONSUMER STAPLES 1.2% | ||
| Beverages 0.7% | ||
| Keurig Dr Pepper | 135,602 | 4,518 |
| 4,518 | ||
| Food Products 0.5% | ||
| Mondelez International, Class A | 48,021 | 3,478 |
| 3,478 | ||
| Total Consumer Staples | 7,996 | |
| ENERGY 2.4% | ||
| Oil, Gas & Consumable Fuels 2.4% | ||
| Canadian Natural Resources | 126,266 | 8,273 |
| Chesapeake Energy | 68,566 | 5,275 |
| EOG Resources | 21,437 | 2,593 |
| Total Energy | 16,141 | |
| FINANCIALS 10.7% | ||
| Banks 1.1% | ||
| Bank of America | 94,438 | 3,180 |
| PNC Financial Services Group | 25,132 | 3,892 |
| 7,072 | ||
| Capital Markets 4.5% | ||
| CME Group | 13,664 | 2,878 |
| Goldman Sachs Group | 12,328 | 4,756 |
| Intercontinental Exchange | 46,814 | 6,012 |
| KKR | 56,899 | 4,714 |
| Moody's | 3,405 | 1,330 |
| Morgan Stanley | 39,617 | 3,694 |
| MSCI | 1,974 | 1,116 |
| S&P Global | 9,236 | 4,069 |
| Tradeweb Markets, Class A | 20,546 | 1,867 |
| 30,436 | ||
| Shares | $ Value | |
| (Cost and value in $000s) | ||
| Financial Services 2.9% | ||
| Mastercard, Class A | 22,328 | 9,523 |
| Visa, Class A | 37,730 | 9,823 |
| 19,346 | ||
| Insurance 2.2% | ||
| Arthur J Gallagher | 29,161 | 6,558 |
| Marsh & McLennan | 43,655 | 8,271 |
| 14,829 | ||
| Total Financials | 71,683 | |
| HEALTH CARE 17.3% | ||
| Biotechnology 2.6% | ||
| AbbVie | 60,864 | 9,432 |
| Biogen (1) | 32,461 | 8,400 |
| 17,832 | ||
| Health Care Equipment & Supplies 4.4% | ||
| Abbott Laboratories | 59,965 | 6,600 |
| Alcon | 18,960 | 1,481 |
| Becton Dickinson | 51,062 | 12,450 |
| GE HealthCare Technologies | 42,652 | 3,298 |
| Stryker | 10,210 | 3,058 |
| Teleflex | 9,697 | 2,418 |
| 29,305 | ||
| Health Care Providers & Services 3.8% | ||
| Elevance Health | 8,744 | 4,124 |
| Humana | 2,128 | 974 |
| McKesson | 7,773 | 3,599 |
| UnitedHealth Group | 31,694 | 16,686 |
| 25,383 | ||
| Shares | $ Value | |
| (Cost and value in $000s) | ||
| Life Sciences Tools & Services 4.5% | ||
| Avantor (1) | 106,468 | 2,430 |
| Danaher | 44,207 | 10,227 |
| Revvity | 131,103 | 14,331 |
| Thermo Fisher Scientific | 5,531 | 2,936 |
| 29,924 | ||
| Pharmaceuticals 2.0% | ||
| Eli Lilly | 14,612 | 8,518 |
| Zoetis | 25,224 | 4,978 |
| 13,496 | ||
| Total Health Care | 115,940 | |
| INDUSTRIALS & BUSINESS SERVICES 14.6% | ||
| Aerospace & Defense 2.3% | ||
| Lockheed Martin | 5,346 | 2,423 |
| Northrop Grumman | 8,745 | 4,094 |
| RTX | 101,999 | 8,582 |
| 15,099 | ||
| Building Products 0.4% | ||
| Trane Technologies | 11,669 | 2,846 |
| 2,846 | ||
| Commercial Services & Supplies 4.8% | ||
| Cintas | 1,413 | 851 |
| Republic Services | 53,027 | 8,745 |
| Veralto | 116,449 | 9,579 |
| Waste Connections | 86,633 | 12,932 |
| 32,107 | ||
| Electrical Equipment 1.0% | ||
| AMETEX | 42,683 | 7,038 |
| 7,038 | ||
| Shares | $ Value | |
| (Cost and value in $000s) | ||
| Ground Transportation 0.4% | ||
| CSX | 82,610 | 2,864 |
| 2,864 | ||
| Industrial Conglomerates 2.0% | ||
| General Electric | 32,106 | 4,098 |
| Roper Technologies | 16,894 | 9,210 |
| 13,308 | ||
| Machinery 3.3% | ||
| Fortive | 158,365 | 11,661 |
| IDEX | 7,319 | 1,589 |
| Ingersoll-Rand | 110,800 | 8,569 |
| 21,819 | ||
| Professional Services 0.4% | ||
| Broadridge Financial Solutions | 2,846 | 586 |
| Equifax | 9,023 | 2,231 |
| 2,817 | ||
| Total Industrials & Business Services | 97,898 | |
| INFORMATION TECHNOLOGY 27.3% | ||
| Electronic Equipment, Instruments & Components 2.2% | ||
| Amphenol, Class A | 53,848 | 5,338 |
| TE Connectivity | 13,054 | 1,834 |
| Teledyne Technologies (1) | 16,446 | 7,340 |
| 14,512 | ||
| IT Services 0.9% | ||
| Accenture, Class A | 16,529 | 5,800 |
| 5,800 | ||
| Semiconductors & Semiconductor Equipment 6.1% | ||
| Analog Devices | 33,668 | 6,685 |
| Applied Materials | 27,732 | 4,495 |
| Shares | $ Value | |
| (Cost and value in $000s) | ||
| KLA | 6,941 | 4,035 |
| Lam Research | 844 | 661 |
| NVIDIA | 39,912 | 19,765 |
| NXP Semiconductors | 23,982 | 5,508 |
| 41,149 | ||
| Software 12.5% | ||
| Cadence Design Systems (1) | 11,180 | 3,045 |
| Intuit | 15,553 | 9,721 |
| Microsoft | 141,267 | 53,122 |
| PTC (1) | 40,712 | 7,123 |
| Salesforce.com (1) | 34,801 | 9,158 |
| Tyler Technologies (1) | 4,679 | 1,956 |
| 84,125 | ||
| Technology Hardware, Storage & Peripherals 5.6% | ||
| Apple | 194,195 | 37,388 |
| 37,388 | ||
| Total Information Technology | 182,974 | |
| MATERIALS 2.0% | ||
| Chemicals 1.7% | ||
| Linde | 26,998 | 11,089 |
| 11,089 | ||
| Construction Materials 0.3% | ||
| Martin Marietta Materials | 3,887 | 1,939 |
| 1,939 | ||
| Total Materials | 13,028 | |
| REAL ESTATE 1.7% | ||
| Specialized REITs 1.7% | ||
| American Tower, REIT | 28,709 | 6,198 |
| Shares | $ Value | |
| (Cost and value in $000s) | ||
| SBA Communications, REIT | 20,406 | 5,177 |
| Total Real Estate | 11,375 | |
| UTILITIES 7.0% | ||
| Electric Utilities 2.4% | ||
| Exelon | 178,813 | 6,419 |
| NextEra Energy | 34,558 | 2,099 |
| Xcel Energy | 124,401 | 7,702 |
| 16,220 | ||
| Multi-Utilities 4.0% | ||
| Ameren | 139,423 | 10,086 |
| CenterPoint Energy | 192,022 | 5,486 |
| CMS Energy | 25,290 | 1,469 |
| DTE Energy | 56,877 | 6,271 |
| WEC Energy Group | 42,835 | 3,605 |
| 26,917 | ||
| Water Utilities 0.6% | ||
| Essential Utilities | 106,649 | 3,984 |
| 3,984 | ||
| Total Utilities | 47,121 | |
| Total Common Stocks (Cost $628,022) | 667,767 | |
| MONEY MARKET FUNDS 0.2% | ||
| Money Market Funds 0.2% | ||
| T. Rowe Price Government Reserve Fund, 5.42% (2)(3) | 1,792,333 | 1,792 |
| Total Money Market Funds (Cost $1,792) | 1,792 | |
| Total Investments in Securities 99.9% of Net Assets (Cost $629,814) | $669,559 | |
| ‡ | Shares are denominated in U.S. dollars unless otherwise noted. |
| (1) | Non-income producing. |
| (2) | Seven-day yield |
| (3) | Affiliated Companies |
| REIT | A domestic Real Estate Investment Trust whose distributions pass-through with original tax character to the shareholder |
| Affiliate | Net Realized Gain (Loss) | Changes in Net Unrealized Gain/Loss | Investment Income |
| T. Rowe Price Government Reserve Fund | $ — | $— | $ 22 |
| Totals | $—# | $— | $22+ |
| Supplementary Investment Schedule | ||||
| Affiliate | Value 12/31/22 | Purchase Cost | Sales Cost | Value 12/31/23 |
| T. Rowe Price Government Reserve Fund | $ — | ¤ | ¤ | $ 1,792 |
| Total | $1,792^ | |||
| # | Capital gain distributions from mutual funds represented $0 of the net realized gain (loss). |
| + | Investment income comprised $22 of dividend income and $0 of interest income. |
| ¤ | Purchase and sale information not shown for cash management funds. |
| ^ | The cost basis of investments in affiliated companies was $1,792. |
| Assets | |
| Investments in securities, at value (cost $629,814) | $ 669,559 |
| Receivable for shares sold | 11,038 |
| Dividends receivable | 428 |
| Cash | 35 |
| Total assets | 681,060 |
| Liabilities | |
| Payable for investment securities purchased | 11,003 |
| Investment management and administrative fees payable | 154 |
| Total liabilities | 11,157 |
| NET ASSETS | $ 669,903 |
| Net assets consists of: | |
| Total distributable earnings (loss) | $ 38,526 |
| Paid-in capital applicable to 24,300,000 shares of $0.0001 par value capital stock outstanding; 4,000,000,000 shares authorized | 631,377 |
| NET ASSETS | $669,903 |
| NET ASSET VALUE PER SHARE | $ 27.57 |
| 6/14/23 Through | |
| 12/31/23 | |
| Investment Income (Loss) | |
| Dividend income (net of foreign taxes of $21) | $ 1,967 |
| Investment management and administrative expense | 447 |
| Net investment income | 1,520 |
| Realized and Unrealized Gain / Loss | |
| Net realized gain (loss) | |
| Securities | (1,219) |
| In-kind redemptions | 2,734 |
| Net realized gain | 1,515 |
| Change in net unrealized gain / loss on securities | 39,745 |
| Net realized and unrealized gain / loss | 41,260 |
| INCREASE IN NET ASSETS FROM OPERATIONS | $42,780 |
| 6/14/23 Through | |
| 12/31/23 | |
| Increase (Decrease) in Net Assets | |
| Operations | |
| Net investment income | $ 1,520 |
| Net realized gain | 1,515 |
| Change in net unrealized gain / loss | 39,745 |
| Increase in net assets from operations | 42,780 |
| Distributions to shareholders | |
| Net earnings | (1,597) |
| Capital share transactions* | |
| Shares sold | 659,650 |
| Shares redeemed | (30,930) |
| Increase in net assets from capital share transactions | 628,720 |
| Net Assets | |
| Increase during period | 669,903 |
| Beginning of period | - |
| End of period | $669,903 |
| *Share information | |
| Shares sold | 25,500 |
| Shares redeemed | (1,200) |
| Increase in shares outstanding | 24,300 |
| ($000s) | |
| December 31, | |
| 2023 | |
| Ordinary income (including short-term capital gains, if any) | $1,597 |
| ($000s) | |
| Cost of investments | $629,836 |
| Unrealized appreciation | $ 42,240 |
| Unrealized depreciation | (2,517) |
| Net unrealized appreciation (depreciation) | $ 39,723 |
| ($000s) | |
| Net unrealized appreciation (depreciation) | $39,723 |
| Loss carryforwards and deferrals | (1,197) |
| Total distributable earnings (loss) | $38,526 |
| Name (Year of Birth) Year Elected [Number of T. Rowe Price Portfolios Overseen] | Principal Occupation(s) and Directorships of Public Companies and Other Investment Companies During the Past Five Years |
| Teresa Bryce Bazemore (1959) 2020 [209] | President and Chief Executive Officer, Federal Home Loan Bank of San Francisco (2021 to present); Chief Executive Officer, Bazemore Consulting LLC (2018 to 2021); Director, Chimera Investment Corporation (2017 to 2021); Director, First Industrial Realty Trust (2020 to present); Director, Federal Home Loan Bank of Pittsburgh (2017 to 2019) |
| Melody Bianchetto (1966) 2023 [209] | Vice President for Finance, University of Virginia (2015 to 2023) |
| Bruce W. Duncan (1951) 2020 [209] | President, Chief Executive Officer, and Director, CyrusOne, Inc. (2020 to 2021); Chair of the Board (2016 to 2020) and President (2009 to 2016), First Industrial Realty Trust, owner and operator of industrial properties; Member, Investment Company Institute Board of Governors (2017 to 2019); Member, Independent Directors Council Governing Board (2017 to 2019); Senior Advisor, KKR (2018 to 2022); Director, Boston Properties (2016 to present); Director, Marriott International, Inc. (2016 to 2020) |
| Robert J. Gerrard, Jr. (1952) 2020 [209] | Chair of the Board, all funds (July 2018 to present) |
| Name (Year of Birth) Year Elected [Number of T. Rowe Price Portfolios Overseen] | Principal Occupation(s) and Directorships of Public Companies and Other Investment Companies During the Past Five Years |
| Paul F. McBride (1956) 2020 [209] | Advisory Board Member, Vizzia Technologies (2015 to present); Board Member, Dunbar Armored (2012 to 2018) |
| Mark J. Parrell (1966) 2023 [209] | Board of Trustees Member and Chief Executive Officer (2019 to present), President (2018 to present), Executive Vice President and Chief Financial Officer (2007 to 2018), and Senior Vice President and Treasurer (2005 to 2007), EQR; Member, Nareit Dividends Through Diversity, Equity & Inclusion CEO Council and Chair, Nareit 2021 Audit and Investment Committee (2021); Advisory Board, Ross Business School at University of Michigan (2015 to 2016); Member, National Multifamily Housing Council and served as Chair of the Finance Committee (2015 to 2016); Member, Economic Club of Chicago; Director, Brookdale Senior Living, Inc. (2015 to 2017); Director, Aviv REIT, Inc. (2013 to 2015); Director, Real Estate Roundtable and the 2022 Executive Board Nareit; Board of Directors and Chair of the Finance Committee, Greater Chicago Food Depository |
| Kellye L. Walker (1966) 2021 [209] | Executive Vice President and Chief Legal Officer, Eastman Chemical Company (April 2020 to present); Executive Vice President and Chief Legal Officer, Huntington Ingalls Industries, Inc. (January 2015 to March 2020); Director, Lincoln Electric Company (October 2020 to present) |
| Name (Year of Birth) Year Elected [Number of T. Rowe Price Portfolios Overseen] | Principal Occupation(s) and Directorships of Public Companies and Other Investment Companies During the Past Five Years |
| David Oestreicher (1967) 2020 [209] | Director, Vice President, and Secretary, T. Rowe Price, T. Rowe Price Investment Services, Inc., T. Rowe Price Retirement Plan Services, Inc., and T. Rowe Price Services, Inc.; Director and Secretary, T. Rowe Price Investment Management, Inc. (Price Investment Management); Vice President and Secretary, T. Rowe Price International (Price International); Vice President, T. Rowe Price Hong Kong (Price Hong Kong), T. Rowe Price Japan (Price Japan), and T. Rowe Price Singapore (Price Singapore); General Counsel, Vice President, and Secretary, T. Rowe Price Group, Inc.; Chair of the Board, Chief Executive Officer, President, and Secretary, T. Rowe Price Trust Company; Principal Executive Officer and Executive Vice President, all funds |
| Eric L. Veiel, CFA (1972) 2022 [209] | Director and Vice President, T. Rowe Price; Vice President, T. Rowe Price Group, Inc., and T. Rowe Price Trust Company; Vice President, Global Funds |
| Name (Year of Birth) Position Held With Exchange-Traded Funds, Inc. | Principal Occupation(s) |
| Armando (Dino) Capasso (1974) Chief Compliance Officer and Vice President | Chief Compliance Officer and Vice President, T. Rowe Price and Price Investment Management; Vice President, T. Rowe Price Group, Inc.; formerly, Chief Compliance Officer, PGIM Investments LLC and AST Investment Services, Inc. (ASTIS) (to 2022); Chief Compliance Officer, PGIM Retail Funds complex and Prudential Insurance Funds (to 2022); Vice President and Deputy Chief Compliance Officer, PGIM Investments LLC and ASTIS (to 2019) |
| Alan S. Dupski, CPA (1982) Principal Financial Officer, Vice President, and Treasurer | Vice President, Price Investment Management, T. Rowe Price, T. Rowe Price Group, Inc., and T. Rowe Price Trust Company |
| Name (Year of Birth) Position Held With Exchange-Traded Funds, Inc. | Principal Occupation(s) |
| Cheryl Emory (1963) Assistant Secretary | Assistant Vice President and Assistant Secretary, T. Rowe Price; Assistant Secretary, T. Rowe Price Group, Inc., Price Investment Management, Price International, Price Hong Kong, Price Singapore, T. Rowe Price Investment Services, Inc., T. Rowe Price Retirement Plan Services, Inc., and T. Rowe Price Trust Company |
| David Giroux (1975) Executive Vice President | Vice President, Price Investment Management, T. Rowe Price Group, Inc., and T. Rowe Price Trust Company |
| Cheryl Hampton, CPA (1969) Vice President | Vice President, T. Rowe Price, T. Rowe Price Group, Inc., and T. Rowe Price Trust Company; formerly, Tax Director, Invesco Ltd. (to 2021); Vice President, Oppenheimer Funds, Inc. (to 2019) |
| Stephon Jackson, CFA (1962) President | Director and President, Price Investment Management; Vice President, T. Rowe Price Group, Inc. |
| Benjamin Kersse, CPA (1989) Vice President | Vice President, T. Rowe Price and T. Rowe Price Trust Company |
| Paul J. Krug, CPA (1964)) Vice President | Vice President, T. Rowe Price, T. Rowe Price Group, Inc., and T. Rowe Price Trust Company |
| Kevin Patrick Loome, CFA (1967) Executive Vice President | Vice President, Price Investment Management and T. Rowe Price Group, Inc. |
| Robert P. McDavid (1972) Vice President | Vice President, T. Rowe Price, Price Investment Management, T. Rowe Price Investment Services, Inc., and T. Rowe Price Trust Company |
| Fran M. Pollack-Matz (1961) Vice President and Secretary | Vice President, T. Rowe Price, T. Rowe Price Group, Inc., T. Rowe Price Investment Services, Inc., T. Rowe Price Services, Inc., and T. Rowe Price Trust Company |
| Richard Sennett, CPA (1970) Assistant Treasurer | Vice President, T. Rowe Price, T. Rowe Price Group, Inc., and T. Rowe Price Trust Company |
| Ellen York (1988) Vice President | Vice President, Price Investment Management and T. Rowe Price |
Item 1. (b) Notice pursuant to Rule 30e-3.
Not applicable.
Item 2. Code of Ethics.
The registrant has adopted a code of ethics, as defined in Item 2 of Form N-CSR, applicable to its principal executive officer, principal financial officer, principal accounting officer or controller, or persons performing similar functions. A copy of this code of ethics is filed as an exhibit to this Form N-CSR. No substantive amendments were approved or waivers were granted to this code of ethics during the period covered by this report.
Item 3. Audit Committee Financial Expert.
The registrant’s Board of Directors has determined that Mr. Paul F. McBride qualifies as an audit committee financial expert, as defined in Item 3 of Form N-CSR. Mr. McBride is considered independent for purposes of Item 3 of Form N-CSR.
Item 4. Principal Accountant Fees and Services.
(a) – (d) Aggregate fees billed for the last two fiscal years for professional services rendered to, or on behalf of, the registrant by the registrant’s principal accountant were as follows:
2023 | 2022 | |||||||||||||
Audit Fees | $25,357 | $ | ||||||||||||
Audit-Related Fees | - | |||||||||||||
Tax Fees | - | |||||||||||||
All Other Fees | - | |||||||||||||
Audit fees include amounts related to the audit of the registrant’s annual financial statements and services normally provided by the accountant in connection with statutory and regulatory filings. Audit-related fees include amounts reasonably related to the performance of the audit of the registrant’s financial statements and specifically include the issuance of a report on internal controls and, if applicable, agreed-upon procedures related to fund acquisitions. Tax fees include amounts related to services for tax compliance, tax planning, and tax advice. The nature of these services specifically includes the review of distribution calculations and the preparation of Federal, state, and excise tax returns. All other fees include the registrant’s pro-rata share of amounts for agreed-upon procedures in conjunction with service contract approvals by the registrant’s Board of Directors/Trustees.
(e)(1) The registrant’s audit committee has adopted a policy whereby audit and non-audit services performed by the registrant’s principal accountant for the registrant, its investment adviser, and any entity controlling, controlled by, or under common control with the investment adviser that provides ongoing services to the registrant require pre-approval in advance at regularly scheduled audit committee meetings. If such a service is required between regularly scheduled audit committee meetings, pre-approval may be authorized by one audit committee member with ratification at the next scheduled audit committee meeting. Waiver of pre-approval for audit or non-audit services requiring fees of a de minimis amount is not permitted.
(2) No services included in (b) – (d) above were approved pursuant to paragraph (c)(7)(i)(C) of Rule 2-01 of Regulation S-X.
(f) Less than 50 percent of the hours expended on the principal accountant’s engagement to audit the registrant’s financial statements for the most recent fiscal year were attributed to work performed by persons other than the principal accountant’s full-time, permanent employees.
(g) The aggregate fees billed for the most recent fiscal year and the preceding fiscal year by the registrant’s principal accountant for non-audit services rendered to the registrant, its investment adviser, and any entity controlling, controlled by, or under common control with the investment adviser that provides ongoing services to the registrant were $1,524,000 and $2,037,000, respectively.
(h) All non-audit services rendered in (g) above were pre-approved by the registrant’s audit committee. Accordingly, these services were considered by the registrant’s audit committee in maintaining the principal accountant’s independence.
Item 5. Audit Committee of Listed Registrants.
Not applicable.
Item 6. Investments.
(a) Not applicable. The complete schedule of investments is included in Item 1 of this Form N-CSR.
(b) Not applicable.
Item 7. Disclosure of Proxy Voting Policies and Procedures for Closed-End Management Investment Companies.
Not applicable.
Item 8. Portfolio Managers of Closed-End Management Investment Companies.
Not applicable.
Item 9. Purchases of Equity Securities by Closed-End Management Investment Company and Affiliated Purchasers.
Not applicable.
Item 10. Submission of Matters to a Vote of Security Holders.
There has been no change to the procedures by which shareholders may recommend nominees to the registrant’s board of directors.
Item 11. Controls and Procedures.
(a) The registrant’s principal executive officer and principal financial officer have evaluated the registrant’s disclosure controls and procedures within 90 days of this filing and have concluded that the registrant’s disclosure controls and procedures were effective, as of that date, in ensuring that information required to be disclosed by the registrant in this Form N-CSR was recorded, processed, summarized, and reported timely.
(b) The registrant’s principal executive officer and principal financial officer are aware of no change in the registrant’s internal control over financial reporting that occurred during the period covered by this report that has materially affected, or is reasonably likely to materially affect, the registrant’s internal control over financial reporting.
Item 12. Disclosure of Securities Lending Activities for Closed-End Management Investment Companies.
Not applicable.
Item 13. Exhibits.
| (a)(1) | The registrant’s code of ethics pursuant to Item 2 of Form N-CSR is attached. | |
| (2) | ||
| (3) | Written solicitation to repurchase securities issued by closed-end companies: not applicable. | |
| (b) | ||
SIGNATURES
Pursuant to the requirements of the Securities Exchange Act of 1934 and the Investment Company Act of 1940, the registrant has duly caused this report to be signed on its behalf by the undersigned, thereunto duly authorized.
| T. Rowe Price Exchange-Traded Funds, Inc. | ||||
| By | /s/ David Oestreicher | |||
| David Oestreicher | ||||
| Principal Executive Officer | ||||
| Date | February 16, 2024 | |||
Pursuant to the requirements of the Securities Exchange Act of 1934 and the Investment Company Act of 1940, this report has been signed below by the following persons on behalf of the registrant and in the capacities and on the dates indicated.
| By | /s/ David Oestreicher | |||
| David Oestreicher | ||||
| Principal Executive Officer | ||||
| Date | February 16, 2024 | |||
| By | /s/ Alan S. Dupski | |||
| Alan S. Dupski | ||||
| Principal Financial Officer | ||||
| Date | February 16, 2024 | |||