
Exhibit 99.2 Report of Independent Registered Public Accounting Firm KPMG LLP Two Financial Center 60 South Street Boston, Massachusetts 02111-2759 To the Stockholders and Board of Directors Century Bancorp, Inc.: Opinion on the Consolidated Financial Statements We have audited the accompanying consolidated balance sheets of Century Bancorp, Inc. and subsidiaries (the Company) as of December 31, 2020 and 2019, the related consolidated statements of income, comprehensive income, changes in stockholders’ equity, and cash flows for each of the years in the three-year period ended December 31, 2020, and the related notes (collectively, the consolidated financial statements). In our opinion, the consolidated financial statements present fairly, in all material respects, the financial position of the Company as of December 31, 2020 and 2019, and the results of its operations and its cash flows for each of the years in the three-year period ended December 31, 2020, in conformity with U.S. generally accepted accounting principles. We also have audited, in accordance with the standards of the Public Company Accounting Oversight Board (United States) (PCAOB), the Company’s internal control over financial reporting as of December 31, 2020, based on criteria established in Internal Control—Integrated Framework (2013) issued by the Committee of Sponsoring Organizations of the Treadway Commission, and our report dated March 10, 2021 expressed an unqualified opinion on the effectiveness of the Company’s internal control over financial reporting. Basis for Opinion These consolidated financial statements are the responsibility of the Company’s management. Our responsibility is to express an opinion on these consolidated financial statements based on our audits. We are a public accounting firm registered with the PCAOB and are required to be independent with respect to the Company in accordance with the U.S. federal securities laws and the applicable rules and regulations of the Securities and Exchange Commission and the PCAOB. We conducted our audits in accordance with the standards of the PCAOB. Those standards require that we plan and perform the audit to obtain reasonable assurance about whether the consolidated financial statements are free of material misstatement, whether due to error or fraud. Our audits included performing procedures to assess the risks of material misstatement of the consolidated financial statements, whether due to error or fraud, and performing procedures that respond to those risks. Such procedures included examining, on a test basis, evidence regarding the amounts and disclosures in the consolidated financial statements. Our audits also included evaluating the accounting principles used and significant estimates made by management, as well as evaluating the overall presentation of the consolidated financial statements. We believe that our audits provide a reasonable basis for our opinion. Critical Audit Matter The critical audit matter communicated below is a matter arising from the current period audit of the consolidated financial statements that was communicated or required to be communicated to the audit committee and that: (1) relates to accounts or disclosures that are material to the consolidated financial statements and (2) involved our especially challenging, subjective, or complex judgments. The communication of a critical audit matter does not alter in any way our opinion on the consolidated financial statements, taken as a whole, and we 1
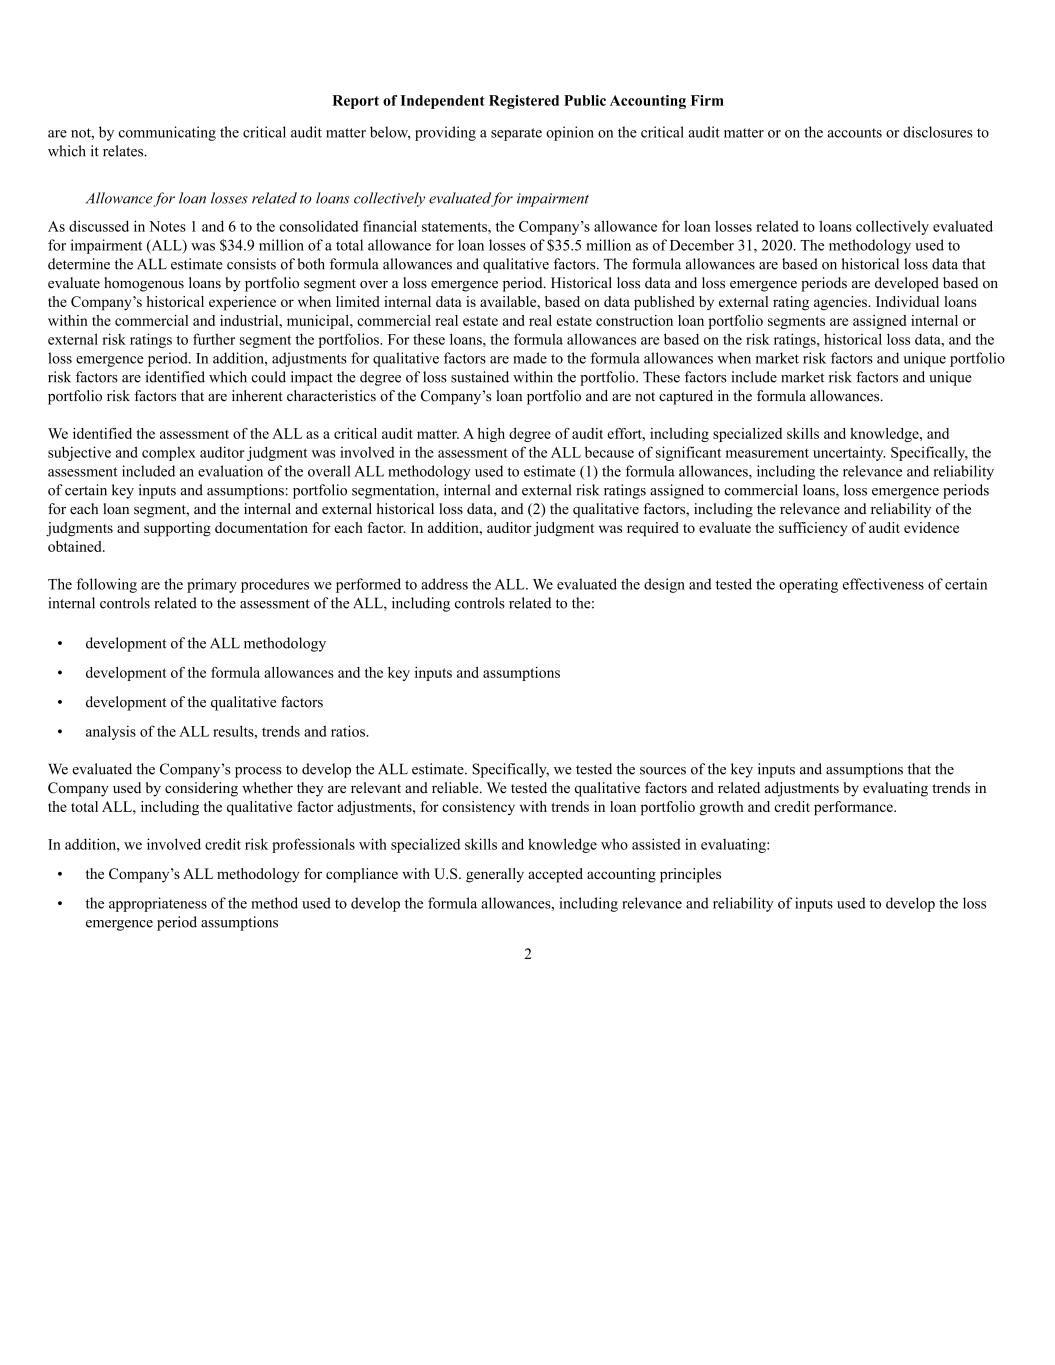
Report of Independent Registered Public Accounting Firm are not, by communicating the critical audit matter below, providing a separate opinion on the critical audit matter or on the accounts or disclosures to which it relates. Allowance for loan losses related to loans collectively evaluated for impairment As discussed in Notes 1 and 6 to the consolidated financial statements, the Company’s allowance for loan losses related to loans collectively evaluated for impairment (ALL) was $34.9 million of a total allowance for loan losses of $35.5 million as of December 31, 2020. The methodology used to determine the ALL estimate consists of both formula allowances and qualitative factors. The formula allowances are based on historical loss data that evaluate homogenous loans by portfolio segment over a loss emergence period. Historical loss data and loss emergence periods are developed based on the Company’s historical experience or when limited internal data is available, based on data published by external rating agencies. Individual loans within the commercial and industrial, municipal, commercial real estate and real estate construction loan portfolio segments are assigned internal or external risk ratings to further segment the portfolios. For these loans, the formula allowances are based on the risk ratings, historical loss data, and the loss emergence period. In addition, adjustments for qualitative factors are made to the formula allowances when market risk factors and unique portfolio risk factors are identified which could impact the degree of loss sustained within the portfolio. These factors include market risk factors and unique portfolio risk factors that are inherent characteristics of the Company’s loan portfolio and are not captured in the formula allowances. We identified the assessment of the ALL as a critical audit matter. A high degree of audit effort, including specialized skills and knowledge, and subjective and complex auditor judgment was involved in the assessment of the ALL because of significant measurement uncertainty. Specifically, the assessment included an evaluation of the overall ALL methodology used to estimate (1) the formula allowances, including the relevance and reliability of certain key inputs and assumptions: portfolio segmentation, internal and external risk ratings assigned to commercial loans, loss emergence periods for each loan segment, and the internal and external historical loss data, and (2) the qualitative factors, including the relevance and reliability of the judgments and supporting documentation for each factor. In addition, auditor judgment was required to evaluate the sufficiency of audit evidence obtained. The following are the primary procedures we performed to address the ALL. We evaluated the design and tested the operating effectiveness of certain internal controls related to the assessment of the ALL, including controls related to the: • development of the ALL methodology • development of the formula allowances and the key inputs and assumptions • development of the qualitative factors • analysis of the ALL results, trends and ratios. We evaluated the Company’s process to develop the ALL estimate. Specifically, we tested the sources of the key inputs and assumptions that the Company used by considering whether they are relevant and reliable. We tested the qualitative factors and related adjustments by evaluating trends in the total ALL, including the qualitative factor adjustments, for consistency with trends in loan portfolio growth and credit performance. In addition, we involved credit risk professionals with specialized skills and knowledge who assisted in evaluating: • the Company’s ALL methodology for compliance with U.S. generally accepted accounting principles • the appropriateness of the method used to develop the formula allowances, including relevance and reliability of inputs used to develop the loss emergence period assumptions 2
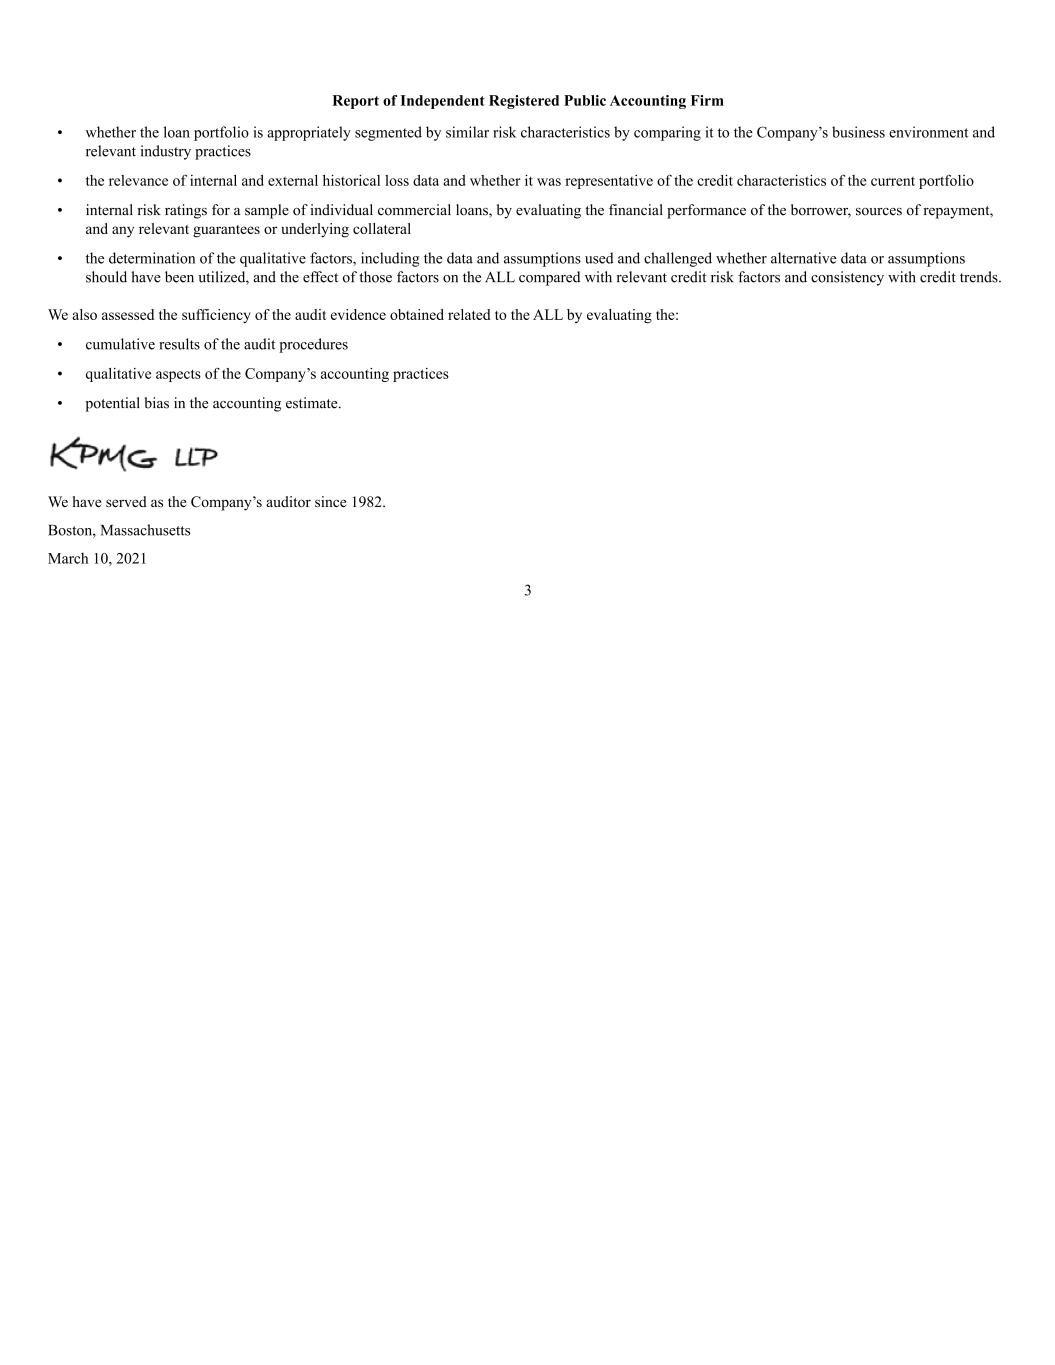
Report of Independent Registered Public Accounting Firm • whether the loan portfolio is appropriately segmented by similar risk characteristics by comparing it to the Company’s business environment and relevant industry practices • the relevance of internal and external historical loss data and whether it was representative of the credit characteristics of the current portfolio • internal risk ratings for a sample of individual commercial loans, by evaluating the financial performance of the borrower, sources of repayment, and any relevant guarantees or underlying collateral • the determination of the qualitative factors, including the data and assumptions used and challenged whether alternative data or assumptions should have been utilized, and the effect of those factors on the ALL compared with relevant credit risk factors and consistency with credit trends. We also assessed the sufficiency of the audit evidence obtained related to the ALL by evaluating the: • cumulative results of the audit procedures • qualitative aspects of the Company’s accounting practices • potential bias in the accounting estimate. We have served as the Company’s auditor since 1982. Boston, Massachusetts March 10, 2021 3

Consolidated Balance Sheets December 31, 2020 2019 (dollars in thousands except share data) ASSETS Cash and due from banks (Note 2) $ 136,735 $ 44,420 Federal funds sold and interest-bearing deposits in other banks 237,265 214,273 Total cash and cash equivalents 374,000 258,693 Securities available-for-sale, amortized cost $282,273 in 2020 and $260,924 in 2019 (Notes 3, 9 and 11) 282,448 260,502 Securities held-to-maturity, fair value $2,579,103 in 2020 and $2,361,304 in 2019 (Notes 4 and 11) 2,509,088 2,351,120 Federal Home Loan Bank of Boston, stock at cost 13,361 19,471 Equity securities, cost $1,635 in 2020 and $1,635 in 2019, respectively 1,668 1,688 Loans, net (Note 5) 2,995,829 2,426,119 Less: allowance for loan losses (Note 6) 35,486 29,585 Net loans 2,960,343 2,396,534 Bank premises and equipment (Note 7) 39,062 33,952 Accrued interest receivable 13,283 13,110 Other assets (Notes 5, 6, 8, 16, 17, 23) 165,581 157,354 Total assets $6,358,834 $5,492,424 LIABILITIES AND STOCKHOLDERS’ EQUITY Demand deposits $1,103,878 $ 712,842 Savings and NOW deposits 1,728,092 1,678,250 Money market accounts 2,074,108 1,453,572 Time deposits (Note 10) 546,143 555,447 Total deposits 5,452,221 4,400,111 Securities sold under agreements to repurchase (Note 11) 232,090 266,045 Other borrowed funds (Note 12) 177,009 370,955 Subordinated debentures (Note 12) 36,083 36,083 Other liabilities (Note 17) 91,022 86,649 Total liabilities 5,988,425 5,159,843 Commitments and contingencies (Notes 18 and 19) Stockholders’ equity (Note 15): Preferred Stock—$1.00 par value; 100,000 shares authorized; no shares issued and outstanding — — Common stock, Class A, $1.00 par value per share; authorized 10,000,000 shares; issued 3,655,469 shares in 2020 and 3,650,949 shares in 2019 3,656 3,651 Common stock, Class B, $1.00 par value per share; authorized 5,000,000 shares; issued 1,912,440 in 2020 and 1,916,960 shares in 2019 1,912 1,917 Additional paid-in capital 12,292 12,292 Retained earnings 378,699 338,980 396,559 356,840 Unrealized gains (losses) on securities available-for-sale, net of taxes 130 (308) Unrealized losses on securities transferred to held-to-maturity, net of taxes (1,221) (1,812) Pension liability, net of taxes (25,059) (22,139) Total accumulated other comprehensive loss, net of taxes (Notes 3, 13 and 15) (26,150) (24,259) Total stockholders’ equity 370,409 332,581 Total liabilities and stockholders’ equity $6,358,834 $5,492,424 See accompanying “Notes to Consolidated Financial Statements.” 4
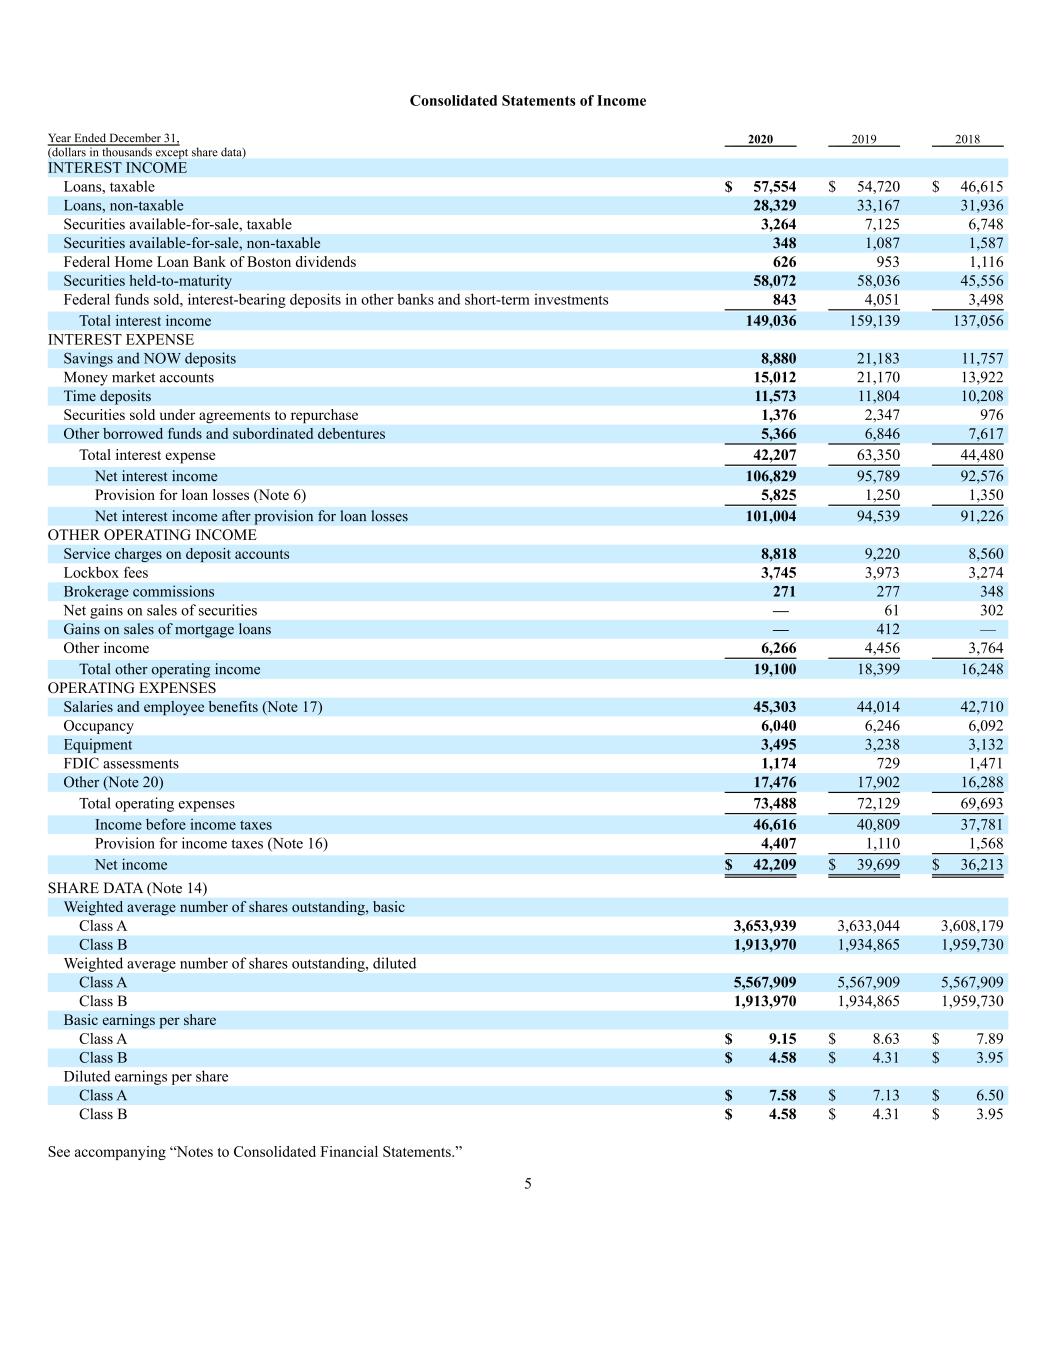
Consolidated Statements of Income Year Ended December 31, 2020 2019 2018 (dollars in thousands except share data) INTEREST INCOME Loans, taxable $ 57,554 $ 54,720 $ 46,615 Loans, non-taxable 28,329 33,167 31,936 Securities available-for-sale, taxable 3,264 7,125 6,748 Securities available-for-sale, non-taxable 348 1,087 1,587 Federal Home Loan Bank of Boston dividends 626 953 1,116 Securities held-to-maturity 58,072 58,036 45,556 Federal funds sold, interest-bearing deposits in other banks and short-term investments 843 4,051 3,498 Total interest income 149,036 159,139 137,056 INTEREST EXPENSE Savings and NOW deposits 8,880 21,183 11,757 Money market accounts 15,012 21,170 13,922 Time deposits 11,573 11,804 10,208 Securities sold under agreements to repurchase 1,376 2,347 976 Other borrowed funds and subordinated debentures 5,366 6,846 7,617 Total interest expense 42,207 63,350 44,480 Net interest income 106,829 95,789 92,576 Provision for loan losses (Note 6) 5,825 1,250 1,350 Net interest income after provision for loan losses 101,004 94,539 91,226 OTHER OPERATING INCOME Service charges on deposit accounts 8,818 9,220 8,560 Lockbox fees 3,745 3,973 3,274 Brokerage commissions 271 277 348 Net gains on sales of securities — 61 302 Gains on sales of mortgage loans — 412 — Other income 6,266 4,456 3,764 Total other operating income 19,100 18,399 16,248 OPERATING EXPENSES Salaries and employee benefits (Note 17) 45,303 44,014 42,710 Occupancy 6,040 6,246 6,092 Equipment 3,495 3,238 3,132 FDIC assessments 1,174 729 1,471 Other (Note 20) 17,476 17,902 16,288 Total operating expenses 73,488 72,129 69,693 Income before income taxes 46,616 40,809 37,781 Provision for income taxes (Note 16) 4,407 1,110 1,568 Net income $ 42,209 $ 39,699 $ 36,213 SHARE DATA (Note 14) Weighted average number of shares outstanding, basic Class A 3,653,939 3,633,044 3,608,179 Class B 1,913,970 1,934,865 1,959,730 Weighted average number of shares outstanding, diluted Class A 5,567,909 5,567,909 5,567,909 Class B 1,913,970 1,934,865 1,959,730 Basic earnings per share Class A $ 9.15 $ 8.63 $ 7.89 Class B $ 4.58 $ 4.31 $ 3.95 Diluted earnings per share Class A $ 7.58 $ 7.13 $ 6.50 Class B $ 4.58 $ 4.31 $ 3.95 See accompanying “Notes to Consolidated Financial Statements.” 5

Consolidated Statements of Comprehensive Income Year Ended December 31, 2020 2019 2018 (dollars in thousands) NET INCOME $42,209 $39,699 $36,213 Other comprehensive income (loss), net of tax: Unrealized gains (losses) on securities: Unrealized holding gains (losses) arising during period 438 (270) 326 Less: reclassification adjustment for gains included in net income — (44) (217) Total unrealized gains (losses) on securities 438 (314) 109 Accretion of net unrealized losses transferred during period 591 753 1,086 Defined benefit pension plans: Pension liability adjustment, net of tax: Net (loss) gain (4,361) (6,842) 3,770 Amortization of prior service cost and loss included in net periodic benefit cost 1,441 1,053 1,167 Total pension liability adjustment (2,920) (5,789) 4,937 Other comprehensive (loss) income (1,891) (5,350) 6,132 Comprehensive income $40,318 $34,349 $42,345 See accompanying “Notes to Consolidated Financial Statements.” 6

Consolidated Statements of Changes in Stockholders’ Equity Class A Common Stock Class B Common Stock Additional Paid-in Capital Retained Earnings Accumulated Other Comprehensive Loss Total Stockholders’ Equity (dollars in thousands except share data) BALANCE, DECEMBER 31, 2017 $ 3,606 $ 1,962 $ 12,292 $263,666 $ (21,229) $ 260,297 Net income — — — 36,213 — 36,213 Other comprehensive income, net of tax: Unrealized holding gains arising during period, net of $16 in taxes and $302 in realized net gains — — — — 109 109 Accretion of net unrealized losses transferred during the period, net of $391 in taxes — — — — 1,086 1,086 Pension liability adjustment, net of $1,930 in taxes — — — — 4,937 4,937 Adoption of ASU 2018-2, Income Statement-Reporting Comprehensive Income (Topic 220)-Reclassification of Certain Tax Effects from AOCI — — — 3,783 (3,783) — Adoption of ASU 2016-1, Financial Instruments-Overall (Subtopic 825-10) Recognition and Measurement of Financial Assets and Financial Liabilities — — — 29 (29) — Conversion of Class B Common Stock to Class A Common Stock, 2,500 shares 2 (2) — — — — Cash dividends, Class A Common Stock, $0.48 per share — — — (1,732) — (1,732) Cash dividends, Class B Common Stock, $0.24 per share — — — (471) — (471) BALANCE, DECEMBER 31, 2018 $ 3,608 $ 1,960 $ 12,292 $301,488 $ (18,909) $ 300,439 Net income — — — 39,699 — 39,699 Other comprehensive income, net of tax: Unrealized holding gains arising during period, net of $116 in taxes and $61 in realized net gains — — — — (314) (314) Accretion of net unrealized losses transferred during the period, net of $269 in taxes — — — — 753 753 Pension liability adjustment, net of $2,263 in taxes — — — — (5,789) (5,789) Conversion of Class B Common Stock to Class A Common Stock, 42,620 shares 43 (43) — — — — Cash dividends, Class A Common Stock, $0.48 per share — — — (1,742) — (1,742) Cash dividends, Class B Common Stock, $0.24 per share — — — (465) — (465) BALANCE, DECEMBER 31, 2019 $ 3,651 $ 1,917 $ 12,292 338,980 (24,259) $ 332,581 Net income — — — 42,209 — 42,209 Other comprehensive income, net of tax: Unrealized holding gains arising during period, net of $159 in taxes — — — — 438 438 Accretion of net unrealized losses transferred during the period, net of $207 in taxes — — — — 591 591 Pension liability adjustment, net of $1,142 in taxes — — — — (2,920) (2,920) Conversion of Class B Common Stock to Class A Common Stock, 4,520 shares 5 (5) — — — — Cash dividends, Class A Common Stock, $0.54 per share — — — (1,973) — (1,973) Cash dividends, Class B Common Stock, $0.27 per share — — — (517) — (517) BALANCE, DECEMBER 31, 2020 $ 3,656 $ 1,912 $ 12,292 $378,699 $ (26,150) $ 370,409 See accompanying “Notes to Consolidated Financial Statements.” 7

Consolidated Statements of Cash Flows Year Ended December 31, 2020 2019 2018 (dollars in thousands) CASH FLOWS FROM OPERATING ACTIVITIES: Net income $ 42,209 $ 39,699 $ 36,213 Adjustments to reconcile net income to net cash provided by operating activities: Gain on sales of portfolio loans — (412) — Loss on sales of other real estate owned — 79 — Net gains on sales of securities — (61) (302) Net (gain) loss on equity securities 20 (92) 67 Provision for loan losses 5,825 1,250 1,350 Deferred tax (expense) benefit (1,089) (2,135) (1,766) Net depreciation and amortization (1,070) (2,382) 885 (Increase) decrease in accrued interest receivable (173) 1,296 (3,227) Decrease in other assets (413) 8,532 2,326 (Decrease) increase in other liabilities (934) 2,075 5,242 Net cash provided by operating activities 44,375 47,849 40,788 CASH FLOWS FROM INVESTING ACTIVITIES: Proceeds from redemptions of Federal Home Loan Bank of Boston stock 10,836 14,380 18,388 Purchase of Federal Home Loan Bank of Boston stock (4,726) (15,877) (14,583) Proceeds from calls/maturities of securities available-for-sale 86,691 144,739 215,406 Proceeds from sales of securities available-for-sale — 16,285 27,517 Purchase of securities available-for-sale (107,744) (85,123) (183,588) Proceeds from calls/maturities of securities held-to-maturity 902,981 458,915 234,741 Proceeds from sales of securities held-to-maturity — 1,193 — Purchase of securities held-to-maturity (1,056,023) (757,997) (576,140) Proceeds from life insurance policies 3,900 5,461 375 Proceeds from sales of portfolio loans — 22,120 — Net increase in loans (569,595) (162,415) (110,874) Bank owned life insurance purchases (8,731) (33,664) — Proceeds from sales of other real estate owned — 2,146 — Capital expenditures (8,376) (13,144) (3,601) Net cash used in investing activities (750,787) (402,981) (392,359) CASH FLOWS FROM FINANCING ACTIVITIES: Net decrease in time deposit accounts (9,304) (5,132) (64,782) Net increase (decrease) in demand, savings, money market and NOW deposits 1,061,414 (1,721) 554,779 Cash dividends (2,490) (2,207) (2,203) Net (decrease) increase in securities sold under agreements to repurchase (33,955) 111,805 (4,750) Net (decrease) increase in other borrowed funds (193,946) 168,577 (145,400) Net cash provided by financing activities 821,719 271,322 337,644 Net increase (decrease) in cash and cash equivalents 115,307 (83,810) (13,927) Cash and cash equivalents at beginning of year 258,693 342,503 356,430 Cash and cash equivalents at end of year $ 374,000 $ 258,693 $ 342,503 SUPPLEMENTAL DISCLOSURES OF CASH FLOW INFORMATION: Cash paid (received) during the year for: Interest $ 42,655 $ 63,345 $ 44,289 Income taxes $ 4,300 $ (6,504) $ 590 Change in unrealized losses on securities available-for-sale, net of taxes $ 438 $ (314) $ 109 Change in unrealized losses on securities transferred to held-to-maturity, net of taxes $ 591 $ 753 $ 1,086 Pension liability adjustment, net of taxes $ (2,920) $ (5,789) $ 4,937 Transfer of loans to other real estate owned $ — $ — $ 2,225 See accompanying “Notes to Consolidated Financial Statements.” 8
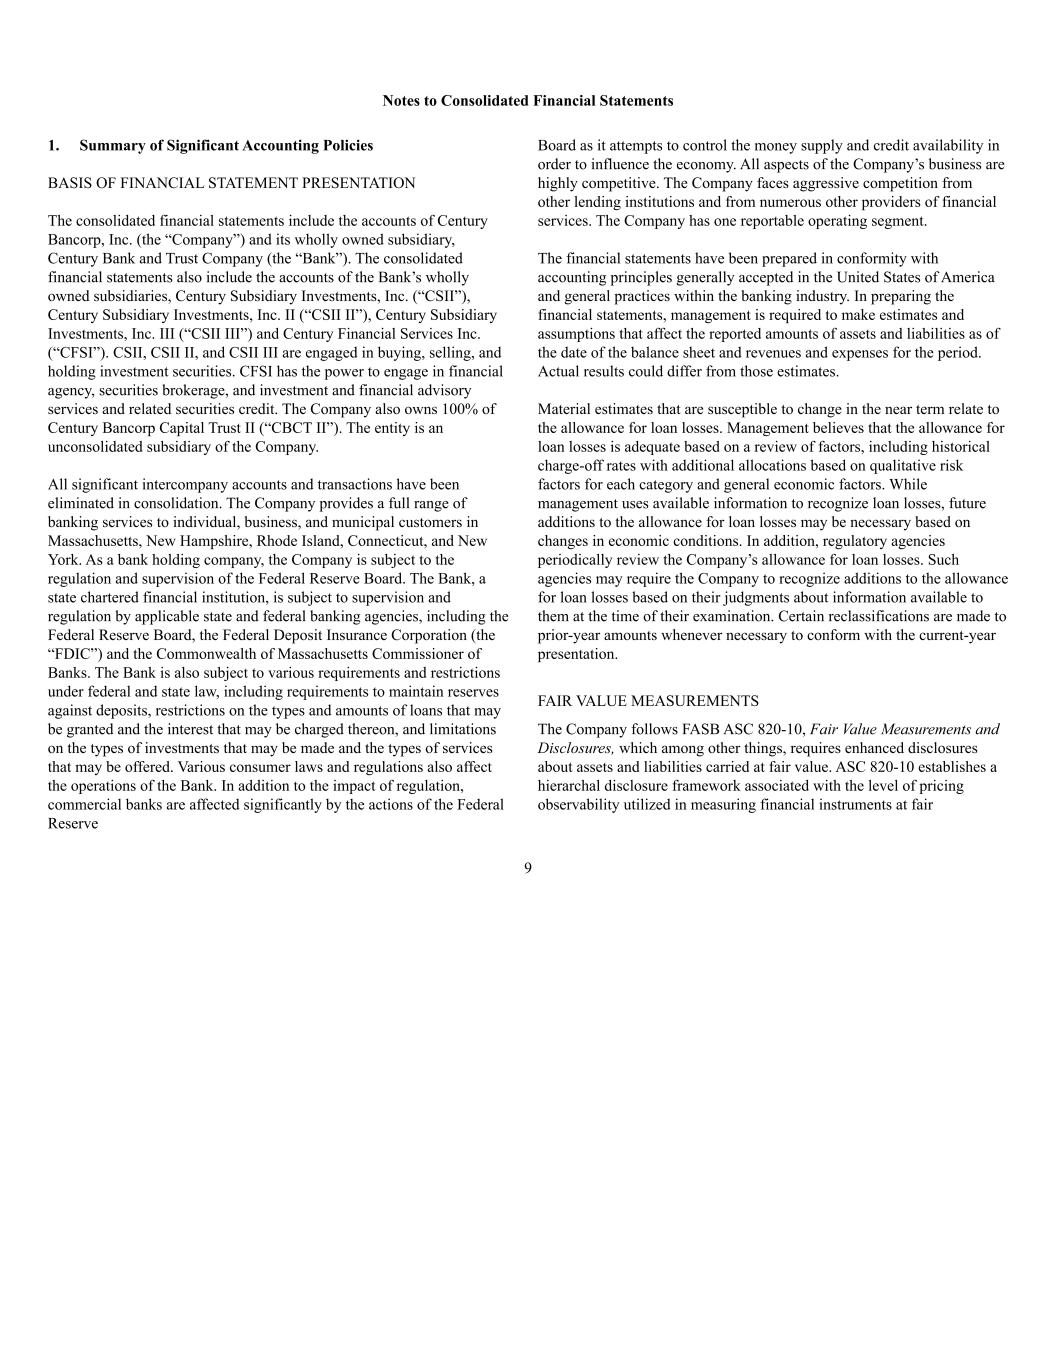
Notes to Consolidated Financial Statements 9 1. Summary of Significant Accounting Policies BASIS OF FINANCIAL STATEMENT PRESENTATION The consolidated financial statements include the accounts of Century Bancorp, Inc. (the “Company”) and its wholly owned subsidiary, Century Bank and Trust Company (the “Bank”). The consolidated financial statements also include the accounts of the Bank’s wholly owned subsidiaries, Century Subsidiary Investments, Inc. (“CSII”), Century Subsidiary Investments, Inc. II (“CSII II”), Century Subsidiary Investments, Inc. III (“CSII III”) and Century Financial Services Inc. (“CFSI”). CSII, CSII II, and CSII III are engaged in buying, selling, and holding investment securities. CFSI has the power to engage in financial agency, securities brokerage, and investment and financial advisory services and related securities credit. The Company also owns 100% of Century Bancorp Capital Trust II (“CBCT II”). The entity is an unconsolidated subsidiary of the Company. All significant intercompany accounts and transactions have been eliminated in consolidation. The Company provides a full range of banking services to individual, business, and municipal customers in Massachusetts, New Hampshire, Rhode Island, Connecticut, and New York. As a bank holding company, the Company is subject to the regulation and supervision of the Federal Reserve Board. The Bank, a state chartered financial institution, is subject to supervision and regulation by applicable state and federal banking agencies, including the Federal Reserve Board, the Federal Deposit Insurance Corporation (the “FDIC”) and the Commonwealth of Massachusetts Commissioner of Banks. The Bank is also subject to various requirements and restrictions under federal and state law, including requirements to maintain reserves against deposits, restrictions on the types and amounts of loans that may be granted and the interest that may be charged thereon, and limitations on the types of investments that may be made and the types of services that may be offered. Various consumer laws and regulations also affect the operations of the Bank. In addition to the impact of regulation, commercial banks are affected significantly by the actions of the Federal Reserve Board as it attempts to control the money supply and credit availability in order to influence the economy. All aspects of the Company’s business are highly competitive. The Company faces aggressive competition from other lending institutions and from numerous other providers of financial services. The Company has one reportable operating segment. The financial statements have been prepared in conformity with accounting principles generally accepted in the United States of America and general practices within the banking industry. In preparing the financial statements, management is required to make estimates and assumptions that affect the reported amounts of assets and liabilities as of the date of the balance sheet and revenues and expenses for the period. Actual results could differ from those estimates. Material estimates that are susceptible to change in the near term relate to the allowance for loan losses. Management believes that the allowance for loan losses is adequate based on a review of factors, including historical charge-off rates with additional allocations based on qualitative risk factors for each category and general economic factors. While management uses available information to recognize loan losses, future additions to the allowance for loan losses may be necessary based on changes in economic conditions. In addition, regulatory agencies periodically review the Company’s allowance for loan losses. Such agencies may require the Company to recognize additions to the allowance for loan losses based on their judgments about information available to them at the time of their examination. Certain reclassifications are made to prior-year amounts whenever necessary to conform with the current-year presentation. FAIR VALUE MEASUREMENTS The Company follows FASB ASC 820-10, Fair Value Measurements and Disclosures, which among other things, requires enhanced disclosures about assets and liabilities carried at fair value. ASC 820-10 establishes a hierarchal disclosure framework associated with the level of pricing observability utilized in measuring financial instruments at fair

Notes to Consolidated Financial Statements 10 value. The three broad levels of the hierarchy are as follows: Level I—Quoted prices are available in active markets for identical assets or liabilities as of the reported date. The type of financial instruments included in Level I are highly liquid cash instruments with quoted prices, such as listed equities and money market securities, as well as listed derivative instruments. Level II—Pricing inputs are other than quoted prices in active markets, which are either directly or indirectly observable as of the reported date. The nature of these financial instruments includes cash instruments for which quoted prices are available but traded less frequently, derivative instruments whose fair value has been derived using a model where inputs to the model are directly observable in the market or can be derived principally from or corroborated by observable market data, and instruments that are fair valued using other financial instruments, the parameters of which can be directly observed. Instruments that are generally included in this category are G-7 government, agency securities, corporate bonds and loans, mortgage whole loans, municipal bonds and over the counter (“OTC”) derivatives. Level III—These instruments have little to no pricing observability as of the reported date. These financial instruments do not have two-way markets and are measured using management’s best estimate of fair value, where the inputs into the determination of fair value require significant management judgment or estimation. Instruments that are included in this category generally include certain commercial mortgage loans, certain private equity investments, distressed debt, and noninvestment grade residual interests in securitizations as well as certain highly structured OTC derivative contracts. CASH AND CASH EQUIVALENTS For purposes of reporting cash flows, cash equivalents include highly liquid assets with an original maturity of three months or less. Highly liquid assets include cash and due from banks, federal funds sold and certificates of deposit. INVESTMENT SECURITIES Debt securities that the Company has the positive intent and ability to hold to maturity are classified as held-to-maturity and reported at amortized cost; debt securities that are bought and held principally for the purpose of selling are classified as trading and reported at fair value, with unrealized gains and losses included in earnings; and debt securities not classified as either held-to-maturity or trading are classified as available-for-sale and reported at fair value, with unrealized gains and losses excluded from earnings and reported as a separate component of stockholders’ equity, net of estimated related income taxes. Equity securities are reported at fair value with unrealized gains and losses included in earnings. The Company has no securities held for trading. Premiums and discounts on investment securities are amortized or accreted into income by use of the level-yield method. Gains and losses on the sale of investment securities are recognized on the trade date on a specific identification basis. Management also considers the Company’s capital adequacy, interest-rate risk, liquidity, and business plans in assessing whether it is more likely than not that the Company will sell or be required to sell the investment securities before recovery. Other-than-temporary-impairment (OTTI) arises when a security’s fair value is less than its amortized cost and, based on specific factors, the loss is considered OTTI. If the Company determines that a decline in fair value is OTTI and that it is more likely than not that the Company will not sell or be required to sell the investment security before recovery of its amortized cost, the credit portion of the impairment loss is recognized in the Company’s consolidated statement of income and the noncredit portion is recognized in accumulated other comprehensive income. The credit portion of the OTTI impairment represents the difference between the amortized cost and the present value of the expected future cash flows of the investment security. If the Company determines that a decline in fair value is OTTI and it is more likely than not that it will sell or be required to sell the investment security before recovery of its amortized cost, the entire difference between the amortized cost and the fair value of the security will be recognized in the Company’s consolidated statement of income.

Notes to Consolidated Financial Statements 11 The transfer of a security between categories of investments shall be accounted for at fair value. For a debt security transferred into the held-to-maturity category from the available-for-sale category, the unrealized holding gain or loss at the date of the transfer shall continue to be reported in a separate component of shareholders’ equity but shall be amortized over the remaining life of the security as an adjustment of yield in a manner consistent with the amortization of any premium or discount. The amortization of an unrealized holding gain, or loss reported in equity will offset or mitigate the effect on interest income of the amortization of the premium or discount for that held-to-maturity security. The sale of a security held-to-maturity may occur after a substantial portion (at least 85%) of the principal outstanding at acquisition has been paid. This may be due either to prepayments on the debt security or to scheduled payments on the debt security that is payable in equal installments over its term. For variable rate securities, the scheduled payments need not be equal. FEDERAL HOME LOAN BANK STOCK The Bank, as a member of the Federal Home Loan Bank of Boston (“FHLBB”), is required to maintain an investment in capital stock of the FHLBB. Based on redemption provisions, the stock has no quoted market value and is carried at cost. At its discretion, the FHLBB may declare dividends on the stock. The Company reviews for impairment based on the ultimate recoverability of the cost basis of the stock. As of December 31, 2020, no impairment has been recognized. LOANS HELD FOR SALE Loans originated and intended for sale in the secondary market are carried at the lower of cost or estimated fair value in the aggregate. Net unrealized losses, if any, are recognized through a valuation allowance by charges to income. LOANS Loans are stated at the principal amount outstanding, net of amounts charged off, unamortized premiums or discounts, and deferred loan fees or costs. Interest on loans is recognized based on the daily principal amount outstanding. Accrual of interest is discontinued when loans become ninety days delinquent unless the collateral is sufficient to cover both principal and interest and the loan is in the process of collection. Past-due status is based on contractual terms of the loan. Loans, including impaired loans, on which the accrual of interest has been discontinued, are designated nonaccrual loans. When a loan is placed on nonaccrual, all income that has been accrued but remains unpaid is reversed against current period income, and all amortization of deferred loan costs and fees is discontinued. Nonaccrual loans may be returned to an accrual status when principal and interest payments are not delinquent, or the risk characteristics of the loan have improved to the extent that there no longer exists a concern as to the collectibility of principal and interest. Income received on nonaccrual loans is either recorded in income or applied to the principal balance of the loan, depending on management’s evaluation as to the collectibility of principal. Loan origination fees and related direct loan origination costs are offset, and the resulting net amount is deferred and amortized over the life of the related loans using the level-yield method. Prepayments are not initially considered when amortizing premiums and discounts. The Bank measures impairment for impaired loans at either the fair value of the loan, the present value of the expected future cash flows discounted at the loan’s effective interest rate or the fair value of the collateral if the loan is collateral dependent. This method applies to all loans, uncollateralized as well as collateralized, except large groups of smaller- balance homogeneous loans such as residential real estate and consumer loans that are collectively evaluated for impairment. For collateral dependent loans, the amount of the recorded investment in a loan that exceeds the fair value of the collateral is charged-off against the allowance for loan losses in lieu of an allocation of a specific allowance when such an amount has been identified definitively as
Notes to Consolidated Financial Statements 12 uncollectible. Management considers the payment status, net worth and earnings potential of the borrower, and the value and cash flow of the collateral as factors to determine if a loan will be paid in accordance with its contractual terms. Management does not set any minimum delay of payments as a factor in reviewing for impaired classification. Loans are charged-off when management believes that the collectibility of the loan’s principal is not probable. The specific factors that management considers in making the determination that the collectibility of the loan’s principal is not probable include the delinquency status of the loan, the fair value of the collateral, if secured, and the financial strength of the borrower and/or guarantors. In addition, criteria for classification of a loan as in-substance foreclosure has been modified so that such classification need be made only when a lender is in possession of the collateral. The Bank measures the impairment of troubled debt restructurings using the pre-modification effective rate of interest. TRANSFERS OF FINANCIAL ASSETS Transfers of financial assets, typically residential mortgages, and loan participations for the Company, are accounted for as sales when control over the assets has been surrendered. Control over transferred assets is deemed to be surrendered when (1) the assets have been isolated from the Company, (2) the transferee obtains the right (free of conditions that constrain it from taking advantage of that right) to pledge or exchange the transferred assets, and (3) the Company does not maintain effective control over the transferred assets. ACQUIRED LOANS In accordance with FASB ASC 310-30, Loans and Debt Securities Acquired with Deteriorated Credit Quality (formerly Statement of Position (“SOP”) No. 03-3, “Accounting for Certain Loans or Debt Securities Acquired in a Transfer”) the Company reviews acquired loans for differences between contractual cash flows and cash flows expected to be collected from the Company’s initial investment in the acquired loans to determine if those differences are attributable, at least in part, to credit quality. If those differences are attributable to credit quality, the loan’s contractually required payments received in excess of the amount of its cash flows expected at acquisition, or nonaccretable discount, is not accreted into income. FASB ASC 310-30 requires that the Company recognize the excess of all cash flows expected at acquisition over the Company’s initial investment in the loan as interest income using the interest method over the term of the loan. This excess is referred to as accretable discount and is recorded as a reduction of the loan balance. Loans which, at acquisition, do not have evidence of deterioration of credit quality since origination are outside the scope of FASB ASC 310-30. For such loans, the discount, if any, representing the excess of the amount of reasonably estimable and probable discounted future cash collections over the purchase price, is accreted into interest income using the interest method over the term of the loan. Prepayments are not considered in the calculation of accretion income. Additionally, the discount is not accreted on nonperforming loans. When a loan is paid off, the excess of any cash received over the net investment is recorded as interest income. In addition to the amount of purchase discount that is recognized at that time, income may include interest owed by the borrower prior to the Company’s acquisition of the loan, interest collected if on nonperforming status, prepayment fees and other loan fees. NONPERFORMING ASSETS In addition to nonperforming loans, nonperforming assets include other real estate owned. Other real estate owned is comprised of properties acquired through foreclosure or acceptance of a deed in lieu of foreclosure. Other real estate owned is recorded initially at the lower of cost or the estimated fair value less costs to sell. When such assets are acquired, the excess of the loan balance over the estimated fair value of the asset is charged to the allowance for loan losses. An allowance for losses on other real estate owned is established by a charge to earnings when, upon periodic evaluation by management, further declines in the estimated fair value of properties have occurred.
Notes to Consolidated Financial Statements 13 Such evaluations are based on an analysis of individual properties as well as a general assessment of current real estate market conditions. Holding costs and rental income on properties are included in current operations, while certain costs to improve such properties are capitalized. Gains and losses from the sale of other real estate owned are reflected in earnings when realized. ALLOWANCE FOR LOAN LOSSES The allowance for loan losses is based on management’s evaluation of the quality of the loan portfolio and is used to provide for losses resulting from loans that ultimately prove uncollectible. The components of the allowance for loan losses represent estimates based upon Accounting Standards Codification (“ASC”) Topic 450, contingencies, and ASC Topic 310 Receivables. ASC Topic 450 applies to homogenous loan pools such as consumer installment, residential mortgages, consumer lines of credit and commercial loans that are not individually evaluated for impairment under ASC Topic 310. In determining the level of the allowance, periodic evaluations are made of the loan portfolio, which takes into account factors such as the characteristics of the loans, loan status, financial strength of the borrowers, value of collateral securing the loans and other relevant information sufficient to reach an informed judgment. The allowance is increased by provisions charged to income and reduced by loan charge-offs, net of recoveries. Management maintains an allowance for loan losses to absorb losses inherent in the loan portfolio. The allowance is based on assessments of the probable estimated losses inherent in the loan portfolio. Management’s methodology for assessing the appropriateness of the allowance consists of several key elements, which include the specific allowances, if appropriate, for identified problem loans, formula allowance, and possibly an unallocated allowance. Arriving at an appropriate level of allowance for loan losses necessarily involves a high degree of judgment. While management uses available information in establishing the allowance for loan losses, future adjustments to the allowance may be necessary if economic conditions differ substantially from the assumptions used in making the evaluations. Loans are charged-off in whole or in part when, in management’s opinion, collectibility is not probable. The specific factors that management considers in making the determination that the collectibility of the loan’s principal is not probable include the delinquency status of the loan, the fair value of the collateral and the financial strength of the borrower and/or guarantors. Under ASC Topic 310, a loan is impaired, based upon current information and in management’s opinion, when it is probable that the loan will not be repaid according to its original contractual terms, including both principal and interest, or if a loan is designated as a Troubled Debt Restructuring (“TDR”). Specific allowances for loan losses entail the assignment of allowance amounts to individual loans on the basis of loan impairment. Under this method, loans are selected for evaluation based upon a change in internal risk rating, occurrence of delinquency, loan classification or nonaccrual status. A specific allowance amount is allocated to an individual loan when such loan has been deemed impaired and when the amount of a probable loss is able to be estimated on the basis of: (a) present value of anticipated future cash flows, (b) the loan’s observable fair market price or (c) fair value of collateral if the loan is collateral dependent. For collateral dependent loans, the amount of the recorded investment in a loan that exceeds the fair value of the collateral is charged-off against the allowance for loan losses in lieu of an allocation of a specific allowance when such an amount has been identified definitively as uncollectible. In estimating probable loan loss under ASC Topic 450, management considers numerous factors, including historical charge-offs and subsequent recoveries. The formula allowances are based on evaluations of homogenous loans to determine the allocation appropriate within each portfolio segment. Formula allowances are based on internal risk ratings or credit ratings from external sources. Individual loans within the commercial and industrial, commercial real estate and real estate construction loan portfolio segments are assigned internal risk ratings to group them with other loans possessing similar risk characteristics. Changes in risk grades affect the amount of the formula allowance. Risk
Notes to Consolidated Financial Statements 14 grades are determined by reviewing current collateral value, financial information, cash flow, payment history and other relevant facts surrounding the particular credit. On these loans, the formula allowances are based on the risk ratings, the historical loss experience, and the loss emergence period. Historical loss data and loss emergence periods are developed based on the Company’s historical experience. For larger loans with available external credit ratings, these ratings are utilized rather than the Company’s risk ratings. The historical loss factor and loss emergence periods for these loans are based on data published by the rating agencies for similar credits as the Company has limited internal historical data. For the residential real estate and consumer loan portfolios, the formula allowances are calculated by applying historical loss experience and the loss emergence period to the outstanding balance in each loan category. Loss factors and loss emergence periods are based on the Company’s historical net loss experience. Additional allowances are added to portfolio segments based on qualitative factors. Management considers potential factors identified in regulatory guidance. Management has identified certain qualitative factors, which could impact the degree of loss sustained within the portfolio. These include market risk factors and unique portfolio risk factors that are inherent characteristics of the Company’s loan portfolio. Market risk factors may consist of changes to general economic and business conditions, such as unemployment and GDP that may impact the Company’s loan portfolio customer base in terms of ability to repay and that may result in changes in value of underlying collateral. Unique portfolio risk factors may include the outlooks for business segments in which the Company’s borrowers operate and loan size. The potential ranges for qualitative factors are based on historical volatility in losses. The actual amount utilized is based on management’s assessment of current conditions. After considering the above components, an unallocated component may be generated to cover uncertainties that could affect management’s estimate of probable losses. These uncertainties include the effects of loans in new geographical areas and new industries. The unallocated component of the allowance reflects the margin of imprecision inherent in the underlying assumptions used in the methodologies for estimating allocated and general reserves in the portfolio. BANK PREMISES AND EQUIPMENT Bank premises and equipment are stated at cost less accumulated depreciation and amortization. Land is stated at cost. Depreciation is computed using the straight-line method over the estimated useful lives of the assets or the terms of leases, if shorter. It is general practice to charge the cost of maintenance and repairs to operations when incurred; major expenditures for improvements are capitalized and depreciated. GOODWILL AND IDENTIFIABLE INTANGIBLE ASSETS Goodwill represents the excess of the cost of an acquisition over the fair value of the net assets acquired. Goodwill is not subject to amortization. Identifiable intangible assets consist of core deposit intangibles and are assets resulting from acquisitions that are being amortized over their estimated useful lives. Goodwill and identifiable intangible assets are included in other assets on the consolidated balance sheets. The Company tests goodwill for impairment on an annual basis, or more often if events or circumstances indicate there may be impairment. Goodwill impairment testing is performed at the segment (or “reporting unit”) level. Currently, the Company’s goodwill is evaluated at the entity level as there is only one reporting unit. Goodwill is assigned to reporting units at the date the goodwill is initially recorded. Once goodwill has been assigned to reporting units, it no longer retains its association with a particular acquisition, and all of the activities within a reporting unit, whether acquired or organically grown, are available to support the value of the goodwill. Goodwill impairment is evaluated by first assessing qualitative factors (events and circumstances) to determine whether it is more likely than not (meaning a likelihood of more than 50 percent) that the fair value of a reporting unit is less than its carrying amount. If, after considering all relevant events and circumstances, an entity determines it is not more
Notes to Consolidated Financial Statements 15 likely than not that the fair value of a reporting unit is less than its carrying amount, then performing the quantitative impairment test will be unnecessary. The quantitative impairment test, used to identify potential impairment, involves comparing each reporting unit’s fair value to its carrying value including goodwill. If the fair value of a reporting unit exceeds its carrying value, applicable goodwill is considered not to be impaired. If the carrying value exceeds fair value, the difference is recorded as impairment. SERVICING The Company services mortgage loans for others. Mortgage servicing assets are recognized as separate assets when rights are acquired through purchase or through sale of financial assets. Fair value is determined using prices for similar assets with similar characteristics, when available, or based upon discounted cash flows using market-based assumptions. The valuation model incorporates assumptions that market participants would use in estimating future net servicing income, such as the cost to service, the discount rate, an inflation rate, ancillary income, prepayment speeds and default rates and losses. Capitalized servicing rights are reported in other assets and are amortized into loan servicing fee income in proportion to, and over the period of, the estimated future net servicing income of the underlying financial assets. Servicing assets are evaluated for impairment based upon the fair value of the rights as compared to amortized cost. Impairment is determined by stratifying rights by predominant risk characteristics, such as interest rates and terms. Impairment is recognized through a valuation allowance for an individual stratum, to the extent that fair value is less than the capitalized amount for the stratum. Changes in the valuation allowance are reported in loan servicing fee income. INCOME TAXES The Company uses the asset and liability method in accounting for income taxes. Under the asset and liability method, deferred tax assets and liabilities are recognized for the future tax consequences attributable to differences between the financial statement carrying amounts of existing assets and liabilities and their respective tax bases. Deferred tax assets and liabilities are measured using enacted tax rates expected to apply to taxable income in the years in which temporary differences are expected to be recovered or settled. Under this method, the effect on deferred tax assets and liabilities of a change in tax rates is recognized in income in the period that includes the enactment date. The Company accounts for uncertain tax positions in accordance with FASB ASC 740. The Company classifies interest resulting from underpayment of income taxes as income tax expense in the first period the interest would begin accruing according to the provisions of the relevant tax law. The Company classifies penalties resulting from underpayment of income taxes as income tax expense in the period for which the Company claims or expects to claim an uncertain tax position or in the period in which the Company’s judgment changes regarding an uncertain tax position. Also, for tax years beginning after December 31, 2017, the corporate Alternative Minimum Tax (“AMT”) has been repealed. For 2018 through 2021, the AMT credit carryforward can offset regular tax liability and is refundable in an amount equal to 50% (100% for 2021) of the excess of the minimum tax credit for the tax year over the amount of the credit allowable for the year against regular tax liability. On March 27, 2020, the Coronavirus Aid, Relief and Economic Security (CARES) Act was signed into law. As a result of the CARES Act, the full balance of the AMT credit was refunded during 2020. The Tax Act also contains other provisions that may affect the Company currently or in future years. Among these are changes to the deductibility of meals and entertainment, the deductibility of executive compensation, the dividend received deduction and net operating loss carryforwards. Tax Act changes for individuals include lower tax rates, mortgage interest and state and local tax limitations as well as an increase in the standard deduction, among others.
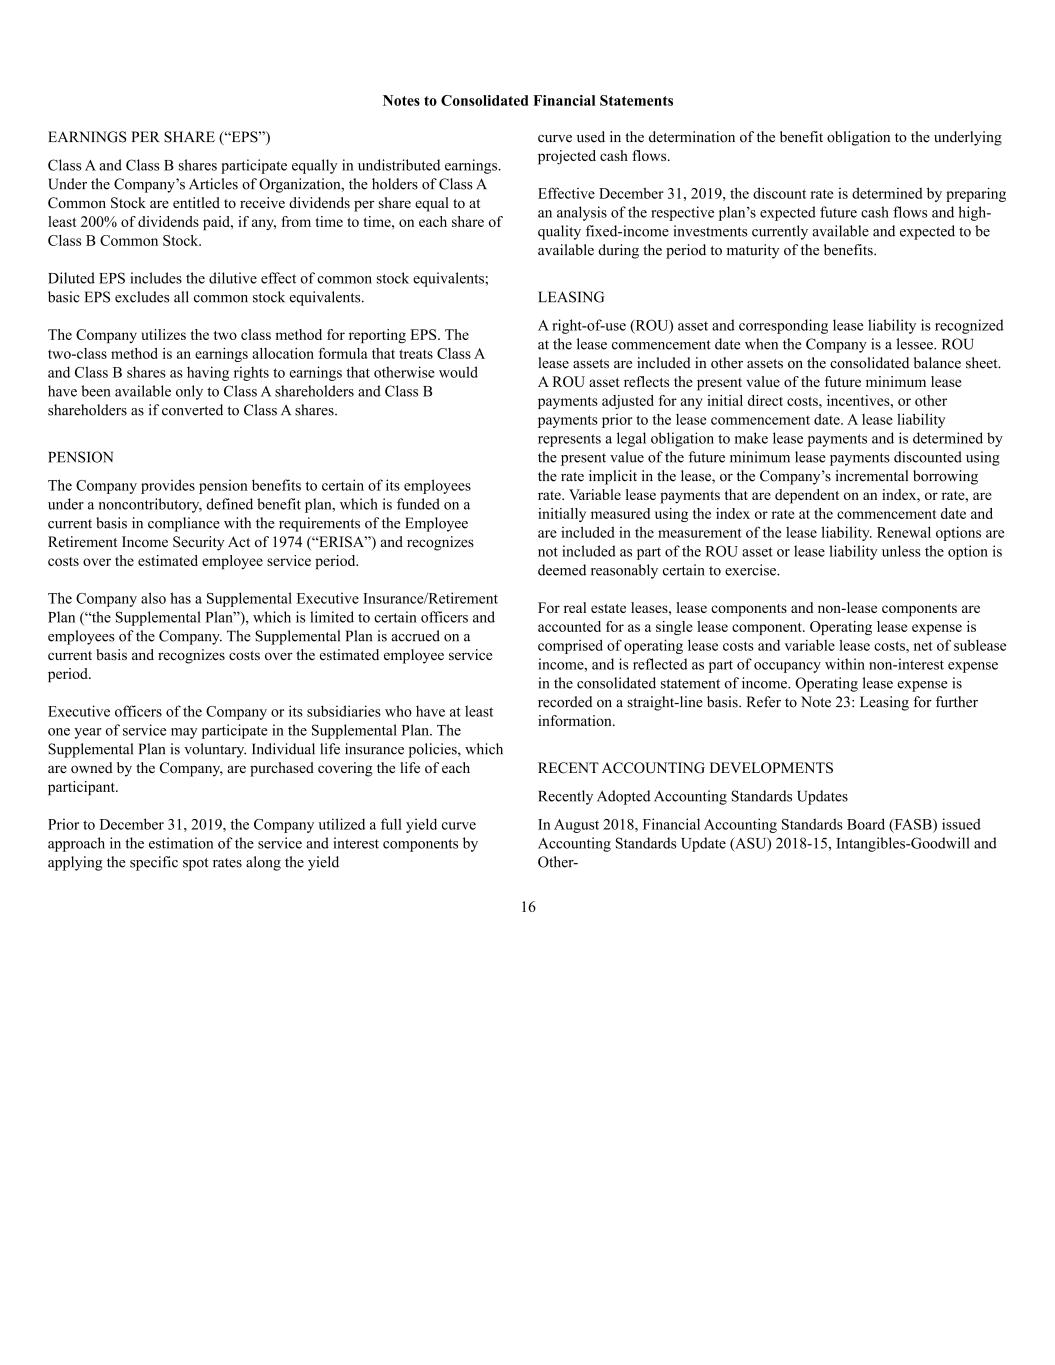
Notes to Consolidated Financial Statements 16 EARNINGS PER SHARE (“EPS”) Class A and Class B shares participate equally in undistributed earnings. Under the Company’s Articles of Organization, the holders of Class A Common Stock are entitled to receive dividends per share equal to at least 200% of dividends paid, if any, from time to time, on each share of Class B Common Stock. Diluted EPS includes the dilutive effect of common stock equivalents; basic EPS excludes all common stock equivalents. The Company utilizes the two class method for reporting EPS. The two-class method is an earnings allocation formula that treats Class A and Class B shares as having rights to earnings that otherwise would have been available only to Class A shareholders and Class B shareholders as if converted to Class A shares. PENSION The Company provides pension benefits to certain of its employees under a noncontributory, defined benefit plan, which is funded on a current basis in compliance with the requirements of the Employee Retirement Income Security Act of 1974 (“ERISA”) and recognizes costs over the estimated employee service period. The Company also has a Supplemental Executive Insurance/Retirement Plan (“the Supplemental Plan”), which is limited to certain officers and employees of the Company. The Supplemental Plan is accrued on a current basis and recognizes costs over the estimated employee service period. Executive officers of the Company or its subsidiaries who have at least one year of service may participate in the Supplemental Plan. The Supplemental Plan is voluntary. Individual life insurance policies, which are owned by the Company, are purchased covering the life of each participant. Prior to December 31, 2019, the Company utilized a full yield curve approach in the estimation of the service and interest components by applying the specific spot rates along the yield curve used in the determination of the benefit obligation to the underlying projected cash flows. Effective December 31, 2019, the discount rate is determined by preparing an analysis of the respective plan’s expected future cash flows and high- quality fixed-income investments currently available and expected to be available during the period to maturity of the benefits. LEASING A right-of-use (ROU) asset and corresponding lease liability is recognized at the lease commencement date when the Company is a lessee. ROU lease assets are included in other assets on the consolidated balance sheet. A ROU asset reflects the present value of the future minimum lease payments adjusted for any initial direct costs, incentives, or other payments prior to the lease commencement date. A lease liability represents a legal obligation to make lease payments and is determined by the present value of the future minimum lease payments discounted using the rate implicit in the lease, or the Company’s incremental borrowing rate. Variable lease payments that are dependent on an index, or rate, are initially measured using the index or rate at the commencement date and are included in the measurement of the lease liability. Renewal options are not included as part of the ROU asset or lease liability unless the option is deemed reasonably certain to exercise. For real estate leases, lease components and non-lease components are accounted for as a single lease component. Operating lease expense is comprised of operating lease costs and variable lease costs, net of sublease income, and is reflected as part of occupancy within non-interest expense in the consolidated statement of income. Operating lease expense is recorded on a straight-line basis. Refer to Note 23: Leasing for further information. RECENT ACCOUNTING DEVELOPMENTS Recently Adopted Accounting Standards Updates In August 2018, Financial Accounting Standards Board (FASB) issued Accounting Standards Update (ASU) 2018-15, Intangibles-Goodwill and Other-

Notes to Consolidated Financial Statements 17 Internal Use Software (Subtopic 350-40): Customer’s Accounting for Implementation Costs Incurred in a Cloud Computing Arrangement That Is a Service Contract (a consensus of the FASB Emerging Issues Task Force). The amendments in this ASU align the requirements for capitalizing implementation costs incurred in a hosting arrangement that is a service contract with the requirements for capitalizing implementation costs incurred to develop or obtain internal-use software (and hosting arrangements that include an internal use software license). This ASU is effective for annual reporting periods beginning after December 15, 2019. The effect of this ASU did not have a material impact on the Company’s consolidated financial position. In August 2018, FASB issued ASU 2018-13, Fair Value Measurement (Topic 820), Disclosure Framework-Changes to the Disclosure Requirements for Fair Value. The amendments in this ASU modify the disclosure requirements on fair value measurements in Topic 820, Fair Value Measurement, based on the concepts in the Concepts Statement, including the consideration of costs and benefits. This ASU is effective for annual reporting periods beginning after December 15, 2019. The effect of this update did not have a material impact on the Company’s disclosures. In January 2017, the FASB issued ASU 2017-04, Intangibles—Goodwill and Other (Topic 350). This ASU was issued to simplify the subsequent measurement of goodwill by eliminating Step 2 from the goodwill impairment test. For public entities, this ASU is effective for the fiscal years beginning after December 15, 2019, including interim periods within those fiscal years. Early adoption is permitted, and application should be on a prospective basis. The effect of this update did not have a material impact on the Company’s consolidated financial position. Securities and Exchange Commission (SEC) Ruling: In August 2018, the SEC issued a final rule that amends certain of the Commission’s disclosure requirements “that have become redundant, duplicative, overlapping, outdated, or superseded, in light of other Commission disclosure requirements, U.S. GAAP, or changes in the information environment.” The financial reporting implications of the final rule’s amendments may vary by company, but the changes are generally expected to reduce or eliminate some of an SEC registrant’s disclosure requirements. In limited circumstances, however, the amendments may expand those requirements, including those related to interim disclosures about changes in stockholders’ equity. Under the requirements, registrants must now analyze changes in stockholders’ equity, in the form of a reconciliation, for “the current and comparative year-to-date periods, with subtotals for each interim period.” Beginning with its March 31, 2019 filing, the Company included a reconciliation for the current quarter and year-to-date interim periods as well as the comparative periods of the prior years (i.e., a reconciliation covering each period for which an income statement is presented). 2. Cash and Due from Banks The Company is required to maintain a portion of its cash and due from banks as a reserve balance under the Federal Reserve Act. Such reserve is calculated based upon deposit levels and amounted to $0 at December 31, 2020, and $0 at December 31, 2019.
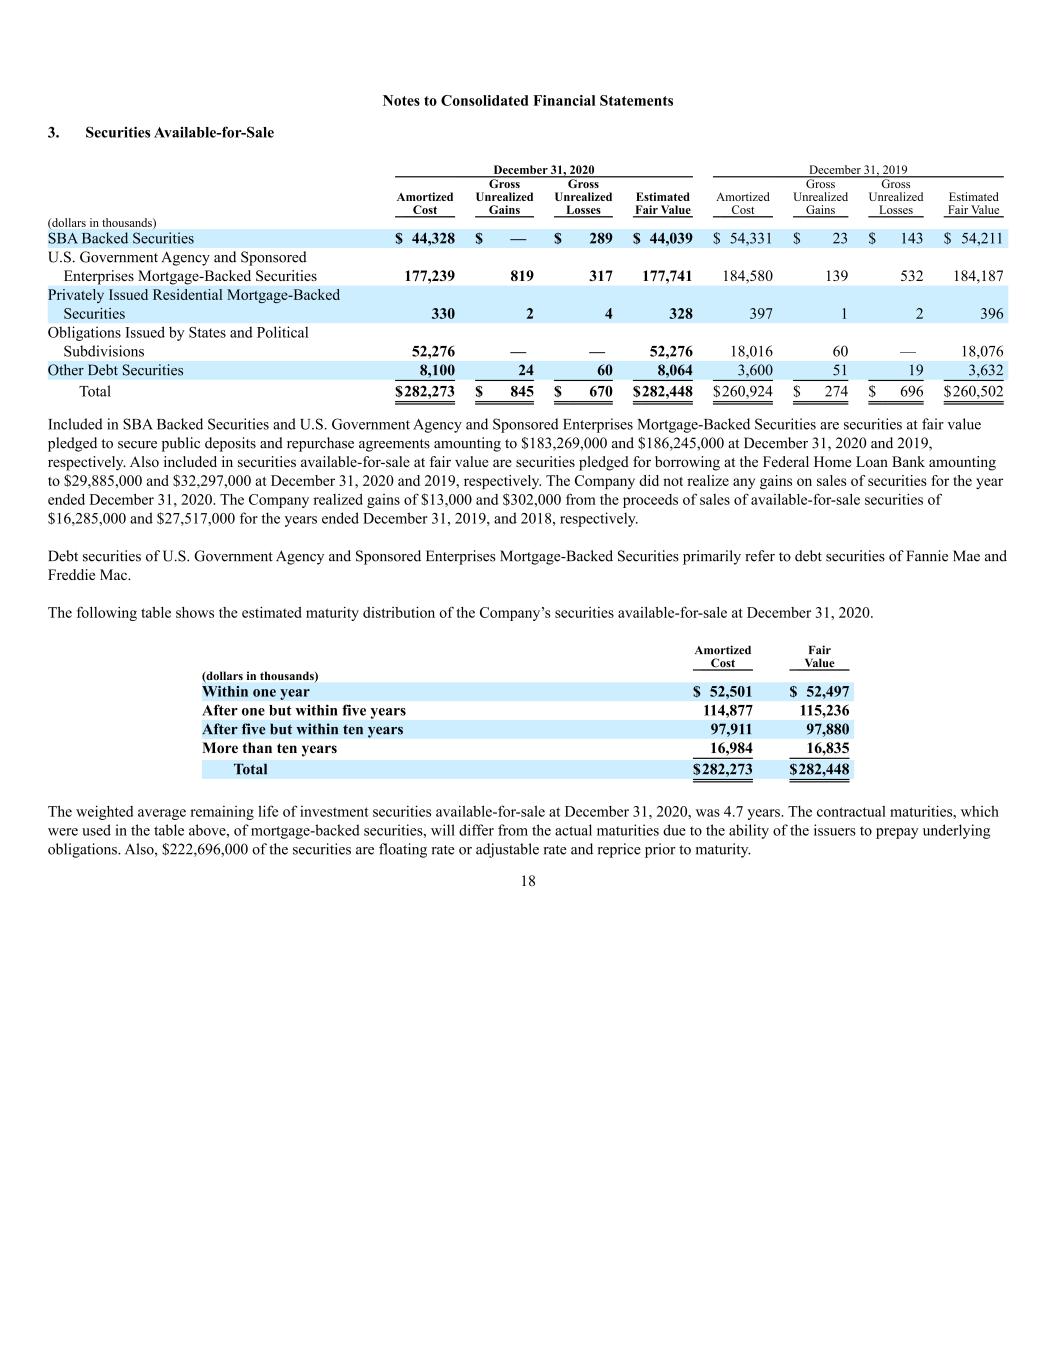
Notes to Consolidated Financial Statements 3. Securities Available-for-Sale December 31, 2020 December 31, 2019 Amortized Cost Gross Unrealized Gains Gross Unrealized Losses Estimated Fair Value Amortized Cost Gross Unrealized Gains Gross Unrealized Losses Estimated Fair Value (dollars in thousands) SBA Backed Securities $ 44,328 $ — $ 289 $ 44,039 $ 54,331 $ 23 $ 143 $ 54,211 U.S. Government Agency and Sponsored Enterprises Mortgage-Backed Securities 177,239 819 317 177,741 184,580 139 532 184,187 Privately Issued Residential Mortgage-Backed Securities 330 2 4 328 397 1 2 396 Obligations Issued by States and Political Subdivisions 52,276 — — 52,276 18,016 60 — 18,076 Other Debt Securities 8,100 24 60 8,064 3,600 51 19 3,632 Total $282,273 $ 845 $ 670 $282,448 $260,924 $ 274 $ 696 $260,502 Included in SBA Backed Securities and U.S. Government Agency and Sponsored Enterprises Mortgage-Backed Securities are securities at fair value pledged to secure public deposits and repurchase agreements amounting to $183,269,000 and $186,245,000 at December 31, 2020 and 2019, respectively. Also included in securities available-for-sale at fair value are securities pledged for borrowing at the Federal Home Loan Bank amounting to $29,885,000 and $32,297,000 at December 31, 2020 and 2019, respectively. The Company did not realize any gains on sales of securities for the year ended December 31, 2020. The Company realized gains of $13,000 and $302,000 from the proceeds of sales of available-for-sale securities of $16,285,000 and $27,517,000 for the years ended December 31, 2019, and 2018, respectively. Debt securities of U.S. Government Agency and Sponsored Enterprises Mortgage-Backed Securities primarily refer to debt securities of Fannie Mae and Freddie Mac. The following table shows the estimated maturity distribution of the Company’s securities available-for-sale at December 31, 2020. Amortized Cost Fair Value (dollars in thousands) Within one year $ 52,501 $ 52,497 After one but within five years 114,877 115,236 After five but within ten years 97,911 97,880 More than ten years 16,984 16,835 Total $282,273 $282,448 The weighted average remaining life of investment securities available-for-sale at December 31, 2020, was 4.7 years. The contractual maturities, which were used in the table above, of mortgage-backed securities, will differ from the actual maturities due to the ability of the issuers to prepay underlying obligations. Also, $222,696,000 of the securities are floating rate or adjustable rate and reprice prior to maturity. 18

Notes to Consolidated Financial Statements As of December 31, 2020 and December 31, 2019, management concluded that the unrealized losses of its investment securities are temporary in nature since they are not related to the underlying credit quality of the issuers, and the Company does not intend to sell these debt securities and it is not more likely than not that it will be required to sell these debt securities before the anticipated recovery of its remaining amortized cost. In making its other- than-temporary impairment evaluation, the Company considered the fact that the principal and interest on these securities are from issuers that are investment grade. The change in the unrealized losses on the Obligations Issued by States and Political Subdivisions, Privately Issued Residential Mortgage-Backed Securities and Other Debt Securities was primarily caused by changes in credit spreads and liquidity issues in the marketplace. The unrealized loss on SBA Backed Securities and U.S. Government Agency and Sponsored Enterprises Mortgage-Backed Securities related primarily to interest rates and not credit quality. The Company has the ability and intent to hold these investments until recovery of fair value, which may be maturity. The Company does not consider these investments to be other-than-temporarily impaired at December 31, 2020 and December 31, 2019. In evaluating the underlying credit quality of a security, management considers several factors such as the credit rating of the obligor and the issuer, if applicable. Internal reviews of issuer financial statements are performed as deemed necessary. In the case of privately issued mortgage-backed securities, the performance of the underlying loans is analyzed as deemed necessary to determine the estimated future cash flows of the securities. Factors considered include the level of subordination, current and estimated future default rates, current and estimated prepayment rates, estimated loss severity rates, geographic concentrations, and origination dates of underlying loans. The following table shows the temporarily impaired securities of the Company’s available-for-sale portfolio at December 31, 2020. This table shows the unrealized market loss of securities that have been in a continuous unrealized loss position for 12 months or less and a continuous loss position for 12 months and longer. There are 13 and 21 securities that are temporarily impaired for less than 12 months and for 12 months or longer, respectively, out of a total of 153 holdings at December 31, 2020. Temporarily Impaired Investments December 31, 2020 Less Than 12 Months 12 Months or Longer Total Fair Value Unrealized Losses Fair Value Unrealized Losses Fair Value Unrealized Losses (dollars in thousands) SBA Backed Securities $ 13,839 $ 42 $ 30,200 $ 247 $ 44,039 $ 289 U.S. Government Agency and Sponsored Enterprise Mortgage-Backed Securities 18,188 50 33,617 267 51,805 317 Privately Issued Residential Mortgage-Backed Securities — — 210 4 210 4 Obligations Issued by States and Political Subdivisions — — — — — — Other Debt Securities 3,942 58 1,298 2 5,240 60 Total temporarily impaired securities $ 35,969 $ 150 $ 65,325 $ 520 $ 101,294 $ 670 19
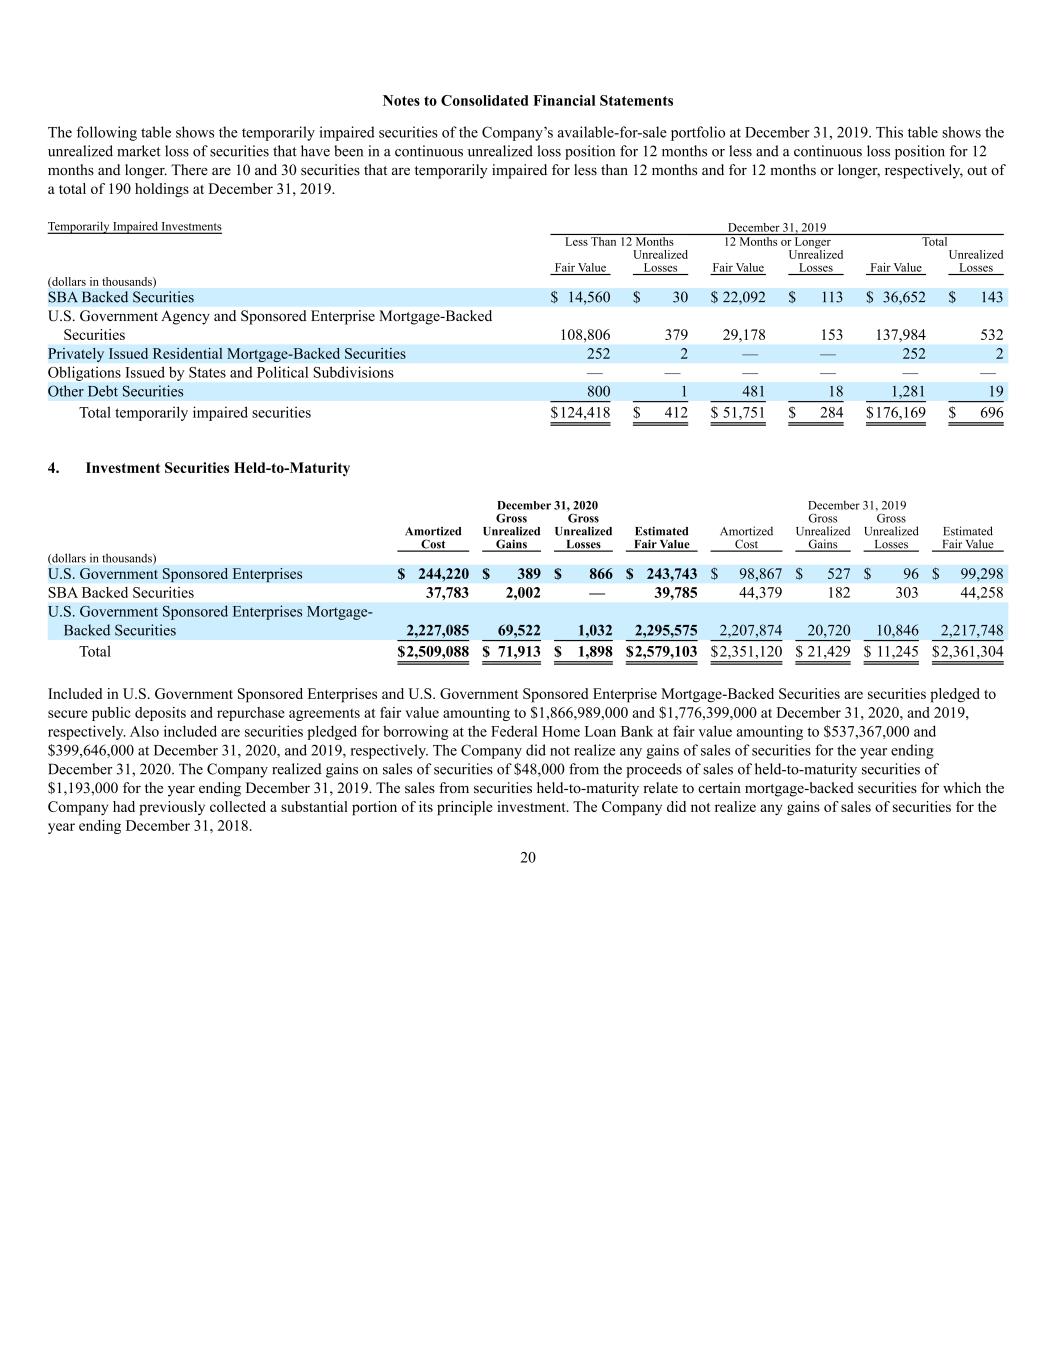
Notes to Consolidated Financial Statements The following table shows the temporarily impaired securities of the Company’s available-for-sale portfolio at December 31, 2019. This table shows the unrealized market loss of securities that have been in a continuous unrealized loss position for 12 months or less and a continuous loss position for 12 months and longer. There are 10 and 30 securities that are temporarily impaired for less than 12 months and for 12 months or longer, respectively, out of a total of 190 holdings at December 31, 2019. Temporarily Impaired Investments December 31, 2019 Less Than 12 Months 12 Months or Longer Total Fair Value Unrealized Losses Fair Value Unrealized Losses Fair Value Unrealized Losses (dollars in thousands) SBA Backed Securities $ 14,560 $ 30 $ 22,092 $ 113 $ 36,652 $ 143 U.S. Government Agency and Sponsored Enterprise Mortgage-Backed Securities 108,806 379 29,178 153 137,984 532 Privately Issued Residential Mortgage-Backed Securities 252 2 — — 252 2 Obligations Issued by States and Political Subdivisions — — — — — — Other Debt Securities 800 1 481 18 1,281 19 Total temporarily impaired securities $124,418 $ 412 $ 51,751 $ 284 $176,169 $ 696 4. Investment Securities Held-to-Maturity December 31, 2020 December 31, 2019 Amortized Cost Gross Unrealized Gains Gross Unrealized Losses Estimated Fair Value Amortized Cost Gross Unrealized Gains Gross Unrealized Losses Estimated Fair Value (dollars in thousands) U.S. Government Sponsored Enterprises $ 244,220 $ 389 $ 866 $ 243,743 $ 98,867 $ 527 $ 96 $ 99,298 SBA Backed Securities 37,783 2,002 — 39,785 44,379 182 303 44,258 U.S. Government Sponsored Enterprises Mortgage- Backed Securities 2,227,085 69,522 1,032 2,295,575 2,207,874 20,720 10,846 2,217,748 Total $2,509,088 $ 71,913 $ 1,898 $2,579,103 $2,351,120 $ 21,429 $ 11,245 $2,361,304 Included in U.S. Government Sponsored Enterprises and U.S. Government Sponsored Enterprise Mortgage-Backed Securities are securities pledged to secure public deposits and repurchase agreements at fair value amounting to $1,866,989,000 and $1,776,399,000 at December 31, 2020, and 2019, respectively. Also included are securities pledged for borrowing at the Federal Home Loan Bank at fair value amounting to $537,367,000 and $399,646,000 at December 31, 2020, and 2019, respectively. The Company did not realize any gains of sales of securities for the year ending December 31, 2020. The Company realized gains on sales of securities of $48,000 from the proceeds of sales of held-to-maturity securities of $1,193,000 for the year ending December 31, 2019. The sales from securities held-to-maturity relate to certain mortgage-backed securities for which the Company had previously collected a substantial portion of its principle investment. The Company did not realize any gains of sales of securities for the year ending December 31, 2018. 20
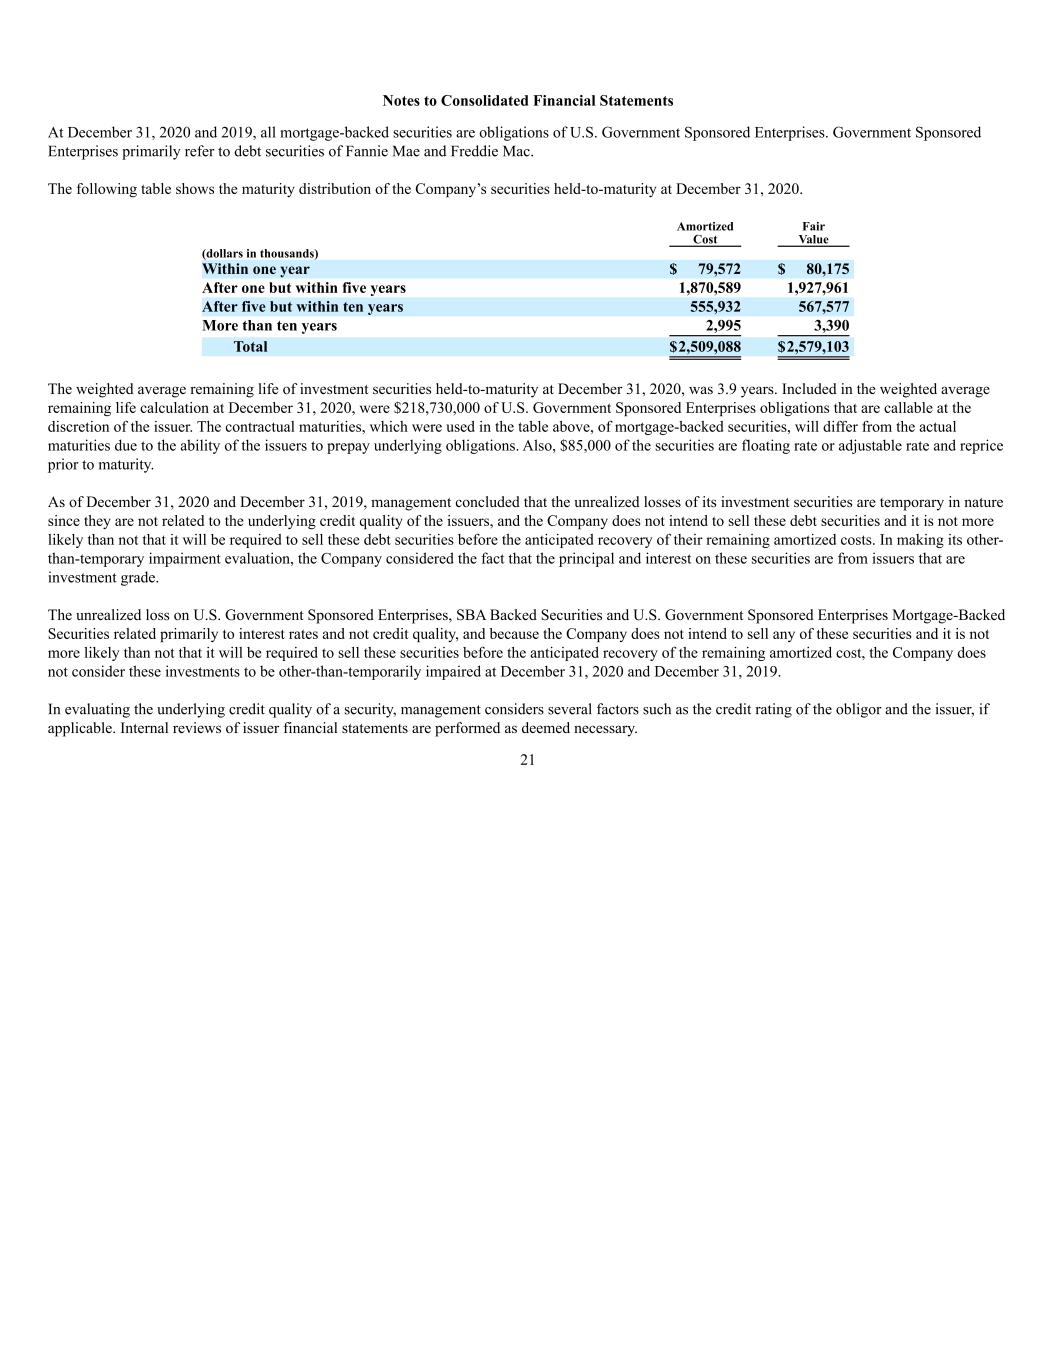
Notes to Consolidated Financial Statements At December 31, 2020 and 2019, all mortgage-backed securities are obligations of U.S. Government Sponsored Enterprises. Government Sponsored Enterprises primarily refer to debt securities of Fannie Mae and Freddie Mac. The following table shows the maturity distribution of the Company’s securities held-to-maturity at December 31, 2020. Amortized Cost Fair Value (dollars in thousands) Within one year $ 79,572 $ 80,175 After one but within five years 1,870,589 1,927,961 After five but within ten years 555,932 567,577 More than ten years 2,995 3,390 Total $2,509,088 $2,579,103 The weighted average remaining life of investment securities held-to-maturity at December 31, 2020, was 3.9 years. Included in the weighted average remaining life calculation at December 31, 2020, were $218,730,000 of U.S. Government Sponsored Enterprises obligations that are callable at the discretion of the issuer. The contractual maturities, which were used in the table above, of mortgage-backed securities, will differ from the actual maturities due to the ability of the issuers to prepay underlying obligations. Also, $85,000 of the securities are floating rate or adjustable rate and reprice prior to maturity. As of December 31, 2020 and December 31, 2019, management concluded that the unrealized losses of its investment securities are temporary in nature since they are not related to the underlying credit quality of the issuers, and the Company does not intend to sell these debt securities and it is not more likely than not that it will be required to sell these debt securities before the anticipated recovery of their remaining amortized costs. In making its other- than-temporary impairment evaluation, the Company considered the fact that the principal and interest on these securities are from issuers that are investment grade. The unrealized loss on U.S. Government Sponsored Enterprises, SBA Backed Securities and U.S. Government Sponsored Enterprises Mortgage-Backed Securities related primarily to interest rates and not credit quality, and because the Company does not intend to sell any of these securities and it is not more likely than not that it will be required to sell these securities before the anticipated recovery of the remaining amortized cost, the Company does not consider these investments to be other-than-temporarily impaired at December 31, 2020 and December 31, 2019. In evaluating the underlying credit quality of a security, management considers several factors such as the credit rating of the obligor and the issuer, if applicable. Internal reviews of issuer financial statements are performed as deemed necessary. 21
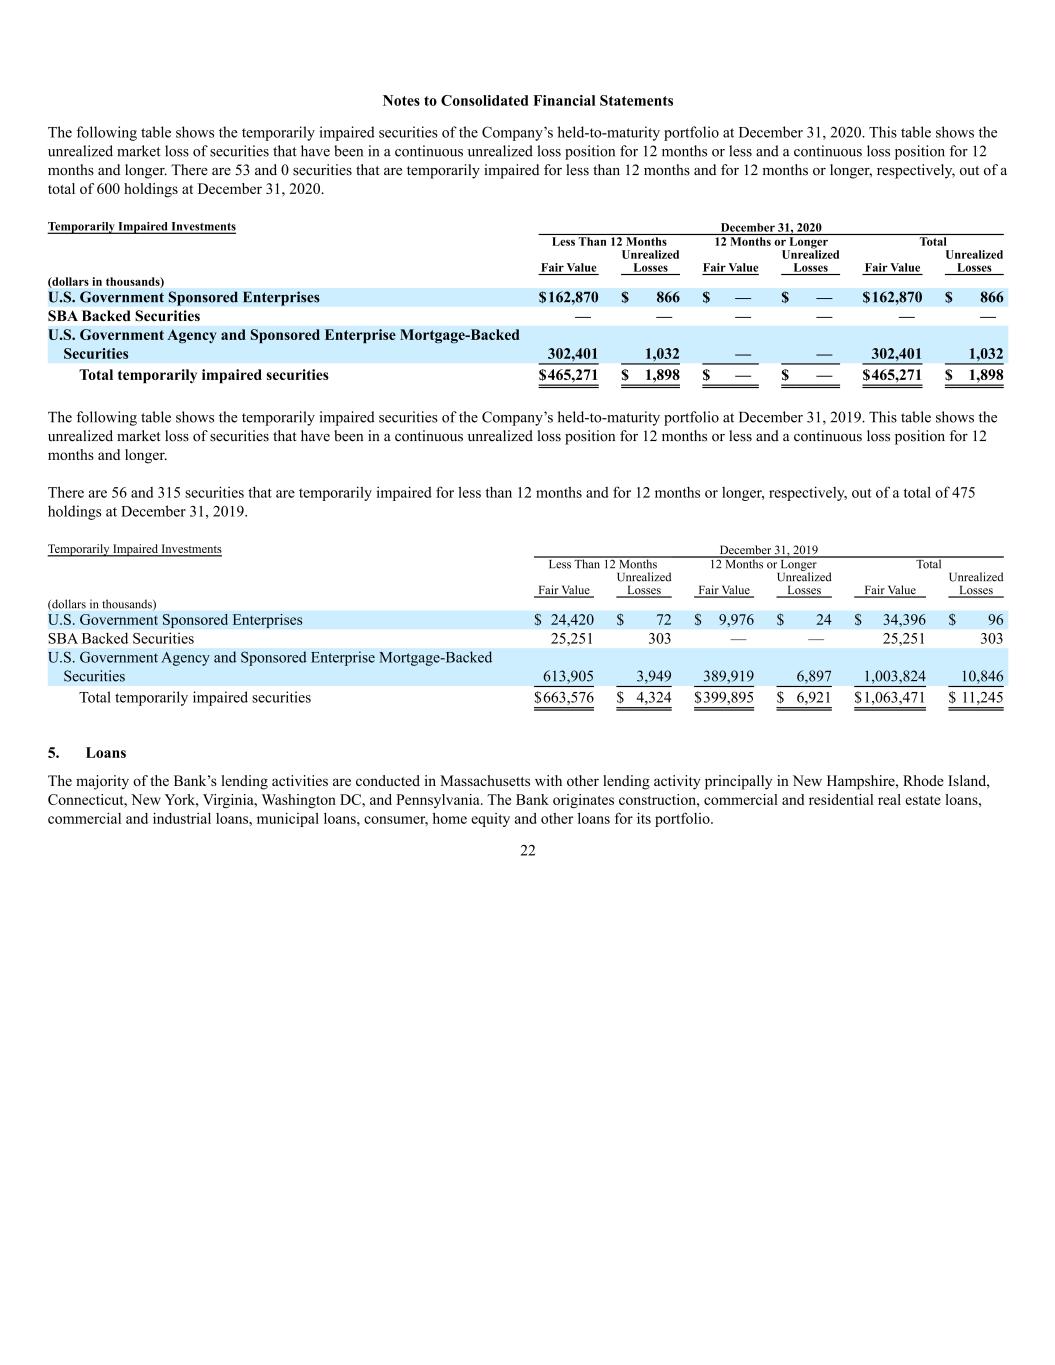
Notes to Consolidated Financial Statements The following table shows the temporarily impaired securities of the Company’s held-to-maturity portfolio at December 31, 2020. This table shows the unrealized market loss of securities that have been in a continuous unrealized loss position for 12 months or less and a continuous loss position for 12 months and longer. There are 53 and 0 securities that are temporarily impaired for less than 12 months and for 12 months or longer, respectively, out of a total of 600 holdings at December 31, 2020. Temporarily Impaired Investments December 31, 2020 Less Than 12 Months 12 Months or Longer Total Fair Value Unrealized Losses Fair Value Unrealized Losses Fair Value Unrealized Losses (dollars in thousands) U.S. Government Sponsored Enterprises $162,870 $ 866 $ — $ — $162,870 $ 866 SBA Backed Securities — — — — — — U.S. Government Agency and Sponsored Enterprise Mortgage-Backed Securities 302,401 1,032 — — 302,401 1,032 Total temporarily impaired securities $465,271 $ 1,898 $ — $ — $465,271 $ 1,898 The following table shows the temporarily impaired securities of the Company’s held-to-maturity portfolio at December 31, 2019. This table shows the unrealized market loss of securities that have been in a continuous unrealized loss position for 12 months or less and a continuous loss position for 12 months and longer. There are 56 and 315 securities that are temporarily impaired for less than 12 months and for 12 months or longer, respectively, out of a total of 475 holdings at December 31, 2019. Temporarily Impaired Investments December 31, 2019 Less Than 12 Months 12 Months or Longer Total Fair Value Unrealized Losses Fair Value Unrealized Losses Fair Value Unrealized Losses (dollars in thousands) U.S. Government Sponsored Enterprises $ 24,420 $ 72 $ 9,976 $ 24 $ 34,396 $ 96 SBA Backed Securities 25,251 303 — — 25,251 303 U.S. Government Agency and Sponsored Enterprise Mortgage-Backed Securities 613,905 3,949 389,919 6,897 1,003,824 10,846 Total temporarily impaired securities $663,576 $ 4,324 $399,895 $ 6,921 $1,063,471 $ 11,245 5. Loans The majority of the Bank’s lending activities are conducted in Massachusetts with other lending activity principally in New Hampshire, Rhode Island, Connecticut, New York, Virginia, Washington DC, and Pennsylvania. The Bank originates construction, commercial and residential real estate loans, commercial and industrial loans, municipal loans, consumer, home equity and other loans for its portfolio. 22
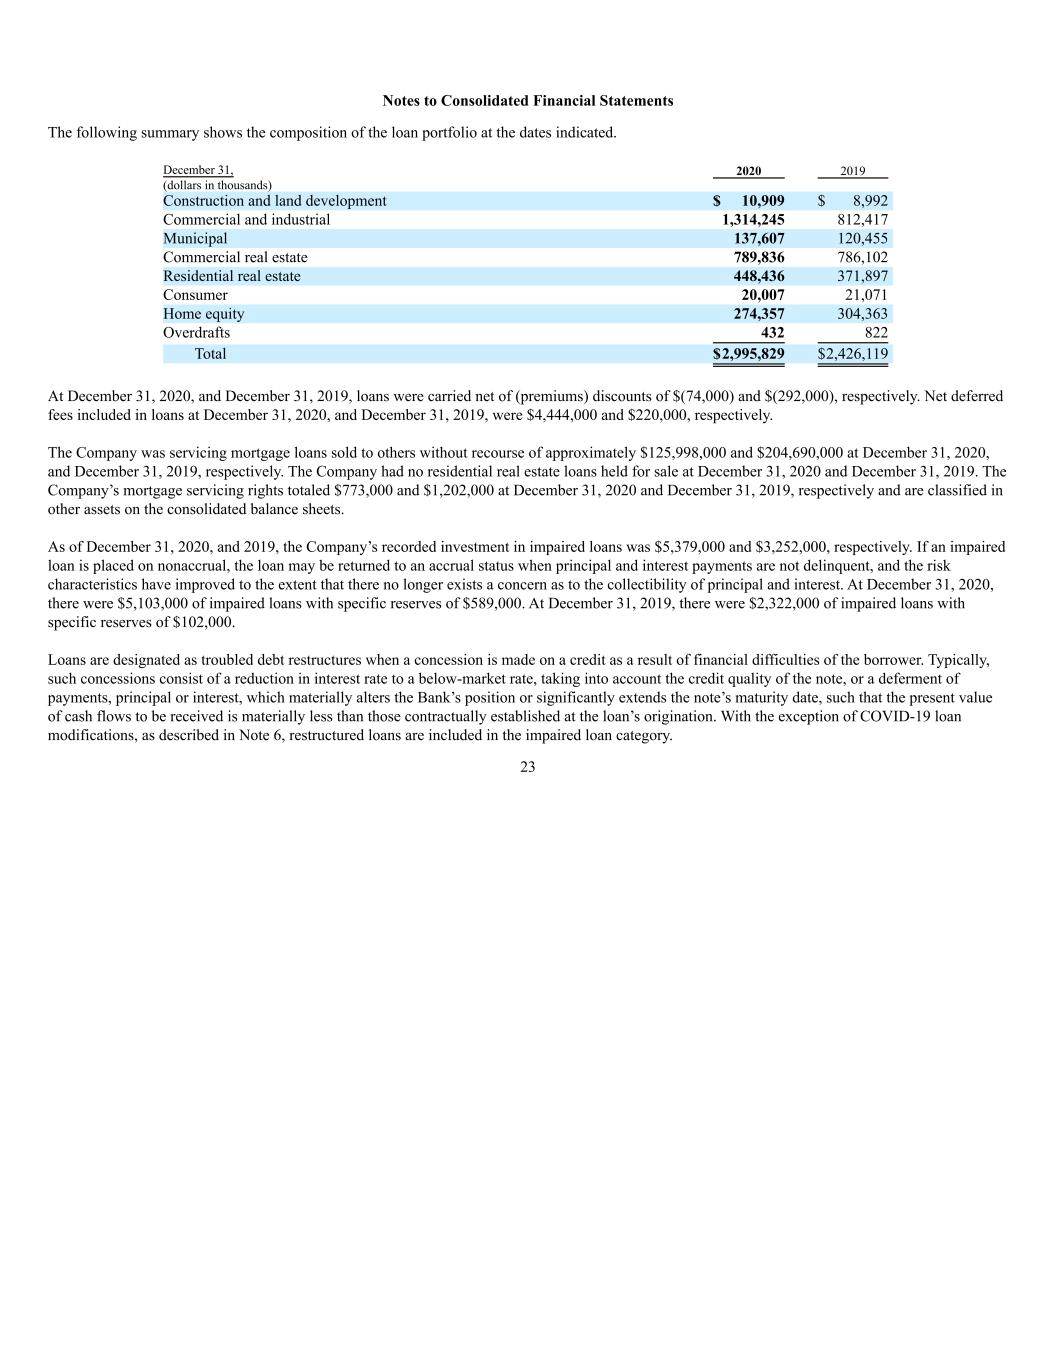
Notes to Consolidated Financial Statements The following summary shows the composition of the loan portfolio at the dates indicated. December 31, 2020 2019 (dollars in thousands) Construction and land development $ 10,909 $ 8,992 Commercial and industrial 1,314,245 812,417 Municipal 137,607 120,455 Commercial real estate 789,836 786,102 Residential real estate 448,436 371,897 Consumer 20,007 21,071 Home equity 274,357 304,363 Overdrafts 432 822 Total $2,995,829 $2,426,119 At December 31, 2020, and December 31, 2019, loans were carried net of (premiums) discounts of $(74,000) and $(292,000), respectively. Net deferred fees included in loans at December 31, 2020, and December 31, 2019, were $4,444,000 and $220,000, respectively. The Company was servicing mortgage loans sold to others without recourse of approximately $125,998,000 and $204,690,000 at December 31, 2020, and December 31, 2019, respectively. The Company had no residential real estate loans held for sale at December 31, 2020 and December 31, 2019. The Company’s mortgage servicing rights totaled $773,000 and $1,202,000 at December 31, 2020 and December 31, 2019, respectively and are classified in other assets on the consolidated balance sheets. As of December 31, 2020, and 2019, the Company’s recorded investment in impaired loans was $5,379,000 and $3,252,000, respectively. If an impaired loan is placed on nonaccrual, the loan may be returned to an accrual status when principal and interest payments are not delinquent, and the risk characteristics have improved to the extent that there no longer exists a concern as to the collectibility of principal and interest. At December 31, 2020, there were $5,103,000 of impaired loans with specific reserves of $589,000. At December 31, 2019, there were $2,322,000 of impaired loans with specific reserves of $102,000. Loans are designated as troubled debt restructures when a concession is made on a credit as a result of financial difficulties of the borrower. Typically, such concessions consist of a reduction in interest rate to a below-market rate, taking into account the credit quality of the note, or a deferment of payments, principal or interest, which materially alters the Bank’s position or significantly extends the note’s maturity date, such that the present value of cash flows to be received is materially less than those contractually established at the loan’s origination. With the exception of COVID-19 loan modifications, as described in Note 6, restructured loans are included in the impaired loan category. 23

Notes to Consolidated Financial Statements The composition of nonaccrual loans and impaired loans is as follows: December 31, 2020 2019 2018 (dollars in thousands) Loans on nonaccrual $3,996 $2,014 $1,313 Loans 90 days past due and still accruing 90 — — Impaired loans on nonaccrual included above 3,178 891 296 Total recorded investment in impaired loans 5,379 3,252 3,051 Average recorded investment of impaired loans 3,641 3,161 5,491 Accruing troubled debt restructures 2,202 2,361 2,559 Interest income not recorded on nonaccrual loans according to their original terms 95 67 64 Interest income on nonaccrual loans actually recorded — — — Interest income recognized on impaired loans 94 103 196 Directors and officers of the Company and their associates are customers of, and have other transactions with, the Company in the normal course of business. All loans and commitments included in such transactions were made on substantially the same terms, including interest rates and collateral, as those prevailing at the time for comparable transactions with other persons and do not involve more than normal risk of collection or present other unfavorable features. The following table shows the aggregate amount of loans to directors and officers of the Company and their associates during 2020. Balance at December 31, 2019 Additions Repayments and Deletions Balance at December 31, 2020 (dollars in thousands) $12,031 $6,340 $2,389 $15,982 6. Allowance for Loan Losses The Company maintains an allowance for loan losses in an amount determined by management on the basis of the character of the loans, loan performance, financial condition of borrowers, the value of collateral securing loans and other relevant factors. The following table summarizes the changes in the Company’s allowance for loan losses for the years indicated. An analysis of the allowance for loan losses for each of the three years ending December 31, 2020, 2019 and 2018 is as follows: 2020 2019 2018 (dollars in thousands) Allowance for loan losses, beginning of year $29,585 $28,543 $26,255 Loans charged-off (238) (454) (833) Recoveries on loans previously charged-off 314 246 1,771 Net recoveries (charge-offs ) 76 (208) 938 Provision charged to expense 5,825 1,250 1,350 Allowance for loan losses, end of year $35,486 $29,585 $28,543 24

Notes to Consolidated Financial Statements Further information pertaining to the allowance for loan losses at December 31, 2020 follows: Construction and Land Development Commercial and Industrial Municipal Commercial Real Estate Residential Real Estate Consumer Home Equity Unallocated Total (dollars in thousands) Allowance for Loan Losses: Ending balance at December 31, 2019 $ 331 $ 11,596 $ 2,566 $ 11,464 $ 2,194 $ 312 $ 1,065 $ 57 $ 29,585 Charge-offs — (29) — — — (209) — — (238) Recoveries — 197 — — — 112 5 — 314 Provision 98 4,949 238 287 (83) 26 138 172 5,825 Ending balance at December 31, 2020 $ 429 $ 16,713 $ 2,804 $ 11,751 $ 2,111 $ 241 $ 1,208 $ 229 $ 35,486 Amount of allowance for loan losses for loans deemed to be impaired $ — $ 140 $ — $ 449 $ — $ — $ — $ — $ 589 Amount of allowance for loan losses for loans not deemed to be impaired $ 429 $ 16,573 $ 2,804 $ 11,302 $ 2,111 $ 241 $ 1,208 $ 229 $ 34,897 Loans: Ending balance $ 10,909 $ 1,314,245 $ 137,607 $ 789,836 $ 448,436 $ 20,439 $274,357 $ — $ 2,995,829 Loans deemed to be impaired $ — $ 439 $ — $ 4,940 $ — $ — $ — $ — $ 5,379 Loans not deemed to be impaired $ 10,909 $ 1,313,806 $ 137,607 $ 784,896 $ 448,436 $ 20,439 $274,357 $ — $ 2,990,450 Further information pertaining to the allowance for loan losses at December 31, 2019 follows: Construction and Land Development Commercial and Industrial Municipal Commercial Real Estate Residential Real Estate Consumer Home Equity Unallocated Total (dollars in thousands) Allowance for Loan Losses: Ending balance at December 31, 2018 $ 1,092 $ 10,998 $ 1,838 $ 10,663 $ 2,190 $ 365 $ 1,111 $ 286 $ 28,543 Charge-offs — (137) — — — (295) (22) — (454) Recoveries — 60 — — — 186 — — 246 Provision (761) 675 728 801 4 56 (24) (229) 1,250 Ending balance at December 31, 2019 $ 331 $ 11,596 $ 2,566 $ 11,464 $ 2,194 $ 312 $ 1,065 $ 57 $ 29,585 Amount of allowance for loan losses for loans deemed to be impaired $ — $ 15 $ — $ 87 $ — $ — $ — $ — $ 102 Amount of allowance for loan losses for loans not deemed to be impaired $ 331 $ 11,581 $ 2,566 $ 11,377 $ 2,194 $ 312 $ 1,065 $ 57 $ 29,483 Loans: Ending balance $ 8,992 $ 812,417 $ 120,455 $ 786,102 $ 371,897 $21,893 $304,363 $ — $ 2,426,119 Loans deemed to be impaired $ — $ 906 $ — $ 2,346 $ — $ — $ — $ — $ 3,252 Loans not deemed to be impaired $ 8,992 $ 811,511 $ 120,455 $ 783,756 $ 371,897 $21,893 $304,363 $ — $ 2,422,867 25
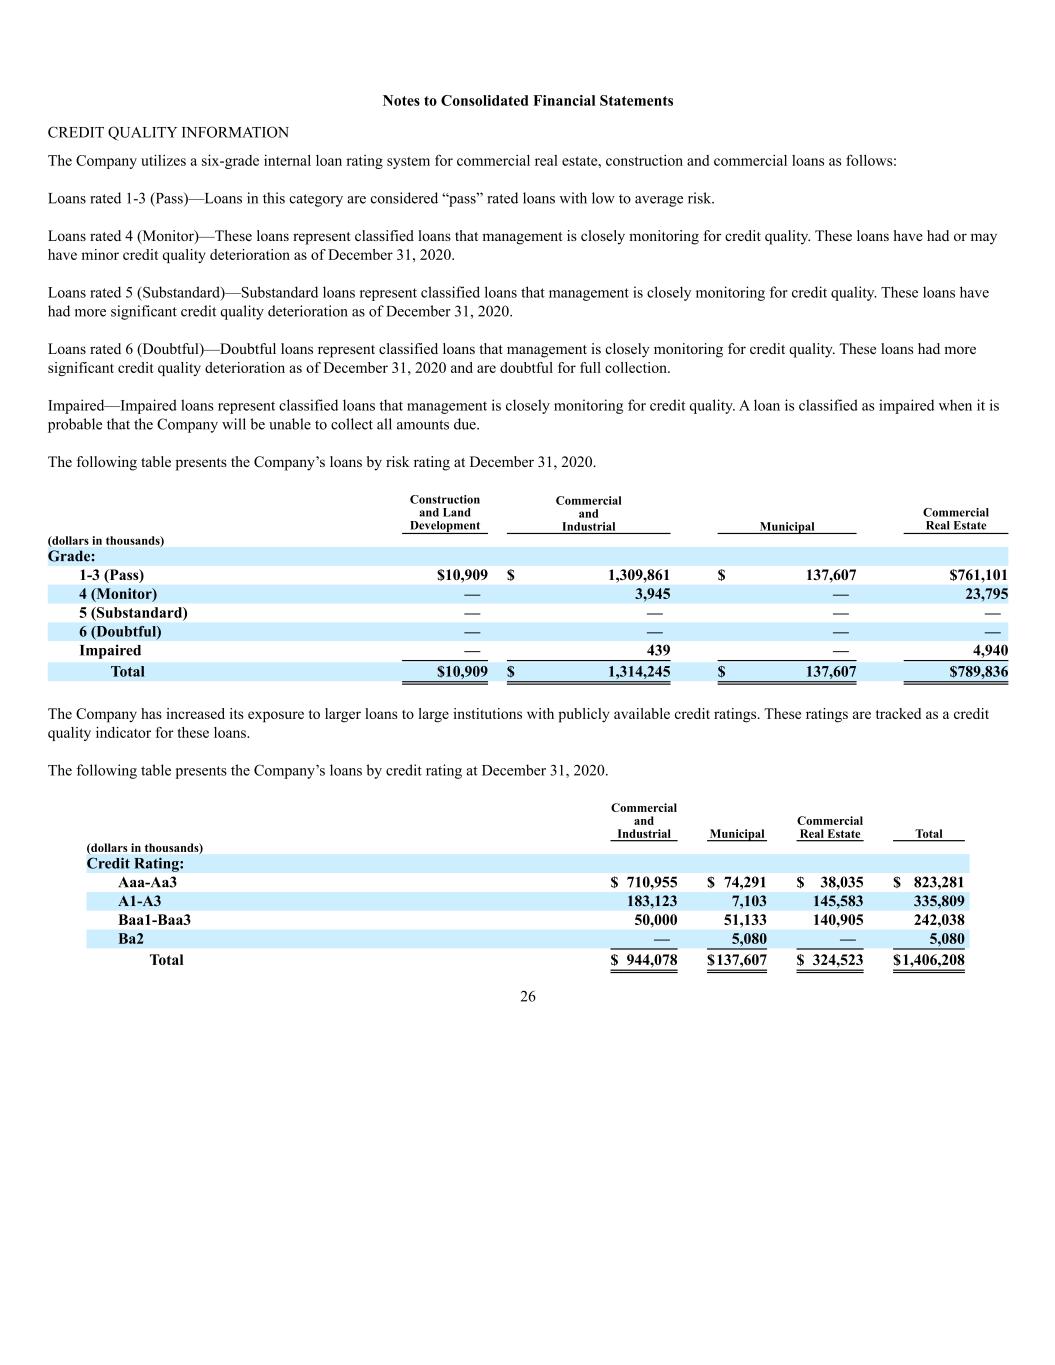
Notes to Consolidated Financial Statements CREDIT QUALITY INFORMATION The Company utilizes a six-grade internal loan rating system for commercial real estate, construction and commercial loans as follows: Loans rated 1-3 (Pass)—Loans in this category are considered “pass” rated loans with low to average risk. Loans rated 4 (Monitor)—These loans represent classified loans that management is closely monitoring for credit quality. These loans have had or may have minor credit quality deterioration as of December 31, 2020. Loans rated 5 (Substandard)—Substandard loans represent classified loans that management is closely monitoring for credit quality. These loans have had more significant credit quality deterioration as of December 31, 2020. Loans rated 6 (Doubtful)—Doubtful loans represent classified loans that management is closely monitoring for credit quality. These loans had more significant credit quality deterioration as of December 31, 2020 and are doubtful for full collection. Impaired—Impaired loans represent classified loans that management is closely monitoring for credit quality. A loan is classified as impaired when it is probable that the Company will be unable to collect all amounts due. The following table presents the Company’s loans by risk rating at December 31, 2020. Construction and Land Development Commercial and Industrial Municipal Commercial Real Estate (dollars in thousands) Grade: 1-3 (Pass) $10,909 $ 1,309,861 $ 137,607 $761,101 4 (Monitor) — 3,945 — 23,795 5 (Substandard) — — — — 6 (Doubtful) — — — — Impaired — 439 — 4,940 Total $10,909 $ 1,314,245 $ 137,607 $789,836 The Company has increased its exposure to larger loans to large institutions with publicly available credit ratings. These ratings are tracked as a credit quality indicator for these loans. The following table presents the Company’s loans by credit rating at December 31, 2020. Commercial and Industrial Municipal Commercial Real Estate Total (dollars in thousands) Credit Rating: Aaa-Aa3 $ 710,955 $ 74,291 $ 38,035 $ 823,281 A1-A3 183,123 7,103 145,583 335,809 Baa1-Baa3 50,000 51,133 140,905 242,038 Ba2 — 5,080 — 5,080 Total $ 944,078 $137,607 $ 324,523 $1,406,208 26
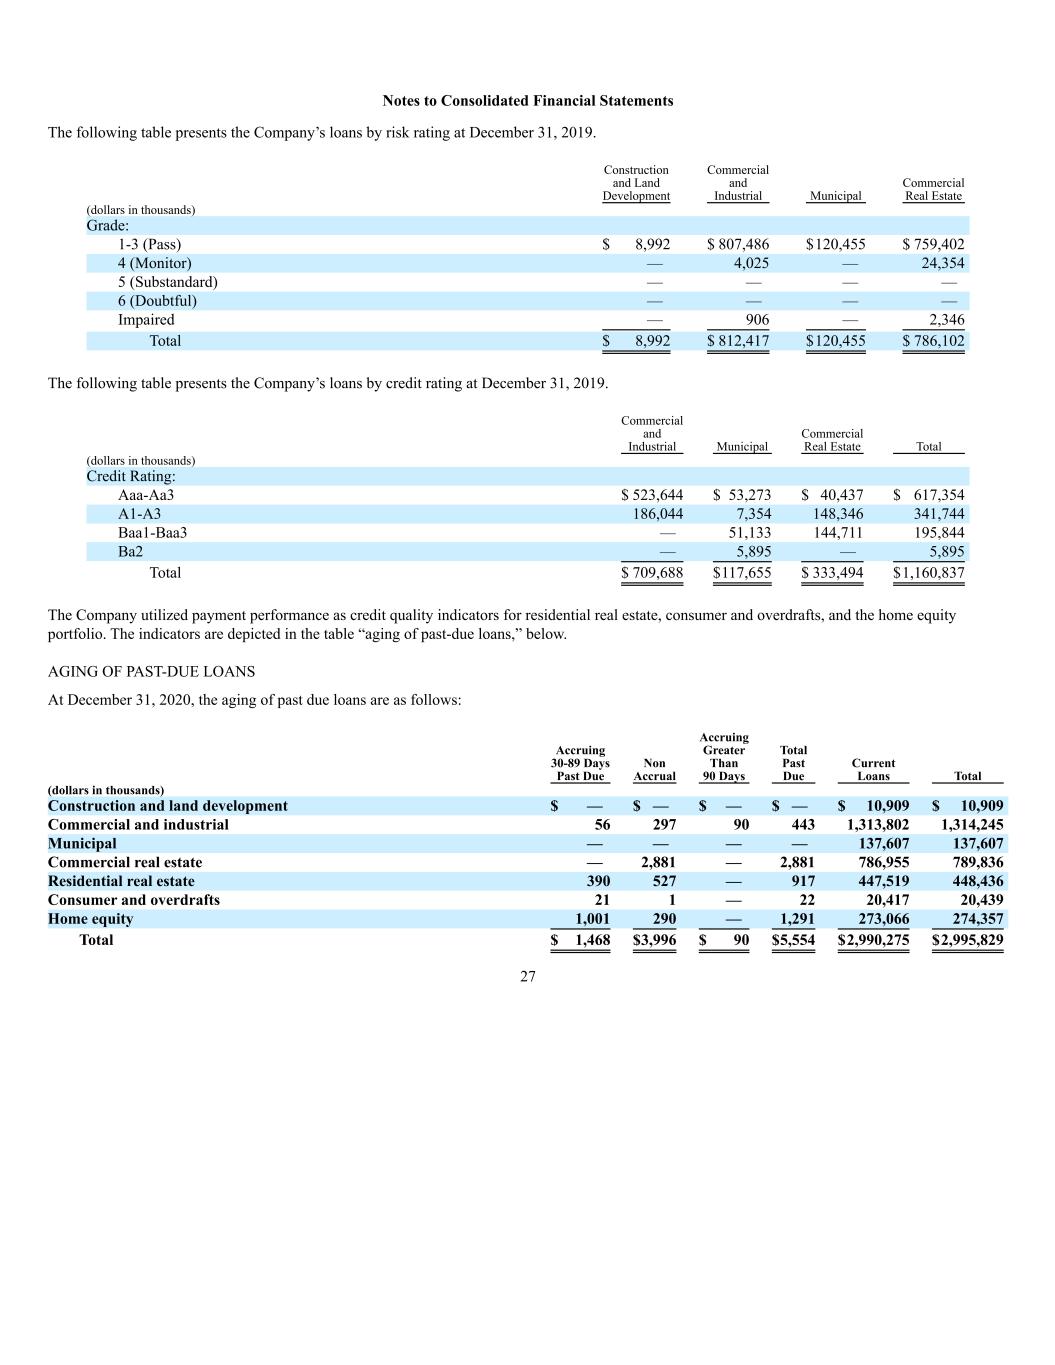
Notes to Consolidated Financial Statements The following table presents the Company’s loans by risk rating at December 31, 2019. Construction and Land Development Commercial and Industrial Municipal Commercial Real Estate (dollars in thousands) Grade: 1-3 (Pass) $ 8,992 $ 807,486 $120,455 $ 759,402 4 (Monitor) — 4,025 — 24,354 5 (Substandard) — — — — 6 (Doubtful) — — — — Impaired — 906 — 2,346 Total $ 8,992 $ 812,417 $120,455 $ 786,102 The following table presents the Company’s loans by credit rating at December 31, 2019. Commercial and Industrial Municipal Commercial Real Estate Total (dollars in thousands) Credit Rating: Aaa-Aa3 $ 523,644 $ 53,273 $ 40,437 $ 617,354 A1-A3 186,044 7,354 148,346 341,744 Baa1-Baa3 — 51,133 144,711 195,844 Ba2 — 5,895 — 5,895 Total $ 709,688 $117,655 $ 333,494 $1,160,837 The Company utilized payment performance as credit quality indicators for residential real estate, consumer and overdrafts, and the home equity portfolio. The indicators are depicted in the table “aging of past-due loans,” below. AGING OF PAST-DUE LOANS At December 31, 2020, the aging of past due loans are as follows: Accruing 30-89 Days Past Due Non Accrual Accruing Greater Than 90 Days Total Past Due Current Loans Total (dollars in thousands) Construction and land development $ — $ — $ — $ — $ 10,909 $ 10,909 Commercial and industrial 56 297 90 443 1,313,802 1,314,245 Municipal — — — — 137,607 137,607 Commercial real estate — 2,881 — 2,881 786,955 789,836 Residential real estate 390 527 — 917 447,519 448,436 Consumer and overdrafts 21 1 — 22 20,417 20,439 Home equity 1,001 290 — 1,291 273,066 274,357 Total $ 1,468 $3,996 $ 90 $5,554 $2,990,275 $2,995,829 27

Notes to Consolidated Financial Statements At December 31, 2019 the aging of past due loans are as follows: Accruing 30-89 Days Past Due Non Accrual Accruing Greater Than 90 Days Total Past Due Current Loans Total (dollars in thousands) Construction and land development $ — $ — $ — $ — $ 8,992 $ 8,992 Commercial and industrial 227 400 — 627 811,790 812,417 Municipal — — — — 120,455 120,455 Commercial real estate 840 492 — 1,332 784,770 786,102 Residential real estate 1,563 683 — 2,246 369,651 371,897 Consumer and overdrafts 18 4 — 22 21,871 21,893 Home equity 603 435 — 1,038 303,325 304,363 Total $ 3,251 $2,014 $ — $ 5,265 $2,420,854 $2,426,119 IMPAIRED LOANS A loan is impaired when, based on current information and events, it is probable that a creditor will be unable to collect all amounts due according to the contractual terms of the loan agreement. When a loan is impaired, the Company measures impairment based on the present value of expected future cash flows discounted at the loan’s effective interest rate, except that as a practical expedient, the Company measures impairment based on a loan’s observable market price or the fair value of the collateral if the loan is collateral dependent. Loans are charged-off when management believes that the collectibility of the loan’s principal is not probable. The specific factors that management considers in making the determination that the collectibility of the loan’s principal is not probable include; the delinquency status of the loan, the fair value of the collateral, if secured, and the financial strength of the borrower and/or guarantors. For collateral dependent loans, the amount of the recorded investment in a loan that exceeds the fair value of the collateral is charged-off against the allowance for loan losses in lieu of an allocation of a specific allowance amount when such an amount has been identified definitively as uncollectible. The Company’s policy for recognizing interest income on impaired loans is contained within Note 1 of the “Notes to Consolidated Financial Statements.” 28

Notes to Consolidated Financial Statements The following is information pertaining to impaired loans at December 31, 2020: Carrying Value Unpaid Balance Principal Required Reserve Average Carrying Value Recognized Interest Income (dollars in thousands) With no required reserve recorded: Construction and land development $ — $ — $ — $ — $ — Commercial and industrial 4 5 — 633 — Municipal — — — — — Commercial real estate 272 306 — 437 — Residential real estate — — — 127 — Consumer — — — — — Home equity — — — — — Total $ 276 $ 311 $ — $ 1,197 $ — With required reserve recorded: Construction and land development $ — $ — $ — $ — $ — Commercial and industrial 435 454 140 121 8 Municipal — — — — — Commercial real estate 4,668 4,797 449 2,323 86 Residential real estate — — — — — Consumer — — — — — Home equity — — — — — Total $ 5,103 $ 5,251 $ 589 $ 2,444 $ 94 Total Construction and land development $ — $ — $ — $ — $ — Commercial and industrial 439 459 140 754 8 Municipal — — — — — Commercial real estate 4,940 5,103 449 2,760 86 Residential real estate — — — 127 — Consumer — — — — — Home equity — — — — — Total $ 5,379 $ 5,562 $ 589 $ 3,641 $ 94 29
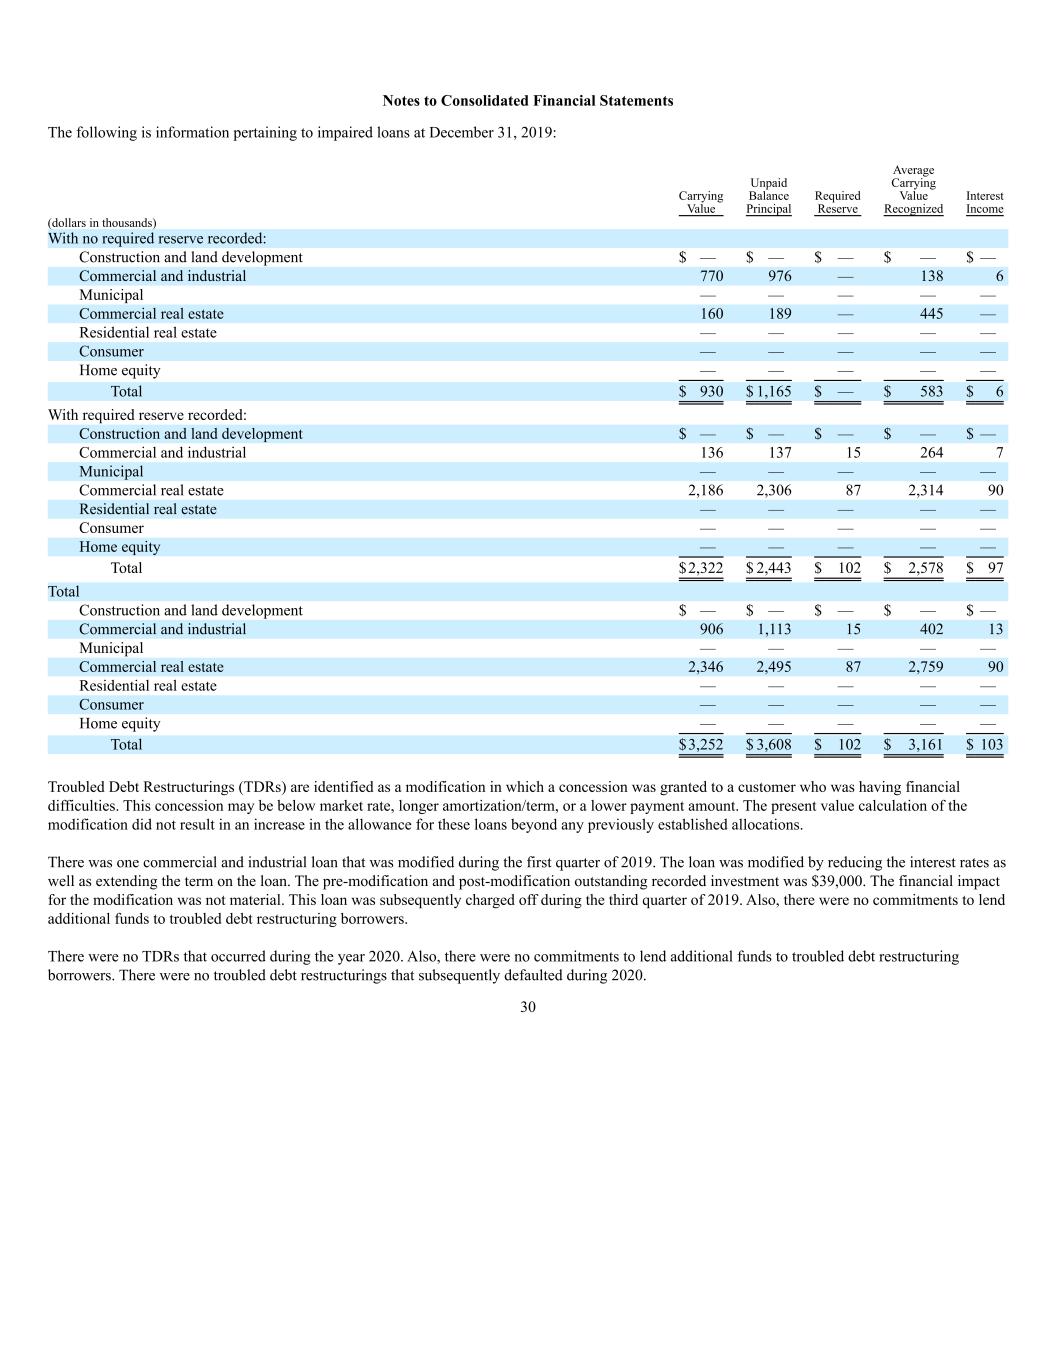
Notes to Consolidated Financial Statements The following is information pertaining to impaired loans at December 31, 2019: Carrying Value Unpaid Balance Principal Required Reserve Average Carrying Value Recognized Interest Income (dollars in thousands) With no required reserve recorded: Construction and land development $ — $ — $ — $ — $ — Commercial and industrial 770 976 — 138 6 Municipal — — — — — Commercial real estate 160 189 — 445 — Residential real estate — — — — — Consumer — — — — — Home equity — — — — — Total $ 930 $ 1,165 $ — $ 583 $ 6 With required reserve recorded: Construction and land development $ — $ — $ — $ — $ — Commercial and industrial 136 137 15 264 7 Municipal — — — — — Commercial real estate 2,186 2,306 87 2,314 90 Residential real estate — — — — — Consumer — — — — — Home equity — — — — — Total $2,322 $ 2,443 $ 102 $ 2,578 $ 97 Total Construction and land development $ — $ — $ — $ — $ — Commercial and industrial 906 1,113 15 402 13 Municipal — — — — — Commercial real estate 2,346 2,495 87 2,759 90 Residential real estate — — — — — Consumer — — — — — Home equity — — — — — Total $3,252 $ 3,608 $ 102 $ 3,161 $ 103 Troubled Debt Restructurings (TDRs) are identified as a modification in which a concession was granted to a customer who was having financial difficulties. This concession may be below market rate, longer amortization/term, or a lower payment amount. The present value calculation of the modification did not result in an increase in the allowance for these loans beyond any previously established allocations. There was one commercial and industrial loan that was modified during the first quarter of 2019. The loan was modified by reducing the interest rates as well as extending the term on the loan. The pre-modification and post-modification outstanding recorded investment was $39,000. The financial impact for the modification was not material. This loan was subsequently charged off during the third quarter of 2019. Also, there were no commitments to lend additional funds to troubled debt restructuring borrowers. There were no TDRs that occurred during the year 2020. Also, there were no commitments to lend additional funds to troubled debt restructuring borrowers. There were no troubled debt restructurings that subsequently defaulted during 2020. 30

Notes to Consolidated Financial Statements Under Section 4013 of the CARES Act, loans less than 30 days past due as of December 31, 2019 will be considered current for COVID-19 modifications. The Company can then suspend the requirements under GAAP for loan modifications related to COVID-19 that would otherwise be categorized as a TDR, and suspend any determination of a loan modified as a result of COVID-19 as being a TDR, including the requirement to determine impairment for accounting purposes. As of December 31, 2020, and as a result of COVID-19 loan modifications, the Company has 20 loans operating under modified terms aggregating $25,022,000, primarily consisting of short-term payment deferrals. Of these modifications, $25,022,000, or 100%, were performing in accordance with their modified terms. 7. Bank Premises and Equipment December 31, 2020 2019 Estimated Useful Life (dollars in thousands) Land $ 7,905 $ 7,246 — Bank premises 34,556 28,175 30-39 years Furniture and equipment 34,381 33,259 3-10 years Leasehold improvements 12,830 12,674 30-39 years or lease term 89,672 81,354 Accumulated depreciation and amortization (50,610) (47,402) Total $ 39,062 $ 33,952 Depreciation and amortization amounted to $3,266,000, $3,235,000, and $3,206,000 at December 31, 2020, 2019 and 2018, respectively. 8. Goodwill and Identifiable Intangible Assets At December 31, 2020 and 2019, the Company concluded that it is not more likely than not that fair value of the reporting unit is less than its carrying value, and goodwill is not considered to be impaired. The changes in goodwill and identifiable intangible assets for the years ended December 31, 2020 and 2019 are shown in the table below. Carrying Amount of Goodwill and Intangibles Goodwill Mortgage Servicing Rights Total (dollars in thousands) Balance at December 31, 2018 $ 2,714 $ 1,226 $3,940 Additions — 237 237 Amortization Expense — (261) (261) Balance at December 31, 2019 $ 2,714 $ 1,202 $3,916 Additions — — — Amortization Expense — (429) (429) Balance at December 31, 2020 $ 2,714 $ 773 $3,487 31
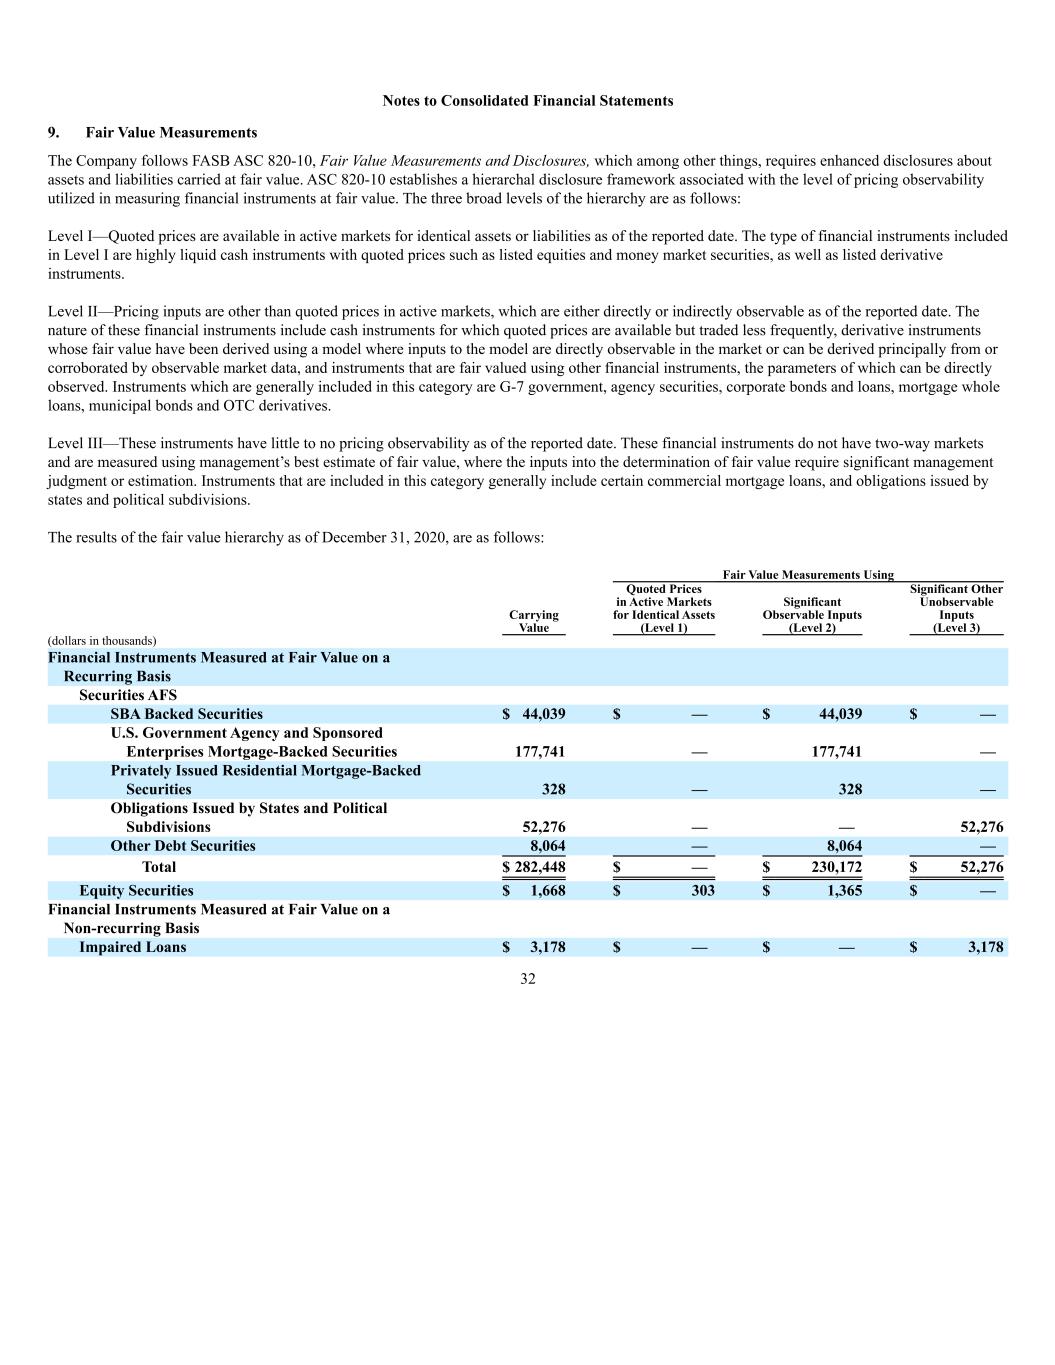
Notes to Consolidated Financial Statements 9. Fair Value Measurements The Company follows FASB ASC 820-10, Fair Value Measurements and Disclosures, which among other things, requires enhanced disclosures about assets and liabilities carried at fair value. ASC 820-10 establishes a hierarchal disclosure framework associated with the level of pricing observability utilized in measuring financial instruments at fair value. The three broad levels of the hierarchy are as follows: Level I—Quoted prices are available in active markets for identical assets or liabilities as of the reported date. The type of financial instruments included in Level I are highly liquid cash instruments with quoted prices such as listed equities and money market securities, as well as listed derivative instruments. Level II—Pricing inputs are other than quoted prices in active markets, which are either directly or indirectly observable as of the reported date. The nature of these financial instruments include cash instruments for which quoted prices are available but traded less frequently, derivative instruments whose fair value have been derived using a model where inputs to the model are directly observable in the market or can be derived principally from or corroborated by observable market data, and instruments that are fair valued using other financial instruments, the parameters of which can be directly observed. Instruments which are generally included in this category are G-7 government, agency securities, corporate bonds and loans, mortgage whole loans, municipal bonds and OTC derivatives. Level III—These instruments have little to no pricing observability as of the reported date. These financial instruments do not have two-way markets and are measured using management’s best estimate of fair value, where the inputs into the determination of fair value require significant management judgment or estimation. Instruments that are included in this category generally include certain commercial mortgage loans, and obligations issued by states and political subdivisions. The results of the fair value hierarchy as of December 31, 2020, are as follows: Fair Value Measurements Using Carrying Value Quoted Prices in Active Markets for Identical Assets (Level 1) Significant Observable Inputs (Level 2) Significant Other Unobservable Inputs (Level 3) (dollars in thousands) Financial Instruments Measured at Fair Value on a Recurring Basis Securities AFS SBA Backed Securities $ 44,039 $ — $ 44,039 $ — U.S. Government Agency and Sponsored Enterprises Mortgage-Backed Securities 177,741 — 177,741 — Privately Issued Residential Mortgage-Backed Securities 328 — 328 — Obligations Issued by States and Political Subdivisions 52,276 — — 52,276 Other Debt Securities 8,064 — 8,064 — Total $ 282,448 $ — $ 230,172 $ 52,276 Equity Securities $ 1,668 $ 303 $ 1,365 $ — Financial Instruments Measured at Fair Value on a Non-recurring Basis Impaired Loans $ 3,178 $ — $ — $ 3,178 32
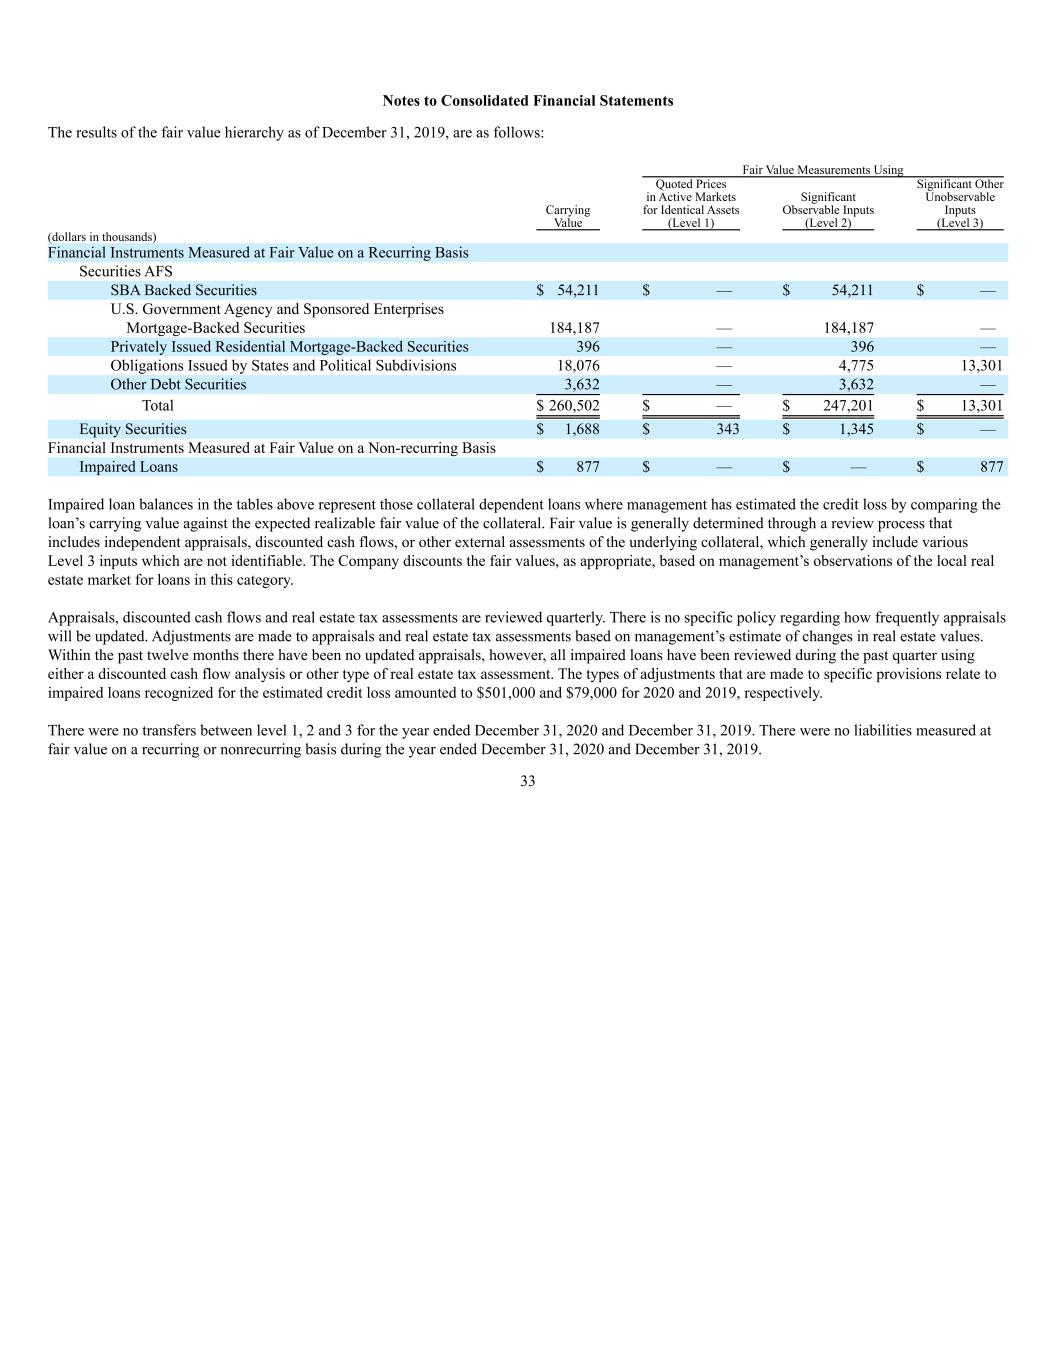
Notes to Consolidated Financial Statements The results of the fair value hierarchy as of December 31, 2019, are as follows: Fair Value Measurements Using Carrying Value Quoted Prices in Active Markets for Identical Assets (Level 1) Significant Observable Inputs (Level 2) Significant Other Unobservable Inputs (Level 3) (dollars in thousands) Financial Instruments Measured at Fair Value on a Recurring Basis Securities AFS SBA Backed Securities $ 54,211 $ — $ 54,211 $ — U.S. Government Agency and Sponsored Enterprises Mortgage-Backed Securities 184,187 — 184,187 — Privately Issued Residential Mortgage-Backed Securities 396 — 396 — Obligations Issued by States and Political Subdivisions 18,076 — 4,775 13,301 Other Debt Securities 3,632 — 3,632 — Total $ 260,502 $ — $ 247,201 $ 13,301 Equity Securities $ 1,688 $ 343 $ 1,345 $ — Financial Instruments Measured at Fair Value on a Non-recurring Basis Impaired Loans $ 877 $ — $ — $ 877 Impaired loan balances in the tables above represent those collateral dependent loans where management has estimated the credit loss by comparing the loan’s carrying value against the expected realizable fair value of the collateral. Fair value is generally determined through a review process that includes independent appraisals, discounted cash flows, or other external assessments of the underlying collateral, which generally include various Level 3 inputs which are not identifiable. The Company discounts the fair values, as appropriate, based on management’s observations of the local real estate market for loans in this category. Appraisals, discounted cash flows and real estate tax assessments are reviewed quarterly. There is no specific policy regarding how frequently appraisals will be updated. Adjustments are made to appraisals and real estate tax assessments based on management’s estimate of changes in real estate values. Within the past twelve months there have been no updated appraisals, however, all impaired loans have been reviewed during the past quarter using either a discounted cash flow analysis or other type of real estate tax assessment. The types of adjustments that are made to specific provisions relate to impaired loans recognized for the estimated credit loss amounted to $501,000 and $79,000 for 2020 and 2019, respectively. There were no transfers between level 1, 2 and 3 for the year ended December 31, 2020 and December 31, 2019. There were no liabilities measured at fair value on a recurring or nonrecurring basis during the year ended December 31, 2020 and December 31, 2019. 33
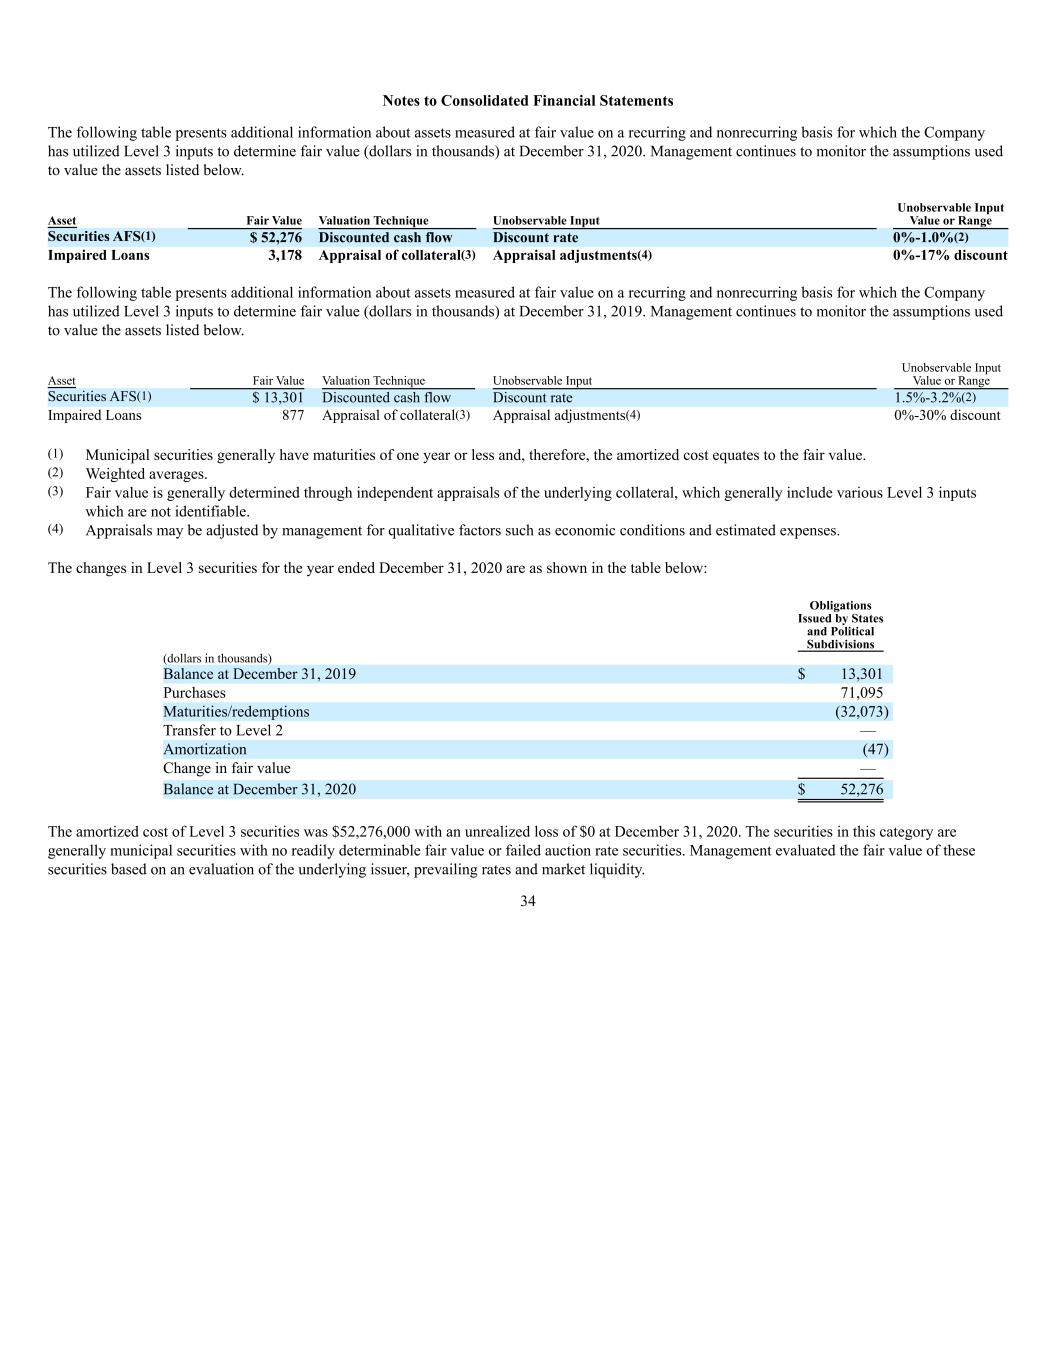
Notes to Consolidated Financial Statements The following table presents additional information about assets measured at fair value on a recurring and nonrecurring basis for which the Company has utilized Level 3 inputs to determine fair value (dollars in thousands) at December 31, 2020. Management continues to monitor the assumptions used to value the assets listed below. Asset Fair Value Valuation Technique Unobservable Input Unobservable Input Value or Range Securities AFS(1) $ 52,276 Discounted cash flow Discount rate 0%-1.0%(2) Impaired Loans 3,178 Appraisal of collateral(3) Appraisal adjustments(4) 0%-17% discount The following table presents additional information about assets measured at fair value on a recurring and nonrecurring basis for which the Company has utilized Level 3 inputs to determine fair value (dollars in thousands) at December 31, 2019. Management continues to monitor the assumptions used to value the assets listed below. Asset Fair Value Valuation Technique Unobservable Input Unobservable Input Value or Range Securities AFS(1) $ 13,301 Discounted cash flow Discount rate 1.5%-3.2%(2) Impaired Loans 877 Appraisal of collateral(3) Appraisal adjustments(4) 0%-30% discount (1) Municipal securities generally have maturities of one year or less and, therefore, the amortized cost equates to the fair value. (2) Weighted averages. (3) Fair value is generally determined through independent appraisals of the underlying collateral, which generally include various Level 3 inputs which are not identifiable. (4) Appraisals may be adjusted by management for qualitative factors such as economic conditions and estimated expenses. The changes in Level 3 securities for the year ended December 31, 2020 are as shown in the table below: Obligations Issued by States and Political Subdivisions (dollars in thousands) Balance at December 31, 2019 $ 13,301 Purchases 71,095 Maturities/redemptions (32,073) Transfer to Level 2 — Amortization (47) Change in fair value — Balance at December 31, 2020 $ 52,276 The amortized cost of Level 3 securities was $52,276,000 with an unrealized loss of $0 at December 31, 2020. The securities in this category are generally municipal securities with no readily determinable fair value or failed auction rate securities. Management evaluated the fair value of these securities based on an evaluation of the underlying issuer, prevailing rates and market liquidity. 34
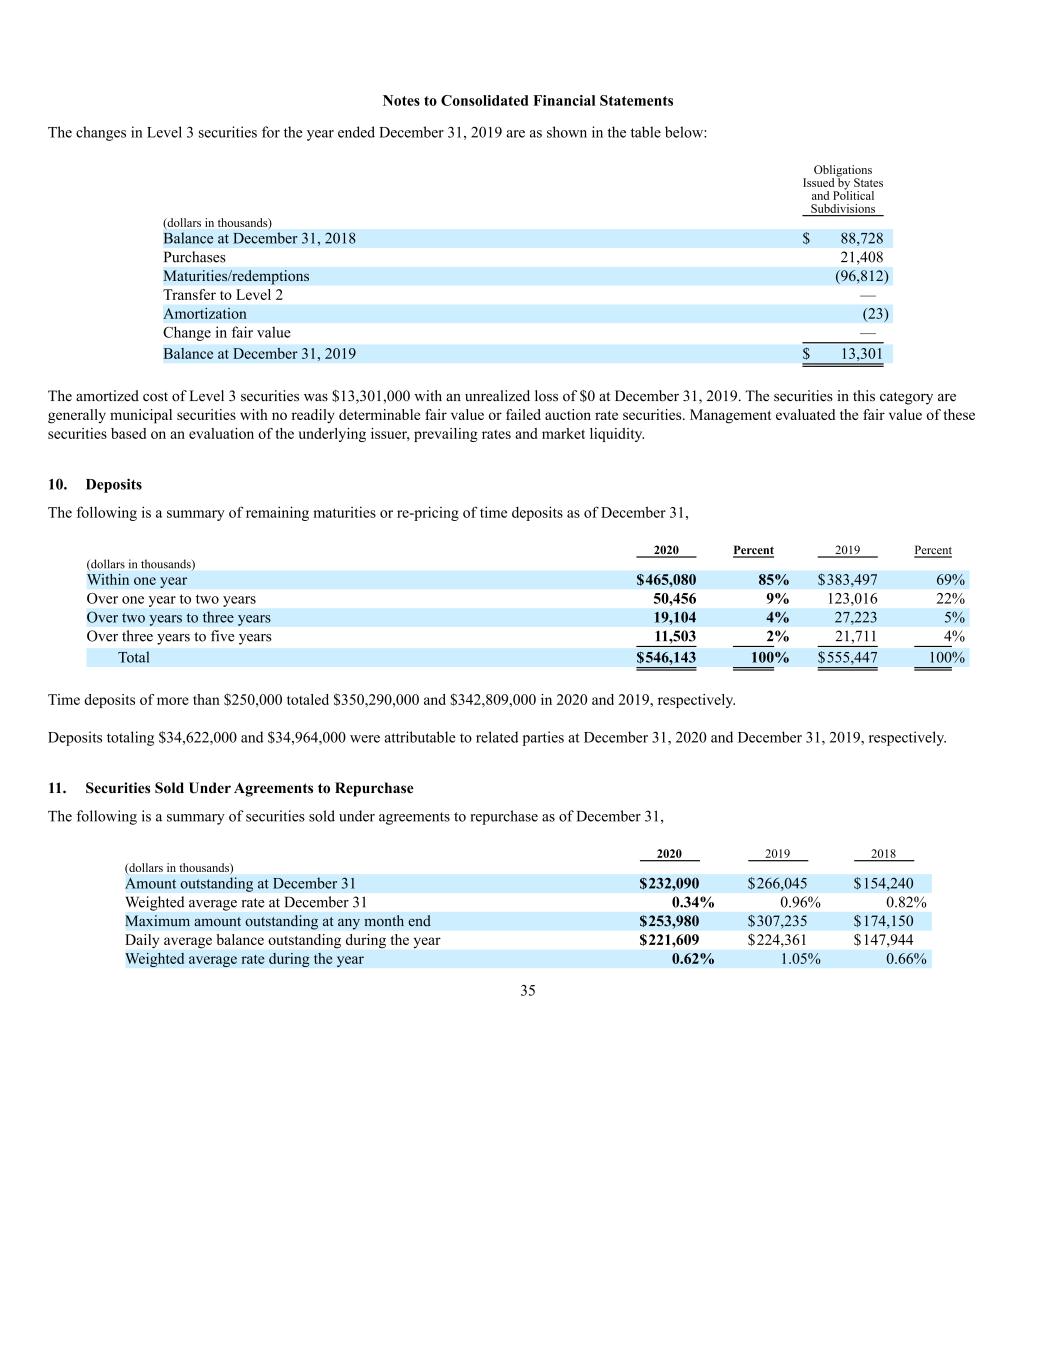
Notes to Consolidated Financial Statements The changes in Level 3 securities for the year ended December 31, 2019 are as shown in the table below: Obligations Issued by States and Political Subdivisions (dollars in thousands) Balance at December 31, 2018 $ 88,728 Purchases 21,408 Maturities/redemptions (96,812) Transfer to Level 2 — Amortization (23) Change in fair value — Balance at December 31, 2019 $ 13,301 The amortized cost of Level 3 securities was $13,301,000 with an unrealized loss of $0 at December 31, 2019. The securities in this category are generally municipal securities with no readily determinable fair value or failed auction rate securities. Management evaluated the fair value of these securities based on an evaluation of the underlying issuer, prevailing rates and market liquidity. 10. Deposits The following is a summary of remaining maturities or re-pricing of time deposits as of December 31, 2020 Percent 2019 Percent (dollars in thousands) Within one year $465,080 85% $383,497 69% Over one year to two years 50,456 9% 123,016 22% Over two years to three years 19,104 4% 27,223 5% Over three years to five years 11,503 2% 21,711 4% Total $546,143 100% $555,447 100% Time deposits of more than $250,000 totaled $350,290,000 and $342,809,000 in 2020 and 2019, respectively. Deposits totaling $34,622,000 and $34,964,000 were attributable to related parties at December 31, 2020 and December 31, 2019, respectively. 11. Securities Sold Under Agreements to Repurchase The following is a summary of securities sold under agreements to repurchase as of December 31, 2020 2019 2018 (dollars in thousands) Amount outstanding at December 31 $232,090 $266,045 $154,240 Weighted average rate at December 31 0.34% 0.96% 0.82% Maximum amount outstanding at any month end $253,980 $307,235 $174,150 Daily average balance outstanding during the year $221,609 $224,361 $147,944 Weighted average rate during the year 0.62% 1.05% 0.66% 35
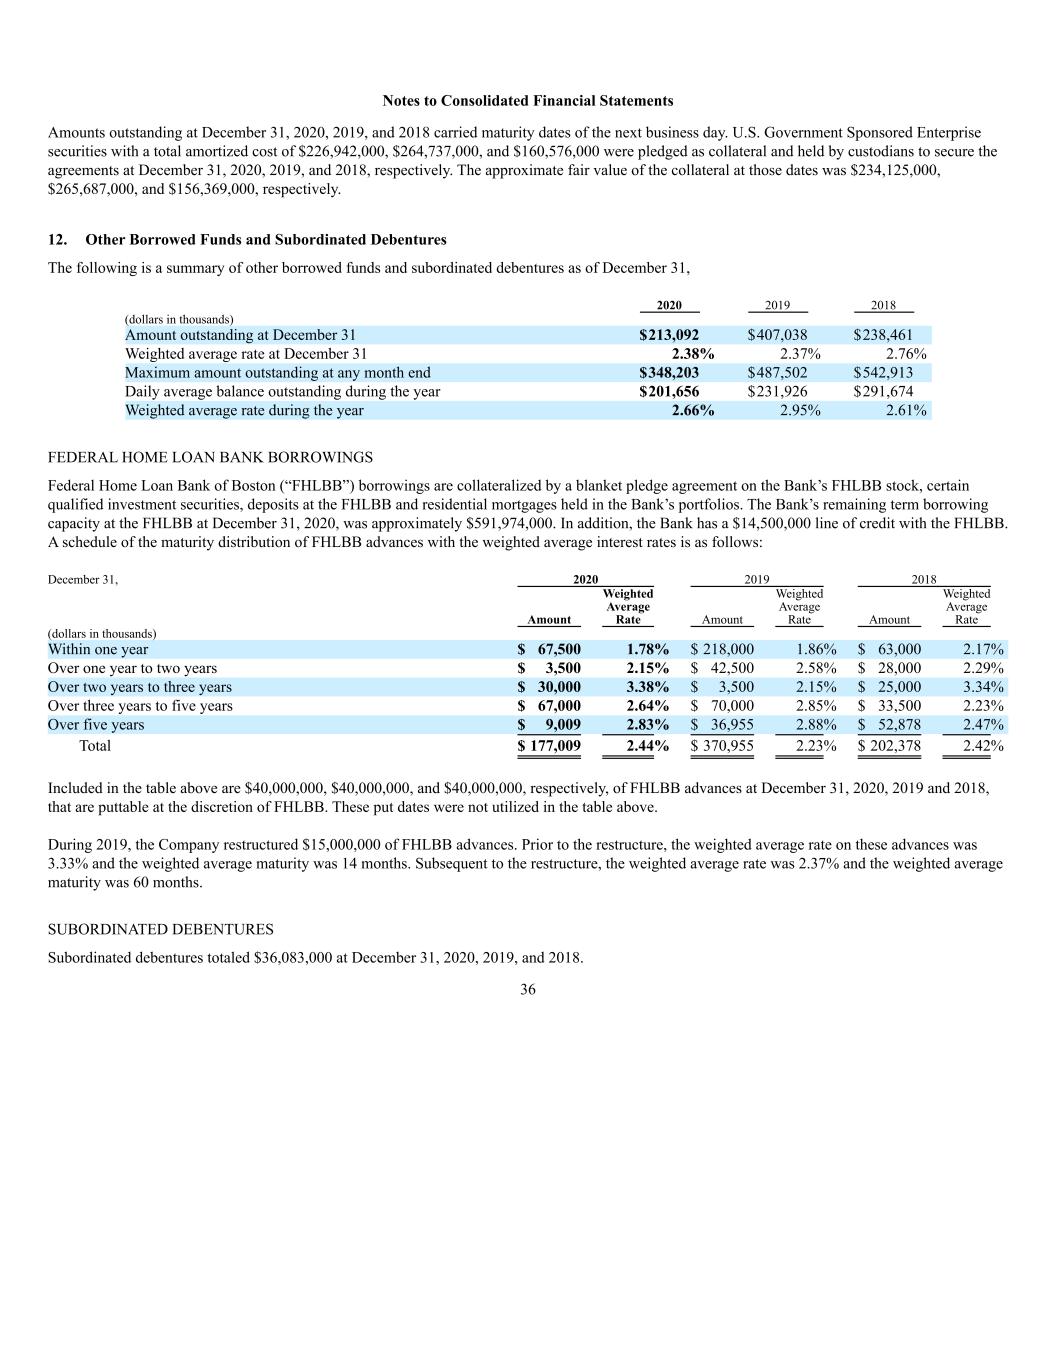
Notes to Consolidated Financial Statements Amounts outstanding at December 31, 2020, 2019, and 2018 carried maturity dates of the next business day. U.S. Government Sponsored Enterprise securities with a total amortized cost of $226,942,000, $264,737,000, and $160,576,000 were pledged as collateral and held by custodians to secure the agreements at December 31, 2020, 2019, and 2018, respectively. The approximate fair value of the collateral at those dates was $234,125,000, $265,687,000, and $156,369,000, respectively. 12. Other Borrowed Funds and Subordinated Debentures The following is a summary of other borrowed funds and subordinated debentures as of December 31, 2020 2019 2018 (dollars in thousands) Amount outstanding at December 31 $213,092 $407,038 $238,461 Weighted average rate at December 31 2.38% 2.37% 2.76% Maximum amount outstanding at any month end $348,203 $487,502 $542,913 Daily average balance outstanding during the year $201,656 $231,926 $291,674 Weighted average rate during the year 2.66% 2.95% 2.61% FEDERAL HOME LOAN BANK BORROWINGS Federal Home Loan Bank of Boston (“FHLBB”) borrowings are collateralized by a blanket pledge agreement on the Bank’s FHLBB stock, certain qualified investment securities, deposits at the FHLBB and residential mortgages held in the Bank’s portfolios. The Bank’s remaining term borrowing capacity at the FHLBB at December 31, 2020, was approximately $591,974,000. In addition, the Bank has a $14,500,000 line of credit with the FHLBB. A schedule of the maturity distribution of FHLBB advances with the weighted average interest rates is as follows: December 31, 2020 2019 2018 Amount Weighted Average Rate Amount Weighted Average Rate Amount Weighted Average Rate (dollars in thousands) Within one year $ 67,500 1.78% $ 218,000 1.86% $ 63,000 2.17% Over one year to two years $ 3,500 2.15% $ 42,500 2.58% $ 28,000 2.29% Over two years to three years $ 30,000 3.38% $ 3,500 2.15% $ 25,000 3.34% Over three years to five years $ 67,000 2.64% $ 70,000 2.85% $ 33,500 2.23% Over five years $ 9,009 2.83% $ 36,955 2.88% $ 52,878 2.47% Total $ 177,009 2.44% $ 370,955 2.23% $ 202,378 2.42% Included in the table above are $40,000,000, $40,000,000, and $40,000,000, respectively, of FHLBB advances at December 31, 2020, 2019 and 2018, that are puttable at the discretion of FHLBB. These put dates were not utilized in the table above. During 2019, the Company restructured $15,000,000 of FHLBB advances. Prior to the restructure, the weighted average rate on these advances was 3.33% and the weighted average maturity was 14 months. Subsequent to the restructure, the weighted average rate was 2.37% and the weighted average maturity was 60 months. SUBORDINATED DEBENTURES Subordinated debentures totaled $36,083,000 at December 31, 2020, 2019, and 2018. 36
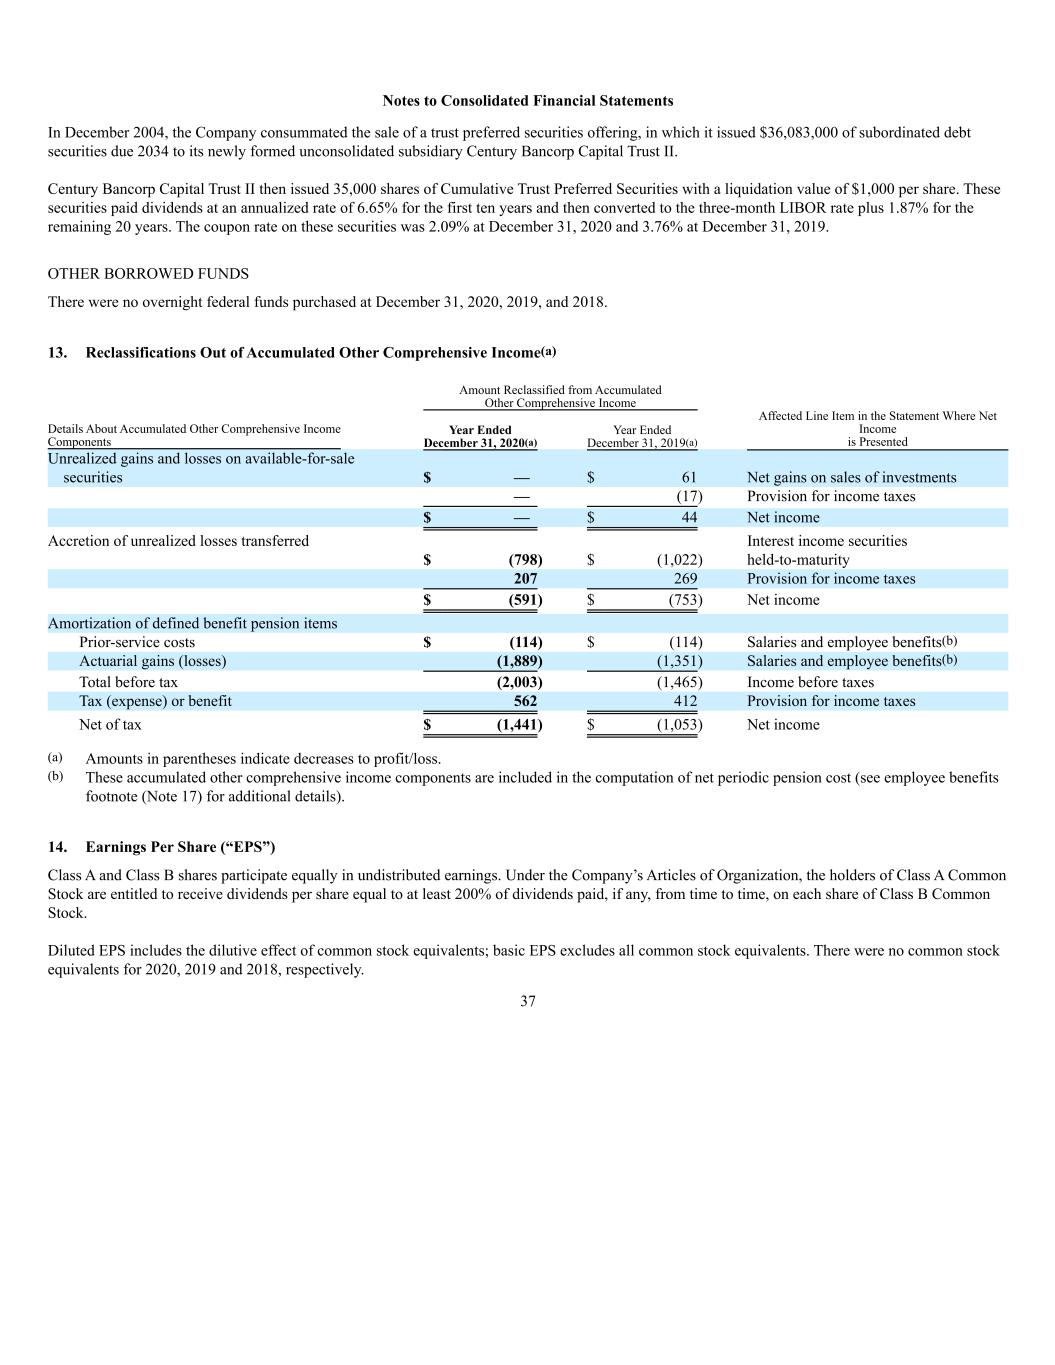
Notes to Consolidated Financial Statements In December 2004, the Company consummated the sale of a trust preferred securities offering, in which it issued $36,083,000 of subordinated debt securities due 2034 to its newly formed unconsolidated subsidiary Century Bancorp Capital Trust II. Century Bancorp Capital Trust II then issued 35,000 shares of Cumulative Trust Preferred Securities with a liquidation value of $1,000 per share. These securities paid dividends at an annualized rate of 6.65% for the first ten years and then converted to the three-month LIBOR rate plus 1.87% for the remaining 20 years. The coupon rate on these securities was 2.09% at December 31, 2020 and 3.76% at December 31, 2019. OTHER BORROWED FUNDS There were no overnight federal funds purchased at December 31, 2020, 2019, and 2018. 13. Reclassifications Out of Accumulated Other Comprehensive Income(a) Amount Reclassified from Accumulated Other Comprehensive Income Details About Accumulated Other Comprehensive Income Components Year Ended December 31, 2020(a) Year Ended December 31, 2019(a) Affected Line Item in the Statement Where Net Income is Presented Unrealized gains and losses on available-for-sale securities $ — $ 61 Net gains on sales of investments — (17) Provision for income taxes $ — $ 44 Net income Accretion of unrealized losses transferred $ (798) $ (1,022) Interest income securities held-to-maturity 207 269 Provision for income taxes $ (591) $ (753) Net income Amortization of defined benefit pension items Prior-service costs $ (114) $ (114) Salaries and employee benefits(b) Actuarial gains (losses) (1,889) (1,351) Salaries and employee benefits(b) Total before tax (2,003) (1,465) Income before taxes Tax (expense) or benefit 562 412 Provision for income taxes Net of tax $ (1,441) $ (1,053) Net income (a) Amounts in parentheses indicate decreases to profit/loss. (b) These accumulated other comprehensive income components are included in the computation of net periodic pension cost (see employee benefits footnote (Note 17) for additional details). 14. Earnings Per Share (“EPS”) Class A and Class B shares participate equally in undistributed earnings. Under the Company’s Articles of Organization, the holders of Class A Common Stock are entitled to receive dividends per share equal to at least 200% of dividends paid, if any, from time to time, on each share of Class B Common Stock. Diluted EPS includes the dilutive effect of common stock equivalents; basic EPS excludes all common stock equivalents. There were no common stock equivalents for 2020, 2019 and 2018, respectively. 37
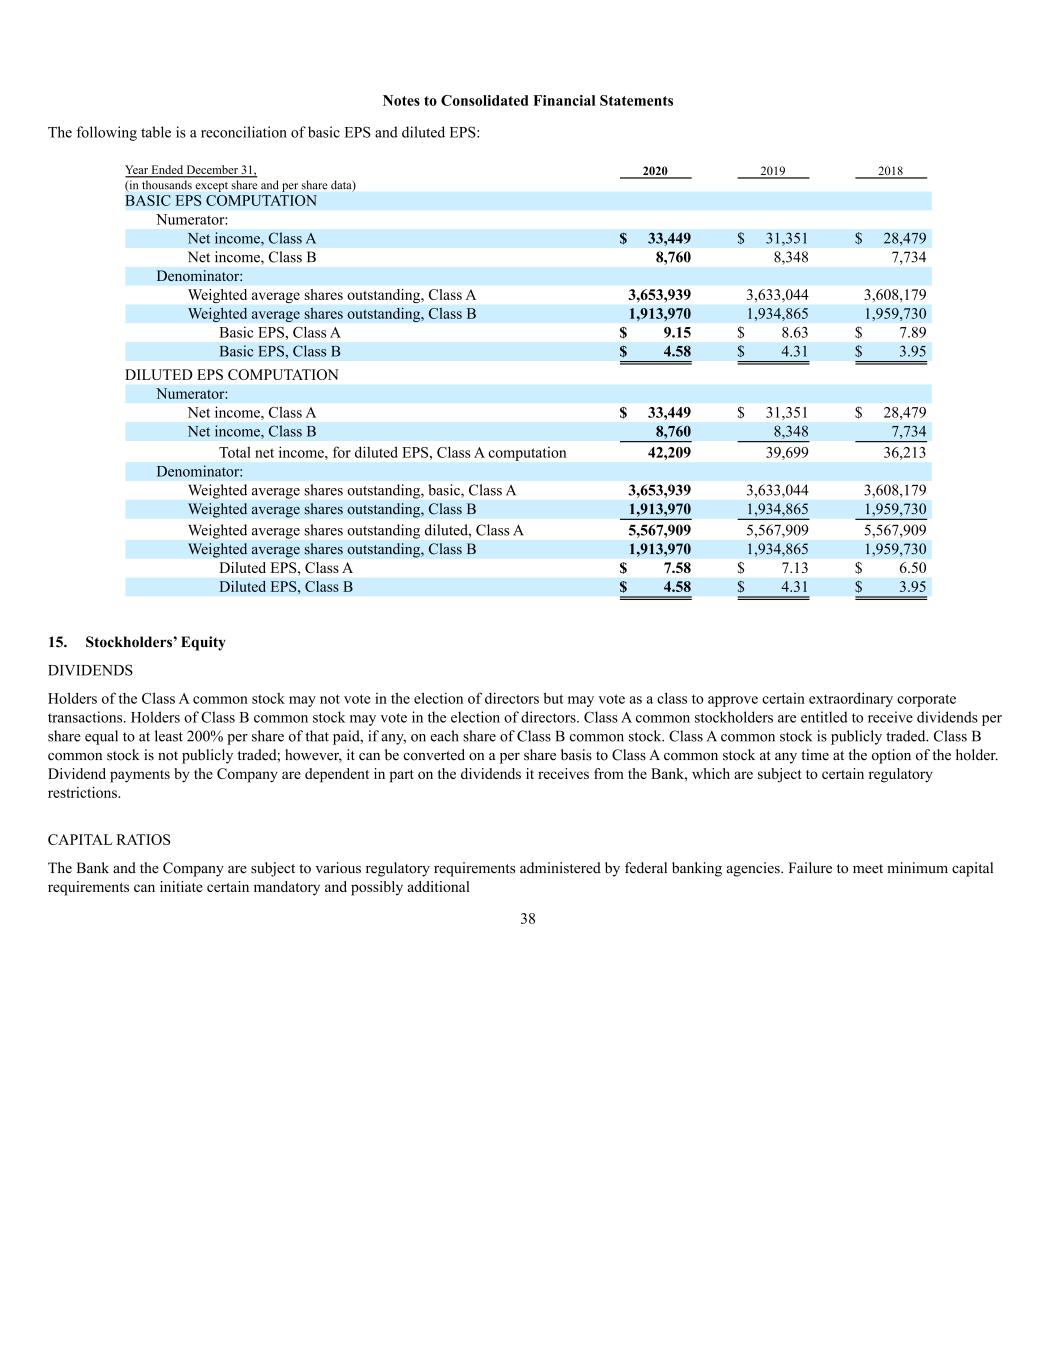
Notes to Consolidated Financial Statements The following table is a reconciliation of basic EPS and diluted EPS: Year Ended December 31, 2020 2019 2018 (in thousands except share and per share data) BASIC EPS COMPUTATION Numerator: Net income, Class A $ 33,449 $ 31,351 $ 28,479 Net income, Class B 8,760 8,348 7,734 Denominator: Weighted average shares outstanding, Class A 3,653,939 3,633,044 3,608,179 Weighted average shares outstanding, Class B 1,913,970 1,934,865 1,959,730 Basic EPS, Class A $ 9.15 $ 8.63 $ 7.89 Basic EPS, Class B $ 4.58 $ 4.31 $ 3.95 DILUTED EPS COMPUTATION Numerator: Net income, Class A $ 33,449 $ 31,351 $ 28,479 Net income, Class B 8,760 8,348 7,734 Total net income, for diluted EPS, Class A computation 42,209 39,699 36,213 Denominator: Weighted average shares outstanding, basic, Class A 3,653,939 3,633,044 3,608,179 Weighted average shares outstanding, Class B 1,913,970 1,934,865 1,959,730 Weighted average shares outstanding diluted, Class A 5,567,909 5,567,909 5,567,909 Weighted average shares outstanding, Class B 1,913,970 1,934,865 1,959,730 Diluted EPS, Class A $ 7.58 $ 7.13 $ 6.50 Diluted EPS, Class B $ 4.58 $ 4.31 $ 3.95 15. Stockholders’ Equity DIVIDENDS Holders of the Class A common stock may not vote in the election of directors but may vote as a class to approve certain extraordinary corporate transactions. Holders of Class B common stock may vote in the election of directors. Class A common stockholders are entitled to receive dividends per share equal to at least 200% per share of that paid, if any, on each share of Class B common stock. Class A common stock is publicly traded. Class B common stock is not publicly traded; however, it can be converted on a per share basis to Class A common stock at any time at the option of the holder. Dividend payments by the Company are dependent in part on the dividends it receives from the Bank, which are subject to certain regulatory restrictions. CAPITAL RATIOS The Bank and the Company are subject to various regulatory requirements administered by federal banking agencies. Failure to meet minimum capital requirements can initiate certain mandatory and possibly additional 38

Notes to Consolidated Financial Statements discretionary actions by regulators that, if undertaken, could have a direct material effect on the Bank and Company’s financial statements. Under capital adequacy guidelines and regulatory framework for prompt corrective action, the Bank and Company must meet specific capital guidelines that involve quantitative measures of the Bank and Company’s assets and liabilities, and certain off-balance-sheet items as calculated under regulatory accounting practices. The Bank and Company’s capital amounts and classification are also subject to qualitative judgments by the regulators about components, risk weightings and other factors. Quantitative measures established by regulation to ensure capital adequacy require the Bank and the Company to maintain minimum amounts and ratios (set forth in the table below) of total and Tier 1 capital (as defined in the regulation) to risk-weighted assets (as defined) and Tier 1 capital (as defined) to average assets (as defined). Management believes, as of December 31, 2020, that the Bank and the Company meet all capital adequacy requirements to which they are subject. The Basel Committee has issued capital standards entitled “Basel III: A global framework for more resilient banks and banking systems” (Basel III). The Federal Reserve has finalized its rule implementing the Basel III regulatory capital framework. The rule was effective in January 2015 and sets the Basel III minimum Regulatory capital requirements. To be categorized as well capitalized, the Bank must maintain minimum total risk-based, Common Equity tier 1, tier 1 risk-based, and Tier 1 leverage ratios as set forth in the table. There are no conditions or events since that notification that management believes would cause a change in the Bank’s categorization. The Bank’s actual capital amounts and ratios are presented in the following table: Actual For Capital Adequacy Purposes To Be Well Capitalized Under Prompt Corrective Action Provisions Amount Ratio Amount Ratio Amount Ratio As of December 31, 2020 (Basel III) Total Capital (to Risk-Weighted Assets) $448,695 13.03% $275,403 8.00% $ 344,254 10.00% Tier 1 Capital (to Risk-Weighted Assets) 413,209 12.00% 206,553 6.00% 275,403 8.00% Common Equity Tier 1 Capital (to Risk-Weighted Assets) 413,209 12.00% 154,914 4.50% 223,765 6.50% Tier 1 Capital (to 4th Quarter Average Assets) 413,209 6.41% 257,763 4.00% 322,204 5.00% As of December 31, 2019 (Basel III) Total Capital (to Risk-Weighted Assets) $401,850 13.57% $236,830 8.00% $ 296,037 10.00% Tier 1 Capital (to Risk-Weighted Assets) 372,265 12.57% 177,622 6.00% 236,830 8.00% Common Equity Tier 1 Capital (to Risk-Weighted Assets) 372,265 12.57% 133,217 4.50% 192,424 6.50% Tier 1 Capital (to 4th Quarter Average Assets) 372,265 7.01% 212,549 4.00% 265,686 5.00% 39
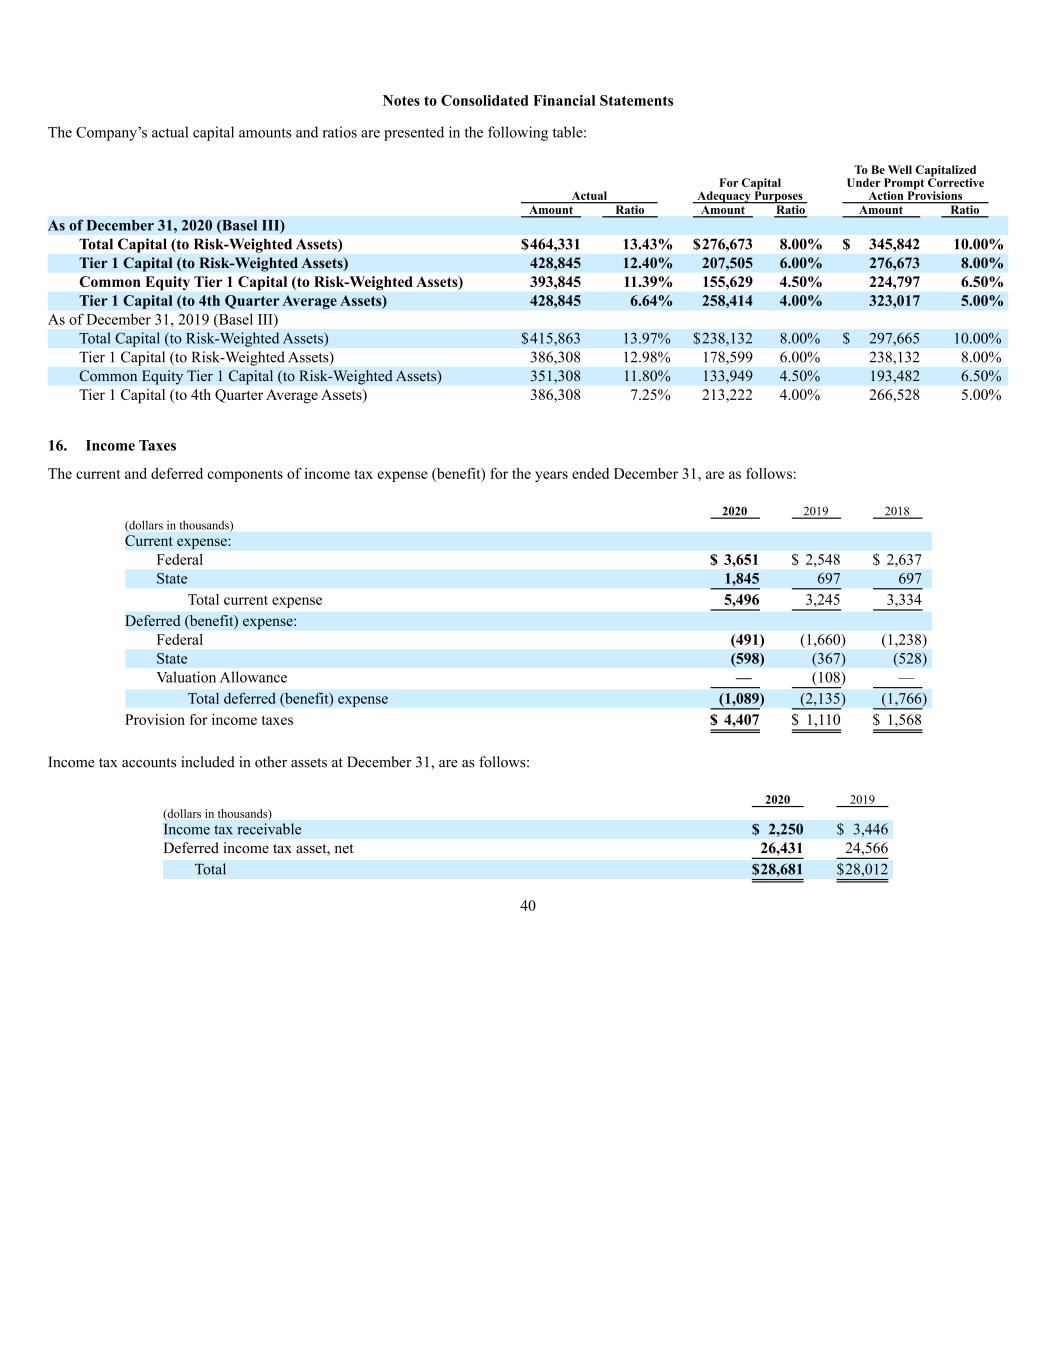
Notes to Consolidated Financial Statements The Company’s actual capital amounts and ratios are presented in the following table: Actual For Capital Adequacy Purposes To Be Well Capitalized Under Prompt Corrective Action Provisions Amount Ratio Amount Ratio Amount Ratio As of December 31, 2020 (Basel III) Total Capital (to Risk-Weighted Assets) $464,331 13.43% $276,673 8.00% $ 345,842 10.00% Tier 1 Capital (to Risk-Weighted Assets) 428,845 12.40% 207,505 6.00% 276,673 8.00% Common Equity Tier 1 Capital (to Risk-Weighted Assets) 393,845 11.39% 155,629 4.50% 224,797 6.50% Tier 1 Capital (to 4th Quarter Average Assets) 428,845 6.64% 258,414 4.00% 323,017 5.00% As of December 31, 2019 (Basel III) Total Capital (to Risk-Weighted Assets) $415,863 13.97% $238,132 8.00% $ 297,665 10.00% Tier 1 Capital (to Risk-Weighted Assets) 386,308 12.98% 178,599 6.00% 238,132 8.00% Common Equity Tier 1 Capital (to Risk-Weighted Assets) 351,308 11.80% 133,949 4.50% 193,482 6.50% Tier 1 Capital (to 4th Quarter Average Assets) 386,308 7.25% 213,222 4.00% 266,528 5.00% 16. Income Taxes The current and deferred components of income tax expense (benefit) for the years ended December 31, are as follows: 2020 2019 2018 (dollars in thousands) Current expense: Federal $ 3,651 $ 2,548 $ 2,637 State 1,845 697 697 Total current expense 5,496 3,245 3,334 Deferred (benefit) expense: Federal (491) (1,660) (1,238) State (598) (367) (528) Valuation Allowance — (108) — Total deferred (benefit) expense (1,089) (2,135) (1,766) Provision for income taxes $ 4,407 $ 1,110 $ 1,568 Income tax accounts included in other assets at December 31, are as follows: 2020 2019 (dollars in thousands) Income tax receivable $ 2,250 $ 3,446 Deferred income tax asset, net 26,431 24,566 Total $28,681 $28,012 40
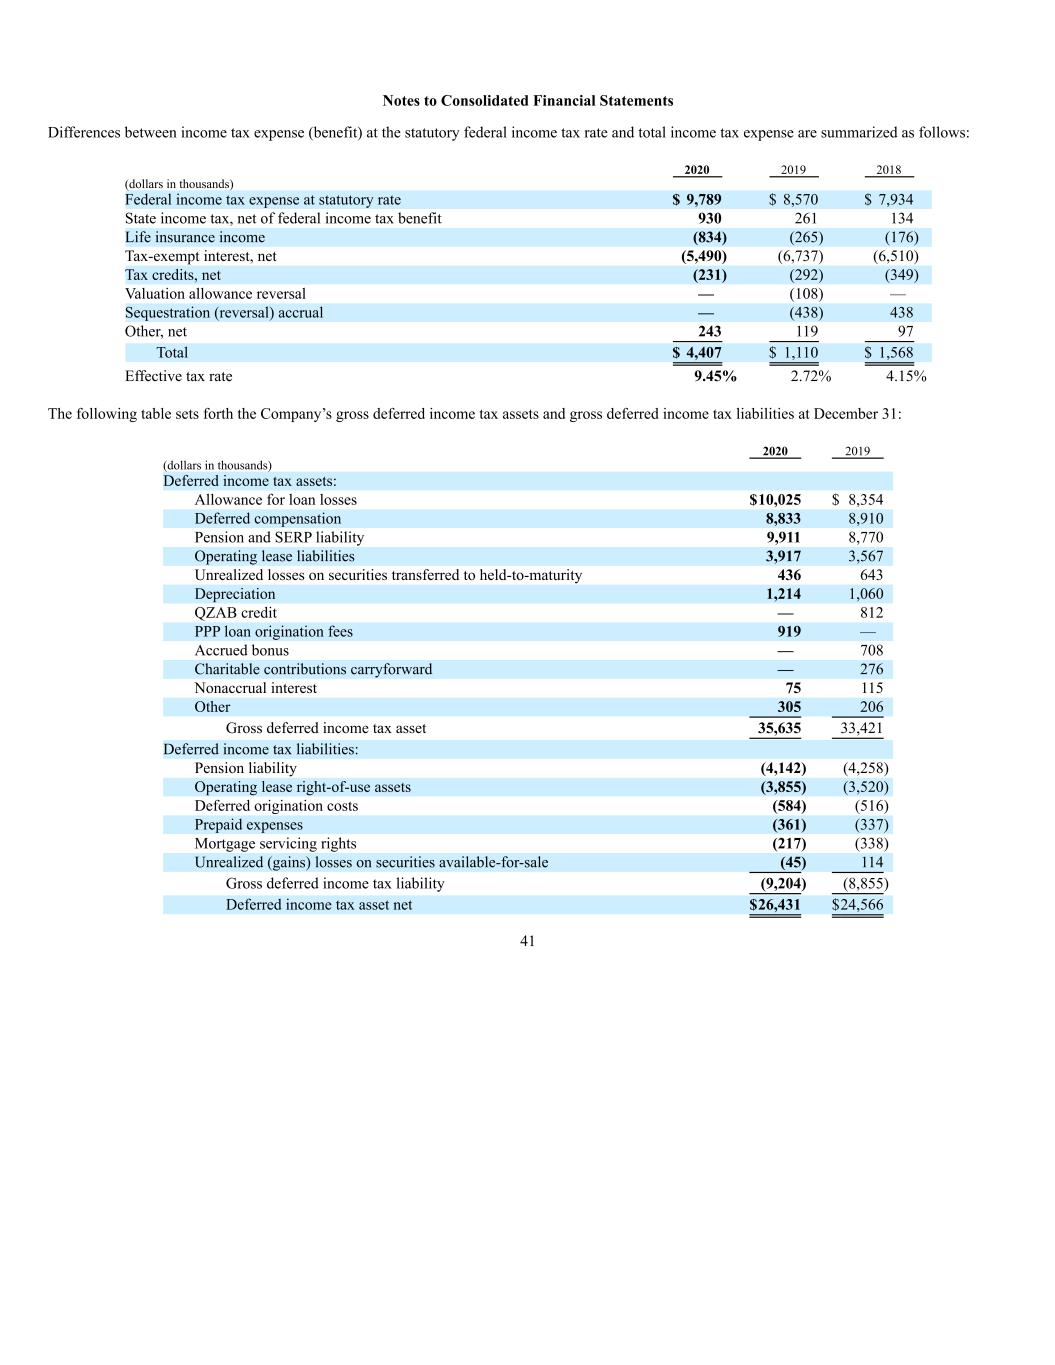
Notes to Consolidated Financial Statements Differences between income tax expense (benefit) at the statutory federal income tax rate and total income tax expense are summarized as follows: 2020 2019 2018 (dollars in thousands) Federal income tax expense at statutory rate $ 9,789 $ 8,570 $ 7,934 State income tax, net of federal income tax benefit 930 261 134 Life insurance income (834) (265) (176) Tax-exempt interest, net (5,490) (6,737) (6,510) Tax credits, net (231) (292) (349) Valuation allowance reversal — (108) — Sequestration (reversal) accrual — (438) 438 Other, net 243 119 97 Total $ 4,407 $ 1,110 $ 1,568 Effective tax rate 9.45% 2.72% 4.15% The following table sets forth the Company’s gross deferred income tax assets and gross deferred income tax liabilities at December 31: 2020 2019 (dollars in thousands) Deferred income tax assets: Allowance for loan losses $10,025 $ 8,354 Deferred compensation 8,833 8,910 Pension and SERP liability 9,911 8,770 Operating lease liabilities 3,917 3,567 Unrealized losses on securities transferred to held-to-maturity 436 643 Depreciation 1,214 1,060 QZAB credit — 812 PPP loan origination fees 919 — Accrued bonus — 708 Charitable contributions carryforward — 276 Nonaccrual interest 75 115 Other 305 206 Gross deferred income tax asset 35,635 33,421 Deferred income tax liabilities: Pension liability (4,142) (4,258) Operating lease right-of-use assets (3,855) (3,520) Deferred origination costs (584) (516) Prepaid expenses (361) (337) Mortgage servicing rights (217) (338) Unrealized (gains) losses on securities available-for-sale (45) 114 Gross deferred income tax liability (9,204) (8,855) Deferred income tax asset net $26,431 $24,566 41
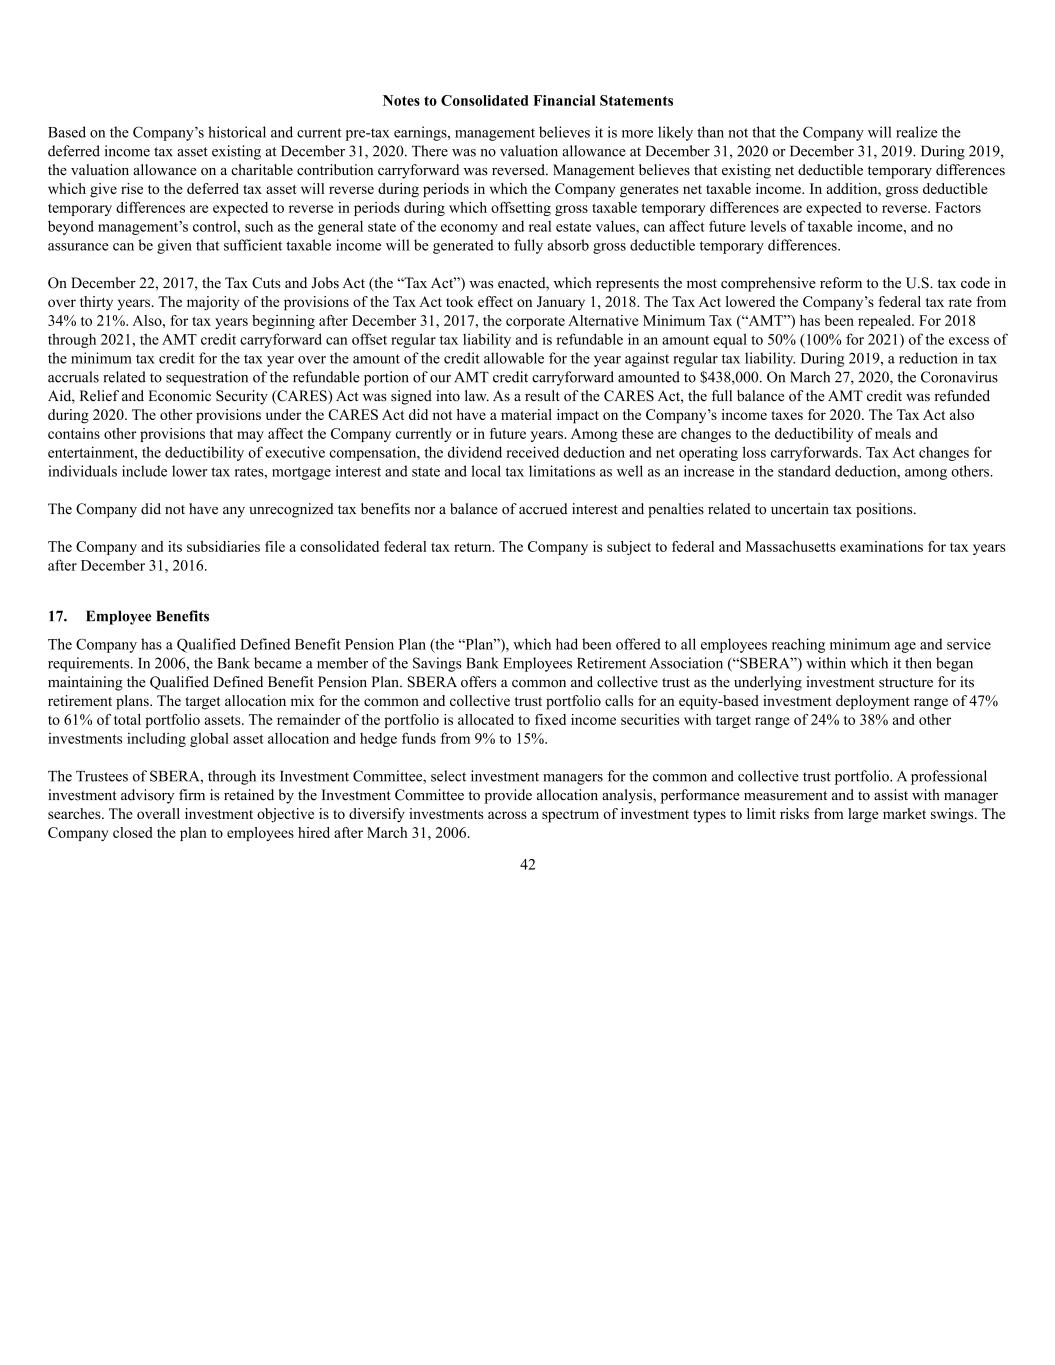
Notes to Consolidated Financial Statements Based on the Company’s historical and current pre-tax earnings, management believes it is more likely than not that the Company will realize the deferred income tax asset existing at December 31, 2020. There was no valuation allowance at December 31, 2020 or December 31, 2019. During 2019, the valuation allowance on a charitable contribution carryforward was reversed. Management believes that existing net deductible temporary differences which give rise to the deferred tax asset will reverse during periods in which the Company generates net taxable income. In addition, gross deductible temporary differences are expected to reverse in periods during which offsetting gross taxable temporary differences are expected to reverse. Factors beyond management’s control, such as the general state of the economy and real estate values, can affect future levels of taxable income, and no assurance can be given that sufficient taxable income will be generated to fully absorb gross deductible temporary differences. On December 22, 2017, the Tax Cuts and Jobs Act (the “Tax Act”) was enacted, which represents the most comprehensive reform to the U.S. tax code in over thirty years. The majority of the provisions of the Tax Act took effect on January 1, 2018. The Tax Act lowered the Company’s federal tax rate from 34% to 21%. Also, for tax years beginning after December 31, 2017, the corporate Alternative Minimum Tax (“AMT”) has been repealed. For 2018 through 2021, the AMT credit carryforward can offset regular tax liability and is refundable in an amount equal to 50% (100% for 2021) of the excess of the minimum tax credit for the tax year over the amount of the credit allowable for the year against regular tax liability. During 2019, a reduction in tax accruals related to sequestration of the refundable portion of our AMT credit carryforward amounted to $438,000. On March 27, 2020, the Coronavirus Aid, Relief and Economic Security (CARES) Act was signed into law. As a result of the CARES Act, the full balance of the AMT credit was refunded during 2020. The other provisions under the CARES Act did not have a material impact on the Company’s income taxes for 2020. The Tax Act also contains other provisions that may affect the Company currently or in future years. Among these are changes to the deductibility of meals and entertainment, the deductibility of executive compensation, the dividend received deduction and net operating loss carryforwards. Tax Act changes for individuals include lower tax rates, mortgage interest and state and local tax limitations as well as an increase in the standard deduction, among others. The Company did not have any unrecognized tax benefits nor a balance of accrued interest and penalties related to uncertain tax positions. The Company and its subsidiaries file a consolidated federal tax return. The Company is subject to federal and Massachusetts examinations for tax years after December 31, 2016. 17. Employee Benefits The Company has a Qualified Defined Benefit Pension Plan (the “Plan”), which had been offered to all employees reaching minimum age and service requirements. In 2006, the Bank became a member of the Savings Bank Employees Retirement Association (“SBERA”) within which it then began maintaining the Qualified Defined Benefit Pension Plan. SBERA offers a common and collective trust as the underlying investment structure for its retirement plans. The target allocation mix for the common and collective trust portfolio calls for an equity-based investment deployment range of 47% to 61% of total portfolio assets. The remainder of the portfolio is allocated to fixed income securities with target range of 24% to 38% and other investments including global asset allocation and hedge funds from 9% to 15%. The Trustees of SBERA, through its Investment Committee, select investment managers for the common and collective trust portfolio. A professional investment advisory firm is retained by the Investment Committee to provide allocation analysis, performance measurement and to assist with manager searches. The overall investment objective is to diversify investments across a spectrum of investment types to limit risks from large market swings. The Company closed the plan to employees hired after March 31, 2006. 42

Notes to Consolidated Financial Statements The measurement date for the Plan is December 31 for each year. The benefits expected to be paid in each year from 2021 to 2025 are $2,008,000, $2,188,000, $2,322,000, $2,521,000, and $2,707,000, respectively. The aggregate benefits expected to be paid in the five years from 2026 to 2030 are $16,087,000. The framework for measuring fair value provides a fair value hierarchy that prioritizes the inputs to valuation techniques used to measure fair value. The hierarchy gives the highest priority to unadjusted quoted prices in active markets for identical assets or liabilities (level 1) and the lowest priority to unobservable inputs (level 3). Valuation techniques maximize the use of relevant observable inputs and minimize the use of unobservable inputs. The three levels of the fair value hierarchy under Topic 820 are described as follows: LEVEL 1 Inputs to the valuation methodology are quoted market prices (unadjusted) for identical assets or liabilities in active markets that the Company has the ability to access at the measurement date. LEVEL 2 Inputs other than quoted prices included within level 1 that are observable for the asset or liability, either directly or indirectly, such as: quoted prices for similar assets or liabilities in active markets; quoted prices for identical or similar assets or liabilities in inactive markets; inputs other that quoted prices that are observable for the asset or liability; or inputs that are derived principally from or corroborated by observable market data by correlation or other means. If the asset or liability has specified (contractual) term, the level 2 input must be observable for substantially the full term of the asset or liability. LEVEL 3 Inputs that are unobservable inputs for the asset or liability. Below is a description of the valuation methodologies used for assets measured at fair value. Collective Funds Valued at either the closing price reported on the active market on which the individual securities are traded or valued at the net asset value (NAV) of units of a collective trust. The NAV, as provided by the trustee, is used as a practical expedient to estimate fair value. The NAV is based on the fair value of the underlying investments held by the fund less its liabilities. This practical expedient is not used when it is determined to be probable that the fund will sell the investment for an amount different than the reported NAV. Participant transactions (purchases and sales) may occur daily. Were SBERA to initiate a full redemption of the collective trust, the investment advisor reserves the right to temporarily delay withdrawal from the trust in order to ensure that securities liquidations will be carried out in an orderly business manner. Equity Securities Valued at the closing price reported on the active market on which the individual securities are traded. Mutual Funds Valued at the daily closing price as reported by the fund. Mutual funds held open-end mutual funds that are registered with the U.S. Securities and Exchange Commission. The funds are required to publish their daily NAV and to transact at that price. The mutual funds held are deemed to be actively traded. 43
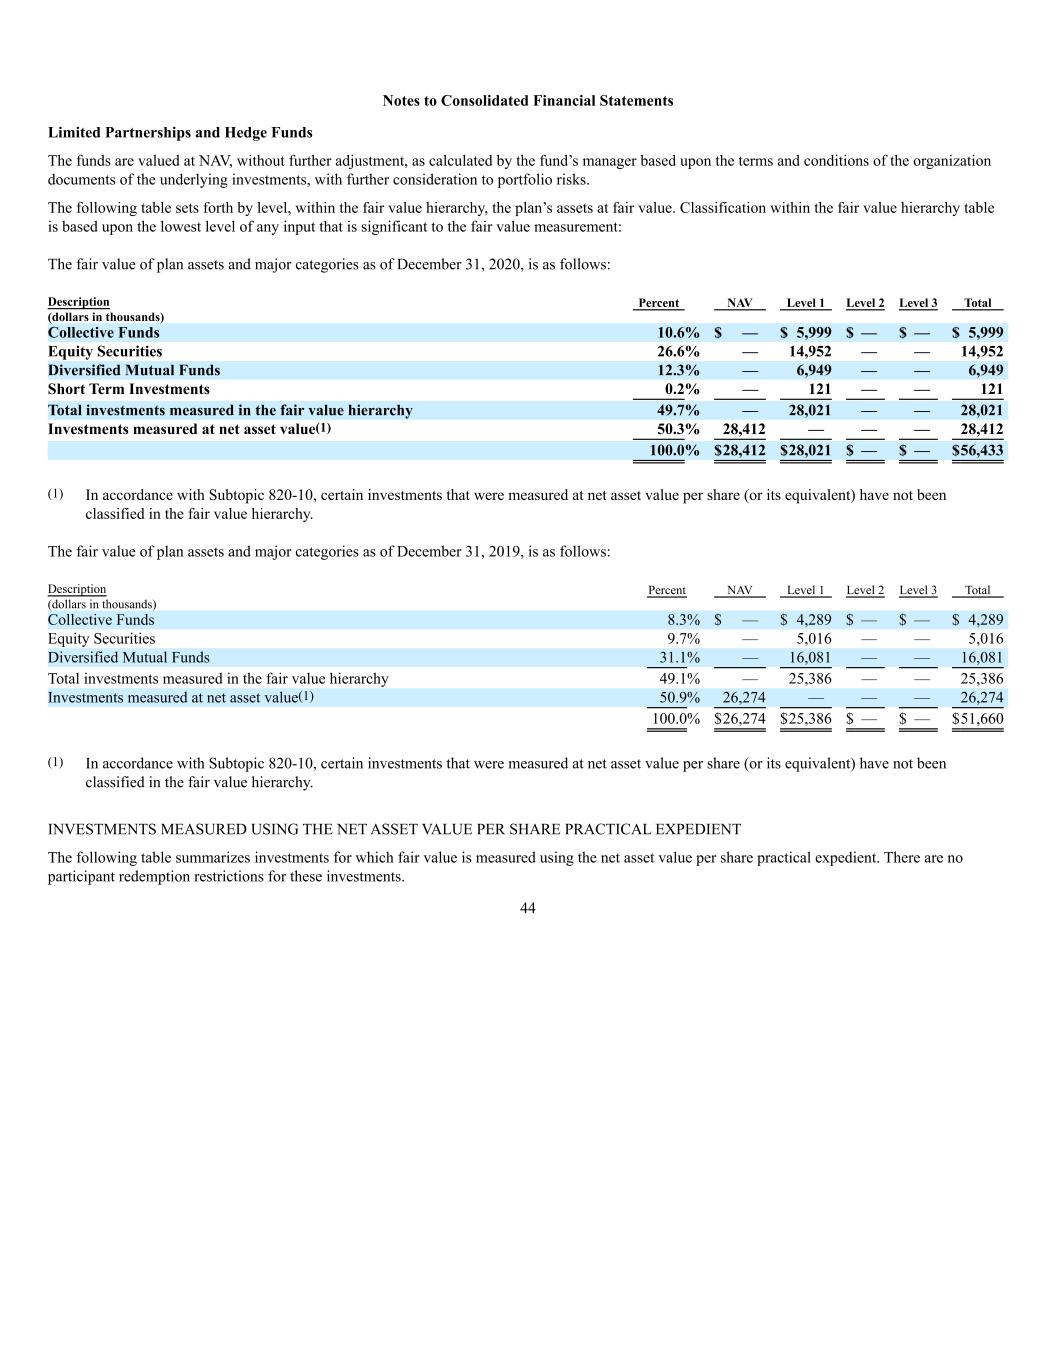
Notes to Consolidated Financial Statements Limited Partnerships and Hedge Funds The funds are valued at NAV, without further adjustment, as calculated by the fund’s manager based upon the terms and conditions of the organization documents of the underlying investments, with further consideration to portfolio risks. The following table sets forth by level, within the fair value hierarchy, the plan’s assets at fair value. Classification within the fair value hierarchy table is based upon the lowest level of any input that is significant to the fair value measurement: The fair value of plan assets and major categories as of December 31, 2020, is as follows: Description Percent NAV Level 1 Level 2 Level 3 Total (dollars in thousands) Collective Funds 10.6% $ — $ 5,999 $ — $ — $ 5,999 Equity Securities 26.6% — 14,952 — — 14,952 Diversified Mutual Funds 12.3% — 6,949 — — 6,949 Short Term Investments 0.2% — 121 — — 121 Total investments measured in the fair value hierarchy 49.7% — 28,021 — — 28,021 Investments measured at net asset value(1) 50.3% 28,412 — — — 28,412 100.0% $28,412 $28,021 $ — $ — $56,433 (1) In accordance with Subtopic 820-10, certain investments that were measured at net asset value per share (or its equivalent) have not been classified in the fair value hierarchy. The fair value of plan assets and major categories as of December 31, 2019, is as follows: Description Percent NAV Level 1 Level 2 Level 3 Total (dollars in thousands) Collective Funds 8.3% $ — $ 4,289 $ — $ — $ 4,289 Equity Securities 9.7% — 5,016 — — 5,016 Diversified Mutual Funds 31.1% — 16,081 — — 16,081 Total investments measured in the fair value hierarchy 49.1% — 25,386 — — 25,386 Investments measured at net asset value(1) 50.9% 26,274 — — — 26,274 100.0% $26,274 $25,386 $ — $ — $51,660 (1) In accordance with Subtopic 820-10, certain investments that were measured at net asset value per share (or its equivalent) have not been classified in the fair value hierarchy. INVESTMENTS MEASURED USING THE NET ASSET VALUE PER SHARE PRACTICAL EXPEDIENT The following table summarizes investments for which fair value is measured using the net asset value per share practical expedient. There are no participant redemption restrictions for these investments. 44
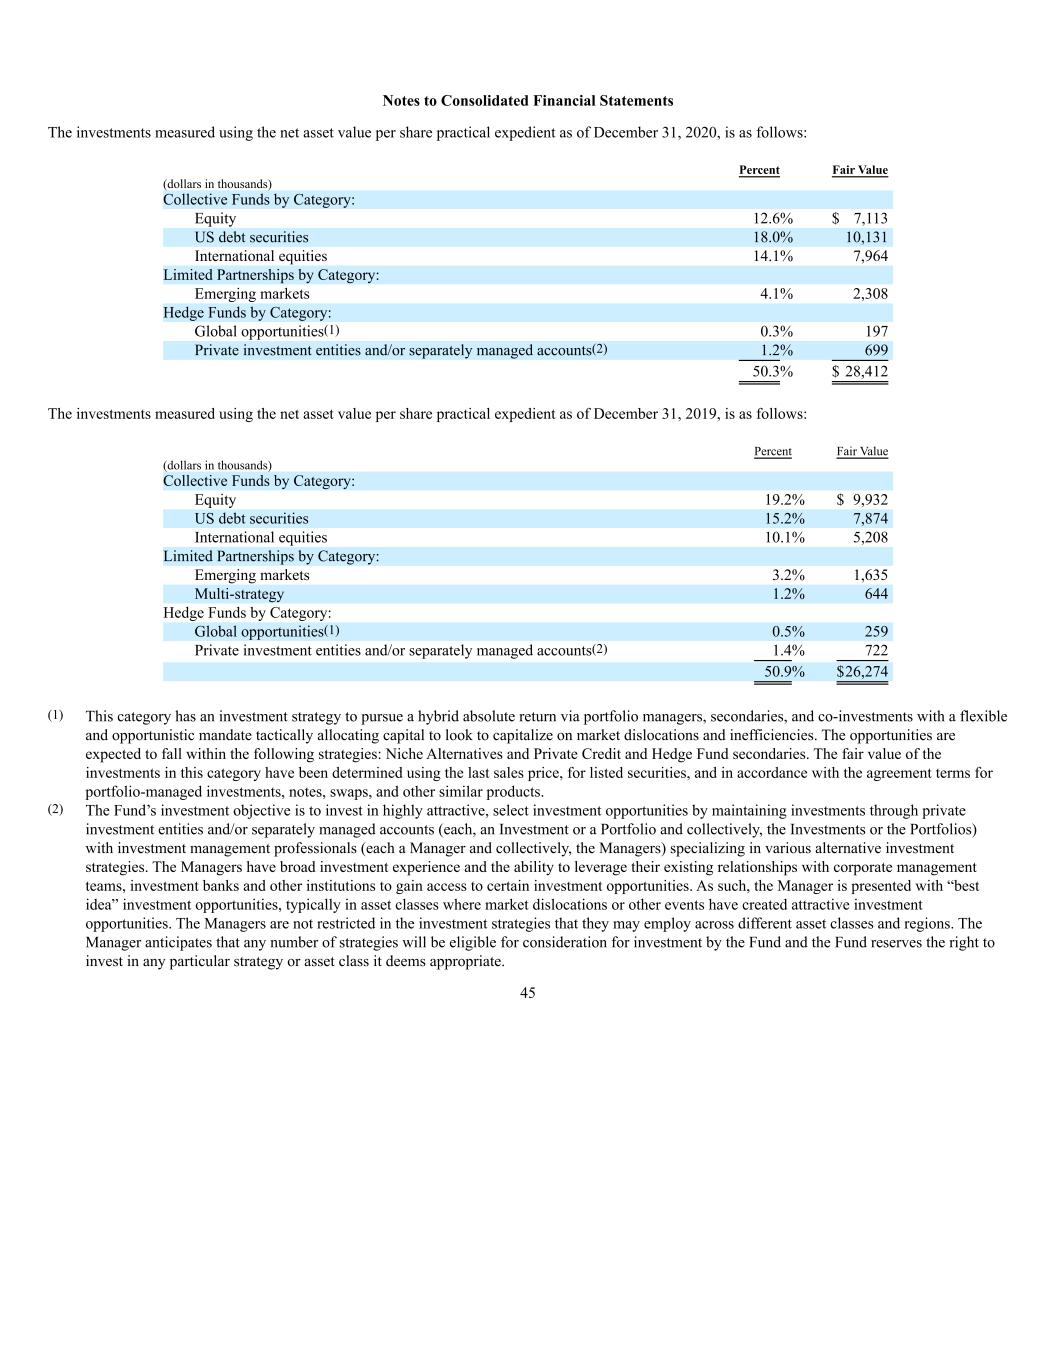
Notes to Consolidated Financial Statements The investments measured using the net asset value per share practical expedient as of December 31, 2020, is as follows: Percent Fair Value (dollars in thousands) Collective Funds by Category: Equity 12.6% $ 7,113 US debt securities 18.0% 10,131 International equities 14.1% 7,964 Limited Partnerships by Category: Emerging markets 4.1% 2,308 Hedge Funds by Category: Global opportunities(1) 0.3% 197 Private investment entities and/or separately managed accounts(2) 1.2% 699 50.3% $ 28,412 The investments measured using the net asset value per share practical expedient as of December 31, 2019, is as follows: Percent Fair Value (dollars in thousands) Collective Funds by Category: Equity 19.2% $ 9,932 US debt securities 15.2% 7,874 International equities 10.1% 5,208 Limited Partnerships by Category: Emerging markets 3.2% 1,635 Multi-strategy 1.2% 644 Hedge Funds by Category: Global opportunities(1) 0.5% 259 Private investment entities and/or separately managed accounts(2) 1.4% 722 50.9% $26,274 (1) This category has an investment strategy to pursue a hybrid absolute return via portfolio managers, secondaries, and co-investments with a flexible and opportunistic mandate tactically allocating capital to look to capitalize on market dislocations and inefficiencies. The opportunities are expected to fall within the following strategies: Niche Alternatives and Private Credit and Hedge Fund secondaries. The fair value of the investments in this category have been determined using the last sales price, for listed securities, and in accordance with the agreement terms for portfolio-managed investments, notes, swaps, and other similar products. (2) The Fund’s investment objective is to invest in highly attractive, select investment opportunities by maintaining investments through private investment entities and/or separately managed accounts (each, an Investment or a Portfolio and collectively, the Investments or the Portfolios) with investment management professionals (each a Manager and collectively, the Managers) specializing in various alternative investment strategies. The Managers have broad investment experience and the ability to leverage their existing relationships with corporate management teams, investment banks and other institutions to gain access to certain investment opportunities. As such, the Manager is presented with “best idea” investment opportunities, typically in asset classes where market dislocations or other events have created attractive investment opportunities. The Managers are not restricted in the investment strategies that they may employ across different asset classes and regions. The Manager anticipates that any number of strategies will be eligible for consideration for investment by the Fund and the Fund reserves the right to invest in any particular strategy or asset class it deems appropriate. 45

Notes to Consolidated Financial Statements The Company has a Supplemental Executive Insurance/Retirement Plan (the Supplemental Plan), which is limited to certain officers and employees of the Company. The Supplemental Plan is voluntary. Under the Supplemental Plan, each participant will receive a retirement benefit based on compensation and length of service. Life insurance policies, which are owned by the Company, are purchased covering the lives of each participant. The benefits expected to be paid in each year from 2021 to 2025 are $2,570,000, $2,507,000, $2,439,000, $2,595,000, and $3,102,000, respectively. The aggregate benefits expected to be paid in the five years from 2026 to 2030 are $17,913,000. Defined Benefit Pension Plan Supplemental Insurance/ Retirement Plan 2020 2019 2020 2019 (dollars in thousands) Change projected in benefit obligation Benefit obligation at beginning of year $ 49,434 $ 40,509 $ 49,976 $ 40,405 Service cost 1,377 1,103 1,412 1,024 Interest cost 1,801 1,892 1,862 1,926 Prior service cost — — 501 — Actuarial (gain)/loss 3,245 7,099 4,703 7,537 Benefits paid (1,418) (1,169) (4,511) (916) Projected benefit obligation at end of year $ 54,439 $ 49,434 $ 53,943 $ 49,976 Change in plan assets Fair value of plan assets at beginning of year $ 51,660 $ 44,437 Actual return on plan assets 6,191 8,392 Employer contributions — — Benefits paid (1,418) (1,169) Fair value of plan assets at end of year $ 56,433 $ 51,660 (Unfunded) Funded status $ 1,994 $ 2,226 $(53,943) $(49,976) Accumulated benefit obligation $ 54,439 $ 49,434 $ 48,767 $ 45,238 Weighted-average assumptions as of December 31 Discount rate—Liability 3.25% 3.71% 3.21% 3.71% Discount rate—Expense 3.71% 4.76% 3.71% 4.79% Expected return on plan assets 7.50% 7.50% NA NA Rate of compensation increase 4.00% 4.00% 4.00% 4.00% Components of net periodic benefit cost Service cost $ 1,377 $ 1,103 $ 1,412 $ 1,024 Interest cost 1,801 1,892 1,862 1,926 Expected return on plan assets (3,808) (3,275) — — Recognized prior service cost — — 114 114 Recognized net losses 1,041 916 848 435 Net periodic cost (benefit) $ 411 $ 636 $ 4,236 $ 3,499 Other changes in plan assets and benefit obligations recognized in other comprehensive income Amortization of prior service cost $ — $ — $ (114) $ (114) Net (gain) loss (179) 1,066 3,809 7,101 Total recognized in other comprehensive income (179) 1,066 3,695 6,987 Total recognized in net periodic benefit cost and other comprehensive income $ 232 $ 1,702 $ 7,931 $ 10,486 46

Notes to Consolidated Financial Statements The following table represents the unrecognized pension liability at the time period indicated: Plan December 31, 2020 Supplemental Plan Total Plan December 31, 2019 Supplemental Plan Total (dollars in thousands) Prior service cost $ — $ (739) $ (739) $ — $ (307) $ (307) Net actuarial loss (12,741) (21,780) (34,521) (12,920) (17,971) (30,891) Total $(12,741) $ (22,519) $(35,260) $(12,920) $ (18,278) $(31,198) 47 The following table summarizes the amounts included in Accumulated Other Comprehensive Loss at December 31, 2020, expected to be recognized as components of net periodic benefit cost in the next year: Plan Supplemental Plan Amortization of prior service cost to be recognized in 2021 $— $ 214 Amortization of loss to be recognized in 2021 965 1,079 Assumptions for the expected return on plan assets and discount rates in the Company’s Plan and Supplemental Plan are periodically reviewed. As part of the review, management in consultation with independent consulting actuaries performs an analysis of expected returns based on the plan’s asset allocation. This forecast reflects the Company’s and actuarial firm’s expected return on plan assets for each significant asset class or economic indicator. The range of returns developed relies on forecasts and on broad market historical benchmarks for expected return, correlation and volatility for each asset class. Also, as a part of the review, the Company’s management in consultation with independent consulting actuaries performs an analysis of discount rates based on expected returns of high-grade fixed income debt securities. Prior to December 31, 2019, the Company utilized a full yield curve approach in the estimation of the service and interest components of the net periodic pension cost by applying the specific spot rates along the yield curve used in the determination of the benefit obligation to their underlying projected cash flows. Beginning December 31, 2019, the discount rate was determined by preparing an analysis of the respective plan’s expected future cash flows and high-quality fixed-income investments currently available and expected to be available during the period to maturity of the benefits. Mortality assumptions are based on the “RP 2015 Mortality Table projected with Scale MP 2016” in 2019 and the “Amount-weighted Pri- 2012 White Collar Mortality Table, adjusted for mortality improvements with the Scale MP—2020 mortality improvement scale on a generational basis in 2020.” This methodology more accurately matches yields to the expected benefit payments than the previous method. The discount rate used is an estimate of the rate at which the plans could settle their obligations. Rather than using a rate and curve developed using a bond portfolio, this method selects individual bonds to match to the expected cash flows of the Plans. This provides a more accurate depiction of the true cost to the plans to settle the obligations as the Plans could theoretically go into the marketplace and purchase the specific bonds used in the analysis in order to settle the obligations of the Plans. The financial impact of the enhanced estimate to the discount rate amounted to approximately $6,800,000 decrease in the projected benefit obligations for the combined plans at December 31, 2019. The Company offers a 401(k) defined contribution plan for all employees reaching minimum age and service requirements. The plan is voluntary and employee contributions are matched by the Company at a rate of 33.3% for the first 6% of compensation contributed by each employee. The Company’s match totaled $533,000 for 2020, $458,000 for 2019 and $454,000 for 2018. Administrative costs associated with the plan are absorbed by the Company.
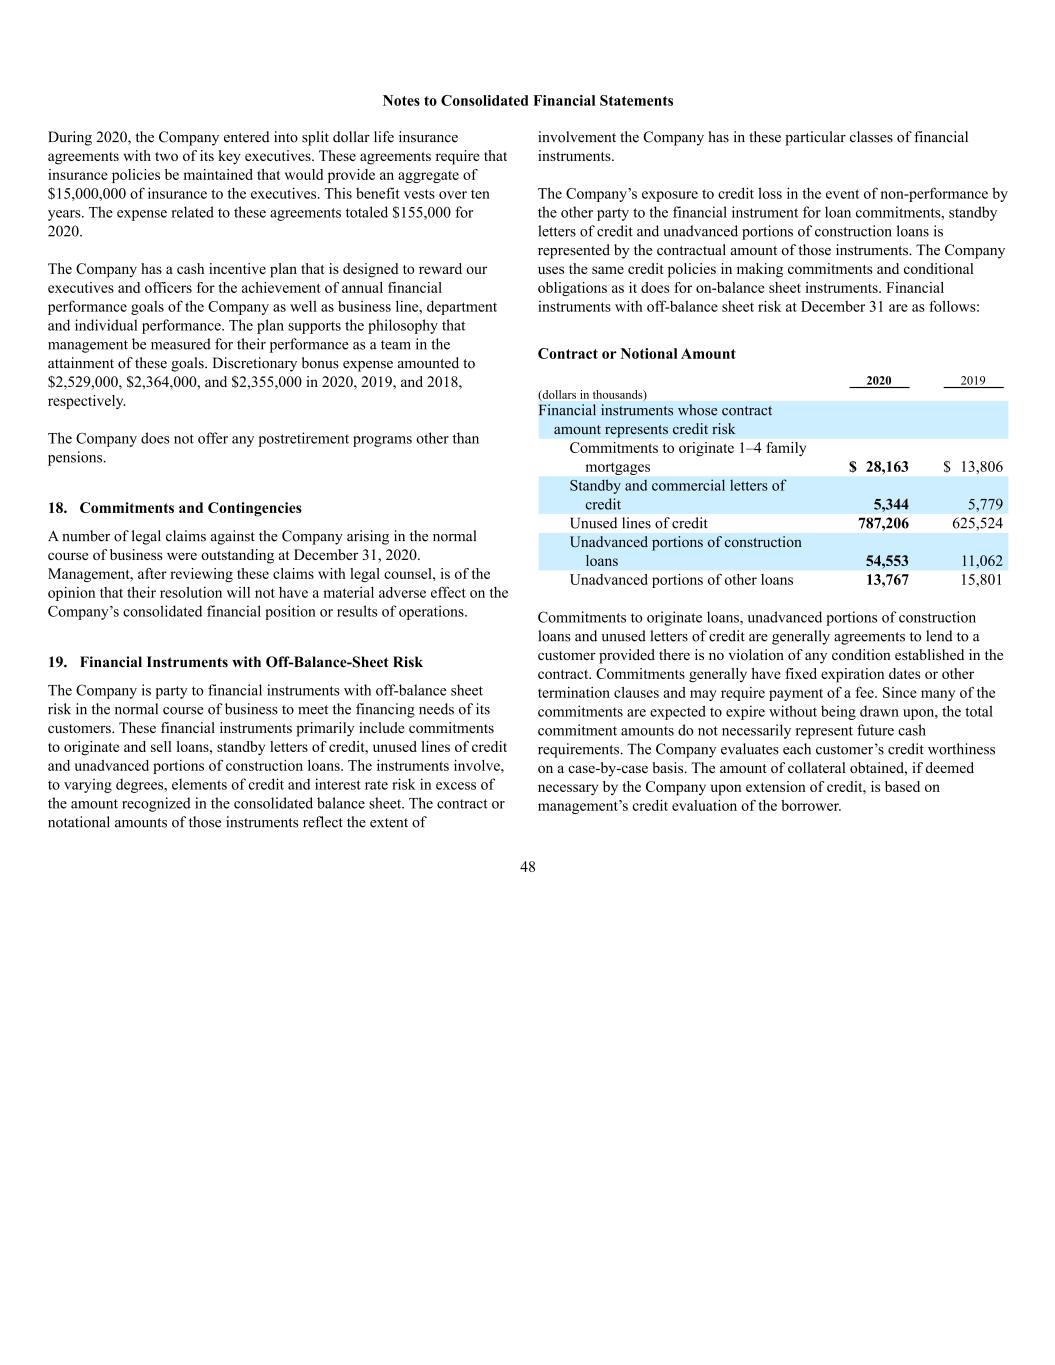
Notes to Consolidated Financial Statements 48 During 2020, the Company entered into split dollar life insurance agreements with two of its key executives. These agreements require that insurance policies be maintained that would provide an aggregate of $15,000,000 of insurance to the executives. This benefit vests over ten years. The expense related to these agreements totaled $155,000 for 2020. The Company has a cash incentive plan that is designed to reward our executives and officers for the achievement of annual financial performance goals of the Company as well as business line, department and individual performance. The plan supports the philosophy that management be measured for their performance as a team in the attainment of these goals. Discretionary bonus expense amounted to $2,529,000, $2,364,000, and $2,355,000 in 2020, 2019, and 2018, respectively. The Company does not offer any postretirement programs other than pensions. 18. Commitments and Contingencies A number of legal claims against the Company arising in the normal course of business were outstanding at December 31, 2020. Management, after reviewing these claims with legal counsel, is of the opinion that their resolution will not have a material adverse effect on the Company’s consolidated financial position or results of operations. 19. Financial Instruments with Off-Balance-Sheet Risk The Company is party to financial instruments with off-balance sheet risk in the normal course of business to meet the financing needs of its customers. These financial instruments primarily include commitments to originate and sell loans, standby letters of credit, unused lines of credit and unadvanced portions of construction loans. The instruments involve, to varying degrees, elements of credit and interest rate risk in excess of the amount recognized in the consolidated balance sheet. The contract or notational amounts of those instruments reflect the extent of involvement the Company has in these particular classes of financial instruments. The Company’s exposure to credit loss in the event of non-performance by the other party to the financial instrument for loan commitments, standby letters of credit and unadvanced portions of construction loans is represented by the contractual amount of those instruments. The Company uses the same credit policies in making commitments and conditional obligations as it does for on-balance sheet instruments. Financial instruments with off-balance sheet risk at December 31 are as follows: Contract or Notional Amount 2020 2019 (dollars in thousands) Financial instruments whose contract amount represents credit risk Commitments to originate 1–4 family mortgages $ 28,163 $ 13,806 Standby and commercial letters of credit 5,344 5,779 Unused lines of credit 787,206 625,524 Unadvanced portions of construction loans 54,553 11,062 Unadvanced portions of other loans 13,767 15,801 Commitments to originate loans, unadvanced portions of construction loans and unused letters of credit are generally agreements to lend to a customer provided there is no violation of any condition established in the contract. Commitments generally have fixed expiration dates or other termination clauses and may require payment of a fee. Since many of the commitments are expected to expire without being drawn upon, the total commitment amounts do not necessarily represent future cash requirements. The Company evaluates each customer’s credit worthiness on a case-by-case basis. The amount of collateral obtained, if deemed necessary by the Company upon extension of credit, is based on management’s credit evaluation of the borrower.

Notes to Consolidated Financial Statements 49 Standby letters of credit are conditional commitments issued by the Company to guarantee the performance by a customer to a third party. The credit risk involved in issuing letters of credit is essentially the same as that involved in extending loan facilities to customers. 20. Other Operating Expenses Year ended December 31, 2020 2019 2018 (dollars in thousands) Marketing $ 1,295 $ 2,132 $ 2,346 Software maintenance/amortization 2,580 2,409 2,002 Legal and audit 1,668 1,514 1,444 Contributions 870 813 1,077 Processing services 1,712 1,875 1,740 Consulting 1,151 1,552 1,464 Postage and delivery 896 1,002 1,021 Supplies 1,096 985 987 Telephone 1,012 956 946 Directors’ fees 500 456 478 Insurance 464 456 420 Pension 1,859 2,008 678 Other 2,373 1,744 1,685 Total $17,476 $17,902 $16,288 21. Fair Values of Financial Instruments The following methods and assumptions were used by the Company in estimating fair values of its financial instruments. Excluded from this disclosure are all non-financial instruments. Accordingly, the aggregate fair value amounts presented do not represent the underlying value of the Company. The assumptions used below are expected to approximate those that market participants would use in valuing these financial instruments. Fair value estimates are made at a specific point in time, based on available market information and judgments about the financial instrument, including estimates of timing, amount of expected future cash flows and the credit standing of the issuer. Such estimates do not consider the tax impact of the realization of unrealized gains or losses. In some cases, the fair value estimates cannot be substantiated by comparison to independent markets. In addition, the disclosed fair value may not be realized in the immediate settlement of the financial instrument. Care should be exercised in deriving conclusions about our business, its value or financial position based on the fair value information of financial instruments presented below. SECURITIES HELD-TO-MATURITY The fair values of these securities were based on quoted market prices, where available, as provided by third-party investment portfolio pricing vendors. If quoted market prices were not available, fair values provided by the vendors were based on quoted market prices of comparable instruments in active markets and/or based on a matrix pricing methodology which employs The Bond Market Association’s standard calculations for cash flow and price/yield analysis, live benchmark bond pricing and terms/condition data available from major pricing sources. Management regards the inputs and methods used by third party pricing vendors to be “Level 2 inputs and methods” as defined in the “fair value hierarchy” provided by FASB. LOANS The fair value of loans is estimated using the exit price notion consistent with Topic 820, Fair Value Measurement. Fair value is determined based on a discounted cash flow analysis. The discounted cash flow analysis was based on the contractual maturity of the loan and market indications of rates, prepayment speeds, defaults and credit risk. For certain non-performing assets fair value is determined based on the estimated values of the underlying collateral of individual analysis of receipts. TIME DEPOSITS The fair value of time deposits was estimated using a discounted cash flow approach that applies prevailing market interest rates for similar maturity instruments. The fair values of the Company’s time deposit liabilities do not take into consideration the value of the Company’s long-term relationships with depositors, which may have significant value.

Notes to Consolidated Financial Statements Fair Value Measurements Carrying Amount Estimated Fair Value Level 1 Inputs Level 2 Inputs Level 3 Inputs (dollars in thousands) December 31, 2020 Financial assets: Securities held-to-maturity $2,509,088 $2,579,103 $ — $2,579,103 $ — Loans(1) 2,960,343 2,902,390 — — 2,902,390 Financial liabilities: Time deposits 546,143 556,470 — 556,470 — Other borrowed funds 177,009 183,000 — 183,000 — Subordinated debentures 36,083 36,083 — 36,083 — December 31, 2019 Financial assets: Securities held-to-maturity $2,351,120 $2,361,304 $ — $2,361,304 $ — Loans(1) 2,396,534 2,424,770 — — 2,424,770 Financial liabilities: Time deposits 555,447 560,746 — 560,746 — Other borrowed funds 370,955 374,531 — 374,531 — Subordinated debentures 36,083 36,083 — 36,083 — (1) Comprised of loans (including collateral dependent impaired loans), net of deferred loan costs and the allowance for loan losses. 50 OTHER BORROWED FUNDS The fair value of other borrowed funds is based on the discounted value of contractual cash flows. The discount rate used is estimated based on the rates currently offered for other borrowed funds of similar remaining maturities. SUBORDINATED DEBENTURES The fair value of subordinated debentures is based on the discounted value of contractual cash flows. The discount rate used is estimated based on the rates currently offered for other subordinated debentures of similar remaining maturities. The following presents (in thousands) the carrying amount, estimated fair value, and placement in the fair value hierarchy of the Company’s financial instruments as of December 31, 2020 and December 31, 2019. This table excludes financial instruments for which the carrying amount approximates fair value. Financial assets for which the fair value approximates carrying value include cash and cash equivalents, FHLBB stock and accrued interest receivable. Financial liabilities for which the fair value approximates carrying value include deposits other than time deposits, securities sold under agreements to repurchase, and accrued interest payable. LIMITATIONS Fair value estimates are made at a specific point in time, based on relevant market information and information about the type of financial instrument. These estimates do not reflect any premium or discount that could result from offering for sale at one time the Bank’s entire holdings of a particular financial instrument. Because no active market exists for some of the Bank’s financial instruments, fair value estimates are based on judgments regarding future expected loss experience, cash flows, current economic conditions, risk characteristics and other factors. These estimates are subjective in nature and involve uncertainties and matters of significant judgment and therefore cannot be determined with precision. Changes in assumptions and changes in the loan, debt and interest rate markets could significantly affect the estimates. Further, the income tax ramifications related to the realization of the unrealized gains and losses can have a significant effect on the fair value estimates and have not been considered.
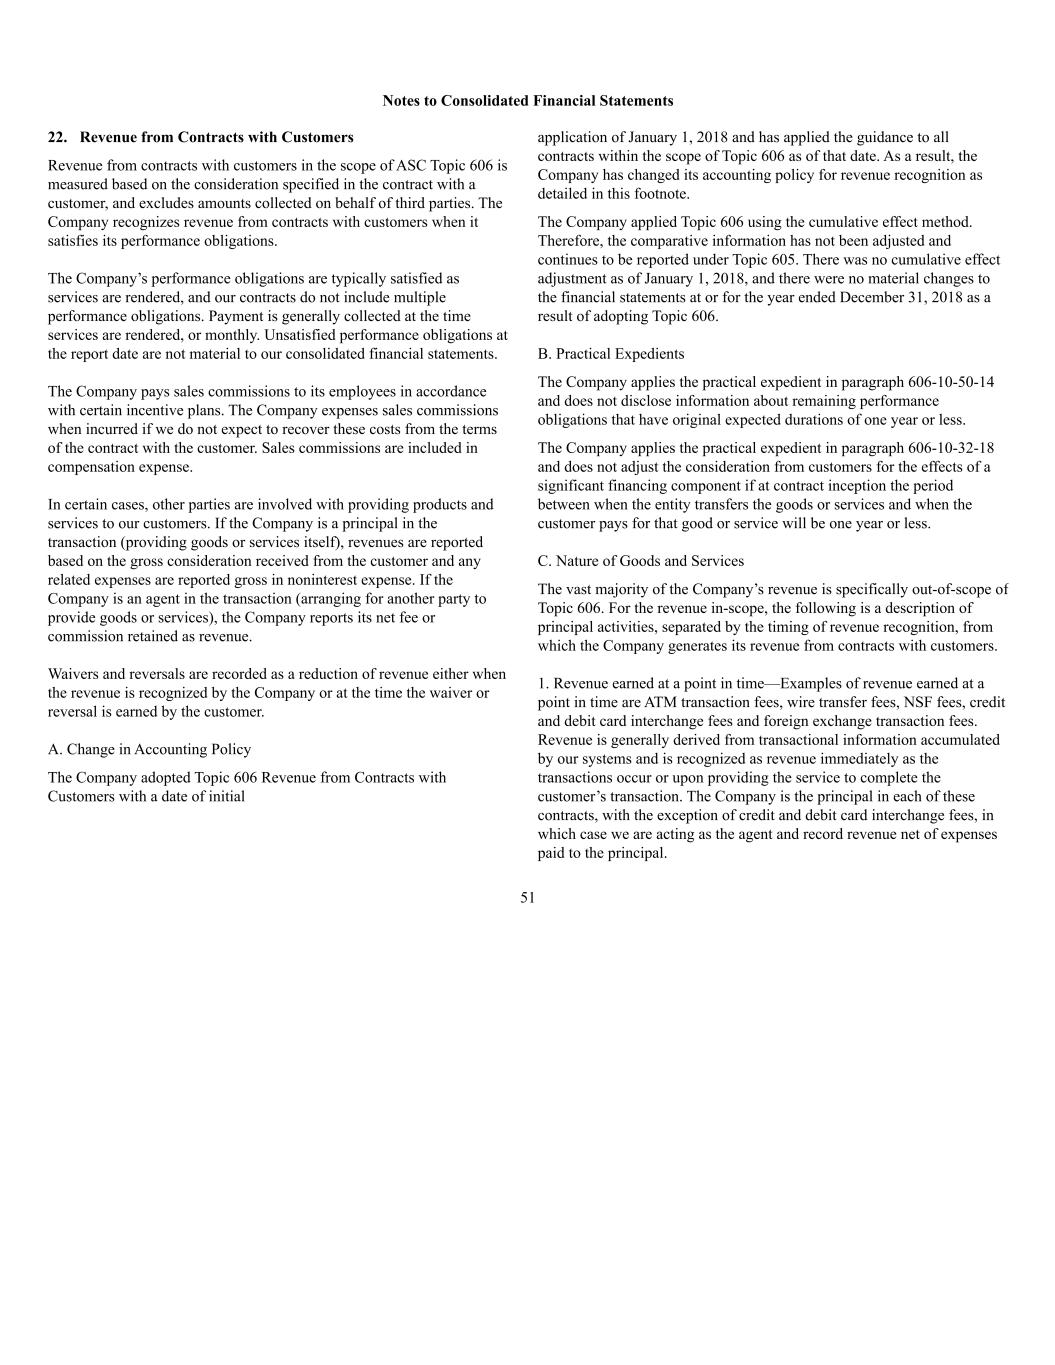
Notes to Consolidated Financial Statements 51 22. Revenue from Contracts with Customers Revenue from contracts with customers in the scope of ASC Topic 606 is measured based on the consideration specified in the contract with a customer, and excludes amounts collected on behalf of third parties. The Company recognizes revenue from contracts with customers when it satisfies its performance obligations. The Company’s performance obligations are typically satisfied as services are rendered, and our contracts do not include multiple performance obligations. Payment is generally collected at the time services are rendered, or monthly. Unsatisfied performance obligations at the report date are not material to our consolidated financial statements. The Company pays sales commissions to its employees in accordance with certain incentive plans. The Company expenses sales commissions when incurred if we do not expect to recover these costs from the terms of the contract with the customer. Sales commissions are included in compensation expense. In certain cases, other parties are involved with providing products and services to our customers. If the Company is a principal in the transaction (providing goods or services itself), revenues are reported based on the gross consideration received from the customer and any related expenses are reported gross in noninterest expense. If the Company is an agent in the transaction (arranging for another party to provide goods or services), the Company reports its net fee or commission retained as revenue. Waivers and reversals are recorded as a reduction of revenue either when the revenue is recognized by the Company or at the time the waiver or reversal is earned by the customer. A. Change in Accounting Policy The Company adopted Topic 606 Revenue from Contracts with Customers with a date of initial application of January 1, 2018 and has applied the guidance to all contracts within the scope of Topic 606 as of that date. As a result, the Company has changed its accounting policy for revenue recognition as detailed in this footnote. The Company applied Topic 606 using the cumulative effect method. Therefore, the comparative information has not been adjusted and continues to be reported under Topic 605. There was no cumulative effect adjustment as of January 1, 2018, and there were no material changes to the financial statements at or for the year ended December 31, 2018 as a result of adopting Topic 606. B. Practical Expedients The Company applies the practical expedient in paragraph 606-10-50-14 and does not disclose information about remaining performance obligations that have original expected durations of one year or less. The Company applies the practical expedient in paragraph 606-10-32-18 and does not adjust the consideration from customers for the effects of a significant financing component if at contract inception the period between when the entity transfers the goods or services and when the customer pays for that good or service will be one year or less. C. Nature of Goods and Services The vast majority of the Company’s revenue is specifically out-of-scope of Topic 606. For the revenue in-scope, the following is a description of principal activities, separated by the timing of revenue recognition, from which the Company generates its revenue from contracts with customers. 1. Revenue earned at a point in time—Examples of revenue earned at a point in time are ATM transaction fees, wire transfer fees, NSF fees, credit and debit card interchange fees and foreign exchange transaction fees. Revenue is generally derived from transactional information accumulated by our systems and is recognized as revenue immediately as the transactions occur or upon providing the service to complete the customer’s transaction. The Company is the principal in each of these contracts, with the exception of credit and debit card interchange fees, in which case we are acting as the agent and record revenue net of expenses paid to the principal.
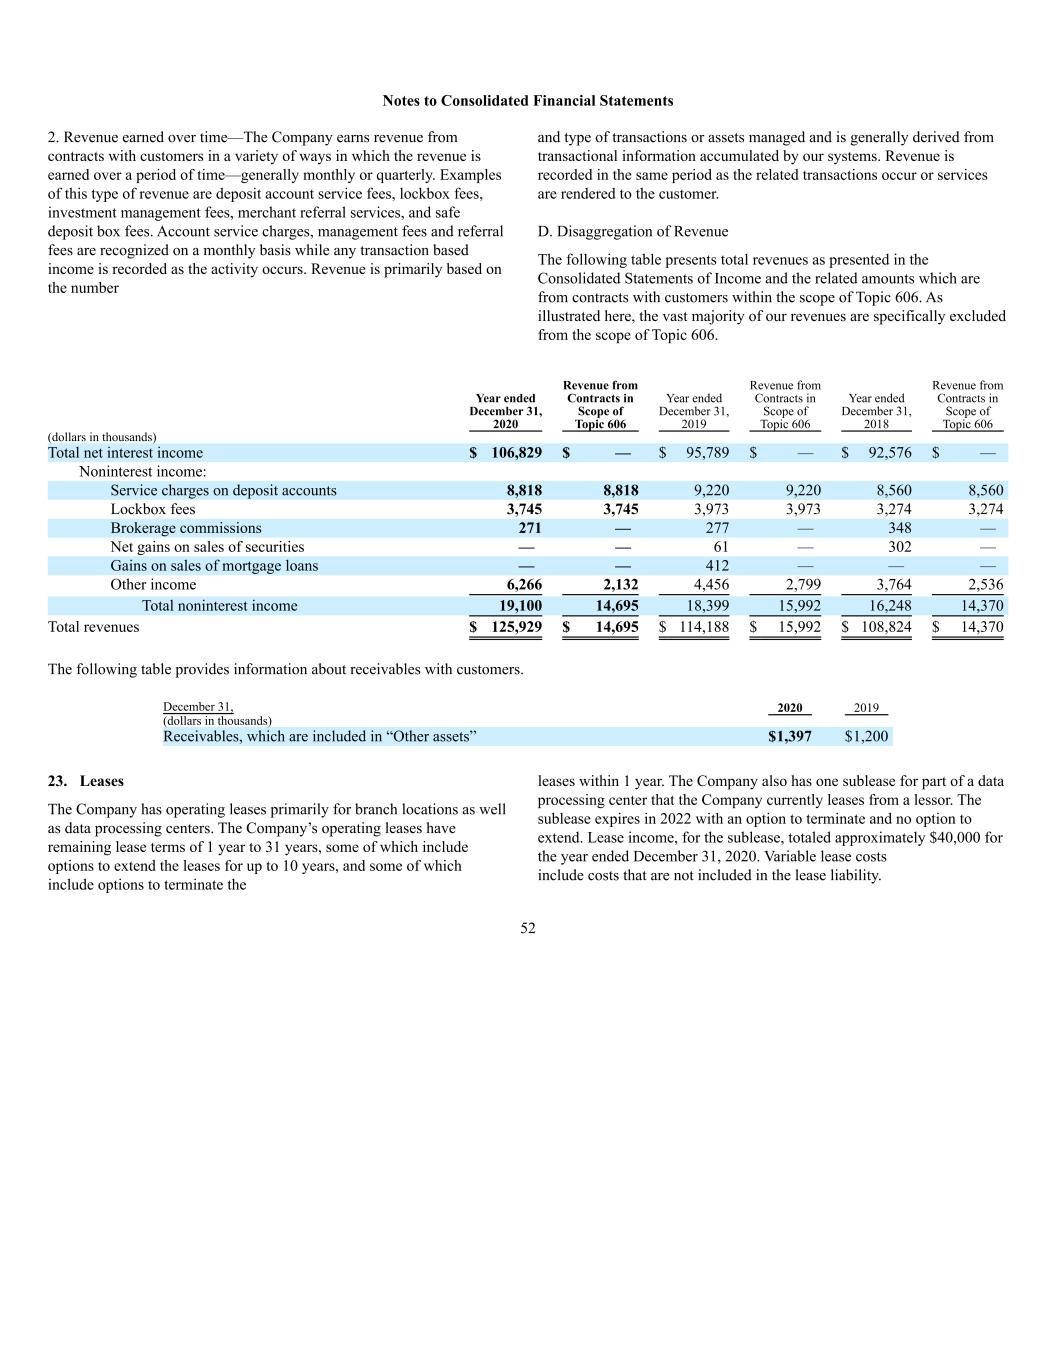
Notes to Consolidated Financial Statements Year ended December 31, 2020 Revenue from Contracts in Scope of Topic 606 Year ended December 31, 2019 Revenue from Contracts in Scope of Topic 606 Year ended December 31, 2018 Revenue from Contracts in Scope of Topic 606 (dollars in thousands) Total net interest income $ 106,829 $ — $ 95,789 $ — $ 92,576 $ — Noninterest income: Service charges on deposit accounts 8,818 8,818 9,220 9,220 8,560 8,560 Lockbox fees 3,745 3,745 3,973 3,973 3,274 3,274 Brokerage commissions 271 — 277 — 348 — Net gains on sales of securities — — 61 — 302 — Gains on sales of mortgage loans — — 412 — — — Other income 6,266 2,132 4,456 2,799 3,764 2,536 Total noninterest income 19,100 14,695 18,399 15,992 16,248 14,370 Total revenues $ 125,929 $ 14,695 $ 114,188 $ 15,992 $ 108,824 $ 14,370 The following table provides information about receivables with customers. December 31, 2020 2019 (dollars in thousands) Receivables, which are included in “Other assets” $1,397 $1,200 52 2. Revenue earned over time—The Company earns revenue from contracts with customers in a variety of ways in which the revenue is earned over a period of time—generally monthly or quarterly. Examples of this type of revenue are deposit account service fees, lockbox fees, investment management fees, merchant referral services, and safe deposit box fees. Account service charges, management fees and referral fees are recognized on a monthly basis while any transaction based income is recorded as the activity occurs. Revenue is primarily based on the number and type of transactions or assets managed and is generally derived from transactional information accumulated by our systems. Revenue is recorded in the same period as the related transactions occur or services are rendered to the customer. D. Disaggregation of Revenue The following table presents total revenues as presented in the Consolidated Statements of Income and the related amounts which are from contracts with customers within the scope of Topic 606. As illustrated here, the vast majority of our revenues are specifically excluded from the scope of Topic 606. 23. Leases The Company has operating leases primarily for branch locations as well as data processing centers. The Company’s operating leases have remaining lease terms of 1 year to 31 years, some of which include options to extend the leases for up to 10 years, and some of which include options to terminate the leases within 1 year. The Company also has one sublease for part of a data processing center that the Company currently leases from a lessor. The sublease expires in 2022 with an option to terminate and no option to extend. Lease income, for the sublease, totaled approximately $40,000 for the year ended December 31, 2020. Variable lease costs include costs that are not included in the lease liability.
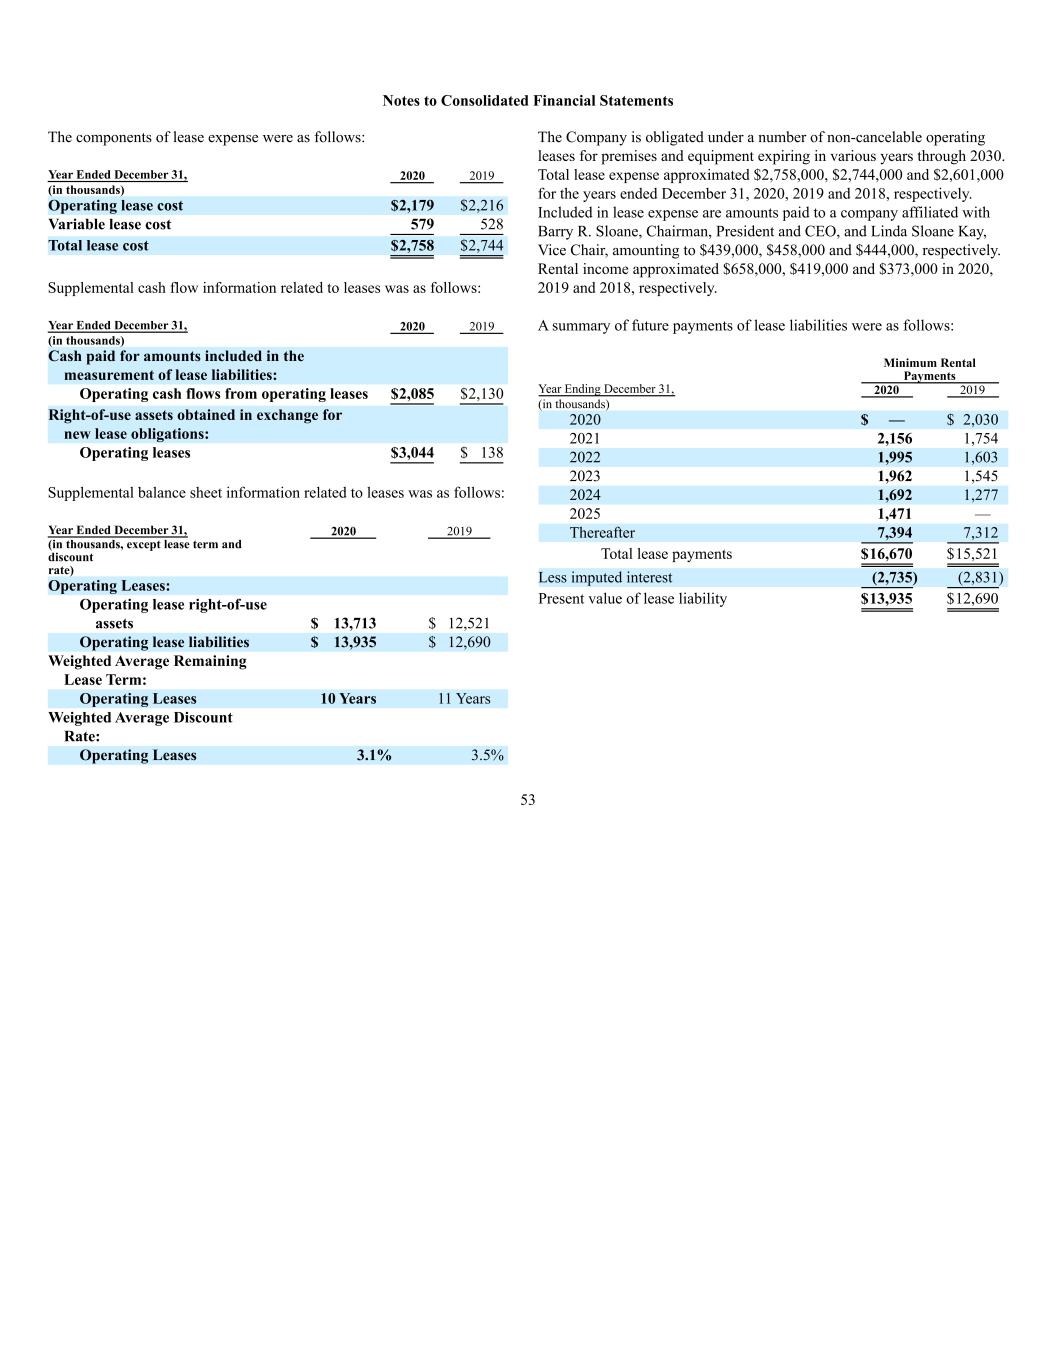
Notes to Consolidated Financial Statements 53 The components of lease expense were as follows: Year Ended December 31, 2020 2019 (in thousands) Operating lease cost $2,179 $2,216 Variable lease cost 579 528 Total lease cost $2,758 $2,744 Supplemental cash flow information related to leases was as follows: Year Ended December 31, 2020 2019 (in thousands) Cash paid for amounts included in the measurement of lease liabilities: Operating cash flows from operating leases $2,085 $2,130 Right-of-use assets obtained in exchange for new lease obligations: Operating leases $3,044 $ 138 Supplemental balance sheet information related to leases was as follows: Year Ended December 31, 2020 2019 (in thousands, except lease term and discount rate) Operating Leases: Operating lease right-of-use assets $ 13,713 $ 12,521 Operating lease liabilities $ 13,935 $ 12,690 Weighted Average Remaining Lease Term: Operating Leases 10 Years 11 Years Weighted Average Discount Rate: Operating Leases 3.1% 3.5% The Company is obligated under a number of non-cancelable operating leases for premises and equipment expiring in various years through 2030. Total lease expense approximated $2,758,000, $2,744,000 and $2,601,000 for the years ended December 31, 2020, 2019 and 2018, respectively. Included in lease expense are amounts paid to a company affiliated with Barry R. Sloane, Chairman, President and CEO, and Linda Sloane Kay, Vice Chair, amounting to $439,000, $458,000 and $444,000, respectively. Rental income approximated $658,000, $419,000 and $373,000 in 2020, 2019 and 2018, respectively. A summary of future payments of lease liabilities were as follows: Minimum Rental Payments Year Ending December 31, 2020 2019 (in thousands) 2020 $ — $ 2,030 2021 2,156 1,754 2022 1,995 1,603 2023 1,962 1,545 2024 1,692 1,277 2025 1,471 — Thereafter 7,394 7,312 Total lease payments $16,670 $15,521 Less imputed interest (2,735) (2,831) Present value of lease liability $13,935 $12,690

Notes to Consolidated Financial Statements 24. Quarterly Results of Operations (unaudited) 2020 Quarters Fourth Third Second First (in thousands, except share data) Interest income $ 36,617 $ 36,504 $ 36,120 $ 39,795 Interest expense 8,138 9,173 10,302 14,594 Net interest income 28,479 27,331 25,818 25,201 Provision for loan losses 2,150 900 1,700 1,075 Net interest income after provision for loan losses 26,329 26,431 24,118 24,126 Other operating income 6,580 4,169 4,041 4,310 Operating expenses 20,106 18,167 17,042 18,173 Income before income taxes 12,803 12,433 11,117 10,263 Provision for income taxes 1,203 1,546 1,061 597 Net income $ 11,600 $ 10,887 $ 10,056 $ 9,666 Share data: Average shares outstanding, basic Class A 3,655,469 3,655,469 3,652,469 3,652,349 Class B 1,912,440 1,912,440 1,915,440 1,915,560 Average shares outstanding, diluted Class A 5,567,909 5,567,909 5,567,909 5,567,909 Class B 1,912,440 1,912,440 1,915,440 1,915,560 Earnings per share, basic Class A $ 2.52 $ 2.36 $ 2.18 $ 2.10 Class B $ 1.26 $ 1.18 $ 1.09 $ 1.05 Earnings per share, diluted Class A $ 2.08 $ 1.96 $ 1.81 $ 1.74 Class B $ 1.26 $ 1.18 $ 1.09 $ 1.05 54

Notes to Consolidated Financial Statements 2019 Quarters Fourth Third Second First (in thousands, except share data) Interest income $ 40,518 $ 39,852 $ 39,692 $ 39,077 Interest expense 15,187 16,082 16,442 15,639 Net interest income 25,331 23,770 23,250 23,438 Provision for loan losses 550 75 250 375 Net interest income after provision for loan losses 24,781 23,695 23,000 23,063 Other operating income 4,689 4,286 4,997 4,427 Operating expenses 18,212 17,462 18,264 18,190 Income before income taxes 11,258 10,519 9,733 9,300 Provision for income taxes 526 435 267 (118) Net income $ 10,732 $ 10,084 $ 9,466 $ 9,418 Share data: Average shares outstanding, basic Class A 3,650,949 3,650,449 3,620,449 3,610,329 Class B 1,916,960 1,917,460 1,947,460 1,957,580 Average shares outstanding, diluted Class A 5,567,909 5,567,909 5,567,909 5,567,909 Class B 1,916,960 1,917,460 1,947,460 1,957,580 Earnings per share, basic Class A $ 2.33 $ 2.19 $ 2.06 $ 2.05 Class B $ 1.16 $ 1.09 $ 1.03 $ 1.03 Earnings per share, diluted Class A $ 1.93 $ 1.81 $ 1.70 $ 1.69 Class B $ 1.16 $ 1.09 $ 1.03 $ 1.03 25. Parent Company Financial Statements The balance sheets of Century Bancorp, Inc. (“Parent Company”) as of December 31, 2020 and 2019 and the statements of income and cash flows for each of the years in the three-year period ended December 31, 2020, are presented below. The statements of changes in stockholders’ equity are identical to the consolidated statements of changes in stockholders’ equity and are therefore not presented here. BALANCE SHEETS December 31, 2020 2019 (dollars in thousands) ASSETS: Cash $ 5,141 $ 3,177 Investment in subsidiary, at equity 389,724 353,489 Other assets 15,920 16,325 Total assets $410,785 $372,991 LIABILITIES AND STOCKHOLDERS’ EQUITY: Liabilities $ 4,293 $ 4,327 Subordinated debentures 36,083 36,083 Stockholders’ equity 370,409 332,581 Total liabilities and stockholders’ equity $410,785 $372,991 55

Notes to Consolidated Financial Statements STATEMENTS OF INCOME Year Ended December 31, 2020 2019 2018 (dollars in thousands) Income: Dividends from subsidiary $ 5,000 $ 5,000 $ 4,750 Other income 25 65 53 Total income 5,025 5,065 4,803 Interest expense 951 1,577 1,474 Operating expenses 235 215 225 Income before income taxes and equity in undistributed income of subsidiary 3,839 3,273 3,104 Benefit from income taxes (244) (363) (347) Income before equity in undistributed income of subsidiary 4,083 3,636 3,451 Equity in undistributed income of subsidiary 38,126 36,063 32,762 Net income $42,209 $39,699 $36,213 STATEMENTS OF CASH FLOWS December 31, 2020 2019 2018 (dollars in thousands) CASH FLOWS FROM OPERATING ACTIVITIES: Net income $ 42,209 $ 39,699 $ 36,213 Adjustments to reconcile net income to net cash provided by operating activities Undistributed income of subsidiary (38,126) (36,063) (32,762) Decrease (increase) in other assets 405 665 (158) (Decrease) increase in liabilities (34) (180) (1,808) Net cash provided by (used in) operating activities 4,454 4,121 1,485 CASH FLOWS FROM FINANCING ACTIVITIES: Cash dividends paid (2,490) (2,207) (2,203) Net cash used in financing activities (2,490) (2,207) (2,203) Net (decrease) in cash 1,964 1,914 (718) Cash at beginning of year 3,177 1,263 1,981 Cash at end of year $ 5,141 $ 3,177 $ 1,263 56


