UNITED STATES
SECURITIES AND EXCHANGE COMMISSION
Washington, D.C. 20549
FORM N-CSR
CERTIFIED SHAREHOLDER REPORT OF REGISTERED MANAGEMENT
INVESTMENT COMPANIES
Investment Company Act file number 811-23590
CPG Cooper Square International Equity, LLC
(Exact name of registrant as specified in charter)
805 Third Avenue
New York, New York 10022
(Address of principal executive offices) (Zip code)
Mitchell A. Tanzman
c/o Central Park Advisers, LLC
805 Third Avenue
New York, NY 10022
(Name and address of agent for service)
Registrant's telephone number, including area code: (212) 317-9200
Date of fiscal year end: September 30
Date of reporting period: September 30, 2021
Form N-CSR is to be used by management investment companies to file reports with the Commission not later than 10 days after the transmission to stockholders of any report that is required to be transmitted to stockholders under Rule 30e-1 under the Investment Company Act of 1940 (17 CFR 270.30e-1). The Commission may use the information provided on Form N-CSR in its regulatory, disclosure review, inspection, and policymaking roles.
A registrant is required to disclose the information specified by Form N-CSR, and the Commission will make this information public. A registrant is not required to respond to the collection of information contained in Form N-CSR unless the Form displays a currently valid Office of Management and Budget (“OMB”) control number. Please direct comments concerning the accuracy of the information collection burden estimate and any suggestions for reducing the burden to Secretary, Securities and Exchange Commission, 100 F Street, NE, Washington, DC 20549-0609. The OMB has reviewed this collection of information under the clearance requirements of 44 U.S.C. § 3507.
ITEM 1. REPORTS TO STOCKHOLDERS.
| (a) | The Report to Shareholders is attached herewith. |
CPG Cooper Square International Equity, LLC
Financial Statements
For the Period November 2, 2020 to September 30, 2021
With Report of Independent Registered Public Accounting Firm
CPG Cooper Square International Equity, LLC
Table of Contents
For the Period from November 2, 2020 to September 30, 2021
Report of Independent Registered Public Accounting Firm | 1 |
Schedule of Investments | 2-11 |
Statement of Assets and Liabilities | 12 |
Statement of Operations | 13 |
Statement of Changes in Net Assets | 14 |
Statement of Cash Flows | 15-16 |
Financial Highlights | 17-18 |
Notes to Financial Statements | 19-30 |
Other Information | 31-35 |
Fund Management | 36-37 |
CPG Cooper Square International Equity, LLC
Report of Independent Registered Public Accounting Firm
September 30, 2021
To the Unit holders and the Board of Directors of CPG Cooper Square International Equity, LLC
Opinion on the Financial Statements
We have audited the accompanying statement of assets and liabilities of CPG Cooper Square International Equity, LLC (the “Fund”), including the schedule of investments, as of September 30, 2021, and the related statements of operations, cash flows, changes in net assets and financial highlights for the period from November 2, 2020 (commencement of operations) through September 30, 2021, and the related notes (collectively referred to as the “financial statements”). In our opinion, the financial statements present fairly, in all material respects, the financial position of the Fund at September 30, 2021, the results of its operations, its cash flows, its changes in its net assets and its financial highlights for the period from November 2, 2020 (commencement of operations) through September 30, 2021, in conformity with U.S. generally accepted accounting principles.
Basis for Opinion
These financial statements are the responsibility of the Fund’s management. Our responsibility is to express an opinion on the Fund’s financial statements based on our audit. We are a public accounting firm registered with the Public Company Accounting Oversight Board (United States) (“PCAOB”) and are required to be independent with respect to the Fund in accordance with the U.S. federal securities laws and the applicable rules and regulations of the Securities and Exchange Commission and the PCAOB.
We conducted our audit in accordance with the standards of the PCAOB. Those standards require that we plan and perform the audit to obtain reasonable assurance about whether the financial statements are free of material misstatement, whether due to error or fraud. The Fund is not required to have, nor were we engaged to perform, an audit of the Fund’s internal control over financial reporting. As part of our audit, we are required to obtain an understanding of internal control over financial reporting but not for the purpose of expressing an opinion on the effectiveness of the Fund’s internal control over financial reporting. Accordingly, we express no such opinion.
Our audit included performing procedures to assess the risks of material misstatement of the financial statements, whether due to error or fraud, and performing procedures that respond to those risks. Such procedures included examining, on a test basis, evidence regarding the amounts and disclosures in the financial statements. Our procedures included confirmation of securities owned as of September 30, 2021, by correspondence with the custodian and brokers. Our audit also included evaluating the accounting principles used and significant estimates made by management, as well as evaluating the overall presentation of the financial statements. We believe that our audit provides a reasonable basis for our opinion.

We have served as the auditor of one or more Central Park Group investment companies since 2007.
Boston, Massachusetts
November 26, 2021
1
CPG Cooper Square International Equity, LLC
Schedule of Investments
September 30, 2021
Common Stock (79.39%) | Shares | Fair Value | ||||||
Australia (1.90%) | ||||||||
Treasury Wine Estates, Ltd. | 187,417 | $ | 1,680,075 | |||||
China (0.68%) | ||||||||
Alibaba Group Holding, Ltd.(a) | 32,710 | 597,504 | ||||||
Denmark (0.42%) | ||||||||
Chr Hansen Holding A/S(b) | 4,536 | 370,736 | ||||||
France (10.18%) | ||||||||
Edenred(b) | 93,083 | 5,030,376 | ||||||
Safran SA | 31,210 | 3,966,493 | ||||||
| 8,996,869 | ||||||||
Germany (7.02%) | ||||||||
CTS Eventim AG & Co. KGaA(a)(b) | 27,332 | 2,068,470 | ||||||
SAP SE(b) | 26,150 | 3,542,229 | ||||||
Scout24 AG(b)(c)(d) | 8,574 | 595,813 | ||||||
| 6,206,512 | ||||||||
Great Britain (18.79%) | ||||||||
Ashmore Group PLC | 262,944 | 1,207,565 | ||||||
Baltic Classifieds Group PLC(a) | 190,886 | 505,754 | ||||||
Clarivate PLC(a) | 124,941 | 2,736,208 | ||||||
Electrocomponents PLC(b) | 173,183 | 2,517,253 | ||||||
Everarc Holdings, Ltd.(a)(c) | 57,096 | 713,700 | ||||||
Melrose Industries PLC(b) | 1,345,120 | 3,156,733 | ||||||
Petershill Partners PLC(a)(c) | 203,945 | 962,463 | ||||||
Prudential PLC(b) | 164,745 | 3,232,049 | ||||||
Reckitt Benckiser Group PLC(b) | 19,986 | 1,571,076 | ||||||
| 16,602,801 | ||||||||
Hong Kong (3.61%) | ||||||||
AIA Group, Ltd. | 276,625 | 3,196,344 | ||||||
Ireland (6.65%) | ||||||||
CRH PLC(b) | 71,126 | 3,343,421 | ||||||
Experian PLC(b) | 60,628 | 2,541,539 | ||||||
| 5,884,960 | ||||||||
Japan (14.52%) | ||||||||
Justsystems Corp. | 28,575 | 1,618,588 | ||||||
Keyence Corp. | 1,765 | 1,059,870 | ||||||
2
CPG Cooper Square International Equity, LLC
Schedule of Investments (Continued)
September 30, 2021
Common Stock (continued) | Shares | Fair Value | ||||||
NOF Corp. | 72,410 | $ | 4,101,557 | |||||
Obic Co., Ltd. | 6,600 | 1,264,100 | ||||||
Shiseido Co., Ltd. | 46,096 | 3,113,830 | ||||||
Trancom Co., Ltd. | 22,905 | 1,683,361 | ||||||
| 12,841,306 | ||||||||
Netherlands (2.18%) | ||||||||
ASML Holding NV(b) | 2,581 | 1,932,048 | ||||||
Sweden (1.88%) | ||||||||
Telefonaktiebolaget LM Ericsson | 146,591 | 1,660,523 | ||||||
Switzerland (4.43%) | ||||||||
Alcon, Inc.(b) | 48,032 | 3,915,263 | ||||||
United States (7.13%) | ||||||||
Fidelity National Information Services, Inc.(b) | 36,077 | 4,389,849 | ||||||
PerkinElmer, Inc.(b) | 11,083 | 1,920,573 | ||||||
| 6,310,422 | ||||||||
Total Common Stock | ||||||||
(Cost $68,662,561) | $ | 70,195,363 | ||||||
Purchased Options (0.10%) |
|
| ||||||
United States (0.10%) | ||||||||
EURO STOXX 50 Price EUR-SX5E 12/17/21 P3800 | 1,051 | 90,136 | ||||||
Total Purchased Options | ||||||||
(Cost $65,301) | $ | 90,136 | ||||||
Total Investments (79.49%) | $ | 70,285,499 | ||||||
Securities Sold Short (-34.04%) | $ | (30,102,371 | ) | |||||
Other Assets In Excess of Liabilities (54.55%)(e) | 48,233,320 | |||||||
Net Assets (100.00%) | $ | 88,416,448 | ||||||
(a) | Non-income producing security. |
(b) | All or a portion of the security is pledged as collateral for total return swap contracts and securities sold short. As of September 30, 2021, the aggregate value of those securities was $28,314,572 and $2,000,000 in cash, representing 34.29% of net assets. |
(c) | Securities exempt from registration under Rule 144A of the Securities Act of 1933. These securities may be resold in transactions exempt from registration, normally to qualified institutional buyers. As of September 30, 2021 the aggregate fair value of securities restricted under Rule 144A was $2,271,976, representing 2.57% of net assets. |
(d) | Securities were purchased pursuant to Regulation S under the Securities Act of 1933, which exempts securities offered and sold outside of the United States from registration. Such securities cannot be sold in the United States without either an effective registration statement filed pursuant to the Securities Act of 1933, or pursuant to an exemption from registration. As of September 30, 2021, the aggregate fair value of those securities was $595,813 representing 0.07% of net assets. |
(e) | Includes cash which is being held as collateral for total return swap contracts and securities sold short. |
3
CPG Cooper Square International Equity, LLC
Schedule of Investments (Continued)
September 30, 2021
TOTAL RETURN SWAP CONTRACTS
Counterparty | Reference Entity/ | Notional | Floating | Floating | Termination | Value | Net | ||||||||||||||||||
Morgan Stanley | Adyen NV | $ | 987,259 | FEDEF-1D | 50 bps | 01/03/2022 | $ | 1,231,500 | $ | 244,241 | |||||||||||||||
Morgan Stanley | Ansell, Ltd. | (750,077 | ) | FEDEF-1D | (50) bps | 01/04/2022 | (648,094 | ) | 101,983 | ||||||||||||||||
Morgan Stanley | ATS Automation Tooling Systems, Inc. | 919,930 | FEDEF-1D | 30 bps | 03/16/2022 | 1,237,672 | 317,741 | ||||||||||||||||||
Morgan Stanley | Breville Group, Ltd. | (137,851 | ) | FEDEF-1D | (50) bps | 09/14/2022 | (119,313 | ) | 18,539 | ||||||||||||||||
Morgan Stanley | Brookfield Asset Mgmt, Inc. Class A | 2,811,161 | FEDEF-1D | 30 bps | 04/18/2022 | 3,199,268 | 388,107 | ||||||||||||||||||
Morgan Stanley | Brookfield Asset Mgmt Reinsurance Partners | — | FEDEF-1D | 30 bps | 04/18/2022 | 19,395 | 19,395 | ||||||||||||||||||
Morgan Stanley | Compass Group PLC | 264,818 | FEDEF-1D | 50 bps | 08/19/2022 | 270,444 | 5,625 | ||||||||||||||||||
Morgan Stanley | Constellation Software, Inc. | 1,193,357 | FEDEF-1D | 30 bps | 01/04/2022 | 1,449,574 | 256,217 | ||||||||||||||||||
Morgan Stanley | Dormakaba Holding AG | 485,420 | FEDEF-1D | 50 bps | 03/01/2022 | 563,377 | 77,957 | ||||||||||||||||||
Goldman Sachs | GS Swap GSCBHKDD Basket Index(a) | (918,467 | ) | HIBOR-1M | (55) bps | 09/13/2022 | (818,894 | ) | 99,573 | ||||||||||||||||
Goldman Sachs | GS Swap GSCBSAPP Basket Index | (282,596 | ) | 1M LIBOR | (35) bps | 10/13/2022 | (267,458 | ) | 15,138 | ||||||||||||||||
Goldman Sachs | GS Swap GSCBSUTE Basket Index | (518,245 | ) | 1M LIBOR | (15) bps | 09/13/2022 | (494,637 | ) | 23,608 | ||||||||||||||||
Morgan Stanley | Industria de Diseno Textil SA | 3,058,482 | FEDEF-1D | 50 bps | 03/09/2022 | 3,342,677 | 284,195 | ||||||||||||||||||
Morgan Stanley | JB Hi-Fi, Ltd. | (751,947 | ) | FEDEF-1D | (50) bps | 03/01/2022 | (652,695 | ) | 99,251 | ||||||||||||||||
Morgan Stanley | Lenovo Group, Ltd. | (167,122 | ) | FEDEF-1D | (50) bps | 03/09/2022 | (139,775 | ) | 27,347 | ||||||||||||||||
Morgan Stanley | MS Swap MSCBMINE Basket Index(a) | (1,046,585 | ) | FEDEF-1D | (30) bps | 10/17/2022 | (1,031,265 | ) | 15,320 | ||||||||||||||||
Morgan Stanley | MS Swap MSCBNRGY Basket Index(a) | (1,005,620 | ) | FEDEF-1D | (44) bps | 10/28/2022 | (1,003,399 | ) | 2,221 | ||||||||||||||||
Morgan Stanley | Partners Group Holding AG | 585,628 | FEDEF-1D | 50 bps | 12/02/2021 | 734,154 | 148,526 | ||||||||||||||||||
Morgan Stanley | RELX PLC | 89,764 | FEDEF-1D | 50 bps | 07/01/2022 | 99,643 | 9,879 | ||||||||||||||||||
Morgan Stanley | Samsonite International SA | 318,489 | FEDEF-1D | 50 bps | 06/06/2022 | 380,903 | 62,414 | ||||||||||||||||||
Morgan Stanley | Sensata Technologies Holding PLC | 3,305,346 | FEDEF-1D | 30 bps | 12/02/2021 | 3,327,906 | 22,560 | ||||||||||||||||||
Morgan Stanley | Sika AG | 571,244 | FEDEF-1D | 50 bps | 03/01/2022 | 632,830 | 61,586 | ||||||||||||||||||
Morgan Stanley | Taiwan Semiconductor Manufacturing Co., Ltd. | 1,289,737 | FEDEF-1D | 95 bps | 01/03/2022 | 1,310,597 | 20,860 | ||||||||||||||||||
Morgan Stanley | Treasury Wine Estates, Ltd. | 896,029 | FEDEF-1D | 50 bps | 04/26/2022 | 971,504 | 75,475 | ||||||||||||||||||
| $ | 11,198,153 | $ | 13,595,912 | $ | 2,397,759 | ||||||||||||||||||||
4
CPG Cooper Square International Equity, LLC
Schedule of Investments (Continued)
September 30, 2021
Counter Party | Reference Entity/ | Notional | Floating | Floating | Termination | Value | Net | ||||||||||||||||||
Morgan Stanley | Adidas AG | $ | 2,459,962 | FEDEF-1D | 50 bps | 03/21/2022 | $ | 2,181,393 | $ | (278,569 | ) | ||||||||||||||
Morgan Stanley | Amadeus IT Group SA | 2,542,188 | FEDEF-1D | 50 bps | 12/02/2021 | 2,511,000 | (31,188 | ) | |||||||||||||||||
Morgan Stanley | Becle SAB de CV | 1,947,244 | FEDEF-1D | 130 bps | 12/03/2021 | 1,842,519 | (104,725 | ) | |||||||||||||||||
Morgan Stanley | Bureau Veritas SA | 1,519 | FEDEF-1D | 50 bps | 07/01/2022 | 1,517 | (2 | ) | |||||||||||||||||
Morgan Stanley | Canadian Pacific Railway, Ltd. | 2,725,017 | FEDEF-1D | 30 bps | 03/02/2022 | 2,432,693 | (292,324 | ) | |||||||||||||||||
Morgan Stanley | Deutsche Boerse AG | 1,503,194 | FEDEF-1D | 50 bps | 01/03/2022 | 1,464,678 | (38,516 | ) | |||||||||||||||||
Morgan Stanley | Elektra AB | 77,019 | FEDEF-1D | 50 bps | 10/28/2022 | 76,291 | (728 | ) | |||||||||||||||||
Morgan Stanley | Giant Manufacturing Co., Ltd. | (152,971 | ) | FEDEF-1D | (163) bps | 07/15/2022 | (155,143 | ) | (2,172 | ) | |||||||||||||||
Morgan Stanley | Grifols SA | 1,318,764 | FEDEF-1D | 40 bps | 08/16/2022 | 1,291,772 | (26,992 | ) | |||||||||||||||||
Goldman Sachs | GS Swap GSCBHRES Basket Index | (316,339 | ) | HIBOR-1M | (55) bps | 10/19/2022 | (368,588 | ) | (52,249 | ) | |||||||||||||||
Goldman Sachs | GS Swap GSCNCNSM Basket Index | (198,115 | ) | 1M LIBOR | (35) bps | 09/13/2022 | (200,162 | ) | (2,048 | ) | |||||||||||||||
Morgan Stanley | Heineken NV | 179,197 | FEDEF-1D | 50 bps | 10/10/2022 | 177,295 | (1,902 | ) | |||||||||||||||||
Morgan Stanley | InterContinental Hotels Group PLC | 415,496 | FEDEF-1D | 50 bps | 10/10/2022 | 413,751 | (1,745 | ) | |||||||||||||||||
Morgan Stanley | James Hardie Industries PLC | (573,762 | ) | FEDEF-1D | (50) bps | 09/13/2022 | (588,190 | ) | (14,428 | ) | |||||||||||||||
Morgan Stanley | JD.Com, Inc. | 3,474,118 | FEDEF-1D | 50 bps | 04/01/2022 | 3,126,654 | (347,464 | ) | |||||||||||||||||
Morgan Stanley | Koninklijke Philips NV | 2,156,818 | FEDEF-1D | 50 bps | 12/02/2021 | 1,864,501 | (292,317 | ) | |||||||||||||||||
Morgan Stanley | LG Household & Health Care, Ltd. | 458,798 | FEDEF-1D | 30 bps | 05/16/2022 | 372,644 | (86,155 | ) | |||||||||||||||||
Morgan Stanley | MS Swap MSSEEWT Basket Index | (802,093 | ) | FEDEF-1D | (110) bps | 05/09/2022 | (805,476 | ) | (3,383 | ) | |||||||||||||||
Morgan Stanley | MS Swap MSSENDUS Basket Index | (475,466 | ) | FEDEF-1D | (30) bps | 10/20/2022 | (488,769 | ) | (13,304 | ) | |||||||||||||||
Morgan Stanley | Sonic Healthcare, Ltd. | (781,761 | ) | FEDEF-1D | (50) bps | 05/12/2022 | (830,810 | ) | (49,049 | ) | |||||||||||||||
Morgan Stanley | STOXX Europe 600 Chemicals Index | (888,345 | ) | FEDEF-1D | (10) bps | 12/02/2021 | (959,795 | ) | (71,450 | ) | |||||||||||||||
Morgan Stanley | Worldline SA/France | 2,110,537 | FEDEF-1D | 50 bps | 06/06/2022 | 1,796,580 | (313,957 | ) | |||||||||||||||||
| $ | 17,181,017 | $ | 15,156,352 | $ | (2,024,665 | ) | |||||||||||||||||||
TOTAL | $ | 28,379,170 | $ | 28,752,264 | $ | 373,094 | |||||||||||||||||||
FEDEF-1D - Federal Funds Effective Rate (Daily)
HIBOR-1M - Hong Kong Interbank Offered Rate (Monthly)
1M-LIBOR - London Interbank Offered Rate (Monthly)
(a) | See tables below for details of the equity basket holdings underlying the swaps. |
5
CPG Cooper Square International Equity, LLC
Schedule of Investments (Continued)
September 30, 2021
The following table represents the equity basket holdings underlying the total return swap with GS Swap GSCBHKDD Basket Index as of September 30, 2021.
GS Swap GSCBHKDD Basket Index
Description | Shares | Value | Percentage of Value | |||||||||
Short Securities | ||||||||||||
Common Stocks | ||||||||||||
Chow Tai Fook Jewellery Group, Ltd. | (35,159 | ) | (HKD 523,866 | ) | 8.22 | % | ||||||
CK Asset Holdings, Ltd. | (19,929 | ) | (898,796 | ) | 14.10 | % | ||||||
Hang Lung Properties, Ltd. | (24,073 | ) | (427,539 | ) | 6.71 | % | ||||||
Henderson Land Development Co., Ltd. | (17,124 | ) | (511,147 | ) | 8.02 | % | ||||||
Kerry Properties, Ltd. | (4,494 | ) | (92,343 | ) | 1.45 | % | ||||||
Lifestyle International Holdings, Ltd. | (5,839 | ) | (24,701 | ) | 0.39 | % | ||||||
Luk Fook Holdings International, Ltd. | (1,605 | ) | (32,107 | ) | 0.50 | % | ||||||
MTR Corp, Ltd. | (19,885 | ) | (835,176 | ) | 13.10 | % | ||||||
New World Development Co., Ltd. | (20,330 | ) | (647,511 | ) | 10.16 | % | ||||||
Sino Land Co., Ltd. | (18,690 | ) | (195,870 | ) | 3.07 | % | ||||||
Sun Hung Kai Properties, Ltd. | (15,046 | ) | (1,465,439 | ) | 22.99 | % | ||||||
Swire Pacific, Ltd. | (4,807 | ) | (222,564 | ) | 3.49 | % | ||||||
Swire Properties, Ltd. | (10,818 | ) | (211,172 | ) | 3.31 | % | ||||||
The Wharf Holdings, Ltd. | (11,090 | ) | (286,680 | ) | 4.50 | % | ||||||
Common Stocks Total | (6,374,910 | ) | 100.00 | % | ||||||||
Total Short Securities (Hong Kong Dollars) | (6,374,910 | ) | ||||||||||
| 9/30 USDHKD Spot Rate of | 7.785 | ||||||||||
Grand Total (US Dollars) | (USD 818,894 | ) | ||||||||||
6
CPG Cooper Square International Equity, LLC
Schedule of Investments (Continued)
September 30, 2021
The following table represents the equity basket holdings underlying the total return swap with MS Swap MSCBMINE Basket Index as of September 30, 2021.
MS Swap MSCBMINE Basket Index
Description | Shares | Value | Percentage of Value | |||||||||
Short Securities | ||||||||||||
Common Stocks | ||||||||||||
Anglo American PLC | (37,446 | ) | (USD 130,701 | ) | 12.67 | % | ||||||
Antofagasta PLC | (76,474 | ) | (137,962 | ) | 13.38 | % | ||||||
BHP Group PLC | (92,701 | ) | (231,530 | ) | 22.45 | % | ||||||
Rio Tinto PLC | (34,033 | ) | (221,650 | ) | 21.49 | % | ||||||
Southern Copper Corp. | (24,002 | ) | (132,182 | ) | 12.82 | % | ||||||
Teck Resources, Ltd. | (72,181 | ) | (176,385 | ) | 17.10 | % | ||||||
Thungela Resources, Ltd. | (3,745 | ) | (2,281 | ) | 0.22 | % | ||||||
Common Stocks Total | (1,032,691 | ) | 100.14 | % | ||||||||
Total Short Securities (US Dollars) | (1,032,691 | ) | ||||||||||
Remaining Securities and Cash | 1,426 | |||||||||||
Grand Total (US Dollars) | (USD 1,031,265 | ) | ||||||||||
The following table represents the equity basket holdings underlying the total return swap with MS Swap MSCBNRGY Basket Index as of September 30, 2021.
MS Swap MSCBNRGY Basket Index
Description | Shares | Value | Percentage of Value | |||||||||
Short Securities | ||||||||||||
Common Stocks | ||||||||||||
BP PLC | (401,075 | ) | (USD 233,420 | ) | 23.26 | % | ||||||
Eni SpA | (145,133 | ) | (246,220 | ) | 24.54 | % | ||||||
Galp Energia SGPS SA | (26,679 | ) | (38,428 | ) | 3.83 | % | ||||||
Royal Dutch Shell PLC | (86,606 | ) | (247,296 | ) | 24.65 | % | ||||||
TotalEnergies SE | (39,202 | ) | (238,142 | ) | 23.73 | % | ||||||
Common Stocks Total | (1,003,506 | ) | 100.01 | % | ||||||||
Total Short Securities (US Dollars) | (1,003,506 | ) | ||||||||||
Remaining Securities and Cash | 107 | |||||||||||
Grand Total (US Dollars) | (USD 1,003,399 | ) | ||||||||||
7
CPG Cooper Square International Equity, LLC
Schedule of Investments (Continued)
September 30, 2021
Schedule of Securities Sold Short
Common Stocks (27.35%) | Shares | Fair Value | ||||||
Belgium (0.63%) | ||||||||
Etablissements Franz Colruyt NV | (10,890 | ) | $ | (555,322 | ) | |||
Bermuda (1.04%) | ||||||||
Triton International, Ltd. | (17,733 | ) | (922,825 | ) | ||||
Canada (0.14%) | ||||||||
Cargojet, Inc. | (781 | ) | (124,784 | ) | ||||
Denmark (0.84%) | ||||||||
AP Moeller-Maersk A/S | (273 | ) | (739,718 | ) | ||||
Finland (1.97%) | ||||||||
Kesko Oyj, Class B | (23,998 | ) | (829,924 | ) | ||||
UPM-Kymmene Oyj | (25,673 | ) | (913,737 | ) | ||||
| (1,743,661 | ) | |||||||
France (1.17%) | ||||||||
BioMerieux | (2,475 | ) | (282,710 | ) | ||||
Cie Generale des Etablissements Michelin SCA | (4,122 | ) | (634,411 | ) | ||||
Trigano SA | (636 | ) | (119,851 | ) | ||||
| (1,036,972 | ) | |||||||
Germany (3.70%) | ||||||||
Bayerische Motoren Werke AG | (5,742 | ) | (550,742 | ) | ||||
Draegerwerk AG & Co. KGaA | (12,472 | ) | (1,022,651 | ) | ||||
Wacker Chemie AG | (9,061 | ) | (1,694,901 | ) | ||||
| (3,268,294 | ) | |||||||
Great Britain (3.99%) | ||||||||
Amcor PLC | (79,044 | ) | (916,120 | ) | ||||
Fevertree Drinks PLC | (6,049 | ) | (189,957 | ) | ||||
Hargreaves Lansdown PLC | (5,648 | ) | (109,016 | ) | ||||
Kingfisher PLC | (168,586 | ) | (764,908 | ) | ||||
Pentair PLC | (3,633 | ) | (263,865 | ) | ||||
Schroders PLC | (26,573 | ) | (1,288,078 | ) | ||||
| (3,531,944 | ) | |||||||
Japan (1.97%) | ||||||||
Mitsui Chemicals, Inc. | (22,890 | ) | (772,403 | ) | ||||
Sugi Holdings Co., Ltd. | (13,323 | ) | (973,179 | ) | ||||
| (1,745,582 | ) | |||||||
8
CPG Cooper Square International Equity, LLC
Schedule of Investments (Continued)
September 30, 2021
Common Stock (continued) | Shares | Fair Value | ||||||
Netherlands (1.87%) | ||||||||
Koninklijke Ahold Delhaize NV | (20,941 | ) | $ | (697,386 | ) | |||
Randstad NV | (14,176 | ) | (954,541 | ) | ||||
| (1,651,927 | ) | |||||||
Sweden (1.40%) | ||||||||
Dometic Group AB | (40,535 | ) | (615,307 | ) | ||||
Electrolux AB, Series B | (9,736 | ) | (225,134 | ) | ||||
ICA Gruppen AB | (8,727 | ) | (401,110 | ) | ||||
| (1,241,551 | ) | |||||||
Switzerland (4.16%) | ||||||||
Kuehne + Nagel International AG | (3,765 | ) | (1,289,104 | ) | ||||
Swisscom AG | (2,251 | ) | (1,296,765 | ) | ||||
Tecan Group AG | (1,912 | ) | (1,089,380 | ) | ||||
| (3,675,249 | ) | |||||||
United States (4.47%) | ||||||||
AutoNation, Inc. | (6,095 | ) | (742,127 | ) | ||||
Blackstone, Inc. | (1,085 | ) | (126,229 | ) | ||||
Brunswick Corp. | (1,906 | ) | (181,585 | ) | ||||
Dow, Inc. | (1,468 | ) | (84,498 | ) | ||||
Flowers Foods, Inc. | (32,144 | ) | (759,563 | ) | ||||
General Mills, Inc. | (10,222 | ) | (611,480 | ) | ||||
Kimberly-Clark Corp. | (1,186 | ) | (157,074 | ) | ||||
Kraft Heinz Co. | (8,210 | ) | (302,292 | ) | ||||
Leggett & Platt, Inc. | (4,902 | ) | (219,806 | ) | ||||
Malibu Boats, Inc. | (1,118 | ) | (78,238 | ) | ||||
Polaris, Inc. | (1,378 | ) | (164,891 | ) | ||||
Textainer Group Holdings, Ltd. | (8,529 | ) | (297,747 | ) | ||||
Whirlpool Corp. | (1,094 | ) | (223,023 | ) | ||||
| (3,948,553 | ) | |||||||
Total Common Stocks | ||||||||
(Proceeds $23,363,318) | (24,186,382 | ) | ||||||
9
CPG Cooper Square International Equity, LLC
Schedule of Investments (Continued)
September 30, 2021
Exchange Traded Funds (6.69%) | Shares | Fair Value | ||||||
Invesco DB US Dollar Index Bullish Fund | (29,308 | ) | $ | (741,785 | ) | |||
Invesco STOXX Europe 600 Optimised Health Care UCITS ETF | (1,452 | ) | (574,927 | ) | ||||
iShares® Core MSCI Total International Stock ETF | (12,902 | ) | (916,042 | ) | ||||
iShares® MSCI ACWI ex US ETF | (16,539 | ) | (916,426 | ) | ||||
iShares® MSCI Brazil ETF | (16,294 | ) | (523,526 | ) | ||||
Vanguard® FTSE Europe ETF | (5,560 | ) | (364,792 | ) | ||||
Vanguard® Total International Stock ETF | (14,678 | ) | (928,531 | ) | ||||
WisdomTree India Earnings Fund | (25,400 | ) | (949,960 | ) | ||||
Total Exchange Traded Funds | ||||||||
(Proceeds $5,861,256) | $ | (5,915,989 | ) | |||||
Total Securities Sold Short (34.04%) | ||||||||
(Proceeds $29,224,574) | $ | (30,102,371 | ) | |||||
See accompanying Notes to Financial Statements.
10
CPG Cooper Square International Equity, LLC
Schedule of Investments (Continued)
September 30, 2021
Country Composition (September 30, 2021)
Common Stock | ||||
Great Britain | 18.79 | % | ||
Japan | 14.52 | % | ||
France | 10.18 | % | ||
United States | 7.13 | % | ||
Germany | 7.02 | % | ||
Ireland | 6.65 | % | ||
Switzerland | 4.43 | % | ||
Hong Kong | 3.61 | % | ||
Netherlands | 2.18 | % | ||
Australia | 1.90 | % | ||
Sweden | 1.88 | % | ||
China | 0.68 | % | ||
Denmark | 0.42 | % | ||
| 79.39 | % |
Securities Sold Short | ||||
Common Stock | ||||
Canada | -0.14 | % | ||
Belgium | -0.63 | % | ||
Denmark | -0.84 | % | ||
Bermuda | -1.04 | % | ||
France | -1.17 | % | ||
Sweden | -1.40 | % | ||
Netherlands | -1.87 | % | ||
Finland | -1.97 | % | ||
Japan | -1.97 | % | ||
Germany | -3.70 | % | ||
Great Britain | -3.99 | % | ||
Switzerland | -4.16 | % | ||
United States | -4.47 | % | ||
Exchange Traded Funds | ||||
European Union | -0.41 | % | ||
Brazil | -0.59 | % | ||
India | -1.07 | % | ||
Germany | -1.69 | % | ||
United States | -2.93 | % | ||
| -34.04 | % |
Percentages are based upon net assets.
11
CPG Cooper Square International Equity, LLC
Statement of Assets and Liabilities
September 30, 2021
Assets | ||||
Investments, at fair value (Cost $68,727,862) | $ | 70,285,499 | ||
Cash | 51,227,551 | |||
Cash denominated in foreign currencies (Cost $86,404) | 86,329 | |||
Due from broker | 2,000,000 | |||
Due from advisor | 1,008,845 | |||
Receivable for Investments sold | 309,108 | |||
Foreign tax reclaims | 21,950 | |||
Dividends receivable | 101,603 | |||
Unrealized appreciation on total return swap contracts (net of premiums paid $0) | 2,397,759 | |||
Prepaid board retainer | 16,900 | |||
Receivable for total return swap contracts | 31,022 | |||
Prepaid Offering Costs | 37,248 | |||
Prepaid expenses and other assets | 3,001 | |||
Total Assets | 127,526,815 | |||
Liabilities | ||||
Securities sold short, at value (Proceeds $29,224,574) | 30,102,371 | |||
Capital contributions received in advance | 3,415,800 | |||
Unrealized depreciation on total return swap contracts (net of premiums received $0) | 2,024,665 | |||
Payable for Investments purchased | 1,643,601 | |||
Incentive fees payable | 239,211 | |||
Payable to Adviser | 1,228,508 | |||
Professional fees payable | 123,307 | |||
Payable for short sale dividends | 76,749 | |||
Payable for total return swap contracts payments | 66,777 | |||
Accounting and administration fees payable | 39,876 | |||
Distribution and servicing fees payable | 34,350 | |||
Transfer agency fees payable | 28,036 | |||
Directors’ and Officer fees payable | 2,000 | |||
Accounts payable and other accrued expenses | 85,116 | |||
Total Liabilities | 39,110,367 | |||
Net Assets | $ | 88,416,448 | ||
Composition of Net Assets | ||||
Paid-in capital | $ | 87,655,095 | ||
Total distributable earnings | 761,353 | |||
Net Assets | $ | 88,416,448 | ||
Net Assets Attributable to: | ||||
Class A Units | 55,083,489 | |||
Class I Units | 33,332,959 | |||
| 88,416,448 | ||||
Units of Beneficial Interest Outstanding (Unlimited Number of Units Authorized): | ||||
Class A Units | 3,465,557 | |||
Class I Units | 1,560,515 | |||
| 5,026,072 | ||||
Net Asset Value per Unit: | ||||
Class A Units | $ | 15.90 | ||
Class I Units | $ | 21.36 |
See accompanying Notes to Financial Statements.
12
CPG Cooper Square International Equity, LLC
Statement of Operations
For the Period from November 2, 2020 (Commencement of Operations) to September 30, 2021
Investment Income | ||||
Dividend income (net, foreign withholding tax $(53,285)) | $ | 871,094 | ||
Investment Income | 871,094 | |||
Expenses | ||||
Management fee | 719,766 | |||
Incentive fees | ||||
Class I | 239,211 | |||
Organizational Expenses | 86,370 | |||
Transfer agent fees | 79,490 | |||
Accounting and administration fees | 122,043 | |||
Professional fees | 295,000 | |||
Distribution and Servicing fees | ||||
Class A | 256,983 | |||
Offering costs | 378,339 | |||
Interest expense | 104,918 | |||
Dividend expense on short sales | 533,131 | |||
Directors’ and Officer fees | 85,500 | |||
Custody fees | 66,523 | |||
Insurance expense | 603 | |||
Other fees | 55,350 | |||
Total Expenses | 3,023,227 | |||
Less expenses waived/reimbursed by Adviser | ||||
Class A Units | (454,955 | ) | ||
Class I Units | (363,889 | ) | ||
Net expenses | 2,204,383 | |||
Net Investment Loss | (1,333,289 | ) | ||
Net Realized Gain/(Loss) and Change in Unrealized Appreciation/(Depreciation) | ||||
Net realized gain/(loss) from: | ||||
Investments | 3,340,373 | |||
Securities sold short | (2,877,808 | ) | ||
Total return swap contracts | 616,613 | |||
Forward foreign currency contracts | 35,564 | |||
Foreign currency transactions | (70,618 | ) | ||
Net change in unrealized appreciation/(depreciation) on: | ||||
Investments | 1,557,637 | |||
Securities sold short | (877,797 | ) | ||
Total return swap contracts | 373,094 | |||
Foreign currency | (2,416 | ) | ||
Net Realized Gain/(Loss) and Change in Unrealized Appreciation/(Depreciation) | 2,094,642 | |||
Net Increase in Net Assets Resulting from Operations | $ | 761,353 |
See accompanying Notes to Financial Statements.
13
CPG Cooper Square International Equity, LLC
Statement of Changes in Net Assets
| For the Period | |||
Changes in Net Assets Resulting from Operations | ||||
Net investment loss | $ | (1,333,289 | ) | |
Net realized gain | 1,044,124 | |||
Net change in unrealized appreciation | 1,050,518 | |||
Net Change in Assets Resulting from Operations | 761,353 | |||
Change in Net Assets Resulting from Capital Transactions | ||||
Class A Units | ||||
Capital contributions | 55,227,115 | |||
Total Class A Units Transactions | 55,227,115 | |||
Class I Units | ||||
Capital contributions | 32,327,980 | |||
Total Class I Units Transactions | 32,327,980 | |||
Net Change in Net Assets Resulting from Capital Transactions | 87,555,095 | |||
Total Net increase in Net Assets | 88,316,448 | |||
Net Assets | ||||
Beginning of period | 100,000 | |||
End of period | $ | 88,416,448 | ||
Unit Activity | ||||
Class A Units | ||||
Capital contributions | 3,462,223 | |||
Net Change in Class A Units Outstanding | 3,462,223 | |||
Class I Units | ||||
Capital contributions | 1,558,014 | |||
Net Change in Class I Units Outstanding | 1,558,014 | |||
Total Change in Units Outstanding | 5,020,237 | |||
See accompanying Notes to Financial Statements.
14
CPG Cooper Square International Equity, LLC
Statement of Cash Flows
For the Period November 2, 2020 (Commencement of Operations) to September 30, 2021
Cash Flows from Operating Activities: | ||||
Net increase in net assets resulting from operations | $ | 761,353 | ||
Adjustments to reconcile net increase in net assets from operations to net cash used in operating activities: | ||||
Net realized gain from investments | (3,340,373 | ) | ||
Net realized loss on securities sold short | 2,877,808 | |||
Net realized gain on forward foreign currency contracts | (35,564 | ) | ||
Net realized gain on total return swap contracts | (616,613 | ) | ||
Net change in unrealized appreciation on investments | (1,557,637 | ) | ||
Net change in unrealized depreciation on securities sold short | 877,797 | |||
Net change in unrealized appreciation on total return swaps | (373,094 | ) | ||
Purchases of Investment securities | (99,326,414 | ) | ||
Sales of Investment securities | 36,193,698 | |||
Proceeds from securities sold short transactions | 55,601,370 | |||
Purchases to cover securities sold short transactions | (29,254,605 | ) | ||
Proceeds from sale of option contracts | 389,773 | |||
Purchases of option contracts | (366,054 | ) | ||
(Increase)/Decrease in assets: | ||||
Prepaid offering costs | (37,248 | ) | ||
Due from advisor | (1,008,845 | ) | ||
Dividend receivable | (101,603 | ) | ||
Foreign tax reclaims | (21,950 | ) | ||
Unrealized appreciation on total return swap contracts | (2,397,759 | ) | ||
Receivable for total return swap contracts | (31,022 | ) | ||
Due from broker | (2,000,000 | ) | ||
Prepaid board retainer | (16,900 | ) | ||
Prepaid expenses and other assets | (3,001 | ) | ||
Increase/(Decrease) in liabilities: | ||||
Payable for short sale dividends | 76,749 | |||
Payable to Adviser | 1,228,508 | |||
Payable for total return swap contract payments | 66,777 | |||
Unrealized depreciation on total return swap contracts | 2,024,665 | |||
Payable for Directors and officer fees | 2,000 | |||
Accounting and administration fees payable | 39,876 | |||
Payable for incentive fees | 239,211 | |||
Professional fees payable | 123,307 | |||
Distribution and servicing fees payable | 34,350 | |||
Transfer agency fees payable | 28,036 | |||
Accounts payable and other accrued expenses | 85,116 | |||
Net cash used in operating activities | (39,838,288 | ) | ||
15
CPG Cooper Square International Equity, LLC
Statement of Cash Flows (Continued)
For the Period November 2, 2020 (Commencement of Operations) to September 30, 2021
Cash Flows from Financing Activities: | ||||
Proceeds from capital contributions, including contributions received in advance | $ | 90,970,895 | ||
Net cash provided by financing activities | 90,970,895 | |||
Effects of exchange rates on cash | 81,273 | |||
Net Change in cash | 51,213,880 | |||
Cash, beginning of period | $ | 100,000 | ||
Cash, end of period | $ | 51,313,880 | ||
Includes cash denominated in foreign currencies. | ||||
Reconciliation of cash at the end of the period to the Statement of Assets and Liabilities: | ||||
Cash | 51,227,551 | |||
Cash denominated in foreign currencies | 86,329 | |||
Cash, end of period | 51,313,880 |
See accompanying Notes to Financial Statements.
16
CPG Cooper Square International Equity, LLC
Financial Highlights
Class A
| For the Period | |||
Per Unit Operating Performance: | ||||
Net Asset Value, Beginning of Period | $ | 15.00 | ||
Activity from investment operations:(1) | ||||
Net investment loss | (0.32 | )(2) | ||
Net realized and unrealized gain | 1.22 | |||
Total from investment operations | 0.90 | |||
Net Asset Value, End of Period | $ | 15.90 | ||
Net assets, end of period (in thousands) | $ | 55,083 | ||
Ratios to Average Net Assets (including interest expense and dividend expense on securities sold short) | ||||
Operating expenses excluding fee waivers/reimbursements | 5.11 | %(3) | ||
Operating expenses including fee waivers/reimbursements | 3.77 | %(3) | ||
Net investment loss including fee waivers/reimbursements | (2.20 | )%(3) | ||
Ratios to Average Net Assets (excluding interest expense and dividend expense on securities sold short) | ||||
Operating expenses excluding fee waivers/reimbursements | 3.95 | %(3) | ||
Operating expenses including fee waivers/reimbursements | 2.61 | %(3) | ||
Net investment loss including fee waivers/reimbursements | (1.04 | )%(3) | ||
Portfolio turnover rate(4) | 78 | % | ||
Total Return(5)(6) | 6.00 | % | ||
Total Return excluding incentive fees(7) | 6.00 | % | ||
(1) | Selected data is for a single unit outstanding throughout the period. |
(2) | Based on average shares outstanding during the period. |
(3) | Net investment loss and total expenses are annualized for periods less than one full year, except for organizational costs and incentive fees which are one-time expenses. During the period, there was no incentive fee for class A. |
(4) | Portfolio turnover for periods less than one year are not annualized and does not include securities received or delivered from processing creations or redemptions in-kind. |
(5) | Total return reflects the changes in net asset value and adjusted for cash flows related to capital contributions and withdrawals during the period. Total returns shown exclude the effect of applicable sales charges and redemption fees. |
(6) | Not annualized |
(7) | Class A did not incur any incentive fees during the period. |
See accompanying Notes to Financial Statements.
17
CPG Cooper Square International Equity, LLC
Financial Highlights
Class I
| For the Period | |||
Per Unit Operating Performance: | ||||
Net Asset Value, Beginning of Period | $ | 20.00 | ||
Activity from investment operations:(1) | ||||
Net investment loss | (0.49 | )(2) | ||
Net realized and unrealized gain | 1.85 | |||
Total from investment operations | 1.36 | |||
Net Asset Value, End of Period | $ | 21.36 | ||
Net assets, end of period (in thousands) | $ | 33,333 | ||
Ratios to Average Net Assets (including interest expense and dividend expense on securities sold short) | ||||
Operating expenses excluding fee waivers/reimbursements | 5.42 | %(3) | ||
Operating expenses including fee waivers/reimbursements | 3.85 | %(3) | ||
Net investment loss including fee waivers/reimbursements | (2.39 | )%(3) | ||
Ratios to Average Net Assets (excluding interest expense and dividend expense on securities sold short) | ||||
Operating expenses excluding fee waivers/reimbursements | 4.36 | %(3) | ||
Operating expenses including fee waivers/reimbursements | 2.79 | %(3) | ||
Net investment loss including fee waivers/reimbursements | (1.33 | )%(3) | ||
Portfolio turnover rate(4) | 78 | % | ||
Total Return(5)(6) | 6.80 | % | ||
Total Return excluding incentive fees | 7.55 | % | ||
(1) | Selected data is for a single unit outstanding throughout the period. |
(2) | Based on average shares outstanding during the period. |
(3) | Net investment loss and total expenses are annualized for periods less than one full year, except for organizational costs and incentive fees which are one-time expenses. |
(4) | Portfolio turnover for periods less than one year are not annualized and does not include securities received or delivered from processing creations or redemptions in-kind. |
(5) | Total return reflects the changes in net asset value and adjusted for cash flows related to capital contributions and withdrawals during the period. Total returns shown exclude the effect of applicable sales charges and redemption fees. |
(6) | Not annualized |
See accompanying Notes to Financial Statements.
18
CPG Cooper Square International Equity, LLC
Notes to Financial Statements
September 30, 2021
1. ORGANIZATION
CPG Cooper Square International Equity, LLC (the “Fund”) was organized as a Delaware limited liability company on July 14, 2020. The Fund is registered under the Investment Company Act of 1940, as amended (the “1940 Act”), as a closed-end, non-diversified management investment company. The Fund commenced operations on November 2, 2020. The Fund’s investment adviser is Central Park Advisers, LLC (the “Adviser”), a Delaware Limited Liability Company registered under the Investment Advisers Act of 1940, as amended (the “Advisers Act”). The Fund’s investment sub-adviser (the “Sub-Adviser”) is Select Equity Group, L.P., a Delaware limited partnership registered under the Advisers Act. The Sub-Adviser is responsible for the day-to-day management of the Fund’s portfolio. The Fund’s investment objective is to seek to achieve maximum total return. The Fund seeks to achieve its investment objective by investing primarily in equity securities of non-U.S.-domiciled issuers, including those domiciled in emerging markets. Under normal circumstances, the Fund invests at least 80% of its net assets, plus any borrowings for investment purposes, in equity securities. For purposes of the Fund’s investment program, “Equity securities” means common and preferred stocks (including investments in initial public offerings), convertible securities, warrants and rights. The Fund may invest in equity securities without restriction to market capitalization. The Fund’s approach involves taking long and short positions in equity securities – namely, investing long on the basis of extensive research and fundamental analysis, and seeking to take opportunistic advantage of market inefficiencies by selling other securities short. The majority of the Fund’s long exposure is to growth companies with high returns on capital and high barriers to competition that the Sub-Adviser believes are trading at a discount to their intrinsic value. The Sub-Adviser invests in a majority of these companies with an expectation of a multi-year holding period. The Fund’s long exposure also includes investments in more opportunistic situations that may be held for a multi-quarter, rather than multi-year, time frame. In the short portfolio, the Fund attempts to identify companies that are exposed to ongoing competitive pressures with poor returns on capital and deteriorating fundamentals. The short positions generally are not selected as direct hedges to the long positions. Under extraordinary circumstances, the Fund may acquire substantial stakes in public companies; however, the Fund generally does not invest more than 10% of its net asset value (measured at the time of purchase) in the voting securities of any one investment. The Fund may seek to obtain exposure to particular issuers or securities through derivative transactions, including, without limitation, swaps (including total return swaps), contracts for differences, options and other types of derivative arrangements for investment or hedging purposes.
Subject to the requirements of the 1940 Act, the business and affairs of the Fund shall be managed under the direction of the Fund’s Board of Directors (the “Board,” with an individual member referred to as a “Director”). The Board has the right, power and authority, on behalf of the Fund and in its name, to do all things necessary and proper to carry out its duties under the Fund’s Limited Liability Company Agreement, as amended and restated from time to time. Each Director shall be vested with the same powers, authority and responsibilities on behalf of the Fund as are customarily vested in each director of a Delaware corporation, and each Director who is not an “interested person” (as defined in the 1940 Act) of the Fund shall be vested with the same powers, authority and responsibilities on behalf of the Fund as are customarily vested in each director of a closed-end management investment company registered under the 1940 Act that is organized as a Delaware corporation who is not an “interested person” of such company. No Director shall have the authority individually to act on behalf of or to bind the Fund except within the scope of such Director’s authority as delegated by the Board. The Board may delegate the management of the Fund’s day-to-day operations to one or more officers or other persons (including, without limitation, the Adviser), subject to the investment objective and policies of the Fund and to the oversight of the Board.
The Fund offers two classes of limited liability company interests (“Units”), Class A Units and Class I Units, which are registered under the Securities Act of 1933, as amended, and offered to qualified clients as defined in Rule 205-3 under the Advisers Act. Each class of Units has certain differing characteristics, particularly in terms of the distribution fees that may be charged to investors. While neither the Fund nor Foreside Fund Services, LLC, the distributor of the Fund’s Units, on a best effort basis (the “Distributor”), imposes a sales load on purchases of Class A or Class I Units, financial intermediaries may directly charge Class A investors certain transaction or other fees in such amounts as they may determine. Under the terms of the Fund’s distribution agreement, the Distributor is authorized to pay third parties, including brokers, dealers and certain financial advisors (which may include wealth advisors) and others (collectively, “Selling Agents”) for the provision of distribution services as contemplated by Rule 12b-1 under the 1940 Act and for non-12b-1 services to investors holding Class A Units. The Fund pays the Distributor a monthly fee out of the net assets of Class A Units at the annual rate of 0.75% of the net asset value of Class A Units determined and accrued as of the end of each month (before any repurchases of Class A Units, but after the Management Fee (defined below) is calculated and accrued) (the “Distribution and Servicing
19
CPG Cooper Square International Equity, LLC
Notes to Financial Statements (Continued)
September 30, 2021
1. ORGANIZATION (continued)
Fee”). The Distributor pays the Distribution and Servicing Fee to Selling Agents, who may use such fee to compensate the financial advisors involved in the sale of Units. Amounts retained by the Distributor, if any, are used by the Distributor to pay for Fund-related distribution and servicing expenses. Payment of the Distribution and Servicing Fee is governed by the Fund’s Rule 12b-1 Plan, which, pursuant to the conditions of an exemptive order issued by the Securities and Exchange Commission (the “SEC”), has been adopted by the Fund with respect to Class A Units in compliance with Rule 12b-1 under the 1940 Act. The Distribution and Servicing Fee is charged on an aggregate class-wide basis, and Class A investors are subject to the Distribution and Servicing Fee as long as they hold their Class A Units. Each compensated Selling Agent is paid by the Distributor based on the net asset value of outstanding Class A Units held by investors that receive services from such Selling Agent. Class I Units are not subject to the Distribution and Servicing Fee.
The Fund is offering up to $250 million of Units on a continuous basis through the Distributor. The net asset values of each class of Units will vary over time as a result of the differing fees and expenses applicable to each class of Units and different initial offering prices and inception dates. Units may be purchased as of the first business day of each month based upon their then current net asset value per Unit. Purchase proceeds do not become the Fund’s assets until each closing date on which Units are delivered. Investors’ funds are held in escrow prior to the acceptance of orders and investment of the funds.
The Fund’s term is perpetual unless it is otherwise dissolved under the terms of its formation documents.
2. | SUMMARY OF SIGNIFICANT ACCOUNTING POLICIES |
The Fund meets the definition of an investment company and follows the accounting and reporting guidance as issued through the Financial Accounting Standards Board (“FASB”) Accounting Standards Codification (“ASC”) 946, Financial Services – Investment Companies.
The following is a summary of significant accounting policies followed by the Fund in the preparation of its financial statements. These policies are in conformity with accounting principles generally accepted in the United States of America (“U.S. GAAP”).
Federal Tax Information: It is the Fund’s policy to qualify as a regulated investment company (“RIC”) under Subchapter M of the Internal Revenue Code of 1986, as amended (the “Code”). The Fund’s policy is to comply with the provisions of the Code applicable to RICs and to distribute to its investors substantially all of its net investment income and net realized gain on investments, if any, earned each year. In addition, the Fund intends to distribute sufficient income and gains each year so as to not be subject to U.S. Federal excise tax on certain undistributed amounts. Accordingly, no provision for federal income or excise tax has been recorded in these financial statements.
The Fund has adopted a tax-year end of September 30. The Fund files tax returns as prescribed by the tax laws of the jurisdictions in which it operates. In the normal course of business, the Fund is subject to examination by U.S. federal, state, local and foreign jurisdictions, where applicable.
The character of distributions made during the period from net investment income or net realized gain may differ from the characterization for federal income tax purposes due to differences in the recognition of income, expense and gain or loss items for financial statement and tax purposes. Where appropriate, reclassifications between net asset accounts are made for such differences that are permanent in nature.
The character of distributions made during the year from net investment income or net realized gain may differ from the characterization for federal income tax purposes due to differences in the recognition of income, expense and gains or loss items for financial statement and tax purposes. Where appropriate, reclassifications between net asset accounts are made for such differences that are permanent in nature.
20
CPG Cooper Square International Equity, LLC
Notes to Financial Statements (Continued)
September 30, 2021
2. | SUMMARY OF SIGNIFICANT ACCOUNTING POLICIES (continued) |
The cost of investments and the gross unrealized appreciation and depreciation on investments as of September 30, 2021 are noted below.
Federal tax cost of investments | $ | 69,648,155 | ||
Gross unrealized appreciation | 3,808,446 | |||
Gross unrealized depreciation | (3,171,102 | ) | ||
Net unrealized appreciation | $ | 637,344 |
There were no distributions paid during the Tax Year ended September 30, 2021.
As of September 30, 2021, the components of distributable earnings on a tax basis were as follows:
Undistributed ordinary income | $ | 1,102,755 | ||
Undistributed short-term capital gains | — | |||
Gross unrealized appreciation | 3,808,446 | |||
Gross unrealized depreciation | (3,171,102 | ) | ||
Accumulated capital and other losses | (12,267 | ) | ||
Other differences | (81,092 | ) | ||
Total distributable earnings | $ | 1,646,740 |
Cash: Cash consists of monies held at the Bank of New York Mellon (the “Custodian”), cash on deposit, and cash held at prime brokers. Such cash may exceed federally insured limits. The Fund has not experienced any losses in such accounts and does not believe it is exposed to any significant credit risk on such accounts. There are no restrictions on the cash held by the Fund.
Short-Term Investments: Short-term investments represent investments in high quality money market instruments and money market mutual funds, and are recorded at net asset value per share (“NAV”) per share which approximates fair value. Money market instruments are high quality, short-term fixed-income obligations, which generally have remaining maturities of one year or less and may include U.S. Government securities, commercial paper, certificates of deposit and bankers acceptances issued by domestic branches of U.S. banks that are members of the Federal Deposit Insurance Corporation, and repurchase agreements. The Due from Broker amount represents the cash collateral from the short and swap positions that the Fund holds.
Investment Transactions: Investment transactions are accounted for on a trade date basis. Dividend income is recorded on the ex-dividend date. Interest income, which includes accretion of discounts and amortization of premiums, is accrued and recorded on an accrual basis. Realized gains and losses from securities transactions and unrealized appreciation and depreciation of securities are determined using the specific identification method for both financial reporting and tax purposes.
Foreign Currency: Investments and other assets and liabilities denominated in foreign currencies are translated into U.S. dollar amounts at the date of valuation. Purchases and sales of investments and income and expense items denominated in foreign currencies are translated into U.S. dollar amounts on the respective dates of such transactions. The Fund does not isolate that portion of the results of operations resulting from changes in foreign exchange rates on investments from the fluctuations arising from changes in market prices of securities held. Such fluctuations are included with the net realized and unrealized gain or loss from investments in the Statement of Operations. Reported net realized foreign exchange gains or losses arise from sales of foreign currencies, currency gains or losses realized between the trade and settlement dates on securities transactions and the difference between the amounts of dividends, interest and foreign withholding taxes recorded on the Fund’s books and the U.S. dollar equivalent of the amounts actually received or paid. Net unrealized foreign exchange gains and losses arise from changes in the fair values of assets and liabilities, other than investments at period end, resulting from changes in exchange rates.
21
CPG Cooper Square International Equity, LLC
Notes to Financial Statements (Continued)
September 30, 2021
2. | SUMMARY OF SIGNIFICANT ACCOUNTING POLICIES (continued) |
Use of Estimates: The preparation of financial statements in conformity with U.S. GAAP requires management to make estimates and assumptions that affect the reported amounts of assets and liabilities and disclosure of contingent assets and liabilities at the date of the financial statements and the reported amounts of increases and decreases in net assets from operations during the reporting period. Actual results could differ from those estimates.
Fair Value of Financial Instruments: The fair value of the Fund’s assets and liabilities which qualify as financial instruments approximates the carrying amounts presented in the Statement of Assets and Liabilities. The Fund values its investments in investment funds at fair value in accordance with FASB ASC 820, Fair Value Measurement (“ASC 820”). See Note 3 for more information.
Short sales: The Fund may sell a security that it does not own in anticipation of a decline in the fair value of that security. When the Fund sells a security short, it must borrow the security sold short and deliver it to a broker-deal through which it made the short sale. A gain, limited to the price at which the Fund sold the security short, or a loss, unlimited in size will be recognized upon the termination of a short sale. The Fund is also subject to the risk that it may be unable to reacquire a security to terminate a short position except at a price substantially in excess of the last quoted price.
Class allocations: Income, common expenses and realized and unrealized gains and losses are calculated at the Fund level and allocated monthly to each class of shares based on its respective percentage of adjusted net assets at the beginning of the month.
3. | PORTFOLIO VALUATION |
The NAV of the Fund is calculated as of the close of business on the last business day of each calendar month, each date that Units are offered or repurchased and at such other times as the Board shall determine (each, a “Valuation Date”). In determining its NAV, the Fund values its investments as of the relevant Valuation Date. The NAV of the Fund equals, unless otherwise noted, the value of the total assets of the Fund, less all of its liabilities, including accrued fees and expenses, each determined as of the relevant Valuation Date. The NAVs of the Class A Units and Class I Units are calculated separately based on the fees and expenses applicable to each class.
The 1940 Act provides that securities for which market quotations are “readily available” must be valued at market value, and all other securities and other assets must be valued at “fair value” as determined in good faith by the Board. The Board has approved procedures pursuant to which the Fund values its investments (the “Valuation Procedures”), which memorialize the methods used for determining the value of the Fund’s portfolio securities, and the Adviser oversees the valuation of the Fund’s investments on behalf of the Fund. The Board has assigned to the Adviser general responsibility for determining, in accordance with such procedures, the value of such investments, subject to the statutory obligations of the Board under the 1940 Act. The Adviser has contracted the Sub-Adviser to manage the Fund’s investments. Investments are valued in accordance with the Fund’s Valuation Procedures.
ASC 820 defines fair value as the value that the Fund would receive to sell an investment or pay to transfer a liability in a timely transaction with an independent buyer in the principal market, or in the absence of a principal market, the most advantageous market for the investment or liability. ASC 820 establishes a three-level hierarchy for fair value measurements based upon the transparency of inputs to the valuation of an asset or liability. Inputs may be observable or unobservable and refer broadly to the assumptions that market participants would use in pricing the asset or liability. Observable inputs reflect the assumptions market participants would use in pricing the asset or liability based on market data obtained from sources independent of the Fund. Unobservable inputs reflect the Fund’s own assumptions about the assumptions that market participants would use in valuing the asset or liability developed based on the best information available in the circumstances. Each investment is assigned a level based upon the observation of the inputs which are significant to the overall valuation.
The three-tier hierarchy of inputs is summarized below:
● | Level 1 — unadjusted quoted prices in active markets for identical financial instruments that the reporting entity has the ability to access at the measurement date. |
22
CPG Cooper Square International Equity, LLC
Notes to Financial Statements (Continued)
September 30, 2021
3. | PORTFOLIO VALUATION (continued) |
● | Level 2 — inputs other than quoted prices included within Level 1 that are observable for the financial instrument, either directly or indirectly. Level 2 inputs also include quoted prices for similar assets and liabilities in active markets, and quoted prices for identical or similar assets and liabilities in markets that are not active. |
● | Level 3 — significant unobservable inputs for the financial instrument (including management’s own assumptions in determining the fair value of investments). |
Equity securities, including both long and short positions, are generally valued at the last composite close price on the Valuation Date. If an equity trades on multiple exchanges, the security will be valued at the closing price from the U.S. exchange that the security last traded on before or at the close of the Valuation Date. Publicly-traded foreign equity securities are valued at the last trade price on the securities exchange or national securities market on which such securities primarily are traded (the “primary market”) during regular trading hours on the Valuation Date. Such securities generally are categorized as Level 1 securities. If there are no such trades in the security on the Valuation Date, the security will be valued at the last bid (for long positions) or last ask (for short positions). Debt securities will generally be valued, to the extent possible by an independent pricing service who provides evaluated prices using a variety of inputs, models and assumptions. These securities will be categorized as Level 2 securities. If there is no trade or bid/ask on the previous day, the security will be fair valued. Equity-linked instruments, such as total return swaps, are valued based on the value of the underlying reference asset(s) and the terms of the instrument (e.g., an interest rate) to approximate what the Fund would receive on a current termination of the instrument. Such reference asset(s) are valued in accordance with the applicable provisions of the Valuation Procedures. Such securities will generally be categorized as Level 2 securities.
The following table represents the inputs used to value the investments at fair value on the Statement of Assets and Liabilities within the valuation hierarchy as of September 30, 2021:
Investments in Securities at Value | Level 1 | Level 2 | Level 3 | Total | ||||||||||||
Common Stocks | $ | 70,195,363 | $ | — | $ | — | $ | 70,195,363 | ||||||||
Purchased Options | 90,136 | — | — | 90,136 | ||||||||||||
TOTAL | $ | 70,285,499 | $ | — | $ | — | $ | 70,285,499 | ||||||||
Other Financial Instruments | Level 1 | Level 2 | Level 3 | Total | ||||||||||||
Assets | ||||||||||||||||
Total Return Swap Contracts(a) | $ | — | $ | 2,397,759 | $ | — | $ | 2,397,759 | ||||||||
Liabilities | ||||||||||||||||
Securities Sold Short | ||||||||||||||||
Common Stocks | (24,186,383 | ) | — | — | (24,186,383 | ) | ||||||||||
Exchange Traded Funds | (5,915,988 | ) | — | — | (5,915,988 | ) | ||||||||||
Total Return Swap Contracts(a) | — | (2,024,665 | ) | — | (2,024,665 | ) | ||||||||||
TOTAL | $ | (30,102,371 | ) | $ | 373,094 | $ | — | $ | (29,729,277 | ) | ||||||
(a) | Swap contracts are reported at their unrealized appreciation/(depreciation) at measurement date, which represents the change in the contract’s value from trade date. |
The Fund did not have any securities that used significant unobservable inputs (Level 3) in determining fair value, and there were no transfers into or out of Level 3 during the period.
23
CPG Cooper Square International Equity, LLC
Notes to Financial Statements (Continued)
September 30, 2021
4. | DERIVATIVE INSTRUMENTS |
The Fund is permitted to and also enters into various types of derivative contracts. In doing so, the Fund will employ strategies in differing combinations to permit them to increase, decrease, or change the level or type of exposure to market factors. Central to those strategies are features inherent to derivatives that make them more attractive for this purpose than equity securities; they require little or no initial cash investment, they can focus exposure on only certain selected risk factors and they may not require the ultimate receipt or delivery of the underlying security (or securities) to the contract. This may allow the Fund to pursue its objective more quickly and efficiently than if it were to make direct purchases or sales of securities capable of affecting a similar response to market factors.
The Fund’s use of derivatives can result in losses due to unanticipated changes in the overall market. In instances where the Fund is using derivatives to decrease, or hedge, exposure to market risk factors for securities held by the Fund, there are also risks that those derivatives may not perform as expected resulting in losses for the combined or hedged positions.
Derivatives have little or no initial cash investment relative to their market value exposure and therefore can produce significant gains or losses in excess of their cost. This use of embedded leverage allows the Fund to increase its market value exposure relative to its net assets and can substantially increase the volatility of the Fund’s performance.
Additional associated risks from investing in derivatives also exist and potentially could have significant effects on the valuation of the derivative and the Fund. Typically, the associated risks are not the risks that the Fund is attempting to increase or decrease exposure to, per its investment objectives, but are the additional risks from investing in derivatives.
These associated risks are liquidity risk, which is the risk that the Fund will not be able to sell the derivative in the open market in a timely manner, and credit risk, which is the risk that the counterparty will not fulfill its obligation to the Fund.
Total Return Swap Contracts: Total return swap contracts are exposed to the market risk factor of the specific underlying financial instrument or index. Total return swaps are less standard in structure than other types of swaps and can isolate and/or include multiple types of market risk factors including equity risk, credit risk, and interest rate risk.
A total return swap is an agreement between counterparties to exchange periodic payments based on the value of asset or non-asset references. Generally, upon entering into a total return swap no amount is recorded. Subsequent changes in value are recorded in unrealized appreciation/depreciation on total return swaps at fair value on the Statement of Assets and Liabilities, and net change in unrealized appreciation/depreciation on total return swap contracts on the Statement of Operations. Gain or loss is realized on the termination date of the swap and is included in net realized gain/loss from total return swap contracts on the Statement of Operations.
The Fund may enter into total return swaps on various equity securities or indexes to increase or decrease exposure to equity risk. These equity risk related total return swaps require the Fund to pay or receive a floating reference interest rate, and an amount equal to the opposite price movement of securities or an index (expressed as a percentage) multiplied by the notional amount of the contract. Equity leg payments equal to the positive price movement of the same securities or index (expressed as a percentage) multiplied by the notional amount of the contract and, in some cases, dividends paid on the securities. Reference leg payments equal a floating reference interest rate and an amount equal to the negative price movement of the same securities or index (expressed as a percentage) multiplied by the notional amount of the contract.
The Fund may enter into total return swaps to increase or decrease exposure to the credit risk of various indexes or basket of securities. These credit risk related total return swaps require the Fund to make or receive payments to or from the counterparty based on the movement of credit spreads on the related indexes or securities.
For the period from November 2, 2020 (commencement of operations) to September 30, 2021, the Fund had ending monthly average notional amounts of $1,357,657 on total return swaps which are either long or short the reference asset. Open total return swap contracts at September 30, 2021 are listed in the Schedule of Investments.
24
CPG Cooper Square International Equity, LLC
Notes to Financial Statements (Continued)
September 30, 2021
4. | DERIVATIVE INSTRUMENTS (continued) |
Purchased Options: The Fund may purchase put and call options to seek an increase in total return. Purchased call and put options entitle the Fund to buy and sell a specified number of shares or units of a particular security, currency or index at a specified price at a specific date or within a specific period of time. Upon the purchase of a call or put option, the premium paid by the Fund is included on the Statement of Assets and Liabilities as an investment. All premiums are marked-to-market daily, and any unrealized appreciation or depreciation is recorded on the Fund’s Statement of Operations. As the purchaser of an index option, the Fund has the right to receive a cash payment equal to any depreciation in the value of the index below the strike price of the option (in the case of a put) or equal to any appreciation in the value of the index over the strike price of the option (in the case of a call) as of the valuation date of the option. Premiums paid for purchased call and put options which have expired are treated as realized losses on investments on the Statement of Operations. Upon the exercise or closing of a purchased put option, the premium is offset against the proceeds on the sale of the underlying security or financial instrument in order to determine the realized gain or loss on investments. Upon the exercise or closing of a purchased call option, the premium is added to the cost of the security or financial instrument. The risk associated with purchasing options is limited to the premium originally paid. The average market value of purchased options contracts open during the period ended September 30, 2021, was $8,194. Open purchased options at September 30, 2021, are listed in the Schedule of Investments.
The valuation of derivative instruments by risk exposure as reported within the Statement of Assets and Liabilities at September 30, 2021 was as follows:
Risk Exposure | Statement of Assets and | Fair Value | Statement of Assets and | Fair Value | ||||||
Assets: | Liabilities: | |||||||||
Foreign Exchange Rate Risk (Forward Foreign Currency Contracts) | Unrealized appreciation on forward foreign currency contracts | $ | — | Unrealized depreciation on forward foreign currency contracts | $ | — | ||||
Market and Credit Risk (Purchased Options) | Included in Investments, at value, on the Statement of Assets and Liabilities. | 90,136 | Included in Investments, at value, on the Statement of Assets and Liabilities. | — | ||||||
Market and Credit Risk (Total Return Swap Contracts) | Unrealized appreciation on total return swap contracts | 2,397,759 | Unrealized depreciation on total return swap contracts | 2,024,665 | ||||||
Total | $ | 2,487,895 | $ | 2,024,665 | ||||||
25
CPG Cooper Square International Equity, LLC
Notes to Financial Statements (Continued)
September 30, 2021
4. | DERIVATIVE INSTRUMENTS (continued) |
For the period from November 2, 2020 (commencement of operations) to September 30, 2021, the effect of derivative instruments on the Statement of Operations were as follows:
Risk Exposure | Statement of | Statement of Cash | Realized Gain/ | Statement of | Change in | ||||||
Foreign Exchange Rate Risk (Forward Foreign Currency Contracts) | Net realized gain/(loss) on forward foreign currency contracts | Net realized gain on forward foreign currency contracts | $ | 35,564 | Change in unrealized appreciation/ (depreciation) on forward foreign currency contracts | $ | — | ||||
Market and Credit Risk (Purchased Options) | Net realized gain/(loss) on Investments | Proceeds from sale of option contracts | 89,020 | Included in change in net unrealized appreciation (depreciation) on Investments | 24,836 | ||||||
Market and Credit Risk (Total Return Swap Contracts) | Net realized gain/(loss) on total return swaps | Net realized gain on total return swap contracts | 616,613 | Change in unrealized appreciation/ (depreciation) on total return swaps | 373,094 | ||||||
Total | $ | 741,197 | $ | 397,930 | |||||||
Offsetting Arrangements: Certain derivative contracts are executed under standardized netting agreements. A derivative netting arrangement creates an enforceable right of set-off that becomes effective, and affects the realization of settlement on individual assets, liabilities and collateral amounts, only following a specified event of default or early termination. Default events may include the failure to make payments or deliver securities timely, material adverse changes in financial condition or insolvency, the breach of minimum regulatory capital requirements, or loss of license, charter or other legal authorization necessary to perform under the contract. These agreements mitigate counterparty credit risk by providing for a single net settlement with a counterparty of all financial transactions covered by the agreement in an event of default as defined under such agreement.
26
CPG Cooper Square International Equity, LLC
Notes to Financial Statements (Continued)
September 30, 2021
4. | DERIVATIVE INSTRUMENTS (continued) |
The following table presents derivative financial instruments that are subject to enforceable netting arrangements, collateral arrangements or other similar agreements as of September 30, 2021:
| Offsetting of Derivative Assets | ||||||||||||||||||||||||||
| Gross Amounts Not Offset in the Statement of Assets and Liabilities | ||||||||||||||||||||||||||
| Counterparty | Gross Amounts of Recognized Assets | Gross Amounts Offset in the Statement of Assets and Liabilities | Net Amounts Presented in the Statements of Assets and Liabilities | Financial Instruments Available for Offset | Cash Collateral Received* | Net Amount Receivable | ||||||||||||||||||||
| Total Return Swap Contracts | Morgan Stanley | $ | 2,259,440 | $ | — | $ | 2,259,440 | $ | (1,970,369 | ) | $ | — | $ | 289,071 | ||||||||||||
| Goldman Sachs | 138,319 | — | 138,319 | (54,296 | ) | — | 84,023 | |||||||||||||||||||
| TOTAL | $ | 2,397,759 | $ | — | $ | 2,397,759 | $ | (2,024,665 | ) | $ | — | $ | 373,094 | |||||||||||||
| Offsetting of Derivative Liabilities | ||||||||||||||||||||||||||
| Gross Amounts Not Offset in the Statement of Assets and Liabilities | ||||||||||||||||||||||||||
| Counterparty | Gross Amounts of Recognized Liabilities | Gross Amounts Offset in the Statement of Assets and Liabilities | Net Amounts Presented in the Statements of Assets and Liabilities | Financial Instruments Available for Offset | Cash Collateral Pledged* | Net Amount Receivable | ||||||||||||||||||||
| Total Return Swap Contracts | Morgan Stanley | $ | (1,970,369 | ) | $ | — | $ | (1,970,369 | ) | $ | (1,970,369 | ) | $ | — | $ | — | ||||||||||
| Goldman Sachs | (54,296 | ) | — | (54,296 | ) | (54,296 | ) | — | — | |||||||||||||||||
| TOTAL | $ | (2,024,665 | ) | $ | — | $ | (2,024,665 | ) | $ | (2,024,665 | ) | $ | — | $ | — | |||||||||||
* | These amounts are limited to the derivative asset/liability balance and, accordingly, do not include excess collateral pledged or received. |
5. | RELATED PARTY TRANSACTIONS AND OTHER |
As of September 30, 2021, the Fund had no investments that were related parties.
The Adviser provides investment advisory services to the Fund pursuant to an investment advisory agreement (the “Agreement”). Pursuant to the Agreement, the Fund pays the Adviser a fee (the “Management Fee”) computed and payable monthly in arrears, at the annual rate of 1.25% of the Fund’s net asset value. The Sub-Adviser provides sub-advisory services to the Fund pursuant to a Sub-Advisory agreement among the Sub-Adviser and Adviser and the Fund. In consideration of the sub-advisory services provided to the Fund by the Sub-Adviser, the Adviser pays the Sub-Adviser, out of the Management Fee, a fee computed and payable monthly in arrears, at the annual rate of 0.75% of the Fund’s net asset value (the “Sub-Advisory Fee”). For purposes of determining the Management Fee payable to the Adviser and the Sub-Advisory Fee payable to the Sub-Adviser for any month, “net asset value” means the total value of all assets of the Fund as of the end of such month, less an amount equal to all accrued debts, liabilities and obligations of the Fund as of such date, and calculated before giving effect to any repurchase of Units on such date and before any reduction for any fees (including the Distribution and Servicing Fee and the Incentive Fee (defined below)) and expenses of the Fund. The
27
CPG Cooper Square International Equity, LLC
Notes to Financial Statements (Continued)
September 30, 2021
5. | RELATED PARTY TRANSACTIONS AND OTHER (continued) |
Management Fee and Sub-Advisory Fee are prorated for any period of less than a month based on the number of days in such period. During the period from November 2, 2020 (commencement of operations) to September 30, 2021, the Adviser earned $719,766 of Management Fee which is included in the Statement of Operations.
Additionally, pursuant to the Sub-Advisory Agreement, the Fund will pay the Sub-Adviser an incentive fee, calculated as 20% of the amount by which the Fund’s net profits attributable to each class of Units for all performance periods ending within or coterminous with the close of such fiscal year exceed the balance of the loss carryforward account maintained in respect of such class, without duplication for any incentive fee paid by the Fund in respect of such class during such fiscal year. The Fund also pays the Sub-Adviser the Incentive Fee in the event that a performance period ends in connection with the repurchase of Units by the Fund or a dividend or other distribution payable by the Fund, in each case on the date as of which the Fund’s NAV attributable to any class is calculated for such purpose; provided that only that portion of the Incentive Fee that is attributable to (i) the Units being repurchased (not taking into account any proceeds from any contemporaneous issuance of Units, by reinvestment of dividends and other distributions or otherwise), or (ii) the dividend or other distribution being paid by the Fund and not being reinvested in Units of the Fund, is paid to the Sub-Adviser for such performance period. The Incentive Fee, if any, is calculated and accrued on each date that the Fund calculates its NAV.
“Performance period” means each 12-month period ending as of the Fund’s fiscal year-end (or, for the first fiscal year of the Fund, the period from the commencement of the Fund’s operations through the end of the Fund’s first fiscal year; or such other period ending as of the Fund’s fiscal year-end in the event the Fund’s fiscal year is changed); provided that the period of time from the prior performance period-end (or commencement of the Fund, as the case may be) through the valuation date of (i) a repurchase offer and (ii) a dividend or other distribution also constitutes a performance period. The Incentive Fee is payable for a performance period only if and to the extent that the Fund’s loss carryforward account has a balance of zero. The loss carryforward account is a memorandum account with respect to each class that had an initial balance of zero upon commencement of the class’s operations and, thereafter, is credited as of the end of each performance period with the amount of any net loss of the Fund attributable to such class for that performance period, and is debited with the amount of any net profits of the Fund attributable to such class for that performance period, as applicable. This is known as a “high water mark.” During the period from November 2, 2020 (commencement of operations) to September 30, 2021, the Sub-Adviser earned $239,211 of Incentive Fee for Class I.
Unless otherwise voluntarily or contractually assumed by the Adviser or another party, the Fund bears all expenses incurred in its business, including, but not limited to, the following: all costs and expenses related to investment transactions and positions for the Fund’s account; legal fees; accounting, auditing and tax preparation fees; recordkeeping and custodial fees; costs of computing the Fund’s NAV; fees for data and software providers; research expenses; costs of insurance; registration expenses; certain offering costs; expenses of meetings of investors; directors’ fees; all costs with respect to communications to investors; transfer taxes and taxes withheld on non-U.S. dividends; interest and commitment fees on loans and debit balances; and other types of expenses as may be approved from time to time by the Board.
The Adviser has contractually agreed to limit the amount of specified expenses to an annual rate of 0.60% of the Fund’s net asset value. “Specified expenses” means all expenses incurred by the Fund, except for the management fees and incentive fees paid to the Adviser and Sub-Adviser, distribution or servicing fees, brokerage costs, certain transaction-related expenses, including those incurred in connection with short sales, interest expense and fees and expenses on credit facilities, taxes and extraordinary expenses. Any waiver or reimbursement is subject to repayment by the Fund within three years following the fiscal year in which the expenses occurred if the Fund is able to make the repayment without exceeding its current expense limitation. During the period from November 2, 2020 (commencement of operations) to September 30, 2021, the Adviser reimbursed $818,844 to the Fund.
The Adviser and Sub-Adviser (together the “Advisers”) have entered into an “Expense Limitation and Reimbursement Agreement” with the Fund for a one-year term beginning on the initial Closing Date and ending on the one year anniversary thereof to limit the amount of “Specified Expenses” borne by the Fund to an amount not to exceed 0.60% per annum of the Fund’s net assets (i.e., the Expense Cap). Specified Expenses means all expenses incurred by the Fund, except for: (i) the Management Fee; (ii) the Incentive Fee; (iii) any distribution or servicing fee paid with respect to certain classes of Units, including the Distribution and Servicing Fee; (iv) brokerage costs; (v) certain transaction-related expenses, including those
28
CPG Cooper Square International Equity, LLC
Notes to Financial Statements (Continued)
September 30, 2021
5. | RELATED PARTY TRANSACTIONS AND OTHER (continued) |
incurred in connection with effecting short sales; (vi) interest payments; (vii) fees and expenses incurred in connection with a credit facility, if any, obtained by the Fund; (viii) taxes; and (ix) extraordinary expenses (as determined in the sole discretion of the Adviser). To the extent that Specified Expenses for a month exceed the Expense Cap, the Advisers will reimburse the Fund for expenses to the extent necessary to eliminate such excess. To the extent that the Advisers bear Specified Expenses, they are permitted to receive reimbursement for any expense amounts previously paid or borne by the Advisers, for a period not to exceed three years from the date on which such expenses were paid or borne by the Advisers, even if such reimbursement occurs after the term of the Expense Limitation and Reimbursement Agreement, provided that the Specified Expenses have fallen to a level below, and the reimbursement amount does not raise the level of Specified Expenses in the month the reimbursement is being made to a level that exceeds, the Expense Cap in place at the time such amounts were borne by the Advisers and the expense limitation in place at the time of the reimbursement, if any. At September 30, 2021, the amount of these potentially recoverable expenses was $1,138,046, and is included in the Payable to Adviser in the Statement of Assets and Liabilities.
The Adviser may recapture all or a portion of this amount prior to September, of the fiscal years stated below:
2023 | $ | 109,695 | ||
2024 | $ | 1,028,351 | ||
Total | $ | 1,138,046 |
Each Independent Director, receives an annual retainer of $15,000 (prorated for partial years) plus a fee of $1,000 for each meeting attended and $500 for each meeting by phone. The Board Chair, Audit Committee Chair, Nominating Committee Chair and Contracts Review Committee Chair each receive an additional $2,000 annual retainer. All members of the Board are reimbursed for their reasonable out-of-pocket expenses. Total amounts expensed by the Fund related to Independent Directors for the period from November 2, 2020 (commencement of operations) to September 30, 2021 was $80,334, which is included in Directors’ and Officer Fees in the Statement of Operations.
During the period from November 2, 2020 (commencement of operations) to September 30, 2021, the Fund incurred a portion of the annual compensation of the Fund’s Chief Compliance Officer in the amount of $5,166, which is included in Directors’ and Officer Fees in the Statement of Operations.
Certain officers and the interested director of the Fund are also Officers of the Adviser, and are registered representatives of Foreside Fund Services, LLC.
6. | ADMINISTRATION AND CUSTODIAN FEES |
SS&C Technologies and its affiliates DST Asset Manager Solutions, Inc. and ALPS Fund Services, Inc. serve as administrator (the “Administrator”) to the Fund and provides certain accounting, administrative, record keeping and investor related services. For their services, the Fund pays an annual fee to the Administrator based upon average net assets, subject to certain minimums. For the period from November 2, 2020 (commencement of operations) to September 30, 2021, the total administration fees were $122,043 which is included in Accounting and administration fees in the Statement of Operations.
The Bank of New York Mellon serves as the custodian of the Fund’s assets, and may maintain custody of the Fund’s assets with domestic and foreign sub-custodians. For the period from November 2, 2020 (commencement of operations) to September 30, 2021, the total custodian fees were $66,523 which is included in Custody fees in the Statement of Operations.
7. | INVESTMENTS |
For the period from November 2, 2020 (commencement of operations) to September 30, 2021, purchases and sales of investments, other than short sales, and short-term obligations, amounted to $100,970,015 and $35,555,459, respectively.
29
CPG Cooper Square International Equity, LLC
Notes to Financial Statements (Continued)
September 30, 2021
8. | REPURCHASE OF UNITS |
No investor or other person holding Units acquired from an investor has the right to require the Fund to redeem any Units. To provide a limited degree of liquidity to investors, the Fund may, from time to time, offer to repurchase Units pursuant to written tenders by investors. Repurchases will be made at such times, in such amount and on such terms as may be determined by the Board, in its sole discretion. In determining whether the Fund should offer to repurchase Units, the Board will consider the recommendations of the Adviser as to the timing of such an offer, as well as a variety of operational, business and economic factors. The Adviser anticipates that it will recommend to the Board that the Fund offer to repurchase Units from investors on a quarterly basis, with such repurchases to occur as of the last day of March, June, September and December (or, if any such date is not a business day, on the immediately preceding business day). The Adviser also expects that, generally, it will recommend to the Board that each repurchase offer should apply to 25% of the net assets of the Fund. In certain circumstances, however, the Board may determine not to conduct a repurchase offer, or to conduct a repurchase offer of more or less than 25% of the Fund’s net assets. Each repurchase offer will generally commence approximately 85 days prior to the applicable repurchase date.
9. | INDEMNIFICATION |
Under the Fund’s organizational documents, its Officers and Directors are indemnified against certain liabilities arising out of the performance of their duties to the Fund. In addition, in the ordinary course of business, the Fund may enter into contracts or agreements that contain indemnification or warranties. The Fund’s maximum exposure under these arrangements is unknown, as this would involve future claims that may be made against the Fund that have not yet occurred. However, based on experience, the Fund expects the risk of loss to be remote.
10. | IMPACTS OF COVID-19 |
The pandemic related to the global spread of novel coronavirus disease (COVID-19), which was first detected in December 2019, has resulted in significant disruptions to global business activity and the global economy, as well as the economies of individual countries, the financial performance of individual companies and sectors, and the securities and commodities markets in general. This pandemic has resulted in substantial market volatility and may continue to impact the Fund’s performance going forward.
11. | SUBSEQUENT EVENTS |
On October 21, 2021, Central Park Group, LLC, the parent company of the Adviser, entered into a purchase agreement with Macquarie Management Holdings, Inc. (“Macquarie”) pursuant to which Macquarie has agreed to acquire Central Park Group, subject to the satisfaction or appropriate waiver of certain customary closing conditions (the “Transaction”). If the Transaction is consummated, Central Park Group would become a wholly-owned subsidiary of Macquarie, which is an indirect wholly-owned subsidiary of Macquarie Group Limited (“Macquarie Group”), a publicly-listed (ASX: MQG) global financial services group organized under the laws of Australia.
The Fund will continue to be managed by the same investment personnel who currently are employed by the Adviser following the Transaction.
The Adviser and the Sub-Adviser have agreed to extend the Expense Limitation and Reimbursement Agreement with the Fund until February 1, 2023.
30
CPG Cooper Square International Equity, LLC
Other Information (Unaudited)
September 30, 2021
Proxy Voting
A description of the policies and procedures that the Fund uses to determine how to vote proxies relating to portfolio securities and information regarding how the Fund voted proxies relating to portfolio securities for the period from the Fund’s commencement through June 30 are available without charge, upon request, by calling (collect) 1-212-317-9200 and on the SEC’s website at http://www.sec.gov.
The Fund’s Form N-PX filing is available: (i) without charge, upon request, by calling the Fund (collect) at 1-212-317-9200 or (ii) by visiting the SEC’s website at http://www.sec.gov.
Availability of Quarterly Portfolio Schedules
Disclosure of Portfolio Holdings: The Fund files its complete schedule of portfolio holdings with the Securities and Exchange Commission (the “SEC”) no more than 60 days after the Fund’s first and third fiscal quarters of each fiscal year on Form N-PORT. For the Fund, this would be for the fiscal quarters ending December 31 and June 30. The Fund’s Form N-PORT filings can be found free of charge on the SEC’s website at http://www.sec.gov.
Management Discussion of Fund Performance
How did the Fund perform?
For the period from November 2, 2020 (Commencement of Operations) through September 30, 2021, CPG Cooper Square International Equity, LLC (the “Fund”) returned 5.97% for Class A and 6.81% for Class I, underperforming both the HFRI Equity Hedge (Total) Index and MSCI ACWI ex-US Index, which returned 27.07% and 26.64%, respectively, over the same period. The Fund’s net asset value per share as of September 30, 2021 was $15.90 for Class A and $21.36 for Class I versus $15.00 and $20.00, respectively, on November 2, 2020.
What is the Fund’s investment approach?
The Fund’s investment objective is to seek to achieve maximum total return. The Fund seeks to achieve its investment objective by investing primarily in equity securities of non-U.S.-domiciled issuers, including those domiciled in emerging markets. Under normal circumstances, the Fund invests at least 80% of its net assets, plus any borrowings for investment purposes, in equity securities. For purposes of the Fund’s investment program, “equity securities” means common and preferred stocks (including investments in initial public offerings or “IPOs”), convertible securities, warrants and rights. The Fund may invest in equity securities without restriction as to market capitalization.
The Sub-Adviser’s approach involves taking long and short positions in equity securities—namely, investing long on the basis of extensive research and fundamental analysis, and seeking to take opportunistic advantage of market inefficiencies by selling other securities short. The majority of the Fund’s long exposure will be in growth companies with high returns on capital and high barriers to competition that the Sub-Adviser believes are trading at a discount to their intrinsic value. The Sub-Adviser invests in a majority of these companies with an expectation of a multi-year holding period. The Fund’s long exposure also will include investments in more opportunistic situations that may be held for a multi-quarter, rather than multi-year, time frame. In the short portfolio, the Sub-Adviser will attempt to identify companies that are exposed to ongoing competitive pressures with poor returns on capital and deteriorating fundamentals. The short positions generally are not selected as direct hedges to the long positions. Under extraordinary circumstances, the Fund may acquire substantial stakes in public companies; however, the Fund generally will not invest more than 10% of its net asset value (measured at the time of purchase) in the voting securities of any one investment. The Sub-Adviser may seek to obtain exposure to particular issuers or securities through derivative transactions, including, without limitation, swaps (including total return swaps), contracts for differences (“CFDs”), options and other types of derivative arrangements for investment or hedging purposes.
31
CPG Cooper Square International Equity, LLC
Other Information (Unaudited) (Continued)
September 30, 2021
What influenced the Fund’s performance?
(11/2/20 – 12/31/20)
For the two months since the Fund’s November 2 commencement of operations through December 31, 2020, the Fund returned 8.7% and 8.8% net (Class A and Class I, respectively) with an average net exposure of 65%. Over the same period, the HFRI Equity Hedge Index returned 14.1% and the MSCI ACWI ex US Index returned 19.6%.
Vaccine approvals, coupled with further fiscal stimulus, drove the MSCI ACWI Index up 19.6% during November and December, one of the strongest performances on record. Given its 65% average net exposure over this time period, the strategy underperformed on a relative basis.
In November and December, the Fund’s top three contributors were long positions, Melrose, Edenred, and AIA. The Fund’s top three detractors were Alibaba, Pearson, and Wacker Chemie AG.
(1/1/21 – 3/31/21)
For the first quarter ended March 31, 2021, the Fund returned -3.4% and -3.0% net (Class A and Class I, respectively) with an average net exposure of 74%. Over the same period, the HFRI Equity Hedge Index returned 6.8% and the MSCI ACWI ex US Index returned 3.5%.
Global capital markets in the first quarter were overwhelmingly driven by a single macro theme: reflation in the US. Reflation is inflation that delivers above-trend growth without adverse consequences. It occurs rarely and briefly during that “Goldilocks” moment when an economy is exiting a recession with excess capacity, such that fiscal and/or monetary policy can successfully stimulate growth without igniting inflation of the malicious kind. This latest incarnation was made possible by the coincidental timing of vaccine approval and the US presidential election, and then turbocharged in January when the Georgia Senate runoff elections effectively handed the keys of the Treasury to the Biden administration. There are a number of similarities between the markets of the last six months and those of mid-to-late 2009 following the Global Financial Crisis. Then, as now, unprecedented fiscal stimulus prompted equities to discount a strong recovery. In both instances, commodities soared, US long bond yields rose by over 130 bps and deflation gave way to inflation with US CPI recovering to above 2%. Reflation disproportionately benefits the weakest, most economically sensitive and most indebted companies. As a result, stocks in the first quarter of 2021 also repeated the pattern of 2009: Financials, Energy, Materials and Industrials roared ahead, while defensive sectors lagged. Higher-quality companies whose earnings power is more structural than cyclical (and, therefore, whose valuations are more vulnerable to rising bond yields) generally underperformed as well. Finally, the improvement in US prospects drove a steepening of the US yield curve, strengthening the US dollar.
In the first quarter, the Fund’s top three contributors were long positions, Prudential PLC, ASML Holding, and CRH. The Fund’s top three detractors were Edenred, Pearson, and Nantex Industry.
(4/1/21 – 6/30/21)
For the second quarter ended June 30, 2021, the Fund returned 2.6% net (Class A and Class I) with an average net exposure of 77%. Over the same period, the HFRI Equity Hedge Index returned 4.8% and the MSCI ACWI ex US Index returned 5.5%. For the six months ended June 30, 2021, the Fund returned -0.9% and -0.5% net (class A and I, respectively), versus 12.0% for the HFRI Equity Hedge Index and 9.2% for the MSCI ACWI ex US Index.
After a first quarter when global markets were overwhelmingly driven by the rush to discount a roaring US economic recovery, there were welcome signs of a nascent return to normality in the second quarter with long-term fundamentals starting to reassert themselves over cyclical momentum. The relentless ascent of most commodities to well above pre-pandemic levels either paused or reversed with oil being the only outlier (though it too weakened in July as OPEC supply disagreements were resolved). Low-quality cyclicals such as Banks, Materials and Industrials, which had enjoyed the most dramatic upgrades to short-term earnings estimates, began to fade while the quarter’s strongest-performing sector was the one with the least economic sensitivity of all: Healthcare.
32
CPG Cooper Square International Equity, LLC
Other Information (Unaudited) (Continued)
September 30, 2021
In the US, “red hot” economic data and a surge in core CPI to 3.8% (the highest level since 1992, followed by another increase to 4.5% announced in July) ignited fears of sustained inflation. The Federal Reserve responded on June 16th by finally removing its blanket assurance of policy support, suggesting that interest rates may rise sooner and more dramatically than its previous projections and serving notice that it was actively discussing when to begin tapering its $120 billion monthly asset purchases. As so often seems to be the case, bond markets apparently saw the Fed’s move coming, judged its anti-inflation credentials to be credible and responded by flattening the US Treasury yield curve in the second quarter: The spread between the two- and 10-year yield narrowed by 36 bps with the two-year yield rising 9 bps to 0.25% and the 10-year yield retracing a third of its first quarter gain by declining 27 bps to 1.47%. Treasury-derived five-year inflation expectations declined by 27 bps from its May peak to end the quarter at 2.50%.
International equities continued to lag the US in the second quarter with regional performance still largely following the trend in 2021 earnings revisions; nevertheless, their initial reaction to the Fed’s June 16th policy shift was encouraging. Chairman Powell’s language was softer and more reassuring than Bernanke’s in 2013 (when he triggered the “Taper Tantrum,” which took -11% off the MSCI ACWI ex US Index), but the message was still clear. The prospect of US interest rate increases caused the USD to gain 2.1% on a trade-weighted basis through the end of the quarter. However, non-US equities showed notable resilience, and the MSCI ACWI ex US Index’s -2.0% decline through June 30th was largely a function of USD strength. As the focus shifts to 2022, the Sub-Adviser expects global growth momentum to decouple with US GDP starting to decelerate towards its trend rate (which the Fed sees as approximately 2%), the European Union (EU) accelerating ahead of the US and China settling back to a range of 5%-6%. Assuming equities follow fundamentals, this should result in international outperformance, led by Europe. The Fund continued to add exposure to the UK and Europe (excluding Switzerland), such that their combined percentage of overall net exposure increased slightly during the second quarter from 44% to 45%.
In the second quarter, the Fund’s top three contributors were long positions, PerkinElmer, SAP, and Edenred. The Fund’s top three detractors were a Consumer Discretionary Short, Prudential PLC, and an Industrial Short.
(7/1/21 – 9/30/21)
For the third quarter ended September 30, 2021, the Fund returned -1.6% and -1.4% net for Class A and Class I, respectively, with an average net exposure of 78%. Over the same period, the HFRI Equity Hedge Index returned -0.9% and the MSCI ACWI ex US Index returned -3.0% respectively. For the nine months ended September 30, 2021, the Fund returned -2.52% and -1.85% net (class A and I respectively), versus +5.9% MSCI ACWI ex US Index and 11.0% HFRI Equity Hedge Index return for the period.
The MSCI ACWI ex US Index posted its first quarterly decline since the big selloff of Q1 2020 when the seismic impact of COVID was first understood by global economies. China led international markets lower during the quarter, with the MSCI China Index falling -18% during the quarter, finishing -31% below its February peak. The Chinese government continued pressing regulations on big technology companies while a pronounced erosion in the property sector, and fears of slower growth in the region, all contributed to the decline.
Concurrently, Brent Oil and the broader Bloomberg commodity index spiked +5% and +7%, respectively, as investors fretted that inflation might be more durable than first expected. Adding to the late quarter unease, the US Federal Reserve signaled an imminent tapering of government bond purchases.
Amid these cross currents, the Sub-Adviser is seeing attractive opportunities on both sides of the book. While the MSCI ACWI ex US Index was finishing near its all-time high, almost three-quarters of the companies in the index fell more than -10% below their YTD highs. Higher quality, durable growth businesses that the Fund favors have underperformed lower quality reflation beneficiaries (i.e., banks, energy & cyclical companies) throughout the year. The Sub-Adviser continued to seize compelling opportunities at exceptional valuations, with the discount to fair value in the Fund’s long book rising from 22% to 32%, nearing the high end of the strategy’s historical range.
The Fund’s short portfolio was negatively impacted by continuing supply chain disruptions and the emergence of the Covid Delta variant, both of which allowed many holdings to continue overearning and outperforming, leaving some of them trading at peak multiples on, what we believe, will be peak earnings. In hindsight, we underestimated the degree and
33
CPG Cooper Square International Equity, LLC
Other Information (Unaudited) (Continued)
September 30, 2021
duration of covid-induced disruption, which is reflected in our negative short alpha year to date. The Fund continues to hold many of these positions on an expectation of an imminent decline earnings power and are encouraged by progressive improvement in the Fund’s monthly short alpha from August through October, where the Fund’s finished with positive short alpha for the month.
In the third quarter, the Fund’s top three contributors were long positions, Alcon, CTS Eventim and NOF Corporation. The Fund’s top three detractors were Clarivate, Fidelity National Information Systems and Alibaba Group.
The information contained in this Discussion of Fund Performance reflects the views of the Adviser and/or Sub-Adviser or their respective affiliates and sources it believes are reliable as of the date of this publication. Neither the Adviser nor Sub-Adviser makes any representations or warranties concerning the accuracy of any data. There is no guarantee that any projection, forecast or opinion in this material will be realized. Past performance does not guarantee future results. The views expressed herein may change at any time after the date of this publication. This Discussion of Fund Performance is for informational purposes only and does not constitute investment advice. This information should not be construed as sales or marketing material or an offer or solicitation for the purchase or sale of any security, financial instrument, product or service.
Performance Illustration
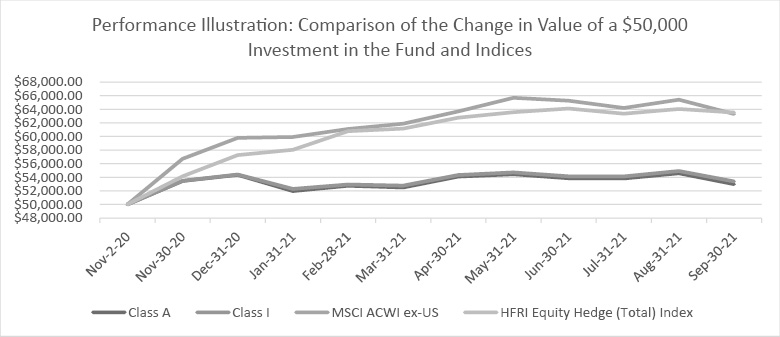
| Trailing 1-Yr | Trailing 5-Yr | Trailing 10-Yr | ITD | ||||||||||||
Class A | NA | NA | NA | 5.97 | % | |||||||||||
Class I | NA | NA | NA | 6.79 | % | |||||||||||
MSCI ACWI ex-US | NA | NA | NA | 26.64 | % | |||||||||||
HFRI Equity Hedge (Total) Index | NA | NA | NA | 27.07 | % | |||||||||||
The performance illustration above assumes the reinvestment of all dividend and capital gain distributions, if any, and represents past performance, which is not a guarantee of future results. The returns shown do not reflect taxes that an investor would pay on Fund distributions or on the redemption of Fund units. The investment return and principal value of an investment will fluctuate and, therefore, an investor’s units, if redeemed, may be worth more or less than their original cost.
Fund returns are estimated, unaudited, and presented net of annual: management fee (1.25%), expenses (capped at 0.60%), incentive fee (20%) and, for Class A, an annual distribution/servicing fee (0.75%). Returns do not account for an upfront placement fee which, if charged, would reduce returns. Fund returns are reflect an operating expense cap from the Fund’s inception. If the cap were not in place, returns would be lower. Past returns may have been generated
34
CPG Cooper Square International Equity, LLC
Other Information (Unaudited) (Continued)
September 30, 2021
during positive market conditions and should not be expected in the future. Indices are included to show general trend in markets and not intended to imply that past performance was comparable to indices either in composition or risk. See the information below regarding the indices presented.
HFRI Equity Hedge Index: Investment Managers who maintain positions both long and short in primarily equity and equity derivative securities. A wide variety of investment processes can be employed to arrive at an investment decision, including both quantitative and fundamental techniques; strategies can be broadly diversified or narrowly focused on specific sectors and can range broadly in terms of levels of net exposure, leverage employed, holding period, concentrations of market capitalizations and valuation ranges of typical portfolios. Managers would typically maintain at least 50% exposure to, and may in some cases be entirely invested in, equities, both long & short.
MSCI ACWI ex US: Captures large and mid-cap representation across 23 developed markets and 24 emerging markets countries. With 2,787 constituents, the index covers approximately 85% of the global investable equity opportunity set.
35
CPG Cooper Square International Equity, LLC
Fund Management (Unaudited)
September 30, 2021
Board members of the Fund, together with information as to their positions with the Fund, principal occupations and other board memberships for the past five years, are shown below.
Four of the Directors are not “interested persons” (as defined in the Investment Company Act) of the Fund (collectively, the “Independent Directors”).
The Fund’s statement of Additional Information includes additional information about Directors of the Fund and is available, without charge, upon calling the Fund at 212-317-9200.
Name, Age, Address and Position(s) with Fund | Term of Office and Length of Time Served | Principal Occupation(s) During Past 5 Years | Number of Portfolios in Fund Complex Overseen by Director | Other Directorships/ Trusteeships Held by Director Outside Fund Complex During Past 5 Years |
INDEPENDENT DIRECTORS | ||||
Joan Shapiro Green (77) c/o Central Park Group, LLC 500 Fifth Avenue, 31st Floor New York, NY 10110 Chair | Term - Indefinite Length - Since Inception | Board Director (2014-present); Executive Director of National Council of Jewish Women New York (2007-2014) ; Executive Director of New York Society of Securities Analysts (2004-2006) | 9 | None |
Kristen M. Leopold (54) c/o Central Park Group, LLC 500 Fifth Avenue, 31st Floor New York, NY 10110 Director | Term - Indefinite Length - Since Inception | Independent Consultant to Hedge Funds (2007 - present); Chief Financial Officer of Weston Capital Management, LLC (investment managers) (1997-2006) | 9 | Blackstone Alternative Alpha Fund; Blackstone Alternative Alpha Fund II; Blackstone Alternative Alpha Master Fund; Blackstone Alternative Multi-Manager Fund; Blackstone Alternative Multi-Strategy Fund |
Janet L. Schinderman (70) c/o Central Park Group, LLC 500 Fifth Avenue, 31st Floor New York, NY 10110 Director | Term - Indefinite Length - Since Inception | Self-Employed Educational Consultant since 2006; Associate Dean for Special Projects and Secretary to the Board of Overseers, Columbia Business School of Columbia University (1990-2006) | 9 | Advantage Advisers Xanthus Fund, L.L.C. |
Sharon J, Weinberg (62) c/o Central Park Group, LLC 500 Fifth Avenue, 31st Floor New York, NY 10110 Director | Term - Indefinite Length - Since Inception | Owner, the Chatham Bookstore (March 2021 – present); Co-Founder, Blue Leaf Ventures (2018-present) Managing Director, New York Ventures, Empire State Development (2016- 2018); Managing Director, JPMorgan Asset Management (2000 - 2015); Vice President, JPMorgan Investment Management (1996 - 2000); Associate, Willkie Farr & Gallagher LLP (1984 - 1996) | 9 | None |
36
CPG Cooper Square International Equity, LLC
Fund Management (Unaudited) (Continued)
September 30, 2021
Name, Age, Address and Position(s) with Fund | Term of Office and Length of Time Served | Principal Occupation(s) During Past 5 Years | Number of Portfolios in Fund Complex Overseen by Director | Other Directorships/ Trusteeships Held by Director Outside Fund Complex During Past 5 Years |
INTERESTED DIRECTOR | ||||
Mitchell A. Tanzman (62) c/o Central Park Group, LLC 500 Fifth Avenue, 31st Floor New York, NY 10110 Director and Principal Executive Officer | Term - Indefinite Length - Since Inception | Co-Chief Executive Officer and Co-Chief Investment Officer of Central Park Group, LLC since 2006 | 9 | None |
OFFICER(S) WHO ARE NOT DIRECTORS | ||||
Michael Mascis (54) c/o Central Park Group, LLC 500 Fifth Avenue, 31st Floor New York, NY 10110 Principal Accounting Officer | Term - Indefinite Length - Since Inception | Chief Financial Officer of Central Park Group, LLC since 2006 | N/A | N/A |
Seth L. Pearlstein (55) c/o Central Park Group, LLC 500 Fifth Avenue, 31st Floor New York, NY 10110 Chief Compliance Officer | Term - Indefinite Length - Since Inception | Chief Compliance Officer of Central Park Group, LLC since 2015 | N/A | N/A |
Gregory Brousseau (66) c/o Central Park Group, LLC 500 Fifth Avenue, 31st Floor New York, NY 10110 Vice President | Term - Indefinite Length - Since Inception | Co-Chief Executive Officer and Co-Chief Investment Officer of Central Park Group, LLC since 2006 | N/A | N/A |
Ruth Goodstein (61) c/o Central Park Group, LLC 500 Fifth Avenue, 31st Floor New York, NY 10110 Vice President | Term - Indefinite Length - Since Inception | Chief Operating Officer of Central Park Group, LLC since 2006 | N/A | N/A |
37
| (b) | Not applicable. |
ITEM 2. CODE OF ETHICS.
(a) The registrant has adopted a code of ethics (the “Code of Ethics”) that applies to the registrant’s principal executive officer and principal financial officer.
(b) No information needs to be disclosed pursuant to this paragraph.
(c) The registrant has made no amendments to its Code of Ethics during the period covered by the report to members presented in Item 1 hereto.
(d) The registrant has not granted a waiver or an implicit waiver from a provision of its Code of Ethics during the period covered by the report to members presented in Item 1 hereto.
(e) Not applicable.
(f)
(1) Code of Ethics, or any amendment thereto, that is the subject of disclosure required by Item 2 is attached hereto.
(2) Not applicable.
(3) Not applicable.
ITEM 3. AUDIT COMMITTEE FINANCIAL EXPERT.
As of the end of the period covered by the report, the registrant’s board of directors has determined that Kristen Leopold is qualified to serve as the audit committee financial expert serving on its audit committee and that he/she is “independent,” as defined by Item 3 of Form N-CSR.
ITEM 4. PRINCIPAL ACCOUNTANT FEES AND SERVICES.
Audit Fees
(a) The aggregate fees billed for the fiscal period November 2, 2020, (commencement of fund operations) to September 30, 2021, for professional services rendered by the principal accountant for the audit of the registrant’s annual financial statements or services that are normally provided by the accountant in connection with statutory and regulatory filings or engagements was $90,000.
Audit-Related Fees
(b) The aggregate fees billed for the fiscal period November 2, 2020, (commencement of fund operations) to September 30, 2021, for assurance and related services by the principal accountant that are reasonably related to the performance of the audit of the registrant’s financial statements and are not reported under paragraph (a) of this Item are $0. The fees listed in item 4 (b) are related to out-of-pocket expenses in relation to the annual audit of the registrant.
Tax Fees
(c) The aggregate fees billed for the fiscal period November 2, 2020, (commencement of fund operations) to September 30, 2021, for professional services rendered by the principal accountant for tax compliance, tax advice, and tax planning are $85,0000.
All Other Fees
(d) The aggregate fees billed in for the fiscal period November 2, 2020, (commencement of fund operations) to September 30, 2021, for products and services provided by the principal accountant, other than the services reported in paragraphs (a) through (c) of this Item are $0.
(e)(1) Disclose the audit committee’s pre-approval policies and procedures described in paragraph (c)(7) of Rule 2-01 of Regulation S-X.
The registrant's Audit Committee must pre-approve the audit and non-audit services of the Auditors prior to the Auditor's engagement.
(e)(2) The percentage of services described in each of paragraphs (b) through (d) of this Item that were approved by the audit committee pursuant to paragraph (c)(7)(i)(C) of Rule 2-01 of Regulation S-X are as follows:
(b) 0%
(c) 0%
(d) 0%
(f) Not applicable.
(g) The aggregate non-audit fees billed by the registrant's accountant for services rendered to the registrant, and rendered to the registrant's investment adviser (not including any sub-adviser whose role is primarily portfolio management and is subcontracted with or overseen by another investment adviser), and any entity controlling, controlled by, or under common control with the adviser that provides ongoing services to the registrant for the fiscal period November 2, 2020, (commencement of fund operations) to September 30, 2021, of the registrant was $85,000.
(h) The registrant’s audit committee of the board of directors has considered whether the provision of non-audit services that were rendered to the registrant's investment adviser (not including any sub-adviser whose role is primarily portfolio management and is subcontracted with or overseen by another investment adviser), and any entity controlling, controlled by, or under common control with the investment adviser that provides ongoing services to the registrant that were not pre-approved pursuant to paragraph (c)(7)(ii) of Rule 2-01 of Regulation S-X is compatible with maintaining the principal accountant's independence. No such services were provided.
ITEM 5. AUDIT COMMITTEE OF LISTED REGISTRANTS.
Not applicable.
ITEM 6. SCHEDULE OF INVESTMENTS.
Schedule of Investments in securities of unaffiliated issuers as of the close of the reporting period is included as part of the report to shareholders filed under Item 1 of this form.
ITEM 7. DISCLOSURE OF PROXY VOTING POLICIES AND PROCEDURES FOR CLOSED-END MANAGEMENT INVESTMENT COMPANIES.
ITEM 8. PORTFOLIO MANAGERS OF CLOSED-END MANAGEMENT INVESTMENT COMPANIES.
Portfolio Management
Chad M. Clark and Matthew C. Pickering serve as the Fund’s portfolio managers (the “Portfolio Managers”). Messrs. Clark and Pickering are jointly responsible for the day-to-day management of the Fund’s assets.
Mr. Clark joined the Sub-Adviser in August 2010. He oversees the Sub-Adviser’s international strategies and is a member of its Management Committee. Prior to joining the Sub-Adviser, Mr. Clark spent 14 years at Harris Associates, where he was a Partner and co-managed the Oakmark International Small Cap Fund and Harris International Value L.P. Prior to Harris Associates, he was an Analyst in Corporate Finance at William Blair & Company. Mr. Clark received a B.S. in Industrial Management from Carnegie Mellon University (summa cum laude), and is a CFA charterholder.
Mr. Pickering, a senior member of the Sub-Adviser’s investment team, joined the Sub-Adviser in December 2010. Prior to joining the Sub-Adviser, Mr. Pickering was an Analyst with Harris Associates for four years. Prior to Harris Associates, he worked for six years as an Analyst and Associate Portfolio Manager with Institutional Capital, where he was named Morningstar International Stock Co-Manager of the Year in 2005. Mr. Pickering received a B.S. from Miami University (magna cum laude), and is a CFA charterholder.
The Portfolio Managers provide advisory services to other clients, including other pooled investment vehicles, that invest in securities of the same type in which the Fund invests. As a result, there may be an incentive to favor one vehicle or account over another, resulting in conflicts of interest. The Sub-Adviser is aware of its obligation to ensure that, when orders for the same securities are entered on behalf of the Fund and other accounts, the Fund receives a fair and equitable allocation of the orders, particularly where affiliated accounts may participate. The Sub-Adviser has adopted various compliance policies and procedures that it believes are reasonably designed to address various conflicts of interest that may arise in connection with its management of other accounts and investment vehicles, and that provide a methodology for seeking to ensure fair treatment of all clients.
Each Portfolio Manager's compensation is comprised of a fixed annual salary, a discretionary bonus and potentially an annual supplemental distribution paid by the Sub-Adviser, or its parent company, and not by the Fund.
The following table lists the number and types of accounts, other than the Fund, managed by the Fund’s Portfolio Managers and estimated assets under management in those accounts, as of September 30, 2021.
| Registered Investment Companies | Pooled Investment Vehicles | Other Accounts | ||||||||||||||||||||||
| Portfolio Manager | Number of Accounts | Assets Managed | Number of Accounts | Assets Managed | Number of Accounts | Assets Managed | ||||||||||||||||||
| Chad M. Clark | 1 | $ | 2,600,428,148 | 12(1) | $ | 17,639,860,106 | 16(2) | $ | 4,829,292,208 | |||||||||||||||
| Matthew C. Pickering | 1 | $ | 2,6,00,428,148 | 11(3) | $ | 11,195,555,703 | 16(2) | $ | 4,829,292,208 | |||||||||||||||
| 1 | Of these accounts, 6 accounts with total assets of approximately $3,023,435,147 charge performance-based advisory fees. |
| 2 | Of these accounts, 2 accounts with total assets of approximately $352,824,161 charge performance-based advisory fees. |
ITEM 9. PURCHASES OF EQUITY SECURITIES BY CLOSED-END MANAGEMENT INVESTMENT COMPANY AND AFFILIATED PURCHASERS.
Not applicable.
ITEM 10. SUBMISSION OF MATTERS TO A VOTE OF SECURITY HOLDERS.
The registrant’s nominating committee reviews and considers, as it deems appropriate after taking into account, among other things, the factors listed in its charter, nominations of potential Directors made by the registrant’s management and by the registrant’s Investors who have sent to Gregory S. Rowland, Esq., legal counsel for the Independent Directors, at c/o Davis Polk & Wardwell LLP, 450 Lexington Avenue, New York, NY 10017, such nominations, which include all information relating to the recommended nominee that is required to be disclosed in solicitations or proxy statements for the election of Directors, including without limitation the biographical information and the qualifications of the proposed nominees. Nomination submissions must be accompanied by a written consent of the individual to stand for election if nominated by the Board and to serve if elected, and such additional information must be provided regarding the recommended nominee as is reasonably requested by the nominating committee. The nominating committee meets as is necessary or appropriate.
ITEM 11. CONTROLS AND PROCEDURES.
(a) The registrant’s principal executive and principal financial officers, or persons performing similar functions, have concluded that the registrant’s disclosure controls and procedures (as defined in Rule 30a-3(c) under the Investment Company Act of 1940, as amended (the “1940 Act”) (17 CFR 270.30a-3(c))) are effective, as of a date within 90 days of the filing date of the report that includes the disclosure required by this paragraph, based on their evaluation of these controls and procedures required by Rule 30a-3(b) under the 1940 Act (17 CFR 270.30a-3(b)) and Rules 13a-15(b) or 15d-15(b) under the Securities Exchange Act of 1934, as amended (17 CFR 240.13a-15(b) or 240.15d-15(b)).
(b) There were no changes in the registrant’s internal control over financial reporting (as defined in Rule 30a-3(d) under the 1940 Act (17 CFR 270.30a-3(d)) that occurred during the period covered by this report that has materially affected, or is reasonably likely to materially affect, the registrant’s internal control over financial reporting.
ITEM 12. DISCLOSURE OF SECURITIES LENDING ACTIVITIES FOR CLOSED-END MANAGEMENT INVESTMENT COMPANIES
(a)(1) Not applicable.
(a)(2) Not applicable.
(a)(3) Not applicable.
(a)(4) Not applicable.
(b) Not applicable.
ITEM 13. EXHIBITS.
(a)(3) Not applicable.
(a)(4) Not applicable.
(b) Not applicable.
SIGNATURES
Pursuant to the requirements of the Securities Exchange Act of 1934 and the Investment Company Act of 1940, the registrant has duly caused this report to be signed on its behalf by the undersigned, thereunto duly authorized.
| (registrant) | CPG Cooper Square International Equity, LLC | |
| By (Signature and Title)* | /s/ Mitchell A. Tanzman | |
| Mitchell A. Tanzman | ||
| (Principal Executive Officer) | ||
| Date | December 9, 2021 |
Pursuant to the requirements of the Securities Exchange Act of 1934 and the Investment Company Act of 1940, this report has been signed below by the following persons on behalf of the registrant and in the capacities and on the dates indicated.
| By (Signature and Title)* | /s/ Mitchell A. Tanzman | |
| Mitchell A. Tanzman | ||
| (Principal Executive Officer) | ||
| Date | December 9, 2021 | |
| By (Signature and Title)* | /s/ Michael Mascis | |
| Michael Mascis | ||
| (Principal Financial Officer) | ||
| Date | December 9, 2021 |
| * | Print the name and title of each signing officer under his or her signature. |