UNITED STATES
SECURITIES AND EXCHANGE COMMISSION
Washington, D.C. 20549
FORM N-CSR
CERTIFIED SHAREHOLDER REPORT OF REGISTERED MANAGEMENT
INVESTMENT COMPANIES
Investment Company Act file number 811-23590
CPG Cooper Square International Equity, LLC
(Exact name of registrant as specified in charter)
125 W. 55th Street
New York, New York 10019
(Address of principal executive offices) (Zip code)
Mitchell A. Tanzman
c/o Central Park Advisers, LLC
125 W. 55th Street
New York, New York 10019
(Name and address of agent for service)
Registrant's telephone number, including area code: (212) 317-9200
Date of fiscal year end: September 30
Date of reporting period: September 30, 2023
Form N-CSR is to be used by management investment companies to file reports with the Commission not later than 10 days after the transmission to stockholders of any report that is required to be transmitted to stockholders under Rule 30e-1 under the Investment Company Act of 1940 (17 CFR 270.30e-1). The Commission may use the information provided on Form N-CSR in its regulatory, disclosure review, inspection, and policymaking roles.
A registrant is required to disclose the information specified by Form N-CSR, and the Commission will make this information public. A registrant is not required to respond to the collection of information contained in Form N-CSR unless the Form displays a currently valid Office of Management and Budget (“OMB”) control number. Please direct comments concerning the accuracy of the information collection burden estimate and any suggestions for reducing the burden to Secretary, Securities and Exchange Commission, 100 F Street, NE, Washington, DC 20549-0609. The OMB has reviewed this collection of information under the clearance requirements of 44 U.S.C. § 3507.
ITEM 1. REPORTS TO STOCKHOLDERS.
| (a) | The Report to Shareholders is attached herewith. |
CPG Cooper Square International Equity, LLC
Financial Statements
For the Year Ended September 30, 2023
With Report of Independent Registered Public Accounting Firm
CPG Cooper Square International Equity, LLC
Table of Contents
For the Year Ended September 30, 2023
Report of Independent Registered Public Accounting Firm | 1 |
Schedule of Investments | 2-22 |
Statement of Assets and Liabilities | 23 |
Statement of Operations | 24 |
Statements of Changes in Net Assets | 25 |
Financial Highlights | 26-27 |
Notes to Financial Statements | 28-38 |
Other Information | 39-42 |
Principal Risk Factors | 43-57 |
Fund Management | 58-60 |
CPG Cooper Square International Equity, LLC
Report of Independent Registered Public Accounting Firm
September 30, 2023
To the Board of Directors and Unitholders of CPG Cooper Square International Equity, LLC
Opinion on the Financial Statements
We have audited the accompanying statement of assets and liabilities, including the schedule of investments, of CPG Cooper Square International Equity, LLC (the “Fund”) as of September 30, 2023, the related statement of operations for the year ended September 30, 2023, the statement of changes in net assets for each of the two years in the period ended September 30, 2023, including the related notes, and the financial highlights for each of the two years in the period ended September 30, 2023 (collectively referred to as the “financial statements”). In our opinion, the financial statements present fairly, in all material respects, the financial position of the Fund as of September 30, 2023, the results of its operations for the year then ended, the changes in its net assets for each of the two years in the period ended September 30, 2023 and the financial highlights for each of the two years in the period ended September 30, 2023 in conformity with accounting principles generally accepted in the United States of America.
The financial statements of the Fund as of September 30, 2021 and for the period November 2, 2020 (commencement of operations) to September 30, 2021 and the financial highlights for the period November 2, 2020 (commencement of operations) to September 30, 2021 (not presented herein, other than the financial highlights) were audited by other auditors whose report dated November 26, 2021 expressed an unqualified opinion on those financial statements and financial highlights.
Basis for Opinion
These financial statements are the responsibility of the Fund’s management. Our responsibility is to express an opinion on the Fund’s financial statements based on our audits. We are a public accounting firm registered with the Public Company Accounting Oversight Board (United States) (PCAOB) and are required to be independent with respect to the Fund in accordance with the U.S. federal securities laws and the applicable rules and regulations of the Securities and Exchange Commission and the PCAOB.
We conducted our audits of these financial statements in accordance with the standards of the PCAOB. Those standards require that we plan and perform the audit to obtain reasonable assurance about whether the financial statements are free of material misstatement, whether due to error or fraud.
Our audits included performing procedures to assess the risks of material misstatement of the financial statements, whether due to error or fraud, and performing procedures that respond to those risks. Such procedures included examining, on a test basis, evidence regarding the amounts and disclosures in the financial statements. Our audits also included evaluating the accounting principles used and significant estimates made by management, as well as evaluating the overall presentation of the financial statements. Our procedures included confirmation of securities owned as of September 30, 2023, by correspondence with the custodian and brokers; when replies were not received from brokers, we performed other auditing procedures. We believe that our audits provide a reasonable basis for our opinion.

Philadelphia, Pennsylvania
November 27, 2023
We have served as the auditor of one or more Central Park Group investment companies since 2022.
1
CPG Cooper Square International Equity, LLC
Schedule of Investments
September 30, 2023
Common Stock (90.47%) | Shares | Fair Value | ||||||
Canada (4.13%) | ||||||||
Brookfield Corp.(a) | 60,319 | $ | 1,894,784 | |||||
Denmark (0.34%) | ||||||||
GN Store Nord AS(b) | 8,504 | 154,246 | ||||||
France (12.36%) | ||||||||
Edenred SE(a) | 41,256 | 2,589,338 | ||||||
Safran SA(a) | 16,420 | 2,584,058 | ||||||
Worldline SA(b)(c) | 17,370 | 490,106 | ||||||
| 5,663,502 | ||||||||
Germany (11.82%) | ||||||||
CTS Eventim AG & Co. KGaA(a) | 45,092 | 2,570,861 | ||||||
Merck KGaA | 2,298 | 384,780 | ||||||
SAP SE(a) | 18,932 | 2,461,835 | ||||||
| 5,417,476 | ||||||||
Great Britain (23.23%) | ||||||||
Dowlais Group PLC | 483,554 | 633,877 | ||||||
Melrose Industries PLC(a) | 336,592 | 1,927,601 | ||||||
Prudential PLC | 231,548 | 2,511,890 | ||||||
Reckitt Benckiser Group PLC(a) | 19,586 | 1,385,095 | ||||||
RS GROUP PLC(a) | 174,437 | 1,565,733 | ||||||
Sensata Technologies Holding PLC(a) | 50,747 | 1,919,252 | ||||||
WAG Payment Solutions PLC(a)(b) | 628,773 | 706,053 | ||||||
| 10,649,501 | ||||||||
Ireland (10.62%) | ||||||||
CRH PLC | 56,805 | 3,149,120 | ||||||
Experian PLC(a) | 52,317 | 1,718,351 | ||||||
| 4,867,471 | ||||||||
Italy (0.99%) | ||||||||
DiaSorin SpA | 4,962 | 454,009 | ||||||
Japan (10.12%) | ||||||||
Justsystems Corp. | 26,129 | 525,119 | ||||||
Keyence Corp. | 2,083 | 774,713 | ||||||
NOF Corp. | 20,391 | 816,597 | ||||||
Obic Co., Ltd. | 3,528 | 536,322 | ||||||
Olympus Corp. | 95,998 | 1,248,987 | ||||||
Welcia Holdings Co., Ltd. | 42,626 | 737,975 | ||||||
| 4,639,713 | ||||||||
2
CPG Cooper Square International Equity, LLC
Schedule of Investments (Continued)
September 30, 2023
Common Stock (continued) | Shares | Fair Value | ||||||
Luxembourg (1.34%) | ||||||||
Eurofins Scientific SE | 2,171 | $ | 122,972 | |||||
Perimeter Solutions SA(a)(b) | 107,627 | 488,627 | ||||||
| 611,599 | ||||||||
Netherlands (5.32%) | ||||||||
ASML Holding NV(a) | 2,283 | 1,351,415 | ||||||
Heineken NV(a) | 12,308 | 1,087,575 | ||||||
| 2,438,990 | ||||||||
Switzerland (4.77%) | ||||||||
Alcon, Inc.(a) | 28,213 | 2,187,834 | ||||||
United States (5.43%) | ||||||||
Revvity, Inc.(a) | 22,498 | 2,490,529 | ||||||
Total Common Stock | ||||||||
(Cost $43,103,427) | $ | 41,469,654 | ||||||
Underlying Security/Expiration Date/ Exercise Price/Notional Amount | Contracts | Value | ||||||
PURCHASED OPTIONS 0.42% | ||||||||
Call Options Purchased 0.42% | ||||||||
EURO STOXX 50 Index | ||||||||
11/17/23, $4,250, $127,543 | 1,078 | $ | 137,469 | |||||
Intel Corp. | ||||||||
01/19/24, $43, $2,335,635 | 657 | 52,888 | ||||||
Total Call Options Purchased | ||||||||
(Cost $196,717) | $ | 190,357 | ||||||
Total Investments (90.89%) | $ | 41,660,011 | ||||||
Written Options (-0.06%) | $ | (27,520 | ) | |||||
Securities Sold Short (-42.51%) | (19,486,262 | ) | ||||||
Other Assets In Excess of Liabilities (51.68%) | 23,690,573 | |||||||
Net Assets (100.00%) | $ | 45,836,802 | ||||||
(a) | All or a portion of the security is pledged as collateral for total return swap contracts and securities sold short. As of September 30, 2023, the aggregate value of those securities was $18,691,504, representing 40.78% of net assets. |
(b) | Non-income producing security. |
(c) | Securities exempt from registration under Rule 144A of the Securities Act of 1933. These securities may be resold in transactions exempt from registration, normally to qualified institutional buyers. As of September 30, 2023, the aggregate fair value of securities restricted under Rule 144A was $490,106, representing 1.07% of net assets. |
3
CPG Cooper Square International Equity, LLC
Schedule of Investments (Continued)
September 30, 2023
Country Composition (September 30, 2023)
Common Stock | ||||
Great Britain | 23.23 | % | ||
France | 12.36 | % | ||
Germany | 11.82 | % | ||
Ireland | 10.62 | % | ||
Japan | 10.12 | % | ||
United States | 5.43 | % | ||
Netherlands | 5.32 | % | ||
Switzerland | 4.77 | % | ||
Canada | 4.13 | % | ||
Luxembourg | 1.34 | % | ||
Italy | 0.99 | % | ||
Denmark | 0.34 | % | ||
| 90.47 | % |
Securities Sold Short | ||||
Common Stock | ||||
Finland | -0.30 | % | ||
Japan | -0.45 | % | ||
India | -0.72 | % | ||
Norway | -1.80 | % | ||
Netherlands | -1.93 | % | ||
France | -2.66 | % | ||
Germany | -3.14 | % | ||
Great Britain | -3.40 | % | ||
Sweden | -3.64 | % | ||
United States | -4.15 | % | ||
Switzerland | -5.44 | % | ||
Exchange Traded Funds | ||||
Australia | -0.07 | % | ||
India | -0.15 | % | ||
Mexico | -0.17 | % | ||
Brazil | -0.26 | % | ||
South Korea | -0.55 | % | ||
European Union | -0.78 | % | ||
China | -0.83 | % | ||
Canada | -1.01 | % | ||
Japan | -2.05 | % | ||
United States | -9.01 | % | ||
| -42.51 | % |
Percentages are based upon net assets.
4
CPG Cooper Square International Equity, LLC
Schedule of Investments (Continued)
September 30, 2023
TOTAL RETURN SWAP CONTRACTS
Counterparty | Reference Entity/ | Notional | Floating | Floating | Termination | Value | Net | |||||||||||||||||||||
Morgan Stanley | Adidas AG | $ | 1,327,231 | FEDEF-1D | 50 bps | 02/09/2024 | $ | 1,425,737 | $ | 98,506 | ||||||||||||||||||
Morgan Stanley | Amadeus IT Group SA | 299,755 | FEDEF-1D | 50 bps | 11/06/2023 | 363,204 | 63,449 | |||||||||||||||||||||
Goldman Sachs | Commonwealth Bank of Australia | (1,122,149 | ) | FEDEF-1D | (50) bps | 01/31/2024 | (1,062,461 | ) | 59,688 | |||||||||||||||||||
Morgan Stanley | Dechra Pharmaceuticals PLC | 743,232 | FEDEF-1D | 50 bps | 11/30/2023 | 1,106,667 | 363,436 | |||||||||||||||||||||
Morgan Stanley | DSM FIRMENICH AG | 1,003,819 | FEDEF-1D | 50 bps | 10/22/2024 | 1,019,236 | 15,417 | |||||||||||||||||||||
Goldman Sachs | GS Swap GSCBAIEU Basket Index | (405,783 | ) | ESTR-1D | (40) bps | 08/09/2024 | (400,711 | ) | 5,072 | |||||||||||||||||||
Goldman Sachs | GS Swap GSCBERE1 Basket Index(a) | (604,441 | ) | ESTR-1D | (40) bps | 08/14/2024 | (558,002 | ) | 46,439 | |||||||||||||||||||
Goldman Sachs | GS Swap GSCBETAS Basket Index(a) | (862,876 | ) | ESTR-1D | (45) bps | 06/27/2024 | (804,537 | ) | 58,339 | |||||||||||||||||||
Goldman Sachs | GS Swap GSCBSCF Basket Index | (128,925 | ) | FEDEF-1D | (33) bps | 10/03/2024 | (128,852 | ) | 74 | |||||||||||||||||||
Goldman Sachs | GS Swap GSCBSECN Basket Index | (364,518 | ) | FEDEF-1D | (33) bps | 10/10/2024 | (345,247 | ) | 19,271 | |||||||||||||||||||
Goldman Sachs | GS Swap GSCBSEGP Basket Index(a) | (1,170,676 | ) | FEDEF-1D | (46) bps | 09/05/2024 | (1,067,921 | ) | 102,756 | |||||||||||||||||||
Morgan Stanley | H&M Hennes & Mauritz AB | 1,293,319 | FEDEF-1D | 50 bps | 04/03/2024 | 1,333,892 | 40,573 | |||||||||||||||||||||
Morgan Stanley | London Stock Exchange | 1,784,067 | FEDEF-1D | 50 bps | 10/23/2023 | 2,042,865 | 258,798 | |||||||||||||||||||||
Morgan Stanley | MS Swap MSSEEWT Basket Index | (405,952 | ) | FEDEF-1D | (160) bps | 10/11/2024 | (404,280 | ) | 1,671 | |||||||||||||||||||
Morgan Stanley | Nexi Spa Npv | 498,912 | FEDEF-1D | 50 bps | 10/28/2024 | 500,465 | 1,554 | |||||||||||||||||||||
Morgan Stanley | Rentokil Initial PLC | 1,102,386 | FEDEF-1D | 50 bps | 11/06/2023 | 1,381,945 | 279,559 | |||||||||||||||||||||
Morgan Stanley | Schneider Electric | 1,435,900 | FEDEF-1D | 50 bps | 11/13/2023 | 1,962,188 | 526,288 | |||||||||||||||||||||
| $ | 4,423,301 | $ | 6,364,188 | $ | 1,940,890 | |||||||||||||||||||||||
5
CPG Cooper Square International Equity, LLC
Schedule of Investments (Continued)
September 30, 2023
Counterparty | Reference Entity/ | Notional | Floating | Floating | Termination | Value | Net | |||||||||||||||||||||
Morgan Stanley | Amplifon SPA | $ | 293,538 | FEDEF-1D | 50 bps | 01/29/2024 | $ | 286,973 | $ | (6,565 | ) | |||||||||||||||||
Morgan Stanley | Bureau Veritas SA | 1,539,057 | FEDEF-1D | 50 bps | 01/19/2024 | 1,456,484 | (82,573 | ) | ||||||||||||||||||||
Morgan Stanley | Diageo PLC | 665,310 | FEDEF-1D | 50 bps | 09/23/2024 | 605,872 | (59,438 | ) | ||||||||||||||||||||
Bank Of America Merrill Lynch | EURO STOXX Banks (Price) Index | (606,809 | ) | FEDEF-1D | (30) bps | 04/22/2024 | (648,366 | ) | (41,557 | ) | ||||||||||||||||||
Goldman Sachs | GS Swap GSCBAIUS Basket Index | (320,247 | ) | FEDEF-1D | (33) bps | 06/06/2024 | (353,363 | ) | (33,116 | ) | ||||||||||||||||||
Morgan Stanley | JD.Com, Inc. | 1,220,510 | FEDEF-1D | 50 bps | 11/27/2023 | 872,864 | (347,646 | ) | ||||||||||||||||||||
Morgan Stanley | Koninklijke DSM NV | 710,747 | FEDEF-1D | 50 bps | 10/20/2023 | 654,733 | (56,014 | ) | ||||||||||||||||||||
Morgan Stanley | MS Swap MSCBDSMF Basket Index(a) | 677,801 | ESTR-1D | 50 bps | 09/29/2023 | 637,295 | (40,506 | ) | ||||||||||||||||||||
Morgan Stanley | MS Swap MSEUBANK Basket Index | (390,224 | ) | FEDEF-1D | (42) bps | 04/17/2024 | (465,811 | ) | (75,587 | ) | ||||||||||||||||||
Morgan Stanley | Prosus N.V. | 2,917,861 | FEDEF-1D | 50 bps | 12/11/2023 | 2,901,403 | (16,459 | ) | ||||||||||||||||||||
Bank Of America Merrill Lynch | REPSOL SA | (510,490 | ) | FEDEF-1D | (20) bps | 05/20/2024 | (585,456 | ) | (74,966 | ) | ||||||||||||||||||
Morgan Stanley | Sartorius Stedim Biotech | 1,853,554 | FEDEF-1D | 50 bps | 10/19/2023 | 1,678,053 | (175,501 | ) | ||||||||||||||||||||
Morgan Stanley | SONOVA HOLDING AG | 1,166,449 | FEDEF-1D | 50 bps | 06/17/2024 | 1,054,708 | (111,742 | ) | ||||||||||||||||||||
Morgan Stanley | Taiwan Semiconductor Manufacturing Co., Ltd. | 2,146,049 | FEDEF-1D | 95 bps | 12/15/2023 | 2,087,496 | (58,553 | ) | ||||||||||||||||||||
Morgan Stanley | Treasury Wine Estates, Ltd. | 2,327,162 | FEDEF-1D | 50 bps | 11/06/2023 | 2,220,134 | (107,028 | ) | ||||||||||||||||||||
| $ | 13,690,268 | $ | 12,403,019 | $ | (1,287,251 | ) | ||||||||||||||||||||||
TOTAL | $ | 18,113,569 | $ | 18,767,207 | $ | 653,639 | ||||||||||||||||||||||
ESTR-1D - Euro Short-Term Rate (Daily)
FEDEF-1D - Federal Funds Effective Rate (Daily)
(a) See tables below for details of the equity basket holdings underlying the swaps.
6
CPG Cooper Square International Equity, LLC
Schedule of Investments (Continued)
September 30, 2023
The following table represents the equity basket holdings underlying the total return swap with GS Swap GSCBERE1 Basket Index as of September 30, 2023.
GS Swap GSCBERE1 Basket Index
Description | Shares | Value | Percentage of Value | |||||||||
Short Securities | ||||||||||||
Common Stocks | ||||||||||||
Buzzi SpA | (8,380 | ) | (EUR 217,220 | ) | 41.22 | % | ||||||
SSAB AB | (28,812 | ) | (154,547 | ) | 29.32 | % | ||||||
voestalpine AG | (6,010 | ) | (155,292 | ) | 29.46 | % | ||||||
Common Stocks Total | (527,059 | ) | 100.00 | % | ||||||||
Total Short Securities (Euros) | (527,059 | ) | ||||||||||
9/30 USD/EUR Spot Rate (rounded) of | 0.945 | |||||||||||
Grand Total (US Dollars) | (USD 558,002 | ) | ||||||||||
7
CPG Cooper Square International Equity, LLC
Schedule of Investments (Continued)
September 30, 2023
The following table represents the equity basket holdings underlying the total return swap with GS Swap GSCBETAS Basket Index as of September 30, 2023.
GS Swap GSCBETAS Basket Index
Description | Shares | Value | Percentage of Value | |||||||||
Short Securities | ||||||||||||
Common Stocks | ||||||||||||
Air France-KLM | (1,245 | ) | (EUR 14,813 | ) | 1.95 | % | ||||||
Antofagasta PLC | (1,115 | ) | (18,365 | ) | 2.42 | % | ||||||
ArcelorMittal SA | (1,859 | ) | (44,209 | ) | 5.82 | % | ||||||
Cie Financiere Richemont SA | (212 | ) | (24,526 | ) | 3.23 | % | ||||||
CNH Industrial NV | (2,570 | ) | (29,656 | ) | 3.90 | % | ||||||
Continental AG | (722 | ) | (48,226 | ) | 6.35 | % | ||||||
Delivery Hero SE | (1,390 | ) | (37,775 | ) | 4.97 | % | ||||||
Deutsche Lufthansa AG | (4,805 | ) | (36,064 | ) | 4.75 | % | ||||||
Forvia SE | (1,509 | ) | (29,587 | ) | 3.89 | % | ||||||
Heidelberg Materials AG | (671 | ) | (49,367 | ) | 6.50 | % | ||||||
Hexagon AB | (4,509 | ) | (36,606 | ) | 4.82 | % | ||||||
Kingspan Group PLC | (312 | ) | (22,156 | ) | 2.92 | % | ||||||
Logitech International SA | (634 | ) | (41,390 | ) | 5.45 | % | ||||||
Nexi SpA | (4,319 | ) | (24,998 | ) | 3.29 | % | ||||||
Nibe Industrier AB | (3,086 | ) | (19,265 | ) | 2.54 | % | ||||||
Norsk Hydro ASA | (4,879 | ) | (29,102 | ) | 3.83 | % | ||||||
Pandora A/S | (218 | ) | (21,384 | ) | 2.81 | % | ||||||
Ryanair Holdings PLC | (1,569 | ) | (24,977 | ) | 3.29 | % | ||||||
SKF AB | (2,709 | ) | (42,894 | ) | 5.64 | % | ||||||
Straumann Holding AG | (235 | ) | (28,390 | ) | 3.74 | % | ||||||
UBS Group AG | (1,792 | ) | (41,989 | ) | 5.53 | % | ||||||
Vestas Wind Systems A/S | (1,313 | ) | (26,680 | ) | 3.51 | % | ||||||
Vonovia SE | (1,754 | ) | (40,001 | ) | 5.25 | % | ||||||
Zalando SE | (1,299 | ) | (27,442 | ) | 3.60 | % | ||||||
Common Stocks Total | (759,862 | ) | 100.00 | % | ||||||||
Total Short Securities (Euros) | (759,862 | ) | ||||||||||
9/30 USD/EUR Spot Rate (rounded) of | 0.945 | |||||||||||
Grand Total (US Dollars) | (USD 804,537 | ) | ||||||||||
8
CPG Cooper Square International Equity, LLC
Schedule of Investments (Continued)
September 30, 2023
The following table represents the equity basket holdings underlying the total return swap with GS Swap GSCBSEGP Basket Index as of September 30, 2023.
GS Swap GSCBSEGP Basket Index
Description | Shares | Value | Percentage of Value | |||||||||
Short Securities | ||||||||||||
Common Stocks | ||||||||||||
10X Genomics, Inc. | (6 | ) | (USD 234 | ) | 0.02 | % | ||||||
23andMe Holding Co. | (67 | ) | (66 | ) | 0.01 | % | ||||||
Abbott Laboratories | (5 | ) | (511 | ) | 0.05 | % | ||||||
AbbVie, Inc. | (5 | ) | (776 | ) | 0.07 | % | ||||||
Academy Sports & Outdoors, Inc. | (83 | ) | (3,936 | ) | 0.37 | % | ||||||
Accenture PLC | (20 | ) | (5,997 | ) | 0.56 | % | ||||||
Affirm Holdings, Inc. | (11 | ) | (234 | ) | 0.02 | % | ||||||
Aflac, Inc. | (5 | ) | (394 | ) | 0.04 | % | ||||||
agilon health, Inc. | (39 | ) | (696 | ) | 0.07 | % | ||||||
Airbnb, Inc. | (136 | ) | (18,656 | ) | 1.75 | % | ||||||
Alcoa Corp. | (6 | ) | (186 | ) | 0.02 | % | ||||||
Algonquin Power & Utilities Corp. | (165 | ) | (983 | ) | 0.09 | % | ||||||
Alight, Inc. | (39 | ) | (277 | ) | 0.03 | % | ||||||
Align Technology, Inc. | (38 | ) | (11,468 | ) | 1.07 | % | ||||||
Allegion plc | (3 | ) | (264 | ) | 0.02 | % | ||||||
Allegro MicroSystems, Inc. | (3 | ) | (84 | ) | 0.01 | % | ||||||
Allison Transmission Holdings, Inc. | (6 | ) | (345 | ) | 0.03 | % | ||||||
Amazon.com, Inc. | (3 | ) | (386 | ) | 0.04 | % | ||||||
Amcor PLC | (1,115 | ) | (10,210 | ) | 0.96 | % | ||||||
American Airlines Group, Inc. | (307 | ) | (3,928 | ) | 0.37 | % | ||||||
American International Group, Inc. | (3 | ) | (161 | ) | 0.02 | % | ||||||
AMN Healthcare Services, Inc. | (3 | ) | (279 | ) | 0.03 | % | ||||||
Antero Resources Corp. | (14 | ) | (351 | ) | 0.03 | % | ||||||
Aon PLC | (4 | ) | (1,360 | ) | 0.13 | % | ||||||
APA Corp. | (27 | ) | (1,127 | ) | 0.11 | % | ||||||
Apple, Inc. | (179 | ) | (30,577 | ) | 2.86 | % | ||||||
AppLovin Corp. | (30 | ) | (1,215 | ) | 0.11 | % | ||||||
Aptiv PLC | (36 | ) | (3,501 | ) | 0.33 | % | ||||||
ArcBest Corp. | (6 | ) | (649 | ) | 0.06 | % | ||||||
Archer Aviation, Inc. | (29 | ) | (147 | ) | 0.01 | % | ||||||
Ares Management Corp. | (117 | ) | (12,050 | ) | 1.13 | % | ||||||
Arista Networks, Inc. | (6 | ) | (1,109 | ) | 0.10 | % | ||||||
Array Technologies, Inc. | (10 | ) | (227 | ) | 0.02 | % | ||||||
Arrival SA | (2 | ) | (2 | ) | 0.00 | % | ||||||
Arthur J Gallagher & Co. | (3 | ) | (659 | ) | 0.06 | % | ||||||
Asana, Inc. | (6 | ) | (102 | ) | 0.01 | % | ||||||
Aspen Technology, Inc. | (4 | ) | (862 | ) | 0.08 | % | ||||||
9
CPG Cooper Square International Equity, LLC
Schedule of Investments (Continued)
September 30, 2023
Description | Shares | Value | Percentage of Value | |||||||||
Assurant, Inc. | (1 | ) | (163 | ) | 0.02 | % | ||||||
AST SpaceMobile, Inc. | (31 | ) | (117 | ) | 0.01 | % | ||||||
Aurora Innovation, Inc. | (78 | ) | (184 | ) | 0.02 | % | ||||||
Automatic Data Processing, Inc. | (143 | ) | (34,364 | ) | 3.22 | % | ||||||
AutoZone, Inc. | (9 | ) | (22,840 | ) | 2.14 | % | ||||||
Avery Dennison Corp. | (70 | ) | (12,727 | ) | 1.19 | % | ||||||
Axalta Coating Systems, Ltd. | (9 | ) | (232 | ) | 0.02 | % | ||||||
Azenta, Inc. | (23 | ) | (1,148 | ) | 0.11 | % | ||||||
Baker Hughes Co. | (39 | ) | (1,377 | ) | 0.13 | % | ||||||
Bank of America Corp. | (13 | ) | (354 | ) | 0.03 | % | ||||||
Bank of Hawaii Corp. | (1 | ) | (62 | ) | 0.01 | % | ||||||
Bank OZK | (4 | ) | (157 | ) | 0.01 | % | ||||||
Baxter International, Inc. | (7 | ) | (280 | ) | 0.03 | % | ||||||
Beam Therapeutics, Inc. | (11 | ) | (266 | ) | 0.02 | % | ||||||
Becton Dickinson & Co. | (3 | ) | (804 | ) | 0.08 | % | ||||||
BellRing Brands, Inc. | (26 | ) | (1,078 | ) | 0.10 | % | ||||||
Berry Global Group, Inc. | (5 | ) | (282 | ) | 0.03 | % | ||||||
Blackstone, Inc. | (413 | ) | (44,300 | ) | 4.15 | % | ||||||
Booz Allen Hamilton Holding Corp. | (6 | ) | (701 | ) | 0.07 | % | ||||||
Boston Properties, Inc. | (34 | ) | (2,013 | ) | 0.19 | % | ||||||
Brandywine Realty Trust | (111 | ) | (502 | ) | 0.05 | % | ||||||
Brinker International, Inc. | (20 | ) | (645 | ) | 0.06 | % | ||||||
Brookfield Corp. | (302 | ) | (9,499 | ) | 0.89 | % | ||||||
Brown-Forman Corp. | (10 | ) | (569 | ) | 0.05 | % | ||||||
Brunswick Corp. | (78 | ) | (6,161 | ) | 0.58 | % | ||||||
Builders FirstSource, Inc. | (65 | ) | (8,112 | ) | 0.76 | % | ||||||
Bumble, Inc. | (20 | ) | (293 | ) | 0.03 | % | ||||||
Burlington Stores, Inc. | (63 | ) | (8,507 | ) | 0.80 | % | ||||||
Butterfly Network, Inc. | (37 | ) | (44 | ) | 0.00 | % | ||||||
C3.ai, Inc. | (19 | ) | (490 | ) | 0.05 | % | ||||||
Cadence Bank | (5 | ) | (105 | ) | 0.01 | % | ||||||
Cal-Maine Foods, Inc. | (119 | ) | (5,783 | ) | 0.54 | % | ||||||
Campbell Soup Co. | (13 | ) | (551 | ) | 0.05 | % | ||||||
Canadian National Railway Co. | (4 | ) | (438 | ) | 0.04 | % | ||||||
Cargojet, Inc. | (5 | ) | (347 | ) | 0.03 | % | ||||||
Carlisle Cos., Inc. | (52 | ) | (13,519 | ) | 1.27 | % | ||||||
CarMax, Inc. | (45 | ) | (3,190 | ) | 0.30 | % | ||||||
Caterpillar, Inc. | (28 | ) | (7,635 | ) | 0.71 | % | ||||||
Cboe Global Markets, Inc. | (2 | ) | (346 | ) | 0.03 | % | ||||||
CBRE Group, Inc. | (188 | ) | (13,850 | ) | 1.30 | % | ||||||
Celanese Corp. | (2 | ) | (300 | ) | 0.03 | % | ||||||
Celsius Holdings, Inc. | (10 | ) | (1,651 | ) | 0.15 | % | ||||||
Centene Corp. | (4 | ) | (296 | ) | 0.03 | % | ||||||
10
CPG Cooper Square International Equity, LLC
Schedule of Investments (Continued)
September 30, 2023
Description | Shares | Value | Percentage of Value | |||||||||
CH Robinson Worldwide, Inc. | (5 | ) | (430 | ) | 0.04 | % | ||||||
ChargePoint Holdings, Inc. | (20 | ) | (101 | ) | 0.01 | % | ||||||
Charles Schwab Corp. | (5 | ) | (283 | ) | 0.03 | % | ||||||
Chesapeake Energy Corp. | (10 | ) | (856 | ) | 0.08 | % | ||||||
Chevron Corp. | (11 | ) | (1,937 | ) | 0.18 | % | ||||||
Chewy, Inc. | (166 | ) | (3,024 | ) | 0.28 | % | ||||||
Chipotle Mexican Grill, Inc. | (10 | ) | (17,621 | ) | 1.65 | % | ||||||
Ciena Corp. | (2 | ) | (111 | ) | 0.01 | % | ||||||
Cisco Systems, Inc. | (242 | ) | (12,997 | ) | 1.22 | % | ||||||
Cleveland-Cliffs, Inc. | (15 | ) | (231 | ) | 0.02 | % | ||||||
Clorox Co. | (45 | ) | (5,915 | ) | 0.55 | % | ||||||
Clover Health Investments Corp. | (118 | ) | (127 | ) | 0.01 | % | ||||||
CME Group, Inc. | (6 | ) | (1,125 | ) | 0.11 | % | ||||||
Cognex Corp. | (3 | ) | (107 | ) | 0.01 | % | ||||||
Columbia Banking System, Inc. | (6 | ) | (113 | ) | 0.01 | % | ||||||
Comerica, Inc. | (4 | ) | (166 | ) | 0.02 | % | ||||||
Commonwealth Bank of Australia | (249 | ) | (16,083 | ) | 1.51 | % | ||||||
Conagra Brands, Inc. | (19 | ) | (532 | ) | 0.05 | % | ||||||
Confluent, Inc. | (30 | ) | (883 | ) | 0.08 | % | ||||||
ConocoPhillips | (104 | ) | (12,445 | ) | 1.17 | % | ||||||
Consolidated Edison, Inc. | (13 | ) | (1,105 | ) | 0.10 | % | ||||||
Corteva, Inc. | (10 | ) | (537 | ) | 0.05 | % | ||||||
Costco Wholesale Corp. | (1 | ) | (749 | ) | 0.07 | % | ||||||
Coterra Energy, Inc. | (35 | ) | (949 | ) | 0.09 | % | ||||||
Coty, Inc. | (989 | ) | (10,844 | ) | 1.02 | % | ||||||
Coupang, Inc. | (38 | ) | (641 | ) | 0.06 | % | ||||||
Coursera, Inc. | (50 | ) | (931 | ) | 0.09 | % | ||||||
Cousins Properties, Inc. | (36 | ) | (741 | ) | 0.07 | % | ||||||
Cracker Barrel Old Country Store, Inc. | (16 | ) | (1,048 | ) | 0.10 | % | ||||||
Crane Co. | (2 | ) | (152 | ) | 0.01 | % | ||||||
Crane NXT Co. | (2 | ) | (94 | ) | 0.01 | % | ||||||
Credit Acceptance Corp. | (2 | ) | (910 | ) | 0.09 | % | ||||||
Crocs, Inc. | (119 | ) | (10,537 | ) | 0.99 | % | ||||||
Crowdstrike Holdings, Inc. | (21 | ) | (3,486 | ) | 0.33 | % | ||||||
CSX Corp. | (9 | ) | (271 | ) | 0.03 | % | ||||||
Cullen/Frost Bankers, Inc. | (4 | ) | (396 | ) | 0.04 | % | ||||||
Cummins, Inc. | (1 | ) | (259 | ) | 0.02 | % | ||||||
Cushman & Wakefield PLC | (43 | ) | (324 | ) | 0.03 | % | ||||||
CVB Financial Corp. | (6 | ) | (99 | ) | 0.01 | % | ||||||
CyberArk Software, Ltd. | (6 | ) | (1,054 | ) | 0.10 | % | ||||||
Darden Restaurants, Inc. | (14 | ) | (1,940 | ) | 0.18 | % | ||||||
DaVita, Inc. | (4 | ) | (349 | ) | 0.03 | % | ||||||
Desktop Metal, Inc. | (46 | ) | (67 | ) | 0.01 | % | ||||||
11
CPG Cooper Square International Equity, LLC
Schedule of Investments (Continued)
September 30, 2023
Description | Shares | Value | Percentage of Value | |||||||||
Devon Energy Corp. | (22 | ) | (1,066 | ) | 0.10 | % | ||||||
Dexcom, Inc. | (3 | ) | (241 | ) | 0.02 | % | ||||||
Diamondback Energy, Inc. | (11 | ) | (1,718 | ) | 0.16 | % | ||||||
Dine Brands Global, Inc. | (6 | ) | (306 | ) | 0.03 | % | ||||||
Dlocal, Ltd. | (25 | ) | (476 | ) | 0.04 | % | ||||||
Douglas Emmett, Inc. | (71 | ) | (906 | ) | 0.08 | % | ||||||
Dow, Inc. | (5 | ) | (240 | ) | 0.02 | % | ||||||
DTE Energy Co. | (11 | ) | (1,060 | ) | 0.10 | % | ||||||
Dun & Bradstreet Holdings, Inc. | (45 | ) | (447 | ) | 0.04 | % | ||||||
Duolingo, Inc. | (7 | ) | (1,136 | ) | 0.11 | % | ||||||
DXC Technology Co. | (5 | ) | (102 | ) | 0.01 | % | ||||||
Dynatrace, Inc. | (20 | ) | (935 | ) | 0.09 | % | ||||||
E2open Parent Holdings, Inc. | (46 | ) | (209 | ) | 0.02 | % | ||||||
Ecolab, Inc. | (5 | ) | (845 | ) | 0.08 | % | ||||||
Edison International | (20 | ) | (1,245 | ) | 0.12 | % | ||||||
Eli Lilly & Co. | (2 | ) | (1,230 | ) | 0.12 | % | ||||||
Emerson Electric Co. | (10 | ) | (996 | ) | 0.09 | % | ||||||
Empire State Realty Trust, Inc. | (339 | ) | (2,729 | ) | 0.26 | % | ||||||
Enovix Corp. | (28 | ) | (346 | ) | 0.03 | % | ||||||
Evercore, Inc. | (3 | ) | (402 | ) | 0.04 | % | ||||||
Evolent Health, Inc. | (34 | ) | (932 | ) | 0.09 | % | ||||||
Exelon Corp. | (31 | ) | (1,162 | ) | 0.11 | % | ||||||
Exxon Mobil Corp. | (11 | ) | (1,327 | ) | 0.12 | % | ||||||
FactSet Research Systems, Inc. | (1 | ) | (285 | ) | 0.03 | % | ||||||
FedEx Corp. | (3 | ) | (869 | ) | 0.08 | % | ||||||
Ferguson PLC | (40 | ) | (6,515 | ) | 0.61 | % | ||||||
First Citizens BancShares, Inc. | (0 | ) | (166 | ) | 0.02 | % | ||||||
First Commonwealth Financial Corp. | (4 | ) | (48 | ) | 0.00 | % | ||||||
First Financial Bankshares, Inc. | (3 | ) | (87 | ) | 0.01 | % | ||||||
First Hawaiian, Inc. | (3 | ) | (53 | ) | 0.00 | % | ||||||
First Interstate BancSystem, Inc. | (4 | ) | (102 | ) | 0.01 | % | ||||||
First Solar, Inc. | (1 | ) | (93 | ) | 0.01 | % | ||||||
Fiserv, Inc. | (8 | ) | (934 | ) | 0.09 | % | ||||||
Five Below, Inc. | (35 | ) | (5,613 | ) | 0.53 | % | ||||||
FleetCor Technologies, Inc. | (1 | ) | (160 | ) | 0.01 | % | ||||||
Floor & Decor Holdings, Inc. | (206 | ) | (18,659 | ) | 1.75 | % | ||||||
FMC Corp. | (5 | ) | (360 | ) | 0.03 | % | ||||||
FNB Corp. | (13 | ) | (139 | ) | 0.01 | % | ||||||
Forward Air Corp. | (4 | ) | (308 | ) | 0.03 | % | ||||||
Freeport-McMoRan, Inc. | (231 | ) | (8,632 | ) | 0.81 | % | ||||||
FREYR Battery SA | (23 | ) | (113 | ) | 0.01 | % | ||||||
Gartner, Inc. | (30 | ) | (10,189 | ) | 0.95 | % | ||||||
General Mills, Inc. | (80 | ) | (5,134 | ) | 0.48 | % | ||||||
12
CPG Cooper Square International Equity, LLC
Schedule of Investments (Continued)
September 30, 2023
Description | Shares | Value | Percentage of Value | |||||||||
Gentex Corp. | (181 | ) | (5,881 | ) | 0.55 | % | ||||||
Genuine Parts Co. | (4 | ) | (553 | ) | 0.05 | % | ||||||
GFL Environmental, Inc. | (26 | ) | (823 | ) | 0.08 | % | ||||||
Gitlab, Inc. | (4 | ) | (165 | ) | 0.02 | % | ||||||
Glacier Bancorp, Inc. | (2 | ) | (69 | ) | 0.01 | % | ||||||
Globe Life, Inc. | (3 | ) | (325 | ) | 0.03 | % | ||||||
Grab Holdings, Ltd. | (217 | ) | (769 | ) | 0.07 | % | ||||||
Graphic Packaging Holding Co. | (166 | ) | (3,692 | ) | 0.35 | % | ||||||
Guardant Health, Inc. | (11 | ) | (313 | ) | 0.03 | % | ||||||
GXO Logistics, Inc. | (16 | ) | (939 | ) | 0.09 | % | ||||||
Hancock Whitney Corp. | (3 | ) | (103 | ) | 0.01 | % | ||||||
Hashicorp, Inc. | (4 | ) | (96 | ) | 0.01 | % | ||||||
Hayward Holdings, Inc. | (61 | ) | (860 | ) | 0.08 | % | ||||||
Hecla Mining Co. | (35 | ) | (136 | ) | 0.01 | % | ||||||
Hershey Co. | (3 | ) | (622 | ) | 0.06 | % | ||||||
Hess Corp. | (11 | ) | (1,630 | ) | 0.15 | % | ||||||
Highwoods Properties, Inc. | (32 | ) | (669 | ) | 0.06 | % | ||||||
Hims & Hers Health, Inc. | (44 | ) | (276 | ) | 0.03 | % | ||||||
Home BancShares, Inc. | (4 | ) | (91 | ) | 0.01 | % | ||||||
Honeywell International, Inc. | (47 | ) | (8,658 | ) | 0.81 | % | ||||||
Howard Hughes Holdings, Inc. | (16 | ) | (1,151 | ) | 0.11 | % | ||||||
Howmet Aerospace, Inc. | (6 | ) | (288 | ) | 0.03 | % | ||||||
Hub Group, Inc. | (6 | ) | (456 | ) | 0.04 | % | ||||||
Hudson Pacific Properties, Inc. | (172 | ) | (1,144 | ) | 0.11 | % | ||||||
Humana, Inc. | (1 | ) | (633 | ) | 0.06 | % | ||||||
Huntington Bancshares, Inc. | (24 | ) | (250 | ) | 0.02 | % | ||||||
ICU Medical, Inc. | (7 | ) | (832 | ) | 0.08 | % | ||||||
Illinois Tool Works, Inc. | (39 | ) | (9,028 | ) | 0.85 | % | ||||||
Impinj, Inc. | (1 | ) | (52 | ) | 0.00 | % | ||||||
Inari Medical, Inc. | (5 | ) | (300 | ) | 0.03 | % | ||||||
Infosys, Ltd. | (723 | ) | (12,372 | ) | 1.16 | % | ||||||
Innoviz Technologies, Ltd. | (37 | ) | (73 | ) | 0.01 | % | ||||||
Inspire Medical Systems, Inc. | (1 | ) | (239 | ) | 0.02 | % | ||||||
Insulet Corp. | (1 | ) | (146 | ) | 0.01 | % | ||||||
International Bancshares Corp. | (1 | ) | (47 | ) | 0.00 | % | ||||||
Intra-Cellular Therapies, Inc. | (6 | ) | (323 | ) | 0.03 | % | ||||||
IonQ, Inc. | (28 | ) | (416 | ) | 0.04 | % | ||||||
IPG Photonics Corp. | (1 | ) | (103 | ) | 0.01 | % | ||||||
IQVIA Holdings, Inc. | (18 | ) | (3,557 | ) | 0.33 | % | ||||||
iRhythm Technologies, Inc. | (3 | ) | (241 | ) | 0.02 | % | ||||||
J.M. Smucker Co. | (42 | ) | (5,203 | ) | 0.49 | % | ||||||
JB Hunt Transport Services, Inc. | (68 | ) | (12,912 | ) | 1.21 | % | ||||||
Jefferies Financial Group, Inc. | (10 | ) | (360 | ) | 0.03 | % | ||||||
13
CPG Cooper Square International Equity, LLC
Schedule of Investments (Continued)
September 30, 2023
Description | Shares | Value | Percentage of Value | |||||||||
Joby Aviation, Inc. | (115 | ) | (741 | ) | 0.07 | % | ||||||
Johnson & Johnson | (7 | ) | (1,156 | ) | 0.11 | % | ||||||
Johnson Controls International PLC | (5 | ) | (245 | ) | 0.02 | % | ||||||
Jones Lang LaSalle, Inc. | (76 | ) | (10,721 | ) | 1.00 | % | ||||||
Kawasaki Kisen Kaisha, Ltd. | (24 | ) | (810 | ) | 0.08 | % | ||||||
Keurig Dr Pepper, Inc. | (19 | ) | (589 | ) | 0.06 | % | ||||||
KeyCorp | (23 | ) | (249 | ) | 0.02 | % | ||||||
Kilroy Realty Corp. | (58 | ) | (1,846 | ) | 0.17 | % | ||||||
Kimberly-Clark Corp. | (142 | ) | (17,140 | ) | 1.60 | % | ||||||
Knight-Swift Transportation Holdings, Inc. | (80 | ) | (3,993 | ) | 0.37 | % | ||||||
Kontoor Brands, Inc. | (41 | ) | (1,810 | ) | 0.17 | % | ||||||
Kuehne + Nagel International AG | (2 | ) | (585 | ) | 0.05 | % | ||||||
Kulicke & Soffa Industries, Inc. | (2 | ) | (111 | ) | 0.01 | % | ||||||
Landstar System, Inc. | (3 | ) | (495 | ) | 0.05 | % | ||||||
Leggett & Platt, Inc. | (175 | ) | (4,434 | ) | 0.42 | % | ||||||
Levi Strauss & Co. | (222 | ) | (3,015 | ) | 0.28 | % | ||||||
Li-Cycle Holdings Corp. | (23 | ) | (80 | ) | 0.01 | % | ||||||
LKQ Corp. | (221 | ) | (10,933 | ) | 1.02 | % | ||||||
Loews Corp. | (8 | ) | (525 | ) | 0.05 | % | ||||||
Logitech International SA | (37 | ) | (2,566 | ) | 0.24 | % | ||||||
Louisiana-Pacific Corp. | (54 | ) | (2,965 | ) | 0.28 | % | ||||||
Lululemon Athletica, Inc. | (42 | ) | (16,017 | ) | 1.50 | % | ||||||
Luminar Technologies, Inc. | (52 | ) | (237 | ) | 0.02 | % | ||||||
Lyft, Inc. | (23 | ) | (244 | ) | 0.02 | % | ||||||
M&T Bank Corp. | (2 | ) | (277 | ) | 0.03 | % | ||||||
Marsh & McLennan Cos, Inc. | (7 | ) | (1,418 | ) | 0.13 | % | ||||||
MasTec, Inc. | (5 | ) | (368 | ) | 0.03 | % | ||||||
McDonald’s Corp. | (33 | ) | (8,637 | ) | 0.81 | % | ||||||
McKesson Corp. | (3 | ) | (1,195 | ) | 0.11 | % | ||||||
Medpace Holdings, Inc. | (13 | ) | (3,158 | ) | 0.30 | % | ||||||
Merck & Co., Inc. | (8 | ) | (794 | ) | 0.07 | % | ||||||
Micron Technology, Inc. | (2 | ) | (153 | ) | 0.01 | % | ||||||
Microvast Holdings, Inc. | (78 | ) | (146 | ) | 0.01 | % | ||||||
Mirati Therapeutics, Inc. | (10 | ) | (433 | ) | 0.04 | % | ||||||
Mister Car Wash, Inc. | (60 | ) | (330 | ) | 0.03 | % | ||||||
Mitsui OSK Lines, Ltd. | (19 | ) | (527 | ) | 0.05 | % | ||||||
MKS Instruments, Inc. | (10 | ) | (889 | ) | 0.08 | % | ||||||
Moelis & Co. | (8 | ) | (357 | ) | 0.03 | % | ||||||
Molson Coors Beverage Co. | (104 | ) | (6,583 | ) | 0.62 | % | ||||||
Monday.com, Ltd. | (2 | ) | (376 | ) | 0.04 | % | ||||||
MP Materials Corp. | (319 | ) | (6,089 | ) | 0.57 | % | ||||||
MSCI, Inc. | (1 | ) | (309 | ) | 0.03 | % | ||||||
Nasdaq, Inc. | (5 | ) | (221 | ) | 0.02 | % | ||||||
14
CPG Cooper Square International Equity, LLC
Schedule of Investments (Continued)
September 30, 2023
Description | Shares | Value | Percentage of Value | |||||||||
New York Community Bancorp, Inc. | (7 | ) | (76 | ) | 0.01 | % | ||||||
Nextdoor Holdings, Inc. | (55 | ) | (100 | ) | 0.01 | % | ||||||
Nippon Yusen KK | (20 | ) | (524 | ) | 0.05 | % | ||||||
Northrop Grumman Corp. | (1 | ) | (584 | ) | 0.05 | % | ||||||
Norwegian Cruise Line Holdings, Ltd. | (15 | ) | (242 | ) | 0.02 | % | ||||||
NOV, Inc. | (19 | ) | (393 | ) | 0.04 | % | ||||||
Novocure, Ltd. | (7 | ) | (113 | ) | 0.01 | % | ||||||
NU Holdings, Ltd. | (165 | ) | (1,200 | ) | 0.11 | % | ||||||
Okta, Inc. | (1 | ) | (118 | ) | 0.01 | % | ||||||
Old Dominion Freight Line, Inc. | (2 | ) | (661 | ) | 0.06 | % | ||||||
Old National Bancorp | (7 | ) | (100 | ) | 0.01 | % | ||||||
Ollie’s Bargain Outlet Holdings, Inc. | (100 | ) | (7,722 | ) | 0.72 | % | ||||||
ON Semiconductor Corp. | (45 | ) | (4,181 | ) | 0.39 | % | ||||||
Option Care Health, Inc. | (9 | ) | (291 | ) | 0.03 | % | ||||||
Organon & Co. | (13 | ) | (223 | ) | 0.02 | % | ||||||
Otis Worldwide Corp. | (3 | ) | (259 | ) | 0.02 | % | ||||||
Ovintiv, Inc. | (22 | ) | (1,032 | ) | 0.10 | % | ||||||
Oxford Industries, Inc. | (18 | ) | (1,696 | ) | 0.16 | % | ||||||
Palantir Technologies, Inc. | (312 | ) | (4,992 | ) | 0.47 | % | ||||||
Paramount Global | (39 | ) | (501 | ) | 0.05 | % | ||||||
Paramount Group, Inc. | (374 | ) | (1,729 | ) | 0.16 | % | ||||||
Parker-Hannifin Corp. | (1 | ) | (319 | ) | 0.03 | % | ||||||
Paycor HCM, Inc. | (24 | ) | (546 | ) | 0.05 | % | ||||||
Payoneer Global, Inc. | (171 | ) | (1,047 | ) | 0.10 | % | ||||||
Paysafe, Ltd. | (6 | ) | (67 | ) | 0.01 | % | ||||||
Penumbra, Inc. | (1 | ) | (268 | ) | 0.03 | % | ||||||
PepsiCo, Inc. | (4 | ) | (649 | ) | 0.06 | % | ||||||
Permian Resources Corp. | (55 | ) | (761 | ) | 0.07 | % | ||||||
Pfizer, Inc. | (17 | ) | (552 | ) | 0.05 | % | ||||||
PG&E Corp. | (81 | ) | (1,310 | ) | 0.12 | % | ||||||
Piedmont Office Realty Trust, Inc. | (25 | ) | (139 | ) | 0.01 | % | ||||||
Planet Fitness, Inc. | (108 | ) | (5,328 | ) | 0.50 | % | ||||||
Planet Labs PBC | (56 | ) | (146 | ) | 0.01 | % | ||||||
Plug Power, Inc. | (554 | ) | (4,207 | ) | 0.39 | % | ||||||
PPG Industries, Inc. | (2 | ) | (250 | ) | 0.02 | % | ||||||
PPL Corp. | (43 | ) | (1,002 | ) | 0.09 | % | ||||||
Principal Financial Group, Inc. | (4 | ) | (280 | ) | 0.03 | % | ||||||
Procore Technologies, Inc. | (2 | ) | (131 | ) | 0.01 | % | ||||||
Progyny, Inc. | (9 | ) | (290 | ) | 0.03 | % | ||||||
Prologis, Inc. | (89 | ) | (9,996 | ) | 0.94 | % | ||||||
Prosperity Bancshares, Inc. | (2 | ) | (112 | ) | 0.01 | % | ||||||
Proterra, Inc. | (28 | ) | (2 | ) | 0.00 | % | ||||||
PulteGroup, Inc. | (15 | ) | (1,084 | ) | 0.10 | % | ||||||
15
CPG Cooper Square International Equity, LLC
Schedule of Investments (Continued)
September 30, 2023
Description | Shares | Value | Percentage of Value | |||||||||
PVH Corp. | (46 | ) | (3,499 | ) | 0.33 | % | ||||||
R1 RCM, Inc. | (78 | ) | (1,180 | ) | 0.11 | % | ||||||
Ralph Lauren Corp. | (161 | ) | (18,681 | ) | 1.75 | % | ||||||
Rambus, Inc. | (3 | ) | (157 | ) | 0.01 | % | ||||||
Range Resources Corp. | (24 | ) | (765 | ) | 0.07 | % | ||||||
Regions Financial Corp. | (15 | ) | (253 | ) | 0.02 | % | ||||||
Reinsurance Group of America, Inc. | (4 | ) | (529 | ) | 0.05 | % | ||||||
Repligen Corp. | (157 | ) | (24,967 | ) | 2.34 | % | ||||||
Republic Services, Inc. | (5 | ) | (742 | ) | 0.07 | % | ||||||
ResMed, Inc. | (4 | ) | (645 | ) | 0.06 | % | ||||||
RH | (1 | ) | (210 | ) | 0.02 | % | ||||||
Rio Tinto PLC | (146 | ) | (9,291 | ) | 0.87 | % | ||||||
Rivian Automotive, Inc. | (157 | ) | (3,820 | ) | 0.36 | % | ||||||
Robinhood Markets, Inc. | (152 | ) | (1,491 | ) | 0.14 | % | ||||||
ROBLOX Corp. | (15 | ) | (439 | ) | 0.04 | % | ||||||
Rocket Cos, Inc. | (732 | ) | (5,986 | ) | 0.56 | % | ||||||
Rocket Lab USA, Inc. | (62 | ) | (272 | ) | 0.03 | % | ||||||
Rockwell Automation, Inc. | (1 | ) | (269 | ) | 0.03 | % | ||||||
Royal Caribbean Cruises, Ltd. | (3 | ) | (282 | ) | 0.03 | % | ||||||
Rush Street Interactive, Inc. | (31 | ) | (145 | ) | 0.01 | % | ||||||
RXO, Inc. | (29 | ) | (564 | ) | 0.05 | % | ||||||
Saia, Inc. | (9 | ) | (3,460 | ) | 0.32 | % | ||||||
Sanmina Corp. | (2 | ) | (110 | ) | 0.01 | % | ||||||
Schlumberger NV | (206 | ) | (12,035 | ) | 1.13 | % | ||||||
Schneider National, Inc. | (19 | ) | (538 | ) | 0.05 | % | ||||||
Seacoast Banking Corp. of Florida | (5 | ) | (104 | ) | 0.01 | % | ||||||
Seagate Technology Holdings PLC | (214 | ) | (14,122 | ) | 1.32 | % | ||||||
Sempra | (15 | ) | (1,037 | ) | 0.10 | % | ||||||
SentinelOne, Inc. | (8 | ) | (137 | ) | 0.01 | % | ||||||
ServisFirst Bancshares, Inc. | (1 | ) | (54 | ) | 0.01 | % | ||||||
Shift4 Payments, Inc. | (2 | ) | (97 | ) | 0.01 | % | ||||||
SL Green Realty Corp. | (97 | ) | (3,626 | ) | 0.34 | % | ||||||
Snap-on, Inc. | (16 | ) | (3,978 | ) | 0.37 | % | ||||||
SoFi Technologies, Inc. | (61 | ) | (486 | ) | 0.05 | % | ||||||
SolarEdge Technologies, Inc. | (0 | ) | (50 | ) | 0.00 | % | ||||||
SomaLogic, Inc. | (21 | ) | (51 | ) | 0.00 | % | ||||||
Sotera Health Co | (19 | ) | (284 | ) | 0.03 | % | ||||||
Southern Copper Corp. | (93 | ) | (7,037 | ) | 0.66 | % | ||||||
Southwestern Energy Co. | (118 | ) | (761 | ) | 0.07 | % | ||||||
Spirit AeroSystems Holdings, Inc. | (9 | ) | (149 | ) | 0.01 | % | ||||||
Squarespace, Inc. | (31 | ) | (893 | ) | 0.08 | % | ||||||
Stanley Black & Decker, Inc. | (2 | ) | (208 | ) | 0.02 | % | ||||||
Steel Dynamics, Inc. | (65 | ) | (6,961 | ) | 0.65 | % | ||||||
16
CPG Cooper Square International Equity, LLC
Schedule of Investments (Continued)
September 30, 2023
Description | Shares | Value | Percentage of Value | |||||||||
Stem, Inc. | (27 | ) | (115 | ) | 0.01 | % | ||||||
Sunrun, Inc. | (10 | ) | (120 | ) | 0.01 | % | ||||||
Synovus Financial Corp. | (6 | ) | (164 | ) | 0.02 | % | ||||||
T Rowe Price Group, Inc. | (313 | ) | (32,773 | ) | 3.07 | % | ||||||
Tapestry, Inc. | (91 | ) | (2,604 | ) | 0.24 | % | ||||||
TD SYNNEX Corp. | (8 | ) | (826 | ) | 0.08 | % | ||||||
Teladoc Health, Inc. | (11 | ) | (206 | ) | 0.02 | % | ||||||
Tenet Healthcare Corp. | (5 | ) | (343 | ) | 0.03 | % | ||||||
Tesla, Inc. | (121 | ) | (30,198 | ) | 2.83 | % | ||||||
Texas Pacific Land Corp. | (8 | ) | (14,244 | ) | 1.33 | % | ||||||
Texas Roadhouse, Inc. | (17 | ) | (1,624 | ) | 0.15 | % | ||||||
Textainer Group Holdings, Ltd. | (15 | ) | (577 | ) | 0.05 | % | ||||||
TFI International, Inc. | (4 | ) | (569 | ) | 0.05 | % | ||||||
The Allstate Corp. | (4 | ) | (416 | ) | 0.04 | % | ||||||
The Bancorp., Inc. | (2 | ) | (55 | ) | 0.01 | % | ||||||
The Beauty Health Co. | (11 | ) | (69 | ) | 0.01 | % | ||||||
The Cheesecake Factory, Inc. | (22 | ) | (662 | ) | 0.06 | % | ||||||
The Hartford Financial Services Group, Inc. | (2 | ) | (149 | ) | 0.01 | % | ||||||
The New York Times Co. | (261 | ) | (10,735 | ) | 1.01 | % | ||||||
The Progressive Corp. | (5 | ) | (739 | ) | 0.07 | % | ||||||
The Timken Co. | (3 | ) | (250 | ) | 0.02 | % | ||||||
Toast, Inc. | (7 | ) | (128 | ) | 0.01 | % | ||||||
Topgolf Callaway Brands Corp. | (98 | ) | (1,354 | ) | 0.13 | % | ||||||
TriNet Group, Inc. | (8 | ) | (972 | ) | 0.09 | % | ||||||
Truist Financial Corp. | (8 | ) | (231 | ) | 0.02 | % | ||||||
Ulta Beauty, Inc. | (19 | ) | (7,579 | ) | 0.71 | % | ||||||
UMB Financial Corp. | (2 | ) | (151 | ) | 0.01 | % | ||||||
Under Armour, Inc. | (94 | ) | (646 | ) | 0.06 | % | ||||||
Union Pacific Corp. | (1 | ) | (211 | ) | 0.02 | % | ||||||
United Airlines Holdings, Inc. | (92 | ) | (3,873 | ) | 0.36 | % | ||||||
United Bankshares, Inc. | (3 | ) | (74 | ) | 0.01 | % | ||||||
United Community Banks, Inc. | (3 | ) | (87 | ) | 0.01 | % | ||||||
United Parcel Service, Inc. | (61 | ) | (9,533 | ) | 0.89 | % | ||||||
United Rentals, Inc. | (1 | ) | (300 | ) | 0.03 | % | ||||||
UnitedHealth Group, Inc. | (23 | ) | (11,693 | ) | 1.09 | % | ||||||
Unity Software, Inc. | (11 | ) | (360 | ) | 0.03 | % | ||||||
Universal Display Corp. | (1 | ) | (136 | ) | 0.01 | % | ||||||
Universal Health Services, Inc. | (2 | ) | (306 | ) | 0.03 | % | ||||||
Unum Group | (7 | ) | (368 | ) | 0.03 | % | ||||||
US Bancorp | (11 | ) | (360 | ) | 0.03 | % | ||||||
Varonis Systems, Inc. | (5 | ) | (142 | ) | 0.01 | % | ||||||
Veeva Systems, Inc. | (30 | ) | (6,185 | ) | 0.58 | % | ||||||
Velo3D, Inc. | (28 | ) | (44 | ) | 0.00 | % | ||||||
17
CPG Cooper Square International Equity, LLC
Schedule of Investments (Continued)
September 30, 2023
Description | Shares | Value | Percentage of Value | |||||||||
Vornado Realty Trust | (155 | ) | (3,510 | ) | 0.33 | % | ||||||
Walmart, Inc. | (75 | ) | (12,064 | ) | 1.13 | % | ||||||
Warner Bros Discovery, Inc. | (56 | ) | (608 | ) | 0.06 | % | ||||||
Waste Management, Inc. | (6 | ) | (963 | ) | 0.09 | % | ||||||
Wayfair, Inc. | (54 | ) | (3,256 | ) | 0.30 | % | ||||||
Webster Financial Corp. | (4 | ) | (168 | ) | 0.02 | % | ||||||
Wells Fargo & Co | (10 | ) | (408 | ) | 0.04 | % | ||||||
Werner Enterprises, Inc. | (11 | ) | (442 | ) | 0.04 | % | ||||||
West Pharmaceutical Services, Inc. | (5 | ) | (1,818 | ) | 0.17 | % | ||||||
Western Digital Corp. | (3 | ) | (155 | ) | 0.01 | % | ||||||
WeWork, Inc. | (2 | ) | (7 | ) | 0.00 | % | ||||||
Whirlpool Corp. | (2 | ) | (261 | ) | 0.02 | % | ||||||
Willis Towers Watson PLC | (2 | ) | (499 | ) | 0.05 | % | ||||||
WillScot Mobile Mini Holdings Corp. | (316 | ) | (13,143 | ) | 1.23 | % | ||||||
Wix.com, Ltd. | (1 | ) | (122 | ) | 0.01 | % | ||||||
Xylem, Inc. | (3 | ) | (230 | ) | 0.02 | % | ||||||
Zions Bancorp NA | (8 | ) | (272 | ) | 0.03 | % | ||||||
ZoomInfo Technologies, Inc. | (16 | ) | (267 | ) | 0.03 | % | ||||||
Common Stocks Total | (1,067,891 | ) | 100.00 | % | ||||||||
Total Short Securities (US Dollars) | (1,067,891 | ) | ||||||||||
Remaining Securities and Cash | (30 | ) | ||||||||||
Grand Total (US Dollars) | (USD 1,067,921 | ) | ||||||||||
18
CPG Cooper Square International Equity, LLC
Schedule of Investments (Continued)
September 30, 2023
The following table represents the equity basket holdings underlying the total return swap with MS Swap MSCBDSMF Basket Index as of September 30, 2023.
MS Swap MSCBDSMF Basket Index
Description | Shares | Value | Percentage of Value | |||||||||
Long Securities | ||||||||||||
Common Stocks | ||||||||||||
Anheuser-Busch InBev SA/NV | 234 | EUR 12,266 | 2.04 | % | ||||||||
AstraZeneca PLC | 94 | 12,049 | 2.00 | % | ||||||||
Chr Hansen Holding A/S | 180 | 10,428 | 1.73 | % | ||||||||
Coloplast A/S | 108 | 10,867 | 1.81 | % | ||||||||
Croda International PLC | 185 | 10,391 | 1.73 | % | ||||||||
Diageo PLC | 309 | 10,832 | 1.80 | % | ||||||||
DSM-Firmenich AG | 4,812 | 385,583 | 64.05 | % | ||||||||
Givaudan SA | 4 | 12,334 | 2.05 | % | ||||||||
GSK PLC | 753 | 12,970 | 2.15 | % | ||||||||
Kerry Group PLC | 133 | 10,494 | 1.74 | % | ||||||||
L’Oreal SA | 29 | 11,560 | 1.92 | % | ||||||||
LVMH Moet Hennessy Louis Vuitton SE | 15 | 10,580 | 1.76 | % | ||||||||
Nestle SA | 110 | 11,739 | 1.95 | % | ||||||||
Novartis AG | 127 | 12,319 | 2.05 | % | ||||||||
Novo Nordisk A/S | 140 | 12,079 | 2.01 | % | ||||||||
Novozymes A/S | 271 | 10,355 | 1.72 | % | ||||||||
Pernod Ricard SA | 61 | 9,611 | 1.60 | % | ||||||||
Roche Holding AG | 43 | 11,077 | 1.84 | % | ||||||||
Sanofi | 126 | 12,737 | 2.12 | % | ||||||||
Symrise AG | 129 | 11,614 | 1.93 | % | ||||||||
Common Stocks Total | 601,885 | 100.00 | % | |||||||||
Total Long Securities (Euros) | 601,885 | |||||||||||
9/30 USD/EUR Spot Rate (rounded) of | 0.945 | |||||||||||
Grand Total (US Dollars) | USD 637,295 | |||||||||||
19
CPG Cooper Square International Equity, LLC
Schedule of Investments (Continued)
September 30, 2023
Securities Sold Short
Common Stocks (27.63%) | Shares | Fair Value | ||||||
Finland (0.30%) | ||||||||
Valmet Oyj | (5,962 | ) | $ | (136,724 | ) | |||
France (2.66%) | ||||||||
Air France-KLM | (7,538 | ) | (94,956 | ) | ||||
Alstom SA | (15,130 | ) | (362,027 | ) | ||||
Capgemini SE | (1,586 | ) | (278,408 | ) | ||||
Kering SA | (99 | ) | (45,270 | ) | ||||
Legrand SA | (4,734 | ) | (437,558 | ) | ||||
| (1,218,219 | ) | |||||||
Germany (3.14%) | ||||||||
Brenntag SE | (9,710 | ) | (755,408 | ) | ||||
Deutsche Lufthansa AG | (27,841 | ) | (221,252 | ) | ||||
Scout24 SE | (6,685 | ) | (464,725 | ) | ||||
| (1,441,385 | ) | |||||||
Great Britain (3.40%) | ||||||||
Ashtead Group PLC | (8,157 | ) | (498,000 | ) | ||||
InterContinental Hotels Group PLC | (7,476 | ) | (554,242 | ) | ||||
International Consolidated Airlines Group SA | (97,097 | ) | (175,397 | ) | ||||
Rightmove PLC | (47,977 | ) | (329,215 | ) | ||||
| (1,556,854 | ) | |||||||
India (0.72%) | ||||||||
Infosys, Ltd., ADR | (18,945 | ) | (324,149 | ) | ||||
Japan (0.45%) | ||||||||
Daifuku Co., Ltd. | (10,890 | ) | (206,489 | ) | ||||
Netherlands (1.93%) | ||||||||
Randstad NV | (15,953 | ) | (884,711 | ) | ||||
Norway (1.80%) | ||||||||
Equinor ASA | (24,946 | ) | (823,223 | ) | ||||
Sweden (3.64%) | ||||||||
Assa Abloy AB, Class B | (23,546 | ) | (516,251 | ) | ||||
EQT AB | (9,960 | ) | (198,848 | ) | ||||
Sandvik AB | (17,617 | ) | (326,907 | ) | ||||
SKF AB, Class B | (37,324 | ) | (625,777 | ) | ||||
| (1,667,783 | ) | |||||||
20
CPG Cooper Square International Equity, LLC
Schedule of Investments (Continued)
September 30, 2023
Common Stocks (continued) | Shares | Fair Value | ||||||
Switzerland (5.44%) | ||||||||
ABB, Ltd. | (12,304 | ) | $ | (441,158 | ) | |||
Kuehne + Nagel International AG | (2,665 | ) | (760,347 | ) | ||||
Lonza Group AG | (1,059 | ) | (492,687 | ) | ||||
Sika AG | (1,021 | ) | (260,161 | ) | ||||
Swisscom AG | (780 | ) | (464,010 | ) | ||||
VAT Group AG | (219 | ) | (78,761 | ) | ||||
| (2,497,124 | ) | |||||||
United States (4.15%) | ||||||||
Airbnb, Inc., Class A | (4,234 | ) | (580,947 | ) | ||||
AutoZone, Inc. | (120 | ) | (304,799 | ) | ||||
Medpace Holdings, Inc. | (1,846 | ) | (446,972 | ) | ||||
Repligen Corp. | (1,321 | ) | (210,052 | ) | ||||
Robert Half, Inc. | (1,761 | ) | (129,046 | ) | ||||
Tesla, Inc. | (109 | ) | (27,274 | ) | ||||
West Pharmaceutical Services, Inc. | (552 | ) | (207,116 | ) | ||||
| (1,906,206 | ) | |||||||
Total Common Stocks | ||||||||
(Proceeds $12,701,802) | $ | (12,662,867 | ) | |||||
Exchange Traded Funds (14.88%) | ||||||||
Invesco DB US Dollar Index Bullish Fund | (7,183 | ) | (213,551 | ) | ||||
iShares® China Large-Cap ETF | (14,378 | ) | (381,448 | ) | ||||
iShares® Core MSCI Total International Stock ETF | (21,830 | ) | (1,309,582 | ) | ||||
iShares® MSCI ACWI ex US ETF | (27,557 | ) | (1,295,455 | ) | ||||
iShares® MSCI Australia ETF | (1,531 | ) | (32,932 | ) | ||||
iShares® MSCI Brazil ETF | (3,919 | ) | (120,196 | ) | ||||
iShares® MSCI Canada ETF | (13,793 | ) | (461,514 | ) | ||||
iShares® MSCI India ETF | (1,545 | ) | (68,320 | ) | ||||
iShares® MSCI Japan ETF | (15,563 | ) | (938,293 | ) | ||||
iShares® MSCI Mexico ETF | (1,374 | ) | (80,008 | ) | ||||
iShares® MSCI South Korea ETF | (4,310 | ) | (254,031 | ) | ||||
Vanguard® FTSE Europe ETF | (6,179 | ) | (357,949 | ) | ||||
Vanguard® Total International Stock ETF | (24,479 | ) | (1,310,116 | ) | ||||
Total Exchange Traded Funds | ||||||||
(Proceeds $7,038,462) | $ | (6,823,395 | ) | |||||
Total Securities Sold Short (42.51%) | ||||||||
(Proceeds $19,740,264) | $ | (19,486,262 | ) | |||||
See accompanying Notes to Financial Statements.
21
CPG Cooper Square International Equity, LLC
Schedule of Investments (Continued)
September 30, 2023
PUT OPTIONS WRITTEN
Underlying Security | Counterparty | Expiration | Strike Price | Contracts | Notional | Value | ||||||||||||||||||
EURO STOXX 50 Index | Goldman Sachs | 11/17/2023 | $ | 3,900 | (1,078 | ) | $ | (127,543 | ) | $ | (27,520 | ) | ||||||||||||
| $ | (127,543 | ) | $ | (27,520 | ) | |||||||||||||||||||
See accompanying Notes to the Financial Statements.
22
CPG Cooper Square International Equity, LLC
Statement of Assets and Liabilities
September 30, 2023
Assets | ||||
Investments, at fair value (Cost $43,300,144) | $ | 41,660,011 | ||
Cash | 26,620,338 | |||
Cash denominated in foreign currencies (Cost $(7,169)) | 3,173 | |||
Due from Broker | 2,012,046 | |||
Foreign tax reclaims | 141,030 | |||
Interest receivable | 89,452 | |||
Dividends receivable | 30,260 | |||
Unrealized appreciation on total return swap contracts (net of premiums paid $0) | 1,940,890 | |||
Receivable for investments sold | 392,401 | |||
Due from Adviser | 366,148 | |||
Prepaid expenses and other assets | 38,218 | |||
Total Assets | 73,293,967 | |||
Liabilities | ||||
Securities sold short, at value (Proceeds $19,740,264) | 19,486,262 | |||
Payable for shares repurchased | 5,439,478 | |||
Unrealized depreciation on total return swap contracts (net of premiums paid $0) | 1,287,251 | |||
Payable for total return swap contracts payments | 509,415 | |||
Payable for investments purchased | 314,421 | |||
Professional fees payable | 180,920 | |||
Transfer agency fees payable | 108,954 | |||
Written options, at value | 27,520 | |||
Distribution and servicing fees payable | 22,095 | |||
Payable for short sale dividends | 10,844 | |||
Accounting and administration fees payable | 8,350 | |||
Accounts payable and other accrued expenses | 61,655 | |||
Total Liabilities | 27,457,165 | |||
Net Assets | $ | 45,836,802 | ||
Composition of Net Assets | ||||
Paid-in capital | $ | 77,820,414 | ||
Total accumulated loss | (31,983,612 | ) | ||
Net Assets | $ | 45,836,802 | ||
Net Assets Attributable to: | ||||
Class A Units | $ | 25,023,157 | ||
Class I Units | 20,813,645 | |||
| $ | 45,836,802 | |||
Units of Beneficial Interest Outstanding (Unlimited Number of Units Authorized): | ||||
Class A Units | $ | 2,499,254 | ||
Class I Units | 1,525,963 | |||
| $ | 4,025,217 | |||
Net Asset Value per Unit: | ||||
Class A Units | $ | 10.01 | ||
Class I Units | 13.64 |
See accompanying Notes to Financial Statements.
23
CPG Cooper Square International Equity, LLC
Statement of Operations
For the Year Ended September 30, 2023
Investment Income | ||||
Interest income | $ | 1,009,644 | ||
Dividend income (net, Foreign withholding tax $(11,832)) | 637,944 | |||
Investment Income | 1,647,588 | |||
Expenses | ||||
Management fee | 776,915 | |||
Transfer agent fees | 187,183 | |||
Accounting and administration fees | 210,227 | |||
Professional fees | 405,711 | |||
Distribution fees | ||||
Class A | 276,090 | |||
Dividend expense on short sales | 561,039 | |||
Directors’ and Officer fees | 81,674 | |||
Custody fees | 90,749 | |||
Insurance expense | 2,566 | |||
Other fees | 74,090 | |||
Total Expenses | 2,666,244 | |||
Less fees waived/reimbursed by Adviser | ||||
Class A Shares | (399,992 | ) | ||
Class I Shares | (279,157 | ) | ||
Net expenses | 1,987,095 | |||
NET INVESTMENT LOSS | (339,507 | ) | ||
Net Realized Gain/(Loss) and Change in Unrealized Appreciation/(Depreciation) | ||||
Net realized gain/(loss) from: | ||||
Investments | (7,731,702 | ) | ||
Securities sold short | (2,918,413 | ) | ||
Written options | 117,832 | |||
Total return swap contracts | (6,012,888 | ) | ||
Forward foreign currency contracts | (9,544 | ) | ||
Foreign currency transactions | (24,293 | ) | ||
Net change in unrealized appreciation/(depreciation) on: | ||||
Investments | 13,614,981 | |||
Securities sold short | (3,500,846 | ) | ||
Written options | 24,615 | |||
Total return swap contracts | 6,375,188 | |||
Foreign currency | (9,352 | ) | ||
Net Realized Gain/(Loss) and Change in Unrealized Appreciation/(Depreciation) | (74,422 | ) | ||
Net Decrease in Net Assets Resulting from Operations | $ | (413,929 | ) |
See accompanying Notes to Financial Statements.
24
CPG Cooper Square International Equity, LLC
Statements of Changes in Net Assets
| For the | For the | ||||||
Changes in Net Assets Resulting from Operations | ||||||||
Net investment loss | $ | (339,507 | ) | $ | (2,268,428 | ) | ||
Net realized loss | (16,579,008 | ) | (13,751,276 | ) | ||||
Net change in unrealized appreciation/(depreciation) | 16,504,586 | (18,255,404 | ) | |||||
Net Change in Assets Resulting from Operations | (413,929 | ) | (34,275,108 | ) | ||||
Distributions to investors | ||||||||
Class A Units | — | (712,220 | ) | |||||
Class I Units | — | (434,361 | ) | |||||
Net Change in Net Assets from Distributions to Investors | — | (1,146,581 | ) | |||||
Change in Net Assets Resulting from Capital Transactions | ||||||||
Class A Units | ||||||||
Capital contributions | 606,172 | 10,569,300 | ||||||
Reinvested distributions | — | 703,585 | ||||||
Capital withdrawals | (12,244,350 | ) | (7,476,514 | ) | ||||
Total Class A Units Transactions | (11,638,178 | ) | 3,796,371 | |||||
Class I Units | ||||||||
Capital contributions | 1,045,262 | 7,506,970 | ||||||
Reinvested distributions | — | 427,833 | ||||||
Capital withdrawals | (3,958,314 | ) | (3,923,972 | ) | ||||
Total Class I Units Transactions | (2,913,052 | ) | 4,010,831 | |||||
Net Change in Net Assets Resulting from Capital Transactions | (14,551,230 | ) | 7,807,202 | |||||
Total Net Decrease in Net Assets | (14,965,159 | ) | (27,614,487 | ) | ||||
Net Assets | ||||||||
Beginning of year | 60,801,961 | 88,416,448 | ||||||
End of year | $ | 45,836,802 | $ | 60,801,961 | ||||
Unit Activity | ||||||||
Class A Units Activity | ||||||||
Capital contributions | 47,573 | 722,968 | ||||||
Reinvested distributions | — | 47,860 | ||||||
Capital withdrawals | (1,132,697 | ) | (652,007 | ) | ||||
Net Change in Class A Units Outstanding | (1,085,124 | ) | 118,821 | |||||
Class I Units Activity | ||||||||
Capital contributions | 64,801 | 391,350 | ||||||
Reinvested distributions | — | 21,628 | ||||||
Capital withdrawals | (255,796 | ) | (256,535 | ) | ||||
Net Change in Class I Units Outstanding | (190,995 | ) | 156,443 | |||||
Total Change in Units Outstanding | (1,276,119 | ) | 275,264 | |||||
See accompanying Notes to Financial Statements.
25
CPG Cooper Square International Equity, LLC
Financial Highlights
Class A
| For the | For the | For the Period | |||||||||
PER UNIT OPERATING PERFORMANCE: | ||||||||||||
NET ASSET VALUE, BEGINNING OF PERIOD | $ | 10.29 | $ | 15.90 | $ | 15.00 | ||||||
Activity from investment operations:(1) | ||||||||||||
Net investment loss(2) | (0.10 | ) | (0.40 | ) | (0.32 | ) | ||||||
Net realized and unrealized gain/(loss) | (0.18 | ) | (5.01 | ) | 1.22 | |||||||
Total from investment operations | (0.28 | ) | (5.41 | ) | 0.90 | |||||||
Distributions to investors | ||||||||||||
From net realized gains | — | (0.20 | ) | — | ||||||||
Total distributions to investors | — | (0.20 | ) | — | ||||||||
NET ASSET VALUE, END OF PERIOD | $ | 10.01 | $ | 10.29 | $ | 15.90 | ||||||
Net assets, end of period (in thousands) | $ | 25,023 | $ | 36,901 | $ | 55,083 | ||||||
RATIOS TO AVERAGE NET ASSETS (including interest expense and dividend expense on securities sold short) | ||||||||||||
Operating expenses excluding fee waivers/reimbursements | 4.57 | % | 4.27 | % | 5.11 | %(3) | ||||||
Operating expenses including fee waivers/reimbursements | 3.49 | % | 3.84 | % | 3.77 | %(3) | ||||||
Net investment loss including fee waivers/reimbursements | (0.87 | )% | (2.99 | )% | (2.20 | )%(3) | ||||||
Total Return(4) | (2.72 | )% | (34.37 | )% | 6.00 | %(5) | ||||||
Total return excluding incentive fees(6) | (2.72 | )% | (34.37 | )% | 6.00 | %(5) | ||||||
SUPPLEMENTAL RATIOS TO AVERAGE NET ASSETS (excluding interest expense and dividend expense on securities sold short) | ||||||||||||
Operating expenses excluding fee waivers/reimbursements | 3.67 | % | 3.04 | % | 3.95 | %(3) | ||||||
Operating expenses including fee waivers/reimbursements | 2.59 | % | 2.61 | % | 2.61 | %(3) | ||||||
Net investment income/(loss) including fee waivers/reimbursements | 0.03 | % | (1.76 | )% | (1.04 | )%(3) | ||||||
Portfolio turnover rate | 97 | % | 78 | % | 78 | %(7) | ||||||
(1) | Selected data is for a single unit outstanding throughout the year. |
(2) | Based on average units outstanding during the period. |
(3) | Net investment loss and operating expenses ratios are annualized for periods less than one full year, except for organizational costs which are one-time expenses. |
(4) | Total return reflects the changes in net asset value and is adjusted for cash flows related to capital contributions and withdrawals during the period. Total returns shown exclude the effect of applicable sales charges and redemption fees. |
(5) | Not annualized. |
(6) | Class A did not incur any incentive fees during the period. |
(7) | Portfolio turnover rate for periods less than one year is not annualized. |
See accompanying Notes to Financial Statements.
26
CPG Cooper Square International Equity, LLC
Financial Highlights
Class I
| For the | For the | For the Period | |||||||||
PER UNIT OPERATING PERFORMANCE: | ||||||||||||
NET ASSET VALUE, BEGINNING OF PERIOD | $ | 13.92 | $ | 21.36 | $ | 20.00 | ||||||
Activity from investment operations:(1) | ||||||||||||
Net investment loss(2) | (0.01 | ) | (0.40 | ) | (0.49 | ) | ||||||
Net realized and unrealized gain/(loss) | (0.27 | ) | (6.78 | ) | 1.85 | |||||||
Total from investment operations | (0.28 | ) | (7.18 | ) | 1.36 | |||||||
Distributions to investors | ||||||||||||
From net realized gains | — | (0.26 | ) | — | ||||||||
Total distributions to investors | — | (0.26 | ) | — | ||||||||
NET ASSET VALUE, END OF PERIOD | $ | 13.64 | $ | 13.92 | $ | 21.36 | ||||||
Net assets, end of period (in thousands) | $ | 20,814 | $ | 23,901 | $ | 33,333 | ||||||
RATIOS TO AVERAGE NET ASSETS (including interest expense and dividend expense on securities sold short) | ||||||||||||
Operating expenses excluding fee waivers/reimbursements | 3.86 | % | 3.53 | % | 5.42 | %(3) | ||||||
Operating expenses including fee waivers/reimbursements | 2.76 | % | 3.10 | % | 3.85 | %(3) | ||||||
Net investment loss including fee waivers/reimbursements | (0.08 | )% | (2.25 | )% | (2.39 | )%(3) | ||||||
Total Return(4) | (2.01 | )% | (33.97 | )% | 6.80 | %(5) | ||||||
Total return excluding incentive fees | (2.01 | )%(6) | (33.97 | )%(6) | 7.55 | %(5) | ||||||
SUPPLEMENTAL RATIOS TO AVERAGE NET ASSETS (excluding interest expense and dividend expense on securities sold short) | ||||||||||||
Operating expenses excluding fee waivers/reimbursements | 2.95 | % | 2.29 | % | 4.36 | %(3) | ||||||
Operating expenses including fee waivers/reimbursements | 1.85 | % | 1.86 | % | 2.79 | %(3) | ||||||
Net investment income/(loss) including fee waivers/reimbursements | 0.83 | % | (1.01 | )% | (1.33 | )%(3) | ||||||
Portfolio turnover rate | 97 | % | 78 | % | 78 | %(7) | ||||||
(1) | Selected data is for a single unit outstanding throughout the year. |
(2) | Based on average units outstanding during the period. |
(3) | Net investment loss and operating expenses ratios are annualized for periods less than one full year, except for organizational costs which are one-time expenses. |
(4) | Total return reflects the changes in net asset value and is adjusted for cash flows related to capital contributions and withdrawals during the period. Total returns shown exclude the effect of applicable sales charges and redemption fees. |
(5) | Not annualized. |
(6) | Class I did not incur any incentive fees during the period. |
(7) | Portfolio turnover rate for periods less than one year is not annualized. |
See accompanying Notes to Financial Statements.
27
CPG Cooper Square International Equity, LLC
Notes to Financial Statements
September 30, 2023
1. ORGANIZATION
CPG Cooper Square International Equity, LLC (the “Fund”) was organized as a Delaware limited liability company on July 14, 2020. The Fund is registered under the Investment Company Act of 1940, as amended (the “1940 Act”), as a closed-end, non-diversified management investment company. The Fund commenced operations on November 2, 2020. The Fund’s investment adviser is Central Park Advisers, LLC (the “Adviser”), a Delaware Limited Liability Company registered under the Investment Advisers Act of 1940, as amended (the “Advisers Act”). The Fund’s investment sub-adviser (the “Sub-Adviser”) is Select Equity Group, L.P., a Delaware limited partnership registered under the Advisers Act. The Sub-Adviser is responsible for the day-to-day management of the Fund’s portfolio. The Fund’s investment objective is to seek to achieve maximum total return. The Fund seeks to achieve its investment objective by investing primarily in equity securities of non-U.S.-domiciled issuers, including those domiciled in emerging markets. Under normal circumstances, the Fund invests at least 80% of its net assets, plus any borrowings for investment purposes, in equity securities. For purposes of the Fund’s investment program, “equity securities” means common and preferred stocks (including investments in initial public offerings), convertible securities, warrants and rights. The Fund may invest in equity securities without restriction to market capitalization. Under extraordinary circumstances, the Fund may acquire substantial stakes in public companies; however, the Fund generally does not invest more than 10% of its net asset value (measured at the time of purchase) in the voting securities of any one investment. The Fund may seek to obtain exposure to particular issuers or securities through derivative transactions, including, without limitation, swaps (including total return swaps), contracts for differences, options and other types of derivative arrangements for investment or hedging purposes.
Subject to the requirements of the 1940 Act, the business and affairs of the Fund shall be managed under the direction of the Fund’s Board of Directors (the “Board,” with an individual member referred to as a “Director”). The Board has the right, power and authority, on behalf of the Fund and in its name, to do all things necessary and proper to carry out its duties under the Fund’s Limited Liability Company Agreement, as amended and restated from time to time. Each Director shall be vested with the same powers, authority and responsibilities on behalf of the Fund as are customarily vested in each director of a Delaware corporation, and each Director who is not an “interested person” (as defined in the 1940 Act) of the Fund shall be vested with the same powers, authority and responsibilities on behalf of the Fund as are customarily vested in each director of a closed-end management investment company registered under the 1940 Act that is organized as a Delaware corporation who is not an “interested person” of such company. No Director shall have the authority individually to act on behalf of or to bind the Fund except within the scope of such Director’s authority as delegated by the Board. The Board may delegate the management of the Fund’s day-to-day operations to one or more officers or other persons (including, without limitation, the Adviser), subject to the investment objective and policies of the Fund and to the oversight of the Board.
The Fund offers two classes of limited liability company interests (“Units”), Class A Units and Class I Units, which are registered under the Securities Act of 1933, as amended, and offered to qualified clients as defined in Rule 205-3 under the Advisers Act. Each class of Units has certain differing characteristics, particularly in terms of the distribution fees that may be charged to investors. While neither the Fund nor Delaware Distributors, LP, the distributor for the Fund (the “Distributor”), imposes a sales load on purchases of Class A or Class I Units, financial intermediaries may directly charge Class A investors certain transaction or other fees in such amounts as they may determine. Under the terms of the Fund’s distribution agreement, the Distributor is authorized to pay third parties, including brokers, dealers and certain financial advisors (which may include wealth advisors) and others (collectively, “Selling Agents”) for the provision of distribution services as contemplated by Rule 12b-1 under the 1940 Act and for non-12b-1 services to investors holding Class A Units. The Fund pays the Distributor a monthly fee out of the net assets of Class A Units at the annual rate of 0.75% of the net asset value of Class A Units determined and accrued as of the end of each month (before any repurchases of Class A Units, but after the Management Fee (defined below) is calculated and accrued) (the “Distribution and Servicing Fee”). The Distributor pays the Distribution and Servicing Fee to Selling Agents, who may use such fee to compensate the financial advisors involved in the sale of Units. Amounts retained by the Distributor, if any, are used by the Distributor to pay for Fund-related distribution and servicing expenses. Payment of the Distribution and Servicing Fee is governed by the Fund’s Rule 12b-1 Plan, which, pursuant to the conditions of an exemptive order issued by the Securities and Exchange Commission (the “SEC”), has been adopted by the Fund with respect to Class A Units in compliance with Rule 12b-1 under the 1940 Act. The Distribution and Servicing Fee is charged on an aggregate class-wide basis, and Class A investors are subject
28
CPG Cooper Square International Equity, LLC
Notes to Financial Statements (Continued)
September 30, 2023
1. ORGANIZATION (continued)
to the Distribution and Servicing Fee as long as they hold their Class A Units. Each compensated Selling Agent is paid by the Distributor based on the net asset value of outstanding Class A Units held by investors that receive services from such Selling Agent. Class I Units are not subject to the Distribution and Servicing Fee.
The Fund is offering up to $250 million of Units on a continuous basis through the Distributor. The net asset values of each class of Units will vary over time as a result of the differing fees and expenses applicable to each class of Units and different initial offering prices and inception dates. Units may be purchased as of the first business day of each month based upon their then current net asset value per Unit. Purchase proceeds do not become the Fund’s assets until each closing date on which Units are delivered. Investors’ funds are held in escrow prior to the acceptance of orders and investment of the funds.
The Fund’s term is perpetual unless it is otherwise dissolved under the terms of its formation documents.
2. SUMMARY OF SIGNIFICANT ACCOUNTING POLICIES
The Fund meets the definition of an investment company and follows the accounting and reporting guidance as issued through the Financial Accounting Standards Board (“FASB”) Accounting Standards Codification (“ASC”) 946, Financial Services – Investment Companies.
The following is a summary of significant accounting policies followed by the Fund in the preparation of its financial statements. These policies are in conformity with accounting principles generally accepted in the United States of America (“U.S. GAAP”).
Federal Tax Information: It is the Fund’s policy to qualify as a regulated investment company (“RIC”) under Subchapter M of the Internal Revenue Code of 1986, as amended (the “Code”). The Fund’s policy is to comply with the provisions of the Code applicable to RICs and to distribute to its investors substantially all of its net investment income and net realized gain on investments, if any, earned each year. In addition, the Fund intends to distribute sufficient income and gains each year so as to not be subject to U.S. Federal excise tax on certain undistributed amounts. Accordingly, no provision for federal income or excise tax has been recorded in these financial statements.
The Fund has adopted a tax-year end of September 30. The Fund files tax returns as prescribed by the tax laws of the jurisdictions in which it operates. In the normal course of business, the Fund is subject to examination by U.S. federal, state, local and foreign jurisdictions, where applicable.
The character of distributions made during the period from net investment income or net realized gain may differ from the characterization for federal income tax purposes due to differences in the recognition of income, expense and gain or loss items for financial statement and tax purposes. Where appropriate, reclassifications between net asset accounts are made for such differences that are permanent in nature.
The cost of investments and the gross unrealized appreciation and depreciation on investments and derivatives as of September 30, 2023 are noted below.
Federal tax cost of investments and derivatives(a) | $ | 45,000,579 | ||
Gross unrealized appreciation | 5,632,776 | |||
Gross unrealized depreciation | (8,291,117 | ) | ||
Net unrealized depreciation | $ | (2,658,341 | ) |
At September 30, 2023, the Fund had accumulated capital loss carryforwards as follows:
Short-term capital loss carryforward | $ | 17,560,440 | ||
Long-term capital loss carryforward | 11,826,890 |
29
CPG Cooper Square International Equity, LLC
Notes to Financial Statements (Continued)
September 30, 2023
2. SUMMARY OF SIGNIFICANT ACCOUNTING POLICIES (continued)
There were no tax distributions paid for the tax year ended September 30, 2023. The tax character of distributions paid during the tax year ended September 30, 2022 are as follows:
Long Term Capital Gain | $ | 0 | ||
Ordinary Income | 1,146,581 |
As of September 30, 2023, the components of distributable earnings on a tax basis were as follows:
Undistributed ordinary income | $ | 0 | ||
Undistributed short-term capital gain | 0 | |||
Gross unrealized appreciation | 0 | |||
Gross unrealized depreciation | (2,400,735 | ) | ||
Accumulated capital and other losses(b) | (29,513,301 | ) | ||
Other differences | (69,576 | ) | ||
Total distributable earnings | $ | (31,983,612 | ) |
(a) | The difference between book basis and tax basis net unrealized depreciation are primarily attributable to the deferral of wash sale losses and other temporary adjustments. |
(b) | At September 30, 2023, the Fund had a qualified late-year ordinary loss deferral of $48,598 which is deemed to arise on October 1, 2023. The fund deferred $57,392 in straddle losses and $19,981 in short sale losses. |
Permanent book and tax differences, primarily attributable to net operating losses, resulted in reclassification for the tax year ended September 30, 2023 as follows:
Paid in capital | $ | (3,090,251 | ) | |
Total distributable earnings/loss | 3,090,251 |
These reclassifications had no effect on net assets.
Expenses: Unless otherwise voluntarily or contractually assumed by the Adviser or another party, the Fund bears all expenses incurred in its business, including, but not limited to, the following: all costs and expenses related to investment transactions and positions for the Fund’s account; legal fees; accounting, auditing and tax preparation fees; recordkeeping and custodial fees; costs of computing the Fund’s NAV; fees for data and software providers; research expenses; costs of insurance; registration expenses; certain offering costs; expenses of meetings of investors; directors’ fees; all costs with respect to communications to investors; transfer taxes and taxes withheld on non-U.S. dividends; interest and commitment fees on loans and debit balances; and other types of expenses as may be approved from time to time by the Board.
Cash: Cash consists of monies held at the Bank of New York Mellon (the “Custodian”), cash on deposit, and cash held at prime brokers. Such cash may exceed federally insured limits. The Fund has not experienced any losses in such accounts and does not believe it is exposed to any significant credit risk on such accounts. There are no restrictions on the cash held by the Fund.
Investment Transactions: Investment transactions are accounted for on a trade date basis. Dividend income is recorded on the ex-dividend date. Interest income, which includes accretion of discounts and amortization of premiums, is accrued and recorded on an accrual basis. Realized gains and losses from securities transactions and unrealized appreciation and depreciation of securities are determined using the specific identification method for both financial reporting and tax purposes.
30
CPG Cooper Square International Equity, LLC
Notes to Financial Statements (Continued)
September 30, 2023
2. SUMMARY OF SIGNIFICANT ACCOUNTING POLICIES (continued)
Foreign Currency: Investments and other assets and liabilities denominated in foreign currencies are translated into U.S. dollar amounts at the date of valuation. Purchases and sales of investments and income and expense items denominated in foreign currencies are translated into U.S. dollar amounts on the respective dates of such transactions. The Fund does not isolate that portion of the results of operations resulting from changes in foreign exchange rates on investments from the fluctuations arising from changes in market prices of securities held. Such fluctuations are included with the net realized and unrealized gain or loss from investments in the Statement of Operations. Reported net realized foreign exchange gains or losses arise from sales of foreign currencies, currency gains or losses realized between the trade and settlement dates on securities transactions and the difference between the amounts of dividends, interest and foreign withholding taxes recorded on the Fund’s books and the U.S. dollar equivalent of the amounts actually received or paid. Net unrealized foreign exchange gains and losses arise from changes in the fair values of assets and liabilities, other than investments at period end, resulting from changes in exchange rates.
Use of Estimates: The preparation of financial statements in conformity with U.S. GAAP requires management to make estimates and assumptions that affect the reported amounts of assets and liabilities and disclosure of contingent assets and liabilities at the date of the financial statements and the reported amounts of increases and decreases in net assets from operations during the reporting period. Actual results could differ from those estimates and such differences could be material.
Fair Value of Financial Instruments: The fair value of the Fund’s assets and liabilities which qualify as financial instruments approximates the carrying amounts presented in the Statement of Assets and Liabilities. The Fund values its investments at fair value in accordance with FASB ASC 820, Fair Value Measurement (“ASC 820”). See Note 3 for more information.
Short sales: The Fund may sell a security that it does not own in anticipation of a decline in the fair value of that security. When the Fund sells a security short, it must borrow the security sold short and deliver it to a broker-dealer through which it made the short sale. A gain, limited to the price at which the Fund sold the security short, or a loss, potentially unlimited in size, will be recognized upon the termination of a short sale. The Fund is subject to the risk that it may be unable to reacquire a security to terminate a short position except at a price substantially in excess of the last quoted price.
Class allocations: Income, common expenses and realized and unrealized gains and losses are calculated at the Fund level and allocated monthly to each class of shares based on its respective percentage of adjusted net assets at the beginning of the month.
3. PORTFOLIO VALUATION
The NAV of the Fund is calculated as of the close of business on the last business day of each calendar month, each date that Units are offered or repurchased and at such other times as the Board shall determine (each, a “Valuation Date”). In determining its NAV, the Fund values its investments as of the relevant Valuation Date. The NAV of the Fund equals, unless otherwise noted, the value of the total assets of the Fund, less all of its liabilities, including accrued fees and expenses, each determined as of the relevant Valuation Date. The NAVs of the Class A Units and Class I Units are calculated separately based on the fees and expenses applicable to each class.
The 1940 Act provides that securities for which market quotations are “readily available” must be valued at market value, and all other securities and other assets must be valued at “fair value” as determined in good faith by the Board. In accordance with Rule 2a-5 promulgated under the 1940 Act, the Board has appointed the Adviser as the Fund’s valuation designee (the “Valuation Designee”), and has assigned to the Adviser general responsibility for determining the value of the Fund’s investments. In that role, the Adviser has established a committee (the “Valuation Committee”) that oversees the valuation of the Fund’s investments pursuant to procedures adopted by the Adviser (the “Valuation Procedures”).
ASC 820 defines fair value as the value that the Fund would receive to sell an investment or pay to transfer a liability in a timely transaction with an independent buyer in the principal market, or in the absence of a principal market, the most advantageous market for the investment or liability. ASC 820 establishes a three-level hierarchy for fair value measurements based upon the transparency of inputs to the valuation of an asset or liability. Inputs may be observable or unobservable and refer broadly to the assumptions that market participants would use in pricing the asset or liability. Observable inputs
31
CPG Cooper Square International Equity, LLC
Notes to Financial Statements (Continued)
September 30, 2023
3. PORTFOLIO VALUATION (continued)
reflect the assumptions market participants would use in pricing the asset or liability based on market data obtained from sources independent of the Fund. Unobservable inputs reflect the Fund’s own assumptions about the assumptions that market participants would use in valuing the asset or liability developed based on the best information available in the circumstances. Each investment is assigned a level based upon the observation of the inputs which are significant to the overall valuation.
The three-tier hierarchy of inputs is summarized below:
● | Level 1 — unadjusted quoted prices in active markets for identical financial instruments that the reporting entity has the ability to access at the measurement date. |
● | Level 2 — inputs other than quoted prices included within Level 1 that are observable for the financial instrument, either directly or indirectly. Level 2 inputs also include quoted prices for similar assets and liabilities in active markets, and quoted prices for identical or similar assets and liabilities in markets that are not active. |
● | Level 3 — significant unobservable inputs for the financial instrument (including management’s own assumptions in determining the fair value of investments). |
Equity securities, including both long and short positions, are generally valued at the last composite close price on the Valuation Date. If an equity trades on multiple exchanges, the security will be valued at the closing price from the U.S. exchange that the security last traded on before or at the close of the Valuation Date. Publicly-traded foreign equity securities are valued at the last trade price on the securities exchange or national securities market on which such securities primarily are traded (the “primary market”) during regular trading hours on the Valuation Date. Foreign markets are monitored for significant events that occur after the markets are closed, and if there is a significant event, adjustments are made to fair value. Such securities generally are categorized as Level 1 securities, unless adjustments are made to the fair value for significant events, whereby such securities would be categorized as Level 2. If there are no such trades in the security on the Valuation Date, the security will be valued at the last bid (for long positions) or last ask (for short positions). Debt securities will generally be valued, to the extent possible by an independent pricing service who provides evaluated prices using a variety of inputs, models and assumptions. These securities will be categorized as Level 2 securities. If there is no trade or bid/ask on the previous day, the security will be fair valued. Fair valued securities will generally be categorized as Level 2 or Level 3, depending upon whether the significant inputs to the fair valuation are observable (Level 2) or unobservable (Level 3). Equity-linked instruments, such as total return swaps, are valued based on the value of the underlying reference asset(s) and the terms of the instrument (e.g., an interest rate) to approximate what the Fund would receive on a current termination of the instrument. Such reference asset(s) are valued in accordance with the applicable provisions of the Valuation Procedures. Such securities will generally be categorized as Level 2 securities.
The following table represents the inputs used to value the investments at fair value on the Statement of Assets and Liabilities within the valuation hierarchy as of September 30, 2023:
Investments in Securities at Value | Level 1 | Level 2 | Level 3 | Total | ||||||||||||
Common Stocks | $ | 41,469,654 | $ | — | $ | — | $ | 41,469,654 | ||||||||
Purchased Options | 52,888 | 137,469 | — | 190,357 | ||||||||||||
TOTAL | $ | 41,522,542 | $ | 137,469 | $ | — | $ | 41,660,011 | ||||||||
32
CPG Cooper Square International Equity, LLC
Notes to Financial Statements (Continued)
September 30, 2023
3. PORTFOLIO VALUATION (continued)
Other Financial Instruments | Level 1 | Level 2 | Level 3 | Total | ||||||||||||
Assets | ||||||||||||||||
Total Return Swap Contracts(a) | $ | — | $ | 1,940,890 | $ | — | $ | 1,940,890 | ||||||||
Liabilities | ||||||||||||||||
Securities Sold Short | ||||||||||||||||
Common Stocks | (12,662,867 | ) | — | — | (12,662,867 | ) | ||||||||||
Exchange Traded Funds | (6,823,395 | ) | — | — | (6,823,395 | ) | ||||||||||
Written Options……. | — | (27,520 | ) | (27,520 | ) | |||||||||||
Total Return Swap Contracts(a) | — | (1,287,251 | ) | — | (1,287,251 | ) | ||||||||||
TOTAL | $ | (19,486,262 | ) | $ | 626,119 | $ | — | $ | (18,860,143 | ) | ||||||
(a) | Swap contracts are reported at their unrealized appreciation/(depreciation) at measurement date, which represents the change in the contract’s value from trade date. |
The Fund did not have any securities that used significant unobservable inputs (Level 3) in determining fair value, and there were no transfers into or out of Level 3 during the period.
4. DERIVATIVE INSTRUMENTS
The Fund is permitted to enter into various types of derivative contracts. In doing so, the Fund will employ strategies in differing combinations to permit them to increase, decrease, or change the level or type of exposure to market factors. Central to those strategies are features inherent to derivatives that make them more attractive for this purpose than equity securities; they require little or no initial cash investment, they can focus exposure on only certain selected risk factors and they may not require the ultimate receipt or delivery of the underlying security (or securities) to the contract. This may allow the Fund to pursue its objective more quickly and efficiently than if it were to make direct purchases or sales of securities capable of affecting a similar response to market factors.
The Fund’s use of derivatives can result in losses due to unanticipated changes in the overall market. In instances where the Fund is using derivatives to decrease, or hedge, exposure to market risk factors for securities held by the Fund, there are also risks that those derivatives may not perform as expected resulting in losses for the combined or hedged positions.
Derivatives have little or no initial cash investment relative to their market value exposure and therefore can produce significant gains or losses in excess of their cost. This use of embedded leverage allows the Fund to increase its market value exposure relative to its net assets and can substantially increase the volatility of the Fund’s performance.
Additional associated risks from investing in derivatives also exist and potentially could have significant effects on the valuation of the derivative and the Fund. Typically, the associated risks are not the risks that the Fund is attempting to increase or decrease exposure to, per its investment objectives, but are the additional risks from investing in derivatives.
These associated risks are liquidity risk, which is the risk that the Fund will not be able to sell the derivative in the open market in a timely manner, and credit risk, which is the risk that the counterparty will not fulfill its obligation to the Fund.
Total Return Swap Contracts: Total return swaps involve commitments to pay interest in exchange for a market-linked return based on a notional amount. To the extent the total return of the security, instrument or basket of instruments underlying the transaction exceeds the offsetting interest obligation, the Fund will receive a payment from the counterparty. To the extent the total return of the security, instrument or basket of instruments underlying the transaction falls short of the offsetting interest obligation, the Fund will make a payment to the counterparty. The change in value of swap contracts outstanding, if any, is recorded as unrealized appreciation or depreciation daily. A realized gain or loss is recorded on maturity or termination of the swap contract.
33
CPG Cooper Square International Equity, LLC
Notes to Financial Statements (Continued)
September 30, 2023
4. DERIVATIVE INSTRUMENTS (continued)
The Fund’s maximum risk of loss from counterparty credit risk is the discounted net value of the cash flows to be received from/paid to the counterparty over the total return swap contract’s remaining life, to the extent that the amount is positive. This risk is mitigated by having a master netting arrangement between the Fund and the counterparty and by the posting of collateral by the counterparty to the Fund to cover the Fund’s exposure to the counterparty.
For the year ended September 30, 2023, the Fund had ending monthly average notional amounts of ($55,443,892) on total return swaps short the reference asset, and $56,934,886 on total return swaps long the reference asset. Open total return swap contracts at September 30, 2023 are listed in the Schedule of Investments.
Options Contracts — The Fund may enter into options contracts in the normal course of pursuing its investment objective. The Fund may buy or write options contracts for any number of reasons, including without limitation: to manage the Fund’s exposure to changes in securities prices caused by interest rates or market conditions and foreign currencies. The Fund may buy or write call or put options on securities, futures, swaps, swaptions, financial indices, and foreign currencies. When the Fund buys an option, a premium is paid and an asset is recorded and adjusted on a daily basis to reflect the current market value of the option purchased. When the Fund writes an option, a premium is received and a liability is recorded and adjusted on a daily basis to reflect the current market value of the option written. Premiums received from writing options that expire unexercised are treated by the Fund on the expiration date as realized gains. The difference between the premium received and the amount paid on effecting a closing purchase transaction, including brokerage commissions, is treated as realized gain or loss. If a call option is exercised, the premium is added to the proceeds from the sale of the underlying security in determining whether the Fund has a realized gain or loss. If a put option is exercised, the premium reduces the cost basis of the securities purchased by the Fund. The Fund, as writer of an option, bears the market risk of an unfavorable change in the price of the security underlying the written option. When writing options, the Fund is subject to minimal counterparty risk because the counterparty is only obligated to pay premiums and does not bear the market risk of an unfavorable market change.
The valuation of derivative instruments by risk exposure as reported within the Statement of Assets and Liabilities at September 30, 2023 was as follows:
Risk Exposure | Statement of Assets and | Fair Value | Statement of Assets and | Fair Value | ||||||
Assets: | Liabilities: | |||||||||
Market Risk (Written Options) | $ | — | Written Options, at value | $ | 27,520 | |||||
Market Risk (Total Return Swap Contracts) | Unrealized appreciation on total return swap contracts | $ | 1,940,890 | Unrealized depreciation on total return swap contracts | $ | 1,287,251 | ||||
Total | $ | 1,940,890 | $ | 1,314,771 | ||||||
34
CPG Cooper Square International Equity, LLC
Notes to Financial Statements (Continued)
September 30, 2023
4. DERIVATIVE INSTRUMENTS (continued)
For the year ended September 30, 2023, the effects of derivative instruments on the Statement of Operations were as follows:
Risk Exposure | Statement of | Realized Gain/ | Statement of | Change in | ||||||
Foreign Exchange Rate Risk (Forward Foreign Currency Contracts) | Net realized gain/(loss) from forward foreign currency contracts | $ | (9,544 | ) | Net change in unrealized appreciation/ (depreciation) on forward foreign currency contracts | — | ||||
Market (Written Options) | Net realized gain/(loss) from written options | 117,832 | Net change in unrealized appreciation/ (depreciation) on written options | $ | 24,615 | |||||
Market (Total Return Swap Contracts) | Net realized gain/(loss) from total return swaps | (6,012,888 | ) | Net change in unrealized appreciation/ (depreciation) on total return swaps | 6,375,188 | |||||
Total | $ | (5,904,600 | ) | $ | 6,399,803 | |||||
Offsetting Arrangements: Certain derivative contracts are executed under standardized master netting arrangements. A derivative netting arrangement creates an enforceable right of set-off that becomes effective, and affects the realization of settlement on individual assets, liabilities and collateral amounts, only following a specified event of default or early termination. Default events may include the failure to make payments or deliver securities timely, material adverse changes in financial condition or insolvency, the breach of minimum regulatory capital requirements, or loss of license, charter or other legal authorization necessary to perform under the contract. These agreements mitigate counterparty credit risk by providing for a single net settlement with a counterparty of all financial transactions covered by the agreement in an event of default as defined under such agreement.
35
CPG Cooper Square International Equity, LLC
Notes to Financial Statements (Continued)
September 30, 2023
4. DERIVATIVE INSTRUMENTS (continued)
The following table presents derivative financial instruments that are subject to enforceable master netting arrangements, collateral arrangements or other similar agreements as of September 30, 2023:
Offsetting of Derivative Assets & Liabilities | |||||||||||||||||||||||||
Gross Amounts Not Offset in the Statement of | |||||||||||||||||||||||||
| Counterparty | Gross Amounts | Gross Amounts | Net Position | Fair Value | Cash Collateral | Net Amount | ||||||||||||||||||
Total Return Swap Contracts | Morgan Stanley | $ | 1,649,251 | $ | (1,137,612 | ) | $ | 511,639 | $ | (511,639 | ) | $ | — | $ | — | ||||||||||
Goldman Sachs | 291,639 | (33,116 | ) | 258,523 | — | (258,523 | ) | — | |||||||||||||||||
Bank of America Merrill Lynch | — | (116,623 | ) | (116,623 | ) | — | 116,623 | — | |||||||||||||||||
Written Options | Goldman Sachs | — | (27,520 | ) | (27,520 | ) | — | — | (27,520 | ) | |||||||||||||||
TOTAL | $ | 1,940,890 | $ | (1,314,871 | ) | $ | 626,019 | $ | (511,639 | ) | $ | (141,900 | ) | $ | (27,520 | ) | |||||||||
* | These amounts are limited to the derivative asset/liability balance and, accordingly, do not include excess collateral received/pledged, which is disclosed in the Statements of Investments. |
5. RELATED PARTY TRANSACTIONS
As of September 30, 2023, the Fund had no investments that were related parties.
The Adviser provides investment advisory services to the Fund pursuant to an investment advisory agreement (the “Agreement”). Pursuant to the Agreement, the Fund pays the Adviser a fee (the “Management Fee”) computed and payable monthly in arrears, at the annual rate of 1.25% of the Fund’s net asset value. The Sub-Adviser provides sub-advisory services to the Fund pursuant to a Sub-Advisory agreement among the Sub-Adviser and Adviser and the Fund. In consideration of the sub-advisory services provided to the Fund by the Sub-Adviser, the Adviser pays the Sub-Adviser, out of the Management Fee, a fee computed and payable monthly in arrears, at the annual rate of 0.75% of the Fund’s net asset value (the “Sub-Advisory Fee”). The obligation for any payments made to the Sub-Adviser is solely the Adviser’s and not the Fund’s. For purposes of determining the Management Fee payable to the Adviser, “net asset value” means the total value of all assets of the Fund as of the end of such month, less an amount equal to all accrued debts, liabilities and obligations of the Fund as of such date, and calculated before giving effect to any repurchase of Units on such date and before any reduction for any fees (including the Distribution and Servicing Fee and the Incentive Fee (defined below)) and expenses of the Fund. The Management Fee is prorated for any period of less than a month based on the number of days in such period. During the year ended September 30, 2023, the Adviser earned $776,915 of Management Fee which is included in the Statement of Operations.
Additionally, pursuant to the Sub-Advisory Agreement, the Fund will pay the Sub-Adviser an incentive fee, calculated as 20% of the amount by which the Fund’s net profits attributable to each class of Units for all performance periods ending within or coterminous with the close of such fiscal year exceed the balance of the loss carryforward account maintained in respect of such class, without duplication for any incentive fee paid by the Fund in respect of such class during such fiscal year. The Fund also pays the Sub-Adviser the Incentive Fee in the event that a performance period ends in connection with the repurchase of Units by the Fund or a dividend or other distribution payable by the Fund, in each case on the date as of which the Fund’s NAV attributable to any class is calculated for such purpose; provided that only that portion of the Incentive Fee that is attributable to (i) the Units being repurchased (not taking into account any proceeds from any contemporaneous
36
CPG Cooper Square International Equity, LLC
Notes to Financial Statements (Continued)
September 30, 2023
5. RELATED PARTY TRANSACTIONS (continued)
issuance of Units, by reinvestment of dividends and other distributions or otherwise), or (ii) the dividend or other distribution being paid by the Fund and not being reinvested in Units of the Fund, is paid to the Sub-Adviser for such performance period. The Incentive Fee, if any, is calculated and accrued on each date that the Fund calculates its NAV.
“Performance period” means each 12-month period ending as of the Fund’s fiscal year-end (or, for the first fiscal year of the Fund, the period from the commencement of the Fund’s operations through the end of the Fund’s first fiscal year; or such other period ending as of the Fund’s fiscal year-end in the event the Fund’s fiscal year is changed); provided that the period of time from the prior performance period-end (or commencement of the Fund, as the case may be) through the valuation date of (i) a repurchase offer and (ii) a dividend or other distribution also constitutes a performance period. The Incentive Fee is payable for a performance period only if and to the extent that the Fund’s loss carryforward account has a balance of zero. The loss carryforward account is a memorandum account with respect to each class that had an initial balance of zero upon commencement of the class’s operations and, thereafter, is credited as of the end of each performance period with the amount of any net loss of the Fund attributable to such class for that performance period, and is debited with the amount of any net profits of the Fund attributable to such class for that performance period, as applicable. This is known as a “high water mark.” During the year ended September 30, 2023, the Sub-Adviser earned no Incentive Fees for Class A or Class I.
The Adviser and Sub-Adviser (together the “Advisers”) have entered into an “Expense Limitation and Reimbursement Agreement” with the Fund for a one-year term beginning on the initial Closing Date and ending on the one year anniversary thereof to limit the amount of “Specified Expenses” borne by the Fund to an amount not to exceed 0.60% per annum of the Fund’s net assets (i.e., the Expense Cap). The Expense Limitation and Reimbursement Agreement was extended through February 1, 2024. Specified Expenses means all expenses incurred by the Fund, except for: (i) the Management Fee; (ii) the Incentive Fee; (iii) any distribution or servicing fee paid with respect to certain classes of Units, including the Distribution and Servicing Fee; (iv) brokerage costs; (v) certain transaction-related expenses, including those incurred in connection with effecting short sales; (vi) interest payments; (vii) fees and expenses incurred in connection with a credit facility, if any, obtained by the Fund; (viii) taxes; and (ix) extraordinary expenses (as determined in the sole discretion of the Adviser). To the extent that Specified Expenses for a month exceed the Expense Cap, the Advisers will reimburse the Fund for expenses to the extent necessary to eliminate such excess. To the extent that the Advisers bear Specified Expenses, they are permitted to receive reimbursement for any expense amounts previously paid or borne by the Adviser, for a period not to exceed three years from the date on which such expenses were paid or borne by the Advisers, even if such reimbursement occurs after the term of the Expense Limitation and Reimbursement Agreement, provided that the Specified Expenses have fallen to a level below, and the reimbursement amount does not raise the level of Specified Expenses in the month the reimbursement is being made to a level that exceeds, the Expense Cap in place at the time such amounts were borne by the Advisers and the expense limitation in place at the time of the reimbursement, if any. During the year ended September 30, 2023, the Adviser reimbursed $679,149 to the Fund, of which $366,148 was payable as of year end.
The Adviser may recapture all or a portion of this amount prior to September, of the fiscal years stated below:
2024 | 899,149 | |||
2025 | 360,172 | |||
2026 | 679,149 | |||
Total | $ | 1,938,470 |
Each Independent Director, receives an annual retainer of $15,000 (prorated for partial years) plus a fee of $1,000 for each meeting attended and $500 for each meeting by phone. The Board Chair, Audit Committee Chair, Nominating Committee Chair and Contracts Review Committee Chair each receive an additional $2,000 annual retainer. All members of the Board are reimbursed for their reasonable out-of-pocket expenses. Total amounts expensed by the Fund related to Independent Directors for the year ended September 30, 2023 was $81,098, which is included in Directors’ and Officer Fees in the Statement of Operations.
During the year ended September 30, 2023, the Fund incurred a portion of the annual compensation of the Fund’s Chief Compliance Officer in the amount of $576, which is included in Directors’ and Officer Fees in the Statement of Operations.
37
CPG Cooper Square International Equity, LLC
Notes to Financial Statements (Continued)
September 30, 2023
5. RELATED PARTY TRANSACTIONS (continued)
Certain officers and the interested director of the Fund are also Officers of the Adviser and were registered representatives of Delaware Distributors, L.P. through September 30, 2023. The Distributor is, as of such date, an affiliate of the Adviser, both of which are indirect subsidiaries of Macquarie Management Holdings, Inc. (“Macquarie”), which is an indirect wholly-owned subsidiary of Macquarie Group.
6. ADMINISTRATION AND CUSTODIAN FEES
SS&C Technologies and its affiliates DST Asset Manager Solutions, Inc. and ALPS Fund Services, Inc. serve as administrator (the “Administrator”) to the Fund and provides certain accounting, administrative, record keeping and investor related services. For their services, the Fund pays an annual fee to the Administrator based upon average net assets, subject to certain minimums. For the year ended September 30, 2023, the total administration fees were $210,227 which is included in accounting and administration fees in the Statement of Operations.
The Bank of New York Mellon serves as the custodian of the Fund’s assets, and may maintain custody of the Fund’s assets with domestic and foreign sub-custodians. For the year ended September 30, 2023, the total custodian fees were $90,749 which is included in Custody fees in the Statement of Operations.
7. INVESTMENTS
For the year ended September 30, 2023, purchases and sales of investments, other than short sales, and short-term obligations, amounted to $46,688,550 and $47,739,283, respectively.
8. REPURCHASE OF UNITS
No investor or other person holding Units acquired from an investor has the right to require the Fund to redeem any Units. To provide a limited degree of liquidity to investors, the Fund may, from time to time, offer to repurchase Units pursuant to written tenders by investors. Repurchases will be made at such times, in such amount and on such terms as may be determined by the Board, in its sole discretion. In determining whether the Fund should offer to repurchase Units, the Board will consider the recommendations of the Adviser as to the timing of such an offer, as well as a variety of operational, business and economic factors. The Adviser anticipates that it will recommend to the Board that the Fund offer to repurchase Units from investors on a quarterly basis, with such repurchases to occur as of the last day of March, June, September and December (or, if any such date is not a business day, on the immediately preceding business day). The Adviser also expects that, generally, it will recommend to the Board that each repurchase offer should apply to up to 25% of the net assets of the Fund. In certain circumstances, however, the Board may determine not to conduct a repurchase offer, or to conduct a repurchase offer of more or less than 25% of the Fund’s net assets. Each repurchase offer will generally commence approximately 30 days prior to the applicable repurchase date.
9. INDEMNIFICATION
Under the Fund’s organizational documents, its Officers and Directors are indemnified against certain liabilities arising out of the performance of their duties to the Fund. In addition, in the ordinary course of business, the Fund may enter into contracts or agreements that contain indemnification or warranties. The Fund’s maximum exposure under these arrangements is unknown, as this would involve future claims that may be made against the Fund that have not yet occurred. However, based on experience, the Fund expects the risk of loss to be remote.
10. SUBSEQUENT EVENTS
Subsequent to September 30, 2023, the Adviser paid the Fund for the total amount of Due from Adviser in the Statement of Assets and Liabilities.
Management has determined that no other material events or transactions occurred subsequent to September 30, 2023, that would require recognition or disclosure in the Fund’s financial statements.
38
CPG Cooper Square International Equity, LLC
Other Information (Unaudited)
September 30, 2023
Investment Advisor
In the Fund’s semi-annual report for the period ended March 31, 2023, the Fund disclosed that it intended to transfer the Adviser’s investment advisory business to CPG Fund Advisers (“CFA”). Management has determined not to proceed with the transfer at this time.
Proxy Voting
A description of the policies and procedures that the Fund uses to determine how to vote proxies relating to portfolio securities and information regarding how the Fund voted proxies relating to portfolio securities for the period from the Fund’s commencement through June 30 are available without charge, upon request, by calling (collect) 1-212-317-9200 and on the SEC’s website at http://www.sec.gov.
The Fund’s Form N-PX filing is available: (i) without charge, upon request, by calling the Fund (collect) at 1-212-317-9200 or (ii) by visiting the SEC’s website at http://www.sec.gov.
Availability of Quarterly Portfolio Schedules
Disclosure of Portfolio Holdings: The Fund files its complete schedule of portfolio holdings with the Securities and Exchange Commission (the “SEC”) no more than 60 days after the Fund’s first and third fiscal quarters of each fiscal year on Form N-PORT. For the Fund, this would be for the fiscal quarters ending December 31 and June 30. The Fund’s Form N-PORT filings can be found free of charge on the SEC’s website at http://www.sec.gov.
Management Discussion of Fund Performance
How did the Fund perform?
For the period from October 1, 2022 through September 30, 2023, the Fund returned -2.72% for Class A and -2.01% for Class I, underperforming both the HFRI Equity Hedge (Total) Index and MSCI ACWI ex-US Index, which returned 9.14% and 20.39%, respectively, over the same period. The Fund’s net asset value per share as of September 30, 2023 was $10.01 for Class A and $13.64 for Class I versus $10.29 and $13.92, respectively, on September 30, 2022.
What is the Fund’s investment approach?
The Fund’s investment objective is to seek to achieve maximum total return. The Fund seeks to achieve its investment objective by investing primarily in equity securities of non-U.S.-domiciled issuers, including those domiciled in emerging markets. Under normal circumstances, the Fund invests at least 80% of its net assets, plus any borrowings for investment purposes, in equity securities. For purposes of the Fund’s investment program, “equity securities” means common and preferred stocks (including investments in initial public offerings or “IPOs”), convertible securities, warrants and rights. The Fund may invest in equity securities without restriction as to market capitalization.
The Sub-Adviser’s approach involves taking long and short positions in equity securities—namely, investing long on the basis of extensive research and fundamental analysis, and seeking to take opportunistic advantage of market inefficiencies by selling other securities short. The majority of the Fund’s long exposure will be in growth companies with high returns on capital and high barriers to competition that the Sub-Adviser believes are trading at a discount to their intrinsic value. The Sub-Adviser invests in a majority of these companies with an expectation of a multi-year holding period. The Fund’s long exposure also will include investments in more opportunistic situations that may be held for a multi-quarter, rather than multi-year, time frame. In the short portfolio, the Sub-Adviser will attempt to identify companies that are exposed to ongoing competitive pressures with poor returns on capital and deteriorating fundamentals. The short positions generally are not selected as direct hedges to the long positions. Under extraordinary circumstances, the Fund may acquire substantial stakes in public companies; however, the Fund generally will not invest more than 10% of its net asset value (measured at the time of purchase) in the voting securities of any one investment. The Sub-Adviser may seek to obtain exposure to particular issuers or securities through derivative transactions, including, without limitation, swaps (including total return swaps), contracts for differences (“CFDs”), options and other types of derivative arrangements for investment or hedging purposes.
39
CPG Cooper Square International Equity, LLC
Other Information (Unaudited) (Continued)
September 30, 2023
What influenced the Fund’s performance?
(10/1/22 – 12/31/22)
For the fourth quarter ended December 31, 2022, the Fund returned +6.6% and +6.8% net (Class A and Class I, respectively) with an average net exposure of 79%. Over the same period, the HFRI Equity Hedge Index returned +4.3% and the MSCI ACWI ex US Index returned +14.3%.
In the fourth quarter, the Fund’s top three contributors were longs and together contributed approximately +500 bps to gross performance. Top contributors included AIA Group, CTS Eventim, and JD.com. The top three detractors in the fourth quarter, two of which were shorts, detracted approximately -260 bps from gross performance. Top detractors included an Industrials Short, Fidelity National Information Services and a Financials short.
(1/1/23 – 3/31/23)
For the first quarter ended March 31, 2023, the Fund returned +5.4% and +5.6% net (Class A and Class I, respectively) with an average net exposure of 80%. Over the same period, the HFRI Equity Hedge Index returned +2.5% and the MSCI ACWI ex US Index returned +6.9%.
2023 started off on a positive note. Rapid Chinese economic reopening and moderating inflation data drove non-US equities higher and fueled speculation that interest rates might peak lower and earlier than expected. Geopolitical developments were more mixed. Warm weather helped the European Union through its first winter without access to Russian natural gas, but this was offset by a bloody stalemate in Ukraine and worsening US/China tensions. March failures in the US regional banking system provided the latest evidence that the scale and speed of central bank tightening threatens to break parts of the real economy. Against this backdrop, international markets performed well, as did Cooper Square’s long positions. It was a volatile quarter with big swings in monthly returns. However, based on business operating momentum, the message was clear: The majority of our long portfolio holdings outperformed both their management teams’ and our own expectations in the fourth quarter of 2022, and this positive trend has continued into 2023.
In the first quarter, the Fund’s top three contributors were longs and together contributed approximately +320 bps to gross performance. Top contributors included CRH, Sensata Technologies and SAP. The top three detractors in the first quarter, two of which were shorts, detracted approximately -197 bps from gross performance. Top detractors included JD.com, an Industrials Short and a Consumer Discretionary short
(4/1/23 – 6/30/23)
For the second quarter ended June 30, 2023, the Fund returned +0.1% and +0.3% net (Class A and Class I, respectively) with an average net exposure of 67%. Over the same period, the HFRI Equity Hedge Index returned +3.0% and the MSCI ACWI ex US Index returned +2.4%.
The MSCI ACWI ex US Index returned +2.4% in the second quarter, bringing its year-to-date gain to +9.5%. This reflects a significant shift in consensus views. Six months ago, it was assumed that a return to 2% inflation in the US and Europe would require central banks to raise interest rates so aggressively as to trigger a steep recession. Today, we believe equity markets are discounting a much more benign outlook—led by the US—with policy rates peaking sooner and at lower levels. Year-over-year (YoY) headline Consumer Price Index inflation trended down in all major developed markets, culminating in June readings of 3.0% in the US, 5.5% in the eurozone, 7.9% in the UK (stubbornly high but still falling) and 3.3% in Japan. Markets were further heartened by the fact that the monetary tightening required to bring about this disinflation has not (so far, at least) materially dented economic momentum. Since the start of the year, the consensus estimate for 2023 world GDP growth has increased from 2.1% to 2.6% with upward revisions in the US, eurozone and UK. In addition, unemployment has remained remarkably low in our opinion everywhere. Finally, notwithstanding the brief “coup” in Russia, it was a relatively calm quarter on the geopolitical front. The war in Ukraine has evolved into a hard-fought battle over inches, tragic for human life but in our opinion stable in terms of wider economic impact. Meanwhile, US/China relations remain frayed, but the recent pace of ministerial and bureaucratic contact suggests that guardrails to this vital relationship are at least being maintained.
40
CPG Cooper Square International Equity, LLC
Other Information (Unaudited) (Continued)
September 30, 2023
In the second quarter, the Fund’s top three contributors were longs and together contributed approximately +200 bps to gross performance. Top contributors included Dechra Pharmaceuticals, Alcon Inc, and Edenred. The top three detractors in the second quarter were longs and detracted approximately -270bps from gross performance. Top detractors included JD.com, Revvity and Treasury Wine Estates.
(7/1/23 – 9/30/23)
For the third quarter ended September 30, 2023, the Fund returned -13.5% and -13.3% net (Class A and Class I, respectively) with an average net exposure of 80%. Over the same period, the HFRI Equity Hedge Index returned -1.0% and the MSCI ACWI ex US Index returned -3.8%.
Third quarter performance was poor and disappointing. Particularly after a difficult 2021 and 2022, this year has extended a challenging period for our style of investing. We expect this to change, mostly because of the portfolio’s extremely attractive valuation discount against a backdrop of rising earnings. We believe the portfolio trades at a near 50% discount to our estimate of intrinsic value today. The opportunity to own what we believe are some of the best businesses in the world at such attractive valuations is unusual in our multi-decade careers as international investors. While the length of the recent underperformance has been surprising to us, historically, the portfolio has generally performed well following the rare moments during which it has reached similarly wide discounts.
In the third quarter, the Fund’s top three contributors were two longs and one short and together contributed approximately +60 bps to gross performance. Top contributors included Treasury Wine Estates Limited, a Healthcare short and Universal Music Group. The top three detractors in the third quarter were longs and detracted approximately -290 bps from gross performance. Top detractors included AIA Group, Ltd., Adyen and Sensata Technologies.
The information contained in this Discussion of Fund Performance reflects the views of the Adviser and/or Sub-Adviser or their respective affiliates and sources it believes are reliable. Neither the Adviser nor Sub-Adviser makes any representations or warranties concerning the accuracy of any data. There is no guarantee that any projection, forecast or opinion in this material will be realized. Past performance does not guarantee future results. The views expressed herein may change at any time. This Discussion of Fund Performance is for informational purposes only and does not constitute investment advice. This information should not be construed as sales or marketing material or an offer or solicitation for the purchase or sale of any security, financial instrument, product or service.
Performance Illustration: Comparison of the Change in Value of a
$50,000 Investment in the Fund and Indices
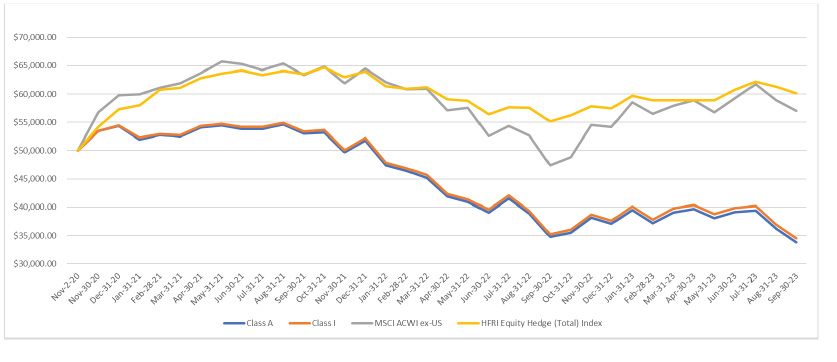
41
CPG Cooper Square International Equity, LLC
Other Information (Unaudited) (Continued)
September 30, 2023
| Trailing 1-Yr | Trailing 5-Yr | Trailing 10-Yr | ITD - Annualized | ||||||||||||
Class A | -2.75 | % | NA | NA | -12.53 | % | ||||||||||
Class I | -2.02 | % | NA | NA | -11.91 | % | ||||||||||
MSCI ACWI ex-US | 20.39 | % | NA | NA | 4.62 | % | ||||||||||
HFRI Equity Hedge (Total) Index | 9.14 | % | NA | NA | 6.55 | % | ||||||||||
The performance illustration above assumes the reinvestment of all dividend and capital gain distributions, if any, and represents past performance, which is not a guarantee of future results. The returns shown do not reflect taxes that an investor would pay on Fund distributions or on the redemption of Fund shares. The investment return and principal value of an investment will fluctuate and, therefore, an investor’s shares, if redeemed, may be worth more or less than their original cost.
Fund returns are estimated, unaudited, and presented net of annual: management fee (1.25%), expenses (capped at 0.60%), incentive fee (20%) and, for Class A, an annual distribution/servicing fee (0.75%). Returns do not account for an upfront placement fee which, if charged, would reduce returns. Fund returns reflect an operating expense cap from the Fund’s inception. If the cap were not in place, returns would be lower. Past returns may have been generated during positive market conditions and should not be expected in the future. Indices are included to show general trend in markets and not intended to imply that past performance was comparable to indices either in composition or risk. See the information below regarding the indices presented.
HFRI Equity Hedge Index: Investment Managers who maintain positions both long and short in primarily equity and equity derivative securities. A wide variety of investment processes can be employed to arrive at an investment decision, including both quantitative and fundamental techniques; strategies can be broadly diversified or narrowly focused on specific sectors and can range broadly in terms of levels of net exposure, leverage employed, holding period, concentrations of market capitalizations and valuation ranges of typical portfolios. Managers would typically maintain at least 50% exposure to, and may in some cases be entirely invested in, equities, both long & short.
MSCI ACWI ex US: Captures large and mid-cap representation across 22 of 23 developed markets and 24 emerging markets countries. With 2,273 constituents, the index covers approximately 85% of the global investable equity opportunity set.
42
CPG Cooper Square International Equity, LLC
Principal Risk Factors (Unaudited)
September 30, 2023
General Risks
Investment Risk. All investments risk the loss of capital. An investment in the Fund involves a high degree of risk, including the risk that the Investor’s entire investment may be lost. The value of the Fund’s assets should be expected to fluctuate. To the extent that the Fund’s portfolio is concentrated in securities of a single issuer or issuers in a single sector, the risk of any investment decision is increased. The Fund’s use of leverage is likely to cause the Fund’s assets to appreciate or depreciate at a greater rate than if leverage were not used. In addition, the Fund’s use of leverage, short sales or derivative transactions can result in significant losses to the Fund.
No assurance can be given that the Fund’s investment objective will be achieved. The Fund’s performance depends upon the Sub-Adviser’s selection of investments and the performance of the investments. The identification of investment opportunities is a difficult task, and there can be no assurance that such opportunities will be successfully recognized. While the Sub-Adviser endeavors to achieve the Fund’s investment objective, there can be no assurance that the Fund will not incur losses. The value of the Fund’s investments can be reduced by risks arising from national or international economic conditions, volatility in the global equity, currency, real estate and fixed-income markets, shifts in macro-economic fundamentals, the risks of short sales, the risks of leverage, the potential illiquidity of securities and derivative instruments, the risk of loss from counterparty defaults and the risk of borrowing to meet withdrawal requests, as well as acts of God, uninsurable losses, war, terrorism, earthquakes, pandemics, hurricanes or floods and other factors which are beyond the control of the Fund. No assurance can be given that: (i) the Fund’s investment program, strategy, decisions and activities will be successful; (ii) the Fund will achieve its return expectations; (iii) the Fund will achieve any return of capital invested; or (iv) Investors will not suffer losses from an investment in the Fund. The Fund’s results may vary substantially over time.
Market Risk. Market risks, including political, regulatory, market, economic and social developments, and developments that impact specific economic sectors, industries or segments of the market, can affect the value and liquidity of the Fund’s investments. In addition, turbulence and reduced liquidity in financial markets may negatively affect issuers, which could adversely affect the Fund. Global economies and financial markets are becoming increasingly interconnected, and conditions and events in one country, region or market may adversely impact issuers in a different country, region or market. These risks may be magnified if certain events or developments adversely interrupt the global supply chain, and could affect companies worldwide. Recent examples include: pandemic risks related to COVID-19 and the aggressive measures taken in response by governments and businesses; geopolitical consequences arising from Russia’s invasion of Ukraine; and economic consequences occasioned by fiscal tightening, widespread inflation and attempts to contain it, and possible recession in various countries.
In addition, legal and regulatory changes effected in response to the COVID-19 pandemic, or other significant events, could adversely affect the Fund and its ability to execute its investment strategy. For example, certain European jurisdictions, including Austria, Belgium, France, Greece, Italy and Spain, enacted temporary short sale bans in 2020 in an attempt to stabilize financial markets and maintain investor confidence.
Unspecified Investments; Dependence on the Sub-Adviser. The Sub-Adviser has complete discretion to select investments as opportunities arise. The Fund, and, accordingly, Investors, must rely upon the ability of the Sub-Adviser to identify and implement investments consistent with the Fund’s investment objective. Investors will not receive or otherwise be privy to due diligence or risk information prepared by or for the Sub-Adviser. The Sub-Adviser has the authority and responsibility for asset allocation, the selection of Fund’s investments and all other investment decisions for the Fund. The success of the Fund depends upon the ability of the Sub-Adviser to develop and implement an investment strategy that achieves the investment objective of the Fund. Investors will have no right or power to participate in the management or control of the Fund, or the terms of any such investments. There can be no assurance that the Sub-Adviser will be able to select or implement successful strategies or that the Fund will be able to achieve its investment objective.
Limitations on Transferability; Units Not Listed; No Market for Units. The transferability of Units is subject to certain restrictions contained in the LLC Agreement, as amended or supplemented, and is affected by restrictions imposed under applicable securities laws. Units are not traded on any securities exchange or any public or other market. No market currently exists for Class A or Class I Units, and it is not anticipated that a market will develop. Although the Adviser and
43
CPG Cooper Square International Equity, LLC
Principal Risk Factors (Unaudited) (Continued)
September 30, 2023
the Fund expect to recommend to the Board that the Fund offer to repurchase up to 25% of the net assets of the Fund quarterly, no assurances can be given that the Fund will do so. Consequently, Class A and Class I Units should only be acquired by Investors able to commit their funds for an indefinite period of time.
Closed-End Fund; Liquidity Risks. The Fund is a non-diversified, closed-end management investment company designed for long-term Investors. An Investor should not invest in the Fund if the Investor needs a liquid investment. Closed-end funds differ from open-end management investment companies (commonly known as mutual funds) in that investors in a closed-end fund do not have the right to redeem their units on a daily basis at a price based on net asset value. Units in the Fund are not traded on any securities exchange or other market and are subject to substantial restrictions on transferability. Although the Fund may offer to repurchase Units from time to time, an Investor may not be able to redeem its Units in the Fund for a substantial period of time.
Legal and Regulatory Risks. Legal and regulatory changes that could occur during the life of the Fund may adversely impact the performance of the Fund. The regulation of the U.S. and non-U.S. securities and futures markets and investment funds has undergone substantial change in recent years and such change may continue. Greater regulatory scrutiny may increase the exposure of the Fund, the Adviser and the Sub-Adviser to potential liabilities. Increased regulatory oversight also can impose administrative burdens and costs on the Fund, the Adviser and the Sub-Adviser, including, without limitation, responding to examinations or investigations and implementing new policies and procedures.
The Dodd-Frank Wall Street Reform and Consumer Protection Act (the “Dodd-Frank Act”) and related regulatory developments established financial oversight standards and resulted in significant revisions to the U.S. financial regulatory framework and the operation of financial institutions. The Dodd-Frank Act includes provisions regarding, among other things, the comprehensive regulation of the over-the-counter derivatives market, the identification, monitoring and regulation of systemic risks to financial markets and the regulation of proprietary trading and investment activity of banking institutions. The continued implementation of the Dodd-Frank Act and other similar and follow-on regulations could affect, among other things, financial consumer protection, proprietary trading, registration of investment advisers and the trading and use of derivative instruments and, therefore, could adversely affect the Fund or investments made by the Fund. There can be no assurance that such regulation will not have a material adverse effect on the Fund, increase transaction, operations, legal and/or regulatory compliance costs, significantly reduce the profitability of the Fund or impair the ability of the Fund to achieve its investment objective.
Effective August 19, 2022, the Fund began complying with Rule 18f-4 under the 1940 Act, which permits, among others, closed-end funds such as the Fund to enter into certain derivatives transactions notwithstanding the prohibitions and restrictions on the issuance of senior securities under Section 18 of the 1940 Act, provided that the closed-end fund complies with the conditions of the rule, including establishing a comprehensive derivatives risk management program and complying with certain value-at- risk leverage limits, requirements and compliance and disclosure obligations, subject to certain exceptions. Compliance with Rule 18f-4 by the Fund could, among other things, make derivatives more costly, or limit their availability or utility, or otherwise adversely affect the Fund’s performance.
As of the date hereof, there is uncertainty with respect to legislation, regulation and government policy at the federal, state and local levels, notably as respects U.S. trade, fiscal, tax, healthcare, immigration, foreign and government regulatory policy. Recent events have created a climate of heightened uncertainty and introduced difficult-to-quantify macroeconomic and geopolitical risks with potentially far-reaching implications. There has been a corresponding meaningful increase in the uncertainty surrounding interest rates, tax rates, inflation, foreign exchange rates, trade volumes, trade wars and fiscal and monetary policy. To the extent the U.S. Congress or Biden administration implements additional changes to U.S. policy, those changes may impact, among other things, the U.S. and global economy, international trade and relations, unemployment, immigration, healthcare, the U.S. regulatory environment and inflation, among other areas. Until any additional policy changes are finalized, it cannot be known whether the Fund and its investments or future investments may be positively or negatively affected, or the impact of continuing uncertainty.
Fees and Expenses. An Investor in the Fund will bear a portion of the Management Fee, Incentive Fee (if any), Distribution and Servicing Fee (if applicable) and other expenses of the Fund. The fees and expenses of the Fund disclosed in the fee table in “Summary of Fund Expenses” illustrate the expenses and fees that the Fund expects to incur and that Investors can expect to bear, directly or indirectly, by investing in the Fund.
44
CPG Cooper Square International Equity, LLC
Principal Risk Factors (Unaudited) (Continued)
September 30, 2023
Non-Diversified Status. The Fund is a “non-diversified” management investment company for purposes of the 1940 Act, which means it is not subject to percentage limitations under the 1940 Act on assets that may be invested in the securities of any one issuer. As a result, the Fund’s net asset value may be subject to greater volatility than that of an investment company that is subject to diversification limitations. The Fund generally will not, however, invest more than 10% of its net asset value (measured at the time of purchase) in the voting securities of any one investment.
Reporting Requirements. Investors who beneficially own Units that constitute more than 5% or 10% of the Fund’s Units are subject to certain requirements under the Exchange Act and the rules promulgated thereunder. These include requirements to file certain reports with the SEC. The Fund has no obligation to file such reports on behalf of such Investors or to notify Investors that such reports are required to be made. Investors who may be subject to such requirements should consult with their legal advisors.
Investment Strategy-Related Risks
Certain of the principal risks of the Fund’s investment strategy are set forth below. Depending on economic and market conditions other risks may be present.
Non-U.S. Investments. The Fund invests primarily in equity securities of non-U.S.-domiciled issuers. Non-U.S. securities in which the Fund invests may be listed on non-U.S. securities exchanges, traded in non-U.S. over-the-counter markets or purchased in private placements and not be publicly traded. These investments involve special risks not usually associated with investing in securities of U.S. companies or U.S. federal, state or local governments.
The securities markets of foreign countries generally are less regulated than U.S. securities markets. Some foreign securities markets have a higher potential for price volatility and relative illiquidity compared to the U.S. securities markets. In addition, because there is less publicly available information about foreign companies, and because many non-U.S. entities are not subject to uniform accounting, auditing and financial reporting standards, practices and requirements comparable to those of U.S. companies, it may be difficult to analyze and compare such foreign company’s performance.
Although the Fund may invest portions of its assets in non-U.S. equity or fixed-income instruments or in instruments denominated in non-U.S. currencies, the Fund will value its securities and other assets in U.S. dollars. The Fund may or may not seek to hedge all or any portion of their foreign currency exposure.
Following is a discussion of some of the more significant risks generally associated with investing in non-U.S. securities:
Non-U.S. Currencies. The Fund may make direct and indirect investments in a number of different currencies. In addition, the Fund will hold funds in bank deposits in non-U.S. dollar currencies. As a result, the Fund may be affected favorably or unfavorably by changes in currency rates and in exchange control regulations, and may incur transaction costs in connection with conversions between various currencies. Any returns on, and the value of the Fund’s investments, may be materially affected by exchange rate fluctuations, local exchange control, limited liquidity of the relevant foreign exchange markets, the convertibility of the currencies in question and/or other factors.
The Fund may, but is not required to, hedge its exposure to fluctuations in the non-U.S. currency exchange rates. The Sub-Adviser may seek to hedge the Fund’s foreign currency exposure by investing in currencies, currency futures contracts and options on currency futures contracts, spot and forward currency exchange contracts, swaps, swaptions or any combination thereof (whether or not exchange traded), but there can be no assurance that these strategies will be effective, and such techniques entail costs and additional risks. If the Fund were to enter into hedging transactions, it may not participate fully in any currency gains that would otherwise be attributable to any appreciation of the foreign currencies. To the extent unhedged, the value of the Fund’s assets will fluctuate with U.S. dollar exchange rates, as well as the price changes of the Fund’s investments in the various local markets and currencies. Among the factors that may affect currency values are trade balances, the level of short-term interest rates, differences in relative values of similar assets in different currencies, long-term opportunities for investment and capital appreciation and political developments. An increase in the value of the U.S. dollar compared to the other currencies in which the Fund makes its investments will reduce the effect of increases,
45
CPG Cooper Square International Equity, LLC
Principal Risk Factors (Unaudited) (Continued)
September 30, 2023
and magnify the effect of decreases, in the prices of the Fund’s securities in their local markets. The Fund could realize a net loss on an investment, even if there were a gain on the underlying investment before currency losses were taken into account.
Characteristics of Non-U.S. Securities Markets. The Fund may buy and sell securities on the principal stock exchange or over-the-counter market of foreign countries. Many foreign stock markets are not as developed or efficient as those in the U.S., and they may be more volatile. Generally, there is less government supervision and regulation of non-U.S. exchanges, brokers and listed companies than in the U.S. Furthermore, trading volumes in non-U.S. markets are usually lower than in U.S. markets, resulting in reduced liquidity and potentially rapid and erratic price fluctuations. Commissions for trades on foreign stock exchanges and custody expenses generally are higher than those in the U.S. Settlement practices for transactions in foreign markets may involve delays beyond periods customary in the United States, possibly requiring the Fund to borrow funds or securities to satisfy its obligations arising out of other transactions. In addition, there could be more “failed settlements,” which can result in losses to the Fund.
Less Company Information and Regulation. Generally, there is less publicly available information about foreign companies than about U.S. companies. This may make it more difficult for the Fund to stay informed of corporate action that may affect the price of a particular security. Further, many foreign countries lack uniform accounting, auditing and financial reporting standards, practices and requirements. These factors can make it difficult to analyze and compare the performance of non-U.S. companies.
Political and Economic Instability. Because of volatile internal political environments, less stable monetary systems and/or external political risks, among other factors, many non-U.S. economies are less stable than the U.S. economy. Some foreign governments participate in their economies through ownership or regulation in ways that can have a significant effect on the prices of securities. Some economies depend heavily on international trade and can be adversely affected by trade barriers or changes in the economic conditions of their trading partners. In addition, some countries face the risk of expropriation or confiscatory taxation, political, economic or social instability, limitation on the removal of funds or other assets or the repatriation of profits, restrictions on investment opportunities, the imposition of trading controls, withholding or other taxes on interest, capital gain or other income, import duties or other protectionist measures, various laws enacted for the protection of creditors, greater risks of nationalization or diplomatic developments which could adversely affect the Fund’s investments in those countries.
Emerging Markets. Emerging market countries have economic structures that generally are less diverse and mature, and political systems that are less stable, than those of developed countries. Emerging markets may be more volatile than the markets of more mature economies. Many emerging countries providing investment opportunities for the Fund have experienced substantial, and in some periods extremely high, rates of inflation for many years, and resulting sharp, sustained declines in the value of their currencies and securities markets. Inflation and rapid fluctuations in inflation rates have had and may continue to have adverse effects on the economies and securities markets of certain of these countries. Many issuers in these countries and the countries themselves have defaulted on their obligations. Additional risks relevant to emerging markets may include: greater dependence on exports and the corresponding importance of international trade; more extensive controls on foreign investment and limitations on repatriation of invested capital; increased likelihood of governmental involvement in, and control over, the economies; decisions by the government to cease support of economic reform programs or to impose restrictions; and less established laws and regulations regarding fiduciary duties of officers and directors and protection of investors.
Withholding Taxes. Income and gains derived by the Fund may be subject to withholding and other taxes, which would reduce net proceeds.
“Short Squeeze.” The Fund could be caught in a “short squeeze” specific to certain non-U.S. markets. Equities issued by foreign issuers generally are subject to being recalled if loaned by a lender pursuant to a stock lending program. In addition, there are certain equities that will be recalled, generally twice a year on the last trade date prior to the record date, on which date the owners of the security must own the equity of record. A “short squeeze” is a speculative trading strategy that is sometimes observed when a security has been heavily sold short. Speculators start acquiring the security, driving up its price. As the price rises, short sellers have to post additional collateral for their borrowed securities, thereby putting pressure on those who have sold the security short. Investors who have sold the security short close out their positions.
46
CPG Cooper Square International Equity, LLC
Principal Risk Factors (Unaudited) (Continued)
September 30, 2023
By purchasing the securities, those who are closing their short positions drive the price higher, putting even more pressure on the remaining short sellers. To the extent that the Fund has sold short a security that is being recalled in the period immediately preceding the last trade date prior to the record date, there is a risk that the Fund could be caught in such a “short squeeze,” possibly preventing the Fund from unwinding its position without incurring significant losses. There is no assurance that the Fund will be able to liquidate a short position at a reasonable price if caught in a short squeeze.
Foreign Exchange. The Fund may engage in foreign-exchange transactions in the spot and, to a limited degree, forward markets. A forward currency exchange contract involves an obligation to purchase or sell a specific currency at a future date, which may be any fixed number of days from the date of the contract as agreed by the parties, at a price that is fixed at the time the contract is entered into. In addition, the Fund may maintain short positions in forward currency exchange transactions, in which the Fund agrees to exchange a specified amount of a currency it does not currently own for another currency at a future date in anticipation of a decline in the value of the currency sold relative to the value of the currency the Fund agreed to purchase. A forward currency exchange contract offers less protection against defaults by the counterparty than exchange-traded currency futures contracts do. Forward currency exchange contracts also are highly leveraged. The Fund also may purchase and sell put and call options on currencies and currency futures contracts and options on currency futures contracts.
Geographic and Sector Focus. While, as of the date hereof, the Fund does not intend to focus on any particular country, geographic region or sector, implementation of the Fund’s investment strategy may, during certain periods, result in the investment of a significant portion of the Fund’s assets in a particular country or geographic region, such as Europe, or sector, such as information technology or industrials. Investments in the same countries or geographic regions may constrain the liquidity and the number of issues available for investment by the Fund, and may cause the Fund to be disproportionately exposed to the risks associated with the country or region of concentration. Investments in the same sector may be affected similarly by economic, regulatory, political or market events or conditions, which may make the Fund more vulnerable to unfavorable developments in that sector than funds that invest more broadly. As a result, the Fund may be subject to greater investment risk and volatility, and more susceptible to risk of loss, than if investments had been made in issuers in a broader range of countries, geographic regions or sectors.
Investing in Europe. Ongoing concerns regarding the economies of certain European countries and/or their sovereign debt, as well as the possibility that one or more countries might leave the European Union (the “EU”), create certain risks for investing in the EU.
A number of countries in Europe have experienced severe economic and financial difficulties. Many non-governmental issuers, and even certain governments, have defaulted on, or been forced to restructure, their debts. Many other issuers have faced difficulties obtaining credit or refinancing existing obligations. Financial institutions have in many cases required government or central bank support, have needed to raise capital, and/or have been impaired in their ability to extend credit; and financial markets in Europe and elsewhere have experienced significant volatility and declines in asset values and liquidity. These difficulties may continue, worsen or spread within and outside of Europe. Responses to the financial problems by European governments, central banks and others, including austerity measures and reforms, may not be effective, may result in social unrest and may limit future growth and economic recovery or have other unintended consequences. Further defaults or restructurings by governments and others of outstanding debt could have additional adverse effects on economies, financial markets, issuers and asset valuations around the world.
In June 2016, voters within the United Kingdom (the “UK”) participated in a national referendum and voted in favor of leaving the EU (known as “Brexit”). On March 29, 2017, the UK triggered the withdrawal procedures in Article 50 of the Treaty of Lisbon which provided for a two-year negotiation period between the EU and the UK. Accordingly, it initially was anticipated that the UK would cease to be a member of the EU by the end of March 2019; however, this was subsequently extended to January 31, 2020. Following such date, the UK ceased to be a member of the EU and the EU-UK Withdrawal Agreement came into force. In December 2020, the UK and the EU reached a post-Brexit trade and cooperation agreement, which went into effect on January 1, 2021. Brexit is widely expected to have consequences that are both profound and uncertain for the economic and political future of the UK and the EU, and those consequences include significant legal and business uncertainties. The full scope and nature of the potential political, regulatory, economic and market consequences are not known at this time and are unlikely to be known for a significant period of time; however, they could be significant, potentially resulting in a period of instability and market volatility. It is not possible to ascertain the precise impact these
47
CPG Cooper Square International Equity, LLC
Principal Risk Factors (Unaudited) (Continued)
September 30, 2023
events may have on the Fund or its investments from an economic, financial, tax or regulatory perspective, but any such impact could have material consequences for the Fund and its investments, regardless as to whether the Fund invests in securities of issuers located in Europe or has significant exposure to European issuers or countries. Unforeseen geopolitical events, such as Russia’s large-scale invasion of Ukraine in February 2022, have dramatically affected markets and prospects world-wide. The extent and duration of this military action, resulting sanctions and resulting future market disruptions are impossible to predict, but should be expected to be significant. Any such disruptions caused by Russian military action or other actions (including cyberattacks and espionage) or resulting actual and threatened responses to such activity, including purchasing and financing restrictions, boycotts or changes in consumer or purchaser preferences, sanctions, tariffs or cyberattacks on Russian entities or individuals could have a severe adverse effect on the region, and on others around the world, including significant negative impacts on the economies and the markets for certain securities and commodities, such as oil and natural gas, as well as other sectors. How long such military action and related events will last cannot be predicted. These and any related events could have significant impact on Fund performance and the value of the investments in the Fund.
Investing in the Information Technology Sector. Certain technology companies may have limited product lines, markets or financial resources, or may depend on a limited management group. In addition, such companies are strongly affected by the volatile technology market, worldwide technological developments and advancements, government regulation, rapidly changing market conditions, new competing products and companies, changing consumer and business preferences and short product life cycles. The products manufactured and services offered by technology companies may not be economically successful, or may quickly become outdated.
Companies in the information technology sector are subject to various risks, including the risk that new services, equipment or technologies will not be accepted by consumers and businesses or will become rapidly obsolete. Performance of such companies may be affected by factors such as obtaining and protecting patents, or the failure to do so, and significant competitive pressures, including aggressive pricing of their products or services, new market entrants, competition for market share and short product cycles due to an accelerated rate of technological developments. These competitive pressures may have an adverse effect on earnings and profit margins, and may lead to technologies and products that ultimately fail. As a result, the securities of information technology companies tend to exhibit a greater degree of market risk and sharp price fluctuations than other types of securities, especially over the short term. These securities may fall in and out of favor with investors rapidly, which may cause sudden selling and dramatically lower market prices.
Investing in the Industrials Sector. The value of companies in the industrials sector may be adversely affected by supply and demand related to their specific products or services and industrials sector products in general, as well as liability for environmental damage and product liability claims and government regulations. For example, the products of manufacturing companies may face obsolescence due to rapid technological developments and frequent new product introduction. Certain companies within this sector, particularly aerospace and defense companies, may be heavily affected by government spending policies because companies involved in this industry rely, to a significant extent, on government demand for their products and services, and, therefore, the financial condition of, and investor interest in, these companies are significantly influenced by governmental defense spending policies, which are typically under pressure from efforts to control the U.S. and other government budgets. In addition, securities of industrials companies in transportation may be cyclical and have occasional sharp price movements which may result from economic changes, fuel prices, labor relations and insurance costs. In certain countries, other companies in the industrials sector may also be subject to significant government regulation and oversight, which may adversely affect their businesses.
Equity Securities. The Fund primarily invests in equity securities, which, for these purposes, means common and preferred stocks (including investments in IPOs), convertible securities, warrants and rights. As a result, the value of the Fund’s portfolio will be affected by daily movements in the prices of equity securities. These price movements may result from factors affecting individual companies, industries or the securities markets as a whole. Individual companies may report poor results or be negatively affected by industry, regulatory or economic trends and developments. The prices of securities issued by such companies may suffer a decline in response. In addition, stock markets can be volatile at times, and stock prices can change drastically. This market risk will affect the Fund’s net asset value per Unit, which will fluctuate as the values of the Fund’s investments and other assets change. Not all stock prices change uniformly or at the same time, and not all stock markets move in the same direction at the same time.
48
CPG Cooper Square International Equity, LLC
Principal Risk Factors (Unaudited) (Continued)
September 30, 2023
Convertible securities also carry unique risks. The value of a convertible security is a function of its “investment value” (determined by its yield in comparison with the yields of other securities of comparable maturity and quality that do not have a conversion privilege) and its “conversion value” (the security’s worth, at market value, if converted into the underlying common stock). The investment value of a convertible security, therefore, is influenced by changes in interest rates, with investment value declining as interest rates increase and increasing as interest rates decline. The credit standing of the issuer and other factors may also have an effect on the convertible security’s investment value. The conversion value of a convertible security is determined by the market price of the underlying common stock. If the conversion value is low relative to the investment value, the price of the convertible security is governed principally by its investment value. Generally, the conversion value decreases as the convertible security approaches maturity. To the extent the market price of the underlying common stock approaches or exceeds the conversion price, the price of the convertible security is increasingly influenced by its conversion value. A convertible security generally sells at a premium over its conversion value by the extent to which investors place value on the right to acquire the underlying common stock while holding a fixed-income or preferred security, as applicable.
A convertible security may be subject to redemption at the option of the issuer at a price established in the convertible security’s governing instrument. If a convertible security held by the Fund is called for redemption, the Fund will be required to permit the issuer to redeem the security, convert it into the underlying common stock or sell it to a third party. Any of these actions could have an adverse effect on the Fund’s ability to achieve its investment objective.
Warrants permit, but do not require, the holder to subscribe for other securities or commodities. Rights are similar to warrants, but typically have a shorter duration and are offered or distributed to shareholders of a company. Warrants and rights may be considered more speculative than certain other types of equity-like securities because they do not carry with them rights to dividends or voting rights, and they do not represent any rights in the assets of the issuer. If not exercised prior to their expiration dates, these instruments will lose their value. The market for warrants and rights can become very illiquid. Changes in liquidity may significantly impact the price for warrants and rights, which could decrease the value of the Fund’s portfolio.
Small-and Medium-Capitalization Companies. The Fund may invest a substantial portion of its assets in the securities of companies with small-to medium-sized market capitalizations. While such securities may provide significant potential for appreciation, the securities of certain companies, particularly smaller-capitalization companies, may involve higher risks than do investments in securities of larger companies. For example, prices of small-capitalization and even medium-capitalization securities are often more volatile than prices of large-capitalization securities, as they typically are traded in lower volume and the issuers typically are more subject to changes in earnings and prospects, and the risk of bankruptcy or insolvency is higher than for larger, “blue-chip” companies. In addition, an investment in some small-capitalization companies may be relatively illiquid due to thin trading in their securities.
IPO Securities. Special risks are associated with investments in IPO securities, including lack of a trading history, lack of knowledge about the issuer and limited operating history. These factors may contribute to substantial price volatility for the shares of these companies, and this volatility can affect the value of the Fund’s investment in these shares. The limited number of shares available for trading in some initial public offerings may make it more difficult for the Fund to buy or sell significant amounts of shares without an unfavorable effect on prevailing market prices. In addition, some companies in initial public offerings may be involved in relatively new industries or businesses, which may not be widely understood by investors. Some of these companies may be undercapitalized or regarded as developmental stage companies, without revenues or operating income, or close to achieving revenues or operating income.
Short Sales. The Fund engages in short sales in pursuit of its investment objective and in connection with executing its investment strategy. The Sub-Adviser seeks to take opportunistic advantage of market inefficiencies by selling securities short.
To effect a short sale, the Fund will borrow a security from a brokerage firm, or other permissible financial intermediary, to make delivery to the buyer, with an obligation to replace the borrowed securities at a later date. The Fund then is obligated to replace the borrowed security by purchasing it at the market price at the time of replacement. Short-selling allows an investor to profit from declines in market prices to the extent such declines exceed the transaction costs and the costs of borrowing the securities. In certain circumstances, these techniques can substantially increase the impact of adverse price
49
CPG Cooper Square International Equity, LLC
Principal Risk Factors (Unaudited) (Continued)
September 30, 2023
movements on the Fund’s portfolio. A short sale of a security involves the theoretical risk of an unlimited increase in the market price of the security, which could result in an inability to cover the short position and thus a theoretically unlimited loss. There can be no assurance that the securities necessary to cover a short position will be available for purchase. Purchasing securities to close out the short position can itself cause the price of the securities to rise further, thereby exacerbating the loss.
Short selling is a speculative investment technique that involves expenses to the Fund and the following additional risks:
● | The Fund may not be able to close out a short position at any particular time or at the desired price. |
● | The Fund may be subject to a “short squeeze” when other short sellers desire to replace a borrowed security at the same time as the Fund, thus increasing the price the Fund may have to pay for the security and causing the Fund to incur losses on the position. |
● | If the market for smaller capitalization or foreign companies becomes illiquid, the Fund may be unable to obtain securities to cover short positions. |
● | Certain foreign markets may limit the Fund’s ability to short stocks. |
● | Certain foreign exchanges may suspend the limits on short sellers. |
Short sale transactions have been subject to increased regulatory scrutiny, including the imposition of restrictions on short selling certain securities and reporting requirements. The Fund’s ability to execute short sales may be materially adversely impacted by rules, interpretations, prohibitions and restrictions on short selling activity imposed by regulatory authorities, including the SEC, its foreign counterparts, other government authorities or self-regulatory organizations. These rules, interpretations, prohibitions and restrictions may be imposed with little or no advance notice, and may impact prior trading activities of the Fund. Additionally, traditional lenders of securities might be less likely to lend securities under certain market conditions. As a result, the Fund may not be able to effectively pursue a short selling strategy due to a limited supply of securities available for borrowing.
In connection with short selling, the Fund may be required to comply with the requirements of Rule 18f-4, which may limit its ability to sell securities short.
Certain European jurisdictions, including Austria, Belgium, France, Greece, Italy and Spain, enacted temporary short sale bans in 2020 in response to the COVID-19 pandemic. While the SEC did not take similar action in response to the pandemic, it temporarily banned short selling in the stocks of numerous financial services companies, and promulgated new disclosure requirements with respect to short positions held by investment managers, in September 2008 in response to the global financial crisis. Certain international regulatory bodies, including the UK’s Financial Services Authority, also promulgated restrictions on short selling in 2008. While these measures have all since expired, similar restrictions and/or additional disclosure requirements may be promulgated at any time, especially during periods of financial crisis and market turmoil, and could adversely affect the Fund and its ability to execute its investment strategy.
Leverage and Borrowing. The Fund’s investment program makes frequent use of leverage by using net short proceeds to purchase securities or borrowing money, subject to the limits of the Asset Coverage Requirement and the requirements of Rule 18f-4, for investment purposes, to satisfy repurchase requests from Investors and to otherwise provide the Fund with liquidity. The practice of leveraging by borrowing money is speculative and involves certain risks. Because short sales involve borrowing securities and then selling them, the Fund’s short sales have the additional effect of leveraging the Fund’s assets.
The Fund also may use leverage in the form of loans for borrowed money (e.g., margin loans) or in the form of derivative instruments, such as options, futures, forward contracts, swaps and repurchase agreements. The use of leverage by the Fund can substantially increase the market exposure (and market risk) to which the Fund’s portfolio may be subject. Trading on leverage will result in interest charges or costs, which may be substantial. The level of interest rates generally, and the rates at which the Fund can leverage in particular, can affect the operating results of the Fund.
50
CPG Cooper Square International Equity, LLC
Principal Risk Factors (Unaudited) (Continued)
September 30, 2023
The Fund’s use of short-term margin borrowings, repurchase agreements, derivatives and other instruments may present additional risks. For example, if the value of securities pledged to brokers to secure the Fund’s margin accounts declines, the Fund might be subject to a “margin call,” pursuant to which the Fund would be required either to deposit additional funds with the broker or liquidate the pledged securities to compensate for the decline in value. If a counterparty determines that the value of the collateral has decreased, the counterparty may initiate a margin call or other payment obligation and require the Fund to either post additional collateral to cover such decrease or repay a portion of the outstanding borrowing. Additionally, to obtain cash to satisfy a margin call, the Fund may be required to liquidate assets at a disadvantageous time, which could cause it to incur further losses. In the event of a sudden drop in the value of the Fund’s assets, the Fund might not be able to liquidate assets quickly enough to pay off its margin debt.
In the U.S. futures markets, margin deposits are typically required. These deposits may range from 1% to 15% of the value of the futures contracts being purchased or sold. With respect to other derivative markets, margin deposits may be lower or may not be required at all. Such low margin deposits indicate that any trading in these markets typically is accompanied by a high degree of leverage.
A relatively small adverse price movement in a futures or forward contract may result in immediate and substantial losses to the investor where low margin deposits exist.
There are no margin requirements in connection with purchases of options, because the option premium is paid for in full. The premiums for certain options traded on foreign exchanges may be paid for on margin. When the Fund sells an option on a futures contract, it may be required to deposit margin in an amount that may be determined by the margin requirement established for the futures contract underlying the option and, in addition, an amount substantially equal to the current premium for the option. The margin requirements imposed on the writing of options can be higher than those imposed when dealing in the futures markets directly. Whether any margin deposit will be required for over-the- counter options and other over-the-counter instruments, such as currency forwards, swaps and certain other derivative instruments, will depend on the credit determinations and specific agreements of the parties to the transaction, which are individually negotiated.
The Fund’s Use of Derivatives Involves Risk. The Fund may invest in, or enter into, derivatives, including swaps (including total return swaps), swaptions, CFDs, futures and forward agreements and options, for investment or hedging purposes. To date, the Fund has obtained considerable market exposure, and expects to continue to do so, by using total return swaps. A total return swap is an agreement between counterparties to exchange periodic payments based on the value of asset or non-asset references. Total return swap contracts are exposed to the market risk factor of the specific underlying financial instrument or index. Total return swaps are less standard in structure than other types of swaps and can isolate and/or include multiple types of market risk factors including equity risk, credit risk, and interest rate risk. The Fund could be exposed to credit or market risk due to unfavorable changes in the fluctuation of interest rates or in the price of the underlying security or index, the possibility that there is no liquid market for these agreements or that the counterparty may default on its obligation to perform.
The use of these instruments involves the following risks, among others:
● | Derivatives can be volatile. |
● | Derivatives may entail investment exposures that are greater than their cost would suggest, meaning that a small investment in derivatives could have a large impact on the Fund’s performance. |
● | The market for any derivative is, or suddenly can become, illiquid. Changes in liquidity may result in significant, rapid and unpredictable changes in the prices for derivatives. |
● | Entering into derivatives in foreign markets may involve more risk than entering into domestic transactions. |
● | Certain derivatives, such as swaps, involve the assumption of the credit risk of the counterparty to the transactions. |
The stability and liquidity of derivatives depend in large part on the creditworthiness of the parties to the transactions. It is expected that the Sub-Adviser will monitor on an ongoing basis the creditworthiness of firms with which it will enter into derivatives. If there is a default by the counterparty to such transaction, the Sub-Adviser will under most normal
51
CPG Cooper Square International Equity, LLC
Principal Risk Factors (Unaudited) (Continued)
September 30, 2023
circumstances have contractual remedies pursuant to the agreements related to the transaction. However, exercising such contractual rights may involve delays or costs that could result in the net asset value of the Fund being less than if the Sub- Adviser had not entered into the transaction. Furthermore, there is a risk that a counterparty could become insolvent. If the Sub-Adviser’s counterparties (e.g., prime broker or broker-dealer) were to become insolvent or the subject of liquidation proceedings, there exists the risk that the recovery of securities and other assets from such prime broker or broker-dealer will be delayed or will be of a value less than the value of the securities or assets originally entrusted to such prime broker or broker-dealer.
In addition, the Sub-Adviser may use counterparties located in various jurisdictions. Such local counterparties are subject to various laws and regulations in various jurisdictions that are designed to protect their customers in the event of their insolvency. However, the practical effect of these laws and their application to the Fund’s assets are subject to substantial limitations and uncertainties.
Repurchase Agreements and Reverse Repurchase Agreements. The Fund may enter into repurchase agreements and reverse repurchase agreements. For the purposes of maintaining liquidity and achieving income, the Fund may enter into repurchase agreements with domestic and foreign banks, registered broker-dealers or other appropriate counterparties. A repurchase agreement is a contract under which the Fund would acquire a security for a relatively short period subject to the obligation of the seller to repurchase and the Fund to resell such security at a fixed time and price (representing the Fund’s cost plus interest). In the case of repurchase agreements with broker-dealers, the value of the underlying securities (or collateral) will be at least equal at all times to the total amount of the repurchase obligation, including the interest factor. The Fund bears a risk of loss in the event that the other party to a repurchase agreement defaults on its obligations and the Fund is delayed or prevented from exercising its rights to dispose of the collateral securities. This risk includes the risk of procedural costs or delays in addition to a loss on the securities if their value should fall below their repurchase price. If the seller under the repurchase agreement becomes insolvent or otherwise fails to repurchase the securities, the Fund would be permitted to sell the securities. However, this right to sell may be restricted, or the value of the securities may decline before the securities can be liquidated. Repurchase agreements that are subject to foreign law may not enjoy protections comparable to those provided to certain repurchase agreements under U.S. bankruptcy law, and they therefore may involve greater risks.
The Fund may enter into reverse repurchase agreements. A reverse repurchase agreement involves the sale of a security by the Fund and its agreement to repurchase the instrument at a specified time and price. A counterparty to a reverse repurchase agreement may be unable or unwilling to complete the transaction as scheduled, which may result in losses to the Fund. Reverse repurchase agreements may be considered forms of borrowing for some purposes.
Credit Risk. Certain of the markets in which the Fund effects its transactions are over-the-counter or “interdealer” markets. The participants in such markets typically are not subject to credit evaluation and regulatory oversight as are members of “exchange based” markets. To the extent the Fund invests in swaps, derivative or synthetic instruments, or other over-the-counter transactions, on these markets, the Fund may take a credit risk with regard to parties with whom it trades and may also bear the risk of settlement default. These risks may differ materially from those entailed in exchange-traded transactions, which generally are backed by clearing organization guarantees, daily marking-to-market and settlement, and segregation and minimum capital requirements applicable to intermediaries. Transactions entered into directly between two counterparties generally do not benefit from such protections. This exposes the Fund to the risk that a counterparty will not settle a transaction in accordance with its terms and conditions because of a dispute over the terms of the contract (whether or not bona fide) or because of a credit or liquidity problem, thus causing the Fund to suffer a loss. Such “counterparty risk” is accentuated for contracts with longer maturities where events may intervene to prevent settlement, or where the Fund has concentrated its transactions with a single or small group of counterparties. The Fund is not restricted from dealing with any particular counterparty or from concentrating any or all of their transactions with one counterparty. The ability of the Fund to transact business with any one or number of counterparties, the lack of any independent evaluation of such counterparties’ financial capabilities and the absence of a regulated market to facilitate settlement may increase the potential for losses.
Bonds and Other Fixed-Income Securities. The Fund may invest in bonds and other fixed- income securities, and may take short positions in these securities. The Sub-Adviser will invest in these securities when it believes such securities offer opportunities for capital appreciation (or capital depreciation in the case of short positions) and also may invest in
52
CPG Cooper Square International Equity, LLC
Principal Risk Factors (Unaudited) (Continued)
September 30, 2023
these securities for temporary defensive purposes and to maintain liquidity. Fixed-income securities include, among other securities: bonds, notes and debentures issued by corporations; debt securities issued or guaranteed by governments; municipal securities; and mortgage-backed and asset-backed securities. Certain securities in which the Fund may invest, such as those with interest rates that fluctuate directly or indirectly based on multiples of a stated index, are designed to be highly sensitive to changes in interest rates and can subject the holders thereof to significant reductions of yield and possible loss of principal. These securities may pay fixed, variable or floating rates of interest, and may include zero coupon obligations. Fixed-income securities are subject to the risk of the issuer’s inability to meet principal and interest payments on its obligations (i.e., credit risk) and are subject to price volatility resulting from, among other things, interest rate sensitivity, market perception of the creditworthiness of the issuer and general market liquidity (i.e., market risk).
Dislocations in the fixed-income sector and weaknesses in the broader financial market could adversely affect the Fund. As a result of such dislocations, the Fund may face increased borrowing costs, reduced liquidity and reductions in the value of its investments. One or more of the counterparties providing financing for the Fund’s portfolio could be affected by financial market weaknesses, and may be unwilling or unable to provide financing. As a result, the Fund may be unable to fully finance its investments and operations. This risk would be exacerbated if a substantial portion of the Fund’s financing is provided by a relatively small number of counterparties. If one or more major market participants fail or withdraw from the market, it could negatively affect the marketability of all fixed- income securities and this could reduce the value of the securities in the Fund’s portfolio, thereby reducing the Fund’s net asset value. Furthermore, if one or more counterparties are unwilling or unable to provide ongoing financing, the Fund could be forced to sell its investments at a time when prices are depressed.
Restricted and Illiquid Investments. Although the Fund will invest primarily in publicly-traded securities, the Fund may from time to time invest in securities and other financial instruments or obligations for which little or no market exists, restricted securities and other investments that are illiquid. Restricted securities are securities that may not be sold to the public without an effective registration statement under the Securities Act of 1933, as amended (the “1933 Act”), or, if they are unregistered, may be sold only in a privately negotiated transaction or pursuant to an exemption from registration under the 1933 Act.
Where registration is required to sell a security, the Fund may be obligated to pay all or part of the registration expenses, and a considerable period may elapse between the decision to sell and the time the Fund may be permitted to sell a security under an effective registration statement. If during such a period adverse market conditions were to develop, the Fund might obtain a less favorable price than the prevailing price when it decided to sell. The Fund may be unable to sell restricted and other illiquid securities at the most opportune times or at prices approximating the value at which they purchased such securities. The Fund’s portfolio may include a number of investments for which no market exists and which have substantial restrictions on transferability.
PIPEs. The Fund may invest in private investment in public equities (“PIPEs”) and other unregistered or otherwise restricted securities. The Fund expects most such private securities to be liquid within six to nine months of funding, but may also invest in other private securities with significantly longer or shorter restricted periods. PIPEs involve the direct placement of equity securities to a purchaser such as the Fund. Equity issued in this manner is often unregistered and therefore less liquid than equity issued through a public offering. Such private equity offerings provide issuers greater flexibility in structure and timing as compared to public offerings.
Cash, Cash Equivalents, Investment Grade Bonds, Money Market Instruments. The Fund may invest a portion of its assets in high quality fixed-income securities, money market instruments and money market mutual funds, or hold cash or cash equivalents in such amounts as the Sub-Adviser deems appropriate under the circumstances, including in response to adverse market or economic or political conditions, pending the investment of assets in accordance with its investment strategy or to maintain the liquidity necessary to effect repurchases of Units or meet expenses, subject to the Fund’s policy to invest at least 80% of its net assets, plus any borrowings for investment purposes, in equity securities. In addition, when the Sub-Adviser determines that adverse market conditions exist, the Fund may adopt a temporary defensive position and invest up to 100% of its assets in such securities. During such periods, the Fund may not achieve its investment objective.
53
CPG Cooper Square International Equity, LLC
Principal Risk Factors (Unaudited) (Continued)
September 30, 2023
These investments may be adversely affected by tax, legislative, regulatory, credit, political or government changes, interest rate increases and the financial conditions of issuers, which may pose credit risks that result in issuer default and the Fund may not achieve its investment objective.
Registered Investment Companies. The Fund may invest in the securities of other registered investment companies for cash management purposes. Under one provision of the 1940 Act, the Fund may not acquire the securities of other registered investment companies if, as a result, (i) more than 10% of the Fund’s total assets would be invested in securities of other registered investment companies, (ii) such purchase would result in more than 3% of the total outstanding voting securities of any one registered investment company being held by the Fund or (iii) more than 5% of the Fund’s total assets would be invested in any one registered investment company. Other provisions of the 1940 Act are less restrictive provided that the Fund is able to meet certain conditions. The Fund, as a holder of the securities of other investment companies, will bear its pro rata portion of the other investment companies’ expenses, including advisory fees. These expenses will be in addition to the direct expenses incurred by the Fund.
Active Management Risk. The Fund’s investment program emphasizes active management of the Fund’s portfolio. Consequently, the Fund’s portfolio turnover and brokerage commission expenses may exceed those of other investment companies. A high portfolio turnover rate (i.e., 100% or higher) may also result in the greater realization of capital gains, including short-term gains which are taxable to Investors at the same rates as ordinary income.
Other Risks
The Incentive Fee. The Incentive Fee may create an incentive for the Sub-Adviser to cause the Fund to make investments that are riskier or more speculative than in the absence of the Incentive Fee. The Incentive Fee is based on both realized as well as unrealized appreciation; therefore, the Incentive Fee may be greater than if it were based only on realized gains.
The Incentive Fee, if any, is calculated and accrued on each date that the Fund calculates its net asset value, thereby reducing the net asset value of the Fund and the Units. The repurchase price received by an Investor whose Units are repurchased in a repurchase offer will reflect an Incentive Fee accrual if the Fund has experienced positive performance through the date of repurchase. However, the Fund will not accrue an Incentive Fee for any period unless it has fully recovered any cumulative losses from prior fiscal periods. This is known as a “high water mark.” An Incentive Fee accrual may subsequently be reversed if the Fund’s performance declines. No adjustment to a repurchase price will be made after it has been determined.
When Units are repurchased in a repurchase offer, or the Fund pays a dividend or a distribution, the amount of any cumulative loss will be reduced in proportion to the reduction in the Fund’s assets paid in respect of such repurchase or in respect of such dividend or distribution. The amount of any cumulative loss incurred by the Fund, however, will not be increased by any sales of Units (including Units issued as a result of the reinvestment of dividends and distributions). Consequently, as the number of outstanding Units increases, the per-Unit amount (but not the dollar amount) of a cumulative loss will be reduced. As a result, if an Investor does not reinvest its distributions, the benefits that such Investor would receive from a cumulative loss (if any) will be diluted. This means that an Investor’s investment may bear a higher percentage Incentive Fee than it otherwise would.
The application of the Incentive Fee may not correspond to a particular Investor’s experience in the Fund because aggregate cumulative appreciation is calculated on an overall basis allocated equally to each outstanding Unit. An Investor may not owe an Incentive Fee on its investment, even though the value of its investment has increased. For example, if an Investor were to acquire Units after the Fund’s trading resulted in a cumulative loss, the Investor would not owe an Incentive Fee until sufficient gains have been achieved to exceed such losses, despite the fact that the Investor will have experienced aggregate cumulative appreciation in respect of its Units. Conversely, an Investor may owe an Incentive Fee on its investment, even though the value of its investment has declined. For example, if an Investor were to acquire Units at a time when the Fund had net profits to date for the Performance Period of $2 million in excess of the high water mark, but at the end of the Performance Period the Fund had net profits of only $1 million in excess of the high water mark, the Investor would owe an Incentive Fee despite the fact that the value of its investment declined. In addition, when Units are issued at a net asset value reduced by the accrued Incentive Fee, and such accrued Incentive Fee is subsequently
54
CPG Cooper Square International Equity, LLC
Principal Risk Factors (Unaudited) (Continued)
September 30, 2023
reversed due to trading losses, the reversal will be allocated equally among all outstanding Units (increasing the net asset value per Unit), including those Units whose purchase price had not itself been reduced by the accrued Incentive Fee being reversed.
Inadequate Return. No assurance can be given that the returns on the Fund’s investments will be proportionate to the risk of investment in the Fund. Potential Investors should not commit money to the Fund unless they have the resources to sustain the loss of their entire investment.
Inside Information. From time to time, the Fund or its affiliates may come into possession of material, non-public information concerning an entity or issuer in which the Fund has invested or may invest. The possession of such information may limit the Fund’s ability to buy or sell securities of the issuer.
Recourse to the Fund’s Assets. The Fund’s assets, including any investments made by the Fund, are available to satisfy all liabilities and other obligations of the Fund. If the Fund becomes subject to a liability, parties seeking to have the liability satisfied may have recourse to the Fund’s assets generally and not be limited to any particular asset, such as the asset representing the investment giving rise to the liability.
Possible Exclusion of Investors Based on Certain Detrimental Effects. The Fund may repurchase, outside of the repurchase procedure described under the caption “Repurchases of Units and Transfers— Repurchases of Units,” Units held by an Investor or other person acquiring Units from or through an Investor, if: (i) the Units have been transferred or have vested in any person other than by operation of law as the result of the death, bankruptcy, insolvency, adjudicated incompetence or dissolution of the Investor; (ii) the Investor or other person is not an Eligible Investor; (iii) ownership of the Units by the
Investor or other person is likely to cause the Fund to be in violation of, require registration of any Units under, or subject the Fund to additional registration or regulation under, the securities, commodities or other laws of the United States or any other relevant jurisdiction; (iv) continued ownership of the Units by the Investor or other person may be harmful or injurious to the business or reputation of the Fund, or may subject the Fund or any Investor to an undue risk of adverse tax or other consequences or restrictions; (v) any of the representations and warranties made by the Investor or other person in connection with the acquisition of the Units was not true when made or has ceased to be true; (vi) the Investor is likely to be subject to additional regulatory or compliance requirements under special laws or regulations by virtue of continuing to hold the Units; (vii) the Investor’s investment balance falls below $25,000; or (viii) the Board determines that it would be in the best interests of the Fund. These provisions may, in effect, deprive an Investor in the Fund of an opportunity for a return that might be received by other Investors.
Selling Agent Risk. When a limited number of Selling Agents represents a large percentage of Investors, actions recommended by Selling Agents may result in significant and undesirable variability in terms of Investor subscription or tender activity. Additionally, it is possible that if a matter is put to a vote at a meeting of Investors, clients of a single Selling Agent may vote as a block, if so recommended by the Selling Agent.
Tax Risks. Special tax risks are associated with an investment in the Fund. The Fund has elected, and intends to continue to qualify, to be treated as a RIC under Subchapter M of the Code. As such, the Fund must satisfy, among other requirements, certain ongoing asset diversification, source-of- income and annual distribution requirements. See “Certain U.S. Federal Income Tax Considerations— Taxation of the Fund.”
If, before the end of any quarter of its taxable year, the Fund believes that it may fail the asset diversification requirement of RIC qualification, the Fund may seek to take certain actions to avert such a failure. The Fund may try to acquire additional investments or dispose of non-diversified assets to bring the Fund into compliance with the asset diversification test. Relevant tax provisions afford the Fund a 30- day period after the end of the relevant quarter in which to cure a diversification failure by disposing of non-diversified assets. In certain cases, the Fund may be afforded a longer cure period under applicable savings provisions. However, the Fund may be subject to a penalty tax in connection with its use of those savings provisions. If the Fund fails to satisfy the asset diversification test or other RIC requirements, it may fail to qualify as a RIC under Subchapter M of the Code. If the Fund fails to qualify as a RIC, the Fund would become subject to a corporate-level U.S. federal income tax (and any applicable U.S. state and local taxes) and distributions (including
55
CPG Cooper Square International Equity, LLC
Principal Risk Factors (Unaudited) (Continued)
September 30, 2023
distributions of net capital gain) to Investors would be taxable as dividend income to the extent of the Fund’s current and accumulated earnings and profits, and would not be deductible to the Fund. Accordingly, disqualification as a RIC may have a material adverse effect on the value of the Units and the amount of the Fund’s distributions.
Under the DRIP, an Investor’s dividends and capital gain distributions paid by the Fund are automatically reinvested in additional Units unless the Investor “opts out.” Investors may opt out initially, and thereafter may change their election at any time, by contacting the Administrator. If an Investor participates in the DRIP, that Investor will be deemed to have received, and for U.S. federal income tax purposes will be taxed on, the amount reinvested in Units to the extent the amount reinvested was not a tax-free return of capital. As a result, an Investor may have to use funds from other sources to pay U.S. federal income tax liability on the value of the Units received. Even if an Investor does not participate in the DRIP, the Fund will have the ability to declare a large portion of a dividend in Units instead of in cash, for example, to satisfy the Annual Distribution Requirement (as defined below). As long as a portion of this dividend is paid in cash and certain requirements are met, the entire distribution will be treated as a dividend for U.S. federal income tax purposes. As a result, an Investor generally would be subject to tax on 100% of the fair market value of the dividend on the date the dividend is received by the Investor in the same manner as a cash dividend, even though most of the dividend was paid in Units.
For U.S. federal income tax purposes, the Fund generally will be required to include in income certain amounts that the Fund has not yet received in cash, such as original issue discount (“OID”), which may arise, for example, if the Fund receives warrants in connection with the making of a loan or “payment-in-kind” interest representing contractual interest added to the loan principal balance and due at the end of the loan term. This OID or “payment-in-kind” interest is included in the Fund’s income before the Fund receives any corresponding cash payments. The Fund also may be required to include in income certain other amounts that it will not receive in cash, such as amounts attributable to certain hedging and foreign currency transactions. Since, in certain cases, the Fund may recognize income before or without receiving cash in respect of this income, the Fund may have difficulty meeting the Annual Distribution Requirement. Accordingly, the Fund may have to sell some of its investments at times that are not advantageous or reduce new investments to meet these distribution requirements. If the Fund is not able to obtain cash from other sources, it may fail to qualify as a RIC and thus be subject to additional corporate-level income taxes. This failure could have a material adverse effect on the Fund and on any investment in Units. See “Certain U.S. Federal Income Tax Considerations—Taxation of the Fund.”
The Fund may retain some income and capital gains in the future, which amounts may be subject to the 4% U.S. federal excise tax. In that event, the Fund will be liable for the tax on the amount by which the Fund does not meet the foregoing distribution requirement.
Any non-U.S. entities in or through which the Fund invests may be subject to non-U.S. withholding and other taxes. Further, adverse U.S. tax consequences can be associated with certain foreign investments, including potential U.S. withholding on foreign investment entities with respect to their U.S. investments.
Changes in Tax Laws Governing IRAs. A change in the current tax laws under the Code or other applicable tax rules governing IRAs and their investments (including, without limitation, Code provisions governing the maximum contributions that may be made to IRAs, the types of investments that IRAs may hold, the maximum amount that may be invested in IRAs and/or the annual minimum required distributions that an IRA must make) could result in adverse consequences for IRA investors (and their owners and beneficiaries). These changes could include, for example, a prohibition on IRA investors holding investments such as the Fund (i.e., investments that require representations that the IRA investor has a specified minimum amount of income or assets) and a limitation on the aggregate investments that an IRA may hold, which could cause an IRA to lose its tax-exempt status if it is unable to divest from the necessary investments to satisfy any such rules and/or be exposed to penalties for failure to comply with such rules. By investing in the Fund, an IRA will be deemed to represent and warrant that it expressly understands that a Unit generally is non-transferable and may not be tendered, transferred or otherwise disposed of except as permitted under and in accordance with the LLC Agreement, and that there can be no assurance that the IRA will be able to timely tender, transfer or otherwise dispose of Units in the event of any changes in the law to avoid adverse consequences (and that neither the Fund nor the Adviser is under any obligation, whether express or implied, to assist or otherwise accommodate such tender, transfer or disposition or mitigate any adverse consequences to the IRA investor or its owners or beneficiaries).
56
CPG Cooper Square International Equity, LLC
Principal Risk Factors (Unaudited) (Continued)
September 30, 2023
Cybersecurity Risk. The Fund and its service providers are susceptible to operational and information security and related risks of cybersecurity incidents. In general, cyber-incidents can result from deliberate attacks or unintentional events. Cybersecurity attacks include, but are not limited to, gaining unauthorized access to digital systems (e.g., through “hacking” or malicious software coding) for purposes of misappropriating assets or sensitive information, corrupting data or causing operational disruption. Cyber-attacks also may be carried out in a manner that does not require gaining unauthorized access, such as causing denial-of-service attacks on websites (i.e., efforts to make services unavailable to intended users). Cybersecurity incidents affecting the Adviser, Sub-Adviser, Administrator, Distributor, Selling Agents, the Fund’s custodian or other service providers have the ability to cause: (i) disruptions and impact business operations, potentially resulting in financial losses; (ii) interference with the Fund’s ability to calculate its net asset value; (iii) the inability of Investors to transact business with the Fund; (iv) violations of applicable privacy, data security or other laws; (v) regulatory fines and penalties; (vi) reputational damage; (vii) reimbursement or other compensation or remediation costs; (viii) legal fees; or (ix) additional compliance costs. Similar adverse consequences could result from cybersecurity incidents affecting governmental and other regulatory authorities, exchange and other financial market operators, banks, brokers, dealers, insurance companies and other financial institutions and other parties. While information risk management systems and business continuity plans have been developed that are designed to reduce the risks associated with cybersecurity, there are inherent limitations in any cybersecurity risk management system or business continuity plan, including the possibility that certain risks have not been identified.
57
CPG Cooper Square International Equity, LLC
Fund Management (Unaudited)
September 30, 2023
Board members of the Fund, together with information as to their positions with the Fund, principal occupations and other board memberships for the past five years, are shown below.
Four of the Directors are not “interested persons” (as defined in the Investment Company Act) of the Fund (collectively, the “Independent Directors”).
The Fund’s Statement of Additional Information includes additional information about Directors of the Fund and is available, without charge, upon calling the Fund at 212-317-9200.
Name, Age, Address and | Term of | Principal Occupation(s) | Number of | Other |
INDEPENDENT DIRECTORS | ||||
Joan Shapiro Green (79) | Term - Indefinite Length - Since Inception | Board Director (2014-present); Executive Director of National Council of Jewish Women New York (2007-2014); Executive Director of New York Society of Securities Analysts (2004-2006) | 10 | None |
Kristen M. Leopold (56) c/o Central Park Group, LLC New York, NY 10019 | Term - Indefinite Length - Since Inception | Independent Consultant to Hedge Funds (2007 - present); Chief Financial Officer of Weston Capital Management, LLC (investment managers) (1997-2006) | 10 | Blackstone Alternative Investment Funds (1 portfolio) (March 2013- present); Blackstone Alternative Alpha Fund; Blackstone Alternative Alpha Fund II; Blackstone Alternative Alpha Master Fund; Blackstone Alternative Multi-Manager Fund (2012- August 2021); Constitution Capital Access Fund, LLC (October 2022 - Present) |
Janet L. Schinderman (72) c/o Central Park Group, LLC 125 W 55th Street | Term - Indefinite Length -Since Inception | Self-Employed Educational Consultant since 2006; Associate Dean for Special Projects and Secretary to the Board of Overseers, Columbia Business School of Columbia University (1990-2006) | 10 | Advantage Advisers Xanthus Fund, L.L.C. |
58
CPG Cooper Square International Equity, LLC
Fund Management (Unaudited) (Continued)
September 30, 2023
Name, Age, Address and | Term of | Principal Occupation(s) | Number of | Other |
INDEPENDENT DIRECTORS (CONTINUED) | ||||
Sharon J, Weinberg (64) c/o Central Park Group, LLC 125 W 55th Street | Term - Indefinite Length - Since Inception | Owner, the Chatham Bookstore (March 2021 – present); Co-Founder, Blue Leaf Ventures (investing/consulting) (2018-present); Managing Director, New York Ventures, Empire State Development (2016- 2018); Managing Director, JPMorgan Asset Management (2000 - 2015); Vice President, JPMorgan Investment Management (1996 - 2000); Associate, Willkie Farr & Gallagher LLP (1984 - 1996) | 10 | None |
INTERESTED DIRECTOR | ||||
Mitchell A. Tanzman (63) c/o Central Park Group, LLC 125 W 55th Street Director and Principal Executive Officer | Term - Indefinite Length - Since Inception | Co-Head/Co-CIO Wealth Solutions Macquaire Asset Management (since 2022); Co-Chief Executive Officer and Co-Chief Investment Officer of Central Park Group, LLC (2006-2022) | 10 | None |
OFFICER(S) WHO ARE NOT DIRECTORS | ||||
Michael Mascis (56) c/o Central Park Group, LLC 125 W 55th Street Principal Accounting Officer | Term - Indefinite Length - Since Inception | Chief Administrative Officer, Wealth Solutions Macquaire Asset Management (since 2022); Chief Financial Officer of Central Park Group, LLC (2006-2022) | N/A | N/A |
Seth L. Pearlstein (57) c/o Central Park Group, LLC 125 W 55th Street New York, NY 10019 Chief Compliance Officer | Term - Indefinite Length - Since Inception | Associate Director, Wealth Solutions Macquaire Asset Management (since 2022); Chief Compliance Officer of Central Park Advisers, LLC (since 2015); General Counsel and Chief Compliance Officer of W.P. Stewart & Co., Ltd. (2008-2014); previously, Associate General Counsel | N/A | N/A |
Gregory Brousseau (68) c/o Central Park Group, LLC 125 W 55th Street New York, NY 10019 Vice President | Term - Indefinite Length - Since Inception | (2002-2007) Co-Head/Co-CIO Wealth Solutions Macquaire Asset Management (since 2022); Co-Chief Executive Officer of Central Park Group, LLC (2006-2022) | N/A | N/A |
59
CPG Cooper Square International Equity, LLC
Fund Management (Unaudited) (Continued)
September 30, 2023
Name, Age, Address and | Term of | Principal Occupation(s) | Number of | Other |
OFFICER(S) WHO ARE NOT DIRECTORS (CONTINUED) | ||||
Ruth Goodstein (63) c/o Central Park Group, LLC 125 W 55th Street Vice President | Term - Indefinite Length - Since Inception | Chief Operating Officer, Wealth Solutions Macquaire Asset Management (since 2022); Chief Operating Officer of Central Park Group, LLC (2006-2022) | N/A | N/A |
David F. Connor (60) c/o Central Park Group, LLC 125 W 55th Street Vice President | Term - Indefinite Length - Since March 2022 | General Counsel of Macquarie Asset Management Public Investments Americas (since 2015) | N/A | N/A |
Graeme Conway (49) c/o Central Park Group, LLC 125 W 55th Street New York, NY 10019 Vice President | Term - Indefinite Length - Since March 2022 | Chief Commercial Officer and Head of Strategic Solutions of Macquarie Asset Management (since 2012) | N/A | N/A |
Micheal E. Dresnin (51) c/o Central Park Group, LLC 125 W 55th Street New York, NY 10019 Vice President | Term - Indefinite Length - Since September 2023 | Associate General Counsel of Macquarie Asset Management (since 2005) | N/A | N/A |
Richard Salus (60) c/o Central Park Group,LLC 125 W 55th Street New York, NY 10019 Vice President | Term - Indefinite Length - Since September 2023 | Global Head of Fund Services of Macquarie Asset Management (since 2016) | N/A | N/A |
60
This page intentionally left blank.
| (b) | Not applicable. |
ITEM 2. CODE OF ETHICS.
(a) The registrant has adopted a code of ethics (the “Code of Ethics”) that applies to the registrant’s principal executive officer and principal financial officer.
(b) No information needs to be disclosed pursuant to this paragraph.
(c) The registrant has made no amendments to its Code of Ethics during the period covered by the report to members presented in Item 1 hereto.
(d) The registrant has not granted a waiver or an implicit waiver from a provision of its Code of Ethics during the period covered by the report to members presented in Item 1 hereto.
(e) Not applicable.
(f)
(1) Code of Ethics, or any amendment thereto, that is the subject of disclosure required by Item 2 is attached hereto.
(2) Not applicable.
(3) Not applicable.
ITEM 3. AUDIT COMMITTEE FINANCIAL EXPERT.
As of the end of the period covered by the report, the registrant’s board of directors has determined that Kristen Leopold is qualified to serve as the audit committee financial expert serving on its audit committee and that he/she is “independent,” as defined by Item 3 of Form N-CSR.
ITEM 4. PRINCIPAL ACCOUNTANT FEES AND SERVICES.
Audit Fees
(a) The aggregate fees billed for the fiscal year for professional services rendered by the principal accountant for the audit of the registrant’s annual financial statements or services that are normally provided by the accountant in connection with statutory and regulatory filings or engagements for those fiscal years are $85,000 for 2022 and $85,000 for 2023.
Audit-Related Fees
(b) The aggregate fees billed for the fiscal year for assurance and related services by the principal accountant that are reasonably related to the performance of the audit of the registrant’s financial statements and are not reported under paragraph (a) of this Item are $0 for 2022 and $0 for 2023. The fees listed in item 4 (b) are related to out-of-pocket expenses in relation to the annual audit of the registrant.
Tax Fees
(c) The aggregate fees billed for the fiscal year for professional services rendered by the principal accountant for tax compliance, tax advice, and tax planning are $0 for 2022 and $0 for 2023.
All Other Fees
(d) The aggregate fees billed in the fiscal year for products and services provided by the principal accountant, other than the services reported in paragraphs (a) through (c) of this Item are $0 for 2022 and $0 for 2023.
(e)(1) Disclose the audit committee’s pre-approval policies and procedures described in paragraph (c)(7) of Rule 2-01 of Regulation S-X.
The registrant's Audit Committee must pre-approve the audit and non-audit services of the Auditors prior to the Auditor's engagement.
(e)(2) The percentage of services described in each of paragraphs (b) through (d) of this Item that were approved by the audit committee pursuant to paragraph (c)(7)(i)(C) of Rule 2-01 of Regulation S-X are as follows:
(b) 0%
(c) 0%
(d) 0%
(f) Not applicable.
(g) The aggregate non-audit fees billed by the registrant’s accountant for services rendered to the registrant, and rendered to the registrant’s investment adviser (not including any sub-adviser whose role is primarily portfolio management and is subcontracted with or overseen by another investment adviser), and any entity controlling, controlled by, or under common control with the adviser that provides ongoing services to the registrant for the fiscal year of the registrant was $0 for 2022 and $0 for 2023.
(h) The registrant’s audit committee of the board of directors has considered whether the provision of non-audit services that were rendered to the registrant's investment adviser (not including any sub-adviser whose role is primarily portfolio management and is subcontracted with or overseen by another investment adviser), and any entity controlling, controlled by, or under common control with the investment adviser that provides ongoing services to the registrant that were not pre-approved pursuant to paragraph (c)(7)(ii) of Rule 2-01 of Regulation S-X is compatible with maintaining the principal accountant's independence. No such services were provided.
(i) Not applicable.
(j) Not applicable.
ITEM 5. AUDIT COMMITTEE OF LISTED REGISTRANTS.
Not applicable.
ITEM 6. SCHEDULE OF INVESTMENTS.
Schedule of Investments in securities of unaffiliated issuers as of the close of the reporting period is included as part of the report to shareholders filed under Item 1 of this form.
ITEM 7. DISCLOSURE OF PROXY VOTING POLICIES AND PROCEDURES FOR CLOSED-END MANAGEMENT INVESTMENT COMPANIES.
ITEM 8. PORTFOLIO MANAGERS OF CLOSED-END MANAGEMENT INVESTMENT COMPANIES.
Portfolio Management
Chad M. Clark and Matthew C. Pickering serve as the Fund’s portfolio managers (the “Portfolio Managers”). Messrs. Clark and Pickering are jointly responsible for the day-to-day management of the Fund’s assets.
Mr. Clark joined the Sub-Adviser in August 2010. He oversees the Sub-Adviser’s international strategies and is a member of its Management Committee. Prior to joining the Sub-Adviser, Mr. Clark spent 14 years at Harris Associates, where he was a Partner and co-managed the Oakmark International Small Cap Fund and Harris International Value L.P. Prior to Harris Associates, he was an Analyst in Corporate Finance at William Blair & Company. Mr. Clark received a B.S. in Industrial Management from Carnegie Mellon University (summa cum laude), and is a CFA charterholder.
Mr. Pickering, a senior member of the Sub-Adviser’s investment team, joined the Sub-Adviser in December 2010. Prior to joining the Sub-Adviser, Mr. Pickering was an Analyst with Harris Associates for four years. Prior to Harris Associates, he worked for six years as an Analyst and Associate Portfolio Manager with Institutional Capital, where he was named Morningstar International Stock Co-Manager of the Year in 2005. Mr. Pickering received a B.S. from Miami University (magna cum laude), and is a CFA charterholder.
The Portfolio Managers provide advisory services to other clients, including other pooled investment vehicles, that invest in securities of the same type in which the Fund invests. As a result, there may be an incentive to favor one vehicle or account over another, resulting in conflicts of interest. The Sub-Adviser is aware of its obligation to ensure that, when orders for the same securities are entered on behalf of the Fund and other accounts, the Fund receives a fair and equitable allocation of the orders, particularly where affiliated accounts may participate. The Sub-Adviser has adopted various compliance policies and procedures that it believes are reasonably designed to address various conflicts of interest that may arise in connection with its management of other accounts and investment vehicles, and that provide a methodology for seeking to ensure fair treatment of all clients.
Each Portfolio Manager's compensation is comprised of a fixed annual salary, a discretionary bonus and potentially an annual supplemental distribution paid by the Sub-Adviser, or its parent company, and not by the Fund.
The following table lists the number and types of accounts, other than the Fund, managed by the Fund’s Portfolio Managers and estimated assets under management in those accounts, as of September 30, 2023.
| Registered Investment Companies | Pooled Investment Vehicles | Other Accounts | ||||||||||||||||||||||
| Portfolio Manager | Number of Accounts | Assets Managed | Number of Accounts | Assets Managed | Number of Accounts | Assets Managed | ||||||||||||||||||
| Chad M. Clark | 1 | $ | 1,447,345,923 | 12 | (1) | $ | 13,126,740,832 | 12 | (2) | $ | 2,894,664,965 | |||||||||||||
| Matthew C. Pickering | 1 | $ | 1,447,345,923 | 11 | (1) | $ | 7,531,002,888 | 12 | (2) | $ | 2,894,664,965 | |||||||||||||
| 1 | Of these accounts, 6 accounts with total assets of approximately $1,964,654,008 charge performance-based advisory fees. |
| 2 | Of these accounts, 1 account with total assets of approximately $32,210,724 charges performance-based advisory fees. |
ITEM 9. PURCHASES OF EQUITY SECURITIES BY CLOSED-END MANAGEMENT INVESTMENT COMPANY AND AFFILIATED PURCHASERS.
Not applicable.
ITEM 10. SUBMISSION OF MATTERS TO A VOTE OF SECURITY HOLDERS.
The registrant’s nominating committee reviews and considers, as it deems appropriate after taking into account, among other things, the factors listed in its charter, nominations of potential Directors made by the registrant’s management and by the registrant’s Investors who have sent to Gregory S. Rowland, Esq., legal counsel for the Independent Directors, at c/o Davis Polk & Wardwell LLP, 450 Lexington Avenue, New York, NY 10017, such nominations, which include all information relating to the recommended nominee that is required to be disclosed in solicitations or proxy statements for the election of Directors, including without limitation the biographical information and the qualifications of the proposed nominees. Nomination submissions must be accompanied by a written consent of the individual to stand for election if nominated by the Board and to serve if elected, and such additional information must be provided regarding the recommended nominee as is reasonably requested by the nominating committee. The nominating committee meets as is necessary or appropriate.
ITEM 11. CONTROLS AND PROCEDURES.
(a) The registrant’s principal executive and principal financial officers, or persons performing similar functions, have concluded that the registrant’s disclosure controls and procedures (as defined in Rule 30a-3(c) under the Investment Company Act of 1940, as amended (the “1940 Act”) (17 CFR 270.30a-3(c))) are effective, as of a date within 90 days of the filing date of the report that includes the disclosure required by this paragraph, based on their evaluation of these controls and procedures required by Rule 30a-3(b) under the 1940 Act (17 CFR 270.30a-3(b)) and Rules 13a-15(b) or 15d-15(b) under the Securities Exchange Act of 1934, as amended (17 CFR 240.13a-15(b) or 240.15d-15(b)).
(b) There were no changes in the registrant’s internal control over financial reporting (as defined in Rule 30a-3(d) under the 1940 Act (17 CFR 270.30a-3(d)) that occurred during the period covered by this report that has materially affected, or is reasonably likely to materially affect, the registrant’s internal control over financial reporting.
ITEM 12. DISCLOSURE OF SECURITIES LENDING ACTIVITIES FOR CLOSED-END MANAGEMENT INVESTMENT COMPANIES
(a)(1) Not applicable.
(a)(2) Not applicable.
(a)(3) Not applicable.
(a)(4) Not applicable.
(b) Not applicable.
ITEM 13. EXHIBITS.
(a)(1) Code of ethics, or any amendment thereto, that is the subject of disclosure required by Item 2 is attached hereto.
(a)(3) Not applicable.
(a)(4) Not applicable.
(b) Not applicable.
SIGNATURES
Pursuant to the requirements of the Securities Exchange Act of 1934 and the Investment Company Act of 1940, the registrant has duly caused this report to be signed on its behalf by the undersigned, thereunto duly authorized.
| (registrant) | CPG Cooper Square International Equity, LLC | |
| By (Signature and Title)* | /s/ Mitchell A. Tanzman | |
| Mitchell A. Tanzman | ||
| (Principal Executive Officer) | ||
| Date | December 8, 2023 |
Pursuant to the requirements of the Securities Exchange Act of 1934 and the Investment Company Act of 1940, this report has been signed below by the following persons on behalf of the registrant and in the capacities and on the dates indicated.
| By (Signature and Title)* | /s/ Mitchell A. Tanzman | |
| Mitchell A. Tanzman | ||
| (Principal Executive Officer) | ||
| Date | December 8, 2023 | |
| By (Signature and Title)* | /s/ Michael Mascis | |
| Michael Mascis | ||
| (Principal Financial Officer) | ||
| Date | December 8, 2023 |
| * | Print the name and title of each signing officer under his or her signature. |