UNITED STATES
SECURITIES AND EXCHANGE COMMISSION
Washington, D.C. 20549
FORM N-CSR
CERTIFIED SHAREHOLDER REPORT OF REGISTERED MANAGEMENT
INVESTMENT COMPANIES
Investment Company Act file number 811-23590
CPG Cooper Square International Equity, LLC
(Exact name of registrant as specified in charter)
125 W. 55th Street
New York, New York 10019
(Address of principal executive offices) (Zip code)
Mitchell A. Tanzman
c/o Central Park Advisers, LLC
125 W. 55th Street
New York, New York 10019
(Name and address of agent for service)
Registrant's telephone number, including area code: (212) 317-9200
Date of fiscal year end: September 30
Date of reporting period: September 30, 2022
Form N-CSR is to be used by management investment companies to file reports with the Commission not later than 10 days after the transmission to stockholders of any report that is required to be transmitted to stockholders under Rule 30e-1 under the Investment Company Act of 1940 (17 CFR 270.30e-1). The Commission may use the information provided on Form N-CSR in its regulatory, disclosure review, inspection, and policymaking roles.
A registrant is required to disclose the information specified by Form N-CSR, and the Commission will make this information public. A registrant is not required to respond to the collection of information contained in Form N-CSR unless the Form displays a currently valid Office of Management and Budget (“OMB”) control number. Please direct comments concerning the accuracy of the information collection burden estimate and any suggestions for reducing the burden to Secretary, Securities and Exchange Commission, 100 F Street, NE, Washington, DC 20549-0609. The OMB has reviewed this collection of information under the clearance requirements of 44 U.S.C. § 3507.
ITEM 1. REPORTS TO STOCKHOLDERS.
| (a) | The Report to Shareholders is attached herewith. |
CPG Cooper Square International Equity, LLC
Financial Statements
For the Year Ended September 30, 2022
With Report of Independent Registered Public Accounting Firm
CPG Cooper Square International Equity, LLC
Table of Contents
For the Year Ended September 30, 2022
Report of Independent Registered Public Accounting Firm | 1 |
Schedule of Investments | 2-24 |
Statement of Assets and Liabilities | 25 |
Statement of Operations | 26 |
Statements of Changes in Net Assets | 27 |
Financial Highlights | 28-29 |
Notes to Financial Statements | 30-40 |
Other Information | 41-47 |
Fund Management | 48-50 |
CPG Cooper Square International Equity, LLC
Report of Independent Registered Public Accounting Firm
September 30, 2022
To the Board of Directors and Unitholders of CPG Cooper Square International Equity, LLC
Opinion on the Financial Statements
We have audited the accompanying statement of assets and liabilities, including the schedule of investments, of CPG Cooper Square International Equity, LLC (the “Fund”) as of September 30, 2022, and the related statements of operations and changes in net assets, including the related notes, and the financial highlights for the year ended September 30, 2022 (collectively referred to as the “financial statements”). In our opinion, the financial statements present fairly, in all material respects, the financial position of the Fund as of September 30, 2022, and the results of its operations, changes in its net assets, and the financial highlights for the year ended September 30, 2022 in conformity with accounting principles generally accepted in the United States of America.
The financial statements of the Fund as of September 30, 2021 and for the period November 2, 2020 (commencement of operations) to September 30, 2021 and the financial highlights for the period November 2, 2020 (commencement of operations) to September 30, 2021 (not presented herein, other than the statement of changes in net assets and the financial highlights) were audited by other auditors whose report dated November 26, 2021 expressed an unqualified opinion on those financial statements and financial highlights.
Basis for Opinion
These financial statements are the responsibility of the Fund’s management. Our responsibility is to express an opinion on the Fund’s financial statements based on our audit. We are a public accounting firm registered with the Public Company Accounting Oversight Board (United States) (PCAOB) and are required to be independent with respect to the Fund in accordance with the U.S. federal securities laws and the applicable rules and regulations of the Securities and Exchange Commission and the PCAOB.
We conducted our audit of these financial statements in accordance with the standards of the PCAOB. Those standards require that we plan and perform the audit to obtain reasonable assurance about whether the financial statements are free of material misstatement, whether due to error or fraud.
Our audit included performing procedures to assess the risks of material misstatement of the financial statements, whether due to error or fraud, and performing procedures that respond to those risks. Such procedures included examining, on a test basis, evidence regarding the amounts and disclosures in the financial statements. Our audit also included evaluating the accounting principles used and significant estimates made by management, as well as evaluating the overall presentation of the financial statements. Our procedures included confirmation of securities owned as of September 30, 2022 by correspondence with the custodian and brokers; when replies were not received from brokers, we performed other auditing procedures. We believe that our audit provides a reasonable basis for our opinion.
/s/PricewaterhouseCoopers LLP
Philadelphia, Pennsylvania
December 8, 2022
We have served as the auditor of one or more Central Park Group investment companies since 2022.
1
CPG Cooper Square International Equity, LLC
Schedule of Investments
September 30, 2022
Common Stock (58.94%) | Shares | Fair Value | ||||||
Australia (1.31%) | ||||||||
Treasury Wine Estates, Ltd.(a) | 98,560 | $ | 796,550 | |||||
France (5.29%) | ||||||||
Edenred(a) | 69,335 | 3,216,881 | ||||||
Germany (3.10%) | ||||||||
CTS Eventim AG & Co. KGaA(a)(b) | 45,260 | 1,885,292 | ||||||
Great Britain (10.13%) | ||||||||
Clarivate PLC(a)(b) | 157,040 | 1,474,606 | ||||||
Petershill Partners PLC(a)(c) | 263,698 | 542,222 | ||||||
RS GROUP PLC(a) | 201,083 | 2,175,103 | ||||||
Sensata Technologies Holding PLC | 16,140 | 601,699 | ||||||
WAG Payment Solutions PLC(a)(b) | 1,341,818 | 1,360,067 | ||||||
| 6,153,697 | ||||||||
Hong Kong (5.09%) | ||||||||
AIA Group, Ltd.(a) | 371,197 | 3,094,924 | ||||||
Ireland (7.89%) | ||||||||
CRH PLC(a) | 96,576 | 3,128,774 | ||||||
Experian PLC(a) | 56,143 | 1,667,712 | ||||||
| 4,796,486 | ||||||||
Japan (10.57%) | ||||||||
Justsystems Corp.(a) | 32,115 | 742,165 | ||||||
Keyence Corp.(a) | 5,685 | 1,881,319 | ||||||
NOF Corp.(a) | 81,860 | 2,952,152 | ||||||
Obic Co., Ltd.(a) | 6,340 | 849,305 | ||||||
| 6,424,941 | ||||||||
Luxembourg (2.71%) | ||||||||
Perimeter Solutions SA(a)(b) | 156,700 | 1,255,167 | ||||||
Spotify Technology SA(a)(b) | 4,590 | 396,117 | ||||||
| 1,651,284 | ||||||||
Netherlands (3.57%) | ||||||||
ASML Holding NV(a) | 5,107 | 2,169,332 | ||||||
Switzerland (4.48%) | ||||||||
Alcon, Inc.(a) | 46,145 | 2,725,802 | ||||||
2
CPG Cooper Square International Equity, LLC
Schedule of Investments (Continued)
September 30, 2022
Common Stock (continued) | Shares | Fair Value | ||||||
United States (4.80%) | ||||||||
PerkinElmer, Inc.(a) | 23,547 | $ | 2,833,410 | |||||
S&P Global, Inc. | 286 | 87,330 | ||||||
| 2,920,740 | ||||||||
Total Common Stock | ||||||||
(Cost $50,897,004) | $ | 35,835,929 | ||||||
| Underlying Security/Expiration Date/ Exercise Price/Notional Amount | Contracts | Value | ||||||
| PURCHASED OPTIONS 1.57% | ||||||||
| Put Options Purchased 1.57% | ||||||||
| DAX Index | ||||||||
| 12/16/22, $12,300, $2,180,584 | 180 | $ | 121,907 | |||||
| 12/16/22, $12,100, $3,694,880 | 305 | 179,613 | ||||||
| 12/16/22, $12,000, $1,574,867 | 130 | 76,061 | ||||||
| EURO STOXX 50 Index | ||||||||
| 12/16/22, $3,350, $2,239,785 | 675 | 117,801 | ||||||
| 12/16/22, $3,300, $3,815,930 | 1,150 | 187,628 | ||||||
| 12/16/22, $3,275, $1,609,327 | 485 | 74,966 | ||||||
| EUR USD .91p 12/16/22 Bin | ||||||||
| 12/16/22, $1, $168,780 | 168,780 | 18,553 | ||||||
| 12/16/22, $1, $78,120 | 78,120 | 18,426 | ||||||
| EUR USD .92p 12/16/22 Ot | ||||||||
| 12/16/22, $1, $139,850 | 139,850 | 18,868 | ||||||
| 12/16/22, $1, $64,135 | 64,135 | 18,775 | ||||||
| EUR USD .93p 12/16/22 Bin | ||||||||
| 12/16/22, $1, $115,735 | 115,735 | 19,063 | ||||||
| 12/16/22, $1, $52,565 | 52,565 | 19,006 | ||||||
| GBP USD 1.00p 11/18/22 Bin | ||||||||
| 11/18/22, $1, $159,135 | 159,135 | 13,823 | ||||||
| GBP USD 1.00p 11/18/22 Ot | ||||||||
| 11/18/22, $1, $81,255 | 81,255 | 14,237 | ||||||
| GBP USD 1.01p 11/18/22 Bin | ||||||||
| 11/18/22, $1, $144,670 | 144,670 | 14,477 | ||||||
| GBP USD 1.01p 11/18/22 Ot | ||||||||
| 11/18/22, $1, $71,370 | 71,370 | 14,487 | ||||||
| GBP USD 1.02p 11/18/22 Bin | ||||||||
| 11/18/22, $1, $125,380 | 125,380 | 14,426 | ||||||
3
CPG Cooper Square International Equity, LLC
Schedule of Investments (Continued)
September 30, 2022
| Underlying Security/Expiration Date/ Exercise Price/Notional Amount (continued) | Contracts | Value | ||||||
| Put Options Purchased (continued) | ||||||||
| GBP USD 1.02p 11/18/22 Ot | ||||||||
| 11/18/22, $1, $61,965 | 61,965 | $ | 14,579 | |||||
| Total Put Options Purchased | ||||||||
| (Cost $1,150,735) | $ | 956,696 | ||||||
| Total Investments (60.51%) | $ | 36,792,625 | ||||||
| Securities Sold Short (-38.64%) | $ | (23,496,307 | ) | |||||
Other Assets In Excess of Liabilities (78.13%)(d) | 47,505,643 | |||||||
| Net Assets (100.00%) | $ | 60,801,961 | ||||||
(a) | All or a portion of the security is pledged as collateral for total return swap contracts and securities sold short. As of September 30, 2022, the aggregate value of those securities was $31,737,051 and $4,000,000 in cash, representing 58.78% of net assets. |
(b) | Non-income producing security. |
(c) | Securities exempt from registration under Rule 144A of the Securities Act of 1933. These securities may be resold in transactions exempt from registration, normally to qualified institutional buyers. As of September 30, 2022, the aggregate fair value of securities restricted under Rule 144A was $542,222, representing 0.89% of net assets. |
(d) | Includes cash which is being held as collateral for total return swap contracts and securities sold short. |
Bin - Binary
Ot - One-Touch
4
CPG Cooper Square International Equity, LLC
Schedule of Investments (Continued)
September 30, 2022
Country Composition (September 30, 2022)
Common Stock | ||||
Japan | 10.57 | % | ||
Great Britain | 10.13 | % | ||
Ireland | 7.89 | % | ||
France | 5.29 | % | ||
Hong Kong | 5.09 | % | ||
United States | 4.80 | % | ||
Switzerland | 4.48 | % | ||
Netherlands | 3.57 | % | ||
Germany | 3.10 | % | ||
Luxembourg | 2.71 | % | ||
Australia | 1.31 | % | ||
| 58.94 | % |
Securities Sold Short | ||||
Common Stock | ||||
India | -0.07 | % | ||
Canada | -0.21 | % | ||
Norway | -0.28 | % | ||
Finland | -0.38 | % | ||
Taiwan | -0.56 | % | ||
Bermuda | -1.81 | % | ||
Germany | -1.82 | % | ||
France | -2.32 | % | ||
Netherlands | -2.35 | % | ||
Sweden | -3.41 | % | ||
Japan | -4.17 | % | ||
Switzerland | -4.33 | % | ||
Great Britain | -5.99 | % | ||
United States | -6.14 | % | ||
Exchange Traded Funds | ||||
Brazil | -0.13 | % | ||
European Union | -0.63 | % | ||
India | -1.34 | % | ||
United States | -2.69 | % | ||
| -38.63 | % |
Percentages are based upon net assets.
5
CPG Cooper Square International Equity, LLC
Schedule of Investments (Continued)
September 30, 2022
TOTAL RETURN SWAP CONTRACTS
| Counterparty | Reference Entity/ Obligation | Notional Amount | Floating Rate Index | Floating Rate Paid/ (Received) by the Fund | Termination Date | Value | Net Unrealized Appreciation | |||||||||||||
| Goldman Sachs | Breville Group, Ltd. | $ | (75,792 | ) | FEDEF-1D | (100) bps | 09/05/2023 | $ | (57,458 | ) | $ | 18,335 | ||||||||
| Morgan Stanley | Giant Manufacturing Co., Ltd. | (239,614 | ) | FEDEF-1D | (100) bps | 07/17/2023 | (189,746 | ) | 49,869 | |||||||||||
| Goldman Sachs | GS Swap GSCBHKDD Basket Index | (488,129 | ) | HIBOR-1M | (55) bps | 02/07/2023 | (448,071 | ) | 40,058 | |||||||||||
| Goldman Sachs | GS Swap GSCBWLT2 Basket Index | (304,795 | ) | FEDEF-1D | (35) bps | 08/16/2023 | (246,286 | ) | 58,509 | |||||||||||
| Goldman Sachs | James Hardie Industries PLC Index | (406,198 | ) | FEDEF-1D | (50) bps | 11/03/2022 | (312,677 | ) | 93,521 | |||||||||||
| Morgan Stanley | James Hardie Industries PLC Index | (22,558 | ) | FEDEF-1D | (50) bps | 01/03/2023 | (11,501 | ) | 11,058 | |||||||||||
| Morgan Stanley | JB Hi-Fi, Ltd. | (521,796 | ) | FEDEF-1D | (50) bps | 04/04/2023 | (338,419 | ) | 183,377 | |||||||||||
| Morgan Stanley | MS Swap MSCBINDS Basket Index(a) | (1,267,763 | ) | FEDEF-1D | (40) bps | 10/19/2023 | (1,222,693 | ) | 45,071 | |||||||||||
| Morgan Stanley | MS Swap MSCBMINE Basket Index(a) | (1,057,778 | ) | FEDEF-1D | (30) bps | 08/28/2023 | (1,007,651 | ) | 50,128 | |||||||||||
| Morgan Stanley | MS Swap MSCBNRGY Basket Index(a) | (1,138,542 | ) | FEDEF-1D | (44) bps | 06/09/2023 | (1,017,713 | ) | 120,829 | |||||||||||
| Morgan Stanley | MS Swap MSCBTELE Basket Index | (192,421 | ) | FEDEF-1D | (45) bps | 08/28/2023 | (156,616 | ) | 35,805 | |||||||||||
| Morgan Stanley | MS Swap MSCBUTES Basket Index(a) | (756,197 | ) | ESTR-1D | (32) bps | 06/26/2023 | (594,985 | ) | 161,212 | |||||||||||
| Morgan Stanley | MS Swap MSSEEWT Basket Index | (640,886 | ) | FEDEF-1D | (110) bps | 01/13/2023 | (486,508 | ) | 154,378 | |||||||||||
| Morgan Stanley | MS Swap MSSENERGY Basket Index | (463,556 | ) | FEDEF-1D | (50) bps | 04/10/2023 | (429,096 | ) | 34,460 | |||||||||||
| Morgan Stanley | MS Swap MSHKRESI Basket Index | (306,173 | ) | FEDEF-1D | (50) bps | 05/04/2023 | (253,743 | ) | 52,430 | |||||||||||
| Morgan Stanley | Koninklijke DSM NV | 394,543 | FEDEF-1D | 50 bps | 10/19/2023 | 402,182 | 7,639 | |||||||||||||
| Goldman Sachs | GS Swap GSCBRFNC Basket Index | (302,215 | ) | FEDEF-1D | (35) bps | 10/04/2023 | (266,380 | ) | 35,835 | |||||||||||
| Goldman Sachs | GS Swap GSCBSXK1 Basket Index | (400,232 | ) | ESTR-1D | (50) bps | 10/25/2023 | (386,725 | ) | 13,507 | |||||||||||
| Bank Of America Merrill Lynch | BAML Swap MLHMBLDR Basket(a) | (1,005,579 | ) | SONIA-1D | (30) bps | 10/26/2023 | (972,119 | ) | 33,460 | |||||||||||
| Morgan Stanley | EURO STOXX Banks (Price) Index | (1,325,652 | ) | FEDEF-1D | (40) bps | 05/30/2023 | (1,167,364 | ) | 158,287 | |||||||||||
| $ | (10,521,333 | ) | $ | (9,163,569 | ) | $ | 1,357,768 | |||||||||||||
6
CPG Cooper Square International Equity, LLC
Schedule of Investments (Continued)
September 30, 2022
| Counterparty | Reference Entity/ Obligation | Notional Amount | Floating Rate Index | Floating Rate Paid/ (Received) by the Fund | Termination Date | Value | Net Unrealized Depreciation | |||||||||||||
| Morgan Stanley | Adyen NV | $ | 1,322,156 | FEDEF-1D | 50 bps | 11/01/2022 | $ | 890,165 | $ | (431,991 | ) | |||||||||
| Morgan Stanley | Amadeus IT Group SA | 1,940,556 | FEDEF-1D | 50 bps | 11/01/2022 | 1,416,687 | (523,869 | ) | ||||||||||||
| Morgan Stanley | Amplifon SpA | 697,098 | FEDEF-1D | 50 bps | 04/28/2023 | 497,290 | (199,808 | ) | ||||||||||||
| Morgan Stanley | Aritzia Inc | 915,852 | FEDEF-1D | 30 bps | 04/10/2023 | 867,169 | (48,684 | ) | ||||||||||||
| Morgan Stanley | ATS Automation Tooling Systems, Inc. | 982,954 | FEDEF-1D | 30 bps | 11/28/2022 | 863,890 | (119,064 | ) | ||||||||||||
| Morgan Stanley | Becle SAB de CV | 1,477,148 | FEDEF-1D | 130 bps | 11/01/2022 | 1,127,524 | (349,623 | ) | ||||||||||||
| Morgan Stanley | Brookfield Asset Management, Inc. Class A | 2,695,249 | FEDEF-1D | 30 bps | 02/21/2023 | 2,131,756 | (563,493 | ) | ||||||||||||
| Morgan Stanley | Bureau Veritas SA | 1,806,242 | FEDEF-1D | 50 bps | 02/06/2023 | 1,381,583 | (424,658 | ) | ||||||||||||
| Morgan Stanley | Constellation Software, Inc. | 278,471 | FEDEF-1D | 30 bps | 04/03/2023 | 233,608 | (44,863 | ) | ||||||||||||
| Morgan Stanley | Dechra Pharmaceuticals PLC | 917,628 | FEDEF-1D | 50 bps | 05/12/2023 | 669,567 | (248,061 | ) | ||||||||||||
| Morgan Stanley | Diasorin SpA | 876,200 | FEDEF-1D | 50 bps | 04/28/2023 | 696,039 | (180,161 | ) | ||||||||||||
| Morgan Stanley | Eurofins Scientific SE | 1,078,566 | FEDEF-1D | 50 bps | 04/28/2023 | 800,904 | (277,662 | ) | ||||||||||||
| Morgan Stanley | Grifols SA | 812,668 | FEDEF-1D | 40 bps | 01/27/2023 | 378,061 | (434,608 | ) | ||||||||||||
| Goldman Sachs | GS Swap GSCBSEHK Basket(a) | 867,013 | FEDEF-1D | 40 bps | 11/01/2023 | 842,495 | (24,518 | ) | ||||||||||||
| Morgan Stanley | KONE Oyj | 275,029 | FEDEF-1D | 50 bps | 10/12/2023 | 269,028 | (6,001 | ) | ||||||||||||
| Morgan Stanley | London Stock Exchange Group PLC | 1,976,059 | FEDEF-1D | 50 bps | 04/10/2023 | 1,750,968 | (225,092 | ) | ||||||||||||
| Morgan Stanley | MS Swap MSESMACH Basket Index(a) | 1,431,871 | ESTR-1D | 59 bps | 10/06/2023 | 1,304,295 | (127,575 | ) | ||||||||||||
| Morgan Stanley | MS Swap MSUKCONS Basket Index(a) | (823,303 | ) | SONIA-1D | (45) bps | 10/30/2023 | (845,958 | ) | (22,655 | ) | ||||||||||
| Morgan Stanley | MS Swap MSGASOFF Basket Index(a) | (699,534 | ) | ESTR-1D | (32) bps | 10/30/2023 | (706,632 | ) | (7,097 | ) | ||||||||||
| Morgan Stanley | Olympus Corp | 1,076,901 | FEDEF-1D | 50 bps | 01/30/2023 | 982,135 | (94,765 | ) | ||||||||||||
| Morgan Stanley | Partners Group Holding AG | 1,278,481 | FEDEF-1D | 50 bps | 11/01/2022 | 779,054 | (499,427 | ) | ||||||||||||
| Goldman Sachs | GS Swap GSCBSEST Basket Index(a) | 2,538,886 | FEDEF-1D | 45 bps | 10/17/2023 | 2,363,951 | (174,936 | ) | ||||||||||||
| Goldman Sachs | GS Swap GSCBSFIV Basket Index(a) | 3,748,416 | FEDEF-1D | 40 bps | 10/17/2023 | 3,420,074 | (328,342 | ) | ||||||||||||
| Bank Of America Merrill Lynch | BAML Swap MLGNBSKT Basket Index(a) | 891,073 | ESTR-1D | 30 bps | 10/13/2023 | 725,438 | (165,635 | ) | ||||||||||||
| Bank Of America Merrill Lynch | BAML Swap MLMROBSK Basket Index(a) | 1,951,522 | SONIA-1D | 30 bps | 10/13/2023 | 1,858,066 | (93,456 | ) | ||||||||||||
| Bank Of America Merrill Lynch | BAML Swap MLSAFRAN Basket Index(a) | 3,301,289 | ESTR-1D | 30 bps | 09/29/2023 | 3,109,014 | (192,275 | ) | ||||||||||||
| Bank Of America Merrill Lynch | BAML Swap MLSAPBSK Basket Index(a) | 3,024,302 | ESTR-1D | 30 bps | 09/29/2023 | 2,967,898 | (56,405 | ) | ||||||||||||
| Bank Of America Merrill Lynch | BAML Swap MLSUBSKT Basket Index(a) | 2,211,350 | ESTR-1D | 30 bps | 09/29/2023 | 2,157,339 | (54,012 | ) | ||||||||||||
| Bank Of America Merrill Lynch | BAML Swap MLUKUTIL Basket Index | (398,067 | ) | SONIA-1D | 30 bps | 10/27/2023 | (400,105 | ) | (2,038 | ) | ||||||||||
7
CPG Cooper Square International Equity, LLC
Schedule of Investments (Continued)
September 30, 2022
| Counterparty | Reference Entity/ Obligation | Notional Amount | Floating Rate Index | Floating Rate Paid/ (Received) by the Fund | Termination Date | Value | Net Unrealized Depreciation | |||||||||||||
| Bank Of America Merrill Lynch | BAML Swap MLWLNBSK Basket Index(a) | $ | 1,842,097 | ESTR-1D | 30 bps | 09/29/2023 | $ | 1,752,876 | $ | (89,222 | ) | |||||||||
| Morgan Stanley | BAML Swap MSJDBSKT Basket Index(a) | 3,584,490 | HONIX-1D | 50 bps | 10/16/2023 | 3,174,402 | (410,088 | ) | ||||||||||||
| Morgan Stanley | Rentokil Initial PLC | 1,209,932 | FEDEF-1D | 50 bps | 02/21/2023 | 1,014,016 | (195,916 | ) | ||||||||||||
| Morgan Stanley | Sartorius Stedim Biotech | 649,089 | FEDEF-1D | 50 bps | 06/12/2023 | 628,128 | (20,961 | ) | ||||||||||||
| Morgan Stanley | Shopify, Inc. | 399,379 | FEDEF-1D | 30 bps | 09/11/2023 | 269,014 | (130,365 | ) | ||||||||||||
| Morgan Stanley | Treasury Wine Estates, Ltd. | 2,086,109 | FEDEF-1D | 50 bps | 11/01/2022 | 2,005,430 | (80,679 | ) | ||||||||||||
| Morgan Stanley | Universal Music Group NV | 1,358,206 | FEDEF-1D | 50 bps | 04/10/2023 | 1,126,894 | (231,312 | ) | ||||||||||||
| $ | 49,581,378 | $ | 42,502,063 | $ | (7,079,317 | ) | ||||||||||||||
| TOTAL | $ | 39,060,045 | $ | 33,338,494 | $ | (5,721,549 | ) | |||||||||||||
ESTR-1D - Euro Short-Term Rate (Daily)
FEDEF-1D - Federal Funds Effective Rate (Daily)
HIBOR-1M - Hong Kong Interbank Offered Rate (Monthly)
SONIA-1D - Daily Sterling Overnight Index Average (Daily)
(a) See tables below for details of the equity basket holdings underlying the swaps.
The following table represents the equity basket holdings underlying the total return swap with MS Swap MSCBINDS Basket Index as of September 30, 2022.
MS Swap MSCBINDS Basket Index
Description | Shares | Value | Percentage of Value | |||||||||
Short Securities | ||||||||||||
Common Stocks | ||||||||||||
ABB, Ltd. | (8,800 | ) | (USD 230,651 | ) | 18.86 | % | ||||||
GEA Group AG | (8,543 | ) | (279,010 | ) | 22.82 | % | ||||||
Prysmian SpA | (10,601 | ) | (307,652 | ) | 25.16 | % | ||||||
Siemens AG | (4,089 | ) | (405,391 | ) | 33.16 | % | ||||||
Common Stocks Total | (1,222,704 | ) | 100.00 | % | ||||||||
Total Short Securities (US Dollars) | (1,222,704 | ) | ||||||||||
Remaining Securities and Cash | 11 | |||||||||||
Grand Total (US Dollars) | (USD 1,222,693 | ) | ||||||||||
8
CPG Cooper Square International Equity, LLC
Schedule of Investments (Continued)
September 30, 2022
The following table represents the equity basket holdings underlying the total return swap with MS Swap MSCBMINE Basket Index as of September 30, 2022.
MS Swap MSCBMINE Basket Index
Description | Shares | Value | Percentage of Value | |||||||||
Short Securities | ||||||||||||
Common Stocks | ||||||||||||
Anglo American PLC | (2,687 | ) | (USD 82,103 | ) | 8.15 | % | ||||||
Antofagasta PLC | (5,487 | ) | (67,706 | ) | 6.72 | % | ||||||
BHP Group, Ltd. | (12,358 | ) | (312,909 | ) | 31.13 | % | ||||||
Rio Tinto PLC | (5,068 | ) | (277,947 | ) | 27.58 | % | ||||||
Southern Copper Corp. | (1,722 | ) | (77,214 | ) | 7.66 | % | ||||||
Teck Resources, Ltd. | (5,179 | ) | (157,484 | ) | 15.63 | % | ||||||
Woodside Energy Group, Ltd. | (1,528 | ) | (31,561 | ) | 3.13 | % | ||||||
Common Stocks Total | (1,006,923 | ) | 100.00 | % | ||||||||
Total Short Securities (US Dollars) | (1,006,923 | ) | ||||||||||
Remaining Securities and Cash | (728 | ) | ||||||||||
Grand Total (US Dollars) | (USD 1,007,651 | ) | ||||||||||
The following table represents the equity basket holdings underlying the total return swap with MS Swap MSCBNRGY Basket Index as of September 30, 2022.
MS Swap MSCBNRGY Basket Index
Description | Shares | Value | Percentage of Value | |||||||||
Short Securities | ||||||||||||
Common Stocks | ||||||||||||
BP PLC | (53,394 | ) | (USD 258,429 | ) | 25.39 | % | ||||||
Eni SpA | (19,321 | ) | (206,545 | ) | 20.30 | % | ||||||
Galp Energia SGPS SA | (3,552 | ) | (34,168 | ) | 3.36 | % | ||||||
Shell PLC | (10,832 | ) | (271,996 | ) | 26.70 | % | ||||||
TotalEnergies SE | (5,219 | ) | (246,800 | ) | 24.25 | % | ||||||
Common Stocks Total | (1,017,938 | ) | 100.00 | % | ||||||||
Total Short Securities (US Dollars) | (1,017,938 | ) | ||||||||||
Remaining Securities and Cash | 225 | |||||||||||
Grand Total (US Dollars) | (USD 1,017,713 | ) | ||||||||||
9
CPG Cooper Square International Equity, LLC
Schedule of Investments (Continued)
September 30, 2022
The following table represents the equity basket holdings underlying the total return swap with MS Swap MSCBUTES Basket Index as of September 30, 2022.
MS Swap MSCBUTES Basket Index
Description | Shares | Value | Percentage of Value | |||||||||
Short Securities | ||||||||||||
Common Stocks | ||||||||||||
Enagas SA | (10,243 | ) | (EUR 162,254 | ) | 26.72 | % | ||||||
Red Electrica Corp. SA | (28,331 | ) | (445,083 | ) | 73.28 | % | ||||||
Common Stocks Total | (607,337 | ) | 100.00 | % | ||||||||
Total Short Securities (Euros) | (607,337 | ) | ||||||||||
09/30 USDEUR Spot Rate of | 1.021 | |||||||||||
Grand Total (US Dollars) | (USD 594,985 | ) | ||||||||||
The following table represents the equity basket holdings underlying the total return swap with BAML Swap MLHMBLDR Basket Index as of September 30, 2022.
BAML Swap MLHMBLDR Basket Index
Description | Shares | Value | Percentage of Value | |||||||||
Short Securities | ||||||||||||
Common Stocks | ||||||||||||
Berkeley Group Holdings PLC | (5,194 | ) | (GBP 171,245 | ) | 19.67 | % | ||||||
Persimmon PLC | (13,404 | ) | (165,877 | ) | 19.05 | % | ||||||
Rightmove PLC | (43,081 | ) | (207,738 | ) | 23.86 | % | ||||||
Taylor Wimpey PLC | (175,431 | ) | (154,906 | ) | 17.79 | % | ||||||
Travis Perkins PLC | (22,014 | ) | (170,917 | ) | 19.63 | % | ||||||
Common Stocks Total | (870,682 | ) | 100.00 | % | ||||||||
Total Short Securities (British Pounds) | (870,682 | ) | ||||||||||
09/30 USDGBP Spot Rate of | 0.896 | |||||||||||
Grand Total (US Dollars) | (USD 972,119 | ) | ||||||||||
10
CPG Cooper Square International Equity, LLC
Schedule of Investments (Continued)
September 30, 2022
The following table represents the equity basket holdings underlying the total return swap with GS Swap GSCBSEHK Basket Index as of September 30, 2022.
GS Swap GSCBSEHK Basket Index
Description | Shares | Value | Percentage of Value | |||||||||
Long Securities | ||||||||||||
Common Stocks | ||||||||||||
Hong Kong Exchanges & Clearing, Ltd. | 987 | USD 265,963 | 31.57 | % | ||||||||
Li Ning Co., Ltd. | 688 | 41,336 | 4.91 | % | ||||||||
Tencent Holdings, Ltd. | 865 | 230,376 | 27.34 | % | ||||||||
Tongcheng Travel Holdings, Ltd. | 10,401 | 160,172 | 19.01 | % | ||||||||
Trip.com Group, Ltd. | 686 | 144,617 | 17.17 | % | ||||||||
Common Stocks Total | 842,463 | 100.00 | % | |||||||||
Total Long Securities (US Dollars) | 842,463 | |||||||||||
Remaining Securities and Cash | 31 | |||||||||||
Grand Total (US Dollars) | USD 842,495 | |||||||||||
The following table represents the equity basket holdings underlying the total return swap with MS Swap MSESMACH Basket Index as of September 30, 2022.
MS Swap MSESMACH Basket Index
Description | Shares | Value | Percentage of Value | |||||||||
Long Securities | ||||||||||||
Common Stocks | ||||||||||||
Brookfield Renewable Partners LP | 6,315 | EUR 201,758 | 15.15 | % | ||||||||
Bayer AG | 20,532 | 973,616 | 73.13 | % | ||||||||
Eprioc AB | 5,226 | 76,981 | 5.78 | % | ||||||||
Epiroc AB | 6,097 | 79,079 | 5.94 | % | ||||||||
Common Stocks Total | 1,331,434 | 100.00 | % | |||||||||
Total Long Securities (Euros) | 1,331,434 | |||||||||||
09/30 USDEUR Spot Rate of | 1.021 | |||||||||||
Grand Total (US Dollars) | USD 1,304,295 | |||||||||||
11
CPG Cooper Square International Equity, LLC
Schedule of Investments (Continued)
September 30, 2022
The following table represents the equity basket holdings underlying the total return swap with MS Swap MSUKCONS Basket Index as of September 30, 2022.
MS Swap MSUKCONS Basket Index
Description | Shares | Value | Percentage of Value | |||||||||
Short Securities | ||||||||||||
Common Stocks | ||||||||||||
Associated British Foods PLC | (23,774 | ) | (GBP 299,183 | ) | 39.48 | % | ||||||
Dunelm Group PLC | (1,053 | ) | (7,621 | ) | 1.01 | % | ||||||
Frasers Group PLC | (1,990 | ) | (13,466 | ) | 1.78 | % | ||||||
Howden Joinery Group PLC | (26,050 | ) | (132,035 | ) | 17.42 | % | ||||||
JD Sports Fashion PLC | (48,646 | ) | (48,989 | ) | 6.46 | % | ||||||
Kingfisher PLC | (57,815 | ) | (127,297 | ) | 16.80 | % | ||||||
Next PLC | (2,686 | ) | (129,232 | ) | 17.05 | % | ||||||
Common Stocks Total | (757,823 | ) | 100.00 | % | ||||||||
Total Short Securities (British Pounds) | (757,823 | ) | ||||||||||
09/30 USDGBP Spot Rate of | 0.896 | |||||||||||
Grand Total (US Dollars) | (USD 845,958 | ) | ||||||||||
The following table represents the equity basket holdings underlying the total return swap with MS Swap MSGASOFF Basket Index as of September 30, 2022.
MS Swap MSGASOFF Basket Index
Description | Shares | Value | Percentage of Value | |||||||||
Short Securities | ||||||||||||
Common Stocks | ||||||||||||
Brenntag SE | (11,563 | ) | (EUR 721,277 | ) | 100.00 | % | ||||||
Common Stocks Total | (721,277 | ) | 100.00 | % | ||||||||
Total Short Securities (Euros) | (721,277 | ) | ||||||||||
09/30 USDEUR Spot Rate of | 1.021 | |||||||||||
Grand Total (US Dollars) | (USD 706,632 | ) | ||||||||||
12
CPG Cooper Square International Equity, LLC
Schedule of Investments (Continued)
September 30, 2022
The following table represents the equity basket holdings underlying the total return swap with GS Swap GSCBSEST Basket Index as of September 30, 2022.
GS Swap GSCBSEST Basket Index
Description | Shares | Value | Percentage of Value | |||||||||
Long Securities | ||||||||||||
Common Stocks | ||||||||||||
Analog Devices, Inc. | 324 | USD 45,150 | 1.91 | % | ||||||||
Aptiv PLC | 517 | 40,403 | 1.71 | % | ||||||||
Autoliv, Inc. | 661 | 44,012 | 1.86 | % | ||||||||
BorgWarner, Inc. | 1,296 | 40,689 | 1.72 | % | ||||||||
Cie Generale des Etablissements Michelin SCA | 2,047 | 46,487 | 1.97 | % | ||||||||
Continental AG | 868 | 39,094 | 1.65 | % | ||||||||
Dana, Inc. | 3,286 | 37,555 | 1.59 | % | ||||||||
Faurecia SE | 3,427 | 37,748 | 1.60 | % | ||||||||
Ford Motor Co. | 3,241 | 36,300 | 1.54 | % | ||||||||
General Motors Co. | 1,210 | 38,838 | 1.64 | % | ||||||||
Lear Corp. | 355 | 42,521 | 1.80 | % | ||||||||
Magna International, Inc. | 863 | 40,948 | 1.73 | % | ||||||||
Renault SA | 1,694 | 46,468 | 1.97 | % | ||||||||
Sensata Technologies Holding PLC | 42,115 | 1,570,029 | 66.40 | % | ||||||||
Stellantis NV | 3,727 | 44,124 | 1.87 | % | ||||||||
Texas Instruments, Inc. | 293 | 45,318 | 1.92 | % | ||||||||
Toyota Motor Corp. | 343 | 44,730 | 1.89 | % | ||||||||
Valeo | 2,606 | 39,948 | 1.69 | % | ||||||||
Visteon Corp. | 393 | 41,654 | 1.76 | % | ||||||||
Volkswagen AG | 339 | 41,986 | 1.78 | % | ||||||||
Common Stocks Total | 2,364,003 | 100.00 | % | |||||||||
Total Long Securities (US Dollars) | 2,364,003 | |||||||||||
Remaining Securities and Cash | (53 | ) | ||||||||||
Grand Total (US Dollars) | USD 2,363,951 | |||||||||||
13
CPG Cooper Square International Equity, LLC
Schedule of Investments (Continued)
September 30, 2022
The following table represents the equity basket holdings underlying the total return swap with GS Swap GSCBSFIV Basket Index as of September 30, 2022.
GS Swap GSCBSFIV Basket Index
Description | Shares | Value | Percentage of Value | |||||||||
Long Securities | ||||||||||||
Common Stocks | ||||||||||||
Black Knight, Inc. | 1,115 | USD 72,165 | 2.11 | % | ||||||||
Block, Inc. | 1,014 | 55,757 | 1.63 | % | ||||||||
DLocal, Ltd./Uruguay | 2,840 | 58,278 | 1.70 | % | ||||||||
Envestnet, Inc. | 1,422 | 63,157 | 1.85 | % | ||||||||
Fidelity National Information Services, Inc. | 28,937 | 2,186,802 | 63.95 | % | ||||||||
Fiserv, Inc. | 700 | 65,488 | 1.91 | % | ||||||||
Global Payments, Inc. | 559 | 60,428 | 1.77 | % | ||||||||
Intuit, Inc. | 168 | 64,983 | 1.90 | % | ||||||||
Jack Henry & Associates, Inc. | 381 | 69,508 | 2.03 | % | ||||||||
Pagseguro Digital, Ltd. | 4,616 | 61,074 | 1.79 | % | ||||||||
PayPal Holdings, | 781 | 67,250 | 1.97 | % | ||||||||
Shift4 Payments, Inc. | 1,564 | 69,783 | 2.04 | % | ||||||||
SoFi Technologies, Inc. | 11,905 | 58,096 | 1.70 | % | ||||||||
StoneCo, Ltd. | 7,795 | 74,284 | 2.17 | % | ||||||||
Temenos AG | 885 | 60,522 | 1.77 | % | ||||||||
Toast, Inc. | 3,424 | 57,243 | 1.67 | % | ||||||||
Upstart Holdings, Inc. | 2,725 | 56,643 | 1.66 | % | ||||||||
Virtu Financial, Inc. | 3,338 | 69,333 | 2.03 | % | ||||||||
Wise PLC | 12,249 | 90,350 | 2.64 | % | ||||||||
Xero, Ltd. | 1,242 | 58,386 | 1.71 | % | ||||||||
Common Stocks Total | 3,419,529 | 100.00 | % | |||||||||
Total Long Securities (US Dollars) | 3,419,529 | |||||||||||
Remaining Securities and Cash | 545 | |||||||||||
Grand Total (US Dollars) | USD 3,420,074 | |||||||||||
14
CPG Cooper Square International Equity, LLC
Schedule of Investments (Continued)
September 30, 2022
The following table represents the equity basket holdings underlying the total return swap with BAML Swap MLGNBSKT Basket Index as of September 30, 2022.
BAML Swap MLGNBSKT Basket Index
Description | Shares | Value | Percentage of Value | |||||||||
Long Securities | ||||||||||||
Common Stocks | ||||||||||||
Assa Abloy AB | 894 | EUR 17,249 | 2.33 | % | ||||||||
Capgemini SE | 105 | 17,338 | 2.34 | % | ||||||||
Coloplast A/S | 158 | 16,433 | 2.22 | % | ||||||||
Compass Group PLC | 861 | 17,713 | 2.39 | % | ||||||||
Demant A/S | 607 | 15,409 | 2.08 | % | ||||||||
Deutsche Boerse AG | 111 | 18,733 | 2.53 | % | ||||||||
EssilorLuxottica SA | 122 | 17,109 | 2.31 | % | ||||||||
GN Store Nord AS | 22,646 | 408,310 | 55.15 | % | ||||||||
Heineken NV | 204 | 18,318 | 2.47 | % | ||||||||
Hexagon AB | 1,736 | 16,717 | 2.26 | % | ||||||||
Kerry Group PLC | 189 | 17,267 | 2.33 | % | ||||||||
Logitech International SA | 369 | 17,593 | 2.38 | % | ||||||||
L’Oreal SA | 54 | 17,946 | 2.42 | % | ||||||||
LVMH Moet Hennessy Louis Vuitton SE | 29 | 17,743 | 2.40 | % | ||||||||
Merck KGaA | 108 | 18,078 | 2.44 | % | ||||||||
Pernod Ricard SA | 100 | 18,940 | 2.56 | % | ||||||||
Sika AG | 79 | 16,518 | 2.23 | % | ||||||||
Temenos AG | 225 | 15,571 | 2.13 | % | ||||||||
Unilever PLC | 412 | 18,659 | 2.52 | % | ||||||||
Wolters Kluwer NV | 186 | 18,605 | 2.51 | % | ||||||||
Common Stocks Total | 740,428 | 100.00 | % | |||||||||
Total Long Securities (Euros) | 740,428 | |||||||||||
09/30 USDEUR Spot Rate of | 1.021 | |||||||||||
Grand Total (US Dollars) | USD 725,438 | |||||||||||
15
CPG Cooper Square International Equity, LLC
Schedule of Investments (Continued)
September 30, 2022
The following table represents the equity basket holdings underlying the total return swap with BAML Swap MLMROBSK Basket Index as of September 30, 2022.
BAML Swap MLMROBSK Basket Index
Description | Shares | Value | Percentage of Value | |||||||||
Long Securities | ||||||||||||
Common Stocks | ||||||||||||
Assa Abloy AB | 1,943 | GBP 32,867 | 1.97 | % | ||||||||
Capgemini SE | 228 | 33,038 | 1.98 | % | ||||||||
Coloplast A/S | 342 | 31,311 | 1.88 | % | ||||||||
Compass Group PLC | 1,870 | 33,751 | 2.03 | % | ||||||||
Dassault Systemes SE | 1,055 | 33,058 | 1.99 | % | ||||||||
Deutsche Boerse AG | 242 | 35,696 | 2.14 | % | ||||||||
Diageo PLC | 939 | 35,657 | 2.14 | % | ||||||||
EssilorLuxottica SA | 265 | 32,599 | 1.96 | % | ||||||||
Heineken NV | 443 | 34,906 | 2.10 | % | ||||||||
Hexagon AB | 3,771 | 31,853 | 1.91 | % | ||||||||
Kerry Group PLC | 411 | 32,902 | 1.98 | % | ||||||||
L’Oreal SA | 118 | 34,198 | 2.05 | % | ||||||||
LVMH Moet Hennessy Louis Vuitton SE | 63 | 33,801 | 2.03 | % | ||||||||
Melrose Industries PLC | 1,003,356 | 1,025,429 | 61.64 | % | ||||||||
Merck KGaA | 235 | 34,447 | 2.07 | % | ||||||||
Pernod Ricard SA | 218 | 36,090 | 2.17 | % | ||||||||
Sika AG | 172 | 31,470 | 1.89 | % | ||||||||
Temenos AG | 489 | 30,009 | 1.80 | % | ||||||||
Unilever PLC | 896 | 35,552 | 2.14 | % | ||||||||
Wolters Kluwer NV | 405 | 35,451 | 2.13 | % | ||||||||
Common Stocks Total | 1,664,084 | 100.00 | % | |||||||||
Total Long Securities (British Pounds) | 1,664,084 | |||||||||||
09/30 USDGBP Spot Rate of | 0.896 | |||||||||||
Grand Total (US Dollars) | USD 1,858,066 | |||||||||||
16
CPG Cooper Square International Equity, LLC
Schedule of Investments (Continued)
September 30, 2022
The following table represents the equity basket holdings underlying the total return swap with BAML Swap MLSAFRAN Basket Index as of September 30, 2022.
BAML Swap MLSAFRAN Basket Index
Description | Shares | Value | Percentage of Value | |||||||||
Long Securities | ||||||||||||
Common Stocks | ||||||||||||
Assa Abloy AB | 3,102 | EUR 59,843 | 1.89 | % | ||||||||
Capgemini SE | 361 | 59,762 | 1.88 | % | ||||||||
Coloplast A/S | 568 | 59,228 | 1.87 | % | ||||||||
Compass Group PLC | 2,922 | 60,138 | 1.89 | % | ||||||||
Dassault Systemes SE | 1,637 | 58,505 | 1.84 | % | ||||||||
Deutsche Boerse AG | 375 | 63,172 | 1.99 | % | ||||||||
Diageo PLC | 1,432 | 62,019 | 1.95 | % | ||||||||
EssilorLuxottica SA | 419 | 58,769 | 1.85 | % | ||||||||
Heineken NV | 703 | 61,130 | 1.99 | % | ||||||||
Hexagon AB | 6,019 | 57,976 | 1.83 | % | ||||||||
Kerry Group PLC | 615 | 56,121 | 1.77 | % | ||||||||
L’Oreal SA | 185 | 60,949 | 1.92 | % | ||||||||
LVMH Moet Hennessy Louis Vuitton SE | 96 | 58,317 | 1.84 | % | ||||||||
Merck KGaA | 368 | 61,460 | 1.94 | % | ||||||||
Pernod Ricard SA | 341 | 64,318 | 2.03 | % | ||||||||
Safran SA | 21,627 | 2,033,171 | 64.05 | % | ||||||||
Sika AG | 275 | 57,310 | 1.81 | % | ||||||||
Temenos AG | 806 | 56,393 | 1.78 | % | ||||||||
Unilever PLC | 1,377 | 62,131 | 1.96 | % | ||||||||
Wolters Kluwer NV | 609 | 60,835 | 1.92 | % | ||||||||
Common Stocks Total | 3,173,737 | 100.00 | % | |||||||||
Total Long Securities (Euros) | 3,173,737 | |||||||||||
09/30 USDEUR Spot Rate of | 1.021 | |||||||||||
Grand Total (US Dollars) | USD 3,109,014 | |||||||||||
17
CPG Cooper Square International Equity, LLC
Schedule of Investments (Continued)
September 30, 2022
The following table represents the equity basket holdings underlying the total return swap with BAML Swap MLSAPBSK Basket Index as of September 30, 2022.
BAML Swap MLSAPBSK Basket Index
Description | Shares | Value | Percentage of Value | |||||||||
Long Securities | ||||||||||||
Common Stocks | ||||||||||||
Assa Abloy AB | 2,798 | EUR 53,975 | 1.78 | % | ||||||||
Capgemini SE | 326 | 53,901 | 1.78 | % | ||||||||
Coloplast A/S | 512 | 53,420 | 1.76 | % | ||||||||
Compass Group PLC | 2,635 | 54,241 | 1.79 | % | ||||||||
Dassault Systemes SE | 1,477 | 52,768 | 1.74 | % | ||||||||
Deutsche Boerse AG | 339 | 56,977 | 1.88 | % | ||||||||
Diageo PLC | 1,292 | 55,937 | 1.85 | % | ||||||||
EssilorLuxottica SA | 378 | 53,006 | 1.75 | % | ||||||||
Heineken NV | 634 | 56,939 | 1.88 | % | ||||||||
Hexagon AB | 5,429 | 52,291 | 1.73 | % | ||||||||
Kerry Group PLC | 555 | 50,617 | 1.67 | % | ||||||||
L’Oreal SA | 166 | 54,972 | 1.81 | % | ||||||||
LVMH Moet Hennessy Louis Vuitton SE | 86 | 52,599 | 1.74 | % | ||||||||
Merck KGaA | 332 | 55,433 | 1.83 | % | ||||||||
Pernod Ricard SA | 307 | 58,011 | 1.91 | % | ||||||||
SAP SE | 23,786 | 2,000,853 | 66.04 | % | ||||||||
Sika AG | 248 | 51,690 | 1.71 | % | ||||||||
Temenos AG | 727 | 50,863 | 1.68 | % | ||||||||
Unilever PLC | 1,242 | 56,210 | 1.86 | % | ||||||||
Wolters Kluwer NV | 549 | 54,870 | 1.81 | % | ||||||||
Common Stocks Total | 3,029,571 | 100.00 | % | |||||||||
Total Long Securities (Euros) | 3,029,571 | |||||||||||
09/30 USDEUR Spot Rate of | 1.021 | |||||||||||
Grand Total (US Dollars) | USD 2,967,898 | |||||||||||
18
CPG Cooper Square International Equity, LLC
Schedule of Investments (Continued)
September 30, 2022
The following table represents the equity basket holdings underlying the total return swap with BAML Swap MLSUBSKT Basket Index as of September 30, 2022.
BAML Swap MLSUBSKT Basket Index
Description | Shares | Value | Percentage of Value | |||||||||
Long Securities | ||||||||||||
Common Stocks | ||||||||||||
Assa Abloy AB | 2,090 | EUR 40,322 | 1.83 | % | ||||||||
Capgemini SE | 243 | 40,267 | 1.83 | % | ||||||||
Coloplast A/S | 383 | 39,907 | 1.81 | % | ||||||||
Compass Group PLC | 1,969 | 40,520 | 1.84 | % | ||||||||
Dassault Systemes SE | 1,103 | 39,420 | 1.79 | % | ||||||||
Deutsche Boerse AG | 253 | 42,564 | 1.93 | % | ||||||||
Diageo PLC | 965 | 41,787 | 1.90 | % | ||||||||
EssilorLuxottica SA | 282 | 39,598 | 1.80 | % | ||||||||
Heineken NV | 473 | 42,536 | 1.93 | % | ||||||||
Hexagon AB | 4,056 | 39,063 | 1.77 | % | ||||||||
Kerry Group PLC | 415 | 37,813 | 1.72 | % | ||||||||
L’Oreal SA | 124 | 41,067 | 1.86 | % | ||||||||
LVMH Moet Hennessy Louis Vuitton SE | 64 | 39,294 | 1.78 | % | ||||||||
Merck KGaA | 248 | 41,411 | 1.88 | % | ||||||||
Pernod Ricard SA | 229 | 43,337 | 1.97 | % | ||||||||
Schneider Electric SE | 12,261 | 1,433,855 | 65.11 | % | ||||||||
Sika AG | 185 | 38,615 | 1.75 | % | ||||||||
Temenos AG | 543 | 37,997 | 1.73 | % | ||||||||
Unilever PLC | 928 | 41,991 | 1.91 | % | ||||||||
Wolters Kluwer NV | 410 | 40,990 | 1.86 | % | ||||||||
Common Stocks Total | 2,202,354 | 100.00 | % | |||||||||
Total Long Securities (Euros) | 2,202,354 | |||||||||||
09/30 USDEUR Spot Rate of | 1.021 | |||||||||||
Grand Total (US Dollars) | USD 2,157,339 | |||||||||||
19
CPG Cooper Square International Equity, LLC
Schedule of Investments (Continued)
September 30, 2022
The following table represents the equity basket holdings underlying the total return swap with BAML Swap MLWLNBSK Basket Index as of September 30, 2022.
BAML Swap MLWLNBSK Basket Index
Description | Shares | Value | Percentage of Value | |||||||||
Long Securities | ||||||||||||
Common Stocks | ||||||||||||
Assa Abloy AB | 1,693 | EUR 32,666 | 1.83 | % | ||||||||
Capgemini SE | 197 | 32,621 | 1.82 | % | ||||||||
Coloplast A/S | 310 | 32,330 | 1.81 | % | ||||||||
Compass Group PLC | 1,595 | 32,827 | 1.83 | % | ||||||||
Dassault Systemes SE | 894 | 31,935 | 1.78 | % | ||||||||
Deutsche Boerse AG | 205 | 34,483 | 1.93 | % | ||||||||
Diageo PLC | 782 | 33,853 | 1.89 | % | ||||||||
EssilorLuxottica SA | 229 | 32,079 | 1.79 | % | ||||||||
Heineken NV | 383 | 34,460 | 1.93 | % | ||||||||
Hexagon AB | 3,286 | 31,647 | 1.77 | % | ||||||||
Kerry Group PLC | 336 | 30,634 | 1.71 | % | ||||||||
L’Oreal SA | 101 | 33,270 | 1.86 | % | ||||||||
LVMH Moet Hennessy Louis Vuitton SE | 52 | 31,833 | 1.78 | % | ||||||||
Merck KGaA | 201 | 33,548 | 1.87 | % | ||||||||
Pernod Ricard SA | 186 | 35,109 | 1.96 | % | ||||||||
Sika AG | 150 | 31,283 | 1.75 | % | ||||||||
Temenos AG | 440 | 30,782 | 1.72 | % | ||||||||
Unilever PLC | 752 | 34,018 | 1.90 | % | ||||||||
Wolters Kluwer NV | 332 | 33,208 | 1.86 | % | ||||||||
Worldline SA/France | 28,682 | 1,166,786 | 65.11 | % | ||||||||
Common Stocks Total | 1,789,374 | 100.00 | % | |||||||||
Total Long Securities (Euros) | 1,789,374 | |||||||||||
09/30 USDEUR Spot Rate of | 1.021 | |||||||||||
Grand Total (US Dollars) | USD 1,752,876 | |||||||||||
20
CPG Cooper Square International Equity, LLC
Schedule of Investments (Continued)
September 30, 2022
The following table represents the equity basket holdings underlying the total return swap with MS Swap MSJDBSKT Basket Index as of September 30, 2022.
MS Swap MSJDBSKT Basket Index
Description | Shares | Value | Percentage of Value | |||||||||
Long Securities | ||||||||||||
Common Stocks | ||||||||||||
Alibaba Group Holding, Ltd. | 5,945 | HKD 463,386 | 1.86 | % | ||||||||
ANTA Sports Products, Ltd. | 5,771 | 480,159 | 1.93 | % | ||||||||
Baidu, Inc. | 3,885 | 443,305 | 1.78 | % | ||||||||
Budweiser Brewing Co APAC, Ltd. | 24,945 | 512,627 | 2.06 | % | ||||||||
BYD Co., Ltd. | 2,409 | 468,306 | 1.88 | % | ||||||||
China Mengniu Dairy Co., Ltd. | 16,177 | 503,904 | 2.02 | % | ||||||||
China Resources Beer Holdings Co., Ltd. | 10,044 | 548,896 | 2.20 | % | ||||||||
CITIC, Ltd. | 65,101 | 481,750 | 1.93 | % | ||||||||
CLP Holdings, Ltd. | 8,138 | 482,970 | 1.94 | % | ||||||||
Galaxy Entertainment Group, Ltd. | 12,605 | 584,882 | 2.35 | % | ||||||||
Geely Automobile Holdings, Ltd. | 37,700 | 407,913 | 1.64 | % | ||||||||
Hengan International Group Co., Ltd. | 14,829 | 520,485 | 2.09 | % | ||||||||
Hong Kong & China Gas Co., Ltd. | 72,531 | 501,917 | 2.01 | % | ||||||||
JD.com, Inc. | 79,200 | 15,729,069 | 63.12 | % | ||||||||
Li Ning Co., Ltd. | 7,944 | 477,429 | 1.92 | % | ||||||||
Meituan | 2,967 | 491,397 | 1.97 | % | ||||||||
MTR Corp, Ltd. | 13,312 | 479,915 | 1.93 | % | ||||||||
NetEase, Inc. | 3,854 | 456,743 | 1.83 | % | ||||||||
Techtronic Industries Co., Ltd. | 5,535 | 419,814 | 1.68 | % | ||||||||
Tencent Holdings, Ltd. | 1,739 | 463,233 | 1.86 | % | ||||||||
Common Stocks Total | 24,918,100 | 100.00 | % | |||||||||
Total Long Securities (Hong Kong Dollars) | 24,918,100 | |||||||||||
09/30 USDHKD Spot Rate of | 7.850 | |||||||||||
Grand Total (US Dollars) | USD 3,174,402 | |||||||||||
21
CPG Cooper Square International Equity, LLC
Schedule of Investments (Continued)
September 30, 2022
Securities Sold Short
Common Stocks (33.84%) | Shares | Fair Value | ||||||
Bermuda (1.81%) | ||||||||
Triton International, Ltd. | (20,107 | ) | $ | (1,100,453 | ) | |||
Canada (0.21%) | ||||||||
BRP, Inc. | (2,045 | ) | (126,640 | ) | ||||
Finland (0.38%) | ||||||||
Stora Enso Oyj | (17,921 | ) | (229,812 | ) | ||||
France (2.32%) | ||||||||
Aeroports de Paris | (560 | ) | (65,284 | ) | ||||
Kering SA | (1,137 | ) | (510,761 | ) | ||||
Remy Cointreau SA | (4,984 | ) | (834,432 | ) | ||||
| (1,410,477 | ) | |||||||
Germany (1.83%) | ||||||||
adidas AG | (1,648 | ) | (191,927 | ) | ||||
Bayerische Motoren Werke AG | (2,078 | ) | (142,479 | ) | ||||
Mercedes-Benz Group AG | (13,291 | ) | (681,624 | ) | ||||
Puma SE | (2,094 | ) | (98,405 | ) | ||||
| (1,114,435 | ) | |||||||
Great Britain (6.00%) | ||||||||
Amcor PLC | (40,622 | ) | (435,874 | ) | ||||
Barclays PLC | (272,923 | ) | (439,630 | ) | ||||
Ferguson PLC | (4,476 | ) | (460,715 | ) | ||||
Intercontinental Hotels Group | (7,068 | ) | (344,714 | ) | ||||
International Consolidated Airlines Group SA | (62,091 | ) | (65,618 | ) | ||||
Lloyds Banking Group PLC | (2,177,307 | ) | (1,005,995 | ) | ||||
Lyx Ftse Mib Dr | (9,426 | ) | (185,238 | ) | ||||
RELX PLC | (5,500 | ) | (135,195 | ) | ||||
Segro PLC | (12,046 | ) | (101,255 | ) | ||||
Whitbread PLC | (18,504 | ) | (475,501 | ) | ||||
| (3,649,735 | ) | |||||||
India (0.07%) | ||||||||
Infosys, Ltd., ADR | (2,534 | ) | (43,002 | ) | ||||
Japan (4.16%) | ||||||||
Disco Corp. | (2,630 | ) | (581,436 | ) | ||||
Nippon Yusen KK | (61,590 | ) | (1,049,729 | ) | ||||
Shimano, Inc. | (4,460 | ) | (700,683 | ) | ||||
Shiseido Co., Ltd. | (5,740 | ) | (200,500 | ) | ||||
| (2,532,348 | ) | |||||||
22
CPG Cooper Square International Equity, LLC
Schedule of Investments (Continued)
September 30, 2022
Common Stocks (continued) | Shares | Fair Value | ||||||
Netherlands (2.35%) | ||||||||
BE Semiconductor Industries NV | (2,812 | ) | $ | (122,835 | ) | |||
JDE Peet’s NV | (6,810 | ) | (199,742 | ) | ||||
Randstad NV | (4,137 | ) | (180,674 | ) | ||||
STMicroelectronics NV | (29,396 | ) | (928,585 | ) | ||||
| (1,431,836 | ) | |||||||
Norway (0.28%) | ||||||||
Nordic Semiconductor ASA | (12,958 | ) | (173,015 | ) | ||||
Sweden (3.41%) | ||||||||
Atlas Copco AB | (69,697 | ) | (585,712 | ) | ||||
EQT AB | (31,902 | ) | (629,847 | ) | ||||
H & M Hennes & Mauritz AB, Class B | (92,070 | ) | (858,352 | ) | ||||
| (2,073,911 | ) | |||||||
Switzerland (4.32%) | ||||||||
ABB, Ltd. | (15,606 | ) | (409,078 | ) | ||||
Cie Financiere Richemont SA, Class A | (3,216 | ) | (308,056 | ) | ||||
Dufry AG | (5,443 | ) | (167,949 | ) | ||||
Kuehne + Nagel International AG | (2,415 | ) | (495,636 | ) | ||||
Lonza Group AG | (619 | ) | (305,837 | ) | ||||
Nestle SA | (3,481 | ) | (378,710 | ) | ||||
Swisscom AG | (1,189 | ) | (559,920 | ) | ||||
| (2,625,186 | ) | |||||||
Taiwan (0.56%) | ||||||||
United Microelectronics Corp., Sponsored ADR | (61,490 | ) | (342,499 | ) | ||||
United States (6.12%) | ||||||||
Airbnb, Inc., Class A | (992 | ) | (104,200 | ) | ||||
AutoNation, Inc. | (2,958 | ) | (301,331 | ) | ||||
Blackstone, Inc. | (3,635 | ) | (304,250 | ) | ||||
Brunswick Corp. | (1,807 | ) | (118,268 | ) | ||||
CBRE Group, Inc. | (3,092 | ) | (208,741 | ) | ||||
CSX Corp. | (4,102 | ) | (109,277 | ) | ||||
Installed Building Products, Inc. | (4,027 | ) | (326,147 | ) | ||||
iShares MSCI Spain ETF | (7,567 | ) | (149,978 | ) | ||||
iShares MSCI Taiwan ETF | (11,025 | ) | (475,178 | ) | ||||
JB Hunt Transport Services, Inc. | (3,992 | ) | (624,429 | ) | ||||
Medpace Holdings, Inc. | (426 | ) | (66,954 | ) | ||||
Norfolk Southern Corp. | (526 | ) | (110,276 | ) | ||||
Polaris, Inc. | (133 | ) | (12,721 | ) | ||||
Procter & Gamble Co. | (774 | ) | (97,718 | ) | ||||
23
CPG Cooper Square International Equity, LLC
Schedule of Investments (Continued)
September 30, 2022
Common Stocks (continued) | Shares | Fair Value | ||||||
Thor Industries, Inc. | (8,019 | ) | $ | (561,170 | ) | |||
TopBuild Corp. | (926 | ) | (152,586 | ) | ||||
| (3,723,224 | ) | |||||||
Total Common Stocks | ||||||||
(Proceeds $23,599,227) | $ | (20,576,573 | ) | |||||
Exchange Traded Funds (4.79%) | ||||||||
Invesco DB US Dollar Index Bullish Fund | (15,423 | ) | (465,003 | ) | ||||
iShares® Core MSCI Total International Stock ETF | (7,570 | ) | (385,464 | ) | ||||
iShares® MSCI ACWI ex US ETF | (9,929 | ) | (397,259 | ) | ||||
iShares® MSCI Brazil ETF | (2,698 | ) | (79,942 | ) | ||||
Vanguard® FTSE Europe ETF | (8,243 | ) | (380,414 | ) | ||||
Vanguard® Total International Stock ETF | (8,663 | ) | (396,506 | ) | ||||
WisdomTree India Earnings Fund | (26,691 | ) | (815,143 | ) | ||||
Total Exchange Traded Funds | ||||||||
(Proceeds $3,651,923) | $ | (2,919,731 | ) | |||||
Total Securities Sold Short (38.64%) | ||||||||
(Proceeds $27,251,150) | $ | (23,496,304 | ) | |||||
PUT OPTIONS WRITTEN
| Underlying Security | Counterparty | Expiration Date | Strike Price | Contracts | Notional Amount | Value | ||||||||||||||
| DAX Index | Morgan Stanley | 12/16/2022 | $ | 10,500 | (305 | ) | $ | (3,694,880 | ) | $ | (54,125 | ) | ||||||||
| EURO STOXX 50 Index | Morgan Stanley | 12/16/2022 | 2,850 | (1,150 | ) | (3,815,930 | ) | (54,140 | ) | |||||||||||
| $ | (7,510,810 | ) | $ | (108,265 | ) | |||||||||||||||
See accompanying Notes to Schedule of Investments.
24
CPG Cooper Square International Equity, LLC
Statement of Assets and Liabilities
September 30, 2022
Assets | ||||
Investments, at fair value (Cost $52,047,739) | $ | 36,792,625 | ||
Cash | 54,133,857 | |||
Cash denominated in foreign currencies (Cost $10,668) | 32,223 | |||
Due from broker | 4,000,000 | |||
Foreign tax reclaims | 72,777 | |||
Dividends receivable | 190,673 | |||
Receivable for total return swap contracts receipts | 181,993 | |||
Unrealized appreciation on total return swap contracts (net of premiums paid $0) | 1,357,768 | |||
Receivable for Investments sold | 1,546,455 | |||
Due from Adviser | 491,505 | |||
Prepaid Board Retainer | 18,098 | |||
Prepaid expenses and other assets | 25,270 | |||
Total Assets | 98,843,244 | |||
Liabilities | ||||
Securities sold short, at value (Proceeds $27,251,152) | 23,496,304 | |||
Unrealized depreciation on total return swap contracts (net of premiums paid $0) | 7,079,317 | |||
Payable for shares repurchased | 4,189,736 | |||
Payable for Investments purchased | 1,480,484 | |||
Payable to Advisor | 426,509 | |||
Professional fees payable | 262,947 | |||
Payable for total return swap contracts payments | 443,333 | |||
Payable for short sale dividends | 171,509 | |||
Written Options, at value | 108,265 | |||
Accounting and administration fees payable | 34,986 | |||
Distribution and servicing fees payable | 24,746 | |||
Directors’ and Officer fees payable | 11,678 | |||
Accounts payable and other accrued expenses | 311,469 | |||
Total Liabilities | 38,041,283 | |||
Net Assets | $ | 60,801,961 | ||
Composition of Net Assets | ||||
Paid-in capital | $ | 95,461,895 | ||
Total distributable earnings (loss) | (34,659,934 | ) | ||
Net Assets | $ | 60,801,961 | ||
Net Assets Attributable to: | ||||
Class A Units | $ | 36,901,173 | ||
Class I Units | 23,900,788 | |||
| $ | 60,801,961 | |||
Units of Beneficial Interest Outstanding (Unlimited Number of Units Authorized): | ||||
Class A Units | $ | 3,584,378 | ||
Class I Units | 1,716,958 | |||
| $ | 5,301,336 | |||
Net Asset Value per Unit: | ||||
Class A Units | $ | 10.29 | ||
Class I Units | 13.92 |
See accompanying Notes to Financial Statements.
25
CPG Cooper Square International Equity, LLC
Statement of Operations
For the Year Ended September 30, 2022
Investment Income | ||||
Dividend income (net, Foreign withholding tax $(51,675)) | $ | 712,501 | ||
Investment Income | 712,501 | |||
Expenses | ||||
Management fee | 1,041,177 | |||
Transfer agent fees | 70,837 | |||
Accounting and administration fees | 157,646 | |||
Professional fees | 347,035 | |||
Distribution fees | ||||
Class A | 384,192 | |||
Offering costs | 37,248 | |||
Dividend expense on short sales | 1,034,338 | |||
Directors’ and Officer fees | 135,364 | |||
Custody fees | 81,448 | |||
Insurance expense | 4,007 | |||
Other fees | 47,809 | |||
Total Expenses | 3,341,101 | |||
Less fees waived/reimbursed by Adviser | ||||
Class A Shares | (221,057 | ) | ||
Class I Shares | (139,115 | ) | ||
Net expenses | 2,980,929 | |||
NET INVESTMENT LOSS | (2,268,428 | ) | ||
Net Realized Gain/(Loss) and Change in Unrealized Appreciation/(Depreciation) | ||||
Net realized gain/(loss) from: | ||||
Investments | (12,509,396 | ) | ||
Securities sold short | 5,633,795 | |||
Written Options | (1,208 | ) | ||
Total return swap contracts | (6,732,025 | ) | ||
Forward foreign currency contracts | 3,656 | |||
Foreign currency transactions | (146,098 | ) | ||
Net change in unrealized appreciation/(depreciation) on: | ||||
Investments | (16,812,751 | ) | ||
Securities sold short | 4,632,645 | |||
Written Options | 3,973 | |||
Total return swap contracts | (6,094,643 | ) | ||
Foreign currency | 15,372 | |||
Net Realized Gain/(Loss) and Change in Unrealized Appreciation/(Depreciation) | (32,006,680 | ) | ||
Net Decrease in Net Assets Resulting from Operations | $ | (34,275,108 | ) |
See accompanying Notes to Financial Statements.
26
CPG Cooper Square International Equity, LLC
Statements of Changes in Net Assets
| For the | For the Period | ||||||
Changes in Net Assets Resulting from Operations | ||||||||
Net investment loss | $ | (2,268,428 | ) | $ | (1,333,289 | ) | ||
Net realized gain/(loss) | (13,751,276 | ) | 1,044,124 | |||||
Net change in unrealized appreciation/(depreciation) | (18,255,404 | ) | 1,050,518 | |||||
Net Change in Assets Resulting from Operations | (34,275,108 | ) | 761,353 | |||||
Distributions to investors | ||||||||
Class A Units | (712,220 | ) | — | |||||
Class I Units | (434,361 | ) | — | |||||
Net Change in Net Assets from Distributions to Investors | (1,146,581 | ) | — | |||||
Change in Net Assets Resulting from Capital Transactions | ||||||||
Class A Units | ||||||||
Capital contributions | 10,569,300 | 55,227,115 | ||||||
Reinvested distributions | 703,585 | — | ||||||
Capital withdrawals | (7,476,514 | ) | — | |||||
Total Class A Units Transactions | 3,796,371 | 55,227,115 | ||||||
Class I Units | ||||||||
Capital contributions | 7,506,970 | 32,327,980 | ||||||
Reinvested distributions | 427,833 | — | ||||||
Capital withdrawals | (3,923,972 | ) | — | |||||
Total Class I Units Transactions | 4,010,831 | 32,327,980 | ||||||
Net Change in Net Assets Resulting from Capital Transactions | 7,807,202 | 87,555,095 | ||||||
Total Net increase/(decrease) in Net Assets | (27,614,487 | ) | 88,316,448 | |||||
Net Assets | ||||||||
Beginning of year | 88,416,448 | 100,000 | ||||||
End of year | $ | 60,801,961 | $ | 88,416,448 | ||||
Unit Activity | ||||||||
Class A Units | ||||||||
Capital contributions | 722,968 | 3,462,223 | ||||||
Reinvested distributions | 47,860 | — | ||||||
Capital withdrawals | (652,007 | ) | — | |||||
Net Change in Class A Units Outstanding | 118,821 | 3,462,223 | ||||||
Class I Units | ||||||||
Capital contributions | 391,350 | 1,558,014 | ||||||
Reinvested distributions | 21,628 | — | ||||||
Capital withdrawals | (256,535 | ) | — | |||||
Net Change in Class I Units Outstanding | 156,443 | 1,558,014 | ||||||
Total Change in Units Outstanding | 275,264 | 5,020,237 | ||||||
See accompanying Notes to Financial Statements.
27
CPG Cooper Square International Equity, LLC
Financial Highlights
Class A
| For the | For the Period | ||||||
PER UNIT OPERATING PERFORMANCE: | ||||||||
NET ASSET VALUE, BEGINNING OF PERIOD | $ | 15.90 | $ | 15.00 | ||||
Activity from investment operations:(1) | ||||||||
Net investment loss(2) | (0.40 | ) | (0.32 | ) | ||||
Net realized and unrealized gain/(loss) | (5.01 | ) | 1.22 | |||||
Total from investment operations | (5.41 | ) | 0.90 | |||||
Distributions to investors | ||||||||
From net realized gains | (0.20 | ) | — | |||||
Total distributions to investors | (0.20 | ) | — | |||||
NET ASSET VALUE, END OF PERIOD | $ | 10.29 | $ | 15.90 | ||||
Net assets, end of period (in thousands) | $ | 36,901 | $ | 55,083 | ||||
RATIOS TO AVERAGE NET ASSETS (including interest expense and dividend expense on securities sold short) | ||||||||
Operating expenses excluding fee waivers/reimbursements | 4.27 | % | 5.11 | %(3) | ||||
Operating expenses including fee waivers/reimbursements | 3.84 | % | 3.77 | %(3) | ||||
Net investment loss including fee waivers/reimbursements | (2.99 | )% | (2.20 | )%(3) | ||||
RATIOS TO AVERAGE NET ASSETS (excluding interest expense and dividend expense on securities sold short) | ||||||||
Operating expenses excluding fee waivers/reimbursements | 3.04 | % | 3.95 | %(3) | ||||
Operating expenses including fee waivers/reimbursements | 2.61 | % | 2.61 | %(3) | ||||
Net investment loss including fee waivers/reimbursements | (1.76 | )% | (1.04 | )%(3) | ||||
Portfolio turnover rate | 78 | % | 78 | %(4) | ||||
Total return(5) | (34.37 | )% | 6.00 | %(6) | ||||
Total return excluding incentive fees(7) | (34.37 | )% | 6.00 | %(6) | ||||
(1) | Selected data is for a single unit outstanding throughout the period. |
(2) | Based on average shares outstanding during the period. |
(3) | Net investment loss and operating expenses ratios are annualized for periods less than one full year, except for organizational costs which are one-time expenses. |
(4) | Portfolio turnover rate for periods less than one year is not annualized and does not include securities received or delivered from processing creations or redemptions in-kind. |
(5) | Total return reflects the changes in net asset value and adjusted for cash flows related to capital contributions and withdrawals during the period. Total returns shown exclude the effect of applicable sales charges and redemption fees. |
(6) | Not annualized. |
(7) | Class A did not incur any incentive fees during the period. |
See accompanying Notes to Financial Statements.
28
CPG Cooper Square International Equity, LLC
Financial Highlights
Class I
| For the | For the Period | ||||||
PER UNIT OPERATING PERFORMANCE: | ||||||||
NET ASSET VALUE, BEGINNING OF PERIOD | $ | 21.36 | $ | 20.00 | ||||
Activity from investment operations:(1) | ||||||||
Net investment loss(2) | (0.40 | ) | (0.49 | ) | ||||
Net realized and unrealized gain/(loss) | (6.78 | ) | 1.85 | |||||
Total from investment operations | (7.18 | ) | 1.36 | |||||
Distributions to investors | ||||||||
From net realized gains | (0.26 | ) | — | |||||
Total distributions to investors | (0.26 | ) | — | |||||
NET ASSET VALUE, END OF PERIOD | $ | 13.92 | $ | 21.36 | ||||
Net assets, end of period (in thousands) | $ | 23,901 | $ | 33,333 | ||||
RATIOS TO AVERAGE NET ASSETS (including interest expense and dividend expense on securities sold short) | ||||||||
Operating expenses excluding fee waivers/reimbursements | 3.53 | % | 5.42 | %(3) | ||||
Operating expenses including fee waivers/reimbursements | 3.10 | % | 3.85 | %(3) | ||||
Net investment loss including fee waivers/reimbursements | (2.25 | )% | (2.39 | )%(3) | ||||
RATIOS TO AVERAGE NET ASSETS (excluding interest expense and dividend expense on securities sold short) | ||||||||
Operating expenses excluding fee waivers/reimbursements | 2.29 | % | 4.36 | %(3) | ||||
Operating expenses including fee waivers/reimbursements | 1.86 | % | 2.79 | %(3) | ||||
Net investment loss including fee waivers/reimbursements | (1.01 | )% | (1.33 | )%(3) | ||||
Portfolio turnover rate | 78 | % | 78 | %(4) | ||||
Total return(5) | (33.97 | )% | 6.80 | %(6) | ||||
Total return excluding incentive fees | (33.97 | )%(7) | 7.55 | %(6) | ||||
(1) | Selected data is for a single unit outstanding throughout the period. |
(2) | Based on average shares outstanding during the period. |
(3) | Net investment loss and operating expenses ratios are annualized for periods less than one full year, except for organizational costs which are one-time expenses. |
(4) | Portfolio turnover rate for periods less than one year is not annualized and does not include securities received or delivered from processing creations or redemptions in-kind. |
(5) | Total return reflects the changes in net asset value and adjusted for cash flows related to capital contributions and withdrawals during the period. Total returns shown exclude the effect of applicable sales charges and redemption fees. |
(6) | Not annualized. |
(7) | Class I did not incur any incentive fees during the period. |
See accompanying Notes to Financial Statements.
29
CPG Cooper Square International Equity, LLC
Notes to Financial Statements
September 30, 2022
1. ORGANIZATION
CPG Cooper Square International Equity, LLC (the “Fund”) was organized as a Delaware limited liability company on July 14, 2020. The Fund is registered under the Investment Company Act of 1940, as amended (the “1940 Act”), as a closed-end, non-diversified management investment company. The Fund commenced operations on November 2, 2020. The Fund’s investment adviser is Central Park Advisers, LLC (the “Adviser”), a Delaware Limited Liability Company registered under the Investment Advisers Act of 1940, as amended (the “Advisers Act”). The Fund’s investment sub-adviser (the “Sub-Adviser”) is Select Equity Group, L.P., a Delaware limited partnership registered under the Advisers Act. The Sub-Adviser is responsible for the day-to-day management of the Fund’s portfolio. The Fund’s investment objective is to seek to achieve maximum total return. The Fund seeks to achieve its investment objective by investing primarily in equity securities of non-U.S.-domiciled issuers, including those domiciled in emerging markets. Under normal circumstances, the Fund invests at least 80% of its net assets, plus any borrowings for investment purposes, in equity securities. For purposes of the Fund’s investment program, “Equity securities” means common and preferred stocks (including investments in initial public offerings), convertible securities, warrants and rights. The Fund may invest in equity securities without restriction to market capitalization. Under extraordinary circumstances, the Fund may acquire substantial stakes in public companies; however, the Fund generally does not invest more than 10% of its net asset value (measured at the time of purchase) in the voting securities of any one investment. The Fund may seek to obtain exposure to particular issuers or securities through derivative transactions, including, without limitation, swaps (including total return swaps), contracts for differences, options and other types of derivative arrangements for investment or hedging purposes.
Subject to the requirements of the 1940 Act, the business and affairs of the Fund shall be managed under the direction of the Fund’s Board of Directors (the “Board,” with an individual member referred to as a “Director”). The Board has the right, power and authority, on behalf of the Fund and in its name, to do all things necessary and proper to carry out its duties under the Fund’s Limited Liability Company Agreement, as amended and restated from time to time. Each Director shall be vested with the same powers, authority and responsibilities on behalf of the Fund as are customarily vested in each director of a Delaware corporation, and each Director who is not an “interested person” (as defined in the 1940 Act) of the Fund shall be vested with the same powers, authority and responsibilities on behalf of the Fund as are customarily vested in each director of a closed-end management investment company registered under the 1940 Act that is organized as a Delaware corporation who is not an “interested person” of such company. No Director shall have the authority individually to act on behalf of or to bind the Fund except within the scope of such Director’s authority as delegated by the Board. The Board may delegate the management of the Fund’s day-to-day operations to one or more officers or other persons (including, without limitation, the Adviser), subject to the investment objective and policies of the Fund and to the oversight of the Board.
The Fund offers two classes of limited liability company interests (“Units”), Class A Units and Class I Units, which are registered under the Securities Act of 1933, as amended, and offered to qualified clients as defined in Rule 205-3 under the Advisers Act. Each class of Units has certain differing characteristics, particularly in terms of the distribution fees that may be charged to investors. While neither the Fund nor Delaware Distributors, LP, the distributor for the Fund (the “Distributor”), imposes a sales load on purchases of Class A or Class I Units, financial intermediaries may directly charge Class A investors certain transaction or other fees in such amounts as they may determine. Under the terms of the Fund’s distribution agreement, the Distributor is authorized to pay third parties, including brokers, dealers and certain financial advisors (which may include wealth advisors) and others (collectively, “Selling Agents”) for the provision of distribution services as contemplated by Rule 12b-1 under the 1940 Act and for non-12b-1 services to investors holding Class A Units. The Fund pays the Distributor a monthly fee out of the net assets of Class A Units at the annual rate of 0.75% of the net asset value of Class A Units determined and accrued as of the end of each month (before any repurchases of Class A Units, but after the Management Fee (defined below) is calculated and accrued) (the “Distribution and Servicing Fee”). The Distributor pays the Distribution and Servicing Fee to Selling Agents, who may use such fee to compensate the financial advisors involved in the sale of Units. Amounts retained by the Distributor, if any, are used by the Distributor to pay for Fund-related distribution and servicing expenses. Payment of the Distribution and Servicing Fee is governed by the Fund’s Rule 12b-1 Plan, which, pursuant to the conditions of an exemptive order issued by the Securities and Exchange Commission (the “SEC”), has been adopted by the Fund with respect to Class A Units in compliance with Rule 12b-1 under the 1940 Act. The Distribution and Servicing Fee is charged on an aggregate class-wide basis, and Class A investors are subject
30
CPG Cooper Square International Equity, LLC
Notes to Financial Statements (Continued)
September 30, 2022
1. ORGANIZATION (continued)
to the Distribution and Servicing Fee as long as they hold their Class A Units. Each compensated Selling Agent is paid by the Distributor based on the net asset value of outstanding Class A Units held by investors that receive services from such Selling Agent. Class I Units are not subject to the Distribution and Servicing Fee.
Effective April 1, 2022, the Fund’s distributor became Delaware Distributors, LP. Prior to April 1, 2022, the Fund’s distributor was Foreside Fund Services, LLC, who provided distribution services consistent with those described above.
The Fund is offering up to $250 million of Units on a continuous basis through the Distributor. The net asset values of each class of Units will vary over time as a result of the differing fees and expenses applicable to each class of Units and different initial offering prices and inception dates. Units may be purchased as of the first business day of each month based upon their then current net asset value per Unit. Purchase proceeds do not become the Fund’s assets until each closing date on which Units are delivered. Investors’ funds are held in escrow prior to the acceptance of orders and investment of the funds.
The Fund’s term is perpetual unless it is otherwise dissolved under the terms of its formation documents.
On March 11, 2022, Macquarie Asset Management, the asset management division of Macquarie Group Limited (“Macquarie Group”) (ASX: MQG; ADR: MQBKY), announced the completion of its acquisition of Central Park Group, LLC (“Central Park Group”), an independent investment advisory firm that specializes in institutional-quality alternative investment strategies for high-net-worth investors, and is the parent company of the Adviser.
2. | SUMMARY OF SIGNIFICANT ACCOUNTING POLICIES |
The Fund meets the definition of an investment company and follows the accounting and reporting guidance as issued through the Financial Accounting Standards Board (“FASB”) Accounting Standards Codification (“ASC”) 946, Financial Services – Investment Companies.
The following is a summary of significant accounting policies followed by the Fund in the preparation of its financial statements. These policies are in conformity with accounting principles generally accepted in the United States of America (“U.S. GAAP”).
Federal Tax Information: It is the Fund’s policy to qualify as a regulated investment company (“RIC”) under Subchapter M of the Internal Revenue Code of 1986, as amended (the “Code”). The Fund’s policy is to comply with the provisions of the Code applicable to RICs and to distribute to its investors substantially all of its net investment income and net realized gain on investments, if any, earned each year. In addition, the Fund intends to distribute sufficient income and gains each year so as to not be subject to U.S. Federal excise tax on certain undistributed amounts. Accordingly, no provision for federal income or excise tax has been recorded in these financial statements.
The Fund has adopted a tax-year end of September 30. The Fund files tax returns as prescribed by the tax laws of the jurisdictions in which it operates. In the normal course of business, the Fund is subject to examination by U.S. federal, state, local and foreign jurisdictions, where applicable.
The character of distributions made during the period from net investment income or net realized gain may differ from the characterization for federal income tax purposes due to differences in the recognition of income, expense and gain or loss items for financial statement and tax purposes. Where appropriate, reclassifications between net asset accounts are made for such differences that are permanent in nature.
The cost of investments and the gross unrealized appreciation and depreciation on investments as of September 30, 2022 are noted below.
Federal tax cost of investments | $ | 55,741,423 | ||
Gross unrealized appreciation | 0 | |||
Gross unrealized depreciation | (20,099,533 | ) | ||
Net unrealized depreciation | $ | (20,099,533 | ) |
31
CPG Cooper Square International Equity, LLC
Notes to Financial Statements (Continued)
September 30, 2022
2. | SUMMARY OF SIGNIFICANT ACCOUNTING POLICIES (continued) |
At September 30, 2022, the Fund had accumulated capital loss carryforwards as follows:
Short-term capital loss carryforward | $ | 5,606,294 | ||
Long-term capital loss carryforward | 3,624,080 |
The tax character of distributions paid during the tax year ended September 30, 2022 is as follows:
Ordinary Income | $ | 1,146,581 |
As of September 30, 2022, the components of distributable earnings on a tax basis were as follows:
Undistributed ordinary income | $ | 0 | ||
Undistributed short-term capital gain | 0 | |||
Gross unrealized appreciation | 0 | |||
Gross unrealized depreciation | (16,330,248 | ) | ||
Accumulated capital and other losses | (18,254,352 | ) | ||
Other differences | (75,334 | ) | ||
Total distributable earnings | $ | (34,659,934 | ) |
(a) | The difference between book basis and tax basis net unrealized depreciation are primarily attributable to the deferral of wash sale losses and other temporary adjustments. |
(b) | At September 30, 2022, the Fund had a qualified late-year ordinary loss deferral of $9,023,978 which is deemed to arise on October 1, 2022. |
Permanent book and tax differences, primarily attributable to excess distribution, resulted in reclassification for the tax year ended September 30, 2022 as follows:
Paid in capital | $ | (402 | ) | |
Total distributable earnings/loss | 402 |
These reclassifications had no effect on net assets.
Cash: Cash consists of monies held at the Bank of New York Mellon (the “Custodian”), cash on deposit, and cash held at prime brokers. Such cash may exceed federally insured limits. The Fund has not experienced any losses in such accounts and does not believe it is exposed to any significant credit risk on such accounts. There are no restrictions on the cash held by the Fund.
Investment Transactions: Investment transactions are accounted for on a trade date basis. Dividend income is recorded on the ex-dividend date. Interest income, which includes accretion of discounts and amortization of premiums, is accrued and recorded on an accrual basis. Realized gains and losses from securities transactions and unrealized appreciation and depreciation of securities are determined using the specific identification method for both financial reporting and tax purposes.
Foreign Currency: Investments and other assets and liabilities denominated in foreign currencies are translated into U.S. dollar amounts at the date of valuation. Purchases and sales of investments and income and expense items denominated in foreign currencies are translated into U.S. dollar amounts on the respective dates of such transactions. The Fund does not isolate that portion of the results of operations resulting from changes in foreign exchange rates on investments from the fluctuations arising from changes in market prices of securities held. Such fluctuations are included with the net realized and unrealized gain or loss from investments in the Statement of Operations. Reported net realized foreign exchange gains or losses arise from sales of foreign currencies, currency gains or losses realized between the trade and settlement
32
CPG Cooper Square International Equity, LLC
Notes to Financial Statements (Continued)
September 30, 2022
2. | SUMMARY OF SIGNIFICANT ACCOUNTING POLICIES (continued) |
dates on securities transactions and the difference between the amounts of dividends, interest and foreign withholding taxes recorded on the Fund’s books and the U.S. dollar equivalent of the amounts actually received or paid. Net unrealized foreign exchange gains and losses arise from changes in the fair values of assets and liabilities, other than investments at period end, resulting from changes in exchange rates.
Use of Estimates: The preparation of financial statements in conformity with U.S. GAAP requires management to make estimates and assumptions that affect the reported amounts of assets and liabilities and disclosure of contingent assets and liabilities at the date of the financial statements and the reported amounts of increases and decreases in net assets from operations during the reporting period. Actual results could differ from those estimates.
Fair Value of Financial Instruments: The fair value of the Fund’s assets and liabilities which qualify as financial instruments approximates the carrying amounts presented in the Statement of Assets and Liabilities. The Fund values its investments in investment funds at fair value in accordance with FASB ASC 820, Fair Value Measurement (“ASC 820”). See Note 3 for more information.
Short sales: The Fund may sell a security that it does not own in anticipation of a decline in the fair value of that security. When the Fund sells a security short, it must borrow the security sold short and deliver it to a broker-deal through which it made the short sale. A gain, limited to the price at which the Fund sold the security short, or a loss, unlimited in size, will be recognized upon the termination of a short sale. The Fund is also subject to the risk that it may be unable to reacquire a security to terminate a short position except at a price substantially in excess of the last quoted price.
Class allocations: Income, common expenses and realized and unrealized gains and losses are calculated at the Fund level and allocated monthly to each class of shares based on its respective percentage of adjusted net assets at the beginning of the month.
3. | PORTFOLIO VALUATION |
The NAV of the Fund is calculated as of the close of business on the last business day of each calendar month, each date that Units are offered or repurchased and at such other times as the Board shall determine (each, a “Valuation Date”). In determining its NAV, the Fund values its investments as of the relevant Valuation Date. The NAV of the Fund equals, unless otherwise noted, the value of the total assets of the Fund, less all of its liabilities, including accrued fees and expenses, each determined as of the relevant Valuation Date. The NAVs of the Class A Units and Class I Units are calculated separately based on the fees and expenses applicable to each class.
The 1940 Act provides that securities for which market quotations are “readily available” must be valued at market value, and all other securities and other assets must be valued at “fair value” as determined in good faith by the Board. The Board has appointed the Adviser as the Fund’s valuation designee pursuant to Rule 2a-5 under the 1940 Act. The Adviser has established procedures pursuant to which the Fund values its investments (the “Valuation Procedures”), which memorialize the methods used for determining the value of the Fund’s portfolio securities. The Adviser has contracted the Sub-Adviser to manage the Fund’s investments. Investments are valued in accordance with the Fund’s Valuation Procedures.
ASC 820 defines fair value as the value that the Fund would receive to sell an investment or pay to transfer a liability in a timely transaction with an independent buyer in the principal market, or in the absence of a principal market, the most advantageous market for the investment or liability. ASC 820 establishes a three-level hierarchy for fair value measurements based upon the transparency of inputs to the valuation of an asset or liability. Inputs may be observable or unobservable and refer broadly to the assumptions that market participants would use in pricing the asset or liability. Observable inputs reflect the assumptions market participants would use in pricing the asset or liability based on market data obtained from sources independent of the Fund. Unobservable inputs reflect the Fund’s own assumptions about the assumptions that market participants would use in valuing the asset or liability developed based on the best information available in the circumstances. Each investment is assigned a level based upon the observation of the inputs which are significant to the overall valuation.
The three-tier hierarchy of inputs is summarized below:
33
CPG Cooper Square International Equity, LLC
Notes to Financial Statements (Continued)
September 30, 2022
3. | PORTFOLIO VALUATION (continued) |
● | Level 1 — unadjusted quoted prices in active markets for identical financial instruments that the reporting entity has the ability to access at the measurement date. |
● | Level 2 — inputs other than quoted prices included within Level 1 that are observable for the financial instrument, either directly or indirectly. Level 2 inputs also include quoted prices for similar assets and liabilities in active markets, and quoted prices for identical or similar assets and liabilities in markets that are not active. |
● | Level 3 — significant unobservable inputs for the financial instrument (including management’s own assumptions in determining the fair value of investments). |
Equity securities, including both long and short positions, are generally valued at the last composite close price on the Valuation Date. If an equity trades on multiple exchanges, the security will be valued at the closing price from the U.S. exchange that the security last traded on before or at the close of the Valuation Date. Publicly-traded foreign equity securities are valued at the last trade price on the securities exchange or national securities market on which such securities primarily are traded (the “primary market”) during regular trading hours on the Valuation Date. Such securities generally are categorized as Level 1 securities. If there are no such trades in the security on the Valuation Date, the security will be valued at the last bid (for long positions) or last ask (for short positions). Debt securities will generally be valued, to the extent possible by an independent pricing service who provides evaluated prices using a variety of inputs, models and assumptions. These securities will be categorized as Level 2 securities. If there is no trade or bid/ask on the previous day, the security will be fair valued. Equity-linked instruments, such as total return swaps, are valued based on the value of the underlying reference asset(s) and the terms of the instrument (e.g., an interest rate) to approximate what the Fund would receive on a current termination of the instrument. Such reference asset(s) are valued in accordance with the applicable provisions of the Valuation Procedures. Such securities will generally be categorized as Level 2 securities.
The following table represents the inputs used to value the investments at fair value on the Statement of Assets and Liabilities within the valuation hierarchy as of September 30, 2022:
Investments in Securities at Value | Level 1 | Level 2 | Level 3 | Total | ||||||||||||
Common Stocks | $ | 35,835,929 | $ | — | $ | — | $ | 35,835,929 | ||||||||
Put Options Purchased | — | 956,696 | — | 956,696 | ||||||||||||
TOTAL | $ | 35,835,929 | $ | 956,696 | $ | — | $ | 36,792,625 | ||||||||
Other Financial Instruments | Level 1 | Level 2 | Level 3 | Total | ||||||||||||
Assets | ||||||||||||||||
Total Return Swap Contracts(a) | $ | — | $ | 1,357,768 | $ | — | $ | 1,357,768 | ||||||||
Liabilities | ||||||||||||||||
Securities Sold Short | ||||||||||||||||
Common Stocks | (20,576,576 | ) | — | — | (20,576,576 | ) | ||||||||||
Exchange Traded Funds | (2,919,731 | ) | — | — | (2,919,731 | ) | ||||||||||
Written Options | — | (108,265 | ) | — | (108,265 | ) | ||||||||||
Total Return Swap Contracts(a) | — | (7,079,317 | ) | — | (7,079,317 | ) | ||||||||||
TOTAL | $ | (23,496,307 | ) | (5,829,814 | ) | $ | — | (29,326,121 | ) | |||||||
(a) | Swap contracts are reported at their unrealized appreciation/(depreciation) at measurement date, which represents the change in the contract’s value from trade date. |
The Fund did not have any securities that used significant unobservable inputs (Level 3) in determining fair value, and there were no transfers into or out of Level 3 during the period.
34
CPG Cooper Square International Equity, LLC
Notes to Financial Statements (Continued)
September 30, 2022
4. | DERIVATIVE INSTRUMENTS |
The Fund is permitted to and also enters into various types of derivative contracts. In doing so, the Fund will employ strategies in differing combinations to permit them to increase, decrease, or change the level or type of exposure to market factors. Central to those strategies are features inherent to derivatives that make them more attractive for this purpose than equity securities; they require little or no initial cash investment, they can focus exposure on only certain selected risk factors and they may not require the ultimate receipt or delivery of the underlying security (or securities) to the contract. This may allow the Fund to pursue its objective more quickly and efficiently than if it were to make direct purchases or sales of securities capable of affecting a similar response to market factors.
The Fund’s use of derivatives can result in losses due to unanticipated changes in the overall market. In instances where the Fund is using derivatives to decrease, or hedge, exposure to market risk factors for securities held by the Fund, there are also risks that those derivatives may not perform as expected resulting in losses for the combined or hedged positions.
Derivatives have little or no initial cash investment relative to their market value exposure and therefore can produce significant gains or losses in excess of their cost. This use of embedded leverage allows the Fund to increase its market value exposure relative to its net assets and can substantially increase the volatility of the Fund’s performance.
Additional associated risks from investing in derivatives also exist and potentially could have significant effects on the valuation of the derivative and the Fund. Typically, the associated risks are not the risks that the Fund is attempting to increase or decrease exposure to, per its investment objectives, but are the additional risks from investing in derivatives.
These associated risks are liquidity risk, which is the risk that the Fund will not be able to sell the derivative in the open market in a timely manner, and credit risk, which is the risk that the counterparty will not fulfill its obligation to the Fund.
Total Return Swap Contracts: Total return swaps involve commitments to pay interest in exchange for a market linked return based on a notional amount. To the extent the total return of the security, instrument or basket of instruments underlying the transaction exceeds the offsetting interest obligation, the Fund will receive a payment from the counterparty. To the extent the total return of the security, instrument or basket of instruments underlying the transaction falls short of the offsetting interest obligation, the Fund will make a payment to the counterparty. The change in value of swap contracts outstanding, if any, is recorded as unrealized appreciation or depreciation daily. A realized gain or loss is recorded on maturity or termination of the swap contract.
The Fund’s maximum risk of loss from counterparty credit risk is the discounted net value of the cash flows to be received from/paid to the counterparty over the total return swap contract’s remaining life, to the extent that the amount is positive. This risk is mitigated by having a netting arrangement between the Fund and the counterparty and by the posting of collateral by the counterparty to the Fund to cover the Fund’s exposure to the counterparty.
For the year ended September 30, 2022, the Fund had ending monthly average notional amounts of $2,328,149 on total return swaps which are either long or short the reference asset. Open total return swap contracts at September 30, 2022 are listed in the Schedule of Investments.
Purchased Options: The Fund may purchase put and call options to seek an increase in total return. Purchased call and put options entitle the Fund to buy and sell a specified number of shares or units of a particular security, currency or index at a specified price at a specific date or within a specific period of time. Upon the purchase of a call or put option, the premium paid by the Fund is included on the Statement of Assets and Liabilities as an investment. All premiums are marked-to-market daily, and any unrealized appreciation or depreciation is recorded on the Fund’s Statement of Operations. As the purchaser of an index option, the Fund has the right to receive a cash payment equal to any depreciation in the value of the index below the strike price of the option (in the case of a put) or equal to any appreciation in the value of the index over the strike price of the option (in the case of a call) as of the valuation date of the option. Premiums paid for purchased call and put options which have expired are treated as realized losses on investments on the Statement of Operations. Upon the exercise or closing of a purchased put option, the premium is offset against the proceeds on the sale of the underlying security or financial instrument in order to determine the realized gain or loss on investments. Upon the exercise or closing of a purchased call option, the premium is added to the cost of the security or financial instrument. The risk associated with
35
CPG Cooper Square International Equity, LLC
Notes to Financial Statements (Continued)
September 30, 2022
4. | DERIVATIVE INSTRUMENTS (continued) |
purchasing options is limited to the premium originally paid. The average market value of purchased options contracts open during the year ended September 30, 2022, was $155,222. Open purchased options at September 30, 2022 are listed in the Schedule of Investments.
The valuation of derivative instruments by risk exposure as reported within the Statement of Assets and Liabilities at September 30, 2022 was as follows:
Risk Exposure | Statement of Assets and | Fair Value | Statement of Assets and | Fair Value | ||||||
Assets: | Liabilities: | |||||||||
Market and Credit Risk | Written Options, at value | $ | 108,265 | |||||||
(Written Options) | ||||||||||
Market and Credit Risk (Total Return Swap Contracts) | Unrealized appreciation on total return swap contracts | $ | 1,357,768 | Unrealized depreciation on total return swap contracts | 7,079,317 | |||||
Total | $ | 1,357,768 | $ | 7,187,582 | ||||||
For the year ended September 30, 2022, the effect of derivative instruments on the Statement of Operations were as follows:
Risk Exposure | Statement of | Realized Gain/ | Statement of | Change in | ||||||
Market and Credit Risk (Written Options) | Net realized gain/(loss) from Written Options | $ | (1,208 | ) | Net change in unrealized appreciation/ (depreciation) on Written Options | $ | 3,973 | |||
Market and Credit Risk (Total Return Swap Contracts) | Net realized gain/(loss) from total return swap contracts | (6,732,025 | ) | Net change in unrealized appreciation/ (depreciation) on total return swap contracts | (6,094,643 | ) | ||||
Total | $ | (6,733,233 | ) | $ | (6,090,670 | ) | ||||
Offsetting Arrangements: Certain derivative contracts are executed under standardized netting agreements. A derivative netting arrangement creates an enforceable right of set-off that becomes effective, and affects the realization of settlement on individual assets, liabilities and collateral amounts, only following a specified event of default or early termination. Default events may include the failure to make payments or deliver securities timely, material adverse changes in financial condition or insolvency, the breach of minimum regulatory capital requirements, or loss of license, charter or other legal authorization necessary to perform under the contract. These agreements mitigate counterparty credit risk by providing for a single net settlement with a counterparty of all financial transactions covered by the agreement in an event of default as defined under such agreement.
36
CPG Cooper Square International Equity, LLC
Notes to Financial Statements (Continued)
September 30, 2022
4. | DERIVATIVE INSTRUMENTS (continued) |
The following table presents derivative financial instruments that are subject to enforceable netting arrangements, collateral arrangements or other similar agreements as of September 30, 2022:
Offsetting of Derivative Assets | |||||||||||||||||||||||||
Gross Amounts Not Offset in the Statement of | |||||||||||||||||||||||||
| Counterparty | Gross Amounts | Gross Amounts | Net Amounts | Financial | Collateral | Net Amount | ||||||||||||||||||
Total Return Swap Contracts | Bank of America | $ | 33,460 | $ | — | $ | 33,460 | $ | (33,460 | ) | $ | — | $ | — | |||||||||||
Goldman Sachs | 259,764 | — | 259,764 | (259,764 | ) | — | — | ||||||||||||||||||
Morgan Stanley | 1,064,544 | — | 1,064,544 | (1,064,544 | ) | — | — | ||||||||||||||||||
Total | $ | 1,357,768 | $ | — | $ | 1,357,768 | $ | (1,357,768 | ) | $ | — | $ | — | ||||||||||||
Offsetting of Derivative Liabilities | |||||||||||||||||||||||||
Gross Amounts Not Offset in the Statement of | |||||||||||||||||||||||||
| Counterparty | Gross Amounts | Gross Amounts | Net Amounts | Financial | Collateral | Net Amount | ||||||||||||||||||
Total Return Swap Contracts | Bank of America | $ | (653,042 | ) | $ | — | $ | (653,042 | ) | $ | (33,460 | ) | $ | (619,582 | ) | $ | — | ||||||||
Goldman Sachs | (527,796 | ) | — | (527,796 | ) | (259,764 | ) | (268,032 | ) | — | |||||||||||||||
Morgan Stanley | (5,898,479 | ) | — | (5,898,479 | ) | (1,064,544 | ) | (4,833,935 | ) | — | |||||||||||||||
Written Options | Morgan Stanley | (108,265 | ) | — | (108,265 | ) | — | — | (108,265 | ) | |||||||||||||||
Total | $ | (7,187,582 | ) | $ | — | $ | (7,187,582 | ) | $ | (1,357,768 | ) | $ | (5,721,549 | ) | $ | (108,265 | ) | ||||||||
* | These amounts are limited to the derivative asset/liability balance and, accordingly, do not include excess collateral received/pledged, which is disclosed in the Statements of Investments. |
5. | RELATED PARTY TRANSACTIONS AND OTHER |
As of September 30, 2022, the Fund had no investments that were related parties.
The Adviser provides investment advisory services to the Fund pursuant to an investment advisory agreement (the “Agreement”). Pursuant to the Agreement, the Fund pays the Adviser a fee (the “Management Fee”) computed and payable monthly in arrears, at the annual rate of 1.25% of the Fund’s net asset value. The Sub-Adviser provides sub-advisory services to the Fund pursuant to a Sub-Advisory agreement among the Sub-Adviser and Adviser and the Fund. In consideration of the sub-advisory services provided to the Fund by the Sub-Adviser, the Adviser pays the Sub-Adviser, out of the Management Fee, a fee computed and payable monthly in arrears, at the annual rate of 0.75% of the Fund’s net asset value (the “Sub-Advisory Fee”). For purposes of determining the Management Fee payable to the Adviser and the
37
CPG Cooper Square International Equity, LLC
Notes to Financial Statements (Continued)
September 30, 2022
5. | RELATED PARTY TRANSACTIONS AND OTHER (continued) |
Sub-Advisory Fee payable to the Sub-Adviser for any month, “net asset value” means the total value of all assets of the Fund as of the end of such month, less an amount equal to all accrued debts, liabilities and obligations of the Fund as of such date, and calculated before giving effect to any repurchase of Units on such date and before any reduction for any fees (including the Distribution and Servicing Fee and the Incentive Fee (defined below)) and expenses of the Fund. The Management Fee and Sub-Advisory Fee are prorated for any period of less than a month based on the number of days in such period. During the year ended September 30, 2022, the Adviser earned $1,041,177 of Management Fee which is included in the Statement of Operations.
Additionally, pursuant to the Sub-Advisory Agreement, the Fund will pay the Sub-Adviser an incentive fee, calculated as 20% of the amount by which the Fund’s net profits attributable to each class of Units for all performance periods ending within or coterminous with the close of such fiscal year exceed the balance of the loss carryforward account maintained in respect of such class, without duplication for any incentive fee paid by the Fund in respect of such class during such fiscal year. The Fund also pays the Sub-Adviser the Incentive Fee in the event that a performance period ends in connection with the repurchase of Units by the Fund or a dividend or other distribution payable by the Fund, in each case on the date as of which the Fund’s NAV attributable to any class is calculated for such purpose; provided that only that portion of the Incentive Fee that is attributable to (i) the Units being repurchased (not taking into account any proceeds from any contemporaneous issuance of Units, by reinvestment of dividends and other distributions or otherwise), or (ii) the dividend or other distribution being paid by the Fund and not being reinvested in Units of the Fund, is paid to the Sub-Adviser for such performance period. The Incentive Fee, if any, is calculated and accrued on each date that the Fund calculates its NAV.
“Performance period” means each 12-month period ending as of the Fund’s fiscal year-end (or, for the first fiscal year of the Fund, the period from the commencement of the Fund’s operations through the end of the Fund’s first fiscal year; or such other period ending as of the Fund’s fiscal year-end in the event the Fund’s fiscal year is changed); provided that the period of time from the prior performance period-end (or commencement of the Fund, as the case may be) through the valuation date of (i) a repurchase offer and (ii) a dividend or other distribution also constitutes a performance period. The Incentive Fee is payable for a performance period only if and to the extent that the Fund’s loss carryforward account has a balance of zero. The loss carryforward account is a memorandum account with respect to each class that had an initial balance of zero upon commencement of the class’s operations and, thereafter, is credited as of the end of each performance period with the amount of any net loss of the Fund attributable to such class for that performance period, and is debited with the amount of any net profits of the Fund attributable to such class for that performance period, as applicable. This is known as a “high water mark.” During the year ended September 30, 2022, the Sub-Adviser earned no Incentive Fees for Class A or Class I.
Unless otherwise voluntarily or contractually assumed by the Adviser or another party, the Fund bears all expenses incurred in its business, including, but not limited to, the following: all costs and expenses related to investment transactions and positions for the Fund’s account; legal fees; accounting, auditing and tax preparation fees; recordkeeping and custodial fees; costs of computing the Fund’s NAV; fees for data and software providers; research expenses; costs of insurance; registration expenses; certain offering costs; expenses of meetings of investors; directors’ fees; all costs with respect to communications to investors; transfer taxes and taxes withheld on non-U.S. dividends; interest and commitment fees on loans and debit balances; and other types of expenses as may be approved from time to time by the Board.
The Adviser and Sub-Adviser (together the “Advisers”) have entered into an “Expense Limitation and Reimbursement Agreement” with the Fund for a one-year term beginning on the initial Closing Date and ending on the one year anniversary thereof to limit the amount of “Specified Expenses” borne by the Fund to an amount not to exceed 0.60% per annum of the Fund’s net assets (i.e., the Expense Cap). The Expense Limitation and Reimbursement Agreement was extended through February 1, 2023. Specified Expenses means all expenses incurred by the Fund, except for: (i) the Management Fee; (ii) the Incentive Fee; (iii) any distribution or servicing fee paid with respect to certain classes of Units, including the Distribution and Servicing Fee; (iv) brokerage costs; (v) certain transaction-related expenses, including those incurred in connection with effecting short sales; (vi) interest payments; (vii) fees and expenses incurred in connection with a credit facility, if any, obtained by the Fund; (viii) taxes; and (ix) extraordinary expenses (as determined in the sole discretion of the Adviser). To the extent that Specified Expenses for a month exceed the Expense Cap, the Advisers will reimburse the Fund for expenses to the extent necessary to eliminate such excess. To the extent that the Advisers bear Specified Expenses, they
38
CPG Cooper Square International Equity, LLC
Notes to Financial Statements (Continued)
September 30, 2022
5. | RELATED PARTY TRANSACTIONS AND OTHER (continued) |
are permitted to receive reimbursement for any expense amounts previously paid or borne by the Adviser, for a period not to exceed three years from the date on which such expenses were paid or borne by the Advisers, even if such reimbursement occurs after the term of the Expense Limitation and Reimbursement Agreement, provided that the Specified Expenses have fallen to a level below, and the reimbursement amount does not raise the level of Specified Expenses in the month the reimbursement is being made to a level that exceeds, the Expense Cap in place at the time such amounts were borne by the Advisers and the expense limitation in place at the time of the reimbursement, if any. During the year ended September 30, 2022, the Adviser reimbursed $360,172 to the Fund. As of September 30, 2022, the Fund has $491,505 due from the Adviser. This is recorded as “Due from Adviser” on the Fund’s Statement of Assets and Liabilities.
The Adviser may recapture all or a portion of this amount prior to September, of the fiscal years stated below:
2023 | $ | 109,695 | ||
2024 | 899,149 | |||
2025 | 360,172 | |||
Total | $ | 1,369,016 |
Each Independent Director, receives an annual retainer of $15,000 (prorated for partial years) plus a fee of $1,000 for each meeting attended and $500 for each meeting by phone. The Board Chair, Audit Committee Chair, Nominating Committee Chair and Contracts Review Committee Chair each receive an additional $2,000 annual retainer. All members of the Board are reimbursed for their reasonable out-of-pocket expenses. Total amounts expensed by the Fund related to Independent Directors for the year ended September 30, 2022 was $129,686, which is included in Directors’ and Officer Fees in the Statement of Operations.
During the year ended September 30, 2022, the Fund incurred a portion of the annual compensation of the Fund’s Chief Compliance Officer in the amount of $5,678, which is included in Directors’ and Officer Fees in the Statement of Operations.
Certain officers and the interested director of the Fund are also Officers of the Adviser and were registered representatives of Foreside Fund Services, LLC through March 31, 2022. On March 24, 2022, the Board of Directors appointed Delaware Distributors, L.P. as the distributor for the Fund, effective April 1, 2022. The Distributor is, as of such date, an affiliate of the Adviser, both of which are indirect subsidiaries of Macquarie Management Holdings, Inc. (“Macquarie”), which is an indirect wholly-owned subsidiary of Macquarie Group. As of April 1, 2022, certain officers and the interested director of the Fund are registered representatives of the Distributor.
6. | ADMINISTRATION AND CUSTODIAN FEES |
SS&C Technologies and its affiliates DST Asset Manager Solutions, Inc. and ALPS Fund Services, Inc. serve as administrator (the “Administrator”) to the Fund and provides certain accounting, administrative, record keeping and investor related services. For their services, the Fund pays an annual fee to the Administrator based upon average net assets, subject to certain minimums. For the year ended September 30, 2022, the total administration fees were $157,646 which is included in Accounting and administration fees in the Statement of Operations.
The Bank of New York Mellon serves as the custodian of the Fund’s assets, and may maintain custody of the Fund’s assets with domestic and foreign sub-custodians. For the year ended September 30, 2022, the total custodian fees were $81,448 which is included in Custody fees in the Statement of Operations.
7. | INVESTMENTS |
For the year ended September 30, 2022, purchases and sales of investments, other than short sales, and short-term obligations, amounted to $51,375,500 and $57,336,823, respectively.
39
CPG Cooper Square International Equity, LLC
Notes to Financial Statements (Continued)
September 30, 2022
8. | REPURCHASE OF UNITS |
No investor or other person holding Units acquired from an investor has the right to require the Fund to redeem any Units. To provide a limited degree of liquidity to investors, the Fund may, from time to time, offer to repurchase Units pursuant to written tenders by investors. Repurchases will be made at such times, in such amount and on such terms as may be determined by the Board, in its sole discretion. In determining whether the Fund should offer to repurchase Units, the Board will consider the recommendations of the Adviser as to the timing of such an offer, as well as a variety of operational, business and economic factors. The Adviser anticipates that it will recommend to the Board that the Fund offer to repurchase Units from investors on a quarterly basis, with such repurchases to occur as of the last day of March, June, September and December (or, if any such date is not a business day, on the immediately preceding business day). The Adviser also expects that, generally, it will recommend to the Board that each repurchase offer should apply to 25% of the net assets of the Fund. In certain circumstances, however, the Board may determine not to conduct a repurchase offer, or to conduct a repurchase offer of more or less than 25% of the Fund’s net assets. Each repurchase offer will generally commence approximately 30 days prior to the applicable repurchase date.
9. | INDEMNIFICATION |
Under the Fund’s organizational documents, its Officers and Directors are indemnified against certain liabilities arising out of the performance of their duties to the Fund. In addition, in the ordinary course of business, the Fund may enter into contracts or agreements that contain indemnification or warranties. The Fund’s maximum exposure under these arrangements is unknown, as this would involve future claims that may be made against the Fund that have not yet occurred. However, based on experience, the Fund expects the risk of loss to be remote.
10. SPECIAL MEETING OF SHAREHOLDERS
On October 21, 2021, Central Park Group, the parent company of the Adviser, and Macquarie Management Holdings, Inc. (“Macquarie”) announced that they had entered into an agreement whereby Macquarie agreed to acquire Central Park Group, subject to the satisfaction or appropriate waiver of certain closing conditions (the “Transaction”). At a special meeting of Fund investors held on February 18, 2022, investors approved the new investment advisory agreement with the Adviser (the “New Agreement”), with 50,871,254 votes for approval, 651,671 votes against and 4,120,094 abstentions. Investors were asked to approve the New Agreement as, upon the closing of the Transaction, the investment advisory agreement then in place between the Adviser and the Fund would automatically terminate in accordance with its terms and applicable law. Similarly, and for the same reason, Fund investors were also asked to approve a new sub-advisory agreement with the Sub-Adviser. At the same special meeting of Fund investors, investors approved the new sub-advisory agreement with the Sub-Adviser, with 50,631,313 votes for approval, 651,671 against and 4,360,035 abstentions.
On March 11, 2022, Central Park Group and Macquarie announced that the Transaction had closed earlier that day (the “Closing”).
11. | SUBSEQUENT EVENTS |
Subsequent events after September 30, 2022 have been evaluated through the date the financial statements were issued. There were no events or material transactions through the date the financial statements were issued, except for the following: The Adviser funded $132,089.72 to the Fund on November 22, 2022, reducing the Due from Adviser asset that the Fund holds.
40
CPG Cooper Square International Equity, LLC
Other Information (Unaudited)
September 30, 2022
Proxy Voting
A description of the policies and procedures that the Fund uses to determine how to vote proxies relating to portfolio securities and information regarding how the Fund voted proxies relating to portfolio securities for the period from the Fund’s commencement through June 30 are available without charge, upon request, by calling (collect) 1-212-317-9200 and on the SEC’s website at http://www.sec.gov.
The Fund’s Form N-PX filing is available: (i) without charge, upon request, by calling the Fund (collect) at 1-212-317-9200 or (ii) by visiting the SEC’s website at http://www.sec.gov.
Availability of Quarterly Portfolio Schedules
Disclosure of Portfolio Holdings: The Fund files its complete schedule of portfolio holdings with the Securities and Exchange Commission (the “SEC”) no more than 60 days after the Fund’s first and third fiscal quarters of each fiscal year on Form N-PORT. For the Fund, this would be for the fiscal quarters ending December 31 and June 30. The Fund’s Form N-PORT filings can be found free of charge on the SEC’s website at http://www.sec.gov.
Management Discussion of Fund Performance
How did the Fund perform?
For the period from October 1, 2021 through September 30, 2022, the Fund returned -34.37% for Class A and -33.97% for Class I, underperforming both the HFRI Equity Hedge (Total) Index and MSCI ACWI ex-US Index, which returned -13.25% and -25.17%, respectively, over the same period. The Fund’s net asset value per share as of September 30, 2022 was $10.29 for Class A and $13.92 for Class I versus $15.90 and $21.36, respectively, on September 30, 2021.
What is the Fund’s investment approach?
The Fund’s investment objective is to seek to achieve maximum total return. The Fund seeks to achieve its investment objective by investing primarily in equity securities of non-U.S.-domiciled issuers, including those domiciled in emerging markets. Under normal circumstances, the Fund invests at least 80% of its net assets, plus any borrowings for investment purposes, in equity securities. For purposes of the Fund’s investment program, “equity securities” means common and preferred stocks (including investments in initial public offerings or “IPOs”), convertible securities, warrants and rights. The Fund may invest in equity securities without restriction as to market capitalization.
The Sub-Adviser’s approach involves taking long and short positions in equity securities—namely, investing long on the basis of extensive research and fundamental analysis, and seeking to take opportunistic advantage of market inefficiencies by selling other securities short. The majority of the Fund’s long exposure will be in growth companies with high returns on capital and high barriers to competition that the Sub-Adviser believes are trading at a discount to their intrinsic value. The Sub-Adviser invests in a majority of these companies with an expectation of a multi-year holding period. The Fund’s long exposure also will include investments in more opportunistic situations that may be held for a multi-quarter, rather than multi-year, time frame. In the short portfolio, the Sub-Adviser will attempt to identify companies that are exposed to ongoing competitive pressures with poor returns on capital and deteriorating fundamentals. The short positions generally are not selected as direct hedges to the long positions. Under extraordinary circumstances, the Fund may acquire substantial stakes in public companies; however, the Fund generally will not invest more than 10% of its net asset value (measured at the time of purchase) in the voting securities of any one investment. The Sub-Adviser may seek to obtain exposure to particular issuers or securities through derivative transactions, including, without limitation, swaps (including total return swaps), contracts for differences (“CFDs”), options and other types of derivative arrangements for investment or hedging purposes.
41
CPG Cooper Square International Equity, LLC
Other Information (Unaudited) (Continued)
September 30, 2022
What influenced the Fund’s performance?
(10/1/21 – 12/31/21)
For the fourth quarter ended December 31, 2021, the Fund returned -2.4% and -2.2% net (Class A and Class I, respectively) with an average net exposure of 85%. Over the same period, the HFRI Equity Hedge Index returned 0.7% and the MSCI ACWI ex US Index returned 1.8%.
In the fourth quarter, the Fed belatedly acknowledged reality, started to taper asset purchases, signaled a faster pace of rate hikes and even hinted at balance sheet reduction as early as mid-2022. The realization that all three might occur in rapid succession has negatively impacted most capital markets.
In the fourth quarter, the Fund’s top three contributors were longs and together contributed approximately +150 bps to gross performance. Top contributors included Perimeter Solutions, CRH, and Brookfield Asset Management. The top three detractors in the fourth quarter were longs and detracted approximately -230 bps from gross performance. Top detractors included WAG Payment Solutions, Edenred, and NOF Corporation.
(1/1/22 – 3/31/22)
For the first quarter ended March 31, 2022, the Fund returned -12.6% and -12.5% net (Class A and Class I, respectively) with an average net exposure of 92%. Over the same period, the HFRI Equity Hedge Index returned -4.3% and the MSCI ACWI ex US Index returned -5.4%.
Two major negative shocks impacted global equity returns during the first quarter. First, the discounting of increasingly imminent monetary policy normalization, as inflation continued to soar in the face of central banks being massively behind the policy curve. Second, concerns regarding the economic and financial fallout from Russia’s invasion of Ukraine. Together, these two negative shocks raised concerns that the global economy is trending toward 1970s-style stagflation.
In the first quarter, the Fund’s top three contributors were one long and two shorts and together contributed approximately +100 bps to gross performance. Top contributors included Edenred, a healthcare short, and a consumer staples short. The top three detractors in the first quarter were longs and detracted approximately -370 bps from gross performance. Top detractors included SAP SE, CRH, and Melrose Industries.
(4/1/22 – 6/30/22)
For the second quarter ended June 30, 2022, the Fund returned -13.6% and -13.5% net (Class A and Class I, respectively) with an average net exposure of 85%. Over the same period, the HFRI Equity Hedge Index returned -7.8% and the MSCI ACWI ex US Index returned -13.7%.
The extraordinary tightening of financial conditions in the US and Europe, triggered by runaway inflation and exacerbated by Russia’s invasion of Ukraine, continued apace in the second quarter. Bloomberg indices measuring aggregate stress levels in money, bond and equity markets plummeted by more in the first half of 2022 than in any period other than the Global Financial Crisis (GFC), the European sovereign debt crisis and the pandemic-induced slump of early 2020. The events of the prior six months amounted to nothing short of a financial earthquake.
In the second quarter, the Fund’s top three contributors were two longs and one short and together contributed approximately +110 bps to gross performance. Top contributors included Melrose Industries, an information technology short, and JD.com. The top three detractors in the second quarter were longs and detracted approximately -400 bps from gross performance. Top detractors included ASML Holding NV, Brookfield Asset Management, and CTS Eventim AG & Co KGaA.
(7/1/22 – 9/30/22)
For the third quarter ended September 30, 2022, the Fund returned -11.0% and -10.9% net (Class A and Class I, respectively) with an average net exposure of 77%. Over the same period, the HFRI Equity Hedge Index returned -2.3% and the MSCI ACWI ex US Index returned -9.9%.
42
CPG Cooper Square International Equity, LLC
Other Information (Unaudited) (Continued)
September 30, 2022
The third quarter of 2022 was marked by a difficult market environment during which correlations across equities rose and relatively little held value except US dollar-denominated cash. Protracted inflation in the US, UK and Europe forced central banks to accelerate the pace of interest rate increases. Geopolitics worsened, impacting growth outlooks and increasing tail risks. Foreign exchange movements were a material headwind. Capital continues to flow into and hide in the USD. Financial market stress is rising. The inexorable rise in the USD and central bank tightening, in general, are beginning to cause stress fractures throughout the financial landscape. Credit spreads rose across most fixed income instruments during the third quarter.
In the third quarter, the Fund’s top three contributors were one long and two shorts and together contributed approximately +120 bps to gross performance. Top contributors included Worldline, an industrials short, and a consumer discretionary short. The top three detractors in the third quarter were three longs and detracted approximately –340 bps from gross performance. Top detractors included AIA Group, Melrose Industrials, and PerkinElmer.
The information contained in this Discussion of Fund Performance reflects the views of the Adviser and/or Sub-Adviser or their respective affiliates and sources it believes are reliable as of the date of this publication. Neither the Adviser nor Sub-Adviser makes any representations or warranties concerning the accuracy of any data. There is no guarantee that any projection, forecast or opinion in this material will be realized. Past performance does not guarantee future results. The views expressed herein may change at any time after the date of this publication. This Discussion of Fund Performance is for informational purposes only and does not constitute investment advice. This information should not be construed as sales or marketing material or an offer or solicitation for the purchase or sale of any security, financial instrument, product or service.
Performance Illustration: Comparison of the Change in Value of a
$50,000 Investment in the Fund and Indices
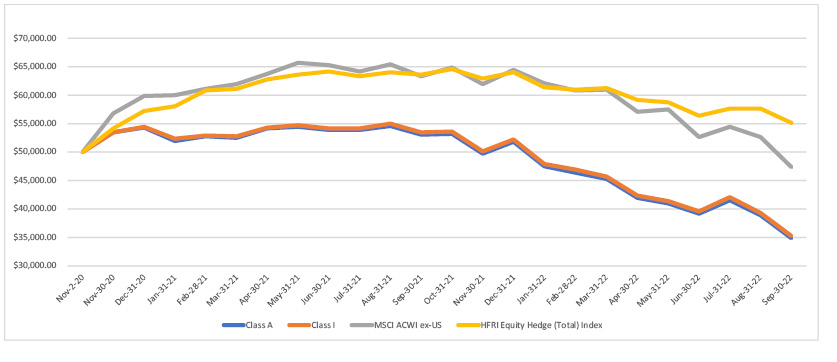
| Trailing 1-Yr | Trailing 5-Yr | Trailing 10-Yr | ITD - Annualized | ||||||||||||
Class A | -34.37 | % | NA | NA | -17.23 | % | ||||||||||
Class I | -33.97 | % | NA | NA | -16.67 | % | ||||||||||
MSCI ACWI ex-US | -25.17 | % | NA | NA | -2.76 | % | ||||||||||
HFRI Equity Hedge (Total) Index | -13.25 | % | NA | NA | 5.22 | % | ||||||||||
43
CPG Cooper Square International Equity, LLC
Other Information (Unaudited) (Continued)
September 30, 2022
The performance illustration above assumes the reinvestment of all dividend and capital gain distributions, if any, and represents past performance, which is not a guarantee of future results. The returns shown do not reflect taxes that an investor would pay on Fund distributions or on the redemption of Fund shares. The investment return and principal value of an investment will fluctuate and, therefore, an investor’s shares, if redeemed, may be worth more or less than their original cost.
Fund returns are estimated, unaudited, and presented net of annual: management fee (1.25%), expenses (capped at 0.60%), incentive fee (20%) and, for Class A, an annual distribution/servicing fee (0.75%). Returns do not account for an upfront placement fee which, if charged, would reduce returns. Fund returns reflect an operating expense cap from the Fund’s inception. If the cap were not in place, returns would be lower. Past returns may have been generated during positive market conditions and should not be expected in the future. Indices are included to show general trend in markets and not intended to imply that past performance was comparable to indices either in composition or risk. See the information below regarding the indices presented.
HFRI Equity Hedge Index: Investment Managers who maintain positions both long and short in primarily equity and equity derivative securities. A wide variety of investment processes can be employed to arrive at an investment decision, including both quantitative and fundamental techniques; strategies can be broadly diversified or narrowly focused on specific sectors and can range broadly in terms of levels of net exposure, leverage employed, holding period, concentrations of market capitalizations and valuation ranges of typical portfolios. Managers would typically maintain at least 50% exposure to, and may in some cases be entirely invested in, equities, both long & short.
MSCI ACWI ex US: Captures large and mid-cap representation across 22 of 23 developed markets and 24 emerging markets countries. With 2,273 constituents, the index covers approximately 85% of the global investable equity opportunity set.
Approval of Investment Advisory Agreement and Sub-Advisory Agreement
At a meeting on November 19, 2021, the Directors, including the Independent Directors, evaluated the proposed Advisory Agreement of the Fund (the “Post-Closing Advisory Agreement”) and the proposed Sub-Advisory Agreement (the “Post-Closing Sub-Advisory Agreement” and together with the Post-Closing Advisory Agreement, the “New Agreements”), in connection with the change of control of the Adviser, to be effective upon the closing of the proposed transaction with Macquarie (the “Transaction”). The Independent Directors met in an executive session during which they were advised by and had the opportunity to discuss with independent legal counsel the approval of the New Agreements. The Directors reviewed materials furnished by the Adviser and Macquarie, and discussed with the Adviser and Macquarie information regarding the Adviser, Macquarie, their respective affiliates and its personnel, operations and financial condition. Tables prepared by the Adviser indicating comparative fee information, and comparative performance information as well as a summary financial analysis for the Fund, were also included in the meeting materials and were reviewed and discussed. The Directors discussed with representatives of the Adviser and Macquarie the Fund’s operations and the Adviser’s ability to provide advisory and other services to the Fund following the closing of the Transaction (the “Closing”). In particular, the Board considered the following:
i. | The nature, extent and quality of services to be provided by the Adviser and the Sub-Adviser: With respect to the New Agreements, the Directors received and considered information regarding the nature, extent and quality of services to be provided by the Adviser post-Closing. In evaluating the nature, extent and quality of services to be provided by the Adviser after the Closing, the Directors considered information provided by the Adviser and Macquarie regarding their advisory services, investment philosophy and process, investment management capabilities, business and operating structure, scale of operations, leadership and reputation, distribution capabilities, and financial condition (in the case of the Adviser, both pre- and post-Closing). The Directors also considered the capabilities, resources and personnel of the Adviser, noting that the founding members of Central Park Group had already agreed to join Macquarie pending closing of the Transaction, and that Macquarie had offered all personnel of the Adviser to join Macquarie as employees, in order to determine whether the Adviser will continue to be capable of providing the same level of investment management services currently provided to the Fund. The Directors also considered the transition and integration plans of Central Park Group and Macquarie, as had been presented to the Board, as well as the risks related to the integration of Central Park Group’s business into the Macquarie organization |
44
CPG Cooper Square International Equity, LLC
Other Information (Unaudited) (Continued)
September 30, 2022
following completion of the Transaction. The Directors considered Macquarie’s experience with integrating other asset managers that it recently acquired. The Directors considered the resources and infrastructure that the Adviser and Macquarie intend to devote to integrating the compliance program of the Fund and the Adviser with those of Macquarie to ensure compliance with applicable laws and regulations as well as Macquarie’s commitment to those programs. The Directors also considered the resources that Macquarie has devoted to its risk management program and cybersecurity program. The Directors also reviewed information provided by Macquarie at the previous meeting related to its business, legal, and regulatory affairs. This review considered the resources available to the Adviser as a subsidiary of Macquarie to provide the services specified under the proposed Post-Closing Investment Advisory Agreement. The Directors considered Macquarie’s financial condition, and noted that the Adviser, as a subsidiary of Macquarie, believes that it will be able to provide a high level of service to the Fund and continuously invest and re-invest in its business. Finally, the Directors considered that, following the Transaction, the Adviser believes there will not be any diminution in the nature, quality and extent of services provided to the Fund and its investors by the Adviser compared to those currently provided.
The Directors considered that the same portfolio managers and portfolio management teams that manage the Fund are expected to continue to do so after the Transaction, except that the portfolio managers that are currently Central Park Group employees are anticipated to become employees of a subsidiary of Macquarie. The Board determined that it had considered the qualifications of the portfolio managers for the Fund at the Fund’s most recent meeting at which the Board last approved the Fund’s existing Investment Advisory Agreement and Sub-Advisory Agreement (the “Last 15(c) Meeting”). |
The Directors considered that the terms and conditions of the proposed Post-Closing Advisory Agreement are identical in all material respects to the terms and conditions of the existing Advisory Agreement, except that the Post-Closing Advisory Agreement provides that the Fund may bear a portion of expenses associated with personnel of the Adviser or its affiliates providing legal services to the Fund (including, without limitation, the review and updating of the registration statement, review of investor reports, preparing materials relating to Board and investor meetings, the negotiation of service provider agreements and other contracts for the Fund and the preparation and review of various regulatory filings for the Fund) and producing Fund regulatory materials (including, without limitation, the production and formatting of investor reports and offering documents for the Fund). The Directors considered that, under this provision, certain expenses associated with personnel of the Adviser or its affiliates providing legal services and producing Fund regulatory materials may be allocated to the Fund by Macquarie, but that none of these expenses will be allocated to the Fund for a period of at least two years following the Closing. The Directors considered that Macquarie believes that the provision by personnel of the Adviser or its affiliates of such services currently provided by external counsel and service providers will be more cost-efficient for the Fund, provided, however that there is no guarantee that this expectation will prove to be true. The Directors considered that these expenses will not be imposed without further approval from the Board. |
After review of these and other considerations, the Directors concluded that the Adviser will continue to be capable of providing investment advisory services of the same high quality as the investment advisory services that are currently provided to the Fund by the Adviser, and that these services are appropriate in nature, quality and extent in light of the Fund’s operations and investor needs. |
The Directors also considered that the Adviser believes that there will not be any diminution in the nature, quality and extent of services provided to the Fund and its investors by the Sub-Adviser compared to those currently provided. The Directors considered that the same portfolio managers and portfolio management teams that manage the Fund are expected to continue to do so under the proposed Post-Closing Sub-Advisory Agreement. The Board determined that it had considered the qualifications of the portfolio managers for the Fund at its Last 15(c) Meeting. |
The Directors considered that the terms and conditions of the proposed Post-Closing Sub-Advisory Agreement are identical in all material respects to the terms and conditions of the current Sub-Advisory Agreement. |
45
CPG Cooper Square International Equity, LLC
Other Information (Unaudited) (Continued)
September 30, 2022
After review of these and other considerations, the Directors concluded that the Sub-Adviser will continue to be capable of providing sub-investment advisory services of the same high quality as the sub-investment advisory services currently provided to the Fund by the Sub-Adviser, and that these services are appropriate in nature and extent in light of the Fund’s operations and investor needs. |
ii. | Investment performance of the Fund: With respect to the performance of the Fund, the Directors considered their review of peer group and benchmark investment performance comparison data relating to the Fund’s performance record presented at the Last 15(c) Meeting, at other Board meetings throughout the year and/or in response to an Information Request from the Board (the “Information Request”). The Directors considered that information reviewed at the Last 15(c) Meeting and other Board meetings would be relevant given that the Fund is expected to retain its current portfolio managers and portfolio management teams. |
The Board reviewed the performance of the Fund and compared that performance to the performance of its comparative indices, and to the performance of other investment companies presented by the Adviser with similar strategies (the “Comparable Funds”), noting that the Fund underperformed the Comparable Funds and underperformed its benchmarks during the applicable comparative year-to-date period as well as since inception. |
Based on information presented to the Board at the Last 15(c) Meeting, other Board meetings throughout the year and in response to the Information Request and its discussions with the Adviser and Macquarie, the Board concluded that the Adviser and Sub-Adviser are capable of continuing to generate a level of long-term investment performance that is appropriate in light of the Fund’s investment objectives, strategies and restrictions. |
iii. | Fees to be paid to the Adviser and expenses of the Fund: The Directors considered that they had reviewed the Fund’s existing advisory fee rate at the Last 15(c) Meeting. The Directors considered that the proposed Post-Closing Advisory Agreement did not change the Fund’s contractual advisory fee rate and that the proposed Post-Closing Sub-Advisory Agreement did not change the Fund’s contractual sub-advisory fee rate (which is paid by the Adviser) or incentive fee rate (which is paid by the Fund). The Directors also considered that the Adviser and Macquarie had represented to the Board that they will use commercially reasonable efforts to ensure that they and their respective affiliates do not take any action that imposes an “unfair burden” on the Fund as a result of the Transaction or as a result of any express or implied terms, conditions or understandings applicable to the Transaction, for so long as the requirements of Section 15(f) of the Investment Company Act apply. The Board concluded that the continued retention of the Adviser was unlikely to impose an unfair burden on the Fund because, after the Transaction, none of the Adviser, Macquarie, or any of their respective affiliates, would be entitled to receive any compensation directly or indirectly (1) from any person in connection with the purchase or sale of securities or other property to, from, or on behalf of the Fund (other than ordinary fees for bona fide principal underwriting services), or (2) from the Fund or their investors for other than bona fide investment advisory or other services. Based on its review, the Board determined, with respect to the Fund, that the advisory fee is fair and reasonable in light of the nature, extent and quality of services to be provided to the Fund under the proposed New Agreements. |
iv. | The extent to which economies of scale may be realized as the Fund grows larger and whether fee levels reflect such economies of scale for the Fund’s investors: The Directors considered potential or anticipated economies of scale in relation to the services the Adviser would continue to provide to the Fund as a subsidiary of Macquarie. The Directors considered the Adviser’s representation that the ability to share costs with a much larger parent organization post-Transaction may reasonably be expected to enable the Adviser to reach greater economies of scale in a shorter time frame. The Directors also considered the Adviser’s and Macquarie’s representations that they may realize economies of scale in connection with the operation of the Fund if certain operational efficiencies, cost synergies and possible future consolidation of service providers and vendors are achieved, and discussed how such potential economies of scale, if achieved, could be shared, including by reinvestment of profits back into the Adviser’s business. The Directors noted that it will have the opportunity to periodically re-examine whether a Fund has achieved economies of scale, and the appropriateness of investment advisory fees payable to the Adviser, in the future. |
46
CPG Cooper Square International Equity, LLC
Other Information (Unaudited) (Continued)
September 30, 2022
The Directors considered potential or anticipated economies of scale in relation to the services the Sub-Adviser would continue to provide to the Fund. The Directors considered that the Fund had not gathered a substantial amount of assets under management since it launched in November 2020 and concluded that material economies of scale, the benefit of which should be shared with the Fund, were not realized during the period since commencement of operations. The Directors noted that it will have the opportunity to periodically re-examine whether the Fund has achieved economies of scale, and the appropriateness of sub-advisory fees payable to the Sub-Adviser, in the future. |
v. | Profits to be realized by the Adviser, Macquarie and their Affiliates from their relationship with the Fund: The Directors considered the benefits the Adviser, Macquarie and their affiliates may derive from their relationship with the Fund. The Directors also considered information on the Adviser’s anticipated post-Transaction profitability that was provided in response to the Information Request. The Directors considered Macquarie’s representation that, while subject to uncertainty, the fully integrated Central Park Group complex, including investments to support ongoing growth, was expected to have an overall marginally positive impact on Macquarie’s overall financial profitability. The Directors considered that the estimated profitability of the Adviser, Macquarie and their affiliates was not excessive in light of the nature, extent and quality of the services to be provided to the Fund. The Directors noted the difficulty of accurately projecting profitability under the current circumstances and noted that they would have the opportunity to give further consideration to the Adviser and Macquarie’s profitability with respect to the Fund at the end of the initial two-year term of the proposed Post-Closing Advisory Agreement. |
The Directors also noted that the Transaction is not expected to have any effect on the profitability of the Sub-Adviser as it relates to the Fund. The Directors also noted that the Fund had been in operation for only one year, and that it will have the opportunity to periodically re-examine the Sub-Adviser’s profitability in the future, as more useful historical information becomes available. |
vi. | Fall-out benefits to the Adviser, Macquarie and their Affiliates: The Directors considered the possible fall-out benefits that may accrue to the Adviser, Macquarie and the Sub-Adviser and their respective affiliates. The Directors noted that the Transaction provides Macquarie and its affiliates the opportunity to deliver additional alternative investment products to investors and that the Adviser can provide portfolio management services to new alternative investment products sponsored by Macquarie. The Directors considered that the Transaction, if consummated, would marginally increase Macquarie’s assets under management and expand Macquarie’s investment capabilities and relationships with certain wealth management intermediaries where Central Park Group has extensive relationships with financial advisors that sell alternative products to high net worth individuals. The Directors considered that senior personnel of the Adviser (including Mr. Tanzman, who is a Director that is an “interested person,” as defined in the 1940 Act, of the Funds) were expected to receive substantial consideration from Macquarie for selling their interests in Central Park Group to Macquarie. Based on its review, the Board determined that any “fall-out” benefits that may accrue to the Adviser, Macquarie and the Sub-Adviser and their respective affiliates are fair and reasonable. |
Based on the foregoing and other relevant considerations, the Directors, including a majority of the Independent Directors, acting within their business judgment, (1) concluded that the terms of the proposed New Agreements are fair and reasonable and that approval of the proposed New Agreements are in the best interests of the Fund and its investors, (2) voted to approve the proposed New Agreements, and (3) voted to recommend approval of the proposed New Agreements by Fund investors. The Board noted some factors may have been more or less important with respect to the Fund and that no one factor was determinative of its decisions which, instead, were premised upon the totality of factors considered. In this connection, the Board also noted that different Board members likely placed emphasis on different factors in reaching their individual conclusions to vote in favor of the proposed New Agreements and to recommend approval of the proposed New Agreements by investors.
47
CPG Cooper Square International Equity, LLC
Fund Management (Unaudited)
September 30, 2022
Board members of the Fund, together with information as to their positions with the Fund, principal occupations and other board memberships for the past five years, are shown below.
Four of the Directors are not “interested persons” (as defined in the Investment Company Act) of the Fund (collectively, the “Independent Directors”).
The Fund’s statement of Additional Information includes additional information about Directors of the Fund and is available, without charge, upon calling the Fund at 212-317-9200.
| Name, Age, Address and Position(s) with Fund | Term of Office and Length of Time Served | Principal Occupation(s) During Past 5 Years | Number of Portfolios in Fund Complex Overseen by Director | Other Directorships/ Trusteeships Held by Director Outside Fund Complex During Past 5 Years | ||||||
| INDEPENDENT DIRECTORS | ||||||||||
| Joan Shapiro Green (78) c/o Central Park Group, LLC 125 W 55th Street New York, NY 10019 Chair | Term - Indefinite Length - Since Inception | Board Director (2014-present); Executive Director of National Council of Jewish Women New York (2007-2014); Executive Director of New York Society of Securities Analysts (2004-2006) | 9 | None | ||||||
| Kristen M. Leopold (55) c/o Central Park Group, LLC 125 W 55th Street New York, NY 10019 Director | Term - Indefinite Length - Since Inception | Independent Consultant to Hedge Funds (2007 - present); Chief Financial Officer of Weston Capital Management, LLC (investment managers) (1997-2006) | 9 | Blackstone Alternative Investment Funds (1 portfolio) (March 2013-present); Blackstone Alternative Alpha Fund; Blackstone Alternative Alpha Fund II; Blackstone Alternative Alpha Master Fund; Blackstone Alternative Multi-Manager Fund (2012-August 2021) | ||||||
| Janet L. Schinderman (72) c/o Central Park Group, LLC 125 W 55th Street New York, NY 10019 Director | Term - Indefinite Length -Since Inception | Self-Employed Educational Consultant since 2006; Associate Dean for Special Projects and Secretary to the Board of Overseers, Columbia Business School of Columbia University (1990-2006) | 9 | Advantage Advisers Xanthus Fund, L.L.C. | ||||||
| Sharon J, Weinberg (63) c/o Central Park Group, LLC 125 W 55th Street New York, NY 10019 Director | Term - Indefinite Length - Since Inception | Owner, the Chatham Bookstore (March 2021 – present); Co-Founder, Blue Leaf Ventures (investing/consulting) (2018-present); Managing Director, New York Ventures, Empire State Development (2016- 2018); Managing Director, JPMorgan Asset Management (2000 - 2015); Vice President, JPMorgan Investment Management (1996 - 2000); Associate, Willkie Farr & Gallagher LLP (1984 - 1996) | 9 | None | ||||||
48
CPG Cooper Square International Equity, LLC
Fund Management (Unaudited) (Continued)
September 30, 2022
| Name, Age, Address and Position(s) with Fund | Term of Office and Length of Time Served | Principal Occupation(s) During Past 5 Years | Number of Portfolios in Fund Complex Overseen by Director | Other Directorships/ Trusteeships Held by Director Outside Fund Complex During Past 5 Years | ||||||
| INTERESTED DIRECTOR | ||||||||||
| Mitchell A. Tanzman (63) c/o Central Park Group, LLC 125 W 55th Street New York, NY 10019 Director and Principal Executive Officer | Term - Indefinite Length - Since Inception | Co-Head/Co-CIO Wealth Solutions Macquaire Asset Management (since 2022); Co-Chief Executive Officer and Co-Chief Investment Officer of Central Park Group, LLC (2006-2022) | 9 | None | ||||||
| OFFICER(S) WHO ARE NOT DIRECTORS | ||||||||||
| Michael Mascis (55) c/o Central Park Group, LLC 125 W 55th Street New York, NY 10019 Principal Accounting Officer | Term - Indefinite Length - Since Inception | Chief Administrative Officer, Wealth Solutions Macquaire Asset Management (since 2022); Chief Financial Officer of Central Park Group, LLC (2006-2022) | N/A | N/A | ||||||
| Seth L. Pearlstein (56) c/o Central Park Group, LLC 125 W 55th Street New York, NY 10019 Chief Compliance Officer | Term - Indefinite Length - Since Inception | Associate Director, Wealth Solutions Macquaire Asset Management (since 2022); Chief Compliance Officer of Central Park Group, LLC (since 2015); General Counsel and Chief Compliance Officer of W.P. Stewart & Co., Ltd. (2008-2014); previously, Associate General Counsel (2002-2007) | N/A | N/A | ||||||
| Gregory Brousseau (67) c/o Central Park Group, LLC 125 W 55th Street New York, NY 10019 Vice President | Term - Indefinite Length - Since Inception | Co-Head/Co-CIO Wealth Solutions Macquaire Asset Management (since 2022); Co-Chief Executive Officer of Central Park Group, LLC (2006-2022) | N/A | N/A | ||||||
| Ruth Goodstein (62) c/o Central Park Group, LLC 125 W 55th Street New York, NY 10019 Vice President | Term - Indefinite Length - Since Inception | Chief Operating Officer, Wealth Solutions Macquaire Asset Management (since 2022); Chief Operating Officer of Central Park Group, LLC (2006-2022) | N/A | N/A | ||||||
| David F. Connor (58) c/o Central Park Group, LLC 125 W 55th Street New York, NY 10019 Vice President | Term - Indefinite Length - Since March 2022 | General Counsel of Macquarie Asset Management Public Investments Americas (since 2015) | N/A | N/A | ||||||
49
CPG Cooper Square International Equity, LLC
Fund Management (Unaudited) (Continued)
September 30, 2022
| Name, Age, Address and Position(s) with Fund | Term of Office and Length of Time Served | Principal Occupation(s) During Past 5 Years | Number of Portfolios in Fund Complex Overseen by Director | Other Directorships/ Trusteeships Held by Director Outside Fund Complex During Past 5 Years | ||||
| OFFICER(S) WHO ARE NOT DIRECTORS (CONTINUED) | ||||||||
| Graeme Conway (47) c/o Central Park Group, LLC 125 W 55th Street New York, NY 10019 Vice President | Term - Indefinite Length - Since March 2022 | Chief Commercial Officer and Head of Strategic Solutions of Macquarie Asset Management (since 2012) | N/A | N/A | ||||
| Jerel A. Hopkins (51) c/o Central Park Group, LLC 125 W 55th Street New York, NY 10019 Vice President | Term - Indefinite Length - Since March 2022 | Division Director, Wealth Solutions Macquarie Asset Management (since 2022); Associate General Counsel of Macquarie Asset Management (2004-2022) | N/A | N/A | ||||
| Brian Murray (56) c/o Central Park Group,LLC 125 W 55th Street New York, NY 10019 Vice President | Term - Indefinite Length - Since March 2022 | Chief Compliance Officer of Macquarie Asset Management Public Investments (since 2017); Chief Compliance Officer of Macquarie Asset Management (2004 - 2017) | N/A | N/A | ||||
| Richard Salus (58) c/o Central Park Group, LLC 125 W 55th Street New York, NY 10019 Vice President | Term - Indefinite Length - Since March 2022 | Global Head of Fund Services of Macquarie Asset Management (since 2016) | N/A | N/A | ||||
50
This page intentionally left blank.
This page intentionally left blank.
This page intentionally left blank.
| (b) | Not applicable. |
ITEM 2. CODE OF ETHICS.
(a) The registrant has adopted a code of ethics (the “Code of Ethics”) that applies to the registrant’s principal executive officer and principal financial officer.
(b) No information needs to be disclosed pursuant to this paragraph.
(c) The registrant has made no amendments to its Code of Ethics during the period covered by the report to members presented in Item 1 hereto.
(d) The registrant has not granted a waiver or an implicit waiver from a provision of its Code of Ethics during the period covered by the report to members presented in Item 1 hereto.
(e) Not applicable.
(f)
(1) Code of Ethics, or any amendment thereto, that is the subject of disclosure required by Item 2 is attached hereto.
(2) Not applicable.
(3) Not applicable.
ITEM 3. AUDIT COMMITTEE FINANCIAL EXPERT.
As of the end of the period covered by the report, the registrant’s board of directors has determined that Kristen Leopold is qualified to serve as the audit committee financial expert serving on its audit committee and that he/she is “independent,” as defined by Item 3 of Form N-CSR.
ITEM 4. PRINCIPAL ACCOUNTANT FEES AND SERVICES.
Audit Fees
(a) The aggregate fees billed for the fiscal period November 2, 2020, (commencement of fund operations) to September 30, 2021 and fiscal year ended September 30, 2022, for professional services rendered by the principal accountant for the audit of the registrant’s annual financial statements or services that are normally provided by the accountant in connection with statutory and regulatory filings or engagements was $90,000 for 2021 and $85,000 for 2022.
Audit-Related Fees
(b) The aggregate fees billed for the fiscal period November 2, 2020, (commencement of fund operations) to September 30, 2021 and fiscal year ended September 30, 2022, for assurance and related services by the principal accountant that are reasonably related to the performance of the audit of the registrant’s financial statements and are not reported under paragraph (a) of this Item are $0 for 2021 and $0 for 2022. The fees listed in item 4 (b) are related to out-of-pocket expenses in relation to the annual audit of the registrant.
Tax Fees
(c) The aggregate fees billed for the fiscal period November 2, 2020, (commencement of fund operations) to September 30, 2021 and fiscal year ended September 30, 2022, for professional services rendered by the principal accountant for tax compliance, tax advice, and tax planning are $85,000 for 2021 and $80,325 for 2022.
All Other Fees
(d) The aggregate fees billed in for the fiscal period November 2, 2020, (commencement of fund operations) to September 30, 2021 and fiscal year ended September 30, 2022, for products and services provided by the principal accountant, other than the services reported in paragraphs (a) through (c) of this Item are $0 for 2021 and $0 for 2022.
(e)(1) Disclose the audit committee’s pre-approval policies and procedures described in paragraph (c)(7) of Rule 2-01 of Regulation S-X.
The registrant's Audit Committee must pre-approve the audit and non-audit services of the Auditors prior to the Auditor's engagement.
(e)(2) The percentage of services described in each of paragraphs (b) through (d) of this Item that were approved by the audit committee pursuant to paragraph (c)(7)(i)(C) of Rule 2-01 of Regulation S-X are as follows:
(b) 0%
(c) 0%
(d) 0%
(f) Not applicable.
(g) The aggregate non-audit fees billed by the registrant's accountant for services rendered to the registrant, and rendered to the registrant's investment adviser (not including any sub-adviser whose role is primarily portfolio management and is subcontracted with or overseen by another investment adviser), and any entity controlling, controlled by, or under common control with the adviser that provides ongoing services to the registrant for the fiscal period November 2, 2020, (commencement of fund operations) to September 30, 2021 and fiscal year ended September 30, 2022, of the registrant was $85,000 for 2021 and $80,325 for 2022.
(h) The registrant’s audit committee of the board of directors has considered whether the provision of non-audit services that were rendered to the registrant's investment adviser (not including any sub-adviser whose role is primarily portfolio management and is subcontracted with or overseen by another investment adviser), and any entity controlling, controlled by, or under common control with the investment adviser that provides ongoing services to the registrant that were not pre-approved pursuant to paragraph (c)(7)(ii) of Rule 2-01 of Regulation S-X is compatible with maintaining the principal accountant's independence. No such services were provided.
ITEM 5. AUDIT COMMITTEE OF LISTED REGISTRANTS.
Not applicable.
ITEM 6. SCHEDULE OF INVESTMENTS.
Schedule of Investments in securities of unaffiliated issuers as of the close of the reporting period is included as part of the report to shareholders filed under Item 1 of this form.
ITEM 7. DISCLOSURE OF PROXY VOTING POLICIES AND PROCEDURES FOR CLOSED-END MANAGEMENT INVESTMENT COMPANIES.
ITEM 8. PORTFOLIO MANAGERS OF CLOSED-END MANAGEMENT INVESTMENT COMPANIES.
Portfolio Management
Chad M. Clark and Matthew C. Pickering serve as the Fund’s portfolio managers (the “Portfolio Managers”). Messrs. Clark and Pickering are jointly responsible for the day-to-day management of the Fund’s assets.
Mr. Clark joined the Sub-Adviser in August 2010. He oversees the Sub-Adviser’s international strategies and is a member of its Management Committee. Prior to joining the Sub-Adviser, Mr. Clark spent 14 years at Harris Associates, where he was a Partner and co-managed the Oakmark International Small Cap Fund and Harris International Value L.P. Prior to Harris Associates, he was an Analyst in Corporate Finance at William Blair & Company. Mr. Clark received a B.S. in Industrial Management from Carnegie Mellon University (summa cum laude), and is a CFA charterholder.
Mr. Pickering, a senior member of the Sub-Adviser’s investment team, joined the Sub-Adviser in December 2010. Prior to joining the Sub-Adviser, Mr. Pickering was an Analyst with Harris Associates for four years. Prior to Harris Associates, he worked for six years as an Analyst and Associate Portfolio Manager with Institutional Capital, where he was named Morningstar International Stock Co-Manager of the Year in 2005. Mr. Pickering received a B.S. from Miami University (magna cum laude), and is a CFA charterholder.
The Portfolio Managers provide advisory services to other clients, including other pooled investment vehicles, that invest in securities of the same type in which the Fund invests. As a result, there may be an incentive to favor one vehicle or account over another, resulting in conflicts of interest. The Sub-Adviser is aware of its obligation to ensure that, when orders for the same securities are entered on behalf of the Fund and other accounts, the Fund receives a fair and equitable allocation of the orders, particularly where affiliated accounts may participate. The Sub-Adviser has adopted various compliance policies and procedures that it believes are reasonably designed to address various conflicts of interest that may arise in connection with its management of other accounts and investment vehicles, and that provide a methodology for seeking to ensure fair treatment of all clients.
Each Portfolio Manager's compensation is comprised of a fixed annual salary, a discretionary bonus and potentially an annual supplemental distribution paid by the Sub-Adviser, or its parent company, and not by the Fund.
The following table lists the number and types of accounts, other than the Fund, managed by the Fund’s Portfolio Managers and estimated assets under management in those accounts, as of September 30, 2022.
| Registered Investment Companies | Pooled Investment Vehicles | Other Accounts | ||||||||||||||||||||||
| Portfolio Manager | Number of Accounts | Assets Managed | Number of Accounts | Assets Managed | Number of Accounts | Assets Managed | ||||||||||||||||||
| Chad M. Clark | 1 | $ | 1,944,304,397 | 12 | (1) | $ | 12,068,636,715 | 16 | (2) | $ | 2,921,520,137 | |||||||||||||
| Matthew C. Pickering | 1 | $ | 1,944,304,397 | 11 | (1) | $ | 7,542,099,512 | 16 | (2) | $ | 2,921,520,137 | |||||||||||||
| 1 | Of these accounts, 6 accounts with total assets of approximately $2,138,422,760 charge performance-based advisory fees. |
| 2 | Of these accounts, 1 account with total assets of approximately $28,202,549 charges performance-based advisory fees. |
ITEM 9. PURCHASES OF EQUITY SECURITIES BY CLOSED-END MANAGEMENT INVESTMENT COMPANY AND AFFILIATED PURCHASERS.
Not applicable.
ITEM 10. SUBMISSION OF MATTERS TO A VOTE OF SECURITY HOLDERS.
The registrant’s nominating committee reviews and considers, as it deems appropriate after taking into account, among other things, the factors listed in its charter, nominations of potential Directors made by the registrant’s management and by the registrant’s Investors who have sent to Gregory S. Rowland, Esq., legal counsel for the Independent Directors, at c/o Davis Polk & Wardwell LLP, 450 Lexington Avenue, New York, NY 10017, such nominations, which include all information relating to the recommended nominee that is required to be disclosed in solicitations or proxy statements for the election of Directors, including without limitation the biographical information and the qualifications of the proposed nominees. Nomination submissions must be accompanied by a written consent of the individual to stand for election if nominated by the Board and to serve if elected, and such additional information must be provided regarding the recommended nominee as is reasonably requested by the nominating committee. The nominating committee meets as is necessary or appropriate.
ITEM 11. CONTROLS AND PROCEDURES.
(a) The registrant’s principal executive and principal financial officers, or persons performing similar functions, have concluded that the registrant’s disclosure controls and procedures (as defined in Rule 30a-3(c) under the Investment Company Act of 1940, as amended (the “1940 Act”) (17 CFR 270.30a-3(c))) are effective, as of a date within 90 days of the filing date of the report that includes the disclosure required by this paragraph, based on their evaluation of these controls and procedures required by Rule 30a-3(b) under the 1940 Act (17 CFR 270.30a-3(b)) and Rules 13a-15(b) or 15d-15(b) under the Securities Exchange Act of 1934, as amended (17 CFR 240.13a-15(b) or 240.15d-15(b)).
(b) There were no changes in the registrant’s internal control over financial reporting (as defined in Rule 30a-3(d) under the 1940 Act (17 CFR 270.30a-3(d)) that occurred during the period covered by this report that has materially affected, or is reasonably likely to materially affect, the registrant’s internal control over financial reporting.
ITEM 12. DISCLOSURE OF SECURITIES LENDING ACTIVITIES FOR CLOSED-END MANAGEMENT INVESTMENT COMPANIES
(a)(1) Not applicable.
(a)(2) Not applicable.
(a)(3) Not applicable.
(a)(4) Not applicable.
(b) Not applicable.
ITEM 13. EXHIBITS.
(a)(3) Not applicable.
(a)(4) Not applicable.
(b) Not applicable.
SIGNATURES
Pursuant to the requirements of the Securities Exchange Act of 1934 and the Investment Company Act of 1940, the registrant has duly caused this report to be signed on its behalf by the undersigned, thereunto duly authorized.
| (registrant) | CPG Cooper Square International Equity, LLC | |
| By (Signature and Title)* | /s/ Mitchell A. Tanzman | |
| Mitchell A. Tanzman | ||
| (Principal Executive Officer) | ||
| Date | December 9, 2022 |
Pursuant to the requirements of the Securities Exchange Act of 1934 and the Investment Company Act of 1940, this report has been signed below by the following persons on behalf of the registrant and in the capacities and on the dates indicated.
| By (Signature and Title)* | /s/ Mitchell A. Tanzman | |
| Mitchell A. Tanzman | ||
| (Principal Executive Officer) | ||
| Date | December 9, 2022 | |
| By (Signature and Title)* | /s/ Michael Mascis | |
| Michael Mascis | ||
| (Principal Financial Officer) | ||
| Date | December 9, 2022 |
| * | Print the name and title of each signing officer under his or her signature. |