UNITED STATES
SECURITIES AND EXCHANGE COMMISSION
Washington, D.C. 20549 |
| |
 |
FORM 10-Q |
[X] QUARTERLY REPORT PURSUANT TO SECTION 13 OR 15(d) OF THE SECURITIES EXCHANGE ACT OF 1934 For the quarterly period ended March 31, 2004 OR [ ] TRANSITION REPORT PURSUANT TO SECTION 13 OR 15(d) OF THE SECURITIES EXCHANGE ACT OF 1934 For the transition period from ________________ to ________________ |
Commission File Number: 1-768 |
CATERPILLAR INC. (Exact name of registrant as specified in its charter) |
Delaware (State or other jurisdiction of incorporation) | 37-0602744 (IRS Employer I.D. No.) |
100 NE Adams Street, Peoria, Illinois (Address of principal executive offices) | 61629 (Zip Code) |
Registrant's telephone number, including area code: (309) 675-1000 |
Indicate by check mark whether the Registrant (1) has filed all reports required to be filed by Section 13 or 15(d) of the Securities Exchange Act of 1934 during the preceding 12 months (or for such shorter period that the Registrant was required to file such reports), and (2) has been subject to such filing requirements for the past 90 days. Yes [ X ] No [ ]. Indicate by check mark whether the Registrant is an accelerated filer (as defined in Rule 12b-2 of the Act). Yes [ X ] No [ ] |
At March 31, 2004, 341,902,131 shares of common stock of the Registrant were outstanding. |
Part I. FINANCIAL INFORMATION
Item 1. Financial Statements
Caterpillar Inc. Consolidated Statement of Results of Operations (Unaudited) (Dollars in millions except per share data) |
| | | Three Months Ended |
| | | March 31, |
| | | | 2004 | | | 2003 | |
| | |
| |
| |
Sales and revenues: | | | | | | | |
Sales of Machinery and Engines | | $ | 6,002 | | $ | 4,424 | |
Revenues of Financial Products | | | 465 | | | 397 | |
| | |
| |
| |
Total sales and revenues | | | 6,467 | | | 4,821 | |
| | | | | | | | |
Operating costs: | | | | | | | |
Cost of goods sold | | | 4,699 | | | 3,630 | |
Selling, general and administrative expenses | | | 724 | | | 570 | |
Research and development expenses | | | 214 | | | 152 | |
Interest expense of Financial Products | | | 118 | | | 120 | |
Other operating expenses | | | 138 | | | 127 | |
| | |
| |
| |
Total operating costs | | | 5,893 | | | 4,599 | |
| | |
| |
| |
| | | | | | | | |
Operating profit | | | 574 | | | 222 | |
| | | | | | | | |
Interest expense excluding Financial Products | | | 57 | | | 66 | |
Other income (expense) | | | 47 | | | 18 | |
| | |
| |
| |
| | | | | | | | |
Consolidated profit before taxes | | | 564 | | | 174 | |
| | | | | | | | |
Provision for income taxes | | | 158 | | | 49 | |
| | |
| |
| |
Profit of consolidated companies | | | 406 | | | 125 | |
| | | | | | | | |
Equity in profit (loss) of unconsolidated affiliated companies | | | 6 | | | 4 | |
| | |
| |
| |
| | | | | | | | |
Profit | | $ | 412 | | $ | 129 | |
| | |
| |
| |
| | | | | | | | |
|
| | | | | | | | |
Profit per common share | | $ | 1.20 | | $ | 0.37 | |
| | | | | | | | |
Profit per common share - diluted (1) | | $ | 1.16 | | $ | 0.37 | |
| | | | | | | | |
Weighted average common shares outstanding (thousands) | | | | | | | |
- Basic | | | 342,612 | | | 344,316 | |
- Diluted (1) | | | 355,736 | | | 346,826 | |
| | | | | | | | |
Cash dividends declared per common share | | $ | - | | $ | - | |
| | | | | | | | |
| |
| |
| |
1Diluted by assumed exercise of stock options, using the treasury stock method. |
See accompanying notes to Consolidated Financial Statements. |
|
Caterpillar Inc. Consolidated Statement of Changes in Stockholders' Equity For the Three Months Ended (Unaudited) (Millions of dollars) |
| | | March 31, | | March 31, |
| | �� | 2004 | | 2003 |
| | |
| |
|
Common stock | | | | | |
Balance at beginning of period | | $ | 1,059 | | | | | $ | 1,034 | | | | |
Common shares issued from treasury stock | | | 42 | | | | | | (1 | ) | | | |
| | |
| | | | |
| | | | |
Balance at end of period | | | 1,101 | | | | | | 1,033 | | | | |
| | |
| | | | |
| | | | |
| | | | | | | | | | | | | | |
Treasury stock: | | | | | | | | | | | | | |
| Balance at beginning of period | | | (2,914 | ) | | | | | (2,669 | ) | | | |
Shares issued: 03/31/04 – 1,350,091; 03/31/03 – 197,747 | | | 35 | | | | | | 5 | | | | |
Shares repurchased: 03/31/04 – 3,210,000; 03/31/03 - 0 | | | (250 | ) | | | | | - | | | | |
| | |
| | | | |
| | | | |
| Balance at end of period | | | (3,129 | ) | | | | | (2,664 | ) | | | |
| | |
| | | | |
| | | | |
| | | | | | | | | | | | | | |
Profit employed in the business: | | | | | | | | | | | | | |
Balance at beginning of period | | | 8,450 | | | | | | 7,849 | | | | |
Profit | | | 412 | | $ | 412 | | | 129 | | $ | 129 | |
Dividends declared | | | - | | | | | | - | | | | |
| | |
| | | | |
| | | | |
Balance at end of period | | | 8,862 | | | | | | 7,978 | | | | |
| | |
| | | | |
| | | | |
| | | | | | | | | | | | | | |
Accumulated other comprehensive income: | | | | | | | | | | | | | |
Foreign currency translation adjustment: | | | | | | | | | | | | | |
Balance at beginning of period | | | 348 | | | | | | 86 | | | | |
Aggregate adjustment for period | | | 2 | | | 2 | | | 54 | | | 54 | |
| | |
| | | | |
| | | | |
Balance at end of period | | | 350 | | | | | | 140 | | | | |
| | |
| | | | |
| | | | |
| | | | | | | | | | | | | | |
Minimum pension liability adjustment - consolidated companies: | | | | | | | | | | | | | |
Balance at beginning of period (net of tax of: 03/31/04 - $383; 03/31/03 - $82) | | | (934 | ) | | | | | (771 | ) | | | |
Aggregate adjustment for period | | | - | | | - | | | - | | | - | |
| | |
| | | | |
| | | | |
Balance at end of period (net of tax of: 03/31/04 - $383; 03/31/03 - $82) | | | (934 | ) | | | | | (771 | ) | | | |
| | |
| | | | |
| | | | |
| | | | | | | | | | | | | | |
Minimum pension liability adjustment - unconsolidated companies: | | | | | | | | | | | | | |
Balance at beginning of period | | | (48 | ) | | | | | (37 | ) | | | |
Aggregate adjustment for period | | | (1 | ) | | (1 | ) | | (1 | ) | | (1 | ) |
| | |
| | | | |
| | | | |
Balance at end of period | | | (49 | ) | | | | | (38 | ) | | | |
| | |
| | | | |
| | | | |
| | | | | | | | | | | | | | |
Derivative financial instruments: | | | | | | | | | | | | | |
Balance at beginning of period (net of tax of: 03/31/04 - $54; 03/31/03 - $4) | | | 104 | | | | | | 11 | | | | |
Gains/(losses) deferred during period (net of tax of: 03/31/04 - $11; 03/31/03 - $12) | | | 21 | | | 21 | | | (23 | ) | | (23 | ) |
(Gains)/losses reclassified to earnings (net of tax of: 03/31/04 - $5; 03/31/03 - $4) | | | (10 | ) | | (10 | ) | | 8 | | | 8 | |
| | |
| | | | |
| | | | |
Balance at end of period (net of tax of: 03/31/04 - $60; 03/31/03 - $4) | | | 115 | | | | | | (4 | ) | | | |
| | |
| | | | |
| | | | |
| | | | | | | | | | | | | | |
| Available-for-sale securities: | | | | | | | | | | | | | |
Balance at beginning of period (net of tax of: 03/31/04 - $7; 03/31/03 - $17) | | | 13 | | | | | | (31 | ) | | | |
Gains/(losses) deferred during period (net of tax of: 03/31/04 - $3; 03/31/03 - $3) | | | 6 | | | 6 | | | (5 | ) | | (5 | ) |
(Gains)/losses reclassified to earnings (net of tax of 03/31/04 - $1; 03/31/03 - $1) | | | (1 | ) | | (1 | ) | | 1 | | | 1 | |
| | |
| | | | |
| | | | |
Balance at end of period (net of tax of: 03/31/04 - $10; 03/31/03 - $19) | | | 18 | | | | | | (35 | ) | | | |
| | |
| | | | |
| | | | |
| | | | | | | | | | | | | | |
Total accumulated other comprehensive income | | | (500 | ) | | | | | (708 | ) | | | |
| | |
| | | | |
| | | | |
| | | | | | | | | | | | | | |
Comprehensive income | | | | | $ | 429 | | | | | $ | 163 | |
| | | | | |
| | | | |
| |
| | | | | | | | | | | | | | |
Stockholders' equity at end of period | | $ | 6,334 | | | | | $ | 5,639 | | | | |
| | |
| | | | |
| | | | |
| | | | | | | | | | | | | | |
See accompanying notes to Consolidated Financial Statements. |
|
Caterpillar Inc. Consolidated Statement of Financial Position (Unaudited) (Millions of dollars) |
| | | | March 31, 2004 | | | December 31, 2003 | |
| | |
| |
| |
Assets | | | | | | | |
Current Assets: | | | | | | | |
Cash and short-term investments | | $ | 368 | | $ | 342 | |
Receivables - trade and other | | | 3,751 | | | 3,666 | |
Receivables - finance | | | 7,989 | | | 7,605 | |
Deferred and refundable income taxes | | | 729 | | | 707 | |
Prepaid expenses | | | 1,351 | | | 1,424 | |
Inventories | | | 3,678 | | | 3,047 | |
| | |
| |
| |
Total current assets | | | 17,866 | | | 16,791 | |
| | | | | | | | |
Property, plant and equipment - net | | | 7,153 | | | 7,290 | |
Long-term receivables - trade and other | | | 109 | | | 82 | |
Long-term receivables - finance | | | 7,972 | | | 7,822 | |
Investments in unconsolidated affiliated companies | | | 817 | | | 800 | |
Deferred income taxes | | | 585 | | | 616 | |
Intangible assets | | | 234 | | | 239 | |
Goodwill | | | 1,400 | | | 1,398 | |
Other assets | | | 1,722 | | | 1,427 | |
| | |
| |
| |
Total Assets | | $ | 37,858 | | $ | 36,465 | |
| | |
| |
| |
| | | | | | | | |
Liabilities | | | | | | | |
Current liabilities: | | | | | | | |
Short-term borrowings: | | | | | | | |
Machinery and Engines | | | 163 | | | 72 | |
Financial Products | | | 2,773 | | | 2,685 | |
Accounts payable | | | 3,309 | | | 3,100 | |
Accrued expenses | | | 1,636 | | | 1,638 | |
Accrued wages, salaries and employee benefits | | | 1,644 | | | 1,802 | |
Dividends payable | | | - | | | 127 | |
Deferred and current income taxes payable | | | 271 | | | 216 | |
Long-term debt due within one year: | | | | | | | |
Machinery and Engines | | | 6 | | | 32 | |
Financial Products | | | 3,398 | | | 2,949 | |
| | |
| |
| |
Total current liabilities | | | 13,200 | | | 12,621 | |
| | | | | | | | |
Long-term debt due after one year: | | | | | | | |
Machinery and Engines | | | 3,660 | | | 3,367 | |
Financial Products | | | 10,910 | | | 10,711 | |
Liability for post-employment benefits | | | 3,222 | | | 3,172 | |
Deferred income taxes and other liabilities | | | 532 | | | 516 | |
| | |
| |
| |
Total Liabilities | | | 31,524 | | | 30,387 | |
| | |
| |
| |
| | | | | | | | |
Stockholders' Equity | | | | | | | |
Common stock of $1.00 par | | | | | | | |
Authorized shares: 900,000,000 | | | | | | | |
Issued shares: (03/31/04 and 12/31/03 - 407,447,312) at paid in amount | | | 1,101 | | | 1,059 | |
Treasury stock (03/31/04 – 65,545,181 shares; 12/31/03 – 63,685,272 shares) at cost | | | (3,129 | ) | | (2,914 | ) |
Profit employed in the business | | | 8,862 | | | 8,450 | |
Accumulated other comprehensive income | | | (500 | ) | | (517 | ) |
| | |
| |
| |
Total Stockholders' Equity | | | 6,334 | | | 6,078 | |
| | |
| |
| |
Total Liabilities and Stockholders' Equity | | $ | 37,858 | | $ | 36,465 | |
| | |
| |
| |
See accompanying notes to Consolidated Financial Statements. |
|
Caterpillar Inc. Condensed Consolidated Statement of Cash Flow (Unaudited) (Millions of dollars) |
| | | Three Months Ended |
| | | March 31, |
| | | | 2004 | | | 2003 | |
| | |
| |
| |
| Cash flow from operating activities: | | | | | | | |
| Profit | | $ | 412 | | $ | 129 | |
Adjustments for non-cash items: | | | | | | | |
Depreciation and amortization | | | 350 | | | 332 | |
Other | | | (37 | ) | | 17 | |
Changes in assets and liabilities: | | | | | | | |
Receivables - trade and other | | | (197 | ) | | (115 | ) |
Inventories | | | (631 | ) | | (301 | ) |
Accounts payable and accrued expenses | | | 260 | | | 248 | |
Other - net | | | (59 | ) | | (92 | ) |
| | |
| |
| |
Net cash provided by operating activities | | | 98 | | | 218 | |
| | |
| |
| |
| | | | | | | | |
Cash flow from investing activities: | | | | | | | |
Capital expenditures - excluding equipment leased to others | | | (106 | ) | | (86 | ) |
Expenditures for equipment leased to others | | | (240 | ) | | (261 | ) |
Proceeds from disposals of property, plant and equipment | | | 206 | | | 160 | |
Additions to finance receivables | | | (4,812 | ) | | (3,386 | ) |
Collection of finance receivables | | | 3,854 | | | 2,995 | |
Proceeds from the sale of finance receivables | | | 264 | | | 269 | |
Investments and acquisitions (net of cash acquired) | | | (13 | ) | | (17 | ) |
| Other - net | | | (65 | ) | | (40 | ) |
| | |
| |
| |
Net cash used for investing activities | | | (912 | ) | | (366 | ) |
| | |
| |
| |
| | | | | | | | |
Cash flow from financing activities: | | | | | | | |
Dividends paid | | | (127 | ) | | (120 | ) |
Common stock issued, including treasury shares reissued | | | 69 | | | - | |
Treasury shares purchased | | | (250 | ) | | - | |
Proceeds from long-term debt issued | | | 1,808 | | | 2,053 | |
Payments on long-term debt | | | (913 | ) | | (985 | ) |
Short-term borrowings - net | | | 220 | | | (773 | ) |
| | |
| |
| |
Net cash provided by financing activities | | | 807 | | | 175 | |
| | |
| |
| |
Effect of exchange rate changes on cash | | | 33 | | | (9 | ) |
| | |
| |
| |
Increase in cash and short-term investments | | | 26 | | | 18 | |
| | | | | | | | |
Cash and short-term investments at beginning of period | | | 342 | | | 309 | |
| | |
| |
| |
Cash and short-term investments at end of period | | $ | 368 | | $ | 327 | |
| | |
| |
| |
All short-term investments, which consist primarily of highly liquid investments with original maturities of three months or less, are considered to be cash equivalents. |
See accompanying notes to Consolidated Financial Statements. |
|
NOTES TO CONSOLIDATED FINANCIAL STATEMENTS (Unaudited) |
1. | A. Financial Statement Presentation In the opinion of management, all adjustments, consisting only of normal recurring adjustments necessary for a fair presentation of (a) the consolidated results of operations for the three-month periods ended March 31, 2004 and 2003, (b) the changes in stockholders' equity for the three-month periods ended March 31, 2004 and 2003, (c) the consolidated financial position at March 31, 2004 and December 31, 2003, and (d) the consolidated statement of cash flow for the three-month periods ended March 31, 2004 and 2003, have been made. Certain amounts for prior periods have been reclassified to conform to the current period financial statement presentation. In the second quarter of 2003, we revised our policy regarding the classification of certain costs related to distributing replacement parts. Prior period amounts have been revised to conform to the new classification. The amount reclassified from selling, general and administrative expenses to cost of goods sold was $106 million for the three months ended March 31, 2003. The reclassification had no impact on operating profit. The December 31, 2003 financial position data included herein is derived from the audited consolidated financial statements included in the Company's annual report on Form 10-K for the year ended December 31, 2003. |
| | B. Nature of Operations We operate in three principal lines of business: |
| | (1) | Machinery– A principal line of business which includes the design, manufacture and marketing of construction, mining and forestry machinery - track and wheel tractors, track and wheel loaders, pipelayers, motor graders, wheel tractor-scrapers, track and wheel excavators, backhoe loaders, mining shovels, log skidders, log loaders, off-highway trucks, articulated trucks, paving products, telescopic handlers, skid steer loaders and related parts. Also includes logistics services for other companies. |
| | (2) | Engines– A principal line of business including the design, manufacture and marketing of engines for Caterpillar machinery, electric power generation systems; on-highway vehicles and locomotives; marine, petroleum, construction, industrial, agricultural and other applications; and related parts. Reciprocating engines meet power needs ranging from 5 to over 22,000 horsepower (4 to over 16 200 kilowatts). Turbines range from 1,600 to 19,500 horsepower (1 000 to 14 500 kilowatts). |
| | (3) | Financial Products– A principal line of business consisting primarily of Caterpillar Financial Services Corporation (Cat Financial), Caterpillar Insurance Holdings, Inc. (Cat Insurance) and their subsidiaries. Cat Financial provides a wide range of financing alternatives for Caterpillar machinery and engines, Solar gas turbines, as well as other equipment and marine vessels. Cat Financial also extends loans to customers and dealers. Cat Insurance provides various forms of insurance to customers and dealers to help support the purchase and lease of our equipment. |
| | Our Machinery and Enginesoperations are highly integrated. Throughout the Notes, Machinery and Engines represents the aggregate total of these principal lines of business. |
| | C. Stock-Based Compensation We use the intrinsic value method of accounting for stock-based employee compensation in accordance with Accounting Principles Board Opinion No. 25, "Accounting for Stock Issued to Employees." Therefore, no compensation expense is recognized in association with our options. Pro forma net profit and profit per share were: |
| | | Three Months Ended March 31, |
(Dollars in millions except per share data) | | | 2004 | | | 2003 | |
| | |
| |
| |
Profit, as reported | | $ | 412 | | $ | 129 | |
Deduct: Total stock-based employee compensation expense determinedunder fair value based method for all awards, net of related tax effects | | | (18 | ) | | (18 | ) |
| | |
| |
| |
Pro forma profit | | $ | 394 | | $ | 111 | |
| | |
| |
| |
| | | | | | | | |
Profit per share of common stock: | | | | | | | |
As reported: | | | | | | | |
Basic | | $ | 1.20 | | $ | 0.37 | |
Diluted | | $ | 1.16 | | $ | 0.37 | |
Pro forma: | | | | | | | |
Basic | | $ | 1.15 | | $ | 0.32 | |
Diluted | | $ | 1.11 | | $ | 0.32 | |
| |
| |
| |
|
2. | The results for the three-month period ended March 31, 2004 are not necessarily indicative of the results for the entire year 2004. |
3. | Environmental and Legal Matters |
The company is regulated by federal, state, and international environmental laws governing our use of substances and control of emissions in all our operations. Compliance with these existing laws has not had a material impact on our capital expenditures, earnings, or competitive position.
We are cleaning up hazardous waste at a number of locations, often with other companies, pursuant to federal and state laws. When it is likely we will pay clean-up costs at a site and those costs can be estimated, the costs are charged against our earnings. In doing that estimate, we do not consider amounts expected to be recovered from insurance companies and others.
The amount accrued for environmental clean-up is not material and is included in "Accrued expenses" in the Statement of Financial Position. If a range of liability estimates is available on a particular site, we accrue at the lower end of that range.
We cannot estimate costs on sites in the very early stages of clean-up. Currently, we have five sites in the very early stages of clean-up, and there is no more than a remote chance that a material amount for clean-up will be required.
Pursuant to a consent decree Caterpillar entered with the EPA, the company was required to meet certain emission standards by October 2002. The decree provides that if engine manufacturers were unable to meet the standards at that time, they would be required to pay a Non-Conformance Penalty (NCP) on each engine sold that did not meet the standard. The amount of the NCP would be based on how close to meeting the standard the engine came - the more out of compliance the higher the penalty. The company began introduction of fully compliant ACERT engines in 2003 and by the end of 2003 Caterpillar was only producing fully compliant engine models. As a result, NCPs are not payable for any engines built in 2004. The company’s first quarter 2004 operating profit was favorably impacted by $49 million due to the absence of NCPs that were recorded in the first quarter 2003.
In addition, the consent decree required Caterpillar to pay a fine of $25 million, which was expensed in 1998 and to make investments totaling $35 million in environmental-related products by July 7, 2007. Total qualifying investments to date for these projects are $30 million, of which $1 million was made through the first quarter of 2004. A future benefit is expected to be realized from these environmental projects related to Caterpillar's ability to capitalize on the technologies it developed in complying with its environmental project obligations. In short, Caterpillar expects to receive a positive net return on the environmental projects by being able to market the technology it developed.
We are a party to litigation matters and claims that are normal in the course of our operations, and, while the results of such litigation and claims cannot be predicted with certainty, management believes, based on the advice of counsel, the final outcome of such matters will not have a materially adverse effect on our consolidated financial position.
On January 16, 2002, Caterpillar commenced an action in the Circuit Court of the Tenth Judicial Circuit of Illinois in Peoria, Illinois, against Navistar International Transportation Corporation and International Truck and Engine Corporation (collectively Navistar). The lawsuit arises out of a long-term purchase contract between Caterpillar and Navistar effective May 31, 1988, as amended from time to time (the Purchase Agreement). The pending complaint alleges that Navistar breached its contractual obligations by: (i) paying Caterpillar $8.08 less per fuel injector than the agreed upon price for new unit injectors delivered by Caterpillar; (ii) refusing to pay contractually agreed upon surcharges owed as a result of Navistar ordering less than planned volumes of replacement unit injectors; and (ii i) refusing to pay contractually agreed upon interest stemming from Navistar’s late payments. At March 31, 2004, the past due receivable from Navistar regarding the foregoing was $139 million. The pending complaint also has claims alleging that Franklin Power Products, Inc., Newstream Enterprises, and Navistar, collectively and individually, failed to pay the applicable price for shipments of unit injectors to Franklin and Newstream. At March 31, 2004, the past due receivables for the foregoing totaled $12 million. The pending complaint further alleges that Sturman Industries, Inc., and Sturman Engine Systems, Inc., colluded with Navistar to utilize technology that Sturman Industries, Inc., misappropriated from Caterpillar to help Navistar develop its G2 fuel system, and tortiously interfered with the Purchase Agreement and Caterpillar’s prospective economic relationship with Navistar. The pending complaint further alleges that the two parties’ collusion led Navistar to select Sturman Engine S ystems, Inc. and another company, instead of Caterpillar, to develop and manufacture the G2 fuel system.
On May 7, 2002, International Truck and Engine Corporation (International) commenced an action against Caterpillar in the Circuit Court of DuPage County, Illinois that alleges Caterpillar breached various aspects of a long-term agreement term sheet. In its fourth amended complaint, International seeks a declaration from the court that the term sheet constitutes a legally binding contract for the sale of heavy-duty engines at specified prices through the end of 2006, alleges that Caterpillar breached the term sheet by raising certain prices effective October 1, 2002, and also alleges that Caterpillar breached an obligation to negotiate a comprehensive long-term agreement referenced in the term sheet. International further claims that Caterpillar improperly restricted the supply of h eavy-duty engines to International from June through September 2002, and claims that Caterpillar made certain fraudulent misrepresentations with respect to the availability of engines during this time period. International seeks damages "in an amount to be determined at trial" and injunctive relief. Caterpillar filed an answer denying International's claims and has filed a counterclaim seeking a declaration that the term sheet has been effectively terminated. Caterpillar denies International's claims and will vigorously contest them. On September 24, 2003, the Appellate Court of Illinois, ruling on an interlocutory appeal, issued an order consistent with Caterpillar's position that, even if the court subsequently determines that the term sheet is a binding contract, it is indefinite in duration and was therefore terminable at will by Caterpillar after a reasonable period.Caterpillar anticipates that a trial currently scheduled for the fourth quarter of 2004 will address all remaining issues in this matter.This matter is not related to the breach of contract action brought by Caterpillar against Navistar currently pending in the Circuit Court of Peoria County, Illinois.
On August 30, 2002, a World Trade Organization (WTO) arbitration panel determined that the European Union (EU) may impose up to $4.04 billion per year in retaliatory tariffs if the U.S. tax code is not brought into compliance with an August 2001 WTO decision that found the extraterritorial tax (ETI) provisions of the FSC Repeal and Extraterritorial Income Exclusion Act of 2000 constitute an export subsidy prohibited by the WTO Agreement on Subsidies and Countervailing Measures. Since August 2002, the EU has developed a list of U.S. origin products on which the EU could impose tariffs as high as 100 percent of the value of the product. Negotiations among EU Member States, the European Commission, and the private sector over which products would be listed were intense. The EU finalized the list in D ecember 2003 and in March 2004 began to impose retaliatory tariffs of 5 percent on certain U.S. origin goods. These tariffs will increase 1 percentage point per month to a maximum of 17 percent after one year. The gradual increase in tariffs is designed to place increasing pressure on the U.S. government to bring its tax laws into compliance with its WTO obligations. Given the makeup of the final retaliation list, some Caterpillar parts and components will be subjected to these additional tariffs. We do not believe these tariffs will materially impact our financial results. The company has production facilities in the EU, Russia, Asia, and South America. Products sold into the EU from these plants are not affected by this retaliatory tariff. Congress is currently under increasing pressure to repeal ETI. We cannot predict how the U.S. legislative process will affect the company’s 2004 income tax liability. Although we don’t expect a material impact, it is possible that enacted changes in legislation could significantly lower our expected 2004 export benefits.
Inventories (principally "last-in, first-out" method) comprise the following:
(Millions of dollars) | | March 31, | | December 31, | |
| | | 2004 | | 2003 | |
| | |
| |
| |
Raw materials | | $ | 1,268 | | $ | 1,105 | |
Work-in-process | | | 552 | | | 377 | |
Finished goods | | | 1,655 | | | 1,381 | |
Supplies | | | 203 | | | 184 | |
| | |
| |
| |
Total inventories | | $ | 3,678 | | $ | 3,047 | |
| | |
| |
| |
| | | | | | | | |
|
5. | Intangible Assets and Goodwill |
Intangible assets are comprised of the following:
| | March 31, | | December 31, | |
(Millions of dollars) | | 2004 | | 2003 | |
| | |
| |
| |
Intellectual property | | $ | 125 | | $ | 126 | |
Pension-related | | | 157 | | | 157 | |
| | |
| |
| |
Total intangible assets - gross | | | 282 | | | 283 | |
Less: Accumulated amortization of intellectual property | | | (48 | ) | | (44 | ) |
| | |
| |
| |
Intangible assets - net | | $ | 234 | | $ | 239 | |
| | |
| |
| |
|
Amortization expense for the three months ended March 31, 2004 and 2003 was $4 million and $3 million, respectively. Amortization expense related to intangible assets is expected to be:
(Millions of dollars) |
2004 | | 2005 | | 2006 | | 2007 | | 2008 | | Thereafter |
| |
| |
| |
| |
| |
|
$ | 16 | | | $ | 14 | | | $ | 14 | | | $ | 12 | | | $ | 8 | | | $ | 13 | |
|
|
| |
|
|
| |
|
|
| |
|
|
| |
|
|
| |
|
|
|
|
During the three months ended March 31, 2004 and 2003, no goodwill was acquired, impaired or disposed.
6. | Unconsolidated Affiliated Companies |
Our investment in affiliated companies accounted for by the equity method consists primarily of a 50% interest in Shin Caterpillar Mitsubishi Ltd. (SCM) in Japan. Combined financial information of the unconsolidated affiliated companies accounted for using the equity method (generally on a three month lag, e.g., SCM results reflect the periods ending December 31) was as follows: |
| | | Results of Operation |
| | | Three Months Ended |
| | March 31, | | March 31, | |
(Millions of dollars) | | 2004 | | 2003 | |
| | |
| |
| |
Sales | | $ | 813 | | $ | 713 | |
Cost of sales | | | 629 | | | 569 | |
| | |
| |
| |
Gross profit | | $ | 184 | | $ | 144 | |
| | | | | | | | |
| Profit | | $ | 17 | | $ | 8 | |
| | |
| |
| |
| Caterpillar's profit | | $ | 6 | | $ | 4 | |
| | |
| |
| |
|
| | | Financial Position |
| | | March 31, | | December 31, | |
(Millions of dollars) | | 2004 | | 2003 |
| | |
| |
| |
Assets: | | | | | | | |
Current assets | | $ | 1,613 | | $ | 1,494 | |
Property, plant and equipment - net | | | 1,047 | | | 961 | |
Other assets | | | 199 | | | 202 | |
| | |
| |
| |
| | | | 2,859 | | | 2,657 | |
Liabilities: | | | | | | | |
Current liabilities | | | 1,414 | | | 1,247 | |
Long-term debt due after one year | | | 314 | | | 343 | |
Other liabilities | | | 263 | | | 257 | |
| | |
| |
| |
| | | | 1,991 | | | 1,847 | |
| | |
| |
| |
Ownership | | $ | 868 | | $ | 810 | |
| | |
| |
| |
| | | | | | | | |
Caterpillar's investment in unconsolidated affiliated companies | | | | | | | |
| Investment in equity method companies | | $ | 460 | | $ | 432 | |
Plus: Investment in cost method companies | | | 357 | | | 368 | |
| | |
| |
| |
Total investment in unconsolidated affiliated companies | | $ | 817 | | $ | 800 | |
| | |
| |
| |
| | | | | | | | |
|
Caterpillar is organized based on a decentralized structure that has established accountabilities to continually improve business focus and increase our ability to react quickly to changes in both the global business cycle and competitors' actions. Our current structure uses a product, geographic matrix organization comprised of multiple profit center and service center divisions.
We have developed an internal measurement system, which is not based on generally accepted accounting principles (GAAP), that is intended to motivate desired behavior and drive performance rather than measure a division's contribution to enterprise results. It is the comparison of actual results to budgeted results that makes our internal reporting valuable to management. Consequently, we believe that segment disclosure based on Statement of Financial Accounting Standards No. 131 (SFAS 131) "Disclosures about Segments of an Enterprise and Related Information" has limited value to our external readers. As a result, in addition to the required SFAS 131 compliant segment information presented below, we are continuing to disclose GAAP-based financial results for our three lines of business (Machinery, Engines, and Financial Products) in our Management's Discussion and Analysis beginning on page 17.
We made several changes to our segment reporting methodologies in the first quarter of 2004. Most notable are a change in the current cost methodology used to value inventory and cost of sales and a change in the manner that interest expense is charged to profit centers. In addition, certain corporate costs that were charged to segments in prior years are now reported as reconciling items. Prior year amounts have been restated to conform to the new methodology.
Business SegmentsThree Months Ended March 31,(Millions of dollars)
|
| | Machinery and Engines
| Financing | |
2004
| Asia/PacificMarketing
| Construction & MiningProducts
| EAMEMarketing
| LatinAmericaMarketing
| PowerProducts
| NorthAmericaMarketing
| AllOther
| Total
| and Insurance Services
| Consolidated Total
|
External sales and revenues | $ | 533 | $ | 138 | | $ | 843 | $ | 354 | $ | 1,733 | $ | 2,037 | $ | 329 | $ | 5,967 | $ | 532 | $ | 6,499 | |
Intersegment sales & revenues | | 110 | | 2,821 | | | 841 | | 225 | | 1,835 | | 86 | | 600 | | 6,518 | | - | | 6,518 | |
|
|
Total sales and revenues | $ | 643 | $ | 2,959 | | $ | 1,684 | $ | 579 | $ | 3,568 | $ | 2,123 | $ | 929 | $ | 12,485 | $ | 532 | $ | 13,017 | |
| Accountable profit | $ | 46 | $ | 310 | | $ | 101 | $ | 50 | $ | 19 | $ | 87 | $ | 161 | $ | 774 | $ | 106 | $ | 880 | |
Accountable assets at March 31, 2004 | $ | 624 | $ | 2,402 | | $ | 1,162 | $ | 660 | $ | 3,746 | $ | 103 | $ | 2,729 | $ | 11,426 | $ | 20,867 | $ | 32,293 | |
| |
|
| | Machinery and Engines
| Financing | |
2003
| Asia/ Pacific Marketing
| Construction & Mining Products
| EAME Marketing
| Latin America Marketing
| Power Products
| North America Marketing
| All Other
| Total
| | |
External sales and revenues | $ | 370 | $ | 45 | | $ | 687 | $ | 235 | $ | 1,379 | $ | 1,418 | $ | 247 | $ | 4,381 | $ | 475 | $ | 4,856 | |
Intersegment sales & revenues | | 79 | | 2,045 | | | 536 | | 116 | | 1,426 | | 48 | | 597 | | 4,847 | | - | | 4,847 | |
|
|
Total sales and revenues | $ | 449 | $ | 2,090 | | $ | 1,223 | $ | 351 | $ | 2,805 | $ | 1,466 | $ | 844 | $ | 9,228 | $ | 475 | $ | 9,703 | |
Accountable profit (loss) | $ | 35 | $ | 101 | | $ | 52 | $ | 10 | $ | (91) | $ | 51 | $ | 76 | $ | 234 | $ | 69 | $ | 303 | |
Accountable assets at December 31, 2003 | $ | 627 | $ | 2,190 | | $ | 1,018 | $ | 692 | $ | 3,710 | $ | 293 | $ | 2,537 | $ | 11,067 | $ | 20,235 | $ | 31,302 | |
|
Reconciliation of Sales & Revenues: | | | | | | | |
(Millions of dollars) | Machinery and Engines | | Financing and Insurance Services | | Consolidating Adjustments | | Consolidated Total |
|
| |
| |
| |
|
Three Months Ended March 31, 2004: | | | | | | | | | | | | |
Total external sales and revenues frombusiness segments | $ | 5,967 | | $ | 532 | | | $ | - | | | $ | 6,499 | |
Other | | 35 | | | (30) | | | | (37)(1) | | | | (32) | |
|
|
| |
|
|
| |
|
|
| |
|
|
|
Total sales and revenues | $ | 6,002 | | $ | 502 | | | $ | (37) | | | $ | 6,467 | |
|
|
| |
|
|
| |
|
|
| |
|
|
|
| | | | | | | | | | | | | | | |
Three Months Ended March 31, 2003: | | | | | | | | | | | | | | |
Total external sales and revenues frombusiness segments | $ | 4,381 | | $ | 475 | | | $ | - | | | $ | 4,856 | |
Other | | 43 | | | (35) | | | | (43)(1) | | | | (35) | |
|
|
| |
|
|
| |
|
|
| |
|
|
|
Total sales and revenues | $ | 4,424 | | $ | 440 | | | $ | (43) | | | $ | 4,821 | |
|
|
| |
|
|
| |
|
|
| |
|
|
|
| | | | | | | | | | | | | |
(1)Elimination of Financial Products revenues earned from Machinery and Engines. |
|
Reconciliation of Profit Before Taxes: | | | | | | | | | |
(Millions of dollars) | | Machinery and Engines | | Financing and Insurance Services | | Consolidated Total |
| |
| |
| |
|
Three Months Ended March 31, 2004: | | | | | | | | | |
Total accountable profit from business segments | | $ | 774 | | | $ | 106 | | | $ | 880 | |
Corporate costs | | | (128) | | | | - | | | | (128) | |
Timing | | | (56) | | | | - | | | | (56) | |
Methodology differences: | | | | | | | | | | | | |
Inventory/cost of sales | | | (29) | | | | - | | | | (29) | |
Postretirement benefit expense | | | (83) | | | | - | | | | (83) | |
Financing costs | | | 18 | | | | - | | | | 18 | |
Other methodology differences | | | (50) | | | | 8 | | | | (42) | |
Other | | | 4 | | | | - | | | | 4 | |
| |
|
|
| |
|
|
| |
|
|
|
Total profit before taxes | | $ | 450 | | | $ | 114 | | | $ | 564 | |
| |
|
|
| |
|
|
| |
|
|
|
| | | | | | | | | | | | | |
Three Months Ended March 31, 2003: | | | | | | | | | | | | |
Total accountable profit from business segments | | $ | 234 | | | $ | 69 | | | $ | 303 | |
Corporate costs | | | (79) | | | | - | | | | (79) | |
Timing | | | (18) | | | | - | | | | (18) | |
Methodology differences: | | | | | | | | | | | | |
Inventory/cost of sales | | | 1 | | | | - | | | | 1 | |
Postretirement benefit expense | | | (43) | | | | - | | | | (43) | |
Financing costs | | | 19 | | | | - | | | | 19 | |
Other methodology differences | | | (33) | | | | 11 | | | | (22) | |
Other | | | 13 | | | | - | | | | 13 | |
| |
|
|
| |
|
|
| |
|
|
|
Total profit before taxes | | $ | 94 | | | $ | 80 | | | $ | 174 | |
| |
|
|
| |
|
|
| |
|
|
|
|
Reconciliation of Assets: | | | | | | | | | | | | |
(Millions of dollars) | | Machinery and Engines | | Financing and Insurance Services | | Consolidating Adjustments | | Consolidated Total |
| |
| |
| |
| |
|
March 31, 2004: | | | | | | | | |
Total accountable assets from business segments | | $ | 11,426 | | $ | 20,867 | | | $ | - | | $ | 32,293 |
Items not included in segment assets: | | | | | | | | | | | | | |
Cash and short-term investments | | | 220 | | | 148 | | | | - | | | 368 |
Intercompany trade receivables | | | 378 | | | 295 | | | | (673) | | | - |
Investment in affiliated companies | | | 331 | | | - | | | | - | | | 331 |
Investment in Financial Products | | | 2,603 | | | - | | | | (2,603) | | | - |
Deferred income taxes and prepaids | | | 2,657 | | | 83 | | | | (243) | | | 2,497 |
Intangible assets and other assets | | | 2,039 | | | - | | | | - | | | 2,039 |
Service center assets | | | 984 | | | - | | | | - | | | 984 |
Liabilities included in segment assets | | | 919 | | | - | | | | - | | | 919 |
Inventory methodology differences | | | (2,148) | | | - | | | | - | | | (2,148) |
Other | | | 424 | | | 151 | | | | - | | | 575 |
| |
|
| |
|
|
| |
|
| |
|
|
Total assets | | $ | 19,833 | | $ | 21,544 | | | $ | (3,519) | | $ | 37,858 |
| |
|
| |
|
|
| |
|
| |
|
|
| | | | | | | | | | | | | | |
December 31, 2003: | | | | | | | | | | | | | |
Total accountable assets from business segments | | $ | 11,067 | | $ | 20,235 | | | $ | - | | $ | 31,302 |
Items not included in segment assets: | | | | | | | | | | | | | |
Cash and short-term investments | | | 220 | | | 122 | | | | - | | | 342 |
Intercompany trade receivables | | | 572 | | | 397 | | | | (969) | | | - |
Investment in affiliated companies | | | 325 | | | - | | | | - | | | 325 |
Investment in Financial Products | | | 2,547 | | | - | | | | (2,547) | | | - |
Deferred income taxes and prepaids | | | 2,736 | | | 77 | | | | (228) | | | 2,585 |
Intangible assets and other assets | | | 1,874 | | | - | | | | - | | | 1,874 |
Service center assets | | | 895 | | | - | | | | - | | | 895 |
Liabilities included in segment assets | | | 925 | | | - | | | | - | | | 925 |
Inventory methodology differences | | | (2,035) | | | - | | | | - | | | (2,035) |
| Other | | | 84 | | | 168 | | | | - | | | 252 |
| |
|
| |
|
|
| |
|
| |
|
|
Total assets | | $ | 19,210 | | $ | 20,999 | | | $ | (3,744) | | $ | 36,465 |
| |
|
| |
|
|
| |
|
| |
|
|
|
|
|
|
|
|
|
|
|
|
|
|
|
8. | Available-For-Sale Securities |
Caterpillar Insurance and Caterpillar Investment Management Ltd. had investments in certain debt and equity securities at March 31, 2004 that are classified as available-for-sale in accordance with Statement of Financial Accounting Standards No. 115 (SFAS 115) and recorded at fair value based upon quoted market prices. These fair values are included in "Other assets" in the Statement of Financial Position. Unrealized gains and losses arising from the revaluation of available-for-sale securities are included, net of applicable deferred income taxes, in equity ("Accumulated other comprehensive income" in the Statement of Financial Position). Realized gains and losses on sales of investments are determined using the specific identification method for debt instruments and the FIFO method for equity se curities. Realized gains and losses are included in "Other income (expense)" in the Statement of Results of Operations.
| | March 31, 2004 |
|
|
| | | | Unrealized | | |
| | | | Pretax Net | | |
(Millions of dollars) | Cost Basis | | Gains | | Fair Value |
|
| |
| |
|
Government debt | $ | 153 | | | $ | 1 | | | $ | 154 | |
Corporate bonds | | 297 | | | | 6 | | | | 303 | |
Equity securities | | 195 | | | | 19 | | | | 214 | |
|
|
|
| |
|
|
| |
|
|
|
Total | $ | 645 | | | $ | 26 | | | $ | 671 | |
|
|
|
| |
|
|
| |
|
|
|
|
|
|
|
|
|
|
|
|
|
|
|
| | December 31, 2003 |
|
|
| | | | Unrealized | | |
| | | | Pretax Net | | |
(Millions of dollars) | Cost Basis | | Gains | | Fair Value |
|
| |
| |
|
Government debt | $ | 102 | | | $ | - | | | $ | 102 | |
Corporate bonds | | 288 | | | | 3 | | | | 291 | |
Equity securities | | 191 | | | | 21 | | | | 212 | |
|
|
|
| |
|
|
| |
|
|
|
Total | $ | 581 | | | $ | 24 | | | $ | 605 | |
|
|
|
| |
|
|
| |
|
|
|
|
|
|
|
|
|
|
|
|
|
|
|
Investments in an unrealized loss position that are not other-than-temporarily impaired: |
| | | |
(Millions of dollars) | | March 31, 2004 |
| |
|
| | | Less than 12 months(1) | | More than 12 months(1) | | Total |
| |
| |
| |
|
| | | Fair Value | | Unrealized Losses | | Fair Value | | Unrealized Losses | | Fair Value | | UnrealizedLosses |
| |
| |
| |
| |
| |
| |
|
Government debt | | $ | 30 | | $ | - | | $ | - | | $ | - | | $ | 30 | | $ | - |
Corporate bonds | | | 55 | | | (1) | | | 18 | | | (1) | | | 73 | | | (2) |
Equity securities | | | 22 | | | - | | | 16 | | | - | | | 38 | | | - |
| |
|
| |
|
| |
|
| |
|
| |
|
| |
|
|
Total | | $ | 107 | | $ | (1) | | $ | 34 | | $ | (1) | | $ | 141 | | $ | (2) |
| |
|
| |
|
| |
|
| |
|
| |
|
| |
|
|
(1)Indicates length of time that individual securities have been in a continuous unrealized loss position. |
| |
|
The fair value of the available-for-sale debt securities at March 31, 2004, by contractual maturity, is shown below. Expected maturities will differ from contractual maturities because borrowers may have the right to prepay and creditors may have the right to call obligations.
(Millions of dollars) | | Fair Value |
| | |
|
Due in one year or less | | $ | 9 | |
Due after one year through five years | | $ | 234 | |
Due after five years through ten years | | $ | 33 | |
Due after ten years | | $ | 181 | |
| | | | | |
|
Proceeds from sales of investments in debt and equity securities during the three months ended March 31, 2004 and 2003 were $93 million and $27 million, respectively. Gross gains of $3 million and gross losses of $2 million were included in current earnings for the three months ended March 31, 2004. There were no gains or losses included in current earnings for the three months ended March 31, 2003.
9. | Derivative Instruments and Hedging Activities |
Our earnings and cash flow are subject to fluctuations due to changes in foreign currency exchange rates, interest rates and commodity prices. Our Risk Management Policy (policy) allows for the use of derivative financial instruments to prudently manage foreign currency exchange rate, interest rate and commodity price exposure. Our policy specifies that derivatives are not to be used for speculative purposes. Derivatives that we use are primarily foreign currency forward and option contracts, interest rate swaps and commodity forward and option contracts. Our derivative activities are subject to the management, direction and control of our financial officers. Risk management practices, including the use of financial derivative instruments, are presented to the Audit Committee of the Board of Directors at least annually.
Foreign Currency Exchange Rate Risk
Foreign currency exchange rate movements create a degree of risk by affecting the U.S. dollar value of sales made and costs incurred in foreign currencies. Movements in foreign currency rates also affect our competitive position as these changes may affect business practices and/or pricing strategies of non-U.S. based competitors. Additionally, we have balance sheet positions denominated in foreign currency, thereby creating exposure to movements in exchange rates.
Machinery and Engines operations purchase, manufacture and sell products in many locations around the world. As we have a diversified revenue and cost base, we manage our future foreign currency cash flow exposure on a net basis. We use foreign currency forward and option contracts to manage unmatched foreign currency cash inflow and outflow. Our objective is to minimize the risk of exchange rate movements that would reduce the U.S. dollar value of our foreign currency cash flow. Our policy allows for managing anticipated foreign currency cash flow for up to four years.
We generally designate as cash flow hedges at inception of the contract any Australian dollar, Brazilian real, British pound, Canadian dollar, euro, Japanese yen, Mexican peso or Singapore dollar forward or option contracts that exceed 90 days in duration. Designation is performed on a specific exposure basis to support hedge accounting. The remainder of Machinery and Engines foreign currency contracts are undesignated. As of March 31, 2004, $88 million of deferred net gains included in equity ("Accumulated other comprehensive income" in the Statement of Financial Position) are expected to be reclassified to current earnings ("Other income (expense)") over the next twelve months when earnings are negatively affected by the hedged transactions. This amount is based on March 31, 2004 exchange rates – the actual amount recorded in other income/expense will vary based on exchange rates at the time the hedged transactions impact earnings. As of March 31, 2003, this projected reclassification was a loss of $4 million. There were no circumstances where hedge treatment was discontinued during the three months ended March 31, 2004 or 2003.
In managing foreign currency risk for our Financial Products operations, our objective is to minimize earnings volatility resulting from conversion and the remeasurement of net foreign currency balance sheet positions. Our policy allows the use of foreign currency forward contracts to offset the risk of currency mismatch between our receivables and debt. All such foreign currency forward contracts are undesignated.
Gains / (losses) included in current earnings [Other income (expense)] on undesignated contracts:
|
| | | Three Months Ended
March 31, |
(Millions of dollars) | | 2004 | | 2003 | |
| | |
| |
| |
Machinery and Engines: | | | | | | | |
On undesignated contracts | | $ | (2 | ) | $ | 3 | |
Financial Products: | | | | | | | |
On undesignated contracts | | | 16 | | | (30 | ) |
| | |
| |
| |
| | | $ | 14 | | $ | (27 | ) |
| | | | | | | | |
|
Gains and losses on the Financial Products contracts above are substantially offset by balance sheet remeasurement and conversion gains and losses.
Interest Rate RiskInterest rate movements create a degree of risk by affecting the amount of our interest payments and the value of our fixed rate debt. Our policy is to use interest rate swap agreements and forward rate agreements to manage our exposure to interest rate changes and lower the cost of borrowed funds.
Machinery and Engines operations generally use fixed rate debt as a source of funding. Our objective is to minimize the cost of borrowed funds. Our policy allows us to enter into fixed-to-floating interest rate swaps and forward rate agreements to meet that objective with the intent to designate as fair value hedges at inception of the contract all fixed-to-floating interest rate swaps. Designation as a hedge of the fair value of our fixed rate debt is performed to support hedge accounting. During 2001, our Machinery and Engines operations liquidated all fixed-to-floating interest rate swaps. Deferred gains on liquidated fixed-to-floating interest rate swaps, which were previously designated as fair value hedges, are being amortized to earnings ratably over the remaining life of the hedged debt. W e designate as cash flow hedges at inception of the contract all forward rate agreements. Designation as a hedge of the anticipated issuance of debt is performed to support hedge accounting. Machinery and Engines forward rate agreements are 100% effective.
Financial Products operations have a "match funding" objective whereby, within specified boundaries, the interest rate profile (fixed rate or floating rate) of their debt portfolio matches the interest rate profile of their receivables. In connection with that objective, we use interest rate derivative instruments to modify the debt structure to match the receivable portfolio. This "match funding" reduces the volatility of margins between interest-bearing assets and interest-bearing liabilities, regardless of which direction interest rates move. We also use these instruments to gain an economic and/or competitive advantage through a lower cost of borrowed funds. This is accomplished by changing the characteristics of existing debt instruments or entering into new agreements in combination with the issuance of new debt.
Our policy allows us to use floating-to-fixed, fixed-to-floating, and floating-to-floating interest rate swaps to meet the "match funding" objective. To support hedge accounting, we designate fixed-to-floating interest rate swaps as fair value hedges of the fair value of our fixed rate debt at the inception of the contract. Financial Products policy is to designate most floating-to-fixed interest rate swaps as cash flow hedges of the variability of future cash flows at inception of the contract. During 2002, our Financial Products operations liquidated four fixed-to-floating interest rate swaps. As a result, the fair value adjustment of the original debt is being amortized to earnings ratably over the remaining life of the hedged debt.
Gains (losses) included in current earnings [Other income (expense)]:
|
|
| | Three Months Ended March 31, |
(Millions of dollars) | 2004 | | 2003 |
|
| |
|
Fixed-to-floating interest rate swaps | | | | | | | |
Machinery and Engines: | | | | | | | |
Gain/(loss) on designated interest rate derivatives | $ | - | | | $ | - | |
Gain/(loss) on hedged debt | | - | | | | - | |
Gain/(loss) on liquidated swaps | | 1 | | | | 2 | |
Financial Products: | | | | | | | |
Gain/(loss) on designated interest rate derivatives | | (34) | | | | - | |
Gain/(loss) on hedged debt | | 34 | | | | - | |
Gain/(loss) on liquidated swaps – included in interest expense | | 1 | | | | 1 | |
Floating-to-fixed interest rate swaps | | | | | | | |
Financial Products: | | | | | | | |
Gain/(loss) due to ineffectiveness | | - | | | | - | |
|
|
|
| |
|
|
|
| | $ | 2 | | | $ | 3 | |
|
|
|
| |
|
|
|
|
|
|
|
|
|
|
|
Deferred net gains (losses) included in equity (Accumulated other comprehensive income) expected to be reclassified to current earnings (Other income (expense)) over the next twelve months: |
|
| | | Three Months Ended March 31, |
(Millions of dollars) | | 2004 | | 2003 |
| | |
| |
|
Machinery and Engines: | | | | | | | |
Forward Rate Agreement Liquidation | | $ | - | | $ | - | |
Financial Products: | | | | | | | |
Floating-to-Fixed Interest Rate Swaps | | $ | (18 | ) | $ | (25 | ) |
| | | | | | | | |
|
The reclassification of the remaining deferred amount to current earnings ("Other income (expense)") will occur over a maximum of 27 years. There were no circumstances where hedge treatment was discontinued during the three months ended March 31, 2004 or 2003.
Commodity Price Risk
Commodity price movements create a degree of risk by affecting the price we must pay for certain raw material. Our policy is to use commodity forward and option contracts to manage the commodity risk and reduce the cost of purchased materials.
Our Machinery and Engines operations purchase aluminum, copper and nickel embedded in the components we purchase from suppliers. Our suppliers pass on to us price changes in the commodity portion of the component cost.
Our objective is to minimize volatility in the price of these commodities. Our policy allows us to enter commodity forward and option contracts to lock in the purchase price of a portion of these commodities within a four-year horizon. All such commodity forward and option contracts are undesignated. Gains on the undesignated contracts of $7 million and $1 million were recorded in current earnings ("Other income (expense)") for the three months ended March 31, 2004 and March 31, 2003, respectively.
10. | Guarantees and product warranty |
We have guaranteed to repurchase loans of certain Caterpillar dealers from the Dealer Capital Asset Trust (DCAT) in the event of their default. These guarantees arose in conjunction with Cat Financial's relationship with third party dealers who sell Caterpillar equipment. These guarantees have terms ranging from one to four years and are secured primarily by dealer assets. At March 31, 2004 and December 31, 2003 amounts outstanding under these guarantees were $355 million and $380 million, respectively. The related book value was $5 million at March 31, 2004 and December 31, 2003.
Our product warranty liability is determined by applying historical claim rate experience to the current field population and dealer inventory. Generally, historical claim rates are developed using a 12-month rolling average of actual warranty payments. These rates are applied to the field population and dealer inventory to determine the liability.
|
(Millions of dollars) | | 2004 |
| | |
|
Warranty liability, January 1 | | $ | 622 | |
Payments | | | (125 | ) |
Provision for warranty | | | 136 | |
| | |
| |
Ending Warranty liability, March 31 | | $ | 633 | |
| | |
| |
|
(Millions of dollars) | | 2003 |
| | |
|
Warranty liability, January 1 | | $ | 693 | |
Payments | | | (484 | ) |
Provision for warranty | | | 413 | |
| | |
| |
Ending Warranty liability, December 31 | | $ | 622 | |
| | |
| |
|
11. | Computations of Profit Per Share |
| | | Three Months Ended March 31, |
| | (Dollars in millions except per share data) | 2004 | | 2003 |
| |
| |
|
I. | Profit for the period (A): | $ | 412 | | $ | 129 |
| |
|
| |
|
|
| | | | | | | |
II. | Determination of shares (thousands): | | | | | |
| | Weighted average number of common shares outstanding (B) | | 342,612 | | | 344,316 |
| | Shares issuable on exercise of stock options, net of shares assumedto be purchased out of proceeds at average market price | | 13,124 | | | 2,510 |
| |
|
| |
|
|
| | Average common shares outstanding for fully diluted computation (C) | | 355,736 | | | 346,826 |
| |
|
| |
|
|
| | | | | | | |
III. | Profit per share of common stock: | | | | | |
| | Assuming no dilution (A/B) | $ | 1.20 | | $ | 0.37 |
| | Assuming full dilution (A/C) | $ | 1.16 | | $ | 0.37 |
| | | | | | | |
|
Stock options to purchase 27,879,699 shares of common stock at a weighted average price of $54.34 were outstanding as of March 31, 2003, but were not included in the computation of diluted profit per share because the options’ exercise price was greater than the average market price of the common shares. As of March 31, 2004, all stock options were included in the computation of diluted profit per share.
12. | Postretirement Benefits |
A. Pension and postretirement benefit costs
| | (Millions of Dollars) |
|
|
| | U.S. Pension Benefits | | Non-U.S. Pension Benefits | | Other Postretirement Benefits |
| |
| |
| |
|
| | | March 31, | | March 31, | | March 31, |
| |
| |
| |
|
Components of net periodic benefit cost: | | 2004 | | 2003 | | 2004 | | 2003 | | 2004 | | 2003 |
| |
| |
| |
| |
| |
| |
|
Service cost | | $ | 36 | | $ | 30 | | $ | 12 | | $ | 10 | | $ | 17 | | $ | 17 | |
Interest cost | | | 137 | | | 139 | | | 22 | | | 20 | | | 71 | | | 75 | |
| Expected return on plan assets | | | (167) | | | (165) | | | (24) | | | (23) | | | (18) | | | (22) | |
Amortization of: | | | | | | | | | | | | | | | | | | | |
Net asset existing at adoption of SFAS 87 | | | - | | | - | | | 1 | | | 1 | | | - | | | - | |
Prior service cost (1) | | | 11 | | | 12 | | | 2 | | | 1 | | | (12) | | | (11) | |
Net actuarial loss (gain) | | | 35 | | | 7 | | | 9 | | | 4 | | | 19 | | | 9 | |
| |
| |
| |
| |
| |
| |
|
Total cost (benefit) included in results of operations | | $ | 52 | | $ | 23 | | $ | 22 | | $ | 13 | | $ | 77 | | $ | 68 | |
|
| |
| |
| |
| |
| |
|
| | | | | | | | | | | | | | | |
Weighted-average assumptions used todetermine net cost: | | | | | | | | | | | | | | |
Discount rate | | 6.2% | | 7.0% | | 5.1% | | 5.4% | | 6.2% | | 7.0% | |
Expected return on plan assets | | 9.0% | | 9.0% | | 7.4% | | 7.1% | | 9.0% | | 9.0% | |
Rate of compensation increase | | 4.0% | | 4.0% | | 3.2% | | 3.3% | | 4.0% | | 4.0% | |
| | | | | | | | | | | | | | | |
(1)Prior service costs are amortized using the straight-line method over the average remaining service period to the full retirement eligibility date of employees expected to receive benefits from the plan amendment. |
|
Our U.S. postretirement health care plans provide for prescription drug benefits. On December 8, 2003, the Medicare Prescription Drug, Improvement and Modernization Act of 2003 (the Act) was signed into law. The Act introduces a prescription drug benefit under Medicare (Medicare part D) as well as a federal subsidy to sponsors of retiree health care benefit plans that provide a benefit that is at least actuarially equivalent to Medicare part D. In accordance with FASB Staff Position FAS 106-1, "Accounting and Disclosure Requirements Related to the Medicare Prescription Drug, Improvement and Modernization Act of 2003" any measures of accumulated postretirement benefit obligation or net periodic postretirement benefit cost in the financial statements and accompanying notes do not reflect the effects of the Act on the plans. Specific authoritative guidance on the accounting for the federal subsidy is pending and that guidance, when issued, could require us to change previously reported information, to reflect this expected benefit.
B. Defined contribution benefit costs
Total company costs related to U.S. and non-U.S. defined contribution plans were the following:
| | | Three Months Ended March 31, |
(Millions of dollars) | | 2004 | 2003 |
| | |
|
|
U.S. Plans | | $ | 30 | | $ | 22 | |
Non-U.S. Plans | | | 3 | | | 3 | |
| | |
| |
| |
| | | $ | 33 | | $ | 25 | |
| | |
| |
| |
|
Item 2. Management's Discussion and Analysis of Financial Condition and Results of Operations
A. Overview
We have made tremendous productivity gains in the last few years, and we continue to benefit from a lean and efficient workforce. Whilethere were some higher costs related to surging volume, we leveraged6 Sigmadisciplines to help overcome supply chain bottlenecks and meet stronger than expected demand.Our record first-quarter results show that people are making a positive difference across the entire value chain.
We remain focused on managing our cost structure as the economy recovers, ensuring we deliver outstanding results over the business cycle. We will continue to rely on our 6 Sigma culture to ensure we are growing profitably. We now have more than 2,700 trained black belts, who are launching thousands of new projects this year as we continue to demonstrate the value of 6 Sigma in achieving our business strategy. Virtually all of our employees are involved in 6 Sigma and engaged in making continuous improvement a way of life.
It appears the world economy will have one of the strongest, broadest recoveries in years. Economic stimulus in the United States is producing strong growth and the Asian economies are improving on last year’s outstanding performance. Low interest rates throughout the world and higher commodity prices are encouraging much needed construction spending and investments in the mining industry. Sales opportunities are increasing and we are exceptionally well positioned to benefit with our broad product offerings and strong global dealer network. We anticipate that keeping pace with volume growth will require additional hiring through the remainder of the year.
Note: Glossary of terms included on pages 26-27; first occurrence of terms shown in bold italics.
B. Consolidated Results of Operations
THREE MONTHS ENDED MARCH 31, 2004 COMPARED WITH THREE MONTHS ENDED MARCH 31, 2003
SALES AND REVENUES
|
The chart above graphically illustrates reasons for the change in Consolidated Sales and Revenues between first quarter 2003 (at left) and first quarter 2004 (at right). Items favorably impacting sales and revenues appear as upward stair steps with the corresponding dollar amounts above each bar, while items negatively impacting sales and revenues appear as downward stair steps with dollar amounts reflected in parenthesis above each bar. Caterpillar management utilizes these charts internally to visually communicate with its Board and employees.
|
MACHINERY AND ENGINES |
|
Sales and Revenues (Millions of dollars) |
|
| | | Total | | North America | | EAME | | | LatinAmerica | | | Asia/ Pacific |
| | |
| |
| |
| | |
| | |
|
Three Months Ended March 31, 2004 | | | | | | | | | | | | | | | |
Machinery | | $ | 4,152 | | $ | 2,283 | | $ | 963 | | $ | 295 | | $ | 611 |
Engines* | | | 1,850 | | | 870 | | | 559 | | | 195 | | | 226 |
Financial Products** | | | 465 | | | 334 | | | 83 | | | 21 | | | 27 |
| | |
| |
| |
| |
| |
|
| | | $ | 6,467 | | $ | 3,487 | | $ | 1,605 | | $ | 511 | | $ | 864 |
| | |
| |
| |
| |
| |
|
Three Months Ended March 31, 2003 | | | | | | | | | | | | | | | |
Machinery | | $ | 2,935 | | $ | 1,532 | | $ | 787 | | $ | 183 | | $ | 433 |
Engines* | | | 1,489 | | | 676 | | | 494 | | | 123 | | | 196 |
Financial Products** | | | 397 | | | 285 | | | 70 | | | 24 | | | 18 |
| | |
| |
| |
| |
| |
|
| | | $ | 4,821 | | $ | 2,493 | | $ | 1,351 | | $ | 330 | | $ | 647 |
| | |
| |
| |
| |
| |
|
* Does not include internal engine transfers of $374 million and $321 million in first quarter 2004 and first quarter 2003, respectively. Internal engine transfers are valued at prices comparable to those for unrelated parties. |
** Does not include revenues earned from Machinery and Engines of $37 million and $43 million in first quarter 2004 and first quarter 2003, respectively. |
Refer to table on page 21 for reconciliation of Machinery and Engine Sales by Geographic Region to External Sales by Marketing Segment. |
|
|
Machinerysaleswere $4.15 billion, an increase of $1.22 billion or 41 percent from first quarter 2003.Sales volumewas up about 36 percent while the favorable impact ofcurrencyaccounted for about 4 percent and improvedprice realizationadded about 1 percent. Sales in North America increased 49 percent from first quarter 2003, 45 percent due to higher volume and the remainder due to improved price realization. Volume benefited from higher dealer deliveries into construction and mining, the result of improved economic conditions in those sectors. In addition, dealers added more to inventories than they did last year to support higher deliveries. Sales inEAMEincreased 22 percent, benefiting from both the favorable currency impact of a stronger euro and higher sales volume. Major contributors to the volume gain were increased dealer deliveries into the construction sectors of oil-producing countries in Africa/Middle East and increased replacement demand particularly from rental fleets in Europe. InLatin America, sales were 61 percent higher than last year, resulting almost entirely from increased deliveries into mining. In Asia/Pacific, sales rose 41 percent from last year as dealer deliveries increased in many countries and dealers built inventories to support anticipated higher demand.
Enginessaleswere $1.85 billion, an increase of $361 million or24percent from first quarter 2003. Sales volume was up about 18percent, the favorable impact of currency accounted for about 4 percent and improved price realization added about 2 percent.Stronger economic and investment growth bolstered sales in all geographic regions. The North American sales gain of 29 percent was led by a 41 percent increaseinsales of on-highway truck engines compared to last year’s first quarter which was negatively impacted by truck manufacturers buying engines before the October 2002 engine emission regulations became effective. North American sales to the electric power sector increased 40 percent while sales to the petroleum sector rose 7 percent. Sales in EAME rose 13 percent mostly due to 39 percen t growth in engine sales in the petroleum sector and 37 percent stronger demand for engines sold into the electric power sector which more than offset lower sales into the marine and industrial sectors. Sales rose 59 percent in Latin America with 70 percent growth in engine sales into the electric power sector and 47 percent growth in engine sales in the petroleum sector. Widespread economic growth contributed to the 15 percent sales increase in Asia/Pacific where engine sales into the electric power sector more than doubled helped by surging investment. Globally, engine sales into the electric power sector rose 51 percent, aided by widespread industry growth and the favorable effects of currency. Engine sales into the global on-highway truck and bus sector rose43percent due to stronger industry demand and improved price realizat ion. Sales into the petroleum sector were up15 percent. Global sales of industrial engines were up 4 percent due to favorable effects of currency which more than offset lower volume as key customers bought engines in fourth quarter 2003 before the final European Tier II emissions law went into effect in January 2004. Global sales of marine engines were 3 percent below last year as customers moved some orders for large reciprocating engines from first quarter 2004 into the second quarter.
Financial Productsrevenueswere $465 million, an increase of $68 million or 17 percent from first quarter 2003. The increase was due primarily to the favorable impact of $57 million from continued growth ofEarning Assetsat Cat Financial and an $11 million increase in e arned premiums and fees on extended service contracts at Cat Insurance. These favorable items were partially offset by a $19 million impact of lower interest rates on new and existing finance receivables at Cat Financial.
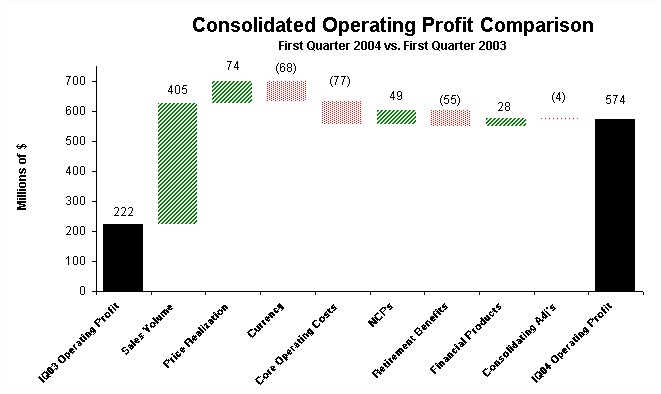
OPERATING PROFIT
|
The chart above graphically illustrates reasons for the change in Consolidated Sales and Revenues between first quarter 2003 (at left) and first quarter 2004 (at right). Items favorably impacting sales and revenues appear as upward stair steps with the corresponding dollar amounts above each bar, while items negatively impacting sales and revenues appear as downward stair steps with dollar amounts reflected in parenthesis above each bar. Caterpillar management utilizes these charts internally to visually communicate with its Board and employees.
|
Higher sales volume in all regions and most industries positively impacted operating profit by $405 million. Improved price realization of $74 million reflected the favorable impact of modest price increases taken on mostmachines, parts and engines. Operating profit was also favorably impacted by $49 million due to the absence ofNon-Conformance Penalties (NCPs)that were recorded in the first quarter 2003.
Partially offsetting the favorable items were $77 million in highercore operating costs, a $68 million unfavorable impact of currency on operating profit due primarily to the continued weakening of the dollar compared with the British pound and the Japanese yen and $55 million of higherretirement benefits.
The increase in core operating costs reflects higher spending to support volume growth including higher steel prices, production ramp-up, material expediting costs and general support costs to meet current demand. In addition, higher incentive compensation due to increasing our outlook above what was originally anticipated and increased spending on product development programs also contributed to higher core operating costs. These unfavorable items were partially offset by the positive impact of continued material cost reductions.
Operating Profit (Loss)
(Millions of Dollars) |
|
| | | Three Months Ended |
| | |
|
| | | March 31, 2004 | | March 31,2003 | |
| | |
| |
| |
Machinery* | | $ | 452 | | $ | 218 | |
Engines* | | | 40 | | | (54 | ) |
| Financial Products | | | 105 | | | 77 | |
| Consolidating Adjustments | | | (23 | ) | | (19 | ) |
| | |
| |
| |
| | | $ | 574 | | $ | 222 | |
| | |
| |
| |
*Caterpillar operations are highly integrated; therefore, the company uses a number of allocations to determine lines of business operating profit for Machinery and Engines. |
|
Machinery operating profitwas up $234 million, or 107 percent, from first quarter 2003. The favorable impact of higher sales volume and improved price realization were partially offset by higher core operating costs (as outlined above), the unfavorable impact of currency and higher retirement benefits.
Engines operating profitwas up $94 million from first quarter 2003. The favorable impact of the absence of NCPs, higher sales volume and improved price realization were partially offset by higher retirement benefits.
Financial Products operating profitwas up $28 million, or 36 percent from first quarter 2003. The increase was primarily due to a $20 million impact from the growth of earning assets and a favorable change in gain/loss on sale of equipment returned from lease of $8 million at Cat Financial.
Reconciliation of Machinery and Engine Sales by Geographic Region to External Sales by Marketing Segment |
| | | Three Months Ended |
| | |
|
(Millions of Dollars) | | March 31,2004 | | March 31,2003 | |
| | |
| |
| |
North American Geographic Region | | $ | 3,153 | | $ | 2,208 | |
| Engine sales included in the Power Products segment | | | (870 | ) | | (676 | ) |
Company owned dealer sales included in the All Other segment | | | (123 | ) | | (75 | ) |
Other* | | | (123 | ) | | (39 | ) |
| | |
| |
| |
North American Marketing external sales | | $ | 2,037 | | $ | 1,418 | |
| | |
| |
| |
EAME Geographic Region | | | 1,522 | | | 1,281 | |
Power Products sales not included in the EAME Marketing segment | | | (533 | ) | | (404 | ) |
Other* | | | (146 | ) | | (190 | ) |
| | |
| |
| |
EAME Marketing external sales | | $ | 843 | | $ | 687 | |
| | |
| |
| |
Latin America Geographic Region | | | 490 | | | 306 | |
Power Products sales not included in the Latin America Marketing segment | | | (191 | ) | | (102 | ) |
Other* | | | 55 | | | 31 | |
| | |
| |
| |
Latin America Marketing external sales | | $ | 354 | | $ | 235 | |
| | |
| |
| |
Asia/Pacific Geographic Region | | $ | 837 | | $ | 629 | |
Power Products sales not included in the Asia/Pacific Marketing segment | | | (139 | ) | | (197 | ) |
Other* | | | (165 | ) | | (62 | ) |
| | |
| |
| |
Asia/Pacific Marketing external sales | | $ | 533 | | $ | 370 | |
| | |
| |
| |
* Represents primarily external sales of the Construction and Mining Products and the All Other segments. |
|
OTHER PROFIT/LOSS ITEMS
Interest expense excluding Financial Products was $9 million lower compared to first quarter 2003 primarily due to lower borrowing rates.
Other income/expense was income of $47 million compared with income of $18 million in first quarter 2003. The favorable change was mostly due to the favorable impact of Machinery and Engines currency gains and the favorable impact of commodity hedges.
Caterpillar’s profit and cash flows are subject to fluctuation due to changes in foreign exchange rates and the company uses currency forward and option contracts to reduce the risk of fluctuations in exchange rates. The impact of currency in the first quarter on Machinery and Engines other income/expense was favorable $18 million reducing the net unfavorable profit before tax impact of currency to $50 million.
The provision for income taxes in the first quarter reflects an estimated annual tax rate of 28 percent for 2004. We are anticipating a 28 percent rate for the full year compared to 27 percent in 2003 primarily due to a change in our geographic mix of profits. This annual tax rate is based on currently enacted legislation and therefore includes existing Extraterritorial Income Exclusion (ETI) provisions for 2004.
The equity in profit/loss of unconsolidated affiliated companies favorably impacted profit$2 million over first quarter a year ago.
EMPLOYMENT
At the end of first quarter 2004, Caterpillar's worldwide employment was 70,815 compared with 67,063 one year ago. The higher employment is necessary to support our increased volume and growing Caterpillar Logistics operations in addition to the impact of acquiring a controlling interest in Hindustan Powerplus Ltd.
OTHER SIGNIFICANT EVENTS
On April 8, 2004, the company made a cash contribution of $494 million into its U.S. pension plans in support of retirement benefit obligations. Robust cash flow due to improved profit, excellent performance by its pension fund managers and a strong financial position have allowed Caterpillar to improve the funded position of its pension plans.
OTHER MATTERS
Environmental and Legal Matters
The company is regulated by federal, state, and international environmental laws governing our use of substances and control of emissions in all our operations. Compliance with these existing laws has not had a material impact on our capital expenditures, earnings, or competitive position.
We are cleaning up hazardous waste at a number of locations, often with other companies, pursuant to federal and state laws. When it is likely we will pay clean-up costs at a site and those costs can be estimated, the costs are charged against our earnings. In doing that estimate, we do not consider amounts expected to be recovered from insurance companies and others.
The amount recorded for environmental clean-up is not material andis included in the Consolidated Statement of Financial Position on page 3 under "Accrued expenses."If a range of liability estimates is available on a particular site, we accrue at the lower end of that range.
We cannot estimate costs on sites in the very early stages of clean-up. Currently, we have five sites in the very early stages of clean-up, and there is no more than a remote chance that a material amount for clean-up will be required.
Pursuant to a consent decree Caterpillar entered with the EPA, the company was required to meet certain emission standards by October 2002. The decree provides that if engine manufacturers were unable to meet the standards at that time, they would be required to pay a Non-Conformance Penalty (NCP) on each engine sold that did not meet the standard. The amount of the NCP would be based on how close to meeting the standard the engine came - the more out of compliance the higher the penalty. The company began introduction of fully compliant ACERT engines in 2003 and by the end of 2003 Caterpillar was only producing fully compliant engine models. As a result, NCPs are not payable for any engines built in 2004. The company’s first quarter 2004 operating profit was favorably impacted by $49 million du e to the absence of NCPs that were recorded in the first quarter 2003.
In addition, the consent decree required Caterpillar to pay a fine of $25 million, which was expensed in 1998 and to make investments totaling $35 million in environmental-related products by July 7, 2007. Total qualifying investments to date for these projects are $30 million, of which $1 million was made through the first quarter of 2004. A future benefit is expected to be realized from these environmental projects related to Caterpillar's ability to capitalize on the technologies it developed in complying with its environmental project obligations. In short, Caterpillar expects to receive a positive net return on the environmental projects by being able to market the technology it developed.
The company is a party to litigation matters and claims that are normal in the course of its operations, and, while the results of such litigation and claims cannot be predicted with certainty, management believes, based on the advice of counsel, the final outcome of such matters will not have a materially adverse effect on our consolidated financial position.
On January 16, 2002, Caterpillar commenced an action in the Circuit Court of the Tenth Judicial Circuit of Illinois in Peoria, Illinois, against Navistar International Transportation Corporation and International Truck and Engine Corporation (collectively Navistar). The lawsuit arises out of a long-term purchase contract between Caterpillar and Navistar effective May 31, 1988, as amended from time to time (the Purchase Agreement). The pending complaint alleges that Navistar breached its contractual obligations by: (i) paying Caterpillar $8.08 less per fuel injector than the agreed upon price for new unit injectors delivered by Caterpillar; (ii) refusing to pay contractually agreed upon surcharges owed as a result of Navistar ordering less than planned volumes of replacement unit injector s; and (iii) refusing to pay contractually agreed upon interest stemming from Navistar's late payments. At March 31, 2004, the past due receivable from Navistar regarding the foregoing was $139 million. The pending complaint also has claims alleging that Franklin Power Products, Inc., Newstream Enterprises, and Navistar, collectively and individually, failed to pay the applicable price for shipments of unit injectors to Franklin and Newstream. At March 31, 2004, the past due receivables for the foregoing totaled $12 million. The pending complaint further alleges that Sturman Industries, Inc. and Sturman Engine Systems, Inc. colluded with Navistar to utilize technology that Sturman Industries, Inc. misappropriated from Caterpillar to help Navistar develop its G2 fuel system, and tortiously interfered with the Purchase Agreement and Caterpillar's prospective economic relationship with Navistar. The pending complaint further alleges that the two parties' collusion led Navistar to select Sturman Engine Systems, Inc., and another company, instead of Caterpillar, to develop and manufacture the G2 fuel system.
On May 7, 2002, International Truck and Engine Corporation (International) commenced an action against Caterpillar in the Circuit Court of DuPage County, Illinois, that alleges Caterpillar breached various aspects of a long-term agreement term sheet. In its fourth amended complaint, International seeks a declaration from the court that the term sheet constitutes a legally binding contract for the sale of heavy-duty engines at specified prices through the end of 2006, alleges that Caterpillar breached the term sheet by raising certain prices effective October 1, 2002, and also alleges that Caterpillar breached an obligation to negotiate a comprehensive long-term agreement referenced in the term sheet. International further claims that Caterpillar improperly restricted the supply of hea vy-duty engines to International from June through September 2002, and claims that Caterpillar made certain fraudulent misrepresentations with respect to the availability of engines during this time period. International seeks damages "in an amount to be determined at trial" and injunctive relief. Caterpillar filed an answer denying International's claims and has filed a counterclaim seeking a declaration that the term sheet has been effectively terminated. Caterpillar denies International's claims and will vigorously contest them. On September 24, 2003, the Appellate Court of Illinois, ruling on an interlocutory appeal, issued an order consistent with Caterpillar's position that, even if the court subsequently determines that the term sheet is a binding contract, it is indefinite in duration and was therefore terminable at will by Caterpillar after a reasonable period.Caterpillar anticipates that a trial currently scheduled f or the fourth quarter of 2004 will address all remaining issues in this matter.This matter is not related to the breach of contract action brought by Caterpillar against Navistar currently pending in the Circuit Court of Peoria County, Illinois.
On August 30, 2002, a World Trade Organization (WTO) arbitration panel determined that the European Union (EU) may impose up to $4.04 billion per year in retaliatory tariffs if the U.S. tax code is not brought into compliance with an August 2001 WTO decision that found the extraterritorial tax (ETI) provisions of the FSC Repeal and Extraterritorial Income Exclusion Act of 2000 constitute an export subsidy prohibited by the WTO Agreement on Subsidies and Countervailing Measures. Since August 2002, the EU has developed a list of U.S. origin products on which the EU could impose tariffs as high as 100 percent of the value of the product. Negotiations among EU Member States, the European Commission, and the private sector over which products would be listed were intense. The EU finalized the list in Dece mber 2003 and in March 2004 began to impose retaliatory tariffs of 5 percent on certain U.S. origin goods. These tariffs will increase 1 percentage point per month to a maximum of 17 percent after one year. The gradual increase in tariffs is designed to place increasing pressure on the U.S. government to bring its tax laws into compliance with its WTO obligations. Given the makeup of the final retaliation list, some Caterpillar parts and components will be subjected to these additional tariffs. We do not believe these tariffs will materially impact our financial results. The company has production facilities in the EU, Russia, Asia, and South America. Products sold into the EU from these plants are not affected by this retaliatory tariff. Congress is currently under increasing pressure to repeal ETI. We cannot predict how the U.S. legislative process will affect the company’s 2004 income tax liability. Although we don’t expect a material impact, it is possible that enacted changes in legislation co uld significantly lower our expected 2004 export benefits.
SALES AND REVENUES OUTLOOK
We project company sales and revenues will increase about 20 percent from 2003, up from the previous forecast of 12 percent growth. Machinery and Engines volume is expected to increase about 16 percent and the favorable impact of currency is expected to contribute about 2 percent with the remainder coming from improved price realization and Financial Products revenues. Included in this outlook are worldwide machine price increases of 2 to 3 percent that have been communicated to dealers with an effective date of July 1, 2004. Our outlook factors in no significant disruption due to work stoppages at any of our facilities worldwide. The outlook factors in a timely ratification of a new 6-year labor agreement between Caterpillar and the United Auto Workers (UAW), which will enable our mid-western U.S. f acilities to remain competitive and succeed long-term. On April 25, 2004, employee members of the UAW voted to reject the company's contract proposal for a new 6-year labor agreement. Operations continue as normal.
The world economy is in a vigorous recovery and global economic growth should be about 4 percent this year, up from 2.5 percent last year. All regions are improving but the recovery in the Euro-zone economy is still weak. Industrial production in many developing countries increased significantly over the past year, often at double-digit rates.
Interest rates are the lowest in decades in many countries and we anticipate little change through the rest of the year. Despite increases in commodity and some asset prices, broad inflation measures are within Central Bank targets. As a result, we expect that Central Banks will be cautious about tightening policies and that any increases in interest rates would be modest and not significant enough to undermine economic recoveries that are underway.
The world economy should provide a favorable climate for our businesses. We expect continued low interest rates will encourage more replacement buying as well as drive recoveries in housing and nonresidential construction. Rising personal incomes and corporate profits should also benefit construction.
Recent increases in coal and metals prices have prompted mining sectors in most countries to increase investments. Further increases in industrial production in addition to tight supplies should help to maintain prices at favorable levels. We expect the mining recovery to strengthen further.
We expect company sales and revenues to continue to be strong in future quarters but year-over-year comparisons should reflect smaller increases than in the first quarter. Sales and revenues strengthened significantly over the course of 2003 and we do not expect sales and revenues in the remaining quarters of 2004 to improve as rapidly as they did last year.
North America (United States and Canada)
U.S. economic data were often weaker than expected at the beginning of the year but improved as the quarter progressed. We believe first quarter growth was around 4 percent and growth should improve further in subsequent quarters resulting in full year growth of about 4.5 to 5 percent. Canada, which has had to reverse recent interest rate hikes, should have economic growth near 3 percent this year.
We estimate that Machinery and Engines sales will increase about 32 percent in 2004. Positives include continued strong demand for housing, a recovery in commercial construction and increased funding for highways. Coal mining should benefit from stronger demand and increases in spot prices. We expect the North American on-highway truck and bus industry will benefit from low financing costs, higher freight-handling requirements and improved fleet operating profits. Stronger economic growth is expected to support increases in all North American engine industries.
EAME
While Euro-zone economies were weaker than expected in the first quarter, we expect some improvement in coming quarters. In addition, other European economies are experiencing stronger recoveries, which should keep overall European economic growth near 2 percent this year. Economies in both Africa/Middle East and the CIS should benefit from high commodity prices.
We estimate that Machinery and Engines sales in EAME should rise about 9 percent in 2004. In Europe, economic recovery and low interest rates should support increased replacement buying and the expansion of rental fleets. We anticipate that sales in both Africa/Middle East and the CIS will benefit from the positive impact that high commodity prices are having on economic growth. Finally, the ongoing favorable impact of the strong euro is expected to contribute 2 percent to sales.
Latin America
Economies recovered late last year and we expect economic growth will improve to about 4 percent this year – the highest since 2000. The stronger world economy is boosting regional exports, higher metals prices should encourage more investment in mining and foreign investors are returning. As a result of the economic recovery, we project that sales of Machinery and Engines should be up about 15 percent in 2004.
Asia/Pacific
The region should remain the fastest growing in the world this year with about 6.5 percent growth. China’s economy could slow a bit in response to modest tightening in economic policies but faster growth in most other countries should more than offset this slowing. Exports should benefit from the worldwide economic recovery and low local interest rates should encourage more domestic spending.
We expect sales of Machinery and Engines to increase around 16 percent in 2004. The sizable mining sector, which had a strong first quarter, should continue to do well. Low interest rates and higher standards of living should benefit housing and commercial construction. Strong economic growth in China has resulted in widespread electric power shortages and we expect sales into this sector should benefit.
Financial Products
We expect continued growth in Financial Products for the remainder of 2004, with revenues expected to increase approximately 10 percent versus 2003 primarily due to higher average earning assets in 2004. New financing activity growth is primarily due to expected improvement in Machinery and Engines sales and other growth initiatives.
PROFIT OUTLOOK
We now expect profit per share to be up 65 to 70 percent from 2003, compared to about 40 percent in the previous outlook. We expect to deliver 6.5 to 7 percentReturn on Sales and Revenuesin 2004 as compared to 4.8 percent in 2003 despite an increase in retirement benefits of about $250 million and pressure on core operating costs associated with supporting higher than anticipated volumes. Due to this improved profitability and our solid financial position, we expect strong operating cash flow in 2004.
SUPPLEMENTAL INFORMATION
We are providing supplemental information including deliveries to users and dealer inventory levels. We sell the majority of our machines and engines to independently owned and operated dealers and original equipment manufacturers (OEMs) to meet the demands of their customers, the end users. Due to time lags between our sales and the deliveries to end users we believe this information will help readers better understand our business and the industries we serve. All information provided in the supplemental section is inConstant Dollars.
Dealer New Machine Deliveries
Worldwide dealer deliveries of new machines to end users in first quarter 2004 were 37 percent higher than the same quarter last year and 19 percent above the previous first quarter high in 1998. Gains were widespread, occurring in all regions and in most industries. In particular, deliveries into mining had a broad, strong recovery.
Dealers in North America increased machine deliveries 43 percent, the biggest year-over-year gain since the current recovery in deliveries started in first quarter 2003. Factors which supported growth in 2003 such as replacement buying, upgrading of rental fleets and increased construction activity continued this quarter. In addition, the depressed coal mining sector showed improvement.
Deliveries into North American general construction were up 56 percent from last year. Low mortgage interest rates and higher prices for new homes caused housing starts to increase 12 percent while nonresidential building construction appeared to bottom. Dealer deliveries into heavy construction were up 53 percent, driven by continued strong highway and sewer and water construction. Increased production and prices for quarry andaggregates caused dealer deliveries into that industry to rise 5 percent. A robust housing industry boosted lumber prices leadi ng to a 60 percent increase in dealer deliveries into forestry. Mining, buoyed by rebounds in both coal production and prices, had a 52 percent increase in dealer deliveries compared to last year. Deliveries into industrial applications increased 23 percent, the result of higher industrial production.
EAME dealer deliveries of new machines in first quarter 2004 rose 19 percent from last year. Europe, despite a slow recovery, had a 19 percent increase which was heavily weighted toward deliveries into rental fleets. Deliveries into Africa/Middle East surged 33 percent, largely into those countries with sizable energy and commodity sectors as higher prices generated the income needed to finance investments. Partially offsetting those two increases were deliveries into the CIS, which tend to be volatile, fell 28 percent from a strong first quarter last year.
In Latin America, new machine deliveries increased 49 percent. The mining sector, responding to significant increases in output prices, accounted for all the gain. Recoveries in most countries started fairly recently and have not yet progressed sufficiently to allow recoveries in construction.
In Asia/Pacific, dealer deliveries to end users improved 39 percent from a strong first quarter 2003. Strength in the region was pervasive as most countries and industries showed improvement. China continues to do well and many of the other large economies in the region had double-digit gains in dealer deliveries. Low interest rates and fast economic growth are boosting construction activity and deliveries into mining rose sharply due to higher output prices.
Dealer Inventories of New Machines
Worldwide dealer inventories at the end of first quarter 2004 were higher than a year earlier in all regions. However, increases in inventories failed to keep pace with deliveries, causing inventory to delivery ratios to decline in all regions.
Engine Deliveries to End Users and OEMs
Worldwide engine deliveries to end users and OEMs in the first quarter of 2004 rose20percent compared to deliveries in first quarter 2003.Stronger economic growth, higher corporate profits and rising business and investor confidence supported improving global investment and industry conditions. Increased engine deliveries to the electric power, on-highway truck and petroleum sectors more than offset lower deliveries of engines to the industrial and marine sectors. Worldwide engine deli veries to end users in the electric power sector rose 37percent with stronger sales in all geographic regions. Truck engine deliveries rose 28 percent with all of the gain occurring in the Americas where industry demand strengthened.Worldwide deliveries to end users in thepetroleum sector rose 17 percent due to stronger industry demand caused by very favorable energy prices.Global deliveries of industrial engines declined8percent partially due to a fourth quarter 2003 pre-buy and a shift in product mix to smaller engines. Worldwide marine engine deliveries were down 3 percent due to delayed demand for large reciprocating engines used in ocean-going vessels.
In North America, engine deliveries to end users and OEMs were up 20 percent from first quarter 2003. Engine deliveries to the electric power, industrial, petroleum and on-highway truck sectors all rose. Engines delivered to North American truck and bus manufacturers rose 27 percent with all of the growth caused by stronger industry demand associated with higher fleet operating profits and more confidence in new engine emissions technologies.Caterpillar maintained its leadership position in the North American on-highway truck and bus industry.Engine deliveries to end users and OEMs in the industrial sector increased 19 pe rcent helped by stronger industry demand as corporate profits and business investment continued to strengthen. Deliveries of engines to the electric power sector rose 11 percent as most of the gain came from robust demand for turbines sold to industrial cogeneration applications. Deliveries of engines to the petroleum sector rose 10 percent, positively impacted by robust industry profits caused by favorable energy prices. Deliveries of engines to the marine sector declined 3 percent due to lower demand for large reciprocating engines used in ocean-going vessels.
In EAME, overall engine deliveries to end users and OEMs rose 6 percent with higher deliveries to the petroleum and electric power sectors accounting for all of the overall sales gain. Petroleum deliveries rose 46 percent and deliveries to the electric power sector rose 16 percent. EAME deliveries of large engines gained from particular strength in the Middle East. Deliveries to the Middle East remained strong due to favorable oil prices and revenues and continuing reconstruction efforts. EAME deliveries of engines to the industrial sector fell 15 percent resulting from weak economic growth in Western Europe and a fourth quarter 2003 pre-buy prior to the final European Tier II emissions laws going into effect in January 2004. Engine deliveries to the marine sector fell 17 percent due to lower demand for large engines used in ocean-going vessels.
Deliveries to end users and OEMs in Latin America rose 80 percent as economic and investment growth strengthened. Engine deliveries to the electric power, on-highway truck and industrial sectors more than doubled from deliveries in first quarter 2003 when Latin American economic growth was sluggish. Deliveries into the petroleum sector were up 42 percent and deliveries to the marine sector were up 19 percent. Deliveries of turbines to the electric power and petroleum sectors accounted for over half of the Latin American quarterly growth. Deliveries of turbines and turbine services to the Latin American electric power sector increased primarily in Venezuela where investments were made to reduce shortages of electrical capacity. Turbine services sales increased in the Latin American pet roleum sector driven primarily by strong production demand for turbine aftermarket products.
Deliveries to end users and OEMs in Asia/Pacific were up 24 percent compared to last year with engine deliveries to the electric power sector more than doubling, 25 percent growth in marine primarily due to deliveries of large marine engines and 17 percent lower deliveries to the petroleum sector. Asia/Pacific demand for turbines used in the petroleum sector weakened from last year’s strong levels due to shipment timing.
Dealer Inventories of Engines
Worldwide dealer engine inventories at the end of the first quarter were 4 percent above last year and were at normal levels compared to selling rates. North American and Latin American dealers have continued to reduce their inventories and their respective inventories are at normal levels. EAME dealer inventories rose as dealers pre-positioned inventory to support expected Middle Eastern reconstruction efforts. Dealer inventories in Asia/Pacific rose as dealers ordered engines to cover expected sales.
GLOSSARY OF TERMS
1. Consolidating Adjustments– Eliminations of transactions between Machinery and Engines and Financial
Products.
2. Constant Dollars– The dollar value of machine and engine deliveries adjusted for changes in price and currency.
3. Core Operating Costs– Machinery and Engines operating cost change adjusted for volume. It excludes the
impact of currency, Non-Conformance Penalties and retirement benefits.
4. Currency– With respect to sales and revenues, currency represents the translation impact on sales resulting from changes in foreign currency exchange rates versus the U.S. dollar. With respect to operating profit, currency represents the net translation impact on sales and operating costs resulting from changes in foreign currency exchange rates versus the U.S. dollar. With respect to other income/expense, currency represents the period over period change in the translation of monetary assets and liabilities not denominated in the functional currency and the change in hedging gains/losses from foreign currency forward and option contracts. C urrency includes the impacts on sales and operating profit for the Machinery and Engines lines of business only; currency impacts on the Financial Products line of business are included in the Financial Products portions of the respective analyses.
5. EAME– Geographic region including Europe, Africa, the Middle East and the Commonwealth of Independent States (CIS).
6. Earning Assets– These assets consist primarily of total net finance receivables plus equipment on operating leases, less accumulated depreciation at Cat Financial. Net finance receivables represent the gross receivables amount less unearned income and the allowance for credit losses.
7. Engines- A principal line of business including the design, manufacture and marketing of engines for Caterpillar machinery, electric power generation systems; on-highway vehicles and locomotives; marine, petroleum, construction, industrial, agricultural and other applications; and related parts. Reciprocating engines meet power needs ranging from 5 to over 22,000 horsepower (4 to over 16 200 kilowatts). Turbines range from 1,600 to 19,500 horsepower (1 000 to 14 500 kilowatts).
8. Financial Products– A principal line of business consisting primarily of Caterpillar Financial Services Corporation (Cat Financial), Caterpillar Insurance Holdings, Inc. (Cat Insurance) and their subsidiaries. Cat Financial provides a wide range of financing alternatives for Caterpillar machinery and engines, Solar gas turbines, as well as other equipment and marine vessels. Cat Financial also extends loans to customers and dealers. Cat Insurance provides various forms of insurance to customers and dealers to help support the purchase and lease of our equipment.
9. Latin America– Geographic region including the Central and South American countries and Mexico.
10. Machinery– A principal line of business which includes the design, manufacture and marketing of construction, mining, agricultural and forestry machinery – track and wheel tractors, track and wheel loaders, pipelayers, motor graders, wheel tractor-scrapers, track and wheel excavators, backhoe loaders, mining shovels, log skidders, log loaders, off-highway trucks, articulated trucks, paving products, telescopic handlers, skid steer loaders and related parts. Also includes logistics services for other companies.
11. Machinery and Engines– Due to the highly integrated nature of operations, represents the aggregate total of the Machinery and Engines lines of business and includes primarily our manufacturing, marketing and parts distribution operations.
12. Non-Conformance Penalties (NCPs)- Pursuant to a consent decree Caterpillar and other engine manufacturers entered into with the United States Environmental Protection Agency (EPA), the company was required to meet certain emission standards by October 2002 for engines manufactured for on-highway use. Under the consent decree, an engine manufacturer was required to pay a non-conformance penalty (NCP) to the EPA for each engine manufactured after October 1, 2002 that did not meet the standards. The amount of the NCP was based on how close to meeting the standards the engine came - the more the engine was out of compliance, th e higher the penalty per engine.
13. Price Realization– The impact of net price changes excluding currency.
14. Retirement Benefits – Cost of defined benefit pension plans, defined contribution plans and retirement healthcare and life insurance.
15. Return on Sales and Revenues– Profit divided by Sales and Revenues.
16. Sales Volume– With respect to sales and revenues, sales volume represents the impact of changes in the quantities sold for machines, engines and parts. With respect to operating profit, sales volume represents the impact of changes in the quantities sold for machines, engines and parts combined with the net operating profit impact of changes in the relative weighting of machines, engines and parts sales with respect to total sales.
17. 6 Sigma– On a technical level, 6 Sigma represents a measure of variation that achieves 3.4 defects per million opportunities. At Caterpillar, 6 Sigma represents a much broader cultural philosophy to drive continuous improvement throughout the value chain. It is a fact-based, data-driven methodology that we are using to improve processes, enhance quality, cut costs, grow our business and deliver greater value to our customers through black belt-led project teams. At Caterpillar, 6 Sigma goes beyond mere process improvement; it has become the way we work as teams to process business information, solve problems and manage our business successfully.
C. Liquidity & Capital Resources
Sources of funds
We generate our capital resources primarily through operations. Consolidated operating cash flow was $98 million through the first quarter of 2004, compared with $218 million through the first quarter of 2003. The decrease is primarily the result of higher working capital requirements, partially offset by increased profits during 2004 as compared to 2003. We anticipate that the majority of future capital resource requirements will be funded by operating cash flow, which is largely sourced from profits. See our Outlook on page 23.
Total debt as of March 31, 2004 was $20.9 billion, an increase of $1 billion from year-end 2003. Debt related to Machinery and Engines incresed $358 million, primarily due to the repurchase of $250 million of outstanding shares. Debt related to Financial Products increased $736 million due to growth at Cat Financial. We have two global credit facilities with a syndicate of banks totaling $4.675 billion available in the aggregate to both Machinery and Engines and Financial Products to support commercial paper programs. Based on management's allocation decision, which can be revised at any time, the portion of the facility available to Cat Financial at March 31, 2004 was $4.075 billion. The five-year facility of $2.125 billion expires in September 2006. The 364-day facility of $2.55 billion expires in September 2004. The facility expiring in September 2004 has a provision that allows Caterpillar or Cat Financial to obtain a one-year loan in September 2004 that would mature in September 2005. Our total credit commitments as of March 31, 2004 were:
| | | (Millions of dollars) |
| | Consolidated | | | Machinery and Engines | | | Financial Products | |
| | |
| |
| |
| |
Credit lines available: | | | | | | | | | | |
Global credit facility | | $ | 4,675 | | $ | 600 | | $ | 4,075 | |
Other external | | | 1,689 | | | 833 | | | 856 | |
Total credit lines available | | | 6,364 | | | 1,433 | | | 4,931 | |
Less: Global credit facility supporting commercial paper | | | 4,129 | | | 336 | | | 3,793 | |
Less: Utilized credit | | | 366 | | | 127 | | | 239 | |
| | |
| |
| |
| |
Available credit | | $ | 1,869 | | $ | 970 | | $ | 899 | |
| | |
| |
| |
| |
|
We also generate funding through the securitization of receivables. Through the first quarter of 2004, we generated $264 million of capital resources from the securitization of trade receivables. As of March 31, 2004, we had trade and finance receivables of $1.5 billion and $16.0 billion, respectively.
We do not generate material funding through structured finance transactions.
Machinery and Engines
Net cash used for operating activities was $149 million compared with $81 million for the same period a year ago. The unfavorable change was due to higher working capital requirements in 2004 consisting primarily of increased inventory related to higher sales volume and a higher incentive compensation payout. These items were partially offset by higher profit in 2004.
Pursuant to the share repurchase program authorized by the Board of Directors in October 2003, $250 million was spent to purchase 3.21 million shares during the first quarter of 2004. There were 342 million shares outstanding at the end of the first quarter 2004. The goal of the share repurchase program, which expires in October 2008, is to reduce the company’s outstanding shares to 320 million.
Capital expenditures, excluding equipment leased to others, during the three months ended March 31, 2004 were $101 million, an increase of $20 million from the same period a year ago. The increase is a result of increased spending to support growth and new product introductions.
Financial Products
Operating cash flow was $251 million through the first quarter 2004, compared with $309 million for the same period a year ago. The decrease was the result of higher working capital requirements, partially offset by an increase in profit through the first quarter 2004 as compared to the same period a year ago. Cash used to purchase equipment leased to others was $240 million during the first quarter of 2004 compared to $261 million for the first quarter of 2003. In addition, net cash used for finance receivables was $694 million for the first quarter of 2004, compared to $122 million for the first quarter of 2003.
Financial Products total borrowings were $17.08 billion at March 31, 2004, an increase of $736 million from December 31, 2003 due to financing a higher amount of assets. Debt repayment in Financial Products depends primarily on timely repayment and collectibility of the receivables portfolio. At March 31, 2004, finance receivables past due over 30 days were 2.8 percent, compared with 3.1 percent at the end of March 31, 2003. The allowance for credit losses was 1.48 percent of finance receivables, net of unearned income, at March 31, 2004, compared to 1.49 percent at March 31, 2003. Receivables written off due to uncollectibility, net of recoveries on receivables previously written off, were $11 million and $22 million for the three months ended March 31, 2004 and 2003, respectively.
D. Critical Accounting Policies
The preparation of financial statements in conformity with generally accepted accounting principles requires management to make estimates and assumptions that affect reported amounts. The more significant estimates include: residual values for leased assets, fair market values for goodwill impairment tests, and reserves for warranty, product liability and insurance losses, postretirement benefits, post-sale discounts, credit losses and income taxes. Following are the methods and assumptions used in determining our estimates and an indication of the risks inherent in each.
Residual values for leased assets- Determined based on the product, specifications, application and hours of usage. Each product has its own model for evaluation that includes market value cycles and forecasts. Consideration is also given to the amount of assets that will be returned from lease during a given time frame. Residual values could decline due to economic factors, obsolescence or other adverse circumstances.
Fair market values for goodwill impairment tests -Determined for each reporting unit by discounting projected cash flow for five years and adding a year-five residual value based upon a market Earnings Before Interest, Taxes, Depreciation and Amortization (EBITDA) multiple. The estimated fair value could be impacted by changes in interest rates, growth rates, costs, capital expenditures and market conditions.
Warranty reserve- Determined by applying historical claim rate experience to the current field population and dealer inventory. Generally, historical claim rates are developed using a 12-month rolling average of actual warranty expense. These rates are applied to the field population and dealer inventory to determine the reserve. Warranty payments may differ from those estimated if actual claim rates are higher or lower than our historical rates.
Product liability and insurance loss reserve -Determined based upon reported claims in process of settlement and actuarial estimates for losses incurred but not reported. Loss reserves, including incurred but not reported reserves, are based on estimates and ultimate settlements may vary significantly from such estimates due to increased claims frequency or severity over historical levels.
Postretirement benefits- Primary actuarial assumptions are determined as follows:
The U.S. expected long-term rate of return on plan assets is based on our estimate of long-term passive returns for equities and fixed income securities weighted by the allocation of our plan assets. Based on historical performance, we increase the passive returns due to our active management of the plan assets. A similar process is used to determine the rate for our non-U.S. pension plans. This rate is impacted by changes in general market conditions, but because it represents a long-term rate, it is not significantly impacted by short-term market swings. Changes in our allocation of plan assets would also impact this rate. For example, a shift to more fixed income securities would lower the rate. A decrease in the rate would increase our expense.
The assumed discount rate is used to discount future benefit obligations back to today's dollars. The U.S. discount rate is based on the Moody's Aa bond yield as of our measurement date, November 30. A similar process is used to determine the assumed discount rate for our non-U.S. plans. This rate is sensitive to changes in interest rates. A decrease in the discount rate would increase our obligation and future expense.
The expected rate of compensation increase is used to develop benefit obligations using projected pay at retirement. It represents average long-term salary increases. This rate is influenced by our long-term compensation policies. An increase in the rate would increase our obligation and expense.
The assumed health care trend rate represents the rate at which health care costs are assumed to increase and is based on historical and expected experience. Changes in our projections of future health care costs due to general economic conditions and those specific to health care (e.g. technology driven cost changes) will impact this trend rate. An increase in the trend rate would increase our obligation and expense.
Post-sale discount reserve- The company extends numerous merchandising programs that provide discounts to dealers as products are sold to end users. The reserve is determined based on historical data adjusted for known changes in merchandising programs. Discounts paid may differ from those estimated if actual program usage is higher or lower than our historical or expected rates.
Credit loss reserve– The allowance for credit losses is evaluated on a regular basis and adjusted based upon management’s best estimate of probable losses inherent in our finance receivables. In estimating probable losses, we review accounts that are past due, non-performing, or in bankruptcy. We also review accounts that may be at risk using information available about the customer, such as financial statements, news reports, and published credit ratings. We also use general information regarding industry trends and the general economic environment. Using an estimate of current fair market value of collateral and factoring in credit enhancements, such as additional collateral and third par ty guarantees, we arrive at an estimated loss for specific accounts and estimate an additional amount for the remainder of the finance receivables based upon historical trends. Adverse economic conditions or other factors that might cause deterioration of the financial health of our customers could change the timing and level of payments received and thus necessitate a change in our estimated losses.
Income tax reserve– Despite our belief that our tax return positions are consistent with applicable tax law, we believe that certain positions are likely to be challenged by taxing authorities. Settlement of any challenge can result in no change, a complete disallowance, or some partial adjustment reached through negotiations or litigation. Significant judgment is required in evaluating our tax reserves. Our reserves are adjusted in light of changing facts and circumstances, such as the progress of our tax audits. Our income tax expense includes the impact of reserve provisions and changes to reserves that we consider appropriate, as well as related interest. Unfa vorable settlement of any particular issue would require use of our cash. Favorable resolution would be recognized as a reduction to income tax expense at the time of resolution.
We have incorporated many years of data into the determination of each of these estimates and we have not historically experienced significant adjustments.
E. Pension and Other Postretirement Benefits
We recognizedpension expense of $74 million for the three months ended March 31, 2004, as compared to $36 million for the three months ended March 31, 2003. The increase in expense was primarily a result of the amortization of actuarial losses resulting from a declining discount rate and poor performance of the equity markets primarily in 2001 and 2002. SFAS 87, "Employers’ Accounting for Pensions" requires companies to discount future benefit obligations back to today’s dollars using a discount rate that is based on high-quality fixed-income investments. A decrease in the discount rate increases the pension bene fit obligation. This increase is amortized into earnings as an actuarial loss. SFAS 87 also requires companies to use an expected long-term rate of return for computing current year pension expense. Differences between the actual and expected returns are amortized into earnings as actuarial gains and losses.
Other postretirement benefit expense was $77 million in first quarter 2004, up $9 million from first quarter 2003. The increase in expense is the result of the amortization of actuarial losses resulting from a declining discount rate, higher than expected benefit costs and an increase in expected health care inflation.
At the end of 2003, unrecognized actuarial losses related to pension and other postretirement benefit plans were $3.20 billion and $1.38 billion, respectively. The unrecognized actuarial losses for both pensions and other postretirement benefits will be impacted in future periods by actual asset returns, actual health care inflation, discount rate changes and other factors that impact these expenses. These losses are currently being amortized into earnings on a straight-line basis over the remaining service period of active employees expected to receive benefits under the benefit plans.
SFAS 87 requires the recognition of an Additional Minimum Liability if the market value of plan assets is less than the accumulated benefit obligation at the end of the measurement date. Future changes to the Additional Minimum Liability will be dependent on several factors including actual returns on our pension plan assets, company contributions, benefit plan changes and our assumed discount rate.
Although we have no ERISA funding requirements in 2004, on April 8, 2004, we made a voluntary cash contribution of $494 million to fund our U.S. pension plans. We also expect to make $90 million of contributions to certain non-U.S. pension plans during 2004. We have adequate liquidity resources to fund all U.S. and non-U.S. plans.
F. Supplemental Consolidating Data
We are providing supplemental consolidating data for the purpose of additional analysis. The data has been grouped as follows:
Consolidated –Caterpillar Inc. and its subsidiaries.
Machinery and Engines –The Machinery and Engines data contained in the schedules on pages 32 to 37 are "non-GAAP financial measures" as defined by the Securities and Exchange Commission in Regulation G. These non-GAAP financial measures have no standardized meaning prescribed by U.S. GAAP, and therefore, are unlikely to be comparable with the calculation of similar measures for other companies. Management does not intend these items to be considered in isolation or as a substitute for the related GAAP measures. Caterpillar defines Machinery and Engines as it is presented in the supplemental data as Caterpillar Inc. and its subsidiaries with Financial Products accounted for on the equity basis. M achinery and Engines information relates to our design, manufacturing, marketing and parts distribution operations. Financial Products information relates to the financing to customers and dealers for the purchase and lease of Caterpillar and other equipment. The nature of these businesses is different especially with regard to the financial position and cash flow items. Caterpillar management utilizes this presentation internally to highlight these differences. We also believe this presentation will assist readers in understanding our business.
Financial Products –our finance and insurance subsidiaries, primarily Cat Financial and Cat Insurance.
Consolidating Adjustments –eliminations of transactions between Machinery and Engines and Financial Products.
Pages 32 to 37 reconcile Machinery and Engines with Financial Products on the Equity Basis to Caterpillar Inc. Consolidated financial information.
Caterpillar Inc. Supplemental Data for Results of Operations For The Three Months Ended March 31, 2004 (Unaudited) (Millions of dollars)
|
| | | | | | Supplemental Consolidating Data |
| | | | | |
|
| | | Consolidated | | Machinery
and
Engines(1) | | FinancialProducts | | Consolidating Adjustments | |
| | |
| |
| |
| |
| |
Sales and revenues: | | | | | | | | | | | | | |
Sales of Machinery and Engines | | $ | 6,002 | | $ | 6,002 | | $ | - | | $ | - | |
Revenues of Financial Products | | | 465 | | | - | | | 502 | | | (37)2 | |
| | |
| |
| |
| |
| |
Total sales and revenues | | | 6,467 | | | 6,002 | | | 502 | | | (37) | |
| | | | | | | | | | | | | | |
Operating costs: | | | | | | | | | | | | | |
Cost of goods sold | | | 4,699 | | | 4,699 | | | - | | | - | |
Selling, general and administrative expenses | | | 724 | | | 595 | | | 140 | | | (11)3 | |
Research and development expenses | | | 214 | | | 214 | | | - | | | - | |
Interest expense of Financial Products | | | 118 | | | - | | | 121 | | | (3)4 | |
Other operating expenses | | | 138 | | | 2 | | | 136 | | | - | |
| | |
| |
| |
| |
| |
Total operating costs | | | 5,893 | | | 5,510 | | | 397 | | | (14) | |
| | |
| |
| |
| |
| |
| | | | | | | | | | | | | | |
Operating profit | | | 574 | | | 492 | | | 105 | | | (23) | |
| | | | | | | | | | | | | | |
Interest expense excluding Financial Products | | | 57 | | | 58 | | | - | | | (1)4 | |
Other income (expense) | | | 47 | | | 16 | | | 9 | | | 22 5 | |
| | |
| |
| |
| |
| |
| | | | | | | | | | | | | | |
Consolidated profit before taxes | | | 564 | | | 450 | | | 114 | | | - | |
| | | | | | | | | | | | | | |
Provision for income taxes | | | 158 | | | 119 | | | 39 | | | - | |
| | |
| |
| |
| |
| |
Profit of consolidated companies | | | 406 | | | 331 | | | 75 | | | - | |
Profit of consolidated companies | | | | | | | | | | | | | |
Equity in profit (loss) of unconsolidated affiliated companies | | | 6 | | | 5 | | | 1 | | | - | |
Equity in profit of Financial Products' subsidiaries | | | - | | | 76 | | | - | | | (76)6 | |
| | |
| |
| |
| |
| |
| | | | | | | | | | | | | | |
Profit | | $ | 412 | | $ | 412 | | $ | 76 | | $ | (76) | |
| | |
| |
| |
| |
| |
1Represents Caterpillar Inc. and its subsidiaries with Financial Products accounted for on the equity basis. |
2Elimination of Financial Products revenues earned from Machinery and Engines. |
3Elimination of expenses recorded by Machinery and Engines paid to Financial Products. |
4Elimination of interest expense recorded by Financial Products paid to Machinery and Engines subsidiaries. |
5Elimination of discount recorded by Machinery and Engines on receivables sold to Financial Products, and of interest income earned by Machinery and Engines from Financial Products. |
6Elimination of Financial Products profit due to equity method of consolidation. |
|
Caterpillar Inc. Supplemental Data for Results of Operations For The Three Months Ended March 31, 2003 (Unaudited) (Millions of dollars)
|
| | | | Supplemental Consolidating Data
|
| | | Consolidated | | Machinery
and
Engines(1) | | FinancialProducts | | ConsolidatingAdjustments | |
| | |
| |
| |
| |
| |
| | | | | | | | | | | | | | |
Sales and revenues: | | | | | | | | | | | | | |
Sales of Machinery and Engines | | $ | 4,424 | | $ | 4,424 | | $ | - | | $ | - | |
Revenues of Financial Products | | | 397 | | | - | | | 440 | | | (43)2 | |
| | |
| |
| |
| |
| |
Total sales and revenues | | | 4,821 | | | 4,424 | | | 440 | | | (43) | |
| | | | | | | | | | | | | | |
Operating costs: | | | | | | | | | | | | | |
Cost of goods sold | | | 3,630 | | | 3,630 | | | - | | | - | |
Selling, general and administrative expenses | | | 570 | | | 476 | | | 114 | | | (20)3 | |
Research and development expenses | | | 152 | | | 152 | | | - | | | - | |
Interest expense of Financial Products | | | 120 | | | - | | | 124 | | | (4)4 | |
Other operating expenses | | | 127 | | | 2 | | | 125 | | | - | |
| | |
| |
| |
| |
| |
Total operating costs | | | 4,599 | | | 4,260 | | | 363 | | | (24) | |
| | |
| |
| |
| |
| |
| | | | | | | | | | | | | | |
Operating profit | | | 222 | | | 164 | | | 77 | | | (19) | |
| | | | | | | | | | | | | | |
Interest expense excluding Financial Products | | | 66 | | | 66 | | | - | | | - | |
Other income (expense) | | | 18 | | | (4 | ) | | 3 | | | 19 5 | |
| | |
| |
| |
| |
| |
| | | | | | | | | | | | | | |
Consolidated profit before taxes | | | 174 | | | 94 | | | 80 | | | - | |
| | | | | | | | | | | | | | |
Provision for income taxes | | | 49 | | | 20 | | | 29 | | | - | |
| | |
| |
| |
| |
| |
Profit of consolidated companies | | | 125 | | | 74 | | | 51 | | | - | |
| | | | | | | | | | | | | | |
| Equity in profit (loss) of unconsolidatedaffiliated companies | | | 4 | | | 2 | | | 2 | | | - | |
Equity in profit of Financial Products' subsidiaries | | | - | | | 53 | | | - | | | (53)6 | |
| | |
| |
| |
| |
| |
| | | | | | | | | | | | | | |
Profit | | $ | 129 | | $ | 129 | | $ | 53 | | $ | (53) | |
| | |
| |
| |
| |
| |
| | | | | | | | | | | | | | |
|
1RepresentsCaterpillar Inc. and its subsidiaries with Financial Products accounted for on the equity basis. |
2Elimination of Financial Products revenues earned from Machinery and Engines. |
3Elimination of expenses recorded by Machinery and Engines paid to Financial Products. |
4Elimination of interest expense recorded by Financial Products paid to Machinery and Engines. |
5Elimination of discount recorded by Machinery and Engines on receivables sold to Financial Products, and of interest income earned
by Machinery and Engines from Financial Products. |
6Elimination of Financial Products profit due to equity method of consolidations. |
|
Caterpillar Inc. Supplemental Data for Financial Position At March 31, 2004 (Unaudited) (Millions of dollars)
|
| | | | Supplemental Consolidating Data
|
| | | Consolidated | | Machinery and
Engines(1) | | FinancialProducts | | ConsolidatingAdjustments | |
| | |
| |
| |
| |
| |
Assets: | | | | | | | | | | | | | |
Current assets: | | | | | | | | | | | | | |
Cash and short-term investments | | $ | 368 | | $ | 220 | | $ | 148 | | $ | - | |
Receivables - trade and other | | | 3,751 | | | 2,914 | | | 1,510 | | | (673)2 | |
Receivables - finance | | | 7,989 | | | - | | | 7,989 | | | - | |
Deferred and refundable income taxes | | | 729 | | | 666 | | | 63 | | | - | |
Prepaid expenses | | | 1,351 | | | 1,366 | | | 18 | | | (33)3 | |
Inventories | | | 3,678 | | | 3,678 | | | - | | | - | |
| | |
| |
| |
| |
| |
Total current assets | | | 17,866 | | | 8,844 | | | 9,728 | | | (706) | |
| | | | | | | | | | | | | | |
Property, plant and equipment - net | | | 7,153 | | | 4,582 | | | 2,571 | | | - | |
Long-term receivables - trade and other | | | 109 | | | 106 | | | 3 | | | - | |
Long-term receivables - finance | | | 7,972 | | | - | | | 7,972 | | | - | |
| | | | | | | | | | | | | | |
Investments in unconsolidated affiliated companies | | | 817 | | | 455 | | | 362 | | | - | |
Investments in Financial Products subsidiaries | | | - | | | 2,603 | | | - | | | (2,603)4 | |
Deferred income taxes | | | 585 | | | 775 | | | 20 | | | (210)5 | |
Intangible assets | | | 234 | | | 225 | | | 9 | | | - | |
Goodwill | | | 1,400 | | | 1,400 | | | - | | | - | |
Other assets | | | 1,722 | | | 843 | | | 879 | | | - | |
| | |
| |
| |
| |
| |
Total assets | | $ | 37,858 | | $ | 19,833 | | $ | 21,544 | | $ | (3,519) | |
| | |
| |
| |
| |
| |
| | | | | | | | | | | | | | |
Liabilities | | | | | | | | | | | | | |
Current liabilities: | | | | | | | | | | | | | |
Short-term borrowings | | | 2,936 | | | 328 | | | 3,041 | | | (433)6 | |
Accounts payable | | | 3,309 | | | 3,132 | | | 174 | | | 3 7 | |
Accrued expenses | | | 1,636 | | | 847 | | | 804 | | | (15)8 | |
Accrued wages, salaries and employee benefits | | | 1,644 | | | 1,636 | | | 8 | | | - | |
Dividends payable | | | - | | | - | | | - | | | - | |
Deferred and current income taxes payable | | | 271 | | | 186 | | | 85 | | | - | |
Deferred liability | | | - | | | - | | | 261 | | | (261)9 | |
Long-term debt due within one year | | | 3,404 | | | 6 | | | 3,398 | | | - | |
| | |
| |
| |
| |
| |
Total current liabilities | | | 13,200 | | | 6,135 | | | 7,771 | | | (706) | |
Long-term debt due after one year | | | 14,570 | | | 3,660 | | | 10,910 | | | - | |
Liability for postemployment benefits | | | 3,222 | | | 3,222 | | | - | | | - | |
Deferred income taxes and other liabilities | | | 532 | | | 482 | | | 260 | | | (210)5 | |
| | |
| |
| |
| |
| |
Total liabilities | | | 31,524 | | | 13,499 | | | 18,941 | | | (916) | |
| | |
| |
| |
| |
| |
Stockholders' equity | | | | | | | | | | | | | |
Common stock | | | 1,101 | | | 1,101 | | | 890 | | | (890)4 | |
Treasury stock | | | (3,129 | ) | | (3,129 | ) | | - | | | | |
Profit employed in the business | | | 8,862 | | | 8,862 | | | 1,572 | | | (1,572)4 | |
Accumulated other comprehensive income | | | (500 | ) | | (500 | ) | | 141 | | | (141)4 | |
| | |
| |
| |
| |
| |
Total stockholders' equity | | | 6,334 | | | 6,334 | | | 2,603 | | | (2,603) | |
Total liabilities and stockholders' equity | | $ | 37,858 | | $ | 19,833 | | $ | 21,544 | | $ | (3,519) | |
| | |
| |
| |
| |
| |
| | | | | | | | | | | | | | |
|
1Represents Caterpillar Inc. and its subsidiaries with Financial Products accounted for on the equity basis. |
2Elimination of receivables between Machinery and Engines and Financial Products. |
3Elimination of Machinery and Engines insurance premiums which are prepaid to Financial Products. |
4Elimination of Financial Products equity which is accounted for on Machinery and Engines on the equity basis. |
5Reclassification of Financial Products deferred tax liability to a deferred tax asset on a consolidated basis. |
6Elimination of short-term borrowings between Machinery and Engines and Financial Products. |
7Elimination of payables between Machinery and Engines and Financial Products. |
8Elimination of prepaid insurance in Financial Products accrued expenses. |
9Elimination of Financial Products deferred liabilities with Machinery and Engines. |
|
Caterpillar Inc. Supplemental Data for Financial Position At December 31, 2003 (Unaudited) (Millions of dollars)
|
| | | | Supplemental Consolidating Data
|
| | Consolidated | | Machinery
and
Engines(1) | | Financial
Products | | ConsolidatingAdjustments | |
| | |
| |
| |
| |
| |
Assets: | | | | | | | | | | | | | |
Current assets: | | | | | | | | | | | | | |
Cash and short-term investments | | $ | 342 | | $ | 220 | | $ | 122 | | $ | - | |
Receivables - trade and other | | | 3,666 | | | 2,993 | | | 1,642 | | | (969)2 | |
Receivables – finance | | | 7,605 | | | - | | | 7,605 | | | - | |
Deferred and refundable income taxes | | | 707 | | | 645 | | | 62 | | | - | |
Prepaid expenses | | | 1,424 | | | 1,403 | | | 27 | | | (6)3 | |
Inventories | | | 3,047 | | | 3,047 | | | - | | | - | |
| | |
| |
| |
| |
| |
Total current assets | | | 16,791 | | | 8,308 | | | 9,458 | | | (975) | |
| | | | | | | | | | | | | | |
Property, plant and equipment – net | | | 7,290 | | | 4,682 | | | 2,608 | | | - | |
Long-term receivables - trade and other | | | 82 | | | 81 | | | 1 | | | - | |
Long-term receivables – finance | | | 7,822 | | | - | | | 7,822 | | | - | |
Investments in unconsolidated affiliated companies | | | 800 | | | 426 | | | 374 | | | - | |
Investments in Financial Products subsidiaries | | | - | | | 2,547 | | | - | | | (2,547)4 | |
Deferred income taxes | | | 616 | | | 819 | | | 19 | | | (222)5 | |
Intangible assets | | | 239 | | | 230 | | | 9 | | | - | |
Goodwill | | | 1,398 | | | 1,398 | | | - | | | - | |
Other assets | | | 1,427 | | | 719 | | | 708 | | | - | |
| | |
| |
| |
| |
| |
Total assets | | $ | 36,465 | | $ | 19,210 | | $ | 20,999 | | $ | (3,744) | |
| | |
| |
| |
| |
| |
| | | | | | | | | | | | | | |
Liabilities | | | | | | | | | | | | | |
| Current liabilities: | | | | | | | | | | | | | |
Short-term borrowings | | | 2,757 | | | 72 | | | 3,160 | | | (475)6 | |
Accounts payable | | | 3,100 | | | 3,078 | | | 243 | | | (221)7 | |
Accrued expenses | | | 1,638 | | | 857 | | | 802 | | | (21)8 | |
Accrued wages, salaries and employee benefits | | | 1,802 | | | 1,788 | | | 14 | | | - | |
Dividends payable | | | 127 | | | 127 | | | - | | | - | |
Deferred and current income taxes payable | | | 216 | | | 166 | | | 50 | | | - | |
Deferred liability | | | - | | | - | | | 259 | | | (259)9 | |
Long-term debt due within one year | | | 2,981 | | | 32 | | | 2,949 | | | - | |
| | |
| |
| |
| |
| |
Total current liabilities | | | 12,621 | | | 6,120 | | | 7,477 | | | (976) | |
Long-term debt due after one year | | | 14,078 | | | 3,367 | | | 10,711 | | | - | |
Liability for postemployment benefits | | | 3,172 | | | 3,172 | | | - | | | - | |
Deferred income taxes and other liabilities | | | 516 | | | 473 | | | 264 | | | (221)5 | |
| | |
| |
| |
| |
| |
Total liabilities | | | 30,387 | | | 13,132 | | | 18,452 | | | (1,197) | |
| | |
| |
| |
| |
| |
Stockholders' equity | | | | | | | | | | | | | |
Common stock | | | 1,059 | | | 1,059 | | | 890 | | | (890)4 | |
Treasury stock | | | (2,914 | ) | | (2,914 | ) | | - | | | - | |
Profit employed in the business | | | 8,450 | | | 8,450 | | | 1,495 | | | (1,495)4 | |
Accumulated other comprehensive income | | | (517 | ) | | (517 | ) | | 162 | | | (162)4 | |
| | |
| |
| |
| |
| |
Total stockholders' equity | | | 6,078 | | | 6,078 | | | 2,547 | | | (2,547) | |
Total liabilities and stockholders' equity | | $ | 36,465 | | $ | 19,210 | | $ | 20,999 | | $ | (3,744) | |
| | |
| |
| |
| |
| |
|
1Represents Caterpillar Inc. and its subsidiaries with Financial Products accounted for on the equity basis. |
2Elimination of receivables between Machinery and Engines and Financial Products. |
3Elimination of Machinery and Engines insurance premiums which are prepaid to Financial Products. |
4Elimination of Financial Products equity which is accounted for on Machinery and Engines on the equity basis. |
5Reclassification of Financial Products deferred tax liability to a deferred tax asset on a consolidated basis. |
6Elimination of Financial Products short-term borrowings from Machinery and Engines. |
7Elimination of payables between Machinery and Engines and Financial Products. |
8Elimination of prepaid insurance in Financial Products accrued expenses. |
9Elimination of Financial Products deferred liabilities with Machinery and Engines. |
|
Caterpillar Inc. Supplemental Data for Cash Flow For the Three Months Ended March 31, 2004 (Unaudited) (Millions of dollars)
|
| | | | Supplemental Consolidating Data |
| | | |
|
| | | Consolidated | | Machinery
and
Engines(1) | | FinancialProducts | | ConsolidatingAdjustments | |
| | |
| |
| |
| |
| |
Cash flow from operating activities: | | | | | | | | | | | | | |
Profit | | $ | 412 | | $ | 412 | | $ | 76 | | $ | (76)2 | |
Adjustments for non-cash items: | | | | | | | | | | | | | |
Depreciation and amortization | | | 350 | | | 202 | | | 148 | | | - | |
Undistributed profit of Financial Products | | | - | | | (76 | ) | | - | | | 76 3 | |
Other | | | (37 | ) | | (25 | ) | | (3 | ) | | (9)4 | |
Changes in assets and liabilities: | | | | | | | | | | | | | |
Receivables - trade and other | | | (197 | ) | | (143 | ) | | 39 | | | (93)4 | |
Inventories | | | (631 | ) | | (631 | ) | | - | | | - | |
Accounts payable and accrued expenses | | | 260 | | | 228 | | | (39 | ) | | 71 4 | |
Other – net | | | (59 | ) | | (116 | ) | | 30 | | | 27 4 | |
| | |
| |
| |
| |
| |
Net cash provided by (used for) operating activities | | | 98 | | | (149 | ) | | 251 | | | (4) | |
| | |
| |
| |
| |
| |
Cash flow from investing activities: | | | | | | | | | | | | | |
Capital expenditures - excluding equipment leased to others | | | (106 | ) | | (101 | ) | | (5 | ) | | - | |
Expenditures for equipment leased to others | | | (240 | ) | | - | | | (240 | ) | | - | |
Proceeds from disposals of property, plant and equipment | | | 206 | | | 7 | | | 199 | | | - | |
Additions to finance receivables | | | (4,812 | ) | | - | | | (4,812 | ) | | - | |
Collection of finance receivables | | | 3,854 | | | - | | | 3,854 | | | - | |
Proceeds from the sale of finance receivables | | | 264 | | | - | | | 264 | | | - | |
Net intercompany borrowings | | | - | | | 209 | | | (6 | ) | | (203)5 | |
| Investments and acquisitions (net of cash acquired) | | | (13 | ) | | (13 | ) | | - | | | - | |
Other – net | | | (65 | ) | | (5 | ) | | (60 | ) | | - | |
| | |
| |
| |
| |
| |
Net cash provided by (used for) investing activities | | | (912 | ) | | 97 | | | (806 | ) | | (203) | |
| | |
| |
| |
| |
| |
Cash flow from financing activities: | | | | | | | | | | | | | |
Dividends paid | | | (127 | ) | | (127 | ) | | - | | | - | |
Common stock issued, including treasury shares reissued | | | 69 | | | 69 | | | - | | | - | |
Treasury shares purchased | | | (250 | ) | | (250 | ) | | - | | | - | |
Net intercompany borrowings | | | - | | | 6 | | | (209 | ) | | 203 5 | |
Proceeds from long-term debt issued | | | 1,808 | | | 255 | | | 1,553 | | | - | |
Payments on long-term debt | | | (913 | ) | | (25 | ) | | (888 | ) | | - | |
Short-term borrowings - net | | | 220 | | | 91 | | | 129 | | | - | |
| | |
| |
| |
| |
| |
Net cash provided by financing activities | | | 807 | | | 19 | | | 585 | | | 203 | |
| | |
| |
| |
| |
| |
Effect of exchange rate on cash | | | 33 | | | 33 | | | (4 | ) | | 4 6 | |
| | |
| |
| |
| |
| |
Increase in cash and short-term investments | | | 26 | | | - | | | 26 | | | - | |
Cash and short-term investments at beginning of period | | | 342 | | | 220 | | | 122 | | | - | |
| | |
| |
| |
| |
| |
Cash and short-term investments at end of period | | $ | 368 | | $ | 220 | | $ | 148 | | $ | - | |
| | |
| |
| |
| |
| |
1Represents Caterpillar Inc. and its subsidiaries with Financial Products accounted for on the equity basis. |
2Elimination of Financial Products profit after tax due to equity method of consolidation. |
3Non-cash adjustment for the undistributed profit from Financial Products. |
4Elimination of non-cash adjustments and changes in assets and liabilities related to consolidated reporting. |
5Net proceeds and payments to/from Machinery and Engines and Financial Products. |
6Elimination of the effect of exchange on intercompany balances. |
|
Caterpillar Inc. Supplemental Data for Cash Flow For the Three Months Ended March 31, 2003 (Unaudited) (Millions of dollars)
|
| | | | Supplemental Consolidating Data
|
| | |
Consolidated
| | Machinery
and
Engines(1) | | FinancialProducts | | ConsolidatingAdjustments | |
| | |
| |
| |
| |
| |
Cash flow from operating activities: | | | | | | | | | | | | | |
Profit | | $ | 129 | | $ | 129 | | $ | 53 | | $ | (53)2 | |
Adjustments for non-cash items: | | | | | | | | | | | | | |
Depreciation and amortization | | | 332 | | | 205 | | | 127 | | | - | |
Undistributed profit of Financial Products | | | - | | | (53 | ) | | - | | | 53 3 | |
Other | | | 17 | | | 11 | | | 1 | | | 5 4 | |
Changes in assets and liabilities: | | | | | | | | | | | | | |
Receivables - trade and other | | | (115 | ) | | (53 | ) | | (35 | ) | | (27)4 | |
Inventories | | | (301 | ) | | (301 | ) | | - | | | - | |
Accounts payable and accrued expenses | | | 248 | | | 43 | | | 170 | | | 35 4 | |
Other - net | | | (92 | ) | | (62 | ) | | (7 | ) | | (23)4 | |
| | |
| |
| |
| |
| |
Net cash provided by (used for) operating activities | | | 218 | | | (81 | ) | | 309 | | | (10) | |
| | |
| |
| |
| |
| |
Cash flow from investing activities: | | | | | | | | | | | | | |
Capital expenditures - excluding equipmentleased to others | | | (86 | ) | | (81 | ) | | (5 | ) | | - | |
Expenditures for equipment leased to others | | | (261 | ) | | - | | | (261 | ) | | - | |
Proceeds from disposals of property, plant and equipment | | | 160 | | | - | | | 160 | | | - | |
Additions to finance receivables | | | (3,386 | ) | | - | | | (3,386 | ) | | - | |
Collection of finance receivables | | | 2,995 | | | - | | | 2,995 | | | - | |
Proceeds from the sale of finance receivables | | | 269 | | | - | | | 269 | | | - | |
Net intercompany borrowings | | | - | | | 522 | | | 10 | | | (532)5 | |
Investments and acquisitions (net of cash acquired) | | | (17 | ) | | (7 | ) | | (10 | ) | | - | |
Other - net | | | (40 | ) | | (13 | ) | | (40 | ) | | 13 6 | |
| | |
| |
| |
| |
| |
Net cash provided by (used for) investing activities | | | (366 | ) | | 421 | | | (268 | ) | | (519) | |
| | |
| |
| |
| |
| |
Cash flow from financing activities: | | | | | | | | | | | | | |
Dividends paid | | | (120 | ) | | (120 | ) | | - | | | - | |
Common stock issued, including treasury shares reissued | | | - | | | - | | | 13 | | | (13)6 | |
Net intercompany borrowings | | | - | | | (10 | ) | | (522 | ) | | 532 5 | |
Proceeds from long-term debt issued | | | 2,053 | | | 79 | | | 1,974 | | | - | |
Payments on long-term debt | | | (985 | ) | | (250 | ) | | (735 | ) | | - | |
Short-term borrowings - net | | | (773 | ) | | 8 | | | (781 | ) | | - | |
| | |
| |
| |
| |
| |
Net cash provided by (used for) financing activities | | | 175 | | | (293 | ) | | (51 | ) | | 519 | |
| | |
| |
| |
| |
| |
Effect of exchange rate on cash | | | (9 | ) | | (14 | ) | | (5 | ) | | 10 7 | |
| | |
| |
| |
| |
| |
Increase (Decrease) in cash and short-term investments | | | 18 | | | 33 | | | (15 | ) | | - | |
Cash and short-term investments at beginning of period | | | 309 | | | 146 | | | 163 | | | - | |
| | |
| |
| |
| |
| |
Cash and short-term investments at end of period | | $ | 327 | | $ | 179 | | $ | 148 | | $ | - | |
| | |
| |
| |
| |
| |
1 Represents Caterpillar Inc. and its subsidiaries with Financial Products accounted for on the equity basis. |
2 Elimination of Financial Products profit after tax due to equity method of consolidation. |
3 Non-cash adjustment for the undistributed profit from Financial Products. |
4 Elimination of non-cash adjustments and changes in assets and liabilities related to consolidated reporting. |
5 Net proceeds and payments to/from Machinery and Engines and Financial Products. |
6 Change in investment and common stock related to Financial Products. |
7 Elimination of the effect of exchange on intercompany balances. |
|
G.Safe Harbor Statement under the Securities Litigation Reform Act of 1995
Certain statements contained in our first quarter 2004 Form 10-Q and prepared statements from the related results webcast are forward-looking and involve uncertainties that could significantly impact results. The words "believes," "expects," "estimates," "anticipates," "will be", "should" and similar words or expressions identify forward-looking statements made on behalf of Caterpillar. Uncertainties include factors that affect international businesses, as well as matters specific to the company and the markets it serves.
World Economic Factors
A vigorous worldwide economic recovery is now underway and global economic growth is expected to be about 4 percent in 2004, or about 1½ percentage points more than in 2003. All regions are improving, although the recovery in the Euro-zone economy is still weak. Industrial production in many developing countries increased sharply over the past year, often at double-digit rates.
Low interest rates initiated economic recoveries and low inflation rates likely will encourage central bankers to be cautious about implementing any interest rate hikes. Modest interest rate hikes (less than 100 basis points) probably would not much affect the 2004 outlook. If, however, central bankers decide to raise interest rates significantly, the recovery would be less robust than assumed, likely weakening Machinery and Engines sales.
Recent increases in coal and metals prices have prompted mining sectors in most countries to increase investments. Further increases in industrial production, plus tight supplies, should maintain prices at favorable levels and cause the mining recovery to strengthen further. An unexpected, sharp decline in prices would harm the recovery.
U.S. economic data were often weaker than expected at the start of the year but improved as the quarter progressed. First quarter growth was probably 4 percent or more and growth should improve further, allowing full year growth between 4.5 and 5 percent. Canada, which has had to reverse recent interest rate hikes, should have economic growth near 3 percent this year. Positives for Machinery and Engines sales include continued strong demand for housing, a recovery in commercial construction, increased funding for highways and favorable metals and energy prices. Coal mining, benefiting from stronger demand and sharp increases in spot prices, should increase significantly. Should any of these factors change substantially, our sales probably would be weaker than assumed.
While Euro-zone economies were weaker than expected in the first quarter, we expect some improvement in coming quarters. In addition, other European economies are experiencing stronger recoveries, which should keep overall European economic growth near 2 percent this year, enough to help our sales. Economies in both Africa/Middle East and the CIS should benefit from another year of high commodity prices. As a result, we project some growth in Machinery and Engines sales in EAME in 2004. However, the European economy is still fragile and any slowing in economic growth could adversely impact sales. Growth in sales in both Africa/Middle East and CIS are highly dependent upon a continued high level of energy and other commodity prices.
The Japanese economy has been in recovery for eight consecutive quarters and our outlook assumes that measures employed by the Bank of Japan - zero interest rates, the maintenance of high levels of reserves in the banking system and the purchase of long-term government bonds - will allow this recovery to continue. We project economic growth of 3 percent in 2004, somewhat better than in 2003 and the best year since 1996. The economy remains vulnerable to any tightening in financial conditions and should that occur, the recovery could stall. Slower economic growth would adversely affect our sales in that country and could have a negative impact on other economies, particularly those in the region.
Latin American economies recovered sharply late last year and we expect economic growth will improve to about 4 percent this year – the best year since 2000. The stronger world economy is boosting regional exports, higher metals prices should encourage more investment in mining and foreign investors are returning. As a result of the economic recovery, we project significant improvement in Machinery and Engines sales in 2004. Any slowing in world growth, collapse in commodity prices or sharp increases in interest rates would jeopardize the expected sales recovery.
The Asia/Pacific region should remain the fastest growing economic bloc in the world this year, with about 6.5 percent growth. China’s economy could slow a bit in response to modest tightening in economic policies but faster growth in most other countries will more than compensate. Exports will benefit from the worldwide economic recovery and low local interest rates will encourage more domestic spending. We expect sales of Machinery and Engines to increase again in 2004. Either a rapid slowdown in the Chinese economy or intensified trade frictions is a sizable risk to the sales improvement expected.
Commodity Prices
Commodities represent a significant sales opportunity, with prices and production as key drivers. Prices have improved sharply over the past year and our outlook assumes continued growth in the world economy will cause metals prices to hold at or above recent prices in 2004. Any unexpected weakening in world industrial production, however, could cause prices to drop sharply to the detriment of our results.
Coal production and prices have improved this year and our sales have benefited. We expect these trends to continue. Should coal prices soften, due to a slowing in world economic growth, the ongoing sales recovery would be vulnerable.
Oil and natural gas prices have continued fairly high into 2004 due to strong demand and tight inventories. Our outlook assumes that increased production will ease shortages in both oil and natural gas, allowing prices to ease some. We do not yet view higher energy prices as a threat to economies since it is strong demand that is boosting prices and world production is still increasing. However, should significant supply cuts occur, such as from OPEC production cuts or political unrest in a major producing country, the resulting price spikes likely would slow economies, potentially with a depressing impact on our sales.
Monetary and Fiscal Policies
For most companies operating in a global economy, monetary and fiscal policies implemented in the U.S. and abroad could have a significant impact on economic growth, and accordingly, demand for a product. In general, higher than expected interest rates, reductions in government spending, higher taxes, significant currency devaluations, and uncertainty over key policies are some factors likely to lead to slower economic growth and lower industry demand.
While economic data are looking more favorable, central banks in most developed countries are still holding interest rates steady. Two (Reserve Bank of Australia and Bank of England) have implemented modest interest rate increases. Our outlook assumes that Central Banks will take great care to ensure that economic recoveries continue and that interest rates will remain low throughout 2004. Should Central Banks raise interest rates too aggressively, both economic growth and our sales could suffer.
Budget deficits in many countries have increased, which has limited the ability of governments to boost economies with tax cuts and more spending. Our outlook assumes that governments will not aggressively raise taxes and slash spending to deal with their budget imbalances. Such actions could disrupt growth and negatively affect sales to public construction.
Political Factors
Political factors in the United States and abroad have a major impact on global companies.
Our outlook assumes that there will be no major escalations of military conflict in the forecast period. Such military conflicts could severely disrupt sales into countries affected, as well as nearby countries.
Our outlook also assumes that there will be no major terrorist attacks. If there is a major terrorist attack, confidence could be undermined, causing a sharp drop in economic activities and our sales. Attacks in major developed economies would be the most disruptive.
Our outlook further assumes that efforts by countries to increase their exports will not result in retaliatory countermeasures by other countries to block such exports, particularly in the Asia/Pacific region. In addition, our outlook assumes that any change in ETI provisions will not negatively impact our tax liability.
Currency Fluctuations
The company has costs and revenues in many currencies and is therefore exposed to risks arising from currency fluctuations. Many currency positions are fairly closely balanced, which, along with the diversity of currency positions, helps diminish exchange rate risks.
The company's largest manufacturing presence is in the United States. So any unexpected strengthening of the dollar tends to raise the foreign currency value of costs and reduce our global competitiveness.
Dealer Practices
The company sells primarily through an independent dealer network. Dealers carry inventories of both new and rental equipment and adjust those inventories based on their assessments of future needs. Such adjustments can impact our results either positively or negatively. The current outlook assumes dealers will reduce inventories slightly in 2004; more drastic reductions would adversely affect sales.
Other Factors
The rate of infrastructure spending, housing starts, commercial construction and mining play a significant role in the company's results. Our products are an integral component of these activities and as these activities increase or decrease in the United States or abroad, demand for our products may be significantly impacted.
Projected cost savings or synergies from alliances with new partners could also be negatively impacted by a variety of factors. These factors could include, among other things, higher than expected wages, energy and/or material costs, and/or higher than expected financing costs due to unforeseen changes in tax, trade, environmental, labor, safety, payroll or pension policies in any of the jurisdictions where the alliances conduct their operations.
Our outlook factors in no significant disruption due to work stoppages at any of our facilities worldwide. Our outlook factors in the timely ratification of a new 6-year labor agreement between Caterpillar and the United Auto Workers. If, for whatever reason, there were to be a prolonged labor disruption, our sales and revenues and profit would likely be negatively impacted.
Results may be impacted positively or negatively by changes in the sales mix. Our outlook assumes a certain geographic mix of sales as well as a product mix of sales. If actual results vary from this projected geographic and product mix of sales, our results could be negatively impacted.
The company operates in a highly competitive environment and our outlook depends on a forecast of the company's share of industry sales. An unexpected reduction in that share could result from pricing or product strategies pursued by competitors, unanticipated product or manufacturing difficulties, a failure to price the product competitively, or an unexpected buildup in competitors' new machine or dealer owned rental fleets, leading to severe downward pressure on machine rental rates and/or used equipment prices.
The environment also remains very competitive from a pricing standpoint. Our outlook assumes that the company will be successful in implementing worldwide machine price increases communicated to dealers with an effective date of July 1, 2004. If for whatever reason the price increases are not accepted in the marketplace, our results will be negatively impacted. Moreover, additional price discounting would result in lower than anticipated realization.
Inherent in the operation of the Financial Products Division is the credit risk associated with its customers. The creditworthiness of each customer, and the rate of delinquencies, repossessions and net losses on customer obligations are directly impacted by several factors, including, but not limited to, relevant industry and economic conditions, the availability of capital, the experience and expertise of the customer's management team, commodity prices, political events, and the sustained value of the underlying collateral. Additionally, interest rate movements create a degree of risk to our operations by affecting the amount of our interest payments and the value of our fixed rate debt. Our match funding policy manages interest rate risk by matching t he interest rate profile (fixed rate or floating rate) of our debt portfolio with the interest rate profile of our receivables portfolio within certain parameters. To achieve our match funding objectives, we issue debt with a similar interest rate profile to our receivables and also use interest rate swap agreements to manage our interest rate risk exposure to interest rate changes and in some cases to lower our cost of borrowed funds. If interest rates move upward more sharply than anticipated, our financial results could be negatively impacted. With respect to our insurance and investment management operations, changes in the equity and bond markets could cause an impairment of the value of our investment portfolio, thus requiring a negative adjustment to profit.
In general, our results are sensitive to changes in economic growth, particularly those originating in construction, mining and energy. Developments reducing such activities also tend to lower our sales. In addition to the factors mentioned above, our results could be negatively impacted by any of the following:
Any sudden drop in consumer or business confidence
Delays in legislation needed to fund public construction
Regulatory or legislative changes that slow activity in key industries; and/or
Unexpected collapses in stock markets.
This discussion of uncertainties is by no means exhaustive but is designed to highlight important factors that may impact our outlook. Obvious factors such as general economic conditions throughout the world do not warrant further discussion, but are noted to further emphasize the myriad of contingencies that may cause the company's actual results to differ from those currently anticipated.
Item 4. Controls and Procedures .
An evaluation was performed under the supervision and with the participation of the company's management, including the Chief Executive Officer (CEO) and Chief Financial Officer (CFO), of the effectiveness of the design and operation of the company's disclosure controls and procedures as of the end of the period covered by this quarterly report. Based on that evaluation, the company's management, including the CEO and CFO, concluded that the company's disclosure controls and procedures are effective to ensure that information required to be disclosed by the company in reports that it files or submits under the Securities Exchange Act of 1934 is recorded, processed, summarized, and reported within the time periods specified in Securities and Exchange Commission rules and forms. During the last fiscal quarter, there have been no significant changes in the company's internal controls over financial reporting that has materially affected, or is reasonably likely to materially affect, the company's internal control over financial reporting. Although the design of any system of controls is based in part upon certain assumptions about the likelihood of future events, and there can be no assurance that any design will succeed in achieving its stated goals under all potential future conditions, regardless of how remote, management's evaluation provided reasonable assurance that these controls will be effective.
PART II. OTHER INFORMATION
Item 1. Legal Proceedings.
The disclosure regarding legal proceedings contained in Part I - Item 3 "Legal Proceedings" of our Form 10-K filed with the Securities and Exchange Commission for the year ended December 31, 2003 is updated by the following disclosure:
On January 16, 2002, Caterpillar commenced an action in the Circuit Court of the Tenth Judicial Circuit of Illinois in Peoria, Illinois, against Navistar International Transportation Corporation and International Truck and Engine Corporation (collectively Navistar). The lawsuit arises out of a long-term purchase contract between Caterpillar and Navistar effective May 31, 1988, as amended from time to time (the Purchase Agreement). The pending complaint alleges that Navistar breached its contractual obligations by: (i) paying Caterpillar $8.08 less per fuel injector than the agreed upon price for new unit injectors delivered by Caterpillar; (ii) refusing to pay contractually agreed upon surcharges owed as a result of Navistar ordering less than planned volumes of replacement unit injector s; and (iii) refusing to pay contractually agreed upon interest stemming from Navistar's late payments. At March 31, 2004, the past due receivable from Navistar regarding the foregoing was $139 million. The pending complaint also has claims alleging that Franklin Power Products, Inc., Newstream Enterprises, and Navistar, collectively and individually, failed to pay the applicable price for shipments of unit injectors to Franklin and Newstream. At March 31, 2004, the past due receivables for the foregoing totaled $12 million. The pending complaint further alleges that Sturman Industries, Inc. and Sturman Engine Systems, Inc. colluded with Navistar to utilize technology that Sturman Industries, Inc. misappropriated from Caterpillar to help Navistar develop its G2 fuel system, and tortiously interfered with the Purchase Agreement and Caterpillar's prospective economic relationship with Navistar. The pending complaint further alleges that the two parties' collusion led Navistar to select Sturman Engine Systems, Inc., and another company, instead of Caterpillar, to develop and manufacture the G2 fuel system.
On May 7, 2002, International Truck and Engine Corporation (International) commenced an action against Caterpillar in the Circuit Court of DuPage County, Illinois that alleges Caterpillar breached various aspects of a long-term agreement term sheet. In its fourth amended complaint, International seeks a declaration from the court that the term sheet constitutes a legally binding contract for the sale of heavy-duty engines at specified prices through the end of 2006, alleges that Caterpillar breached the term sheet by raising certain prices effective October 1, 2002, and also alleges that Caterpillar breached an obligation to negotiate a comprehensive long-term agreement referenced in the term sheet. International further claims that Caterpillar improperly restricted the supply of heavy-duty engines to International from June through September 2002, and claims that Caterpillar made certain fraudulent misrepresentations with respect to the availability of engines during this time period. International seeks damages "in an amount to be determined at trial" and injunctive relief. Caterpillar filed an answer denying International's claims and has filed a counterclaim seeking a declaration that the term sheet has been effectively terminated. Caterpillar denies International's claims and will vigorously contest them. On September 24, 2003, the Appellate Court of Illinois, ruling on an interlocutory appeal, issued an order consistent with Caterpillar's position that, even if the court subsequently determines that the term sheet is a binding contract, it is indefinite in duration and was therefore terminable at will by Caterpillar after a reasonable period.Caterpillar anticipates that a trial currently scheduled for the fourth quarter of 2004 will address all remaining issues in this matter.This matter is not related to the breach o f contract action brought by Caterpillar against Navistar currently pending in the Circuit Court of Peoria County, Illinois.
On August 30, 2002, a World Trade Organization (WTO) arbitration panel determined that the European Union (EU) may impose up to $4.04 billion per year in retaliatory tariffs if the U.S. tax code is not brought into compliance with an August 2001 WTO decision that found the extraterritorial tax (ETI) provisions of the FSC Repeal and Extraterritorial Income Exclusion Act of 2000 constitute an export subsidy prohibited by the WTO Agreement on Subsidies and Countervailing Measures. Since August 2002, the EU has developed a list of U.S. origin products on which the EU could impose tariffs as high as 100 percent of the value of the product. Negotiations among EU Member States, the European Commission, and the private sector over which products would be listed were intense. The EU finalized the list in Decembe r 2003 and in March 2004 began to impose retaliatory tariffs of 5 percent on certain U.S. origin goods. These tariffs will increase 1 percentage point per month to a maximum of 17 percent after one year. The gradual increase in tariffs is designed to place increasing pressure on the U.S. government to bring its tax laws into compliance with its WTO obligations. Given the makeup of the final retaliation list, some Caterpillar parts and components will be subjected to these additional tariffs. We do not believe these tariffs will materially impact our financial results. The company has production facilities in the EU, Russia, Asia, and South America. Products sold into the EU from these plants are not affected by this retaliatory tariff. Congress is currently under increasing pressure to repeal ETI. We cannot predict how the U.S. legislative process will affect the company’s 2004 income tax liability. Although we don’t expect a material impact, it is possible that enacted changes in legislation could significantly lower our expected 2004 export benefits.
Item 2. Changes in Securities, Use of Proceeds and Issuer Purchases of Equity Securities.
Issuer Purchases of Equity Securities
Period | | Total numberof SharesPurchased | | Average PricePaid per Share | | Total Numberof Shares Purchased Under the Program | | Maximum Numberof Shares that MayYet Be PurchasedUnder the Program |
| |
| |
| |
| |
|
January 1-31, 2004 | | 1,081,900 | | | 79.11 | | | 1,081,900 | | | 23,355,594 | (1) |
February 1-29, 2004 | | 2,128,100 | | | 77.21 | | | 2,128,100 | | | 21,427,249 | (1) |
March 1-31, 2004 | | - | | | - | | | - | | | 21,902,131 | (1) |
Total | | 3,210,000 | | | 77.85 | | | 3,210,000 | | | | |
| |
|
| |
|
| |
|
| | | |
(1) On October 8, 2003, the board of directors approved an extension of the share repurchase program (through October 2008) with the goal of reducing the company's outstanding shares to 320,000,000. Amount represents the shares outstanding at the end of the period less 320,000,000. |
|
Non-U.S. Employee Stock Purchase Plans
We have 27 employee stock purchase plans administered outside the United States for our foreign employees. As of March 31, 2004, those plans had approximately 8,160 participants in the aggregate. During the first quarter of 2004, a total of 102,451shares of Caterpillar common stock or foreign denominated equivalents were distributed under the plans. Participants in some foreign plans have the option of receiving non-U.S. share certificates (foreign-denominated equivalents) in lieu of U.S. shares of Caterpillar Inc. common stock upon withdrawal from the plan. These equivalent certificates are tradable only on the local stock market and are included in our determination of shares outstandi ng.
Item4. Submission of Matters to a Vote of Security Holders .
The Annual Meeting of Stockholders of Caterpillar Inc. was held on April 14, 2004, for the purpose of electing directors and voting on the proposals described below. Proxies for the meeting were solicited pursuant to Section 14(a) of the Securities Exchange Act of 1934 and there was no solicitation in opposition to management's solicitations. A plurality vote of the shares present at the meeting was required for election of directors.An affirmative vote of the majority of shares present at the meeting was required for approval of all other proposals. Abstentions and broker non-votes have the effect of a no vote on matters other than director elections. Quorum exists if at least one-third of Caterpillar stockholders are present in person or by proxy at the meeting. Abstentions and broker non-votes are counted as present for establishing a quorum.
Proposal 1 - Election of Directors All of management's nominees for directors as listed in the proxy statement were elected with the following vote: |
| | | Shares Voted "FOR" | Shares "WITHHELD" | |
| |
|
| |
| | John T. Dillon | 292,840,884.68 | 14,334,813.52 | |
| | Juan Gallardo | 293,424,533.12 | 13,751,165.09 | |
| | William A. Osborn | 296,375,468.41 | 10,800,229.79 | |
| | Gordon R. Parker | 292,587,843.74 | 14,587,854.47 | |
| | Edward B. Rust, Jr. | 293,486,033.26 | 13,692,664.95 | |
Proposal 2 - Amend Stock Option Plan The management proposal requesting approval of an amendment to the Caterpillar Inc. Stock Option and Long-Term Incentive Plan was approved with the following vote: |
| | Shares Voted"FOR" | | Shares Voted"AGAINST" | | Shares"ABSTAINING" | | Broker
Non-Votes |
|
| |
| |
| |
|
| | 193,693,578.06 | | 73,180,116.84 | | 7,948,527.31 | | 32,353,476 |
Proposal 3 - Ratification of Auditors The management proposal requesting ratification of Auditors was approved with the following vote: |
| | Shares Voted"FOR" | | Shares Voted"AGAINST" | | Shares"ABSTAINING" | | Broker
Non-Votes |
|
| |
| |
| |
|
| | 289,639,985.21 | | 10,552,921.88 | | 6,983,875.12 | | 0 |
Proposal 4 - Stockholder Proposal - Shareholder Rights Plan The stockholder proposal requesting the Board of Directors to redeem or terminate the company's shareholder rights plan unless put to shareholder vote was defeated with the following vote: |
| | Shares Voted"FOR" | | Shares Voted"AGAINST" | | Shares"ABSTAINING" | | Broker
Non-Votes |
|
| |
| |
| |
|
| | 147,486,605.18 | | 118,852,353.92 | | 8,483,263.11 | | 32,353,476 |
Proposal 5 - Stockholder Proposal - Sale of Equipment to Israel The stockholder proposal requesting the Board of Directors to report on whether sales of equipment to Israel comports with the company’s Code of Conduct was defeated with the following vote: |
| | Shares Voted"FOR" | | Shares Voted"AGAINST" | | Shares"ABSTAINING" | | Broker
Non-Votes |
|
| |
| |
| |
|
| | 9,691,465.96 | | 232,722,811.89 | | 32,407,944.35 | | 32,353,476 |
Proposal 6 - Stockholder Proposal - HIV/AIDS The stockholder proposal requesting the Board of Directors to report on the economic effects of the HIV/AIDS, tuberculosis and malaria pandemics on the company's business strategy was defeated with the following vote: |
| | Shares Voted"FOR" | | Shares Voted"AGAINST" | | Shares"ABSTAINING" | | BrokerNon-Votes |
|
| |
| |
| |
|
| | 14,675,847.59 | | 227,812,962.48 | | 32,333,412.14 | | 32,353,476 |
Item 6. Exhibits and Reports on Form 8-K . |
| | (a) | Exhibits: |
| | | 3.3 | Bylaws, amended and restated as of February 11, 2004. |
| | | 31.1 | Certification of James W. Owens, Chairman and Chief Executive Officer of Caterpillar Inc., as required pursuant to Section 302 of the Sarbanes-Oxley Act of 2002. |
| | | 31.2 | Certification of F. Lynn McPheeters, Chief Financial Officer of Caterpillar Inc., as required pursuant to Section 302 of the Sarbanes-Oxley Act of 2002. |
| | | 32 | Certification of James W. Owens, Chairman and Chief Executive Officer of Caterpillar Inc. and F. Lynn McPheeters, Chief Financial Officer of Caterpillar Inc., as required pursuant to Section 906 of the Sarbanes-Oxley Act of 2002. |
| | | | |
| | (b) | During the quarter ended March 31, 2004, reports on Form 8-K were filed pursuant to Item 5 on January 27, February 12, March 2 (two), and March 22, and furnished pursuant to Item 12 on January 27. Additional reports on Form 8-K were filed on April 14, April 15, and April 22 pursuant to Item 5 and furnished on April 22, 2004 pursuant to Item 12. No financial statements were filed as part of those reports. |
SIGNATURES |
Pursuant to the requirements of the Securities Exchange Act of 1934, the Registrant has duly caused this report to be signed on its behalf by the undersigned thereunto duly authorized. |
| | | | |
| | CATERPILLAR INC. | | |
May 6, 2004 | /s/ James W. Owens | | Chairman of the Board and Chief Executive Officer |
|
| | |
| | (James W. Owens) | | |
| | | | |
May 6, 2004 | /s/ F. Lynn McPheeters | | Vice President and Chief Financial Officer |
|
| | |
| | (F. Lynn McPheeters) | | |
| | | | |
May 6, 2004 | /s/ David B. Burritt | | Controller and Chief Accounting Officer |
|
| | |
| | (David B. Burritt) | | |
| | | | |
May 6, 2004 | /s/ James B. Buda | | Secretary |
|
| | |
| | (James B. Buda) | | |