Exhibit 99.1
Caterpillar Inc.
1Q Earnings Release
April 20, 2005
FOR IMMEDIATE RELEASE
Caterpillar Achieves Record Profitability;
Company Raises Full-Year Outlook.
PEORIA, Ill. -- Caterpillar Inc. (NYSE: CAT) today reported first-quarter sales and revenues of $8.34 billion and record profit of $581 million, or $1.63 per share. Sales and revenues were up 29 percent and profit was up 38 percent compared to the first quarter of 2004.
“These record results are further evidence of the strength of the many globalmarkets we serve and our ability to successfully meet this continuing strong market demand,” said Chairman and Chief Executive Officer Jim Owens. “Thanks to the commitment of Team Caterpillar -- our employees, dealers and suppliers around the world - we are working diligently to improve our performance while meeting customer needs. Our operating margins in the first quarter were the best since the first half of 2004 when material cost pressures began to accelerate. We have an unwavering commitmentto fulfilling customer demand while improving operating margins throughPrice Realization, which more than offsets material cost increases, and enhanced manufacturing efficiencies.”
Sales and revenues of $8.34 billion were up $1.86 billion, or 29 percent, compared to $6.48 billion in the first quarter of 2004. The increase in sales and revenues was driven by $1.44 billion of higherMachinery and Engines volume, $250 million of increased price realization, a $102 million favorable impact ofCurrency on sales due primarily to the strengthening euro and British pound and $72 million of higherFinancial Products revenues.
Profit of $581 million or $1.63 per share was up $161 million, or 38 percent, compared to $420 million or $1.19 per share in the first quarter of 2004. The main contributors to the profit increase were higherSales Volume of $521 million and higher price realization of $250 million. Partially offsetting these favorable items were $489 million of higherCore Operating Costs and $48 million of higherRetirement Benefits.
“We remain squarely focused on responding to customer needs and improving operating performance, and we are on track to meet our long-term financial targets,” Owens said. “We’re well positioned for growth and will continue to build on our record results, utilizing the power of6 Sigma across the value chain to further increase supply chain efficiencies and performance. While we still face selected industry-wide issues associated with material availability, our suppliers have responded and material availability is improving steadily.”
Page 1
Outlook
We are raising our outlook for both sales and revenues and profit per share. We now expect 2005 sales and revenues to be up 16 to 18 percent and profit per share to be up 35 to 40 percent from 2004.
“As 2005 unfolds, we are encouraged by the fundamental strength of the key markets we serve," Owens said. “Mining companies will continue to add capacity to meet anticipated growth in demand for the next several years. In addition, global demand for energy, including coal as well as oil and gas, and large infrastructure projects are growing. Likewise, commercial construction and housing in most countries will create even further demand for our products and services. This positions Team Caterpillar to deliver results beyond our initial expectations for the year.”
(Complete outlook begins on page 7.)
For 80 years, Caterpillar has been building the world's infrastructure and, in partnership with our independent dealers, is driving positive and sustainable change on every continent. Caterpillar is a technology leader and the world's largest maker of construction and mining equipment, diesel and natural gas engines and industrial gas turbines. More information is available athttp://www.CAT.com/.
Note: Glossary of terms included on pages 14-16; first occurrence of terms shown in bold italics.
Page 2
DETAILED ANALYSIS
First Quarter 2005 vs. First Quarter 2004
 |
The chart above graphically illustrates reasons for the change in Consolidated Sales and Revenues between 1st Quarter 2004 (at left) and 1st Quarter 2005 (at right). Items favorably impacting sales and revenues appear as upward stair steps with the corresponding dollar amounts above each bar. Caterpillar management utilizes these charts internally to visually communicate with its Board and employees. |
Sales and Revenues
Sales and revenues for the first quarter of 2005 were $8.339 billion, up $1.859 billion or 29 percent from first quarter 2004. The increase was due to higherMachinery volume of $1.010 billion, higher Engines volume of $425 million, improved price realization of $250 million, the favorable impact of currency on sales of $102 million due primarily to the strengthening euro and British pound and higher Financial Products revenues of $72 million.
Sales and Revenues by Geographic Region | ||||||||||||||||||||||||
(Millions of dollars) | Total | % Change | North America | % Change | EAME | % Change | Latin America | % Change | Asia/ Pacific | % Change | ||||||||||||||
1st Quarter 2004 | ||||||||||||||||||||||||
| Machinery | $ | 4,152 | $ | 2,283 | $ | 963 | $ | 295 | $ | 611 | ||||||||||||||
Engines1 | 1,850 | 870 | 559 | 195 | 226 | |||||||||||||||||||
Financial Products2 | 478 | 336 | 84 | 30 | 28 | |||||||||||||||||||
| $ | 6,480 | $ | 3,489 | $ | 1,606 | $ | 520 | $ | 865 | |||||||||||||||
1st Quarter 2005 | ||||||||||||||||||||||||
| Machinery | $ | 5,400 | 30% | $ | 2,928 | 28% | $ | 1,355 | 41% | $ | 440 | 49% | $ | 677 | 11% | |||||||||
Engines1 | 2,389 | 29% | 1,200 | 38% | 743 | 33% | 157 | -19% | 289 | 28% | ||||||||||||||
Financial Products2 | 550 | 15% | 390 | 16% | 87 | 4% | 31 | 3% | 42 | 50% | ||||||||||||||
| $ | 8,339 | 29% | $ | 4,518 | 29% | $ | 2,185 | 36% | $ | 628 | 21% | $ | 1,008 | 17% | ||||||||||
1Does not include internal engine transfers of $619 million and $484 million in 2005 and 2004, respectively. Internal engine transfers are valued at prices comparable to those for unrelated parties. | ||||||||||||||||||||||||
2Does not include revenues earned from Machinery and Engines of $62 million and $39 million in 2005 and 2004, respectively. | ||||||||||||||||||||||||
Page 3
Machinery Sales
Machinery sales were $5.400 billion in first quarter 2005, a $1.248 billion or 30 percent increase over first quarter 2004, and a record for any quarter. Sales volume was up about 24 percent. Improved price realization accounted for about 4 percent of the sales change, while the remainder of the sales change was due to the favorable impact of currency. A portion of the higher volume was due to an increase in dealer inventories, which was the result of more machines in transit or dealer preparation to support future deliveries. Dealer inventories, relative to dealer deliveries to end users, were marginally lower than a year earlier.
| § | North America sales were up 28 percent over first quarter 2004, with sales volume up about 24 percent and the remainder due to improved price realization. Sales volume benefited from strong demand in all applications.Housing construction increased in response to low mortgage interest rates and there is a large backlog of unused permits. Nonresidential construction benefited from healthy business cash flows. Both coal and metals prices and production increased, driving sizable increases into mining deliveries. |
| § | EAME sales in first quarter 2005 were 41 percent higher than a year earlier. Volume, up about 29 percent, was the biggest contributor. The favorable impact of currency added about 6 percent and improved price realization added the remainder. Low interest rates in Europe are beginning to revive construction, and both Africa/Middle East (AME) and the CIS continued to benefit from high energy and metals prices and production.Both AME and the CIS are investing in new capacity and upgrading infrastructure. |
| § | Latin America first quarter sales were 49 percent higher than a year earlier. Volume contributed about 41 percent, improved price realization added about 7 percent and the remainder was due to currency. Mining benefited from higher prices and production while low interest rates, increased spending on infrastructure and better economic growth boosted construction. |
| § | Asia/Pacific sales were up 11 percent over first quarter 2004. Increased volume contributed about 8 percent, improved price realization added about 2 percent and the remainder was due to currency. Volume in China declined, but was largely offset by increases in Australia and Indonesia. Coal mining increased sharply in Australia and Indonesia, benefiting from higher coal prices. |
Engines Sales
Engines sales were $2.389 billion in first quarter 2005, a $539 million or 29 percent increase over first quarter 2004. Sales volume was up about 23 percent, improved price realization accounted for about 4 percent and the remainder was due to the favorable impact of currency.
| § | North America sales were up 38 percent over first quarter 2004. Sales of on-highway truck engines increased 33 percent, as truck manufacturers successfully increased line rates to serve an ongoing expansion and replacement cycle driven by high average fleet age, high freight demand, and improved freight carrier profitability. Sales of engines to the petroleum sector increased 54 percent compared to last year, with widespread increases in sales of engines to gas compression, and Original Equipment Manufacturer (OEM) equipment for drilling and well servicing, supported by higher energy prices. Sales of engines to the marine sector increased 59 percent, benefiting from strengthening workboat activity. Sales of engines to the electric power sector gained 3 percent with increased demand for critical standby generator sets to support sustainability for telecommunications and financial service applications. Sales of reciprocating engines were partially offset by reduced turbine sales as fuel prices increased faster than electricity rates.Dealer inventories of reciprocating engines increased above selling rates due to higher levels of in-transit inventory with increasing volume. |
Page 4
| § | EAME sales were up 33 percent over first quarter 2004. Sales of engines into the electric power sector increased 65 percent due to widespread increased demand for prime, cogeneration and standby systems, ongoing Middle East reconstruction demand, and sales resulting from the acquisition of Turbomach. Sales of engines to the industrial sector increased 26 percent due to strong demand for various types of OEM equipment and the favorable impact of currency. In addition, the comparison is with a reduced first quarter 2004 base that was impacted by the fourth quarter 2003 pre-buy of engines prior to the implementation of European Tier II emissions regulations. Sales of engines to the marine sector increased 73 percent, with increased demand for inland waterways workboats and larger engines for oceangoing vessels, as well as the favorable effects of currency.Dealer inventories increased above selling rates due to increasing volume, increased installation time associated with more complex applications, and some investment in inventory from previously reduced levels to serve ongoing demand increases. |
| § | Latin America sales decreased 19 percent versus first quarter 2004, with decreases in most sectors. Sales of marine engines decreased 60 percent, with all of the reduction due to the absence of a large marine project that occurred in 2004. Sales of electric power engines in Latin America decreased 9 percent, while sales of engines to the petroleum sector decreased 4 percent.Dealer inventory increased above selling rates primarily due to higher levels of in-transit inventory in the delivery process. |
| § | Asia/Pacific sales were up 28 percent over first quarter 2004 with increases in all sectors, led by a 36 percent increase in sales of petroleum engines, with all of the increase coming from turbines and turbine related services to support increased exploration and production. Sales of engines to the marine sector increased 49 percent with strong demand for oceangoing, pleasure craft and offshore supply vessels, followed by a 9 percent increase in sales of electric power engines.Current months of sales of dealer inventory are above first quarter 2004 due to higher levels of in-transit inventory in the delivery process. |
Financial Products Revenues
Financial Products revenues were $550 million, an increase of $72 million or 15 percent from first quarter 2004. The increase in revenues was due primarily to a $65 million favorable impact from continued growth ofEarning Assets at Cat Financial.
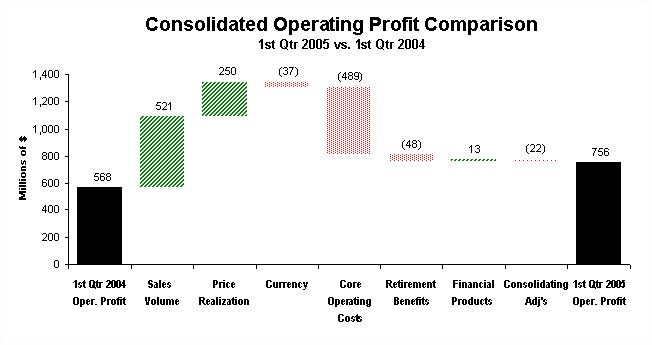 |
The chart above graphically illustrates reasons for the change in Consolidated Operating Profit between 1st Quarter 2004 (at left) and 1st Quarter 2005 (at right). Items favorably impacting operating profit appear as upward stair steps with the corresponding dollar amounts above each bar, while items negatively impacting operating profit appear as downward stair steps with dollar amounts reflected in parentheses above each bar. Caterpillar management utilizes these charts internally to visually communicate with its Board and employees. |
Page 5
Operating Profit
Higher sales volume in all regions resulted in a favorable operating profit impact of $521 million, and improved price realization favorably impacted operating profit by $250 million, which more than offset increases in material costs. Improved profitability of $13 million at Financial Products also contributed to the increase in operating profit.
Partially offsetting the favorable items were $489 million in higher core operating costs, $48 million of higher retirement benefits and a $37 million unfavorable impact of currency on operating profit. Manufacturing costs represented $439 million of the total increase in core operating costs.Roughly two-thirds of the manufacturing cost increase was attributable to variable cost increases - primarily material with some related supply chain inefficiencies. The remaining amount represented normal and expected period manufacturing costs to support the increase in volume.
We continued to satisfy our customers in 2005 by delivering record first-quarter sales. The core operating cost increase reflected above was largely attributable to increases in manufacturing costs to meet this demand. These additional manufacturing costs included higher material costs resulting primarily from steel-related increases, higher manufacturing costs to support increased volume, inefficiencies due to supply constraints, a United Auto Workers (UAW) contract ratification payment, and higher freight and expediting costs to ensure timely delivery of material. The remainder of the core operating cost increase was mainly due to planned spending on general support programs.
Operating Profit by Principal Line of Business | |||||||||||||
(Millions of dollars) | 1st Quarter 2004 | 1st Quarter 2005 | Change $ | ||||||||||
Machinery1 | $ | 441 | $ | 496 | $ | 55 | |||||||
Engines1 | 41 | 183 | 142 | ||||||||||
| Financial Products | 111 | 124 | 13 | ||||||||||
Consolidating Adjustments | (25 | ) | (47 | ) | (22 | ) | |||||||
| Consolidated Operating Profit | $ | 568 | $ | 756 | $ | 188 | |||||||
1 | Caterpillar operations are highly integrated; therefore, the company uses a number of allocations to determine lines of business operating profit for Machinery and Engines. | ||||||||||||
Operating Profit by Principal Line of Business
| · | Machineryoperating profit of $496 million was up $55 million, or 12 percent, from first quarter 2004. The favorable impact of higher sales volume and improved price realization was partially offset by higher core operating costs, higher retirement benefits and the unfavorable impact of currency. |
| · | Enginesoperating profit of $183 million was up $142 million, or 346 percent, from first quarter 2004. The favorable impact of higher sales volume and improved price realization was partially offset by higher core operating costs, higher retirement benefits and the unfavorable impact of currency. |
| · | Financial Productsoperating profit of $124 million was up $13 million, or 12 percent, from first quarter 2004. The increase was primarily due to a $30 million impact from the growth of earning assets, partially offset by an $11 million increase in operating expenses primarily related to growth, at Cat Financial. |
Page 6
Other Profit/Loss Items
| · | Other income/expensewasincome of $108 million compared with income of $61 million in first quarter 2004 for a favorable impact of $47 million. The change was primarily due to the favorable impact of currency gains of $41 million. This, combined with the $37 million unfavorable impact on operating profit, created anet favorable impact of currency on profit before tax of $4 million. |
| · | The provision for income taxes in the first quarter reflects an estimated annual tax rate of 29 percent for 2005. We are anticipating a 29 percent rate for the full year compared to 27 percent in 2004 primarily due to the impact of the phase-out provision of the American Jobs Creation Act permitting only 80 percent of Extraterritorial Income Exclusion (ETI) benefits in 2005 as well as a change in our geographic mix of profits. |
| · | The equity in profit/loss of unconsolidated affiliated companies favorably impacted profit by $8 million over first quarter 2004, primarily driven by increased profitability at Shin Caterpillar Mitsubishi Ltd. (SCM). |
Employment
At the end of the first quarter of 2005, Caterpillar's worldwide employment was 79,988 compared with 70,815 one year ago. The increase is primarily due to approximately 3,500 hourly labor additions to support increased volume, the conversion of approximately 2,000 supplemental employees to full-time employment in our Midwestern U.S. facilities, and the addition of approximately 2,000 employees from acquisitions and growing Caterpillar Logistics operations.
Sales and Revenues Outlook
We project another record year in 2005. We expect company sales and revenues will increase 16 to 18 percent, with Machinery and Engines volume increasing about 8 to 10 percent. We expect improved price realization to add about 5.5 percent, the favorable impact of currency to add about 1.5 percent with the rest coming from Financial Products revenues.
| · | Economic growth in most countries is moderate and key inflation measures are well within target ranges. As a result, we expect central banks will remain cautious about raising interest rates, allowing the current recovery to continue throughout the year. We project the world economy will grow about 3.5 percent. |
| · | Investment sectors are generally faring better than consumer sectors this recovery. Business profits in many countries are at, or near, record shares of national incomes and companies are using profits to boost productivity. Low interest rates are encouraging companies to upgrade and expand aged capital equipment and, more recently, structures. Recoveries in nonresidential construction should strengthen this year, increasing the demand for reliable standby electrical power. |
| · | Housing prices are increasing significantly in many countries and this has begun to encourage construction to alleviate housing shortages. Low interest rates and rising employment should benefit residential construction in most regions. |
| · | Most governments have not invested enough in infrastructure for years, which is now creating inefficiencies, particularly in transportation. Governments have started to allocate more of the revenues rising from faster economic growth to infrastructure, and such construction should improve throughout the year. |
| · | Mining and energy companies underinvested in capacities for years due to unfavorable prices and capacities are now insufficient. Last year, prices surged above the minimums needed to make investment attractive and companies increased spending. Prices are expected to remain above those minimums this year and mining and energy companies should again increase investments. |
Page 7
| · | Increased international trade and an aging ship fleet are driving strong growth in shipbuilding. Demand for support vessels to cope with more port congestion and increased offshore oil and gas production is also increasing. |
Sales and Revenues Outlook - Midpoint of Range | ||||||||||
(Millions of dollars) | 2004 Actual | 2005 Outlook1 | % Change | |||||||
| Machinery and Engines | ||||||||||
| North America | $ | 14,521 | $ | 17,250 | 19 | % | ||||
| EAME | 7,505 | 9,000 | 20 | % | ||||||
| Latin America | 2,372 | 2,750 | 16 | % | ||||||
| Asia/Pacific | 3,938 | 4,150 | 5 | % | ||||||
| Total Machinery and Engines | 28,336 | 33,150 | 17 | % | ||||||
Financial Products2 | 1,970 | 2,300 | 17 | % | ||||||
| Total | $ | 30,306 | $ | 35,450 | 17 | % | ||||
1Based on the sales expectations by geographic region, the company forecasts Consolidated Sales and Revenues to increase in the range of 16 to 18 percent versus 2004. For purposes of this chart, numbers are shown at the middle of the outlook range (i.e., 17 percent). | ||||||||||
2Does not include revenues earned from Machinery and Engines of $200 million and $199 million in 2005 Outlook and 2004, respectively. | ||||||||||
North America (United States and Canada)Machinery and Engines sales are expected to increase about 19 percent in 2005.
| · | The U.S. economy appeared to grow above a 4 percent rate in the first quarter and employment is strengthening further. While inflation is gaining more attention, most inflation measures do not indicate an immediate problem. Consequently, we believe the Fed will continue gradually raising the Federal funds rate to about 4 percent by the end of the year. Overall, interest rates should continue to support growth, particularly in business investment, and the economy should grow close to 4 percent in 2005. |
| · | Housing activity continued to strengthen in the first quarter. The backlog of unused permits, increases in new home prices and low mortgage rates suggest another good year for housing. |
| · | Nonresidential construction recovered from a steep 3-year decline last year and a significant recovery is needed to bring the capacity of this sector in line with the size of the economy. Improved financial conditions and good business cash flows should drive a strong recovery this year. |
| · | Prices for metals and coal are well above year-earlier prices and production increased in the first quarter. Investment is increasing rapidly. |
| · | Trucking companies, which are experiencing improved profitability, should significantly increase purchases to handle strong freight demand and upgrade aging fleets. |
| · | The Canadian economy, benefiting from low interest rates and high commodity prices, should grow about 3 percent in 2005. |
Page 8
EAMEMachinery and Engines sales are expected to increase about 20 percent in 2005.
| · | The Euro-zone economy slowed in the last half of 2004 and showed little improvement in the first quarter of 2005. Weak growth is forcing the European Central Bank to hold interest rates steady, and any rate hikes are not likely before the fourth quarter. Low interest rates are beginning to revive construction, particularly housing, and encourage some replacement buying. The U. K. and Central European economies are performing better, which should maintain overall European growth near 2 percent in 2005. |
| · | Both AME and the CIS are major beneficiaries of favorable commodity prices and increased production of metals and energy. We expect both regions will continue using higher incomes to increase capacity and improve infrastructures. The AME economy should grow over 5 percent in 2005 and the CIS economy more than 6 percent, the third consecutive year of good growth for both. |
| · | A positive impact of currency on sales is expected to contribute about 4 percent of the increase. |
Latin AmericaMachinery and Engines sales are expected to increase about 16 percent in 2005.
| · | Latin American economies should grow about 4 percent in 2005, continuing the recovery that started in late 2003. Projected positives include higher commodity prices, low inflation and increased foreign direct investment. |
| · | Our outlook assumes that mines will invest heavily in new capacity and equipment. Better economic growth is causing some governments to increase infrastructure spending to correct for years of underinvestment. |
Asia/PacificMachinery and Engines sales are expected to increase about 5 percent in 2005.
| · | We anticipate that interest rates will rise slightly this year and we expect regional growth to slow to about 6 percent. Interest rates are expected to support recoveries in consumer spending and business investment while competitive exchange rates are expected to further boost exports. We anticipate that continued economic growth will boost nonresidential construction and demand for standby electrical power. |
| · | Contract prices for coal, particularly coking coal, will increase substantially this year and we expect coal mining will again be a major contributor to sales. Metals mining should benefit from higher contract prices for iron ore and favorable base metals prices. |
Financial Products revenues are expected to increase about 17 percent in 2005.
| · | We expect continued growth in Financial Products, with revenues expected to increase primarily due to higher average earning assets in 2005. |
Page 9
 |
| * Denotes volume range |
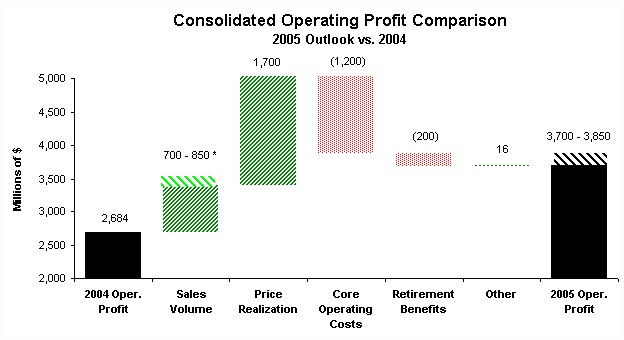
| The chart above graphically illustrates reasons for the change in Consolidated Operating Profit between 2004 (at left) and 2005 Outlook (at right). Items favorably impacting operating profit appear as upward stair steps with the corresponding dollar amounts above each bar, while items negatively impacting operating profit appear as downward stair steps with dollar amounts reflected in parentheses above each bar. Caterpillar management utilizes these charts internally to visually communicate with its Board and employees. |
Profit Outlook
We expect profit per share to be up 35 to 40 percent from 2004. We expect 2005 operating profit to increase between $1.02 and $1.17 billion from 2004. The year will benefit from increased price realization, including the effect of the previously announced mid-year price action, as well as increased volume. We expect our costs in the first half of 2005 will appear substantially higher than costs in the first half of 2004 because this comparative period contains lower material (primarily steel-related) costs. We anticipate continued pressure on our core operating costs throughout the year, with some relief on material costs in the last six months. As a result, we expect the last half of 2005 to be stronger than the first half.
Supplemental Information
Information formerly located in this section is now included in tabular format athttp://www.cat.com/investor under the Quarterly Supplemental Information section.
Page 10
Question and Answer
General
Q1: Will your 2007 emissions solution be based on ACERT® technology?
A: Yes. Caterpillar will utilize the ACERT Technology to meet the 2007 on-highway emission requirements.
Caterpillar has shipped over 200,000 of the five engine models equipped with ACERT Technology thus far. The current field population of engines featuring ACERT Technology continues to exhibit strong reliability. Teardowns of higher mileage engines display excellent longevity of the wear components. Additionally, ACERT Technology serves as the platform for complying with emissions regulations in off-highway applications. As of March 2005, over 20 different Cat machine models equipped with engines featuring ACERT Technology have gone into production.
ACERT Technology reduces emissions via a ‘building blocks’ systems approach to air management, electronics and fuel systems.For 2007 on-highway engines, Caterpillar will build on the ACERT Technology foundation by utilizing a diesel particulate filter (DPF) to trap particulates and by introducing Clean Gas Induction (CGI). A differentiated approach, CGI will draw cool, clean filtered gas from downstream of the DPF and then put it into the engine's intake air system to achieve additional NOx reduction.With ACERT for 2007, Caterpillar on-highway engine customers can expect the same reliability, fuel economy, service intervals and durability that they have come to expect from Caterpillar.
Caterpillar currently has built engines to 2007 standards. A truck with 2007 technology has been demonstrated to the Department of Energy and was recently exhibited at the March 2005 Mid-America Truck Show in Louisville, Kentucky. Moreover, units have been provided to OEMs for summer-cooling tests, and additional field evaluation units are planned to ship to fleet customers beginning in mid-2005.
First Quarter 2005 vs. First Quarter 2004
Q2: Are you achieving price realization associated with the announced price increases in 2004 and 2005?
A: Yes. In general, the price increases are holding in the marketplace. However, as we have discussed over the last few quarters, there is a delay between announced price increases and price realization due to price protection. Price protection means that for most products, if there is a firm customer order before a price increase is announced, we won't harm customers by raising the price on that order already on hand. With recent long lead times for product delivery attributable to the increase in customer demand, the lag between the announced effective date and the actual realization date has been even longer than usual.
Page 11
Q3: Can you please provide more detail on your increases in Core Operating Costs in first quarter 2005 vs. first quarter 2004?
A: The following table summarizes the increase in core operating costs in first quarter 2005 vs. first quarter 2004:
Core Operating Cost Change | |||
1st Quarter 2005 vs. 1st Quarter 2004 | |||
| Manufacturing Costs | $ | (439 | ) |
| SG&A | (46 | ) | |
| R&D | (4 | ) | |
| Total | $ | (489 | ) |
Roughly two-thirds of the manufacturing cost increase is attributable to variable cost increases - primarily material with some related supply chain inefficiencies. Material costs, particularly steel, and volume related manufacturing and supply chain inefficiencies began accelerating more rapidly in the second half of 2004. As a result, first quarter of 2005 vs. the first quarter of 2004 is a tough comparison. We expect the second quarter comparison will also be difficult.
Manufacturing costs also include period costs associated with building our products. Period manufacturing costs increased 15 percent or approximately $100 million to support a 30 percent increase in Machinery and Engines sales. In addition, we made a UAW contract ratification payment.
Machinery and Engines SG&A declined as a percentage of sales from 9.8 percent in first quarter 2004 to 8.3 percent in first quarter 2005 but was up $46 million vs. 2004 excluding the impact of currency and retirement benefits.
Machinery and Engines operating margins are improving compared with the second half of 2004.
Machinery and Engines | ||||||||
Operating Profit as a % of Sales | ||||||||
Q1 '04 | Q2 '04 | Q3 '04 | Q4 '04 | Q1 '05 | ||||
| 8.0% | 9.7% | 7.9% | 7.6% | 8.7% | ||||
Q4: Are you seeing any evidence yet of improvement in supply chain conditions?
A: Yes. As the plants strive to further ramp-up production in 2005 from record 2004 levels to meet continued strong growth in demand, availability of tires, castings, and several other critical components remains tight. However, the plants are reporting that material flow continues to improve, and they have been able to raise production levels.
Page 12
Outlook
Q5: Are the industries you serve approaching a peak after seeing sales and revenue growth in 2003, 2004 and 2005?
A: We don't think so. This recovery follows a four-year period of industry weakness, with flat company sales from 1999 to 2002. Extended weak periods in the early 1980s and 1990s were followed by lengthy recoveries, with company sales doubling over a five to six-year period.
In addition, many industries we serve still have growth potential.
| · | In the United States, non-residential construction and mining have not yet regained prior peaks. Passage of a new highway bill should support further growth in highway construction. |
| · | In the Euro countries, economic recovery has not really started, even after four years of weak growth. However, low interest rates are boosting housing construction. |
| · | AME, Latin America and the CIS are seeing gains from better commodity prices. Their economies, along with construction, are recovering from years of weak growth. |
| · | Asian economies have demonstrated a long-term ability to grow rapidly, which requires more construction. We expect that to continue. |
| · | Finally, capacities in mining and energy are inadequate to meet today's requirements. Rebuilding adequate capacity and meeting future growth in demand for metals and energy will require significant further investment. |
Q6: What is the basis of the volume increase in this outlook compared with the January outlook for 2005?
A: First-quarter sales were stronger than expected and accounted for some of the increase. The first-quarter increase, which was related to even more robust economic conditions than expected, prompted us to conclude sales were on a stronger path for the rest of the year. In particular, housing starts in the United States are better than expected and the recovery in non-residential construction appears to be gaining momentum. Metals and energy prices have been higher than expected, which is benefiting sales to mining and into the developing countries.
Q7: What is your current view on material costs? Do you believe there will be some relief in the second half and can you provide more detail on steel and tires?
A: The 2005 materials environment continues to be challenging, as steel prices continued to rise in the first quarter. In the United States, foundry and forge shop product prices were up 3.2 percent compared to fourth quarter 2004 and the World Bank’s steel price index was up 3.3 percent versus the fourth quarter 2004. We now expect material costs to be slightly higher than originally expected. We don’t expect steel prices to decline overall until the second half of 2005 at the earliest.
Material availability is increasing as supplier confidence and willingness to invest in capacity continues to improve. We are beginning to see improved delivery performances from the second half of 2004.
Steel casting and special bar quality steel availability continues to improve. This has allowed us to improve the flow of steel to the forge shops, machine shops and into our facilities.
Tires continue to be a challenge, although availability is improving. We are working with dealers, customers, and suppliers and are exercising a variety of alternatives including bias-for-radial substitutions, adding new suppliers, adding capacity and considering retreads in some applications.
Page 13
Q8: Do you still expect price realization to more than offset material cost increases?
A: Yes.
Q9: Is incentive compensation a factor in the increase in core operating costs for 2005?
A: Based on our latest outlook, incentive compensation is expected to be approximately 15 to 20 percent lower than in 2004.
Q10: What impact does Caterpillar expect from the American Jobs Creation Act of 2004?
A: The American Jobs Creation Act of 2004 signed by President Bush on October 22, 2004 repeals Extraterritorial Income Exclusion (ETI) benefits, which are phased out over 2005 and 2006. Caterpillar will receive 80 percent of the 2005 ETI benefit and 60 percent of the 2006 ETI benefit. After 2006, Caterpillar will receive no ETI benefit. The benefit of ETI was a reduction of approximately 5 percentage points on Caterpillar’s tax rate in 2003 and 2004. The anticipated impact of the ETI phase-out is reflected in the first quarter effective tax rate and our outlook.
We are currently studying the dividend repatriation provisions of the American Jobs Creation Act of 2004 and our cash needs around the world. We will make a decision on repatriation of non-U.S. earnings in the second quarter, and the potential impact has not been included in our first-quarter effective tax rate or our outlook.
Q11: Can you comment on Caterpillar’s financial strength and cash flow?
A:Caterpillar’s financial position is very strong. Our pension plans are well funded and stockholders are benefiting from both higher dividends and the share repurchase program. In the first quarter of 2005, we repurchased almost 3.9 million shares. We expect 2005 operating cash flow from the Machinery and Engines line of business to exceed 2004 levels even though inventories have risen because of higher sales volume and supply chain inefficiencies.
Q12: Are margins improving in this outlook?
A: Yes. Overall we expect consolidated operating profit as a percent of sales and revenues to improve to 10.7 percent. The improvements from volume and price realization are expected to more than offset changes in core operating costs.
GLOSSARY OF TERMS
| 1. | Consolidating Adjustments - Eliminations of transactions between Machinery and Engines and Financial Products. |
| 2. | Core Operating Costs - Machinery and Engines operating cost change adjusted for volume. It excludes the impact of currency and retirement benefits. |
Page 14
| 3. | Currency - With respect to sales and revenues, currency represents the translation impact on sales resulting from changes in foreign currency exchange rates versus the U.S. dollar. With respect to operating profit, currency represents the net translation impact on sales and operating costs resulting from changes in foreign currency exchange rates versus the U.S. dollar. With respect to profit before tax, currency represents the net translation impact on sales, operating costs and other income/expense resulting from changes in foreign currency exchange rates versus the U.S. dollar. Also included in the currency impact on other income/expense are the effects of currency forward and option contracts entered into by the company to reduce the risk of fluctuations in exchangerates and the net effect of changes in foreign currency exchange rates on our foreign currency assets and liabilities. Currency includes the impacts on sales and operating profit for the Machinery and Engines lines of business only; currency impacts on the Financial Products line of business are included in the Financial Products portions of the respective analyses. |
| 4. | EAME - Geographic region including Europe, Africa, the Middle East and the Commonwealth of Independent States (CIS). |
| 5. | Earning Assets - These assets consist primarily of total net finance receivables plus retained interests in securitized trade receivables, plus equipment on operating leases, less accumulated depreciation at Cat Financial. Net finance receivables represent the gross receivables amount less unearned income and the allowance for credit losses. |
| 6. | Engines- A principal line of business including the design, manufacture, marketing and sales of engines for Caterpillar machinery, electric power generation systems; on-highway vehicles and locomotives; marine, petroleum, construction, industrial, agricultural and other applications; and related parts. Reciprocating engines meet power needs ranging from 5 to over 22,000 horsepower (4 to over 16 200 kilowatts). Turbines range from 1,200 to 20,500 horsepower (900 to 15 000 kilowatts). |
| 7. | Financial Products - A principal line of business consisting primarily of Caterpillar Financial Services Corporation (Cat Financial), Caterpillar Insurance Holdings, Inc. (Cat Insurance), Caterpillar Power Ventures Corporation (Cat Power Ventures) and their respective subsidiaries. Cat Financial provides a wide range of financing alternatives to customers and dealers for Caterpillar machinery and engines, Solar gas turbines, as well as other equipment and marine vessels. Cat Financial also extends loans to customers and dealers. Cat Insurance provides various forms of insurance to customers and dealers to help support the purchase and lease of our equipment. Cat Power Ventures is an active investor in independent power projects using Caterpillar power generation equipment and services. |
| 8. | Latin America - Geographic region including the Central and South American countries and Mexico. |
| 9. | Machinery - A principal line of business which includes the design, manufacture, marketing and sales of construction, mining and forestry machinery - track and wheel tractors, track and wheel loaders, pipelayers, motor graders, wheel tractor-scrapers, track and wheel excavators, backhoe loaders, log skidders, log loaders, off-highway trucks, articulated trucks, paving products, telescopic handlers, skid steer loaders and related parts. Also includes logistics services for other companies. |
| 10. | Machinery and Engines- Due to the highly integrated nature of operations, represents the aggregate total of the Machinery and Engines lines of business and includes primarily our manufacturing, marketing and parts distribution operations. |
| 11. | Price Realization - The impact of net price changes excluding currency. |
| 12. | Retirement Benefits- Cost of defined benefit pension plans, defined contribution plans and retirement healthcare and life insurance. |
Page 15
| 13. | Sales Volume - With respect to sales and revenues, sales volume represents the impact of changes in the quantities sold for machines, engines and parts. With respect to operating profit, sales volume represents the impact of changes in the quantities sold for machines, engines and parts combined with the net operating profit impact of changes in the relative weighting of machines, engines and parts sales with respect to total sales. |
| 14. | 6 Sigma - On a technical level, 6 Sigma represents a measure of variation that achieves 3.4 defects per million opportunities. At Caterpillar, 6 Sigma represents a much broader cultural philosophy to drive continuous improvement throughout the value chain. It is a fact-based, data-driven methodology that we are using to improve processes, enhance quality, cut costs, grow our business and deliver greater value to our customers through Black Belt-led project teams. At Caterpillar, 6 Sigma goes beyond mere process improvement; it has become the way we work as teams to process business information, solve problems and manage our business successfully. |
NON-GAAP FINANCIAL MEASURES
The following definition is provided for “non-GAAP financial measures” in connection with Regulation G issued by the Securities and Exchange Commission. This non-GAAP financial measure has no standardized meaning prescribed by U.S. GAAP, and therefore, is unlikely to be comparable to the calculation of similar measures for other companies. Management does not intend this item to be considered in isolation or as a substitute for the related GAAP measure.
Machinery and Engines
Caterpillar defines Machinery and Engines as it is presented in the supplemental data as Caterpillar Inc. and its subsidiaries with Financial Products accounted for on the equity basis. Machinery and Engines information relates to the design, manufacture and marketing of our products. Financial Products information relates to the financing to customers and dealers for the purchase and lease of Caterpillar and other equipment. The nature of these businesses is different especially with regard to the financial position and cash flow items. Caterpillar management utilizes this presentation internally to highlight these differences. We also believe this presentation will assist readers in understanding our business. Pages 20-23 reconcile Machinery and Engines with Financial Products on the Equity Basis to Caterpillar Inc. Consolidated financial information.
* * *
The information included in the Outlook section is forward-looking and involves risks and uncertainties that could significantly affect expected results. A discussion of these risks and uncertainties is contained in Form 8-K filed with the Securities & Exchange Commission (SEC) on April 20, 2005. This filing is available on our website athttp://www.CAT.com/sec_filings.
Caterpillar's latest financial results and current outlook are also available via:
Telephone:
(800) 228-7717 (Inside the United States and Canada)
(858) 244-2080 (Outside the United States and Canada)
Internet:
http://www.CAT.com/investor
http://www.CAT.com/irwebcast (live broadcast/replays of quarterly conference call)
Caterpillar contact:
Ben Cordani
Corporate Public Affairs
(309) 675-5786
Cordani_Benjamin_S@CAT.com
Page 16
Caterpillar Inc. Condensed Consolidated Statement of Results of Operations (Unaudited) (Dollars in millions except per share data) | |||||||||
Three Months Ended | |||||||||
March 31, | |||||||||
2005 | 2004 | ||||||||
Sales and revenues: | |||||||||
Sales of Machinery and Engines | $ | 7,789 | $ | 6,002 | |||||
| Revenues of Financial Products | 550 | 478 | |||||||
Total sales and revenues | 8,339 | 6,480 | |||||||
Operating costs: | |||||||||
Cost of goods sold | 6,215 | 4,701 | |||||||
Selling, general and administrative expenses | 744 | 673 | |||||||
Research and development expenses | 241 | 231 | |||||||
Interest expense of Financial Products | 170 | 119 | |||||||
Other operating expenses | 213 | 188 | |||||||
Total operating costs | 7,583 | 5,912 | |||||||
Operating profit | 756 | 568 | |||||||
Interest expense excluding Financial Products | 65 | 57 | |||||||
Other income (expense) | 108 | 61 | |||||||
Consolidated profit before taxes | 799 | 572 | |||||||
Provision for income taxes | 232 | 158 | |||||||
Profit of consolidated companies | 567 | 414 | |||||||
Equity in profit (loss) of unconsolidated affiliated companies | 14 | 6 | |||||||
Profit | $ | 581 | $ | 420 | |||||
Profit per common share | $ | 1.70 | $ | 1.23 | |||||
Profit per common share - diluted1 | $ | 1.63 | $ | 1.19 | |||||
Weighted average common shares outstanding (millions) | |||||||||
- Basic | 342.1 | 342.6 | |||||||
- Diluted1 | 356.6 | 355.7 | |||||||
Cash dividends declared per common share | $ | - | $ | - | |||||
1Diluted by assumed exercise of stock options, using the treasury stock method. | |||||||||
Certain amounts from prior periods have been reclassified to conform to current financial statement presentation. | |||||||||
Page 17
Caterpillar Inc. | ||||||||||
Condensed Consolidated Statement of Financial Position | ||||||||||
(Unaudited) | ||||||||||
(Millions of dollars) | ||||||||||
Mar. 31, | Dec. 31, | |||||||||
2005 | 2004 | |||||||||
Assets | ||||||||||
| Current assets: | ||||||||||
| Cash and short-term investments | $ | 517 | $ | 445 | ||||||
| Receivables - trade and other | 7,517 | 7,459 | ||||||||
| Receivables - finance | 5,188 | 5,182 | ||||||||
| Deferred and refundable income taxes | 443 | 398 | ||||||||
| Prepaid expenses | 1,329 | 1,369 | ||||||||
| Inventories | 5,230 | 4,675 | ||||||||
| Total current assets | 20,224 | 19,528 | ||||||||
| Property, plant and equipment - net | 7,551 | 7,682 | ||||||||
| Long-term receivables - trade and other | 780 | 764 | ||||||||
| Long-term receivables - finance | 10,300 | 9,903 | ||||||||
| Investments in unconsolidated affiliated companies | 558 | 517 | ||||||||
| Deferred income taxes | 665 | 674 | ||||||||
| Intangible assets | 310 | 315 | ||||||||
| Goodwill | 1,450 | 1,450 | ||||||||
| Other assets | 2,321 | 2,258 | ||||||||
Total assets | $ | 44,159 | $ | 43,091 | ||||||
Liabilities | ||||||||||
| Current liabilities: | ||||||||||
| Short-term borrowings: | ||||||||||
| -- Machinery and Engines | $ | 101 | $ | 93 | ||||||
| -- Financial Products | 3,164 | 4,064 | ||||||||
| Accounts payable | 3,978 | 3,990 | ||||||||
| Accrued expenses | 1,800 | 1,847 | ||||||||
| Accrued wages, salaries and employee benefits | 1,437 | 1,730 | ||||||||
| Customer advances | 631 | 555 | ||||||||
| Dividends payable | - | 141 | ||||||||
Deferred and current income taxes payable | 416 | 259 | ||||||||
| Long-term debt due within one year: | ||||||||||
| -- Machinery and Engines | 29 | 6 | ||||||||
| -- Financial Products | 3,231 | 3,525 | ||||||||
| Total current liabilities | 14,787 | 16,210 | ||||||||
| Long-term debt due after one year: | ||||||||||
| -- Machinery and Engines | 3,819 | 3,663 | ||||||||
| -- Financial Products | 14,090 | 12,174 | ||||||||
| Liability for postemployment benefits | 2,984 | 2,986 | ||||||||
| Deferred income taxes and other liabilities | 687 | 591 | ||||||||
Total liabilities | 36,367 | 35,624 | ||||||||
Stockholders' equity | ||||||||||
| Common stock | 1,308 | 1,231 | ||||||||
| Treasury stock | (3,554 | ) | (3,277 | ) | ||||||
| Profit employed in the business | 10,518 | 9,937 | ||||||||
| Accumulated other comprehensive income | (480 | ) | (424 | ) | ||||||
Total stockholders' equity | 7,792 | 7,467 | ||||||||
Total liabilities and stockholders' equity | $ | 44,159 | $ | 43,091 | ||||||
Certain amounts from prior periods have been reclassified to conform to current financial statement presentation. | ||||||||||
Page 18
Caterpillar Inc. | |||||||||
Condensed Consolidated Statement of Cash Flow | |||||||||
(Unaudited) | |||||||||
(Millions of dollars) | |||||||||
Three Months Ended | |||||||||
March 31, | |||||||||
Cash flow from operating activities: | 2005 | 2004 | |||||||
Profit | $ | 581 | $ | 420 | |||||
| Adjustments for non-cash items: | |||||||||
Depreciation and amortization | 372 | 350 | |||||||
Other | (68 | ) | (37 | ) | |||||
| Changes in assets and liabilities: | |||||||||
Receivables - trade and other | (228 | ) | (2,498 | ) | |||||
Inventories | (555 | ) | (631 | ) | |||||
Accounts payable and accrued expenses | 96 | 243 | |||||||
Other - net | (19 | ) | (50 | ) | |||||
Net cash provided by (used for) operating activities | 179 | (2,203 | ) | ||||||
Cash flow from investing activities: | |||||||||
Capital expenditures -- excluding equipment leased to others | (165 | ) | (106 | ) | |||||
Expenditures for equipment leased to others | (238 | ) | (240 | ) | |||||
Proceeds from disposals of property,plant and equipment | 131 | 147 | |||||||
Additions to finance receivables | (2,251 | ) | (1,866 | ) | |||||
Collections of finance receivables | 1,597 | 1,472 | |||||||
Proceeds from the sale of finance receivables | 10 | - | |||||||
Collections of retained interests in securitized trade receivables | - | 2,001 | |||||||
Investments and acquisitions (net of cash acquired) | 1 | (13 | ) | ||||||
Other - net | (28 | ) | (6 | ) | |||||
Net cash provided by (used for) investing activities | (943 | ) | 1,389 | ||||||
Cash flow from financing activities: | |||||||||
Dividends paid | (141 | ) | (127 | ) | |||||
Common stock issued, including treasury shares reissued | 154 | 69 | |||||||
Treasury shares purchased | (357 | ) | (250 | ) | |||||
Proceeds from long-term debt issued | 2,513 | 1,808 | |||||||
Payments on long-term debt | (1,359 | ) | (913 | ) | |||||
Short-term borrowings - net | (3 | ) | 220 | ||||||
Net cash provided by financing activities | 807 | 807 | |||||||
Effect of exchange rate changes on cash | 29 | 33 | |||||||
Increase (decrease) in cash and short-term investments | 72 | 26 | |||||||
Cash and short-term investments at beginning of period | 445 | 342 | |||||||
Cash and short-term investments at end of period | $ | 517 | $ | 368 | |||||
All short-term investments, which consist primarily of highly liquid investments with original maturities of three months or less, are considered to be cash equivalents. | |||||||||
Non-cash operating and investing activities: | |||||||||
| Trade receivables of $0 and $2,346 million were exchanged for retained interest in securitized trade receivables during the three months ended March 31, 2005 and 2004, respectively. | |||||||||
Certain amounts from prior periods have been reclassified to conform to current financial statement presentation. | |||||||||
Page 19
Caterpillar Inc. Supplemental Data for Results of Operations For The Three Months Ended March 31, 2005 (Unaudited) (Millions of dollars) | |||||||||||||||||
Supplemental Consolidating Data | |||||||||||||||||
Consolidated | Machinery and Engines 1 | Financial Products | Consolidating Adjustments | ||||||||||||||
Sales and revenues: | |||||||||||||||||
Sales of Machinery and Engines | $ | 7,789 | $ | 7,789 | $ | - | $ | - | |||||||||
Revenues of Financial Products | 550 | - | 612 | (62 | )2 | ||||||||||||
Total sales and revenues | 8,339 | 7,789 | 612 | (62 | ) | ||||||||||||
Operating costs: | |||||||||||||||||
Cost of goods sold | 6,215 | 6,215 | - | - | |||||||||||||
Selling, general and administrative expenses | 744 | 648 | 107 | (11 | )3 | ||||||||||||
Research and development expenses | 241 | 241 | - | - | |||||||||||||
Interest expense of Financial Products | 170 | - | 173 | (3 | )4 | ||||||||||||
Other operating expenses | 213 | 6 | 208 | (1 | )3 | ||||||||||||
Total operating costs | 7,583 | 7,110 | 488 | (15 | ) | ||||||||||||
Operating profit | 756 | 679 | 124 | (47 | ) | ||||||||||||
Interest expense excluding Financial Products | 65 | 66 | - | (1 | )4 | ||||||||||||
Other income (expense) | 108 | 54 | 8 | 46 | 5 | ||||||||||||
Consolidated profit before taxes | 799 | 667 | 132 | - | |||||||||||||
Provision for income taxes | 232 | 186 | 46 | - | |||||||||||||
Profit of consolidated companies | 567 | 481 | 86 | - | |||||||||||||
Equity in profit (loss) of unconsolidated affiliated companies | 14 | 12 | 2 | - | |||||||||||||
Equity in profit of Financial Products' subsidiaries | - | 88 | - | (88 | )6 | ||||||||||||
Profit | $ | 581 | $ | 581 | $ | 88 | $ | (88 | ) | ||||||||
1Represents Caterpillar Inc. and its subsidiaries with Financial Products accounted for on the equity basis. | |||||||||||||||||
2Elimination of Financial Products revenues earned from Machinery and Engines. | |||||||||||||||||
3Elimination of net expenses recorded by Machinery and Engines paid to Financial Products. | |||||||||||||||||
4Elimination of interest expense recorded between Financial Products and Machinery and Engines. | |||||||||||||||||
5Elimination of discount recorded by Machinery and Engines on receivables sold to Financial Products and of interest earned between Machinery and Engines and Financial Products. | |||||||||||||||||
6Elimination of Financial Products profit due to equity method of accounting. | |||||||||||||||||
Page 20
Caterpillar Inc. Supplemental Data for Results of Operations For The Three Months Ended March 31, 2004 (Unaudited) (Millions of dollars) | ||||||||||||||||||
Supplemental Consolidating Data | ||||||||||||||||||
Consolidated | Machinery and Engines1 | Financial Products | Consolidating Adjustments | |||||||||||||||
Sales and revenues: | ||||||||||||||||||
Sales of Machinery and Engines | $ | 6,002 | $ | 6,002 | $ | - | $ | - | ||||||||||
Revenues of Financial Products | 478 | - | 517 | (39 | )2 | |||||||||||||
Total sales and revenues | 6,480 | 6,002 | 517 | (39 | ) | |||||||||||||
Operating costs: | ||||||||||||||||||
Cost of goods sold | 4,701 | 4,701 | - | - | ||||||||||||||
Selling, general and administrative expenses | 673 | 586 | 99 | (12 | )3 | |||||||||||||
Research and development expenses | 231 | 231 | - | - | ||||||||||||||
Interest expense of Financial Products | 119 | - | 122 | (3 | )4 | |||||||||||||
Other operating expenses | 188 | 2 | 185 | 1 | 3 | |||||||||||||
Total operating costs | 5,912 | 5,520 | 406 | (14 | ) | |||||||||||||
Operating profit | 568 | 482 | 111 | (25 | ) | |||||||||||||
Interest expense excluding Financial Products | 57 | 58 | - | (1 | )4 | |||||||||||||
Other income (expense) | 61 | 34 | 3 | 24 | 5 | |||||||||||||
Consolidated profit before taxes | 572 | 458 | 114 | - | ||||||||||||||
Provision for income taxes | 158 | 119 | 39 | - | ||||||||||||||
Profit of consolidated companies | 414 | 339 | 75 | - | ||||||||||||||
Equity in profit (loss) of unconsolidated affiliated companies | 6 | 5 | 1 | - | ||||||||||||||
Equity in profit of Financial Products' subsidiaries | - | 76 | - | (76 | )6 | |||||||||||||
Profit | $ | 420 | $ | 420 | $ | 76 | $ | (76 | ) | |||||||||
1Represents Caterpillar Inc. and its subsidiaries with Financial Products accounted for on the equity basis. | ||||||||||||||||||
2Elimination of Financial Products revenues earned from Machinery and Engines. | ||||||||||||||||||
3Elimination of net expenses recorded by Machinery and Engines paid to Financial Products. | ||||||||||||||||||
4Elimination of interest expense recorded between Financial Products and Machinery and Engines. | ||||||||||||||||||
5Elimination of discount recorded by Machinery and Engines on receivables sold to Financial Products and of interest earned between Machinery and Engines and Financial Products. | ||||||||||||||||||
6Elimination of Financial Products profit due to equity method of accounting. | ||||||||||||||||||
Certain amounts from prior periods have been reclassified to conform to 2005 financial statement presentation. | ||||||||||||||||||
Page 21
Caterpillar Inc. Supplemental Data for Cash Flow For The Three Months Ended March 31, 2005 (Unaudited) (Millions of dollars) | ||||||||||||||||||
Supplemental Consolidating Data | ||||||||||||||||||
Consolidated | Machinery and Engines1 | Financial Products | Consolidating Adjustments | |||||||||||||||
Cash flow from operating activities: | ||||||||||||||||||
Profit | $ | 581 | $ | 581 | $ | 88 | $ | (88 | )2 | |||||||||
| Adjustments for non-cash items: | ||||||||||||||||||
Depreciation and amortization | 372 | 213 | 159 | - | ||||||||||||||
Undistributed profit of Financial Products | - | (88 | ) | - | 88 | 3 | ||||||||||||
Other | (68 | ) | (69 | ) | (46 | ) | 47 | 4 | ||||||||||
| Changes in assets and liabilities: | ||||||||||||||||||
Receivables - trade and other | (228 | ) | (216 | ) | 24 | (36 | )4/5 | |||||||||||
Inventories | (555 | ) | (555 | ) | - | - | ||||||||||||
Accounts payable and accrued expenses | 96 | 48 | 79 | (31 | )4 | |||||||||||||
Other - net | (19 | ) | (28 | ) | 9 | - | ||||||||||||
Net cash provided by (used for) operating activities | 179 | (114 | ) | 313 | (20 | ) | ||||||||||||
Cash flow from investing activities: | ||||||||||||||||||
Capital expenditures - excluding equipment leased to others | (165 | ) | (158 | ) | (7 | ) | - | |||||||||||
Expenditures for equipment leased to others | (238 | ) | - | (238 | ) | - | ||||||||||||
Proceeds from disposals of property, plant and equipment | 131 | 4 | 127 | - | ||||||||||||||
Additions to finance receivables | (2,251 | ) | - | (7,090 | ) | 4,839 | 5 | |||||||||||
Collections of finance receivables | 1,597 | - | 6,414 | (4,817 | )5 | |||||||||||||
Proceeds from the sale of finance receivables | 10 | - | 10 | - | ||||||||||||||
Net intercompany borrowings | - | (109 | ) | (569 | ) | 678 | 6 | |||||||||||
Investments and acquisitions (net of cash acquired) | 1 | 1 | - | - | ||||||||||||||
Other - net | (28 | ) | (8 | ) | (20 | ) | - | |||||||||||
Net cash used for investing activities | (943 | ) | (270 | ) | (1,373 | ) | 700 | |||||||||||
Cash flow from financing activities: | ||||||||||||||||||
Dividends paid | (141 | ) | (141 | ) | - | - | ||||||||||||
Common stock issued, including treasury shares reissued | 154 | 154 | - | - | ||||||||||||||
Treasury shares purchased | (357 | ) | (357 | ) | - | - | ||||||||||||
Net intercompany borrowings | - | 569 | 109 | (678 | )6 | |||||||||||||
Proceeds from long-term debt issued | 2,513 | 194 | 2,319 | |||||||||||||||
Payments on long-term debt | (1,359 | ) | - | (1,359 | ) | - | ||||||||||||
Short-term borrowings - net | (3 | ) | 8 | (11 | ) | - | ||||||||||||
Net cash provided by financing activities | 807 | 427 | 1,058 | (678 | ) | |||||||||||||
Effect of exchange rate changes on cash | 29 | 33 | (2 | ) | (2 | )7 | ||||||||||||
Increase (decrease) in cash and short-term investments | 72 | 76 | (4 | ) | - | |||||||||||||
Cash and short-term investments at beginning of period | 445 | 270 | 175 | - | ||||||||||||||
Cash and short-term investments at end of period | $ | 517 | $ | 346 | $ | 171 | $ | - | ||||||||||
1Represents Caterpillar Inc. and its subsidiaries with Financial Products accounted for on the equity basis. | ||||||||||||||||||
2Elimination of Financial Products profit after tax due to equity method of accounting. | ||||||||||||||||||
3Non-cash adjustment for the undistributed earnings from Financial Products. | ||||||||||||||||||
4Elimination of non-cash adjustments and changes in assets and liabilities related to consolidated reporting. | ||||||||||||||||||
5Reclassification of Cat Financial’s cash flow activity from investing to operating for receivables that arose from the sale of inventory. | ||||||||||||||||||
6Net proceeds and payments to/from Machinery and Engines and Financial Products. | ||||||||||||||||||
7Elimination of the effect of exchange on intercompany balances. | ||||||||||||||||||
Page 22
Caterpillar Inc. Supplemental Data for Cash Flow For The Three Months Ended March 31, 2004 (Unaudited) (Millions of dollars) | ||||||||||||||||||
Supplemental Consolidating Data | ||||||||||||||||||
Consolidated | Machinery and Engines1 | Financial Products | Consolidating Adjustments | |||||||||||||||
Cash flow from operating activities: | ||||||||||||||||||
Profit | $ | 420 | $ | 420 | $ | 76 | $ | (76 | )2 | |||||||||
| Adjustments for non-cash items: | ||||||||||||||||||
Depreciation and amortization | 350 | 202 | 148 | |||||||||||||||
Undistributed profit of Financial Products | - | (76 | ) | - | 76 | 3 | ||||||||||||
Other | (37 | ) | (25 | ) | (34 | ) | 22 | 4 | ||||||||||
| Changes in assets and liabilities: | ||||||||||||||||||
Receivables - trade and other | (2,498 | ) | (143 | ) | 96 | (2,451 | )4/5 | |||||||||||
Inventories | (631 | ) | (631 | ) | - | - | ||||||||||||
Accounts payable and accrued expenses | 243 | 211 | (39 | ) | 71 | 4 | ||||||||||||
Other - net | (50 | ) | (107 | ) | 30 | 27 | 4 | |||||||||||
Net cash provided by (used for) operating activities | (2,203 | ) | (149) | 277 | (2,331 | ) | ||||||||||||
Cash flow from investing activities: | ||||||||||||||||||
Capital expenditures - excluding equipment leased to others | (106 | ) | (101 | ) | (5 | ) | - | |||||||||||
Expenditures for equipment leased to others | (240 | ) | - | (240 | ) | - | ||||||||||||
Proceeds from disposals of property, plant and equipment | 147 | 7 | 140 | - | ||||||||||||||
Additions to finance receivables | (1,866 | ) | - | (3,394 | ) | 1,528 | 5 | |||||||||||
Collections of finance receivables | 1,472 | - | 2,731 | (1,259 | )5 | |||||||||||||
Proceeds from the sale of finance receivables | - | - | 264 | (264 | )5 | |||||||||||||
Additions to retained interests in securitized trade receivables | - | - | (2,322 | ) | 2,322 | 6 | ||||||||||||
Collections of retained interests in securitizedtrade receivables | 2,001 | - | 2,001 | - | ||||||||||||||
Net intercompany borrowings | - | 209 | (6 | ) | (203 | )7 | ||||||||||||
Investments and acquisitions (net of cash acquired) | (13 | ) | (13 | ) | - | - | ||||||||||||
Other - net | (6 | ) | (5 | ) | (1 | ) | - | |||||||||||
Net cash provided by (used for) investing activities | 1,389 | 97 | (832 | ) | 2,124 | |||||||||||||
Cash flow from financing activities: | ||||||||||||||||||
| Dividends paid | (127 | ) | (127 | ) | - | - | ||||||||||||
| Common stock issued, including treasury shares reissued | 69 | 69 | - | - | ||||||||||||||
Treasury shares purchased | (250 | ) | (250 | ) | - | - | ||||||||||||
Net intercompany borrowings | - | 6 | (209 | ) | 203 | 7 | ||||||||||||
Proceeds from long-term debt issued | 1,808 | 255 | 1,553 | - | ||||||||||||||
Payments on long-term debt | (913 | ) | (25 | ) | (888 | ) | - | |||||||||||
Short-term borrowings - net | 220 | 91 | 129 | - | ||||||||||||||
Net cash provided by financing activities | 807 | 19 | 585 | 203 | ||||||||||||||
Effect of exchange rate changes on cash | 33 | 33 | (4 | ) | 4 | 8 | ||||||||||||
Increase (decrease) in cash and short-term investments | 26 | - | 26 | - | ||||||||||||||
Cash and short-term investments at beginning of period | 342 | 220 | 122 | - | ||||||||||||||
Cash and short-term investments at end of period | $ | 368 | $ | 220 | $ | 148 | $ | - | ||||||||||
1Represents Caterpillar Inc. and its subsidiaries with Financial Products accounted for on the equity basis. | ||||||||||||||||||
2Elimination of Financial Products profit after tax due to equity method of accounting. | ||||||||||||||||||
3Non-cash adjustment for the undistributed earnings from Financial Products. | ||||||||||||||||||
4Elimination of non-cash adjustments and changes in assets and liabilities related to consolidated reporting. Receivables amounts include adjustment for consolidated non-cash receipt of retained interests in securitized trade receivables. | ||||||||||||||||||
5Reclassification of Cat Financial’s cash flow activity from investing to operating for receivables that arose from the sale of inventory. | ||||||||||||||||||
6Elimination of Cat Financial’s additions to retained interests in securitized trade receivables that arose from an intercompany purchase of receivables. | ||||||||||||||||||
7Net proceeds and payments to/from Machinery and Engines and Financial Products. | ||||||||||||||||||
8Elimination of the effect of exchange on intercompany balances. | ||||||||||||||||||
| Certain amounts have been reclassified to conform to the 2005 financial statement presentation. | ||||||||||||||||||
Page 23
SAFE HARBOR STATEMENT UNDER THE SECURITIES LITIGATION REFORM ACT OF 1995
Certain statements contained in our Management's Discussion and Analysis are forward-looking and involve uncertainties that could significantly impact results. The words "believes," "expects," "estimates," "anticipates," "will be", "should" and similar words or expressions identify forward-looking statements made on behalf of Caterpillar. Uncertainties include factors that affect international businesses, as well as matters specific to the company and the markets it serves.
World Economic Factors
Our projection for about 3.5 percent growth in the world economy assumes central banks will cautiously raise interest rates so as not to slow growth too much. Low interest rates, and continued good economic growth, should encourage further growth in construction and mining. Should central banks raise interest rates aggressively, both the world economic recovery and our Machinery and Engines sales likely would be weaker.
The U.S. economy is growing near a three percent rate, which up to now has not created an inflation problem. While the Federal Reserve has raised interest rates, we assume the continuation of moderate growth and low inflation will result in interest rates of about 4 percent by the end of 2005. Long-term interest rates are expected to rise less than short-term rates. That environment should support further growth in construction and manufacturing, helping to keep commodity prices favorable. Should financial conditions tighten noticeably, causing economic growth to slow below 3 percent, expected improvements in Machinery and Engines sales likely would be lower than projected.
Our projection of increased sales of Machinery and Engines in Europe, Africa, Middle East (EAME) assumes that low interest rates will allow slightly faster economic growth in Europe and that favorable commodity prices will extend healthy recoveries in both Africa and Middle East (AME) and the CIS. Key risks are that strong currencies or interest rate increases could push the European economy into recession or that commodity prices collapse. Those developments would negatively impact our results.
Favorable commodity prices, increased capital inflows and an improved foreign debt situation are expected to contribute to about 4 percent growth in Latin America. As a result, we project that both mining production and construction spending will increase, supporting an increase in Machinery and Engines sales. This forecast is vulnerable to a significant weakening in commodity prices, slowing in world economic growth, widespread increases in interest rates or political disruptions.
In Asia/Pacific, we project sales growth in Australia, India and the developing Asian economies will offset a further decline in China. Critical assumptions are continued growth in coal demand, low domestic interest rates in most countries, further gains in exports and continued good economic growth in China. Some developments that could lower expected results include reduced demand for thermal and coking coal, significant revaluations of regional currencies, restrictions on regional exports and sharp interest rate hikes, particularly in China.
Commodity Prices
Commodities represent a significant sales opportunity, with prices and production as key drivers. Prices have improved sharply over the past two years and our outlook assumes continued growth in world industrial production will cause metals prices to remain high enough in 2005 to encourage further mine investment. Any unexpected weakening in world industrial production or construction, however, could cause prices to drop sharply to the detriment of our results.
Coal production and prices improved last year and our sales have benefited. We expect these trends to continue in 2005. Should coal prices soften, due to a slowing in world economic growth or otherwise, the ongoing sales recovery would be vulnerable.
Oil and natural gas prices increased sharply over the past two years due to strong demand and high capacity usage. Higher energy prices have not halted economic recoveries since strong demand boosted prices and world production increased. High prices are encouraging more exploration and development and we expect increased production in 2005 will constrain price increases. However, should significant supply cuts occur, such as from OPEC production cuts or political unrest in a major producing country, the resulting oil shortages and price spikes could slow economies, potentially with a depressing impact on our sales.
Page 24
Monetary and Fiscal Policies
For most companies operating in a global economy, monetary and fiscal policies implemented in the United States and abroad could have a significant impact on economic growth, and accordingly, demand for our product. In general, higher than expected interest rates, reductions in government spending, higher taxes, excessive currency movements, and uncertainty over key policies are some factors likely to lead to slower economic growth and lower industry demand.
With economic data looking more favorable, central banks in developed countries have started raising interest rates from the lowest rates in decades. Our outlook assumes that central banks will take great care to ensure that economic recoveries continue and that interest rates will remain low throughout the forecast period. Should central banks raise interest rates more aggressively than anticipated, both economic growth and our sales could suffer.
Budget deficits in many countries have increased, which has limited the ability of governments to boost economies with tax cuts and more spending. Our outlook assumes that governments will not aggressively raise taxes and slash spending to deal with their budget imbalances. Such actions could disrupt growth and negatively affect our sales.
Political Factors
Political factors in the United States and abroad can impact global companies. Our outlook assumes that no major disruptive changes in economic policies occur in either the United States or other major economies. Significant changes in either taxing or spending policies could reduce activities in sectors important to our businesses, thereby reducing sales.
Our outlook assumes that there will be no additional significant military conflicts in either North Korea or the Middle East in the forecast period. Such military conflicts could severely disrupt sales into countries affected, as well as nearby countries.
Our outlook also assumes that there will be no major terrorist attacks. If there is a major terrorist attack, confidence could be undermined, potentially causing a sharp drop in economic activities and our sales. Attacks in major developed economies would be the most disruptive.
Our outlook assumes that efforts by countries to increase their exports will not result in retaliatory countermeasures by other countries to block such exports, particularly in the Asia/Pacific region. Our outlook includes a negative impact from the phase-out of the Extraterritorial Income Exclusion (ETI) as enacted by the American Jobs Creation Act of 2004 (the Act). However, our outlook does not include any impact from the provision of the Act allowing preferential tax treatment of the repatriation of non-U.S. earnings in 2005. Further, our outlook assumes any other tax law changes will not negatively impact our provision for income taxes.
Currency Fluctuations
The company has costs and revenues in many currencies and is therefore exposed to risks arising from currency fluctuations. Our outlook assumes no significant changes in currency values from current rates. Should currency rates change sharply, economic activity and our results could be negatively impacted.
The company's largest manufacturing presence is in the United States, so any unexpected strengthening of the dollar tends to raise the foreign currency costs to our end users and reduce our global competitiveness.
Dealer Practices
The company sells primarily through an independent dealer network. Dealers carry inventories of both new and rental equipment and adjust those inventories based on their assessments of future needs. Such adjustments can impact our results either positively or negatively. The current outlook assumes dealers will increase inventories in line with higher deliveries. Should dealers control inventories more tightly, our sales would be lower.
Page 25
Financial Products Division Factors
Inherent in the operation of Cat Financial is the credit risk associated with its customers. The creditworthiness of each customer, and the rate of delinquencies, repossessions and net losses on customer obligations are directly impacted by several factors, including, but not limited to, relevant industry and economic conditions, the availability of capital, the experience and expertise of the customer's management team, commodity prices, political events, and the sustained value of the underlying collateral. Additionally, interest rate movements create a degree of risk to our operations by affecting the amount of our interest payments and the value of our fixed rate debt. Our match funding policy manages interest rate risk by matching the interest rate profile (fixed rate or floating rate) of our debt portfolio with the interest rate profile of our receivables portfolio within certain parameters. To achieve our match funding objectives, we issue debt with similar interest rate profile to our receivables and also use interest rate swap agreements to manage our interest rate risk exposure to interest rate changes and in some cases to lower our cost of borrowed funds. If interest rates move upward more sharply than anticipated, our financial results could be negatively impacted. With respect to our insurance and investment management operations, changes in the equity and bond markets could cause an impairment of the value of our investment portfolio, thus requiring a negative adjustment to earnings.
Other Factors
The rate of infrastructure spending, housing starts, commercial construction and mining plays a significant role in the company's results. Our products are an integral component of these activities and as these activities increase or decrease in the United States or abroad, demand for our products may be significantly impacted.
Projected cost savings or synergies from alliances with new partners could also be negatively impacted by a variety of factors. These factors could include, among other things, higher than expected wages, energy and/or material costs, and/or higher than expected financing costs due to unforeseen changes in tax, trade, environmental, labor, safety, payroll or pension policies in any of the jurisdictions in which the alliances conduct their operations.
The International Association of Machinists (IAM) represents 1,999 employees under labor agreements expiring on April 30, 2005, and May 29, 2005. Based on our historical experience during periods when labor unrest or work stoppage by union-represented employees has occurred, we do not expect that the occurrence of such events, if any, arising in connection with the expiration of these agreements will have a material impact on our operations or results.
Results may be impacted positively or negatively by changes in the sales mix. Our outlook assumes a certain geographic mix of sales as well as a product mix of sales. If actual results vary from this projected geographic and product mix of sales, our results could be negatively impacted.
The company operates in a highly competitive environment and our outlook depends on a forecast of the company's share of industry sales. An unexpected reduction in that share could result from pricing or product strategies pursued by competitors, unanticipated product or manufacturing difficulties, a failure to price the product competitively, or an unexpected buildup in competitors' new machine or dealer owned rental fleets, leading to severe downward pressure on machine rental rates and/or used equipment prices.
The environment remains competitive from a pricing standpoint. Our 2005 sales outlook assumes that the company will be successful in implementing worldwide machine price increases communicated to dealers with effective dates of January 3, 2005 and May 2, 2005. While we expect that the environment will absorb these price actions, delays in the marketplace acceptance would negatively impact our results. Moreover, additional price discounting to maintain our competitive position could result in lower than anticipated price realization.
Page 26
In general, our results are sensitive to changes in economic growth, particularly those originating in construction, mining and energy. Developments reducing such activities also tend to lower our sales. In addition to the factors mentioned above, our results could be negatively impacted by any of the following:
| · | Any sudden drop in consumer or business confidence; |
| · | Delays in legislation needed to fund public construction; |
| · | Regulatory or legislative changes that slow activity in key industries; and/or |
| · | Unexpected collapses in stock markets. |
This discussion of uncertainties is by no means exhaustive, but is designed to highlight important factors that may impact our outlook. Obvious factors such as general economic conditions throughout the world do not warrant further discussion, but are noted to further emphasize the myriad of contingencies that may cause the company's actual results to differ from those currently anticipated.
Page 27