UNITED STATES SECURITIES AND EXCHANGE COMMISSION Washington, D.C. 20549 |
 |
FORM 10-Q |
[X] QUARTERLY REPORT PURSUANT TO SECTION 13 OR 15(d) OF THE SECURITIES EXCHANGE ACT OF 1934 For the quarterly period ended March 31, 2005 OR [ ] TRANSITION REPORT PURSUANT TO SECTION 13 OR 15(d) OF THE SECURITIES EXCHANGE ACT OF 1934 For the transition period from ________________ to ________________ |
Commission File Number: 1-768 |
CATERPILLAR INC. (Exact name of registrant as specified in its charter) |
Delaware (State or other jurisdiction of incorporation) | 37-0602744 (IRS Employer I.D. No.) |
100 NE Adams Street, Peoria, Illinois (Address of principal executive offices) | 61629 (Zip Code) |
Registrant's telephone number, including area code: (309) 675-1000 |
Indicate by check mark whether the Registrant (1) has filed all reports required to be filed by Section 13 or 15(d) of the Securities Exchange Act of 1934 during the preceding 12 months (or for such shorter period that the Registrant was required to file such reports), and (2) has been subject to such filing requirements for the past 90 days. Yes [ X ] No [ ]. Indicate by check mark whether the Registrant is an accelerated filer (as defined in Rule 12b-2 of the Act). Yes [ X ] No [ ] |
| At March 31, 2005, 341,694,552 shares of common stock of the Registrant were outstanding. |
1
Part I. FINANCIAL INFORMATION
Item 1. Financial Statements
Caterpillar Inc. Consolidated Statement of Results of Operations (Unaudited) (Dollars in millions except per share data)
|
| | Three Months Ended |
| | March 31, |
| | 2005 | | 2004 |
|
| |
|
Sales and revenues: | | | | | | | |
| Sales of Machinery and Engines | $ | 7,789 | | | $ | 6,002 | |
| Revenues of Financial Products | | 550 | | | | 478 | |
| |
|
|
| |
|
|
|
| Total sales and revenues | | 8,339 | | | | 6,480 | |
| | | | | | | | |
Operating costs: | | | | | | | |
| Cost of goods sold | | 6,215 | | | | 4,701 | |
| Selling, general and administrative expenses | | 744 | | | | 673 | |
| Research and development expenses | | 241 | | | | 231 | |
| Interest expense of Financial Products | | 170 | | | | 119 | |
| Other operating expenses | | 213 | | | | 188 | |
| |
|
|
| |
|
|
|
| Total operating costs | | 7,583 | | | | 5,912 | |
| |
|
|
| |
|
|
|
Operating profit | | 756 | | | | 568 | |
| | | | | | | | |
| Interest expense excluding Financial Products | | 65 | | | | 57 | |
| Other income (expense) | | 108 | | | | 61 | |
| |
|
|
| |
|
|
|
Consolidated profit before taxes | | 799 | | | | 572 | |
| | | | | | | | |
| Provision for income taxes | | 232 | | | | 158 | |
| |
|
|
| |
|
|
|
| Profit of consolidated companies | | 567 | | | | 414 | |
| | | | | | | | |
| Equity in profit (loss) of unconsolidated affiliated companies | | 14 | | | | 6 | |
| |
|
|
| |
|
|
|
Profit | $ | 581 | | | $ | 420 | |
|
|
|
| |
|
|
|
|
Profit per common share | $ | 1.70 | | | $ | 1.23 | |
| | | | | | | | |
Profit per common share - diluted1 | $ | 1.63 | | | $ | 1.19 | |
| | | | | | | | | |
Weighted average common shares outstanding (millions) | | | | | | | |
| | - Basic | | 342.1 | | | | 342.6 | |
| | - Diluted1 | | 356.6 | | | | 355.7 | |
| | | | | | | | |
Cash dividends declared per common share | $ | - | | | $ | - | |
1 Diluted by assumed exercise of stock options, using the treasury stock method. |
See accompanying notes to Consolidated Financial Statements. |
|
Caterpillar Inc. Consolidated Statement of Changes in Stockholders' Equity For the Three Months Ended (Unaudited) (Dollars in millions)
|
| | March 31, 2005 | | March 31, 2004 |
|
| |
|
Common stock: | | | | | | | | | | | | | | | |
| | Balance at beginning of period | $ | 1,231 | | | | | | | $ | 1,059 | | | | | |
| | Common shares issued from treasury stock | | 77 | | | | | | | | 42 | | | | | |
| |
|
|
| | | | | |
|
|
| | | | |
| | Balance at end of period | | 1,308 | | | | | | | | 1,101 | | | | | |
| |
|
|
| | | | | |
|
|
| | | | |
Treasury stock: | | | | | | | | | | | | | | | |
| | Balance at beginning of period | | (3,277 | ) | | | | | | | (2,914 | ) | | | | |
| | Shares issued: 2005 - 2,632,203; 2004 - 1,350,091 | | 80 | | | | | | | | 35 | | | | | |
| | Shares repurchased: 2005 - 3,874,600; 2004 - 3,210,000 | | (357 | ) | | | | | | | (250 | ) | | | | |
| |
|
|
| | | | | |
|
|
| | | | |
| | Balance at end of period | | (3,554 | ) | | | | | | | (3,129 | ) | | | | |
| |
|
|
| | | | | |
|
|
| | | | |
Profit employed in the business: | | | | | | | | | | | | | | | |
| | Balance at beginning of period | | 9,937 | | | | | | | | 8,450 | | | | | |
| | Profit | | 581 | | | $ | 581 | | | | 420 | | | $ | 420 | |
| | Dividends declared | | - | | | | | | | | - | | | | | |
| |
|
|
| | | | | |
|
|
| | | | |
| | Balance at end of period | | 10,518 | | | | | | | | 8,870 | | | | | |
| |
|
|
| | | | | |
|
|
| | | | |
Accumulated other comprehensive income: | | | | | | | | | | | | | | | |
| | Foreign currency translation adjustment: | | | | | | | | | | | | | | | |
| | | Balance at beginning of period | | 489 | | | | | | | | 348 | | | | | |
| | | Aggregate adjustment for period | | (26 | ) | | | (26 | ) | | | 2 | | | | 2 | |
| | |
|
|
| | | | | |
|
|
| | | | |
| | | Balance at end of period | | 463 | | | | | | | | 350 | | | | | |
| | |
|
|
| | | | | |
|
|
| | | | |
| | Minimum pension liability adjustment - consolidated companies: | | | | | | | | | | | | | | | |
| | | Balance at beginning of period (net of tax of: 2005-$485; 2004-$460) | | (993 | ) | | | | | | | (934 | ) | | | | |
| | | Aggregate adjustment for period
(net of tax of: 2005- $24) | | (45 | ) | | | (45 | ) | | | - | | | | - | |
| | |
|
|
| | | | | |
|
|
| | | | |
| | | Balance at end of period (net of tax of: 2005-$509; 2004-$460) | | (1,038 | ) | | | | | | | (934 | ) | | | | |
| | |
|
|
| | | | | |
|
|
| | | | |
| | Minimum pension liability adjustment - unconsolidated companies: | | | | | | | | | | | | | | | |
| | | Balance at beginning of period | | (48 | ) | | | | | | | (48 | ) | | | | |
| | | Aggregate adjustment for period | | (3 | ) | | | (3 | ) | | | (1 | ) | | | (1 | ) |
| | |
|
|
| | | | | |
|
|
| | | | |
| | | Balance at end of period | | (51 | ) | | | | | | | (49 | ) | | | | |
| | |
|
|
| | | | | |
|
|
| | | | |
| | Derivative financial instruments: | | | | | | | | | | | | | | | |
| | | Balance at beginning of period (net of tax of: 2005-$58; 2004-$54) | | 110 | | | | | | | | 104 | | | | | |
| | | Gains/(losses) deferred during period (net of tax of: 2005-$1; 2004-$11) | | (2 | ) | | | (2 | ) | | | 21 | | | | 21 | |
| | | (Gains)/losses reclassified to earnings during period (net of tax of: 2005-$8; 2004-$5) | | (18 | ) | | | (18 | ) | | | (10 | ) | | | (10 | ) |
| | |
|
|
| | | | | |
|
|
| | | | |
| | | Balance at end of period (net of tax of: 2005-$49; 2004-$60) | | 90 | | | | | | | | 115 | | | | | |
| | |
|
|
| | | | | |
|
|
| | | | |
| | Available-for-sale securities: | | | | | | | | | | | | | | | |
| | | Balance at beginning of period (net of tax of: 2005-$10; 2004-$7) | | 18 | | | | | | | | 13 | | | | | |
| | | Gains/(losses) deferred during period (net of tax of: 2005-$4; 2004-$3) | | (7 | ) | | | (7 | ) | | | 6 | | | | 6 | |
| | | (Gains)/losses reclassified to earnings during period (net of tax of 2005-$ 0; 2004-$1) | | - | | | | - | | | | (1 | ) | | | (1 | ) |
| | |
|
|
| | | | | |
|
|
| | | | |
| | | Balance at end of period (net of tax of: 2005-$6; 2004-$10) | | 11 | | | | | | | | 18 | | | | | |
| | |
|
|
| | | | | |
|
|
| | | | |
Total accumulated other comprehensive income | | (525 | ) | | | | | | | (500 | ) | | | | |
|
|
|
| | | | | |
|
|
| | | | |
| | Comprehensive income | | | | | $ | 480 | | | | | | | $ | 437 | |
| | | | | |
|
|
| | | | | |
|
|
|
Stockholders' equity at end of period | $ | 7,747 | | | | | | | $ | 6,342 | | | | | |
|
|
|
| | | | | |
|
|
| | | | |
See accompanying notes to Consolidated Financial Statements. |
|
Caterpillar Inc. Consolidated Statement of Financial Position (Unaudited) (Dollars in millions)
|
| | | | March 31, 2005 | | December 31, 2004 |
| | |
| |
|
Assets | | | | | | | |
| | Current assets: | | | | | | | |
| | | Cash and short-term investments | $ | 517 | | | $ | 445 | |
| | | Receivables - trade and other | | 7,517 | | | | 7,459 | |
| | | Receivables - finance | | 5,188 | | | | 5,182 | |
| | | Deferred and refundable income taxes | | 443 | | | | 398 | |
| | | Prepaid expenses | | 1,329 | | | | 1,369 | |
| | | Inventories | | 5,230 | | | | 4,675 | |
| | |
|
|
| |
|
|
|
| | Total current assets | | 20,224 | | | | 19,528 | |
| | | | | | | | | |
| | Property, plant and equipment - net | | 7,551 | | | | 7,682 | |
| | Long-term receivables - trade and other | | 780 | | | | 764 | |
| | Long-term receivables - finance | | 10,300 | | | | 9,903 | |
| | Investments in unconsolidated affiliated companies | | 558 | | | | 517 | |
| | Deferred income taxes | | 689 | | | | 674 | |
| | Intangible assets | | 474 | | | | 315 | |
| | Goodwill | | 1,450 | | | | 1,450 | |
| | Other assets | | 2,321 | | | | 2,258 | |
| |
|
|
| |
|
|
|
Total assets | $ | 44,347 | | | $ | 43,091 | |
|
|
|
| |
|
|
|
Liabilities | | | | | | | |
| | Current liabilities: | | | | | | | |
| | | Short-term borrowings: | | | | | | | |
| | | | Machinery and Engines | | 101 | | | | 93 | |
| | | | Financial Products | | 3,164 | | | | 4,064 | |
| | | Accounts payable | | 3,978 | | | | 3,990 | |
| | | Accrued expenses | | 1,800 | | | | 1,847 | |
| | | Accrued wages, salaries and employee benefits | | 1,437 | | | | 1,730 | |
| | | Customer advances | | 631 | | | | 555 | |
| | | Dividends payable | | - | | | | 141 | |
| | | Deferred and current income taxes payable | | 416 | | | | 259 | |
| | | Long-term debt due within one year: | | | | | | | |
| | | | Machinery and Engines | | 29 | | | | 6 | |
| | | | Financial Products | | 3,231 | | | | 3,525 | |
| | | | |
| |
|
| | Total current liabilities | | 14,787 | | | | 16,210 | |
| | | | | | | | | | | |
| | Long-term debt due after one year: | | | | | | | |
| | | Machinery and Engines | | 3,819 | | | | 3,663 | |
| | | Financial Products | | 14,090 | | | | 12,174 | |
| | Liability for postemployment benefits | | 3,217 | | | | 2,986 | |
| | Deferred income taxes and other liabilities | | 687 | | | | 591 | |
| |
|
|
| |
|
|
|
Total liabilities | | 36,600 | | | | 35,624 | |
|
|
|
| |
|
|
|
Stockholders' equity | | | | | | | |
| | Common stock of $1.00 par: | | | | | | | |
| | | Authorized shares: 900,000,000 Issued shares: (03/31/05 and 12/31/04 - 407,447,312) at paid in amount | | 1,308 | | | | 1,231 | |
| | Treasury stock (03/31/05 - 65,752,760; 12/31/04 - 64,510,363) at cost | | (3,554 | ) | | | (3,277 | ) |
| | Profit employed in the business | | 10,518 | | | | 9,937 | |
| | Accumulated other comprehensive income | | (525 | ) | | | (424 | ) |
| |
|
|
| |
|
|
|
Total stockholders' equity | | 7,747 | | | | 7,467 | |
|
|
|
| |
|
|
|
Total liabilities and stockholders' equity | $ | 44,347 | | | $ | 43,091 | |
|
|
|
| |
|
|
|
See accompanying notes to Consolidated Financial Statements. |
|
Caterpillar Inc. Consolidated Statement of Cash Flow (Unaudited) (Millions of dollars)
|
| | | Three Months Ended |
| | | March 31, |
| | | 2005 | | 2004 |
| |
| |
|
Cash flow from operating activities: | | | | | | | |
| Profit | $ | 581 | | | $ | 420 | |
| Adjustments for non-cash items: | | | | | | | |
| | Depreciation and amortization | | 372 | | | | 350 | |
| | Other | | (68 | ) | | | (37 | ) |
| Changes in assets and liabilities: | | | | | | | |
| | Receivables - trade and other (see non-cash item below) | | (228 | ) | | | (2,498 | ) |
| | Inventories | | (555 | ) | | | (631 | ) |
| | Accounts payable and accrued expenses | | 96 | | | | 243 | |
| | Other - net | | (19 | ) | | | (50 | ) |
| | |
|
|
| |
|
|
|
Net cash provided by (used for) operating activities | | 179 | | | | (2,203 | ) |
|
|
|
| |
|
|
|
Cash flow from investing activities: | | | | | | | |
| Capital expenditures - excluding equipment leased to others | | (165 | ) | | | (106 | ) |
| Expenditures for equipment leased to others | | (238 | ) | | | (240 | ) |
| Proceeds from disposals of property,plant and equipment | | 131 | | | | 147 | |
| Additions to finance receivables | | (2,251 | ) | | | (1,866 | ) |
| Collections of finance receivables | | 1,597 | | | | 1,472 | |
| Proceeds from the sale of finance receivables | | 10 | | | | - | |
| | Collections of retained interests in securitized trade receivables | | - | | | | 2,001 | |
| Investments and acquisitions (net of cash acquired) | | 1 | | | | (13 | ) |
| Other - net | | (28 | ) | | | (6 | ) |
| |
|
|
| |
|
|
|
Net cash provided by (used for) investing activities | | (943 | ) | | | 1,389 | |
|
|
|
| |
|
|
|
Cash flow from financing activities: | | | | | | | |
| Dividends paid | | (141 | ) | | | (127 | ) |
| Common stock issued, including treasury shares reissued | | 154 | | | | 69 | |
| | Treasury shares purchased | | (357 | ) | | | (250 | ) |
| | Proceeds from long-term debt issued | | 2,513 | | | | 1,808 | |
| | Payments on long-term debt | | (1,359 | ) | | | (913 | ) |
| | Short-term borrowings - net | | (3 | ) | | | 220 | |
| |
|
|
| |
|
|
|
Net cash provided by financing activities | | 807 | | | | 807 | |
| |
|
|
| |
|
|
|
Effect of exchange rate changes on cash | | 29 | | | | 33 | |
|
|
|
| |
|
|
|
Increase in cash and short-term investments | | 72 | | | | 26 | |
| | | | | | | | |
Cash and short-term investments at beginning of period | | 445 | | | | 342 | |
|
|
|
| |
|
|
|
Cash and short-term investments at end of period | $ | 517 | | | $ | 368 | |
|
|
|
| |
|
|
|
All short-term investments, which consist primarily of highly liquid investments with original maturities of three months or less, are considered to be cash equivalents. |
Non-cash operating and investing activities:Trade receivables of $0 and $2,346 million were exchanged for retained interests in securitized trade receivables during the three months endedMarch 31, 2005 and 2004, respectively. |
See accompanying notes to Consolidated Financial Statements. |
|
5
NOTES TO CONSOLIDATED FINANCIAL STATEMENTS (Unaudited) |
1. | A. Financial Statement Presentation In the opinion of management, all adjustments, consisting only of normal recurring adjustments necessary for a fair statement of (a) the consolidated results of operations for the three-month periods ended March 31, 2005 and 2004, (b) the changes in stockholders' equity for the three-month periods ended March 31, 2005 and 2004, (c) the consolidated financial position at March 31, 2005 and December 31, 2004, and (d) the consolidated statement of cash flow for the three-month periods ended March 31, 2005 and 2004, have been made. Certain amounts for prior periods have been reclassified to conform to the current period financial statement presentation. In the fourth quarter of 2004, we changed how we classify cash flows related to trade receivables securitized through Cat Financial and wholesale inventory receivables financed by Cat Financial. 2003 and 2002 amounts reported in our 2004 Consolidated Statement of Cash Flow were reclassified to conform to the 2004 presentation. These reclassifications had no impact on the Increase in Cash and Short-term Investments on the Consolidated Statement of Cash Flow. The Consolidated Statement of Cash Flow for the three months ended March 31, 2004 has been reclassified to conform with the 2005 presentation as follows: |
| |
|
| | (Millions of dollars) | Previously Reported | | Change | | As Reclassified |
| |
| |
| |
|
| | Consolidated Statement of Cash Flow | | | | | | | | | | | |
| | Receivables - trade and other | $ | (197 | ) | | $ | (2,301 | ) | | $ | (2,498 | ) |
| | Net cash provided by (used for) operating activities | | 98 | | | | (2,301 | ) | | | (2,203 | ) |
| | Additions to finance receivables | | (4,812 | ) | | | 2,946 | | | | (1,866 | ) |
| | Collections of finance receivables | | 3,854 | | | | (2,382 | ) | | | 1,472 | |
| | Proceeds from sale of finance receivables | | 264 | | | | (264 | ) | | | - | |
| | Collections of retained interests in securitized trade receivables | | - | | | | 2,001 | | | | 2,001 | |
| | Net cash provided by (used for) investing activities | | (912 | ) | | | 2,301 | | | | 1,389 | |
| | | | | | | | | | | | | |
|
|
|
|
|
|
|
|
|
|
|
|
|
| | First quarter 2004 other post retirement benefit cost reflects the adoption of FASB Staff Position 106-2, “Accounting and Disclosure Requirements Related to the Medicare Prescription Drug, Improvement and Modernization Act of 2003” in the third quarter of 2004, retroactive to December 31, 2003. The impact of the anticipated federal subsidy for prescription drugs was a decrease in first quarter 2004 other postretirement benefit expense of $8 million. We adjusted our first quarter results in the third quarter of 2004 for this amount, resulting in profit after tax of $420 million ($1.19 per share) for the first quarter of 2004 as compared to the previously reported $412 million profit after tax ($1.16 per share). The December 31, 2004 financial position data included herein is derived from the audited consolidated financial statements included in the Company's annual report on Form 10-K for the year ended December 31, 2004. |
| | B. Nature of Operations We operate in three principal lines of business: |
| | (1) | Machinery - A principal line of business which includes the design, manufacture, marketing and sales of construction, mining and forestry machinery - track and wheel tractors, track and wheel loaders, pipelayers, motor graders, wheel tractor-scrapers, track and wheel excavators, backhoe loaders, log skidders, log loaders, off-highway trucks, articulated trucks, paving products, telescopic handlers, skid steer loaders and related parts. Also includes logistics services for other companies. |
6
| | (2) | Engines - A principal line of business including the design, manufacture, marketing and sales of engines for Caterpillar machinery, electric power generation systems; on-highway vehicles and locomotives; marine, petroleum, construction, industrial, agricultural and other applications; and related parts. Reciprocating engines meet power needs ranging from 5 to over 22,000 horsepower (4 to over 16 200 kilowatts). Turbines range from 1,200 to 20,500 horsepower (900 to 15 000 kilowatts). |
| | (3) | Financial Products - A principal line of business consisting primarily of Caterpillar Financial Services Corporation (Cat Financial), Caterpillar Insurance Holdings, Inc. (Cat Insurance), Caterpillar Power Ventures Corporation (Cat Power Ventures) and their respective subsidiaries. Cat Financial provides a wide range of financing alternatives to customers and dealers for Caterpillar machinery and engines, Solar gas turbines, as well as other equipment and marine vessels. Cat Financial also extends loans to customers and dealers. Cat Insurance provides various forms of insurance to customers and dealers to help support the purchase and lease of our equipment. Cat Power Ventures is an active investor in independent power projects using Caterpillar power generation equipment and services. |
| | Our Machinery and Engines operations are highly integrated. Throughout the Notes, Machinery and Engines represents the aggregate total of these principal lines of business. |
| | C. Stock-Based Compensation We currently use the intrinsic value method of accounting for stock-based employee compensation in accordance with Accounting Principles Board Opinion No. 25, "Accounting for Stock Issued to Employees." Therefore, no compensation expense is recognized in association with our options. In 2004, we switched from using the Black-Scholes option-pricing model to the binomial option-pricing model in order to calculate the fair value of our options. We believe this model more accurately reflects the value of the options than using the Black-Scholes option-pricing model. Grants made prior to 2004 continue to be valued using the Black-Scholes model. |
Pro forma net profit and profit per share for the three-month period ending March 31, 2005 and 2004 were:
| |
|
| | | Three Months Ended March 31,
|
| | (Dollars in millions except per share data) | 2005 | | 2004 |
| |
| |
|
| | Profit, as reported | $ | 581 | | | $ | 420 | |
| | Deduct: Total stock-based employee compensation expense determined under fair value based method for all awards, net of related tax effects | | 112 | | | | 19 | |
| |
|
|
| |
|
|
|
| | Pro forma profit | $ | 469 | | | $ | 401 | |
| |
|
|
| |
|
|
|
| | Profit per share of common stock: | | | | | | | |
| | | As reported: | | | | | | | |
| | | | Basic | $ | 1.70 | | | $ | 1.23 | |
| | | | Diluted | $ | 1.63 | | | $ | 1.19 | |
| | | Pro forma: | | | | | | | |
| | | | Basic | $ | 1.37 | | | $ | 1.17 | |
| | | | Diluted | $ | 1.32 | | | $ | 1.13 | |
|
|
2. | The results for the three-month period ended March 31, 2005 are not necessarily indicative of the results for the entire year 2005. |
3. | New Accounting Pronouncements |
| | In November 2004, the FASB issued Statement of Financial Accounting Standards No. 151 (SFAS 151), “Inventory Costs an amendment of ARB No. 43, Chapter 4.” SFAS 151 discusses the general principles applicable to the pricing of inventory. Paragraph 5 of ARB 43, Chapter 4 provides guidance on allocating certain costs to inventory. This Statement amends ARB 43, Chapter 4, to clarify that abnormal amounts of idle facility expense, freight, handling costs, and wasted materials (spoilage) should be recognized as current-period charges. In addition, this Statement requires that allocation of fixed production overheads to the costs of conversion be based on the normal capacity of production facilities. As required by SFAS 151, we will adopt this new accounting standard on January 1, 2006. The adoption of SFAS 151 is not expected to have a material impact on our financial statements. |
| | In December 2004, the FASB issued FASB Staff Position No. 109-1, “Application of FASB Statement No. 109, Accounting for Income Taxes, to the Tax Deduction on Qualified Production Activities Provided by the American Jobs Creation Act of 2004”, (FSP 109-1). FSP 109-1 provides accounting guidance for companies that will be eligible for a tax deduction resulting from “qualified production activities income” as defined in the American Jobs Creation Act of 2004 (the Act). FSP 109-1 requires this deduction be treated as a special deduction in accordance with SFAS 109, which does not require a revaluation of our U.S. deferred tax assets. We applied the guidance in FSP 109-1 upon recognition of this tax deduction beginning January 1, 2005. The application of FSP 109-1 did not have a material impact on our financial statements. In December 2004, the FASB issued FASB Staff Position No. 109-2, “Accounting and Disclosure Guidance for the Foreign Earnings Repatriation Provision within the American Jobs Creation Act of 2004”, (FSP 109-2). FSP 109-2 provides accounting guidance for the one-time tax deduction of 85% of certain non-U.S. earnings that are repatriated in excess of a base amount as defined in the Act. SFAS 109 requires a company to reflect in the period of enactment the effect of a new tax law. Due to the lack of clarification on certain provisions within the Act, FSP 109-2 allows companies time beyond the financial reporting period of enactment to evaluate the effect of the Act. We have started an evaluation of the effects of the repatriation provision.Based on the currently expected publication date of additional clarification on key elements of the provision by Congress and the Treasury Department, we anticipate completing our evaluation by June 30, 2005. The range of possible amounts, including the base, which we are considering for repatriation under this provision, is between zero and $1 billion. The related potential range of incremental provisionfor income taxes is between zero and $75 million. In December 2004, the FASB issued Statement of Financial Accounting Standards No. 153 (SFAS 153), “Exchanges of Non-monetary Assets - an amendment of APB Opinion No. 29.” SFAS 153 addresses the measurement of exchanges of non-monetary assets. It eliminates the exception from fair value measurement for non-monetary exchanges of similar productive assets in paragraph 21(b) of APB Opinion No. 29 “Accounting for Non-monetary Transactions” and replaces it with an exception for exchanges that do not have commercial substance. A non-monetary exchange has commercial substance if the future cash flows of the entity are expected to change significantly as a result of the exchange. As required by SFAS 153, we will adopt this new accounting standard effective July 1, 2005. The adoption of SFAS 153 is not expected to have a material impact on our financial statements.
In December 2004, the FASB issued Statement of Financial Accounting Standards No. 123R (revised 2004) “Share-Based Payment.” SFAS 123R requires that the cost resulting from all share-based payment transactions be recognized in the financial statements. SFAS 123R also establishes fair value as the measurement method in accounting for share-based payments with employees. The FASB required the provisions of SFAS 123R be adopted for interim or annual periods beginning after June 15, 2005. In April 2005, the SEC adopted a new rule amending the compliance dates for SFAS 123R. In accordance with this rule, we will adopt this new accounting standard effective January 1, 2006. We will transition to the new guidance using the modified prospective method. In anticipation of delaying vesting until three years after the grant date for future grants, the 2004 employee stock option grant (issued in June) fully vested on December 31, 2004. In order to better align our employee stock option program with the overall market, the number of options granted in 2005 (issued in February) was significantly reduced from the previous year. In response to this decrease, we elected to immediately vest the 2005 option grant. Based on the same assumptions used to value our 2005 stock option grant (including number of options granted and exercise price of options), we expect the application of the expensing provisions of SFAS 123R will result in a pretax expense of approximately $100 million in 2006. As a result of the vesting decisions discussed above, a full complement of expense related to stock options will not be recognized in our results of operations until 2009. We estimate our pretax expense associated with our stock option grants will range from approximately $110 million in 2007 to approximately $160 million in 2009.
|
4. | Derivative Instruments and Hedging Activities |
| | Our earnings and cash flow are subject to fluctuations due to changes in foreign currency exchange rates, interest rates and commodity prices. Our Risk Management Policy (policy) allows for the use of derivative financial instruments to prudently manage foreign currency exchange rate, interest rate and commodity price exposure. Our policy specifies that derivatives are not to be used for speculative purposes. Derivatives that we use are primarily foreign currency forward and option contracts, interest rate swaps and commodity forward and option contracts. Our derivative activities are subject to the management, direction and control of our financial officers. Risk management practices, including the use of financial derivative instruments, are presented to the Audit Committee of the Board of Directors at least annually. Foreign Currency Exchange Rate Risk Foreign currency exchange rate movements create a degree of risk by affecting the U.S. dollar value of sales made and costs incurred in foreign currencies. Movements in foreign currency rates also affect our competitive position as these changes may affect business practices and/or pricing strategies of non-U.S. based competitors. Additionally, we have balance sheet positions denominated in foreign currency, thereby creating exposure to movements in exchange rates. |
| | Our Machinery and Engines operations purchase, manufacture and sell products in many locations around the world. As we have a diversified revenue and cost base, we manage our future foreign currency cash flow exposure on a net basis. We use foreign currency forward and option contracts to manage unmatched foreign currency cash inflow and outflow. Our objective is to minimize the risk of exchange rate movements that would reduce the U.S. dollar value of our foreign currency cash flow. Our policy allows for managing anticipated foreign currency cash flow for up to four years. We generally designate as cash flow hedges at inception of the contract any Australian dollar, Brazilian real, British pound, Canadian dollar, euro, Japanese yen, Mexican peso, Singapore dollar, Chinese yuan, New Zealand dollar or Swiss franc forward or option contracts that exceed 90 days in duration. Designation is performed on a specific exposure basis to support hedge accounting. The remainder of Machinery and Engines foreign currency contracts are undesignated. We also designate as fair value hedges specific euro forward contracts used to hedge firm commitments. As of March 31, 2005, $62 million of deferred net gains included in equity (“Accumulated other comprehensive income” in the Statement of Financial Position) are expected to be reclassified to current earnings (“Other income (expense)”) over the next twelve months when earnings are negatively affected by the hedged transactions. This amount is based on March 31, 2005 exchange rates - the actual amount recorded in other income/expense will vary based on exchange rates at the time the hedged transactions impact earnings. There were no circumstances where hedge treatment was discontinued during the three months ended March 31, 2005 or 2004. In managing foreign currency risk for our Financial Products operations, our objective is to minimize earnings volatility resulting from conversion and the remeasurement of net foreign currency balance sheet positions. Our policy allows the use of foreign currency forward contracts to offset the risk of currency mismatch between our receivables and debt. All such foreign currency forward contracts are undesignated. |
| |
|
| | Gains / (losses) included in current earnings [Other income (expense)] on undesignated contracts: |
| | | Three Months Ended March 31, |
| |
|
| | (Millions of dollars) | 2005 | | 2004 |
| |
| |
|
| | Machinery and Engines: | | | | | | | |
| | | On undesignated contracts | $ | 10 | | | $ | (2 | ) |
| | | | | | | | | | | |
| | Financial Products: | | | | | | | |
| | | On undesignated contracts | $ | 12 | | | $ | 16 | |
|
|
| | Gains and losses on the Financial Products contracts above are substantially offset by balance sheet remeasurement and conversion gains and losses. Interest Rate Risk Interest rate movements create a degree of risk by affecting the amount of our interest payments and the value of our fixed rate debt. Our practice is to use interest rate swap agreements and forward rate agreements to manage our exposure to interest rate changes and lower the cost of borrowed funds. Machinery and Engines operations generally use fixed rate debt as a source of funding. Our objective is to minimize the cost of borrowed funds. Our policy allows us to enter into fixed-to-floating interest rate swaps and forward rate agreements to meet that objective with the intent to designate as fair value hedges at inception of the contract all fixed-to-floating interest rate swaps. Designation as a hedge of the fair value of our fixed rate debt is performed to support hedge accounting. During 2001, our Machinery and Engines operations liquidated all fixed-to-floating interest rate swaps. Deferred gains on liquidated fixed-to-floating interest rate swaps, which were previously designated as fair value hedges, are being amortized to earnings ratably over the remaining life of the hedged debt. We designate as cash flow hedges at inception of the contract all forward rate agreements. Designation as a hedge of the anticipated issuance of debt is performed to support hedge accounting. Machinery and Engines forward rate agreements are 100% effective. |
|
|
| | Financial Products operations have a "match funding" policy whereby the interest rate profile (fixed rate or floating rate) of their debt portfolio largely matches the interest rate profile of their receivables within established guidelines. In connection with that policy, we use interest rate derivative instruments to modify the debt structure to match these assets. This "match funding" reduces the volatility of margins between interest-bearing assets and interest-bearing liabilities, regardless of which direction interest rates move. We also use these instruments to gain an economic and/or competitive advantage through a lower cost of borrowed funds. This is accomplished by changing the characteristics of existing debt instruments or entering into new agreements in combination with the issuance of new debt. Our policy allows us to use floating-to-fixed, fixed-to-floating, and floating-to-floating interest rate swaps to meet the "match funding" objective. To support hedge accounting, we designate fixed-to-floating interest rate swaps as fair value hedges of the fair value of our fixed rate debt at the inception of the contract. Financial Products policy is to designate most floating-to-fixed interest rate swaps as cash flow hedges of the variability of future cash flows at inception of the swap contract. Designation as a hedge of the variability of cash flow is performed to support hedge accounting. During 2005, 2004 and 2002, Financial Products operations liquidated six, three and four fixed-to-floating interest rate swaps, respectively. As a result, the fair value adjustment of the original debt is being amortized to earnings ratably over the remaining life of the hedged debt. |
| |
|
| | Gains / (losses) included in current earnings [Other income (expense)]: |
| | | Three Months Ended March 31, |
| | (Millions of dollars) | 2005 | | 2004 |
| | |
| |
|
| | Fixed-to-floating interest rate swaps | | | | | | | |
| | | Machinery and Engines: | | | | | | | |
| | | | Gain/(loss) on liquidated swaps | $ | 1 | | | $ | 1 | |
| | | Financial Products: | | | | | | | |
| | | | Gain/(loss) on designated interest rate derivatives | | (47 | ) | | | 34 | |
| | | | Gain/(loss) on hedged debt | | 47 | | | | (34 | ) |
| | | | Gain/(loss) on liquidated swaps - included in interest expense | | 1 | | | | 1 | |
| | | | |
|
|
| |
|
|
|
| | | | | $ | 2 | | | $ | 2 | |
| | | | |
|
|
| |
|
|
|
| |
|
| | As of March 31, 2005, $8 million of deferred net gains included in equity (“Accumulated other comprehensive income” in Consolidated Statement of Financial Position), related to Financial Products floating-to-fixed interest rate swaps, is expected to be reclassified to current earnings (“Interest expense of Financial Products”) over the next twelve months. There were no circumstances where hedge treatment was discontinued during the three months ended March 31, 2005 or 2004. Commodity Price Risk Commodity price movements create a degree of risk by affecting the price we must pay for certain raw materials. Our policy is to use commodity forward and option contracts to manage the commodity risk and reduce the cost of purchased materials. Our Machinery and Engines operations purchase aluminum, copper and nickel embedded in the components we purchase from suppliers. Our suppliers pass on to us price changes in the commodity portion of the component cost. In addition, we are also subjected to price changes on natural gas purchased for operational use. Our objective is to minimize volatility in the price of these commodities. Our policy allows us to enter commodity forward and option contracts to lock in the purchase price of a portion of these commodities within a four-year horizon. All such commodity forward and option contracts are undesignated. Gains on the undesignated contracts of $2 million and $7 million were recorded in current earnings ("Other income (expense)") for the three months ended March 31, 2005 and March 31, 2004, respectively. |
5. | Inventories Inventories (principally "last-in, first-out" method) comprise the following: |
| |
|
| | (Millions of dollars) | March 31, | | December 31, |
| | | 2005 | | 2004 |
| | |
| |
|
| | Raw materials | $ | 1,752 | | | $ | 1,592 | |
| | Work-in-process | | 766 | | | | 664 | |
| | Finished goods | | 2,505 | | | | 2,209 | |
| | Supplies | | 207 | | | | 210 | |
| | |
|
|
| |
|
|
|
| | Total inventories | $ | 5,230 | | | $ | 4,675 | |
| | |
|
|
| |
|
|
|
| |
|
6. | Investments in Unconsolidated Affiliated Companies |
| | Our investments in affiliated companies accounted for by the equity method consist primarily of a 50% interest in Shin Caterpillar Mitsubishi Ltd. (SCM) located in Japan. Combined financial information of the unconsolidated affiliated companies accounted for by the equity method (generally on a three month lag, e.g., SCM results reflect the periods ending December 31) was as follows: |
| |
|
| | | Results of Operations |
| | | Three Months Ended |
| | | March 31, | | March 31, |
| | (Millions of dollars) | 2005 | | 2004 |
| | |
| |
|
| | Sales | $ | 966 | | $ | 813 |
| | Cost of sales | | 757 | | | 629 |
| | |
|
| |
|
|
| | Gross profit | $ | 209 | | $ | 184 |
| | | | | | | |
| | Profit | $ | 33 | | $ | 17 |
| | |
|
| |
|
|
| | Caterpillar's profit | $ | 14 | | $ | 6 |
| | |
|
| |
|
|
| |
|
| | | Financial Position |
| | | March 31, | | December 31, |
| | (Millions of dollars) | 2005 | | 2004 |
| | |
| |
|
| | Assets: | | | |
| | Current assets | $ | 1,778 | | $ | 1,540 |
| | Property, plant and equipment - net | | 1,128 | | | 1,097 |
| | Other assets | | 210 | | | 145 |
| | |
|
| |
|
|
| | | | 3,116 | | | 2,782 |
| | Liabilities: | | | | | |
| | Current liabilities | | 1,495 | | | 1,345 |
| | Long-term debt due after one year | | 336 | | | 276 |
| | Other liabilities | | 244 | | | 214 |
| | |
|
| |
|
|
| | | | 2,075 | | | 1,835 |
| | |
|
| |
|
|
| | Ownership | $ | 1,041 | | $ | 947 |
| | |
|
| |
|
|
| | Caterpillar's investments in unconsolidated affiliated companies | | | | | |
| | Investments in equity method companies | $ | 529 | | $ | 487 |
| | Plus: Investments in cost method companies | | 29 | | | 30 |
| | |
|
| |
|
|
| | Total investments in unconsolidated affiliated companies | $ | 558 | | $ | 517 |
| | |
|
| |
|
|
| |
|
7. | Intangible Assets and Goodwill |
| | A. Intangible Assets |
| | Intangible assets are comprised of the following: |
| |
|
| | (Millions of dollars) | March 31, | | December 31, |
| | | 2005 | | 2004 |
| |
| |
|
| | Intellectual property | $ | 212 | | | $ | 213 | |
| | Pension-related | | 284 | | | | 120 | |
| | Other | | 73 | | | | 73 | |
| | |
| |
|
| | Total intangible assets - gross | | 569 | | | | 406 | |
| | Less: Accumulated amortization of finite lived intangible assets | | (95 | ) | | | (91 | ) |
| |
|
|
| |
|
|
|
| | Intangible assets - net | $ | 474 | | | $ | 315 | |
| |
|
|
| |
|
|
|
|
|
| | Amortization expense for the three months ended March 31, 2005 and 2004 was $4 million and $4 million, respectively. Amortization expense related to intangible assets is expected to be: |
| |
|
| | (Millions of dollars) |
| | 2005 | | 2006 | | 2007 | | 2008 | | 2009 | | Thereafter |
|
| |
| |
| |
| |
| |
|
| | $ | 23 | | | $ | 22 | | | $ | 19 | | | $ | 17 | | | $ | 17 | | | $ | 97 | |
|
|
|
| |
|
|
| |
|
|
| |
|
|
| |
|
|
| |
|
|
|
|
|
| B. Goodwill |
| | During the three months ended March 31, 2005 and 2004, no goodwill was acquired, impaired or disposed. On an annual basis, we test goodwill for impairment in accordance with Statement of Financial Accounting Standards No. 142 “Goodwill and Other Intangible Assets.” |
8. | Available-For-Sale Securities |
| | Caterpillar Insurance and Caterpillar Investment Management Ltd. have investments in certain debt and equity securities that are classified as available-for-sale in accordance with Statement of Financial Accounting Standards No. 115 (SFAS 115) and recorded at fair value based upon quoted market prices. These fair values are included in "Other assets" in the Statement of Financial Position. Unrealized gains and losses arising from the revaluation of available-for-sale securities are included, net of applicable deferred income taxes, in equity ("Accumulated other comprehensive income" in the Statement of Financial Position). Realized gains and losses on sales of investments are generally determined using the specific identification method for debt instruments and the FIFO method for equity securities. Realized gains and losses are included in "Other income (expense)" in the Statement of Results of Operations. |
| |
|
| | | March 31, 2005 |
| |
|
| | | | | Unrealized | | |
| | | | | Pretax Net | | |
| | (Millions of dollars) | Cost Basis | | Gains (Losses) | | Fair Value |
| |
| |
| |
|
| | Government debt | $ | 266 | | | $ | (4 | ) | | $ | 262 | |
| | Corporate bonds | | 382 | | | | (4 | ) | | | 378 | |
| | Equity securities | | 206 | | | | 20 | | | | 226 | |
| |
|
|
| |
|
|
| |
|
|
|
| | Total | $ | 854 | | | $ | 12 | | | $ | 866 | |
| |
|
|
| |
|
|
| |
|
|
|
|
|
12
| |
|
| | | December 31, 2004 |
| |
|
| | (Millions of dollars) | Cost Basis | | Unrealized Pretax Net Gains (Losses) | | Fair Value |
| |
| |
| | Government debt | $ | 239 | | | $ | (1 | ) | | $ | 238 | |
| | Corporate bonds | | 342 | | | | - | | | | 342 | |
| | Equity securities | | 203 | | | | 21 | | | | 224 | |
| |
|
|
| |
|
|
| |
|
|
|
| | Total | $ | 784 | | | $ | 20 | | | $ | 804 | |
| |
|
|
| |
|
|
| |
|
|
|
|
|
| |
|
| | Investments in an unrealized loss position that are not other-than-temporarily impaired: |
| | | March 31, 2005 |
| |
|
| | | Less than 12 months(1) | | More than 12 months(1) | | Total |
| |
| |
| |
|
| | (Millions of dollars) | Fair Value | | Unrealized Losses | | Fair Value | | Unrealized Losses | | Fair Value | | Unrealized Losses |
| |
| |
| |
| |
| |
| |
|
| | Government debt | $ | 183 | | | $ | 2 | | | $ | 70 | | | $ | 2 | | | $ | 253 | | | $ | 4 | |
| | Corporate bonds | | 193 | | | | 3 | | | | 96 | | | | 3 | | | | 289 | | | | 6 | |
| | Equity securities | | 26 | | | | 1 | | | | 2 | | | | - | | | | 28 | | | | 1 | |
| |
|
|
| |
|
|
| |
|
|
| |
|
|
| |
|
|
| |
|
|
|
| | Total | $ | 402 | | | $ | 6 | | | $ | 168 | | | $ | 5 | | | $ | 570 | | | $ | 11 | |
| |
|
|
| |
|
|
| |
|
|
| |
|
|
| |
|
|
| |
|
|
|
| |
(1)Indicates length of time that individual securities have been in a continuous unrealized loss position. |
|
|
| | The fair value of the available-for-sale debt securities at March 31, 2005, by contractual maturity, is shown below. Expected maturities will differ from contractual maturities because borrowers may have the right to prepay and creditors may have the right to call obligations. |
| |
|
| | (Millions of dollars) | | Fair Value |
| | |
|
| | Due in one year or less | | $ | 43 |
| | Due after one year through five years | | $ | 288 |
| | Due after five years through ten years | | $ | 56 |
| | Due after ten years | | $ | 253 |
|
|
| | Proceeds from sales of investments in debt and equity securities during the three months ended March 31, 2005 and 2004 were $62 million and $76 million, respectively. Gross gains of $2 and $3 million, and gross losses of $2 and $2 million, were included in current earnings for the three months ended March 31, 2005 and 2004, respectively. |
9. | Postretirement Benefits |
| | A. Pension and postretirement benefit costs |
| | In January 2005, amendments were made to both U.S. pension and other postretirement benefit plans due to the company and the United Auto Workers reaching a new six-year labor agreement that will expire on March 1, 2011. These plans were remeasured as of January 1, 2005 to account for the benefit changes. The result was an increase in first quarter 2005 pension cost of $7 million and other postretirement benefit cost of $17 million. In addition, the Additional Minimum Pension Liability increased $233 million as a result of the remeasurement. The liability was offset by an increase in pension-related intangible assets of $164 million and a decrease in other comprehensive income (pre-tax) of $69 million. First quarter 2004 other postretirement benefit cost reflects the adoption of FASB Staff Position No. 106-2, “Accounting and Disclosure Requirements Related to the Medicare Prescription Drug, Improvement and Modernization Act of 2003” in the third quarter of 2004, retroactive to December 31, 2003. The impact of the anticipated federal subsidy for prescription drugs was a decrease in first quarter 2004 other postretirement benefit expense of $8 million. |
| |
|
| | | U.S. Pension Benefits | | Non-U.S. Pension Benefits | | Other Postretirement Benefits |
| |
| |
| |
|
| | | March 31, | | March 31, | | March 31, |
| | | 2005 | | 2004 | | 2005 | | 2004 | | 2005 | | 2004 |
| |
| |
| |
| |
| |
| |
|
| | For the three months ended: | | | | | | | | | | | | | | | | | | | | | | | |
| |
Components of net periodic benefit cost:
| | | | | | | | | | | | | | | | | | | | | | | |
| | | Service cost | $ | 38 | | | $ | 36 | | | $ | 14 | | | $ | 12 | | | $ | 22 | | | $ | 17 | |
| | | Interest cost | | 140 | | | | 137 | | | | 28 | | | | 22 | | | | 75 | | | | 67 | |
| | | Expected return on plan assets | | (178 | ) | | | (167 | ) | | | (26 | ) | | | (24 | ) | | | (22 | ) | | | (18 | ) |
| | | Amortization of: | | | | | | | | | | | | | | | | | | | | | | | |
| | | | Net asset existing at adoption
of SFAS 87 | | - | | | | - | | | | - | | | | 1 | | | | - | | | | - | |
| | | | Prior service cost1 | | 16 | | | | 11 | | | | 1 | | | | 2 | | | | (3 | ) | | | (12 | ) |
| | | | Net actuarial loss (gain) | | 50 | | | | 35 | | | | 13 | | | | 9 | | | | 17 | | | | 13 | |
| | | |
|
|
| |
|
|
| |
|
|
| |
|
|
| |
|
|
| |
|
|
|
| | | Total cost (benefit) included in results of operations | $ | 66 | | | $ | 52 | | | $ | 30 | | | $ | 22 | | | $ | 89 | | | $ | 67 | |
| | |
|
|
| |
|
|
| |
|
|
| |
|
|
| |
|
|
| |
|
|
|
| | Weighted-average assumptions used to determine net cost: | | | | | | | | | | | | | | | | | | | | | | | |
| | Discount rate2 | | 5.9/5.8 | % | | | 6.2 | % | | | 5.2 | % | | | 5.1 | % | | | 5.9/5.8 | % | | | 6.2 | % |
| | Expected return on plan assets | | 9.0 | % | | | 9.0 | % | | | 7.2 | % | | | 7.4 | % | | | 9.0 | % | | | 9.0 | % |
| | Rate of compensation increase | | 4.0 | % | | | 4.0 | % | | | 3.5 | % | | | 3.2 | % | | | 4.0 | % | | | 4.0 | % |
| | | | | | | | | | | | | | | | | | | | | | | | | |
| |
1 Prior service costs for both pension and other postretirement benefits are generally amortized using the straight-line method over the average remaining service period to the full retirement eligibility date of employees expected to receive benefits from the plan amendment. For other postretirement benefit plans in which all or almost all of the plan’s participants are fully eligible for benefits under the plan, prior service costs are amortized using the straight-line method over the remaining life expectancy of those employees. |
| |
2 For U.S. plans impacted by the January 2005 plan amendments, a 5.8% discount rate was utilized for valuing the plan remeasurement. |
|
|
| | B. Defined contribution benefit costs |
| | Total company costs related to U.S. and non-U.S. defined contribution plans were the following: |
| | | Three Months Ended March 31, |
| | (Millions of dollars) | 2005 | | 2004 |
| |
| |
|
| | U.S. Plans | $ 33 | | $ 30 |
| | Non-U.S. Plans | 4 | | 3 |
| |
| |
|
| | | $ 37 | | $ 33 |
| |
| |
|
|
|
|
|
|
10. | Guarantees and product warranty |
| | We have guaranteed to repurchase loans of certain Caterpillar dealers from third party lenders in the event of default. These guarantees arose in conjunction with Cat Financial's relationship with third party dealers who sell Caterpillar equipment. These guarantees generally have one year terms and are secured primarily by dealer assets. Cat Financial has provided a limited indemnity to a third party bank for $43 million resulting from the assignment of certain leases to that bank. The indemnity is for the remote chance that the insurers of these leases would become insolvent. The indemnity/guarantee is for eight years and is unsecured. |
| | No loss has been experienced or is anticipated under any of these guarantees. At March 31, 2005 and December 31, 2004 the book value of these guarantees was $10 million. The maximum potential amount of future payments (undiscounted and without reduction for any amount that may possibly be recovered under recourse or collateralized provisions) we could be required to make under the guarantees are as follows: |
| | (Millions of dollars) | March 31, | | December 31, |
| | | 2005 | | 2004 |
| |
| |
|
| | Guarantees with Caterpillar dealers | $ | 388 | | | $ | 364 | |
| | Guarantees - other | | 74 | | | | 62 | |
| |
|
|
| |
|
|
|
| | Total guarantees | $ | 462 | | | $ | 426 | |
| |
|
|
| |
|
|
|
|
|
|
|
|
|
|
|
|
| | Our product warranty liability is determined by applying historical claim rate experience to the current field population and dealer inventory. Historical claim rates are developed using a rolling average of actual warranty payments. |
| |
|
| | (Millions of dollars) | 2005 |
| |
|
| | Warranty liability, January 1 | $ | 782 | |
| | Payments | | (190 | ) |
| | Provision for warranty | | 211 | |
| |
|
|
|
| | Warranty liability, March 31 | $ | 803 | |
| |
|
|
|
| |
|
| | (Millions of dollars) | 2004 |
| |
|
| | Warranty liability, January 1 | $ | 622 | |
| | Payments | | (535 | ) |
| | Provision for warranty | | 695 | |
| |
|
|
|
| | Warranty liability, December 31 | $ | 782 | |
| |
|
|
|
|
|
|
|
|
11. | Computations of Profit Per Share |
| |
|
| | | Three Months Ended March 31, |
| | (Dollars in millions except per share data) | 2005 | | 2004 |
| |
| |
|
| | I. | Profit for the period (A): | $ | 581 | | $ | 420 |
| | |
|
| |
|
|
| | II. | Determination of shares (thousands): | | | | | |
| | | Weighted average number of common shares outstanding (B) | | 342,059 | | | 342,612 |
| | | Shares issuable on exercise of stock options, net of shares assumed to be purchased out of proceeds at average market price | | 14,572 | | | 13,124 |
| | |
|
| |
|
|
| | | Average common shares outstanding for fully diluted computation (C) | | 356,631 | | | 355,736 |
| | |
|
| |
|
|
| | III. | Profit per share of common stock: | | | | | |
| | | Assuming no dilution (A/B) | $ | 1.70 | | $ | 1.23 |
| | | Assuming full dilution (A/C) | $ | 1.63 | | $ | 1.19 |
|
|
12. | Environmental and Legal Matters |
| | The company is regulated by federal, state, and international environmental laws governing our use of substances and control of emissions in all our operations. Compliance with these existing laws has not had a material impact on our capital expenditures or earnings.
We are cleaning up hazardous waste at a number of locations, often with other companies, pursuant to federal and state laws. When it is likely we will pay clean-up costs at a site and those costs can be estimated, the costs are charged against our earnings. In formulating that estimate, we do not consider amounts expected to be recovered from insurance companies and others.
The amount recorded for environmental clean up is not material and is included in "Accrued expenses" in the Statement of Financial Position. If a range of liability estimates is available on a particular site, we accrue at the lower end of that range. We cannot estimate costs on sites in the very early stages of clean up. Currently, we have several sites in the very early stages of clean up, and there is no more than a remote chance that a material amount for clean up will be required.
Pursuant to a consent decree Caterpillar entered into with the EPA, the company was required to pay a fine of $25 million, which was expensed in 1998 and to make investments totaling $35 million in environmental-related products by July 7, 2007. During the first quarter of 2005, Caterpillar made qualifying investments of $3.1 million surpassing its investment requirement in environmental-related products with an accumulated investment of $38 million. A future benefit is expected to be realized from these environmental projects related to Caterpillar's ability to capitalize on the technologies it developed in complying with its environmental project obligations. In short, Caterpillar expects to receive a positive net return on the environmental projects by being able to market the technology it developed.
We are a party to litigation matters and claims that are normal in the course of our operations, and, while the results of such litigation and claims cannot be predicted with certainty, management believes, based on the advice of counsel, the final outcome of any single proceeding or all proceedings in the aggregate would not have a materially adverse effect on our consolidated financial position or results of operations or cash flows.
On January 16, 2002, Caterpillar commenced an action in the Circuit Court of the Tenth Judicial Circuit of Illinois in Peoria, Illinois, against Navistar International Transportation Corporation and International Truck and Engine Corporation (collectively Navistar). The lawsuit arises out of a long-term purchase contract between Caterpillar and Navistar effective May 31, 1988, as amended from time to time (the Purchase Agreement). The pending complaint alleges that Navistar breached its contractual obligations by: (i) paying Caterpillar $8.08 less per fuel injector than the agreed upon price for new unit injectors delivered by Caterpillar; (ii) refusing to pay contractually agreed upon surcharges owed as a result of Navistar ordering less than planned volumes of replacement unit injectors; and (iii) refusing to pay contractually agreed upon interest stemming from Navistar's late payments. As of March 31, 2005, the net past due receivable from Navistar regarding the foregoing and included in “Long-term receivables - trade and other” in the Consolidated Statement of Financial Position totaled $139 million. The pending complaint also has claims alleging that Newstream Enterprises and Navistar, collectively and individually, failed to pay the applicable price to Caterpillar for shipments of unit injectors to Newstream. In January 2005, Caterpillar and Franklin Power Products, Inc. resolved claims similar to those currently pending against Newstream, and Franklin has been dismissed from the lawsuit. As of March 31, 2005, the net past due receivables for the foregoing, included in “Long-term receivables - trade and other” in the Consolidated Statement of Financial Position totaled $12 million. The pending complaint further alleges that Sturman Industries, Inc. and Sturman Engine Systems, Inc. colluded with Navistar to utilize technology that Sturman Industries, Inc. misappropriated from Caterpillar to help Navistar develop its G2 fuel system, and tortiously interfered with the Purchase Agreement and Caterpillar's prospective economic relationship with Navistar. The pending complaint further alleges that the two parties' collusion led Navistar to select Sturman Engine Systems, Inc., and another company, instead of Caterpillar, to develop and manufacture the G2 fuel system. |
| On May 7, 2002 International Truck and Engine Corporation (International) commenced an action against Caterpillar in the Circuit Court of DuPage County, Illinois regarding a long-term agreement term sheet ("term sheet"). In its sixth amended complaint, International alleges that the term sheet constitutes a legally binding contract for the sale of heavy-duty engines at specified prices through the end of 2006, alleges that Caterpillar breached the term sheet by, among other things, raising certain prices effective October 1, 2002, and also alleges that Caterpillar breached an obligation to negotiate a comprehensive long-term agreement referenced in the term sheet. International seeks declaratory and injunctive relief as well as damages in an amount to be determined at trial. Caterpillar denies International's claims and has filed a counterclaim seeking a declaration that the term sheet has been effectively terminated. Caterpillar also asserts that pursuant to a subsequent agreement International has released Caterpillar from certain of its claims. On September 24, 2003 the Appellate Court of Illinois, ruling on an interlocutory appeal, issued an order consistent with Caterpillar's position that, even if the court subsequently determines that the term sheet is a binding contract, it is indefinite in duration and was therefore terminable at will by Caterpillar upon reasonable notice. On April 12, 2005 International commenced a second, related action against Caterpillar in the Circuit Court of DuPage County, Illinois. The second lawsuit contains allegations that are similar to the allegations contained in the first lawsuit filed in May, 2002. International also alleges that Caterpillar materially breached the subsequent agreement. No trial dates are currently scheduled for either of the cases pending in the Circuit Court of DuPage County. Neither of these cases are related to the breach of contract action brought by Caterpillar against Navistar which is currently pending in the Circuit Court of Peoria County, Illinois.
In a letter dated November 15, 2004, the EPA proposed a civil penalty of $641,392 to Caterpillar for the alleged failure to comply with certain requirements of the Federal Clean Air Act. The EPA alleges that Caterpillar constructed a facility in Emporia, Kansas, and failed to comply with Section 112(g)(2)(B) of the Clean Air Act. Caterpillar sold the Emporia facility in December 2002. We are seeking a settlement of this matter with all concerned parties and the company believes the outcome will not have a material impact on our financial statements. |
| 13. | Segment Information |
| | Caterpillar is organized based on a decentralized structure that has established accountabilities to continually improve business focus and increase our ability to react quickly to changes in both the global business cycle and competitors' actions. Our current structure uses a product, geographic matrix organization comprised of multiple profit center and service center divisions. Caterpillar is a highly integrated company. The majority of our profit centers are product focused. They are primarily responsible for the design, manufacture and ongoing support of their products. However, some of these product-focused profit centers also have marketing responsibilities. We also have geographically-based profit centers that are focused primarily on marketing. However, most of these profit centers also have some manufacturing responsibilities. One of our profit centers provides various financial services to our customers and dealers. The service center divisions perform corporate functions and provide centralized services. |
| | We have developed an internal measurement system to evaluate performance and to drive continuous improvement. This measurement system, which is not based on generally accepted accounting principles (GAAP), is intended to motivate desired behavior of employees and drive performance. It is not intended to measure a division’s contribution to enterprise results. The sales and cost information used for internal purposes varies significantly from our consolidated, externally reported information resulting in substantial reconciling items. Each division has specific performance targets and is evaluated and compensated based on achieving those targets. Performance targets differ from division to division; therefore, meaningful comparisons cannot be made among the profit or service center divisions. It is the comparison of actual results to budgeted results that makes our internal reporting valuable to management. Consequently, we feel that the financial information required by Statement of Financial Accounting Standards No. 131 (SFAS 131), "Disclosures about Segments of an Enterprise and Related Information" has limited value to our external readers.
In the first quarter of 2005, we made several organizational changes which impacted our segment reporting. No individual segment was materially impacted as a result of the changes and prior period amounts have been restated to conform to the current period presentation.
Due to Caterpillar’s high level of integration and our concern that segment disclosures based on SFAS 131 requirements have limited value to external readers, we are continuing to disclose financial results for our three principal lines of business (Machinery, Engines and Financial Products) in our Management’s Discussion and Analysis beginning on page 21. |
17
Business SegmentsThree Months Ended March 31, (Millions of dollars) |
|
| Machinery and Engines | Financing & Insurance Services | Consolidated Total |
2005 | Asia/ Pacific Marketing | Construction & Mining Products | EAME Marketing | Latin America Marketing | Power Products | North America Marketing | All Other | Total |
| External sales and revenues | $ | 598 | $ | 93 | | $ | 1,113 | $ | 488 | $ | 2,231 | $ | 2,581 | $ | 600 | $ | 7,704 | $ | 680 | | $ | 8,384 | |
| Intersegment sales & revenues | | 36 | | 3,657 | | | 1,042 | | 367 | | 2,116 | | 103 | | 884 | | 8,205 | | 20 | | | 8,225 | |
|
|
| Total sales and revenues | $ | 634 | $ | 3,750 | | $ | 2,155 | $ | 855 | $ | 4,347 | $ | 2,684 | $ | 1,484 | $ | 15,909 | $ | 700 | | $ | 16,609 | |
|
|
| Depreciation and amortization | $ | 3 | $ | 45 | | $ | 17 | $ | 12 | $ | 74 | $ | 1 | $ | 28 | $ | 180 | $ | 159 | | $ | 339 | |
| Imputed interest expense | $ | 4 | $ | 20 | | $ | 8 | $ | 6 | $ | 29 | $ | 1 | $ | 29 | $ | 97 | $ | 176 | | $ | 273 | |
| Accountable profit (loss) | $ | 34 | $ | 383 | | $ | 116 | $ | 48 | $ | 134 | $ | 37 | $ | 211 | $ | 963 | $ | 129 | | $ | 1,092 | |
Accountable assets at March 31, 2005 | $ | 512 | $ | 2,656 | | $ | 1,203 | $ | 842 | $ | 3,759 | $ | 377 | $ | 3,985 | $ | 13,334 | $ | 24,829 | | $ | 38,163 | |
| Capital Expenditures | $ | 1 | $ | 43 | | $ | 13 | $ | 5 | $ | 59 | $ | - | $ | 17 | $ | 138 | $ | 239 | | $ | 377 | |
|
|
| Machinery and Engines | Financing & Insurance Services | Consolidated Total |
2004 | Asia/ Pacific Marketing | Construction & Mining Products | EAME Marketing | Latin America Marketing | Power Products | North America Marketing | All Other | Total |
| External sales and revenues | $ | 533 | $ | 64 | | $ | 829 | $ | 346 | $ | 1,727 | $ | 2,037 | $ | 427 | $ | 5,963 | $ | 547 | | $ | 6,510 | |
| Intersegment sales & revenues | | 27 | | 2,828 | | | 867 | | 275 | | 1,679 | | 86 | | 648 | | 6,410 | | - | | | 6,410 | |
|
|
| Total sales and revenues | $ | 560 | $ | 2,892 | | $ | 1,696 | $ | 621 | $ | 3,406 | $ | 2,123 | $ | 1,075 | $ | 12,373 | $ | 547 | | $ | 12,920 | |
|
|
Depreciation and amortization | $ | 3 | $ | 45 | | $ | 15 | $ | 11 | $ | 73 | $ | - | $ | 24 | $ | 171 | $ | 149 | | $ | 320 | |
| Imputed interest expense | $ | 4 | $ | 16 | | $ | 7 | $ | 5 | $ | 28 | $ | - | $ | 23 | $ | 83 | $ | 123 | | $ | 206 | |
| Accountable profit (loss) | $ | 47 | $ | 298 | | $ | 91 | $ | 47 | $ | 15 | $ | 87 | $ | 151 | $ | 736 | $ | 106 | | $ | 842 | |
Accountable assets at December 31, 2004 | $ | 525 | $ | 2,572 | | $ | 1,097 | $ | 775 | $ | 3,900 | $ | 28 | $ | 3,896 | $ | 12,793 | $ | 24,450 | | $ | 37,243 | |
| Capital Expenditures | $ | 1 | $ | 22 | | $ | 7 | $ | 4 | $ | 31 | $ | - | $ | 17 | $ | 82 | $ | 251 | | $ | 333 | |
|
|
Reconciliation of Sales & Revenues: | |
(Millions of dollars) | Machinery and Engines | | Financing & Insurance Services | | Consolidating Adjustments | | Consolidated Total |
|
| |
| |
| |
|
Three Months Ended March 31, 2005: | | | | | | | | | | | | | | | |
Total external sales and revenues from business segments | $ | 7,704 | | | $ | 680 | | | $ | - | | | $ | 8,384 | |
| Other | | 85 | | | | (68 | ) | | | (62 | ) 1 | | | (45 | ) |
|
|
|
| |
|
|
| |
|
|
| |
|
|
|
| Total sales and revenues | $ | 7,789 | | | $ | 612 | | | $ | (62 | ) | | $ | 8,339 | |
|
|
|
| |
|
|
| |
|
|
| |
|
|
|
Three Months Ended March 31, 2004: | | | | | | | | | | | | | | | |
Total external sales and revenues from business segments | $ | 5,963 | | | $ | 547 | | | $ | - | | | $ | 6,510 | |
| Other | | 39 | | | | (30 | ) | | | (39 | )1 | | | (30 | ) |
|
|
|
| |
|
|
| |
|
|
| |
|
|
|
| Total sales and revenues | $ | 6,002 | | | $ | 517 | | | $ | (39 | ) | | $ | 6,480 | |
|
|
|
| |
|
|
| |
|
|
| |
|
|
|
1 Elimination of Financial Products revenues from Machinery and Engines |
|
18
|
Reconciliation of Profit Before Taxes: | | | | | |
(Millions of dollars) | Machinery and Engines | | Financing & Insurance Services | | Consolidated Total |
|
| |
| |
|
Three Months Ended March 31, 2005: | | | | | | | | | | | |
| Total accountable profit from business segments | $ | 963 | | | $ | 129 | | | $ | 1,092 | |
| Corporate costs | | (162 | ) | | | - | | | | (162 | ) |
| Timing | | (32 | ) | | | - | | | | (32 | ) |
| Methodology differences: | | | | | | | | | | | |
| | Inventory/cost of sales | | (17 | ) | | | - | | | | (17 | ) |
| | Postretirement benefit expense | | (97 | ) | | | - | | | | (97 | ) |
| | Financing costs | | 7 | | | | - | | | | 7 | |
| | Equity in profit of unconsolidated affiliated companies | | (12 | ) | | | (2 | ) | | | (14 | ) |
| | Currency | | 8 | | | | - | | | | 8 | |
| | Other methodology differences | | - | | | | 5 | | | | 5 | |
| Other | | 9 | | | | - | | | | 9 | |
|
|
|
| |
|
|
| |
|
|
|
| Total profit before taxes | $ | 667 | | | $ | 132 | | | $ | 799 | |
|
|
|
| |
|
|
| |
|
|
|
Three Months Ended March 31, 2004: | | | | | | | | | | | |
| Total accountable profit from business segments | $ | 736 | | | $ | 106 | | | $ | 842 | |
| Corporate costs | | (129 | ) | | | - | | | | (129 | ) |
| Timing | | (37 | ) | | | - | | | | (37 | ) |
| Methodology differences: | | | | | | | | | | | |
| | Inventory/cost of sales | | (29 | ) | | | - | | | | (29 | ) |
| | Postretirement benefit expense | | (75 | ) | | | - | | | | (75 | ) |
| | Financing costs | | 18 | | | | - | | | | 18 | |
| | Equity in profit of unconsolidated affiliated companies | | (5 | ) | | | (1 | ) | | | (6 | ) |
| | Currency | | 10 | | | | - | | | | 10 | |
| | Other methodology differences | | (35 | ) | | | 9 | | | | (26 | ) |
| Other | | 4 | | | | - | | | | 4 | |
|
|
|
| |
|
|
| |
|
|
|
| Total profit before taxes | $ | 458 | | | $ | 114 | | | $ | 572 | |
|
|
|
| |
|
|
| |
|
|
|
|
|
Reconciliation of Assets: | | | | | | | |
(Millions of dollars) | Machinery and Engines | | Financing & Insurance Services | | Consolidating Adjustments | | Consolidated Total |
|
| |
| |
| |
|
March 31, 2005: | | | | | | | | | | | | | | | |
| Total accountable assets from business segments | $ | 13,334 | | | $ | 24,829 | | | $ | - | | | $ | 38,163 | |
| Items not included in segment assets: | | | | | | | | | | | | | | | |
| | Cash and short-term investments | | 346 | | | | 171 | | | | - | | | | 517 | |
| | Intercompany receivables | | 549 | | | | 573 | | | | (1,122 | ) | | | - | |
| | Trade and other receivables | | 515 | | | | - | | | | - | | | | 515 | |
| | Investment in unconsolidated affiliated companies | | 391 | | | | - | | | | - | | | | 391 | |
| | Investment in Financial Products | | 3,066 | | | | - | | | | (3,066 | ) | | | - | |
| | Deferred income taxes and prepaids | | 2,552 | | | | 97 | | | | (369 | ) | | | 2,280 | |
| | Intangible assets and other assets | | 2,324 | | | | - | | | | - | | | | 2,324 | |
| | Service center assets | | 986 | | | | - | | | | - | | | | 986 | |
| Liabilities included in segment assets | | 1,407 | | | | - | | | | - | | | | 1,407 | |
| Inventory methodology differences | | (2,273 | ) | | | - | | | | - | | | | (2,273 | ) |
| Other | | 132 | | | | (59 | ) | | | (36 | ) | | | 37 | |
|
|
|
| |
|
|
| |
|
|
| |
|
|
|
| Total assets | $ | 23,329 | | | $ | 25,611 | | | $ | (4,593 | ) | | $ | 44,347 | |
|
|
|
| |
|
|
| |
|
|
| |
|
|
|
December 31, 2004: | | | | | | | | | | | | | | | |
| Total accountable assets from business segments | $ | 12,793 | | | $ | 24,450 | | | $ | - | | | $ | 37,243 | |
| Items not included in segment assets: | | | | | | | | | | | | | | | |
| | Cash and short-term investments | | 270 | | | | 175 | | | | - | | | | 445 | |
| | Intercompany receivables | | 443 | | | | 18 | | | | (461 | ) | | | - | |
| | Trade and other receivables | | 547 | | | | - | | | | - | | | | 547 | |
| | Investment in unconsolidated affiliated companies | | 348 | | | | - | | | | (1 | ) | | | 347 | |
| | Investment in Financial Products | | 3,012 | | | | - | | | | (3,012 | ) | | | - | |
| | Deferred income taxes and prepaids | | 2,477 | | | | 92 | | | | (317 | ) | | | 2,252 | |
| | Intangible assets and other assets | | 2,177 | | | | - | | | | - | | | | 2,177 | |
| | Service center assets | | 1,001 | | | | - | | | | - | | | | 1,001 | |
| Liabilities included in segment assets | | 1,346 | | | | - | | | | - | | | | 1,346 | |
| Inventory methodology differences | | (2,235 | ) | | | - | | | | - | | | | (2,235 | ) |
| Other | | 86 | | | | (123 | ) | | | 5 | | | | (32 | ) |
|
|
|
| |
|
|
| |
|
|
| |
|
|
|
| Total assets | $ | 22,265 | | | $ | 24,612 | | | $ | (3,786 | ) | | $ | 43,091 | |
|
|
|
| |
|
|
| |
|
|
| |
|
|
|
|
|
|
|
|
|
|
|
|
|
|
|
|
|
|
|
14. | Subsequent Event |
| | On April 28, 2005, Cat Financial completed a public securitization of retail installment sale contracts and finance leases. The net proceeds, including cash proceeds and retained interests, were $850 million and the net gain was $12 million. |
20
Item 2. Management's Discussion and Analysis of Financial Condition and Results of Operations
A.Overview
We reported record sales and revenues of $8.34 billion for the first quarter and record first quarter profit of $581 million, or $1.63 per share. Sales and revenues were up 29 percent and profit was up 38 percent compared to the first quarter of 2004.
These record results are further evidence of the strength of the many global markets we serve and our ability to successfully meet this continuing strong market demand. Thanks to the commitment of Team Caterpillar -- our employees, dealers and suppliers around the world - we are working diligently to improve our performance while meeting customer needs. Our operating margins in the first quarter were the best since the first half of 2004 when material cost pressures began to accelerate. We have an unwavering commitment to fulfilling customer demand while improving operating margins throughPrice Realization, which more than offsets material cost increases, and enhanced manufacturing efficiencies.
Sales and revenues of $8.34 billion were up $1.86 billion, or 29 percent, compared to $6.48 billion in the first quarter of 2004. The increase in sales and revenues was driven by $1.44 billion of higherMachinery and Engines volume, $250 million of increased price realization, a $102 million favorable impact ofCurrency on sales due primarily to the strengthening euro and British pound and $72 million of higherFinancial Products revenues.
Profit of $581 million or $1.63 per share was up $161 million, or 38 percent, compared to $420 million or $1.19 per share in the first quarter of 2004. The main contributors to the profit increase were higherSales Volume of $521 million and higher price realization of $250 million. Partially offsetting these favorable items were $489 million of higherCore Operating Costs and $48 million of higherRetirement Benefits.
We remain squarely focused on responding to customer needs and improving operating performance, and we are on track to meet our long-term financial targets. We’re well positioned for growth and will continue to build on our record results, utilizing the power of6 Sigma across the value chain to further increase supply chain efficiencies and performance. While we still face selected industry-wide issues associated with material availability, our suppliers have responded and material availability is improving steadily.
We are raising our outlook for both sales and revenues and profit per share. We now expect 2005 sales and revenues to be up 16 to 18 percent and profit per share to be up 35 to 40 percent from 2004.
As 2005 unfolds, we are encouraged by the fundamental strength of the key markets we serve. Mining companies will continue to add capacity to meet anticipated growth in demand for the next several years. In addition, global demand for energy, including coal as well as oil and gas, and large infrastructure projects are growing. Likewise, commercial construction and housing in most countries will create even further demand for our products and services. This positions Team Caterpillar to deliver results beyond our initial expectations for the year.
Note: Glossary of terms included on pages 26-27; first occurrence of terms shown in bold italics.
B. Consolidated Results of Operations
THREE MONTHS ENDED MARCH 31, 2005 COMPARED WITH THREE MONTHS ENDED MARCH 31, 2004
SALES AND REVENUES
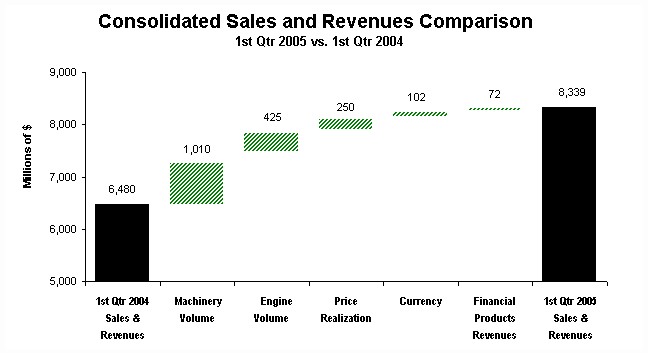 |
The chart above graphically illustrates reasons for the change in Consolidated Sales and Revenues between 1st Quarter 2004 (at left) and 1st Quarter 2005 (at right). Items favorably impacting sales and revenues appear as upward stair steps with the corresponding dollar amounts above each bar. Caterpillar management utilizes these charts internally to visually communicate with its Board and employees. |
Sales and revenues for the first quarter of 2005 were $8.34 billion, up $1.86 billion or 29 percent from first quarter 2004. The increase was due to higherMachinery volume of $1.01 billion, higher Engines volume of $425 million, improved price realization of $250 million, the favorable impact of currency on sales of $102 million due primarily to the strengthening euro and British pound and higher Financial Products revenues of $72 million.
|
Sales and Revenues by Geographic Region |
(Millions of dollars) | Total | | % Change | | North America | | % Change | | EAME | | % Change | | Latin America | | % Change | | Asia/ Pacific | | % Change |
|
| |
| |
| |
| |
| |
| |
| |
| |
| |
|
1st Quarter 2004 | | | | | | | | | | | | | | | | | | | | | | | | |
| Machinery | $ | 4,152 | | | | $ | 2,283 | | | | $ | 963 | | | | $ | 295 | | | | $ | 611 | | |
Engines1 | | 1,850 | | | | | 870 | | | | | 559 | | | | | 195 | | | | | 226 | | |
Financial Products2 | | 478 | | | | | 336 | | | | | 84 | | | | | 30 | | | | | 28 | | |
|
|
| | | |
|
| | | |
|
| | | |
|
| | | |
|
| | |
| | $ | 6,480 | | | | $ | 3,489 | | | | $ | 1,606 | | | | $ | 520 | | | | $ | 865 | | |
|
|
| | | |
|
| | | |
|
| | | |
|
| | | |
|
| | |
1st Quarter 2005 | | | | | | | | | | | | | | | | | | | | | | | | |
| Machinery | $ | 5,400 | | 30% | | $ | 2,928 | | 28% | | $ | 1,355 | | 41% | | $ | 440 | | 49 % | | $ | 677 | | 11% |
Engines1 | | 2,389 | | 29% | | | 1,200 | | 38% | | | 743 | | 33% | | | 157 | | (19)% | | | 289 | | 28% |
Financial Products2 | | 550 | | 15% | | | 390 | | 16% | | | 87 | | 4% | | | 31 | | 3 % | | | 42 | | 50% |
|
|
| | | |
|
| | | |
|
| | | |
|
| | | |
|
| | |
| | $ | 8,339 | | 29% | | $ | 4,518 | | 29% | | $ | 2,185 | | 36% | | $ | 628 | | 21 % | | $ | 1,008 | | 17% |
|
|
| | | |
|
| | | |
|
| | | |
|
| | | |
|
| | |
1Does not include internal engine transfers of $619 million and $484 million in 2005 and 2004, respectively. Internal engine transfers are valued at prices comparable to those for unrelated parties. |
2Does not include revenues earned from Machinery and Engines of $62 million and $39 million in 2005 and 2004, respectively. |
|
22
Machinery sales were $5.40 billion in first quarter 2005, a $1.25 billion or 30 percent increase over first quarter 2004, and a record for any quarter. Sales volume was up about 24 percent. Improved price realization accounted for about 4 percent of the sales change, while the remainder of the sales change was due to the favorable impact of currency. A portion of the higher volume was due to an increase in dealer inventories, which was the result of more machines in transit or dealer preparation to support future deliveries. Dealer inventories, relative to dealer deliveries to end users, were marginally lower than a year earlier.
| · | North America sales were up 28 percent over first quarter 2004, with sales volume up about 24 percent and the remainder due to improved price realization. Sales volume benefited from strong demand in all applications.Housing construction increased in response to low mortgage interest rates and there is a large backlog of unused permits. Nonresidential construction benefited from healthy business cash flows. Both coal and metals prices and production increased, driving sizable increases into mining deliveries. |
| · | EAME sales in first quarter 2005 were 41 percent higher than a year earlier. Volume, up about 29 percent, was the biggest contributor. The favorable impact of currency added about 6 percent and improved price realization added the remainder. Low interest rates in Europe are beginning to revive construction, and both Africa/Middle East (AME) and the CIS continued to benefit from high energy and metals prices and production.Both AME and the CIS are investing in new capacity and upgrading infrastructure. |
| · | Latin America first quarter sales were 49 percent higher than a year earlier. Volume contributed about 41 percent, improved price realization added about 7 percent and the remainder was due to currency. Mining benefited from higher prices and production while low interest rates, increased spending on infrastructure and better economic growth boosted construction. |
| · | Asia/Pacific sales were up 11 percent over first quarter 2004. Increased volume contributed about 8 percent, improved price realization added about 2 percent and the remainder was due to currency. Volume in China declined, but was largely offset by increases in Australia and Indonesia. Coal mining increased sharply in Australia and Indonesia, benefiting from higher coal prices. |
Engines Sales
Engines sales were $2.39 billion in first quarter 2005, a $539 million or 29 percent increase over first quarter 2004. Sales volume was up about 23 percent, improved price realization accounted for about 4 percent and the remainder was due to the favorable impact of currency.
| · | North America sales were up 38 percent over first quarter 2004. Sales of on-highway truck engines increased 33 percent, as truck manufacturers successfully increased line rates to serve an ongoing expansion and replacement cycle driven by high average fleet age, high freight demand, and improved freight carrier profitability. Sales of engines to the petroleum sector increased 54 percent compared to last year, with widespread increases in sales of engines to gas compression, and Original Equipment Manufacturer (OEM) equipment for drilling and well servicing, supported by higher energy prices. Sales of engines to the marine sector increased 59 percent, benefiting from strengthening workboat activity. Sales of engines to the electric power sector gained 3 percent with increased demand for critical standby generator sets to support sustainability for telecommunications and financial service applications. Sales of reciprocating engines were partially offset by reduced turbine sales as fuel prices increased faster than electricity rates.Dealer inventories of reciprocating engines increased above selling rates due to higher levels of in-transit inventory with increasing volume. |
| · | EAME sales were up 33 percent over first quarter 2004. Sales of engines into the electric power sector increased 65 percent due to widespread increased demand for prime, cogeneration and standby systems, ongoing Middle East reconstruction demand, and sales resulting from the acquisition of Turbomach. Sales of engines to the industrial sector increased 26 percent due to strong demand for various types of OEM equipment and the favorable impact of currency. In addition, the comparison is with a reduced first quarter 2004 base that was impacted by the fourth quarter 2003 pre-buy of engines prior to the implementation of European Tier II emissions regulations. Sales of engines to the marine sector increased 73 percent, with increased demand for inland waterways workboats and larger engines for oceangoing vessels, as well as the favorable effects of currency.Dealer inventories increased above selling rates due to increasing volume, increased installation time associated with more complex applications, and some investment in inventory from previously reduced levels to serve ongoing demand increases. |
23
| · | Latin Americasales decreased 19 percent versus first quarter 2004, with decreases in most sectors. Sales of marine engines decreased 60 percent, with all of the reduction due to the absence of a large marine project that occurred in 2004. Sales of electric power engines in Latin America decreased 9 percent, while sales of engines to the petroleum sector decreased 4 percent. Dealer inventory increased above selling rates primarily due to higher levels of in-transit inventory in the delivery process. |
| · | Asia/Pacific sales were up 28 percent over first quarter 2004 with increases in all sectors, led by a 36 percent increase in sales of petroleum engines, with all of the increase coming from turbines and turbine related services to support increased exploration and production. Sales of engines to the marine sector increased 49 percent with strong demand for oceangoing, pleasure craft and offshore supply vessels, followed by a 9 percent increase in sales of electric power engines.Current months of sales of dealer inventory are above first quarter 2004 due to higher levels of in-transit inventory in the delivery process. |
Financial Products Revenues
Financial Products revenues were $550 million, an increase of $72 million or 15 percent from first quarter 2004. The increase in revenues was due primarily to a $65 million favorable impact from continued growth ofEarning Assets at Cat Financial.
OPERATING PROFIT
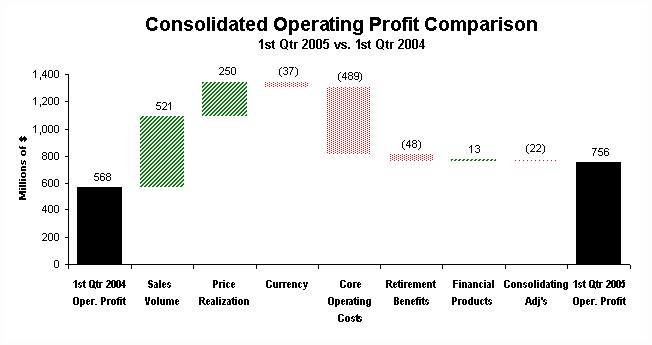 |
The chart above graphically illustrates reasons for the change in Consolidated Operating Profit between 1st Quarter 2004 (at left) and 1st Quarter 2005 (at right). Items favorably impacting operating profit appear as upward stair steps with the corresponding dollar amounts above each bar, while items negatively impacting operating profit appear as downward stair steps with dollar amounts reflected in parentheses above each bar. Caterpillar management utilizes these charts internally to visually communicate with its Board and employees. |
Higher sales volume in all regions resulted in a favorable operating profit impact of $521 million, and improved price realization favorably impacted operating profit by $250 million, which more than offset increases in material costs. Improved profitability of $13 million at Financial Products also contributed to the increase in operating profit.
Partially offsetting the favorable items were $489 million in higher core operating costs, $48 million of higher retirement benefits and a $37 million unfavorable impact of currency on operating profit. Manufacturing costs represented $439 million of the total increase in core operating costs.Roughly two-thirds of the manufacturing cost increase was attributable to variable cost increases - 75 percent of which resulted from higher material costs (primarily steel) with the remainder related to supply chain inefficiencies. The other one-third of the increase in manufacturing costs was the result of a 15 percent, or approximately $100 million, increase in period manufacturing costs to support a 30 percent increase in Machinery and Engine Sales and a United Auto Workers (UAW) contract ratification payment.
We continued to satisfy our customers in 2005 by delivering record first-quarter sales. The core operating cost increase reflected above was largely attributable to increases in manufacturing costs to meet this demand. These additional manufacturing costs included higher material costs resulting primarily from steel-related increases, higher manufacturing costs to support increased volume, inefficiencies due to supply constraints, a UAW contract ratification payment, and higher freight and expediting costs to ensure timely delivery of material. The remainder of the core operating cost increase was mainly due to planned spending on general support programs.
24
|
Operating Profit by Principal Line of Business |
(Millions of dollars) | 1st Quarter 2004 | | 1st Quarter 2005 | | Change $ |
|
| |
| |
|
Machinery1 | $ | 441 | | | $ | 496 | | | $ | 55 | |
Engines1 | | 41 | | | | 183 | | | | 142 | |
| Financial Products | | 111 | | | | 124 | | | | 13 | |
Consolidating Adjustments | | (25 | ) | | | (47 | ) | | | (22 | ) |
|
|
|
| |
|
|
| |
|
|
|
| Consolidated Operating Profit | $ | 568 | | | $ | 756 | | | $ | 188 | |
|
|
|
| |
|
|
| |
|
|
|
1 Caterpillar operations are highly integrated; therefore, the company uses a number of allocations to determine lines of business operating profit for Machinery and Engines. |
|
Operating Profit by Principal Line of Business
| · | Machineryoperating profit of $496 million was up $55 million, or 12 percent, from first quarter 2004. The favorable impact of higher sales volume and improved price realization was partially offset by higher core operating costs, higher retirement benefits and the unfavorable impact of currency. |
| · | Enginesoperating profit of $183 million was up $142 million, or 346 percent, from first quarter 2004. The favorable impact of higher sales volume and improved price realization was partially offset by higher core operating costs, higher retirement benefits and the unfavorable impact of currency. |
| · | Financial Productsoperating profit of $124 million was up $13 million, or 12 percent, from first quarter 2004. The increase was primarily due to a $30 million impact from the growth of earning assets, partially offset by an $11 million increase in operating expenses primarily related to growth, at Cat Financial. |
|
Reconciliation of Machinery and Engine Sales by Geographic Region to External Sales by Marketing Segment |
| | Three months ended March 31, |
(Millions of Dollars) | 2005 | | 2004 |
|
| |
|
North American Geographic Region | $ | 4,128 | | | $ | 3,153 | |
Engine sales included in the Power Products segment | | (1,200 | ) | | | (870 | ) |
Company owned dealer sales included in the All Other segment | | (201 | ) | | | (123 | ) |
| Other* | | (146 | ) | | | (123 | ) |
|
|
|
| |
|
|
|
North American Marketing external sales | $ | 2,581 | | | $ | 2,037 | |
|
|
|
| |
|
|
|
EAME Geographic Region | $ | 2,098 | | | $ | 1,522 | |
| Power Products sales not included in the EAME Marketing segment | | (672 | ) | | | (533 | ) |
| Other* | | (313 | ) | | | (160 | ) |
|
|
|
| |
|
|
|
EAME Marketing external sales | $ | 1,113 | | | $ | 829 | |
|
|
|
| |
|
|
|
Latin America Geographic Region | $ | 597 | | | $ | 490 | |
| Power Products sales not included in the Latin America Marketing segment | | (167 | ) | | | (185 | ) |
| Other* | | 58 | | | | 41 | |
|
|
|
| |
|
|
|
Latin America Marketing external sales | $ | 488 | | | $ | 346 | |
|
|
|
| |
|
|
|
Asia/Pacific Geographic Region | $ | 966 | | | $ | 837 | |
Power Products sales not included in the Asia/Pacific Marketing segment | | (192 | ) | | | (139 | ) |
| Other* | | (176 | ) | | | (165 | ) |
|
|
|
| |
|
|
|
Asia/Pacific Marketing external sales | $ | 598 | | | $ | 533 | |
|
|
|
| |
|
|
|
* Mostly represents external sales of Construction and Mining Products and All Other segments. |
|
25
OTHER PROFIT/LOSS ITEMS
| · | Other income/expensewasincome of $108 million compared with income of $61 million in first quarter 2004 for a favorable impact of $47 million. The change was primarily due to the favorable impact of currency gains of $41 million. This, combined with the $37 million unfavorable impact on operating profit, created anet favorable impact of currency on profit before tax of $4 million. |
| · | The provision for income taxes in the first quarter reflects an estimated annual tax rate of 29 percent for 2005. We are anticipating a 29 percent rate for the full year compared to 27 percent in 2004 primarily due to the impact of the phase-out provision of the American Jobs Creation Act permitting only 80 percent of Extraterritorial Income Exclusion (ETI) benefits in 2005 as well as a change in our geographic mix of profits. |
| · | The equity in profit/loss of unconsolidated affiliated companies favorably impacted profit by $8 million over first quarter 2004, primarily driven by increased profitability at Shin Caterpillar Mitsubishi Ltd. (SCM). |
UAW LABOR AGREEMENT
In January 2005 the company and about 9,000 employees represented by the United Auto Workers reached a new six-year labor agreement that will expire on March 1, 2011. This agreement positions the company and all our employees for long-term competitiveness. While the initial impact will be about a $100 million increase in retirement benefits in 2005, with the establishment of a very competitive market-based new hire wage package, the introduction of employee and retiree health care cost-sharing and other operational effectiveness improvements, we believe we have a long-term cost structure that enables us to compete from our traditional manufacturing and logistics locations. See additional information on the UAW Labor Agreement under Retirement Benefits on pages 32 to 33.
GLOSSARY OF TERMS
| 1. | Consolidating Adjustments - Eliminations of transactions between Machinery and Engines and Financial Products. |
| 2. | Core Operating Costs - Machinery and Engines operating cost change adjusted for volume. It excludes the impact of currency and retirement benefits. |
| 3. | Currency - With respect to sales and revenues, currency represents the translation impact on sales resulting from changes in foreign currency exchange rates versus the U.S. dollar. With respect to operating profit, currency represents the net translation impact on sales and operating costs resulting from changes in foreign currency exchange rates versus the U.S. dollar. With respect to profit before tax, currency represents the net translation impact on sales, operating costs and other income/expense resulting from changes in foreign currency exchange rates versus the U.S. dollar. Also included in the currency impact on other income/expense are the effects of currency forward and option contracts entered into by the company to reduce the risk of fluctuations in exchangerates and the net effect of changes in foreign currency exchange rates on our foreign currency assets and liabilities. Currency includes the impacts on sales and operating profit for the Machinery and Engines lines of business only; currency impacts on the Financial Products line of business are included in the Financial Products portions of the respective analyses. |
| 4. | EAME - Geographic region including Europe, Africa, the Middle East and the Commonwealth of Independent States (CIS). |
| 5. | Earning Assets - These assets consist primarily of total net finance receivables plus retained interests in securitized trade receivables, plus equipment on operating leases, less accumulated depreciation at Cat Financial. Net finance receivables represent the gross receivables amount less unearned income and the allowance for credit losses. |
| 6. | Engines- A principal line of business including the design, manufacture, marketing and sales of engines for Caterpillar machinery, electric power generation systems; on-highway vehicles and locomotives; marine, petroleum, construction, industrial, agricultural and other applications; and related parts. Reciprocating engines meet power needs ranging from 5 to over 22,000 horsepower (4 to over 16 200 kilowatts). Turbines range from 1,200 to 20,500 horsepower (900 to 15 000 kilowatts). |
| 7. | Financial Products - A principal line of business consisting primarily of Caterpillar Financial Services Corporation (Cat Financial), Caterpillar Insurance Holdings, Inc. (Cat Insurance), Caterpillar Power Ventures Corporation (Cat Power Ventures) and their respective subsidiaries. Cat Financial provides a wide range of financing alternatives to customers and dealers for Caterpillar machinery and engines, Solar gas turbines, as well as other equipment and marine vessels. Cat Financial also extends loans to customers and dealers. Cat Insurance provides various forms of insurance to customers and dealers to help support the purchase and lease of our equipment. Cat Power Ventures is an active investor in independent power projects using Caterpillar power generation equipment and services. |
| 8. | Latin America - Geographic region including the Central and South American countries and Mexico. |
| 9. | Machinery - A principal line of business which includes the design, manufacture, marketing and sales of construction, mining and forestry machinery - track and wheel tractors, track and wheel loaders, pipelayers, motor graders, wheel tractor-scrapers, track and wheel excavators, backhoe loaders, log skidders, log loaders, off-highway trucks, articulated trucks, paving products, telescopic handlers, skid steer loaders and related parts. Also includes logistics services for other companies. |
| 10. | Machinery and Engines- Due to the highly integrated nature of operations, represents the aggregate total of the Machinery and Engines lines of business and includes primarily our manufacturing, marketing and parts distribution operations. |
| 11. | Price Realization - The impact of net price changes excluding currency. |
| 12. | Retirement Benefits- Cost of defined benefit pension plans, defined contribution plans and retirement healthcare and life insurance. |
| 13. | Sales Volume - With respect to sales and revenues, sales volume represents the impact of changes in the quantities sold for machines, engines and parts. With respect to operating profit, sales volume represents the impact of changes in the quantities sold for machines, engines and parts combined with the net operating profit impact of changes in the relative weighting of machines, engines and parts sales with respect to total sales. |
| 14. | 6 Sigma - On a technical level, 6 Sigma represents a measure of variation that achieves 3.4 defects per million opportunities. At Caterpillar, 6 Sigma represents a much broader cultural philosophy to drive continuous improvement throughout the value chain. It is a fact-based, data-driven methodology that we are using to improve processes, enhance quality, cut costs, grow our business and deliver greater value to our customers through Black Belt-led project teams. At Caterpillar, 6 Sigma goes beyond mere process improvement; it has become the way we work as teams to process business information, solve problems and manage our business successfully. |
C. Liquidity & Capital Resources
Sources of funds
We generate our capital resources primarily through operations and the collections of certificated retained interests in trade receivables. Collections of certificated retained interests take place when Cat Financial collects cash on their portion of the securitized trade receivables they have placed in a trust. In the first quarter of 2005, operating cash flow was $179 million. In the first quarter of 2004, operating cash flow was negative $2.2 billion, and collections of certificated retained interests in trade receivables were $2.0 billion totaling negative $202 million. The increase from negative $202 million in the first quarter of 2004 to positive $179 million in the first quarter of 2005 is primarily the result of higher profitability and lower working capital requirements. For the first quarter of 2005, we did not have collections of certificated retained interests in trade receivables because the trust did not meet the criteria for a qualifying special purpose entity (QSPE) during that timeframe. We therefore consolidated the trust and included the assets and related cash flows in “Receivables—trade and other” in the Consolidated Statement of Financial Position and the Consolidated Statement of Cash Flow, respectively.
First quarter 2005 and 2004 operating cash flow was negatively impacted by inventory growth and incentive compensation payouts. Short-term incentive compensation payouts (paid annually in the first quarter) were $461 million and $335 million in 2005 and 2004, respectively. Seasonal inventory growth has been more significant the last two years due to increased sales and high production volumes, which have resulted in key component shortages and delayed shipments.
We anticipate that the majority of future capital resource requirements will be funded by operating cash flow, which is largely sourced from profits. See our Outlook on page 40.
Total debt as of March 31, 2005, was $24.4 billion, an increase of $909 million from year-end 2004. Debt related to Machinery and Engines increased $187 million. Debt related to Financial Products increased $722 million due to growth at Cat Financial. We have two global credit facilities with a syndicate of banks totaling $5.0 billion available in the aggregate to both Machinery and Engines and Financial Products to support commercial paper programs. Based on management's allocation decision, which can be revised at any time, the portion of the facility available to Cat Financial at March 31, 2005 was $4.4 billion. The five-year facility of $2.5 billion expires in September 2009. The 364-day facility of $2.5 billion expires in September 2005. The facility expiring in September 2005 has a provision that allows Caterpillar or Cat Financial to obtain a one-year loan in September 2005 that would mature in September 2006. Our total credit commitments as of March 31, 2005 were:
|
| | | | Machinery | | Financial |
(Millions of dollars) | Consolidated | | and Engines | | Products |
|
| |
| |
|
| Credit lines available: | | | | | | | | | | | |
| | Global credit facility | $ | 5,000 | | | $ | 600 | | | $ | 4,400 | |
| | Other external | | 2,046 | | | | 771 | | | | 1,275 | |
| |
| |
| |
|
| Total credit lines available | | 7,046 | | | | 1,371 | | | | 5,675 | |
| Less: Global credit facility supporting commercial paper | | 4,458 | | | | 235 | | | | 4,223 | |
| Less: Utilized credit | | 526 | | | | 101 | | | | 425 | |
|
|
|
| |
|
|
| |
|
|
|
| Available credit | $ | 2,062 | | | $ | 1,035 | | | $ | 1,027 | |
|
|
|
| |
|
|
| |
|
|
|
|
We also generate funding through the securitization and sale of receivables/leases where the investors and/or the securitization trusts have limited or no recourse to Caterpillar or Cat Financial. During the first quarter of 2005 Cat Financial sold retail finance leases with servicing retained; proceeds of $10 million were received from the sale of such contracts.
We do not generate material funding through structured finance transactions.
Machinery and Engines
Net cash used for operating activities was $114 million compared with $149 million for the same period a year ago. The favorable change is due to higher profit, which was partially offset by higher working capital requirements in the first quarter of 2005.
Pursuant to the share repurchase program authorized by the Board of Directors in October 2003, $357 million was spent to purchase 3.9 million shares during the first quarter of 2005. There were 342 million shares outstanding at the end of the first quarter 2005. The goal of the share repurchase program, which expires in October 2008, is to reduce the company’s outstanding shares to 320 million.
Capital expenditures, excluding equipment leased to others, during the three months ended March 31, 2005 were $158 million, an increase of $57 million from the same period a year ago. The increase is a result of increased spending to support growth and new product introductions.
Financial Products
Operating cash flow was $313 million through the first quarter 2005, compared with $277 million for the same period a year ago. The increase is the result of lower working capital requirements and an increase in profit through the first quarter 2005 as compared to the same period a year ago. Cash used to purchase equipment leased to others was $238 million during the first quarter of 2005 compared to $240 million for the first quarter of 2004. In addition, net cash used for finance receivables was $666 million for the first quarter of 2005, compared to $399 million for the first quarter of 2004.
Financial Products total borrowings were $20.5 billion at March 31, 2005, an increase of $722 million from December 31, 2004 due to financing a higher amount of assets. Debt repayment in Financial Products depends primarily on timely repayment and collectibility of the receivables portfolio. At March 31, 2005, finance receivables past due over 30 days were 1.94 percent, compared with 2.82 percent at the end of March 31, 2004. The allowance for credit losses was 1.38 percent of finance receivables, net of unearned income, at March 31, 2005, compared to 1.48 percent at March 31, 2004. Receivables written off due to uncollectibility, net of recoveries on receivables previously written off, were $5 million and $11 million for the three months ended March 31, 2005 and 2004, respectively.
On April 28, 2005, Cat Financial completed a public securitization of retail installment sale contracts and finance leases. The net proceeds, including cash proceeds and retained interests, were $850 million and the net gain was $12 million.
2004 Cash Flow Reclassification
In the fourth quarter of 2004, we changed how we classify cash flows related to trade receivables securitized through Cat Financial and wholesale inventory receivables financed by Cat Financial. 2003 and 2002 amounts reported in our 2004 Consolidated Statement of Cash Flow were reclassified to conform to the 2004 presentation. These reclassifications had no impact on the Increase in Cash and Short-term Investments on the Consolidated Statement of Cash Flow.
The Consolidated Statement of Cash Flow for the three months ended March 31, 2004 has been reclassified to conform with the 2005 presentation as follows:
|
(Millions of dollars) | Previously Reported | | Change | | As Reclassified |
|
| |
| |
|
Consolidated Statement of Cash Flow | | | | | | | | | | | |
| Receivables - trade and other | $ | (197 | ) | | $ | (2,301 | ) | | $ | (2,498 | ) |
Net cash provided by (used for) operating activities | | 98 | | | | (2,301 | ) | | | (2,203 | ) |
| Additions to finance receivables | | (4,812 | ) | | | 2,946 | | | | (1,866 | ) |
| Collections of finance receivables | | 3,854 | | | | (2,382 | ) | | | 1,472 | |
| Proceeds from sale of finance receivables | | 264 | | | | (264 | ) | | | - | |
| Collections of retained interests in securitized trade receivables | | - | | | | 2,001 | | | | 2,001 | |
Net cash provided by (used for) investing activities | | (912 | ) | | | 2,301 | | | | 1,389 | |
|
D. Critical Accounting Policies
The preparation of financial statements in conformity with generally accepted accounting principles requires management to make estimates and assumptions that affect reported amounts. The more significant estimates include: residual values for leased assets, fair market values for goodwill impairment tests, and reserves for warranty, product liability and insurance losses, postretirement benefits, post-sale discounts, credit losses and income taxes. We have incorporated many years of data into the determination of each of these estimates and we have not historically experienced significant adjustments. These assumptions are reviewed at least annually with the Audit Committee of the Board of Directors. Following are the methods and assumptions used in determining our estimates and an indication of the risks inherent in each.
Residual values for leased assets- Determined based on the product, specifications, application and hours of usage. Each product has its own model for evaluation that includes market value cycles and forecasts. Consideration is also given to the amount of assets that will be returned from lease during a given time frame. Residual values could decline due to economic factors, obsolescence or other adverse circumstances.
Fair market values for goodwill impairment tests -Determined for each reporting unit by discounting projected cash flow for five years and adding a year-five residual value based upon a market Earnings Before Interest, Taxes, Depreciation and Amortization (EBITDA) multiple. The estimated fair value could be impacted by changes in interest rates, growth rates, costs, capital expenditures and market conditions.
Warranty reserve- Determined by applying historical claim rate experience to the current field population and dealer inventory. Historical claim rates are developed using a rolling average of actual warranty payments. Effective in the third quarter of 2004, we refined our process to utilize more detailed claim rates by product. This provides more comprehensive product warranty information for management. This change did not have a material impact on our financial statements. Warranty payments may differ from those estimated if actual claim rates are higher or lower than our historical rates.
Product liability and insurance loss reserve -Determined based upon reported claims in process of settlement and actuarial estimates for losses incurred but not reported. Loss reserves, including incurred but not reported reserves, are based on estimates and ultimate settlements may vary significantly from such estimates due to increased claims frequency or severity over historical levels.
Postretirement benefits - Primary actuarial assumptions are determined as follows:
| · | The U.S. expected long-term rate of return on plan assets is based on our estimate of long-term passive returns for equities and fixed income securities weighted by the allocation of our plan assets. Based on historical performance, we increase the passive returns due to our active management of the plan assets. A similar process is used to determine the rate for our non-U.S. pension plans. This rate is impacted by changes in general market conditions, but because it represents a long-term rate, it is not significantly impacted by short-term market swings. Changes in our allocation of plan assets would also impact this rate. For example, a shift to more fixed income securities would lower the rate. A decrease in the rate would increase our expense. |
| · | The assumed discount rate is used to discount future benefit obligations back to today's dollars. The U.S. discount rate is based on the Moody's Aa bond yield as of our measurement date, November 30, and represents the rate at which our benefit obligations could effectively be settled. A similar process is used to determine the assumed discount rate for our non-U.S. plans. This rate is sensitive to changes in interest rates. A decrease in the discount rate would increase our obligation and future expense. |
| · | The expected rate of compensation increase is used to develop benefit obligations using projected pay at retirement. It represents average long-term salary increases. This rate is influenced by our long-term compensation policies. An increase in the rate would increase our obligation and expense. |
| · | The assumed health care trend rate represents the rate at which health care costs are assumed to increase and is based on historical and expected experience. Changes in our projections of future health care costs due to general economic conditions and those specific to health care (e.g. technology driven cost changes) will impact this trend rate. An increase in the trend rate would increase our obligation and expense. |
Post-sale discount reserve - The company extends numerous merchandising programs that provide discounts to dealers as products are sold to end users. The reserve is determined based on historical data adjusted for known changes in merchandising programs. Discounts paid may differ from those estimated if actual program usage is higher or lower than our historical or expected rates.
Credit loss reserve- The allowance for credit losses is evaluated on a regular basis and adjusted based upon management’s best estimate of probable losses inherent in our finance receivables. In estimating probable losses, we review accounts that are past due, non-performing, or in bankruptcy. We also review accounts that may be at risk using information available about the customer, such as financial statements, news reports, and published credit ratings. We also use general information regarding industry trends and the general economic environment. Using an estimate of current fair market value of collateral and factoring in credit enhancements, such as additional collateral and third party guarantees, we arrive at an estimated loss for specific accounts and estimate an additional amount for the remainder of the finance receivables based upon historical trends. Adverse economic conditions or other factors that might cause deterioration of the financial health of our customers could change the timing and level of payments received and thus necessitate a change in our estimated losses.
Income tax reserve- Despite our belief that our tax return positions are consistent with applicable tax law, we believe that certain positions are likely to be challenged by taxing authorities. Settlement of any challenge can result in no change, a complete disallowance, or some partial adjustment reached through negotiations or litigation. Significant judgment is required in evaluating our tax reserves. Our reserves are adjusted in light of changing facts and circumstances, such as the progress of our tax audits. Our income tax expense includes the impact of reserve provisions and changes to reserves that we consider appropriate, as well as related interest. Unfavorable settlement of any particular issue would require use of our cash. Favorable resolution would be recognized as a reduction to income tax expense at the time of resolution.
EMPLOYMENT
At the end of the first quarter of 2005, Caterpillar's worldwide employment was 79,988 compared with 70,815 one year ago. The increase is primarily due to approximately 3,500 hourly labor additions to support increased volume, the conversion of approximately 2,000 supplemental employees to full-time employment in our Midwestern U.S. facilities, and the addition of approximately 2,000 employees from acquisitions and growing Caterpillar Logistics operations.
Environmental and Legal Matters
The company is regulated by federal, state, and international environmental laws governing our use of substances and control of emissions in all our operations. Compliance with these existing laws has not had a material impact on our capital expenditures or earnings.
We are cleaning up hazardous waste at a number of locations, often with other companies, pursuant to federal and state laws. When it is likely we will pay clean-up costs at a site and those costs can be estimated, the costs are charged against our earnings. In formulating that estimate, we do not consider amounts expected to be recovered from insurance companies and others.
The amount recorded for environmental clean up is not material and is included in "Accrued expenses" in the Statement of Financial Position. If a range of liability estimates is available on a particular site, we accrue at the lower end of that range. We cannot estimate costs on sites in the very early stages of clean up. Currently, we have several sites in the very early stages of clean up, and there is no more than a remote chance that a material amount for clean up will be required.
Pursuant to a consent decree Caterpillar entered into with the EPA, the company was required to pay a fine of $25 million, which was expensed in 1998 and to make investments totaling $35 million in environmental-related products by July 7, 2007. During the first quarter of 2005, Caterpillar made qualifying investments of $3.1 million surpassing its investment requirement in environmental-related products with an accumulated investment of $38 million. A future benefit is expected to be realized from these environmental projects related to Caterpillar's ability to capitalize on the technologies it developed in complying with its environmental project obligations. In short, Caterpillar expects to receive a positive net return on the environmental projects by being able to market the technology it developed.
We are a party to litigation matters and claims that are normal in the course of our operations, and, while the results of such litigation and claims cannot be predicted with certainty, management believes, based on the advice of counsel, the final outcome of any single proceeding or all proceedings in the aggregate would not have a materially adverse effect on our consolidated financial position or results of operations or cash flows.
On January 16, 2002, Caterpillar commenced an action in the Circuit Court of the Tenth Judicial Circuit of Illinois in Peoria, Illinois, against Navistar International Transportation Corporation and International Truck and Engine Corporation (collectively Navistar). The lawsuit arises out of a long-term purchase contract between Caterpillar and Navistar effective May 31, 1988, as amended from time to time (the Purchase Agreement). The pending complaint alleges that Navistar breached its contractual obligations by: (i) paying Caterpillar $8.08 less per fuel injector than the agreed upon price for new unit injectors delivered by Caterpillar; (ii) refusing to pay contractually agreed upon surcharges owed as a result of Navistar ordering less than planned volumes of replacement unit injectors; and (iii) refusing to pay contractually agreed upon interest stemming from Navistar's late payments. As of March 31, 2005, the net past due receivable from Navistar regarding the foregoing and included in “Long-term receivables - trade and other” in the Consolidated Statement of Financial Position totaled $139 million. The pending complaint also has claims alleging that Newstream Enterprises and Navistar, collectively and individually, failed to pay the applicable price to Caterpillar for shipments of unit injectors to Newstream. In January 2005, Caterpillar and Franklin Power Products, Inc. resolved claims similar to those currently pending against Newstream, and Franklin has been dismissed from the lawsuit. As of March 31, 2005, the net past due receivables for the foregoing, included in “Long-term receivables - trade and other” in the Consolidated Statement of Financial Position totaled $12 million. The pending complaint further alleges that Sturman Industries, Inc. and Sturman Engine Systems, Inc. colluded with Navistar to utilize technology that Sturman Industries, Inc. misappropriated from Caterpillar to help Navistar develop its G2 fuel system, and tortiously interfered with the Purchase Agreement and Caterpillar's prospective economic relationship with Navistar. The pending complaint further alleges that the two parties' collusion led Navistar to select Sturman Engine Systems, Inc., and another company, instead of Caterpillar, to develop and manufacture the G2 fuel system.
On May 7, 2002 International Truck and Engine Corporation (International) commenced an action against Caterpillar in the Circuit Court of DuPage County, Illinois regarding a long-term agreement term sheet ("term sheet"). In its sixth amended complaint, International alleges that the term sheet constitutes a legally binding contract for the sale of heavy-duty engines at specified prices through the end of 2006, alleges that Caterpillar breached the term sheet by, among other things, raising certain prices effective October 1, 2002, and also alleges that Caterpillar breached an obligation to negotiate a comprehensive long-term agreement referenced in the term sheet. International seeks declaratory and injunctive relief as well as damages in an amount to be determined at trial. Caterpillar denies International's claims and has filed a counterclaim seeking a declaration that the term sheet has been effectively terminated. Caterpillar also asserts that pursuant to a subsequent agreement International has released Caterpillar from certain of its claims. On September 24, 2003 the Appellate Court of Illinois, ruling on an interlocutory appeal, issued an order consistent with Caterpillar's position that, even if the court subsequently determines that the term sheet is a binding contract, it is indefinite in duration and was therefore terminable at will by Caterpillar upon reasonable notice. On April 12, 2005 International commenced a second, related action against Caterpillar in the Circuit Court of DuPage County, Illinois. The second lawsuit contains allegations that are similar to the allegations contained in the first lawsuit filed in May, 2002. International also alleges that Caterpillar materially breached the subsequent agreement. No trial dates are currently scheduled for either of the cases pending in the Circuit Court of DuPage County. Neither of these cases are related to the breach of contract action brought by Caterpillar against Navistar which is currently pending in the Circuit Court of Peoria County, Illinois.
In a letter dated November 15, 2004, the EPA proposed a civil penalty of $641,392 to Caterpillar for the alleged failure to comply with certain requirements of the Federal Clean Air Act. The EPA alleges that Caterpillar constructed a facility in Emporia, Kansas, and failed to comply with Section 112(g)(2)(B) of the Clean Air Act. Caterpillar sold the Emporia facility in December 2002. We are seeking a settlement of this matter with all concerned parties and the company believes the outcome will not have a material impact on our financial statements.
E. Retirement Benefits
We recognizedpension expense of $96 million for the three months ended March 31, 2005, as compared to $74 million for the three months ended March 31, 2004. The increase in expense was primarily a result of both the amortization of actuarial losses resulting from a declining discount rate and plan changes from the new UAW labor agreement (discussed below), partially offset by the impact of expected asset returns on plan assets. SFAS 87, “Employers’ Accounting for Pensions” requires companies to discount future benefit obligations back to today’s dollars using a discount rate that is based on high-quality fixed-income investments. A decrease in the discount rate increases the pension benefit obligation. This increase is amortized into earnings as an actuarial loss. SFAS 87 also requires companies to use an expected long-term rate of asset return for computing current year pension expense. Differences between the actual and expected returns are amortized into earnings as actuarial gains and losses. At the end of 2004, unrecognized actuarial losses related to pension were $3.28 billion. The majority of the unrecognized actuarial losses are due to declining discount rates in recent years.
Other postretirement benefit expense was $89 million in first quarter 2005, as compared to $67 million in the first quarter 2004. The increase in expense is primarily the result of plan changes from the new UAW labor agreement, and the amortization of actuarial losses resulting from an increase in expected health care inflation and a declining discount rate. Unrecognized actuarial losses for other postretirement benefit plans were $1.23 billion at the end of 2004. These losses reflect a declining discount rate, an increase in expected health care inflation and higher than expected benefit costs.
The unrecognized actuarial losses for both pensions and other postretirement benefits will be impacted in future periods by actual asset returns, actual health care inflation, discount rate changes and other factors that impact these expenses. These losses will be amortized on a straight-line basis over the average remaining service period of active employees expected to receive benefits under the benefit plans. At the end of 2004, the average remaining service period of active employees was 13 years for our U.S. pension plans, 12 years for our non-U.S. pension plans and 8 years for other postretirement benefit plans. We expect our amortization of net actuarial losses to increase approximately $100 million in 2005 as compared to 2004, primarily because of a decrease in the discount rate.
SFAS 87 requires the recognition of an Additional Minimum Liability if the market value of plan assets is less than the accumulated benefit obligation at the end of the measurement date. Future changes to the Additional Minimum Liability will be dependent on several factors including our assumed discount rate, actual returns on our pension plan assets, company contributions and benefit plan changes.
The agreement reached with the UAW in January 2005 included changes to both pension and other postretirement benefits. Pension plan changes included increases in basic benefit payments, increases in the allowance provided to employees who retire before age 62 as well as annual lump-sum payments to retirees during the first three years of the contract. Other postretirement benefit changes included several changes to our retiree medical plan design that resulted in a net increase in company cost sharing with retirees.
| · | Changes to the pension plan resulted in an increase in the pension obligation of approximately $230 million. This reflects a discount rate of 5.75%. The increase will be amortized into earnings on a straight-line basis over 10 years, the average remaining service period of active employees impacted by the plan change. In addition, there will be an ongoing increase in expense as a result of the benefit changes. In total, full year 2005 pension expense (and annual expense until the plan change is fully amortized) will increase approximately $30 million. In addition to the increase in pension expense, the plan changes increased the Additional Minimum Pension Liability by approximately $230 million. |
| · | Changes to the other postretirement plan resulted in an increase in the benefit obligation of approximately $620 million. This also reflects a discount rate of 5.75%. The increase will be amortized into earnings on a straight-line basis over 16 years, the average remaining life expectancy of plan participants that are fully eligible for benefits (as they comprise almost all of the plan). In addition, there will be an ongoing increase in expense as a result of the benefit changes. In total, full year 2005 other postretirement benefit expense (and annual expense until the plan change is fully amortized) will increase approximately $70 million. |
Although we have no ERISA funding requirements in 2005, we expect to make $30 million of voluntary cash contributions to fund our U.S. pension plans. (No U.S. plan contributions were made in the first quarter of 2005.) We made approximately $50 million of contributions to non-U.S. pension plans during the first three months ended March 31, 2005, and anticipate additional contributions of approximately $90 million during 2005. We have adequate liquidity resources to fund all U.S. and non-U.S. plans.
F. Supplemental Consolidating Data
We are providing supplemental consolidating data for the purpose of additional analysis. The data has been grouped as follows:
Consolidated - - Caterpillar Inc. and its subsidiaries.
Machinery and Engines -The Machinery and Engines data contained in the schedules on pages 34 to 39 are “non-GAAP financial measures” as defined by the Securities and Exchange Commission in Regulation G. These non-GAAP financial measures have no standardized meaning prescribed by U.S. GAAP, and therefore, are unlikely to be comparable with the calculation of similar measures for other companies. Management does not intend these items to be considered in isolation or as a substitute for the related GAAP measures. Caterpillar defines Machinery and Engines as it is presented in the supplemental data as Caterpillar Inc. and its subsidiaries with Financial Products accounted for on the equity basis. Machinery and Engines information relates to our design, manufacturing, marketing of our products. Financial Products information relates to the financing to customers and dealers for the purchase and lease of Caterpillar and other equipment. The nature of these businesses is different especially with regard to the financial position and cash flow items. Caterpillar management utilizes this presentation internally to highlight these differences. We also believe this presentation will assist readers in understanding our business.
Financial Products - our finance and insurance subsidiaries, primarily Cat Financial and Cat Insurance.
Consolidating Adjustments - eliminations of transactions between Machinery and Engines and Financial Products.
Pages 34 to 39 reconcile Machinery and Engines with Financial Products on the Equity Basis to Caterpillar Inc. Consolidated financial information. Certain amounts for prior periods have been reclassified to conform to the current period financial statement presentation.
|
Caterpillar Inc. Supplemental Data for Results of Operations For The Three Months Ended March 31, 2005 (Unaudited) (Millions of dollars) |
| | | | | Supplemental Consolidating Data |
| | | |
|
| | Consolidated | | Machinery and Engines1 | | Financial Products | | Consolidating Adjustments |
| |
| |
| |
| |
|
Sales and revenues: | | | | | | | | | | | | | | | |
| Sales of Machinery and Engines | $ | 7,789 | | | $ | 7,789 | | | $ | - | | | $ | - | |
| Revenues of Financial Products | | 550 | | | | - | | | | 612 | | | | (62 | )2 |
| |
|
|
| |
|
|
| |
|
|
| |
|
|
|
| Total sales and revenues | | 8,339 | | | | 7,789 | | | | 612 | | | | (62 | ) |
| | | | | | | | | | | | | | | | |
Operating costs: | | | | | | | | | | | | | | | |
| Cost of goods sold | | 6,215 | | | | 6,215 | | | | - | | | | - | |
| Selling, general and administrative expenses | | 744 | | | | 648 | | | | 107 | | | | (11 | )3 |
| Research and development expenses | | 241 | | | | 241 | | | | - | | | | - | |
| Interest expense of Financial Products | | 170 | | | | - | | | | 173 | | | �� | (3 | )4 |
| Other operating expenses | | 213 | | | | 6 | | | | 208 | | | | (1 | )3 |
| |
|
|
| |
|
|
| |
|
|
| |
|
|
|
| Total operating costs | | 7,583 | | | | 7,110 | | | | 488 | | | | (15 | ) |
| |
|
|
| |
|
|
| |
|
|
| |
|
|
|
| | | | | | | | | | | | | | | | |
Operating profit | | 756 | | | | 679 | | | | 124 | | | | (47 | ) |
| | | | | | | | | | | | | | | | |
| Interest expense excluding Financial Products | | 65 | | | | 66 | | | | - | | | | (1 | )4 |
| Other income (expense) | | 108 | | | | 54 | | | | 8 | | | | 46 | 5 |
| |
|
|
| |
|
|
| |
|
|
| |
|
|
|
| | | | | | | | | | | | | | | | |
Consolidated profit before taxes | | 799 | | | | 667 | | | | 132 | | | | - | |
| | | | | | | | | | | | | | | | |
| Provision for income taxes | | 232 | | | | 186 | | | | 46 | | | | - | |
| |
|
|
| |
|
|
| |
|
|
| |
|
|
|
| Profit of consolidated companies | | 567 | | | | 481 | | | | 86 | | | | - | |
| | | | | | | | | | | | | | | | |
| Equity in profit (loss) of unconsolidated affiliated companies | | 14 | | | | 12 | | | | 2 | | | | - | |
| | Equity in profit of Financial Products' subsidiaries | | - | | | | 88 | | | | - | | | | (88 | )6 |
| |
|
|
| |
|
|
| |
|
|
| |
|
|
|
| | | | | | | | | | | | | | | | |
Profit | $ | 581 | | | $ | 581 | | | $ | 88 | | | $ | (88 | ) |
|
|
|
| |
|
|
| |
|
|
| |
|
|
|
1 Represents Caterpillar Inc. and its subsidiaries with Financial Products accounted for on the equity basis. |
2 Elimination of Financial Products revenues earned from Machinery and Engines. |
3 Elimination of net expenses recorded by Machinery and Engines paid to Financial Products. |
4 Elimination of interest expense recorded between Financial Products and Machinery and Engines. |
5 Elimination of discount recorded by Machinery and Engines on receivables sold to Financial Products and of interest earned between Machinery and Engines and Financial Products. |
6 Elimination of Financial Products profit due to equity method of accounting. |
|
|
Caterpillar Inc. Supplemental Data for Results of Operations For The Three Months Ended March 31, 2004 (Unaudited) (Millions of dollars) |
| | | | Supplemental Consolidating Data |
| | | |
|
| Consolidated | | Machinery and Engines1 | | Financial Products | | Consolidating Adjustments |
| |
| |
| |
| |
|
Sales and revenues: | | | | | | | | | | | | | | | |
| Sales of Machinery and Engines | $ | 6,002 | | | $ | 6,002 | | | $ | - | | | $ | - | |
| Revenues of Financial Products | | 478 | | | | - | | | | 517 | | | | (39 | )2 |
| |
|
|
| |
|
|
| |
|
|
| |
|
|
|
| Total sales and revenues | | 6,480 | | | | 6,002 | | | | 517 | | | | (39 | ) |
| | | | | | | | | | | | | | | | |
Operating costs: | | | | | | | | | | | | | | | |
| Cost of goods sold | | 4,701 | | | | 4,701 | | | | - | | | | - | |
| Selling, general and administrative expenses | | 673 | | | | 586 | | | | 99 | | | | (12 | )3 |
| Research and development expenses | | 231 | | | | 231 | | | | - | | | | - | |
| Interest expense of Financial Products | | 119 | | | | - | | | | 122 | | | | (3 | )4 |
| Other operating expenses | | 188 | | | | 2 | | | | 185 | | | | 1 | 3 |
| |
|
|
| |
|
|
| |
|
|
| |
|
|
|
| Total operating costs | | 5,912 | | | | 5,520 | | | | 406 | | | | (14 | ) |
| |
|
|
| |
| |
|
|
| |
|
|
|
| | | | | | | | | | | | | | | | |
Operating profit | | 568 | | | | 482 | | | | 111 | | | | (25 | ) |
| | | | | | | | | | | | | | | | |
| Interest expense excluding Financial Products | | 57 | | | | 58 | | | | - | | | | (1 | )4 |
| Other income (expense) | | 61 | | | | 34 | | | | 3 | | | | 24 | 5 |
| |
|
|
| |
|
|
| |
|
|
| |
|
|
|
| | | | | | | | | | | | | | | | |
Consolidated profit before taxes | | 572 | | | | 458 | | | | 114 | | | | - | |
| | | | | | | | | | | | | | | | |
| Provision for income taxes | | 158 | | | | 119 | | | | 39 | | | | - | |
| |
|
|
| |
|
|
| |
|
|
| |
|
|
|
| Profit of consolidated companies | | 414 | | | | 339 | | | | 75 | | | | - | |
| | | | | | | | | | | | | | | | |
| Equity in profit (loss) of unconsolidated affiliated companies | | 6 | | | | 5 | | | | 1 | | | | - | |
| Equity in profit of Financial Products' subsidiaries | | - | | | | 76 | | | | - | | | | (76 | )6 |
| |
|
|
| |
|
|
| |
|
|
| |
|
|
|
| | | | | | | | | | | | | | | | |
Profit | $ | 420 | | | $ | 420 | | | $ | 76 | | | $ | (76 | ) |
|
|
|
| |
|
|
| |
|
|
| |
|
|
|
1 Represents Caterpillar Inc. and its subsidiaries with Financial Products accounted for on the equity basis. |
2 Elimination of Financial Products revenues earned from Machinery and Engines. |
3 Elimination of net expenses recorded by Machinery and Engines paid to Financial Products. |
4 Elimination of interest expense recorded between Financial Products and Machinery and Engines. |
5 Elimination of discount recorded by Machinery and Engines on receivables sold to Financial Products and of interest earned between Machinery and Engines and Financial Products. |
6 Elimination of Financial Products profit due to equity method of accounting. |
|
|
Caterpillar Inc. Supplemental Data for Financial Position At March 31, 2005 (Unaudited) (Millions of dollars) |
| | | | | Supplemental Consolidating Data |
| | | |
|
| | | Consolidated | | Machinery and Engines1 | | Financial Products | | Consolidating Adjustments |
| |
| |
| |
| |
|
Assets: | | | | | | | | | | | | | | | |
| | Current assets: | | | | | | | | | | | | | | | |
| | | Cash and short-term investments | $ | 517 | | | $ | 346 | | | $ | 171 | | | $ | - | |
| | | Receivables - trade and other | | 7,517 | | | | 3,459 | | | | 984 | | | | 3,074 | 2,3 |
| | | Receivables - finance | | 5,188 | | | | - | | | | 9,383 | | | | (4,195 | )3 |
| | | Deferred and refundable income taxes | | 443 | | | | 374 | | | | 69 | | | | - | |
| | | Prepaid expenses | | 1,329 | | | | 1,324 | | | | 20 | | | | (15 | )4 |
| | | Inventories | | 5,230 | | | | 5,230 | | | | - | | | | - | |
| | |
|
|
| |
|
|
| |
|
|
| |
|
|
|
| | Total current assets | | 20,224 | | | | 10,733 | | | | 10,627 | | | | (1,136 | ) |
| | | | | | | | | | | | | | | | | |
| | Property, plant and equipment - net | | 7,551 | | | | 4,757 | | | | 2,794 | | | | - | |
| | Long-term receivables - trade and other | | 780 | | | | 255 | | | | 37 | | | | 488 | 3 |
| | Long-term receivables - finance | | 10,300 | | | | - | | | | 10,825 | | | | (525 | )3 |
| | Investments in unconsolidated affiliated companies | | 558 | | | | 516 | | | | 42 | | | | - | |
| | Investments in Financial Products subsidiaries | | - | | | | 3,066 | | | | - | | | | (3,066 | )6 |
| | Deferred income taxes | | 689 | | | | 1,015 | | | | 28 | | | | (354 | )7 |
| | Intangible assets | | 474 | | | | 467 | | | | 7 | | | | - | |
| | Goodwill | | 1,450 | | | | 1,450 | | | | - | | | | - | |
| | Other assets | | 2,321 | | | | 1,070 | | | | 1,251 | | | | - | |
| |
|
|
| |
|
|
| |
|
|
| |
|
|
|
Total assets | $ | 44,347 | | | $ | 23,329 | | | $ | 25,611 | | | $ | (4,593 | ) |
|
|
|
| |
|
|
| |
|
|
| |
|
|
|
Liabilities | | | | | | | | | | | | | | | |
| | Current liabilities: | | | | | | | | | | | | | | | |
| | | Short-term borrowings | | 3,265 | | | | 669 | | | | 3,596 | | | | (1,000 | )8 |
| | | Accounts payable | | 3,978 | | | | 3,863 | | | | 236 | | | | (121 | )9 |
| | | Accrued expenses | | 1,800 | | | | 909 | | | | 906 | | | | (15 | )10 |
| | | Accrued wages, salaries and employee benefits | | 1,437 | | | | 1,432 | | | | 5 | | | | - | |
| | | Customer advances | | 631 | | | | 631 | | | | - | | | | - | |
| | | Dividends payable | | - | | | | - | | | | - | | | | - | |
| | | Deferred and current income taxes payable | | 416 | | | | 347 | | | | 75 | | | | (6 | )7 |
| | | Long-term debt due within one year | | 3,260 | | | | 29 | | | | 3,231 | | | | - | |
| | |
|
|
| |
|
|
| |
|
|
| |
|
|
|
| | Total current liabilities | | 14,787 | | | | 7,880 | | | | 8,049 | | | | (1,142 | ) |
| | Long-term debt due after one year | | 17,909 | | | | 3,854 | | | | 14,092 | | | | (37 | )8 |
| | Liability for postemployment benefits | | 3,217 | | | | 3,217 | | | | - | | | | - | |
| | Deferred income taxes and other liabilities | | 687 | | | | 631 | | | | 404 | | | | (348 | )7 |
| |
|
|
| |
|
|
| |
|
|
| |
|
|
|
Total liabilities | | 36,600 | | | | 15,582 | | | | 22,545 | | | | (1,527 | ) |
|
|
|
| |
|
|
| |
|
|
| |
|
|
|
Stockholders' equity | | | | | | | | | | | | | | | |
| Common stock | | 1,308 | | | | 1,308 | | | | 888 | | | | (888 | )6 |
| Treasury stock | | (3,554 | ) | | | (3,554 | ) | | | - | | | | - | |
| Profit employed in the business | | 10,518 | | | | 10,518 | | | | 1,912 | | | | (1,912 | )6 |
| Accumulated other comprehensive income | | (525 | ) | | | (525 | ) | | | 266 | | | | (266 | )6 |
| |
|
|
| |
|
|
| |
|
|
| |
|
|
|
Total stockholders' equity | | 7,747 | | | | 7,747 | | | | 3,066 | | | | (3,066 | ) |
|
|
|
| |
|
|
| |
|
|
| |
|
|
|
Total liabilities and stockholders' equity | $ | 44,347 | | | $ | 23,329 | | | $ | 25,611 | | | $ | (4,593 | ) |
|
|
|
| |
|
|
| |
|
|
| |
|
|
|
1 Represents Caterpillar Inc. and its subsidiaries with Financial Products accounted for on the equity basis. |
2 Elimination of receivables between Machinery and Engines and Financial Products. |
3 Reclassification of Machinery and Engines trade receivables purchased by Cat Financial and Cat Financial’s wholesale inventory receivables. |
4 Elimination of Machinery and Engines insurance premiums that are prepaid to Financial Products. |
5 Elimination of Machinery and Engines investment in Financial Products subsidiary. |
6 Elimination of Financial Products equity which is accounted for on Machinery and Engines on the equity basis. |
7 Reclassification reflecting required netting of deferred tax assets / liabilities by taxing jurisdiction. |
8 Elimination of debt between Machinery and Engines and Financial Products. |
9 Elimination of payables between Machinery and Engines and Financial Products. |
10 Elimination of prepaid insurance in Financial Products' accrued expenses. |
|
Caterpillar Inc. Supplemental Data for Financial Position At December 31, 2004 (Unaudited) (Millions of dollars) |
| | | | | Supplemental Consolidating Data |
| | | |
|
| | | Consolidated | | Machinery and Engines1 | | Financial Products | | Consolidating Adjustments |
| |
| |
| |
| |
|
Assets: | | | | | | | | | | | | | | | |
| | Current assets: | | | | | | | | | | | | | | | |
| | | Cash and short-term investments | $ | 445 | | | $ | 270 | | | $ | 175 | | | $ | - | |
| | | Receivables - trade and other | | 7,459 | | | | 3,272 | | | | 465 | | | | 3,722 | 2,3 |
| | | Receivables - finance | | 5,182 | | | | - | | | | 9,325 | | | | (4,143 | )3 |
| | | Deferred and refundable income taxes | | 398 | | | | 333 | | | | 65 | | | | - | |
| | | Prepaid expenses | | 1,369 | | | | 1,367 | | | | 16 | | | | (14 | )4 |
| | | Inventories | | 4,675 | | | | 4,675 | | | | - | | | | - | |
| | |
|
|
| |
|
|
| |
|
|
| |
|
|
|
| | Total current assets | | 19,528 | | | | 9,917 | | | | 10,046 | | | | (435 | ) |
| | | | | | | | | | | | | | | | | |
| | Property, plant and equipment - net | | 7,682 | | | | 4,820 | | | | 2,862 | | | | - | |
| | Long-term receivables - trade and other | | 764 | | | | 255 | | | | 37 | | | | 472 | 3 |
| | Long-term receivables - finance | | 9,903 | | | | - | | | | 10,410 | | | | (507 | )3 |
| | Investments in unconsolidated affiliated companies | | 517 | | | | 479 | | | | 39 | | | | (1 | )5 |
| | Investments in Financial Products subsidiaries | | - | | | | 3,012 | | | | - | | | | (3,012 | )6 |
| | Deferred income taxes | | 674 | | | | 950 | | | | 27 | | | | (303 | )7 |
| | Intangible assets | | 315 | | | | 307 | | | | 8 | | | | - | |
| | Goodwill | | 1,450 | | | | 1,450 | | | | - | | | | - | |
| | Other assets | | 2,258 | | | | 1,075 | | | | 1,183 | | | | - | |
| |
|
|
| |
|
|
| |
|
|
| |
|
|
|
Total assets | $ | 43,091 | | | $ | 22,265 | | | $ | 24,612 | | | $ | (3,786 | ) |
|
|
|
| |
|
|
| |
|
|
| |
|
|
|
Liabilities | | | | | | | | | | | | | | | |
| | Current liabilities: | | | | | | | | | | | | | | | |
| | | Short-term borrowings | | 4,157 | | | | 93 | | | | 4,396 | | | | (332 | )8 |
| | | Accounts payable | | 3,990 | | | | 3,869 | | | | 205 | | | | (84 | )9 |
| | | Accrued expenses | | 1,847 | | | | 1,012 | | | | 855 | | | | (20 | )10 |
| | | Accrued wages, salaries and employee benefits | | 1,730 | | | | 1,716 | | | | 14 | | | | - | |
| | | Customer advances | | 555 | | | | 555 | | | | - | | | | - | |
| | | Dividends payable | | 141 | | | | 141 | | | | - | | | | - | |
| | | Deferred and current income taxes payable | | 259 | | | | 212 | | | | 47 | | | | - | |
| | | Long-term debt due within one year | | 3,531 | | | | 6 | | | | 3,525 | | | | - | |
| | |
|
|
| |
|
|
| |
|
|
| |
|
|
|
| | Total current liabilities | | 16,210 | | | | 7,604 | | | | 9,042 | | | | (436 | ) |
| | Long-term debt due after one year | | 15,837 | | | | 3,697 | | | | 12,175 | | | | (35 | )8 |
| | Liability for postemployment benefits | | 2,986 | | | | 2,986 | | | | - | | | | - | |
| | Deferred income taxes and other liabilities | | 591 | | | | 511 | | | | 383 | | | | (303 | )7 |
| |
|
|
| |
|
|
| |
|
|
| |
|
|
|
Total liabilities | | 35,624 | | | | 14,798 | | | | 21,600 | | | | (774 | ) |
|
|
|
| |
|
|
| |
|
|
| |
|
|
|
Stockholders' equity | | | | | | | | | | | | | | | |
| Common stock | | 1,231 | | | | 1,231 | | | | 888 | | | | (888 | )6 |
| Treasury stock | | (3,277 | ) | | | (3,277 | ) | | | - | | | | - | |
| Profit employed in the business | | 9,937 | | | | 9,937 | | | | 1,824 | | | | (1,824 | )6 |
| Accumulated other comprehensive income | | (424 | ) | | | (424 | ) | | | 300 | | | | (300 | )6 |
| |
|
|
| |
|
|
| |
|
|
| |
|
|
|
Total stockholders' equity | | 7,467 | | | | 7,467 | | | | 3,012 | | | | (3,012 | ) |
|
|
|
| |
|
|
| |
|
|
| |
|
|
|
Total liabilities and stockholders' equity | $ | 43,091 | | | $ | 22,265 | | | $ | 24,612 | | | $ | (3,786 | ) |
|
|
|
| |
|
|
| |
|
|
| |
|
|
|
1 Represents Caterpillar Inc. and its subsidiaries with Financial Products accounted for on the equity basis. |
2 Elimination of receivables between Machinery and Engines and Financial Products. |
3 Reclassification of Machinery and Engines trade receivables purchased by Cat Financial and Cat Financial’s wholesale inventory receivables. |
4 Elimination of Machinery and Engines insurance premiums that are prepaid to Financial Products. |
5 Elimination of Machinery and Engines investment in Financial Products subsidiary. |
6 Elimination of Financial Products equity which is accounted for on Machinery and Engines on the equity basis. |
7 Reclassification reflecting required netting of deferred tax assets/liabilities by taxing jurisdiction. |
8 Elimination of debt between Machinery and Engines and Financial Products. |
9 Elimination of payables between Machinery and Engines and Financial Products. |
10 Elimination of prepaid insurance in Financial Products' accrued expenses. |
|
Caterpillar Inc. Supplemental Data for Cash Flow For the Three Months Ended March 31, 2005 (Unaudited) (Millions of dollars) |
| | | | Supplemental Consolidating Data |
| | |
|
| | Consolidated | | Machinery and Engines1 | | Financial Products | | Consolidating Adjustments |
|
| |
| |
| |
|
Cash flow from operating activities: | | | | | | | | | | | | | | | |
| | Profit | $ | 581 | | | $ | 581 | | | $ | 88 | | | $ | (88 | )2 |
| | Adjustments for non-cash items: | | | | | | | | | | | | | | | |
| | | Depreciation and amortization | | 372 | | | | 213 | | | | 159 | | | | - | |
| | | Undistributed profit of Financial Products | | - | | | | (88 | ) | | | - | | | | 88 | 3 |
| | | Other | | (68 | ) | | | (69 | ) | | | (46 | ) | | | 47 | 4 |
| | Changes in assets and liabilities: | | | | | | | | | | | | | | | |
| | | Receivables - trade and other | | (228 | ) | | | (216 | ) | | | 24 | | | | (36 | )4,5 |
| | | Inventories | | (555 | ) | | | (555 | ) | | | - | | | | - | |
| | | Accounts payable and accrued expenses | | 96 | | | | 48 | | | | 79 | | | | (31 | )4 |
| | | Other - net | | (19 | ) | | | (28 | ) | | | 9 | | | | - | |
| | |
|
|
| |
|
|
| |
|
|
| |
|
|
|
Net cash provided by (used for) operating activities | | 179 | | | | (114 | ) | | | 313 | | | | (20 | ) |
|
|
|
| |
|
|
| |
|
|
| |
|
|
|
Cash flow from investing activities: | | | | | | | | | | | | | | | |
| | Capital expenditures - excluding equipment leased to others | | (165 | ) | | | (158 | ) | | | (7 | ) | | | - | |
| | Expenditures for equipment leased to others | | (238 | ) | | | - | | | | (238 | ) | | | - | |
| | Proceeds from disposals of property, plant and equipment | | 131 | | | | 4 | | | | 127 | | | | - | |
| | Additions to finance receivables | | (2,251 | ) | | | - | | | | (7,090 | ) | | | 4,839 | 5 |
| | Collection of finance receivables | | 1,597 | | | | - | | | | 6,414 | | | | (4,817 | )5 |
| | Proceeds from the sale of financereceivables | | 10 | | | | - | | | | 10 | | | | - | |
| | Net intercompany borrowings | | - | | | | (109 | ) | | | (569 | ) | | | 678 | 6 |
| | Investments and acquisitions (net of cashacquired) | | 1 | | | | 1 | | | | - | | | | - | |
| | Other - net | | (28 | ) | | | (8 | ) | | | (20 | ) | | | - | |
| |
|
|
| |
|
|
| |
|
|
| |
|
|
|
Net cash used for investing activities | | (943 | ) | | | (270 | ) | | | (1,373 | ) | | | 700 | |
|
|
|
| |
|
|
| |
|
|
| |
|
|
|
Cash flow from financing activities: | | | | | | | | | | | | | | | |
| | Dividends paid | | (141 | ) | | | (141 | ) | | | - | | | | - | |
| | Common stock issued, including treasury shares reissued | | 154 | | | | 154 | | | | - | | | | - | |
| | Treasury shares purchased | | (357 | ) | | | (357 | ) | | | - | | | | - | |
| | Net intercompany borrowings | | - | | | | 569 | | | | 109 | | | | (678 | )6 |
| | Proceeds from long-term debt issued | | 2,513 | | | | 194 | | | | 2,319 | | | | - | |
| | Payments on long-term debt | | (1,359 | ) | | | - | | | | (1,359 | ) | | | - | |
| | Short-term borrowings - net | | (3 | ) | | | 8 | | | | (11 | ) | | | - | |
| |
|
|
| |
|
|
| |
|
|
| |
|
|
|
Net cash provided by financing activities | | 807 | | | | 427 | | | | 1,058 | | | | (678 | ) |
|
|
|
| |
|
|
| |
|
|
| |
|
|
|
Effect of exchange rate changes on cash | | 29 | | | | 33 | | | | (2 | ) | | | (2 | )7 |
|
|
|
| |
|
|
| |
|
|
| |
|
|
|
Increase (decrease) in cash and short-term investments | | 72 | | | | 76 | | | | (4 | ) | | | - | |
Cash and short-term investments at beginning of period | | 445 | | | | 270 | | | | 175 | | | | - | |
|
| |
| |
| |
|
Cash and short-term investments at end of period | $ | 517 | | | $ | 346 | | | $ | 171 | | | $ | - | |
|
|
|
| |
|
|
| |
|
|
| |
|
|
|
1 Represents Caterpillar Inc. and its subsidiaries with Financial Products accounted for on the equity basis. |
2 Elimination of Financial Products profit after tax due to equity method of accounting. |
3 Non-cash adjustment for the undistributed earnings from Financial Products. |
4 Elimination of non-cash adjustments and changes in assets and liabilities related to consolidated reporting. |
5 Reclassification of Cat Financial’s cash flow activity from investing to operating for receivables that arose from the sale of inventory. |
6 Net proceeds and payments to/from Machinery and Engines and Financial Products. |
7 Elimination of the effect of exchange on intercompany balances. |
|
Caterpillar Inc. Supplemental Data for Cash Flow For the Three Months Ended March 31, 2004 (Unaudited) (Millions of dollars) |
| | | | Supplemental Consolidating Data |
| | |
|
| | Consolidated | | Machinery and Engines1 | | Financial Products | | Consolidating Adjustments |
|
| |
| |
| |
|
Cash flow from operating activities: | | | | | | | | | | | | | | | |
| | Profit | $ | 420 | | | $ | 420 | | | $ | 76 | | | $ | (76 | )2 |
| | Adjustments for non-cash items: | | | | | | | | | | | | | | | |
| | | Depreciation and amortization | | 350 | | | | 202 | | | | 148 | | | | - | |
| | | Undistributed profit of Financial Products | | - | | | | (76 | ) | | | - | | | | 76 | 3 |
| | | Other | | (37 | ) | | | (25 | ) | | | (34 | ) | | | 22 | 4 |
| | Changes in assets and liabilities: | | | | | | | | | | | | | | | |
| | | Receivables - trade and other | | (2,498 | ) | | | (143 | ) | | | 96 | | | | (2,451 | )4,5 |
| | | Inventories | | (631 | ) | | | (631 | ) | | | - | | | | - | |
| | | Accounts payable and accrued expenses | | 243 | | | | 211 | | | | (39 | ) | | | 71 | 4 |
| | | Other - net | | (50 | ) | | | (107 | ) | | | 30 | | | | 27 | 4 |
| | |
|
|
| |
|
|
| |
|
|
| |
|
|
|
Net cash provided by (used for) operating activities | | (2,203 | ) | | | (149 | ) | | | 277 | | | | (2,331 | ) |
|
|
|
| |
|
|
| |
|
|
| |
|
|
|
Cash flow from investing activities: | | | | | | | | | | | | | | | |
| | Capital expenditures - excluding equipment leasedto others | | (106 | ) | | | (101 | ) | | | (5 | ) | | | - | |
| | Expenditures for equipment leased to others | | (240 | ) | | | - | | | | (240 | ) | | | - | |
| | Proceeds from disposals of property, plant and equipment | | 147 | | | | 7 | | | | 140 | | | | - | |
| | Additions to finance receivables | | (1,866 | ) | | | - | | | | (3,394 | ) | | | 1,528 | 5 |
| | Collection of finance receivables | | 1,472 | | | | - | | | | 2,731 | | | | (1,259 | )5 |
| | Proceeds from sale of finance receivables | | - | | | | - | | | | 264 | | | | (264 | )5 |
| | Additions to retained interests in securitized trade receivables | | - | | | | - | | | | (2,322 | ) | | | 2,322 | 6 |
| | Collection of retained interests in securitized trade receivables | | 2,001 | | | | - | | | | 2,001 | | | | - | |
| | Net intercompany borrowings | | - | | | | 209 | | | | (6 | ) | | | (203 | )7 |
| | Investments and acquisitions (net of cashacquired) | | (13 | ) | | | (13 | ) | | | - | | | | - | |
| | Other - net | | (6 | ) | | | (5 | ) | | | (1 | ) | | | - | |
| |
|
|
| |
|
|
| |
|
|
| |
|
|
|
Net cash provided by (used for) investing activities | | 1,389 | | | | 97 | | | | (832 | ) | | | 2,124 | |
|
|
|
| |
|
|
| |
|
|
| |
|
|
|
Cash flow from financing activities: | | | | | | | | | | | | | | | |
| | Dividends paid | | (127 | ) | | | (127 | ) | | | - | | | | - | |
| | Common stock issued, including treasury shares reissued | | 69 | | | | 69 | | | | - | | | | - | |
| | Treasury shares purchased | | (250 | ) | | | (250 | ) | | | - | | | | - | |
| | Net intercompany borrowings | | - | | | | 6 | | | | (209 | ) | | | 203 | 7 |
| | Proceeds from long-term debt issued | | 1,808 | | | | 255 | | | | 1,553 | | | | - | |
| | Payments on long-term debt | | (913 | ) | | | (25 | ) | | | (888 | ) | | | - | |
| | Short-term borrowings - net | | 220 | | | | 91 | | | | 129 | | | | - | |
| |
|
|
| |
|
|
| |
|
|
| |
|
|
|
Net cash provided by financing activities | | 807 | | | | 19 | | | | 585 | | | | 203 | |
|
|
|
| |
|
|
| |
|
|
| |
|
|
|
Effect of exchange rate changes on cash | | 33 | | | | 33 | | | | (4 | ) | | | 4 | 8 |
|
|
|
| |
|
|
| |
|
|
| |
|
|
|
Increase in cash and short-term investments | | 26 | | | | - | | | | 26 | | | | - | |
Cash and short-term investments at beginning of period | | 342 | | | | 220 | | | | 122 | | | | - | |
|
| |
| |
| |
|
Cash and short-term investments at end of period | $ | 368 | | | $ | 220 | | | $ | 148 | | | $ | - | |
|
|
|
| |
|
|
| |
|
|
| |
|
|
|
1 Represents Caterpillar Inc. and its subsidiaries with Financial Products accounted for on the equity basis. |
2 Elimination of Financial Products profit after tax due to equity method of accounting. |
3 Non-cash adjustment for the undistributed earnings from Financial Products. |
4 Elimination of non-cash adjustments and changes in assets and liabilities related to consolidated reporting. Receivables amounts include adjustment for consolidated non-cash receipt of retained interests in securitized trade receivables. |
5 Reclassification of Cat Financial’s cash flow activity from investing to operating for receivables that arose from the sale of inventory. |
6 Elimination of Cat Financial’s additions to retained interests in securitized trade receivables that arose from an intercompany purchase of receivables. |
7 Net proceeds and payments to/from Machinery and Engines and Financial Products. |
8 Elimination of the effect of exchange on intercompany balances. |
|
SALES AND REVENUES OUTLOOK
We project another record year in 2005. We expect company sales and revenues will increase 16 to 18 percent, with Machinery and Engines volume increasing about 8 to 10 percent. We expect improved price realization to add about 5.5 percent, the favorable impact of currency to add about 1.5 percent with the rest coming from Financial Products revenues.
| · | Economic growth in most countries is moderate and key inflation measures are well within target ranges. As a result, we expect central banks will remain cautious about raising interest rates, allowing the current recovery to continue throughout the year. We project the world economy will grow about 3.5 percent. |
| · | Investment sectors are generally faring better than consumer sectors during this recovery. Business profits in many countries are at, or near, record shares of national incomes and companies are using profits to boost productivity. Low interest rates are encouraging companies to upgrade and expand aged capital equipment and, more recently, structures. Recoveries in nonresidential construction should strengthen this year, increasing the demand for reliable standby electrical power. |
| · | Housing prices are increasing significantly in many countries and this has begun to encourage construction to alleviate housing shortages. Low interest rates and rising employment should benefit residential construction in most regions. |
| · | Most governments have not invested enough in infrastructure for years, which is now creating inefficiencies, particularly in transportation. Governments have started to allocate more of the revenues rising from faster economic growth to infrastructure, and such construction should improve throughout the year. |
| · | Mining and energy companies underinvested in capacities for years due to unfavorable prices and capacities are now insufficient. Last year, prices surged above the minimums needed to make investment attractive and companies increased spending. Prices are expected to remain above those minimums this year and mining and energy companies should again increase investments. |
| · | Increased international trade and an aging ship fleet are driving strong growth in shipbuilding. Demand for support vessels to cope with more port congestion and increased offshore oil and gas production is also increasing. |
|
Sales and Revenues Outlook - Midpoint of Range |
(Millions of dollars) | 2004 Actual | | 2005 Outlook1 | | % Change |
|
| |
| |
|
| Machinery and Engines | | | | | | | | |
| | North America | $ | 14,521 | | $ | 17,250 | | 19 | % |
| | EAME | | 7,505 | | | 9,000 | | 20 | % |
| | Latin America | | 2,372 | | | 2,750 | | 16 | % |
| | Asia/Pacific | | 3,938 | | | 4,150 | | 5 | % |
| |
|
| |
|
| | | |
| Total Machinery and Engines | | 28,336 | | | 33,150 | | 17 | % |
|
|
| |
|
| | | |
Financial Products2 | | 1,970 | | | 2,300 | | 17 | % |
|
|
| |
|
| | | |
| Total | $ | 30,306 | | $ | 35,450 | | 17 | % |
|
|
| |
|
| | | |
1 Based on the sales expectations by geographic region, the company forecasts Consolidated Sales and Revenues to increase in the range of 16 to 18 percent versus 2004. For purposes of this chart, numbers are shown at the middle of the outlook range (i.e., 17 percent). |
2 Does not include revenues earned from Machinery and Engines of $200 million and $199 million in 2005 Outlook and 2004, respectively. |
|
North America (United States and Canada)Machinery and Engines sales are expected to increase about 19 percent in 2005.
| · | The U.S. economy grew at more than a 3 percent rate in the first quarter and employment is strengthening further. While inflation is gaining more attention, most inflation measures do not indicate an immediate problem. Consequently, we believe the Fed will continue gradually raising the Federal funds rate to about 4 percent by the end of the year. Overall, interest rates should continue to support growth, particularly in business investment, and the economy should grow close to 4 percent in 2005. |
| · | Housing activity continued to strengthen in the first quarter. The backlog of unused permits, increases in new home prices and low mortgage rates suggest another good year for housing. |
| · | Nonresidential construction recovered from a steep 3-year decline last year and a significant recovery is needed to bring the capacity of this sector in line with the size of the economy. Improved financial conditions and good business cash flows should drive a strong recovery this year. |
| · | Prices for metals and coal are well above year-earlier prices and production increased in the first quarter. Investment is increasing rapidly. |
| · | Trucking companies, which are experiencing improved profitability, should significantly increase purchases to handle strong freight demand and upgrade aging fleets. |
| · | The Canadian economy, benefiting from low interest rates and high commodity prices, should grow about 3 percent in 2005. |
EAMEMachinery and Engines sales are expected to increase about 20 percent in 2005.
| · | The Euro-zone economy slowed in the last half of 2004 and showed little improvement in the first quarter of 2005. Weak growth is forcing the European Central Bank to hold interest rates steady, and any rate hikes are not likely before the fourth quarter. Low interest rates are beginning to revive construction, particularly housing, and encourage some replacement buying. The U. K. and Central European economies are performing better, which should maintain overall European growth near 2 percent in 2005. |
| · | Both AME and the CIS are major beneficiaries of favorable commodity prices and increased production of metals and energy. We expect both regions will continue using higher incomes to increase capacity and improve infrastructures. The AME economy should grow over 5 percent in 2005 and the CIS economy more than 6 percent, the third consecutive year of good growth for both. |
| · | A positive impact of currency on sales is expected to contribute about 4 percent of the increase. |
Latin AmericaMachinery and Engines sales are expected to increase about 16 percent in 2005.
| · | Latin American economies should grow about 4 percent in 2005, continuing the recovery that started in late 2003. Projected positives include higher commodity prices, low inflation and increased foreign direct investment. |
| · | Our outlook assumes that mines will invest heavily in new capacity and equipment. Better economic growth is causing some governments to increase infrastructure spending to correct for years of underinvestment. |
Asia/PacificMachinery and Engines sales are expected to increase about 5 percent in 2005.
| · | We anticipate that interest rates will rise slightly this year and we expect regional growth to slow to about 6 percent. Interest rates are expected to support recoveries in consumer spending and business investment while competitive exchange rates are expected to further boost exports. We anticipate that continued economic growth will boost nonresidential construction and demand for standby electrical power. |
| · | Contract prices for coal, particularly coking coal, will increase substantially this year and we expect coal mining will again be a major contributor to sales. Metals mining should benefit from higher contract prices for iron ore and favorable base metals prices. |
Financial Products revenues are expected to increase about 17 percent in 2005.
| · | We expect continued growth in Financial Products, with revenues expected to increase primarily due to higher average earning assets in 2005. |
41
|
| * Denotes volume range |
| The chart above graphically illustrates reasons for the change in Consolidated Operating Profit between 2004 (at left) and 2005 Outlook (at right). Items favorably impacting operating profit appear as upward stair steps with the corresponding dollar amounts above each bar, while items negatively impacting operating profit appear as downward stair steps with dollar amounts reflected in parentheses above each bar. Caterpillar management utilizes these charts internally to visually communicate with its Board and employees. |
PROFIT OUTLOOK
We expect profit per share to be up 35 to 40 percent from 2004. We expect 2005 operating profit to increase between $1.02 and $1.17 billion from 2004. The year will benefit from increased price realization, including the effect of the previously announced mid-year price action, as well as increased volume. We expect our costs in the first half of 2005 will appear substantially higher than costs in the first half of 2004 because this comparative period contains lower material (primarily steel-related) costs. We anticipate continued pressure on our core operating costs throughout the year, with some relief on material costs in the last six months. As a result, we expect the last half of 2005 to be stronger than the first half.
G.Safe Harbor Statement under the Securities Litigation Reform Act of 1995
Certain statements contained in our first quarter 2005 form 10-Q are forward-looking and involve uncertainties that could significantly impact results. The words "believes," "expects," "estimates," "anticipates," "will be", "should" and similar words or expressions identify forward-looking statements made on behalf of Caterpillar. Uncertainties include factors that affect international businesses, as well as matters specific to the company and the markets it serves.
World Economic Factors
Our projection for about 3.5 percent growth in the world economy assumes central banks will cautiously raise interest rates so as not to slow growth too much. Low interest rates, and continued good economic growth, should encourage further growth in construction and mining. Should central banks raise interest rates aggressively, both the world economic recovery and our Machinery and Engines sales likely would be weaker.
The U.S. economy is growing near a three percent rate, which up to now has not created an inflation problem. While the Federal Reserve has raised interest rates, we assume the continuation of moderate growth and low inflation will result in interest rates of about 4 percent by the end of 2005. Long-term interest rates are expected to rise less than short-term rates. That environment should support further growth in construction and manufacturing, helping to keep commodity prices favorable. Should financial conditions tighten noticeably, causing economic growth to slow below 3 percent, expected improvements in Machinery and Engines sales likely would be lower than projected.
Our projection of increased sales of Machinery and Engines in Europe, Africa, Middle East (EAME) assumes that low interest rates will allow slightly faster economic growth in Europe and that favorable commodity prices will extend healthy recoveries in both Africa and Middle East (AME) and the CIS. Key risks are a significant slowing in the European economy or a collapse in commodity prices. Those developments would likely negatively impact our results.
Favorable commodity prices, increased capital inflows and an improved foreign debt situation are expected to contribute to about 4 percent growth in Latin America. As a result, we project that both mining production and construction spending will increase, supporting an increase in Machinery and Engines sales. This forecast is vulnerable to a significant weakening in commodity prices, slowing in world economic growth, widespread increases in interest rates or political disruptions.
In Asia/Pacific, we project sales growth in Australia, India and the developing Asian economies will offset a further decline in China. Critical assumptions are continued growth in coal demand, low domestic interest rates in most countries, further gains in exports and continued good economic growth in China. Some developments that could lower expected results include reduced demand for thermal and coking coal, significant revaluations of regional currencies, restrictions on regional exports and sharp interest rate hikes, particularly in China.
Commodity Prices
Commodities represent a significant sales opportunity, with prices and production as key drivers. Prices have improved sharply over the past two years and our outlook assumes continued growth in world industrial production will cause metals prices to remain high enough in 2005 to encourage further mine investment. Any unexpected weakening in world industrial production or construction, however, could cause prices to drop sharply to the detriment of our results.
Coal production and prices improved last year and our sales have benefited. We expect these trends to continue in 2005. Should coal prices soften, due to a slowing in world economic growth or otherwise, the ongoing sales recovery would be vulnerable.
Oil and natural gas prices increased sharply over the past two years due to strong demand and high capacity usage. Higher energy prices have not halted economic recoveries since strong demand boosted prices and world production increased. High prices are encouraging more exploration and development and we expect increased production in 2005 will constrain price increases. However, should significant supply cuts occur, such as from OPEC production cuts or political unrest in a major producing country, the resulting oil shortages and price spikes could slow economies, potentially with a depressing impact on our sales.
Monetary and Fiscal Policies
For most companies operating in a global economy, monetary and fiscal policies implemented in the United States and abroad could have a significant impact on economic growth, and accordingly, demand for our product. In general, higher than expected interest rates, reductions in government spending, higher taxes, excessive currency movements, and uncertainty over key policies are some factors likely to lead to slower economic growth and lower industry demand.
With economic data looking more favorable, central banks in developed countries have started raising interest rates from the lowest rates in decades. Our outlook assumes that central banks will take great care to ensure that economic recoveries continue and that interest rates will remain low throughout the forecast period. Should central banks raise interest rates more aggressively than anticipated, both economic growth and our sales could suffer.
Budget deficits in many countries have increased, which has limited the ability of governments to boost economies with tax cuts and more spending. Our outlook assumes that governments will not aggressively raise taxes and slash spending to deal with their budget imbalances. Such actions could disrupt growth and negatively affect our sales.
Political Factors
Political factors in the United States and abroad can impact global companies. Our outlook assumes that no major disruptive changes in economic policies occur in either the United States or other major economies. Significant changes in either taxing or spending policies could reduce activities in sectors important to our businesses, thereby reducing sales.
Our outlook assumes that there will be no additional significant military conflicts in either North Korea or the Middle East in the forecast period. Such military conflicts could severely disrupt sales into countries affected, as well as nearby countries.
Our outlook also assumes that there will be no major terrorist attacks. If there is a major terrorist attack, confidence could be undermined, potentially causing a sharp drop in economic activities and our sales. Attacks in major developed economies would be the most disruptive.
Our outlook assumes that efforts by countries to increase their exports will not result in retaliatory countermeasures by other countries to block such exports, particularly in the Asia/Pacific region. Our outlook includes a negative impact from the phase-out of the Extraterritorial Income Exclusion (ETI) as enacted by the American Jobs Creation Act of 2004 (the Act). However, our outlook does not include any impact from the provision of the Act allowing preferential tax treatment of the repatriation of non-U.S. earnings in 2005. Further, our outlook assumes any other tax law changes will not negatively impact our provision for income taxes.
Currency Fluctuations
The company has costs and revenues in many currencies and is therefore exposed to risks arising from currency fluctuations. Our outlook assumes no significant changes in currency values from current rates. Should currency rates change sharply, economic activity and our results could be negatively impacted.
The company's largest manufacturing presence is in the United States, so any unexpected strengthening of the dollar tends to raise the foreign currency costs to our end users and reduce our global competitiveness.
Dealer Practices
The company sells primarily through an independent dealer network. Dealers carry inventories of both new and rental equipment and adjust those inventories based on their assessments of future needs. Such adjustments can impact our results either positively or negatively. The current outlook assumes dealers will increase inventories in line with higher deliveries. Should dealers control inventories more tightly, our sales would be lower.
Financial Products Division Factors
Inherent in the operation of Cat Financial is the credit risk associated with its customers. The creditworthiness of each customer, and the rate of delinquencies, repossessions and net losses on customer obligations are directly impacted by several factors, including, but not limited to, relevant industry and economic conditions, the availability of capital, the experience and expertise of the customer's management team, commodity prices, political events, and the sustained value of the underlying collateral. Additionally, interest rate movements create a degree of risk to our operations by affecting the amount of our interest payments and the value of our fixed rate debt. Our match funding policy manages interest rate risk by matching the interest rate profile (fixed rate or floating rate) of our debt portfolio with the interest rate profile of our receivables portfolio within established guidelines. To achieve our match funding objectives, we issue debt with similar interest rate profile to our receivables and also use interest rate swap agreements to manage our interest rate risk exposure to interest rate changes and in some cases to lower our cost of borrowed funds. If interest rates move upward more sharply than anticipated, our financial results could be negatively impacted. With respect to our insurance and investment management operations, changes in the equity and bond markets could cause an impairment of the value of our investment portfolio, thus requiring a negative adjustment to earnings.
Other Factors
The rate of infrastructure spending, housing starts, commercial construction and mining plays a significant role in the company's results. Our products are an integral component of these activities and as these activities increase or decrease in the United States or abroad, demand for our products may be significantly impacted.
Projected cost savings or synergies from alliances with new partners could also be negatively impacted by a variety of factors. These factors could include, among other things, higher than expected wages, energy and/or material costs, and/or higher than expected financing costs due to unforeseen changes in tax, trade, environmental, labor, safety, payroll or pension policies in any of the jurisdictions in which the alliances conduct their operations.
The International Association of Machinists (IAM) represents 1,999 employees under labor agreements expiring on April 30, 2005, and May 29, 2005. Based on our historical experience during periods when labor unrest or work stoppage by union-represented employees has occurred, we do not expect that the occurrence of such events, if any, arising in connection with the expiration of these agreements will have a material impact on our operations or results.
Results may be impacted positively or negatively by changes in the sales mix. Our outlook assumes a certain geographic mix of sales as well as a product mix of sales. If actual results vary from this projected geographic and product mix of sales, our results could be negatively impacted.
The company operates in a highly competitive environment and our outlook depends on a forecast of the company's share of industry sales. An unexpected reduction in that share could result from pricing or product strategies pursued by competitors, unanticipated product or manufacturing difficulties, a failure to price the product competitively, or an unexpected buildup in competitors' new machine or dealer owned rental fleets, leading to severe downward pressure on machine rental rates and/or used equipment prices.
The environment remains competitive from a pricing standpoint. Our 2005 sales outlook assumes that the company will be successful in implementing worldwide machine price increases communicated to dealers with effective dates of January 3, 2005 and May 2, 2005. While we expect that the environment will absorb these price actions, delays in the marketplace acceptance would negatively impact our results. Moreover, additional price discounting to maintain our competitive position could result in lower than anticipated price realization.
In general, our results are sensitive to changes in economic growth, particularly those originating in construction, mining and energy. Developments reducing such activities also tend to lower our sales. In addition to the factors mentioned above, our results could be negatively impacted by any of the following:
- Any sudden drop in consumer or business confidence;
Delays in legislation needed to fund public construction;
Regulatory or legislative changes that slow activity in key industries; and/or
Unexpected collapses in stock markets.
This discussion of uncertainties is by no means exhaustive, but is designed to highlight important factors that may impact our outlook. Obvious factors such as general economic conditions throughout the world do not warrant further discussion, but are noted to further emphasize the myriad of contingencies that may cause the company's actual results to differ from those currently anticipated.
Item 4. Controls and Procedures
Evaluation of disclosure controls and procedures
An evaluation was performed under the supervision and with the participation of the company's management, including the Chief Executive Officer (CEO) and Chief Financial Officer (CFO), of the effectiveness of the design and operation of the company's disclosure controls and procedures as of the end of the period covered by this quarterly report. Based on that evaluation, the company's management, including the CEO and CFO, concluded that the company's disclosure controls and procedures are effective to ensure that information required to be disclosed by the company in reports that it files or submits under the Securities Exchange Act of 1934 is recorded, processed, summarized, and reported within the time periods specified in Securities and Exchange Commission rules and forms. Although the design of any system of controls is based in part upon certain assumptions about the likelihood of future events, and there can be no assurance that any design will succeed in achieving its stated goals under all potential future conditions, regardless of how remote, management's evaluation provided reasonable assurance that these controls will be effective.
Changes in internal control over financial reporting
During the last fiscal quarter, there has been no significant change in the company's internal controls over financial reporting that has materially affected, or is reasonably likely to materially affect, the company's internal control over financial reporting.
PART II. OTHER INFORMATION
Item 1. Legal Proceedings.
We are a party to litigation matters and claims that are normal in the course of our operations, and while the results of such litigation and claims cannot be predicted with certainty, management believes, based on the advice of counsel, the final outcome of any single proceeding or all proceedings in the aggregate would not have a materially adverse effect on our consolidated financial position or results of operations or cash flows.
On January 16, 2002, Caterpillar commenced an action in the Circuit Court of the Tenth Judicial Circuit of Illinois in Peoria, Illinois, against Navistar International Transportation Corporation and International Truck and Engine Corporation (collectively Navistar). The lawsuit arises out of a long-term purchase contract between Caterpillar and Navistar effective May 31, 1988, as amended from time to time (the Purchase Agreement). The pending complaint alleges that Navistar breached its contractual obligations by: (i) paying Caterpillar $8.08 less per fuel injector than the agreed upon price for new unit injectors delivered by Caterpillar; (ii) refusing to pay contractually agreed upon surcharges owed as a result of Navistar ordering less than planned volumes of replacement unit injectors; and (iii) refusing to pay contractually agreed upon interest stemming from Navistar's late payments. As of March 31, 2005, the net past due receivable from Navistar regarding the foregoing and included in “Long-term receivables - trade and other” in the Consolidated Statement of Financial Position totaled $139 million. The pending complaint also has claims alleging that Newstream Enterprises and Navistar, collectively and individually, failed to pay the applicable price to Caterpillar for shipments of unit injectors to Newstream. In January 2005, Caterpillar and Franklin Power Products, Inc. resolved claims similar to those currently pending against Newstream, and Franklin has been dismissed from the lawsuit. As of March 31, 2005, the net past due receivables for the foregoing, included in “Long-term receivables - trade and other” in the Consolidated Statement of Financial Position totaled $12 million. The pending complaint further alleges that Sturman Industries, Inc. and Sturman Engine Systems, Inc. colluded with Navistar to utilize technology that Sturman Industries, Inc. misappropriated from Caterpillar to help Navistar develop its G2 fuel system, and tortiously interfered with the Purchase Agreement and Caterpillar's prospective economic relationship with Navistar. The pending complaint further alleges that the two parties' collusion led Navistar to select Sturman Engine Systems, Inc., and another company, instead of Caterpillar, to develop and manufacture the G2 fuel system.
On May 7, 2002 International Truck and Engine Corporation (International) commenced an action against Caterpillar in the Circuit Court of DuPage County, Illinois regarding a long-term agreement term sheet ("term sheet"). In its sixth amended complaint, International alleges that the term sheet constitutes a legally binding contract for the sale of heavy-duty engines at specified prices through the end of 2006, alleges that Caterpillar breached the term sheet by, among other things, raising certain prices effective October 1, 2002, and also alleges that Caterpillar breached an obligation to negotiate a comprehensive long-term agreement referenced in the term sheet. International seeks declaratory and injunctive relief as well as damages in an amount to be determined at trial. Caterpillar denies International's claims and has filed a counterclaim seeking a declaration that the term sheet has been effectively terminated. Caterpillar also asserts that pursuant to a subsequent agreement International has released Caterpillar from certain of its claims. On September 24, 2003 the Appellate Court of Illinois, ruling on an interlocutory appeal, issued an order consistent with Caterpillar's position that, even if the court subsequently determines that the term sheet is a binding contract, it is indefinite in duration and was therefore terminable at will by Caterpillar upon reasonable notice. On April 12, 2005 International commenced a second, related action against Caterpillar in the Circuit Court of DuPage County, Illinois. The second lawsuit contains allegations that are similar to the allegations contained in the first lawsuit filed in May, 2002. International also alleges that Caterpillar materially breached the subsequent agreement. No trial dates are currently scheduled for either of the cases pending in the Circuit Court of DuPage County. Neither of these cases are related to the breach of contract action brought by Caterpillar against Navistar which is currently pending in the Circuit Court of Peoria County, Illinois.
Item 2. Changes in Securities, Use of Proceeds and Issuer Purchases of Equity Securities.
Issuer Purchases of Equity Securities
|
Period | | Total number of Shares Purchased | | Average Price Paid per Share | | Total Number of Shares Purchased Under the Program | | Maximum Number of Shares that May Yet Be Purchased Under the Program |
| |
| |
| |
| |
|
| January 1-31, 2005 | | 1,084,000 | | | 92.20 | | | 1,084,000 | | | 22,487,064 | 1 |
| February 1-28, 2005 | | 2,197,600 | | | 90.97 | | | 2,197,600 | | | 21,117,709 | 1 |
| March 1-31, 2005 | | 593,000 | | | 95.70 | | | 593,000 | | | 21,694,552 | 1 |
| |
| |
| |
| | | |
Total | | 3,874,600 | | | 92.04 | | | 3,874,600 | | | | |
| |
|
| |
|
| |
|
| | | |
1 On October 8, 2003, the board of directors approved an extension of the share repurchase program (through October 2008) with the goal of reducing the company's outstanding shares to 320,000,000. Amount represents the shares outstanding at the end of the period less 320,000,000. |
|
Other Purchases of Equity Securities
|
Period | | Total number of Shares Purchased1 | | Average Price Paid per Share | | Total Number of Shares Purchased Under the Program | | Maximum Number of Shares that May Yet Be Purchased Under the Program |
| |
| |
| |
| |
|
| January 1-31, 2005 | | 1,143 | | | 94.85 | | | NA | | | NA | |
| February 1-28, 2005 | | - | | | - | | | NA | | | NA | |
| March 1-31, 2005 | | 7,235 | | | 96.01 | | | NA | | | NA | |
| |
| |
| | | | | | |
Total | | 8,378 | | | 95.85 | | | | | | | |
| |
|
| |
|
| | | | | | |
1 Represents shares delivered back to issuer for the payment of taxes resulting from the exercise of stock options. |
|
Non-U.S. Employee Stock Purchase Plans
We have 27 employee stock purchase plans administered outside the United States for our foreign employees. As of March 30, 2005, those plans had approximately 9,108 participants in the aggregate. During the first quarter of 2005, approximately 184,282 shares of Caterpillar common stock or foreign denominated equivalents were distributed under the plans. Participants in some foreign plans have the option of receiving non-U.S. share certificates (foreign-denominated equivalents) in lieu of U.S. shares of Caterpillar Inc. common stock upon withdrawal from the plan. These equivalent certificates are tradable only on the local stock market and are included in our determination of shares outstanding.
Item 4. Submission of Matters to a Vote of Security Holders
The Annual Meeting of Stockholders of Caterpillar Inc. was held on April 13, 2005, for the purpose of electing directors and voting on the proposals described below. Proxies for the meeting were solicited pursuant to Section 14(a) of the Securities Exchange Act of 1934 and there was no solicitation in opposition to management's solicitations. A plurality vote of the shares present at the meeting was required for election of directors.An affirmative vote of the majority of shares present at the meeting was required for approval of all other proposals. Abstentions and broker non-votes have the effect of a vote against matters other than director elections. Quorum exists if at least one-third of Caterpillar stockholders are present in person or by proxy at the meeting. Abstentions and broker non-votes are counted as present for establishing a quorum.
Proposal 1 - Election of Directors All of management's nominees for directors as listed in the proxy statement were elected with the following vote: |
| | | | Shares Voted "FOR" | | Shares "WITHHELD" | |
| | |
| |
| |
| | W. Frank Blount | | 278,031,215.55 | | 18,374,051.83 | |
| | John R. Brazil | | 280,231,864.70 | | 16,173,402.68 | |
| | Eugene V. Fife | | 280,815,918.88 | | 15,589,348.50 | |
| | Gail D. Fosler | | 280,429,355.33 | | 15,975,912.06 | |
| | Peter A. Magowan | | 280,305,046.96 | | 16,100,220.42 | |
Proposal 2 - Ratification of Auditors The management proposal requesting ratification of Auditors was approved with the following vote: |
| | Shares Voted "FOR" | | Shares Voted "AGAINST" | | Shares "ABSTAINING" | | Broker Non-Votes |
|
| |
| |
| |
|
| | 289,482,203.54 | | 6,347,547.24 | | 575,516.61 | | 0 |
Proposal 3 - Stockholder Proposal - Shareholder Rights Plan The stockholder proposal requesting the Board of Directors to redeem or terminate the company's shareholder rights plan unless put to shareholder vote was approved with the following vote: |
| | Shares Voted "FOR" | | Shares Voted "AGAINST" | | Shares "ABSTAINING" | | Broker Non-Votes |
|
| |
| |
| |
|
| | 151,841,347.60 | | 105,614,152.16 | | 1,634,299.62 | | 37,315,468 |
Proposal 4 - Stockholder Proposal - Code of Conduct The stockholder proposal requesting the Board of Directors to report on whether sales of equipment to Israel comports with the company’s Code of Conduct was defeated with the following vote: |
| | Shares Voted "FOR" | | Shares Voted "AGAINST" | | Shares "ABSTAINING" | | Broker Non-Votes |
|
| |
| |
| |
|
| | 9,429,015.26 | | 221,883,776.29 | | 27,777,007.84 | | 37,315,468 |
Proposal 5 - Stockholder Proposal - Global Pandemics The stockholder proposal requesting the Board of Directors to report on the economic effects of the HIV/AIDS, tuberculosis and malaria pandemics on the company's business strategy was defeated with the following vote: |
| | Shares Voted "FOR" | | Shares Voted "AGAINST" | | Shares "ABSTAINING" | | Broker Non-Votes |
|
| |
| |
| |
|
| | 17,191,834.01 | | 214,519,336.70 | | 27,378,628.67 | | 37,315,468 |
Proposal 6 - Stockholder Proposal - Director Election The stockholder proposal requesting the Board of Directors to amend governance documents to provide for directors to be elected by the affirmative vote of the majority of votes cast at the annual meeting was defeated with the following vote: |
| | Shares Voted "FOR" | | Shares Voted "AGAINST" | | Shares "ABSTAINING" | | Broker Non-Votes |
|
| |
| |
| |
|
| | 111,413,399.75 | | 144,889,538.15 | | 2,786,861.49 | | 37,315,468 |
Item 6. Exhibits |
| | | Exhibits: |
| | | 31.1 | Certification of James W. Owens, Chairman and Chief Executive Officer of Caterpillar Inc., as required pursuant to Section 302 of the Sarbanes-Oxley Act of 2002. |
| | | 31.2 | Certification of David B. Burritt, Chief Financial Officer of Caterpillar Inc., as required pursuant to Section 302 of the Sarbanes-Oxley Act of 2002. |
| | | 32 | Certification of James W. Owens, Chairman and Chief Executive Officer of Caterpillar Inc. and David B. Burritt, Chief Financial Officer of Caterpillar Inc., as required pursuant to Section 906 of the Sarbanes-Oxley Act of 2002. |
SIGNATURES |
| Pursuant to the requirements of the Securities Exchange Act of 1934, the Registrant has duly caused this report to be signed on its behalf by the undersigned thereunto duly authorized. |
| | | | |
| | CATERPILLAR INC. | | |
May 6, 2005 | /s/ James W. Owens | | Chairman of the Board and Chief Executive Officer |
|
| | |
| | (James W. Owens) | | |
| | | | |
May 6, 2005 | /s/ David B. Burritt | | Vice President and Chief Financial Officer |
|
| | |
| | (David B. Burritt) | | |
| | | | |
May 6, 2005 | /s/ Bradley M. Halverson | | Controller and Chief Accounting Officer |
|
| | |
| | (Bradley M. Halverson) | | |
| | | | |
May 6, 2005 | /s/ James B. Buda | | Secretary |
|
| | |
| | (James B. Buda) | | |