EXHIBIT 99.1
Caterpillar Inc.
3Q Earnings Release
October 21, 2005
FOR IMMEDIATE RELEASE
Caterpillar Inc. Announces Record Third-Quarter Sales and Profits
Amid Continued Strong Demand in Key Markets and Industries;
Revises 2005 Outlook; Projects Another Year of Growth in 2006
PEORIA, Ill. - Continuing to meet strong customer demand worldwide, Caterpillar Inc. (NYSE: CAT) today reported third-quarter sales and revenues of $8.977 billion and profit of $667 million, or $0.94 per share. Both sales and revenues and profit per share are the highest in the company’s history for a third quarter.
“Thanks to the hard work of our people around the world and the discipline of 6 Sigma, Team Caterpillar has again effectively responded to our customers’ needs,” said Caterpillar Chairman and Chief Executive Officer Jim Owens. “We met the challenges stemming from recent hurricanes with minimum disruption to our business and maximum responsiveness to the cleanup needs in the Gulf region and delivered the best third-quarter financial results in company history.”
Sales and revenues of $8.977 billion were up $1.318 billion, or 17 percent, compared to $7.659 billion for the third quarter of 2004. The higher sales and revenues were driven by continued strong global demand and improved price realization.
Profit of $667 million, or $0.94 a share, was up 34 percent compared to profit of $498 million in the third quarter of 2004. Machinery and Engines operating profit as a percent of sales increased substantially—7.9 percent in the third quarter of 2004 to 10.5 percent in the third quarter of 2005. The increase was the result of improved price realization, higher sales volume and effective management of our period cost structure, somewhat offset by continued pressure on variable manufacturing costs.
“While we posted the best third quarter in our history, we still have opportunity to improve our operations. In particular, we have to work through capacity bottlenecks and need more focus on production processes to improve order fulfillment and supply chain efficiencies. To help move us faster along this path, we announced last week a new division to drive improvements in our production processes and order fulfillment capability,” said Owens.
Page 1
Outlook - 2005
The outlook for 2005 has been revised from previously reported levels. Sales and revenues are now expected to be up about 20 percent from 2004, and the profit outlook has been adjusted to reflect an estimated profit range of $3.85 to $4.00 per share.
The previous outlook reflected sales and revenues up 18 to 20 percent and profit per share of $4.00 to $4.20.
The revised profit outlook includes potential charges of approximately $100 million before tax that are likely to be incurred in the fourth quarter and an increase in the estimated annual tax rate from 29 percent to 30 percent. Potential charges of $100 million are related to changes in our dealer distribution software and a product realignment that are under consideration.
Preliminary Outlook - 2006
Sales and revenues in 2006 are expected to be up about 10 percent from 2005. The profit outlook for 2006 is an increase of 15 to 25 percent from 2005 from the middle of the profit range in the 2005 outlook.
Owens stated, “The company is well-positioned for continued profitable growth, with selected increases in capacity, a comprehensive rollout of new products and strong growth in our service businesses. Further, we will intensify our focus on order fulfillment and cost management. Caterpillar is ready for the challenges ahead.”
(Complete outlook begins on page 11.)
For 80 years, Caterpillar has been building the world's infrastructure and, in partnership with our independent dealers, is driving positive and sustainable change on every continent. Caterpillar is a technology leader and the world's largest maker of construction and mining equipment, diesel and natural gas engines and industrial gas turbines. More information is available at http://www.cat.com/.
Note: Glossary of terms included on pages 16-17; first occurrence of terms shown in bold italics.
Page 2
Key Points
Third-Quarter Comparison
| · | Third-quarter sales and revenues were the highest in Caterpillar history for any third quarter and the second highest quarter on record—$8.977 billion. |
| · | Sales and revenues were 17 percent higher than the third quarter of 2004. Machinery sales increased 20 percent, Engines sales increased 11 percent and Financial Products revenues rose 21 percent from a year ago. |
| · | Third-quarter profit was the highest for any third quarter in company history, and second highest on record—$667 million, 34 percent higher than the third quarter of 2004. |
| · | Machinery and Engines operating profit as a percent of sales increased substantially—7.9 percent in the third quarter of 2004 to 10.5 percent in the third quarter of 2005. The increase was the result of improved price realization, higher sales volume and effective management of our period cost structure, somewhat offset by continued pressure on variable manufacturing costs. |
| · | Compared with third quarter 2004, Machinery and Engines incremental operating profit as a percent of incremental sales was 26 percent. |
| · | The provision for income taxes reflects an increase in the estimated annual tax rate from 29 percent to 30 percent. The effect of increasing the estimated annual tax rate to 30 percent lowered third-quarter profit by $28 million. |
Outlook
| · | The 2005 sales and revenues outlook has been reaffirmed at the top end of the previous outlook and reflects an increase of about 20 percent from 2004. |
| · | The 2005 profit outlook has been revised and now reflects a profit range of $3.85 to $4.00 per share. The revised outlook includes $100 million of potential charges that are likely for the fourth quarter and a higher estimated annual tax rate. |
| · | Caterpillar expects 2006 sales and revenues to be up about 10 percent and profit per share to be up 15 to 25 percent from 2005. |
General
| · | Share repurchases totaled 3.6 million during the third quarter, bringing the year-to-date total to 22.1 million shares. With shares issued to cover options exercised, the net reduction of shares outstanding is 5.7 million shares year-to-date. |
| · | A question and answer section has been included in this release starting on page 13. |
Page 3
DETAILED ANALYSIS
Third Quarter 2005 vs. Third Quarter 2004
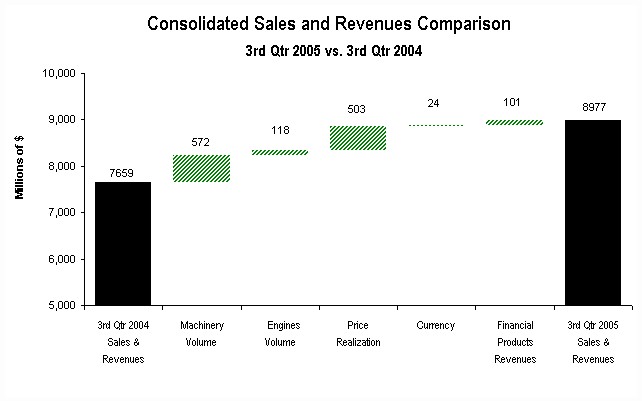 |
| The chart above graphically illustrates reasons for the change in Consolidated Sales and Revenues between 3rd Quarter 2004 (at left) and 3rd Quarter 2005 (at right). Items favorably impacting sales and revenues appear as upward stair steps with the corresponding dollar amounts above each bar. Caterpillar management utilizes these charts internally to visually communicate with its Board and employees. |
Sales and Revenues
Sales and revenues for the third quarter of 2005 were $8.977 billion, up $1.318 billion or 17 percent from third quarter 2004. Machinery volume was up $572 million, Engines volume was up $118 million, price realization improved $503 million and currency had a positive impact on sales of $24 million, due primarily to a stronger Brazilian real compared with third quarter 2004. In addition, Financial Products revenues increased $101 million.
Page 4
Sales and Revenues by Geographic Region | ||||||||||||||||||||||||
(Millions of dollars) | Total | % Change | North America | % Change | EAME | % Change | Latin America | % Change | Asia/ Pacific | % Change | ||||||||||||||
3rd Quarter 2004 | ||||||||||||||||||||||||
| Machinery | $ | 4,699 | $ | 2,597 | $ | 1,106 | $ | 422 | $ | 574 | ||||||||||||||
Engines1 | 2,476 | 1,100 | 747 | 214 | 415 | |||||||||||||||||||
Financial Products2 | 484 | 343 | 83 | 25 | 33 | |||||||||||||||||||
| $ | 7,659 | $ | 4,040 | $ | 1,936 | $ | 661 | $ | 1,022 | |||||||||||||||
3rd Quarter 2005 | ||||||||||||||||||||||||
| Machinery | $ | 5,648 | 20% | $ | 3,198 | 23% | $ | 1,199 | 8% | $ | 551 | 31% | $ | 700 | 22% | |||||||||
Engines1 | 2,744 | 11% | 1,299 | 18% | 816 | 9% | 287 | 34% | 342 | (18%) | ||||||||||||||
Financial Products2 | 585 | 21% | 412 | 20% | 85 | 2% | 39 | 56% | 49 | 48% | ||||||||||||||
| $ | 8,977 | 17% | $ | 4,909 | 22% | $ | 2,100 | 8% | $ | 877 | 33% | $ | 1,091 | 7% | ||||||||||
1 Does not include internal engines transfers of $451 million and $387 million in 2005 and 2004, respectively. Internal engines transfers are valued at prices comparable to those for unrelated parties. | ||||||||||||||||||||||||
2 Does not include revenues earned from Machinery and Engines of $82 million and ($47) million in 2005 and 2004, respectively. | ||||||||||||||||||||||||
Machinery Sales
Machinery sales in third quarter 2005 were $5.648 billion, an increase of $949 million or 20 percent from third quarter 2004. Sales were a record for the third quarter and were only slightly below last quarter’s record high. Sales volume accounted for $572 million of the increase, price realization added $353 million and the remaining $24 million was due to currency. Sales gains benefited from a double-digit percentage increase in deliveries to end users, with all regions and most industries contributing to growth.
Dealer machine inventories rose during the third quarter of 2005, but the gain was less than in last year’s third quarter. Worldwide machine inventories, as measured in months of deliveries, were the same as a year earlier.
| · | North America sales were up $601 million or 23 percent from third quarter 2004; sales volume increased $389 million and price realization added $212 million. Low mortgage interest rates and higher home prices pushed housing units under construction to the highest level since the early 1970s, and nonresidential construction benefited from record corporate profits. Higher output prices and increased production boosted mining. |
| · | EAME sales increased 8 percent or $93 million when compared to third quarter 2004. Improved price realization accounted for $65 million, sales volume added $26 million and the remaining $2 million came from the favorable impact of the stronger euro. Sales volume in Europe, where the economy was weak, declined slightly. Economies in Africa/Middle East (AME) and the Commonwealth of Independent States (CIS) benefited from higher commodity prices, particularly energy, and increased production of those commodities. Sales volume in both regions increased significantly. |
| · | Latin America sales rose $129 million or 31 percent from the same quarter last year—$85 million from increased volume, $28 million from improved price realization and the remaining $16 million from a stronger Brazilian real. The region benefited from low domestic interest rates, increased capital inflows and growth in both mining and construction. Sales increased rapidly in Brazil, Mexico and Venezuela, and in most applications throughout the region. |
Page 5
| · | Asia/Pacific third-quarter sales were 22 percent or $126 million higher than last year—$72 million from higher volume, $48 million from improved price realization and the remaining $6 million due to currency. Fast economic growth in the region has boosted construction, and mining benefited from higher metals and coal prices. Sales in China continued to improve and were significantly above the year earlier quarter. Sales in Australia, where mining has boomed, also increased rapidly. |
Engines Sales
Engine sales were $2.744 billion in third quarter 2005, up $268 million or 11 percent from the third quarter 2004. Price realization accounted for $150 million, and sales volume added $118 million.
Dealer engine inventory declined during the third quarter of 2005, compared to an increase in inventory during the third quarter of 2004. The decline during the third quarter of 2005 reduced the company’s third-quarter sales growth compared to a year ago. Months of inventory relative to deliveries declined in all regions compared to third quarter 2004, as deliveries increased in response to market demand.
| · | North America sales were up 18 percent. Engine sales to the petroleum sector surged 57 percent, primarily from continued growth in demand for reciprocating engines as a result of higher energy prices as well as a strong increase in sales of turbines and turbine-related services driven by higher demand for gas production and transmission. Engine sales to the electric power sector were up 48 percent, with widespread increases in demand for generator sets to support business investments in standby power driven by healthy corporate profits. On-highway truck engine sales increased 3 percent, fueled by high freight demand and continued fleet replacements. Marine engine sales were up 56 percent with strong demand for workboat vessels to support petroleum production. |
| · | EAME sales increased about 9 percent. Electric power engine sales were up 16 percent with widespread strong demand for prime and standby generator sets. Engine sales into the marine sector were up 8 percent with ongoing demand for inland waterway and port support vessels. Petroleum engine sales dropped 18 percent, as decreased sales for gas transmission projects in Europe more than offset an increase in projects for offshore oil production in the AME region. Engine sales to the industrial sector decreased 2 percent, impacted by some Original Equipment Manufacturers' (OEMs) vertical engine integration and reduced demand for agricultural equipment. |
| · | Latin America sales were up 34 percent. Petroleum engine sales increased 41 percent from increased sales of turbines and turbine-related services, primarily for Mexico offshore oil production projects. Electric power engine sales were up 27 percent, benefiting from increased investment in generator sets for electric reliability, communications applications and rental fleets. |
| · | Asia/Pacific sales were down 18 percent. Marine engine sales were up 38 percent due to continued shipbuilding growth supported by increased freight tonnage. Petroleum engine sales were up 20 percent, primarily due to growing demand for reciprocating engines to support production. Engine sales to the electric power sector dropped 46 percent, primarily due to reduced opportunity for load management generator sets in China, as improved electricity availability and demand management efforts reduced the demand for generator sets. |
Financial Products Revenues
Financial Products revenues were $585 million, up $101 million or 21 percent from third quarter 2004. The increase was due primarily to a $61 million favorable impact from continued growth of Earning Assets and a $26 million impact of higher interest rates on new and existing finance receivables at Cat Financial.
Page 6
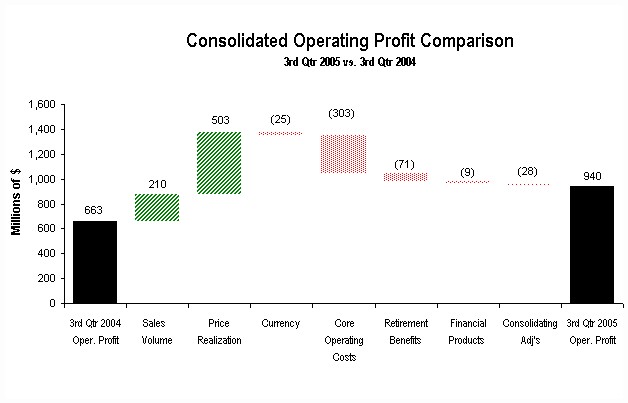 |
| The chart above graphically illustrates reasons for the change in Consolidated Operating Profit between 3rd Quarter 2004 (at left) and 3rd Quarter 2005 (at right). Items favorably impacting operating profit appear as upward stair steps with the corresponding dollar amounts above each bar, while items negatively impacting operating profit appear as downward stair steps with dollar amounts reflected in parentheses above each bar. Caterpillar management utilizes these charts internally to visually communicate with its Board and employees. |
Operating Profit
Third-quarter operating profit improved $277 million, or 42 percent over a year ago, driven by higher price realization and sales volume partially offset by higher core operating costs and retirement benefits.
Core operating costs rose $303 million from the third quarter of 2004, primarily due to a $236 million increase in manufacturing costs. Approximately 60 percent of the manufacturing cost increase was attributable to variable costs due to material, volume-related inefficiencies and increased freight and expediting costs. The remainder of the manufacturing cost increase was due to an increase in period manufacturing costs associated with building our products. Non-manufacturing related core operating costs were up $67 million - a result of higher Research and Development (R&D) and Selling, General and Administrative (SG&A) expenses to support product programs and the growth in volume. As a percent of sales, the total of SG&A and R&D expenses were lower than in the third quarter of 2004.
Page 7
Operating Profit by Principal Line of Business | |||||||||||||
(Millions of dollars) | 3rd Quarter 2004 | 3rd Quarter 2005 | Change $ | Change % | |||||||||
Machinery1 | $ | 411 | $ | 615 | $ | 204 | 50% | ||||||
Engines1 | 155 | 265 | 110 | 71% | |||||||||
| Financial Products | 132 | 123 | (9 | ) | (7%) | ||||||||
Consolidating Adjustments | (35 | ) | (63 | ) | (28 | ) | |||||||
| Consolidated Operating Profit | $ | 663 | $ | 940 | $ | 277 | 42% | ||||||
1 Caterpillar operations are highly integrated; therefore, the company uses a number of allocations to determine lines of business operating profit for Machinery and Engines. | |||||||||||||
Operating Profit by Principal Line of Business
| · | Machinery operating profit of $615 million was up $204 million, or 50 percent, from third quarter 2004. The favorable impact of improved price realization and higher sales volume was partially offset by higher core operating costs and higher retirement benefits. |
| · | Engines operating profit of $265 million was up $110 million, or 71 percent, from third quarter 2004. The favorable impact of improved price realization and higher sales volume was partially offset by higher core operating costs and higher retirement benefits. |
| · | Financial Products operating profit of $123 million was down $9 million, or 7 percent, from third quarter 2004. Cat Insurance experienced a $15 million decrease primarily due to less favorable reserve adjustments in 2005 than in 2004. In addition, there was a $12 million increase in operating expenses primarily related to growth, a $7 million write-down of a marine-related asset, and a $7 million write-off of investment-related income, partially offset by a $36 million favorable impact from the growth in earning assets at Cat Financial. |
Other Profit/Loss Items
| · | Other income/expense was income of $80 million compared with income of $60 million in third quarter 2004. The improvement was due to higher interest income and the absence of a number of expense items incurred during the third quarter of 2004 that were individually not significant. |
| · | The provision for income taxes in the third quarter reflects an estimated annual tax rate of 30 percent as compared to a 27 percent rate in 2004. The increase is primarily due to a reduction in our estimated Extraterritorial Income Exclusion (ETI) benefits, partially attributable to the impact of American Jobs Creation Act (AJCA) permitting only 80 percent of ETI benefits in 2005, and also to a change in our geographic mix of profits. Our estimated annual tax rate excludes the $11 million discrete charge recorded in the second quarter for our repatriation plans including the impact of the AJCA. The third quarter 2005 provision for income taxes includes an unfavorable adjustment of $18 million related to the first six months of 2005 resulting from an increase in the estimated annual tax rate from 29 to 30 percent. The change in the estimated rate was primarily from changes in our estimated tax benefits from ETI. |
Page 8
Employment
At the end of the third quarter, worldwide employment was 83,899 compared with 75,530 one year ago. The increase was primarily due to about 4,300 hourly labor additions to support higher volume and the conversion of about 2,000 supplemental employees to full-time employment.
Sales and Revenues Outlook | |||||||||||
(Millions of dollars) | 2004 | 2005 | % | ||||||||
Actual | Outlook | Change | |||||||||
| Machinery and Engines | |||||||||||
| North America | $ | 14,521 | $ | 17,700 | 22% | ||||||
| EAME | 7,505 | 8,950 | 19% | ||||||||
| Latin America | 2,372 | 3,050 | 29% | ||||||||
| Asia/Pacific | 3,938 | 4,250 | 8% | ||||||||
| Total Machinery and Engines | 28,336 | 33,950 | 20% | ||||||||
Financial Products1 | 1,970 | 2,350 | 19% | ||||||||
| Total | $ | 30,306 | $ | 36,300 | 20% | ||||||
1 Does not include revenues earned from Machinery and Engines of $199 million and $307 million in 2004 and 2005 outlook, respectively. | |||||||||||
2005 Outlook - Sales and Revenues
We project company sales and revenues will increase about 20 percent in 2005, setting a new record. That forecast assumes about a 12 percent increase in Machinery and Engines volume, a more than 5 percent gain from improved price realization and the rest from Financial Products revenues.
| · | Interest rates in most countries, except for the United States, have been stable this year, and economic growth has slowed only slightly from last year’s robust pace. Good economic growth, along with low interest rates, has provided an attractive investment environment. Machinery and equipment investments have increased much faster than overall economic growth in many countries, and those trends should continue for the rest of the year. |
| · | World demand for energy and most base metals has continued to grow, maintaining pressure on production capacities and inventories. As a result, prices increased over the course of 2005 and are very favorable for investment. Opportunities for mine development, oil and natural gas drilling and well servicing should remain favorable this year. |
| · | Consumers in many countries are upgrading housing, and home prices are rising. Growing incomes and favorable financing should keep residential construction strong in most regions this year. |
| · | The increase in world trade in this business cycle highlighted the inadequate condition of many countries’ infrastructure. Economic recoveries and higher commodity prices improved many governments’ finances, particularly in developing countries. As a result, several countries have boosted infrastructure spending. |
Page 9
| · | Business profits are at record highs in many countries, financing is attractive and stock prices are up. Consequently, companies have started to boost spending on new structures and standby power. We expect these recoveries will accelerate. |
North America (United States and Canada) Machinery and Engines sales are expected to increase about 22 percent in 2005.
| · | We expect the U. S. Federal Reserve will continue increasing interest rates this year, bringing the Federal funds rate to at least 4 percent by the end of the year. Economic growth will continue around 3.5 percent, fast enough to support demand in key industries we serve but not so fast as to cause inflation to accelerate. |
| · | Housing starts have averaged over a 2 million unit annual rate this year, and permits for new construction have averaged even higher. With 30-year mortgage rates near 6 percent, new home prices rising and inventories relatively low, housing starts in 2005 should be the highest in more than 30 years. |
| · | Investment in nonresidential structures has slowly improved over the past two years, but we expect the recovery to accelerate. Investment is well below the previous peak, businesses have record cash flows and financing terms are favorable. |
| · | Prices for metals and energy commodities increased throughout the third quarter and are attractive for producers to increase output. Production of metals increased 9 percent year to date; however, coal production was down slightly due to lower electricity generation and some transportation problems. We expect recent increases in utility output and the need to rebuild stocks will boost coal demand in coming months. |
| · | The North American truck fleet is growing in response to higher freight volume and improved profits. Demand for on-highway trucks is expected to continue strong, particularly for larger units. |
| · | Canadian economic growth has been somewhat slower than in the United States, but low interest rates and high commodity prices have benefited construction, mining and energy. Those sectors should continue doing well the rest of the year. |
EAME Machinery and Engines sales are expected to increase about 19 percent in 2005.
| · | The Euro-zone economy continued to grow slowly, and we expect no change in interest rates this year. In the United Kingdom, weaker than expected growth prompted a recent cut in interest rates. Low interest rates have encouraged somewhat faster growth in investment and construction, particularly housing. We project overall European growth will be about 2 percent this year. |
| · | Both AME and the CIS are benefiting from higher metals and energy prices, and both regions should grow more than 5 percent this year. Improved economic growth has prompted some countries to increase spending on infrastructure. |
Page 10
Latin America Machinery and Engines sales are expected to increase about 29 percent in 2005.
| · | Several countries recently cut interest rates, and we expect further rate cuts this year. Direct investment into the region is increasing, and overall economic growth should exceed 4 percent. |
| · | Higher metals prices have driven significant increases in production and investment in many countries. Better economic growth and lower interest rates have allowed construction to rebound from years of underinvestment. |
Asia/Pacific Machinery and Engines sales are expected to increase about 8 percent in 2005.
| · | Interest rates edged up slightly in recent months, but economic growth this year should exceed 6 percent. Rapid growth is requiring businesses to invest in new structures. |
| · | Australia and India increased mine production, especially for coal and iron ore. Prices for those commodities continue to be high, and we project investments in new mine capacity and supporting infrastructure will grow. |
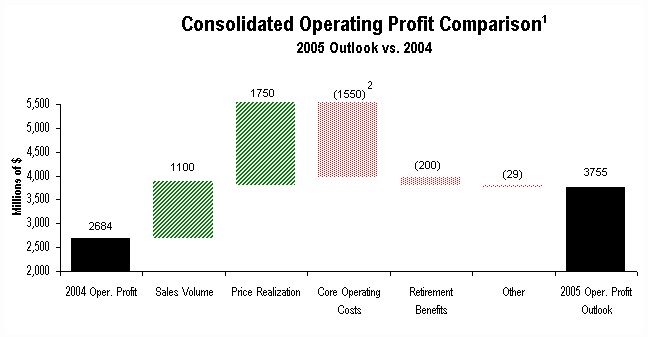 |
| 1 The PPS outlook is between $3.85 and $4.00. The above chart illustrates operating profit at the midpoint of this profit range. Each of the stair steps in the chart may individually vary within the outlook range. |
| 2 Includes $100 million of potential charges. |
2005 Outlook - Profit
The profit outlook for 2005 has been adjusted to reflect an estimated profit range of $3.85 to $4.00 per share, up 34 to 39 percent. The previous outlook reflected sales and revenues up 18 to 20 percent and profit per share of $4.00 to $4.20.
Page 11
The change in profit outlook includes potential charges of approximately $100 million before tax that are likely to be incurred in the fourth quarter and an increase in the estimated annual tax rate to 30 percent. Potential charges of $100 million are related to changes in our dealer distribution software and a product realignment that are under consideration.
The fourth-quarter outlook for 2005 reflects sales and revenues of $9.6 billion and profit per share in a range between $1.01 and $1.16.
Preliminary 2006 Outlook
Interest rates, except in the United States, have been fairly stable, and we expect only moderate rate increases in 2006. Inflation is low in most countries, and economic growth is not exceeding potential capacity. The world economy should grow about 3.5 percent, or the same as in 2005. Growth in the United States will slow to a little over 3 percent; improvements in Europe and Japan will offset this slowing.
| · | Low interest rates, rising employment and better home prices should allow some growth in housing construction, particularly outside the United States. Hurricane damage repair in the U.S. Gulf region will be a positive catalyst for building construction in 2006. |
| · | Another year of good economic growth will leave nonresidential structures increasingly inadequate to efficiently support production. We expect businesses will use record cash flows to increase spending on construction and standby power. |
| · | Economic growth will put increasing stress on many countries’ infrastructure. Governments are expected to use improved finances to increase infrastructure spending. We expect the U.S. highway bill will increase federal funds available for highway construction. |
| · | We believe the investment in mining and energy development that has occurred so far in this cycle has not been sufficient to restore adequate production capacity worldwide. Next year should be another good year for these industries, with prices down only slightly from this year. |
| · | Our preliminary projection is for about 10 percent increase in company sales and revenues over expected 2005 results. |
| · | The profit outlook for 2006 is expected to be up 15 to 25 percent from the middle of the profit range in the 2005 outlook. |
The outlook described above reflects our base case expectations. Economic risks to this outlook include: (1) excessive increases in interest rates driven by central bank inflationary concerns and (2) high energy costs that could negatively impact consumption. These developments could become severe enough to lower our outlook for 2006.
Supplemental Information
Information previously located in this section is now included in tabular format at http://www.cat.com/investor under the Quarterly Supplemental Information section.
Page 12
QUESTION AND ANSWER
General
Q1: | Will your 2007 on-highway engines be based on ACERT® Technology? |
| A: | Yes. Caterpillar will utilize the ACERT Technology to meet the 2007 on-highway emissions requirements. We demonstrated Caterpillar technological and environmental leadership at the Mid-America Truck Show earlier this year when we presented our 2007 ACERT emissions solution to the trade and business press. Our press event, which highlighted the new On-highway Vocational Transmission and our Clean Power Technology commitment, included a chance for editors to drive an ACERT-equipped 2007 compliant truck. Cat was the only engine manufacturer with an operable 2007 clean diesel engine on display at the show. Moreover, engines have been provided to OEMs for summer-cooling tests and additional field evaluation units are now shipping to fleet customers. ACERT Technology reduces emissions via a "building blocks" systems approach to air management, electronics and fuel systems. For 2007 on-highway engines, Caterpillar will build on the ACERT Technology foundation by utilizing a diesel particulate filter (DPF) to trap particulates and by introducing Clean Gas Induction (CGI). A differentiated approach, CGI will draw cool, clean filtered gas from downstream of the DPF and then put it into the engine's intake air system to achieve additional NOx reduction. Development of the Caterpillar unique CGI and Caterpillar Regeneration System (CRS) is showing added value versus competitive systems. Advantages in fuel economy, engine durability and after-treatment life are expected. |
Q2: | You’ve mentioned your accelerated timetable of having 2007 ACERT-equipped test engines placed with customers during mid-year 2005. Can you comment on the progress? |
| A: | Over 100 customer evaluation engines have been shipped to OEM truck manufacturers, and they are in the process of being delivered to customers for testing. We continue to take and fill orders for customers who want to evaluate the 2007 engines. |
Q3: | How are plans going to leverage ACERT Technology into other off-road applications? |
| A: | The ACERT launch in the machine business is well underway. By the end of 2005, 45 machine models powered by Tier 3/Stage IIIA ACERT-equipped engines should be in production. Caterpillar was the only manufacturer at CONEXPO exhibiting machines with Tier 3/Stage IIIA certified engines. |
Third Quarter 2005 vs. Third Quarter 2004
Q4: | Are recent price increases holding in the marketplace? |
| A: | We continue to monitor the marketplace for the impact of the recent price actions. Indications are that these actions are finding their way into commercial transactions. The degree and speed may vary for different markets, but the trends at this time are indicating improving price levels. We closely monitor price levels for our products by region, and we are determined to maintain our market position. |
Page 13
Q5: | Are you seeing any evidence yet of improvement in supply chain conditions? |
| A: | Yes. For most components, our plants are seeing improved supplier delivery performance and overall supply chain efficiency. However, demand continues to increase, and our factories are working to raise production schedules to meet the strong growth in demand. Tires continue to have tight availability, and on a factory-by-factory basis a number of component categories are in tight supply. |
Q6: | Is product availability improving? |
| A: | Machines - Overall, availability has not yet recovered to where it was in the first half of 2004, and strong increases in demand continue to pose a challenge to our production operations. As a result, about 60 machine models are on managed distribution. Engines - Product availability is improving in most areas, with a few supply constraints still being worked. Heavy-duty truck and commercial engines have demonstrated substantial line rate increases. Our larger high-speed engine production is running at substantially higher line rates compared to 2004, but high demand has caused extended delivery times. |
Q7: | Are you at capacity for large mining products? If so, what are you doing about it? |
| A: | Demand for mining products has increased at an unprecedented rate over the past two years, and our factories have responded by dramatically increasing production. Lead times on most large mining products are significantly longer than usual. We are working with our supply chain and our factories to respond to the increasing demand and have numerous 6 Sigma teams working to further increase our production. |
Q8: | Can you please provide more detail on your increases in core operating costs? |
| A: | The following table summarizes the increase in core operating costs in third quarter 2005 versus third quarter 2004: |
Core Operating Cost Change | 3rd Quarter 2005 | ||||
vs. | |||||
(Millions of dollars) | 3rd Quarter 2004 | ||||
| Manufacturing Costs | $ | 236 | |||
| SG&A | 24 | ||||
| R&D | 41 | ||||
| Other Operating Costs | 2 | ||||
| Total | $ | 303 | |||
| Approximately 60 percent of the manufacturing cost increase is attributable to variable cost increases—about half of which is material and the remainder due to volume-related inefficiencies and increased freight and expediting costs. |
Page 14
Manufacturing costs also include period manufacturing costs associated with building our products. Period manufacturing costs increased 10 percent or approximately $90 million to support the 17 percent increase in Machinery and Engines sales. Machinery and Engines SG&A declined as a percentage of sales from 8.7 percent in third quarter 2004 to 8.2 percent in third quarter 2005 but was up $24 million versus 2004 excluding the impact of currency and retirement benefits. Machinery and Engines operating margins are improving compared with the second half of 2004: |
Q1 ‘04 | Q2 ‘04 | Q3 ‘04 | Q4 ‘04 | Q1 ‘05 | Q2 ‘05 | Q3 ‘05 | |||||||
| 8.0% | 9.7% | 7.9% | 7.6% | 8.7% | 10.7% | 10.5% |
Q9: | Why did the tax rate increase in the third quarter? Is it likely that 2006 is going to be up further? |
| A: | The effective tax rate increased from 29 percent to 30 percent primarily because of a change in our estimate of ETI benefits. The rate will likely go up further next year because of the continued phase out of ETI. The American Jobs Creation Act provides for the phase-out of ETI with 80 percent of benefits in 2005, 60 percent of benefits in 2006 and complete phase-out in 2007. |
Outlook
Q10: | Are the machine industries you serve approaching a peak after seeing sales growth in 2003, 2004 and 2005? |
| A: | We don't think so. This recovery follows a four-year period of industry weakness, with flat sales from 1999 to 2002. Extended weak periods in the early 1980s and 1990s were followed by lengthy recoveries, with sales doubling over a five- to six-year period. In addition, many industries we serve still have growth potential. In the United States, non-residential construction and mining have not yet regained prior peaks. The new highway bill should support further growth in highway construction. In Euro-zone countries, economic recovery has not really started, even after more than four years of weak growth. However, low interest rates are boosting housing construction and some investment in equipment. AME, Latin America and the CIS are seeing gains from better commodity prices. Their economies, along with construction, are recovering from years of weak growth. Asian economies have demonstrated a long-term ability to grow rapidly, which requires more construction. We expect that to continue. Finally, capacities in mining and energy are inadequate to meet today's requirements. Rebuilding adequate capacity and meeting future growth in demand for metals and energy will require significant further investment. |
Page 15
Q11: | Please elaborate on your expectations for material costs in the 2005 outlook. |
| A: | We had expected that material costs, particularly steel, would begin trending down over the second half of 2005. Costs for some types of steel did start to decline as we began the quarter. However, the outlook for the remainder of 2005 does reflect higher material costs than we had expected in our previous outlook. |
Q12: | Is incentive compensation a factor in the increase in core operating costs for 2005? |
| A: | Based on our latest outlook, 2005 incentive compensation is expected to be about 10 percent lower than in 2004. |
Q13: | Your 2006 outlook doesn’t appear to be achieving your ROS (Return on Sales) target of 9 percent plus—is that still the target? |
| A: | While our target is still 9 percent plus, the outlook for 2006 does not reflect that level of profitability. As compared with 2005, employee benefit costs, the expensing of stock options and the annual tax rate are all expected to negatively impact profitability—we’re looking for another record year, but the profitability projected is below our target. |
Q14: | Can you comment on the possible effect of recent natural disasters on your outlook? |
| A: | The devastating earthquakes in Asia and the hurricanes along the U.S. Gulf Coast were tragic events that still require significant humanitarian effort in their aftermath, and we are proud of the response of our employees and dealers. These disasters are not likely to have a significant effect on 2005 profit. |
GLOSSARY OF TERMS
| 1. | Consolidating Adjustments - Eliminations of transactions between Machinery and Engines and Financial Products. |
| 2. | Core Operating Costs - Machinery and Engines variable manufacturing cost change adjusted for volume and change in period costs. Excludes the impact of currency and retirement benefits. |
| 3. | Currency - With respect to sales and revenues, currency represents the translation impact on sales resulting from changes in foreign currency exchange rates versus the U.S. dollar. With respect to operating profit, currency represents the net translation impact on sales and operating costs resulting from changes in foreign currency exchange rates versus the U.S. dollar. Currency includes the impacts on sales and operating profit for the Machinery and Engines lines of business only; currency impacts on the Financial Products line of business are included in the Financial Products portions of the respective analyses. With respect to profit before tax, currency represents the net translation impact on sales, operating costs and other income/expense resulting from changes in foreign currency exchange rates versus the U.S. dollar. Also included in the currency impact on other income/expense are the effects of currency forward and option contracts entered into by the company to reduce the risk of fluctuations in exchange rates and the net effect of changes in foreign currency exchange rates on our foreign currency assets and liabilities. |
| 4. | EAME - Geographic region including Europe, Africa, the Middle East and the Commonwealth of Independent States (CIS). |
| 5. | Earning Assets - These assets consist primarily of total net finance receivables plus retained interests in securitized trade receivables, plus equipment on operating leases, less accumulated depreciation at Cat Financial. Net finance receivables represent the gross receivables amount less unearned income and the allowance for credit losses. |
Page 16
| 6. | Engines - A principal line of business including the design, manufacture, marketing and sales of engines for Caterpillar machinery, electric power generation systems; on-highway vehicles and locomotives; marine, petroleum, construction, industrial, agricultural and other applications; and related parts. Reciprocating engines meet power needs ranging from 5 to over 22,000 horsepower (4 to over 16 200 kilowatts). Turbines range from 1,200 to 20,500 horsepower (900 to 15 000 kilowatts). |
| 7. | Financial Products - A principal line of business consisting primarily of Caterpillar Financial Services Corporation (Cat Financial), Caterpillar Insurance Holdings, Inc. (Cat Insurance), Caterpillar Power Ventures Corporation (Cat Power Ventures) and their respective subsidiaries. Cat Financial provides a wide range of financing alternatives to customers and dealers for Caterpillar machinery and engines, Solar gas turbines, as well as other equipment and marine vessels. Cat Financial also extends loans to customers and dealers. Cat Insurance provides various forms of insurance to customers and dealers to help support the purchase and lease of our equipment. Cat Power Ventures is an active investor in independent power projects using Caterpillar power generation equipment and services. |
| 8. | Latin America - Geographic region including the Central and South American countries and Mexico. |
| 9. | Machinery - A principal line of business which includes the design, manufacture, marketing and sales of construction, mining and forestry machinery—track and wheel tractors, track and wheel loaders, pipelayers, motor graders, wheel tractor-scrapers, track and wheel excavators, backhoe loaders, log skidders, log loaders, off-highway trucks, articulated trucks, paving products, telescopic handlers, skid steer loaders and related parts. Also includes logistics services for other companies. |
| 10. | Machinery and Engines - Due to the highly integrated nature of operations, represents the aggregate total of the Machinery and Engines lines of business and includes primarily our manufacturing, marketing and parts distribution operations. |
| 11. | Manufacturing Costs - Represents our cost of goods sold. Comprised of variable costs adjusted for volume and period manufacturing costs. Variable manufacturing costs are defined as having a direct relationship with the volume of production. This includes material costs, direct labor and other costs that vary directly with production volume such as freight, power to operate machines, and supplies that are consumed in the manufacturing process. Period manufacturing costs support production but are defined as generally not having a direct relationship to short-term changes in volume. Examples include machine and equipment repair, depreciation on manufacturing assets, facility support, procurement, factory scheduling, manufacturing planning and operations management. Excludes the impact of currency and retirement benefits. |
| 12. | Period Costs - Comprised of Machinery and Engines period manufacturing costs, SG&A expense, R&D expense and other operating costs. Excludes the impact of currency and retirement benefits. |
| 13. | Price Realization - The impact of net price changes excluding currency. |
| 14. | Retirement Benefits - Cost of defined benefit pension plans, defined contribution plans and retirement healthcare and life insurance. |
| 15. | Sales Volume - With respect to sales and revenues, sales volume represents the impact of changes in the quantities sold for machines, engines and parts. With respect to operating profit, sales volume represents the impact of changes in the quantities sold for machines, engines and parts combined with the net operating profit impact of changes in the relative weighting of machines, engines and parts sales with respect to total sales. |
| 16. | 6 Sigma - On a technical level, 6 Sigma represents a measure of variation that achieves 3.4 defects per million opportunities. At Caterpillar, 6 Sigma represents a much broader cultural philosophy to drive continuous improvement throughout the value chain. It is a fact-based, data-driven methodology that we are using to improve processes, enhance quality, cut costs, grow our business and deliver greater value to our customers through Black Belt-led project teams. At Caterpillar, 6 Sigma goes beyond mere process improvement—it has become the way we work as teams to process business information, solve problems and manage our business successfully. |
Page 17
NON-GAAP FINANCIAL MEASURES
The following definition is provided for “non-GAAP financial measures” in connection with Regulation G issued by the Securities and Exchange Commission. This non-GAAP financial measure has no standardized meaning prescribed by U.S. GAAP, and therefore is unlikely to be comparable to the calculation of similar measures for other companies. Management does not intend this item to be considered in isolation or as a substitute for the related GAAP measure.
Machinery and Engines
Caterpillar defines Machinery and Engines as it is presented in the supplemental data as Caterpillar Inc. and its subsidiaries with Financial Products accounted for on the equity basis. Machinery and Engines information relates to the design, manufacture and marketing of our products. Financial Products information relates to the financing to customers and dealers for the purchase and lease of Caterpillar and other equipment. The nature of these businesses is different, especially with regard to the financial position and cash flow items. Caterpillar management utilizes this presentation internally to highlight these differences. We also believe this presentation will assist readers in understanding our business. Pages 22-27 reconcile Machinery and Engines with Financial Products on the equity basis to Caterpillar Inc. Consolidated financial information.
* * *
The information included in the Outlook section is forward-looking and involves risks and uncertainties that could significantly affect expected results. A discussion of these risks and uncertainties is contained in Form 8-K filed with the Securities & Exchange Commission (SEC) on October 21, 2005. This filing is available on our website at http://www.cat.com/sec_filings.
Caterpillar's latest financial results and current outlook are also available via:
Telephone:
(800) 228-7717 (Inside the United States and Canada)
(858) 244-2080 (Outside the United States and Canada)
Internet:
http://www.cat.com/investor
http://www.cat.com/irwebcast (live broadcast/replays of quarterly conference call)
Caterpillar contact:
Rusty Dunn
Corporate Public Affairs
(309) 675-4803
Dunn_Rusty L@cat.com
Page 18
Caterpillar Inc. Condensed Consolidated Statement of Results of Operations (Unaudited) (Dollars in millions except per share data) | ||||||||||||||||
Three Months Ended | Nine Months Ended | |||||||||||||||
September 30, | September 30, | |||||||||||||||
2005 | 2004 | 2005 | 2004 | |||||||||||||
Sales and revenues: | ||||||||||||||||
Sales of Machinery and Engines | $ | 8,392 | $ | 7,175 | $ | 24,965 | $ | 20,277 | ||||||||
| Revenues of Financial Products | 585 | 484 | 1,711 | 1,445 | ||||||||||||
Total sales and revenues | 8,977 | 7,659 | 26,676 | 21,722 | ||||||||||||
Operating costs: | ||||||||||||||||
Cost of goods sold | 6,547 | 5,745 | 19,652 | 16,009 | ||||||||||||
Selling, general and administrative expenses | 775 | 701 | 2,308 | 2,118 | ||||||||||||
Research and development expenses | 285 | 240 | 794 | 685 | ||||||||||||
Interest expense of Financial Products | 197 | 130 | 551 | 370 | ||||||||||||
Other operating expenses | 233 | 180 | 654 | 539 | ||||||||||||
Total operating costs | 8,037 | 6,996 | 23,959 | 19,721 | ||||||||||||
Operating profit | 940 | 663 | 2,717 | 2,001 | ||||||||||||
Interest expense excluding Financial Products | 68 | 60 | 198 | 176 | ||||||||||||
Other income (expense) | 80 | 60 | 278 | 171 | ||||||||||||
Consolidated profit before taxes | 952 | 663 | 2,797 | 1,996 | ||||||||||||
Provision for income taxes | 303 | 182 | 850 | 549 | ||||||||||||
Profit of consolidated companies | 649 | 481 | 1,947 | 1,447 | ||||||||||||
Equity in profit (loss) of unconsolidated affiliated companies | 18 | 17 | 61 | 37 | ||||||||||||
Profit | $ | 667 | $ | 498 | $ | 2,008 | $ | 1,484 | ||||||||
Profit per common share | $ | .98 | $ | .73 | $ | 2.95 | $ | 2.17 | ||||||||
Profit per common share - diluted 1 | $ | .94 | $ | .70 | $ | 2.84 | $ | 2.10 | ||||||||
Weighted average common shares outstanding (millions) | ||||||||||||||||
- Basic | 678.8 | 683.6 | 680.5 | 684.5 | ||||||||||||
- Diluted 1 | 710.7 | 706.0 | 707.4 | 708.4 | ||||||||||||
Cash dividends declared per common share | $ | - | $ | - | $ | .46 | $ | .39 | ||||||||
1 Diluted by assumed exercise of stock options, using the treasury stock method. | ||||||||||||||||
| Certain amounts for prior periods have been reclassified to conform to current financial statement presentation. | ||||||||||||||||
Page 19
Caterpillar Inc. Condensed Consolidated Statement of Financial Position (Unaudited) (Millions of dollars) | |||||||||||
Sep. 30, | Dec. 31, | ||||||||||
2005 | 2004 | ||||||||||
Assets | |||||||||||
| Current assets: | |||||||||||
| Cash and short-term investments | $ | 967 | $ | 445 | |||||||
| Receivables - trade and other | 7,319 | 7,463 | |||||||||
| Receivables - finance | 5,725 | 5,182 | |||||||||
| Deferred and refundable income taxes | 581 | 398 | |||||||||
| Prepaid expenses | 1,301 | 1,369 | |||||||||
| Inventories | 5,469 | 4,675 | |||||||||
| Total current assets | 21,362 | 19,532 | |||||||||
| Property, plant and equipment - net | 7,817 | 7,682 | |||||||||
| Long-term receivables - trade and other | 893 | 764 | |||||||||
| Long-term receivables - finance | 10,336 | 9,903 | |||||||||
| Investments in unconsolidated affiliated companies | 563 | 517 | |||||||||
| Deferred income taxes | 707 | 674 | |||||||||
| Intangible assets | 462 | 315 | |||||||||
| Goodwill | 1,451 | 1,450 | |||||||||
| Other assets | 2,274 | 2,258 | |||||||||
Total assets | $ | 45,865 | $ | 43,095 | |||||||
Liabilities | |||||||||||
| Current liabilities: | |||||||||||
| Short-term borrowings: | |||||||||||
| -- Machinery and Engines | $ | 603 | $ | 93 | |||||||
| -- Financial Products | 5,031 | 4,064 | |||||||||
| Accounts payable | 3,425 | 3,580 | |||||||||
| Accrued expenses | 2,508 | 2,261 | |||||||||
| Accrued wages, salaries and employee benefits | 1,735 | 1,730 | |||||||||
| Customer advances | 554 | 447 | |||||||||
| Dividends payable | - | 141 | |||||||||
Deferred and current income taxes payable | 583 | 259 | |||||||||
| Long-term debt due within one year: | |||||||||||
| -- Machinery and Engines | 234 | 6 | |||||||||
| -- Financial Products | 3,850 | 3,525 | |||||||||
| Total current liabilities | 18,523 | 16,106 | |||||||||
| Long-term debt due after one year: | |||||||||||
| -- Machinery and Engines | 3,406 | 3,663 | |||||||||
| -- Financial Products | 11,908 | 12,174 | |||||||||
| Liability for postemployment benefits | 2,827 | 2,986 | |||||||||
| Deferred income taxes and other liabilities | 809 | 699 | |||||||||
Total liabilities | 37,473 | 35,628 | |||||||||
Stockholders' equity | |||||||||||
| Common stock | 1,821 | 1,231 | |||||||||
| Treasury stock | (4,039 | ) | (3,277 | ) | |||||||
| Profit employed in the business | 11,298 | 9,937 | |||||||||
| Accumulated other comprehensive income | (688 | ) | (424 | ) | |||||||
Total stockholders' equity | 8,392 | 7,467 | |||||||||
Total liabilities and stockholders' equity | $ | 45,865 | $ | 43,095 | |||||||
Certain amounts for prior periods have been reclassified to conform to current financial statement presentation. | |||||||||||
Page 20
Caterpillar Inc. Condensed Consolidated Statement of Cash Flow (Unaudited) (Millions of dollars) | |||||||||
Nine Months Ended September 30, | |||||||||
Cash flow from operating activities: | 2005 | 2004 | |||||||
Profit | $ | 2,008 | $ | 1,484 | |||||
| Adjustments for non-cash items: | |||||||||
Depreciation and amortization | 1,113 | 1,055 | |||||||
Other | (89 | ) | (83 | ) | |||||
| Changes in assets and liabilities: | |||||||||
Receivables - trade and other (see non-cash items below) | (620 | ) | (7,110 | ) | |||||
Inventories | (794 | ) | (1,225 | ) | |||||
Accounts payable and accrued expenses | 313 | 728 | |||||||
Other - net | 100 | 74 | |||||||
Net cash provided by (used for) operating activities | 2,031 | (5,077 | ) | ||||||
Cash flow from investing activities: | |||||||||
Capital expenditures - excluding equipment leased to others | (709 | ) | (519 | ) | |||||
Expenditures for equipment leased to others | (965 | ) | (827 | ) | |||||
Proceeds from disposals of property, plant and equipment | 447 | 378 | |||||||
Additions to finance receivables | (7,310 | ) | (6,423 | ) | |||||
Collections of finance receivables | 4,889 | 4,617 | |||||||
Proceeds from the sale of finance receivables | 916 | 647 | |||||||
Collections of retained interests in securitized trade receivables | - | 5,722 | |||||||
Investments and acquisitions (net of cash acquired) | (12 | ) | (284 | ) | |||||
Other - net | 80 | (40 | ) | ||||||
Net cash provided by (used for) investing activities | (2,664 | ) | 3,271 | ||||||
Cash flow from financing activities: | |||||||||
Dividends paid | (449 | ) | (395 | ) | |||||
Common stock issued, including treasury shares reissued | 511 | 137 | |||||||
Treasury shares purchased | (1,039 | ) | (400 | ) | |||||
Proceeds from long-term debt issued | 4,358 | 4,532 | |||||||
Payments on long-term debt | (3,324 | ) | (2,615 | ) | |||||
Short-term borrowings - net | 1,085 | 563 | |||||||
Net cash provided by financing activities | 1,142 | 1,822 | |||||||
Effect of exchange rate changes on cash | 13 | 59 | |||||||
Increase in cash and short-term investments | 522 | 75 | |||||||
Cash and short-term investments at beginning of period | 445 | 342 | |||||||
Cash and short-term investments at end of period | $ | 967 | $ | 417 | |||||
All short-term investments, which consist primarily of highly liquid investments with original maturities of three months or less, are considered to be cash equivalents. | |||||||||
Non-cash operating and investing activities: Trade receivables of $0 and $6,786 million were exchanged for retained interests in securitized trade receivables during the nine months ended September 30, 2005 and 2004, respectively. | |||||||||
| Certain amounts for prior periods have been reclassified to conform to current financial statement presentation. | |||||||||
Page 21
Caterpillar Inc. Supplemental Data for Results of Operations For The Three Months Ended September 30, 2005 (Unaudited) (Millions of dollars) | ||||||||||||||||
Supplemental Consolidating Data | ||||||||||||||||
Consolidated | Machinery and Engines 1 | Financial Products | Consolidating Adjustments | |||||||||||||
Sales and revenues: | ||||||||||||||||
Sales of Machinery and Engines | $ | 8,392 | $ | 8,392 | $ | - | $ | - | ||||||||
Revenues of Financial Products | 585 | - | 667 | (82 | )2 | |||||||||||
Total sales and revenues | 8,977 | 8,392 | 667 | (82 | ) | |||||||||||
Operating costs: | ||||||||||||||||
Cost of goods sold | 6,547 | 6,547 | - | - | ||||||||||||
Selling, general and administrative expenses | �� | 775 | 676 | 110 | (11 | )3 | ||||||||||
Research and development expenses | 285 | 285 | - | - | ||||||||||||
Interest expense of Financial Products | 197 | - | 203 | (6 | )4 | |||||||||||
Other operating expenses | 233 | 4 | 231 | (2 | )3 | |||||||||||
Total operating costs | 8,037 | 7,512 | 544 | (19 | ) | |||||||||||
Operating profit | 940 | 880 | 123 | (63 | ) | |||||||||||
Interest expense excluding Financial Products | 68 | 69 | - | (1 | )4 | |||||||||||
Other income (expense) | 80 | 1 | 17 | 62 | 5 | |||||||||||
Consolidated profit before taxes | 952 | 812 | 140 | - | ||||||||||||
Provision for income taxes | 303 | 256 | 47 | - | ||||||||||||
Profit of consolidated companies | 649 | 556 | 93 | - | ||||||||||||
Equity in profit (loss) of unconsolidated affiliated companies | 18 | 16 | 2 | - | ||||||||||||
Equity in profit of Financial Products' subsidiaries | - | 95 | - | (95 | )6 | |||||||||||
Profit | $ | 667 | $ | 667 | $ | 95 | $ | (95 | ) | |||||||
1 Represents Caterpillar Inc. and its subsidiaries with Financial Products accounted for on the equity basis. | ||||||||||||||||
2 Elimination of Financial Products revenues earned from Machinery and Engines. | ||||||||||||||||
3 Elimination of net expenses recorded by Machinery and Engines paid to Financial Products. | ||||||||||||||||
4 Elimination of interest expense recorded between Financial Products and Machinery and Engines. | ||||||||||||||||
5 Elimination of discount recorded by Machinery and Engines on receivables sold to Financial Products and of interest earned between Machinery and Engines and Financial Products. | ||||||||||||||||
6 Elimination of Financial Products profit due to equity method of accounting. | ||||||||||||||||
Page 22
Caterpillar Inc. Supplemental Data for Results of Operations For The Three Months Ended September 30, 2004 (Unaudited) (Millions of dollars) | ||||||||||||||||
Supplemental Consolidating Data | ||||||||||||||||
Consolidated | Machinery and Engines 1 | Financial Products | Consolidating Adjustments | |||||||||||||
Sales and revenues: | ||||||||||||||||
Sales of Machinery and Engines | $ | 7,175 | $ | 7,175 | $ | - | $ | - | ||||||||
Revenues of Financial Products | 484 | - | 437 | 47 | 2 | |||||||||||
Total sales and revenues | 7,659 | 7,175 | 437 | 47 | ||||||||||||
Operating costs: | ||||||||||||||||
Cost of goods sold | 5,745 | 5,745 | - | - | ||||||||||||
Selling, general and administrative expenses | 701 | 622 | 98 | (19 | )3 | |||||||||||
Research and development expenses | 240 | 240 | - | - | ||||||||||||
Interest expense of Financial Products | 130 | - | 133 | (3 | )4 | |||||||||||
Other operating expenses | 180 | 2 | 74 | 104 | 3 | |||||||||||
Total operating costs | 6,996 | 6,609 | 305 | 82 | ||||||||||||
Operating profit | 663 | 566 | 132 | (35 | ) | |||||||||||
Interest expense excluding Financial Products | 60 | 62 | - | (2 | )4 | |||||||||||
Other income (expense) | 60 | 15 | 12 | 33 | 5 | |||||||||||
Consolidated profit before taxes | 663 | 519 | 144 | - | ||||||||||||
Provision for income taxes | 182 | 141 | 41 | - | ||||||||||||
Profit of consolidated companies | 481 | 378 | 103 | - | ||||||||||||
Equity in profit (loss) of unconsolidated affiliated companies | 17 | 17 | - | - | ||||||||||||
Equity in profit of Financial Products' subsidiaries | - | 103 | - | (103 | )6 | |||||||||||
Profit | $ | 498 | $ | 498 | $ | 103 | $ | (103 | ) | |||||||
1 Represents Caterpillar Inc. and its subsidiaries with Financial Products accounted for on the equity basis. | ||||||||||||||||
2 Elimination of Financial Products revenues earned from Machinery and Engines. | ||||||||||||||||
3 Elimination of net expenses recorded by Machinery and Engines paid to Financial Products. | ||||||||||||||||
4 Elimination of interest expense recorded between Financial Products and Machinery and Engines. | ||||||||||||||||
5 Elimination of discount recorded by Machinery and Engines on receivables sold to Financial Products and of interest earned between Machinery and Engines and Financial Products. | ||||||||||||||||
6 Elimination of Financial Products profit due to equity method of accounting. | ||||||||||||||||
| Certain amounts have been reclassified to conform to the 2005 financial statement presentation. | ||||||||||||||||
Page 23
Caterpillar Inc. Supplemental Data for Results of Operations For The Nine Months Ended September 30, 2005 (Unaudited) (Millions of dollars) | ||||||||||||||||
Supplemental Consolidating Data | ||||||||||||||||
Consolidated | Machinery and Engines 1 | Financial Products | Consolidating Adjustments | |||||||||||||
Sales and revenues: | ||||||||||||||||
Sales of Machinery and Engines | $ | 24,965 | $ | 24,965 | $ | - | $ | - | ||||||||
Revenues of Financial Products | 1,711 | - | 1,935 | (224 | )2 | |||||||||||
Total sales and revenues | 26,676 | 24,965 | 1,935 | (224 | ) | |||||||||||
Operating costs: | ||||||||||||||||
Cost of goods sold | 19,652 | 19,652 | - | - | ||||||||||||
Selling, general and administrative expenses | 2,308 | 2,013 | 328 | (33 | )3 | |||||||||||
Research and development expenses | 794 | 794 | - | - | ||||||||||||
Interest expense of Financial Products | 551 | - | 565 | (14 | )4 | |||||||||||
Other operating expenses | 654 | 6 | 653 | (5 | )3 | |||||||||||
Total operating costs | 23,959 | 22,465 | 1,546 | (52 | ) | |||||||||||
Operating profit | 2,717 | 2,500 | 389 | (172 | ) | |||||||||||
Interest expense excluding Financial Products | 198 | 202 | - | (4 | )4 | |||||||||||
Other income (expense) | 278 | 76 | 34 | 168 | 5 | |||||||||||
Consolidated profit before taxes | 2,797 | 2,374 | 423 | - | ||||||||||||
Provision for income taxes | 850 | 704 | 146 | - | ||||||||||||
Profit of consolidated companies | 1,947 | 1,670 | 277 | - | ||||||||||||
Equity in profit (loss) of unconsolidated affiliated companies | 61 | 54 | 7 | - | ||||||||||||
Equity in profit of Financial Products' subsidiaries | - | 284 | - | (284 | )6 | |||||||||||
Profit | $ | 2,008 | $ | 2,008 | $ | 284 | $ | (284 | ) | |||||||
1 Represents Caterpillar Inc. and its subsidiaries with Financial Products accounted for on the equity basis. | ||||||||||||||||
2 Elimination of Financial Products revenues earned from Machinery and Engines. | ||||||||||||||||
3 Elimination of net expenses recorded by Machinery and Engines paid to Financial Products. | ||||||||||||||||
4 Elimination of interest expense recorded between Financial Products and Machinery and Engines. | ||||||||||||||||
5 Elimination of discount recorded by Machinery and Engines on receivables sold to Financial Products and of interest earned between Machinery and Engines and Financial Products. | ||||||||||||||||
6 Elimination of Financial Products profit due to equity method of accounting. | ||||||||||||||||
Page 24
Caterpillar Inc. Supplemental Data for Results of Operations For The Nine Months Ended September 30, 2004 (Unaudited) (Millions of dollars) | ||||||||||||||||
Supplemental Consolidating Data | ||||||||||||||||
Consolidated | Machinery and Engines 1 | Financial Products | Consolidating Adjustments | |||||||||||||
Sales and revenues: | ||||||||||||||||
Sales of Machinery and Engines | $ | 20,277 | $ | 20,277 | $ | - | $ | - | ||||||||
Revenues of Financial Products | 1,445 | - | 1,587 | (142 | )2 | |||||||||||
Total sales and revenues | 21,722 | 20,277 | 1,587 | (142 | ) | |||||||||||
Operating costs: | ||||||||||||||||
Cost of goods sold | 16,009 | 16,009 | - | - | ||||||||||||
Selling, general and administrative expenses | 2,118 | 1,846 | 315 | (43 | )3 | |||||||||||
Research and development expenses | 685 | 685 | - | - | ||||||||||||
Interest expense of Financial Products | 370 | - | 378 | (8 | )4 | |||||||||||
Other operating expenses | 539 | 2 | 537 | - | ||||||||||||
Total operating costs | 19,721 | 18,542 | 1,230 | (51 | ) | |||||||||||
Operating profit | 2,001 | 1,735 | 357 | (91 | ) | |||||||||||
Interest expense excluding Financial Products | 176 | 180 | - | (4 | )4 | |||||||||||
Other income (expense) | 171 | 64 | 20 | 87 | 5 | |||||||||||
Consolidated profit before taxes | 1,996 | 1,619 | 377 | - | ||||||||||||
Provision for income taxes | 549 | 428 | 121 | - | ||||||||||||
Profit of consolidated companies | 1,447 | 1,191 | 256 | - | ||||||||||||
Equity in profit (loss) of unconsolidated affiliated companies | 37 | 35 | 2 | - | ||||||||||||
Equity in profit of Financial Products' subsidiaries | - | 258 | - | (258 | )6 | |||||||||||
Profit | $ | 1,484 | $ | 1,484 | $ | 258 | $ | (258 | ) | |||||||
1 Represents Caterpillar Inc. and its subsidiaries with Financial Products accounted for on the equity basis. | ||||||||||||||||
2 Elimination of Financial Products revenues earned from Machinery and Engines. | ||||||||||||||||
3 Elimination of net expenses recorded by Machinery and Engines paid to Financial Products. | ||||||||||||||||
4 Elimination of interest expense recorded between Financial Products and Machinery and Engines. | ||||||||||||||||
5 Elimination of discount recorded by Machinery and Engines on receivables sold to Financial Products and of interest earned between Machinery and Engines and Financial Products. | ||||||||||||||||
6 Elimination of Financial Products profit due to equity method of accounting. | ||||||||||||||||
| Certain amounts have been reclassified to conform to the 2005 financial statement presentation. | ||||||||||||||||
Page 25
Caterpillar Inc. Supplemental Data for Cash Flow For The Nine Months Ended September 30, 2005 (Unaudited) (Millions of dollars) | |||||||||||||||||
Supplemental Consolidating Data | |||||||||||||||||
Consolidated | Machinery and Engines1 | Financial Products | Consolidating Adjustments | ||||||||||||||
Cash flow from operating activities: | |||||||||||||||||
Profit | $ | 2,008 | $ | 2,008 | $ | 284 | $ | (284 | )2 | ||||||||
| Adjustments for non-cash items: | |||||||||||||||||
Depreciation and amortization | 1,113 | 633 | 480 | - | |||||||||||||
Undistributed profit of Financial Products | - | (284 | ) | - | 284 | 3 | |||||||||||
Other | (89 | ) | (150 | ) | (141 | ) | 202 | 4 | |||||||||
| Changes in assets and liabilities: | |||||||||||||||||
Receivables - trade and other | (620 | ) | 149 | 10 | (779 | )4/5 | |||||||||||
Inventories | (794 | ) | (794 | ) | - | - | |||||||||||
Accounts payable and accrued expenses | 313 | 207 | 114 | (8 | )4 | ||||||||||||
Other - net | 100 | 74 | 35 | (9 | )4 | ||||||||||||
Net cash provided by (used for) operating activities | 2,031 | 1,843 | 782 | (594 | ) | ||||||||||||
Cash flow from investing activities: | |||||||||||||||||
Capital expenditures - excluding equipment leased to others | (709 | ) | (677 | ) | (32 | ) | - | ||||||||||
Expenditures for equipment leased to others | (965 | ) | - | (965 | ) | - | |||||||||||
Proceeds from disposals of property, plant and equipment | 447 | 31 | 416 | - | |||||||||||||
Additions to finance receivables | (7,310 | ) | - | (24,898 | ) | 17,588 | 5 | ||||||||||
Collections of finance receivables | 4,889 | - | 21,589 | (16,700 | )5 | ||||||||||||
Proceeds from the sale of finance receivables | 916 | - | 1,178 | (262 | )5 | ||||||||||||
Net intercompany borrowings | - | (315 | ) | (11 | ) | 326 | 6 | ||||||||||
Investments and acquisitions (net of cash acquired) | (12 | ) | (12 | ) | - | - | |||||||||||
Other - net | 80 | (7 | ) | 87 | - | ||||||||||||
Net cash provided by (used for) investing activities | (2,664 | ) | (980 | ) | (2,636 | ) | 952 | ||||||||||
Cash flow from financing activities: | |||||||||||||||||
| Dividends paid | (449 | ) | (449 | ) | - | - | |||||||||||
| Common stock issued, including treasury shares reissued | 511 | 511 | - | - | |||||||||||||
Treasury shares purchased | (1,039 | ) | (1,039 | ) | - | - | |||||||||||
Net intercompany borrowings | - | 11 | 315 | (326 | )6 | ||||||||||||
Proceeds from long-term debt issued | 4,358 | 129 | 4,229 | - | |||||||||||||
Payments on long-term debt | (3,324 | ) | (64 | ) | (3,260 | ) | - | ||||||||||
Short-term borrowings - net | 1,085 | 470 | 615 | - | |||||||||||||
Net cash provided by (used for) financing activities | 1,142 | (431 | ) | 1,899 | (326 | ) | |||||||||||
Effect of exchange rate changes on cash | 13 | 52 | (7 | ) | (32 | )7 | |||||||||||
Increase in cash and short-term investments | 522 | 484 | 38 | - | |||||||||||||
Cash and short-term investments at beginning of period | 445 | 270 | 175 | - | |||||||||||||
Cash and short-term investments at end of period | $ | 967 | $ | 754 | $ | 213 | $ | - | |||||||||
1 Represents Caterpillar Inc. and its subsidiaries with Financial Products accounted for on the equity basis. | |||||||||||||||||
2 Elimination of Financial Products profit after tax due to equity method of accounting. | |||||||||||||||||
3 Non-cash adjustment for the undistributed earnings from Financial Products. | |||||||||||||||||
4 Elimination of non-cash adjustments and changes in assets and liabilities related to consolidated reporting. | |||||||||||||||||
5 Reclassification of Cat Financial’s cash flow activity from investing to operating for receivables that arose from the sale of inventory. | |||||||||||||||||
6 Net proceeds and payments to/from Machinery and Engines and Financial Products. | |||||||||||||||||
7 Elimination of the effect of exchange on intercompany balances. | |||||||||||||||||
Page 26
Caterpillar Inc. Supplemental Data for Cash Flow For The Nine Months Ended September 30, 2004 (Unaudited) (Millions of dollars) | ||||||||||||||||||
Supplemental Consolidating Data | ||||||||||||||||||
Consolidated | Machinery and Engines1 | Financial Products | Consolidating Adjustments | |||||||||||||||
Cash flow from operating activities: | ||||||||||||||||||
Profit | $ | 1,484 | $ | 1,484 | $ | 258 | $ | (258 | )2 | |||||||||
| Adjustments for non-cash items: | ||||||||||||||||||
Depreciation and amortization | 1,055 | 612 | 443 | - | ||||||||||||||
Undistributed profit of Financial Products | - | (258 | ) | - | 258 | 3 | ||||||||||||
Other | (83 | ) | (103 | ) | (80 | ) | 100 | 4 | ||||||||||
| Changes in assets and liabilities: | ||||||||||||||||||
Receivables - trade and other | (7,110 | ) | (284 | ) | 89 | (6,915 | )4/5 | |||||||||||
Inventories | (1,225 | ) | (1,225 | ) | - | - | ||||||||||||
Accounts payable and accrued expenses | 728 | 570 | (33 | ) | 191 | 4 | ||||||||||||
Other - net | 74 | (38 | ) | 119 | (7 | )4 | ||||||||||||
Net cash provided by (used for) operating activities | (5,077 | ) | 758 | 796 | (6,631 | ) | ||||||||||||
Cash flow from investing activities: | ||||||||||||||||||
Capital expenditures - excluding equipment leased to others | (519 | ) | (460 | ) | (59 | ) | - | |||||||||||
Expenditures for equipment leased to others | (827 | ) | (2 | ) | (825 | ) | - | |||||||||||
Proceeds from disposals of property, plant and equip. | 378 | 19 | 359 | - | ||||||||||||||
Additions to finance receivables | (6,423 | ) | - | (12,728 | ) | 6,305 | 5 | |||||||||||
Collections of finance receivables | 4,617 | - | 10,313 | (5,696 | )5 | |||||||||||||
Proceeds from the sale of finance receivables | 647 | - | 1,311 | (664 | )5 | |||||||||||||
Additions to retained interests in securitized trade receivables | - | - | (6,686 | ) | 6,686 | 6 | ||||||||||||
Collections of retained interests in securitized trade receivables | 5,722 | - | 5,722 | - | ||||||||||||||
Net intercompany borrowings | - | 203 | 30 | (233 | )7 | |||||||||||||
| Investments and acquisitions (net of cash acquired) | (284 | ) | (284 | ) | - | - | ||||||||||||
Other - net | (40 | ) | (94 | ) | 54 | - | ||||||||||||
Net cash provided by (used for) investing activities | 3,271 | (618 | ) | (2,509 | ) | 6,398 | ||||||||||||
Cash flow from financing activities: | ||||||||||||||||||
| Dividends paid | (395 | ) | (395 | ) | - | - | ||||||||||||
| Common stock issued, including treasury shares reissued | 137 | 137 | - | - | ||||||||||||||
Treasury shares purchased | (400 | ) | (400 | ) | - | - | ||||||||||||
Net intercompany borrowings | - | (30 | ) | (203 | ) | 233 | 7 | |||||||||||
Proceeds from long-term debt issued | 4,532 | 263 | 4,269 | - | ||||||||||||||
Payments on long-term debt | (2,615 | ) | (28 | ) | (2,587 | ) | - | |||||||||||
Short-term borrowings - net | 563 | 264 | 299 | - | ||||||||||||||
Net cash provided by (used for) financing activities | 1,822 | (189 | ) | 1,778 | 233 | |||||||||||||
Effect of exchange rate changes on cash | 59 | 70 | (11 | ) | - | |||||||||||||
Increase in cash and short-term investments | 75 | 21 | 54 | - | ||||||||||||||
Cash and short-term investments at beginning of period | 342 | 220 | 122 | - | ||||||||||||||
Cash and short-term investments at end of period | $ | 417 | $ | 241 | $ | 176 | $ | - | ||||||||||
1 Represents Caterpillar Inc. and its subsidiaries with Financial Products accounted for on the equity basis. | ||||||||||||||||||
2 Elimination of Financial Products profit after tax due to equity method of accounting. | ||||||||||||||||||
3 Non-cash adjustment for the undistributed earnings from Financial Products. | ||||||||||||||||||
4 Elimination of non-cash adjustments and changes in assets and liabilities related to consolidated reporting. Receivables amounts include adjustment for consolidated non-cash receipt of retained interests in securitized trade receivables. | ||||||||||||||||||
5 Reclassification of Cat Financial’s cash flow activity from investing to operating for receivables that arose from the sale of inventory. | ||||||||||||||||||
6 Elimination of Cat Financial’s additions to retained interests in securitized trade receivables that arose from an intercompany purchase of receivables. | ||||||||||||||||||
7 Net proceeds and payments to/from Machinery and Engines and Financial Products. | ||||||||||||||||||
| Certain amounts have been reclassified to conform to the 2005 financial statement presentation. | ||||||||||||||||||
Page 27
Safe Harbor Statement under the Securities Litigation Reform Act of 1995
Certain statements contained in our third-quarter 2005 results release and prepared statements from the related results webcast are forward-looking and involve uncertainties that could significantly impact results. The words "believes," "expects," "estimates," "anticipates," "will be," "should" and similar words or expressions identify forward-looking statements made on behalf of Caterpillar. Uncertainties include factors that affect international businesses, as well as matters specific to the company and the markets it serves.
World Economic Factors
Our projection for about 3.5 percent growth in the world economy in 2005 assumes central banks will cautiously raise interest rates so as not to slow growth too much. Low interest rates, and continued good economic growth, should encourage further growth in construction and mining. Should central banks raise interest rates aggressively, both the world economic recovery and our Machinery and Engines sales likely would be weaker.
We expect the U.S. economy to grow about 3.5 percent in 2005, which up to now has not created an inflation problem. While the Federal Reserve has raised interest rates, we assume the continuation of moderate growth and low inflation will result in interest rates of 4 percent or slightly higher by the end of 2005. Long-term interest rates are expected to rise less than short-term rates. That environment should support further growth in construction and manufacturing, helping to keep commodity prices favorable. Should financial conditions tighten noticeably, causing economic growth to slow below 3 percent, expected improvements in Machinery and Engines sales likely would be lower than projected.
Our projection of increased sales of Machinery and Engines in Europe, Africa, Middle East (EAME) in 2005 assumes that low interest rates will allow slightly faster economic growth in Europe and that favorable commodity prices will extend healthy recoveries in both Africa and Middle East (AME) and the CIS. Key risks are a significant slowing in the European economy or a collapse in commodity prices. Those developments would likely negatively impact our results.
Favorable commodity prices, increased capital inflows and an improved foreign debt situation are expected to contribute to about 4 percent growth in Latin America in 2005. As a result, we project that both mining production and construction spending will increase, supporting an increase in Machinery and Engines sales. This forecast is vulnerable to a significant weakening in commodity prices, slowing in world economic growth, widespread increases in interest rates or political disruptions.
In Asia/Pacific, we project sales growth in 2005 will be concentrated in Australia and India. Critical assumptions are continued growth in coal demand, low domestic interest rates in most countries, further gains in exports and continued good economic growth in China. Some developments that could lower expected results include reduced demand for thermal and coking coal, significant revaluations of regional currencies, restrictions on regional exports and sharp interest rate hikes, particularly in China and Indonesia.
In 2006, we assume that interest rates will increase moderately and world economic growth will be about 3.5 percent or the same as in 2005. Should interest rates increase more rapidly such that economic growth slows, sales of Machinery and Engines could be less than anticipated. High interest rates and slower economic growth could cause housing construction to decline and worsen government budgets, thereby causing reductions in infrastructure spending. Slower economic growth could also weaken energy and metals demand, driving prices low enough to undermine new investments.
Commodity Prices
Commodities represent a significant sales opportunity, with prices and production as key drivers. Prices have improved sharply over the past three years and our outlook assumes continued growth in world industrial production will cause metals prices to remain high enough in both 2005 and 2006 to encourage further mine investment. Any unexpected weakening in world industrial production or construction, however, could cause prices to drop sharply to the detriment of our results.
Coal prices improved and our sales have benefited. We expect favorable conditions to continue in the future. Should coal prices soften, due to a slowing in world economic growth or otherwise, the ongoing sales recovery would be vulnerable.
Page 28
Oil and natural gas prices increased sharply over the past three years due to strong demand and high capacity usage. Higher energy prices have not halted economic recoveries since strong demand boosted prices and world production increased. High prices are encouraging more exploration and development. However, should significant supply cuts occur, such as from OPEC production cuts or political unrest in a major producing country, the resulting oil shortages and price spikes could slow economies, potentially with a depressing impact on our sales.
Monetary and Fiscal Policies
For most companies operating in a global economy, monetary and fiscal policies implemented in the United States and abroad could have a significant impact on economic growth, and accordingly, demand for our product. In general, higher than expected interest rates, reductions in government spending, higher taxes, excessive currency movements, and uncertainty over key policies are some factors likely to lead to slower economic growth and lower industry demand.
With economic data looking more favorable, central banks in several developed countries have raised interest rates from the lowest rates in decades, with the U. S. Federal Reserve Bank being the most aggressive. Our outlook assumes that central banks will try to avoid increasing rates so much that economic recoveries stall. Should central banks raise interest rates more aggressively than anticipated, both economic growth and our sales could suffer.
Budget deficits in many countries remain higher than governments would like. Our outlook assumes that governments will not aggressively raise taxes and slash spending to deal with their budget imbalances. Such actions could disrupt growth and negatively affect our sales.
Political Factors
Political factors in the United States and abroad can impact global companies. Our outlook assumes that no major disruptive changes in economic policies occur in either the United States or other major economies. Significant changes in either taxing or spending policies could reduce activities in sectors important to our businesses, thereby reducing sales.
Our outlook assumes that there will be no additional significant military conflicts in either North Korea or the Middle East in the forecast period. Such military conflicts could severely disrupt sales into countries affected, as well as nearby countries.
Our outlook also assumes that there will be no major terrorist attacks. If there is a major terrorist attack, confidence could be undermined, potentially causing a sharp drop in economic activities and our sales. Attacks in major developed economies would be the most disruptive.
Our outlook assumes that efforts by countries to increase their exports will not result in retaliatory countermeasures by other countries to block such exports, particularly in the Asia/Pacific region. Our outlook includes a negative impact from the phase-out of the Extraterritorial Income Exclusion (ETI) as enacted by the American Jobs Creation Act of 2004 (the Act). Our outlook assumes any other tax law changes will not negatively impact our provision for income taxes.
Currency Fluctuations
The company has costs and revenues in many currencies and is therefore exposed to risks arising from currency fluctuations. Our outlook assumes no significant changes in currency values from current rates. Should currency rates change sharply, economic activity and our results could be negatively impacted.
The company's largest manufacturing presence is in the United States, so any unexpected strengthening of the dollar tends to raise the foreign currency costs to our end users and reduce our global competitiveness.
Dealer Practices
The company sells primarily through an independent dealer network. Dealers carry inventories of both new and rental equipment and adjust those inventories based on their assessments of future needs. Such adjustments can impact our results either positively or negatively. The current outlook assumes dealers will increase inventories in line with higher deliveries. Should dealers control inventories more tightly, our sales would be lower.
Page 29
Financial Products Division Factors
Inherent in the operation of Cat Financial is the credit risk associated with its customers. The creditworthiness of each customer, and the rate of delinquencies, repossessions and net losses on customer obligations are directly impacted by several factors, including, but not limited to, relevant industry and economic conditions, the availability of capital, the experience and expertise of the customer's management team, commodity prices, political events, and the sustained value of the underlying collateral. Additionally, interest rate movements create a degree of risk to our operations by affecting the amount of our interest payments and the value of our fixed rate debt. Our "match funding" policy addresses interest rate risk by aligning the interest rate profile (fixed or floating rate) of our debt portfolio with the interest rate profile of our receivables portfolio (loans and leases with customers and dealers) within pre-determined ranges on an ongoing basis. To achieve our match funding objectives, we issue debt with a similar interest rate profile to our receivables and also use interest rate swap agreements to manage our interest rate risk exposure to interest rate changes and in some cases to lower our cost of borrowed funds. If interest rates move upward more sharply than anticipated, our financial results could be negatively impacted. With respect to our insurance and investment management operations, changes in the equity and bond markets could cause an impairment of the value of our investment portfolio, thus requiring a negative adjustment to earnings.
Other Factors
The rate of infrastructure spending, housing starts, commercial construction and mining plays a significant role in the company's results. Our products are an integral component of these activities and as these activities increase or decrease in the United States or abroad, demand for our products may be significantly impacted.
Projected cost savings or synergies from alliances with new partners could also be negatively impacted by a variety of factors. These factors could include, among other things, higher than expected wages, energy and/or material costs, and/or higher than expected financing costs due to unforeseen changes in tax, trade, environmental, labor, safety, payroll or pension policies in any of the jurisdictions in which the alliances conduct their operations.
Results may be impacted positively or negatively by changes in the sales mix. Our outlook assumes a certain geographic mix of sales as well as a product mix of sales. If actual results vary from this projected geographic and product mix of sales, our results could be negatively impacted.
The company operates in a highly competitive environment and our outlook depends on a forecast of the company's share of industry sales. An unexpected reduction in that share could result from pricing or product strategies pursued by competitors, unanticipated product or manufacturing difficulties, a failure to price the product competitively, or an unexpected buildup in competitors' new machine or dealer owned rental fleets, leading to severe downward pressure on machine rental rates and/or used equipment prices.
The environment remains competitive from a pricing standpoint. Our 2005 sales outlook assumes that the price increases announced in early 2005 hold in the marketplace. If needed, additional price discounting to maintain our competitive position could result in lower than anticipated price realization.
In general, our results are sensitive to changes in economic growth, particularly those originating in construction, mining and energy. Developments reducing such activities also tend to lower our sales. In addition to the factors mentioned above, our results could be negatively impacted by any of the following:
· Any sudden drop in consumer or business confidence;
· Delays in legislation needed to fund public construction;
· Regulatory or legislative changes that slow activity in key industries; and/or
· Unexpected collapses in stock markets.
This discussion of uncertainties is by no means exhaustive, but is designed to highlight important factors that may impact our outlook. Obvious factors such as general economic conditions throughout the world do not warrant further discussion, but are noted to further emphasize the myriad of contingencies that may cause the company's actual results to differ from those currently anticipated.
Page 30