0001828811 ifrs-full:GrossCarryingAmountMember 2022-04-30
As filed with the Securities and Exchange Commission on July 27, 2022
Registration
No. 333-259895
UNITED STATES
SECURITIES AND EXCHANGE COMMISSION
Washington, D.C. 20549
POST-EFFECTIVE AMENDMENT NO. 2
to
FORM
F-1
REGISTRATION STATEMENT
UNDER
THE SECURITIES ACT OF 1933
Li-Cycle Holdings Corp.
(Exact Name of Registrant as specified in its charter)
Ontario | 4955 | Not Applicable | ||
(State or other jurisdiction of incorporation or organization) | (Primary Standard Industrial Classification Code Number) | (I.R.S. Employer Identification Number ) |
Li-Cycle
Holdings Corp.207 Queen’s Quay West,
Suite 590, Toronto, ON, M5J 1A7
Canada
(877) 542-9253
(Address, including zip code, and telephone number, including area code, of Registrant’s principal executive offices)
Puglisi & Associates
850 Library Avenue, Suite 204
Newark, DE 19711
(302)
738-6680
(Name, address, including zip code, and telephone number, including area code, of agent for service)
Copies to:
Paul M. Tiger Andrea M. Basham Freshfields Bruckhaus Deringer US LLP 601 Lexington Avenue New York, NY 10022 (212) 277-4000 | Jonathan Grant Fraser Bourne McCarthy Tétrault LLP 66 Wellington Street West, Suite 5300, TD Bank Tower Box 48 Toronto, Ontario M5K 1E6 Tel: (416) 362-1812 |
Approximate date of commencement of proposed sale to the public:
As soon as practicable after this registration statement becomes effective.
If any of the securities being registered on this Form are to be offered on a delayed or continuous basis pursuant to Rule 415 under the Securities Act of 1933, check the following box. ☒
If this Form is filed to register additional securities for an offering pursuant to Rule 462(b) under the Securities Act, check the following box and list the Securities Act registration statement number of the earlier effective registration statement for the same offering. ☐
If this Form is a post-effective amendment filed pursuant to Rule 462(c) under the Securities Act, check the following box and list the Securities Act registration statement number of the earlier effective registration statement for the same offering. ☐
If this Form is a post-effective amendment filed pursuant to Rule 462(d) under the Securities Act, check the following box and list the Securities Act registration number of the earlier effective registration statement for the same offering. ☐
Indicate by check mark whether the registrant is an emerging growth company as defined in Rule 405 of the Securities Act of 1933.
Emerging growth company ☒
If an emerging growth company that prepares its financial statements in accordance with U.S. GAAP, indicate by check mark if the registrant has elected not to use the extended transition period for complying with any new or revised financial accounting standards† provided pursuant to Section 7(a)(2)(B) of the Securities Act. ☐
† The term “new or revised financial accounting standard” refers to any update issued by the Financial Accounting Standards Board to its Accounting Standards Codification after April 5, 2012.
The Registrant hereby amends this registration statement on such date or dates as may be necessary to delay its effective date until the Registrant shall file a further amendment which specifically states that this registration statement shall thereafter become effective in accordance with Section 8(a) of the Securities Act of 1933, as amended, or until the registration statement shall become effective on such date as the Securities and Exchange Commission, acting pursuant to said Section 8(a), may determine.
EXPLANATORY NOTE
This Post-Effective Amendment No. 2 relates to the Registration Statement on Form
F-1
(File No. 333-259895)
ofLi-Cycle
Holdings Corp. (the “Registrant”) originally declared effective by the Securities and Exchange Commission (the “SEC”) on October 5, 2021 (the “Initial Registration Statement”).The Registrant is filing this Post-Effective Amendment No. 2 pursuant to the undertakings in the Initial Registration Statement to update and supplement the information contained in the Initial Registration Statement to, among other things, include the Registrant’s consolidated financial statements and the notes thereto as of and for the
six-month
period ended April 30, 2022.The Registration Statement, as amended by this Post-Effective Amendment No. 2, relates solely to the registration of the offer and sale from time to time by the selling shareholders named in this prospectus or their permitted transferees of up to 84,351,553 common shares of the Registrant. No additional securities are being registered pursuant to this Post-Effective Amendment No. 2. All applicable registration fees were paid in connection with the initial filing of the Initial Registration Statement.
The information in this prospectus is not complete and may be changed. Neither we nor the selling shareholders may sell these securities until the registration statement filed with the Securities and Exchange Commission is effective. This prospectus is not an offer to sell these securities and is not soliciting an offer to buy these securities in any jurisdiction where the offer or sale is not permitted.
Subject to Completion, dated July 27, 2022
PRELIMINARY PROSPECTUS
Li-Cycle
Holdings Corp.
Secondary Offering of
84,351,553 Common Shares
This prospectus relates to the offer and sale from time to time by the selling shareholders named in this prospectus or their permitted transferees (collectively, the “selling shareholders”) of up to 84,351,553 common shares, without par value, (the “common shares”) of
Li-Cycle
Holdings Corp., an Ontario corporation (“we” or the “Company”). This prospectus covers any additional securities that may become issuable by reason of share splits, share dividends, and other events described therein.The common shares covered by this prospectus that may be offered and sold by the selling shareholders include (i) 60,654,565 common shares issued to certain former shareholders and optionholders of
Li-Cycle
Corp., an Ontario corporation(“Li-Cycle”),
at the closing of the business combination by and among the Company,Li-Cycle,
and Peridot Acquisition Corp., an Ontario corporation (“Peridot”), on August 10, 2021, as a result of which the Company became a new public company (the “Business Combination”), (ii) 7,500,000 common shares issued to Peridot Class B Holders (as defined herein) in connection with the Business Combination, (iii) 1,796,531 common shares issued following the exercise of private placement warrants (the “private placement warrants”) held by Peridot Acquisition Sponsor, LLC, a Delaware limited liability company (the “Sponsor”) and (iv) 14,400,457 common shares issued to certain institutions and accredited investors in the PIPE Financing (as defined herein).We are registering the offer and sale of these common shares to satisfy certain registration rights that we have granted. The selling shareholders may offer all or part of the common shares covered by this prospectus for resale from time to time through public or private transactions, at either prevailing market prices or at privately negotiated prices. These common shares are being registered to permit the selling shareholders to sell common shares from time to time, in amounts, at prices and on terms determined at the time of offering. The selling shareholders may sell these common shares through an underwritten offering, ordinary brokerage transactions, directly to market makers of our common shares or through any other means described in the section titled “” herein. In connection with any sales of common shares offered hereunder, the selling shareholders, any underwriters, agents, brokers or dealers participating in such sales may be deemed to be “underwriters” within the meaning of the Securities Act of 1933, as amended (the “Securities Act”). If our common shares are sold through underwriters or broker-dealers, the selling shareholders will be responsible for underwriting discounts or commissions or agent’s commissions.
Plan of Distribution
All of the common shares offered by the selling shareholders pursuant to this prospectus will be sold by the selling shareholders for their respective accounts. We will not receive any of the proceeds from these sales.
We will pay certain expenses associated with the registration of the common shares covered by this prospectus, as described in the section titled “.”
Plan of Distribution
Our common shares are currently listed on The New York Stock Exchange under the symbol “LICY”. On July 26, 2022, the last reported sale price of our common shares as reported on The New York Stock Exchange was $6.15 per common share.
We may amend or supplement this prospectus from time to time by filing amendments or supplements. You should read this entire prospectus and any amendments or supplements carefully before you make your investment decision.
We are currently an “emerging growth company” as that term is defined in the Jumpstart Our Business Startups Act of 2012 and, as such, are subject to reduced public company reporting requirements. We are also a “foreign private issuer” and will report under the Securities Exchange Act of 1934, as amended (the “Exchange Act”), as a
non-U.S.
company with foreign private issuer status. Even after we no longer qualify as an emerging growth company, as long as we qualify as a foreign private issuer under the Exchange Act, we will be exempt from certain provisions of the Exchange Act that are applicable to U.S. domestic public companies.Our principal executive offices are located at 207 Queen’s Quay West, Suite 590, Toronto, ON, M5J 1A7, Canada.
Investing in our common shares involves a high degree of risk. Before buying any common shares, you should carefully read the discussion of material risks of investing in our common shares in the section titled “Risk Factors” beginning on page 15 of this prospectus.
Neither the Securities and Exchange Commission nor any state securities commission has approved or disapproved of these common shares or passed on the adequacy or accuracy of this prospectus. Any representation to the contrary is a criminal offense.
Prospectus dated , 2022
TABLE OF CONTENTS
| 1 | ||||
| 15 | ||||
| 37 | ||||
| 38 | ||||
| 38 | ||||
| 39 | ||||
| 40 | ||||
| 43 | ||||
| 57 | ||||
| 86 | ||||
| 93 | ||||
| 107 | ||||
| 113 | ||||
| 118 | ||||
| 122 | ||||
| 125 | ||||
| 133 | ||||
| 137 | ||||
| 139 | ||||
| 144 | ||||
| 148 | ||||
| 149 | ||||
| 149 | ||||
| 150 | ||||
| 151 | ||||
| F-1 |
i
You should rely only on the information contained in this prospectus, any amendment or supplement to this prospectus or any free writing prospectus prepared by us or on our behalf. Neither we, nor the selling shareholders, have authorized any other person to provide you with different or additional information. Neither we, nor the selling shareholders, take responsibility for, nor can we provide assurance as to the reliability of, any other information that others may provide. The selling shareholders are not making an offer to sell these securities in any jurisdiction where the offer or sale is not permitted. The information contained in this prospectus is accurate only as of the date of this prospectus or such other date stated in this prospectus, and our business, financial condition, results of operations and/or prospects may have changed since those dates.
Except as otherwise set forth in this prospectus, neither we nor the selling shareholders have taken any action to permit a public offering of these securities outside the United States or to permit the possession or distribution of this prospectus outside the United States. Persons outside the United States who come into possession of this prospectus must inform themselves about and observe any restrictions relating to the offering of these securities and the distribution of this prospectus outside the United States.
BASIS OF PRESENTATION
Our fiscal year consists of twelve months ending October 31. Accordingly, references herein to “2019 fiscal year” relate to the twelve months ended October 31, 2019, references herein to “2020 fiscal year” relate to the twelve months ended October 31, 2020, references herein to “2021 fiscal year” relate to the twelve months ended October 31, 2021 and references herein to “2022 fiscal year” relate to the twelve months ending October 31, 2022. Our fiscal quarters consist of the three months ending on January 31, April 30, July 31 and October 31. References to any given year in this prospectus will be to a calendar year, and not a fiscal year, unless otherwise noted.
IMPORTANT INFORMATION ABOUT IFRS
Our financial statements are prepared in accordance with International Financial Reporting Standards as issued by the International Accounting Standards Board and referred to in this prospectus as “IFRS.”
INDUSTRY AND MARKET DATA
In this prospectus, we rely on and refer to industry data, information and statistics regarding the markets in which we compete from research as well as from publicly available information, industry and general publications and research and studies conducted by third parties. We have supplemented this information where necessary with our own internal estimates, considering publicly available information about other industry participants and our management’s best view as to information that is not publicly available. This information appears in “,” “” and other sections of this prospectus. We have taken such care as we consider reasonable in the extraction and reproduction of information from such data from third party sources.
Management’s Discussion and Analysis of Financial Condition and Results of Operations
Business
Industry publications, research, studies and forecasts generally state that the information they contain has been obtained from sources believed to be reliable, but that the accuracy and completeness of such information is not guaranteed. Forecasts and other forward-looking information obtained from these sources are subject to the same qualifications and uncertainties as the other forward-looking statements in this prospectus. These forecasts and forward-looking information are subject to uncertainty and risk due to a variety of factors, including those described under the section titled “Risk Factors.” These and other factors could cause results to differ materially from those expressed in the forecasts or estimates from independent third parties and us.
ii
FREQUENTLY USED TERMS
As used in this prospectus, unless the context otherwise requires or indicates otherwise, references to “we,” “us,” “our,”
“Li-Cycle”
or the “Company” refer toLi-Cycle
Holdings Corp., an Ontario corporation, and its consolidated subsidiaries.In this document:
“2021 Convertible Notes” means the KSP Note together with any PIK Notes issued in satisfaction of interest due and payable thereon.
“Alabama Spoke” means
Li-Cycle’s
Spoke near Tuscaloosa, Alabama that is currently under development and construction.“Amalgamation” means the amalgamation of Peridot Ontario and NewCo in accordance with the terms of the Arrangement.
“Arizona Spoke” means
Li-Cycle’s
operational Spoke in Gilbert, Arizona, which opened on May 17, 2022.“Arrangement” means the plan of arrangement (including the Business Combination) in substantially the form attached as Annex C to the proxy statement/prospectus forming a part of the registration statement on
Form F-4,
filed by the Company with the SEC on July 6, 2021.“Business Combination” means the transactions contemplated by the Business Combination Agreement.
“Business Combination Agreement” means the Business Combination Agreement, dated as of February 15, 2021, as amended, by and among Peridot,
Li-Cycle
and NewCo.“Closing Date” means the closing date of the Business Combination.
“common shares” means the common shares of the Company, without par value.
“Continuance” means the continuance of Peridot from the Cayman Islands under the Companies Act to the Province of Ontario, Canada as a corporation existing under the OBCA.
“EV” means electric vehicles.
“Germany Spoke” means
Li-Cycle’s
planned Spoke in Germany that is currently under development.“Glencore” means Glencore Ltd.
“Glencore Convertible Note” means the unsecured convertible note due May 31, 2027 issued to Glencore Ltd. pursuant to the Glencore Note Purchase Agreement on May 31, 2022.
“Glencore Note Purchase Agreement” means the note purchase agreement, dated as of May 5, 2022, between the Company and Glencore Ltd.
“Hub” means a centralized facility for large-scale production of specialty materials that achieves economies of scale in recycling. Our first commercial Hub will be located in Rochester, New York and is currently in the project execution phase.
iii
“Incentive Plan” means the Company’s 2021 Incentive Award Plan.
“Investor Agreement” means the Investor and Registration Rights Agreement, dated as of August 10, 2021, by and among the Company, the Peridot Class B Holders and the
Li-Cycle
Holders.“KSP Note” means the unsecured convertible note due September 29, 2026 originally issued to Spring Creek Capital, LLC pursuant to the KSP Note Purchase Agreement on September 29, 2021 and assigned on May 1, 2022, to Wood River Capital, LLC, as amended from time to time.
“KSP Note Purchase Agreement” means the Note Purchase Agreement, dated as of September��29, 2021, between the Company and Spring Creek Capital, LLC, and assigned on May 1, 2022, to Wood River Capital, LLC.
“LGC” means LG Chem, Ltd.
“LGES” means LG Energy Solution, Ltd.
“Li-Cycle
Holders” means the prior shareholders ofLi-Cycle
that entered into theLi-Cycle
Transaction Support Agreements in connection with the Business Combination.“Li-Cycle
Shares” means the issued and outstanding common shares ofLi-Cycle
prior to the Business Combination.“Li-Cycle
Transaction Support Agreements” means the Transaction Support Agreements, each dated as of February 15, 2021, among Peridot and theLi-Cycle
Holders, entered into in connection with the Business Combination Agreement.“NewCo” means
Li-Cycle
Holdings Corp. prior to the Amalgamation.“New York Spoke” means
Li-Cycle’s
operational Spoke in Rochester, New York.“Norway Spoke” means
Li-Cycle’s
planned Spoke in Norway that is currently under development.“NYSE” means the New York Stock Exchange.
“OBCA” means the Ontario Business Corporations Act.
“OEM” means an original equipment manufacturer.
“Ohio Spoke” means
Li-Cycle’s
planned, co-located Spoke with Ultium near Warren, Ohio that is currently under development.“Ontario Spoke” means
Li-Cycle’s
operational Spoke in Kingston, Ontario.“Peridot” means, before the Continuance, Peridot Acquisition Corp., a Cayman Islands exempt company and, after the Continuance, Peridot Ontario.
“Peridot Class B Holders” means the holders of Peridot Class B Shares immediately prior to the Business Combination.
“Peridot Class B Shares” means the Class B common shares of Peridot.
“Peridot Ontario” means Peridot as continued under the OBCA following the Continuance.
iv
“PIK Notes” means the additional unsecured convertible notes that may be issued by Li-Cycle from time to time in satisfaction of the interest due and payable on the 2021 Convertible Notes.
“PIPE Financing” means the issuance and sale to the PIPE Investors, following the Amalgamation and prior to the closing date of the Business Combination, of an aggregate of 31,549,000 common shares for a purchase price of $10.00 per share, for aggregate gross proceeds of $315,490,000.
“PIPE Investors” means those certain investors, including an affiliate of Peridot’s Sponsor, who entered into Subscription Agreements to purchase common shares in the PIPE Financing.
“private placement warrants” means 8,000,000 warrants to purchase common shares that were issued to the Sponsor in exchange for outstanding warrants of Peridot in connection with the Business Combination, which were exercised or surrendered for common shares of the Company or redeemed on January 26, 2022 pursuant to the notice of redemption dated December 27, 2021.
“Product Recovery Percentage” means (a) the quantity of a given constituent in the feed
lithium-ion
battery materials (e.g., lithium, nickel, cobalt, other constituents) that is returned from the process and is available for sale after the process has taken place, divided by (b) input quantity of the given constituent, measured as a percentage.“public warrants” means 15,000,000 warrants to purchase common shares that were issued in exchange for outstanding warrants of Peridot that were issued in Peridot’s initial public offering, which were exercised or surrendered for common shares of the Company or redeemed on January 26, 2022 pursuant to the notice of redemption dated December 27, 2021.
“Recycling Efficiency Rate” means (a) the mass of recycled materials exiting the recycling process and returned to the economy, divided by (b) the mass of materials entering the recycling process, measured as a percentage.
“Rochester Hub” means
Li-Cycle’s
first commercial-scale Hub, that is currently under construction in Rochester, New York.“SEC” means the U.S. Securities and Exchange Commission.
“Securities Act” means the Securities Act of 1933, as amended.
“Spoke” means a decentralized facility that mechanically processes batteries close to sources of supply and handles the preliminary processing ofbatteries and battery scrap.
end-of-life
“Spoke Capital Projects” means the Spoke facilities presently under development and construction by
Li-Cycle.
“Sponsor” means Peridot Acquisition Sponsor, LLC, a Delaware limited liability company.
“Subscription Agreements” means the subscription agreements entered into with the PIPE Investors, in connection with the PIPE Financing.
“Traxys” means Traxys North America LLC.
“Ultium” means Ultium Cells LLC.
v
“Warrant Redemption” means the redemption of all our outstanding warrants on January 26, 2022 as described in the notice of redemption dated December 27, 2021.
“warrants” means the public warrants and the private placement warrants.
References to “dollar,” “USD,” “US$” and “$” are to U.S. dollars and references to “CA$” and “Cdn. $” are to Canadian dollars.
TRADEMARKS, SERVICE MARKS AND TRADE NAMES
This prospectus includes certain trademarks, service marks and trade names that we own or otherwise have the right to use, such as
“Li-Cycle”
and “Spoke & Hub Technologies” which are protected under applicable intellectual property laws and are our property. This prospectus also contains additional trademarks, tradenames, and service marks belonging to other companies, which are the property of their respective owners. Solely for convenience, our trademarks, service marks and trade names referred to in this prospectus may appear without the®
or™
symbol, but such references are not intended to indicate, in any way, that we will not assert, to the fullest extent under applicable law, our rights to these trademarks, service marks and trade names. We do not intend our use or display of other parties’ trademarks, tradenames, or service marks to imply, and such use or display should not be construed to imply, a relationship with, or endorsement or sponsorship of us by, these other parties.vi
PROSPECTUS SUMMARY
This summary highlights selected information contained elsewhere in this prospectus. This summary does not contain all of the information you should consider before investing in our securities. Before making an investment decision, you should read this entire prospectus carefully, especially the section titled “Risk Factors” and the financial statements and related notes thereto. Some of the statements in this prospectus constitute forward-looking statements that involve significant risks and uncertainties. See “Forward-Looking Statements” for more information.
Our Company
Li-Cycle
is an industry leader inlithium-ion
battery resource recovery and the leadinglithium-ion
battery recycler in North America. When we refer to ourselves as the leadinglithium-ion
battery recycler in North America, we are referring to our status based on installed permitted capacity forlithium-ion
battery recycling measured in tonnes per year. Our proprietary “Spoke & Hub” recycling and resource recovery process is designed (a) at our Spokes, to process battery manufacturing scrap andend-of-life
Li-Cycle
was founded in 2016 by our chief executive officer, Ajay Kochhar, and executive chair, Tim Johnston, with the mission of solving the global disposal problem forend-of-life
lithium-ion
batteries and battery manufacturing scrap while simultaneously creating a secondary source of critical battery materials. By providing an “urban mining” solution,Li-Cycle
seeks to offer an alternative to raw materials sourced through traditional global mining practices.We pioneered what we believe to be an innovative and scalable metallurgical processing method with our Spoke & Hub Technologies. We expect to make a valuable contribution to the EV industry and the world’s transition to a circular economy by offering an environmentally friendly recycling solution to energy-intensive pyrometallurgical processing methods. We believe our production costs are on average lower than the mining and processing costs otherwise incurred by suppliers to produce these materials because we are able to produce multiple materials from a single process and because our process yields minimal waste and no displaced earth or tailings, as compared to traditional mining processes. Bymanufacturing phases in both an environmentally and what we believe to be an economically sustainable manner.
re-inserting
critical materials back into thelithium-ion
battery supply chain, we are able to effectively close the loop between the beginning andend-of-life
Lithium-ion
batteries are increasingly powering products and solutions in a range of industries, including consumer electronics and EVs. Our sources of recycling feed are derived primarily from three key sources: 1) battery manufacturing scrap; 2)end-of-life
lithium-ion
batteries; and 3) damaged, defective, or recalledlithium-ion
batteries.1
An overview of the industries in which
lithium-ion
batteries are utilized is set forth below:
Source: Expert Interviews, Secondary Research, and BIS Research Analysis
Our Strategy
Our goal is to be a leading global recycler of
lithium-ion
batteries and battery scrap and producer of key battery grade materials.Li-Cycle
has developed atwo-phased
strategy, positioned to grow in lockstep with the electrification supply chain. In the first phase,Li-Cycle
plans to expand its network in line with the manufacturing oflithium-ion
batteries, by utilizing the resulting manufacturing scrap or yield loss as a key base-load of supply forLi-Cycle’s
facilities. In the second phase,Li-Cycle
plans to leverage its global network established predominantly on the basis of manufacturing scrap to position itself as the leader for the processing ofend-of-life
lithium-ion
batteries. We are executing on our plan to construct a network of Spokes located at regionally optimized locations that reduce safety risk and costs associated with battery transport to our Spokes. We are also executing on our plan to construct centralized, large-scale Hubs to maximize economies of scale and efficiencies, with our first commercial Hub being under construction in Rochester New York. Our Hub facilities will process an intermediate product (black mass) from our Spokes, as this is significantly easier and safer to transport than batteries.We are evaluating additional global opportunities to scale our operations with a range of potential partners and expansion opportunities that may include acquisitions, joint ventures or other commercial arrangements in North America, Europe and Asia Pacific. We seek to partner with multiple customers in each geography in connection with supply and
off-take
arrangements. Near tomid-term,
our growth strategy is to focus on North America and Europe, aligning with leading global customer demand needs. During this period, we also expect to assess the potential for investments in the Asia Pacific region.Our Competitive Strengths
Customer-Centric Solutions Provider
We provide sustainable and customer-centric solutions for each of our customers’ battery recycling needs. We provide the support necessary along each step of the process to ensure that our customers’ battery recycling experience is handled in a manner that is safe, professional, and economically viable. In particular,
| • | we work closely with a reliable network of logistics partners to support customers in transporting their batteries to our facilities; |
2
| • | we offer our customers a home for the secure destruction of materials containing IP-sensitive design information, such as research and development batteries and battery materials. We have adopted procedures to protect the privacy and confidentiality of our customers’ trade secrets; and |
| • | in addition to providing advice on packaging and support with procurement, we provide spare battery storage, manage comprehensive battery replacement campaigns and customize programs and services to individual customers’ needs. |
Proprietary and Innovative Technology
We have established proprietary technology that we believe sets us apart from competitors because our technology has the ability to respond to changes in battery chemistries and adapt to change in inputs to the battery recycling process. Our process produces the fundamental building blocks ofrecycling produce
lithium-ion
batteries — cathode precursor input chemicals, cathode input chemicals and raw materials that can be reused in batteries or the broader economy. By contrast, competitive emerging technologies such ascathode-to-cathode
end-products
that have a higher risk of obsolescence due to continuous cathode technology advancement.Leading Environmental Footprint
Due to our high recovery rates and sustainable, environmentally-friendly processes, we believe we are well-positioned to comply with heightened regulations applicable to us across the globe.
Unlike conventional pyrometallurgy processes, our hydrometallurgical process is designed for “best in class” environmental performance, with minimal solid waste streams to landfill, zero wastewater discharge, and relatively low air emissions. This has been a competitive advantage in terms of conforming to the requirements for municipal, state, and federal permitting processes associated with the development of our Spokes and Hub, as well as meeting our customers’ mandates for quality and sustainability.
In 2021,
Li-Cycle
received the 2021 Big Innovation Award presented by Business Intelligence Group, and it was named to the World Circular Economy Forum’s list of Circular Economy Solutions Inspiring the World. In addition, for three years in a row (2020, 2021 and 2022),Li-Cycle
was named as a Global Cleantech 100 Company by the Cleantech Group and was also a finalist in the 10th Annual Business Green Leaders Awards.Minimal Human Operating Risk
Unlike smelting, thermalprocesses, our processes have minimal human operating risk. Our Spokes can safely process
pre-treatment
refining, orcathode-to-cathode
lithium-ion
batteries at any state of charge, without any manual sorting, discharging, or dismantling required. In addition, our Spokes reduce the size of battery mass through an automated process, minimizing human operating risk.Superior Recycling Recovery Rates and More Economical Supplier
Ourbatteries and reduces waste.
wet-chemistry
method is able to extract valuable battery-grade materials from black mass that are directlyre-usable
in the manufacturing of new battery technologies. In the short term, this increases the value that we derive from battery manufacturing scrap as well asend-of-life
We expect our production costs on average to be lower than the mining and processing costs otherwise incurred by suppliers to produce these battery-grade materials because we are able to produce multiple materials from a single process that yields minimal waste and no displaced earth or tailings, as compared to traditional mining processes.
3
Investment by and Strategic Partnerships with Key Global Players
We believe that the investment by and strategic partnerships we have established with leading global players in the
lithium-ion
battery materials space, as described below, represent a strong validation of our business model:Glencore
On May 5, 2022, the Company announced the entry into a global feedstock supply agreement with Glencore Ltd. (“Glencore”) pursuant to which Glencore will supply manufacturing scrap and” for more information about the Glencore Convertible Note.
end-of-life
lithium-ion
batteries to the Company on a global basis. The Company also announced the entry into a note purchase agreement with Glencore (the “Glencore Note Purchase Agreement”) pursuant to which the Company issued to Glencore on May 31, 2022, an unsecured convertible note in the aggregate principal amount of $200,000,000, in a transaction exempt from registration under the Securities Act of 1933, as amended (the “Glencore Convertible Note”). See “— Recent Developments — Strategic Partnership with Glencore — Glencore Convertible Note
On May 31, 2022,
Li-Cycle
entered into certain long-term commercial agreements with Glencore (the “Commercial Agreements”). Subject to existing commitments of the Company and other exceptions (including materials required for the Company’s operations), under the terms of the Commercial Agreements, Glencore will source and supplylithium-ion
battery manufacturing scrap and otherlithium-ion
battery materials to the Company for use at the Company’s Spokes; Glencore will source and supply black mass to the Company for use at the Company’s Hubs; Glencore will purchase, for its internal consumption oron-sale
to third party end customers, black mass, battery-grade end products and certainby-products
produced at the Company’s Spokes and Hubs; and Glencore will supply sulfuric acid for use at the Company’s Hubs. Pursuant to the Commercial Agreements, Glencore will earn (i) sourcing fees on all feed flowing into the Company’s Spokes; (ii) sourcing fees on all third-party black mass flowing into the Company’s Hubs; (iii) marketing fees on all black mass flowing out of the Company’s Spokes and not flowing into the Company’s Hubs; and (iv) marketing fees on all end products flowing out of the Company’s Hubs or any third party processing sites that the Company may utilize. The term of the Amended and Restated Global Feed Sourcing Agreement commenced on May 4, 2022 and the term of the other Commercial Agreements will commence on August 1, 2022.LG Chem (“LGC”) and LG Energy Solution (“LGES”)
In December 2021,
Li-Cycle,
LGC and LGES announced their intention to enter into a manufacturing scrap supply and nickel sulphateoff-take
agreement, pursuant to anon-binding
letter of intent. On April 20, 2022, a subsidiary of the Company entered into a scrap offer agreement with LGES pursuant to which the Company will have the opportunity to recycle nickel-bearinglithium-ion
battery manufacturing scrap and otherlithium-ion
battery material from LGES’s North American manufacturing sites. In addition, on April 20, 2022, a subsidiary of the Company entered into nickel sulphate offtake agreements with each of LGES and LGC pursuant to which the Company will allocate for sale, through itsend-product
offtake partner, Traxys, a combined initial allocation of 20,000 tonnes of nickel contained in nickel sulphate produced at the Company’s Hub facility currently under construction in Rochester, New York, to LGC and LGES over 10 years. These agreements will enable a closed-loop ecosystem for LGC and LGES for key materials in the lithium battery supply chain.On December 13, 2021,
Li-Cycle
entered into subscription agreements with each of LGES and LGC, each of which were subsequently amended and restated on March 11, 2022 and April 21, 2022 (the “LG Subscription Agreements” and each, an “LG Subscription Agreement”), pursuant to which each of LGES and LGC agreed, subject to the satisfaction of certain conditions, to subscribe for an equal number of the Company’s common shares in transactions exempt from registration under the Securities Act (the “LG Subscription”). The LG Subscription was completed on May 11, 2022 and consisted of the issuance by the Company in accordance with the LG Subscription Agreements of (i) an initial tranche of 4,416,960 common shares, in the aggregate, at a price of $10.00 per share, for an aggregate initial tranche subscription price of approximately $44.2 million, and (ii) a4
second tranche of 883,392 common shares, in the aggregate, at a price of $6.60 per share (based on the volume-weighted average trading price of the Company’s common shares for the 5 trading days ending immediately prior to April 29, 2022), for an aggregate second tranche subscription price of approximately $5.8 million, for a total investment of $50.0 million. See “” and “” for more information about the equity investment and related standstill agreement.
Description of Securities
—
Registration Rights — LG Subscription Agreements
Description of
Securities — Registration Rights — LG Standstill Agreement
Koch Strategic Platforms (“KSP”)
KSP, a subsidiary of Koch Investments Group, through its affiliate, Wood River Capital, LLC, has invested $100 million in” for more information about the 2021 Convertible Notes and related KSP Standstill Agreement. We believe this strategic investment by KSP will provide
Li-Cycle
pursuant to a convertible note to support the Company’s growth opportunities in North America, Europe and Asia Pacific. See “Management’s Discussion and Analysis of Financial Condition and Results of Operations — Liquidity and Capital Resources — Debt Obligations
Li-Cycle
with access to key industry expertise and commercial opportunities across the broader Koch Industries ecosystem.Well Positioned for Governmental “Green” Financing Partnerships
With the emergence of government initiatives to accelerate the development of the circular economy and EV adoption, significant programs are underway to support the development of domestic critical material supply in the North American market. With our first mover technology and environmental advantages, we believe we are well positioned to explore various green financing opportunities from government or financial institutions supporting cleantech infrastructure in North America.
Li-Cycle
has also historically built strong relationships with various government agencies.Recent Developments
Inclusion of
Li-Cycle
to Russell 2000 Index®
As part of the 2022 Russell indexes annual reconstitution, the Company was added to the
small-cap
Russell 2000®
Index and the broad-market Russell 3000®
Index, in each case effective on June 27, 2022.Strategic Partnership with Glencore
Commercial Agreements with Glencore
On June 1, 2022, the Company announced the entry into commercial agreements (collectively, the “Commercial Agreements”) with Glencore, including the Master Commercial Agreement, the Amended & Restated Global Feed Sourcing Agreement, the Black Mass Sourcing Agreement, the Sulfuric Acid Supply Agreement, the Black Mass Offtake Agreement, the End Products Offtake Agreement and the
By-Products
Offtake Agreement.Subject to existing commitments of the Company and other exceptions (including materials required for the Company’s operations), under the terms of the Commercial Agreements, Glencore will source and supply
lithium-ion
battery manufacturing scrap and otherlithium-ion
battery materials to the Company for use at the Company’s Spokes; Glencore will source and supply black mass to the Company for use at the Company’s Hubs; Glencore will supply sulfuric acid for use at the Company’s Hubs; and Glencore will purchase, for its internal consumption or on-sale to third party end customers, black mass, battery-grade end products and certainby-products
produced at the Company’s Spokes and Hubs. Pursuant to the Commercial Agreements, Glencore will earn (i) sourcing fees on all feed flowing into the Company’s Spokes; (ii) sourcing fees on all third party black mass flowing into the Company’s Hubs; (iii) marketing fees on all black mass flowing out of the Company’s Spokes and not flowing into the Company’s Hubs; and (iv) end products marketing fees on all end products flowing out of the Company’s Hubs or any third party processing sites that the Company may utilize.5
The term of the Amended and Restated Global Feed Sourcing Agreement commenced on May 4, 2022, and the term of the other Commercial Agreements will commence on August 1, 2022. The term of each Commercial Agreement will, unless earlier terminated in accordance with the termination provisions of the Master Commercial Agreement, continue until the later to occur of (i) ten years from the date on which the Company’s next Hub (after the completion of the North America Hub under construction in Rochester, New York) achieves a specified level of commercial production, and (ii) the date by which such Hub has processed a minimum quantity of black mass. The term of the Commercial Agreements will automatically renew on an evergreen basis for subsequent terms of five years after the expiry of the initial term, subject to the Company’s right to terminate all (but not less than all) of the Commercial Agreements upon 365 days’ prior notice to Glencore and payment of a termination fee based upon five times the aggregate value of the sourcing and marketing fees and certain other amounts invoiced in the preceding twelve months.
Glencore Convertible Note
On May 31, 2022, pursuant to the Glencore Note Purchase Agreement, the Company issued to Glencore an unsecured convertible note (the “Glencore Convertible Note”) in the aggregate principal amount of $200,000,000, in a transaction exempt from registration under the Securities Act.
The Glencore Convertible Note matures five years from the date of issuance and interest on the Glencore Convertible Note is payable on a semi-annual basis, either in cash or by(“PIK”), at the Company’s option, beginning on May 31, 2022. The Glencore Convertible Note accrues interest from the date of issuance at the forward-looking term rate based on the secured overnight financing rate (“SOFR”) for a tenor comparable to the relevant interest payment period plus 0.42826% (the “Floating Rate”) plus five percent (5%) per annum if interest is paid in cash and plus six percent (6%) per annum if interest is paid in PIK. The Floating Rate has a floor of 1% and a cap of 2%. The obligations of the Company to make any payment on account of the principal of and interest on the Glencore Convertible Note are subordinate and junior in right of payment and upon liquidation to the Company’s obligations to the holders of all current and future senior indebtedness of the Company.
payment-in-kind
The principal and accrued interest owing under the Glencore Convertible Note may be converted at any time by the holder into the Company’s common shares, at a per share price equal to $9.95 (the “Conversion Price”), subject to adjustments. If Glencore elects to convert the entire aggregate principal amount of the Glencore Convertible Note using the initial Conversion Price, it will hold an approximate 10% equity stake in the Company (based on the current number of outstanding Common Shares and not factoring in any accumulated PIK interest).
The Company may redeem the Glencore Convertible Note at any time by payment of an amount in cash equal to 100% of the principal amount of the Glencore Convertible Note and all accrued interest owing under the Glencore Convertible Note. In connection with any optional redemption and provided that the holder of the Glencore Convertible Note has not elected to convert the Glencore Convertible Note into common shares following receipt of notice of such optional redemption, the Company shall issue warrants (the “Glencore Warrants”) to the holder of the Glencore Convertible Note on the optional redemption date that entitle the holder to acquire, until the maturity date of the Glencore Convertible Note, a number of common shares equal to the principal amount of the Glencore Convertible Note being redeemed divided by the then applicable Conversion Price. The initial exercise price of the Glencore Warrants will be equal to the Conversion Price as of the optional redemption date.
The Glencore Convertible Note is subject to certain events of default, the occurrence of which would give the holder the right to require the Company to redeem the Glencore Convertible Note by payment of an amount in cash equal to the outstanding principal amount of the Glencore Convertible Note and all accrued interest owing under the Glencore Convertible Note, plus a make-whole amount equal to the undiscounted interest payments that would have otherwise been payable through maturity (the “Make-Whole Amount”). In addition, the occurrence of certain bankruptcy-related events of default renders the outstanding principal amount of the
6
Glencore Convertible Note, all accrued interest owing thereunder and the Make-Whole Amount immediately due and payable.
Upon a change of control transaction, the Company will be required to redeem the Glencore Convertible Note by payment of an amount in cash equal to the outstanding principal amount of the Glencore Convertible Note and all accrued interest owing under the Glencore Convertible Note, plus the Make-Whole Amount.
Glencore has agreed to certain transfer restrictions with respect to the common shares issued or issuable upon conversion of the Glencore Convertible Note, including that Glencore will not transfer such common shares other than to permitted transferees until May 5, 2024.
Subject to certain exceptions, limitations, and applicable law, Glencore will, pursuant to the Note Purchase Agreement, be entitled to nominate one individual to the Board of Directors of the Company following the issuance of the Glencore Convertible Note.
Appointment of Glencore Nominee to Board of Directors
Pursuant to the Glencore Note Purchase Agreement, Kunal Sinha, Glencore’s Head of Recycling, has been appointed to the Company’s Board of Directors.
Glencore Registration Rights Agreement
Concurrently with the issuance of the Glencore Convertible Note, the Company entered into a registration rights agreement with Glencore (the “Glencore Registration Rights Agreement”). The Glencore Registration Rights Agreement provides that upon request of the holder of the Glencore Convertible Note, the Company will file with the SEC within 45 days after notice of such request, a resale registration statement covering the resale of the common shares issuable upon conversion of the Glencore Convertible Note and upon exercise of the Glencore Warrants and held by such holder. The Company is required to use commercially reasonable efforts to have such registration statement declared effective by the SEC as soon as practicable and no later than the earlier of (A) 45 days after the filing of such registration statement (or 75 days after the filing of such registration statement if the SEC notifies the Company that it will review the registration statement) or (B) 15 business days after the SEC notifies the Company in writing that it will not review the registration statement. The Company agreed to keep the registration statement (or another shelf registration statement covering the common shares issued or issuable upon conversion of the Glencore Convertible Note and upon exercise of the Glencore Warrants) effective until three years after the holder’s receipt of the common shares issued upon conversion of the Glencore Convertible Note or upon exercise of the Glencore Warrants, as applicable.
In addition, subject to certain requirements and customary conditions, including with regard to the number of demand rights that may be exercised, the holder of the Glencore Convertible Note may demand at any time or from time to time, that the Company file a registration statement on Form
F-3
(or on FormF-1
if FormF-3
is not available) to register the common shares issuable upon conversion of the Glencore Convertible Note and upon exercise of the Glencore Warrants and held by such holder. In addition, the holder of the Glencore Convertible Note may specify that such demand registration take the form of an underwritten offering, subject to limitations on the number of demands and underwritten offerings that can be requested by the holder, as specified in the Glencore Registration Rights Agreement. The holder of the Glencore Convertible Note will also have “piggy-back” registration rights, subject to certain requirements and customary conditions.The Glencore Registration Rights Agreement also provides that the Company will pay certain expenses relating to such registrations and indemnify the holder of the Glencore Convertible Note against (or make contributions in respect of) certain liabilities that may arise under the Securities Act.
7
Amended and Restated Standstill Agreement
On May 31, 2022, the Company, Glencore and Glencore plc (the “Glencore Parent”) entered into an amended and restated standstill agreement (the “Glencore Standstill Agreement”), which restricts Glencore, the Glencore Parent and their affiliates from taking certain actions until the five years from the date of the Glencore Standstill Agreement (the “Glencore Standstill Period”).
The actions that Glencore, the Glencore Parent and their affiliates are restricted from taking during the Glencore Standstill Period include, among others, (A) the acquisition of additional voting securities or of any debt, material assets or material businesses of the Company, provided that Glencore and the Glencore Parent may acquire voting securities of the Company so long as the aggregate beneficial ownership of such securities does not exceed 5.0% of the then-outstanding voting securities of the Company, (B) any tender or exchange offer, merger, business combination and certain other transactions involving the Company and its securities, (C) any solicitation of proxies or votes or other attempt to influence votes by any holder of the Company’s securities and (D) formation of a “group” (as defined under the Securities Exchange Act of 1934) with respect to the Company’s securities.
Commencement of Operations of Arizona Spoke
On May 17, 2022,”.
Li-Cycle
announced the commencement of operations at the Arizona Spoke, which has a recycling capacity of 10,000 tonnes per year. See “Management’s Discussion and Analysis of Financial Condition and Results of Operations—Spoke Capital Projects
Completion of LG Subscription
The LG Subscription was completed on May 11, 2022 and consisted of the issuance by the Company in accordance with the LG Subscription Agreements of (i) an initial tranche of 4,416,960 common shares, in the aggregate, at a price of $10.00 per share, for an aggregate initial tranche subscription price of approximately $44.2 million, and (ii) a second tranche of 883,392 common shares, in the aggregate, at a price of $6.60 per share (based on the volume-weighted average trading price of the Company’s common shares for the 5 trading days ending immediately prior to April 29, 2022), for an aggregate second tranche subscription price of approximately $5.8 million, for a total investment of $50.0 million. See “” and “” for more information about the equity investment and related standstill agreement.
Description of Securities
—
Registration Rights — LG Subscription Agreements
Description of Securities — Registration Rights — LG Standstill Agreement
Current Situation with Respect to
COVID-19
The ongoing
COVID-19
pandemic has resulted in significant supply chain disruptions globally and continues to affectLi-Cycle’s
business.Li-Cycle’s
operations have been impacted by theCOVID-19
pandemic.Li-Cycle’s
operations have been considered an essential service in both Canada and the United States and, as a result,Li-Cycle’s
plants have continued operations during theCOVID-19
pandemic, albeit with the implementation of appropriate measures to ensure employee safety.Li-Cycle’s
operations were however impacted by theCOVID-19
pandemic in the form of operational slow-downs and interruptions caused by employee absences and mandatory quarantines resulting from actual or suspected exposure toCOVID-19.
The company has, at times, experienced slow-downs and interruptions in its battery supply chain.Li-Cycle
shut down its corporate headquarters in March 2020 and enforced a work-from-home mandate.Li-Cycle
re-opened
its corporate office facilities in November 2021. A second temporary closure ofLi-Cycle’s
corporate headquarters occurred in January 2022 related to the Omicron variant and the office subsequentlyre-opened
in February 2022.8
Li-Cycle
cannot currently predict the duration of the impact of theCOVID-19
pandemic on its operations. Continuing effects of theCOVID-19
pandemic, including the emergence of new strains such as the Omicron or Delta variant may cause governments to impose new restrictive measures, result in employee absences from work or result in negative economic effects, which in each case could have a material adverse impact onLi-Cycle’s
operations, development and construction activities and financial condition. See “Risk Factors — Risks Relating to
Li-Cycle’s
Business — Unfavorable economic conditions, such as consequences of the globalCOVID-19
pandemic and disruptions in the global supply chain, may have a material adverse effect onLi-Cycle’s
business, results of operations and financial conditionEmerging Growth Company and Foreign Private Issuer Status
We are currently an “emerging growth company” as defined in the Jumpstart Our Business Startups Act of 2012 (the “JOBS Act”). As an emerging growth company, we may take advantage of certain exemptions from specified disclosure and other requirements that are otherwise generally applicable to public companies. These exemptions include:
| • | not being required to comply with the auditor attestation requirements for the assessment of our internal control over financial reporting provided by Section 404 of the Sarbanes-Oxley Act of 2002; |
| • | reduced disclosure obligations regarding executive compensation; and |
| • | not being required to hold a nonbinding advisory vote on executive compensation or seek shareholder approval of any golden parachute payments not previously approved. |
We may take advantage of these provisions for up to five years or such earlier time that we are no longer an emerging growth company. We would cease to be an emerging growth company upon the earliest to occur of (i) the last day of the fiscal year in which we have more than $1.07 billion in annual revenue; (ii) the date we qualify as a “large accelerated filer,” with at least $700 million of equity securities held by
non-affiliates;
(iii) the issuance, in any three-year period, by our Company of more than $1.0 billion innon-convertible
debt securities; or (iv) the last day of the fiscal year ending after the fifth anniversary of the date of the first sale of common equity securities pursuant to an effective registration statement. We will no longer qualify as an “emerging growth company” on October 31, 2022. Consequently, the Company will be required to comply with the auditor attestation requirements for the assessment of its internal control over financial reporting provided by Section 404 of the Sarbanes-Oxley Act of 2002, which would be included in the Company’s Annual Report on Form 20-F covering the fiscal year ended October 31, 2022.We are also considered a “foreign private issuer” and will report under the Securities Exchange Act of 1934, as amended (the “Exchange Act”), as a
non-U.S.
company with foreign private issuer status. This means that, even after we no longer qualify as an emerging growth company, as long as we qualify as a foreign private issuer under the Exchange Act, we will be exempt from certain provisions of the Exchange Act that are applicable to U.S. domestic public companies, including:| • | the sections of the Exchange Act regulating the solicitation of proxies, consents or authorizations in respect of a security registered under the Exchange Act; |
| • | the sections of the Exchange Act requiring insiders to file public reports of their stock ownership and trading activities and liability for insiders who profit from trades made in a short period of time; and |
| • | the rules under the Exchange Act requiring the filing with the Securities and Exchange Commission (the “SEC”) of quarterly reports on Form 10-Q containing unaudited financial and other specified information, or current reports on Form8-K, upon the occurrence of specified significant events. |
We may take advantage of these exemptions until such time as we are no longer a foreign private issuer. We would cease to be a foreign private issuer at such time as more than 50% of our outstanding voting securities are
9
held by U.S. residents and any of the following three circumstances applies: (i) the majority of our executive officers or directors are U.S. citizens or residents, (ii) more than 50% of our assets are located in the United States or (iii) our business is administered principally in the United States.
We may choose to take advantage of some but not all of these reduced burdens. We have taken advantage of reduced reporting requirements in this prospectus. Accordingly, the information contained herein may be different from the information you receive from our competitors that are public companies, or other public companies in which you have made an investment.
Summary of Risk Factors
Investing in our securities entails a high degree of risk as more fully described in the “” section of this prospectus beginning on page 15. You should carefully consider such risks before deciding to invest in our securities. These risks include but are not limited to the following:
Risk Factors
Risks Relating to
Li-Cycle’s
Business| • | Li-Cycle’s success will depend on its ability to economically and efficiently source, recover and recyclelithium-ion batteries andlithium-ion battery manufacturing scrap, as well as third-party black mass, and to meet the market demand for an environmentally sound, closed-loop solution for manufacturing waste andend-of-life lithium-ion batteries. |
| • | Li-Cycle may not be able to successfully implement its global growth strategy, on a timely basis or at all, and may be unable to manage future global growth effectively. Expanding internationally involves risks that could delay our expansion plans and/or prohibit us from entering markets in certain jurisdictions, which could have a material adverse effect on results of operations. |
| • | The development of Li-Cycle’s Rochester Hub, Spoke Capital Projects and other future projects is subject to risks andLi-Cycle cannot guarantee that these projects will be completed in a timely manner, that costs will not be significantly higher than estimated, or that the completed projects will meet expectations with respect to productivity or the specifications of their end products, among others. |
| • | Li-Cycle may engage in strategic transactions that could disrupt its business, cause dilution to its shareholders, reduce its financial resources, result in the incurrence of debt or other liabilities, or prove not to be successful. |
| • | Failure to materially increase recycling capacity and efficiency could have a material adverse effect on Li-Cycle’s business, results of operations or financial condition.Li-Cycle is and will be dependent on its recycling facilities. If one or more of its current or future facilities become inoperative, capacity constrained or if operations are disrupted,Li-Cycle’s business, results of operations or financial condition could be materially adversely affected. |
| • | Li-Cycle may in the future need to raise additional funds to meet its capital requirements and such funds may not be available toLi-Cycle on commercially reasonable terms or at all, which could materially adversely affectLi-Cycle’s business, results of operations or financial condition. |
| • | Li-Cycle has a history of losses and expects to incur significant expenses for the foreseeable future, and there is no guarantee it will achieve or sustain profitability. |
| • | Problems with the handling of lithium-ion battery cells that result in less usage oflithium-ion batteries or affectLi-Cycle’s operations could materially affectLi-Cycle’s revenues and business. |
| • | Li-Cycle’s business is subject to operational risks that could disrupt our business, some of which may not be insured or fully covered by insurance. |
10
| • | Li-Cycle’s revenue depends on maintaining and increasing feedstock supply commitments as well as securing new customers andoff-take agreements. |
| • | A decline in the adoption rate of EVs, or a decline in the support by governments for “green” energy technologies, could materially harm Li-Cycle’s financial results and ability to grow its business. |
| • | Decreases in demand and fluctuations in benchmark prices for the metals contained in Li-Cycle’s products could significantly impactLi-Cycle’s costs, revenues and results of operations. In addition to commodity prices,Li-Cycle’s costs and revenues are primarily driven by the volume and composition oflithium-ion battery feedstock materials processed at its facilities (including manufacturing scrap, spent batteries and third-party purchased black mass) and changes in the volume or composition of feedstock processed could significantly impactLi-Cycle’s revenues and results of operations. |
| • | The development of an alternative chemical make-up oflithium-ion batteries or battery alternatives could adversely affectLi-Cycle’s revenues and results of operations. |
| • | Li-Cycle relies on a limited number of customers and the projected revenues for the Rochester Hub are derived significantly from a single customer. |
| • | Li-Cycle’s heavy reliance on the experience and expertise of its management may cause adverse impacts on it if a management member departs. |
| • | Li-Cycle relies on third-party consultants for its regulatory compliance andLi-Cycle could be adversely impacted if the consultants do not correctly informLi-Cycle of the legal changes. Further,Li-Cycle is subject to the risk of litigation or regulatory proceedings, which could impact its financial results. |
| • | Li-Cycle may not be able to complete its recycling processes as quickly as customers may require, which could cause it to lose supply contracts and could harm its reputation.Li-Cycle operates in an emerging, competitive industry and if it is unable to compete successfully its revenue and profitability will be adversely affected. |
11
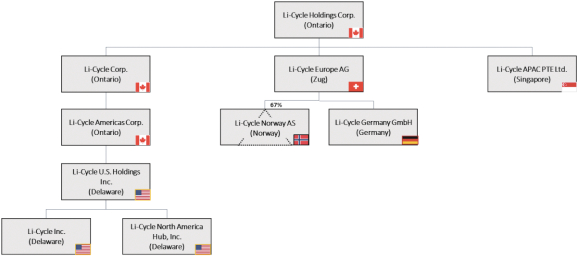
Corporate Structure
The following diagram depicts the organizational structure of the Company and its principal subsidiaries as of the date of this prospectus. All of the subsidiaries of the Company are directly or indirectly wholly-owned by the Company, except as otherwise indicated below.
Corporate Information
Li-Cycle
Holdings Corp. was incorporated on February 12, 2021 under the laws of Ontario as a corporation solely for the purpose of effectuating the Business Combination, which was consummated on August 10, 2021. It is governed by Articles of Amalgamation dated August 10, 2021.Our principal executive office is located 207 Queen’s Quay West, Suite 590, Toronto, ON, M5J 1A7, Canada and our phone number is (877)
542-9253.
Our agent for service of process in the United States is Puglisi & Associates located at 850 Library Avenue, Suite 204, Newark, DE 19711.Our principal website address is
http://www.li-cycle.com.
The information contained on our website does not form a part of, and is not incorporated by reference into, this prospectus.12
Summary Terms of the Offering
The summary below describes the principal terms of this offering. The “Description of Securities” section of this prospectus contains a more detailed description of our common shares.
Securities that may be offered and sold from time to time by the selling shareholders | Up to 84,351,553 common shares. |
Offering prices | The securities offered by this prospectus may be offered and sold at prevailing market prices, privately negotiated prices or such other prices as the selling shareholders may determine. See “ Plan of Distribution |
Common shares issued and outstanding | 175,383,580 common shares (as of July 22, 2022). |
Transfer restrictions on securities held by certain shareholders | Pursuant to the Investor and Registration Rights Agreement (the “Investor Agreement”), dated as of August 10, 2021, by and among the Company, the holders of Peridot Class B Shares prior to the Business Combination (the “Peridot Class B Holders”) and the prior shareholders of Li-Cycle that entered into theLi-Cycle Transaction Support Agreements (as defined herein) in connection with the Business Combination (the“Li-Cycle Holders”), the Peridot Class B Holders will be subject to certain transfer restrictions until the earliest of (a) one year after the closing of the Business Combination (August 10, 2022) and (b) (x) if the closing price of our common shares equals or exceeds $12.00 per share (as adjusted for share subdivisions, share capitalizations, reorganizations, recapitalizations and the like) for any 20 trading days within any30-trading day period commencing at least 150 days after the closing of the Business Combination (January 7, 2022), or (y) the date on which the we complete a liquidation, merger, share exchange or other similar transaction that results in all of our public shareholders having the right to exchange their common shares for cash, securities or other property. |
Dividend policy | We have not paid any cash dividends on our common shares to date and do not intend to pay cash dividends for the foreseeable future. The payment of cash dividends in the future will be dependent upon our revenues and earnings, if any, capital requirements, any future debt agreements and general financial condition. The payment of any cash dividends will be within the discretion of our board of directors at such time. See “ Dividend Policy |
Use of proceeds | All of the common shares offered by the selling shareholders pursuant to this prospectus will be sold by the selling shareholders for their respective accounts. We will not receive any of the proceeds from these sales. See “ Use of Proceeds |
Market for our common shares | Our common shares are listed on The New York Stock Exchange under the symbol “LICY”. |
13
Risk factors | Investing in our securities involves substantial risks. See “ Risk Factors |
14
RISK FACTORS
An investment in our securities carries a significant degree of risk. You should carefully consider the following risks and other information in this prospectus, including our consolidated financial statements and related notes before you decide to purchase our securities. If any of the events described below occur, our business and financial results could be materially adversely affected. This could cause the trading price of our securities to decline, perhaps significantly, and you therefore may lose all or part of your investment. The risks set out below are not exhaustive and do not comprise all of the risks associated with an investment in the Company. Additional risks and uncertainties not currently known to us or which we currently deem immaterial may also have a material adverse effect on our business, financial condition and results of operations.
References in this section to “we,” “us” or
“Li-Cycle”
refer toLi-Cycle
Corp. and its subsidiaries prior to the consummation of the Business Combination and the Company and its subsidiaries subsequent to the Business Combination, unless the context otherwise requires or indicates otherwise.Summary of Risk Factors
The following summarizes some, but not all, of the risks provided below. Please carefully consider all of the information discussed in these “” for a more thorough description of these and other risks:
Risk Factors
Risks Relating to
Li-Cycle’s
Business| • | Li-Cycle’s success will depend on its ability to economically and efficiently source, recover and recyclelithium-ion batteries andlithium-ion battery manufacturing scrap, as well as third-party black mass, and to meet the market demand for an environmentally sound, closed-loop solution for manufacturing waste andend-of-life lithium-ion batteries. |
| • | Li-Cycle may not be able to successfully implement its global growth strategy, on a timely basis or at all, and may be unable to manage future global growth effectively. Expanding internationally involves risks that could delay our expansion plans and/or prohibit us from entering markets in certain jurisdictions, which could have a material adverse effect on results of operations. |
| • | The development of Li-Cycle’s Rochester Hub, Spoke Capital Projects and other future projects is subject to risks andLi-Cycle cannot guarantee that these projects will be completed in a timely manner, that costs will not be significantly higher than estimated, or that the completed projects will meet expectations with respect to productivity or the specifications of their end products, among others. |
| • | Li-Cycle may engage in strategic transactions that could disrupt its business, cause dilution to its shareholders, reduce its financial resources, result in the incurrence of debt or other liabilities, or prove not to be successful. |
| • | Failure to materially increase recycling capacity and efficiency could have a material adverse effect on Li-Cycle’s business, results of operations or financial condition.Li-Cycle is and will be dependent on its recycling facilities. If one or more of its current or future facilities become inoperative, capacity constrained or if operations are disrupted,Li-Cycle’s business, results of operations or financial condition could be materially adversely affected. |
| • | Li-Cycle may in the future need to raise additional funds to meet its capital requirements and such funds may not be available toLi-Cycle on commercially reasonable terms or at all, which could materially adversely affectLi-Cycle’s business, results of operations or financial condition. |
| • | Li-Cycle has a history of losses and expects to incur significant expenses for the foreseeable future, and there is no guarantee it will achieve or sustain profitability. |
| • | Problems with the handling of lithium-ion battery cells that result in less usage oflithium-ion batteries or affectLi-Cycle’s operations could materially affectLi-Cycle’s revenues and business. |
15
| • | Li-Cycle’s business is subject to operational risks that could disrupt our business, some of which may not be insured or fully covered by insurance. |
| • | Li-Cycle’s revenue depends on maintaining and increasing feedstock supply commitments as well as securing new customers andoff-take agreements. |
| • | A decline in the adoption rate of EVs, or a decline in the support by governments for “green” energy technologies, could materially harm Li-Cycle’s financial results and ability to grow its business. |
| • | Decreases in demand and fluctuations in benchmark prices for the metals contained in Li-Cycle’s products could significantly impactLi-Cycle’s costs, revenues and results of operations. In addition to commodity prices,Li-Cycle’s costs and revenues are primarily driven by the volume and composition oflithium-ion battery feedstock materials processed at its facilities (including manufacturing scrap, spent batteries and third-party purchased black mass) and changes in the volume or composition of feedstock processed could significantly impactLi-Cycle’s revenues and results of operations. |
| • | The development of an alternative chemical make-up oflithium-ion batteries or battery alternatives could adversely affectLi-Cycle’s revenues and results of operations. |
| • | Li-Cycle relies on a limited number of customers and the projected revenues for the Rochester Hub are derived significantly from a single customer. |
| • | Li-Cycle’s heavy reliance on the experience and expertise of its management may cause adverse impacts on it if a management member departs. |
| • | Li-Cycle relies on third-party consultants for its regulatory compliance andLi-Cycle could be adversely impacted if the consultants do not correctly informLi-Cycle of the legal changes. Further,Li-Cycle is subject to the risk of litigation or regulatory proceedings, which could impact its financial results. |
| • | Li-Cycle may not be able to complete its recycling processes as quickly as customers may require, which could cause it to lose supply contracts and could harm its reputation.Li-Cycle operates in an emerging, competitive industry and if it is unable to compete successfully its revenue and profitability will be adversely affected. |
| • | Increases in income tax rates, changes in income tax laws or disagreements with tax authorities could adversely affect Li-Cycle’s business, financial condition or results of operations. |
| • | Li-Cycle’s operating and financial results may vary significantly from period to period due to fluctuations in its operating costs and other factors. |
| • | Fluctuations in foreign currency exchange rates could result in declines in reported sales and net earnings. |
| • | Unfavorable economic conditions, including the consequences of the global COVID-19 pandemic and disruptions in the global supply chain, may have a material adverse effect onLi-Cycle’s business, results of operations and financial condition. |
| • | Natural disasters, unusually adverse weather, epidemic or pandemic outbreaks, cyber incidents, boycotts and geo-political events could materially adversely affectLi-Cycle’s business, results of operations or financial condition. |
| • | Failure to protect or enforce Li-Cycle’s intellectual property could adversely affect its business, andLi-Cycle may be subject to intellectual property rights claims by third parties, which could be costly to defend, could require us to pay significant damages and could limit the Company’s ability to use certain technologies. |
| • | Li-Cycle has identified material weaknesses in its internal control over financial reporting. If its remediation of such material weaknesses is not effective, or if it fails to develop and maintain a proper and effective internal control over financial reporting, its ability to produce timely and accurate financial statements or comply with applicable laws and regulations could be impaired. |
16
Risks Relating to this Offering and Ownership of Our Securities
| • | Our by-laws provide, subject to limited exceptions, that the Superior Court of Justice of the Province of Ontario and the appellate courts therefrom are the sole and exclusive forum for certain shareholder litigation matters, which could limit shareholders’ ability to obtain a favorable judicial forum for disputes. |
| • | Our common shares have only recently become publicly traded, and the market price of our common shares may be volatile. The trading price of our common shares could be subject to wide fluctuations. Sales of substantial amounts of our common shares after the expiration of applicable lock-up periods, or the perception that such sales will occur, could adversely affect the market price of our common shares. |
| • | NYSE may delist our common shares, which could limit investors’ ability to engage in transactions in our common shares and subject us to additional trading restrictions. Because Li-Cycle has historically operated as a private company, we have limited experience complying with public company obligations and fulfilling these obligations is expensive and time consuming and may divert management’s attention from theday-to-day |
| • | As a “foreign private issuer” under the rules and regulations of the SEC, we are permitted to, and will, file less or different information with the SEC than a company incorporated in the United States or otherwise subject to these rules, and will follow certain home country corporate governance practices in lieu of certain NYSE requirements applicable to U.S. issuers. |
| • | Failure to develop and maintain effective internal control over financial reporting could have a material adverse effect on our business, results of operations and stock price. |
| • | As an “emerging growth company,” the Company cannot be certain if reduced disclosure and governance requirements applicable to “emerging growth companies” will make its shares less attractive to investors. |
| • | We may issue additional shares or other equity securities without shareholder approval, which would dilute the ownership interests of existing shareholders and may depress the market price of our common shares. The issuance of our common shares in connection with the conversion of our outstanding convertible notes would cause substantial dilution, and could materially affect the trading price of our common shares. The Company becoming a PFIC could also have adverse consequences for U.S. Holders. We do not currently intend to pay dividends, which could affect your ability to achieve a return on your investment. |
| • | The Company’s ability to meet expectations and projections in any research or reports published by securities or industry analysts, or a lack of coverage by securities or industry analysts, could result in a depressed market price and limited liquidity for its shares. |
| • | The Company may be required to take write-downs or write-offs, restructuring and impairment or other charges that could have a significant negative effect on its financial condition, results of operations and share price, which could cause you to lose some or all of your investment. |
Risks Relating to
Li-Cycle’s
BusinessLi-Cycle’s
success will depend on its ability to economically and efficiently source, recover and recyclelithium-ion
batteries andlithium-ion
battery manufacturing scrap, as well as third-party black mass, and to meet the market demand for an environmentally sound, closed-loop solution for manufacturing waste andend-of-life
lithium-ion
batteries.Li-Cycle’s
future business depends in large part on its ability to economically and efficiently recycle and recoverlithium-ion
battery materials (includingend-of-life
17
mass), and to meet the market demand for an environmentally sound, closed-loop solution for manufacturing waste and
end-of-life
lithium-ion
batteries. Although it currently recycles and recovers using its Spoke facilities in Ontario and New York State and recently commenced operations at its Spoke facility in Arizona,Li-Cycle
will need to scale its recycling capacity in order to successfully implement its global growth strategy and plans to do so in the future by, among other things, successfully building and developing additional Spoke & Hub facilities, including its first commercial Hub facility in Rochester, New York (the “Rochester Hub”) and Spoke facilities near Tuscaloosa, Alabama (the “Alabama Spoke”) and in Warren, Ohio (the “Ohio Spoke”), and the Company’s recently announced two European Spokes, in Norway (the “Norway Spoke”) and Germany (the “Germany Spoke”).Although
Li-Cycle
has experience in recyclinglithium-ion
materials in its existing facilities, such operations are currently conducted on a limited scale, andLi-Cycle
has not yet developed or operated a Hub facility on a commercial scale to produce and sell end products.Li-Cycle
does not know whether it will be able to develop efficient, automated,low-cost
recycling capabilities and processes, or whether it will be able to secure reliable sources of supply, in each case that will enable it to meet the production standards, costs and volumes required to successfully recyclelithium-ion
batteries andlithium-ion
battery materials and meet its business objectives and customer needs. Even ifLi-Cycle
is successful in high-volume recycling in its current and future facilities, it does not know whether it will be able to do so in a manner that avoids significant delays and cost overruns, including as a result of factors beyond its control, such as problems with suppliers, or in time to meet the commercialization schedules of future recycling needs or to satisfy the requirements of its customers.Li-Cycle’s
ability to effectively reduce its cost structure over time is limited by the fixed nature of many of its planned expenses in the near-term, and its ability to reduce long-term expenses is constrained by its need to continue investment in its global growth strategy. Any failure to develop and scale such manufacturing processes and capabilities withinLi-Cycle’s
projected costs and timelines could have a material adverse effect on its business, results of operations or financial condition.Li-Cycle
may not be able to successfully implement its global growth strategy, on a timely basis or at all.Li-Cycle’s
future global growth, results of operations and financial condition depend upon its ability to successfully implement its growth strategy, which, in turn, is dependent upon a number of factors, some of which are beyondLi-Cycle’s
control, including its ability to:| • | Economically recycle and recover lithium-ion batteries andlithium-ion battery materials and meet customers’ business needs; |
| • | Effectively introduce methods for higher recovery rates of lithium-ion batteries and solutions to recycling; |
| • | Complete the construction of its future facilities, including the Rochester Hub, and the Spoke Capital Projects at a reasonable cost on a timely basis; |
| • | Invest and keep pace in technology, research and development efforts, and the expansion and defense of its intellectual property portfolio; |
| • | Secure and maintain required strategic supply arrangements; |
| • | Secure and maintain leases for future Spoke & Hub facilities at competitive rates and in favorable locations; |
| • | Apply for and obtain the permits necessary to operate Spoke & Hub facilities on a timely basis; |
| • | Effectively compete in the markets in which it operates; and |
| • | Attract and retain management or other employees who possess specialized knowledge and technical skills. |
There can be no assurance that
Li-Cycle
can successfully achieve any or all of the above initiatives in the manner or time period that it expects. Further, achieving these objectives will require investments that may result18
in both short-term and long-term costs without generating any current revenue and therefore may be dilutive to earnings.
Li-Cycle
cannot provide any assurance that it will realize, in full or in part, the anticipated benefits it expects to generate from its growth strategy. Failure to realize those benefits could have a material adverse effect onLi-Cycle’s
business, results of operations or financial condition.Li-Cycle
may be unable to manage future global growth effectively.Even if it can successfully implement its global growth strategy, any failure to manage its growth effectively could materially and adversely affect
Li-Cycle’s
business, results of operations and financial condition.Li-Cycle
intends to expand its operations globally, which will require it to hire and train new employees across all divisions; accurately forecast supply and demand, production and revenue; control expenses and investments in anticipation of expanded operations; establish new or expand current design, production, and sales and service facilities; and implement and enhance administrative infrastructure, systems and processes. Future growth may also be tied to acquisitions, andLi-Cycle
cannot guarantee that it will be able to effectively acquire other businesses or integrate businesses that it acquires. Failure to efficiently manage any of the above could have a material adverse effect onLi-Cycle’s
business, results of operations or financial condition.The development of
Li-Cycle’s
Rochester Hub, Spoke Capital Projects and other future projects is subject to risks, including with respect to engineering, permitting, procurement, construction, commissioning andramp-up,
andLi-Cycle
cannot guarantee that these projects will be completed in a timely manner, that its costs will not be significantly higher than estimated, or that the completed projects will meet expectations with respect to their productivity or the specifications of their end products, among others.Li-Cycle’s
Rochester Hub, Spoke Capital Projects and other future projects are subject to development risks, including with respect to engineering, permitting, procurement, construction, commissioning andramp-up.
Because of the uncertainties inherent in estimating construction and labor costs, including as a result of unfavorable market conditions, and the potential for the scope of a project to change, it is relatively difficult to evaluate accurately the total funds that will be required to complete the Rochester Hub, Spoke Capital Projects or other future projects. Further,Li-Cycle’s
estimates of the amount of time it will take to complete the Rochester Hub, Spoke Capital Projects or other future projects are based on assumptions about the timing of engineering studies, permitting, procurement, construction, commissioning andramp-up,
all of which can vary significantly from the time an estimate is made to the time of completion.Li-Cycle
cannot guarantee that the costs of the Rochester Hub, Spoke Capital Projects or other future projects will not be higher than estimated, or that it will have sufficient capital to cover any increased costs, or that it will be able to complete the Rochester Hub, Spoke Capital Projects or other future projects within expected timeframes. Any such cost increases or delays could negatively affectLi-Cycle’s
results of operations and ability to continue to grow, particularly if the Rochester Hub, Spoke Capital Projects or any other future project cannot be completed. Further, there can be no assurance that the Rochester Hub or the Spoke Capital Projects will perform at the expected production rates or unit costs, or that the end products will meet the intended specifications.Failure to materially increase recycling capacity and efficiency could have a material adverse effect on
Li-Cycle’s
business, results of operations or financial condition.Although
Li-Cycle’s
existing facilities in Ontario, New York State and Arizona currently have total processing capacity of 20,000 tonnes oflithium-ion
batteries andlithium-ion
battery materials per year, the future success ofLi-Cycle’s
business depends in part on its ability to significantly increase recycling capacity and efficiency as part of the incremental/additional facilities.Li-Cycle
may be unable to expand its business, satisfy demand from its current and new customers, maintain its competitive position and achieve profitability if it is unable to build and operate any future facilities and otherwise allow for increases in scrapping output and speed. The construction of future global facilities will require significant cash investments and management resources and may not meetLi-Cycle’s
expectations with respect to increasing capacity, efficiency and satisfying additional demand. For example, if there are delays in any future planned Hub, such as its current development19
and construction of the Rochester Hub, construction of the Spoke Capital Projects and/or the future construction of other Spoke & Hub facilities, or if its facilities do not meet expected performance standards or are not able to produce materials that meet the quality standards
Li-Cycle
expects,Li-Cycle
may not meet its target for adding capacity, which would limit its ability to increase sales and result in lower than expected sales and higher than expected costs and expenses. Failure to drastically increase recycling and processing capacity or otherwise satisfy customers’ demands may result in a loss of market share to competitors, damageLi-Cycle’s
relationships with its key customers, a loss of business opportunities or otherwise materially adversely affect its business, results of operations or financial condition.Li-Cycle
may engage in strategic transactions, including acquisitions, that could disrupt its business, cause dilution to its shareholders, reduce its financial resources, result in the incurrence of debt, or prove not to be successful.From time to time,responsibilities, increase
Li-Cycle
may enter into transactions to acquire other businesses or technologies, to enter into joint ventures or to develop additional commercial relationships and its ability to do so successfully cannot be ensured. On January 26, 2022,Li-Cycle
entered into a joint venture agreement with ECO STOR AS (“ECO STOR”) and Morrow Batteries AS (“Morrow”) to formLi-Cycle
Norway AS through which it will construct the Norway Spoke. In January 2022, we announced that we would be developing a co-located Spoke with a strategic industry partner in Warren, Ohio, to enhance our ability to serve their recycling needs. In addition to these ventures,Li-Cycle
is currently considering certain other joint ventures, strategic partnerships and acquisitions to support its growth strategy, including but not limited to the development of new Spoke & Hub facilities, but it does not currently have any binding commitments for such transactions other than as described herein.Li-Cycle
will be dependent on its strategic partners with respect to the Norway Spoke, the Ohio Spoke and any other joint ventures. Conflicts or disagreements betweenLi-Cycle
and its strategic partners, or failure ofLi-Cycle’s
strategic partners to commit sufficient resources to a joint venture may, among other things, delay or prevent the successful development or operation of the Norway Spoke, the Ohio Spoke or other joint ventures, which could have a material adverse effect onLi-Cycle’s
business, financial condition, results of operations and prospects.Li-Cycle’s
acquisitions or other strategic transactions could include the payment of the purchase price in whole or in part usingLi-Cycle’s
common shares, which would have a dilutive impact on existing shareholders.Li-Cycle
may also decide to incur debt in connection with an acquisition or any other strategic transaction. Even ifLi-Cycle
identifies suitable opportunities for acquisitions, joint ventures or other strategic transactions,Li-Cycle
may not be able to make such transactions on favorable terms or at all. Any strategic transactionsLi-Cycle
makes may not strengthen its competitive position, and these transactions may be viewed negatively by customers, suppliers or investors.Li-Cycle
could incur losses resulting from undiscovered liabilities of an acquired business that we failed to or were unable to discover or were unable to quantify in the course of performing due diligence and that are not covered by any indemnificationLi-Cycle
may obtain from the seller. In addition,Li-Cycle
may not be able to successfully integrate the acquired personnel, technologies and operations into its existing business in an effective, timely andnon-disruptive
manner. Strategic transactions may also divert management attention fromday-to-day
Li-Cycle’s
expenses and reduceLi-Cycle’s
cash available for operations and other uses. In addition,Li-Cycle
may not be able to fully recover the costs of such acquisitions, joint ventures or other strategic transitions or be successful in leveraging any of them into increased business, revenue or profitability.Li-Cycle
also cannot predict the number, timing or size of any future transactions or the effect that any such transactions might have on its results of operations. Accordingly, although there can be no assurance thatLi-Cycle
will undertake or successfully complete any acquisitions, joint ventures or other strategic transactions, any transactions thatLi-Cycle
does complete may be subject to the foregoing or other risks and may have a material adverse effect onLi-Cycle’s
business, financial condition, results of operations and prospects.20
Expanding internationally involves risks that could delay our expansion plans and/or prohibit us from entering markets in certain jurisdictions, which could have a material adverse effect on our results of operations.
International operations, such as those we intend to establish, are subject to certain risks inherent in doing business abroad, including:
| • | political, civil and economic instability; |
| • | risks of war and other hostilities; |
| • | corruption risks; |
| • | trade, customs and tax risks; |
| • | currency exchange rates and currency controls; |
| • | limitations on the repatriation of funds; |
| • | insufficient infrastructure; |
| • | economic sanctions; |
| • | restrictions on exports, imports and foreign investment; |
| • | increases in working capital requirements related to long supply chains; |
| • | changes in labor laws and regimes and disagreements with the labor force; |
| • | difficulty in protecting intellectual property rights and complying with data privacy and protection laws and regulations; and |
| • | different and less established legal systems. |
Expanding our business in international markets, including the construction and operation of the Norway Spoke and Germany Spoke, is an important element of our strategy and, as a result, our exposure to the risks described above may be greater in the future. The likelihood of such occurrences and their potential effect on our business and results of operations will vary from country to country and are unpredictable, but could have an adverse effect on our ability to execute our strategy and accordingly on our business, results of operations or financial condition.
Li-Cycle
is and will be dependent on its recycling facilities. If one or more of its current or future facilities become inoperative, capacity constrained or if operations are disrupted,Li-Cycle’s
business, results of operations or financial condition could be materially adversely affected.Li-Cycle’s
revenue is and will be dependent on the continued operations of its Kingston, Ontario, Rochester, New York and Gilbert, Arizona Spoke facilities as well as its future facilities, including its planned Rochester Hub, Spoke Capital Projects and any other facilities it develops in the future. To the extent thatLi-Cycle
experiences any operational risk including, among other things, fire and explosions, severe weather and natural disasters (such as floods, hurricanes and earthquakes), failures in water supply, major power failures, equipment failures (including any failure of its information technology, air conditioning, and cooling and compressor systems), a cyber-attack or other incident, failures to comply with applicable regulations and standards, labor force and work stoppages, including those resulting from local or global pandemics or otherwise, or if its current or future facilities become capacity constrained,Li-Cycle
may be required to make capital expenditures even though it may not have sufficient available resources at such time. Additionally, there is no guarantee that the proceeds available fromLi-Cycle’s
insurance policies will be sufficient to cover such capital expenditures.Li-Cycle’s
insurance coverage and available resources may prove to be inadequate for events that may cause significant disruption to its operations. Any disruption inLi-Cycle’s
recycling processes could result in delivery delays, scheduling problems, increased costs or production interruption, which, in turn, may result in its21
customers deciding to send their
end-of-life
lithium-ion
batteries and battery manufacturing scrap toLi-Cycle’s
competitors.Li-Cycle
is and will be dependent on its current and future facilities, which will in the future require a high degree of capital expenditures. If one or more ofLi-Cycle’s
current or future facilities become inoperative, capacity constrained or if operations are disrupted, its business, results of operations or financial condition could be materially adversely affected.Li-Cycle
may in the future need to raise additional funds to meet its capital requirements and such funds may not be available toLi-Cycle
on commercially reasonable terms or at all, which could materially adversely affectLi-Cycle’s
business, results of operations or financial condition.The closed loop resource recovery, logistics management, secure destruction and
add-on
services ofLi-Cycle’s
lithium-ion
battery recycling are capital-intensive. AlthoughLi-Cycle
believes that it will have sufficient funds to meet its capital requirements for the next 12 months, it may in the future need to raise additional funds, including through the issuance of equity, equity linked or debt securities or through obtaining credit from government or financial institutions, and the availability of additional funds toLi-Cycle
will depend on a variety of factors, some of which are outside of its control. Additional funds may not be available toLi-Cycle
on commercially reasonable terms or at all, which could materially adversely affect its business, results of operations or financial condition. If additional funds are raised by issuing equity or equity-linked securities, shareholders ofLi-Cycle
may incur dilution.Li-Cycle
has a history of losses and expects to incur significant expenses for the foreseeable future, and there is no guarantee it will achieve or sustain profitability.Li-Cycle
was until 2020 a development stage company with no commercial revenues, and incurred net losses of approximately $226.6 million for the year ended October 31, 2021, $9.3 million for the year ended October 31, 2020, $4.1 million for the year ended October 31, 2019 and $0.9 million for the year ended October 31, 2018. The loss for the twelve months ended October 31, 2021, included a one-time listing fee of $152.7 million in relation to the Business Combination between Li-Cycle and Peridot Acquisition Corp. which was finalized on August 10, 2021 and represents the difference between the estimated fair value of the consideration transferred and the estimated fair value of assets acquired and liabilities assumed in the transaction. In addition, the loss for the twelve months ended October 31, 2021, included a $33.8 million fair value loss to remeasure Company warrants to their publicly traded fair market value. For the six months ended April 30, 2022,Li-Cycle’s
revenue was $12.5 million, and it recorded a net profit of $7.9 million, which included a $36.2 million fair value gain on the redemption of all outstanding Company warrants. As of January 31, 2022, the Company warrants are no longer publicly traded.Li-Cycle’s
primary sources of liquidity are currently the funds raised from the Business Combination, including the PIPE Financing, the 2021 Convertible Notes, the LG Subscription, the Glencore Convertible Note, as well as funds generated by operating activities.Li-Cycle
expects both its capital and operating expenditures will increase significantly in connection withLi-Cycle’s
ongoing activities.Li-Cycle
believes that its performance and future success is dependent on multiple factors that present significant opportunities forLi-Cycle
to increase revenues, but also pose risks and challenges.Li-Cycle
believes it will continue to incur losses for the foreseeable future and there is no guarantee it will achieve or sustain profitability in the future.Problems with the handling of
lithium-ion
battery cells that result in less usage oflithium-ion
batteries or affectLi-Cycle’s
operations could materially affectLi-Cycle’s
revenues and business.On rare occasions,
lithium-ion
battery cells can rapidly release the energy they contain by venting smoke and flames in a manner that can ignite nearby materials as well as otherlithium-ion
battery cells. Negative public perceptions regarding the safety or suitability oflithium-ion
battery cells for automotive applications, the social and environmental impacts of cobalt mining or any future incident involvinglithium-ion
battery cells, such as a vehicle or other fire, even if such incident does not involveLi-Cycle
directly, could have a negative impact on the market forlithium-ion
batteries, reducing the number of batteries in the market andLi-Cycle’s
revenue.22
In addition, recycling of
lithium-ion
batteries requiresLi-Cycle
to store a significant number oflithium-ion
battery cells at its facilities. We are subject to risks associated to mishandling oflithium-ion
battery cells, which could cause disruption to the operation ofLi-Cycle’s
current or future facilities. WhileLi-Cycle
has implemented safety procedures related to the handling of the cells, a safety issue or fire related to the cells could disruptLi-Cycle’s
operations. Any impact on revenue resulting from reduced demand forlithium-ion
batteries or onLi-Cycle’s
operations from perceived or actual safety or security issues at its own facilities could materially adversely affectLi-Cycle’s
business, results of operations or financial condition.Li-Cycle’s
business is subject to operational risks that could disrupt our business, some of which may not be insured or fully covered by insurance.Our operations are subject to risks inherent in the
lithium-ion
battery recycling industry, including potential liability which could result from, among other circumstances, personal injury, environmental claims or property damage some of which may not be insured or fully covered by insurance. The availability of, and the ability to collect on, insurance coverage is subject to factors beyond our control and is not guaranteed to cover any or all of our losses in every circumstance.Li-Cycle’s
insurance coverage may also be inadequate to cover liabilities related to such operational risks.Li-Cycle
has no control over changing conditions and pricing in the insurance marketplace and the cost or availability of various types of insurance may change dramatically in the future. Moreover,Li-Cycle
may not be able to maintain adequate insurance in the future at rates we consider reasonable and commercial justifiable, and insurance may not continue to be available on terms as favorable as our current arrangements. The occurrence of a significant uninsured claim, or a claim in excess of the insurance coverage limits maintained byLi-Cycle
could adversely affectLi-Cycle’s
business, results of operations and financial condition.Li-Cycle’s
revenue depends on maintaining and increasing feedstock supply commitments as well as securing new customers andoff-take
agreements.Li-Cycle
must maintain and gain feedstock supply commitments as well as new customers (including through entry intooff-take
agreements). Feedstock suppliers may change or delay supply contracts for any number of reasons, such as force majeure or government approval factors that are unrelated toLi-Cycle.
Customers may fail to perform under their contracts for similar reasons. As a result, in order to maintain and expand its business,Li-Cycle
must continue to develop and obtain new feedstock supply and customer contracts. However, it is difficult to predict whether and whenLi-Cycle
will secure such commitments and/or contracts due to competition for suppliers and customers and the lengthy process of negotiating supplier and customer agreements, which may be affected by factors thatLi-Cycle
does not control, such as market and economic conditions, financing arrangements, commodity prices, environmental issues and government approvals.A decline in the adoption rate of EVs, or a decline in the support by governments for “green” energy technologies, could materially harm
Li-Cycle’s
financial results and ability to grow its business.The demand for
Li-Cycle’s
recycling services and end products is driven in part by projected increases in the demand for EVs (including automobiles,e-bikes,
scooters, buses and trucks). A decline in the adoption rate of EVs could reduce the demand forLi-Cycle’s
recycling services and end products. A decline in volume under existing contracts or an inability to source new supplier relationships could also have a negative impact onLi-Cycle’s
results of operations.Decreases in demand and fluctuations in benchmark prices for the metals contained in
Li-Cycle’s
products could significantly impactLi-Cycle’s
costs, revenues and results of operations.The prices that
Li-Cycle
pays for battery feedstock, and the prices thatLi-Cycle
receives for its products, are generally tied to commodity prices for their principal contained metals, such as lithium, nickel and cobalt.23
Decreases in demand for or fluctuations in the prices of these commodities will affect
Li-Cycle’s
costs and revenues and declines in the prices of these commodities could have a material adverse impact onLi-Cycle’s
revenues and result in fluctuations in its margins. Any significant decline inLi-Cycle’s
revenues and margins will have a material impact on its results of operations.In addition to commodity prices,
Li-Cycle’s
revenues are primarily driven by the volume and composition oflithium-ion
battery feedstock materials processed at its facilities (including manufacturing scrap, spent batteries and third-party purchased black mass) and changes in the volume or composition of feedstock processed could significantly impactLi-Cycle’s
revenues and results of operations.Li-Cycle’s
revenues depend on processing high volumes of feedstock at our Spokes and Hubs, and its revenues are directly impacted by the chemistry of the feedstock processed, particularly as market chemistries shift. Certain feedstock chemistries produce raw materials such as cobalt for whichLi-Cycle
receives higher prices than others. A decline in overall volume of feedstock processed, or a decline in volume of chemistries with higher priced content relative to other chemistries, could result in a significant decline inLi-Cycle’s
revenues, which in turn would have a material impact on its results of operations.The development of an alternative chemical
make-up
oflithium-ion
batteries or battery alternatives could adversely affectLi-Cycle’s
revenues and results of operations.The development and adoption of alternative battery technologies could impact
Li-Cycle’s
prospects and future revenues. Current and next generation high energy densitylithium-ion
batteries for use in products such as EVs use nickel and cobalt as significant inputs. Cobalt and nickel tend to be in lower supply and therefore command higher prices than certain other raw materials. Alternative chemical makeups forlithium-ion
batteries or battery alternatives are being developed and some of these alternatives could be less reliant on cobalt and nickel or use other lower-priced raw materials such as lithium-iron phosphate chemistries, which contain neither cobalt nor nickel. A shift in production to batteries using lower-priced raw materials could affect the value of the end products produced byLi-Cycle,
lowering its revenues and negatively impacting its results of operations.Li-Cycle
relies on a limited number of customers and the projected revenues for the Rochester Hub are derived significantly from a single customer.Li-Cycle
relies on a limited number of customers from whom we generate most of our revenue.Li-Cycle
has entered into two agreements with Traxys North America LLC (“Traxys”) covering (i) 100% of its production of black mass, fromLi-Cycle’s
North American Spokes, other than such black mass asLi-Cycle
has determined (in its sole discretion) is required for internal purposes atLi-Cycle’s
Hubs, and (ii) 100% of its production of certain end products fromLi-Cycle’s
Rochester Hub, being lithium carbonate, nickel sulphate, cobalt sulphate, manganese carbonate and graphite concentrate.Li-Cycle
has also entered into additionaloff-take
agreements with Glencore, covering substantially all of our other Spoke and Hub products. If our offtake partners are unwilling or unable to fulfill their contractual obligations to us, if either party fails to perform under the relevant contract, or if these partners otherwise terminate such agreements prior to their expiration, our business could suffer and we may not be able to find a similar offtake partners or end customers on similar or favorable terms, which could have a material adverse effect on our business, financial conditions or results of operations.Our commercial agreements with Glencore also provide for the procurement of feedstock for our Spoke facilities, and procurement of black mass for our future Hub facilities, to supplement the volumes we are currently either independently sourcing or producing. Although these agreements are not exclusive for either party, they also do not commit either party to a specific performance threshold, and therefore a substantial reduction in Glencore’s supply of either product or an unwillingness or inability to fulfill its contractual obligations to us could have a material adverse effect on our business, financial condition or results of operations.
24
Li-Cycle’s heavy
reliance on the experience and expertise of its management may cause adverse impacts on it if a management member departs.Li-Cycle
depends on key personnel for the success of its business.Li-Cycle’s
business may be severely disrupted if it loses the services of its key executives and employees or fails to add new senior and middle managers to its management.Li-Cycle’s
future success is heavily dependent upon the continued service of its key executives.Li-Cycle
also relies on a number of key technology staff for its continued operation.Li-Cycle’s
future success is also dependent upon its ability to attract and retain qualified senior and middle managers to its management team. If one or more of its current or future key executives or employees are unable or unwilling to continue in their present positions,Li-Cycle
may not be able to easily replace them, and its business may be severely disrupted. In addition, if any of these key executives or employees joins a competitor or forms a competing company,Li-Cycle
could lose customers and suppliers and incur additional expenses to recruit and train personnel.Li-Cycle’s
relies on third-party consultants for its regulatory compliance andLi-Cycle
could be adversely impacted if the consultants do not correctly informLi-Cycle
of the legal changes.Li-Cycle
depends on third-party consultants to work with it across all of its projects to ensure correct permitting, regulatory compliance and keepLi-Cycle
apprised of legal changes.Li-Cycle
may facenon-compliance
challenges if the third-party consultants do not informLi-Cycle
of the proper compliance measures or ifLi-Cycle
fails to maintain its engagement with third-party consultants. IfLi-Cycle
is not in compliance with the current regulations, it could face litigation, sanctions and fees, which could adversely impact its business, results of operations and financial condition.Li-Cycle
is subject to the risk of litigation or regulatory proceedings, which could impact its financial results.All industries, including the” and Note 17 in our financial statements for the six months ended April 30, 2022 and 2021.
lithium-ion
battery recycling industry, are subject to legal claims, with or without merit. From time to time, we are subject to various litigation and regulatory proceedings arising in the normal course of business. Due to the inherent uncertainty of the litigation process, we may not be able to predict with any reasonable degree of certainty the outcome of any litigation or the potential for future litigation. Regardless of the outcome, any legal or regulatory proceeding could have an adverse impact onLi-Cycle’s
business, prospects, financial conditions, and results of operations due to defense costs, the diversion of management resources, potential reputational harm and other factors. See also “Business — Legal Proceedings
Li-Cycle
may not be able to complete its recycling processes as quickly as customers may require, which could cause it to lose supply contracts and could harm its reputation.Li-Cycle
may not be able to complete its recycling processes to meet the supply it receives from its customers. Operating delays and interruptions can occur for many reasons, including, but not limited to:| • | equipment failures; |
| • | personnel shortage; |
| • | labor disputes; or |
| • | transportation disruptions. |
The recycling process for
lithium-ion
batteries andlithium-ion
battery manufacturing scrap material, as well as black mass, is complex. IfLi-Cycle
fails to complete its recycling processes in a timely fashion, its reputation may be harmed. Any failure byLi-Cycle
to complete its recycling processes in a timely fashion may also jeopardize existing orders and causeLi-Cycle
to lose potential supply contracts and be forced to pay penalties.25
Li-Cycle
operates in an emerging, competitive industry and if it is unable to compete successfully its revenue and profitability will be adversely affected.The
lithium-ion
recycling market is competitive. As the industry evolves and the demand increases,Li-Cycle
anticipates that competition will increase.Li-Cycle
currently faces competition primarily from companies that focus on one type oflithium-ion
material recycling, some of which have more expertise in the recycling of that material thanLi-Cycle.
Li-Cycle
also competes against companies that have a substantial competitive advantage because of longer operating histories and larger budgets, as well as greater financial and other resources. National or global competitors could enter the market with more substantial financial and workforce resources, stronger existing customer relationships, and greater name recognition, or could choose to target medium to small companies inLi-Cycle’s
traditional markets. Competitors could focus their substantial resources on developing a more efficient recovery solution thanLi-Cycle’s
solutions. Competition also places downward pressure onLi-Cycle’s
contract prices and gross margins, which presents it with significant challenges in its ability to maintain strong growth rates and acceptable gross margins. IfLi-Cycle
is unable to meet these competitive challenges, it could lose market share to its competitors and experience an adverse impact to its business, financial condition and results of operations.Increases in income tax rates, changes in income tax laws or disagreements with tax authorities could adversely affect
Li-Cycle’s
business, financial condition or results of operations.Li-Cycle
is subject to income taxes in the United States, Canada and in certain foreign jurisdictions in which it operates. Increases in income tax rates or other changes in income tax laws that apply to its business could reduceLi-Cycle’s
after-tax
income from such jurisdiction and could adversely affect its business, financial condition or results of operations.Li-Cycle’s
operations outside the United States generate a significant portion of its income. In addition, the United States has recently made or is actively considering changes to existing tax laws. Additional changes in the U.S. tax regime or in how U.S. multinational corporations are taxed on foreign earnings, including changes in how existing tax laws are interpreted or enforced, could adversely affectLi-Cycle’s
business, financial condition or results of operations.Li-Cycle
is also subject to regular reviews, examinations and audits by the IRS and other taxing authorities with respect to income andnon-income-based
taxes both within and outside the United States. Economic and political pressures to increase tax revenues in jurisdictions in which it operates, or the adoption of new or reformed tax legislation or regulation, may make resolving tax disputes more difficult and the final resolution of tax audits and any related litigation could differ from its historical provisions and accruals, resulting in an adverse impact on its business, financial condition or results of operations. In addition, in connection with the Organization for EconomicCo-operation
and Development Base Erosion and Profit Shifting project, companies are required to disclose more information to tax authorities on operations around the world, which may lead to greater audit scrutiny of profits earned in various countries.Li-Cycle’s
operating and financial results may vary significantly from period to period due to fluctuations in its operating costs and other factors.Li-Cycle
expects itsperiod-to-period
Li-Cycle’s
control.Li-Cycle
expects itsperiod-to-period
Li-Cycle
believes thatquarter-to-quarter
Li-Cycle’s
financial results may not meet expectations of equity research analysts, ratings agencies or investors, who may be focused only on quarterly financial results. If any of this occurs, the trading price of our common shares could fall substantially, either suddenly or over time.26
Fluctuations in foreign currency exchange rates could result in declines in reported sales and net earnings.
Li-Cycle
reports its financial results in U.S. dollars and a material portion of its sales and operating costs are realized in currencies other than the U.S. dollar. For the year ended October 31, 2021, approximately 41% ofLi-Cycle’s
revenues were realized in Canada.Li-Cycle
is also exposed to other currencies, such as the Euro, and may in the future be exposed to additional currencies. If the value of any currencies in which sales are realized, particularly the Canadian dollar, depreciates relative to the U.S. dollar,Li-Cycle’s
foreign currency revenue will decrease when translated to U.S. dollars for reporting purposes. In addition, any depreciation in foreign currencies could result in higher local prices, which may negatively impact local demand and have a material adverse effect onLi-Cycle’s
business, results of operations or financial condition. Alternatively, if the value of any of the currencies in which operating costs are realized appreciates relative to the U.S. dollar,Li-Cycle’s
operating costs will increase when translated to U.S. dollars for reporting purposes. Although these risks may sometimes be naturally hedged by a match in operating costs denominated in the same currency, fluctuations in foreign currency exchange rates, particularly the U.S.-Canadian dollar exchange rate, could create discrepancies betweenLi-Cycle’s
operating costs in a given currency that could have a material adverse effect on its business, results of operations or financial condition.While
Li-Cycle
actively manages its exposure to foreign-exchange rate fluctuations and may enter into hedging contracts from time to time, such contracts hedge foreign-currency denominated transactions and any change in the fair value of the contracts could be offset by changes in the underlying value of the transactions being hedged. Furthermore,Li-Cycle
does not have foreign-exchange hedging contracts in place with respect to all currencies in which it does business. As a result, there can be no assurance thatLi-Cycle’s
approach to managing its exposure to foreign-exchange rate fluctuations will be effective in the future or thatLi-Cycle
will be able to enter into foreign-exchange hedging contracts as deemed necessary on satisfactory terms.Unfavorable economic conditions, including the consequences of the global
COVID-19
pandemic and disruptions in the global supply chain, may have a material adverse effect onLi-Cycle’s
business, results of operations and financial condition.Li-Cycle
has been impacted by theCOVID-19
pandemic, andLi-Cycle
cannot predict the future impacts theCOVID-19
pandemic, including the emergence of new strains such as the Omicron or Delta variant, may have on its business, results of operations and financial condition. Beginning in March 2020, numerous government regulations and public advisories, as well as shifting social behaviors, temporarily and from time to time limited or closednon-essential
transportation, government functions, business activities andperson-to-person
COVID-19
on manufacturing production may lead to less demand forlithium-ion
batteries, impacting the resulting contribution of batteries and battery-related scrap material to the recycling market over theshort-to-medium
The ongoing
COVID-19
pandemic has resulted in significant supply chain disruptions globally and continues to affectLi-Cycle’s
business in the form of operational slow-downs and interruptions caused by employee absences and mandatory quarantines resulting from actual or suspected exposure toCOVID-19.
The company has, at times, experienced slow-downs and interruptions in its battery supply chain.Li-Cycle
shut down its corporate headquarters in March 2020 and enforced a work-from-home mandate.Li-Cycle
re-opened
its corporate office facilities in November 2021. A second temporary closure ofLi-Cycle’s
corporate headquarters occurred in January 2022 related to the Omicron variant and the office subsequentlyre-opened
in February 2022.Li-Cycle
cannot currently predict the duration of the impact of theCOVID-19
pandemic on its operations. Continuing effects of theCOVID-19
pandemic, including the emergence of new strains such as the Omicron or Delta variant may cause governments to impose new restrictive measures, result in employee absences from work or result in negative economic effects, which in each case could have a material adverse impact onLi-Cycle’s
operations, development and construction activities and financial condition.Li-Cycle’s
operations, costs and timelines may also be affected by global economic markets and levels of consumer comfort and spend, including recessions, slow economic growth, economic and pricing instability,27
inflation levels, increase of interest rates and credit market volatility, all of which could impact demand in the worldwide transportation industries or otherwise have a material adverse effect on
Li-Cycle’s
business, results of operations and financial condition. For example, Russia’s invasion of Ukraine has and may continue to further exacerbate disruptions in the global supply chain. Shortages, price increases and/or delays in shipments of supplies, equipment and raw materials have occurred and may continue to occur in the future which may result in increased operational or construction costs or operational or construction slowdowns. Because the impact of current conditions on an ongoing basis is yet largely unknown, is rapidly evolving and has been varied across geographic regions, this ongoing assessment will be particularly critical to allowLi-Cycle
to accurately project supply and demand and infrastructure requirements globally and allocate resources accordingly. If current global market conditions continue or worsen,Li-Cycle’s
business, results of operations and financial condition could be materially adversely affected.Natural disasters, unusually adverse weather, epidemic or pandemic outbreaks, cyber incidents, boycotts and
geo-political
events could materially adversely affectLi-Cycle’s
business, results of operations or financial condition.The occurrence of one or more natural disasters, such as fires, hurricanes and earthquakes, unusually adverse weather, epidemic or pandemic outbreaks, such as the ongoing
COVID-19
pandemic, cyber incidents such as ransomware attacks, boycotts andgeo-political
events, such as civil unrest and acts of terrorism (including cyber terrorism or other cyber incidents), or similar disruptions could materially adversely affectLi-Cycle’s
business, power supply, results of operations or financial condition. These events could result in physical damage to property, an increase in energy prices, temporary or permanent closure of one or more ofLi-Cycle’s
current or planned facilities, temporary lack of an adequate workforce in a market, temporary or long-term disruption in the supply of raw materials, construction delays at the Rochester Hub, the Spoke Capital Projects or other facilities being developed, temporary disruption in transport from overseas, or disruption toLi-Cycle’s
information systems.Li-Cycle
may incur expenses or delays relating to such events outside of its control, which could have a material adverse impact on its business, results of operations and financial condition.Failure to protect or enforce
Li-Cycle’s
intellectual property could adversely affect its business.Li-Cycle’s
success depends in large part on its proprietary technology.Li-Cycle
relies on various intellectual property rights, including patents, copyrights, trademarks, and trade secrets, as well as confidentiality provisions and contractual arrangements, and other forms of statutory and common law protection to protect its proprietary rights. IfLi-Cycle
does not protect and enforce its intellectual property rights adequately and successfully, its competitive position may suffer, which could adversely affect the Company’s business, prospects, financial condition, and results of operations.Li-Cycle’s
pending patent or trademark applications may not be approved, or competitors or others may challenge the validity, enforceability, or scope of its issued patents, the scope of its copyrights, the registrability of its trademarks or the trade secret status of its proprietary information. There can be no assurance that additional patents will be filed or issued or that any ofLi-Cycle’s
currently issued patents will provide significant protection forLi-Cycle’s
commercially relevant intellectual property or for those portions of its proprietary technology that are the most key to its competitive positions in the marketplace. In addition,Li-Cycle’s
patents, copyrights, trademarks, trade secrets, and other intellectual property rights may not provide us a significant competitive advantage. There is no assurance that the forms of intellectual property protection thatLi-Cycle
seeks, including business decisions about whether, when and where to file patents and when and how to maintain and protect copyrights, trade secrets, license and other contractual rights, will be adequate to protectLi-Cycle’s
business.Not all countries offer the same types, standards for registrability or level of protection for the Company’s intellectual property as Canada and the United States, and
Li-Cycle
may not pursue the same intellectual property filings or obtain the intellectual property registrations of the same scope in all of its commercially-relevant28
markets. As
Li-Cycle
expands its international activities, its exposure to unauthorized copying and use of its technology and proprietary information will likely increase. Effective intellectual property protection may not be available toLi-Cycle
in every country in which it operates. In addition, many countries limit the enforceability of patents against certain third parties, including government agencies or government contractors, or make patents subject to compulsory licenses to third parties under certain circumstances. In these countries, patents may provide limited or no benefit.Intellectual property laws, procedures, and restrictions provide only limited protection and any of the Company’s intellectual property rights may be challenged, invalidated, circumvented, infringed, or misappropriated. The Company enters into confidentiality and invention assignment or intellectual property ownership agreements with its employees and contractors and enters into confidentiality agreements with other third parties. The Company cannot ensure that these agreements, or all the terms thereof, will be enforceable or compliant with applicable law, or otherwise effective in controlling access to, use of, reverse engineering, and distribution of
Li-Cycle’s
proprietary information or in effectively securing exclusive ownership of intellectual property developed by its current or former employees and contractors. Despite these agreements and the Company’s reasonable precautions, its intellectual property is vulnerable to misappropriation, unauthorized access and copying through employee or third-party error or actions, including malicious state or state-sponsored actors, theft, hacking, cybersecurity incidents, and other security breaches and incidents, and such incidents may be difficult to detect and may remain undiscovered or unknown for a significant period of time. Further, these agreements with the Company’s employees, contractors, and other parties do not prevent other parties from independently developing technologies, products and services that are substantially equivalent or superior to the Company’s technologies and services. It is possible for third parties to infringe upon or misappropriate the Company’s intellectual property and to use information thatLi-Cycle
regards as proprietary to create services that compete with those of the Company.Li-Cycle
may need to spend significant resources securing and monitoring its intellectual property rights, and it may or may not be able to detect infringement by third parties.Li-Cycle’s
competitive position may be adversely impacted if it cannot detect infringement or enforce its intellectual property rights quickly or successfully. In some circumstances,Li-Cycle
may choose not to pursue enforcement of its valid intellectual property rights for a variety of legal and business considerations, including (i) because an infringer has a dominant intellectual property position, (ii) because of uncertainty relating to the scope of the Company’s intellectual property or the outcome of an enforcement action, (iii) because of the financial and reputational costs associated with enforcement or (iv) for other business reasons. In addition, competitors might avoid infringement by designing around the Company’s intellectual property rights or by developingnon-infringing
competing technologies. Litigation brought to protect and enforce the Company’s intellectual property rights could be costly, time-consuming, and distracting to management andLi-Cycle’s
development teams and could result in the impairment or loss of portions of its intellectual property, for example, the Company’s efforts to enforce its intellectual property rights may be met with defenses, counterclaims attacking the scope, validity, and enforceability of the Company’s intellectual property rights, or with counterclaims and countersuits asserting infringement by the Company of third-party intellectual property rights.Li-Cycle’s
failure to secure, protect, and enforce its intellectual property rights could adversely affect its brand and its business, any of which could have an adverse effect on the Company’s business, prospects, financial condition, and results of operations.Li-Cycle
may be subject to intellectual property rights claims by third parties, which could be costly to defend, could require payment of significant damages and could limit the Company’s ability to use certain technologies.Li-Cycle
is subject to the risk of third parties asserting claims of infringement of intellectual property rights or violation of other statutory, license or contractual rights in technology or data. Any such claim by a third party, even if without merit, could causeLi-Cycle
to incur substantial costs defending against such claim and could distract the Company’s management and its development teams from its business.29
Although third parties may offer a license to their technology or data, the terms of any offered license may not be acceptable or commercially reasonable and the failure to obtain a license or the costs associated with any license could cause the Company’s business, prospects, financial condition, and results of operations to be adversely affected. In addition, some licenses may be
non-exclusive,
and therefore the Company’s competitors may have access to the same technology or data licensed to the Company. Alternatively,Li-Cycle
may be required to developnon-infringing
technology or data which could require significant effort and expense and ultimately may not be successful. Furthermore, a successful claimant could secure a judgment or the Company may agree to a settlement that prevents it from selling certain products or performing certain services in a given country or countries or that requires the Company to pay royalties, substantial damages, including treble damages if it is found to have willfully infringed the claimant’s patents, copyrights, trade secrets or other statutory rights, or other fees. Any of these events could have an adverse effect on the Company’s business, prospects, financial condition, and results of operations.Li-Cycle
has identified material weaknesses in its internal control over financial reporting. If its remediation of such material weaknesses is not effective, or if it fails to develop and maintain a proper and effective internal control over financial reporting, its ability to produce timely and accurate financial statements or comply with applicable laws and regulations could be impaired.Prior to August 10, 2021,
Li-Cycle
Holdings Corp. was a private company and we addressed our internal control over financial reporting with internal accounting and financial reporting personnel and other resources.In the course of preparing for the Business Combination with Peridot Acquisition Corp,
Li-Cycle
identified material weaknesses in its internal control over financial reporting. A material weakness is a deficiency, or a combination of deficiencies, in internal control over financial reporting, such that there is a reasonable possibility that a material misstatement ofLi-Cycle’s
annual or interim consolidated financial statements may not be prevented or detected on a timely basis.For the fiscal year ended October 31, 2021,
Li-Cycle
did not have in place i) an effective control environment with formal processes and procedures and ii) an adequate number of accounting personnel with the appropriate technical training in, and experience with, IFRS to allow for a detailed review of complex accounting transactions, that would identify errors in a timely manner, including in areas such as revenue recognition, inventory, related party arrangements, financing transactions and business combination transactions.Li-Cycle
did not design or maintain effective controls over the financial statement close and reporting process in order to ensure the accurate and timely preparation of financial statements in accordance with IFRS. In addition, information technology controls, including end user and privileged access rights and appropriate segregation of duties, including for certain users the ability to create and post journal entries, were not designed or operating effectively. As of April 30, 2022, these material weaknesses have not been remediated.While we have taken steps to address these material weaknesses and expect to continue to implement the remediation plan, any gaps or deficiencies in our internal control over financing reporting may result in us being unable to provide required financial information in a timely and reliable manner and/or incorrectly reporting financial information.
Risks Relating to this Offering and Ownership of Our Securities
Our
by-laws
provide, subject to limited exceptions, that the Superior Court of Justice of the Province of Ontario and the appellate courts therefrom are the sole and exclusive forum for certain shareholder litigation matters, which could limit shareholders’ ability to obtain a favorable judicial forum for disputes with us or our directors, officers, employees or shareholders.Our
by-laws
require, to the fullest extent permitted by law and subject to certain exemptions for actions brought to enforce a duty or liability under certain U.S. securities laws, that (i) derivative actions brought in our30
name, (ii) actions against directors, officers and employees for breach of fiduciary duty, (iii) any action or proceeding asserting a claim arising pursuant to the Ontario Business Corporations Act (the “OBCA”) or our Governing Documents, and (iv) any action or proceeding asserting a claim otherwise related to our “affairs” (as defined in the OBCA) may be brought only in the Superior Court of Justice of the Province of Ontario, Canada and the appellate courts therefrom and, if brought outside of such forum, the shareholder bringing the suit will be deemed to have consented to the personal jurisdiction of the provincial and federal courts located within the Province of Ontario in connection with any action brought in such court to enforce the forum provisions and to service of process on such shareholder’s counsel. Any person or entity purchasing or otherwise acquiring any interest in our common shares shall be deemed to have notice of and consented to the forum provisions in its articles. Unless we consent in writing to the selection of an alternative forum, the federal district courts of the United States of America will have exclusive jurisdiction for the resolution of any complaint asserting a cause of action arising under the U.S. Securities Act. The exclusive forum provision in our
by-laws
will not apply to actions arising under the Securities Act or the Exchange Act.This choice of forum provision may limit a shareholder’s ability to bring a claim in a judicial forum that it finds favorable for disputes with us or any of our directors, officers, other employees or shareholders, which may discourage lawsuits with respect to such claims. Alternatively, if a court were to find the choice of forum provision contained in our articles to be inapplicable or unenforceable in an action, we may incur additional costs associated with resolving such action in other jurisdictions, which could harm our business, results of operations and financial condition.
Our common shares have only recently become publicly traded, and the market price of our common shares may be volatile. The trading price of our common shares could be subject to wide fluctuations due to a variety of factors, including:
| • | the COVID-19 pandemic and its impact on the markets and economies in which we operate; |
| • | our actual or anticipated operating performance and the operating performance of our competitors; |
| • | failure of securities analysts to initiate or maintain coverage of us, changes in financial estimates by any securities analysts who follow our company, or our failure to meet the estimates or the expectations of investors; |
| • | any major change in our board of directors, management, or key personnel; |
| • | market conditions in our industry; |
| • | general economic conditions such as recessions, interest rates, fuel prices, international currency fluctuations; |
| • | rumors and market speculation involving us or other companies in our industry; |
| • | announcements by us or our competitors of significant innovations, new products, services or capabilities, acquisitions, strategic investments, partnerships, joint venture or capital commitments; |
| • | the legal and regulatory landscape and changes in the application of existing laws or adoption of new laws that impact our business; |
| • | legal and regulatory claims, litigation, or pre-litigation disputes and other proceedings; |
| • | other events or factors, including those resulting from war, incidents of terrorism, or responses to these events; and |
| • | sales or expected sales of our common shares by us, our officers, directors, significant shareholders, and employees. |
In addition, stock markets have experienced significant price and volume fluctuations that have affected and continue to affect the market prices of equity securities of many companies. The stock market in general and
31
NYSE have experienced price and volume fluctuations that have often been unrelated or disproportionate to the operating performance of the particular companies affected. These fluctuations may be even more pronounced in the trading market for our common shares as a result of the supply and demand forces for newly public companies. In the past, stockholders have instituted securities class action litigation following periods of stock volatility.
Sales of substantial amounts of our common shares after the expiration of applicable
lock-up
periods, or the perception that such sales will occur, could adversely affect the market price of our common shares.On the closing date of the Business Combination, we, the Peridot Class B Holders and the
Li-Cycle
Holders entered into the Investor Agreement. Pursuant to the Investor Agreement, the common shares held by Peridot Class B Holders are subject to certain transfer restrictions until the earliest of (a) one year after the Closing and (b) (x) the last consecutive trading day where the last reported sale price of our common shares equals or exceeds $12.00 per share (as adjusted for share subdivisions, share capitalizations, reorganizations, recapitalizations and the like) for any 20 trading days within any30-trading
day period commencing at least 150 days after the Closing, or (y) the date on which we complete a liquidation, merger, share exchange or other similar transaction that results in all of its public shareholders having the right to exchange their common shares for cash, securities or other property.Sales of a substantial number of our common shares in the public market after the expiration of the
lock-up
period pursuant to the Investor Agreement, or the perception that such sales will occur, could adversely affect the market price of our common shares and make it difficult for us to raise funds through securities offerings.NYSE may delist our common shares, which could limit investors’ ability to engage in transactions in our common shares and subject us to additional trading restrictions.
Upon consummation of the Business Combination, our common shares became listed on the New York Stock Exchange. In order to list our common shares, we were required to meet the NYSE initial listing requirements. Although we were able to meet those initial listing requirements, we may be unable to maintain the listing of our common shares in the future.
If NYSE were to delist our common shares, we could face significant material adverse consequences, including:
| • | a limited availability of market quotations for our securities; |
| • | a limited amount of news and analyst coverage for the Company; and |
| • | a decreased ability to obtain capital or pursue acquisitions by issuing additional equity or convertible securities. |
Becauseoperation of our business.
Li-Cycle
has historically operated as a private company, we have limited experience complying with public company obligations and fulfilling these obligations is expensive and time consuming and may divert management’s attention from theday-to-day
As a privately held company,
Li-Cycle
was not required to comply with many corporate governance and financial reporting practices and policies required of publicly-traded companies. As a publicly traded company, we incur significant legal, accounting and other expenses thatLi-Cycle
was not required to incur in the recent past. These expenses will increase once we are no longer an “emerging growth company” as defined under the Jumpstart Our Business Startups Act of 2012 (“JOBS Act”). We will no longer qualify as an “emerging growth company” on October 31, 2022. In addition, new and changing laws, regulations and standards relating to corporate governance and public disclosure for public companies, including the Dodd-Frank Act, the Sarbanes-Oxley Act, regulations related thereto and the rules and regulations of the SEC and NYSE, have increased the32
costs and the time that must be devoted to compliance matters. We expect these laws and regulations to increase our legal and financial compliance costs and to render some activities more time-consuming and costly, although we are currently unable to estimate these costs with any degree of certainty. We may need to hire more employees or engage outside consultants to comply with these requirements, which will increase our costs and expenses. Being a public company could make it more difficult or costly for us to obtain certain types of insurance, including director and officer liability insurance, and we may be forced to accept reduced policy limits and coverage or incur substantially higher costs to obtain the same or similar coverage. Being a public company could also make it more difficult and expensive for us to attract and retain qualified persons to serve on our board of directors, board committees or as executive officers. Furthermore, if we are unable to satisfy our obligations as a public company, we could be subject to delisting of our common shares, fines, sanctions and other regulatory action and potentially civil litigation.
For as long as we remain an “emerging growth company” as defined in the JOBS Act, we may take advantage of certain exemptions from various reporting requirements that are applicable to other public companies that are not “emerging growth companies.” We will remain an emerging growth company until the earlier of (1) the last day of the fiscal year (a) following the fifth anniversary of the completion of Peridot’s public offering, (b) in which we have total annual gross revenue of at least $1.07 billion or (c) in which we are deemed to be a large accelerated filer, which means the market value of our common shares that are held by
non-affiliates
exceeds $700 million as of the last day of the second fiscal quarter, and (2) the date on which we have issued more than $1.0 billion innon-convertible
debt securities during the prior three-year period. To the extent we choose not to use exemptions from various reporting requirements under the JOBS Act, or if we can no longer be classified as an “emerging growth company,” we expect to incur additional compliance costs, which will reduce our ability to operate profitably. We will no longer qualify as an “emerging growth company” on October 31, 2022. Consequently, the Company will be required to comply with the auditor attestation requirements for the assessment of its internal control over financial reporting provided by Section 404 of the Sarbanes-Oxley Act of 2002, which would be included in the Company’s Annual Report on Form 20-F covering the fiscal year ended October 31, 2022.As a “foreign private issuer” under the rules and regulations of the SEC, we are permitted to, and will, file less or different information with the SEC than a company incorporated in the United States or otherwise subject to these rules, and will follow certain home country corporate governance practices in lieu of certain NYSE requirements applicable to U.S. issuers.
The Company is considered a “foreign private issuer” under the Exchange Act and is therefore exempt from certain rules under the Exchange Act. For example, we are not required to file current reports on Form
8-K
or quarterly reports on Form10-Q,
we are exempt from the U.S. proxy rules which impose certain disclosure and procedural requirements for U.S. proxy solicitations and we will not be required to file financial statements prepared in accordance with or reconciled to U.S. GAAP so long as our financial statements are prepared in accordance with IFRS as issued by the International Accounting Standards Board. We are not required to comply with Regulation FD, which imposes restrictions on the selective disclosure of material information to shareholders, and our officers, directors and principal shareholders are exempt from the reporting and short-swing profit recovery provisions of Section 16 of the Exchange Act. In addition, we are not required to file periodic reports and financial statements with the SEC as frequently or within the same time frames as U.S. companies with securities registered under the Exchange Act. Accordingly, holders of the Company’s securities may receive less or different information about the Company than they may receive with respect to public companies incorporated in the United States.In addition, as a “foreign private issuer” whose common shares are listed on NYSE, we are permitted to follow certain home country corporate governance practices in lieu of certain NYSE requirements.
We could lose our status as a “foreign private issuer” under current SEC rules and regulations if more than 50% of our outstanding voting securities become directly or indirectly held of record by U.S. holders and one of
33
the following is true: (i) the majority of our directors or executive officers are U.S. citizens or residents; (ii) more than 50% of our assets are located in the United States; or (iii) our business is administered principally in the United States. If we lose our status as a foreign private issuer in the future, we will no longer be exempt from the rules described above and, among other things, will be required to file periodic reports and annual and quarterly financial statements as if we were a company incorporated in the United States (including preparation of financial statements in accordance with U.S. GAAP). If this were to happen, we would likely incur substantial costs in fulfilling these additional regulatory requirements and members of our management would likely have to divert time and resources from other responsibilities to ensuring these additional regulatory requirements are fulfilled.
Failure to develop and maintain effective internal control over financial reporting could have a material adverse effect on our business, results of operations and stock price.
Prior to the consummation of the Business Combination,.”
Li-Cycle
was not subject to Section 404 of the Sarbanes-Oxley Act. However, following the consummation of the Business Combination and the transactions related thereto, the Company is required to comply with Section 404 of the Sarbanes-Oxley Act on the timeline described below, which requires, among other things, the Company to evaluate annually the effectiveness of its internal control over financial reporting. The standards required for a public company under Section 404 of the Sarbanes-Oxley Act are significantly more stringent than those required ofLi-Cycle
prior to the Business Combination. Section 404(a) of the Sarbanes-Oxley Act (“Section 404(a)”) requires that, beginning with the second annual report following the Business Combination, management assess and report annually on the effectiveness of internal control over financial reporting and identify any material weaknesses in internal control over financial reporting. Additionally, Section 404(b) requires the independent registered public accounting firm to issue an annual report that addresses the effectiveness of internal control over financial reporting. We expect our first Section 404(a) assessment will take place for our annual report for the year ending October 31, 2022 and our first Section 404(b) assessment will take place for our annual report for the year ending October 31, 2022 (given that we will no longer qualify as an “emerging growth company” on October 31, 2022).Li-Cycle
identified material weaknesses in its internal control over financial reporting, see “Risk Factors — Risks Relating to
Li-Cycle’s
Business —Li-Cycle
has identified material weaknesses in its internal control over financial reporting. If its remediation of such material weaknesses is not effective, or if it fails to develop and maintain a proper and effective internal control over financial reporting, its ability to produce timely and accurate financial statements or comply with applicable laws and regulations could be impairedManagement may not be able to effectively and timely implement controls and procedures that adequately respond to the increased regulatory compliance and reporting requirements that are applicable to the Company following the Business Combination. If we are not able to implement the additional requirements of Section 404 in a timely manner as required or with adequate compliance, we may not be able to assess whether our internal control over financial reporting is effective, which may subject us to adverse regulatory consequences and could harm investor confidence and the market price of our common shares.
As an “emerging growth company,” the Company cannot be certain if the reduced disclosure and governance requirements applicable to “emerging growth companies” will make its shares less attractive to investors.
As an “emerging growth company,” the Company may take advantage of certain exemptions from various reporting requirements that are applicable to other public companies, including not being required to obtain an assessment of the effectiveness of its internal control over financial reporting from its independent registered public accounting firm pursuant to Section 404 of the Sarbanes-Oxley Act, reduced disclosure obligations regarding executive compensation in its periodic reports and proxy statements, and exemptions from the requirements of holding a nonbinding advisory vote on executive compensation and shareholder approval of any golden parachute payments not previously approved. In addition, the JOBS Act provides that an emerging growth company can take advantage of an extended transition period for complying with new or revised accounting standards, which the Company has elected to do. We will no longer qualify as an “emerging growth company”
34
on October 31, 2022. Consequently, the Company will be required to comply with the auditor attestation requirements for the assessment of its internal control over financial reporting provided by Section 404 of the Sarbanes-Oxley Act of 2002, which would be included in the Company’s Annual Report on Form 20-F covering the fiscal year ended October 31, 2022.
We cannot predict if investors will find our common shares less attractive because we will rely on these exemptions. If some investors find our common shares less attractive as a result, there may be a less active market for our common shares, our share price may be more volatile and the price at which our securities trade could be less than if we did not use these exemptions.
We expect to incur costs related to our internal control over financial reporting in the upcoming years to further improve our internal control environment. If we identify deficiencies in our internal control over financial reporting or if we are unable to comply with the requirements applicable to us as a public company, including the requirements of Section 404 of the Sarbanes-Oxley Act, in a timely manner, we may be unable to accurately report our financial results, or report them within the timeframes required by the SEC. If this occurs, we also could become subject to sanctions or investigations by the SEC or other regulatory authorities. In addition, if we are unable to assert that our internal control over financial reporting is effective, or if our independent registered public accounting firm is unable to express an opinion as to the effectiveness of our internal control over financial reporting, or express an adverse opinion, investors may lose confidence in the accuracy and completeness of our financial reports, we may face restricted access to the capital markets and our share price may be adversely affected.
We may issue additional common shares or other equity securities without shareholder approval, which would dilute the ownership interests of existing shareholders in the Company and may depress the market price of our common shares.
We may issue additional shares or other equity securities in the future in connection with, among other things, capital raises, future acquisitions, repayment of outstanding indebtedness or grants under the Company’s 2021 Incentive Award Plan (the “Incentive Plan”) without shareholder approval in a number of circumstances. Pursuant to the terms of the 2021 Convertible Notes and the Glencore Convertible Note, we may issue common shares upon conversion or redemption of the 2021 Convertible Notes or Glencore Convertible Note, as applicable, upon exercise of the warrants issued to Glencore in connection with a redemption of the Glencore Convertible Note or pursuant to any other term of the 2021 Convertible Notes or Glencore Convertible Note, as applicable, including as a result of any of the PIK provisions of the 2021 Convertible Notes or Glencore Convertible Note, as applicable.
The issuance of additional shares or other equity securities could have one or more of the following effects:
| • | our existing shareholders’ proportionate ownership will decrease; |
| • | the amount of cash available per share, including for payment of dividends in the future, may decrease; |
| • | the relative voting strength of each previously outstanding share may be diminished; and |
| • | the market price of our common shares may decline. |
The issuance of our common shares in connection with the conversion of the 2021 Convertible Notes and the Glencore Convertible Note would cause substantial dilution, and could materially affect the trading price of our common shares.
As of the date of this prospectus, there is an aggregate principal amount of $105.9 million outstanding under the 2021 Convertible Notes and $200 million outstanding under the Glencore Convertible Note. To the extent we or the holder of the 2021 Convertible Notes or Glencore Convertible Note, as applicable, converts the 2021 Convertible Notes or Glencore Convertible Note, as applicable, into our common shares, substantial amounts of our common shares will be issued. Such issuances could result in substantial decreases to our stock price and dilution to our existing shareholders.
35
We do not currently intend to pay dividends on our common shares and, consequently, your ability to achieve a return on your investment will depend on appreciation in the price of our common shares.
We currently intend to retain our future earnings, if any, to finance the further development and expansion of our business and do not intend to pay cash dividends in the foreseeable future. Any future determination to pay dividends will be at the discretion of our board of directors and will depend on our financial condition, results of operations, capital requirements and future agreements and financing instruments, business prospects and such other factors as our board of directors deems relevant. As a result, a shareholder’s ability to achieve a return on their investment in our common shares will depend on appreciation in the price of our common shares.
The Company’s ability to meet expectations and projections in any research or reports published by securities or industry analysts, or a lack of coverage by securities or industry analysts, could result in a depressed market price and limited liquidity for its shares.
The trading market for the Company’s common shares will be influenced by the research and reports that industry or securities analysts may publish about it, its business, its market, or its competitors. If no securities or industry analysts commence coverage of the Company, its share price would likely be less than that which would be obtained if it had such coverage and the liquidity, or trading volume of its common shares may be limited, making it more difficult for a shareholder to sell shares at an acceptable price or amount. If any analysts do cover the Company, their projections may vary widely and may not accurately predict the results it actually achieves. The Company’s share price may decline if its actual results do not match the projections of research analysts covering it. Similarly, if one or more of the analysts who write reports on the Company downgrades its shares or publishes inaccurate or unfavorable research about its business, its share price could decline. If one or more of these analysts ceases coverage of the Company or fails to publish reports on it regularly, its share price or trading volume could decline.
The Company may be required to take write-downs or write-offs, restructuring and impairment or other charges that could have a significant negative effect on its financial condition, results of operations and share price, which could cause you to lose some or all of your investment.
The Company may be forced to later write down or write off assets, restructure its operations, or incur impairment or other charges that could result in losses. Unexpected risks may arise and previously known risks may materialize. Even though these charges may be
non-cash
items and not have an immediate impact on the Company’s liquidity, the fact that it may report charges of this nature could contribute to negative market perceptions about the Company or its securities. In addition, charges of this nature may cause the Company to be unable to obtain future financing on favorable terms or at all.The Company could be or may become a passive foreign investment company, which could result in adverse U.S. federal income tax consequences.
It is possible that the Company could be classified as a “passive foreign investment company” or “PFIC” for U.S. federal income tax purposes, which would have adverse U.S. tax consequences for U.S. persons holding the Company’s common shares. Although the Company believes that it should not be classified as a PFIC for its current taxable year and does not expect to be so classified in the foreseeable future, whether the Company is a PFIC is a factual determination made annually, and the Company’s status will depend among other things upon changes in the composition and relative value of its gross receipts and assets. Because the market value of the Company’s assets (including for this purpose goodwill) may be measured in large part by the market price of the common shares, which is likely to fluctuate, no assurance can be given that the Company will not be a PFIC in the current year or in any future taxable year.
36
FORWARD-LOOKING STATEMENTS
Certain statements contained in this prospectus may be considered “forward-looking statements” within the meaning of the U.S. Private Securities Litigation Reform Act of 1995, Section 27A of the U.S. Securities Act of 1933, as amended, Section 21 of the U.S. Securities Exchange Act of 1934, as amended, and applicable Canadian securities laws. Forward-looking statements may generally be identified by the use of words such as “believe”, “may”, “will”, “continue”, “anticipate”, “intend”, “expect”, “should”, “would”, “could”, “plan”, “potential”, “future”, “target” or other similar expressions that predict or indicate future events or trends or that are not statements of historical matters, although not all forward-looking statements contain such identifying words. Forward-looking statements in this prospectus include but are not limited to statements about: Li-Cycle’s ability to capitalize on global growth opportunities; anticipated growth in global demand for and production of lithium-ion batteries and the growth of related industries; the annual input capacity and production output of Li-Cycle’s Rochester Hub and its Arizona, Alabama, Ohio, Norway and Germany Spokes, and the expected start-up dates and total capital costs of those projects, as applicable. These statements are based on various assumptions, whether or not identified in this prospectus, made by Li-Cycle management, including but not limited to assumptions regarding the timing, scope and cost of Li-Cycle’s projects; the processing capacity and production of Li-Cycle’s facilities; Li-Cycle’s ability to source feedstock and manage supply chain risk; Li-Cycle’s ability to increase recycling capacity and efficiency; Li-Cycle’s ability to obtain financing on acceptable terms; Li-Cycle’s ability to retain and hire key personnel and maintain relationships with customers, suppliers and other business partners; general economic conditions; currency exchange and interest rates; compensation costs; and inflation. There can be no assurance that such assumptions will prove to be correct and, as a result, actual results or events may differ materially from expectations expressed in or implied by the forward-looking statements.
Forward-looking statements involve inherent risks and uncertainties, most of which are difficult to predict and many of which are beyond the control of Li-Cycle, and which may cause actual results to differ materially from the forward-looking information. The risk factors and cautionary language discussed in this prospectus provide examples of risks, uncertainties and events that may cause actual results to differ materially from the expectations described by us in such forward-looking statements, including among other things:
| • | changes adversely affecting the industry in which we operate; |
| • | our ability to achieve our business strategies, develop our capital projects or to manage our growth; |
| • | our ability to increase recycling capacity and efficiency and maintain operations at our facilities; |
| • | maintaining our supplier and customer relationships; |
| • | our ability to raise funds for our capital requirements; |
| • | general economic conditions; |
| • | the effects of the COVID-19 pandemic on the global economy, on the markets in which we compete and on our business; |
| • | our ability to maintain the listing of our securities on NYSE; |
| • | our ability to retain our key employees; and |
| • | the outcome of any legal proceedings or arbitrations that may be instituted against us or in which we may be involved. |
These and other risks and uncertainties related to Li-Cycle’s business and the assumptions on which the forward-looking information is based are described in greater detail in the sections entitled “” and “” and elsewhere in this prospectus.
Risk Factors
Key Factors Affecting Li-Cycle’s Performance
Li-Cycle assumes no obligation to update or revise any forward-looking statements, except as required by applicable laws. These forward-looking statements should not be relied upon as representing Li-Cycle’s assessments as of any date subsequent to the date of this prospectus.
37
USE OF PROCEEDS
All of the common shares offered by the selling shareholders pursuant to this prospectus will be sold by the selling shareholders for their respective accounts. We will not receive any of the proceeds from these sales.
We will pay certain expenses associated with the registration of the securities covered by this prospectus, as described in the section titled “.”
Plan of Distribution
DIVIDEND POLICY
We have not paid any cash dividends on our common shares to date and do not intend to pay cash dividends for the foreseeable future. The payment of cash dividends in the future will be dependent upon our revenues and earnings, if any, capital requirements, any future debt agreements and general financial condition. The payment of any cash dividends will be within the discretion of our board of directors at such time.
38
CAPITALIZATION
The following table sets forth the capitalization of the Company as of April 30, 2022.
The information in this table should be read in conjunction with the financial statements and notes thereto and other financial information included in this prospectus and any prospectus supplement and the information in the section titled “.” Our historical results are not necessarily indicative of our expected results for any future periods.
Management’s Discussion and Analysis of Financial Condition and Results of Operations
(US$) | As at April 30, 2022 | |||
Cash & cash equivalents | $ | 509,315,733 | ||
Other current assets | $ | 54,641,360 | ||
Non-current assets | $ | 102,798,714 | ||
Total assets | $ | 666,755,807 | ||
Accounts payable and accrued liabilities | $ | 45,158,491 | ||
Lease liabilities | $ | 34,977,692 | ||
Loans payable | $ | 35,287 | ||
Restoration provisions | $ | 433,280 | ||
Convertible debt | $ | 88,526,371 | ||
Warrant liability | $ | — | ||
Total liabilities | $ | 169,131,121 | ||
Share capital | $ | 718,258,295 | ||
Contributed surplus | $ | 12,524,967 | ||
Accumulated deficit | $ | (233,168,290 | ) | |
Accumulated other comprehensive income | $ | (296,612 | ) | |
Equity attributable to the Shareholders of Li-Cycle Holdings Corp. | $ | 497,318,360 | ||
Non-controlling interest | $ | 306,326 | ||
Total shareholders’ equity | $ | 497,624,686 | ||
Total liabilities and shareholders’ equity | $ | 666,755,807 | ||
39
INDUSTRY AND MARKET OVERVIEW
This section provides an overview of the industry in which
Li-Cycle
previously operated and in which the Company operates subsequent to the Business Combination. References in this section to “we,” “us” or“Li-Cycle”
refer toLi-Cycle
Corp. and its subsidiaries prior to the consummation of the Business Combination and the Company and its subsidiaries subsequent to the Business Combination.Lithium-ion
Battery Recycling Market in North America and EuropeAs production and use ofbatteries and battery scrap in an environmentally friendly way.
lithium-ion
batteries has increased in recent years, manufacturers, consumers, regulators and investors have increasingly cited the importance of creating sustainable domestic recycling technologies to maximize the recovery of battery materials and minimize waste fromend-of-life
Presently, most recycling facilities use pyrometallurgy-based technologies involving heat-based operations. Many of these facilities are capital intensive due to the need to treat the emission of toxic fluorine compounds released while smelting. Hydrometallurgical processing techniques, on the other hand, employ a less energy-consuming and more environmentally friendly alternative at a lower cost.
Based on a range of inputs from independent sources, it is projected that the combined North America and Europe lithium-ion battery recycling total addressable market will grow from the current level in 2022 of more than 250,000 tonnes LIB equivalent/year to more than 800,000 tonnes LIB equivalent/year by 2025. This meaningful step change is largely driven by increased mega-factory investments by battery manufacturers to keep pace with anticipated demand from EV automotive OEMs.
The outlook for theand ultimately will be recycled.
lithium-ion
battery recycling market generally will depend on a number of factors, including how many batteries are placed in the market, remain in use, reachend-of-life,
The United States has a relatively established market for
lithium-ion
battery recycling, primarily from several small-scale recycling facilities. Fuel economy standards and their increase under the Biden administration, corresponding to high growth rates in EV sales, are expected to result in an increase inlithium-ion
recycling in the United States.Canada has a moderately established market for post-consumer battery sorting and
lithium-ion
battery recycling, primarily from several small-scale sorting and recycling facilities. Based on recycling regulations,lithium-ion
recycling is compulsory in three provinces in Canada — British Columbia, Manitoba and Quebec. The EV market continues to grow in Canada as well, where regulators and private institutions are jointly developing EV charging stations.Key Products in the North America
Lithium-ion
Battery Recycled Raw Materials MarketLithium Cobalt Oxide
Lithium Cobalt Oxide (“LCO”) has a specific energy that makes it an attractive cathode material for
lithium-ion
batteries used in mobile phones, laptops, and digital cameras. It is mostly used in consumer electronics.Lithium-iron Phosphate
Lithium-iron phosphate (“LFP”) has a moderate specific energy and is widely used for residential storage systems, such as Alpha ESS battery and Enphase battery system. LFP are environmentally friendly and cost effective, but they have the lowest resale values. At present, China is the most lucrative market for LFP recycling as these batteries are being used on a large scale in the country.
40
Lithium Nickel Cobalt Manganese Oxide
Lithium nickel cobalt manganese oxide (“NCM”) is one of the most widely used cathode chemistries in
lithium-ion
batteries. It is known to have a high capacity, high operating voltage, and relatively slow reaction time with electrolytes. There is a major shift to high nickel content NCM to reduce the content of cobalt in NCM cathode technologies. Some NCM lithium technologies used in energy storage system applications are 7 kilowatt-hour Tesla Powerwall, the LG Chem equivalent and Leclanche Apollion Cube, for example.Lithium Nickel Cobalt Aluminum Oxide
Lithium nickel cobalt aluminum oxide (“NCA”) is similar to NCM; it offers high specific energy and has high durability. NCA is extensively used by Tesla. The increasing demand for NCA technologies from the electronics industry is expected to boost demand for NCA in the global market.
Key Players in the North America
Lithium-ion
Recycling MarketIn addition to Li-Cycle, other key players in the North American lithium-ion battery recycling market are Ascend Elements, Inc., Cirba Solutions, and Redwood Materials Inc.
COVID-19
ImpactThe ongoing
COVID-19
pandemic has resulted in significant supply chain disruptions globally and continues to affectLi-Cycle’s
business.Li-Cycle’s
operations have been impacted by theCOVID-19
pandemic.Li-Cycle’s
operations have been considered an essential service in both Canada and the United States and, as a result,Li-Cycle’s
plants have continued operations during theCOVID-19
pandemic, albeit with the implementation of appropriate measures to ensure employee safety.Li-Cycle’s
operations were however impacted by theCOVID-19
pandemic in the form of operational slow-downs and interruptions caused by employee absences and mandatory quarantines resulting from actual or suspected exposure toCOVID-19.
The company has, at times, experienced slow-downs and interruptions in its battery supply chain.Li-Cycle
shut down its corporate headquarters in March 2020 and enforced a work-from-home mandate.Li-Cycle
re-opened
its corporate office facilities in November 2021. A second temporary closure ofLi-Cycle’s
corporate headquarters occurred in January 2022 related to the Omicron variant and the office subsequentlyre-opened
in February 2022.Li-Cycle
cannot currently predict the duration of the impact of theCOVID-19
pandemic on its operations. Continuing effects of theCOVID-19
pandemic, including the emergence of new strains such as the Omicron or Delta variant may cause governments to impose new restrictive measures, result in employee absences from work or result in negative economic effects, which in each case could have a material adverse impact onLi-Cycle’s
operations, development and construction activities and financial condition. See “Risk Factors — Risks Relating to
Li-Cycle’s
Business — Unfavorable economic conditions, including consequences of the globalCOVID-19
pandemic and disruptions in the global supply chain, may have a material adverse effect onLi-Cycle’s
business, results of operations and financial condition.”Regulation
There continues to be increased activity in
lithium-ion
battery regulation globally in recent years, with a continued focus to create domestic supply chains. Specifically, in the United States and Canada, various industry groups are focused on working with governments to identify opportunities to support the domestic supply of critical materials through regulation and financial support mechanisms.41
In the European Union, the proposed updates to the EU Battery Directive to implement more aggressive recycling targets continue to progress. The targets include minimum material recovery rates of 90% for both cobalt and nickel by 2025 (also a potential ‘high level of ambition’ mandate for at least a 95% material recovery rate for both cobalt and nickel by 2030; this is being discussed as part of the proposed regulation), a minimum recovery rate of 35% for lithium by 2025 (also a potential ‘high level of ambition’ mandate for at least a 70% material recovery rate for lithium by 2030; this is being discussed as part of the proposed regulation), and a Recycling Efficiency Rate of least 65% by 2025 (also includes a potential ‘high level of ambition’ mandate for a Recycling Efficiency Rate of at least 70% by 2030; this is being discussed as part of the proposed regulation).
Li-Cycle
holds all licenses currently required in connection with its technologies and operations.Li-Cycle
has engaged a third-party consultant to work with a dedicated team across allLi-Cycle
projects, supporting it with permitting and regulatory compliance, and keeping it apprised of all regulatory changes and regulations applicable to it.42
BUSINESS
Shareholders should read this section in conjunction with the other sections of this prospectus, including our audited financial statements and the section titled “Management’s Discussion and Analysis of Financial Condition and Results of Operations.”
General
Li-Cycle
is an industry leader inlithium-ion
battery resource recovery and the leadinglithium-ion
battery recycler in North America. When we refer to ourselves as the leadinglithium-ion
battery recycler in North America, we are referring to our status based on installed permitted capacity forlithium-ion
battery recycling measured in tonnes per year. Our proprietary “Spoke & Hub” recycling and resource recovery process is designed (a) at our Spokes, to process battery manufacturing scrap andend-of-life
Li-Cycle
was founded in 2016 by our chief executive officer, Ajay Kochhar, and executive chair, Tim Johnston, with the mission of solving the global disposal problem forend-of-life
lithium-ion
batteries and battery manufacturing scrap while simultaneously creating a secondary source of critical battery materials. By providing an “urban mining” solution,Li-Cycle
seeks to offer an alternative to raw materials sourced through traditional global mining practices.We pioneered what we believe to be an innovative and scalable metallurgical processing method with our Spoke & Hub Technologies. We expect to make a valuable contribution to the EV industry and the world’s transition to a circular economy by offering an environmentally friendly recycling solution to energy-intensive pyrometallurgical processing methods. We believe our production costs are on average lower than the mining and processing costs otherwise incurred by suppliers to produce these materials because we are able to produce multiple materials from a single process and because our process yields minimal waste and no displaced earth or tailings, as compared to traditional mining processes. Bymanufacturing phases in both an environmentally and what we believe to be an economically sustainable manner.
re-inserting
critical materials back into thelithium-ion
battery supply chain, we are able to effectively close the loop between the beginning andend-of-life
Lithium-ion
batteries are increasingly powering products and solutions in a range of industries, including consumer electronics and EVs. Our sources of recycling feed are derived primarily from three key sources: 1) battery manufacturing scrap; 2)end-of-life
lithium-ion
batteries; and 3) damaged, defective, or recalledlithium-ion
batteries.43
An overview of the industries in which
lithium-ion
batteries are utilized is set forth below: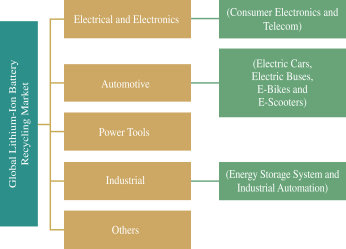
Source: Expert Interviews, Secondary Research, and BIS Research Analysis
History and development of the Company
General
Li-Cycle
Holdings Corp. was incorporated on February 12, 2021 under the laws of the Province of Ontario, Canada as a corporation solely for the purpose of effectuating the Business Combination, which was consummated on August 10, 2021. It is governed by Articles of Amalgamation dated August 10, 2021.Our principal executive office is located at 207 Queen’s Quay West, Suite 590, Toronto, Ontario, Canada and our phone number is (877)
542-9253.
Our agent for service of process in the United States is Puglisi & Associates located at 850 Library Avenue, Suite 204, Newark, DE 19711.The SEC maintains an Internet site that contains reports, proxy and information statements, and other information regarding issuers that file electronically with the SEC, which is accessible at http://www.sec.gov.
Our principal website address is
http://www.li-cycle.com.
The information contained on our website does not form a part of, and is not incorporated by reference into, this prospectus.Business Combination
On August 10, 2021,(Ontario) (the “Arrangement”). Pursuant to the Business Combination,
Li-Cycle
Corp.,Li-Cycle
Holdings Corp. (a wholly-owned subsidiary ofLi-Cycle
prior to the Business Combination) and Peridot Acquisition Corp. (“Peridot”) completed the Business Combination pursuant to a plan of arrangement under theBusiness Corporations Act
Li-Cycle
Corp. became a wholly-owned subsidiary ofLi-Cycle
Holdings Corp.Upon the closing of the Business Combination and a concurrent $315.5 million private placement of common shares (the “PIPE Financing”), the combined company received $581.9 million of gross transaction proceeds, before deduction of $29.6 million of Peridot’s transaction costs and $27.0 million of
Li-Cycle’s
transaction costs.44
Our Strategy
Our goal is to be a leading global recycler of
lithium-ion
batteries and battery scrap and producer of key battery grade materials.Li-Cycle
has developed atwo-phased
strategy, positioned to grow in lockstep with the electrification supply chain. In the first phase,Li-Cycle
plans to expand its network in line with the manufacturing oflithium-ion
batteries, by utilizing the resulting manufacturing scrap or yield loss as a key base-load of supply forLi-Cycle’s
facilities. In the second phase,Li-Cycle
plans to leverage its global network established predominantly on the basis of manufacturing scrap to position itself as the leader for the processing ofend-of-life
lithium-ion
batteries. We are executing on our plan to construct a network of Spokes located at regionally optimized locations that reduce safety risk and costs associated with battery transport to our Spokes. We are also executing on our plan to construct centralized, large-scale Hubs to maximize economies of scale and efficiencies, with our first commercial Hub being under construction in Rochester New York. Our Hub facilities will process an intermediate product (black mass) from our Spokes, as this is significantly easier and safer to transport than batteries.We are evaluating additional global opportunities to scale our operations with a range of potential partners and expansion opportunities that may include acquisitions, joint ventures or other commercial arrangements in North America, Europe and Asia Pacific. We seek to partner with multiple customers in each geography in connection with supply and
off-take
arrangements. Near tomid-term,
our growth strategy is to focus on North America and Europe, aligning with leading global customer demand needs. During this period, we also expect to assess the potential for investments in the Asia Pacific region.Our Industry
Li-Cycle
is at the intersection of three broad and accelerating trends that we believe are key drivers for successful movement toward azero-carbon
economy: the EV revolution; sustainability with emphasis on a circular economy; and localized investments in battery production to establish and grow sustainable domestic supplies of strategic battery materials.As battery manufacturers and automotive OEMs in the lithium-ion battery supply chain increasingly establish localized operations in North America and Europe, we expect increased quantities of battery manufacturing scrap and end-of-life batteries available for recycling. Based on industry and external sources and our internal estimates, we project that from 2022 to 2025, the mega-factory capacity in North America will grow from more than 50 GWh to >600 GWh and in Europe to grow from more than 50 GWh to >650 GWh.
45
Our Integrated Spoke & Hub Technologies
Li-Cycle’s
operating model enables a circular loop in the EV battery value chain, as shown in the chart below: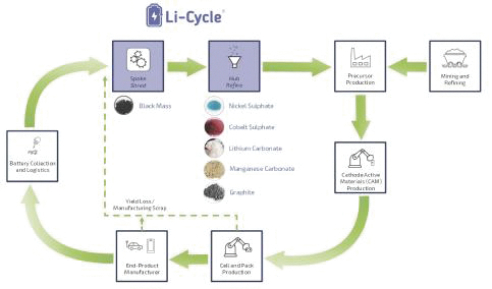
Under ourbatteries and battery-related waste are first shipped to Spoke locations, where the materials are mechanically processed into several intermediate products, including black mass. Black mass from several Spoke locations will be received at a Hub location and put through a hydrometallurgical (or “wet chemistry”) process to produce end products, such as nickel sulphate, cobalt sulphate and lithium carbonate, which can be sold back into the battery supply chain and used in the manufacturing of new
two-part
Spoke & Hub process,end-of-life
lithium-ion
batteries.Utilizing our Hub & Spoke Technologies
™
, we are able to achieve a Recycling Efficiency Rate of up to 95%. Ourtwo-stage
battery recycling model enables our customers to benefit from a safe and environmentally friendly solution for recycling all types oflithium-ion
batteries andlithium-ion
battery materials.We have a market-leading position in North America through our two operational Spokes in Kingston, Ontario (the “Ontario Spoke”) and Rochester, New York (the “New York Spoke”), respectively. A third Spoke in Gilbert, Arizona opened on May 17, 2022 (the “Arizona Spoke”). We are currently developing our first commercial-scale Hub in Rochester, New York (the “Rochester Hub”). We have also announced the development and construction of an additional Spoke near Tuscaloosa, Alabama (the “Alabama Spoke”). Further, we have announced the development of a
co-located
Spoke with a strategic industry partner in Warren, Ohio (the “Ohio Spoke”) and our first two European Spokes in Norway (the “Norway Spoke”) and Germany (the “Germany Spoke”).Spokes
At our Spokes, batteries for recycling are broken down through a mechanical size reduction process known as shredding and separated into three “intermediate” product lines: black mass, mixed copper/aluminum and mixed plastics. Black mass is a powder-like substance, which contains a number of valuable metals, including nickel, cobalt and lithium. Based on the Product Recovery Percentage, more than 95% of the mass of batteries and battery scrap entering the recycling process is transformed through our Spokes into these intermediate products.
46
We intend to construct a global network of Spokes located at regionally optimized locations near sources of battery manufacturing scrap and
end-of
life batteries to reduce safety risk and costs associated with battery transport to our Spokes. We are strategically locating our Spokes close to our existing customers, and at the nexus of where we expect there will be continued growth of batteries and battery scrap available for recycling.Hubs
At our Hub facilities, black mass from the Spokes will be separated through the hydrometallurgical circuit to produce individual raw materials with the purity levels required of raw materials to be used in battery production. The end products produced from black mass will include nickel sulphate, cobalt sulphate and lithium carbonate.
Our hydrometallurgical process is more efficient and more environmentally friendly than traditional pyrometallurgical processes, which involve volatizing or burning materials at high temperatures. Pyrometallurgical processes also have lower recovery rates, are carbon-intensive and generate harmful emissions. Accordingly, the hydrometallurgical process is expected to become the preferred approach to
lithium-ion
battery recycling among manufacturers who are focused on product stewardship and environmental sustainability.We expect to construct and operate two types of Hubs. A ternary Hub, such as the Hub we are currently constructing in Rochester, New York, will process all types of black mass. A lithium ion phosphate (“LFP”) Hub will have the capacity to process all types of black mass, but will have dedicated capacity to process LFP black mass derived from LFP
lithium-ion
batteries, LFPlithium-ion
battery materials, and LFP black mass to produce LFP cathode pertinentend-products
(e.g., lithium carbonate). LFPlithium-ion
batteries have historically been viewed by the market as more difficult to recycle than otherlithium-ion
batteries; we intend to address this deficiency by providing the industry the ability transformLFP-containing
lithium-ion
batteries into a valuable resource through our LFP Hubs.Our Broad and Diversified Intake and
Off-Take
Commercial ContractsBattery Intake Sources
We have commercial contracts with leaders in the EV andbatteries. We currently have over 100 suppliers ofEV batteries to be available for recycling by 2025.
lithium-ion
battery ecosystem, including consumer electronics, manufacturing scrap, energy storage, and automotive OEMs/transportation companies.Li-Cycle
procures all aspects oflithium-ion
battery material sources in the supply chain, including battery manufacturing scrap, battery recalls, andend-of-life
end-of-life
lithium-ion
batteries and battery manufacturing scrap, predominantly in North America, compared to 35 suppliers in fiscal year 2020. As the market for EVs grows and drives increased manufacturing oflithium-ion
batteries in North America, we anticipate higher supplier volumes of manufacturing scrap and increasing numbers ofend-of-life
47
The chart below shows our battery supply intake sources in FY 2021:
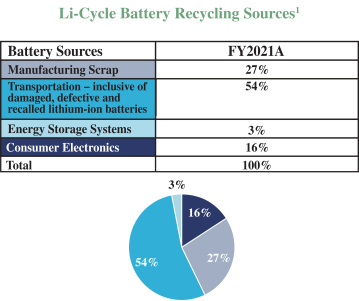
| 1. | Measured by weight of battery materials |
Black Mass Offtake Agreement with Traxys
Li-Cycle
has entered into a strategic marketing relationship with Traxys, a company that provides financial and logistics solutions to the metals, mining and energy industries. As part of this relationship,Li-Cycle
has entered into a Black Mass Marketing, Logistics and Working Capital Agreement with Traxys, covering 100% of its production of black mass from its North American Spokes, until such time as this material is integrated byLi-Cycle
into the supply chain forLi-Cycle’s
Hubs. Traxys earns marketing fees under the agreement, based on the final sales price of the black mass sold by Traxys to its third-party customers, as well as interest on provisional payments made from Traxys toLi-Cycle.
Prices are based on index pricing for the nickel and cobalt contained in the black mass.Refined Products Offtake Agreement with Traxys
Li-Cycle
has also entered into a Refined Products Marketing, Logistics and Working Capital Agreement with Traxys, covering 100% of its production of certain end products from the Rochester Hub, consisting of nickel sulphate, cobalt sulphate, lithium carbonate, manganese carbonate and graphite concentrate. The Hub products agreement extends for a term expiring seven years after the achievement of certain commercial production milestones at the Rochester Hub, and is therefore expected to extend to 2030. Traxys earns marketing fees under the agreement, based on the final sales price of the black mass sold by Traxys to its third-party customers, as well as interest on provisional payments made from Traxys toLi-Cycle.
Prices are based on index pricing for the relevant products, adjusted for the product form (e.g., adjusted to reflect the pricing for the premium battery grade nickel sulphate form, relative to the relevant index pricing which is for nickel metal). Commercial terms between Traxys and its third-party customers are arranged in advance, transparent toLi-Cycle
and based on the commodity prices for the metals contained in theLi-Cycle
products.When the Rochester Hub commences commercial production,
Li-Cycle
expects that sales of refined products through Traxys will represent the significant majority of its revenues.48
Glencore Commercial Agreements
On June 1, 2022, the Company announced the entry into commercial agreements (collectively, the “Commercial Agreements”) with Glencore, including the Master Commercial Agreement, the Amended & Restated Global Feed Sourcing Agreement, the Black Mass Sourcing Agreement, the Sulfuric Acid Supply Agreement, the Black Mass Offtake Agreement, the End Products Offtake Agreement and the
By-Products
Offtake Agreement.Subject to existing commitments of the Company and other exceptions (including materials required for the Company’s operations), under the terms of the Commercial Agreements, Glencore will source and supply
lithium-ion
battery manufacturing scrap and otherlithium-ion
battery materials to the Company for use at the Company’s Spokes; Glencore will source and supply black mass to the Company for use at the Company’s Hubs; Glencore will supply sulfuric acid for use at the Company’s Hubs; and Glencore will purchase, for its internal consumption oron-sale
to third party end customers, black mass, battery-grade end products and certainby-products
produced at the Company’s Spokes and Hubs. Pursuant to the Commercial Agreements, Glencore will earn (i) sourcing fees on all feed flowing into the Company’s Spokes; (ii) sourcing fees on all third party black mass flowing into the Company’s Hubs; (iii) marketing fees on all black mass flowing out of the Company’s Spokes and not flowing into the Company’s Hubs; and (iv) end products marketing fees on all end products flowing out of the Company’s Hubs or any third party processing sites that the Company may utilize.The term of the Amended and Restated Global Feed Sourcing Agreement commenced on May 4, 2022 and the term of the other Commercial Agreements will commence on August 1, 2022. The term of each Commercial Agreement will, unless earlier terminated in accordance with the termination provisions of the Master Commercial Agreement, continue until the later to occur of (i) ten years from the date on which the Company’s next Hub (after the completion of the North America Hub under construction in Rochester, New York) achieves a specified level of commercial production, and (ii) the date by which such Hub has processed a minimum quantity of black mass. The term of the Commercial Agreements will automatically renew on an evergreen basis for subsequent terms of five years after the expiry of the initial term, subject to the Company’s right to terminate all (but not less than all) of the Commercial Agreements upon 365 days’ prior notice to Glencore and payment of a termination fee based upon five times the aggregate value of the sourcing and marketing fees and certain other amounts invoiced in the preceding twelve months.
Our Competitive Strengths
Customer-Centric Solutions Provider
We provide sustainable and customer-centric solutions for each of our customers’ battery recycling needs. We provide the support necessary along each step of the process to ensure that our customers’ battery recycling experience is handled in a manner that is safe, professional, and economically viable. In particular,
| • | we work closely with a reliable network of logistics partners to support customers in transporting their batteries to our facilities; |
| • | we offer our customers a home for the secure destruction of materials containing IP-sensitive design information, such as research and development batteries and battery materials. We have adopted procedures to protect the privacy and confidentiality of our customers’ trade secrets; and |
| • | in addition to providing advice on packaging and support with procurement, we provide spare battery storage, manage comprehensive battery replacement campaigns and customize programs and services to individual customers’ needs. |
Proprietary and Innovative Technology
We have established proprietary technology that we believe sets us apart from competitors because our technology has the ability to respond to changes in battery chemistries and adapt to change in inputs to the
49
battery recycling process. Our process produces the fundamental building blocks ofrecycling produce
lithium-ion
batteries—cathode precursor input chemicals, cathode input chemicals and raw materials that can be reused in batteries or the broader economy. By contrast, competitive emerging technologies such ascathode-to-cathode
end-products
that have a higher risk of obsolescence due to continuous cathode technology advancement.Research and Development
Our highly experienced technical team is continuously engaged in research and development (“R&D”) efforts to expand the scope of our processing capacities and drive other process improvements.
R&D work continues in support of our Spoke facilities, specifically focused on optimizing their operating parameters. For example, certain of our Spokes are being engineered to process entire vehicles battery packs, without dismantling, while other Spokes will focus on processing manufacturing scrap. With respect to our Hub facilities, we also continue to develop and evaluate new concepts with an eye to the future, including processing nickel metal hydride, LFP and solid-state batteries.
Leading Environmental Footprint
Due to our high recovery rates and sustainable, environmentally-friendly processes, we believe we are well-positioned to comply with heightened regulations applicable to us across the globe.
Unlike conventional pyrometallurgy processes, our hydrometallurgical process is designed for “best in class” environmental performance, with minimal solid waste streams to landfill, zero wastewater discharge, and relatively low air emissions. This has been a competitive advantage in terms of conforming to the requirements for municipal, state, and federal permitting processes associated with the development of our Spokes and Hub, as well as meeting our customers’ mandates for quality and sustainability.
In 2021,
Li-Cycle
received the 2021 Big Innovation Award presented by Business Intelligence Group, and it was named to the World Circular Economy Forum’s list of Circular Economy Solutions Inspiring the World. In addition, for three years in a row (2020, 2021 and 2022),Li-Cycle
was named as a Global Cleantech 100 Company by the Cleantech Group and was also a finalist in the 10th Annual Business Green Leaders Awards.Minimal Human Operating Risk
Unlike smelting, thermalprocesses, our processes have minimal human operating risk. Our Spokes can safely process
pre-treatment
refining, orcathode-to-cathode
lithium-ion
batteries at any state of charge, without any manual sorting, discharging, or dismantling required. In addition, our Spokes reduce the size of battery mass through an automated process, minimizing human operating risk.Superior Recycling Recovery Rates and More Economical Supplier
Ourbatteries and reduces waste.
wet-chemistry
method is able to extract valuable battery-grade materials from black mass that are directlyre-usable
in the manufacturing of new battery technologies. In the short term, this increases the value that we derive from battery manufacturing scrap as well asend-of-life
We expect our production costs on average to be lower than the mining and processing costs otherwise incurred by suppliers to produce these battery-grade materials because we are able to produce multiple materials from a single process that yields minimal waste and no displaced earth or tailings, as compared to traditional mining processes.
50
Investment by and Strategic Partnerships with Key Global Players
We believe that the investment by and strategic partnerships we have established with leading global players in the
lithium-ion
battery materials space, as described below, represent a strong validation of our business model:Glencore
On May 5, 2022, the Company announced the entry into a global feedstock supply agreement with Glencore Ltd. (“Glencore”) pursuant to which Glencore will supply manufacturing scrap and” for more information about the Glencore Convertible Note.
end-of-life
lithium-ion
batteries to the Company on a global basis. The Company also announced the entry into a note purchase agreement with Glencore (the “Glencore Note Purchase Agreement”) pursuant to which the Company issued to Glencore on May 31, 2022, an unsecured convertible note in the aggregate principal amount of $200,000,000, in a transaction exempt from registration under the Securities Act of 1933, as amended (the “Glencore Convertible Note”). See “— Recent Developments — Strategic Partnership with Glencore — Glencore Convertible Note
On May 31, 2022,
Li-Cycle
entered into certain long-term commercial agreements with Glencore (the “Commercial Agreements”). Subject to existing commitments of the Company and other exceptions (including materials required for the Company’s operations), under the terms of the Commercial Agreements, Glencore will source and supplylithium-ion
battery manufacturing scrap and otherlithium-ion
battery materials to the Company for use at the Company’s Spokes; Glencore will source and supply black mass to the Company for use at the Company’s Hubs; Glencore will purchase, for its internal consumption oron-sale
to third party end customers, black mass, battery-grade end products and certainby-products
produced at the Company’s Spokes and Hubs; and Glencore will supply sulfuric acid for use at the Company’s Hubs. Pursuant to the Commercial Agreements, Glencore will earn (i) sourcing fees on all feed flowing into the Company’s Spokes; (ii) sourcing fees on all third-party black mass flowing into the Company’s Hubs; (iii) marketing fees on all black mass flowing out of the Company’s Spokes and not flowing into the Company’s Hubs; and (iv) marketing fees on all end products flowing out of the Company’s Hubs or any third party processing sites that the Company may utilize. The term of the Amended and Restated Global Feed Sourcing Agreement commenced on May 4, 2022 and the term of the other Commercial Agreements will commence on August 1, 2022.LG Chem (“LGC”) and LG Energy Solution (“LGES”)
In December 2021,
Li-Cycle,
LGC and LGES announced their intention to enter into a manufacturing scrap supply and nickel sulphateoff-take
agreement, pursuant to anon-binding
letter of intent. On April 20, 2022, a subsidiary of the Company entered into a scrap offer agreement with LGES pursuant to which the Company will have the opportunity to recycle nickel-bearinglithium-ion
battery manufacturing scrap and otherlithium-ion
battery material from LGES’s North American manufacturing sites. In addition, on April 20, 2022, a subsidiary of the Company entered into nickel sulphate offtake agreements with each of LGES and LGC pursuant to which the Company will allocate for sale, through itsend-product
offtake partner, Traxys, a combined initial allocation of 20,000 tonnes of nickel contained in nickel sulphate produced at the Company’s Hub facility currently under construction in Rochester, New York, to LGC and LGES over 10 years. These agreements will enable a closed-loop ecosystem for LGC and LGES for key materials in the lithium battery supply chain.On December 13, 2021,
Li-Cycle
entered into subscription agreements with each of LGES and LGC, each of which were subsequently amended and restated on March 11, 2022 and April 21, 2022 (the “LG Subscription Agreements” and each, an “LG Subscription Agreement”), pursuant to which each of LGES and LGC agreed, subject to the satisfaction of certain conditions, to subscribe for an equal number of the Company’s common shares in transactions exempt from registration under the Securities Act (the “LG Subscription”). The LG Subscription was completed on May 11, 2022 and consisted of the issuance by the Company in accordance with the LG Subscription Agreements of (i) an initial tranche of 4,416,960 common shares, in the aggregate, at a price51
of $10.00 per share, for an aggregate initial tranche subscription price of approximately $44.2 million, and (ii) a second tranche of 883,392 common shares, in the aggregate, at a price of $6.60 per share (based on the volume-weighted average trading price of the Company’s common shares for the 5 trading days ending immediately prior to April 29, 2022), for an aggregate second tranche subscription price of approximately $5.8 million, for a total investment of $50.0 million. See “” and “” for more information about the equity investment and related standstill agreement.
Description of Securities
—
Registration Rights — LG Subscription Agreements
Description of Securities — Registration Rights — LG Standstill Agreement
Koch Strategic Platforms (“KSP”)
KSP, a subsidiary of Koch Investments Group, through its affiliate, Wood River Capital, LLC, has invested $100 million in” for more information about the 2021 Convertible Notes and related KSP Standstill Agreement. We believe this strategic investment by KSP will provide
Li-Cycle
pursuant to a convertible note to support the Company’s growth opportunities in North America, Europe and Asia Pacific. See “Management’s Discussion and Analysis of Financial Condition and Results of Operations — Liquidity and Capital Resources — Debt Obligations
Li-Cycle
with access to key industry expertise and commercial opportunities across the broader Koch Industries ecosystem.Well Positioned for Governmental “Green” Financing Partnerships
With the emergence of government initiatives to accelerate the development of the circular economy and EV adoption, significant programs are underway to support the development of domestic critical material supply in the North American market. With our first mover technology and environmental advantages, we believe we are well positioned to explore various green financing opportunities from government or financial institutions supporting cleantech infrastructure in North America.
Li-Cycle
has also historically built strong relationships with various government agencies.Intellectual Property
As of April 30, 2022,
Li-Cycle
has a total of 39 pending utility patent applications and issued utility patents, grouped into six patent families based on common priority details, which cover aspects ofLi-Cycle’s
innovative technologies and include issued patents or pending patent applications in Australia, Canada, China, Europe, Hong Kong, Japan, South Korea, United States, Belgium, Germany, France, United Kingdom, Netherlands, Sweden, Spain, Italy, Switzerland, Estonia, Finland, Croatia, Hungary, Norway, Poland and the World Intellectual Property Office. These applications and patents have filing dates between 2018 and 2021, and therefore will expire between 2038 and 2041.All patents and patent applications are 100% owned by
Li-Cycle.
Our Vision, Mission and Commitment to Environmental, Social and Governance Leadership
Our vision is to be the world’s most sustainable, vertically-integrated and globally
pre-eminent
lithium-ion
battery recycling and resource recovery company. Our mission is: (i) to provide sustainable and safe customer-centric solutions and technology to solve the globalend-of-life
lithium-ion
battery challenge, and (ii) to meet the rapidly growing demand for criticallithium-ion
battery materialsBy supporting the
lithium-ion
battery materials supply chain with an innovative recycling solution, we believe we are contributing to the global “green energy” transition and the movement toward azero-carbon
economy. We believe that environmental, social and governance (“ESG”) leadership is important to the success of our business model and intend to develop corporate policies and business practices to support these values.Our Focus on Quality and Sustainability
We have instituted an Integrated Business Policy to guide our actions on health and safety, environmental and quality practices.
52
Our Kingston, Ontario and Rochester, New York sites are registered to ISO (“International Standards Organization”) 9001 quality standards, ISO 14001 environmental standards, ISO 45001 occupational health & safety standards and the Responsible Recycling (“R2”) electronics recycling standard. Our corporate headquarters location in Toronto, Ontario has not been registered to these standards, given that no direct recycling operations are conducted at this location.
We prioritize the safety of our employees, suppliers, contractors and visitors. We aim for a
“zero-harm”
workplace and ensure compliance with all applicable occupation health and safety laws, regulations and standards in the jurisdictions in which we operate. We provide training to our employees on quality, health and safety and environmental and R2 requirements. We also ensure that our equipment is equipped with safety instructions, allot the time to practice emergency procedures and expect our managers and employees to maintain clean and well-organized facilities.Regulatory Landscape
There continues to be increased activity in
lithium-ion
battery regulation globally in recent years, with a continued focus to create domestic supply chains. Specifically, in the United States and Canada, various industry groups are focused on working with governments to identify opportunities to support the domestic supply of critical materials through regulation and financial support mechanisms.In the European Union, the proposed updates to the EU Battery Directive to implement more aggressive recycling targets continue to progress. The targets include minimum material recovery rates of 90% for both cobalt and nickel by 2025 (also a potential ‘high level of ambition’ mandate for at least a 95% material recovery rate for both cobalt and nickel by 2030; this is being discussed as part of the proposed regulation), a minimum recovery rate of 35% for lithium by 2025 (also a potential ‘high level of ambition’ mandate for at least a 70% material recovery rate for lithium by 2030; this is being discussed as part of the proposed regulation), and a Recycling Efficiency Rate of least 65% by 2025 (also includes a potential ‘high level of ambition’ mandate for a Recycling Efficiency Rate of at least 70% by 2030; this is being discussed as part of the proposed regulation).
We believe
Li-Cycle
is well-positioned to comply with heightened battery regulations across the globe.Li-Cycle
holds all licenses currently required in connection with its technologies and operations.Li-Cycle
has engaged a third-party consultant to provide support with permitting and regulatory compliance across allLi-Cycle
products, and to updateLi-Cycle
regularly regarding legal and regulatory developments applicable to its business.While competitors face challenges adapting to increasingly stringent environmental regulations,
Li-Cycle’s
technologies are sustainable and attractive to a growing number ofESG-focused
clients.Li-Cycle’s
scalable, sustainable, safe and patented Spoke & Hub Technologies enable an up to 95% Spoke Recycling Efficiency Rate, produce minimal solid waste or wastewater, zero impact air emissions, and use far less energy than any other existing solution. By contrast, other hydrometallurgical technologies often have significant water emissions and solid waste streams, while smelting or thermal processing typically involves the burning oflithium-ion
batteries that produces toxic emissions in theoff-gas.
The emissions caused by competitor methods present regulatory compliance challenges and complicate facility permitting. We believe that this provides a significant opportunity forLi-Cycle
with a truly differentiated hydrometallurgical process.Government mandates also continue to drive increased infrastructure spending and funding availability for the battery supply chain. In the United States, the Biden Administration announced it will make a $2 trillion investment in infrastructure, including investments in the clean energy economy.
Employees
As of April 30, 2022, we had over 279 employees, including 37 employees at our Arizona Spoke, which commenced operations in May 2022. The majority of our employees are employed on a full-time basis and are primarily located in Toronto, Ontario; Kingston, Ontario; Rochester, New York; and Gilbert Arizona.
53
As we continue to grow our Spoke & Hub network, we anticipate adding additional employees. We expect that our recently announced Spoke facilities in Alabama, Ohio, Norway and Germany will require at least 35 employees each once operational.
We expect that the Rochester Hub will result in over 200 additional employment positions once operational.
Our success is highly dependent on our human capital and leadership team. We have talent acquisition strategies in place to attract, retain and develop employees with the skills, experience and potential necessary to implement our growth strategy.
Our culture aims to promote an “owner’s mindset” that empowers employees to deliver a high level of performance and to honor our corporate values, including ethics and integrity, courage and passion, and innovation and creativity. When recruiting and onboarding new employees, we communicate our vision and the core values that we expect all staff to uphold, which is underpinned by a business-wide Code of Conduct and Ethics supported by appropriate training programs. We regularly engage with staff on issues affecting the business through group-wide and location-specific
“all-hands”
and “town hall” sessions and other engagement platforms.None of our employees are represented by a labor union and there have been no work stoppages to date. We generally consider relations with our employees to be good.
Legal Proceedings
From time to time, we are subject to various litigation and regulatory proceedings arising in the normal course of business. Where it is determined, in consultation with counsel based on litigation and settlement risks, that a loss is both probable and estimable, we establish an accrual. We expect that we may not be able to predict with certainty the outcome of any litigation or the potential for future litigation. We expect to continuously monitor any proceedings as they develop and adjust any accrual or disclosure as needed. Regardless of the outcome, litigation could have an adverse impact on us due to defense costs, diversion of management resources, potential reputational harm and other factors, and it could have a material effect on our results of operations for a given reporting period.
On April 19, 2022, a putative securities class action lawsuit was filed in the U.S. District Court for the Eastern District of New York against the Company, its CEO, and its former CFO, on behalf of a proposed class of purchasers of the Company’s publicly traded securities during the period from February 16, 2021 through March 23, 2022. The complaint, which is captioned as Barnish v. Li-Cycle Holdings Corp., et al., 1:22-cv-02222 (E.D.N.Y.), asserts claims under Sections 10(b) and 20(a) of the Exchange Act and alleges that the defendants issued false and misleading statements concerning Li-Cycle’s business, which were revealed when Blue Orca Capital published a short seller report on March 24, 2022. The complaint seeks compensatory damages and an award of costs. On July 22, 2022, the court appointed The Lanigan Group Inc. as lead plaintiff. The Company believes that the allegations in the proposed claim are without merit and intends to vigorously defend against this matter. No amounts have been recorded for any potential liability arising from this matter. See also Note 17 in our financial statements for the six months ended April 30, 2022 and 2021.
Property, Plants and Equipment
Spokes
Li-Cycle
opened its first pilot facility in Canada in 2017, which had a recycling capacity of 50 tonnes oflithium-ion
battery equivalent feed per year. In 2018, it launched its first Spoke & Hub demonstration facility in Kingston, Ontario.Li-Cycle
commissioned its first commercial Spoke facility in 2019 in Kingston, Ontario, with a recycling capacity of 2,500 tonnes per year, and upgraded this facility to 5,000 tonnes per year in 2020. In late 2020,Li-Cycle
opened a second commercial Spoke facility with a recycling capacity of 5,000 tonnes per year, in Rochester, New York.54
In the first quarter of 2021,
Li-Cycle
announced the development and construction of the Arizona Spoke, and in the fourth quarter of 2021,Li-Cycle
announced the development of the Alabama Spoke. Each of these Spokes will have a recycling capacity of 10,000 tonnes per year. In May 2022,Li-Cycle
announced the commencement of operations at the Arizona Spoke.On January 26, 2022,
Li-Cycle
entered into a joint venture agreement with ECO STOR AS (“ECO STOR”) and Morrow Batteries AS (“Morrow”) to formLi-Cycle
Norway AS through which it will construct a new commerciallithium-ion
battery recycling facility in southern Norway.Li-Cycle
is the majority owner ofLi-Cycle
Norway AS, with ECO STOR and Morrow being minority owners and Nordic-headquartered strategic partners. Once constructed, the Norway Spoke is expected to have a recycling capacity of 10,000 tonnes (2 GWh equivalent) oflithium-ion
batteries per year, including battery manufacturing scrap, full EV packs, and energy storage systems. We have leased a site in Moss, Norway, approximately 60 kilometers from Oslo, for our Norway Spoke and the facility is expected to be operational in 2023.On January 27, 2022,
Li-Cycle
announced the development of the Ohio Spoke at Ultium Cells LLC’s battery cell manufacturing mega-factory in Warren, Ohio. The Ohio Spoke is expected to be operational in 2023. Once completed, we expect the Ohio Spoke to have a recycling capacity of 15,000 tonnes per year.On January 27, 2022,
Li-Cycle
also announced the development of a second European Spoke in Germany. The Germany Spoke is expected to have a recycling capacity of 10,000 tonnes per year, and is expected to be operational during 2023. We have leased a site in Magdenburg, Germany, approximately 160 kilometers from Berlin, for our Germany Spoke.Rochester Hub
Li-Cycle’s
first commercial Hub will be located in Rochester, New York, and is currently under construction (the “Rochester Hub”). The location for the Rochester Hub was specifically selected due to the nature of the infrastructure available at the site, including utilities and road/rail networks.Li-Cycle’s
Spoke facilities in North America will be the primary suppliers of feedstock known as black mass for the Rochester Hub.Li-Cycle
expects that the Rochester Hub will result in over 200 additional employment positions at its operations.Li-Cycle completed a definitive feasibility study for the Rochester Hub in December 2021. Based on the definitive feasibility study, Li-Cycle estimates that the Rochester Hub will be able to process battery material that is equivalent to approximately 225,000 EVs per year. Li-Cycle expects the Rochester Hub will have the nameplate input capacity to process 35,000 tonnes of black mass annually (equivalent to approximately 90,000 tonnes or 18 GWh of lithium-ion battery equivalent feed annually), resulting in expected output capacity of approximately 42,000 to 48,000 tonnes per annum of nickel sulphate, 7,500 to 8,500 tonnes per annum of lithium carbonate and 6,500 to 7,500 tonnes per annum of cobalt sulphate. Li-Cycle estimates that the Rochester Hub will require a total capital investment of approximately $485 million (+/-15%), based on the results of the definitive feasibility study, which can be funded from existing balance sheet cash and cash equivalents.
Li-Cycle
has engaged Hatch Ltd. as its engineering and procurement contractor. Hatch Ltd. is also providing select construction management services such as onsite field engineering support and overall project scheduling for the Rochester Hub. Procurement activities have commenced on all equipment and select construction materials for the Rochester Hub.Li-Cycle
commenced construction on the Rochester Hub site in January 2022 and has engaged Mastec Inc. as its general contractor. The Company expects the Rochester Hub to commence commissioning in phases in calendar 2023.As of April 30, 2022,
Li-Cycle
had spent approximately $45.4 million on the engineering, construction and development of the Rochester Hub.55
Li-Cycle
has been granted a special permit, overall site plan approval, and a special use permit with an area variance for hazardous material storage tanks from the Town of Greece, New York, all subject to certain conditions. The New York State Environmental Quality Review Act (“SEQRA”) process was completed in November 2021. The New York State Department of Environmental Conservation (“NYSDEC”) issued a state facility air permit for the expected emissions from the Rochester Hub in March 2022, which is a key permitting step to advance the construction process from earthworks to the construction of permanent infrastructure.The remaining anticipated regulatory and other approvals required to develop and construct the Rochester Hub consist of construction and building permits from the Town of Greece, as well as the monitoring of storm water discharge, chemical bulk storage registration, and petroleum bulk storage registration all granted by the NYSDEC.
Leases
We lease the following properties as of April 30, 2022:
Gross Floor Area (square foot) | Lease period | |||||||||||||||
Country | Location | Use | Start | End | ||||||||||||
Canada | Millhaven, Ontario | 46,639 | Construction of new spokes | 7/1/2021 | 6/30/2024 | |||||||||||
Canada | Toronto, Ontario | 31,762 | Office | 6/1/2021 | 5/31/2031 | |||||||||||
United States of America | Cottondale, Alabama | 120,000 | Storage | 11/1/2021 | 12/31/2023 | |||||||||||
United States of America | North Port, Alabama | 108,469 | Plant | 7/1/2022 | 6/30/2042 | |||||||||||
United States of America | Gilbert, Arizona | 138,949 | Plant | 10/1/2021 | 2/28/2032 | |||||||||||
United States of America | Mesa, Arizona | 69,016 | Storage | 9/1/2021 | 11/30/2026 | |||||||||||
United States of America | Greece, New York | 63,901 | Plant | 7/1/2019 | 6/30/2029 | |||||||||||
United States of America | Webster, New York | 37,231 | Storage | 4/1/2020 | 3/31/2025 | |||||||||||
United States of America | Rochester, New York | 2,309,000 | Land | 4/1/2022 | 3/31/2042 | |||||||||||
United States of America | Rochester, New York | 98,500 | Storage | 11/1/2021 | 12/31/2022 | |||||||||||
We have also entered into leases for our Germany Spoke and our Norway Spoke, as of the date of this prospectus, as noted in the table below:
Lease period | ||||||||||||||||
Country | Location | Gross Floor Area (square foot) | Use | Start | End | |||||||||||
Germany | Magdenburg, Germany | 546,828 | Plant | 7/1/2022 | 6/30/2032 | |||||||||||
Norway | Moss, Norway | 165,936 | Plant | 6/1/2023 | 5/31/2035 | |||||||||||
Owned Property
We had no owned properties as of April 30, 2022.
56
MANAGEMENT’S DISCUSSION AND ANALYSIS OF FINANCIAL CONDITION AND
RESULTS OF OPERATIONS
This “Management’s Discussion and Analysis of Financial Condition and Results of Operations” should be read in conjunction with the “Business” section and the consolidated financial statements and related notes included elsewhere in this prospectus. The financial information contained herein is taken or derived from such consolidated financial statements, unless otherwise indicated. The following discussion contains forward-looking statements. Our actual results could differ materially from those that are discussed in our forward-looking statements. For more information about forward-looking statements, see the section entitled “Forward-Looking Statements” included in this prospectus. Factors that could cause or contribute to such differences include those discussed below and elsewhere in this prospectus, particularly under “Risk Factors.”
References in this section to “we,” “us” or
“Li-Cycle”
refer toLi-Cycle
Corp. and its subsidiaries prior to the consummation of the Business Combination andLi-Cycle
Holdings Corp. and its subsidiaries subsequent to the Business Combination, unless the context otherwise requires or indicates otherwise.Li-Cycle’s
annual consolidated financial statements have been prepared in accordance with International Financial Reporting Standards (“IFRS”), as issued by the International Accounting Standards Board (“IASB”).Li-Cycle’s
condensed consolidated interim financial statements have been prepared in accordance with International Accounting Standard 34 “Interim Financial Reporting” as issued by the IASB. All amounts are in U.S. dollars except as otherwise indicated. For more information about the basis of presentation ofLi-Cycle’s
financial statements, see the section entitled “Components of Results of Operations—Basis of Presentation
Certain figures, such as interest rates and other percentages included in this discussion and analysis, have been rounded for ease of presentation. Percentage figures included in this discussion and analysis have not in all cases been calculated on the basis of such rounded figures but on the basis of such amounts prior to rounding. For this reason, percentage amounts in this discussion and analysis may vary slightly from those obtained by performing the same calculations using the figures in
Li-Cycle’s
financial statements or in the associated text. Certain other amounts that appear in this section may similarly not sum due to rounding.Company Overview
Li-Cycle
is an industry leader inlithium-ion
battery resource recovery and the leadinglithium-ion
battery recycler in North America. When we refer to ourselves as the leadinglithium-ion
battery recycler in North America, we are referring to our status based on installed permitted capacity forlithium-ion
battery recycling measured in tonnes per year. Our proprietary “Spoke & Hub” recycling and resource recovery process is designed (a) at our Spokes, to process battery manufacturing scrap andend-of-life
co-located
Spoke with a strategic industry partner in Warren, Ohio (the “Ohio Spoke”) and our first two European Spokes in Norway (the “Norway Spoke”) and Germany (the “Germany Spoke”). For ease of presentation, our Spokes in development and construction for the relevant time period indicated, are collectively referred to as the “Spoke Capital Projects.”Li-Cycle
was until 2020 a development stage company with no commercial revenues. For the twelve months ended October 31, 2021 and 2020,Li-Cycle’s
revenue was $7.4 million and $0.8 million, respectively.57
For the twelve months ended October 31, 2021 and 2020,
Li-Cycle
recorded a net loss of $226.6 million and $9.3 million and an Adjusted EBITDA1
loss of $25.4 million and $8.0 million, respectively. For the six months ended April 30, 2022 and 2021,Li-Cycle’s
revenue was $12.5 million and $1.3 million, respectively. For the six months ended April 30, 2022 and 2021,Li-Cycle
recorded a net profit of $7.9 million and a net loss of $14.7 million and an Adjusted EBITDA loss of $36.4 million and $9.1 million, respectively.To date,
Li-Cycle
has financed its operations primarily through: (i) proceeds received in connection with the Business Combination; (ii) private placements ofLi-Cycle
securities (including the 2021 Convertible Notes, the LG Subscription and the Glencore Convertible Note); (iii) loans from third parties (such as BDC Capital) and certainLi-Cycle
shareholders; and (iv) various government funding initiatives.The Business Combination
On August 10, 2021,(Ontario) (the “Business Combination”).
Li-Cycle
Corp.,Li-Cycle
Holdings Corp. (a wholly-owned subsidiary ofLi-Cycle
prior to the Business Combination) (“OldLi-Cycle
Holdings”) and Peridot Acquisition Corp. (“Peridot”) completed their previously announced business combination pursuant to a plan of arrangement under theBusiness Corporations Act
Pursuant to the terms of the Business Combination, on the closing date of the Business Combination, (i) Peridot and Old
Li-Cycle
Holdings amalgamated, and in connection therewith, the Class A common shares and warrants to purchase Class A common shares of Peridot converted into an equivalent number of shares and warrants of the amalgamated entity,Li-Cycle
Holdings Corp., and the common share in OldLi-Cycle
Holdings held byLi-Cycle
were exchanged for a share ofLi-Cycle
Holdings Corp.; (ii) the share ofLi-Cycle
Holdings Corp. held byLi-Cycle
was purchased for cancellation byLi-Cycle
Holdings Corp. for cash equal to the subscription price for the common share in OldLi-Cycle
Holdings for which such share was exchanged pursuant to the Amalgamation; (iii) the preferred shares ofLi-Cycle
converted into common shares ofLi-Cycle;
and(iv) Li-Cycle
Holdings Corp. acquired all of the issued and outstanding common shares ofLi-Cycle
fromLi-Cycle’s
shareholders (includingLi-Cycle
common shares issued upon exercise, cancellation, exchange or settlement of all issued and outstanding equity awards (whether vested or unvested), including pursuant to the Business Combination, but excluding any equity awards that were cancelled and exchanged for equity awards ofLi-Cycle
Holdings Corp. and remained outstanding on the day following the closing date of the Business Combination) in exchange for common shares ofLi-Cycle
Holdings Corp. Pursuant to the Business Combination,Li-Cycle
Corp. became a wholly-owned subsidiary ofLi-Cycle
Holdings Corp.Upon the closing of the Business Combination and a concurrent $315.5 million private placement of common shares (the “PIPE Financing”), the combined company received $581.9 million of gross transaction proceeds, before deduction of $29.6 million of Peridot’s transaction costs and $27.0 million of
Li-Cycle’s
transaction costs.Accounting Treatment of the Business Combination
The Business Combination has been accounted for as a reverse acquisition in accordance with IFRS. Under this method of accounting,
Li-Cycle
Holdings Corp. (as the continuing entity after the Amalgamation of OldLi-Cycle
Holdings and Peridot) is treated as the “acquired” company for accounting purposes. As Peridot Acquisition Corp. does not meet the definition of a business as defined in IFRS 3 — Business Combinations (“IFRS 3”), the acquisition, net assets ofLi-Cycle
Holdings Corp. were stated at historical cost, with no goodwill or other intangible assets recorded.| 1 | Adjusted EBITDA is a non-IFRS financial measure and does not have a standardized meaning under IFRS. See “—Non-IFRS MeasuresManagement’s Discussion and Analysis of Financial Condition and Results of Operations |
58
Li-Cycle
has been determined to be the accounting acquirer based on an evaluation of the following facts and circumstances, and accordingly the Business Combination is treated as an equivalent to an acquisition of Peridot accompanied by a recapitalization.| • | Li-Cycle’s shareholders prior to the Business Combination have the greatest voting interest in the combined entity relative to other shareholders (including following the redemptions discussed under “—Liquidity and Capital Resources — Sources of Liquidity |
| • | The largest individual minority shareholder of the combined entity is an existing shareholder of Li-Cycle; |
| • | The Company’s senior management is the senior management of Li-Cycle; |
| • | Li-Cycle is the larger entity based on historical total assets and revenues; and |
| • | Li-Cycle’s operations comprise the ongoing operations of the Company. |
Upon consummation of the Business Combination and the closing of the PIPE Financing, the most significant change in
Li-Cycle’s
financial position and results of operations was an increase in cash and cash equivalents (as compared toLi-Cycle’s
balance sheet at July 31, 2021) of $581.9 million, including $315.5 million in gross proceeds from the PIPE Financing. Total direct and incremental transaction costs of Peridot andLi-Cycle
were $29.6 million and $27.0 million, respectively.Li-Cycle’s
transaction costs was treated as a reduction of the cash proceeds and deducted fromLi-Cycle
Holdings Corp.’s additionalpaid-in
capital.As a consequence of the Business Combination,
Li-Cycle
Holdings Corp. became the successor to anSEC-registered and
NYSE-listed company, which requiresLi-Cycle
to continue to hire additional personnel and implement procedures and processes to address public company regulatory requirements and customary practices. We expect to incur additional annual expenses as a public company for, among other things, directors’ and officers’ liability insurance, director fees and additional internal and external accounting, legal and administrative resources, including increased audit and legal fees.Current Situation with Respect to
COVID-19
The ongoing
COVID-19
pandemic has resulted in significant supply chain disruptions globally and continues to affectLi-Cycle’s
business.Li-Cycle’s
operations have been impacted by theCOVID-19
pandemic.Li-Cycle’s
operations have been considered an essential service in both Canada and the United States and, as a result,Li-Cycle’s
plants have continued operations during theCOVID-19
pandemic, albeit with the implementation of appropriate measures to ensure employee safety.Li-Cycle’s
operations were however impacted by theCOVID-19
pandemic in the form of operational slow-downs and interruptions caused by employee absences and mandatory quarantines resulting from actual or suspected exposure toCOVID-19.
The company has, at times, experienced slow-downs and interruptions in its battery supply chain.Li-Cycle
shut down its corporate headquarters in March 2020 and enforced a work-from-home mandate.Li-Cycle
re-opened
its corporate office facilities in November 2021. A second temporary closure ofLi-Cycle’s
corporate headquarters occurred in January 2022 related to the Omicron variant and the office subsequentlyre-opened
in February 2022.Li-Cycle
cannot currently predict the duration of the impact of theCOVID-19
pandemic on its operations. Continuing effects of theCOVID-19
pandemic, including the emergence of new strains such as the Omicron or Delta variant may cause governments to impose new restrictive measures, result in employee absences from work or result in negative economic effects, which in each case could have a material adverse impact onLi-Cycle’s
operations, development and construction activities and financial condition. See “Risk Factors —
59
Risks Relating to
Li-Cycle’s
Business — Unfavorable economic conditions, such as consequences of the globalCOVID-19
pandemic and disruptions in the global supply chain, may have a material adverse effect onLi-Cycle’s
business, results of operations and financial conditionComparability of Financial Information
Li-Cycle’s
future results of operations and financial position may not be comparable to historical results as a result of the Business Combination and the factors described below, among other things.Li-Cycle
included certain projected financial information in the proxy statement/prospectus on FormF-4
dated July 15, 2021 and filed with the U.S. Securities and Exchange Commission (the “SEC”) in connection with the Business Combination (as amended, the “Proxy/Registration Statement”), which information was also incorporated by reference inLi-Cycle’s
non-offering
final prospectus dated August 10, 2021 filed with the Ontario Securities Commission (the “Canadian Prospectus”) and Shell Company Report on Form20-F
filed with the SEC. Readers of the Proxy / Registration Statement and the Canadian Prospectus were cautioned that the financial projections and the assumptions underlying them reflected the opinion ofLi-Cycle’s
management, based onLi-Cycle’s
business plan at the time the financial projections were prepared, which was in January 2021. The financial projections and underlying assumptions included in the Proxy / Registration Statement and the Canadian Prospectus did not take into account any circumstances or events occurring after the date they were prepared. The financial projections reflected numerous estimates and assumptions with respect to general business, economic, regulatory, market and financial conditions and other future events, as well as matters specific toLi-Cycle’s
business, all of which were difficult to predict and many of which were beyondLi-Cycle’s
control. The financial projections and assumptions underlying them were inherently subject to significant uncertainties and contingencies, many of which were beyondLi-Cycle’s
control.As a result of the developments described below, we noted in our results for the three and nine months ended July
31, 2021, that the assumptions underlying the projected financial information included in the Proxy/Registration Statement and the Canadian Prospectus, including a number of assumptions regarding capital expenditures and the timing of the
roll-out
of new operational facilities, no longer reflected a reasonable basis on which to project our future results and therefore such projections should not be relied on as indicative of future results.lithium-ion
battery recycling has continued to exceed our internal projections and, in order to meet this growing demand, we have decided to increase and accelerate our investment in thebuild-out
of our recycling capacity in certain respects. For example, since the date of effectiveness of the Proxy/Registration Statement and the date of the Canadian Prospectus, respectively, we have, among other things, announced the development of the Spoke Capital Projects, increasing our processing capacity beyond that of our previous plans and projections. We have also announced the increase of expected processing capacity and development costs at our Rochester Hub. Our actual results could differ substantially from the projected financial information contained in the Proxy/Registration Statement and the Canadian Prospectus.Key Factors Affecting
Li-Cycle’s
PerformanceWe believe that.”
Li-Cycle’s
performance and future success is dependent on multiple factors that present significant opportunities forLi-Cycle,
but also pose significant risks and challenges, including those discussed below and in the section of the section entitled “Risk Factors
Availability of
Lithium-Ion
Battery Materials for RecyclingLi-Cycle
is reliant on obtaininglithium-ion
batteries and battery manufacturing scrap for recycling through its contracts with suppliers. The Company maintains commercial contracts with leaders in the electric vehicle (“EV”) andlithium-ion
battery ecosystem, including consumer electronics, manufacturing scrap, energy storage, and automotive OEMs and transportation companies.Li-Cycle
currently has over 100 suppliers ofend-of-life
60
lithium-ion
batteries and battery manufacturing scrap and we expectLi-Cycle
to attract new suppliers by differentiating itself based on the sustainability of its process and the robustness of its technology, which in turn will enableLi-Cycle
to offer competitive terms to suppliers. We expectLi-Cycle’s
supply pipeline to grow as suppliers grow volumes of batteries and manufacturing scrap available for recycling due to the continuing trend toward EVs, and asLi-Cycle
continues to source additional supplier relationships. Our commercial agreements with Glencore also provide for the procurement of battery material for our Spoke facilities, providing access to an additional source of supply. However, there can be no assurance thatLi-Cycle
will attract new suppliers or expand its supply pipeline from existing suppliers, and any decline in supply volume from existing suppliers or an inability to source new supplier relationships could have a negative impact onLi-Cycle’s
results of operations and financial condition.On May 11, 2021,
Li-Cycle
announced its entry into an agreement with Ultium Cells LLC (“Ultium”), a joint venture between General Motors and LG Energy Solution, Ltd. (“LGES”), pursuant to which Ultium will supply toLi-Cycle,
andLi-Cycle
will purchase and recycle, up to 100% of the scrap generated by battery cell manufacturing at Ultium’s Warren, Ohio mega-factory. On January 27, 2022,Li-Cycle
announced the development of aco-located
Spoke in Warren, Ohio to enhance its ability to service Ultium’s recycling needs.Customer Demand for Recycled Raw Materials
Li-Cycle
relies on a limited number of customers from whom we generate most of our revenue.Li-Cycle
has entered into two agreements with Traxys North America LLC (“Traxys”) coveringoff-take
from its Spokes in North America and the Rochester Hub. See the section titled “Business — Our Commercial Contracts
Li-Cycle
has also entered into additionaloff-take
agreements with Glencore, covering substantially all of our other Spoke and Hub products. See the section titled “Business — Our Commercial Contracts — Glencore Commercial Agreements
Our commercial agreements with Glencore also provide for the procurement of feedstock for our Spoke facilities, and procurement of black mass for our future Hub facilities, to supplement the volumes we are currently either independently sourcing or producing. Although these agreements are not exclusive for either party, they also do not commit either party to a specific performance threshold, and therefore a substantial reduction in Glencore’s supply of either product or an unwillingness or inability to fulfill its contractual obligations to us could have a material adverse effect on our business, financial condition or results of operations.
In December 2021,
Li-Cycle,
LGC and LGES announced their intention to enter into a manufacturing scrap supply and nickel sulphateoff-take
agreement, pursuant to anon-binding
letter of intent. On April 20, 2022, a subsidiary of the Company entered into a scrap offer agreement with LGES pursuant to which the Company will have the opportunity to recycle nickel-bearinglithium-ion
battery manufacturing scrap and otherlithium-ion
battery material from LGES’s North American manufacturing sites. In addition, on April 20, 2022, a subsidiary of the Company entered into nickel sulphate offtake agreements with each of LGES and LGC pursuant to which the Company will allocate for sale, through itsend-product
offtake partner, Traxys, a combined initial allocation of 20,000 tonnes of nickel contained in nickel sulphate produced at the Company’s Hub facility currently under construction in Rochester, New York, to LGC and LGES over 10 years. These agreements will enable a closed-loop ecosystem for LGC and LGES for key materials in the lithium battery supply chain.Ability to Build Out Additional Facilities
Li-Cycle
is confident in its ability to scale the business as currently planned.Li-Cycle
has a market-leading position in North America through its operational commercial Spokes in Kingston, Ontario, Rochester, New61
York, and Gilbert, Arizona and
Li-Cycle
has announced additional Spokes under development in Tuscaloosa, Alabama and Warren, Ohio.Li-Cycle
is also advancing the construction of its first commercial Hub, in Rochester, New York.Li-Cycle
has also announced its first European Spokes, in Norway and Germany, and is evaluating additional opportunities to scale its operations with a range of potential partners and expansion opportunities that may include acquisitions, joint ventures or other commercial arrangements in North America, Europe, and Asia Pacific.Li-Cycle’s
continued growth and results of operations will be negatively impacted if it is unable to continue to scale its operations.Russia’s invasion of Ukraine has and may continue to further exacerbate disruptions in the global supply chain. Shortages, price increases and/or delays in shipments of supplies, equipment and raw materials have occurred and may continue to occur in the future which may result in operational or construction slowdowns, which may in turn have a material adverse effect on
Li-Cycle’s
operations, development and construction activities and financial condition.International operations are subject to certain risks inherent in doing business abroad, including:
| • | political, civil and economic instability; |
| • | risks of war and other hostilities; |
| • | corruption risks; |
| • | trade, customs and tax risks; |
| • | currency exchange rates and currency controls; |
| • | limitations on the repatriation of funds; |
| • | insufficient infrastructure; |
| • | restrictions on exports, imports and foreign investment; |
| • | economic sanctions; |
| • | increases in working capital requirements related to long supply chains; |
| • | changes in labor laws and regimes and disagreements with the labor force; |
| • | difficulty in protecting intellectual property rights; and |
| • | different and less established legal systems. |
Expanding our business in international markets, including the construction and operation of the Norway Spoke and Germany Spoke, is an important element of our strategy and, as a result, our exposure to the risks described above may be greater in the future. The likelihood of such occurrences and their potential effects on our business and results of operations will vary from country to country and are unpredictable, but could have an adverse effect on our ability to execute our strategy and accordingly on our results of operations.
Commodity and Specialty Prices
Li-Cycle
currently recognizes revenue from, among other things, sales of three intermediate products produced atLi-Cycle’s
Spokes: black mass; mixed copper and aluminum shred; and mixed plastics.Li-Cycle
expects to recognize revenue from sales of end products, including nickel sulphate, cobalt sulphate and lithium carbonate, after its first Hub becomes operational.The price
Li-Cycle
can charge for its end products is tied to commodity and specialty pricing for nickel, cobalt, and lithium, among others. This can lead to variability in revenues, but we believe the wide range of materialsLi-Cycle
produces results in a diversification effect that provides it with a natural hedge against significant variations in the commodity pricing related to a single product.62
Research and Development
Li-Cycle
continues to conduct research and development (“R&D”) centered on various aspects of its business. R&D work is ongoing in support of its Spoke operations and its Rochester Hub project, specifically focused on continuous optimization of operating parameters and preparing for operations.Li-Cycle
also continues to develop and evaluate new concepts with an eye to the future, including solid-state battery processing and others related to its Spoke & Hub Technologies™
.Components of Results of Operations
Basis of Presentation
Li-Cycle’s
consolidated and condensed financial statements have been prepared in accordance with IFRS. All amounts are in U.S. dollars except otherwise indicated. Currently,Li-Cycle
conducts business through one operating segment.Li-Cycle
was apre-revenue
company with no commercial operations until 2020. For more information aboutLi-Cycle’s
significant accounting policies, refer to Note 2 in the accompanying consolidated financial statements ofLi-Cycle
for the years ended October 31, 2021, 2020 and 2019 and the three and six months ended April 30, 2022 and 2021.Li-Cycle’s
fiscal year end is October 31.Revenue
Li-Cycle
recognizes revenue from: (i) sales of intermediate products fromLi-Cycle’s
Spokes, being black mass, mixed copper and aluminum shred and mixed plastics; and (ii) providing services relating to recycling oflithium-ion
batteries, which includes coordination of logistics and destruction of batteries.Li-Cycle
expects to recognize revenue from sales of end products, including nickel sulphate, cobalt sulphate and lithium carbonate, after its first Hub becomes operational.We expect
Li-Cycle’s
sales of products to increase as a percentage of overall revenue as more Spokes, the Rochester Hub and additional Hubs become operational over time.For product sales, revenue is recognized when control of the goods has been transferred, meaning when the goods have been picked up by the customer or shipped to the customer’s location (delivery). A receivable is recognized by.”
Li-Cycle
at the point of delivery, as this represents the point in time at which the right to consideration becomes unconditional, as passage of time is the only condition to payment becoming due. For more information about the basis of presentation ofLi-Cycle’s
financial statements, see “—Critical Accounting Policies and Estimates
Service revenue is recognized upon completion of each service. Prices for services are separately identifiable within each contract. A receivable is recognized by
Li-Cycle
when the services are completed as this represents the point in time at which the right to consideration becomes unconditional, as passage of time is the only condition to payment becoming due.Operating expenses
Primary expense categories for
Li-Cycle
include employee salaries and benefits, raw materials and supplies, professional fees (which include consulting and other advisor fees), share-based compensation, R&D and depreciation. AsLi-Cycle
continues to grow and expand internationally, we expect to incur additional expenses in connection with acquisitions, joint ventures and/or other commercial or contractual arrangements. Additional personnel expenses are also anticipated. The amount of consulting and professional feesLi-Cycle
expects to incur is commensurate with the engineering requirements associated with its Rochester Hub project and its Spoke Capital Projects, as well as requisite expenses for legal and audit asLi-Cycle
funds its operations and scales its internal systems and processes. R&D expenses reflect ongoing efforts byLi-Cycle
to develop and expand its technology, and such costs are offset by any government funding for government funded projects.63
Other Income and Expense
Other income and expense consists of foreign exchange gain and loss, interest income and expense, fair value gain and loss on financial instruments and, in 2021, the cost of listing on the New York Stock Exchange. Financing costs are typically applied against the gross proceeds of any capital raised, and in the case of debt, amortized over the term of such debt. Interest expense represents the actual cash interest costs incurred plus any accrued interest payable at a future date.
Results of Operations
Comparison of the three and six months ended April 30, 2022 and 2021
Three months ended April 30, | $ Change | % Change | Six months ended April 30, | $ Change | % Change | |||||||||||||||||||||||||||
2022 | 2021 | 2022 | 2021 | |||||||||||||||||||||||||||||
(amounts in thousands, except per share data) | ||||||||||||||||||||||||||||||||
Revenues | 8,653 | 257 | 8,396 | 3262 | % | 12,491 | 1,275 | 11,217 | 880 | % | ||||||||||||||||||||||
Product sales | 8,291 | 176 | 8,115 | 4608 | % | 11,914 | 1,089 | 10,825 | 994 | % | ||||||||||||||||||||||
Recycling Services | 362 | 81 | 281 | 345 | % | 578 | 186 | 392 | 211 | % | ||||||||||||||||||||||
Operating expenses | 29,978 | 5,578 | 24,399 | 437 | % | 52,548 | 12,799 | 39,749 | 311 | % | ||||||||||||||||||||||
Employee salaries and benefits | 11,329 | 2,547 | 8,782 | 345 | % | 19,108 | 4,245 | 14,862 | 350 | % | ||||||||||||||||||||||
Professional fees | 3,560 | 568 | 2,992 | 527 | % | 6,434 | 3,002 | 3,432 | 114 | % | ||||||||||||||||||||||
Share-based compensation | 4,477 | 263 | 4,214 | 1601 | % | 9,676 | 1,009 | 8,667 | 859 | % | ||||||||||||||||||||||
Raw materials and supplies | 1,817 | 480 | 1,336 | 278 | % | 3,230 | 894 | 2,336 | 261 | % | ||||||||||||||||||||||
Office, administrative and travel | 3,149 | 318 | 2,831 | 891 | % | 5,993 | 622 | 5,371 | 864 | % | ||||||||||||||||||||||
Depreciation | 1,987 | 606 | 1,381 | 228 | % | 3,821 | 1,133 | 2,688 | 237 | % | ||||||||||||||||||||||
Research and development | 528 | 825 | (297 | ) | (36 | )% | 870 | 1,352 | (482 | ) | (36 | )% | ||||||||||||||||||||
Freight and shipping | 587 | 141 | 446 | 315 | % | 798 | 432 | 365 | 84 | % | ||||||||||||||||||||||
Plant facilities | 984 | 234 | 750 | 320 | % | 1,421 | 448 | 973 | 217 | % | ||||||||||||||||||||||
Marketing | 748 | 163 | 584 | 358 | % | 1,197 | 305 | 892 | 293 | % | ||||||||||||||||||||||
Change in Finished Goods Inventory | 812 | (567 | ) | 1,380 | (243 | )% | 1 | (645 | ) | 646 | (100 | )% | ||||||||||||||||||||
Other (income) expenses | (680 | ) | 2,527 | (3,207 | ) | (127 | )% | (47,958 | ) | 3,169 | (51,128 | ) | (1613 | )% | ||||||||||||||||||
Fair value (gain) loss on financial instruments | (2,862 | ) | 1,924 | (4,786 | ) | (249 | )% | (53,733 | ) | 1,924 | (55,657 | ) | (2893 | )% | ||||||||||||||||||
Interest expense | 2,451 | 245 | 2,207 | 902 | % | 6,193 | 495 | 5,697 | 1150 | % | ||||||||||||||||||||||
Foreign exchange (gain) loss | 140 | 359 | (219 | ) | (61 | )% | 129 | 751 | (622 | ) | (83 | )% | ||||||||||||||||||||
Interest income | (409 | ) | (1 | ) | (409 | ) | 80908 | % | (547 | ) | (1 | ) | (545 | ) | 44636 | % | ||||||||||||||||
Net profit (loss) before taxes | (20,645 | ) | (7,848 | ) | (12,797 | ) | 163 | % | 7,901 | (14,693 | ) | 22,595 | (154 | )% | ||||||||||||||||||
Income tax | 5 | — | 5 | 100 | % | 5 | — | 5 | 100 | % | ||||||||||||||||||||||
Net profit (loss) and comprehensive income (loss) | (20,650 | ) | (7,848 | ) | (12,802 | ) | 163 | % | 7,896 | (14,693 | ) | 22,590 | (154 | )% | ||||||||||||||||||
Net profit (loss) attributable to Shareholders of Li-Cycle Holdings Corp. | (20,627 | ) | (7,848 | ) | (12,779 | ) | 163 | % | 7,920 | (14,693 | ) | 22,613 | (154 | )% | ||||||||||||||||||
Non-controlling interest | (24 | ) | — | (24 | ) | 100 | % | (24 | ) | — | (24 | ) | 100 | % | ||||||||||||||||||
Net profit (loss) and comprehensive income (loss) | (20,650 | ) | (7,848 | ) | (12,802 | ) | 163 | % | 7,896 | (14,693 | ) | 22,589 | (154 | )% | ||||||||||||||||||
Earnings (loss) per common share — basic | (0.12 | ) | (0.08 | ) | (0.04 | ) | 48 | % | 0.05 | (0.16 | ) | 0.20 | (130 | )% | ||||||||||||||||||
Earnings (loss) per common share — diluted | (0.12 | ) | (0.08 | ) | (0.04 | ) | 48 | % | 0.05 | (0.16 | ) | 0.21 | (131 | )% | ||||||||||||||||||
Weighted average number of common shares outstanding | 168,972 | 95,060 | 73,911 | 78 | % | 166,366 | 94,255 | 72,111 | 77 | % | ||||||||||||||||||||||
Dilutive number of shares | 168,972 | 95,060 | 73,911 | 78 | % | 171,701 | 94,255 | 77,446 | 82 | % | ||||||||||||||||||||||
64
Revenue
For the three and six months ended April 30, 2022,
Li-Cycle’s
revenues increased to $8.7 million and $12.5 million, respectively, compared to $0.3 million and $1.3 million in the corresponding periods of 2021, respectively, a 3262% and 880% increase when compared to the corresponding prior periods. The revenue growth was mainly attributable to increases in product sales and commodity prices. In the three and six months ended April 30, 2022, the Ontario Spoke and the New York Spoke produced 723 tonnes and 1,422 tonnes of black mass, respectively, compared to 307 tonnes and 546 tonnes of black mass produced in the corresponding period of 2021 when the New York Spoke was in the early stage of ramping up. Revenues from product sales were approximately $8.3 million and $11.9 million, respectively, while revenues from recycling services were approximately $0.4 million and $0.6 million, for the three and six months ended April 30, 2022.Operating expenses
For the three and six months ended April 30, 2022, operating expenses increased by 437% and 311%, respectively, compared to the corresponding periods of 2021, reflecting the continued expansion of
Li-Cycle’s
operations. The increase in personnel costs of $8.8 million and $14.9 million for the three and six months ended April 30, 2022 compared to the corresponding periods in 2021 relates to the addition of operational, corporate, commercial, and engineering personnel asLi-Cycle
continues to pursue its expansion plans. The professional fees incurred in the three and six months ended April 30, 2022 as compared to the prior periods reflect the addition of legal, audit and tax advisory services in support of the Company’s growth plans and required services as a public company. The movements in share-based compensation in the three and six months ended April 30, 2022, arenon-cash
expenses consisting of Restricted Share Units (“RSU’s”) and stock options granted to employees. The increase in raw materials and supplies of $1.3 million and $2.3 million for the three and six months ended April 30, 2022 is mainly a result of increased sales volume and inventory production from Spoke operations. Office and administrative expenses increased in the three and six months ended April 30, 2022, mainly as a result of higher insurance premiums associated with being a public company.Other (Income) Expenses
Other (income) expenses amounted to an income of $0.7 million and income of $48.0 million in the three and six months ended April 30, 2022, compared to $2.5 million and $3.2 million of other expenses in the three and six months ended April 30, 2021. The change was primarily due to fair value gains on financial instruments in the three and six months ended April 30, 2022 which were driven by changes in the fair value of the conversion feature of convertible debt of $2.9 million and $17.6 million, respectively, and changes in the fair value of warrants of $36.2 million in the six months ended April 30, 2022, offset by interest expenses on convertible debt and lease liabilities.
Net profit (loss)
Net profit (loss) amounted to a net loss of $20.7 million and a net profit of $7.9 million in the three and six months ended April 30, 2022, compared to a net loss of $7.8 million and $14.7 million in the three and six months ended April 30, 2021. Net profit (loss) for both periods was driven by the factors discussed above. In addition, excluding fair value gains and other adjusted items, Adjusted EBITDA loss was $19.5 million and $36.4 million in the three and six months ended April 30, 2022, compared to $5.1 million and $9.1 million in the corresponding 2021 periods. This was largely driven by higher staffing and network development costs related to the growth and expansion of the business. A reconciliation of Adjusted EBITDA loss to Net profit (loss) is provided in the section “—” below.
Non-IFRS
Measures65
Comparison of Statement of Financial Position
April 30, 2022 | October 31, 2021 | |||||||
Assets | (amounts in thousands) | |||||||
Cash and cash equivalents | 509,316 | 596,858 | ||||||
Other current assets | 54,641 | 14,891 | ||||||
Plant and equipment | 70,403 | 26,389 | ||||||
Other non-current assets | 32,396 | 27,010 | ||||||
Total Assets | 666,756 | 665,148 | ||||||
Liabilities | ||||||||
Current liabilities | 50,025 | 21,578 | ||||||
Convertible debt | 88,526 | 100,878 | ||||||
Warrants | — | 82,109 | ||||||
Other non-current liabilities | 30,580 | 26,862 | ||||||
Total Liabilities | 169,131 | 231,427 | ||||||
Shareholders’ equity | 497,625 | 433,721 | ||||||
Equity attributable to the Shareholders of Li-Cycle Holdings Corp. | 497,318 | 433,721 | ||||||
Non-controlling interest | 306 | — | ||||||
Total liabilities and shareholders’ equity | 666,756 | 665,148 | ||||||
Assets
Cash and cash equivalents were $509.3 million as at April 30, 2022 compared to $596.9 million as at October 31, 2021. The decrease in cash was primarily driven by purchases of equipment for the Rochester Hub and Spoke Capital Projects and ongoing operating expenses. The increase in working capital requirements was driven by an increase in accounts receivable related to the Company’s growth.
Property plant and equipment was $70.4 million as at April 30, 2022, compared to $26.4 million as at October 31, 2021. This increase was primarily driven by purchases for the construction of the Rochester Hub as well as the Arizona Spoke and Alabama Spoke.
Liabilities
Convertible debt, representing the 2021 Convertible Notes, was $88.5 million as at April 30, 2022, compared to $100.9 million as at October 31, 2021. The decrease is primarily driven by a fair value gain on the embedded derivative and offset by accretion and accrued interest. Warrant liability was nil as at April 30, 2022 as of result of the redemption of all of
Li-Cycle’s
outstanding warrants and the make-whole exercise as described in the notice of redemption dated December 27, 2021. The redemption of the warrants was completed as of January 31, 2022.66
Comparison of the three and twelve months ended October 31, 2021 and 2020
Three months ended October 31, | $ Change | % Change | Year Ended October 31, October 31, | $ Change | % Change | |||||||||||||||||||||||||||
2021 | 2020 | 2021 | 2020 | |||||||||||||||||||||||||||||
(amounts in thousands, except per share data) | ||||||||||||||||||||||||||||||||
Revenues | 4,391 | 469 | 3,922 | 836 | % | 7,375 | 792 | 6,583 | 831 | % | ||||||||||||||||||||||
Product sales | 4,248 | 370 | 3,878 | 1049 | % | 6,930 | 555 | 6,376 | 1149 | % | ||||||||||||||||||||||
Recycling Services | 143 | 99 | 44 | 44 | % | 444 | 237 | 207 | 87 | % | ||||||||||||||||||||||
Operating expenses | 18,558 | 4,966 | 13,592 | 274 | % | 39,232 | 9,934 | 29,298 | 295 | % | ||||||||||||||||||||||
Employee salaries and benefits, net | 4,987 | 1,404 | 3,584 | 255 | % | 12,710 | 2,819 | 9,891 | 351 | % | ||||||||||||||||||||||
Professional fees | 3,470 | 1,402 | 2,068 | 147 | % | 7,689 | 2,962 | 4,726 | 160 | % | ||||||||||||||||||||||
Share-based compensation | 2,675 | 112 | 2,563 | 2284 | % | 3,983 | 333 | 3,650 | 1097 | % | ||||||||||||||||||||||
Raw materials and supplies | 1,406 | 200 | 1,206 | 602 | % | 3,410 | 592 | 2,818 | 476 | % | ||||||||||||||||||||||
Office, administrative and travel | 2,095 | 217 | 1,878 | 866 | % | 3,149 | 477 | 2,672 | 561 | % | ||||||||||||||||||||||
Depreciation | �� | 1,069 | 378 | 691 | 183 | % | 2,899 | 1,095 | 1,804 | 165 | % | |||||||||||||||||||||
Research and development, net | 734 | 796 | (62 | ) | (8 | )% | 2,663 | 777 | 1,886 | 243 | % | |||||||||||||||||||||
Freight and shipping | 445 | 80 | 365 | 459 | % | 1,033 | 137 | 896 | 654 | % | ||||||||||||||||||||||
Plant facilities | 355 | 167 | 188 | 112 | % | 1,031 | 391 | 640 | 164 | % | ||||||||||||||||||||||
Marketing | 508 | 177 | 331 | 187 | % | 974 | 366 | 608 | 166 | % | ||||||||||||||||||||||
Change in Finished Goods Inventory | 813 | 33 | 780 | 2379 | % | (308 | ) | (14 | ) | (294 | ) | 2095 | % | |||||||||||||||||||
Other (income) expenses | 190,802 | (63 | ) | 190,865 | (302380 | )% | 194,702 | 134 | 194,568 | 145093 | % | |||||||||||||||||||||
Listing Fee | 152,719 | — | 152,719 | 100 | % | 152,719 | — | 152,719 | 100 | % | ||||||||||||||||||||||
Fair value loss on financial instruments | 35,821 | 84 | 35,737 | 42315 | % | 38,254 | 84 | 38,170 | 45196 | % | ||||||||||||||||||||||
Interest expense | 2,120 | 189 | 1,931 | 1022 | % | 3,053 | 530 | 2,523 | 476 | % | ||||||||||||||||||||||
Foreign exchange (gain) loss | 222 | (336 | ) | 558 | (166 | )% | 758 | (446 | ) | 1,204 | (270 | )% | ||||||||||||||||||||
Interest income | (81 | ) | — | (81 | ) | 35792 | % | (82 | ) | (34 | ) | (48 | ) | 140 | % | |||||||||||||||||
Net loss | (204,969 | ) | (4,433 | ) | (200,535 | ) | 4523 | % | (226,559 | ) | (9,276 | ) | (217,283 | ) | 2342 | % | ||||||||||||||||
Foreign currency translation adjustment | 0 | 58 | (58 | ) | (100 | )% | 0 | (219 | ) | 219 | (100 | )% | ||||||||||||||||||||
Comprehensive loss | (204,969 | ) | (4,375 | ) | (200,593 | ) | 4585 | % | (226,559 | ) | (9,495 | ) | (217,065 | ) | 2286 | % | ||||||||||||||||
Basic and diluted loss per share | (1.31 | ) | (0.05 | ) | (1.26 | ) | 2405 | % | (2.06 | ) | (0.11 | ) | (1.94 | ) | 1689 | % | ||||||||||||||||
Weighted average number of common shares outstanding | 155,887 | 83,361 | 72,525 | 87 | % | 110,119 | 82,572 | 27,547 | 33 | % | ||||||||||||||||||||||
Revenue
For the three and twelve months ended October 31, 2021,
Li-Cycle’s
revenues increased by 836% and 831%, respectively, when compared to the corresponding periods in 2020. Revenue reached $4.4 million and $7.4 million in the three and twelve months ended October 31, 2021, as compared to $0.5 million and $0.8 million in the corresponding periods of 2020, respectively. The revenue growth was mainly attributable to increases in product sales primarily as a result of the Rochester Spoke ramping up to process meaningful quantities of batteries and battery scrap, with production reaching 811 tonnes and 1,880 tonnes of black mass in the three and twelve months ended October 31, 2021, as compared to 126 tonnes and 226 tonnes of black mass produced in the corresponding periods of 2020, respectively. Revenues from product sales were approximately $4.2 million and $6.9 million, respectively while revenues from recycling services were approximately $0.1 million and $0.4 million, respectively, for the three and twelve months ended October 31, 2021. The increases in recycling services revenue were the result of the continued onboarding of new battery supply customers.67
Operating expenses
For the three and twelve months ended October 31, 2021, operating expenses increased by 274% and 295%, respectively, when compared to the corresponding periods of 2020, asoverall increase in R&D expenditure for the twelve months ended October 31, 2021 as compared to the corresponding period of 2020, notwithstanding the decline in R&D expenditure for the three months ended October 31, 2021 as compared to the corresponding period of 2020, was primarily due to R&D expenses in 2020 being largely funded by government grants, the amortization of which offset the applicable R&D expense for accounting purposes. The amortization of government grants in the three and twelve months ended October 31, 2020 totaled $0.1 million and $2.2 million, respectively, and did not recur to the same extent in the 2021 comparative periods.
Li-Cycle
ramped up its operations in North America. The increases in personnel costs of $3.6 million and $9.9 million, respectively, for the three and twelve months ended October 31, 2021 reflect the ramp up of operations of the Kingston Spoke and Rochester Spoke as well as the addition of corporate team members asLi-Cycle
ramps up its expansion plans. The level of professional fees for the three and twelve months ended October 31, 2021 is commensurate with requisite legal, audit and tax advisory services in support of Company’s growth plans as a public company. The share-based compensation for the quarter and the year included anon-recurring
expense of $1.6 million relating to the accelerated vesting of existing stock options upon the completion of the Business Combination. The increases in raw materials and supplies of $1.2 million and $2.8 million, respectively, for the three and twelve months ended October 31, 2021 are mainly a result of strong sales figures and increased inventory production during theramp-up
phase of the Kingston Spoke and Rochester Spoke operations. Office and administrative expenses increased mainly as a result of higher insurance premiums associated with being a public company. Theperiod-to-period
Other (Income) Expenses
Other expenses were $190.8 million and $194.7 million in the three and twelve months ended October 31, 2021, respectively, as compared to $0.1 million of other income and $0.1 million of other expenses in the three and twelve months ended October 31, 2020, respectively. Thechanges in other expenses for the three and twelve months ended October 31, 2021 as compared to the corresponding 2020 periods was primarily due to the recognition of $152.7 million of excess of fair value over consideration received upon completion of the Business Combination in the last fiscal quarter of 2021, in addition to a fair value loss on financial instruments, interest expenses on convertible debt, loans payable, and lease liabilities and foreign exchange losses in the twelve months ended October 31, 2021.
period-to-period
Net loss
Net loss was $204.97 million and $226.56 million in the three and twelve months ended October 31, 2021, as compared to $4.43 million and $9.28 million in the three and twelve months ended October 31, 2020, respectively. Net loss for both periods was driven by the factors discussed above. In addition, Net loss reflectsSection below.
one-time
listing fees related to the Business Combination and the impact of fair value losses on financial instruments. Excluding these Adjusted EBITDA loss was $11.51 million and $25.37 million in the three and twelve months ended October 31, 2021, as compared to $4.12 million and $8.05 million in the corresponding 2020 periods. This was largely driven by higher staffing and network development costs related to the growth and expansion of the business, as discussed above. A reconciliation of Adjusted EBITDA to net loss is provided in theNon-IFRS
Measures68
Comparison of the twelve months ended October 31, 2020 and 2019
Year ended October 31, | $ Change | % Change | ||||||||||||||
2020 | 2019 | |||||||||||||||
(amounts in thousands, except per share data) | ||||||||||||||||
Revenues | 792 | 48 | 744 | 1545 | % | |||||||||||
Product sales | 555 | — | 555 | 100 | % | |||||||||||
Recycling Services | 237 | 48 | 189 | 393 | % | |||||||||||
Operating expenses | 9,934 | 4,112 | 5,822 | 142 | % | |||||||||||
Employee salaries and benefits, net | 2,819 | 608 | 2,211 | 364 | % | |||||||||||
Professional fees | 2,962 | 547 | 2,416 | 442 | % | |||||||||||
Share-based compensation | 333 | 97 | 235 | 242 | % | |||||||||||
Raw materials and supplies | 592 | — | 592 | 100 | % | |||||||||||
Office, administrative and travel | 477 | 493 | (17 | ) | (3 | )% | ||||||||||
Depreciation | 1,095 | 184 | 911 | 496 | % | |||||||||||
Research and development, net | 777 | 2,112 | (1,335 | ) | (63 | )% | ||||||||||
Freight and shipping | 137 | 6 | 131 | 2268 | % | |||||||||||
Plant facilities | 391 | — | 391 | 100 | % | |||||||||||
Marketing | 366 | 66 | 300 | 456 | % | |||||||||||
Change in Finished Goods Inventory | (14 | ) | — | (14 | ) | 100 | % | |||||||||
Other (income) expenses | 134 | 37 | 97 | 265 | % | |||||||||||
Fair value loss on financial instruments | 84 | — | 84 | 100 | % | |||||||||||
Interest expense | 530 | 60 | 469 | 778 | % | |||||||||||
Foreign exchange (gain) loss | (446 | ) | — | (446 | ) | 100 | % | |||||||||
Interest income | (34 | ) | (24 | ) | (11 | ) | 46 | % | ||||||||
Net loss | (9,276 | ) | (4,101 | ) | (5,175 | ) | 126 | % | ||||||||
Foreign currency translation adjustment | (219 | ) | (37 | ) | (182 | ) | 488 | % | ||||||||
Comprehensive loss | (9,495 | ) | (4,138 | ) | (5,357 | ) | 129 | % | ||||||||
Basic and diluted loss per share | (0.11 | ) | (0.06 | ) | (0.06 | ) | 100 | % | ||||||||
Weighted average number of common shares outstanding | 82,572 | 71,891 | 10,680 | 15 | % | |||||||||||
Revenue
Revenue reached $0.8 million in 2020 as the Kingston Spoke became operational in the summer of 2020. As the Kingston Spoke started to process meaningful quantities of batteries,
Li-Cycle
saw growth in recycling services while also realizing revenue from product sales. Revenues from recycling services were approximately $0.2 million while revenues from product sales were approximately $0.6 million.Operating expenses
Operating expenses increased by 144% year over year as
Li-Cycle
scaled up its operations and expanded internationally. The increase in personnel costs of $2.2 million reflects the increased commercial activities to support the operations of the Kingston Spoke and the setup of Rochester Spoke. The level of consulting and professional fees is commensurate with the engineering requirements associated with the Rochester Hub project, as well as requisite legal and audit expenses for raising capital to execute theLi-Cycle’s
growth plan. R&D expenses declined mainly becauseLi-Cycle
received significant government grants of which $2.2 million were recognized as an offset to the R&D in 2020.69
Other (Income) Expenses
Other expenses were $0.1 million in 2020, as compared to other expenses of $0.04 million in 2019 mainly as a result of interest expenses on the loans payable and lease liabilities. These were partially offset by interest income and foreign exchange gains.
Summary of Quarterly Results
The table below sets forth certain summarized unaudited quarterly financial data for the six most recently completed quarters. This quarterly information has been prepared in accordance with IFRS. The operating results for any quarter are not necessarily indicative of the results to be expected for any future period.
Three months ended | ||||||||||||||||||||||||
(amounts in thousands, except per share data) | April 30, 2022 | January 31, 2022 | October 31, 2021 | July 31, 2021 | April 30, 2021 | January 31, 2021 | ||||||||||||||||||
Revenue | $ | 8,653 | $ | 3,838 | $ | 4,391 | $ | 1,709 | $ | 257 | $ | 1,017 | ||||||||||||
Net profit (loss) | $ | (20,650 | ) | $ | 28,547 | $ | (204,969 | ) | $ | (6,897 | ) | $ | (7,848 | ) | $ | (6,845 | ) | |||||||
Net profit (loss) attributable to: | ||||||||||||||||||||||||
Shareholders of Li-Cycle Holdings Corp. | $ | (20,627 | ) | $ | 28,547 | $ | (204,969 | ) | $ | (6,897 | ) | $ | (7,848 | ) | $ | (6,845 | ) | |||||||
Non-controlling interest | $ | (24 | ) | $ | — | $ | — | $ | — | $ | — | $ | — | |||||||||||
Earnings (loss) per share, basic | $ | (0.12 | ) | $ | 0.17 | $ | (1.31 | ) | $ | (0.07 | ) | $ | (0.08 | ) | $ | (0.07 | ) | |||||||
Earnings (loss) per share, diluted | $ | (0.12 | ) | $ | 0.17 | $ | (1.31 | ) | $ | (0.07 | ) | $ | (0.08 | ) | $ | (0.07 | ) | |||||||
We became a reporting issuer for the purposes of Ontario securities laws on August 10, 2021. Over the last five quarters, our results were primarily impacted by the continued development, construction and commissioning of our Ontario and New York Spokes, the development and construction of the Spoke Capital Projects and the Rochester Hub, and costs and expenses incurred in connection with our growth plan, including personnel and facilities costs and legal, audit and tax advisory services in support of the Company’s growth plans as a public company. Our results were also impacted by costs and expenses incurred in connection with the completion of the Business Combination in August 2021, including listing fee of $152.7 million in the three months ended October 31, 2021, and by fair value gain (loss) on financial instruments relating to warrants and convertible debt.
Non-IFRS
MeasuresThe Company uses the
non-IFRS
measure of Adjusted EBITDA. Management believes that thisnon-IFRS
measures provides useful information to investors in measuring the financial performance of the Company and is provided as additional information to complement IFRS measures by providing a further understanding of the Company’s results of operations from management’s perspective. These measures do not have a standardized meaning prescribed by IFRS and the term therefore may not be comparable to similarly titled measures presented by other publicly traded companies and should not be construed as an alternative to other financial measures determined in accordance with IFRS. Accordingly, it should not be considered in isolation nor as a substitute for the analysis of the Company’s financial information reported under IFRS70
Adjusted EBITDA is defined as earnings before depreciation and amortization, interest expense (income), income tax expense (recovery) adjusted for items that are not considered representative of ongoing operational activities of the business and items where the economic impact of the transactions will be reflected in earnings in future periods. These adjustment items include foreign exchange (gain) loss, fair value (gain) loss on financial instruments, and
non-recurring
expenses such as forfeited SPAC transaction cost. The following table provides a reconciliation of net profit (loss) to Adjusted EBITDA loss.Three months ended April 30, | Six months ended April 30, | Twelve months ended October 31, | ||||||||||||||||||||||||||
2022 | 2021 | 2022 | 2021 | 2021 | 2020 | 2019 | ||||||||||||||||||||||
(dollar amounts in thousands) | ||||||||||||||||||||||||||||
Net profit (loss) | (20,650 | ) | (7,848 | ) | 7,896 | (14,693 | ) | (226,559 | ) | (9,276 | ) | (4,101 | ) | |||||||||||||||
Income Tax | 5 | — | 5 | — | — | — | — | |||||||||||||||||||||
Depreciation | 1,987 | 606 | 3,821 | 1,133 | 2,899 | 1,095 | 184 | |||||||||||||||||||||
Interest expense (income) | 2,042 | 244 | 5,646 | 494 | 2,970 | 495 | 37 | |||||||||||||||||||||
EBITDA (loss) | (16,616 | ) | (6,998 | ) | 17,368 | (13,066 | ) | (220,690 | ) | (7,686 | ) | (3,880 | ) | |||||||||||||||
Foreign exchange (gain) loss | — | — | — | — | 758 | (446 | ) | — | ||||||||||||||||||||
Fair value (gain) loss on financial instruments(1) | (2,862 | ) | 1,924 | (53,733 | ) | 1,942 | 38,254 | 84 | — | |||||||||||||||||||
Listing Fee | — | — | — | — | 152,719 | — | — | |||||||||||||||||||||
Forfeited SPAC transaction cost | — | — | — | 2,000 | 2,000 | — | — | |||||||||||||||||||||
Share-based compensation(2) | — | — | — | — | 1,588 | — | — | |||||||||||||||||||||
Adjusted EBITDA loss | (19,478 | ) | (5,074 | ) | (36,365 | ) | (9,142 | ) | (25,370 | ) | (8,047 | ) | (3,880 | ) | ||||||||||||||
| (1) | Fair value (gain) loss on financial instruments relates to warrants, which were redeemed and no longer outstanding as of January 31, 2022, convertible debt, and restricted share units liability. |
| (2) | Share-based compensation relates to accelerated vesting of existing stock options upon completion of the Business Combination. |
Spoke Capital Projects
In the three months ended, April 30, 2022, we had three Spokes in development in North America, namely the Arizona Spoke, the Alabama Spoke and the Ohio Spoke, and two Spokes in development in Europe, namely the Norway Spoke and the Germany Spoke. Our Arizona Spoke began operations on May 17, 2022. Collectively, our Spoke Capital Projects (excluding the Arizona Spoke) are expected to have a recycling capacity of 45,000 tonnes (11 GWh equivalent) per year, in addition to our existing operational Spoke capacity in Ontario and New York of 10,000 tonnes (2 GWh equivalent) per year and in Arizona of 10,000 tonnes (2 GWh equivalent) per year.
Arizona Spoke
In March 2021,
Li-Cycle
announced the development and construction of the Arizona Spoke. The Phoenix metropolitan area is strategically proximate toLi-Cycle’s
existing battery and battery scrap supply network, as well as being at the nexus of expected continued growth oflithium-ion
batteries available for recycling due to the growing EV industry in Arizona, Nevada and other western U.S. States. The plant will have capacity to process up to 10,000 tonnes (2 GWh equivalent) per year. The Arizona Spoke began operations on May 17, 2022.Alabama Spoke
On September 8, 2021,
Li-Cycle
announced the development and construction of the Alabama Spoke. The Alabama Spoke is located near Tuscaloosa, Alabama, in a region where we expect there will be continued growth oflithium-ion
battery materials available for recycling due to the growing EV industry in Alabama and the U.S.71
Southeast. The plant will have capacity to process up to 10,000 tonnes (2 GWh equivalent) per year. The Alabama Spoke project is currently in the detailed engineering and facility construction stage. We expect the Alabama Spoke to be constructed, commissioned and operational in 2022.
Ohio Spoke
On January 27, 2022,
Li-Cycle
announced the development of the Ohio Spoke on site at the Ultium Cells LLC (“Ultium”) battery cell manufacturing mega-factory in Warren, Ohio. Ultium announced that it would construct a new building for the Ohio Spoke, whereLi-Cycle
could install and operate its proprietary Spoke technology and equipment after construction is complete.Li-Cycle
plans for the Ohio Spoke to have a recycling capacity of 15,000 tonnes (3 GWh equivalent) per year, and to be operational in 2023. The Ohio Spoke is intended to enhance Li-Cycle’s ability to serve Ultium’s recycling needs by providing on-site conversion of battery manufacturing scrap to intermediate products, and to help Li-Cycle service the previously awarded contract for Li-Cycle to process battery manufacturing scrap from Ultium’s Ohio mega-factory.Norway Spoke
On January 26, 2022,
Li-Cycle
entered into a joint venture agreement with ECO STOR AS (“ECO STOR”) and Morrow Batteries AS (“Morrow”) to formLi-Cycle
Norway AS through which it will construct a new commerciallithium-ion
battery recycling facility in southern Norway.Li-Cycle
is the majority owner ofLi-Cycle
Norway AS, with ECO STOR and Morrow being minority owners and Nordic-headquartered strategic partners. Once constructed, the Norway Spoke is expected to have a recycling capacity of 10,000 tonnes (2 GWh equivalent) oflithium-ion
batteries per year, including battery manufacturing scrap, full EV packs, and energy storage systems. We have leased a site in Moss, Norway, approximately 60 kilometers from Oslo, for our Norway Spoke and the facility is expected to be operational in 2023.Germany Spoke
On January 27, 2022,
Li-Cycle
announced the development of another European Spoke in Germany. The Germany Spoke is expected to have a recycling capacity of at least 10,000 tonnes (2 GWh equivalent) per year, and is expected to be operational in 2023. We have leased a site in Magdenburg, Germany, approximately 160 kilometers from Berlin, for our Germany Spoke.Capital Costs of the Spoke Capital Projects
We expect our total investment to construct, commission and commence operations for the Spoke Capital Projects (including the Arizona Spoke, the Alabama Spoke, the Ohio Spoke, the Norway Spoke and the Germany Spoke) to be approximately $60.0 million. As of April 30, 2022, we had spent approximately $16.4 million on detailed engineering, equipment procurement and facility-related expenditures in connection with the Spoke Capital Projects (including the Arizona Spoke).
Additional Spokes
Li-Cycle
plans to develop additional Spokes in North America, as well as Europe and the Asia Pacific region. In furtherance of these plans,Li-Cycle
opened a new Spoke Fulfillment Centre in Kingston, Ontario in October 2021 whereLi-Cycle
plans to fabricate and assemble on a custom basis machinery and equipment for future Spoke recycling lines. These assembled lines will be modular and able to be shipped to, and installed at, any new Spoke site.Hub Capital Projects
Rochester Hub
Li-Cycle’s
first commercial Hub will be located in Rochester, New York, and is currently under construction. The location for the Rochester Hub was specifically selected due to the nature of the infrastructure72
available at the site, including utilities and road/rail networks.
Li-Cycle’s
Spoke facilities in North America will be the primary suppliers of feedstock known as black mass for the Rochester Hub.Li-Cycle
expects that the Rochester Hub will result in over 200 additional employment positions at its operations.Li-Cycle completed a definitive feasibility study for the Rochester Hub in December 2021. Based on the definitive feasibility study, Li-Cycle estimates that the Rochester Hub will be able to process battery material that is equivalent to approximately 225,000 EVs per year. Li-Cycle expects the Rochester Hub will have the nameplate input capacity to process 35,000 tonnes of black mass annually (equivalent to approximately 90,000 tonnes or 18 GWh of lithium-ion battery equivalent feed annually), resulting in expected output capacity of approximately 42,000 to 48,000 tonnes per annum of nickel sulphate, 7,500 to 8,500 tonnes per annum of lithium carbonate and 6,500 to 7,500 tonnes per annum of cobalt sulphate. Li-Cycle estimates that the Rochester Hub will require a total capital investment of approximately $485 million (+/-15%), based on the results of the definitive feasibility study, which can be funded from existing balance sheet cash and cash equivalents.
Li-Cycle
has engaged Hatch Ltd. as its engineering and procurement contractor. Hatch Ltd. is also providing select construction management services such as onsite field engineering support and overall project scheduling for the Rochester Hub. Procurement activities have commenced on all equipment and select construction materials for the Rochester Hub.Li-Cycle
commenced construction on the Rochester Hub site in January 2022 and has engaged Mastec Inc. as its general contractor. The Company expects the Rochester Hub to commence commissioning in phases in calendar 2023.As of April 30, 2022,
Li-Cycle
had spent approximately $45.4 million on the engineering, construction and development of the Rochester Hub.Li-Cycle
has been granted a special permit, overall site plan approval, and a special use permit with an area variance for hazardous material storage tanks from the Town of Greece, New York, all subject to certain conditions. The New York State Environmental Quality Review Act (“SEQRA”) process was completed in November 2021. The New York State Department of Environmental Conservation (“NYSDEC”) issued a state facility air permit for the expected emissions from the Rochester Hub in March 2022, which is a key permitting step to advance the construction process from earthworks to the construction of permanent infrastructure.The remaining anticipated regulatory and other approvals required to develop and construct the Rochester Hub consist of construction and building permits from the Town of Greece, as well as the monitoring of storm water discharge, chemical bulk storage registration, and petroleum bulk storage registration all granted by the NYSDEC.
Liquidity and Capital Resources
Sources of Liquidity
We intend to meet our currently anticipated capital requirements through cash on hand. As a result of the Business Combination and related private placement of common shares (the “PIPE Financing”) on August 10, 2021 and the KSP Note issued on September 29, 2021, we significantly
de-levered
our balance sheet and have no material debt maturities until September 29, 2026. As at April 30, 2022, we had $509.3 million of cash and cash equivalents on hand and convertible debt of $88.5 million.Currently, our primary need for liquidity is to fund working capital requirements of our business, capital expenditures related to the development and construction of our Rochester Hub and new Spoke facilities, debt service obligations and general corporate purposes. Our primary source of liquidity is the funds raised from the Business Combination, the PIPE Financing, the 2021 Convertible Notes financing completed in September 2021, the LG Subscription and the Glencore Convertible Note financing, as well as funds generated by operating activities.
73
Our capital and operating expenditures have increased, and we expect will continue to increase, significantly in connection with our ongoing activities, as we: complete the development and construction of the Rochester Hub; complete the development and construction of the Spoke Capital Projects; expand globally with the deployment of additional Spokes and Hubs, including through acquisitions and/or through joint ventures or other contractual arrangements; continue to invest in our technology, R&D efforts and the expansion of our intellectual property portfolio; increase our investment in logistics infrastructure for the transportation of intermediate products from Spokes to Hubs; obtain, maintain and improve our operational, financial and management information systems; hire additional personnel; and operate as a public company.
Our ability to fund our capital and operating expenditures, make scheduled debt payments and repay or refinance indebtedness depends on our future operating performance and cash flows, which will be affected by prevailing economic conditions and financial, business and other factors, some of which are beyond our control, includingterm, we expect we will need to secure additional equity and debt financing to continue to fund our current growth strategy. Such additional funds may not be available when we need them on terms that are acceptable to us, or at all.
COVID-19.
Over themid-to-longer
Debt Obligations
On December 16, 2019,
Li-Cycle
entered into a binding agreement with BDC Capital Inc. for a loan of $5.3 million to help finance the expansion plans ofLi-Cycle
(the “BDC Capital Loan”). The maturity date of the loan was December 14, 2023 and the entire principal amount was funded, which funding was consummated in three tranches based on the achievement of specific milestones byLi-Cycle.
The base rate of interest was 16% per annum, paid monthly, plus additional accrued interest in kind of 3% that could be reduced to 0% based on the achievement of certain milestones byLi-Cycle.
Principal payments began on the first anniversary date of the loan and could be made at $0.13 million per month with a balloon payment of $0.5 million at maturity.On August 11, 2021, in accordance with an agreement to repay the BDC Capital Loan in full upon the closing of the Business Combination,
Li-Cycle
repaid the BDC Capital Loan balance in full.On June 16, 2021,
Li-Cycle
issued promissory notes (the “Promissory Notes”) for an aggregate principal amount of $7.0 million as consideration for loans received from entities affiliated with the Chief Executive Officer and the Executive Chair ofLi-Cycle.
The Promissory Notes bore interest at the rate of 10% per annum and had a maturity date of December 15, 2023. The Promissory Notes were unsecured and subordinate to indebtedness owing toLi-Cycle’s
senior lender, BDC Capital Inc.Li-Cycle
had the option of prepaying all or any portion of the principal and accrued interest of the Promissory Notes prior to the maturity date without penalty, subject to certain conditions. On August 17, 2021,Li-Cycle
repaid the Promissory Notes and accrued interest in full.On September 29, 2021, the Company entered into a Note Purchase Agreement (the “KSP Note Purchase Agreement”) with Spring Creek Capital, LLC (“Spring Creek Capital”) (an affiliate of Koch Strategic Platforms, LLC, or “KSP”) and issued to Spring Creek Capital, under the KSP Note Purchase Agreement, an unsecured convertible note, as amended from time to time, in the principal amount of $100 million (the “KSP Note”), in a transaction exempt from registration pursuant to Section 4(a)(2) of the Securities Act. On December 31, 2021, the Company issued an additional unsecured convertible note to Spring Creek Capital in the amount of $1,827,778 in satisfaction of the interest due and payable on the KSP Note (a “PIK Note” and together with any other additional unsecured convertible notes issued in satisfaction of interest due and payable, the “PIK Notes”). On May 1, 2022, Spring Creek Capital assigned the KSP Note and the then-outstanding PIK Notes to an affiliate, Wood River Capital, LLC (“Wood River Capital”) and each of Spring Creek Capital and Wood River Capital signed a joinder agreement under which Wood River Capital agreed to become a party to, to be bound by and to comply with the KSP Note Purchase Agreement and KSP Standstill Agreement; provided, however, that such assignment did not relieve Spring Creek Capital of its obligations thereunder. On June 30, 2022, the Company issued a PIK Note to Wood River Capital in the amount of $4,095,740. The KSP Note any and PIK Notes issued
74
in satisfaction of interest due and payable thereon are referred to collectively as the “2021 Convertible Notes”, which as of the date of this prospectus, comprise the following:
Note | Date issued | Amount issued | ||
KSP Note | September 29, 2021 | $100,000,000 | ||
PIK Note | December 31, 2021 | $1,827,778 | ||
PIK Note | June 30, 2022 | $4,095,740 |
The 2021 Convertible Notes mature five years from the date of first issuance (September 29, 2026) and accrue interest from the date of issuance at the London Interbank Offer Rate (LIBOR) plus five percent (5%) per annum. Interest on the 2021 Convertible Notes is payable on a semi-annual basis, either in cash or by(“PIK”), at the Company’s option, beginning on December 31, 2021. Interest on PIK amounts accrues at LIBOR plus six percent (6%) per annum. Under the terms of the investment, LIBOR has a floor of 1% and a cap of 2%. On March 5, 2021, The Financial Conduit Authority announced the retirement of the LIBOR rate, ceasing the publication of the LIBOR rate relevant to the 2021 Convertible Notes as of June 30, 2023. Once the LIBOR interest rate is no longer published, the interest rate will instead be based on the sum of the Secured Overnight Financing Rate (“SOFR”) and the average spread between the SOFR and LIBOR during the three-month period ending on the date on which LIBOR ceases to be published.
payment-in-kind
The principal and accrued interest owing under the 2021 Convertible Notes may be converted at any time by the holder into the Company’s common shares, at a per share price equal to $13.43 (the “Conversion Price”). If the closing price per share of the Company’s common shares on the New York Stock Exchange is above $17.46 for 20 consecutive trading days, the Company may elect to convert the principal and accrued interest owing under the 2021 Convertible Notes, plus a make-whole amount equal to the undiscounted interest payments that would have otherwise been payable through maturity (the “Make-Whole Amount”) into the Company’s common shares at the Conversion Price.
The Company may redeem the 2021 Convertible Notes at any time by payment in cash of an amount equal to 130% of the principal amount of the 2021 Convertible Notes and all accrued interest owing under the 2021 Convertible Notes, plus the Make-Whole Amount. Upon a change of control transaction, the Company will be required to redeem the 2021 Convertible Notes by payment in cash of an amount equal to the outstanding principal amount of the 2021 Convertible Notes and all accrued interest owing under the 2021 Convertible Notes, plus the Make-Whole Amount.
The 2021 Convertible Notes are subject to certain events of default, the occurrence of which would give the holder the right to require the Company to redeem the 2021 Convertible Notes by payment in cash of an amount equal to the outstanding principal amount of the 2021 Convertible Notes and all accrued interest owing thereunder the 2021 Convertible Notes, plus the Make-Whole Amount. The KSP Note Purchase Agreement contains certain customary representations, warranties and covenants by and for the benefit of the parties.
The Company granted certain registration rights to the holder of the 2021 Convertible Notes under the KSP Note Purchase Agreement. The Company has filed a registration statement for the benefit of the holder of the 2021 Convertible Notes in accordance with those registration rights and has agreed to keep the registration statement (or another shelf registration statement covering the common shares issued or issuable upon conversion of the 2021 Convertible Notes) effective until the earlier of (x) the third anniversary of the first issuance of the 2021 Convertible Notes or (y) the date on which the holder of the 2021 Convertible Notes ceases to hold any common shares issued or upon conversion of the 2021 Convertible Notes.
On September 29, 2021, in connection with the 2021 Convertible Notes investment, the Company, KSP and Spring Creek Capital entered into a Standstill Agreement (the “KSP Standstill Agreement”), which restricts KSP, Spring Creek Capital and their affiliates (including Wood River Capital) from taking certain actions until the
75
later of the conversion of the 2021 Convertible Notes in full or twelve months from the first issuance of the 2021 Convertible Notes (the “KSP Standstill Period”). The actions that KSP, Spring Creek Capital and their affiliates (including Wood River Capital) are restricted from taking during the KSP Standstill Period include, among others, (A) the acquisition of additional voting securities of the Company if, after giving effect to such acquisition, KSP and its subsidiaries and affiliates would beneficially own or exercise control or direction over voting securities of the Company having aggregate voting rights equal to or greater than 9.9% of the aggregate voting power of the Company (B) any tender or exchange offer, take-over bid, merger, business combination and certain other transactions involving the Company and its securities, (C) any solicitation of proxies or votes or other attempt to influence votes by any holder of the Company’s securities and (D) formation of a “group” (as defined under the U.S. Securities Exchange Act of 1934) with respect to the Company’s securities.
On May 5, 2022,
Li-Cycle
announced entry into a note purchase agreement with Glencore in connection with a proposed $200,000,000 investment by Glencore in the Company through the purchase of a five-year convertible note, subject to the parties entering into certain commercial agreements.On May 5, 2022, the Company and Wood River Capital entered into a consent and amendment agreement pursuant to which Wood River Capital consented to the issuance of the Glencore Convertible Note and the parties amended certain investor consent-related provisions of the 2021 Convertible Notes.
On May 31, 2022, pursuant to the note purchase agreement entered into by the Company and Glencore on May 5, 2022, the Company issued to Glencore the Glencore Convertible Note in the aggregate principal amount of $200,000,000, in a transaction exempt from registration under the Securities Act. The Glencore Convertible Note matures five years from the date of issuance and interest on the Glencore Convertible Note is payable on a semi-annual basis, either in cash or by PIK, at the Company’s option, beginning on May 31, 2022. The Glencore Convertible Note accrues interest from the date of issuance at the forward-looking term rate based on SOFR for a tenor comparable to the relevant interest payment period plus 0.42826% (the “Floating Rate”) plus 5% per annum if interest is paid in cash and plus 6% per annum if interest is paid in PIK. The Floating Rate has a floor of 1% and a cap of 2%. The obligations of the Company to make any payment on account of the principal of and interest on the Glencore Convertible Note are subordinate and junior in right of payment and upon liquidation to the Company’s obligations to the holders of all current and future senior indebtedness of the Company.
The principal and accrued interest owing under the Glencore Convertible Note may be converted at any time by the holder into the Company’s common shares at a per share price equal to $9.95 (the “Conversion Price”), subject to adjustments. The Company may redeem the Glencore Convertible Note at any time by payment of an amount in cash equal to 100% of the outstanding principal amount of the Glencore Convertible Note and all accrued interest owing under the Glencore Convertible Note. In connection with any optional redemption and provided that the holder of the Glencore Convertible Note has not elected to convert the Glencore Convertible Note into common shares following receipt of notice of such optional redemption, the Company must issue warrants (the “Glencore Warrants”) to the holder of the Glencore Convertible Note on the optional redemption date that entitle the holder to acquire, until the maturity date of the Glencore Convertible Note, a number of common shares equal to the principal amount of the Glencore Convertible Note being redeemed divided by the then applicable Conversion Price. The initial exercise price of the Glencore Warrants will be equal to the Conversion Price as of the optional redemption date.
The Glencore Convertible Note is subject to certain events of default, the occurrence of which would give the holder the right to require the Company to redeem the Glencore Convertible Note by payment of an amount in cash equal to the outstanding principal amount of the Glencore Convertible Note and all accrued interest owing under the Glencore Convertible Note, plus a make-whole amount equal to the undiscounted interest payments that would have otherwise been payable through maturity (the “Make-Whole Amount”). In addition, the occurrence of certain bankruptcy-related events of default renders the outstanding principal amount of the Glencore Convertible Note, all accrued interest owing thereunder and the Make-Whole Amount immediately due and payable.
76
Upon a change of control transaction, the Company will be required to redeem the Glencore Convertible Note by payment of an amount in cash equal to the outstanding principal amount of the Glencore Convertible Note and all accrued interest owing under the Glencore Convertible Note, plus the Make-Whole Amount. Glencore has agreed to certain transfer restrictions with respect to the common shares issued or issuable upon conversion of the Glencore Convertible Note, including that Glencore will not transfer such common shares other than to permitted transferees until May 5, 2024. Subject to certain exceptions, limitations, and applicable law, Glencore will, pursuant to the Note Purchase Agreement, be entitled to nominate one individual to the Board of Directors of the Company. Pursuant to the exercise of that right, Kunal Sinha, Glencore’s Head of Recycling, has been appointed to the Company’s Board of Directors.
The Company granted certain registration rights to the holder of the Glencore Convertible under a registration rights agreement. Under the registration rights agreement, the Company is required to file a resale registration statement covering the resale of the common shares issuable upon conversion of the Glencore Convertible Note and upon exercise of the Glencore Warrants within 45 days after notice of such request from the holder of the Glencore Convertible Note. The Company agreed to keep the registration statement (or another shelf registration statement covering the common shares issued or issuable upon conversion of the Glencore Convertible Note and upon exercise of the Glencore Warrants) effective until three years after the holder’s receipt of the common shares issued upon conversion of the Glencore Convertible Note or upon exercise of the Glencore Warrants, as applicable.
On May 31, 2022, in connection with the issuance of the Glencore Convertible Note, the Company, Glencore and Glencore plc (the “Glencore Parent”) entered into an amended and restated standstill agreement (the “Glencore Standstill Agreement”), which restricts Glencore, the Glencore Parent and their affiliates from taking certain actions until the five years from the date of the Glencore Standstill Agreement (the “Glencore Standstill Period”). The actions that Glencore, the Glencore Parent and their affiliates are restricted from taking during the Glencore Standstill Period include, among others, (A) the acquisition of additional voting securities or of any debt, material assets or material businesses of the Company, provided that Glencore and the Glencore Parent may acquire voting securities of the Company so long as the aggregate beneficial ownership of such securities does not exceed 5.0% of the then-outstanding voting securities of the Company ,(B) any tender or exchange offer, merger, business combination and certain other transactions involving the Company and its securities, (C) any solicitation of proxies or votes or other attempt to influence votes by any holder of the Company’s securities and (D) formation of a “group” (as defined under the Securities Exchange Act of 1934) with respect to the Company’s securities.
Cash Flows Summary
Presented below is a summary of
Li-Cycle’s
operating, investing, and financing cash flows for the periods indicated:Three months ended April 30, | Six months ended April 30, | Twelve months ended October 31, | ||||||||||||||||||||||||||
2022 | 2021 | 2022 | 2021 | 2021 | 2020 | 2019 | ||||||||||||||||||||||
(in thousands) | (in thousands) | (in thousands) | ||||||||||||||||||||||||||
Cash flows used in operating activities | $ | (17,200 | ) | $ | (5,694 | ) | $ | (38,635 | ) | $ | (12,622 | ) | $ | (27,877 | ) | $ | (7,429 | ) | $ | (4,568 | ) | |||||||
Cash flows used in investing activities | (24,995 | ) | (2,852 | ) | (47,407 | ) | (5,451 | ) | (18,203 | ) | (5,108 | ) | (998 | ) | ||||||||||||||
Cash flows from financing activities | (731 | ) | 1,059 | (1,500 | ) | 23,736 | 642,276 | 9,417 | 7,164 | |||||||||||||||||||
Net change in cash | $ | (42,927 | ) | $ | (7,487 | ) | $ | (87,543 | ) | $ | 5,662 | $ | 596,195 | $ | (3,120 | ) | $ | 1,598 | ||||||||||
77
Cash Flows Used in Operating Activities
For the three and six months ended April 30, 2022, cash flows used in operating activities were approximately $17.2 million and $38.6 million, respectively, and were primarily driven by the growth and expansion of
Li-Cycle’s
operations and commercial footprint. The period over period increase in cash flows used in operating activities for the three and six months ended April 30, 2022 were primarily the result of an increase in operating expenses of $24.4 million and $39.7 million, respectively, compared to the corresponding period in 2021.For the twelve months ended October 31, 2021, cash flows used in operating activities were approximately $27.9 million and were primarily driven by the growth and commercialization of
Li-Cycle’s
operations, which included adding headcount,ramp-up
phase production costs at the Rochester Spoke, R&D expenses, and consulting costs relating to the development of the Rochester Hub. The period over period increase in cash flows used in operating activities for the twelve months ended October 31, 2021 was primarily the result of an increase in operating expenses of $29.3 million for that period, as compared to the corresponding period in 2020, partially offset by cash receipts from increased sales in the twelve months ended October 31, 2021 as compared to the corresponding period in 2020.For the years ended October 31, 2020 and 2019, cash flows used in operating activities were approximately $7.4 million and $4.6 million, respectively and in each case were primarily driven by the growth and commercialization of
Li-Cycle’s
operations, including headcount, R&D, and extensive third-party consulting costs relating to the development of the Rochester Hub. The year over year increase in cash flows used in operating activities for 2020 were primarily the result of an increase in operating expenses by $5.8 million, partially offset by an increase in accounts payable and accrued liabilities.Cash Flows Used in Investing Activities
For the three and six months ended April 30, 2022, cash flows used in investing activities were primarily driven by the acquisition of equipment and leasehold improvements for the Spoke Capital Projects and the Rochester Hub. For the three and six months ended April 30, 2021, cash flows used in investing activities were primarily driven by the acquisition of equipment and leasehold improvements for the Ontario Spoke and New York Spoke.
For the twelve months ended October 31, 2021, cash flows used in investing activities were primarily driven by the acquisition of equipment and leasehold improvements for the Arizona Spoke, Rochester Spoke and the Rochester Hub. For the twelve months ended October 31, 2020, cash flows used in investing activities were primarily driven by the acquisition of equipment and leasehold improvements for the Kingston Spoke and Rochester Spoke.
For the years ended October 31, 2020 and 2019, cash flows used in investing activities were primarily driven by the acquisition of equipment and leasehold improvements for
Li-Cycle’s
two operating Spokes.Cash Flows from Financing Activities
Cash flows used in financing activities in the three and six months ended April 30, 2022 related primarily to the repayment of lease liabilities whereas, in the three and six months ended April 30, 2021, cash flows from financing activities related to a private placement of 281,138 Class A shares of
Li-Cycle
Corp in November 2020.Cash flows generated from financing activities in the twelve months ended October 31, 2021 related primarily to capital raising through the issuance of common shares and net proceeds from convertible debt. In the twelve months ended October 31, 2021,
Li-Cycle
received net proceeds of $525.3 million from the Business Combination with Peridot and $98.4 million from the issuance of convertible note to Spring Creek Capital. In the78
twelve months ended October 31, 2021,
Li-Cycle
repaid $4.4 million of loan in full to BDC Capital Inc and repaid $7 million of Promissory Notes in full to entities affiliated with the Chief Executive Officer and the Executive Chair ofLi-Cycle.
In the twelve months ended October 31, 2021, in addition to the activities mentioned above,Li-Cycle
received net proceeds of $21.6 million from a private placement of 281,138 Class A shares ofLi-Cycle
Corp in November 2020. In the twelve months ended October 31, 2020, cash flows from financing activities related to a private placement of Class A shares ofLi-Cycle’s
Corp., a loan advance of $2.3 million from BDC Capital Inc., and proceeds from government grants of $1.2 million.For the twelve months ended October 2020 and 2019, cash flows generated from financing activities relate primarily to capital raising through the issuance of common shares. Amounts generated in 2019 and 2020 relate to
Li-Cycle’s
Series B round. Additionally, in 2020,Li-Cycle
completed a debt facility with BDC Capital for $5.3 million, of which $2.3 million was funded in the year.Li-Cycle
also received government grants of $1.2 million, $1.7 million and $0.1 million in the years ended October 31, 2020, and 2019 respectively.Contractual Obligations and Commitments
The following table summarizes
Li-Cycle’s
contractual obligations and other commitments for cash expenditures as of April 30, 2022, and the years in which these obligations are due.Payment due by period (in thousands) | ||||||||||||||||||||
Contractual Obligations | Total | Less than 1 year | 1 – 3 years | 3 – 5 years | More than 5 years | |||||||||||||||
Accounts payable and accrued liabilities | $ | 45,158 | $ | 45,158 | $ | — | $ | — | — | |||||||||||
Lease liabilities | 46,929 | 6,807 | 10,113 | 8,579 | 21,430 | |||||||||||||||
Loan payable | 41 | 7 | 15 | 15 | 3 | |||||||||||||||
Restoration provisions | 302 | 85 | — | 55 | 163 | |||||||||||||||
Convertible debt principal | 130,000 | — | — | 130,000 | — | |||||||||||||||
Convertible debt interest | 15,245 | — | — | 15,245 | — | |||||||||||||||
Total as of April 30, 2022 | 237,675 | 52,058 | 10,128 | 153,893 | 21,595 | |||||||||||||||
As of April 30, 2022, there were $176.7 million in committed purchase orders or agreements for equipment and services, compared to $6.9 million as of October 31, 2021.
We expect
Li-Cycle
to enter into premises leases for additional Spokes and/or Hubs in the fiscal year end ending October 31, 2022.Capital Expenditures
For a discussion of our currently contemplated capital investments, please see “—” and “—”.
Spoke Capital Projects —Capital Costs of the Spoke Capital Projects
Hub Projects — Rochester Hub
Related Party Transactions
Related-Party Lease
From January 1, 2019 to December 31, 2021, the Company leased certain office space from Ashlin BPG Marketing, which is controlled by certain members of the immediate family of the Company’s President and Chief Executive Officer. Under the terms of the lease, the Company was required to pay Cdn. $4,500 per month plus applicable taxes, subject to 60 days’ notice of termination. Li-Cycle terminated the lease, effective December 31, 2021. During the twelve months ended October 31, 2021, the Company incurred expenses of $39,866 in relation to this vendor, as compared to $35,505 for the twelve months ended October 31, 2020. During the three and six months ended April 30, 2022, the Company incurred expenses of nil and $6,358 in relation to this vendor, compared to $11,155 and $17,353 for the three and six months ended April 30, 2021, respectively.
79
Related-Party Expenses
The Company has engaged Fade In Production Pty. Ltd., which is controlled by certain members of the immediate family of the Executive Chair of
Li-Cycle,
to provide it with corporate video production services since 2017. During the twelve months ended October 31, 2021, the Company incurred expenses of $145,851 attributable to this vendor, as compared to $42,739 for the twelve months ended October 31, 2020. During the three and six months ended April 30, 2022, the Company incurred expenses of $105,372 and $107,472 in relation to this vendor, compared to $69,347 and $97,005 for the three and six months ended April 30, 2021, respectively.The Company has engaged Ashlin BPG Marketing, a related party as described above, to provide it with
Li-Cycle
branded promotional products for both customers and employees since April 1, 2020. During the twelve months ended October 31, 2021, the Company incurred expenses of $46,640 attributable to this vendor, as compared to $5,405 for the twelve months ended October 31, 2020. During the three and six months ended April 30, 2022, the Company incurred expenses of $11,486 and $45,265 attributable to this vendor, compared to $4,415 and $23,688 for the three and six months ended April 30, 2021, respectively.The Company has engaged Consulero Inc., which is controlled by certain members of the immediate family of the Company’s President and Chief Executive Officer, to provide it with technology services in relation to the Company’s inventory management system since September 1, 2020. During the twelve months ended October 31, 2021, the Company incurred expenses of $103,040 attributable to this vendor, as compared to $46,515 for the twelve months ended October 31, 2020. During the three and six months ended April 30, 2022, the Company incurred expenses of $25,252 and $47,355 attributable to this vendor, compared to $22,153 and $58,279 for the three and six months ended April 30, 2021, respectively.
Consulting Agreement
On May 1, 2020,
Li-Cycle
entered into a consulting agreement with Atria Limited (“Atria”), an entity which beneficially owned more than 5% of the outstandingLi-Cycle
Corp. common shares at that time, to agree upon and finalize the consideration for certain business development and marketing consulting services that were previously performed on behalf ofLi-Cycle
from 2018 through April 2020. The fees for such services were agreed at 12,000 common shares ofLi-Cycle
Corp., payable in installments of 1,000 shares per month. On January 25, 2021,Li-Cycle
issued all of the 12,000 shares to Atria as full and final satisfaction of all obligations ofLi-Cycle
to Atria under the consulting agreement. Atria also directed the issuance of such shares as follows: 8,000 Shares to Atria; 2,000 Shares to Pella Ventures (an affiliated company of Atria); and 2,000 Shares to a director ofLi-Cycle
Corp. at the time, who is not related to Atria.Director Consulting Agreements
Under the terms of an agreement dated July 19, 2019 between
Li-Cycle
and Anthony Tse, Mr. Tse provided consulting services toLi-Cycle
in relation to the proposed expansion of its operations in Asia and was entitled to a fee of $4,700 per month for such services. For the twelve months ended October 31, 2021, Mr. Tse was paid aggregate fees under this agreement of $56,400. During the three and six months ended April 30, 2022, Mr. Tse was paid aggregate fees under this agreement of nil and $14,100, compared to $14,100 and $28,200 for the three and six months ended April 30, 2021. The consulting agreement was terminated on January 19, 2022.Under the terms of a consulting agreement dated July 19, 2019 between
Li-Cycle
and Rick Findlay, for the twelve months ended October 31, 2020, Mr. Findlay was paid aggregate fees of $1,332. For the twelve months ended October 31, 2021, there were no fees paid. The consulting agreement was terminated on June 25, 2021.Promissory Notes
On June 16, 2021,
Li-Cycle
issued promissory notes (the “Promissory Notes”) for an aggregate principal amount of $7,000,000 as consideration for loans received from entities affiliated with the Chief Executive Officer and the Executive Chair ofLi-Cycle,
respectively. The Promissory Notes bore interest at the rate of 10%80
per annum and had a maturity date of December 15, 2023. The Promissory Notes were unsecured and subordinate to indebtedness owing to
Li-Cycle’s
senior lender, BDC Capital Inc.Li-Cycle
had the option of prepaying all or any portion of the principal and accrued interest of the Promissory Notes prior to the maturity date without penalty, subject to certain conditions. On August 17, 2021,Li-Cycle
repaid the Promissory Notes and accrued interest in full, for a total of $7,113,151.Off-Balance
Sheet ArrangementsDuring the periods presented,
Li-Cycle
did not have any relationships with unconsolidated organizations or financial partnerships, such as structured finance or special purpose entities, which were established for the purpose of facilitatingoff-balance
sheet arrangements.Critical Accounting Policies and Estimates
Li-Cycle’s
condensed consolidated interim financial statements for the three and six months ended April 30, 2022 and 2021 have been prepared in accordance with IFRS under International Accounting Standard (IAS) 34 using the significant accounting policies and measurement bases that are in effect as of April 30, 2022, as summarized in Note 2 to the condensed consolidated interim financial statements. These were used throughout all periods presented with any applicable changes noted in the condensed consolidated interim financial statements ofLi-Cycle
for the three and six months ended April 30, 2022 and 2021.Li-Cycle’s
consolidated annual financial statements have been prepared in conformity with IFRS using the significant accounting policies and measurement bases in effect at October 31, 2021, as summarized in Note 2 of the accompanying financial statements ofLi-Cycle
for the twelve months ended October 31, 2021, which were used throughout all periods presented in the consolidated financial statements, with any applicable changes in Note 2 of the accompanying financial statements ofLi-Cycle
for the twelve months ended October 31, 2021.Revenue
Revenue is measured based on the consideration to which the Company expects to be entitled to in a contract with a customer. The Company recognizes revenue when it transfers control of a product or service to a customer. There are no significant financing components associated with the Company’s payment terms.
Recycling Services revenue is recognized at a point in time upon completion of the services. Prices for services are separately identifiable within each contract. A receivable is recognized by the Company when the services are completed as this represents the point in time at which the right to consideration becomes unconditional, as only the passage of time is required before payment is due.
For sale of products, revenue is recognized when control of the goods has transferred, being when the goods have been shipped to the customer’s location (delivery). A receivable is recognized by the Company when the goods are delivered to the customer as this represents the point in time at which the right to consideration becomes unconditional, as only the passage of time is required before payment is due. The initial revenue recognized is based on commodity prices at the time of delivery. The Company estimates the amount of consideration to which it expects to be entitled under provisional pricing arrangements. The amount of consideration for black mass and mixed copper and aluminum shred sales is based on the mathematical product of: (i) market prices of the constituent metals at the date of settlement, (ii) product weight, and (iii) assay results (ratio of the constituent metals initially estimated by management and subsequently trued up to customer confirmation). Certain adjustments like handling and refining charges are also made per contractual terms with customers. Depending on the contractual terms with customers, the payment of receivables may take up to 12 months from date of shipment. Product sales and the related trade accounts receivables are measured at fair value at initial recognition and are
re-estimated
at each reporting period end using the market prices of the constituent metals at the respective measurement dates. Changes in fair value are recognized as an adjustment to profit and loss and the related accounts receivable.81
Given the significance of revenue and the level of judgment involved in the provisional pricing, revenue recognition is considered a critical accounting policy.
Convertible debt instruments
The components of convertible debt instruments issued by the Company are classified separately as financial liabilities and equity in accordance with the substance of the contractual arrangements and the definitions of a financial liability and an equity instrument. The debt element of the instruments is classified as a liability and recorded as the present value of the Company’s obligation to make future interest payments in cash and settle the redemption value of the instrument in cash. The carrying value of the debt element is accreted to the original face value of the instruments, over their life, using the effective interest method. If the conversion option is classified as equity, its value is determined by deducting the amount of the liability component from the fair value of the compound instrument as a whole. If the conversion option is classified as a liability and requires bifurcation, it is bifurcated as an embedded derivative unless the issuer elects to apply the fair value option to the convertible debt. The embedded derivative liability is initially recognized at fair value and classified as derivatives in the statement of financial position. Changes in the fair value of the embedded derivative liability are subsequently accounted for directly through the income statement.
De-SPAC
TransactionThe Company finalized the business combination with Peridot Acquisition Corp. (“Peridot”) on August 10, 2021. Upon closing, the combined company was renamed
Li-Cycle
Holdings Corp. While Peridot is the legal acquirer ofLi-Cycle
Corp.,Li-Cycle
Corp. was identified as the acquirer for accounting purposes. As Peridot did not meet the definition of a business as defined in IFRS 3 Business Combinations, the acquisition was not within the scope of IFRS 3 and was accounted for as a share-based payment transaction in accordance with IFRS 2 Share-based Payment. The consolidated financial statements represent the continuance ofLi-Cycle
Corp. and reflect Peridot’s identifiable assets acquired and the liabilities assumed measured at fair value. Under IFRS 2, the transaction was measured at the fair value of the consideration deemed to have been issued byLi-Cycle
Corp., in order for the ownership interest in the combined entity to be the same as if the transaction had taken the legal form ofLi-Cycle
Corp. acquiring 100% of Peridot Acquisition Corp. The difference between the fair value of the consideration deemed to have been transferred represents a Listing Fee.As the transaction is
non-routine
and involves a high degree of accounting and reporting complexity, the accounting treatment for theDe-SPAC
transaction is therefore considered a critical accounting policy.Outstanding Share Data
As of July 22, 2022, and including the results of the redemption of outstanding warrants to purchase common shares of the Company,
Li-Cycle
had the following issued and outstanding common shares, common shares issuable upon conversion of the convertible debt and upon exercise of stock options and restricted share units:Number of common shares outstanding or issuable upon conversion or exercise | ||||
Common shares outstanding | 175,383,580 | |||
Convertible debt | 28,161,273 | |||
Stock options | 4,812,105 | |||
Restricted share units | 2,251,720 | |||
On December 27, 2021,
Li-Cycle
issued a notice of redemption indicating that it would redeem on January 26, 2022 (the “Redemption Date”), all of its outstanding warrants. At any time prior to 5:00 p.m. New York City time on the Redemption Date, the warrants could have been: (i) exercised by holders, at an exercise82
price of $11.50 per common share; or (ii) surrendered by holders on a “cashless basis” (a “Make-Whole Exercise”), in which case the surrendering holder received a number of common shares determined in accordance with the terms of the Warrant Agreement. On January 11, 2022,
Li-Cycle
issued a notice indicating that holders who surrendered their warrants pursuant to the Make-Whole Exercise received 0.253 common shares per warrant. As of January 31, 2022, (i) 9,678 warrants were exercised at the exercise price of $11.50 per common share, and (ii) 22,540,651 warrants were surrendered by holders in a Make-Whole Exercise, together resulting in the issuance of an additional 5,712,322 common shares. On the Redemption Date, the remaining 449,665 unexercised warrants were redeemed at $0.10 per warrant.Disclosure Controls and Procedures
Li-Cycle
maintains a set of disclosure controls and procedures (as defined in Multilateral Instrument52-109)
designed to provide reasonable assurance that information required to be disclosed in its public filings or otherwise under securities legislation is recorded, processed, summarized and reported on a timely basis and that such controls and procedures are designed to ensure that information required to be so disclosed is accumulated and communicated to its management, including its certifying officers, as appropriate to allow timely decisions regarding required disclosure. With the supervision and participation ofLi-Cycle’s
senior management team, the Chief Executive Officer ofLi-Cycle
(the “CEO”) and the Chief Financial Officer (“CFO”) ofLi-Cycle
have evaluated the effectiveness of the disclosure controls and procedures ofLi-Cycle
as of October 31, 2021. Based on that evaluation, those officers have concluded that, as of October 31, 2021, such disclosure controls and procedures were effective to provide reasonable assurance that (i) material information relating toLi-Cycle
was made known to management, and (ii) information required to be disclosed byLi-Cycle
in its annual filings, interim filings or other reports filed or submitted by it under securities legislation is recorded, processed, summarized and reported within the time periods specified in the securities legislation.As of April 30, 2022, there have been no material changes to the Company’s disclosure controls and procedures and their design remains effective.
Internal Control Over Financial Reporting
Management is responsible for establishing, maintaining and assessing the effectiveness of adequate internal control over financial reporting (“ICFR”). The Company’s ICFR is a process designed to provide reasonable assurance regarding the reliability of financial reporting and the preparation of financial statements for external purposes in accordance with IFRS.
Prior to August 10, 2021,
Li-Cycle
was a private company and addressed internal control over financial reporting with internal accounting and financial reporting personnel and other resources. In the course of preparing for the Business Combination with Peridot Acquisition Corp,Li-Cycle
identified material weaknesses in its internal control over financial reporting. A material weakness is a deficiency, or a combination of deficiencies, in internal control over financial reporting, such that there is a reasonable possibility that a material misstatement ofLi-Cycle’s
annual or interim condensed consolidated interim financial statements may not be prevented or detected on a timely basis.For the fiscal year ended October 31, 2021,
Li-Cycle
did not have in place i) an effective control environment with formal processes and procedures and ii) an adequate number of accounting personnel with the appropriate technical training in, and experience with, IFRS to allow for a detailed review of complex accounting transactions, that would identify errors in a timely manner, including in areas such as revenue recognition, inventory, related party arrangements, financing transactions and business combination transactions.Li-Cycle
did not design or maintain effective controls over the financial statement close and reporting process in order to ensure the accurate and timely preparation of financial statements in accordance with IFRS. In addition, information technology controls, including end user and privileged access rights and appropriate segregation of duties, including for certain users the ability to create and post journal entries, were not designed or operating effectively. As of April 30, 2022, these material weaknesses have not been remediated.83
We have taken steps to address these material weaknesses and expect to continue to implement the remediation plan, which we believe will address the underlying causes. We have engaged external advisors with subject matter expertise and additional resources to provide assistance in assessing the control environment and expect to further engage these external advisors to provide assistance with all elements of the internal control over financial reporting program, including: performance of a risk assessment; documentation of process flows; design and remediation of internal controls; and evaluation of the design and operational effectiveness of our internal controls. We also expect to engage additional external advisors to provide assistance in the areas of information technology and financial accounting. We are evaluating the longer-term resource needs of our various financial functions. These remediation measures may be time consuming, costly, and might place significant demands on our financial and operational resources. We have made some upgrades to our enterprise resource planning (“ERP”) system and work on further upgrades is ongoing with the intent to further improve and enhance system functionality. Although we have made enhancements to our control procedures in this area, the material weaknesses will not be remediated until the necessary controls have been implemented and are operating effectively. We will provide an update on the progress of the remediation on a quarterly basis.
Quantitative and Qualitative Disclosures About Market Risk
Li-Cycle
is exposed to various risks in relation to financial instruments. The main types of risks are currency risk and interest rate risk. WhileLi-Cycle
may enter into hedging contracts from time to time, any change in the fair value of the contracts could be offset by changes in the underlying value of the transactions being hedged. Furthermore,Li-Cycle
does not have foreign-exchange hedging contracts in place with respect to all currencies in which it does business.Currency Risk
It is management’s opinion that
Li-Cycle
is not exposed to significant currency risk as its cash is denominated in both Canadian and U.S. dollars and funds its operations accordingly. Up to October 31, 2020, most ofLi-Cycle’s
transactions were in Canadian dollars. Effective November 1, 2020,Li-Cycle
changed its functional currency to U.S. dollars, given the shift in currency of most ofLi-Cycle’s
transactions to U.S. dollars.At April 30, 2022, the Company had Canadian dollar denominated cash of approximately Cdn. $4.1 million and Canadian dollar denominated net liabilities and loans payable of approximately Cdn. $24.8 million. The remaining amounts were denominated in U.S. dollars and immaterial amounts of other currencies. Gains and losses arising upon translation of these amounts into U.S. dollars for inclusion in the condensed consolidated interim financial statements are recorded in other income and expenses as foreign exchange. A 5% strengthening of the Canadian dollar versus the U.S. dollar, at April 30, 2022, would have increased the foreign exchange loss for the year by approximately $0.8 million while a 5% weakening of the Canadian dollar would have had approximately the equal but opposite effect. This analysis assumes that all other variables remain constant.
Interest Rate Risk
Interest rate risk is the risk arising from the effect of changes in prevailing interest rates on the Company’s financial instruments. The Company is exposed to interest rate risk, as it has variable interest rate debt in the form of convertible debt that includes an interest rate floor and cap.
Credit Risk
Financial instruments that potentially subject us to concentration of credit risk consist of cash and cash equivalents and accounts receivable. Substantially all of our cash and cash equivalents were deposited in accounts at one financial institution, and account balances may at times exceed federally insured limits. Management believes that we are not exposed to significant credit risk due to the financial strength of the depository institution in which the cash is held.
84
The Company’s revenue and accounts receivable primarily come from two key customers. The Company manages this risk by engaging with reputable multi-national corporations in stable jurisdictions and performing a review of a potential customer’s financial health prior to engaging in business.
Recently Issued Accounting Standards Not Yet Adopted
From time to time, new accounting standards, amendments to existing standards, and interpretations are issued by the IASB. Unless otherwise discussed, and as further highlighted in Note 2 to the fiscal April 30, 2022 condensed consolidated interim financial statements of
Li-Cycle
for the three and six months ended April 30, 2022 and 2021,Li-Cycle
is in the process of assessing the impact of recently issued standards or amendments to existing standards that are not yet effective.Change in Certifying Accountant
Our Audit Committee conducted a review process to consider the selection of the Company’s independent registered public accounting firm for its 2022 fiscal year, which resulted in the selection of KPMG LLP (“KPMG”) as the Company’s new external auditor.
Resignation/Dismissal of independent registered public accounting firm
On January 31, 2022, the Company, upon the recommendation of the Audit Committee and the approval of the Board, dismissed Deloitte LLP (“Deloitte”) as its independent registered public accounting firm. Deloitte’s resignation was subject to the completion of Deloitte’s audit of the Company’s financial statements for the fiscal year ended October 31, 2021, and filing of the Company’s Annual Report on January 31, 2022.
The reports of Deloitte on the Company’s consolidated financial statements for the past two fiscal years did not contain an adverse opinion or disclaimer of opinion, and were not qualified or modified as to uncertainty, audit scope or accounting principles.
In connection with the audits of the Company’s financial statements for each of the two fiscal years ended October 31, 2021, and 2020, there were no disagreements with Deloitte on any matters of accounting principles or practices, financial statement disclosure, or auditing scope and procedures which, if not resolved to the satisfaction of Deloitte, would have caused Deloitte to make reference to the matter in their report and there were no reportable events.
Engagement of new independent public accounting firm
On January 31, 2022, the Board of Directors of
Li-Cycle,
acting on the recommendation of the Audit Committee, appointed KPMG as the Company’s external auditor for its 2022 fiscal year to replace Deloitte as the Company’s independent registered public accounting firm for the fiscal year ended October 31, 2022.During the fiscal years ended October 31, 2021 and October 31, 2020 and through the date hereof, neither the Company nor anyone on its behalf has consulted with KPMG regarding: (i) the application of accounting principles to a specified transaction, either completed or proposed, or the type of audit opinion that might be rendered on the Company’s financial statements, and neither a written report nor oral advice was provided to the Company that Deloitte concluded was an important factor considered by the Company in reaching a decision as to any accounting, auditing, or financial reporting issue; (ii) any matter that was the subject of a disagreement within the meaning of Item 16F(a)(1)(iv) of Form
20-F
and the related instructions; or (iii) any reportable event within the meaning of Item 16F(a)(1)(v) of Form20-F.
The appointment of KPMG was approved at the Company’s 2022 annual meeting of shareholders.
85
MANAGEMENT
The following table sets forth our current directors and executive officers:
Directors and Executive Officers | Age | Position/Title | ||
| Ajay Kochhar | 30 | Director and President and Chief Executive Officer | ||
| Tim Johnston | 36 | Director and Executive Chairman | ||
| Mark Wellings | 58 | Director | ||
| Rick Findlay | 65 | Director | ||
| Anthony Tse | 52 | Director | ||
| Alan Levande | 66 | Director | ||
| Scott Prochazka | 56 | Director | ||
| Kunal Sinha | 42 | Director | ||
| Debbie Simpson | 55 | Chief Financial Officer | ||
| Kunal Phalpher | 38 | Chief Strategy Officer | ||
| Chris Biederman | 37 | Chief Technology Officer | ||
| Carl DeLuca | 54 | General Counsel and Corporate Secretary | ||
| Lauren Choate | 64 | Chief People Officer | ||
| Richard Storrie | 55 | Regional President, Americas | ||
| Dawei Li | 39 | Regional President, APAC |
The business address for each of the Company’s directors and executive officers is 207 Queen’s Quay West, Suite 590, Toronto, ON, M5J 1A7, Canada.
Biographical information concerning our directors and executive officers listed above is set forth below.
Ajay Kochhar
Ajay Kochhar has served as our President and Chief Executive Officer,
Co-Founder,
and a director since the consummation of the Business Combination on August 10, 2021. Before foundingLi-Cycle,
Mr. Kochhar gained extensive technology and project development experience through progressive roles with Hatch’s industrial cleantech and advisory practices. While working in that space, he garneredin-depth
engineering and project management experience through clean technology development in the lithium, cobalt, nickel, copper, gold, lead, zinc, molybdenum, and rare earth metals industries. His technical expertise spans the entire project lifecycle, from conceptual andpre-feasibility
study to construction and commissioning. Mr. Kochhar is a graduate of the University of Toronto and holds a Bachelor of Applied Science (BASc) in Chemical Engineering.Tim Johnston
Tim Johnston has served as our
Co-Founder
and Executive Chairman since the consummation of the Business Combination on August 10, 2021. With more than 15 years of experience, Mr. Johnston has overseen the development and operation of batteries, metals, industrial minerals and large infrastructure assets. In addition toco-founding
Li-Cycle,
Mr. Johnston served as a director and the chief executive officer of Desert Lion Energy Inc. (“Desert Lion”), a lithium exploration and development company whose securities were listed on the TSX Venture Exchange (the“TSX-V”),from
February 2018 to July 2019, when Desert Lion was sold to a third party. Inmid-2019,the
TSX-V
initiated a review of the Desert Lion senior management team, including Mr. Johnston, to assess their suitability to act as directors or officers of a listed issuer as a result of certain incorrect statements and omissions made by Desert Lion in its press releases for a financing transaction and its listing application with theTSX-V
for approval of the issuance of shares in connection with such transaction. On May 11, 2020, theTSX-V
made a procedural determination that requires Mr. Johnston to make a written application to and obtain the prior written acceptance from the Compliance & Disclosure Department of theTSX-V
for any proposed86
involvement by Mr. Johnston as a director or officer of (or to perform similar functions for) anyissuer. The
TSX-V-listed
TSX-V
has subsequently publicly stated that it has not reached any conclusions regarding the suitability of Mr. Johnston to be a director or officer of aTSX-V
listed company in the future.Prior to Desert Lion, Mr. Johnston worked as a Senior Consultant for Hatch, specializing in project management and transactional analysis for their global lithium business. While there, Mr. Johnston managed the development of projects across the
lithium-ion
battery value chain for companies such as SQM, Rockwood Lithium (Albemarle), Bacanora Minerals,AMG-NV,
Rio Tinto, Galaxy Resources, and other key developers. Mr. Johnston is also theCo-Founder
and Director ofLi-Metal
Corp. (LIM:CN), a Director of Lacero Solutions Inc., an Investment Committee Member of Blue Horizon Capital and an Advisory Board Member of 5E Advanced Materials in Australia. A graduate of the University of Queensland’s Mechanical Engineering Program, Mr. Johnston is a chartered professional engineer and CFA charter holder.Mark Wellings
Mark Wellings has served as a director of the Company since the consummation of the Business Combination on August 10, 2021. Mr. Wellings is a finance professional with over 30 years international experience in both the mining industry and mining finance sector. Mr. Wellings initially worked in the mining industry both in Canada and Australia in exploration, development and production capacities. He then joined the investment dealer GMP Securities L.P. where he
co-founded
the firm’s corporate finance mining practice. During over 18 years at GMP Securities L.P., Mr. Wellings was responsible for, and advised on, some of the Canadian mining industry’s largest transactions, both in equity financing and mergers and acquisitions. Since then he has been appointed to several public and private boards and is also theCo-Chairman
of Lithium Royalties Corp., the Chairman of Adventus Mining Corp., the Chairman of Superior Gold Inc. and a director ofLi-Metal
Corp. Mr. Wellings is a Professional Engineer and holds a Master of Business Administration degree and a Bachelor of Applied Science degree in Geological Engineering.Rick Findlay
Rick Findlay has served as a director of the Company since the consummation of the Business Combination on August 10, 2021. Mr. Findlay has been consulting in the environment and recycling sectors for over 25 years across Canada and internationally. This has included strategy, organization design, processing design, technology development, and financial management. From 2012 to 2014 he was Director of Oversight and Operations for the Province of Ontario’s waste diversion programs, including batteries. Mr. Findlay is currently chief executive officer of LINC it, a firm that focuses on scaling up clean technology ventures. He has previously started a few other firms, two being in environmental management and medical technology. He also
co-founded
and built an international consulting firm, PSTG Consulting, advising small to global companies across a variety of sectors, and local to national governments. Mr. Findlay is a Certified Management Consultant, with a Bachelor in Industrial Engineering and a Master of Business Administration.Anthony Tse
Anthony Tse has served as a director of the Company since the consummation of the Business Combination on August 10, 2021. Mr. Tse has over 25 years of corporate private and public company experience in numerous high-growth industries such as technology, media and telecoms, as well as resource and commodities. This has predominantly been in senior management, corporate finance, capital markets and mergers and acquisitions roles across Greater China and the Asia Pacific region. His previous senior roles include various positions in News Corporation’s STAR TV, the deputy general manager of TOM Online, Director of Corporate Development at Hutchison Whampoa’s TOM Group, President of China Entertainment Television (a joint venture between TOM and Time Warner), and chief executive officer of CSN Corp. He is currently executive director of Galaxy Resources Limited, a leading
ASX-listed
lithium producer, with diversified assets across three continents in Australia, Argentina and Canada, serving key customers in China, Japan and Korea. He joined the board of87
directors at Galaxy Resources Limited in 2010 and from June 2013 to July 2019, served as the managing director and chief executive officer during the corporate turnaround and growth stage of the company, which involved restructuring of over $500 million of debt restructuring and refinancing, as well as asset divestments. Mr. Tse is also a Director of
Li-Metal
Corp.Alan Levande
Alan Levande has served as a director of the Company since the consummation of the Business Combination on August 10, 2021. Mr. Levande was Peridot’s Chairman and Chief Executive Officer since August 2020. Mr. Levande also served as Vice Chairman of Peridot Acquisition Corp. II. Mr. Levande is a career energy executive with broad experience across the power, utilities, renewables, midstream and upstream value chains. Most recently, Mr. Levande was
Co-Chief
Executive Officer of Covey Park Energy LLC, a natural gas company that was acquired for $2.2 billion in 2019 by a public company, from June 2013 to July 2019. Previously, Mr. Levande was aCo-Founder
and Senior Managing Director at Tenaska Capital Management LLC, a $4 billion private equity manager focused on investments in the power and energy sectors, from 2003 to 2012. Mr. Levande began his career in energy investment banking, where he spent 20 years with Goldman Sachs and Salomon Brothers covering power, utilities, renewables and natural resources. In all of Mr. Levande’s prior roles, Mr. Levande was actively involved in sourcing and executing large-scale, complex mergers and acquisitions. Mr. Levande received his B.S. and M.B.A. from The Wharton School of The University of Pennsylvania.Scott Prochazka
Scott Prochazka has served as a director of the Company since the consummation of the Business Combination on August 10, 2021. Mr. Prochazka most recently served as the President and Chief Executive Officer and a director of CenterPoint Energy, an NYSE-listed, Fortune 500 energy delivery company with electric transmission and distribution, power generation and natural gas distribution operations (“CenterPoint”) from January 1, 2014 to February 20, 2020. Prior to that role, Mr. Prochazka held several positions at CenterPoint since 2011, including Executive Vice President, Chief Operating Officer and Senior Vice President and Division President, Electric Operations. Mr. Prochazka was a director of Peridot Acquisition Corp. II. Mr. Prochazka received his B.S. in Chemical Engineering from the University of Texas in Austin.
Kunal Sinha
Kunal Sinha has served as director of the Company since June 1, 2022. Mr. Sinha has been with Glencore since 2012 and currently serves as Glencore’s Head of Recycling. Prior to his current role, Mr. Sinha was the CEO of Glencore’s North American Sulfuric Acid business. Prior to joining Glencore, he worked for six years in Management Consulting at ZS Associates. Mr. Sinha holds an MBA from the London Business School, an M.S. in Systems and Entrepreneurial Engineering from the University of Illinois at Urbana-Champaign, and a B.Tech. in Mechanical Engineering from the Indian Institute of Technology (IIT), Kharagpur.
Debbie Simpson
Debbie Simpson has served as our Chief Financial Officer since February 1, 2022. With more than 30 years of finance and public company experience, Ms. Simpson is an accomplished senior executive with experience in financial and strategic leadership, capital funding, and mergers and acquisitions.
Prior to joining
Li-Cycle,
Ms. Simpson served as Chief Financial Officer of Maple Leaf Foods Inc., a carbon neutral, sustainable, protein company with revenues of approximately $4 billion and over 13,000 employees. Before that, she was Vice President and Treasurer of Vincor International Inc., a leading global producer and distributor of wines, with operations across several countries.Before moving to Canada in 2000, Ms. Simpson lived and worked in Scotland. She began her career with Ernst & Young and obtained her professional accounting designation from the Institute of Chartered Accountants
88
of Scotland. Ms. Simpson holds a Bachelor of Arts (Honours) degree in Accountancy and a Master of Science in Accountancy and Finance from the University of Stirling, Scotland. She is a passionate advocate for advancing women, with a focus on women’s health and education, and volunteers her time as the Board Chair of Women’s College Hospital Foundation and the Board Chair of Havergal College. Ms. Simpson is also a Board member and the Audit Committee Chair for Shearer’s Foods, an OTPP portfolio company.
Kunal Phalpher
Kunal Phalpher has served as our Chief Strategy Officer since November 1, 2021. Mr. Phalpher previously served as the Chief Commercial Officer of the Company since the consummation of the Business Combination on August 10, 2021. Mr. Phalpher initially joined
Li-Cycle
in 2017 and became the Chief Commercial Officer ofLi-Cycle
in 2018. With nearly 15 years of work experience, Kunal brings extensive international expertise in thelithium-ion
battery and renewable energy sectors to his current role. Prior to joining theLi-Cycle
team, Mr. Phalpher worked for a residential solar company as the Director of Product Development and was the Director of Business Development for alithium-ion
battery manufacturer, both in Toronto, Canada. He spent several years working in Germany in the cleantech sector. A University of Toronto graduate, Mr. Phalpher possesses a Bachelor of Applied Sciences in Electrical Engineering and also holds a Master of Business Administration from the Rotman School of Management.Chris Biederman
Chris Biederman has served as our Chief Technical Officer of the Company since the consummation of the Business Combination on August 10, 2021. Mr. Biederman joined
Li-Cycle
in 2020 as the Chief Process Engineer before being promoted to Chief Technical Officer. Mr. Biederman is a professional engineer with 15 years of process engineering experience. Mr. Biederman brings extensive expertise to his current role, having acted as Lead Process Engineer for numerous large and small EPCM projects in the mining industry. He has experience working on greenfield and brownfield projects and overseeing bench-scale and pilot-scale testing. Mr. Biederman is also a skilled project manager with a robust history leading multi- disciplinary engineering teams and delivering successful projects. Previous to his role withLi-Cycle,
he spent time at Hatch as a Senior Engineer and Technology Commercialization Portfolio Manager; he is also the Founder and Managing Director of Biederman Engineering. Mr. Biederman is a graduate of the University of Waterloo’s Chemical Engineering program and is a registered engineer with the Professional Engineers of Ontario.Carl DeLuca
Carl DeLuca has served as General Counsel and Corporate Secretary of the Company since the consummation of the Business Combination on August 10, 2021. Mr. DeLuca joined
Li-Cycle
in 2021. Mr. DeLuca brings over 25 years of legal and public company experience to the Company, with a track record of successfully executing business-critical transactions and leading organizational change. Prior to joiningLi-Cycle,
Mr. DeLuca served as General Counsel and Corporate Secretary for Detour Gold Corporation, aTSX-listed
gold producer. Previously, Mr. DeLuca held various roles at Vale S.A.’s global base metal business, including Head of Legal for North American & U.K. Operations. His experience at Vale included advising on international M&A and joint ventures, capital projects, and commercial transactions. Mr. DeLuca started his career in private practice, in Toronto and New York. Mr. DeLuca holds his LL.B. from the University of Windsor, an H.B.A. from the Ivey School of Business at Western University, and a B.A. from Huron University College.Lauren Choate
Lauren Choate has served as Chief People Officer of the Company since the consummation of the Business Combination on August 10, 2021. Ms. Choate joined
Li-Cycle
in 2021. She brings over 25 years of experience across a variety of industries as a global people operations leader and has been a change agent for complex corporate challenges balancing the people strategy in partnership with business opportunities. Prior to joining89
Li-Cycle,
Ms. Choate led the human resources function for Kärcher North America, a subsidiary of a $2.8 billion global cleaning technology solutions company headquartered in Germany. Prior to Kärcher North America, she served as the Senior Director, Learning & Organizational Development at IHS. Ms. Choate holds her MBA from the Weatherhead School of Management at Case Western University. She also holds a B.A. in Mathematics and Economics from Ohio Wesleyan University.Richard Storrie
Richard Storrie has served as Regional President, Americas of the Company since January 24, 2022. In this role, Richard is responsible for overseeing
Li-Cycle’s
operations, commercial activities, and execution of its growth strategy in the Americas region. With more than 26 years of operational, technical, and strategic development experience in the metals and mining industry, Richard possesses a deep understanding of the battery metals supply chain. Prior to joiningLi-Cycle,
Richard served as President and Chief Operating Officer of the Diavik Diamond Mine, owned by Rio Tinto, one of the largest metals and mining corporations in the world. Throughout his nearly26-year
tenure with Rio Tinto, Richard has worked in its top tieropen-pit
and underground operations in several regions, including Rio Tinto’s multi-billion-dollar Oyu Tolgoi copper mine in Mongolia. Richard served as an officer in the British Royal Marine Commandos and acquired an Honours degree in Mining Engineering from Newcastle University in the United Kingdom.Dawei Li
Dawei Li has served as Regional President, APAC of the Company since November 1, 2021. Mr. Li brings more than 15 years of experience in strategy development and leading growth in untapped markets at international companies to his role at
Li-Cycle.
Focused on the Asian market, he overseesLi-Cycle’s
team, business development, and the rollout of commerciallithium-ion
battery recycling facilities across the continent.Before joining
Li-Cycle,
Mr. Li served as the Global Business Director for battery-grade lithium carbonate at the Albemarle Corporation where he developed growth strategy and executed on business development plans and commercial negotiations in key regions resulting in robust performance. Previously, he held roles at Eastman Chemical Company, managing global product lines, leading growth initiatives, and launching efforts to generate demand for existing products while commercializing novel ones. Mr. Li began his career in Shanghai, China working for PricewaterhouseCoopers. Mr. Li holds a BBA in Marketing from Shanghai University of Finance and Economics, and an MBA from the Darden School of Business at the University of Virginia.Corporate Governance
Board of Directors
Our Articles of Amalgamation provide that the Board will consist of a minimum of one and a maximum of ten directors. The OBCA provides that the board of an offering corporation (as defined in the OBCA, which would include the Company) will consist of not fewer than three individuals. The Board currently consists of seven directors. The directors are elected by our shareholders at each annual general meeting of shareholders, and will hold office for a term expiring at the close of the next annual meeting or until their respective successors are elected or appointed. Between annual general meetings of our shareholders, the directors may appoint one or more additional directors, but the number of additional directors may not at any time exceed
one-third
of the number of current directors who were elected or appointed other than as additional directors.Directors’ Service Contracts
There are no arrangements or understandings between us and any of our subsidiaries, on the one hand, and any of our
non-employee
directors, on the other hand, providing for benefits upon termination of their employment or service as directors of our Company or any of our subsidiaries. Employee directors may be eligible for benefits upon termination of their employment pursuant to their employment agreements.90
Committees of the Board of Directors
The Company has established an audit committee (the “Audit Committee”), a compensation committee (the “Compensation Committee”), a nominating and governance committee (the “Nominating and Governance Committee”) and a health, safety, environment and sustainability committee (the “HSES Committee”). Each committee has a written charter that is posted on our website.
Audit Committee
The Audit Committee is comprised of Scott Prochazka (Chair), Rick Findlay and Mark Wellings. Our Board has determined that each of the Audit Committee members is an independent director, as required by applicable SEC, NYSE rules and National Instrument. Our Board has also determined that at least one member of the Audit Committee, namely Scott Prochazka, qualifies as the “Audit Committee financial expert,” as such term is defined in Item 407 of Regulation
52-110
—Audit Committees
S-K
and that all members of the Audit Committee are “financially literate,” as such term is defined in NI52-110.
The Board has established a written charter setting forth the purpose, composition, authority and responsibility of the Audit Committee consistent with the rules of the NYSE, the SEC and the applicable Canadian securities laws. The Audit Committee is, among other things, directly responsible for monitoring the integrity of the Company’s financial statements, financial reporting process and systems of internal controls and procedures; ensuring compliance by the Company with applicable legal and regulatory requirements, reviewing areas of potential significant financial risk to the Company; evaluating the independent auditor’s independence and qualifications; and appointing, determining the compensation of and monitoring the performance of the independent auditors.
Compensation Committee
The Compensation Committee is comprised of Rick Findlay (Chair), Alan Levande and Mark Wellings. The Board has determined that each of the members of the Compensation Committee is an independent director, other than Alan Levande (by reason of his previous employment with Peridot).
The board has established a written charter setting forth the purpose, composition, authority and responsibility of the compensation committee consistent with the rules of the NYSE, the SEC and the guidance of the Canadian Securities Administrators. The Compensation Committee, among other things, oversees the compensation strategy and policies of the Company’s employees and directors; establishes, reviews and reports on compensation of the Company’s executive officers; administers equity-based and certain other compensation plans; and reviews the “Compensation Discussion and Analysis” and related executive compensation disclosure for inclusion in the Company’s public disclosure documents.
Nominating and Governance Committee
The Nominating and Governance Committee is comprised of Mark Wellings (Chair), Alan Levande and Anthony Tse. The Board has determined that each of the members of the Nominating and Governance Committee is an independent director, other than Alan Levande (by reason of his previous employment with Peridot).
The board has established a written charter setting forth the purpose, composition, authority and responsibility of the Nominating and Governance Committee. The Nominating and Governance Committee is, among other things, responsible for identifying and evaluating individuals qualified to become Board members, consistent with criteria approved by the Board, and recommending such individuals to the Board for approval as nominee; leading the performance review of the Board and its committees; and overseeing the establishment of the Company’s corporate governance practices and policies.
91
Health, Safety, Environment and Sustainability Committee
The HSES Committee is comprised of Tim Johnston (Chair), Anthony Tse, Rick Findlay and Scott Prochazka. The board has established a written charter setting forth the purpose, composition, authority and responsibility of the HSES Committee. The function and purpose of the HSES Committee is to assist the board in fulfilling its responsibilities with respect to developing and implementing the health, safety, environmental and sustainability policies, procedures and programs of the Company and its subsidiaries, and monitoring compliance with such policies.
92
EXECUTIVE AND DIRECTOR COMPENSATION
Compensation of Executives
Introduction
The following section describes the significant elements of the Company’s executive compensation program, with particular emphasis on the process for determining compensation payable to the Company’s Chief Executive Officer, Chief Financial Officer and the Company’s other three most highly compensated executive officers (collectively, the “Named Executive Officers” or “NEOs”). The NEOs are:
| • | Ajay Kochhar, Chief Executive Officer; |
| • | Tim Johnston, Executive Chairman; |
| • | Bruce MacInnis, former Chief Financial Officer; |
| • | Kunal Phalpher, Chief Strategy Officer; and |
| • | Chris Biederman, Chief Technology Officer. |
Overview and Compensation Committee
Compensation Objectives
The Company’s executive compensation program is designed to achieve the following objectives:
| • | provide market-competitive compensation opportunities in order to attract and retain talented, high-performing and experienced executive officers, whose knowledge, skills and performance are critical to our success; |
| • | motivate these executive officers to achieve our business and financial objectives; |
| • | align the interests of our executive officers with those of our shareholders by tying a meaningful portion of compensation directly to the long-term value and growth of our business; |
| • | reward our executive officers for their performance and contribution to our short-term and long-term objectives and success; |
| • | continue to foster an entrepreneurial and results-driven culture; and |
| • | provide the appropriate balance of short and long-term incentives to encourage appropriate levels of risk-taking and prudent decision-making by the executive team. |
Compensation Governance
Our Board of Directors has adopted a written charter for the Compensation Committee that establishes the Compensation Committee’s purpose and its responsibilities with respect to executive compensation. The charter provides that the Compensation Committee will, among other things, oversee the compensation strategy and policies for the Company’s employees and directors; establish, review and report on compensation of the Company’s executive officers; administer equity-based and certain other compensation plans; and review executive compensation disclosure for inclusion in the Company’s public disclosure documents, in accordance with applicable rules and regulations.
Our Compensation Committee currently consists of Rick Findlay (Chair), Alan Levande and Mark Wellings. Rick Findlay and Mark Wellings are considered by the Board of Directors to be independent, and Alan Levande is considered by the Board of Directors to be
non-independent
(by reason of his previous employment with Peridot).93
Compensation Components
In furtherance of the above-stated compensation objectives and in conjunction with our transition from a privately-held business to a publicly traded company in August 2021, we designed a compensation plan to include a mix of base salary, short-term incentives and long-term equity incentives.
Base Salary
We seek to maintain base salary amounts consistent with industry norms. Base salaries for NEOs are established based on the scope of their responsibilities, competencies and their prior relevant experience, taking into account compensation paid in the market for similar positions, the market demand for such NEOs and the NEO’s total compensation package. Base salaries are reviewed annually and increased for merit reasons, based on the executive’s success in meeting or exceeding individual objectives. Additionally, base salaries can be adjusted as warranted throughout the year to reflect promotions or other changes in the scope of breadth of an executive’s role or responsibilities, as well as to maintain market competitiveness.
Short-Term Incentives
The Company’s compensation program for NEOs and other executive officers includes eligibility for annual cash bonuses. Annual bonuses are designed to motivate our executive officers to meet our business and financial objectives generally and our annual financial performance targets in particular. The NEOs are eligible to earn an annual bonus based on a target percentage of
70-120%
of base salary in respect of the year ended October 31, 2021, depending on the level of each NEO, of which a percentage is based on the achievement of certain corporate and financial objectives, and a percentage of which may be based upon the achievement, by the NEO, of personalized goals and objectives.Long-Term Incentives
In connection with the Business Combination, the Company adopted the Incentive Plan to provide different types of equity-awards to be granted to eligible directors, officers, employees and consultants of the Company and its subsidiaries, including options and RSUs. Equity-based awards are a variable element of compensation that allows the Company to reward its NEOs for their sustained contributions to the Company. Equity awards reward performance and continued employment by an NEO, with associated benefits to the Company of attracting and retaining employees. The Company believes that options and RSUs and other equity-based compensation will provide NEOs with a strong link to long-term corporate performance and the creation of shareholder value.
The Compensation Committee is responsible for administering the Incentive Plan. For more information on the material terms and conditions of the Incentive Plan, see “”, below.
Long-Term Incentive Plan
During the year ended October 31, 2021, to support continued alignment with our compensation philosophy and objectives, all of our NEOs received a grant of options upon completion of the Business Combination. These options have a term of ten years and have an exercise price of $10.93, being the closing sale price for a Share on the New York Stock Exchange on the day immediately prior to the date of grant. The options vest over a three-year period starting on August 10, 2022 in increments of one third per annum.
Additionally, in connection with the closing of the Business Combination, RSUs were granted to each of Ajay Kochhar, Tim Johnston, Kunal Phalpher and Chris Biederman. The RSUs were granted with effect on December 10, 2021, being the date following the effectiveness of a registration statement on Form
S-8
filed by the Company with the SEC to register the common shares issuable thereunder. The RSUs vest over a three-year period starting on August 10, 2022 in increments of one third per annum, subject to the participant’s continued employment.94
Summary Compensation Table
The following table shows the compensation earned by, paid to, or awarded to the NEOs in respect of the year ended October 31, 2021.
(1)
Name and Principal Position | Year | Salary(2) ($) | Share Awards(3) ($) | Option Awards(4) ($) | Non-Equity Incentive Plan Compensation(5) ($) | Pension Value ($) | All Other Compensation(6) ($) | Total Compensation ($) | ||||||||||||||||||||||||
Ajay Kochhar | 2021 | 286,850 | 1,181,500 | 1,181,500 | 200,055 | — | 12,092 | 2,861,997 | ||||||||||||||||||||||||
Chief Executive Officer | ||||||||||||||||||||||||||||||||
Tim Johnston | 2021 | 286,850 | 1,181,500 | 1,181,500 | 200,055 | — | 713 | 2,850,618 | ||||||||||||||||||||||||
Executive Chairman | ||||||||||||||||||||||||||||||||
Bruce MacInnis (7) | 2021 | 220,916 | — | 2,077,000 | — | — | 445,286 | 2,743,202 | ||||||||||||||||||||||||
Former Chief Financial Officer | ||||||||||||||||||||||||||||||||
Kunal Phalpher | 2021 | 215,246 | 450,000 | 450,000 | 110,141 | — | 10,103 | 1,235,490 | ||||||||||||||||||||||||
Chief Strategy Officer | ||||||||||||||||||||||||||||||||
Chris Biederman | 2021 | 200,525 | 450,000 | 450,000 | 103,902 | — | 886 | 1,205,313 | ||||||||||||||||||||||||
Chief Technology Officer | ||||||||||||||||||||||||||||||||
Notes:
| (1) | In the above table, all compensation is disclosed in U.S. dollars. A portion of the Salary and/or All Other Compensation for each NEO was paid in Canadian dollars. Those Canadian dollar amounts have been converted to U.S. dollars using the Bank of Canada’s average exchange rate between November 1, 2020 and October 31, 2021 (being the year ended October 31, 2021) of CA$1.00=U.S$0.7955. |
| (2) | Represents the actual base salary earned in the year ended October 31, 2021. As at October 31, 2021, the annual base salary of each of our NEOs is as follows: $450,000 for Mr. Kochhar, $450,000 for Mr. Johnston, $325,000 for Mr. MacInnis, $300,000 for Mr. Phalpher and $300,000 for Mr. Biederman |
| (3) | Represents the grant date fair value of RSUs granted under our Long-Term Incentive Plan in connection with the closing of the Business Combination. The RSUs were granted in connection with the closing of the Business Combination with effect on December 10, 2021, being the date following the effectiveness of a registration statement on Form S-8 filed by the Company with the SEC to register the common shares issuable thereunder. |
| (4) | The grant date fair value of options awarded was calculated using the Black-Scholes Merton option pricing model, a common and widely-accepted valuation methodology. For the key assumptions used to determine the stock option value for grants for the year ended October 31, 2021 using the Black-Scholes Merton option pricing model, see Note 12 in our financial statements for the year ended October 31, 2021. |
| (5) | See “Short-Term Incentives”, above. |
| (6) | Represents the value of employer’s contribution to employee’s registered retirement savings plan contributions and employee benefits coverage (such as health insurance and life insurance). The Company generally contributes 5% of each NEO’s base salary into a defined contribution registered retirement savings plan, subject to Revenue Canada maximums. |
| (7) | Following the entering into of the Retirement Agreement (as described below under “Employment Arrangements, Termination and Change in Control Benefits—Bruce MacInnis”), the Company and Mr. MacInnis mutually agreed that Mr. MacInnis’ retirement date would be January 31, 2022, and the Company agreed to accelerate and settle certain payments to Mr. MacInnis under the terms of the Retirement Agreement in an aggregate amount of $444,647, which amounts would be repayable to the Company if Mr. MacInnis’ employment were terminated by the Company for just cause or by Mr. MacInnis by way of voluntary resignation at any time prior to the retirement date. Mr. MacInnis retired on January 31, 2022. |
95
Long-Term Incentive Plan
The purpose of the Long-Term Incentive Plan is to promote the success and enhance the value of the Company and its subsidiaries by linking the individual interests of the members of the board of directors, employees, and consultants to those of our shareholders and other stakeholders and by providing such individuals with an incentive for outstanding performance to generate superior returns to our shareholders. The Long-Term Incentive Plan also provides flexibility to the Company in its ability to motivate, attract, and retain the services of members of the board of directors, employees, and consultants upon whose judgment, interest, and special effort the successful conduct of the Company’s operation will be largely dependent. Set forth below is a summary of the material terms of the Incentive Plan.
Eligibility and Administration
The Company’s employees, consultants and directors, and employees, consultants and directors of its subsidiaries are eligible to receive awards under the Long-Term Incentive Plan. The Long-Term Incentive Plan is administered by the Board with respect to awards to
non-employee
directors and by the Compensation Committee with respect to other participants, each of which may delegate its duties and responsibilities to committees of the Board of Directors and/or officers (referred to collectively as the “plan administrator” below), subject to certain limitations that may be imposed under Section 16 of the Exchange Act, and/or stock exchange rules, as applicable. The plan administrator has the authority to interpret and adopt rules for the administration of the Long-Term Incentive Plan, subject to its express terms and conditions. The plan administrator can also set the terms and conditions of all awards under the Long-Term Incentive Plan, including any vesting and vesting acceleration conditions.Limitation on Awards and Shares Available
The Incentive Plan provides that the maximum number of Shares initially available for issuance under the Long-Term Incentive Plan is 14,799,519. The number of Shares available for issuance under the Long-Term Incentive Plan will be automatically increased on the first day of each calendar year beginning on January 1, 2022 and ending on and including January 1, 2031, in an amount equal to the lesser of (i) 5% of the outstanding Shares on the last day of the immediately preceding fiscal year and (ii) such number of Shares determined by the Board. Any Shares distributed pursuant to an award may consist, in whole or in part, of authorized and unissued Shares, treasury Shares or Shares purchased on the open market. Notwithstanding the foregoing, the aggregate number of Shares which may be issued or transferred pursuant to awards under the Long-Term Incentive Plan in the form of incentive stock options (“ISOs”) is 14,799,519.
Awards
The Long-Term Incentive Plan provides for the grant of share options, including ISOs and
non-qualified
share options (“NSOs”), Share Appreciation Rights (“SARs”), restricted shares, restricted share units (“RSUs”), dividend equivalents, share payments, other incentive awards, and cash awards. All awards under the Long-Term Incentive Plan will be set forth in award agreements, which will detail all terms and conditions of the awards, including any applicable vesting and payment terms and post-termination exercise limitations. Awards, other than cash awards, generally will be settled in Shares but the plan administrator may provide for cash settlement of any award (other than share options). A brief description of each award type follows.Share Options
Share options will provide for the purchase of Shares in the future at an exercise price set on the grant date. The exercise price per Share subject to each option will be set by the plan administrator, but will, except with respect to certain substitute options granted in connection with a corporate transaction, not be less than 100% of the Fair Market Value (as defined in the Long-Term Incentive Plan) of a Share on the date the option is granted. The term of a share option may not be longer than ten years (or five years in the case of ISOs granted to certain significant shareholders).
96
Restricted Shares and RSUs
Restricted shares are an award of
non-transferable
Shares that remain forfeitable unless and until specified conditions are met, and which may be subject to a purchase price. RSUs are contractual promises to deliver Shares in the future, which may also remain forfeitable unless and until specified conditions are met.Dividend Equivalents
Dividend equivalents represent the right to receive the equivalent value of dividends paid on Shares and may be granted alone or in tandem with awards other than share options or SARs. Dividend equivalents are credited as of dividend payment dates during the period between the date an award is granted and the date such award vests, is exercised, is distributed or expires, as determined by the plan administrator.
Vesting
Vesting conditions determined by the plan administrator may apply to each award and may include continued service, performance and/or other conditions.
Certain Transactions
The plan administrator has broad discretion to take action under the Long-Term Incentive Plan, as well as make adjustments to the terms and conditions of existing and future awards, to prevent the dilution or enlargement of intended benefits and facilitate necessary or desirable changes in the event of certain transactions and events affecting the Shares, such as share dividends, share splits, mergers, amalgamations, arrangements, acquisitions, consolidations and other corporate transactions. In addition, in the event of certain
non-reciprocal
transactions with shareholders known as “equity restructurings,” the plan administrator will make equitable adjustments to the Long-Term Incentive Plan and outstanding awards.In the event of a Change in Control (as defined in the Long-Term Incentive Plan), unless the plan administrator elects to (i) terminate an award in exchange for cash, rights or property, or (ii) cause an award to become fully exercisable and no longer subject to any forfeiture restrictions prior to the consummation of a Change in Control, such award will continue in effect or be assumed or an equivalent award substituted by the successor corporation or a parent or subsidiary of the successor corporation. In the event an award continues in effect or is assumed or an equivalent award substituted, and a holder incurs a termination of service without “cause” (as such term is defined in the sole discretion of the plan administrator, or as set forth in the award agreement relating to such award) upon or within 12 months following a Change in Control, then such holder will be fully vested in such continued, assumed or substituted award.
Non-U.S.
Participants, Claw-Back Provisions and TransferabilityThe Incentive Plan provides that the plan administrator may modify award terms, establish subplans and/or adjust other terms and conditions of awards, subject to the share limits described above, in order to facilitate grants of awards subject to the laws and/or stock exchange rules of countries outside of the United States. All awards will be subject to the provisions of any clawback policy implemented by the Company to the extent set forth in such clawback policy and/or in the applicable award agreement. With limited exceptions for estate planning, domestic relations orders, certain beneficiary designations and the laws of descent and distribution, awards under the Long-Term Incentive Plan are generally
non-transferable,
and are exercisable only by the participant.Plan Amendment and Termination
The Long-Term Incentive Plan provides that the Board may amend or terminate the Long-Term Incentive Plan at any time, provided that no amendment, suspension or termination of the Long-Term Incentive Plan will,
97
without the consent of the holder, materially and adversely affect any rights or obligations under any award, unless the award itself otherwise expressly so provides, and provided further that the board of directors may not take any of the following actions without approval of shareholders given within 12 months before or after such action: (i) increase the limit on the maximum number of Shares which may be issued under the Long-Term Incentive Plan, (ii) reduce the price per Share of any outstanding option or SAR granted under the Long-Term Incentive Plan, or (iii) cancel any option or SAR in exchange for cash or another award when the option or SAR price per share exceeds the fair market value of the underlying Shares.
The Long-Term Incentive Plan provides that in no event may any award be granted under the Long-Term Incentive Plan after the tenth anniversary of the earlier of (i) the date on which the Incentive Plan is adopted by the board or (ii) the date the Long-Term Incentive Plan is approved by shareholders.
Compensation of Directors
The Charter of the Compensation Committee provides that the Compensation Committee will periodically evaluate and make recommendations to the Board with respect to appropriate forms and amounts of compensation for directors of the Company. In doing so, the Compensation Committee will consider: (i) the time commitment associated with being a director of the Company, including, as applicable, committee (and committee chair) work and Board chair (or lead director) work; (ii) the responsibilities and risks associated with being such a director, (iii) compensation paid to directors of companies and their subsidiaries similar to the Company, and (iv) any other factors the Compensation Committee deems relevant.
In the year ended October 31, 2021, the Board approved the following amounts for
non-employee
director compensation.Compensation Element | RSU Award Value | Cash Value | ||||||
Standard Retainer | ||||||||
Director | $ | 100,000 | $ | 50,000 | ||||
Additional Retainers | ||||||||
Lead Director | — | $ | 25,000 | |||||
Audit Committee Chair | — | $ | 15,000 | |||||
Other Committee Chair | — | $ | 10,000 | |||||
In the year ended October 31, 2021,
non-employee
directors were also entitled to receive an“on-boarding”
equity award at the meeting of the Board at which they are initially appointed to the Board, or the first meeting of the Board after their initial election to the Board, as the case may be, valued at two times the annual equity award value (i.e., $200,000).Director Compensation Table
The following table shows the compensation earned by each of our
non-employee
Directors during the year ended October 31, 2021. Neither Mr. Kochhar, the Chief Executive Officer of the Company, nor Mr. Johnston, the Executive Chair of the Company, is included in the table as neither receives any additional compensation for his service as a director.Director | Fees Earned or Paid in Cash(1) ($) | Stock Awards(2) ($) | Option Awards | Non-Equity Incentive Plan Compensation | Pension Value | All Other Compensation ($) | Total ($) | |||||||||||||||||||||
Rick Findlay | 37,215 | 311,124 | — | — | — | — | 348,339 | |||||||||||||||||||||
Alan Levande | 11,277 | 280,822 | — | — | — | — | 292,099 | |||||||||||||||||||||
Scott Prochazka | 14,660 | 280,822 | — | — | — | — | 295,482 | |||||||||||||||||||||
Anthony Tse | 35,077 | 311,124 | — | — | — | 56,400 | (3) | 402,601 | ||||||||||||||||||||
Mark Wellings | 42,853 | 311,124 | — | — | — | — | 353,977 | |||||||||||||||||||||
98
Notes:
| (1) | A portion of the Fees Earned or Paid in Cash for Rick Findlay, Anthony Tse and Mark Wellings represents fees paid to each of them for services as directors of Li-Cycle Corp. prior to the Business Combination, which fees were paid in Canadian dollars prior to January 1, 2021 and paid in U.S. dollars thereafter. Those Canadian dollar amounts have been converted to U.S. dollars using the Bank of Canada’s average exchange rate on between November 1, 2020 and December 31, 2020 (being the period when fees were paid in Canadian dollars) of CA$1.00=U.S.$0.7732. Following the Business Combination, the Fees Earned or Paid in Cash were as follows: Rick Findlay $13,533, Alan Levande $11,277, Scott Prochazka $14,660, Anthony Tse $11,277, and Mark Wellings $19,171. |
| (2) | In connection with the closing of the Business Combination, each non-employee director received an RSU grant with a value of $280,822 (consisting of an annual award (pro rated) of $80,822 and aone-time “on-boarding” award of $200,000). The RSUs were granted with effect on December 10, 2021, being the date following the effectiveness of a registration statement on FormS-8 filed by the Company with the SEC to register the common shares issuable thereunder. The annual RSU award vests ratably over a three-year period starting on August 10, 2022, and theone-time “on-boarding” RSU award vests ratably over atwo-year period starting on August 10, 2022, subject to the participant’s continued service on the Board. Prior to the Business Combination, Rick Findlay, Anthony Tse and Mark Wellings served as directors ofLi-Cycle Corp. In this regard, they each received an RSU grant with a value of CA$39,246 on December 1, 2020. These Canadian dollar amounts have been converted to U.S. dollars using the Bank of Canada’s exchange rate on December 1, 2020 (being the date of grant) of CA$1.00=U.S.$0.7721. |
| (3) | This amount represents aggregate fees paid to Anthony Tse in the year ended October 31, 2021 under the terms of a consulting agreement dated July 19, 2019 between Li-Cycle Corp. and Mr. Tse pursuant to which Mr. Tse provided consulting services toLi-Cycle Corp. in relation to the proposed expansion of its operations in Asia. The agreement has since been terminated. See the section entitled “Certain Relationships and Related Party Transactions |
Each member of our Board of Directors is entitled to reimbursement for reasonable travel and other expenses incurred when attending Board or Committee meetings or otherwise in connection with their director position.
99
Share Ownership
The following table sets out the names and positions of certain executive officers of the Company as of July 22, 2022, the number of common shares, options and RSUs of the Company owned or over which control or direction is exercised by each such executive officer of the Company and, where known after reasonable enquiry, by their respective associates or affiliates.
Name and Principal Position | Number of Shares Owned (#) | Percentage of Total Shares Outstanding (%)(1) | Special Voting Rights | RSUs | Number of Securities Underlying Options | Option Exercise Price ($) | Option Expiration Date | |||||||||||||||||||||
Ajay Kochhar, President and Chief Executive Officer (2) | 24,914,609 | 14.21 | % | None | 165,813 | 159,640 | $ | 0.02 | April 11, 2023 | |||||||||||||||||||
| 139,685 | $ | 0.37 | July 19, 2024 | |||||||||||||||||||||||||
| 176,871 | $ | 10.93 | August 10, 2031 | |||||||||||||||||||||||||
| 92,105 | $ | 7.58 | January 31, 2032 | |||||||||||||||||||||||||
Tim Johnston, Executive Chairman (3) | 11,379,055 | 6.49 | % | None | 165,813 | 159,640 | $ | 0.02 | April 11, 2023 | |||||||||||||||||||
| 199,550 | $ | 0.37 | July 19, 2024 | |||||||||||||||||||||||||
| 176,871 | $ | 10.93 | August 10, 2031 | |||||||||||||||||||||||||
| 92,105 | $ | 7.58 | January 31, 2032 | |||||||||||||||||||||||||
Debbie Simpson, Chief Financial Officer | — | — | None | 432,261 | 58,219 | $ | 7.58 | January 31, 2032 | ||||||||||||||||||||
Kunal Phalpher, Chief Commercial Officer | 304,272 | 0.17 | % | None | 56,012 | 124,640 | $ | 0.02 | April 11, 2023 | |||||||||||||||||||
| 139,685 | $ | 0.37 | July 19, 2024 | |||||||||||||||||||||||||
| 67,365 | $ | 10.93 | August 10, 2031 | |||||||||||||||||||||||||
| 23,684 | $ | 7.58 | January 31, 2032 | |||||||||||||||||||||||||
Chris Biederman, Chief Technology Officer | 106,141 | 0.06 | % | None | 56,012 | 67,365 | $ | 10.93 | August 10, 2031 | |||||||||||||||||||
| 23,684 | $ | 7.58 | January 31, 2032 | |||||||||||||||||||||||||
Notes:
| (1) | The ownership percentage set out in this column is based on a total of 175,383,580 outstanding common shares as of July 22, 2022, in each case rounded down to the nearest hundredth. |
| (2) | The number of shares owned include 51,997 common shares owned directly by Mr. Kochhar and 24,862,612 common shares owned by 2829908 Delaware LLC, a Delaware limited liability company, which is a wholly-owned subsidiary of Maplebriar Holdings Inc., a corporation organized under the laws of the Province of Ontario (“Maplebriar Holdings”), having a sole shareholder, The Kochhar Family Trust, an irrevocable trust established under the laws of the Province of Ontario, Canada (the “Trust”). Mr. Kochhar is one of three trustees of the Trust, along with Mr. Kochhar’s brother and father, and the beneficiaries of the Trust are principally relatives of Mr. Kochhar. There is an oral agreement among Mr. Kochhar, the Trust, Maplebriar Holdings and 2829908 Delaware LLC that grants Mr. Kochhar the sole power to control the voting and disposition of the common shares of the Company held by 2829908 Delaware LLC. Mr. Kochhar is a Director and the President and Chief Executive Officer of the Company. |
| (3) | The number of shares owned include 331,888 common shares owned directly by Mr. Johnston and 11,047,167 common shares owned by Keperra Holdings Ltd., a Guernsey corporation (“Keperra”). Mr. Johnston is the sole shareholder of Keperra. Artemis Nominees Limited is a nominee company that holds legal title to 100 shares of Keperra as nominee of and trustee for Mr. Johnston. Mr. Johnston is a Director and the Executive Chairman of the Company. |
100
Employment Arrangements, Termination and Change in Control Benefits
The following summarizes the employment arrangements, termination and change in control benefits for certain of our executive officers in the year ended October 31, 2021 unless as otherwise indicated. Certain of the agreements summarized below were amended following the year ended October 31, 2021.
Ajay Kochhar
On September 1, 2020,
Li-Cycle
entered into an employment agreement with Mr. Kochhar setting forth the terms and conditions of his employment asLi-Cycle’s
President and Chief Executive Officer, including base salary, annual performance bonus and benefits.In the case of
Li-Cycle’s
termination of Mr. Kochhar’s employment other than for cause, or in the case of Mr. Kochhar’s termination of his employment for good reason (as defined in the employment agreement) following a change of control (as defined in the employment agreement), Mr. Kochhar is entitled to accrued but unpaid base salary, vacation pay, expense reimbursements and benefits, an additionalfifty-two
weeks’ base salary and bonus (calculated on the basis of an average of each bonus received by Mr. Kochhar in the three fiscal years preceding the termination date), and, until the earlier offifty-two
weeks from the termination date or the date on which Mr. Kochhar commences alternative employment or consulting work, continued coverage underLi-Cycle
group benefit plans in place and as amended from time to time.If Mr. Kochhar is terminated for cause, he will not be entitled to any severance pay, notice or compensation in lieu of notice, nor to any bonus payment, other than any minimum entitlements to which he would be entitled under applicable law. He will, however, be entitled to payment of any unpaid base salary, vacation pay and expense reimbursements accrued to the termination date.
Tim Johnston
On September 1, 2020,
Li-Cycle
entered into an employment agreement with Mr. Johnston setting forth the terms and conditions of his employment asLi-Cycle’s
Executive Chairman, including base salary, annual performance bonus and benefits.In the case of
Li-Cycle’s
termination of Mr. Johnston’s employment other than for cause, or in the case of Mr. Johnston’s termination of his employment for good reason (as defined in the employment agreement) following a change of control (as defined in the employment agreement), Mr. Johnston is entitled to accrued but unpaid base salary, vacation pay, expense reimbursements and benefits, an additionalfifty-two
weeks’ base salary and bonus (calculated on the basis of an average of each bonus received by Mr. Johnston in the three fiscal years preceding the termination date), and, until the earlier offifty-two
weeks from the termination date or the date on which Mr. Johnston commences alternative employment or consulting work, continued coverage underLi-Cycle
group benefit plans in place and as amended from time to time.If Mr. Johnston is terminated for cause, he will not be entitled to any severance pay, notice or compensation in lieu of notice, nor to any bonus payment, other than any minimum entitlements to which he would be entitled under applicable law. He will, however, be entitled to payment of any unpaid base salary, vacation pay and expense reimbursements accrued to the termination date.
Bruce MacInnis
On September 1, 2020,
Li-Cycle
entered into an employment agreement with Mr. MacInnis setting forth the terms and conditions of his employment asLi-Cycle’s
Chief Financial Officer, including base salary, annual performance bonus and benefits. On July 7, 2021,Li-Cycle
and NewCo entered into a retirement agreement with Mr. MacInnis. On January 31, 2022, Mr. MacInnis retired. Mr. MacInnis’ retirement agreement (the “Retirement Agreement”) sets forth certain terms and conditions relating to his retirement from employment withLi-Cycle,
which supersede the terms and conditions of his employment agreement that pertain to that subject matter.101
In the case of
Li-Cycle’s
termination of Mr. MacInnis’ employment other than for cause, or in the case of Mr. MacInnis’ termination of his employment for good reason (as defined in the employment agreement) following a change of control (as defined in the employment agreement), Mr. MacInnis is entitled to accrued but unpaid base salary, vacation pay, expense reimbursements and benefits, an additionalfifty-two
weeks’ base salary and bonus (calculated on the basis of an average of each bonus received by Mr. MacInnis in the three fiscal years preceding the termination date), and, until the earlier offifty-two
weeks from the termination date or the date on which Mr. MacInnis commences alternative employment or consulting work, continued coverage underLi-Cycle
group benefit plans in place and as amended from time to time.Pursuant to the Retirement Agreement, subject to certain conditions including those set out below, Mr. MacInnis will be entitled to (i) salary continuance for a period of 12 months following the retirement date, (ii) a bonus for the fiscal year ended October 31, 2021 calculated and payable in the ordinary course in accordance with his employment agreement and the Company’s bonus plan for such year, (iii) a bonus for the period from November 1, 2021 up to and including the retirement date based on his actual bonus achieved in the prior fiscal year, prorated for such period, and (iv) continued participation in the Company’s group health and dental plans until the earlier of the date which is 12 months following the retirement date and the date on which he secures alternate coverage through any source other than existing spousal coverage. The terms of the Retirement Agreement will be null and void in the event that Mr. MacInnis’ employment is terminated by the Company for just clause (as defined in the employment agreement) or by way of Mr. MacInnis’ voluntary resignation (as defined in the employment agreement) at any time prior to the retirement date. Following the entering into of the retirement agreement, the Company and Mr. MacInnis mutually agreed that Mr. MacInnis’ retirement date would be January 31, 2022, and the Company agreed to accelerate and settle certain retirement payments to Mr. MacInnis in an amount of $446,510.45 (Canadian dollar amounts converted to U.S. dollars using the Bank of Canada’s exchange rate on October 29, 2021 of CA$1.00=U.S.$0.8075), which amounts would be repayable to the Company if Mr. MacInnis’ employment were terminated by the Company for just cause or by Mr. MacInnis by way of voluntary resignation at any time prior to the retirement date.
If Mr. MacInnis is terminated for cause, he will not be entitled to any severance pay, notice or compensation in lieu of notice, nor to any bonus payment, other than any minimum entitlements to which he would be entitled under applicable law. He will, however, be entitled to payment of any unpaid base salary, vacation pay and expense reimbursements accrued to the termination date.
Kunal Phalpher
On September 1, 2020,
Li-Cycle
entered into an employment agreement with Mr. Phalpher setting forth the terms and conditions of his employment asLi-Cycle’s
Chief Commercial Officer, including base salary, annual performance bonus and benefits. On November 1, 2021, Mr. Phalpher’s title was changed from Chief Commercial Officer to Chief Strategy Officer, but the terms of his employment agreement remained the same.In the case of
Li-Cycle’s
termination of Mr. Phalpher’s employment other than for cause, or in the case of Mr. Phalpher’s termination of his employment for good reason (as defined in the employment agreement) following a change of control (as defined in the employment agreement), Mr. Phalpher is entitled to accrued but unpaid base salary, vacation pay, expense reimbursements and benefits, an additionalfifty-two
weeks’ base salary and bonus (calculated on the basis of an average of each bonus received by Mr. Phalpher in the three fiscal years preceding the termination date), and, until the earlier offifty-two
weeks from the termination date or the date on which Mr. Phalpher commences alternative employment or consulting work, continued coverage underLi-Cycle
group benefit plans in place and as amended from time to time.If Mr. Phalpher is terminated for cause, he will not be entitled to any severance pay, notice or compensation in lieu of notice, nor to any bonus payment, other than any minimum entitlements to which he would be entitled under applicable law. He will, however, be entitled to payment of any unpaid base salary, vacation pay and expense reimbursements accrued to the termination date.
102
Chris Biederman
On September 7, 2020,
Li-Cycle
entered into an employment agreement with Mr. Biederman setting forth the terms and conditions of his employment asLi-Cycle’s
Chief Technology Officer, including base salary, annual performance bonus and benefits.In the case of
Li-Cycle’s
termination of Mr. Biederman’s employment other than for cause, Mr. Biederman is entitled to accrued but unpaid base salary, vacation pay, expense reimbursements and benefits, and (a) before his completion of one year of service under the agreement, one months’ written notice, or (b) upon one year of completed service under the agreement, one months’ written notice plus an additional one months’ written notice for every additional completed year of completed service up to a maximum of 12 months’ written notice.Li-Cycle
may terminate the agreement and continue to pay Mr. Biederman his base salary until the expiry of the notice period or the date he commences alternative employment or consulting work, in which caseLi-Cycle
will pay Mr. Biederman an amount equal to 50% of the value of the payments remaining to the end of the notice period.If Mr. Biederman is terminated for cause, he will not be entitled to any severance pay, notice or compensation in lieu of notice, nor to any bonus payment, other than any minimum entitlements to which he would be entitled under applicable law. He will, however, be entitled to payment of any unpaid base salary, vacation pay and expense reimbursements accrued to the termination date.
Carl DeLuca
On February 24, 2021,
Li-Cycle
entered into an employment agreement with Mr. DeLuca setting forth the terms and conditions of his employment asLi-Cycle’s
General Counsel & Corporate Secretary, including base salary, annual performance bonus and benefits.In the case of
Li-Cycle’s
termination of Mr. DeLuca’s employment other than for cause, in addition to accrued but unpaid base salary, earned bonus, vacation pay, expense reimbursements and benefits to the date of termination, Mr. DeLuca is entitled to, (i) before his completion of six years of service, six months’ written notice, or (ii) upon six years of completed service, six months’ written notice plus an additional one month’s written notice for every additional completed year of service starting after the sixth anniversary of the commencement date up to an aggregate maximum of 12 months’ written notice. The notice may be satisfied by working notice or pay in lieu of notice (via salary continuance). In the case of salary continuance, the salary continuance period will cease on the date that Mr. DeLuca commences alternate employment or full-time consulting work, andLi-Cycle
will pay Mr. DeLuca alump-sum
equal to 50% of the value of the payments remaining between the date that Mr. DeLuca commences alternate employment or consulting work and the end of the applicable notice period, less all lawful deductions.If Mr. DeLuca is terminated for cause, he will not be entitled to any severance pay, notice or compensation in lieu of notice, other than any minimum entitlements to which he would be entitled under applicable law. He will, however, be entitled to payment of any unpaid base salary, vacation pay and expense reimbursements accrued to the termination date.
Lauren Choate
On April 12, 2021,
Li-Cycle
entered into an employment agreement with Ms. Choate setting forth the terms and conditions of her employment, including base salary, annual performance bonus and benefits. Ms. Choate’s agreement is on an“at-will
basis,” meaning that the Company is free to release the employee at any time for any reason and does not specify any entitlements on such termination of employment.103
Debbie Simpson
On December 6, 2021,
Li-Cycle
entered into an employment agreement with Ms. Simpson setting forth the terms and conditions of her employment asLi-Cycle’s
Chief Financial Officer, including base salary, annual performance bonus and benefits.In the case of
Li-Cycle’s
termination of Ms. Simpson’s employment without cause, or in the case of Ms. Simpson’s termination of her employment for good reason (as defined in the employment agreement), in either case within twelve months following a change in control (as defined in the employment agreement), Ms. Simpson is entitled to accrued and unpaid base salary, accrued vacation pay, and reimbursement for business expenses properly incurred; alump-sum
payment in lieu of notice in the amount of eighteen months’ base salary plus the amount of Ms. Simpson’s short-term incentive plan (“STIP”) target in respect of the fiscal year in which the termination occurs,pro-rated
to eighteen months; matching contributions to Ms. Simpson’s registered retirement savings plan up to and including last day of the statutory notice period required pursuant to applicable employment standards legislation; a continued participation inLi-Cycle’s
executive benefit plans and perquisites until the end of the statutory notice period pursuant to applicable employment standards legislation, and after, for a period of eighteen months or until Ms. Simpson becomes entitled to participate in similar benefit plans with another employer, a participation to primary coverages (health care, dental care, and employee assistance program); alump-sum
for Ms. Simpson’s STIP award in respect of the fiscal year immediately preceding the termination, to the extent earned and unpaid at the date of the termination, calculated at the STIP target for such fiscal year, and STIP award in respect of the fiscal year ofLi-Cycle
in which the termination occurs,pro-rated
from the start of such fiscal year to the date of the termination, calculated at the STIP target for such fiscal year; post-employment treatment of Ms. Simpson’s long term incentive plan awards (including without limitation share options and RSUs) determined in accordance with the terms ofLi-Cycle’s
2021 Incentive Award Plan and/or any other applicable long term incentive plan(s), the relevant award agreement(s), and the 2021 Executive Severance Policy; and outplacement career counselling ending on the earliest to occur of twelve months following the termination and the date that Ms. Simpson obtains full-time employment.In the case of
Li-Cycle’s
termination of Ms. Simpson’s employment without cause, or in the case of Ms. Simpson’s termination of her employment for good reason (as defined in the employment agreement), in either case prior to or more than twelve months after a change in control (as defined in the employment agreement), Ms. Simpson is entitled to accrued and unpaid base salary, accrued vacation pay, and reimbursement for business expenses properly incurred; payment in equal monthly installments representing twelve months’ base salary plus the amount of Ms. Simpson’s STIP target in respect of the fiscal year in which the termination occurs,pro-rated
to twelve months; matching contributions to Ms. Simpson’s registered retirement savings plan up to and including last day of the statutory notice period required pursuant to applicable employment standards legislation; a continued participation inLi-Cycle’s
executive benefit plans and perquisites until the end of the statutory notice period pursuant to applicable employment standards legislation, and after, for a period of twelve months or until Ms. Simpson becomes entitled to participate in similar benefit plans with another employer, a participation to primary coverages (health care, dental care, and employee assistance program); post-employment treatment of Ms. Simpson’s long term incentive plan awards (including without limitation share options and RSUs) determined in accordance with the terms ofLi-Cycle’s
2021 Incentive Award Plan and/or any other applicable long term incentive plan(s), the relevant award agreement(s), and the 2021 Executive Severance Policy; and outplacement career counselling ending on the earliest to occur of twelve months following the termination and the date that Ms. Simpson obtains full-time employment.If Ms. Simpson is terminated for cause, death, mutually agreed retirement or by the executive without good reason, she will be entitled to payment of any unpaid base salary, vacation pay and reimbursement for business expenses properly incurred accrued to the termination date; matching contributions to Ms. Simpson’s registered retirement savings plan up to and including last day of the statutory notice period required pursuant to applicable employment standards legislation; and post-employment treatment of Ms. Simpson’s long term incentive plan awards (including without limitation share options and RSUs) determined in accordance with the terms of
104
Li-Cycle’s
2021 Incentive Award Plan and/or any other applicable long term incentive plan(s), the relevant award agreement(s), and the 2021 Executive Severance Policy.If Ms. Simpson is terminated for permanent disability, she will be entitled to a
lump-sum
payment of any unpaid base salary, vacation pay and reimbursement for business expenses properly incurred accrued during the applicable elimination period for long-term disability benefits stipulated inLi-Cycle’s
long-term disability insurance plan, less any short-term disability benefit payments provided byLi-Cycle;
matching contributions to Ms. Simpson’s registered retirement savings plan up to and including the end of the applicable elimination period; a continued participation inLi-Cycle’s
executive benefit plans and perquisites up to and including the end of the applicable elimination period; post-employment treatment of Ms. Simpson’s long term incentive plan awards (including without limitation share options and RSUs) determined in accordance with the terms ofLi-Cycle’s
2021 Incentive Award Plan and/or any other applicable long term incentive plan(s), the relevant award agreement(s), and the 2021 Executive Severance Policy; and if any, minimum statutory entitlements under applicable employment standards legislation.Richard Storrie
On October 28, 2021,
Li-Cycle
entered into an employment agreement with Mr. Storrie setting forth the terms and conditions of his employment asLi-Cycle’s
Regional President, Americas, including base salary, annual performance bonus and benefits.In the case of
Li-Cycle’s
termination of Mr. Storrie’s employment without cause, or in the case of Mr. Storrie’s termination of his employment for good reason (as defined in the employment agreement), in either case within twelve months following a change in control (as defined in the employment agreement), Mr. Storrie is entitled to accrued and unpaid base salary, accrued vacation pay, reimbursement for business expenses properly incurred, and any amount accrued and arising from Mr. Storrie’s participation in any employee benefit plans, programs or arrangements; alump-sum
payment in the amount of eighteen months’ base salary plus the amount of Mr. Storrie’s short-term incentive plan (“STIP”) target in respect of the fiscal year in which the termination occurs,pro-rated
to eighteen months; reimbursement of premiums under the Consolidated Omnibus Budget Reconciliation Act of 1986, if Mr. Storrie is eligible, in the amount ofLi-Cycle’s
current contribution for the health plan enrollment, for a period of eighteen months or until Mr. Storrie becomes eligible for comparable replacement coverage under a subsequent employer’s group health plan; alump-sum
for Mr. Storrie’s STIP award in respect of the fiscal year immediately preceding the termination, to the extent earned and unpaid at the date of the termination, calculated at the STIP target for such fiscal year, and STIP award in respect of the fiscal year ofLi-Cycle
in which the termination occurs,pro-rated
from the start of such fiscal year to the date of the termination, calculated at the STIP target for such fiscal year; post-employment treatment of Mr. Storrie’s long term incentive plan awards (including without limitation share options and RSUs) determined in accordance with the terms ofLi-Cycle’s
2021 Incentive Award Plan and/or any other applicable long term incentive plan(s), the relevant award agreement(s), and the 2021 Executive Severance Policy; and outplacement career counseling ending on the earliest to occur of twelve months following the termination and the date that Mr. Storrie obtains full-time employment.In the case of
Li-Cycle’s
termination of Mr. Storrie’s employment without cause, or in the case of Mr. Storrie’s termination of his employment for good reason (as defined in the employment agreement), in either case prior to or more than twelve months after a change in control (as defined in the employment agreement), Mr. Storrie is entitled to accrued and unpaid base salary, accrued vacation pay, reimbursement for business expenses properly incurred, and any amount accrued and arising from Mr. Storrie’s participation in any employee benefit plans, programs or arrangements; payment in equal monthly installments representing twelve months’ base salary plus the amount of Mr. Storrie’s STIP target in respect of the fiscal year in which the termination occurs,pro-rated
to twelve months; reimbursement of premiums under the Consolidated Omnibus Budget Reconciliation Act of 1986 if Mr. Storrie is eligible in the amount ofLi-Cycle’s
current contribution for the health plan enrollment, for a period of eighteen months or until Mr. Storrie becomes eligible for comparable105
replacement coverage under a subsequent employer’s group health plan; post-employment treatment of Mr. Storrie’s long term incentive plan awards (including without limitation share options and RSUs) determined in accordance with the terms of
Li-Cycle’s
2021 Incentive Award Plan and/or any other applicable long term incentive plan(s), the relevant award agreement(s), and the 2021 Executive Severance Policy; and outplacement career counseling ending on the earliest to occur of twelve months following the termination and the date that Mr. Storrie obtains full-time employment.If Mr. Storrie is terminated for cause, death, mutually agreed retirement or by the executive without good reason, he will be entitled to payment of any unpaid base salary, vacation pay, reimbursement for business expenses properly incurred accrued to the termination date, and any amount accrued and arising from Mr. Storrie’s participation in any employee benefit plans, programs or arrangements. Mr. Storrie will also be entitled to post-employment treatment of his long term incentive plan awards (including without limitation share options and RSUs) determined in accordance with the terms of
Li-Cycle’s
2021 Incentive Award Plan and/or any other applicable long term incentive plan(s), the relevant award agreement(s), and the 2021 Executive Severance Policy.If Mr. Storrie is terminated for permanent disability, he will be entitled to post-employment treatment of his long term incentive plan awards (including without limitation share options and RSUs) determined in accordance with the terms of
Li-Cycle’s
2021 Incentive Award Plan and/or any other applicable long term incentive plan(s), the relevant award agreement(s), and the 2021 Executive Severance Policy.106
DESCRIPTION OF SECURITIES
General
The following description of the material terms of our share capital includes a summary of certain provisions of our articles that became effective upon the closing of the Business Combination (the “articles”). This description is qualified in its entirety by reference to our articles which are incorporated by reference as exhibits to the registration statement of which this prospectus forms a part.
Share Capital
Our authorized share capital consists of an unlimited number of common shares and an unlimited number of preferred shares issuable in series. As of July 22, 2022, there were 175,383,580 common shares outstanding and no preferred shares outstanding.
Common Shares
Voting Rights
Dividend Rights
Preemptive Rights
no pre-emptive rights
relating to the common shares.Repurchase of Common Shares
Liquidation
Preferred Shares
The Company is authorized to issue an unlimited number of preferred shares, issuable in series. Subject to any limitations prescribed by law, including the OBCA, each series of preferred shares will consist of such number of shares and have such rights, privileges, restrictions and conditions as may be determined by the board prior to the issuance of such series. No rights, privileges, restrictions or conditions attaching to any series of
107
preferred shares will confer upon the shares of such series a priority in respect of dividends or distribution of assets or return of capital in the event of the liquidation, dissolution or winding up of the Company over the shares of any other series of preferred shares. The preferred shares of each series will, with respect to the right of payment of dividends and the distribution of assets or return of capital in the event of liquidation, dissolution or winding up of the Company, rank on parity with the shares of every other series of preferred shares.
The issuance of preferred shares and the terms selected by the board could decrease the amount of earnings and assets available for distribution to holders of common shares or adversely affect the rights and powers, including the voting rights, of the holders of common shares without any further vote or action by the holders of common shares. The issuance of preferred shares, or the issuance of rights to purchase preferred shares, could make it more difficult for a third-party to acquire a majority of the outstanding voting shares and thereby have the effect of delaying, deferring or preventing a change of control of the Company or an unsolicited acquisition proposal or of making the removal of management more difficult. Additionally, the issuance of preferred shares may have the effect of decreasing the market price of the common shares.
Dissent Rights
Under the OBCA, shareholders of a corporation are entitled to exercise dissent rights in respect of certain matters and to be paid the fair value of their shares in connection therewith. The dissent right is applicable where the corporation resolves to: (i) amend its articles to add, remove or change restrictions on the issue, transfer or ownership of shares of a class or series of the shares of the corporation; (ii) amend its articles to add, remove or change any restrictions on the business it is permitted to carry on or the powers it may exercise; (iii) amalgamate with another corporation, subject to certain exceptions; (iv) be continued under the laws of another jurisdiction; or (v) sell, lease or exchange all or substantially all of its property. In addition, holders of a class or series of shares of an OBCA corporation are, in certain circumstances and, in the case of items (a), (b) and (e) below, unless the articles of the corporation provide otherwise, entitled to exercise dissent rights and be paid the fair value of their shares if the corporation resolves to amend its articles to (a) increase or decrease any maximum number of authorized shares of such class or series, or increase any maximum number of authorized shares of a class or series having rights or privileges equal or superior to shares of such class or series; (b) effect an exchange, reclassification or cancellation of the shares of such class or series; (c) add to, remove or change the rights, privileges, restrictions or conditions attached to the shares of such class or series; (d) add to the rights or privileges of any class or series of shares having rights or privileges equal or superior to the shares of such class or series; (e) create a new class or series of shares equal or superior to the shares of such class or series, except in certain circumstances; (f) make a class or series of shares having rights or privileges inferior to the shares of such class or series equal or superior to the shares of such class or series; (g) effect an exchange or create a right of exchange of the shares of another class or series into the shares of such class of series; or (h) add, remove or change restrictions on the issue, transfer or ownership of the shares of such class of series.
Transfer of Shares
Subject to the rules of any stock exchange on which shares are posted or listed for trading, no transfer of a security issued by the Company will be registered except upon (i) presentation of the security certificate representing the security with an endorsement which complies with the OBCA, together with such reasonable assurance that the endorsement is genuine and effective as the directors may require, (ii) payment of all applicable taxes and fees, and (iii) compliance with the articles of the Company. If no security certificate has been issued by the Company in respect of a security issued by the Company, clause (i) above may be satisfied by presentation of a duly executed security transfer power, together with such reasonable assurance that the security transfer power is genuine and effective as the directors may require.
108
Transfer Restrictions
Li-Cycle
Transaction Support AgreementsConcurrently with the execution of the Business Combination Agreement, the
Li-Cycle
Holders entered into theLi-Cycle
Transaction Support Agreements with Peridot (the“Li-Cycle
Transaction Support Agreements”), pursuant to which eachLi-Cycle
Holder agreed to, among other things, (i) vote or cause to be voted (whether in person, by proxy, by action by written consent, as applicable, or as may be required underLi-Cycle’s
shareholders agreement or articles of incorporation) theirLi-Cycle
Shares in favor of the Business Combination Agreement, the Arrangement and certain related transactions; (ii) be bound by certain other covenants and agreements related to the Business Combination and (iii) be bound by certain transfer restrictions with respect to such securities, in each case, on the terms and subject to the conditions set forth in theLi-Cycle
Transaction Support Agreements.On August 10, 2021, the Company, the Peridot Class B Holders and
the Li-Cycle Holders
(collectively for the purposes of this subsection referred to as the “Holders”) entered into the Investor Agreement. The Investor Agreement provides that the common shares held by the Peridot Class B Holders will be subject to certain transfer restrictions until the earliest of (a) one year after the Closing and (b) (x) if the closing price of our common shares equals or exceeds $12.00 per share (as adjusted for share subdivisions, share capitalizations, reorganizations, recapitalizations and the like) for any 20 trading days withinany 30-trading
day period commencing at least 150 days after the Closing, or (y) the date on which we complete a liquidation, merger, share exchange or other similar transaction that results in all of our public shareholders having the right to exchange their common shares for cash, securities or other property.Registration Rights
Investor Agreement
Pursuant to the Investor Agreement, the Company is obligated to file a registration statement to register the resale of certain securities held by the Peridot Class B Holders
and Li-Cycle Holders
within 30 days after the Closing and to use commercially reasonable efforts to cause such registration statement to be declared effective as soon as practicable after such filing, but no later than the earlier of (i) the 75th day (or the 105th day if the SEC notifies that it will “review” such registration statement) following the Closing Date and (ii) the 15th business day after the date the SEC notifies us that such registration statement will not be “reviewed” or will not be subject to further review. In addition, pursuant to the terms of the Investor Agreement and subject to certain requirements and customary conditions, including with regard to the number of demand rights that may be exercised, the Peridot Class B Holdersand Li-Cycle
Holders may, subject to the limitations in the Investor Agreement, demand at any time or from time to time, that the Company file a registration statement onForm F-3 (or
onForm F-1 if
Form F-3
is not available) to register the securities of the Company held by such Peridot Class B Holdersand Li-Cycle Holders,
and each may specify that such demand registration take the form of an underwritten offering, in each case subject to limitations on the number of demands and underwritten offerings that can be requested by each Peridot Class B Holderand Li-Cycle Holder,
as specified in the Investor Agreement. The Peridot Class B Holdersand Li-Cycle
Holders also have “piggy-back” registration rights, subject to certain requirements and customary conditions. The Investor Agreement also provides that the Company will pay certain expenses relating to such registrations and indemnify the Peridot Class B Holdersand Li-Cycle
Holders against (or make contributions in respect of) certain liabilities that may arise under the Securities Act.Subscription Agreements
Contemporaneously with the execution of the Business Combination Agreement, Subscription Agreements were entered into by and among each PIPE Investor, Peridot, and NewCo. Peridot obtained commitments from the PIPE Investors under the Subscription Agreements to purchase common shares for a purchase price of $10.00 per share, for aggregate gross proceeds of $315,490,000. The purpose of the sale of common shares to the PIPE Investors was to raise additional capital for use in connection with the Business Combination.
109
The common shares sold to the PIPE Investors were identical to the shares that were held by the public shareholders at the time of the Closing, except that when initially issued by Peridot, such shares were restricted securities. The PIPE Financing occurred on the date of, and immediately prior to, the consummation of the Business Combination.
The closing of the PIPE Financing was subject to customary conditions, including, among other conditions, the Company’s agreement to, as soon as practicable (but in any case no later than 30 calendar days after the consummation of the Business Combination), file with the SEC (at its sole cost and expense) a registration statement registering the resale of the shares received by the PIPE Investors in the PIPE Financing and to use its commercially reasonable efforts to have such resale registration statement declared effective as soon as practicable after the filing thereof.
KSP Note Purchase Agreement
On September 29, 2021, in connection with the Company’s entry into the KSP Note Purchase Agreement and issuance of the KSP Note, the Company granted certain registration rights under the KSP Note Purchase Agreement. Pursuant to the KSP Note Purchase Agreement, the Company agreed to file with the SEC within 30 days a registration statement covering the resale of the common shares issued or issuable upon conversion of the 2021 Convertible Notes. The Company is required to use commercially reasonable efforts to have such registration statement declared effective by the SEC as soon as practicable and no later than the earlier of (A) 60 days after the issuance of the KSP Note (or 90 days after the issuance of the KSP Note if the SEC notifies the Company that it will review the registration statement) or (B) 10 business days after the SEC notifies the Company in writing that it will not review the registration statement. The Company agreed to keep the registration statement (or another shelf registration statement covering the common shares issued or issuable upon conversion of the 2021 Convertible Notes) effective until the earlier of (x) the third anniversary of the issuance of the KSP Note or (y) the date on which the holder of the 2021 Convertible Notes ceases to hold any common shares issued or upon conversion of the 2021 Convertible Notes.
LG Subscription Agreements
On December 13, 2021,
Li-Cycle
entered into subscription agreements with each of LGES and LGC, each of which were subsequently amended and restated on March 11, 2022 and April 21, 2022 (the “LG Subscription Agreements” and each, an “LG Subscription Agreement”), pursuant to which each of LGES and LGC agreed, subject to the satisfaction of certain conditions, to subscribe for an equal number of the Company’s common shares in transactions exempt from registration under the Securities Act (the “LG Subscription”). The LG Subscription was completed on May 11, 2022 and consisted of the issuance by the Company in accordance with the LG Subscription Agreements of (i) an initial tranche of 4,416,960 common shares, in the aggregate, at a price of $10.00 per share, for an aggregate initial tranche subscription price of approximately $44.2 million, and (ii) a second tranche of 883,392 common shares, in the aggregate, at a price of $6.60 per share (based on the volume-weighted average trading price of the Company’s common shares for the 5 trading days ending immediately prior to April 29, 2022), for an aggregate second tranche subscription price of approximately $5.8 million, for a total investment of $50.0 million.The Company has granted certain registration rights to LGES and LGC under the LG Subscription Agreements. The Company agreed to file with the SEC within 30 days of the closing of the LG Subscription a registration statement covering the resale of the common shares issued pursuant to the LG Subscription Agreements. The Company is required to use commercially reasonable efforts to have such registration statement declared effective by the SEC as soon as practicable and no later than the earlier of (A) 60 days after the closing of the LG Subscription (or 90 days after the closing of the LG Subscription if the SEC notifies the Company that it will review the registration statement) or (B) 10 business days after the SEC notifies the Company in writing that it will not review the registration statement. LGES and LGC have agreed to an extension for the filing of the registration statement. The Company agreed to keep the registration statement (or another shelf registration statement covering the common shares issued pursuant to the LG Subscription Agreements) effective until the
110
earlier of (x) the third anniversary of the closing of the LG Subscription or (y) the date on which LGES or LGC, as applicable, ceases to hold any of the common shares acquired pursuant to the LG Subscription Agreements.
LG Standstill Agreement
On December 13, 2021, the Company, LGES and LGC entered into a Standstill Agreement (the “Standstill Agreement”), which restricts LGES, LGC and each of their respective subsidiaries from taking certain actions until LGES and its subsidiaries or LGC and its subsidiaries, as applicable, cease to beneficially own or control voting securities of the Company having voting rights equal to or greater than 50% of the voting rights attached to the Acquired Shares to be acquired by each of LGES and LGC under the applicable Subscription Agreement (the “Standstill Period”). The obligations of LGES and LGC under the Standstill Agreement are separate such that the termination of the Standstill Period applicable to one party shall not necessarily result in the termination of the Standstill Period applicable to the other party. The actions that LGES, LGC and any of their respective subsidiaries are restricted from taking during the Standstill Period include, among others, (A) the acquisition of additional voting securities or of any debt, material assets or material businesses of the Company, (B) any tender or exchange offer, take-over bid, merger, business combination and certain other transactions involving the Company and its securities, (C) any solicitation of proxies or votes or other attempt to influence votes by any holder of the Company’s securities and (D) formation of a “group” (as defined under the Securities Exchange Act of 1934) with respect to the Company’s securities.
The foregoing descriptions of the LG Subscription Agreements and the LG Standstill Agreement do not purport to describe all the terms and provisions thereof and are qualified in their entirety by reference to the full text of those agreements, copies of which are included as exhibits to this registration statement.
Glencore Registration Rights Agreement
Concurrently with the issuance of the Glencore Convertible Note, the Company entered into a registration rights agreement with Glencore (the “Glencore Registration Rights Agreement”). The Glencore Registration Rights Agreement provides that upon request of the holder of the Glencore Convertible Note, the Company will file with the SEC within 45 days after notice of such request, a resale registration statement covering the resale of the common shares issuable upon conversion of the Glencore Convertible Note and upon exercise of the Glencore Warrants and held by such holder. The Company is required to use commercially reasonable efforts to have such registration statement declared effective by the SEC as soon as practicable and no later than the earlier of (A) 45 days after the filing of such registration statement (or 75 days after the filing of such registration statement if the SEC notifies the Company that it will review the registration statement) or (B) 15 business days after the SEC notifies the Company in writing that it will not review the registration statement. The Company agreed to keep the registration statement (or another shelf registration statement covering the common shares issued or issuable upon conversion of the Glencore Convertible Note and upon exercise of the Glencore Warrants) effective until three years after the holder’s receipt of the common shares issued upon conversion of the Glencore Convertible Note or upon exercise of the Glencore Warrants, as applicable.
In addition, subject to certain requirements and customary conditions, including with regard to the number of demand rights that may be exercised, the holder of the Glencore Convertible Note may demand at any time or from time to time, that the Company file a registration statement on Form
F-3
(or on FormF-1
if FormF-3
is not available) to register the common shares issuable upon conversion of the Glencore Convertible Note and upon exercise of the Glencore Warrants and held by such holder. In addition, the holder of the Glencore Convertible Note may specify that such demand registration take the form of an underwritten offering, subject to limitations on the number of demands and underwritten offerings that can be requested by the holder, as specified in the Glencore Registration Rights Agreement. The holder of the Glencore Convertible Note will also have “piggy-back” registration rights, subject to certain requirements and customary conditions.111
The Glencore Registration Rights Agreement also provides that the Company will pay certain expenses relating to such registrations and indemnify the holder of the Glencore Convertible Note against (or make contributions in respect of) certain liabilities that may arise under the Securities Act.
Listing
Our common shares are listed on NYSE under the symbol “LICY”. Holders of our common shares should obtain current market quotations for their securities. There can be no assurance that our common shares will remain listed on NYSE. If we fail to comply with the NYSE listing requirements, our common shares could be delisted from NYSE. A delisting of our common shares would affect the liquidity of our common shares and could inhibit or restrict our ability to raise additional financing.
Transfer Agent
A register of holders of our common shares is maintained by Continental Stock Transfer and Trust Company in the United States, who serves as registrar and transfer agent for our equity securities.
112
DESCRIPTION OF AMENDED AND RESTATED COMPANY ORGANIZATIONAL DOCUMENTS
Annual Meetings
Under the OBCA, the Company must hold its first annual meeting of shareholders within 18 months after the date on which it was incorporated, and after that must hold an annual meeting not later than 15 months after the last annual meeting at such time and place in or outside the Province of Ontario as may be determined by the directors of the Company or, in the absence of such a determination, at the place where the registered office of the Company is located.
Board and Shareholder Ability to Call Shareholder Meetings
The
by-laws
of the Company provide that meetings of the shareholders may be called by the board of directors at any time. In addition, under the OBCA, the holders of not less than 5% of the issued shares of a corporation that carry the right to vote at a meeting sought to be held may requisition that the directors call a meeting of shareholders for the purposes stated in the requisition. Upon receiving a requisition to call a meeting of shareholders, the directors must, within 21 days after receiving the requisition, call a meeting of shareholders to transact the business stated in the requisition unless a record date has been fixed for a meeting of shareholders and notice of the meeting has been given in accordance with the OBCA; the directors of the Company have called a meeting of shareholder and have given notice of the meeting in accordance with the OBCA; or the business of the meeting as stated in the requisition includes certain matters, including, but not limited to, a proposal the primary purpose of which is to enforce a personal claim or redress a personal grievance against the Company or its directors, officers or security holders. If the directors do not call such a meeting within 21 days after receiving the requisition, any shareholder who signed the requisition may call the meeting. The Company must reimburse the requisitioning shareholders for the expenses reasonably incurred by them in requisitioning, calling and holding the meeting unless the shareholders have not acted in good faith and in the interest of the shareholders of the corporation generally.Shareholder Meeting Quorum
The
by-laws
of the Company provide that one or more persons who are, or who represent by proxy, one or more shareholders who, in the aggregate, hold at least 33 1/3% of the issued shares of the Company entitled to be voted at the meeting, constitute a quorum at any annual or special meeting of shareholders.Voting Rights
Under the OBCA, at any meeting of shareholders at which a quorum is present, any action that must or may be taken or authorized by the shareholders, except as otherwise provided under the OBCA, the Company articles or
by-laws,
may be taken or authorized by an “ordinary resolution,” which is a simple majority of the votes cast by shareholders voting shares that carry the right to vote at general meetings. The Company’sby-laws
provide that every motion put to a vote at a meeting of shareholders will be decided by a show of hands unless a ballot is directed by the chair or demanded by any shareholder entitled to vote who is present in person or by proxy. Votes by a show of hands or its functional equivalent result in each person having one vote regardless of the number of shares such person is entitled to vote. If voting is conducted by ballot, each person is entitled to one vote for each share such person is entitled to vote.There are no limitations on the right of
non-resident
or foreign owners to hold or vote securities of the Company imposed by Ontario law or by the articles or other constituent document of the Company.Shareholder Action by Written Consent
Under the OBCA, shareholder action without a meeting may be taken by a resolution signed by all the shareholders or their attorney authorized in writing entitled to vote on that resolution at a meeting of
113
shareholders. A written resolution of shareholders is as valid as if it had been passed at a meeting of those shareholders. A written resolution of shareholders dealing with all matters required by the OBCA to be dealt with at a meeting of shareholders, and signed by all the shareholders or their attorney authorized in writing entitled to vote on that resolution at that meeting, satisfies all the requirements of the OBCA relating to that meeting of shareholders.
Access to Books and Records and Dissemination of Information
The Company must keep at its registered office, or at such other place in Ontario as designated by the directors of the Company, the documents, copies, registers, minutes and other records which the Company is required by the OBCA to keep at such places. The Company must prepare and maintain, among other specified documents, adequate accounting records. Under the OBCA, any director, shareholder or creditor of the Company may, free of charge, examine certain of the Company’s records during the usual business hours of the Company.
Election and Appointment of Directors
The articles do not provide for the board of directors to be divided into classes.
At any general meeting of shareholders at which directors are to be elected, a separate vote of shareholders entitled to vote will be taken with respect to each candidate nominated for director. Pursuant to the OBCA, any casual vacancy occurring on the board may be filled by a quorum of the remaining directors, subject to certain exceptions. If the Company does not have a quorum of directors, or if there has been a failure to elect the number of directors required by the articles or the OBCA, the directors then in office must forthwith call a special meeting of shareholders to fill the vacancy and, if the directors fail to call a meeting or if there are no directors then in office, the meeting may be called by any shareholder. Pursuant to the OBCA, where empowered by a special resolution, the directors may, between meetings of shareholders, appoint one or more additional directors, but the number of additional directors may not exceed one and one third times the number of directors required to have been elected at the last annual meeting of shareholders.
The minimum number of directors the Company may have is one and the maximum number of directors is ten, as set out in the articles. The OBCA provides that any amendment to the articles to increase or decrease the minimum or maximum number of directors requires the approval of shareholders by a special resolution.
Removal of Directors
Pursuant to the OBCA, the shareholders may remove any director before the expiration of his or her term of office by ordinary resolution at an annual or special meeting of shareholders, provided that, where the holders of any class or series of shares have an exclusive right to elect one or more directors, a director so elected may only be removed by an ordinary resolution at a meeting of the shareholders of that class or series. In that event, the shareholders may elect, by ordinary resolution, another individual as director to fill the resulting vacancy.
Proceedings of Board of Directors
At all meetings of the directors of the Company, every question will be decided by a majority of the votes cast and, in the case of an equality of votes, the chair of the meeting will not have a second or casting vote. A resolution of the directors or of any committee of the directors consented to in writing by all of the directors entitled to vote on it is as valid as if it had been passed at a meeting of the directors or of the committee of the directors duly called and held.
Requirements for Advance Notification of Shareholder Nominations
Pursuant to the
by-laws
of the Company and subject to the OBCA, the articles of the Company and applicable securities laws, shareholders of record entitled to vote will nominate persons for election to the board114
of directors of the Company only by providing proper notice to the corporate secretary. In the case of annual meetings, proper notice must be given, generally between 30 and 65 days prior to the date of the annual meeting. However, in the event that the annual meeting of shareholders is to be held on a date that is less than 50 days after the date (the “Notice Date”) that is the earlier of (i) the date that a notice of meeting is filed for such meeting, and (ii) the date on which the first public announcement of the meeting was made, the notice must be given on the 10th day following the Notice Date. In the case of a special meeting called for the purpose of electing directors and which is not also an annual meeting of shareholders, the notice must be given not later than the close of business on the 15th day following the date that is the earlier of (i) the date that a notice of meeting is filed for such meeting, and (ii) the date on which the first public announcement of the special meeting was made. Such notice must include, among other information, certain information with respect to each shareholder nominating persons for elections to the board, a written consent of each nominee consenting to serve as a director, disclosure about any proxy, contract, arrangement, understanding or relationship pursuant to which the nominating shareholder has a right to vote shares and any other information the Company may reasonably require to determine the eligibility of the nominee to serve as a director.
Approval of Amalgamations, Mergers and Other Corporate Transactions
Under the OBCA, certain corporate actions, such as: (i) amalgamations (other than with certain affiliated corporations); (ii) continuances; (iii) sales, leases or exchanges of all, or substantially all, the property of a corporation other than in the ordinary course of business; (iv) reductions of stated capital for any purpose, including in connection with the payment of special distributions (subject, in certain cases, to the satisfaction of solvency tests); and (v) other actions such as liquidations, or arrangements, must be approved by a special resolution of shareholders.
In certain specified cases where share rights or special rights may be prejudiced or interfered with, a special resolution of shareholders to approve the corporate action in question affecting the share rights or special rights, is also required to be approved separately by the holders of a class or series of shares, including a class or series of shares not otherwise carrying voting rights. In specified extraordinary corporate actions, such as approval of plans of arrangements and amalgamations all shares have a vote, whether or not they generally vote and, in certain cases, have separate class votes.
Limitations on Director Liability and Indemnification of Directors and Officers
Under the OBCA, no provision in a contract, the articles, the
by-laws
or a resolution relieves a director or officer from the duty to act in accordance with the OBCA and its related regulations or relieves him or her from liability for a breach of the OBCA or its regulations.A director is not liable under the OBCA for certain acts if the director exercised the care, diligence and skill that a reasonably prudent person would have exercised in comparable circumstances, including reliance, in good faith, on (i) financial statements of the corporation represented to the director by an officer of the corporation or in a written report of the auditor of the corporation to fairly reflect the financial position of the corporation in accordance with generally accepted accounting principles; (ii) an interim or other report of the corporation represented to the director by an officer of the corporation to fairly reflect the financial position of the corporation in accordance with generally accepted accounting principles; (iii) a report or advice of an officer or employee of the corporation, where it is reasonable in the circumstances to rely on the report of advice; or (iv) a report of a lawyer, accountant, engineer, appraiser or other person whose profession lends credibility to a statement made by that person.
Under the OBCA, the Company may indemnify its current or former directors or officers or another individual who acts or acted at the Company’s request as a director or officer, or an individual acting in a similar capacity, of another entity, against all costs, charges and expenses, including an amount paid to settle an action or satisfy a judgment, reasonably incurred by the individual in respect of any civil, criminal, administrative,
115
investigative or other proceeding in which the individual is involved because of his or her association with the Company or another entity.
The OBCA also provides that the Company may advance monies to a director, officer or other individual for costs, charges and expenses reasonably incurred in connection with such a proceeding; provided that such individual must repay the monies if the individual does not fulfill the conditions described below.
However, indemnification is prohibited under the OBCA unless the individual (i) acted honestly and in good faith with a view to the Company’s best interests, or the best interests of the other entity for which the individual acted as director or officer or in a similar capacity at the Company’s request; and (ii) in the case of a criminal or administrative action or proceeding that is enforced by a monetary penalty, the individual had reasonable grounds for believing that his or her conduct was lawful.
Under the Company’s
by-laws,
the Company will indemnify to the fullest extent permitted by the OBCA (i) any director or officer of the Company; (ii) any former director or officer of the Company; (iii) any individual who acts or acted at the Company’s request as a director or officer, or in a similar capacity, of another entity, against all costs, charges and expenses reasonably incurred by the individual in respect of any civil, criminal, administrative, investigative or other proceeding in which the individual is involved because of that association with the Company or other entity.Derivative Suits and Oppression Remedy
Under the OBCA, a complainant (being a current or former director, officer or security holder of a corporation, which includes a beneficial shareholder, and any other person that a court considers to be a proper person to make such an application) of the Company may apply to the Ontario Superior Court of Justice for leave to bring an action in the name and on behalf of the Company or any of its subsidiaries, or to intervene in an existing action to which the Company or any of its subsidiaries is a party, for the purpose of prosecuting, defending or discontinuing an action on behalf of the Company or any of its subsidiaries.
No such action may be brought and no intervention in any action may be made unless the complainant has given the requisite notice of the application for leave to the directors of the Company or its subsidiary of the complainant’s intention to apply to the court and the court is satisfied that (i) the directors of the Company or its subsidiary will not bring, diligently prosecute or defend or discontinue the action; (ii) the complainant is acting in good faith; and (iii) it appears to be in the best interests of the Company or its subsidiary for the action to be brought, prosecuted, defended or discontinued.
Under the OBCA, the court in a derivative action may make any order it thinks fit.
Under the OBCA, a complainant, and, in the case of a public corporation, the Ontario Securities Commission, may apply to the Ontario Superior Court of Justice for any interim or final order the court thinks fit, including, but not limited to, an order restraining the conduct complained of, where the court is satisfied that, in respect of the Company or any of its affiliates, any act or omission of the Company or any of its affiliates effects or threatens to effect a result, the business or affairs of the Company or any of its affiliates are, have been or are threatened to be carried on or conducted in a manner, or the powers of the directors of the Company or any of its affiliates are, have been or are threatened to be exercised in a manner, that is oppressive or unfairly prejudicial to or that unfairly disregards the interests of any security holder, creditor, director or officer of the Company.
Exclusive Forum
The Company’s
by-laws
provide that, unless the Company consents in writing to the selection of an alternative forum and except as set out below, the Ontario Superior Court of Justice and the appellate courts therefrom will, to the fullest extent permitted by law be the sole and exclusive forum for any derivative action or116
proceeding brought on behalf of the Company, any action asserting a claim of breach of a fiduciary duty owed by any director, officer or other employee to the Company, any action asserting a claim arising pursuant to any provision of the OBCA or the Company’s articles or
by-laws
of the Company, or any action asserting a claim related to the relationships among the Company, its affiliates and their respective shareholders, directors or officers (other than the business carried on by the Company or its affiliates). The Company’sby-laws
also provide that, notwithstanding the foregoing, unless the Company consents in writing to the selection of an alternative forum, the federal district courts of the United States of America will have exclusive jurisdiction for the resolution of any complaint asserting a cause of any action brought to enforce a duty or liability created by the Securities Act. The exclusive forum provision in theby-laws
will not apply to actions arising under the Securities Act or the Exchange Act. Investors cannot waive compliance with the U.S. federal securities laws and the rules and regulations thereunder.Amendment of the Articles,
By-laws
and Alteration of Share CapitalUnder the OBCA, the Company may amend the articles by special resolution. For purposes of the OBCA, a special resolution is a resolution submitted to a special meeting of shareholders duly called for the purpose of considering the resolution and passed at the meeting by at least
two-thirds
of the votes cast or consented to in writing by all shareholders entitled to vote at such a meeting. A special resolution is generally required to approve corporate matters that may materially affect the rights of shareholders or are of a transformative nature for the Company, including, but not limited to, changes to the Company’s authorized capital structure, changes to the rights privileges, restrictions and conditions in respect of any of the Company’s shares, a change in the Company’s name, the winding up, dissolution or liquidation of the Company, and a plan of arrangement with shareholders.Under the OBCA, the board may, by resolution, make, amend or repeal any
by-laws
that regulate the business or affairs of the Company. Where the directors make, amend or repeal anyby-law,
they must submit theby-law,
amendment or repeal to the shareholders at the next meeting of shareholders, and the shareholders may confirm, reject or amend theby-law,
amendment or repeal. Where aby-law
is made, amended or repealed by the directors, theby-law,
amendment or repeal is effective from the date of the resolution of the directors until it is confirmed, amended or rejected by shareholders (or, if the directors fail to submit theby-law,
amendment or repeal to shareholders, until the date of the shareholders meeting at which it should have been submitted).117
CERTAIN RELATIONSHIPS AND RELATED PERSON TRANSACTIONS
Our Related Party Transactions
Related-Party Expenses
The Company has engaged Fade In Production Pty. Ltd., which is controlled by certain members of the immediate family of the Executive Chair of
Li-Cycle,
to provide it with corporate video production services since 2017. During the twelve months ended October 31, 2021, the Company incurred expenses of $145,851 attributable to this vendor, as compared to $42,739 for the twelve months ended October 31, 2020. During the three and six months ended April 30, 2022, the Company incurred expenses of $105,372 and $107,472 in relation to this vendor, compared to $69,347 and $97,005 for the three and six months ended April 30, 2021, respectively.The Company has engaged Ashlin BPG Marketing, a related party as described above, to provide it with
Li-Cycle
branded promotional products for both customers and employees since April 1, 2020. During the twelve months ended October 31, 2021, the Company incurred expenses of $46,640 attributable to this vendor, as compared to $5,405 for the twelve months ended October 31, 2020. During the three and six months ended April 30, 2022, the Company incurred expenses of $11,486 and $45,265 attributable to this vendor, compared to $4,415 and $23,688 for the three and six months ended April 30, 2021, respectively.The Company has engaged Consulero Inc., which is controlled by certain members of the immediate family of the Company’s President and Chief Executive Officer, to provide it with technology services in relation to the Company’s inventory management system since September 1, 2020. During the twelve months ended October 31, 2021, the Company incurred expenses of $103,040 attributable to this vendor, as compared to $46,515 for the twelve months ended October 31, 2020. During the three and six months ended April 30, 2022, the Company incurred expenses of $25,252 and $47,355 attributable to this vendor, compared to $22,153 and $58,279 for the three and six months ended April 30, 2021, respectively.
Consulting Agreement
On May 1, 2020,
Li-Cycle
entered into a consulting agreement with Atria Limited (“Atria”), an entity which beneficially owned more than 5% of the outstandingLi-Cycle
Corp. common shares at that time, to agree upon and finalize the consideration for certain business development and marketing consulting services that were previously performed on behalf ofLi-Cycle
from 2018 through April 2020. The fees for such services were agreed at 12,000 common shares ofLi-Cycle
Corp., payable in installments of 1,000 shares per month. On January 25, 2021,Li-Cycle
issued all of the 12,000 shares to Atria as full and final satisfaction of all obligations ofLi-Cycle
to Atria under the consulting agreement. Atria also directed the issuance of such shares as follows: 8,000 Shares to Atria; 2,000 Shares to Pella Ventures (an affiliated company of Atria); and 2,000 Shares to a director ofLi-Cycle
Corp. at the time, who is not related to Atria.Director Consulting Agreements
Under the terms of an agreement dated July 19, 2019 between
Li-Cycle
and Anthony Tse, Mr. Tse provided consulting services toLi-Cycle
in relation to the proposed expansion of its operations in Asia and was entitled to a fee of $4,700 per month for such services. For the twelve months ended October 31, 2021, Mr. Tse was paid aggregate fees under this agreement of $56,400. During the three and six months ended April 30, 2022, Mr. Tse was paid aggregate fees under this agreement of nil and $14,100, compared to $14,100 and $28,200 for the three and six months ended April 30, 2021. The consulting agreement was terminated on January 19, 2022.Under the terms of a consulting agreement dated July 19, 2019 between
Li-Cycle
and Rick Findlay, for the twelve months ended October 31, 2020, Mr. Findlay was paid aggregate fees of $1,332. For the twelve months ended October 31, 2021, there were no fees paid. The consulting agreement was terminated on June 25, 2021.118
Our Related Party Transaction Policy and Practices
Related Party Transaction Policy.
In connection with the Business Combination, our board of directors adopted a written related party transactions policy that became effective as of the Closing. For purposes of the policy, related party transactions include transactions that would be required to be disclosed under Item 7 of Form
20-F.
This includes transactions or loans between the company and (a) enterprises that directly or indirectly through one or more intermediaries, control or are controlled by, or are under common control with, the Company, (b) unconsolidated enterprises in which the Company has significant influence, or which has significant influence over the Company, (c) individuals owning, directly or indirectly, an interest in the voting power of the Company that gives them significant influence over the Company, and close members of any such individual’s family, (d) key management personnel, that is, those persons having authority and responsibility for planning, directing and controlling the activities of the Company, including directors and senior management of companies and close members of such individuals’ families, and (e) enterprises in which a substantial interest in the voting power is owned, directly or indirectly, by any person described in (c) or (d) or over which such a person is able to exercise significant influence. Shareholders beneficially owning a 10% interest or greater in voting power are deemed to have significant influence.Employment Agreements.
We have entered into employment agreements with certain of our executive officers.
Indemnification Agreements.
The Company has entered into separate indemnification agreements with its directors and executive officers, in addition to the indemnification provided for in the
by-laws.
These agreements, among other things, require the Company to indemnify its directors and executive officers for certain costs, charges and expenses, including attorneys’ fees, judgments, fines and settlement amounts, reasonably incurred by a director or executive officer in any action or proceeding because of their association with the Company or any of its subsidiaries.Certain Related Person Transactions Related to the Business Combination
Transaction Support Agreements
Concurrently with the execution of the Business Combination Agreement,
the Li-Cycle Holders
entered intothe Li-Cycle Transaction
Support Agreements with Peridot, pursuant to which each of theLi-Cycle
Holders agreed to, among other things, (i) vote or cause to be voted (whether in person, by proxy, by action by written consent, as applicable, or as may be requiredunder Li-Cycle’s shareholders
agreement or articles of incorporation)their Li-Cycle Shares
in favor of the Business Combination Agreement, the Arrangement and certain related transactions; (ii) be bound by certain other covenants and agreements related to the Business Combination and (iii) be bound by certain transfer restrictions with respect to such securities.PIPE Financing
MMF LT, LLC, an affiliate of Moore Strategic Ventures, LLC, which was a beneficial owner, in the aggregate, of more than 5% of
Li-Cycle’s
Class A preferred shares prior to the Business Combination, agreed to purchase as a PIPE Investor under the PIPE Financing, 5,000,000 shares of NewCo, which, upon the Amalgamation, became 5,000,000 common shares of the Company, for a purchase price of $10 per share.Anthony Peter Tse, Richard Findlay and Mark Wellings (through his holding company, ZCR Corp.), directors of
Li-Cycle,
respectively agreed to purchase as PIPE Investors in the PIPE Financing, 18,000, 13,000 and 18,000 shares of NewCo, which, upon the Amalgamation, became 18,000, 13,000 and 18,000 common shares of the Company, respectively, for a purchase price of $10 per share.119
Certain Relationships and Related Person Transactions prior to the Business Combination
Shareholder Agreement
The
Li-Cycle’s
shareholders agreement, as amended November 12, 2020, granted certain rights to holders ofLi-Cycle
Shares and Class A preferred shares ofLi-Cycle,
including certain approval rights,pre-emptive
rights,tag-along
rights, drag-along rights and information rights. The shareholders agreement terminated in connection with the consummation of the Business Combination.Related-Party Lease
From January 1, 2019 to December 31, 2021, the Company leased certain office space from Ashlin BPG Marketing, which is controlled by certain members of the immediate family of the Company’s President and Chief Executive Officer. Under the terms of the lease, the Company was required to pay Cdn. $4,500 per month plus applicable taxes, subject to 60 days’ notice of termination.
Li-Cycle
terminated the lease, effective December 31, 2021. During the twelve months ended October 31, 2021, the Company incurred expenses of $39,866 in relation to this vendor, as compared to $35,505 for the twelve months ended October 31, 2020. During the three and six months ended April 30, 2022, the Company incurred expenses of nil and $6,358 in relation to this vendor, compared to $11,155 and $17,353 for the three and six months ended April 30, 2021, respectively.Share Subscriptions
On March 23, 2018,
Li-Cycle
issued 1,663Li-Cycle
Shares to Richard Findlay, 9,706Li-Cycle
Shares to Alex Lowrie, 9,706Li-Cycle
Shares to Louise Lowrie, 9,706Li-Cycle
Shares to Anthony Lowrie and 9,706Li-Cycle
Shares to Liv Lowrie, in each case for a subscription price of C$18.03 perLi-Cycle
Share. On January 23, 2019,Li-Cycle
issued 4,234Li-Cycle
Shares to Alex Lowrie as a finder’s fee in connection with a prior financing conducted byLi-Cycle.
Alex Lowrie was a director ofLi-Cycle
prior to the Business Combination and each of Louise Lowrie, Anthony Lowrie and Liv Lowrie are immediate family members of Alex Lowrie.On October 10, 2019,
Li-Cycle
issued 123,519Li-Cycle
Shares to TechMet Limited, a beneficial owner of more than 5% of the outstandingLi-Cycle
Shares at that time, for a subscription price of C$53.34 perLi-Cycle
Share. On February 4, 2020,Li-Cycle
issued 122,600Li-Cycle
Shares to TechMet Limited for a subscription price of C$81.81.On May 1, 2020,
Li-Cycle
entered into a consulting agreement with Atria Limited (“Atria”), an entity which beneficially owned more than 5% of the outstandingLi-Cycle
Shares at that time, to agree upon and finalize the consideration for certain business development and marketing consulting services that were previously performed on behalf of the Company from 2018 through April 2020. The fees for such services were agreed at 12,000Li-Cycle
Shares payable in installments of 1,000Li-Cycle
Shares per month. On January 25, 2021,Li-Cycle
issued all of the 12,000 shares to Atria in full and final satisfaction of all obligations ofLi-Cycle
to Atria under the consulting agreement. Atria also directed the issuance of such shares as follows: 8,000 Shares to Atria; 2,000 Shares to Pella Ventures, an affiliated company of Atria; and 2,000 Shares to a director of the Company at such time, who is not related to Atria.Investor Agreement
At the closing date of the Business Combination, the Company, the Peridot Class B Holders and the.”
Li-Cycle
Holders entered into the Investor Agreement, pursuant to which, among other things, the Peridot Class B Holders and theLi-Cycle
Holders were granted certain registration rights with respect to the common shares held by the Peridot Class B Holders and theLi-Cycle
Holders. The Investor Agreement provides that the common shares held by theLi-Cycle
Holders will be subject to certain restrictions on the transfer of common shares held by them. For additional information, see the section titled “Description of Securities — Registration Rights — Investor Agreement
120
Promissory Notes
On June 16, 2021,
Li-Cycle
issued promissory notes (the “Promissory Notes”) for an aggregate principal amount of $7,000,000 as consideration for loans received from entities affiliated with the Chief Executive Officer and the Executive Chair ofLi-Cycle,
respectively. The Promissory Notes bore interest at the rate of 10% per annum and had a maturity date of December 15, 2023. The Promissory Notes were unsecured and subordinate to indebtedness owing toLi-Cycle’s
senior lender, BDC Capital Inc.Li-Cycle
had the option of prepaying all or any portion of the principal and accrued interest of the Promissory Notes prior to the maturity date without penalty, subject to certain conditions. On August 17, 2021,Li-Cycle
repaid the Promissory Notes and accrued interest in full, for a total of $7,113,151.121
PRINCIPAL SECURITYHOLDERS
The following table sets forth information regarding beneficial ownership of the Company’s common shares based on 175,383,580 common shares issued and outstanding as of July 22, 2022, with respect to beneficial ownership of our common shares by:
| • | each person known by us to be the beneficial owner of more than 5% of our issued and outstanding common shares; |
| • | each of our executive officers and directors; and |
| • | all our executive officers and directors as a group. |
In accordance with SEC rules, individuals and entities below are shown as having beneficial ownership over common shares they own or have the right to acquire within 60 days, as well as common shares for which they have the right to vote or dispose of such common shares. In accordance with SEC rules, for purposes of calculating percentages of beneficial ownership, common shares which a person has the right to acquire within 60 days are included both in that person’s beneficial ownership as well as in the total number of common shares issued and outstanding used to calculate that person’s percentage ownership but not for purposes of calculating the percentage for other persons.
Except as indicated by the footnotes below, we believe that the persons named below have sole voting and dispositive power with respect to all common shares that they beneficially own. The common shares owned by the persons named below have the same voting rights as the common shares owned by other holders. We believe that, as of July 22, 2022, approximately 66.6% of our common shares are owned by 29 record holders in the United States of America.
Unless otherwise indicated, the business address of each beneficial owner listed in the tables below is
c/o Li-Cycle
Holdings Corp., 207 Queen’s Quay West, Suite 590, Toronto, ON, M5J 1A7, Canada.Name and Address of Beneficial Owner | Number of Common Shares Beneficially Owned | Percentage of Outstanding Common Shares (1) | ||||||
Directors and Executive Officers | ||||||||
Ajay Kochhar (2) | 25,213,934 | 14.4 | % | |||||
Tim Johnston (3) | 11,738,245 | 6.7 | % | |||||
Mark Wellings (4) | 274,541 | * | ||||||
Rick Findlay (5) | 681,405 | * | ||||||
Anthony Tse (6) | 227,844 | * | ||||||
Alan Levande (7) | 933,660 | * | ||||||
Scott Prochazka (8) | 85,000 | * | ||||||
Kunal Sinha | 0 | * | ||||||
Debbie Simpson | 0 | * | ||||||
Kunal Phalpher (9) | 568,597 | * | ||||||
Chris Biederman (10) | 106,141 | * | ||||||
All directors and executive officers as a group (11 individuals) | 39,829,367 | 22.7 | % | |||||
Five Percent or Greater Shareholders | ||||||||
Louis M. Bacon (11) | 8,473,266 | 4.8 | % | |||||
CEC Aventurine Holdings, LLC (12) | 8,885,499 | 5.1 | % | |||||
| * | Less than 1 percent |
| (1) | Based upon a total of 175,383,580 common shares outstanding as of July 22, 2022. |
122
| (2) | Ajay Kochhar’s 25,213,934 shares beneficially owned include (1) 51,997 common shares owned directly by Mr. Kochhar, (2) 24,862,612 common shares owned by 2829908 Delaware LLC, a Delaware limited liability company, which is a wholly-owned subsidiary of Maplebriar Holdings Inc., a corporation organized under the laws of the Province of Ontario (“Maplebriar Holdings”), having a sole shareholder, The Kochhar Family Trust, an irrevocable trust established under the laws of the Province of Ontario, Canada (the “Trust”), and (3) 299,325 common shares subject to vested stock options held by Mr. Kochhar which includes options to acquire (i) 159,640 common shares at a price of US$0.02 per share until April 11, 2023, and (ii) 139,685 common shares at a price of US$0.36 per share until July 19, 2024. There is an oral agreement among Mr. Kochhar, the Trust, Maplebriar Holding, and 2829908 Delaware LLC, that grants Mr. Kochhar the sole power to control the voting and disposition of the common shares of the Company held by 2829908 Delaware LLC. Mr. Kochhar is one of three trustees of the Trust, along with Mr. Kochhar’s brother and father, and the beneficiaries of the Trust are principally relatives of Mr. Kochhar. There is an oral agreement among Mr. Kochhar, the Trust, Maplebriar Holdings and 2829908 Delaware LLC that grants Mr. Kochhar the sole power to control the voting and disposition of the common shares held by 2829908 Delaware LLC. Mr. Kochhar is a Director and the President and Chief Executive Officer of the Company. |
| (3) | Tim Johnston’s 11,738,245 shares beneficially owned include (1) 331,888 common shares owned directly by Mr. Johnston, (2) 11,047,167 common shares owned by Keperra Holdings Ltd., a Guernsey corporation (“Keperra”) and (3) 359,190 common shares subject to vested stock options, which includes options to acquire (i) 159,640 common shares at a price of US$0.02 per share until April 11, 2023, and (ii) 199,550 common shares at a price of US$0.36 per share until July 19, 2024. Mr. Johnston is the sole shareholder of Keperra. Artemis Nominees Limited is a nominee company that holds legal title to 100 shares of Keperra as nominee of and trustee for Mr. Johnston. Mr. Johnston is a Director and the Executive Chairman of the Company. |
| (4) | Mark Wellings’ 274,541 shares beneficially owned include (1) 7,304 common shares owned directly by Mr. Wellings, (2) 180,234 common shares owned by ZCR Corp., a holding company wholly owned by Mr. Wellings, 18,000 of which were purchased through the PIPE Financing, and (3) vested options to acquire 87,003 common shares at a price of US$0.37 per share until July 19, 2024. Mr. Wellings is a director of the Company. |
| (5) | Rick Findlay owns 681,405 shares directly, including 13,000 shares acquired through the PIPE Financing. Mr. Findlay is a Director of the Company. |
| (6) | Anthony Tse beneficially owns 227,844 common shares. Mr. Tse is a Director of the Company. |
| (7) | Alan Levande beneficially owns 933,660 common shares. Mr. Levande was previously the Chief Executive Officer and Chairman of the board of directors of Peridot prior to the consummation of the Business Combination and is currently a Director of the Company. |
| (8) | Scott Prochazka beneficially owns 85,000 common shares directly. Mr. Prochazka previously served as a Director of Peridot and is currently a Director of the Company. |
| (9) | Kunal Phalpher beneficially owns 568,597 common shares consisting of (1) 304,272 common shares owned directly by Mr. Phalpher, and (2) 264,325 common shares subject to vested stock options, which includes options to acquire (i) 124,640 common shares at a price of US$0.02 per share until April 11, 2023 and (ii) 139,685 common shares at a price of US$0.37 per share until July 19, 2024. Mr. Phalpher is the Chief Strategy Officer of the Company. |
| (10) | Chris Biederman beneficially owns 106,141 common shares which he owns directly. Mr. Biederman is the Chief Technology Officer of the Company. |
| (11) | Louis M. Bacon beneficially owned 8,473,266 common shares consisting of (1) 667,868 common shares held by MMF LT, LLC, a Delaware limited liability company (“MMF”) and (2) 7,805,398 common shares held by Moore Strategic Ventures, LLC, a Delaware limited liability company (“MSV”). According to an amendment no. 1 to a Schedule 13G filed with the SEC on February 14, 2022, Kendall Capital Markets, LLC, a Delaware limited liability company (“KCM”) and MSV may be deemed to be the beneficial owner of the 7,805,398 common shares held by MSV. Each of Moore Capital Management, LP, a Delaware limited partnership (“MCM”), Moore Global Investments, LLC, a Delaware limited liability company (“MGI”), Moore Capital Advisors, L.L.C., a Delaware limited liability company (“MCA”), MMF and |
123
| Mr. Bacon may be deemed to be the beneficial owner of 2,000,000 Shares held by MMF. Mr. Bacon controls the general partner of MCM, is the chairman and director of MCA, and is the indirect majority owner of MMF. MCM, the investment manager of MMF, has voting and investment control over the shares held by MMF. MGI and MCA are the sole owners of MMF. KCM, the investment manager of MSV, has voting and investment control over the shares held by MSV. Louis M. Bacon controls KCM and may be deemed the beneficial owner of the shares held by MSV. The business address of MCM, MMF, MGI, MCA, MSV, KCM, and Mr. Bacon is Eleven Times Square, New York, New York 10036. |
| (12) | CEC Aventurine Holdings, LLC holdings include common shares held by Peridot Acquisition Sponsor, LLC. CEC Aventurine Holdings, LLC is an affiliate of Peridot Acquisition Sponsor, LLC. The business address of CEC Aventurine Holdings, LLC is 2229 San Felipe Street, Suite 1450, Houston, TX 77019. CEC Aventurine Holdings is controlled by Carnelian Energy Capital III, L.P. (“Carnelian Fund III”), its sole member. Carnelian Fund III is controlled by its general partner, Carnelian Energy Capital GP III, L.P. (“Carnelian L.P.”) and Carnelian L.P. is controlled by its general partner Carnelian Energy Capital Holdings, LLC (“Carnelian Holdings”). Tomas Ackerman and Daniel Goodman are the controlling members of Carnelian Holdings. Accordingly, Tomas Ackerman and Daniel Goodman have voting and investment control of the common shares held by CEC Aventurine Holdings, LLC. |
We are not aware of any arrangement that may, at a subsequent date, result in a change of control of the Company.
124
SELLING SHAREHOLDERS
This prospectus relates to the possible resale by the selling shareholders of up to 84,351,553 common shares.
The selling shareholders may from time to time offer and sell any or all of the common shares set forth below pursuant to this prospectus. When we refer to the “selling shareholders” in this prospectus, we mean the persons listed in the tables below, and the pledgees, donees, transferees, assignees, successors and others who later come to hold any of the selling shareholders’ interest in our common shares after the date of this prospectus.
The table below sets forth, as of July 22, 2022, the name of the selling shareholders for which we are registering common shares for resale to the public, and the aggregate principal amount that the selling shareholders may offer pursuant to this prospectus. In accordance with SEC rules, individuals and entities below are shown as having beneficial ownership over shares they own or have the right to acquire within 60 days, as well as shares for which they have the right to vote or dispose of. Also in accordance with SEC rules, for purposes of calculating percentages of beneficial ownership, shares which a person has the right to acquire within 60 days are included both in that person’s beneficial ownership as well as in the total number of shares outstanding used to calculate that person’s percentage ownership but not for purposes of calculating the percentage for other persons. In some cases, the same shares are reflected more than once in the table below because more than one holder may be deemed the beneficial owner of the same shares.
The common shares held by certain of the selling shareholders are subject to transfer restrictions, as described in the section titled “.”
Description of Securities — Transfer Restrictions
We cannot advise you as to whether the selling shareholders will in fact sell any or all of such common shares. In addition, the selling shareholders may sell, transfer or otherwise dispose of, at any time and from time to time, the common shares in transactions exempt from the registration requirements of the Securities Act after the date of this prospectus, subject to applicable law.
Selling shareholder information for each additional selling shareholder, if any, will be set forth by prospectus supplement to the extent required prior to the time of any offer or sale of such selling shareholder’s common shares pursuant to this prospectus. Any prospectus supplement may add, update, substitute, or change the information contained in this prospectus, including the identity of each selling shareholder and the number of common shares registered on its behalf. A selling shareholder may sell all, some or none of such common shares in this offering. See “.”
Plan of Distribution
Except as indicated by the footnotes below, we believe that the persons named below have sole voting and dispositive power with respect to all common shares that they beneficially own. The shares owned by the persons named below do not have voting rights different from the shares owned by other holders.
Unless otherwise indicated, the address of each beneficial owner listed in the tables below is 207 Queen’s Quay West, Suite 590, Toronto, Ontario, M5J 1A7, Canada.
Securities Beneficially Owned prior to this Offering | Securities to Be Sold in this Offering | Securities Beneficially Owned after this Offering | ||||||||||||||||||
Name of Selling Shareholder | Common Shares | Percentage (1) | Common Shares | Common Shares | Percentage (1) | |||||||||||||||
2829908 Delaware LLC (2) | 24,862,612 | 14.2 | % | 24,862,612 | — | — | ||||||||||||||
Keperra Holdings Limited (3) | 11,047,167 | 6.3 | % | 11,047,167 | — | — | ||||||||||||||
CEC Aventurine Holdings, LLC (4) | 8,885,499 | 5.1 | % | 8,885,499 | — | — | ||||||||||||||
Moore Strategic Ventures (5) | 7,805,398 | 4.5 | % | 7,805,398 | — | — | ||||||||||||||
AH Clover Ltd. (6) | 5,704,542 | 3.3 | % | 5,704,542 | — | — | ||||||||||||||
Principal Nominees Limited (7) | 5,543,059 | 3.2 | % | 5,543,059 | — | — | ||||||||||||||
MMF LT, LLC (8) | 667,868 | * | 667,868 | — | — | |||||||||||||||
125
Securities Beneficially Owned prior to this Offering | Securities to Be Sold in this Offering | Securities Beneficially Owned after this Offering | ||||||||||||||||||
Name of Selling Shareholder | Common Shares | Percentage (1) | Common Shares | Common Shares | Percentage (1) | |||||||||||||||
Pella Ventures Limited (9) | 1,767,562 | 1.0 | % | 1,767,562 | — | — | ||||||||||||||
Atria Limited (10) | 1,770,247 | 1.0 | % | 1,770,247 | — | — | ||||||||||||||
Antara Capital Master Fund LP (11) | 1,700,000 | * | 1,700,000 | — | — | |||||||||||||||
Covalis Capital Master Fund Ltd. (12) | 249,565 | * | 249,565 | — | — | |||||||||||||||
MIC Capital Partners (Public) Parallel Cayman, L.P. (13) | 1,500,000 | * | 1,500,000 | — | — | |||||||||||||||
Nineteen77 Global Multi-Strategy Alpha Master Limited (14) | 1,454,252 | * | 321,930 | 1,132,322 | * | |||||||||||||||
Energy Impact Fund II LP (15) | 1,200,000 | * | 1,200,000 | — | — | |||||||||||||||
Atlas Point Energy Infrastructure Fund, LLC (16) | 2,138,689 | 1.2 | % | 1,000,000 | 1,138,689 | * | ||||||||||||||
2019 GS LLC (17) | 4,902,679 | 2.8 | % | 1,000,000 | 3,902,679 | 2.2 | % | |||||||||||||
Atlas Diversified Master Fund, Ltd. (18) | 1,000,000 | * | 1,000,000 | — | — | |||||||||||||||
Alexander Lowrie (19) | 973,245 | * | 973,245 | — | — | |||||||||||||||
Arena Capital Advisors (20) | 866,907 | * | 30,000 | 836,907 | * | |||||||||||||||
Alan Levande (21) | 933,660 | * | 933,660 | — | — | |||||||||||||||
D. E. Shaw Valence Portfolios, L.L.C. (22) | 900,000 | * | 900,000 | — | — | |||||||||||||||
Traxys Projects, L.P. (23) | 217,863 | * | 217,863 | — | — | |||||||||||||||
Nineteen77 Global Merger Arbitrage Master Limited (24) | 623,970 | * | 321,930 | 302,040 | * | |||||||||||||||
Richard Findlay (25) | 681,405 | * | 523,090 | 158,315 | * | |||||||||||||||
Standard Investment Research Hedged Equity Master Fund, Ltd (26) | 500,000 | * | 500,000 | — | — | |||||||||||||||
Lugard Road Capital Master Fund, LP (27) | 492,549 | * | 492,549 | — | — | |||||||||||||||
Arosa Opportunistic Fund LP (28) | 490,000 | * | 280,000 | 210,000 | * | |||||||||||||||
Markus Specks (29) | 377,910 | * | 377,910 | — | — | |||||||||||||||
Franklin Templeton Investment Funds —Franklin Natural Resources Fund (30) | 313,700 | * | 261,600 | 52,100 | — | |||||||||||||||
Kepos Alpha Master Fund L.P. (31) | 320,500 | * | 320,500 | — | — | |||||||||||||||
D. E. Shaw Oculus Portfolios, L.L.C. (32) | 300,000 | * | 300,000 | — | — | |||||||||||||||
Anthony Peter Tse (33) | 253,536 | * | 227,844 | 25,692 | * | |||||||||||||||
HITE Hedge ET LP (34) | 212,300 | * | 212,300 | — | — | |||||||||||||||
Arosa Alternative Energy Fund LP (35) | 210,000 | * | 120,000 | 90,000 | * | |||||||||||||||
Tech Opportunities LLC (36) | 200,000 | * | 200,000 | — | — | |||||||||||||||
ZCR Corp (37) | 180,234 | * | 180,234 | — | — | |||||||||||||||
Franklin Strategic Series - Franklin Natural Resources Fund (38) | 248,500 | * | 173,800 | 74,700 | — | |||||||||||||||
Thebes Offshore Master Fund, LP (39) | 166,667 | * | 166,667 | — | — | |||||||||||||||
Luxor Capital Partners, LP (40) | 24,635 | * | 24,635 | — | — | |||||||||||||||
Kepos Carbon Transition Master Fund L.P. (41) | 111,886 | * | 79,500 | 32,386 | * | |||||||||||||||
Difesa Master Fund, LP (42) | 100,000 | * | 100,000 | — | * | |||||||||||||||
Luxor Capital Partners Offshore Master Fund, LP (43) | 18,772 | * | 18,772 | — | — | |||||||||||||||
Nineteen77 Global Merger Arbitrage Opportunity Fund (44) | 89,854 | * | 53,760 | 36,094 | * | |||||||||||||||
Luxor Wavefront, LP (45) | 6,593 | * | 6,593 | — | — | |||||||||||||||
ASIG International Limited (46) | 66,109 | * | 66,109 | — | — | |||||||||||||||
126
Securities Beneficially Owned prior to this Offering | Securities to Be Sold in this Offering | Securities Beneficially Owned after this Offering | ||||||||||||||||||
Name of Selling Shareholder | Common Shares | Percentage (1) | Common Shares | Common Shares | Percentage (1) | |||||||||||||||
HITE Carbon Offset Ltd. (47) | 60,000 | * | 60,000 | — | — | |||||||||||||||
DS Liquid Div RVA ARST, LLC (48) | 58,798 | * | 58,798 | — | — | |||||||||||||||
Jonathan Silver (49) | 30,000 | * | 30,000 | — | — | |||||||||||||||
June Yearwood (50) | 30,000 | * | 30,000 | — | — | |||||||||||||||
Scott Prochazka (51) | 30,000 | * | 30,000 | — | — | |||||||||||||||
HITE Carbon Offset LP (52) | 27,700 | * | 27,700 | — | — | |||||||||||||||
Windermere Ireland Fund PLC (53) | 24,665 | * | 24,665 | — | — | |||||||||||||||
IAM Investments ICAV — O’Connor Event Driven UCITS Fund (54) | 4,534 | * | 2,380 | 2,154 | * | |||||||||||||||
| * | Less than 1% |
| (1) | Based upon a total of 175,383,580 common shares outstanding as of July 22, 2022. |
| (2) | 2829908 Delaware LLC is a Delaware limited liability company and wholly-owned subsidiary of Maplebriar Holdings Inc., a corporation organized under the laws of the Province of Ontario (“Maplebriar Holdings”), having a sole shareholder, The Kochhar Family Trust, an irrevocable trust established under the laws of the Province of Ontario, Canada (the “Trust”). Mr. Kochhar is a Director and the President and Chief Executive Officer of the Company. Mr. Kochhar is one of three trustees of the Trust, along with Mr. Kochhar’s brother and father, and the beneficiaries of the Trust are principally relatives of Mr. Kochhar. There is an oral agreement among Mr. Kochhar, the Trust, Maplebriar Holdings and 2829908 Delaware LLC that grants Mr. Kochhar the sole power to control the voting and disposition of the common shares held by 2829908 Delaware LLC. |
| (3) | Tim Johnston, a Director and the Executive Chairman of the Company, is the sole owner of Keperra Holdings Limited and may be deemed to have voting and investment control of the common shares. The business address of Keperra Holdings Limited is Trafalgar Court, 2nd Floor, East Wing, Admiral Park, St Peter Port, Guernsey, GY1 3EL. |
| (4) | CEC Aventurine Holdings, LLC holdings include common shares held by Peridot Acquisition Sponsor, LLC. CEC Aventurine Holdings, LLC is an affiliate of Peridot Acquisition Sponsor, LLC. The business address of CEC Aventurine Holdings, LLC is 2229 San Felipe Street, Suite 1450, Houston, TX 77019. CEC Aventurine Holdings is controlled by Carnelian Energy Capital III, L.P. (“Carnelian Fund III”), its sole member. Carnelian Fund III is controlled by its general partner, Carnelian Energy Capital GP III, L.P. (“Carnelian L.P.”) and Carnelian L.P. is controlled by its general partner Carnelian Energy Capital Holdings, LLC (“Carnelian Holdings”). Tomas Ackerman and Daniel Goodman are the controlling members of Carnelian Holdings. Accordingly, Tomas Ackerman and Daniel Goodman have voting and investment control of the common shares held by CEC Aventurine Holdings, LLC. |
| (5) | Louis Bacon controls the general partner of Moore Capital Management, LP, a Delaware limited partnership (“MCM”), is the chairman and director of Moore Capital Advisors, L.L.C., a Delaware limited liability company (“MCA”) and is the indirect majority owner of MMF LT, LLC, a Delaware limited liability company (“MMF”). MCM, the investment manager of MMF, has voting and investment control over the common shares held by MMF. Moore Global Investments, LLC, a Delaware limited liability company (“MGI”) and MCA are the sole owners of MMF. Kendall Capital Markets, LLC, a Delaware limited liability company (“KCM”), the investment manager of Moore Strategic Ventures, LLC, a Delaware limited liability company (“MSV”), has voting and investment control over the common shares held by MSV. Louis M. Bacon controls KCM and may be deemed the beneficial owner of the common shares held by MSV. The business address of MCM, MMF, MGI, MCA, MSV, KCM, and Mr. Bacon is 11 Times Square, New York, New York 10036. |
| (6) | Andrew Henry Clover, as sole shareholder of AH Clover Ltd., may be deemed to have voting or investment power with respect to the common shares. The business address of AH Clover Ltd. is c/o TC Group, Level 1 Devonshire House, London, W1J 8AJ. |
127
| (7) | The business address of Principal Nominees Limited is 16 South Park, Seven Oaks, GB-KEN, GB TN13 1AN. |
| (8) | MCM is the investment manager of MMF LT, LLC and has voting and investment control of the common shares held by MMF. Louis Bacon controls the general partner of MCM and may be deemed the beneficial owner of the common shares of the Company held by MMF. Mr. Bacon is also the indirect majority owner of MMF. The business address of MMF, MCM and Mr. Bacon is 11 Times Square, New York, New York 10036. |
| (9) | The business address of Pella Ventures Limited is St. Martin’s House, Le Bordage, St. Peter Port, Guernsey GY1 4JE. |
| (10) | The business address of Atria Limited is St. Martin’s House, Le Bordage, St. Peter Port, Guernsey GY1 4JE. |
| (11) | Himanshu Gulati, the sole member of the GP of Antara Capital LP (the Investment Manager of Antara Capital Master Fund LP), may be deemed to have voting and dispositive power with respect to the common shares held by the Antara Capital Master Fund LP. Mr. Gulati disclaims beneficial ownership of the common shares held by Antara Capital Master Fund LP except to the extent of any pecuniary interest. The business address of Antara Capital Master Fund LP is 500 5th Avenue, Suite 2320, New York, New York 10110. |
| (12) | Zilvinas Mecelis, as the Chief Investment Officer of Covalis Capital LLP, the investment manager for Covalis Capital Master Fund Ltd., may be deemed to have voting and investment power with respect to the common shares. The business address of Covalis Capital Master Fund Ltd. is 5th Floor 52 Conduit Street, London, England, W1S 2XY. |
| (13) | As managers of MIC Capital Partners (Public) Parallel Cayman, L.P., Hani Barhoush, Rodney Cannon and Maxime Franzetti have voting or investment control over the common shares. The business address of MIC Capital Partners (Public) Parallel Cayman, L.P. is c/o Walkers Corporate Limited, Cayman Corporate Centre, 27 Hospital Rd., George Town Grand Cayman E9 KY1-9008. |
| (14) | Kevin Russell, the Chief Investment Officer of UBS O’Connor LLC, the investment manager of Nineteen77 Global Multi-Strategy Alpha Master Limited, has voting or investment control over the common shares. The business address of Nineteen77 Global Multi-Strategy Alpha Master Limited is c/o Maples Corporate Services Limited, PO Box 309, Ugland House, George Town KY1-1104, Cayman Islands. |
| (15) | Hans Kobler, as the managing member of Energy Impact Partners LLC, the general partner of Energy Impact Fund II LP, may be deemed to have voting or investment control over the common shares. The business address of Energy Impact Fund II LP is 622 Third Avenue, 37 th Floor, New York, New York 10017. |
| (16) | Paul McPheeters, the portfolio manager of Atlas Point Energy Infrastructure Fund, LLC, has voting or investment control over the common shares. The business address of Atlas Point Energy Infrastructure Fund, LLC is c/o Atlantic Trust Company, N.A., 3290 Northside Parkway, 7 th Floor, Atlanta, Georgia 30327. |
| (17) | HCC Manager LLC, the manager of 2019 GS LLC, has voting or investment control over the common shares. The business address of 2019 GS LLC is c/o HCC Manager LLC, 222 N. Lasalle, Suite 2000, Chicago, Illinois 60601. |
| (18) | Linburgh Martin, John Sutlic and Scott Schroeder, as directors of Atlas Diversified Master Fund, Ltd, are the beneficial owners of the common shares and have voting control. The business address of Atlas Diversified Master Fund, Ltd. is c/o Balyasny Asset Management L.P., 444 West Lake Street, 50 th Floor, Chicago, Illinois 60606. |
| (19) | The business address of Alexander Lowrie is 96 Kensington High Street, London, United Kingdom, W8 4SG. |
| (20) | Arena Capital Advisors, LLC is the general partner of Arena Capital Advisors and may be deemed to have voting control and investment discretion over the common shares. The partners of Arena Capital Advisors are Daniel Elperin, Jeremy Sagi and Sanije Perrett. The business address of Arena Capital Advisors is 12121 Wilshire Boulevard, Suite 1010, Los Angeles, California 90025. |
| (21) | Alan Levande is a Director of Li-Cycle. The business address of Alan Levande is 207 Queen’s Quay West, Suite 590, Toronto, Ontario, M5J 1A7, Canada. |
128
| (22) | D. E. Shaw Valence Portfolios, L.L.C. has the power to vote or to direct the vote of (and the power to dispose or direct the disposition of) the common shares directly owned by it. D. E. Shaw & Co., L.P., as the investment adviser of D. E. Shaw Valence Portfolios, L.L.C., may be deemed to have shared power to vote or direct the vote of (and shared power to dispose or direct the disposition of) the common shares. D. E. Shaw & Co., L.L.C., as the manager of D. E. Shaw Valence Portfolios, L.L.C., may be deemed to have shared power to vote or direct the vote of (and shared power to dispose or direct the disposition of) the common shares. Julius Gaudio, Maximilian Stone, and Eric Wepsic, or their designees, exercise voting and investment control over the common shares on D. E. Shaw & Co., L.P.’s and D. E. Shaw & Co., L.L.C.’s behalf. D. E. Shaw & Co., Inc., as general partner of D. E. Shaw & Co., L.P., may be deemed to have shared power to vote or direct the vote of (and shared power to dispose or direct the disposition of) the common shares. D. E. Shaw & Co. II, Inc., as managing member of D. E. Shaw & Co., L.L.C., may be deemed to have shared power to vote or direct the vote of (and shared power to dispose or direct the disposition of) the common shares. None of D. E. Shaw & Co., L.P., D. E. Shaw & Co., L.L.C., D. E. Shaw & Co., Inc., or D. E. Shaw & Co. II, Inc. owns any common shares of the Company directly, and each entity disclaims beneficial ownership of the common shares. David E. Shaw does not own any common shares of the Company directly. By virtue of David E. Shaw’s position as President and sole shareholder of D. E. Shaw & Co., Inc., which is the general partner of D. E. Shaw & Co., L.P., and by virtue of David E. Shaw’s position as President and sole shareholder of D. E. Shaw & Co. II, Inc., which is the managing member of D. E. Shaw & Co., L.L.C., David E. Shaw may be deemed to have shared power to vote or direct the vote of (and shared power to dispose or direct the disposition of) the common shares and, therefore, David E. Shaw may be deemed to be the beneficial owner of the common shares. David E. Shaw disclaims beneficial ownership of the common shares. The business address of D. E. Shaw Valence Portfolios, L.L.C. is 1166 Avenue of the Americas, 9 th Floor, New York, New York 10036. |
| (23) | Alan Docter and Mark Kristoff, as directors of Traxys Resources Ltd., the general partner of Traxys Projects L.P., have voting or investment control over the common shares. The business address of Traxys Projects, L.P. is 299 Park Avenue, 38th Floor, New York, New York 10171. |
| (24) | Kevin Russell, the Chief Investment Officer of UBS O’Connor LLC, the investment manager of Nineteen77 Global Merger Arbitrage Master Limited, has voting or investment control over the common shares. The business address of Nineteen77 Global Merger Arbitrage Master Limited is c/o UBS O’Connor LLC, UBS Tower, 1 North Wacker Drive, Chicago, Illinois 60606. |
| (25) | Richard Findlay is a Director of Li-Cycle. The business address of Richard Findlay is 207 Queen’s Quay West, Suite 590, Toronto, Ontario, M5J 1A7, Canada. |
| (26) | Shawn M. Brennan, as managing member of the general partner of SIR Capital Management L.P. as investment manager of Standard Investment Research Hedged Equity Master Fund, Ltd, has voting or investment control over the common shares. The business address of Standard Investment Research Hedged Equity Master Fund, Ltd is 640 8 th Avenue, 34th Floor, New York, New York 10036. |
| (27) | Jonathan Green, the portfolio manager of Luxor Capital Group, LP the investment manager of Lugard Road Capital Master Fund, LP, has voting or investment control over the common shares. The business address of Lugard Road Capital Master Fund, LP is 1114 Avenue of the Americas, 28 th Floor, New York, New York 10036. |
| (28) | Till Bechtolsheimer, the Chief Executive Officer of the investment manager of Arosa Opportunistic Fund LP, has voting or investment control over the common shares. The business address of Arosa Opportunistic Fund LP is 550 West 34 th Street, New York, New York, 10001. |
| (29) | The business address of Markus Specks is 207 Queen’s Quay West, Suite 590, Toronto, Ontario, M5J 1A7, Canada. |
| (30) | Fred Fromm, the portfolio manager of Franklin Templeton Investment Funds — Franklin Natural Resources Fund and vice president of Franklin Advisers, Inc., the investment manager for Franklin Templeton Investment Funds — Franklin Natural Resources Fund, has voting or investment control over the common shares. The business address of Franklin Templeton Investment Funds — Franklin Natural Resources Fund is One Franklin Parkway, San Mateo, California 94403. |
| (31) | Kepos Capital LP is the investment manager of Kepos Alpha Master Fund L.P. and Kepos Partners LLC is the General Partner of Kepos Alpha Master Fund L.P. and each may be deemed to have voting and |
129
| dispositive power with respect to the common shares. The general partner of Kepos Capital LP is Kepos Capital GP LLC and the Managing Member of Kepos Partners LLC is Kepos Partners MM LLC. Mark Carhart controls Kepos Capital GP LLC and Kepos Partners MM LLC and, accordingly, may be deemed to have voting and dispositive power with respect to the common shares held by Kepos Alpha Master Fund L.P. Mr. Carhart disclaims beneficial ownership of the common shares held by Kepos Alpha Master Fund L.P. The business address of Kepos Alpha Master Fund L.P. is 11 Times Square, 35 th Floor, New York, New York 10036. |
| (32) | D. E. Shaw Oculus Portfolios, L.L.C. has the power to vote or to direct the vote of (and the power to dispose or direct the disposition of) the common shares directly owned by it. D. E. Shaw & Co., L.P., as the investment adviser of D. E. Shaw Oculus Portfolios, L.L.C., may be deemed to have shared power to vote or direct the vote of (and shared power to dispose or direct the disposition of) the common shares. D. E. Shaw & Co., L.L.C., as the manager of D. E. Shaw Oculus Portfolios, L.L.C., may be deemed to have shared power to vote or direct the vote of (and shared power to dispose or direct the disposition of) the common shares. Julius Gaudio, Maximilian Stone, and Eric Wepsic, or their designees, exercise voting and investment control over the common shares on D. E. Shaw & Co., L.P.’s and D. E. Shaw & Co., L.L.C.’s behalf. D. E. Shaw & Co., Inc., as general partner of D. E. Shaw & Co., L.P., may be deemed to have shared power to vote or direct the vote of (and shared power to dispose or direct the disposition of) the common shares. D. E. Shaw & Co. II, Inc., as managing member of D. E. Shaw & Co., L.L.C., may be deemed to have shared power to vote or direct the vote of (and shared power to dispose or direct the disposition of) the common shares. None of D. E. Shaw & Co., L.P., D. E. Shaw & Co., L.L.C., D. E. Shaw & Co., Inc., or D. E. Shaw & Co. II, Inc. owns any common shares of the Company directly, and each entity disclaims beneficial ownership of the common shares. David E. Shaw does not own any common shares of the Company directly. By virtue of David E. Shaw’s position as President and sole shareholder of D. E. Shaw & Co., Inc., which is the general partner of D. E. Shaw & Co., L.P., and by virtue of David E. Shaw’s position as President and sole shareholder of D. E. Shaw & Co. II, Inc., which is the managing member of D. E. Shaw & Co., L.L.C., David E. Shaw may be deemed to have shared power to vote or direct the vote of (and shared power to dispose or direct the disposition of) the common shares and, therefore, David E. Shaw may be deemed to be the beneficial owner of the common shares. David E. Shaw disclaims beneficial ownership of the common shares. The business address of D. E. Shaw Oculus Portfolios, L.L.C. is 1166 Avenue of the Americas, 9 th Floor, New York, New York 10036. |
| (33) | Anthony Tse is a Director of Li-Cycle. The business address of Anthony Tse is 207 Queen’s Quay West, Suite 590, Toronto, Ontario, M5J 1A7, Canada. |
| (34) | Robert Matthew Niblack, as president of Hite Hedge Asset Managements, LLC, the investment manager of HITE Hedge ET LP, has voting or investment control over the common shares. The business address of HITE Hedge ET LP is c/o Hite Hedge Capital LP, 300 Crown Colony Drive, Suite 108, Quincy, Massachusetts 02169. |
| (35) | Till Bechtolsheimer, Chief Executive Officer of the investment manager of Arosa Alternative Energy Fund LP has voting or investment control over the common shares. The business address of Arosa Alternative Energy Fund LP is 550 West 34 th Street, New York, New York, 10001. |
| (36) | Hudson Bay Capital Management LP, the investment manager of Tech Opportunities LLC, has voting and investment power over the common shares. Sander Gerber is the managing member of Hudson Bay Capital GP LLC, which is the general partner of Hudson Bay Capital Management LP. Each of Tech Opportunities LLC and Sander Gerber disclaims beneficial ownership over the common shares. The business address of Tech Opportunities LLC is 777 3 rd Avenue, 30th Floor, New York, New York 10017. |
| (37) | Mark Wellings is a Director of Li-Cycle and has voting or investment control over the common shares. The business address of ZCR Corp is 2 Highland Avenue, Toronto, Canada, M4W 2A3. |
| (38) | Fred Fromm, the portfolio manager of Franklin Strategic Series — Franklin Natural Resources Fund and vice president of Franklin Advisers, Inc., the investment manager for Franklin Strategic Series — Franklin Natural Resources Fund, has voting or investment control over the common shares. The business address of Franklin Strategic Series — Franklin Natural Resources Fund is One Franklin Parkway, San Mateo, California 94403. |
130
| (39) | Christian Leone, Portfolio Manager of Luxor Capital Group, LP, Investment Manager of Thebes Offshore Master Fund, LP, has voting or investment control over the common shares. The business address of Thebes Offshore Master Fund, LP is c/o Maples Corporate Services Limited, PO Box 309, Ugland House, George Town KY1-1104, Cayman Islands. |
| (40) | Christian Leone, Portfolio Manager of Luxor Capital Group, LP, Investment Manager of Luxor Capital Partners, LP, has voting or investment control over the common shares. The business address of Luxor Capital Partners, LP is 1114 Avenue of the Americas, 29 th Floor, New York, New York 10036. |
| (41) | Kepos Capital LP is the investment manager of Kepos Carbon Transition Master Fund L.P. and Kepos Partners LLC is the General Partner of Kepos Carbon Transition Master Fund L.P. and each may be deemed to have voting and dispositive power with respect to the common shares. The general partner of Kepos Capital LP is Kepos Capital GP LLC and the Managing Member of Kepos Partners LLC is Kepos Partners MM LLC. Mark Carhart controls Kepos Capital GP LLC and Kepos Partners MM LLC and, accordingly, may be deemed to have voting and dispositive power with respect to the common shares held by Kepos Carbon Transition Master Fund L.P. Mr. Carhart disclaims beneficial ownership of the common shares held by Kepos Carbon Transition Master Fund L.P. The business address of Kepos Carbon Transition Master Fund L.P. is 11 Times Square, 35 th Floor, New York, New York 10036. |
| (42) | Andrew Cohen, the General Partner of Difesa Master Fund, LP, exercises voting or investment control over the common shares. The business address of Difesa Master Fund, LP is 40 West 57th Street, Suite 2020, New York. New York 10019. |
| (43) | Christian Leone, Portfolio Manager of Luxor Capital Group, LP, the Investment Manager of Luxor Capital Partners Offshore Master Fund, LP, has voting or investment control over the common shares. The business address of Luxor Capital Partners Offshore Master Fund, LP is c/o Maples Corporate Services Limited, PO Box 309, Ugland House, George Town KY1-1104, Cayman Islands. |
| (44) | Kevin Russell, the Chief Investment Officer of UBS O’Connor LLC, the investment manager of Nineteen77 Global Merger Arbitrage Opportunity Fund, has voting or investment control over the common shares. The business address of Nineteen77 Global Merger Arbitrage Opportunity Fund is c/o UBS O’Connor LLC, UBS Tower, 1 North Wacker Drive, Chicago, Illinois 60606. |
| (45) | Christian Leone, Portfolio Manager of Luxor Capital Group, LP, Investment Manager of Luxor Wavefront, LP, has voting or investment control over the common shares. The business address of Luxor Wavefront, LP is 1114 Avenue of the Americas, 29 th Floor, New York, New York 10036. |
| (46) | Aristeia Capital, L.L.C. and Aristeia Advisors, L.L.C. may be deemed the beneficial owners of the common shares in their capacity as the investment manager, trading manager, and/or general partner, as the case may be, of ASIG International Limited. As investment manager, trading advisor and/or general partner of ASIG International Limited, Aristeia Capital, L.L.C. and Aristeia Advisors, L.L.C. have voting and investment control with respect to the securities held by ASIG International Limited. Anthony M. Frascella and William R. Techar are the co-Chief Investment Officers of Aristeia Capital, L.L.C. and Aristeia Advisors, L.L.C. Each of Aristeia Capital, L.L.C., Aristeia Advisors, L.L.C. and such individuals disclaims beneficial ownership of the common shares except to the extent of its or his direct or indirect economic interest in ASIG International Limited. The business address of ASIG International Limited is c/o Citco Fund Serv (Cayman Islands) Ltd, 89 Nexus Way, 2nd Floor, Camana Bay, Grand Cayman, E9KY1-1205. |
| (47) | Robert Matthew Niblack, as president of Hite Hedge Asset Managements, LLC, the investment manager of HITE Carbon Offset Ltd., has voting or investment control over the common shares. The business address of HITE Carbon Offset Ltd. is c/o Hite Hedge Capital LP, 300 Crown Colony Drive, Suite 108, Quincy, Massachusetts 02169. |
| (48) | Aristeia Capital, L.L.C. and Aristeia Advisors, L.L.C. may be deemed the beneficial owners of the common shares in their capacity as the investment manager, trading manager, and/or general partner, as the case may be, of DS Liquid Div RVA ARST, LLC. As investment manager, trading advisor and/or general partner of DS Liquid Div RVA ARST, LLC, Aristeia Capital, L.L.C. and Aristeia Advisors, L.L.C. have voting and investment control with respect to the securities held by DS Liquid Div RVA ARST, LLC. Anthony M. Frascella and William R. Techar are the co-Chief Investment Officers of Aristeia Capital, L.L.C. and Aristeia Advisors, L.L.C. Each of Aristeia Capital, L.L.C., Aristeia Advisors, L.L.C. and such individuals disclaims beneficial ownership of the common shares except to the extent of its or his direct or indirect |
131
| economic interest in DS Liquid Div RVA ARST, LLC. The business address of DS Liquid Div RVA ARST, LLC is c/o Firm Investment Management (USA) LLC, 452 Fifth Avenue, 26 th Floor, New York, New York 10018. |
| (49) | The business address of Jonathan Silver is c/o Peridot Acquisition Corp., 2229 San Felipe Street, Suite 1450, Houston, Texas 77019. |
| (50) | The business address of June Yearwood is c/o Peridot Acquisition Corp., 2229 San Felipe Street, Suite 1450, Houston, Texas 77019. |
| (51) | Scott Prochazka is a Director of Li-Cycle. The business address of Scott Prochazka is 207 Queen’s Quay West, Suite 590, Toronto, Ontario, M5J 1A7, Canada. |
| (52) | Robert Matthew Niblack, as president of Hite Hedge Asset Managements, LLC, the investment manager of HITE Carbon Offset LP, has voting or investment control over the common shares. The business address of HITE Carbon Offset LP is c/o Hite Hedge Capital LP, 300 Crown Colony Drive, Suite 108, Quincy, Massachusetts 02169. |
| (53) | Aristeia Capital, L.L.C. and Aristeia Advisors, L.L.C. may be deemed the beneficial owners of the common shares in their capacity as the investment manager, trading manager, and/or general partner, as the case may be, of Windermere Ireland Fund PLC. As investment manager, trading advisor and/or general partner of Windermere Ireland Fund PLC, Aristeia Capital, L.L.C. and Aristeia Advisors, L.L.C. have voting and investment control with respect to the securities held by Windermere Ireland Fund PLC. Anthony M. Frascella and William R. Techar are the co-Chief Investment Officers of Aristeia Capital, L.L.C. and Aristeia Advisors, L.L.C. Each of Aristeia Capital, L.L.C., Aristeia Advisors, L.L.C. and such individuals disclaims beneficial ownership of the common shares except to the extent of its or his direct or indirect economic interest in Windermere Ireland Fund PLC. The business address of Windermere Ireland Fund PLC is 70, Sir John Rogersons Quay, Dublin 2, D02 R296, Ireland. |
| (54) | Kevin Russell, the Chief Investment Officer of UBS O’Connor LLC, the investment Manager of IAM Investments ICAV — O’Connor Event Driven UCITS Fund has voting or investment control over the common shares. The business address of IAM Investments ICAV — O’Connor Event Driven UCITS Fund is 32 Molesworth Street, Dublin, IE-D D02Y512, Ireland. |
132
MATERIAL U.S. FEDERAL INCOME TAX CONSIDERATIONS
The following discussion is a general summary based on present law of certain U.S. federal income tax considerations relevant to U.S. Holders (as defined below) of common shares. This discussion is not a complete description of all tax considerations that may be relevant to a U.S. Holder of common shares; it is not a substitute for tax advice. It applies only to U.S. Holders that will hold common shares as capital assets and use the U.S. dollar as their functional currency. In addition, it does not describe all of the U.S. federal income tax considerations that may be relevant to a U.S. Holder in light of a U.S. Holder’s particular circumstances, including U.S. Holders subject to special rules, such as banks or other financial institutions, insurance companies,regulated investment companies, real estate investment trusts, partnerships and other pass-through entities (including
tax-exempt
entities, dealers, traders in securities that elect tomark-to-market,
S-corporations),
U.S. expatriates, persons liable for the alternative minimum tax, persons that directly, indirectly or constructively, own 5% or more of the total combined voting power of the Company’s stock or of the total value of the Company’s equity interests, investors that will hold common shares in connection with a permanent establishment or fixed base outside the United States, or investors that will hold securities as part of a hedge, straddle, conversion, constructive sale or other integrated financial transaction. This summary also does not address U.S. federal taxes other than the income tax (such as estate or gift taxes) or U.S. state and local, ornon-U.S.
tax laws or considerations.As used in this section, “U.S. Holder” means a beneficial owner of common shares that is, for U.S. federal income tax purposes: (i) a citizen or individual resident of the United States, (ii) a corporation, or other entity taxable as a corporation, created or organized in or under the laws of the United States, any state thereof or the District of Columbia, (iii) a trust subject to the control of one or more U.S. persons and the primary supervision of a U.S. court; or (iv) an estate the income of which is subject to U.S. federal income taxation regardless of its source.
The U.S. federal income tax treatment of a partner in a partnership (or other entity or arrangement treated as a partnership for U.S. federal income tax purposes) that holds common shares generally will depend on the status of the partner and the activities of the partnership. Partnerships that hold common shares should consult their own tax advisors regarding the specific U.S. federal income tax consequences to their partners of the partnership’s ownership and disposition of common shares.
U.S. federal income tax consequences of U.S. Holders of common shares
Taxation of dividends and other distributions on our common shares
Subject to the discussion below under “—” the gross amount of any distribution of cash or property (other than certain pro rata distributions of ordinary stock) with respect to common shares will be included in a U.S. Holder’s gross income as ordinary income from foreign sources when actually or constructively received. Dividends will not be eligible for the dividends-received deduction generally available to U.S. corporations. Dividends received from a “qualified foreign corporation” by eligible
Passive Foreign Investment Company rules,
non-corporate
U.S. Holders that satisfy a minimum holding period and certain other requirements generally will be taxed at the preferential rate applicable to qualified dividend income. Anon-U.S.
corporation is treated as a qualified foreign corporation with respect to dividends it pays on shares that are readily tradable on an established securities market in the United States. U.S. Treasury guidance indicates that shares listed on NYSE will be considered readily tradable on an established securities market in the United States. There can be no assurance, however, that common shares will be considered readily tradable on an established securities market in future years.Non-corporate
U.S. holders that do not meet a minimum holding period requirement during which they are not protected from the risk of loss or that elect to treat the dividend income as “investment income” pursuant to Section 163(d)(4) of the Code (dealing with the deduction for investment interest expense) will not be eligible for the reduced rates of taxation regardless of the Company’s status as a qualified foreign corporation. In addition, the rate reduction will not apply to dividends if the recipient of a dividend is obligated to133
make related payments with respect to the positions in substantially similar or related property. This disallowance applies even if the minimum holding period has been met. The Company will not constitute a qualified foreign corporation for purposes of these rules if it is a passive foreign investment company for the taxable year in which it pays a dividend or for the preceding taxable year. See “—.”
Passive Foreign Investment Company Rules
Dividends paid in a currency other than U.S. dollars will be included in income in a U.S. dollar amount based on the exchange rate in effect on the date of receipt, whether or not the currency is converted into U.S. dollars at that time. A U.S. Holder’s tax basis in the
non-U.S.
currency will equal the U.S. dollar amount included in income. Any gain or loss realized on a subsequent conversion or other disposition of thenon-U.S.
currency for a different U.S. dollar amount generally will be U.S. source ordinary income or loss. If dividends paid in a currency other than U.S. dollars are converted into U.S. dollars on the day they are received, the U.S. Holder generally will not be required to recognize foreign currency gain or loss in respect of the dividend income.Subject to certain conditions and limitations, withholding taxes, if any, on dividends paid by the Company may be treated as foreign taxes eligible for credit against a U.S. Holder’s U.S. federal income tax liability under the U.S. foreign tax credit rules. For purposes of calculating the U.S. foreign tax credit, dividends paid on the — common shares will generally be treated as income from sources outside the United States and will generally constitute passive category income. The rules governing the U.S. foreign tax credit are complex. U.S. Holders should consult their tax advisors regarding the availability of the U.S. foreign tax credit under their particular circumstances.
Dividends received by certain
non-corporate
U.S. Holders generally will be includible in “net investment income” for purposes of the Medicare contribution tax.Taxation of dispositions of common shares
Subject to the discussion below under “—,” a U.S. Holder generally will recognize capital gain or loss on the sale or other disposition of common shares in an amount equal to the difference between the U.S. dollar value of the amount realized and the U.S. Holder’s adjusted tax basis in the disposed common shares. Any gain or loss generally will be treated as arising from U.S. sources and will be long-term capital gain or loss if the U.S. Holder’s holding period exceeds one year. Deductions for capital loss are subject to significant limitations.
Passive Foreign Investment Company rules
It is possible that Canada may impose an income tax upon sale of common shares. Because gains generally will be treated as U.S. source gain, as a result of the U.S. foreign tax credit limitation, any Canadian income tax imposed upon capital gains in respect of common shares may not be currently creditable unless a U.S. Holder has other foreign source income for the year in the appropriate U.S. foreign tax credit limitation basket. U.S. Holders should consult their tax advisors regarding the application of Canadian taxes to a disposition of common shares and their ability to credit a Canadian tax against their U.S. federal income tax liability.
Capital gains from the sale or other disposition of common shares received by certain
non-corporate
U.S. Holders generally will be includible in “net investment income” for purposes of the Medicare contribution tax.Passive Foreign Investment Company rules
Based on the composition of the Company’s current gross assets and income and the manner in which the Company expects to operate its business in future years, the Company believes that it should not be classified as a passive foreign investment company (a “PFIC”) for U.S. federal income tax purposes for its current taxable year and does not expect to be so classified in the foreseeable future. In general, a
non-U.S.
corporation will be a PFIC for any taxable year in which, taking into account a pro rata portion of the income and assets of 25% or more owned subsidiaries, either (i) 75% or more of its gross income is passive income, or (ii) 50% or more of the134
average quarterly value of its assets are assets that produce, or are held for the production of, passive income or which do not produce income. For this purpose, passive income generally includes, among other things and subject to various exceptions, interest, dividends, rents, royalties and gains from the disposition of assets that produce passive income. Whether the Company is a PFIC is a factual determination made annually, and the Company’s status could change depending among other things upon changes in the composition and relative value of its gross receipts and assets. Because the market value of the Company’s assets (including for this purpose goodwill) may be measured in large part by the market price of the common shares, which is likely to fluctuate, no assurance can be given that the Company will not be a PFIC in the current year or in any future taxable year.
If the Company were a PFIC for any taxable year in which a U.S. Holder holds common shares, such U.S. Holder would be subject to additional taxes on any excess distributions and any gain realized from the sale or other taxable disposition of common shares (including certain pledges) regardless of whether the Company continues to be a PFIC. A U.S. Holder will have an excess distribution to the extent that distributions on common shares during a taxable year exceed 125% of the average amount received during the three preceding taxable years (or, if shorter, the US Holder’s holding period). To compute the tax on excess distributions or any gain, (i) the excess distribution or gain is allocated ratably over the U.S. Holder’s holding period, (ii) the amount allocated to the current taxable year and any year before the Company became a PFIC is taxed as ordinary income in the current year and (iii) the amount allocated to other taxable years is taxed at the highest applicable marginal rate in effect for each year and an interest charge is imposed to recover the deemed benefit from the deferred payment of the tax attributable to each year.
If, as is not expected to be the case, the Company were a PFIC for any taxable year in which a U.S. Holder holds common shares, a U.S. Holder may be able to avoid some of the adverse impacts of the PFIC rules described above by electing to mark common shares to market annually. The election is available only if the common shares are considered “marketable stock,” which generally includes stock that is regularly traded in more than de minimis quantities on a qualifying exchange (which includes NYSE). If a U.S. Holder makes theelection, any gain from marking common shares to market or from disposing of them would be ordinary income. Any loss from marking common shares to market would be recognized only to the extent of unreversed gains previously included in income. Loss from marking common shares to market would be ordinary, but loss on disposing of them would be capital loss except to the extent ofgains previously included in income. No assurance can be given that the common shares will be traded in sufficient frequency and quantity to be considered “marketable stock.” A validelection cannot be revoked without the consent of the IRS unless the common shares cease to be marketable stock.
mark-to-market
mark-to-market
mark-to-market
As an alternative, if the Company were to be treated as a PFIC, a U.S. Holder may avoid the excess distribution rules described above in respect of common shares by electing to treat the Company (for the first taxable year in which the U.S. Holder owns any common shares) and any lower-tier PFIC (for the first taxable year in which the U.S. Holder is treated as owning an equity interest in such lower-tier PFIC) as a “qualified electing fund” (a “QEF”). If a U.S. Holder makes an effective QEF election with respect to the Company (and any lower-tier PFIC), the U.S. Holder will be required to include in gross income each year, whether or not the Company makes distributions, as capital gains, its pro rata share of the Company’s (and such lower-tier PFIC’s) net capital gains and, as ordinary income, its pro rata share of the Company’s (and such lower-tier PFIC’s) net earnings in excess of its net capital gains. U.S. Holders can make a QEF election only if the Company (and each lower-tier PFIC) provides certain information, including the amount of its ordinary earnings and net capital gains determined under U.S. tax principles. The Company has not determined whether it will provide U.S. Holders with this information if it determines that it is a PFIC.
U.S. Holders of common shares should consult their own tax advisors concerning the Company’s possible PFIC status and the consequences to them if the Company were classified as a PFIC for any taxable year.
135
Information Reporting and Backup Withholding
Dividends on common shares and proceeds from the sale or other disposition of common shares may be reported to the IRS unless the holder is a corporation or otherwise establishes a basis for exemption. Backup withholding tax may apply to amounts subject to reporting. Any amount withheld may be credited against the holder’s U.S. federal income tax liability subject to certain rules and limitations. U.S. Holders should consult with their own tax advisers regarding the application of the U.S. information reporting and backup withholding rules.
Certain
non-corporate
U.S. Holders are required to report information with respect to common shares not held through an account with a domestic financial institution to the IRS. U.S. Holders that fail to report required information could become subject to substantial penalties. Prospective investors are encouraged to consult with their own tax advisors about these and any other reporting obligations arising from their investment in common shares.THE DISCUSSION ABOVE IS A GENERAL SUMMARY. IT DOES NOT COVER ALL TAX MATTERS THAT MAY BE OF IMPORTANCE TO A PARTICULAR U.S. HOLDER. EACH U.S. HOLDER OF COMMON SHARES IS URGED TO CONSULT ITS OWN TAX ADVISOR ABOUT THE TAX CONSEQUENCES TO IT OF OWNING AND DISPOSING OF COMMON SHARES IN LIGHT OF THE U.S. HOLDER’S OWN CIRCUMSTANCES.
136
CERTAIN CANADIAN FEDERAL INCOME TAX CONSIDERATIONS
The following summary describes the principal Canadian federal income tax considerations under the(Canada) and the regulations thereunder (collectively, the “”), as of the date hereof, that are generally applicable to an investor who acquires as beneficial owner common shares from the selling shareholders pursuant to this prospectus and who, at all relevant times, for the purposes of the Tax Act and any applicable tax treaty or convention: (i) deals at arm’s length with the Company, the selling shareholders and each of the underwriters, and is not affiliated with the Company, the selling shareholders or any of the underwriters; (ii) is not and is not deemed to be resident in Canada; (iii) holds the common shares as capital property; and (iv) does not use or hold, and is not deemed to use or hold, the common shares in connection with, or in the course of carrying on, a business in Canada (a “”).
Income Tax Act
Tax Act
Non-Canadian
HolderSpecial rules, which are not discussed in this summary, may apply to a
Non-Canadian
Holder that is an insurer carrying on business in Canada and elsewhere. SuchNon-Canadian
Holders should consult their own tax advisors.This summary is based upon the current provisions of the Tax Act in force as of the date hereof and an understanding of the current administrative policies published in writing by the Canada Revenue Agency (“”) prior to the date hereof. This summary also takes into account all specific proposals to amend the Tax Act publicly announced by or on behalf of the Minister of Finance (Canada) prior to the date hereof (the “”), and assumes that all Proposed Amendments will be enacted in the form proposed. However, no assurances can be given that the Proposed Amendments will be enacted as proposed, or at all. Except for the Proposed Amendments, this summary does not take into account or anticipate any changes in law or administrative policies, whether by legislative, regulatory, administrative or judicial action or decision, nor does it take into account other federal or any provincial, territorial or foreign tax legislation or considerations, which may be different from those discussed in this summary.
CRA
Proposed Amendments
This summary is of a general nature only, is not exhaustive of all possible Canadian federal income tax considerations and is not intended to be, nor should it be construed to be, legal or tax advice to any particular
Non-Canadian
Holder. Accordingly,Non-Canadian
Holders should consult their own tax advisors with respect to their particular circumstances.Currency
For the purposes of the Tax Act, all amounts expressed in a currency other than Canadian dollars relating to the acquisition, holding or disposition of a common share, including dividends, adjusted cost base and proceeds of disposition, must be determined in Canadian dollars using the relevant rate of exchange required under the Tax Act.
Dividends
Dividends paid or credited, or deemed to be paid or credited, on common shares to a
Non-Canadian
Holder generally will be subject to Canadian withholding tax. Under the Tax Act, the rate of withholding tax is 25% of the gross amount of such dividends, which rate may be subject to reduction under the provisions of an applicable income tax treaty or convention. ANon-Canadian
Holder who is resident in the United States for the purposes of the Canada-United States Tax Convention, fully entitled to the benefits of such convention and the beneficial owner of the dividends, will generally be subject to Canadian withholding tax at a rate of 15% of the amount of such dividends.Disposition of common shares
A
Non-Canadian
Holder who disposes or is deemed to dispose of a common share in a taxation year will not be subject to tax in Canada, unless the common share is, or is deemed to be, ‘‘taxable Canadian property’’ to the137
Non-Canadian
Holder at the time of disposition and theNon-Canadian
Holder is not entitled to relief under an applicable income tax treaty or convention between Canada and the country in which theNon-Canadian
Holder is resident.Provided the common shares are listed on a “designated stock exchange”, as defined in the Tax Act (which currently includes the NYSE), at the time of disposition, the common shares generally will not constitute taxable Canadian property of a
Non-Canadian
Holder at that time, unless at any time during the 60 month period immediately preceding the disposition the following two conditions are met concurrently: (i) one or any combination of (a) theNon-Canadian
Holder, (b) persons with whom theNon-Canadian
Holder did not deal at arm’s length, and (c) partnerships in which theNon-Canadian
Holder or a person described in (b) holds a membership interest directly or indirectly through one or more partnerships owned 25% or more of the issued shares of any class or series of shares of the Company; and (ii) more than 50% of the fair market value of the common shares was derived directly or indirectly from one or any combination of (a) real or immovable property situated in Canada, (b) “Canadian resource property” (as defined in the Tax Act), (c) “timber resource property” (as defined in the Tax Act), or (d) an option in respect of, an interest in, or for civil law rights in, property described in any of (a) through (c), whether or not such property exists.Notwithstanding the foregoing, a common share may otherwise be deemed to be taxable Canadian property to a
Non-Canadian
Holder for purposes of the Tax Act in certain limited circumstances.Non-Canadian
Holders who dispose of common shares that are taxable Canadian property should consult their own tax advisors with respect to the requirement to file a Canadian income tax return in respect of the disposition in their particular circumstances.138
PLAN OF DISTRIBUTION
We are registering the resale of up to an aggregate of 84,351,553 of our common shares by the selling shareholders We are not selling any of our common shares under this prospectus.
We will not receive any of the proceeds from the sale of any securities by the selling shareholders. The aggregate proceeds to the selling shareholders will be the purchase price of the securities less any discounts and commissions borne by the selling shareholders.
The selling shareholders will pay any underwriting discounts and commissions and expenses incurred by the selling shareholders for brokerage, accounting, tax or legal services or any other expenses incurred by the selling shareholders in disposing of the securities. We will bear all other costs, fees and expenses incurred in effecting the registration of the common shares covered by this prospectus, including, without limitation, all registration and filing fees, NYSE listing fees and fees and expenses of our counsel and our independent registered public accountants.
The securities beneficially owned by the selling shareholders covered by this prospectus may be offered and sold from time to time by the selling shareholders. The term “selling shareholders” includes donees, pledgees, transferees or other successors in interest selling securities received after the date of this prospectus from a selling shareholder as a gift, pledge, partnership distribution or other transfer. The selling shareholders will act independently of us in making decisions with respect to the timing, manner and size of each sale. Such sales may be made on one or more exchanges or in themarket or otherwise, at prices and under terms then prevailing or at prices related to the then current market price or in negotiated transactions. Each selling shareholder reserves the right to accept and, together with its respective agents, to reject, any proposed purchase of securities to be made directly or through one or more underwriters, broker-dealers or agents. The selling shareholders and any of their permitted transferees may sell their securities offered by this prospectus on any stock exchange, market or trading facility on which the securities are traded or in private transactions. If underwriters are used in the sale, such underwriters will acquire the shares for their own account. These sales may be at a fixed price or varying prices, which may be changed, or at market prices prevailing at the time of sale, at prices relating to prevailing market prices or at negotiated prices. The securities may be offered to the public through underwriting syndicates represented by managing underwriters or by underwriters without a syndicate. The obligations of the underwriters to purchase the securities will be subject to certain conditions. The underwriters will be obligated to purchase all the securities offered if any of the securities are purchased.
over-the-counter
Subject to the limitations set forth in any applicable registration rights agreement, the selling shareholders may use any one or more of the following methods when selling the securities offered by this prospectus:
| • | purchases by a broker-dealer as principal and resale by such broker-dealer for its own account pursuant to this prospectus; |
| • | ordinary brokerage transactions and transactions in which the broker solicits purchasers; |
| • | block trades in which the broker-dealer so engaged will attempt to sell the securities as agent but may position and resell a portion of the block as principal to facilitate the transaction; |
| • | an over-the-counter |
| • | through trading plans entered into by a selling shareholder pursuant to Rule 10b5-1 under the Exchange Act that are in place at the time of an offering pursuant to this prospectus and any applicable prospectus supplement hereto that provide for periodic sales of their securities on the basis of parameters described in such trading plans; |
| • | to or through underwriters or broker-dealers; |
| • | settlement of short sales entered into after the date of this prospectus; |
139
| • | agreements with broker-dealers to sell a specified number of the securities at a stipulated price per share or warrant; |
| • | in “at the market” offerings, as defined in Rule 415 under the Securities Act, at negotiated prices, |
| • | at prices prevailing at the time of sale or at prices related to such prevailing market prices, including sales made directly on a national securities exchange or sales made through a market maker other than on an exchange or other similar offerings through sales agents; |
| • | directly to purchasers, including through a specific bidding, auction or other process or in privately negotiated transactions; |
| • | through the writing or settlement of options or other hedging transactions, whether through an options exchange or otherwise; |
| • | through loans or pledges of the securities, including to a broker-dealer or an affiliate thereof; |
| • | by entering into transactions with third parties who may (or may cause others to) issue securities convertible or exchangeable into, or the return of which is derived in whole or in part from the value of, our securities; |
| • | through a combination of any of the above methods of sale; or |
| • | any other method permitted pursuant to applicable law. |
In addition, a selling shareholder that is an entity may elect to make a pro rata
in-kind
distribution of securities to its members, partners or shareholders pursuant to the registration statement of which this prospectus is a part by delivering a prospectus with a plan of distribution. Such members, partners or shareholders would thereby receive freely tradeable securities pursuant to the distribution through a registration statement. To the extent a distributee is an affiliate of ours (or to the extent otherwise required by law), we may file a prospectus supplement in order to permit the distributees to use the prospectus to resell the securities acquired in the distribution.There can be no assurance that the selling shareholders will sell all or any of the securities offered by this prospectus. In addition, the selling shareholders may also sell securities under Rule 144 under the Securities Act, if available, or in other transactions exempt from registration, rather than under this prospectus. The selling shareholders have the sole and absolute discretion not to accept any purchase offer or make any sale of securities if they deem the purchase price to be unsatisfactory at any particular time.
The selling shareholders also may transfer the securities in other circumstances, in which case the transferees, pledgees or otherwill be the selling beneficial owners for purposes of this prospectus. Upon being notified by a selling shareholder that a donee, pledgee, transferee, or otherintends to sell our securities, we will, to the extent required, promptly file a supplement to this prospectus to name specifically such person as a selling shareholder.
successors-in-interest
successor-in-interest
With respect to a particular offering of the securities held by the selling shareholders, to the extent required, an accompanying prospectus supplement or, if appropriate, a post-effective amendment to the registration statement of which this prospectus is part, will be prepared and will set forth the following information:
| • | the specific securities to be offered and sold; |
| • | the names of the selling shareholders; |
| • | the respective purchase prices and public offering prices, the proceeds to be received from the sale, if any, and other material terms of the offering; |
| • | settlement of short sales entered into after the date of this prospectus; |
| • | the names of any participating agents, broker-dealers or underwriters; and |
140
| • | any applicable commissions, discounts, concessions and other items constituting compensation from the selling shareholders. |
In connection with distributions of the securities or otherwise, the selling shareholders may enter into hedging transactions with broker-dealers or other financial institutions. In connection with such transactions, broker-dealers or other financial institutions may engage in short sales of the securities in the course of hedging the positions they assume with selling shareholders. The selling shareholders may also sell the securities short and redeliver the securities to close out such short positions. The selling shareholders may also enter into option or other transactions with broker-dealers or other financial institutions which require the delivery to such broker-dealer or other financial institution of securities offered by this prospectus, which securities such broker-dealer or other financial institution may resell pursuant to this prospectus (as supplemented or amended to reflect such transaction). The selling shareholders may also pledge securities to a broker-dealer or other financial institution, and, upon a default, such broker-dealer or other financial institution, may effect sales of the pledged securities pursuant to this prospectus (as supplemented or amended to reflect such transaction).
In order to facilitate the offering of the securities, any underwriters or agents, as the case may be, involved in the offering of such securities may engage in transactions that stabilize, maintain or otherwise affect the price of our securities. Specifically, the underwriters or agents, as the case may be, may overallot in connection with the offering, creating a short position in our securities for their own account. In addition, to cover overallotments or to stabilize the price of our securities, the underwriters or agents, as the case may be, may bid for, and purchase, such securities in the open market. Finally, in any offering of securities through a syndicate of underwriters, the underwriting syndicate may reclaim selling concessions allotted to an underwriter or a broker-dealer for distributing such securities in the offering if the syndicate repurchases previously distributed securities in transactions to cover syndicate short positions, in stabilization transactions or otherwise. Any of these activities may stabilize or maintain the market price of the securities above independent market levels. The underwriters or agents, as the case may be, are not required to engage in these activities, and may end any of these activities at any time.
The selling shareholders may solicit offers to purchase the securities directly from, and they may sell such securities directly to, institutional investors or others. In this case, no underwriters or agents would be involved. The terms of any of those sales, including the terms of any bidding or auction process, if utilized, will be described in the applicable prospectus supplement.
It is possible that one or more underwriters may make a market in our securities, but such underwriters will not be obligated to do so and may discontinue any market making at any time without notice. We cannot give any assurance as to the liquidity of the trading market for our securities. Our common shares are listed on NYSE under the symbol “LICY”.
The selling shareholders may authorize underwriters, broker-dealers or agents to solicit offers by certain purchasers to purchase the securities at the public offering price set forth in the prospectus supplement pursuant to delayed delivery contracts providing for payment and delivery on a specified date in the future. The contracts will be subject only to those conditions set forth in the prospectus supplement, and the prospectus supplement will set forth any commissions we or the selling shareholders pay for solicitation of these contracts.
A selling shareholder may enter into derivative transactions with third parties, or sell securities not covered by this prospectus to third parties in privately negotiated transactions. If the applicable prospectus supplement indicates, in connection with those derivatives, the third parties may sell securities covered by this prospectus and the applicable prospectus supplement, including in short sale transactions. If so, the third party may use securities pledged by any selling shareholder or borrowed from any selling shareholder or others to settle those sales or to close out any related open borrowings of stock, and may use securities received from any selling shareholder in settlement of those derivatives to close out any related open borrowings of stock. The third party in such sale transactions will be an underwriter and will be identified in the applicable prospectus supplement (or a post-
141
effective amendment). In addition, any selling shareholder may otherwise loan or pledge securities to a financial institution or other third party that in turn may sell the securities short using this prospectus. Such financial institution or other third party may transfer its economic short position to investors in our securities or in connection with a concurrent offering of other securities.
In effecting sales, broker-dealers or agents engaged by the selling shareholders may arrange for other broker-dealers to participate. Broker-dealers or agents may receive commissions, discounts or concessions from the selling shareholders in amounts to be negotiated immediately prior to the sale.
In compliance with the guidelines of the Financial Industry Regulatory Authority (“FINRA”), the aggregate maximum discount, commission, fees or other items constituting underwriting compensation to be received by any FINRA member or independent broker-dealer will not exceed 8% of the gross proceeds of any offering pursuant to this prospectus and any applicable prospectus supplement.
If at the time of any offering made under this prospectus a member of FINRA participating in the offering has a “conflict of interest” as defined in FINRA Rule 5121, that offering will be conducted in accordance with the relevant provisions of Rule 5121.
To our knowledge, there are currently no plans, arrangements or understandings between the selling shareholders and any broker-dealer or agent regarding the sale of the securities by the selling shareholders. Upon our notification by a selling shareholder that any material arrangement has been entered into with an underwriter or broker-dealer for the sale of securities through a block trade, special offering, exchange distribution, secondary distribution or a purchase by an underwriter or broker-dealer, we will file, if required by applicable law or regulation, a supplement to this prospectus pursuant to Rule 424(b) under the Securities Act disclosing certain material information relating to such underwriter or broker-dealer and such offering.
Underwriters, broker-dealers or agents may facilitate the marketing of an offering online directly or through one of their affiliates. In those cases, prospective investors may view offering terms and a prospectus online and, depending upon the particular underwriter, broker-dealer or agent, place orders online or through their financial advisors.
In offering the securities covered by this prospectus, the selling shareholders and any underwriters, broker-dealers or agents who execute sales for the selling shareholders may be deemed to be “underwriters” within the meaning of the Securities Act in connection with such sales. Any discounts, commissions, concessions or profit they earn on any resale of those securities may be underwriting discounts and commissions under the Securities Act.
The underwriters, broker-dealers and agents may engage in transactions with us or the selling shareholders, may have banking, lending or other relationships with us or the selling shareholders or may perform services for us or the selling shareholders, in the ordinary course of business.
In order to comply with the securities laws of certain states, if applicable, the securities must be sold in such jurisdictions only through registered or licensed brokers or dealers. In addition, in certain states the securities may not be sold unless they have been registered or qualified for sale in the applicable state or an exemption from the registration or qualification requirement is available and is complied with.
We have advised the selling shareholders that the anti-manipulation rules of Regulation M under the Exchange Act may apply to sales of securities in the market and to the activities of the selling shareholders and their affiliates. In addition, we will make copies of this prospectus available to the selling shareholders for the purpose of satisfying the prospectus delivery requirements of the Securities Act. The selling shareholders may indemnify any broker-dealer that participates in transactions involving the sale of the securities against certain liabilities, including liabilities arising under the Securities Act.
142
We have agreed to indemnify the selling shareholders against certain liabilities, including certain liabilities under the Securities Act, the Exchange Act or other federal or state law. Agents, broker-dealers and underwriters may be entitled to indemnification by us and the selling shareholders against certain civil liabilities, including liabilities under the Securities Act, or to contribution with respect to payments which the agents, broker-dealers or underwriters may be required to make in respect thereof.
143
SHARES ELIGIBLE FOR FUTURE SALE
The Company has an unlimited number of common shares authorized and 175,383,580 common shares issued and outstanding as of July 22, 2022. The registration statement of which this prospectus forms a part has been filed to satisfy our obligations to register the offer and sale of our common shares pursuant to the Investor Agreement and the Subscription Agreements entered into with certain of our shareholders. We cannot make any prediction as to the effect, if any, that sales of our common shares or the availability of our common shares for sale will have on the market price of our common shares. Sales of substantial amounts of our common shares in the public market could adversely affect prevailing market prices of the common shares.
Rule 144
Pursuant to Rule 144, a person who has beneficially owned restricted shares of the Company’s common shares for at least six months would be entitled to sell his, her or its securities provided that (i) such person is not deemed to have been one of our affiliates at the time of, or at any time during the three months preceding, a sale and (ii) we are subject to the Exchange Act periodic reporting requirements for at least three months before the sale and have filed all required reports under Section 13 or 15(d) of the Exchange Act during the 12 months (or such shorter period as we were required to file reports) preceding the sale. However, Rule 144 is not available for the resale of securities initially issued by shell companies (other than business combination related shell companies) or issuers that have been at any time previously a shell company. Rule 144 does include an important exception to this prohibition if the following conditions are met:
| • | the issuer of the securities that was formerly a shell company has ceased to be a shell company; |
| • | the issuer of the securities is subject to the reporting requirements of Section 13 or 15(d) of the Exchange Act; |
| • | the issuer of the securities has filed all Exchange Act reports and material required to be filed, as applicable, during the preceding 12 months (or such shorter period that the issuer was required to file such reports and materials), other than Form 8-K reports; and |
| • | at least one year has elapsed from the time that the issuer filed current Form 10 type information with the SEC reflecting its status as an entity that is not a shell company. |
As a result, the initial holders and purchasers of Peridot’s securities will be able to sell their common shares pursuant to and in accordance with Rule 144 without registration one year after the Business Combination. However, if they remain one of our affiliates, they will only be permitted to sell a number of common shares that does not exceed the greater of:
| • | 1% of the total number of common shares then outstanding, which was 1,753,836 common shares as of July 22, 2022; or |
| • | the average weekly reported trading volume of the common shares during the four calendar weeks preceding the filing of a notice on Form 144 with respect to the sale. |
Sales by our affiliates under Rule 144 would also limited be limited by manner of sale provisions and notice requirements and to the availability of current public information about us.
Regulation S
Regulation S under the Securities Act provides an exemption from registration requirements in the United States for offers and sales of securities that occur outside the United States. Rule 903 of Regulation S provides the conditions to the exemption for a sale by an issuer, a distributor, their respective affiliates or anyone acting on their behalf, while Rule 904 of Regulation S provides the conditions to the exemption for a resale by persons other than those covered by Rule 903. In each case, any sale must be completed in an offshore transaction, as that term is defined in Regulation S, and no directed selling efforts, as that term is defined in Regulation S, may be made in the United States.
144
We are a foreign issuer as defined in Regulation S. As a foreign issuer, securities that we sell outside the United States pursuant to Regulation S are not considered to be restricted securities under the Securities Act, and, subject to the offering restrictions imposed by Rule 903, are freely tradable without registration or restrictions under the Securities Act, unless the securities are held by our affiliates. Generally, subject to certain limitations, holders of our restricted shares who are not affiliates of our company or who are affiliates of our company by virtue of their status as an officer or director may, under Regulation S, resell their restricted shares in an “offshore transaction” if none of the seller, its affiliate nor any person acting on their behalf engages in directed selling efforts in the United States and, in the case of a sale of our restricted shares by an officer or director who is an affiliate of ours solely by virtue of holding such position, no selling commission, fee or other remuneration is paid in connection with the offer or sale other than the usual and customary broker’s commission that would be received by a person executing such transaction as agent. Additional restrictions are applicable to a holder of our restricted shares who will be an affiliate of our Company other than by virtue of his or her status as an officer or director of our Company.
Registration Rights
Investor Agreement
On August 10, 2021, the Company, the Peridot Class B Holders and the
Li-Cycle
Holders (collectively for the purposes of this subsection referred to as the “Holders”) entered into the Investor Agreement. Pursuant to the Investor Agreement, the Company is obligated to file a registration statement to register the resale of certain common shares held by the Holders within 30 days after the Closing and to use commercially reasonable efforts to cause such registration statement to be declared effective as soon as practicable after such filing, but no later than the earlier of (i) the 75th day (or the 105th day if the SEC notifies that it will “review” such registration statement) following the Closing Date and (ii) the 15th business day after the date the SEC notified that such registration statement will not be “reviewed” or will not be subject to further review. In addition, pursuant to the terms of the Investor Agreement and subject to certain requirements and customary conditions, including with regard to the number of demand rights that may be exercised, the Holders may demand at any time or from time to time, that the Company file a registration statement on FormF-3
(or on FormF-1
if FormF-3
is not available) to register the securities of the Company held by such Holders, and each may specify that such demand registration take the form of an underwritten offering, in each case subject to limitations on the number of demands and underwritten offerings that can be requested by each Holder, as specified in the Investor Agreement. Holders will also have “piggy-back” registration rights, subject to certain requirements and customary conditions. The Investor Agreement also provides that the Company will pay certain expenses relating to such registrations and indemnify the Holders against (or make contributions in respect of) certain liabilities that may arise under the Securities Act.The Investor Agreement further provides that the securities of the Company held by the Peridot Class B Holders and
Li-Cycle
Holders will be subject to certain transfer restrictions until (i) with respect to the Peridot Class B Holders, the earliest of (a) one year after the Closing and (b) (x) the last consecutive trading day where the last reported sale price of our common shares equals or exceeds $12.00 per share (as adjusted for share subdivisions, share capitalizations, reorganizations, recapitalizations and the like) for any 20 trading days within any30-trading
day period commencing at least 150 days after the Closing, or (y) the date on which the Company completes a liquidation, merger, share exchange or other similar transaction that results in all of its public shareholders having the right to exchange their common shares for cash, securities or other property, and (ii) with respect to theLi-Cycle
Holders, 180 days following the Closing.Subscription Agreements
Contemporaneously with the execution of the Business Combination Agreement, Subscription Agreements were entered into by and among each PIPE Investor, Peridot, and NewCo. Peridot obtained commitments from the PIPE Investors to purchase common shares for a purchase price of $10.00 per share for aggregate gross
145
proceeds of $315,490,000. The purpose of the sale of common shares to the PIPE Investors under the Subscription Agreements was to raise additional capital for use in connection with the Business Combination.
The common shares sold to the PIPE Investors were identical to the common shares that were held by our other shareholders at the time of the Closing, except that when initially issued by Peridot, such shares were restricted securities. The PIPE Financing occurred on the date of, and immediately prior to, the consummation of the Business Combination.
The closing of the PIPE Financing was subject to customary conditions, including, among other conditions, the Company agreed to, as soon as practicable (but in any case no later than 30 calendar days after the consummation of the Business Combination), file with the SEC (at its sole cost and expense) a registration statement registering the resale of the shares received by the PIPE Investors in the PIPE Financing, and to use its commercially reasonable efforts to have such resale registration statement declared effective as soon as practicable after the filing thereof.
KSP Note Purchase Agreement
On September 29, 2021, in connection with the Company’s entry into the KSP Note Purchase Agreement and issuance of the KSP Note, the Company granted certain registration rights under the KSP Note Purchase Agreement. Pursuant to the KSP Note Purchase Agreement, the Company agreed to file with the SEC within 30 days a registration statement covering the resale of the common shares issued or issuable upon conversion of the 2021 Convertible Notes. The Company is required to use commercially reasonable efforts to have such registration statement declared effective by the SEC as soon as practicable and no later than the earlier of (A) 60 days after the issuance of the KSP Note (or 90 days after the issuance of the KSP Note if the SEC notifies the Company that it will review the registration statement) or (B) 10 business days after the SEC notifies the Company in writing that it will not review the registration statement. The Company agreed to keep the registration statement (or another shelf registration statement covering the common shares issued or issuable upon conversion of the 2021 Convertible Notes) effective until the earlier of (x) the third anniversary of the issuance of the KSP Note or (y) the date on which the holder of the 2021 Convertible Notes ceases to hold any common shares issued or upon conversion of the 2021 Convertible Notes.
LG Subscription Agreements
On December 13, 2021, the Company entered into the LG Subscription Agreements with each of LGES and LGC, each of which were subsequently amended and restated on March 11, 2022 and April 21, 2022, pursuant to which each of LGES and LGC agreed, subject to the satisfaction of certain conditions, to subscribe for an equal number of the Company’s common shares in transactions exempt from registration under the Securities Act (the “LG Subscription”). The LG Subscription was completed on May 11, 2022 and consisted of the issuance by the Company in accordance with the Subscription Agreements of (i) an initial tranche of 4,416,960 common shares, in the aggregate, at a price of $10.00 per share, for an aggregate initial tranche subscription price of approximately $44.2 million, and (ii) a second tranche of 883,392 common shares, in the aggregate, at a price of $6.60 per share (based on the volume-weighted average trading price of the Company’s common shares for the 5 trading days ending immediately prior to April 29, 2022), for an aggregate second tranche subscription price of approximately $5.8 million, for a total investment of $50.0 million.
The Company has granted certain registration rights to LGES and LGC under the LG Subscription Agreements. The Company agreed to file with the SEC within 30 days of the closing of the LG Subscription a registration statement covering the resale of the common shares issued pursuant to the LG Subscription Agreements. The Company is required to use commercially reasonable efforts to have such registration statement declared effective by the SEC as soon as practicable and no later than the earlier of (A) 60 days after the closing of the LG Subscription (or 90 days after the closing of the LG Subscription if the SEC notifies the Company that it will review the registration statement) or (B) 10 business days after the SEC notifies the Company in writing
146
that it will not review the registration statement. LGES and LGC have agreed to an extension for the filing of the registration statement. The Company agreed to keep the registration statement (or another shelf registration statement covering the common shares issued pursuant to the LG Subscription Agreements) effective until the earlier of (x) the third anniversary of the closing of the LG Subscription or (y) the date on which LGES or LGC, as applicable, ceases to hold any of the common shares acquired pursuant to the LG Subscription Agreements.
The common shares issued pursuant to the LG Subscription Agreements are subject to certain transfer restrictions, including that such common shares cannot be transferred other than to permitted transferees until 180 days after closing of the LG Subscription.
Glencore Registration Rights Agreement
Concurrently with the issuance of the Glencore Convertible Note, the Company entered into a registration rights agreement with Glencore (the “Glencore Registration Rights Agreement”). The Glencore Registration Rights Agreement provides that upon request of the holder of the Glencore Convertible Note, the Company will file with the SEC within 45 days after notice of such request, a resale registration statement covering the resale of the common shares issuable upon conversion of the Glencore Convertible Note and upon exercise of the Glencore Warrants and held by such holder. The Company is required to use commercially reasonable efforts to have such registration statement declared effective by the SEC as soon as practicable and no later than the earlier of (A) 45 days after the filing of such registration statement (or 75 days after the filing of such registration statement if the SEC notifies the Company that it will review the registration statement) or (B) 15 business days after the SEC notifies the Company in writing that it will not review the registration statement. The Company agreed to keep the registration statement (or another shelf registration statement covering the common shares issued or issuable upon conversion of the Glencore Convertible Note and upon exercise of the Glencore Warrants) effective until three years after the holder’s receipt of the common shares issued upon conversion of the Glencore Convertible Note or upon exercise of the Glencore Warrants, as applicable.
In addition, subject to certain requirements and customary conditions, including with regard to the number of demand rights that may be exercised, the holder of the Glencore Convertible Note may demand at any time or from time to time, that the Company file a registration statement on Form
F-3
(or on FormF-1
if FormF-3
is not available) to register the common shares issuable upon conversion of the Glencore Convertible Note and upon exercise of the Glencore Warrants and held by such holder. In addition, the holder of the Glencore Convertible Note may specify that such demand registration take the form of an underwritten offering, subject to limitations on the number of demands and underwritten offerings that can be requested by the holder, as specified in the Glencore Registration Rights Agreement. The holder of the Glencore Convertible Note will also have “piggy-back” registration rights, subject to certain requirements and customary conditions.The Glencore Registration Rights Agreement also provides that the Company will pay certain expenses relating to such registrations and indemnify the holder of the Glencore Convertible Note against (or make contributions in respect of) certain liabilities that may arise under the Securities Act.
Transfer Restrictions
Please see the section titled “.”
Description of Securities — Transfer Restrictions
147
EXPENSES RELATED TO THE OFFERING
Set forth below is an itemization of the total expenses which are expected to be incurred by us in connection with the offer and sale of our common shares by our selling shareholders. With the exception of the SEC registration fee, all amounts are estimates.
USD | ||||
SEC registration fee | $ | 168,792.32 | ||
FINRA filing fee | $ | 224,850.00 | ||
Legal fees and expenses | * | |||
Accounting fees and expenses | * | |||
Printing expenses | * | |||
Transfer agent fees and expenses | * | |||
Miscellaneous expenses | * | |||
Total | $ | * | ||
| * | The fees are calculated based on the securities offered and the number of issuances and accordingly cannot be defined at this time. |
148
ENFORCEMENT OF CIVIL LIABILITIES
We are incorporated under the laws of the Province of Ontario. Some of our directors and officers, and some of the experts named in this prospectus, are residents of Canada or otherwise reside outside of the United States, and all or a substantial portion of their assets, and a substantial portion of our assets, are located outside of the United States. We have appointed an agent for service of process in the United States, but it may be difficult for shareholders who reside in the United States to effect service within the United States upon those directors, officers and experts who are not residents of the United States. It may also be difficult for shareholders who reside in the United States to realize in the United States upon judgments of courts of the United States predicated upon our civil liability and the civil liability of our directors, officers and experts under the United States federal securities laws. There can be no assurance that U.S. investors will be able to enforce against us, members of our board of directors, officers or certain experts named herein who are residents of Canada or other countries outside the United States, any judgments in civil and commercial matters, including judgments under the federal securities laws.
We have appointed Puglisi & Associates, 850 Library Avenue, Suite 204, Newark, Delaware 19711 as our agent to receive service of process with respect to any action brought against us under the federal securities laws of the United States or of any state in the United States.
LEGAL MATTERS
The validity of the common shares offered by this prospectus and certain legal matters as to Canadian law will be passed upon by McCarthy Tétrault LLP, Toronto, Ontario, Canada. We have been advised on U.S. securities matters by Freshfields Bruckhaus Deringer US LLP.
149
EXPERTS
The financial statements of
Li-Cycle
Holdings Corp. as of October 31, 2021 and 2020, and for each of the three years in the period ended October 31, 2021, included in this prospectus, have been audited by Deloitte LLP, an independent registered public accounting firm, as stated in their report. Such financial statements are included in reliance upon the report of such firm given their authority as experts in accounting and auditing.The offices of Deloitte LLP, Chartered Professional Accountants, are located at 8 Adelaide Street West, Suite 200, Toronto, Ontario, Canada M5H 0A9.
150
WHERE YOU CAN FIND MORE INFORMATION
We have filed with the SEC a registration statement (including amendments and exhibits to the registration statement) on Form
F-1
under the Securities Act. For purposes of this section, the term registration statement means the original registration statement and any and all amendments including the schedules and exhibits to the original registration statement or any amendment. This prospectus, which is part of the registration statement, does not contain all of the information set forth in the registration statement and the exhibits and schedules to the registration statement. For further information, we refer you to the registration statement and the exhibits and schedules filed as part of the registration statement. If a document has been filed as an exhibit to the registration statement, we refer you to the copy of the document that has been filed. Each statement in this prospectus relating to a document filed as an exhibit is qualified in all respects by the filed exhibit.We are subject to the informational requirements of the Exchange Act that are applicable to foreign private issuers. Accordingly, we are required to file or furnish reports and other information with the SEC, including annual reports on
Form 20-F
and reports on Form6-K.
The SEC maintains an Internet website that contains reports and other information regarding issuers that file electronically with the SEC. Our filings with the SEC are available to the public through the SEC’s website athttp://www.sec.gov.
As a foreign private issuer, we are exempt under the Exchange Act from, among other things, the rules prescribing the furnishing and content of proxy statements, and our executive officers, directors and principal and selling shareholders are exempt from the reporting and short-swing profit recovery provisions contained in Section 16 of the Exchange Act. In addition, we will not be required under the Exchange Act to file periodic reports and financial statements with the SEC as frequently or as promptly as U.S. companies whose securities are registered under the Exchange Act.
We maintain a corporate website atThe information posted on or accessible through our website is not incorporated into this prospectus. We have included our website address in this prospectus solely for informational purposes and the references to our websites are intended to be inactive textual references only.
www.li-cycle.com.
151
INDEX TO FINANCIAL STATEMENTS
Page | ||||
Condensed Consolidated Interim Financial Statements of Li-Cycle Holdings Corp. as of and for the three and six months ended April 30, 2022 and 2021 | ||||
| F-1 | ||||
| F-2 | ||||
| F-3 | ||||
| F-4 | ||||
| F-5 | ||||
Consolidated Financial Statements of Li-Cycle Holdings Corp. as of and for the years ended October 31, 2021, 2020, and 2019 | ||||
| F-25 | ||||
| F-26 | ||||
| F-27 | ||||
| F-28 | ||||
| F-29 | ||||
| F-30 | ||||
Li-Cycle
Holdings Corp.Condensed consolidated interim statements of financial position
As at April 30, 2022 and October 31, 2021
(Unaudited - expressed in U.S. dollars)
April 30, 2022 | October 31, 2021 | |||||||||
| Notes | $ | $ | ||||||||
Assets | ||||||||||
Current assets | ||||||||||
Cash and cash equivalents | 509,315,733 | 596,858,298 | ||||||||
Accounts receivable | 3 | 11,501,265 | 4,072,701 | |||||||
Other receivables | 3 | 1,564,430 | 973,145 | |||||||
Prepayments and deposits | 4 | 38,205,456 | 8,646,998 | |||||||
Inventory | 5 | 3,370,209 | 1,197,807 | |||||||
563,957,093 | 611,748,949 | |||||||||
Non-current assets | ||||||||||
Plant and equipment | 6 | 70,402,519 | 26,389,463 | |||||||
Right-of-use | 7 | 32,396,195 | 27,009,760 | |||||||
102,798,714 | 53,399,223 | |||||||||
666,755,807 | 665,148,172 | |||||||||
Liabilities | ||||||||||
Current liabilities | ||||||||||
Accounts payable and accrued liabilities | 9 | 45,158,491 | 18,701,116 | |||||||
Lease liabilities | 10 | 4,858,940 | 2,868,795 | |||||||
Loans payable | 7,475 | 7,752 | ||||||||
50,024,906 | 21,577,663 | |||||||||
Non-current liabilities | ||||||||||
Lease liabilities | 10 | 30,118,752 | 26,496,074 | |||||||
Loans payable | 27,812 | 31,996 | ||||||||
Convertible debt | 11 | 88,526,371 | 100,877,838 | |||||||
Warrants | 12 | — | 82,109,334 | |||||||
Restoration provisions | 433,280 | 334,233 | ||||||||
119,106,215 | 209,849,475 | |||||||||
169,131,121 | 231,427,138 | |||||||||
Shareholders’ equity | ||||||||||
Share capital | 13 | 718,258,295 | 672,079,154 | |||||||
Contributed surplus | 12,524,967 | 3,026,721 | ||||||||
Accumulated deficit | (233,168,290 | ) | (241,088,229 | ) | ||||||
Accumulated other comprehensive loss | (296,612 | ) | (296,612 | ) | ||||||
Equity attributable to the Shareholders of Li-Cycle Holdings Corp. | 497,318,360 | 433,721,034 | ||||||||
Non-controlling interest | 15 | 306,326 | — | |||||||
Total equity | 497,624,686 | 433,721,034 | ||||||||
666,755,807 | 665,148,172 | |||||||||
The accompanying notes are an integral part of the condensed consolidated interim financial statements.
F-1
Li-Cycle
Holdings Corp.Condensed consolidated interim statements of comprehensive income and (loss)
Three and six months ended April 30, 2022 and 2021
(Unaudited - expressed in U.S. dollars)
| Three months ended April 30, | Six Months Ended April 30, | |||||||||||||||||
2022 | 2021 | 2022 | 2021 | |||||||||||||||
| Notes | $ | $ | $ | $ | ||||||||||||||
Revenue | ||||||||||||||||||
Product sales | 14 | 8,291,122 | 176,102 | 11,913,569 | 1,088,968 | |||||||||||||
Recycling services | 362,101 | 81,282 | 577,624 | 185,656 | ||||||||||||||
8,653,223 | 257,384 | 12,491,193 | 1,274,624 | |||||||||||||||
Expenses | ||||||||||||||||||
Employee salaries and benefits | 11,328,894 | 2,547,281 | 19,107,554 | 4,245,480 | ||||||||||||||
Professional fees | 3,559,716 | 567,918 | 6,433,755 | 3,002,052 | ||||||||||||||
Share-based compensation | 13 | 4,477,355 | 263,214 | 9,676,164 | 1,009,385 | |||||||||||||
Raw materials and supplies | 1,816,599 | 480,255 | 3,230,441 | 894,357 | ||||||||||||||
Office, administrative and travel | 3,148,739 | 317,644 | 5,993,279 | 621,885 | ||||||||||||||
Depreciation | 6, 7 | 1,986,776 | 605,621 | 3,820,851 | 1,132,999 | |||||||||||||
Research and development | 528,080 | 824,836 | 869,866 | 1,352,031 | ||||||||||||||
Freight and shipping | 587,484 | 141,447 | 797,845 | 432,497 | ||||||||||||||
Plant facilities | 983,968 | 234,202 | 1,421,038 | 448,336 | ||||||||||||||
Marketing | 747,630 | 163,135 | 1,196,575 | 304,790 | ||||||||||||||
Change in finished goods inventory | 812,421 | (567,261 | ) | 987 | (644,893 | ) | ||||||||||||
29,977,662 | 5,578,292 | 52,548,355 | 12,798,919 | |||||||||||||||
Loss from operations | (21,324,439 | ) | (5,320,908 | ) | (40,057,162 | ) | (11,524,295 | ) | ||||||||||
Other (income) expense | ||||||||||||||||||
Fair value (gain) loss on financial instruments | 11, 12 | (2,861,556 | ) | 1,924,346 | (53,733,121 | ) | 1,924,346 | |||||||||||
Interest expense | 2,451,285 | 244,645 | 6,192,527 | 495,334 | ||||||||||||||
Foreign exchange (gain) loss | 140,296 | 358,748 | 128,843 | 750,712 | ||||||||||||||
Interest income | (409,089 | ) | (505 | ) | (546,676 | ) | (1,222 | ) | ||||||||||
(679,064 | ) | 2,527,234 | (47,958,427 | ) | 3,169,170 | |||||||||||||
Net profit (loss) before taxes | (20,645,375 | ) | (7,848,142 | ) | 7,901,265 | (14,693,465 | ) | |||||||||||
Income tax | 5,000 | — | 5,000 | — | ||||||||||||||
Net profit (loss) and comprehensive income (loss) | (20,650,375 | ) | (7,848,142 | ) | 7,896,265 | (14,693,465 | ) | |||||||||||
Net profit (loss) attributable to | ||||||||||||||||||
Shareholders of Li-Cycle Holdings Corp. | (20,626,701 | ) | (7,848,142 | ) | 7,919,939 | (14,693,465 | ) | |||||||||||
Non-controlling interest | (23,674 | ) | — | (23,674 | ) | — | ||||||||||||
Net profit (loss) and comprehensive income (loss) | (20,650,375 | ) | (7,848,142 | ) | 7,896,265 | (14,693,465 | ) | |||||||||||
Earnings (loss) per common share - basic | 18 | (0.12 | ) | (0.08 | ) | 0.05 | (0.16 | ) | ||||||||||
Earnings (loss) per common share - diluted | 18 | (0.12 | ) | (0.08 | ) | 0.05 | (0.16 | ) | ||||||||||
The accompanying notes are an integral part of the condensed consolidated interim financial statements.
F-2
Li-Cycle
Holdings Corp.Condensed consolidated interim statements of changes in equity
For the six months ended April 30, 2022 and 2021
(Unaudited - expressed in U.S. dollars)
Notes | Number of common shares | Share capital $ | Contributed surplus $ | Accumulated deficit $ | Accumulated other comprehensive income (loss) $ | Equity attributable to the Shareholders of Li-Cycle Holdings Corp. $ | Non-controlling interest $ | Total $ | ||||||||||||||||||||||||||
Balance, October 31, 2021 | 163,179,655 | 672,079,154 | 3,026,721 | (241,088,229 | ) | (296,612 | ) | 433,721,034 | — | 433,721,034 | ||||||||||||||||||||||||
Stock option expense | 13 | — | — | 4,136,896 | — | — | 4,136,896 | — | 4,136,896 | |||||||||||||||||||||||||
Shares issued for cash | 13 | — | — | — | — | — | — | — | ||||||||||||||||||||||||||
Exercise of stock options | 13 | 188,745 | 177,918 | (177,918 | ) | — | — | — | — | — | ||||||||||||||||||||||||
Exercise of warrants | 13 | 5,712,222 | 46,001,223 | — | — | — | 46,001,223 | — | 46,001,223 | |||||||||||||||||||||||||
Restricted Share Units expense | 13 | — | — | 5,539,268 | — | — | 5,539,268 | — | 5,539,268 | |||||||||||||||||||||||||
Non-controlling interest in subsidiary | 15 | — | — | — | — | — | — | 330,000 | 330,000 | |||||||||||||||||||||||||
Comprehensive income | — | — | — | 7,919,939 | — | 7,919,939 | (23,674 | ) | 7,896,265 | |||||||||||||||||||||||||
Balance, April 30, 2022 | 169,080,622 | 718,258,295 | 12,524,967 | (233,168,290 | ) | (296,612 | ) | 497,318,360 | 306,326 | 497,624,686 | ||||||||||||||||||||||||
Balance, October 31, 2020 | 83,361,291 | 15,441,600 | 824,683 | (14,528,941 | ) | (296,612 | ) | 1,440,730 | — | 1,440,730 | ||||||||||||||||||||||||
Series C Class A shares issued for cash | 13 | 11,220,218 | 21,620,000 | — | — | — | 21,620,000 | — | 21,620,000 | |||||||||||||||||||||||||
Shares issued for non-cash costs | 13 | 478,920 | 455,055 | (455,055 | ) | — | — | — | — | — | ||||||||||||||||||||||||
Exercise of stock options | 13 | — | — | — | — | — | — | — | — | |||||||||||||||||||||||||
Restricted Share Units settled in shares | 13 | — | — | — | — | — | — | — | — | |||||||||||||||||||||||||
Public shares issued for cash | 13 | — | — �� | — | — | — | — | — | — | |||||||||||||||||||||||||
Exercise of warrants | 12 | — | — | — | — | — | — | |||||||||||||||||||||||||||
Stock option expense | 13 | — | — | 404,443 | — | — | 404,443 | — | 404,443 | |||||||||||||||||||||||||
Restricted Share Units expense | 13 | — | — | — | — | — | — | — | — | |||||||||||||||||||||||||
Non-controlling interest in subsidiary | 15 | — | — | — | — | — | — | — | — | |||||||||||||||||||||||||
Comprehensive loss | — | — | — | (14,693,465 | ) | — | (14,693,465 | ) | — | (14,693,465 | ) | |||||||||||||||||||||||
Balance, April 30, 2021 | 95,060,429 | 37,516,655 | 774,071 | (29,222,406 | ) | (296,612 | ) | 8,771,708 | — | 8,771,708 | ||||||||||||||||||||||||
The accompanying notes are an integral part of the condensed consolidated interim financial statements.
F-3
Li-Cycle
Holdings Corp.Condensed consolidated interim statements of cash flows
Three and six months ended April 30, 2022 and 2021
(Unaudited - expressed in U.S. dollars)
| Three months ended April 30, | Six months ended April 30, | |||||||||||||||||
2022 | 2021 | 2022 | 2021 | |||||||||||||||
| Notes | $ | $ | $ | $ | ||||||||||||||
Operating activities | ||||||||||||||||||
Net profit (loss) for the period | (20,650,375 | ) | (7,848,142 | ) | 7,896,265 | (14,693,465 | ) | |||||||||||
Items not affecting cash | ||||||||||||||||||
Share-based compensation | 13 | 4,477,355 | 263,214 | 9,676,164 | 1,009,385 | |||||||||||||
Depreciation | 6, 7 | 1,986,776 | 605,621 | 3,820,851 | 1,132,999 | |||||||||||||
Amortization of government grants | — | (51,977 | ) | — | (66,039 | ) | ||||||||||||
Loss on disposal of assets | — | — | — | 13,399 | ||||||||||||||
Foreign exchange (gain) loss on translation | (95,694 | ) | 341,977 | (457,908 | ) | 661,757 | ||||||||||||
Fair value (gain) loss on financial instruments | 11, 12 | (2,861,556 | ) | 1,924,346 | (53,733,121 | ) | 1,924,346 | |||||||||||
Interest and accretion on convertible debt | 11 | 1,942,755 | — | 5,208,363 | — | |||||||||||||
(15,200,739 | ) | (4,764,961 | ) | (27,589,386 | ) | (10,017,618 | ) | |||||||||||
Changes in non-cash working capital items | ||||||||||||||||||
Accounts receivable | (5,685,871 | ) | (5,797 | ) | (7,428,564 | ) | (842,345 | ) | ||||||||||
Other receivables | (853,606 | ) | 174,968 | (591,285 | ) | (19,031 | ) | |||||||||||
Prepayments and deposits | 299,464 | (4,235,085 | ) | 2,370,660 | (4,450,774 | ) | ||||||||||||
Inventory | (489,162 | ) | (646,079 | ) | (2,172,402 | ) | (603,696 | ) | ||||||||||
Accounts payable and accrued liabilities | 4,729,463 | 3,782,666 | (3,224,360 | ) | 3,311,236 | |||||||||||||
(17,200,451 | ) | (5,694,288 | ) | (38,635,337 | ) | (12,622,228 | ) | |||||||||||
Investing activity | ||||||||||||||||||
Purchases of plant and equipment | 6 | (6,072,361 | ) | (2,482,161 | ) | (15,482,102 | ) | (5,098,250 | ) | |||||||||
Prepaid equipment deposits | 4 | (6,844,282 | ) | (369,839 | ) | (19,845,963 | ) | (369,839 | ) | |||||||||
Prepaid construction charges | 4 | (12,078,697 | ) | — | (12,078,697 | ) | — | |||||||||||
Proceeds from disposal of plant and equipment | — | — | — | 16,866 | ||||||||||||||
(24,995,340 | ) | (2,852,000 | ) | (47,406,762 | ) | (5,451,223 | ) | |||||||||||
Financing activities | ||||||||||||||||||
Proceeds from private share issuance, net of share issue costs | 13 | — | — | — | 21,620,000 | |||||||||||||
Proceeds from exercise of warrants | 12 | — | — | 65,180 | — | |||||||||||||
Proceeds from loans payable | — | 1,588,020 | — | 3,091,220 | ||||||||||||||
Proceeds from government grants | — | 51,977 | — | 66,039 | ||||||||||||||
Capital contribution from the holders of non-controlling interest | 15 | 330,000 | — | 330,000 | — | |||||||||||||
Repayment of lease liabilities | (1,059,229 | ) | (167,429 | ) | (1,892,563 | ) | (326,722 | ) | ||||||||||
Repayment of loans payable | (1,548 | ) | (413,748 | ) | (3,083 | ) | (714,741 | ) | ||||||||||
(730,777 | ) | 1,058,820 | (1,500,466 | ) | 23,735,796 | |||||||||||||
Net change in cash and cash equivalents | (42,926,568 | ) | (7,487,468 | ) | (87,542,565 | ) | 5,662,345 | |||||||||||
Cash and cash equivalents, beginning of period | 552,242,301 | 13,813,370 | 596,858,298 | 663,557 | ||||||||||||||
Cash and cash equivalents, end of period | 509,315,733 | 6,325,902 | 509,315,733 | 6,325,902 | ||||||||||||||
Non-cash investing activities | ||||||||||||||||||
Purchase of plant and equipment in payables and accruals | 23,579,072 | 1,775,352 | 29,681,735 | 2,632,909 | ||||||||||||||
Non-cash financing activities | ||||||||||||||||||
Equity issued for non-cash costs | — | — | — | 455,055 | ||||||||||||||
Interest paid | 508,530 | 244,645 | 984,164 | 495,334 | ||||||||||||||
The accompanying notes are an integral part of the condensed consolidated interim financial statements.
F-4
Li-Cycle Holdings Corp.
Notes to the consolidated financial statements
Three months ended April 30, 2022 and 2021
(Unaudited - expressed in U.S. dollars)
1. | Nature of operations |
Nature of Operations
Li-Cycle Holdings
Corp. and its subsidiaries, collectively(“Li-Cycle”
or the “Company”) started their businessas
Li-Cycle
Corp.Li-Cycle
Corp. was incorporated in Ontario, Canada under theBusiness Corporations Act
Li-Cycle’s
core business model is to build, own and operate recycling plants tailored to regional needs.Li-Cycle’s
Spoke & Hub Technologies™
provide an environmentally friendly resource recovery solution that addresses the growing globallithium-ion
battery recycling challenges, supporting the global transition toward electrification.On March 28, 2019,
Li-Cycle
Corp. incorporated a wholly owned subsidiary,Li-Cycle
Inc., under the General Corporation Law of the State of Delaware. This subsidiary operates the Company’s U.S. Spoke facilities.On September 2, 2020,
Li-Cycle
Corp. incorporated a wholly owned subsidiary,Li-Cycle
North America Hub, Inc., under the General Corporation Law of the State of Delaware. This subsidiary is developing the Company’s first commercial Hub, in Rochester, New York.On August 10, 2021, in accordance with the plan of arrangement to reorganize
Li-Cycle
Corp., the Company finalized a business combination (the “Business Combination”) with Peridot Acquisition Corp., and the combined company was renamedLi-Cycle
Holdings Corp. On closing, the common shares ofLi-Cycle
Holdings Corp. were listed on the New York Stock Exchange and commenced trading under the symbol “LICY”.2. | Significant accounting policies |
(a) | Statement of compliance |
These condensed consolidated interim financial statements have been prepared in accordance with International Financial Reporting Standards (“IFRS”) under International Accounting Standard (IAS) 34 – Interim Financial Reporting. Except as described below, these financial statements were prepared using the same basis of presentation, accounting policies and methods of computation as outlined in Note 2, Significant accounting policies in the Company’s consolidated financial statements for the year ended October 31, 2021. These financial statements do not include all the notes required in annual financial statements.
These condensed consolidated interim financial statements were approved and authorized for issue by the Board of Directors on June 13, 2022.
(b) | Basis of consolidation |
These condensed consolidated interim financial statements include the accounts of the Company and its subsidiaries. The Company’s eleven subsidiaries are entities controlled by the Company. Control exists when the Company has power over an investee, when the Company is exposed, or has rights, to variable returns from the investee and when the Company has the ability to affect those returns through its power over the investee. The subsidiaries are included in the condensed consolidated interim financial results of the Company from the effective date of incorporation up to the effective date of
F-5
Li-Cycle Holdings Corp.
Notes to the consolidated financial statements
Three months ended April 30, 2022 and 2021
(Unaudited - expressed in U.S. dollars)
disposition or loss of control. The Company’s principal subsidiaries and their geographic location as at April 30, 2022 are set forth in the table below:
Company | Location | Ownership interest | ||
Li-Cycle Corp. | Ontario, Canada | 100% | ||
Li-Cycle Americas Corp. | Ontario, Canada | 100% | ||
Li-Cycle U.S. Holdings Inc. | Delaware, U.S. | 100% | ||
Li-Cycle Inc. | Delaware, U.S. | 100% | ||
Li-Cycle North America Hub, Inc. | Delaware, U.S. | 100% | ||
Li-Cycle Europe AG | Switzerland | 100% | ||
Li-Cycle APAC PTE. LTD. | Singapore | 100% | ||
Li-Cycle Germany GmbH | Germany | 100% | ||
Li-Cycle Norway AS | Norway | 67% |
Intercompany transactions, balances and unrealized gains/losses on transactions between the Company and its subsidiaries are eliminated.
(c) | Basis of preparation |
These condensed consolidated interim financial statements are presented in U.S. dollars, which is the Company’s functional currency.
(d) | New and revised IFRS Standards issued but not yet effective |
At the date of authorization of these financial statements, the Company has not applied the following new and revised IFRS Standards that have been issued but are not yet effective.
| Amendments to IFRS 3 | Reference to the Conceptual Framework | |
| IFRS 17 (including the June 2020 amendments to IFRS 17) | Insurance Contracts | |
| Annual Improvements to IFRS Standards 2018-2020 | Amendments to IFRS 1 First-time Adoption of International Financial Reporting Standards, IFRS 9 Financial Instruments, IFRS 16 Leases, and IAS 41 Agriculture | |
| Amendments to IAS 1 | Disclosure of Accounting Policies | |
| Amendments to IAS 1 | Classifying liabilities as current or non-current | |
| Amendments to IAS 8 | Definition of Accounting Estimates | |
| Amendments to IAS 12 | Deferred Tax related to Assets and Liabilities arising from a Single Transaction | |
| Amendments to IAS 16 | Property, Plant and Equipment—Proceeds before Intended Use | |
| Amendments to IAS 37 | Onerous Contracts—Cost of Fulfilling a Contract | |
F-6
Li-Cycle Holdings Corp.
Notes to the consolidated financial statements
Three months ended April 30, 2022 and 2021
(Unaudited - expressed in U.S. dollars)
The adoption of the IFRS Standards listed above are not expected to have a material impact on the financial statements of the Company in future periods, except as noted below.
Amendments to IAS 1 Presentation of Financial Statements and IFRS Practice Statement 2 Making Materiality Judgements—Disclosure of Accounting Policies
The amendments change the requirements in IAS 1 with regard to disclosure of accounting policies. The amendments replace all instances of the term ‘significant accounting policies’ with ‘material accounting policy information’. Accounting policy information is material if, when considered together with other information included in an entity’s financial statements, it can reasonably be expected to influence decisions that the primary users of general purpose financial statements make on the basis of those financial statements.
The supporting paragraphs in IAS 1 are also amended to clarify that accounting policy information that relates to immaterial transactions, other events or conditions is immaterial and need not be disclosed. Accounting policy information may be material because of the nature of the related transactions, other events or conditions, even if the amounts are immaterial. However, not all accounting policy information relating to material transactions, other events or conditions is itself material.
The International Accounting Standards Board has also developed guidance and examples to explain and demonstrate the application of the ‘four-step materiality process’ described in IFRS Practice Statement 2.
The amendments to IAS 1 are effective for annual periods beginning on or after 1 January 2023, with earlier application permitted and are applied prospectively. The Company is assessing the potential impact of these amendments.
(e) | Newly adopted IFRS Standards |
Interest Rate Benchmark Reform - Phase 2 The IASB has published Interest Rate Benchmark Reform - Phase 2 (Amendments to IFRS 9, IAS 39, IFRS 7, IFRS 4 and IFRS 16) with amendments that address issues that might affect financial reporting after the reform of an interest rate benchmark, including its replacement with alternative benchmark rates. The amendments are effective for annual reporting periods beginning on or after January 1, 2021. The Company has assessed the revised impact of the amendments and concluded that they have no impact on the condensed consolidated interim financial statements.
(f) | Comparative figures |
Certain of the comparative figure have been reclassified to conform to the financial statement presentation adopted in the current year.
(g) | Non-controlling interest |
Non-controlling
interest is defined as equity in a subsidiary not attributable, directly or indirectly, to a parent where a parent controls one or more entities.Changes in the Company’s ownership interest in a subsidiary that do not result in the loss of control of the subsidiary are accounted for as equity transactions.
Non-controlling
interest will be subsequently measured through profit/loss and will be attributed based on ownership interest and distributions/dividends to thenon-controlling
interest.F-7
Li-Cycle Holdings Corp.
Notes to the consolidated financial statements
Three months ended April 30, 2022 and 2021
(Unaudited - expressed in U.S. dollars)
3. | Accounts receivable |
April 30, 2022 $ | October 31, 2021 $ | |||||||
Trade Receivables | 11,501,265 | 4,072,701 | ||||||
Total accounts receivable | 11,501,265 | 4,072,701 | ||||||
Sales Taxes receivable | 1,392,789 | 379,814 | ||||||
Other | 171,641 | 593,331 | ||||||
Total other receivables | 1,564,430 | 973,145 | ||||||
For product sales, the Company estimates the amount of consideration to which it expects to be entitled under provisional pricing arrangements. For the three and six months ended April 30, 2022, the fair value gain arising from changes in estimates was $3,971,482 and $5,709,952, respectively (three and six months ended April 30, 2021: $(107,535) and $167,969) included in the respective accounts receivable balance.
For the three and six months ended April 30, 2022, the Company has assessed an allowance for credit loss of $3,506 for service-related receivables based on its past experience, the credit ratings of its existing customers and economic trends (at October 31, 2021: $NaN).
The Company’s revenue and accounts receivable primarily come from two key customers as shown in the table below. The Company’s remaining customers do not make up significant percentages of these balances.
Three months ended | Six months ended | |||||||||||||||
2022 % | 2021 % | 2022 % | 2021 % | |||||||||||||
Revenue | ||||||||||||||||
Customer A | 10.0 | % | 65.0 | % | 16.0 | % | 85.0 | % | ||||||||
Customer B | 83.0 | % | 0.0 | % | 74.0 | % | 0.0 | % | ||||||||
April 30, 2022 $ | October 31, 2021 $ | |||||||
Accounts Receivable | ||||||||
Customer A | 7.4 | % | 94.0 | % | ||||
Customer B | 79.1 | % | 0.0 | % | ||||
4. | Prepayments and deposits |
April 30, 2022 $ | October 31, 2021 $ | |||||||
Prepaid lease deposits | 1,406,347 | 886,951 | ||||||
Prepaid equipment deposits | 19,845,963 | 3,231,836 | ||||||
Prepaid insurance | 995,027 | 3,839,880 | ||||||
Prepaid construction charges | 12,078,697 | — | ||||||
Other prepaids | 3,879,422 | 688,331 | ||||||
38,205,456 | 8,646,998 | |||||||
Other prepaids consist principally of parts and consumables, deposits, subscriptions, and environmental financial assurance.
F-8
Li-Cycle Holdings Corp.
Notes to the consolidated financial statements
Three months ended April 30, 2022 and 2021
(Unaudited - expressed in U.S. dollars)
5. | Inventory |
April 30, 2022 $ | October 31, 2021 $ | |||||||
Raw material | 2,983,005 | 850,416 | ||||||
Finished goods | 387,204 | 347,391 | ||||||
3,370,209 | 1,197,807 | |||||||
The cost of inventories recognized as an expense during the three and six months ended April 30, 2022 was $4,545,610 and $6,991,992, respectively (three and six months ended April 30, 2021:$1,309,159 and $2,490,731).
The cost of inventories recognized as an expense during the three and six months ended April 30, 2022 includes a write down of $26,775 and $401,797, respectively, for finished goods and a write down of $113,395 and $398,890, respectively, for raw materials (three and six months ended April 30, 2021: write down of $697,811 and $1,065,233 for finished goods and write down of $0 and $53,757 for raw materials) in respect of adjustments of inventory to net realizable value. Net realizable value of inventory is calculated as the estimated consideration under provisional pricing arrangements less the estimated cost of completion and the estimated costs necessary to make the sale.
6. | Plant and equipment |
| Assets under construction $ | Plant equipment $ | Computer software and equipment $ | Storage containers $ | Vehicles $ | Leasehold improvements $ | Total $ | ||||||||||||||||||||||
Cost | ||||||||||||||||||||||||||||
At October 31, 2021 | 15,638,165 | 6,275,419 | 196,273 | 67,619 | 179,298 | 6,219,456 | 28,576,230 | |||||||||||||||||||||
Additions | 43,648,651 | 12,622 | 162,311 | — | 62,000 | 1,278,253 | 45,163,837 | |||||||||||||||||||||
Transfers from Assets under construction | (2,013,803 | ) | 1,668,065 | 309,555 | 25,733 | — | 10,450 | — | ||||||||||||||||||||
At April 30, 2022 | 57,273,013 | 7,956,106 | 668,139 | 93,352 | 241,298 | 7,508,159 | 73,740,067 | |||||||||||||||||||||
Accumulated depreciation | ||||||||||||||||||||||||||||
At October 31, 2021 | — | (1,549,700 | ) | (8,645 | ) | (14,172 | ) | (49,314 | ) | (564,936 | ) | (2,186,767 | ) | |||||||||||||||
Depreciation | — | (741,003 | ) | (71,386 | ) | (4,454 | ) | (23,332 | ) | (310,606 | ) | (1,150,781 | ) | |||||||||||||||
At April 30, 2022 | — | (2,290,703 | ) | (80,031 | ) | (18,626 | ) | (72,646 | ) | (875,542 | ) | (3,337,548 | ) | |||||||||||||||
Carrying amounts | — | |||||||||||||||||||||||||||
At October 31, 2021 | 15,638,165 | 4,725,719 | 187,628 | 53,447 | 129,984 | 5,654,520 | 26,389,463 | |||||||||||||||||||||
At April 30, 2022 | 57,273,013 | 5,665,403 | 588,108 | 74,726 | 168,652 | 6,632,617 | 70,402,519 | |||||||||||||||||||||
F-9
Li-Cycle Holdings Corp.
Notes to the consolidated financial statements
Three months ended April 30, 2022 and 2021
(Unaudited - expressed in U.S. dollars)
7. | Right-of-use assets |
Premises | Equipment | Total | ||||||||||
Cost | $ | $ | $ | |||||||||
At October 31, 2021 | 28,821,956 | 133,769 | 28,955,725 | |||||||||
Additions | 7,951,830 | 117,517 | 8,069,347 | |||||||||
Modifications | (196,578 | ) | (25,125 | ) | (221,703 | ) | ||||||
At April 30, 2022 | 36,577,208 | 226,161 | 36,803,369 | |||||||||
Accumulated depreciation | ||||||||||||
At October 31, 2021 | (1,894,179 | ) | (51,786 | ) | (1,945,965 | ) | ||||||
Depreciation | (2,648,983 | ) | (21,087 | ) | (2,670,070 | ) | ||||||
Disposals | 208,861 | — | 208,861 | |||||||||
At April 30, 2022 | (4,334,301 | ) | (72,873 | ) | (4,407,174 | ) | ||||||
Carrying amounts | ||||||||||||
At October 31, 2021 | 26,927,777 | 81,983 | 27,009,760 | |||||||||
At April 30, 2022 | 32,242,907 | 153,288 | 32,396,195 | |||||||||
The weighted average lease term is four years.
8. | Related party transactions |
Remuneration of key management personnel including directors
The remuneration of the executive officers and directors, who are the key management personnel of the Company, during the six months ended April 30, 2022 and 2021 are as follows:
April 30, 2022 $ | April 30, 2021 $ | |||||||
Salaries | 1,783,342 | 539,009 | ||||||
Share-based compensation | 8,030,239 | 605,957 | ||||||
Fees and benefits | 1,599,261 | 339,846 | ||||||
11,412,842 | 1,484,812 | |||||||
During the three and six months ended April 30, 2022, the Company paid directors for providing director services and consulting services. Total amounts paid to directors in respect of these activities in the period was $95,379 and $172,879, respectively (three and six months ended April 30, 2021: $61,600 and $110,966).
Outstanding balances of remunerations of the executive officers and directors are summarized as follows:
April 30, 2022 $ | October 31, 2021 $ | |||||||
Accounts payable and accrued liabilities | 1,430,161 | 771,255 | ||||||
Outstanding balances | 1,430,161 | 771,255 | ||||||
F-10
Li-Cycle Holdings Corp.
Notes to the consolidated financial statements
Three months ended April 30, 2022 and 2021
(Unaudited - expressed in U.S. dollars)
Related-Party Lease
From January 1, 2019 to December 31, 2021, the Company leased certain office space from Ashlin BPG Marketing, which is controlled by certain members of the immediate family of the Company’s President and Chief Executive Officer. Under the terms of the lease, the Company was required to pay Cdn. $4,500 per month plus applicable taxes, subject to 60 days’ notice of termination.
Li-Cycle
terminated the lease, effective December 31, 2021. During the three and six months ended April 30, 2022, the Company incurred expenses of $NaN and $6,358 in relation to this vendor, compared to $11,155 and $17,353 for the three and six months ended April 30, 2021, respectively.Related-Party Expenses
The Company has engaged Fade In Production Pty. Ltd., which is controlled by certain members of the immediate family of the Executive Chair of
Li-Cycle,
to provide it with corporate video production services since 2017. During the three and six months ended April 30, 2022, the Company incurred expenses of $105,372 and $107,472 in relation to this vendor, compared to $69,347 and $97,005 for the three and six months ended April 30, 2021, respectively.The Company has engaged Ashlin BPG Marketing, a related party as described above, to provide it with
Li-Cycle
branded promotional products for both customers and employees since April 1, 2020. During the three and six months ended April 30, 2022, the Company incurred expenses of $11,486 and $45,265 attributable to this vendor, compared to $4,415 and $23,688 for the three and six months ended April 30, 2021, respectively.The Company has engaged Consulero Inc., which is controlled by certain members of the immediate family of the Company’s President and Chief Executive Officer, to provide it with technology services in relation to the Company’s inventory management system since September 1, 2020. During the three and six months ended April 30, 2022, the Company incurred expenses of $25,252 and $47,355 attributable to this vendor, compared to $22,153 and $58,279 for the three and six months ended April 30, 2021, respectively.
Consulting Agreements
On May 1, 2020,
Li-Cycle
entered into a consulting agreement with Atria Limited (“Atria”), an entity which beneficially owned more than 5% of the outstandingLi-Cycle
Corp. common shares at that time, to agree upon and finalize the consideration for certain business development and marketing consulting services that were previously performed on behalf ofLi-Cycle
from 2018 through April 2020. The fees for such services were agreed at 12,000 common shares ofLi-Cycle
Corp., payable in installments of 1,000 shares per month. On January 25, 2021,Li-Cycle
issued all of the 12,000 shares to Atria as full and final satisfaction of all obligations ofLi-Cycle
to Atria under the consulting agreement. Atria also directed the issuance of such shares as follows: 8,000 Shares to Atria; 2,000 Shares to Pella Ventures (an affiliated company of Atria); and 2,000 Shares to a director ofLi-Cycle
Corp. at the time, who is not related to Atria.Director Consulting Agreements
Under the terms of an agreement dated July 19, 2019 between
Li-Cycle
and Anthony Tse, Mr. Tse provided consulting services toLi-Cycle
in relation to the proposed expansion of its operations in Asia and was entitled to a fee of $4,700 per month for such services. During the three and six months ended April 30, 2022, Mr. Tse was paid aggregate fees under this agreement of 0nil and $14,100, compared to $14,100 and $28,200 for the three and six months ended April 30, 2021. The consulting agreement was terminated on January 19, 2022.F-11
Li-Cycle Holdings Corp.
Notes to the consolidated financial statements
Three months ended April 30, 2022 and 2021
(Unaudited - expressed in U.S. dollars)
9. | Accounts payable and accrued liabilities |
April 30, 2022 $ | October 31, 2021 $ | |||||||
Trade payables | 20,979,006 | 9,447,394 | ||||||
Accrued fixed Assets | 15,050,873 | 2,074,681 | ||||||
Accrued expenses | 4,827,190 | 4,378,073 | ||||||
Accrued compensation | 4,301,422 | 2,800,968 | ||||||
45,158,491 | 18,701,116 | |||||||
10. | Lease liabilities |
The Company has the following lease liabilities as of April 30, 2022.
Maturity analysis Undiscounted | Year 1 $ | Year 2 $ | Year 3 $ | Year 4 $ | Year 5 $ | Thereafter $ | Total $ | |||||||||||||||||||||
Premises | 6,746,030 | 5,411,060 | 4,600,714 | 4,378,830 | 4,157,619 | 21,426,607 | 46,720,860 | |||||||||||||||||||||
Equipment | 61,153 | 58,152 | 43,149 | 28,312 | 14,103 | 3,134 | 208,003 | |||||||||||||||||||||
Total | 6,807,183 | 5,469,212 | 4,643,863 | 4,407,142 | 4,171,722 | 21,429,741 | 46,928,863 | |||||||||||||||||||||
Lease liabilities Discounted | Current $ | Non-Current $ | Total $ | |||||||||
Premises | 4,812,935 | 29,996,185 | 34,809,120 | |||||||||
Equipment | 46,005 | 122,567 | 168,572 | |||||||||
Total | 4,858,940 | 30,118,752 | 34,977,692 | |||||||||
The Company has the following lease liabilities as of October 31, 2021.
Maturity analysis Undiscounted | Year 1 $ | Year 2 $ | Year 3 $ | Year 4 $ | Year 5 $ | Thereafter $ | Total $ | |||||||||||||||||||||
Premises | 4,468,877 | 4,590,357 | 3,741,940 | 3,332,312 | 3,290,786 | 16,302,071 | 35,726,343 | |||||||||||||||||||||
Equipment | 48,898 | 44,044 | 44,044 | 42,384 | 21,022 | 7,835 | 208,227 | |||||||||||||||||||||
Total | 4,517,775 | 4,634,401 | 3,785,984 | 3,374,696 | 3,311,808 | 16,309,906 | 35,934,570 | |||||||||||||||||||||
Lease liabilities Discounted | Current $ | Non-Current $ | Total $ | |||||||||
Premises | 2,836,348 | 26,366,448 | 29,202,796 | |||||||||
Equipment | 32,447 | 129,626 | 162,073 | |||||||||
Total | 2,868,795 | 26,496,074 | 29,364,869 | |||||||||
In the three and six months ended April 30, 2022, the Company recognized an interest expense of $458,907 and $897,433 related to lease liabilities, respectively (three and six months ended April 30, 2021: $62,205 and $125,006).
The Company’s lease obligations include leases for plant operations, storage facilities, and office space for employees. In the six months ended April 30, 2022, the Company has added 4 new premises leases and modified 2 leases.
F-12
Li-Cycle Holdings Corp.
Notes to the consolidated financial statements
Three months ended April 30, 2022 and 2021
(Unaudited - expressed in U.S. dollars)
11. | Convertible Debt |
April 30, 2022 $ | October 31, 2021 $ | |||||||
Principal of convertible note at beginning of period | 100,000,000 | — | ||||||
Issuance of convertible notes | 1,827,778 | 100,000,000 | ||||||
Principal of convertible note at end of period | 101,827,778 | 100,000,000 | ||||||
Conversion feature at beginning of period | 29,028,938 | — | ||||||
Conversion feature issued | — | 27,681,043 | ||||||
Fair value (gain) loss on embedded derivative | (17,559,830 | ) | 1,347,895 | |||||
Conversion feature at end of period | 11,469,108 | 29,028,938 | ||||||
Debt component at beginning of period | 71,848,900 | — | ||||||
Debt component issued | 1,827,778 | 72,318,957 | ||||||
Transaction costs | — | (1,599,737 | ) | |||||
Accrued interest paid in kind | (1,827,778 | ) | — | |||||
Accrued interest expense | 5,208,363 | 1,129,680 | ||||||
Debt component at end of period | 77,057,263 | 71,848,900 | ||||||
Total Convertible Debt at end of period | 88,526,371 | 100,877,838 | ||||||
On September 29, 2021, the Company entered into a Note Purchase Agreement (the “KSP Note Purchase Agreement”) with Spring Creek Capital, LLC (an affiliate of Koch Strategic Platforms, being a subsidiary of Koch Investments Group) and issued a convertible note (the “KSP Note”) for a principal amount of $100 million to Spring Creek Capital, LLC. The KSP Note will mature on September 29, 2026 unless earlier repurchased, redeemed or converted. Interest on the KSP Note is payable semi-annually, and
Li-Cycle
is permitted to pay interest on the KSP Note in cash or by paymentin-kind
(“PIK”), at its election. Interest payments made in cash are based on an interest rate of LIBOR plus 5.0% per year, and PIK interest payments were based on an interest rate of LIBOR plus 6.0% per year. Under the terms of the KSP Note, LIBOR has a floor of 1% and a cap of 2%. Once the LIBOR interest rate is no longer published, the interest rate will instead be based on the sum of the Secured Overnight Financing Rate (“SOFR”) and the average spread between the SOFR and LIBOR during the three-month period ending on the date on which LIBOR ceases to be published. The PIK election results in a new note under the same terms as the original KSP Note, issued in lieu of interest payments with an issuance date on the applicable interest date.On the first interest payment date of December 31, 2021, the Company elected to pay the accrued interest in kind by issuing a new note (the “PIK Note”) for the amount of $1,827,778 under the same terms as the original KSP Note, in lieu of cash payments.
The conversion feature has been recorded as an embedded derivative liability since the conversion ratio does not always result in a conversion of a fixed dollar amount of liability for a fixed number of shares. The KSP Note had an initial conversion price of approximately $13.43 per
Li-Cycle
common share, subject to customary anti-dilution adjustments, which price was established based on 125% of the7-day
volume-weighted average price ofLi-Cycle’s
common shares prior to the date of the KSP Note Purchase Agreement. Should the Company’s share price be equal to or greater than $17.46, for a period of twenty consecutive days, the Company can force conversion of the KSP Note.Li-Cycle
will settle its conversionF-13
Li-Cycle Holdings Corp.
Notes to the consolidated financial statements
Three months ended April 30, 2022 and 2021
(Unaudited - expressed in U.S. dollars)
obligations through the delivery of its own common shares. As at April 30, 2022, no conversions had taken place.
The fair value of the embedded derivatives upon issuance of the original KSP Note was determined to be a liability of $27,681,043 whereas the remaining $72,318,957, net of transaction costs of $1,599,737, was allocated to the principal portion of the debt. During the three and six months ended April 30, 2022, the Company recognized a fair value gain of $2,861,556 and fair value gain of $17,559,830 on the embedded derivatives, respectively. The embedded derivatives were valued using the Barrier option pricing model. The assumptions used in the model were as follows:
| September 29, 2021 (issuance date) | October 31, 2021 | April 30, 2022 | ||||
Risk free interest rate | 1.06% | 1.23% | 3.07% | |||
Expected life of options | 5 years | 4.92 years | 4.42 years | |||
Expected dividend yield | 0.0% | 0.0% | 0.0% | |||
Expected stock price volatility | 66% | 62% | 65% | |||
Share Price | 12.56 | 12.94 | 6.49 |
Expected volatility was determined by calculating the average implied volatility of a group of listed entities that are considered similar in nature to the Company.
12. | Warrants |
In connection with the completion of the Business Combination on August 10, 2021, the Company assumed obligations under Peridot Acquisition Corp.’s publicly traded warrants to purchase up to 23,000,000 common shares at their fair market value of $2.10 per share for a total acquired liability of $48,299,987.
The total number of warrants was made up of 15,000,000 Public Placement Warrants (“Public Warrants”) and 8,000,000 Private Placement Warrants (“Private Warrants”). All of the warrants had a
5-year
term, expiring on September 24, 2025. The Public Warrants had an exercise price of $11.50 per share, with a redemption price of $0.10 per warrant if the Company’s share price exceeded $10.00, on a cashless basis. If the Company’s share price exceeded $18.00 for any 20 trading days within the 30 trading day period ending three trading days before the Company elected to deliver a notice of redemption, the redemption price was $0.01 on a cash basis. The Private Warrants had an exercise price of $11.50 per share, redeemable only at such time that the share price of the Company was between $10.00 and $18.00, at $0.10 per warrant. The Private Warrants were not transferable until 30 days after the close of the Business Combination, which was September 9, 2021.On December 27, 2021, the Company announced that it would redeem all of its warrants to purchase common shares of the Company that remained outstanding at 5:00 p.m. New York City time on January 26, 2022 (the “Redemption Date”) for a redemption price of $0.10 per warrant. Based on the Redemption Fair Market Value that was announced on January 11, 2022, warrant holders who surrendered their warrants on a “Make-Whole Exercise” prior to the Redemption Date received 0.253 common shares of the Company per warrant. As of January 31, 2022, (i) 9,678 warrants were exercised at the exercise price of $11.50 per common share, and (ii) 22,540,651 warrants were surrendered by holders in the Make-Whole Exercise. The remaining 449,665 unexercised warrants were redeemed at $0.10 per warrant.
F-14
Li-Cycle Holdings Corp.
Notes to the consolidated financial statements
Three months ended April 30, 2022 and 2021
(Unaudited - expressed in U.S. dollars)
| Number of warrants | $ | |||||||
At October 31, 2021 | 22,999,894 | 82,109,334 | ||||||
Three months ended January 31, 2022 | ||||||||
Cash exercises | 9,578 | 22,370 | ||||||
Cashless exercises | 22,540,651 | 45,868,706 | ||||||
Redemptions | 449,665 | 44,967 | ||||||
Fair Value Gain on Warrants | 36,173,291 | |||||||
At January 31, 2022 | — | — | ||||||
At April 30, 2022 | — | — | ||||||
Warrants were
re-measured
through profit or loss at each period end, using first level inputs. As of January 31, 2022, the warrants are no longer publicly traded.13. | Share capital and share-based compensation |
Authorized share capital
Li-Cycle
Corp. is authorized to issue an unlimited number of voting common shares, Class Anon-voting
common shares, preference shares and Class A preferred shares, in each case without par value. All issued shares are fully paid.For retrospective presentation, the number of
Li-Cycle
Corp. common shares and Class A preferred shares on the condensed consolidated interim Statements of Changes in Equity have been scaled by the Business Combination exchange ratio of 1:39.91 for periods prior to the completion of the Business Combination on August 10, 2021.On November 13, 2020,
Li-Cycle
Corp. completed a Series C private placement with two entities to purchase 281,138 Class A preferred shares at a price of $81.81 per share, for total proceeds of $23,000,000 and incurred transaction fees of $1,380,000.On January 25, 2021,
Li-Cycle
Corp. issued 12,000 shares as full and final satisfaction of all obligations under a consulting agreement for services the Company received up to May 2020.For the three months ended July 31, 2021, employee stock options were exercised for a total of 25,664 common shares of
Li-Cycle
Corp., at an aggregate exercise price of $169,105.Li-Cycle
Holdings Corp. is authorized to issue an unlimited number of voting common shares without par value. All issued shares are fully paid.On August 10, 2021, the Company finalized the Business Combination described in Note 1. All outstanding common shares and Class A preferred shares of
Li-Cycle
Corp., 2,407,535 in total, were exchanged for 96,084,679 common shares ofLi-Cycle
Holdings Corp. at the exchange ratio of 1:39.91.Li-Cycle
Holdings Corp. issued an additional 65,671,374 common shares for net proceeds of $525,329,273. As part of this transaction, all outstanding 9,829 Restricted Share Units ofLi-Cycle
Corp. were settled by issuance of additional 392,276 common shares ofLi-Cycle
Holdings Corp. and a cashless exercise of 28,779 stock options ofLi-Cycle
Corp. resulted in the issuance of an additional 1,031,226 common shares ofLi-Cycle
Holdings Corp.For the three months ended October 31, 2021, warrant holders exercised 100 warrants for a total of 100 common shares of
Li-Cycle
Holdings Corp. at an aggregate exercise price of $1,150.F-15
Li-Cycle Holdings Corp.
Notes to the consolidated financial statements
Three months ended April 30, 2022 and 2021
(Unaudited - expressed in U.S. dollars)
For the three months ended January 31, 2022, warrant holders exercised 1,982 warrants for a total of 1,982 common shares of
Li-Cycle
Holdings Corp. at an aggregate exercise price of $22,793.During the warrant redemption period of December 27, 2021 to January 28, 2022, warrant holders exercised 7,596 warrants for 7,596 common shares of
Li-Cycle
Holdings Corp. at an aggregate exercise price of $87,354, and 22,540,651 warrants were surrendered by holders in the Make-Whole Exercise resulting in the issuance of 5,702,644 common shares ofLi-Cycle
Holdings Corp. at an aggregate share capital impact of 45,868,706.During the three months ended April 30, 2022, 222,505 stock options were exercised on a cashless basis, resulting in the issuance of 188,745 common shares of
Li-Cycle
Holdings Corp.Long-term incentive plans
Stock options
For stock options issued under the Company’s 2021 Long Term-Incentive Plan (“2021 LTIP”), each of the Company’s stock options converts into one common share of the Company on exercise. No amounts are paid or payable by the recipient on receipt of the option. The options carry neither rights to dividends nor voting rights. The vesting period is
one-third
on the first-year anniversary of the grant of the option, andone-third
every consecutive year thereafter. If an options remains unexercised after a period of 10 years from the date of grant, the option expires. Options are forfeited if the recipient terminates their contract with the Company before the options vest.A summary of stock option activities is as follows:
Number of Li-Cycle Holdings Corp. stock options | Weighted average exercise price of Li-Cycle Holdings Corp. stock options | |||||||
| $ | ||||||||
Balance – October 31, 2021 | 5,296,553 | 2.81 | ||||||
Granted | 719,718 | 7.86 | ||||||
Exercised | (222,505 | ) | 1.31 | |||||
Balance – April 30, 2022 | 5,793,766 | 3.50 | ||||||
As at April 30, 2022, 4,331,130 of the outstanding stock options (October 31, 2021: 4,242,707) were exercisable.
F-16
Li-Cycle Holdings Corp.
Notes to the consolidated financial statements
Three months ended April 30, 2022 and 2021
(Unaudited - expressed in U.S. dollars)
A summary of the outstanding stock options is as follows:
Number of stock options | Exercise price | |||||||
$ | ||||||||
Expiration dates | ||||||||
September 11, 2022 | 399,100 | 0.02 | ||||||
April 10, 2023 | 798,200 | 0.02 | ||||||
April 10, 2023 | 199,231 | 0.36 | ||||||
April 1, 2024 | 171,613 | 0.36 | ||||||
July 17, 2024 | 865,244 | 0.36 | ||||||
December 16, 2029 | 99,775 | 1.07 | ||||||
April 21, 2030 | 386,010 | 1.07 | ||||||
July 19, 2030 | 251,433 | 1.07 | ||||||
November 30, 2030 | 410,587 | 2.14 | ||||||
February 11, 2031 | 439,010 | 2.14 | ||||||
August 10, 2031 | 1,053,846 | 10.93 | ||||||
November 22, 2031 | 31,725 | 13.20 | ||||||
January 31, 2032 | 560,377 | 7.58 | ||||||
March 8, 2032 | 127,615 | 7.74 | ||||||
5,793,766 | ||||||||
The Company recognized total expenses of $1,259,205 and $4,136,896 related to stock options during the three and six months ended April 30, 2022, respectively (three and six months ended April 30, 2021: $263,215 and $404,443).
The fair value of the stock options granted during the three and six months ended April 30, 2022 was determined to be $616,362 and $3,528,169, respectively (three and six months ended April 30, 2021: $620,515 and $1,242,844) using the Black-Scholes Merton option pricing model. The assumptions used in the stock option pricing model for the grants during the six months ended April 30, 2022 were as follows:
Risk free interest rate | 1.44% - 1.83% | |
Expected life of options | 6 years | |
Expected dividend yield | 0.0% | |
Expected stock price volatility | 65% - 70% | |
Expected forfeiture rate | 0.0% |
Expected volatility was determined by calculating the average historical volatility of a group of listed entities that are considered similar in nature to the Company.
Restricted share units
Under the terms of the Company’s 2021 LTIP, restricted share units (“RSUs”) of
Li-Cycle
Holdings Corp. have been issued to executives, directors, employees and advisors. The RSU vesting periods ranged from several months to 3 years. The RSUs represent the right to receive common shares from the Company in an amount equal to the fair market value of an common share ofLi-Cycle
Holdings Corp. at the time of distribution. RSUs issued under the 2021 LTIP are expected to be settled in common shares. RSUs issued under the 2021 LTIP are classified as equity on the condensed consolidated interim statement of financial position.F-17
Li-Cycle Holdings Corp.
Notes to the consolidated financial statements
Three months ended April 30, 2022 and 2021
(Unaudited - expressed in U.S. dollars)
The Company recognized share-based compensation expense relating to RSUs totaling $3,218,150 and $5,539,268 in the three and six months ended April 30, 2022, respectively (three and six months ended April 30, 2021: NaN and $604,943).
A summary of RSU activities is as follows:
Number of | Weighted average | |||||||
Li-Cycle Holdings Corp RSUs | share price on grant date | |||||||
Balance – October 31, 2021 | 716,763 | $ | 10.93 | |||||
Granted | 1,493,675 | $ | 8.56 | |||||
Forfeited | (14,223 | ) | $ | 8.79 | ||||
Balance – April 30, 2022 | 2,196,215 | $ | 9.34 | |||||
As of April 30, 2022, 22,727 of outstanding RSUs had vested. RSUs granted in the three and six months ended April 30, 2022 vest over 1 to 3 years.
14. | Product sales revenue |
Three months ended | Three months ended | Six months ended | Six months ended | |||||||||||||
April 30, | April 30, | April 30, | April 30, | |||||||||||||
2022 | 2021 | 2022 | 2021 | |||||||||||||
$ | $ | $ | $ | |||||||||||||
Product revenue recognized in the period | 4,319,640 | 283,637 | 6,203,617 | 920,999 | ||||||||||||
Fair value pricing adjustments | 3,971,482 | (107,535 | ) | 5,709,952 | 167,969 | |||||||||||
Total product sales | 8,291,122 | 176,102 | 11,913,569 | 1,088,968 | ||||||||||||
The Company estimates the amount of consideration to which it expects to be entitled under provisional pricing arrangements. Product sales and the related trade accounts receivables are measured at fair value at initial recognition and are
re-estimated
at each reporting period end using the market prices of the constituent metals at the respective measurement dates. Changes in fair value are recognized as an adjustment to revenue and the related accounts receivable. The constituent metals that consideration is most sensitive to are Cobalt and Nickel. See note 16 for the impact of movements in the Cobalt and Nickel prices.15. | Non-Controlling Interest |
On January 26, 2022, the Company entered into a joint venture agreement with ECO STOR AS (“ECO STOR”) and Morrow Batteries AS (“Morrow”) to form
Li-Cycle
Norway AS which will construct a new commerciallithium-ion
battery recycling facility in southern Norway.Li-Cycle
is the majority owner ofLi-Cycle
Norway AS with 67% ownership, with ECO STOR and Morrow being minority owners and Nordic-headquartered strategic partners with 31% and 2% ownership, respectively. These holdings allow the shareholders to nominate 2 Directors, 1 Director, and 1 observer respectively with their ownership holdings.F-18
Li-Cycle Holdings Corp.
Notes to the consolidated financial statements
Three months ended April 30, 2022 and 2021
(Unaudited - expressed in U.S. dollars)
Summarized financial information for
Li-Cycle
Norway AS is as follows:April 30, 2022 | ||||
$ | ||||
Current assets | 1,000,000 | |||
Current liabilities | 71,739 | |||
Net assets | 928,261 | |||
Net assets attributable to non-controlling interest | 306,326 | |||
Three and six months ended April 30, 2022 | ||||
$ | ||||
Revenue | — | |||
Expenses | 71,739 | |||
Net loss | (71,739 | ) | ||
Net loss attributable to non-controlling interest | (23,674 | ) | ||
16. | Financial instruments and financial risk factors |
Fair values
The Company’s financial instruments consist of cash, accounts receivables, accounts payable and accrued liabilities, loans payable. The carrying amounts of cash, Harmonized Sales Taxes receivable, other receivables, accounts payable and accrued liabilities approximately fair value due to the short-term maturity of these instruments.
Fair value hierarchy levels 1 to 3 are based on the degree to which the fair value is observable:
| • | Level 1 fair value measurements are those derived from quoted prices (unadjusted) in active markets for identical assets or liabilities; |
| • | Level 2 fair value measurements are those derived from inputs other than quoted prices included within Level 1 that are observable for the asset or liability, either directly (i.e., as prices) or indirectly (i.e., derived from prices); and |
| • | Level 3 fair value measurements are those derived from valuation techniques that include inputs for the asset or liability that are not based on observable market data (unobservable inputs). |
There were no transfers between the levels during the current or prior year.
F-19
Li-Cycle Holdings Corp.
Notes to the consolidated financial statements
Three months ended April 30, 2022 and 2021
(Unaudited - expressed in U.S. dollars)
The Company’s financial assets measured at fair value on a recurring basis are measured under level 1 of the hierarchy and were calculated as follows:
| Balance | Level 2 | |||||||
| $ | $ | |||||||
As at April 30, 2022 | ||||||||
Accounts receivable | 11,501,265 | 11,501,265 | ||||||
| 11,501,265 | 11,501,265 | |||||||
As at October 31, 2021 | ||||||||
Accounts receivable | 4,072,701 | 4,072,701 | ||||||
| 4,072,701 | 4,072,701 | |||||||
See Note 3 above for additional details related to measurement of accounts receivable.
The Company’s financial liabilities measured at fair value on a recurring basis are measured under level 1 and 2 of the hierarchy and were calculated as follows:
| Balance | Level 1 | Level 2 | ||||||||||
| $ | $ | $ | ||||||||||
As at April 30, 2022 | ||||||||||||
Conversion feature of convertible debt (see Note 11) | 11,469,108 | — | 11,469,108 | |||||||||
| 11,469,108 | — | 11,469,108 | ||||||||||
As at October 31, 2021 | ||||||||||||
Conversion feature of convertible debt (see Note 11) | 29,028,938 | — | 29,028,938 | |||||||||
Warrants (see Note 12) | 82,109,334 | 53,549,989 | 28,559,344 | |||||||||
| 111,138,272 | 53,549,989 | 57,588,282 | ||||||||||
Currency risk
The Company is exposed to currency risk as its cash is mainly denominated in U.S. dollars, but its operations require Canadian dollars and other currencies, in addition to U.S. dollars.
At April 30, 2022, the Company had Canadian dollar denominated cash of approximately Cdn. $4,128,174 and Canadian dollar denominated net liabilities and loans payable of approximately Cdn. $24,778,777. The remaining amounts were denominated in U.S. dollars and immaterial amounts of other currencies. Gains and losses arising upon translation of these amounts into U.S. dollars for inclusion in the condensed consolidated interim financial statements are recorded in other income and expenses as foreign exchange. A 5% strengthening of the Canadian dollar versus the U.S. dollar, at April 30, 2022, would have increased the foreign exchange loss for the period by approximately $803,993 while a 5% weakening of the Canadian dollar would have had approximately the equal but opposite effect. This analysis assumes that all other variables remain constant.
F-20
Li-Cycle Holdings Corp.
Notes to the consolidated financial statements
Three months ended April 30, 2022 and 2021
(Unaudited - expressed in U.S. dollars)
Interest rate risk
Interest rate risk is the risk arising from the effect of changes in prevailing interest rates on the Company’s financial instruments. The Company is exposed to interest rate risk, as it has variable interest rate debt that includes an interest rate floor and cap, see Note 11.
Credit, liquidity, and market risks
Credit risks associated with cash are minimal as the Company deposits the majority of its cash with a large Canadian financial institution. The Company’s credit risks associated with receivables are managed and exposure to potential loss is assessed as minimal.
The Company is exposed to commodity price movements for the inventory it holds and the products it produces. Commodity price risk management activities are currently limited to monitoring market prices.
The following table sets out the Company’s exposure, as of April 30, 2022, in relation to the impact of movements in the Cobalt and Nickel price for the provisionally invoiced sales volume:
| Cobalt | Nickel | |||||||||||||||
April 30, 2022 | October 31, 2021 | April 30, 2022 | October 31, 2021 | |||||||||||||
$ | $ | $ | $ | |||||||||||||
Metric tonnes subject to fair value pricing adjustments | 2,595 | 1,728 | 2,595 | 1,728 | ||||||||||||
10% increase in prices | 681,592 | 303,351 | 1,024,667 | 448,266 | ||||||||||||
10 % decrease in prices | (681,592 | ) | (303,351 | ) | (1,024,667 | ) | (448,266 | ) | ||||||||
The Company’s revenue and accounts receivable primarily come from two key customers, as further disclosed in Note 3. The Company manages this risk by engaging with reputable multi-national corporations in stable jurisdictions and performing a review of a potential customer’s financial health prior to engaging in business.
Management has established an appropriate liquidity risk management framework for the management of the Company’s short-term, medium and long-term funding and liquidity requirements.
Capital risk management
The Company manages its capital to ensure that entities in the Company will be able to continue as a going concern while maximizing the return to shareholders through the optimization of the debt and equity balance.
The capital structure of the Company consists of net debt (borrowings after deducting cash and cash equivalents) and equity of the Company (comprising issued share capital, contributed surplus and accumulated deficit as disclosed in Note 13).
The Company is not subject to any externally imposed capital requirements.
17. | Commitments and contingencies |
As of April 30, 2022, there were $176,722,199 in committed purchase orders or agreements for equipment and services (October 31, 2021:$6,858,617).
F-21
Li-Cycle Holdings Corp.
Notes to the consolidated financial statements
Three months ended April 30, 2022 and 2021
(Unaudited - expressed in U.S. dollars)
Legal Proceedings
The Company is and may be subject to various claims and legal proceedings in the ordinary course of its business. Due to the inherent risks and uncertainties of the litigation process, we cannot predict the final outcome or timing of claims or legal proceedings. The Company records provisions for such claims when an outflow of resources is considered probable and a reliable estimate can be made. No such provisions have been recorded by the Company.
U.S. Shareholder Class Action
On April 19, 2022, a putative securities class action lawsuit was filed in the U.S. District Court for the Eastern District of New York against the Company, its CEO, and its former CFO, on behalf of a proposed class of purchasers of the Company’s publicly traded securities during the period from February 16, 2021 through March 23, 2022. The complaint, which is captioned as Barnish v.(E.D.N.Y.), asserts claims under Sections 10(b) and 20(a) of the U.S. Securities Exchange Act of 1934, and alleges that the defendants issued false and misleading statements concerning
Li-Cycle
Holdings Corp., et al.,1:22-cv-02222
Li-Cycle’s
business, which were revealed when Blue Orca Capital published a short seller report on March 24, 2022. The complaint seeks compensatory damages and an award of costs. The Company believes that the allegations in the proposed claim are without merit and intends to vigorously defend against this matter. No amounts have been recorded for any potential liability arising from this matter.18. | Earnings per share |
For comparability, the stated weighted average number of common shares and the number of potential common shares have been scaled by the Business Combination exchange ratio of 1:39.91 for periods prior to the completion of the business combination on August 10, 2021.
| Three months ended April 30, | Six months ended April 30, | |||||||||||||||
2022 | 2021 | 2022 | 2021 | |||||||||||||
Net profit (loss) | $ | (20,650,375 | ) | $ | (7,848,142 | ) | $ | 7,896,265 | $ | (14,693,465 | ) | |||||
Weighted average number of common shares | 168,971,679 | 95,060,429 | 166,365,628 | 94,254,557 | ||||||||||||
Effect of dilutive securities | ||||||||||||||||
Stock options | — | — | 3,840,066 | — | ||||||||||||
Restricted share units | — | — | 1,493,766 | — | ||||||||||||
Convertible debt | — | — | — | — | ||||||||||||
Warrants | — | — | 1,097 | — | ||||||||||||
Effect of dilutive securities | — | — | 5,334,929 | — | ||||||||||||
Dilutive number of shares | 168,971,679 | 95,060,429 | 171,700,557 | 94,254,557 | ||||||||||||
Basic earnings (loss) per share | $ | (0.12 | ) | $ | (0.08 | ) | $ | 0.05 | $ | (0.16 | ) | |||||
Diluted earnings (loss) per share | $ | (0.12 | ) | $ | (0.08 | ) | $ | 0.05 | $ | (0.16 | ) | |||||
Adjustments for diluted loss per share were not made for the three months ended April 30, 2022 and three and six months ended April 30, 2021 as they would be anti-dilutive in nature. The following table represents
F-22
Li-Cycle Holdings Corp.
Notes to the consolidated financial statements
Three months ended April 30, 2022 and 2021
(Unaudited - expressed in U.S. dollars)
instruments that could potentially dilute basic earnings per share in the future, but were not included in the calculation of diluted earnings per share because they are antidilutive for the periods presented:
April 30, | April 30, | |||||||
2022 | 2021 | |||||||
Stock options | 1,085,571 | 6,415,533 | ||||||
Convertible debt | 7,917,948 | — | ||||||
9,003,519 | 6,415,533 | |||||||
19. | Segment reporting |
The condensed consolidated interim financial data presented in these financial statements is reviewed regularly by the Company’s chief operating decision maker (“CODM”) for making strategic decisions, allocations resources and assessing performance. The Corporation’s CODM is its Chief Executive Officer.
During the three and six months ended April 30, 2022, the Company operated in Canada and the United States. Management has concluded that the customers, and the nature and method of distribution of goods and services delivered, if any, to these geographic regions are similar in nature. The risks and returns across the geographic regions are not dissimilar; therefore, the Company operates as a single operating segment.
The following is a summary of the Company’s geographical information:
| Canada | United States | Total | ||||||||||
| $ | $ | $ | ||||||||||
Revenues | ||||||||||||
Six months ended April 30, 2022 | 3,771,437 | 8,719,756 | 12,491,193 | |||||||||
Six months ended April 30, 2021 | 1,205,384 | 69,240 | 1,274,624 | |||||||||
Non-current assets | ||||||||||||
Six months ended April 30, 2022 | 14,894,897 | 87,903,817 | 102,798,714 | |||||||||
Year ended October 31, 2021 | 15,476,877 | 37,922,346 | 53,399,223 | |||||||||
The Company does not currently have active operations in any other geographical regions.
20. | Subsequent events |
On May 1, 2022, Spring Creek Capital, LLC assigned the KSP Note and the PIK Note (together, the “2021 Convertible Notes”) to an affiliate, Wood River Capital, LLC (“Wood River Capital”) and each of Spring Creek Capital and Wood River Capital signed a joinder agreement under which Wood River Capital agreed to become a party to, to be bound by and to comply with the KSP Note Purchase Agreement and related documents; provided, however, that such assignment did not relieve Spring Creek Capital of its obligations thereunder. This assignment does not change the previously agreed upon terms of the 2021 Convertible Notes.
On May 12, 2022, the Company announced the successful completion of the previously announced $50 million aggregate investment in common shares of the Company by LG Energy Solution, Ltd. (“LGES”) and LG Chem, Ltd. (“LGC”). The Company issued 5,300,352 shares at an average price of $9.43 per common shares to LGES and LGC (being 2,650,176 common shares each). The investment was split into two tranches: (i) an initial tranche of 4,416,960 common shares, in the aggregate, at a price of $10.00
F-23
Li-Cycle Holdings Corp.
Notes to the consolidated financial statements
Three months ended April 30, 2022 and 2021
(Unaudited - expressed in U.S. dollars)
per share (for an aggregate initial tranche subscription price of approximately $44.2 million), and (ii) a second tranche of 883,392 common shares, in the aggregate, at a price of $6.60 per share (for an aggregate second tranche subscription price of approximately $5.8 million).
On May 31, 2022, the Company entered into a Note Purchase Agreement (the “Glencore Note Purchase Agreement”) with Glencore Ltd. (“Glencore”), a subsidiary of Glencore plc (LON: GLEN) and issued a convertible note (the “Glencore Note”) for a principal amount of $200 million to Glencore. The Glencore Note will mature on May 31, 2027 unless earlier repurchased, redeemed or converted. Interest on the Glencore Note is payable semi-annually, and
Li-Cycle
is permitted to pay interest on the Glencore Note in cash or by paymentin-kind
(“PIK”), at its election. Interest payments made in cash are based on an interest rate of SOFR for a tenor comparable to the relevant interest payment period plus 0.42826% (the “Floating Rate”) plus 5% per annum if interest is paid in cash and plus 6% per annum if interest is paid in PIK. The Floating Rate has a floor of 1% and a cap of 2%. The obligations of the Company to make any payment on account of the principal of and interest on the Glencore Note are subordinate and junior in right of payment and upon liquidation to the Company’s obligations to the holders of all current and future senior indebtedness of the Company.The principal and accrued interest owing under the Glencore Note may be converted at any time by the holder into the Company’s common shares at a per share price equal to $9.95 (the “Conversion Price”), subject to adjustments. The Company may redeem the Glencore Note at any time by payment of an amount in cash equal to 100% of the outstanding principal amount of the Glencore Note and all accrued interest owing under the Glencore Note. In connection with any optional redemption and provided that the holder of the Glencore Note has not elected to convert the Glencore Note into common shares following receipt of notice of such optional redemption, the Company must issue warrants (the “Warrants”) to the holder of the Glencore Note on the optional redemption date that entitle the holder to acquire, until the maturity date of the Glencore Note, a number of common shares equal to the principal amount of the Glencore Note being redeemed divided by the then applicable Conversion Price. The initial exercise price of the Warrants will be equal to the Conversion Price as of the optional redemption date.
F-24
 | Deloitte LLP Bay Adelaide East 8 Adelaide Street West Suite 200 Toronto ON M5H 0A9 Canada Tel: 416-601-6150 Fax: 416-601-6151 www.deloitte.ca | |||||
Report of Independent Registered Public Accounting Firm
To the shareholders and the Board of Directors of Li-Cycle Holdings Corp.
Opinion on the Financial Statements
We have audited the accompanying consolidated statements of financial position of Li-Cycle Holdings Corp. and subsidiaries (the “Company”) as of October 31, 2021 and 2020, the related consolidated statements of loss and comprehensive loss, changes in equity, and cash flows, for each of the three years in the period ended October 31, 2021, and the related notes (collectively referred to as the “financial statements”). In our opinion, the financial statements present fairly, in all material respects, the financial position of the Company as of October 31, 2021 and 2020, and its financial performance and its cash flows for each of the three years in the period ended October 31, 2021, in conformity with International Financial Reporting Standards as issued by the International Accounting Standards Board.
Basis for Opinion
These financial statements are the responsibility of the Company’s management. Our responsibility is to express an opinion on the Company’s financial statements based on our audits. We are a public accounting firm registered with the Public Company Accounting Oversight Board (United States) (PCAOB) and are required to be independent with respect to the Company in accordance with the U.S. federal securities laws and the applicable rules and regulations of the Securities and Exchange Commission and the PCAOB.
We conducted our audits in accordance with the standards of the PCAOB. Those standards require that we plan and perform the audit to obtain reasonable assurance about whether the financial statements are free of material misstatement, whether due to error or fraud. The Company is not required to have, nor were we engaged to perform, an audit of its internal control over financial reporting. As part of our audits, we are required to obtain an understanding of internal control over financial reporting but not for the purpose of expressing an opinion on the effectiveness of the Company’s internal control over financial reporting. Accordingly, we express no such opinion.
Our audits included performing procedures to assess the risks of material misstatement of the financial statements, whether due to error or fraud, and performing procedures that respond to those risks. Such procedures included examining, on a test basis, evidence regarding the amounts and disclosures in the financial statements. Our audits also included evaluating the accounting principles used and significant estimates made by management, as well as evaluating the overall presentation of the financial statements. We believe that our audits provide a reasonable basis for our opinion.
/s/ Deloitte LLP
Chartered Professional Accountants
Licensed Public Accountants
Toronto, Canada
January 31, 2022
We have served as the Company’s auditor since 2019.
F-25
Li-Cycle
Holdings Corp.Consolidated statements of financial position
As at October 31, 2021 and 2020
(Expressed in U.S. dollars)
October 31, 2021 | October 31, 2020 | |||||||||||
| Notes | $ | $ | ||||||||||
Assets | ||||||||||||
Current assets | ||||||||||||
Cash and c ash equivalents | 23 | 596,858,298 | 663,557 | |||||||||
Accounts receivable | 4 | 4,072,701 | 571,300 | |||||||||
Other receivables | �� | 4 | 973,145 | 318,929 | ||||||||
Prepayments and deposits | 5 | 8,646,998 | 963,951 | |||||||||
Inventory | 6 | 1,197,807 | 179,994 | |||||||||
611,748,949 | 2,697,731 | |||||||||||
Non-current assets | ||||||||||||
Plant and equipment | 7 | 26,389,463 | 5,602,580 | |||||||||
Right-of-use | 14 | 27,009,760 | 3,859,088 | |||||||||
53,399,223 | 9,461,668 | |||||||||||
665,148,172 | 12,159,399 | |||||||||||
Liabilities | ||||||||||||
Current liabilities | ||||||||||||
Accounts payable and accrued liabilities | 17 | 18,701,116 | 4,364,372 | |||||||||
Restricted share units | 12 | — | 171,849 | |||||||||
Lease liabilities | 15 | 2,868,795 | 591,355 | |||||||||
Loans payable | 9 | 7,752 | 1,468,668 | |||||||||
21,577,663 | 6,596,244 | |||||||||||
Non-current liabilities | ||||||||||||
Lease liabilities | 15 | 26,496,074 | 3,021,815 | |||||||||
Loans payable | 9 | 31,996 | 779,210 | |||||||||
Convertible debt | 10 | 100,877,838 | — | |||||||||
Warrants | 11 | 82,109,334 | — | |||||||||
Restoration provisions | 16 | 334,233 | 321,400 | |||||||||
209,849,475 | 4,122,425 | |||||||||||
231,427,138 | 10,718,669 | |||||||||||
Shareholders’ equity | ||||||||||||
Share capital | 12 | 672,079,154 | 15,441,600 | |||||||||
Contributed surplus | 12 | 3,026,721 | 824,683 | |||||||||
Accumulated deficit | (241,088,229 | ) | (14,528,941 | ) | ||||||||
Accumulated other comprehensive loss | (296,612 | ) | (296,612 | ) | ||||||||
433,721,034 | 1,440,730 | |||||||||||
665,148,172 | 12,159,399 | |||||||||||
The accompanying notes are an integral part of the consolidated financial statements.
F-
2
6
Li-Cycle
Holdings Corp.Consolidated statements of loss and comprehensive loss
Years ended October 31, 2021, 2020, and 2019
(Expressed in U.S. dollars)
Year ended October 31, | ||||||||||||||
2021 | 2020 | 2019 | ||||||||||||
| Notes | $ | $ | $ | |||||||||||
Revenue | ||||||||||||||
Product sales | 6,930,475 | 554,914 | — | |||||||||||
Recycling services | 444,401 | 237,340 | 48,160 | |||||||||||
7,374,876 | 792,254 | 48,160 | ||||||||||||
Expenses | ||||||||||||||
Employee salaries and benefits, net | 12,709,823 | 2,819,195 | 607,820 | |||||||||||
Professional fees | 7,688,520 | 2,962,261 | 546,647 | |||||||||||
Share-based compensation | 12 | 3,982,943 | 332,634 | 97,258 | ||||||||||
Raw materials and supplies | 3,410,014 | 591,881 | — | |||||||||||
Office, administrative and travel | 3,148,871 | 476,733 | 493,304 | |||||||||||
Depreciation | 7,14 | 2,899,345 | 1,095,250 | 183,862 | ||||||||||
Research and development, net | 2,662,572 | 776,668 | 2,111,658 | |||||||||||
Freight and shipping | 1,033,149 | 137,010 | 5,785 | |||||||||||
Plant facilities | 1,030,947 | 390,687 | — | |||||||||||
Marketing | 973,695 | 365,820 | 65,840 | |||||||||||
Change in Finished Goods Inventory | (307,817 | ) | (14,022 | ) | — | |||||||||
39,232,062 | 9,934,117 | 4,112,174 | ||||||||||||
Loss from operations | (31,857,186 | ) | (9,141,863 | ) | (4,064,014 | ) | ||||||||
Other (income) expense | ||||||||||||||
Listing Fee | 1 | 152,719,009 | — | — | ||||||||||
Fair value loss on financial instruments | 10, 11, 12 | 38,254,469 | 84,454 | — | ||||||||||
Interest expense | 3,052,882 | 529,700 | 60,329 | |||||||||||
Foreign exchange (gain) loss | 758,223 | (445,652 | ) | — | ||||||||||
Interest income | (82,481 | ) | (34,403 | ) | (23,561 | ) | ||||||||
194,702,102 | 134,099 | 36,768 | ||||||||||||
Net loss | (226,559,288 | ) | (9,275,962 | ) | (4,100,782 | ) | ||||||||
Other comprehensive income (loss) | ||||||||||||||
Foreign currency translation | — | (218,726 | ) | (37,182 | ) | |||||||||
Comprehensive loss | (226,559,288 | ) | (9,494,688 | ) | (4,137,964 | ) | ||||||||
Loss per common share - basic and diluted | 19 | (2.06 | ) | (0.11 | ) | (0.06 | ) | |||||||
The accompanying notes are an integral part of the consolidated financial statements.
F-
2
7
Li-Cycle
Holdings Corp.Consolidated statements of changes in equity
For the years ended October 31, 2021, 2020, and 2019
(Expressed in U.S. dollars)
| Number of common shares | Share capital | Contributed surplus | Accumulated deficit | Accumulated other comprehensive income (loss) | Total | |||||||||||||||||||||||
| Notes | $ | $ | $ | $ | $ | |||||||||||||||||||||||
Balance, October 31, 2018 | 70,825,919 | 2,969,191 | 26,523 | (1,152,197 | ) | (40,704 | ) | 1,802,813 | ||||||||||||||||||||
Stock option expense | 12 | — | — | 97,258 | — | 97,258 | ||||||||||||||||||||||
Shares issued for cash | 12 | 5,303,760 | 5,379,860 | — | — | 5,379,860 | ||||||||||||||||||||||
Shares issuable for non-cash costs | 12 | 337,958 | 118,759 | — | — | 118,759 | ||||||||||||||||||||||
Comprehensive loss | — | — | — | (4,100,782 | ) | (37,182 | ) | (4,137,964 | ) | |||||||||||||||||||
Balance, October 31, 2019 | 76,467,637 | 8,467,810 | 123,781 | (5,252,979 | ) | (77,886 | ) | 3,260,726 | ||||||||||||||||||||
Stock option expense | 12 | — | — | 245,847 | — | — | 245,847 | |||||||||||||||||||||
Shares issued for cash | 12 | 6,357,423 | 6,481,381 | — | — | — | 6,481,381 | |||||||||||||||||||||
Shares issuable for non-cash costs | 12 | — | — | 455,055 | — | — | 455,055 | |||||||||||||||||||||
Conversion of convertible debt | 12 | 536,231 | 492,409 | — | — | — | 492,409 | |||||||||||||||||||||
Comprehensive loss | — | — | — | (9,275,962 | ) | (218,726 | ) | (9,494,688 | ) | |||||||||||||||||||
Balance, October 31, 2020 | 83,361,291 | 15,441,600 | 824,683 | (14,528,941 | ) | (296,612 | ) | 1,440,730 | ||||||||||||||||||||
Series C Class A shares issued for cash | 12 | 11,220,218 | 21,620,000 | — | — | — | 21,620,000 | |||||||||||||||||||||
Shares issued for non-cash costs | 12 | 478,920 | 455,055 | (455,055 | ) | — | — | — | ||||||||||||||||||||
Exercise of stock options | 12 | 2,055,476 | 891,162 | (722,057 | ) | — | — | 169,105 | ||||||||||||||||||||
Restricted Share Units settled in shares | 12 | 392,276 | 3,922,754 | — | — | — | 3,922,754 | |||||||||||||||||||||
Public shares issued for cash | 12 | 65,671,374 | 629,748,295 | — | — | — | 629,748,295 | |||||||||||||||||||||
Exercise of warrants | 11 | 100 | 288 | 1,150 | 1,438 | |||||||||||||||||||||||
Stock option expense | 12 | — | — | 2,689,913 | — | — | 2,689,913 | |||||||||||||||||||||
Restricted Share Units expense | 12 | — | — | 688,087 | — | — | 688,087 | |||||||||||||||||||||
Comprehensive loss | — | — | — | (226,559,288 | ) | — | (226,559,288 | ) | ||||||||||||||||||||
Balance, October 31, 2021 | 163,179,655 | 672,079,154 | 3,026,721 | (241,088,229 | ) | (296,612 | ) | 433,721,034 | ||||||||||||||||||||
The accompanying notes are an integral part of the consolidated financial statements.
F-
2
8
Li-Cycle
Holdings Corp.Consolidated statements of cash flows
Years ended October 31, 2021, 2020, and 2019
(Expressed in U.S. dollars)
| Year ended October 31, | ||||||||||||||||
2021 | 2020 | 2019 | ||||||||||||||
| Notes | $ | $ | $ | |||||||||||||
Operating activities | ||||||||||||||||
Net loss for the year | (226,559,288 | ) | (9,275,962 | ) | (4,100,782 | ) | ||||||||||
Items not affecting cash | ||||||||||||||||
Share-based compensation | 12 | 3,982,943 | 332,634 | 97,258 | ||||||||||||
Listing fee | 152,719,009 | — | — | |||||||||||||
Depreciation | 7,14 | 2,899,350 | 1,095,250 | 183,862 | ||||||||||||
Amortization of government grants | (92,926 | ) | (2,226,910 | ) | (640,350 | ) | ||||||||||
Loss on disposal of assets | 13,399 | 106,946 | — | |||||||||||||
Foreign exchange (gain) loss on translation | 677,479 | (390,901 | ) | (33,845 | ) | |||||||||||
Fair value loss on financial instruments | 10,11,12 | 38,254,469 | 84,454 | — | ||||||||||||
Share-based professional fees | 12 | — | 455,055 | — | ||||||||||||
Interest and accretion on convertible debt | 10 | 1,129,680 | 9,931 | 60,337 | ||||||||||||
(26,975,885 | ) | (9,809,503 | ) | (4,433,520 | ) | |||||||||||
Changes in non-cash working capital items | ||||||||||||||||
Accounts receivable | (3,501,401 | ) | (538,854 | ) | (29,630 | ) | ||||||||||
Other receivables | (654,216 | ) | 471,304 | (466,915 | ) | |||||||||||
Prepayments and deposits | (7,990,108 | ) | (633,824 | ) | (215,537 | ) | ||||||||||
Inventory | (1,017,813 | ) | (133,438 | ) | (46,556 | ) | ||||||||||
Accounts payable and accrued liabilities | 12,262,063 | 3,215,386 | 624,090 | |||||||||||||
(27,877,360 | ) | (7,428,929 | ) | (4,568,068 | ) | |||||||||||
Investing activity | ||||||||||||||||
Purchases of plant and equipment | 7 | (18,220,339 | ) | (5,107,663 | ) | (998,069 | ) | |||||||||
Proceeds from disposal of plant and equipment | 16,866 | — | — | |||||||||||||
(18,203,473 | ) | (5,107,663 | ) | (998,069 | ) | |||||||||||
Financing activities | ||||||||||||||||
Proceeds from private share issuance, net of share issue costs | 12 | 21,620,000 | 6,481,381 | 5,379,860 | ||||||||||||
Proceeds from public share issuance, net of share issue costs | 12 | 525,329,273 | — | — | ||||||||||||
Proceeds from exercise of stock options | 12 | 169,105 | — | — | ||||||||||||
Proceeds from exercise of warrants | 11 | 1,150 | ||||||||||||||
Proceeds from convertible debt | 10 | 98,400,263 | — | — | ||||||||||||
Proceeds from loans payable | 9 | 10,091,220 | 2,153,110 | 86,572 | ||||||||||||
Proceeds from government grants | 92,926 | 1,182,599 | 1,697,794 | |||||||||||||
Repayment of lease liabilities | (884,024 | ) | (387,508 | ) | — | |||||||||||
Repayment of loans payable | (12,544,339 | ) | (12,881 | ) | — | |||||||||||
642,275,574 | 9,416,701 | 7,164,226 | ||||||||||||||
Net change in cash and cash equivalents | 596,194,741 | (3,119,891 | ) | 1,598,089 | ||||||||||||
Cash and cash equivalents, beginning of period | 663,557 | 3,783,449 | 2,185,360 | |||||||||||||
Cash and cash equivalents, end of period | 596,858,298 | 663,557 | 3,783,449 | |||||||||||||
Non-cash investing activities | ||||||||||||||||
Accrual for purchase of plant and equipment | 2,074,681 | — | — | |||||||||||||
Non cash purchase of plant and equipment | 2,084,235 | — | — | |||||||||||||
Non-cash financing activities | ||||||||||||||||
Equity issued for non-cash costs | — | 947,464 | 118,759 | |||||||||||||
The accompanying notes are an integral part of the consolidated financial statements.
F-
29
Li-Cycle
Holdings Corp.Notes to the consolidated financial statements
Year ended October 31, 2021, 2020, and 2019
(Expressed in U.S. dollars)
1. | Nature of operations and business combination |
| (i) | Nature of Operations |
Li-Cycle
Holdings Corp. and its subsidiaries, collectively(“Li-Cycle”
or the “Company”) started their business asLi-Cycle
Corp.Li-Cycle
Corp was incorporated in Ontario, Canada under theBusiness Corporations Act
on November 18, 2016.
Li-Cycle’s
core business model is to build, own and operate recycling plants tailored to regional needs.Li-Cycle’s
Spoke & Hub Technologies™
lithium-ion
battery recycling challenges, supporting the global transition toward electrification.On March 28, 2019,
Li-Cycle
Corp. incorporated a owned subsidiary in Delaware, U.S.,Li-Cycle
Inc., under theGeneral Corporation Law of the State of Delaware.
On September 2, 2020,.
Li-Cycle
Corp. incorporated a owned subsidiary in Delaware, U.S.,Li-Cycle
North America Hub, Inc., under theGeneral Corporation Law of the State of Delaware
| (ii) | Business Combination |
On February 12, 2021,(Ontario).
Li-Cycle
Corp. incorporated a 100% owned subsidiary in Ontario, Canada,Li-Cycle
Holdings Corp., under theBusiness Corporations Act
On February 16, 2021,
Li-Cycle
Corp. entered into a definitive business combination agreement with Peridot Acquisition Corp. (NYSE: PDAC) andLi-Cycle
Holdings Corp.On August 10, 2021, in accordance with the plan of arrangement to reorganize
Li-Cycle
Corp., the Company finalized the business combination with Peridot Acquisition Corp. (NYSE: PDAC), and the combined company was renamedLi-Cycle
Holdings Corp.As part of this transaction, a total of 3,377,626 Class A shares of Peridot Acquisition Corp. were redeemed by Peridot shareholders, resulting in a total redemption payment of approximately $33.8 million, while the remaining 26,622,374 of Class A shares were converted into common shares of the combined entity,
Li-Cycle
Holdings Corp. In addition, 7,500,000Class B shares of Peridot Acquisition Corp were converted
into 7,500,000common shares of the combined entity, Li-Cycle Holdings Corp. upon closing.
Li-Cycle
Corp.’s existing shareholders exchanged 2,552,450 fully diluted shares ofLi-Cycle
Corp. for the shares of the combined entity,Li-Cycle
Holdings Corp., at an Exchange Ratio of approximately 1:39.91, as determined per the Plan of Arrangement, resulting in 97,508,181 shares ofLi-Cycle
Holdings Corp. and 4,242,707 stock options ofLi-Cycle
Holdings Corp. for the existing shareholders ofLi-Cycle
Corp.31,549,000 shares of the combined entity,
Li-Cycle
Holdings Corp., were issued to the new investors at US$10 per share for a total of US$315.5 million of Private Investment in Public Equity.On closing, the common shares and warrants of
Li-Cycle
Holdings Corp. were listed on the New York Stock Exchange and are traded under the symbols “LICY” and “LICY.WS”, respectively.Li-Cycle
Corp. has been identified as the acquirer for accounting purposes. As Peridot Acquisition Corp. does not meet the definition of a business as defined in IFRS 3—Business Combinations (“IFRS 3”), the acquisition is not within the scope of IFRS 3 and is accounted for as a share-based payment transaction in accordance with IFRS 2 – Share-based Payment (“IFRS 2”). These consolidatedF-
3
0
Li-Cycle
Holdings Corp.Notes to the consolidated financial statements
Year ended October 31, 2021, 2020, and 2019
(Expressed in U.S. dollars)
financial statements represent the continuance of
Li-Cycle
Corp. and reflect the identifiable assets acquired and the liabilities assumed of Peridot Acquisition Corp. at fair value. Under IFRS 2, the transaction was measured at the fair value of the common shares, escrowed shares and warrants deemed to have been issued byLi-Cycle
Corp., in order for the ownership interest in the combined entity to be the same as if the transaction had taken the legal form ofLi-Cycle
Corp. acquiring 100% of Peridot Acquisition Corp. Any difference between the fair value of the common shares, escrowed shares and warrants deemed to have been issued byLi-Cycle
Corp. and the fair value of Peridot Acquisition Corp.’s identifiable net assets acquired and liabilities assumed represents a Listing Fee.The fair value of the warrants assumed in the transaction was determined based on the market closing price
of $2.10 per warrant resulting in total fair value of $48.3 million.
As a result of this reverse asset acquisition, a Listing Fee of $152.7 million has been recorded to reflect the difference between the estimated fair value of the common shares, escrowed shares and warrants deemed issued to the shareholders of Peridot Acquisition Corp. and the net fair value of the assets of Peridot Acquisition Corp. acquired.
Li-Cycle
and Peridot incurred transaction-related costs of $27.0 million and $29.6 million, respectively.Li-Cycle’s
transaction-related costs, such as commissions, professional fees and regulatory fees are directly attributable to common shares issuances and were deducted from the proceeds of the offering.The details of the purchase price allocation of the identifiable assets acquired and liabilities assumed are as follows:
2021 | ||||
$ | ||||
Fair value of consideration transferred: | ||||
Common shares | 656,713,740 | |||
Total fair value of consideration transferred | 656,713,740 | |||
Fair value of assets acquired and liabilities assumed: | ||||
Cash and cash equivalents | 581,862,621 | |||
Warrants | (48,299,987 | ) | ||
Other payables | (29,567,903 | ) | ||
Total fair value of assets acquired and liabilities assumed | 503,994,731 | |||
Excess of fair value of consideration transferred over fair value of assets acquired and liabilities assumed, recognized as Listing Fee | 152,719,009 | |||
Gross proceeds | 581,862,621 | |||
Transaction-related costs | (26,965,445 | ) | ||
Other payables acquired | (29,567,903 | ) | ||
Net proceeds | 525,329,273 | |||
The fair value of the consideration transferred to acquire Peridot Acquisition Corp. and to issue shares to the PIPE investors was
$656,713,740 calculated as 65,671,374 common shares at $10.00 per common share.
The fair value per common share was based on the fair value of
Li-Cycle
Corp. common shares.F-
3
1
Li-Cycle
Holdings Corp.Notes to the consolidated financial statements
Year ended October 31, 2021, 2020, and 2019
(Expressed in U.S. dollars)
As a result of the closing of this transaction, 163,179,555 common shares of the Company were issued and outstanding immediately after the closing. At October 31, 2021, 163,179,655 common shares were outstanding.
2. | Significant accounting policies |
(a) | Statement of compliance |
These consolidated financial statements have been prepared in accordance with International Financial Reporting Standards (“IFRS”) as issued by the International Accounting Standards Board (“IASB”) incorporating interpretations issued by the IFRS Interpretations Committee (“IFRICs”). These consolidated financial statements were approved and authorized for issue by the Board of Directors on January
31
, 2022.(b) | Basis of consolidation |
These consolidated financial statements include the accounts of the Company and its subsidiaries. The Company’s seven subsidiaries are entities controlled by the Company. Control exists when the Company has power over an investee, when the Company is exposed, or has rights, to variable returns from the investee and when the Company has the ability to affect those returns through its power over the investee. The subsidiaries are included in the consolidated financial results of the Company from the effective date of incorporation up to the effective date of disposition or loss of control. The Company’s principal subsidiaries and their geographic location as at October 31, 2021 was as follows:
Company | Location | Ownership interest | ||||
Li-Cycle U.S. Holdings Inc. | Delaware, U.S. | 100 | % | |||
Li-Cycle Inc. | Delaware, U.S. | 100 | % | |||
Li-Cycle North America Hub, Inc. | Delaware, U.S. | 100 | % | |||
Li-Cycle Americas Corp. | Ontario, Canada | 100 | % | |||
Li-Cycle Corp. | Ontario, Canada | 100 | % | |||
Li-Cycle Europe AG | Switzerland | 100 | % | |||
Li-Cycle APAC PTE LTD. | Singapore | 100 | % | |||
Intercompany transactions, balances and unrealized gains/losses on transactions between the Company and its subsidiary are eliminated.
(c) | Basis of preparation |
Change in Functional Currency: Prior to November 1, 2020, the Company had determined its functional currency was the Canadian dollar on the basis that its operating expenditures, capital expenditures and financing were primarily denominated in Canadian dollars. With increasing volume of operations, new contracts with US based suppliers, commencement of operations at its US Spoke and increasing capital expenditures in its US facilities, the Company’s operating expenditures are becoming predominantly denominated in US dollars. Additionally, due to the increase in US dollar expenses and its expansion plans in the US, the Company has obtained, and plans to continue to seek, financing in US dollars. As a result of the increasing activities in US dollars, the Company changed its functional currency to the U.S. dollar, effective November 1, 2020.
F-
3
2
Li-Cycle
Holdings Corp.Notes to the consolidated financial statements
Year ended October 31, 2021, 2020, and 2019
(Expressed in U.S. dollars)
Accordingly, the Company transitioned its functional and presentation currency to U.S. dollars. Transactions in currencies other than the U.S. dollar are recorded at the exchange rates on the dates of transactions. At the end of each reporting period, monetary assets and liabilities that are denominated in foreign currencies are translated at the closing rate on that date.
Comparative financial information was translated from Canadian dollars into U.S. dollars in accordance with IAS 21 The Effects of Changes in Foreign Exchange Rates:
| (i) | Assets and liabilities were translated at the closing rate at end of each reporting period; |
| (ii) | Items recognized in the statement of loss and comprehensive loss were translated at the exchange rate at the time of transaction; |
| (iii) | Equity items have been translated using the historical rate at the time of transaction; |
| (iv) | All resulting exchange differences were recognized in other comprehensive loss. |
(d) | Cash and cash equivalents |
Cash consists of cash deposits with financial institutions. Cash equivalents consists of overnight guaranteed investment certificates with financial institutions.
(e) | Inventories |
Raw materials and finished goods are valued at the lower of cost and net realizable value. Cost is determined on a weighted average basis. The cost of finished goods includes the cost of raw materials and the applicable share of the cost of labour and fixed and variable production overheads. Net realizable value is the estimated selling price less the estimated cost of completion and the estimated costs necessary to make the sale. Costs of idle plant operations are expensed.
At each reporting period, the Company assesses the net realizable value of inventory taking into account current market prices, current economic trends, sales trends and past experiences.
(f) | Convertible debt instruments |
The components of convertible debt instruments issued by the Company are classified separately as financial liabilities and equity in accordance with the substance of the contractual arrangements and the definitions of a financial liability and an equity instrument. The debt element of the instruments is classified as a liability and recorded as the present value of the Company’s obligation to make future interest payments in cash and settle the redemption value of the instrument in cash. The carrying value of the debt element is accreted to the original face value of the instruments, over their life, using the effective interest method. If the conversion option is classified as equity, its value is determined by deducting the amount of the liability component from the fair value of the compound instrument as a whole. If the conversion option is classified as a liability and requires bifurcation, it is bifurcated as an embedded derivative unless the issuer elects to apply the fair value option to the convertible debt. The embedded derivative liability is initially recognized at fair value and classified as derivatives in the statement of financial position. Changes in the fair value of the embedded derivative liability are subsequently accounted for directly through the income statement.
F-
3
3
Li-Cycle
Holdings Corp.Notes to the consolidated financial statements
Year ended October 31, 2021, 2020, and 2019
(Expressed in U.S. dollars)
(g) | Loss per share |
The Company calculated basic and diluted loss per share data for its common shares, calculated by dividing the loss attributable to common shareholders of the Company by the weighted average number of common shares outstanding during the period. Diluted loss per share is based on the weighted average number of common shares, stock options and restricted share units (“RSUs”) outstanding at the beginning of or granted during the period, and shares to be issued upon conversion of a convertible instrument, calculated using the treasury stock method. Under this method, the proceeds from the exercise of the options are assumed to be used to repurchase the Company’s shares. The difference between the number of shares assumed purchased and the number of options assumed exercised is added to the actual number of shares outstanding to determine diluted shares outstanding for purposes of calculating diluted earnings per share. Diluted loss per share does not adjust the loss attributable to common shareholders or the weighted average number of common shares outstanding when the effect is anti-dilutive.
(h) | Plant and equipment |
Plant and equipment are stated at cost less accumulated depreciation and accumulated impairment losses net of any reversals of impairment.
Where parts of an item of plant and equipment have different useful lives, they are accounted for as separate items of plant and equipment.
Depreciation is charged to the consolidated statement of loss and comprehensive loss on a straight-line basis over the estimated useful lives of each part of an item of plant and equipment. The estimated useful lives are reviewed each reporting period and any changes are accounted for on a prospective basis. The estimated useful lives are as follows:
Computers | 3 years | |
Vehicles | 5 years | |
Plant equipment | 5 years | |
Storage containers | 10 years | |
Leasehold improvements | Shorter of term of lease or estimated useful life |
Repairs and maintenance costs are expensed as incurred.
(i) | Financial instruments |
Recognition
The Company recognizes financial assets or financial liabilities on the consolidated statement of financial position when it becomes party to the contractual provisions of the financial instrument. Financial assets are initially measured at fair value and derecognized either when the Company has transferred substantially all the risks and rewards of ownership of the financial asset, or when cash flows expire. Financial liabilities are initially measured at fair value and are derecognized when the obligations specified in the contract is discharged, cancelled or expired.
A
write-off
of a financial asset (or a portion thereof) constitutes a derecognition event.Write
-off
occurs when the Company has no reasonable expectations of recovering the contractual cash flows on a financial asset.F-
3
4
Li-Cycle
Holdings Corp.Notes to the consolidated financial statements
Year ended October 31, 2021, 2020, and 2019
(Expressed in U.S. dollars)
Classification and measurement
The Company determines the classification of its financial instruments at initial recognition. Financial assets and financial liabilities are classified according to the following measurement categories:
| (i) | those to be measured subsequently at fair value, either through profit or loss (“FVTPL”) or through other comprehensive income (“FVTOCI”); and |
| (ii) | those to be measured subsequently at amortized cost. |
The classification and measurement of financial assets after initial recognition at fair value depends on the business model for managing the financial asset and the contractual terms of the cash flows. Financial assets that are held within a business model whose objective is to collect the contractual cash flows, and that have contractual cash flows that are solely payments of principal and interest on the principal outstanding, are generally measured at amortized cost at each subsequent reporting period. Derivative financial instruments are comprised of the embedded derivative liability representing the conversion option of the convertible debt. The embedded derivative liability is measured at fair value at each reporting date. The embedded derivative liability has been classified asIt is classified as
held-for-trading.
non-current
based on the contractual terms specific to the instrument. Gains and losses onre-measurement
of the embedded derivative liability are recognized in the consolidated statements of loss and comprehensive loss. All other financial assets are measured at their fair values at each subsequent reporting period, with any changes recorded through profit and loss or through other comprehensive income (which designation is made as an irrevocable election at the time of recognition).After initial recognition at fair value, financial liabilities are classified and measured at either:
| (i) | amortized cost; |
| (ii) | FVTPL, if the Company has made an irrevocable election at the time of recognition, or when required (for items such as instruments held for trading or derivatives); or, |
| (iii) | FVTOCI, when the change in fair market value is attributable to changes in the Company’s credit risk. |
The classification and measurement basis of the Company’s financial instruments are as follows:
Financial Instrument | Measurement | |
Cash and cash equivalents | Amortized cost | |
Trade accounts receivables | FVTPL | |
Other accounts receivables | Amortized cost | |
Accounts payable and accrued liabilities | Amortized cost | |
Restricted share units | FVTPL | |
Warrants | FVTPL | |
Loans payable | Amortized cost | |
Lease liabilities | Amortized cost | |
Convertible debt | Amortized cost | |
Conversion feature of convertible debt | FVTPL | |
The Company reclassifies financial assets when and only when its business model for managing those assets changes. Financial liabilities are not reclassified.
F-
3
5
Li-Cycle
Holdings Corp.Notes to the consolidated financial statements
Year ended October 31, 2021, 2020, and 2019
(Expressed in U.S. dollars)
Transaction
costs
that are directly attributable to the acquisition or issuance of a financial asset or financial liability classified as subsequently measured at amortized cost are included in the fair value of the instrument on initial recognition. Transaction costs for financial assets and financial liabilities classified at fair value through profit or loss are expensed in profit or loss.Impairment
The Company assesses all information available, including on a forward-looking basis the expected credit loss associated with any financial assets carried at amortized cost. The impairment methodology applied depends on whether there has been a significant increase in credit risk. To assess whether there has been a significant increase in credit risk, the Company compares the risk of default occurring on the asset as at the reporting date with the risk of default as at the date of initial recognition based on all information available, and reasonable supportive forward-looking information.
(j) | Foreign currencies |
The reporting and functional currency of the Company is the U.S. dollar. Transactions in currencies other than the U.S. dollar are recorded at the rates of exchange prevailing on the dates of transactions. At the end of each reporting period, monetary assets and liabilities that are denominated in foreign currencies are translated at the rates prevailing at that date.
(k) | Government assistance and investment tax credits |
Government grants
Amounts received or receivable resulting from government assistance programs are recognized when there is reasonable assurance that the amount of government assistance will be received, and all attached conditions will be complied with. When the amount relates to an expense item, it is recognized as a reduction to the related expense. When the amount relates to an asset, it reduces the carrying amount of the asset and is then recognized as income over the useful life of the depreciable asset by way of a reduced depreciation charge. Grants received in advance are recorded as deferred liability and amortized as a reduction to the related expense/carrying amount of asset as and when the related qualifying costs are incurred.
Investment Tax Credits (“ITCs”) receivable are amounts refundable from the Canadian federal and provincial governments under the Scientific Research & Experimental Development incentive program. The amounts claimed under the program represent the amounts submitted by management based on research and development costs paid during the period and include estimates and assumptions made by management in determining the eligible expenditures. ITCs are netted against the related research and development expense when there is reasonable assurance that the Company will realize the ITCs. ITCs are subject to review and approval by tax authorities and, therefore, could be different from the amounts recorded.
(l) | Impairment of long-term non-financial assets |
At the end of each reporting period the carrying amounts of the Company’s assets are reviewed to determine whether there is any indication that those assets are impaired. If any such indication exists, the recoverable amount of the asset is estimated in order to determine the extent of the impairment, if
F-
3
6
Li-Cycle
Holdings Corp.Notes to the consolidated financial statements
Year ended October 31, 2021, 2020, and 2019
(Expressed in U.S. dollars)
any. The recoverable amount is the higher of fair value less costs to sell and value in use. In assessing value in use, the estimated future cash flows are discounted to their present value using a
pre-tax
discount rate that reflects current market assessments of the time value of money and the risks specific to the asset.If the recoverable amount of an asset is estimated to be less than its carrying amount, the carrying amount of the asset is reduced to its recoverable amount and the impairment loss is recognized in period. For an asset that does not generate largely independent cash inflows, the recoverable amount is determined for the cash generating unit to which the asset belongs.
(m) | Income taxes |
Income tax expense is comprised of current and deferred tax components. Income tax is recognized in profit or loss except to the extent that it relates to items recognized directly in equity or other comprehensive income, in which case the related tax is recognized in equity or other comprehensive income.
Current tax expense is the expected tax payable on the taxable income for the year, using tax rates enacted or substantively enacted at year end, adjusted for amendments to tax payable with regards to previous years.
Deferred tax is recorded using the asset and liability method. Under this method, the Company calculates all temporary differences between the tax bases of assets and liabilities and their carrying amounts for financial reporting purposes at the period end date. Deferred tax is calculated based on the expected manner of realization or settlement of the carrying amount of assets and liabilities, using tax rates that are expected to apply to the year of realization or settlement based on tax rates and laws enacted or substantively enacted at the period end date.
Deferred tax assets are recognized to the extent that it is probable that taxable profits will be available against which the deductible temporary differences and unused tax losses and tax credits can be utilized. The carrying amount of deferred tax assets is reviewed at each statement of the financial position date and reduced to the extent that it is no longer probable that sufficient taxable profits will be available to allow all or part of the asset to be recovered.
Deferred tax assets and liabilities are offset when there is a legally enforceable right to set off current tax assets against current tax liabilities and when they relate to income taxes levied by the same taxation authority and the Company intends to settle its current tax assets and liabilities on a net basis.
(n) | Provisions |
Provisions represent liabilities of the Company for which the amount or timing is uncertain. A provision is recognized when, as a result of a past event, the Company has a present obligation (legal or constructive) that can be estimated reliably, and it is probable that an outflow of economic benefits will be required to settle the obligation. Where appropriate, the future cash flow estimates are adjusted to reflect risks specific to the liability. The amount recognized as a provision is the best estimate of the consideration required to settle the present obligation at the statement of financial position date, considering the risks and uncertainties surrounding the obligation. Where a provision is measured using the cash flows estimated to settle the present obligation, its carrying amount is the present value of those cash flows. When some or all of the economic benefits required to settle a provision are expected
F
-
3
7
Li-Cycle
Holdings Corp.Notes to the consolidated financial statements
Year ended October 31, 2021, 2020, and 2019
(Expressed in U.S. dollars)
to be recovered from a third party, the receivable is recognized as an asset if it is virtually certain that reimbursement will be received, and the amount receivable can be measured reliably.
(o) | Related party transactions |
Parties are considered to be related if one party has the ability, directly or indirectly, to control the other party or exercise significant influence over the other party in making financial and operating decisions. Parties are also considered to be related if they are subject to common control or common significant influence. Related parties may be individuals or corporate entities. A transaction is considered to be a related party transaction when there is a transfer of resources or obligations between related parties.
(p) | Research and development expense |
Research costs are expensed as incurred. An internally-generated intangible asset arising from development (or from the development phase of an internal project) is recognised if, and only if, all of the following conditions have been demonstrated:
| • | the technical feasibility of completing the intangible asset so that it will be available for use or sale; |
| • | the intention to complete the intangible asset and use or sell it; |
| • | the ability to use or sell the intangible asset; |
| • | how the intangible asset will generate probable future economic benefits; |
| • | the availability of adequate technical, financial and other resources to complete the development and to use or sell the intangible asset; and |
| • | the ability to measure reliably the expenditure attributable to the intangible asset during its development. |
The amount initially recognised for internally-generated intangible assets is the sum of the expenditure incurred from the date when the intangible asset first meets the recognition criteria listed above. Where no internally generated intangible asset can be recognised, development expenditure is recognised in profit or loss in the period in which it is incurred.
Subsequent to initial recognition, internally-generated intangible assets are reported at cost less accumulated amortisation and accumulated impairment losses, on the same basis as intangible assets that are acquired separately.
No development costs have been capitalized to date.
(q) | Revenue recognition |
The Company’s principal activities generate revenues from the operation of
lithium-ion
battery recycling plants. The Company uses the following five step approach to revenue recognition:Step 1: Identify the contract(s) with a customer
Step 2: Identify the performance obligations in the contract
F-
3
8
Li-Cycle
Holdings Corp.Notes to the consolidated financial statements
Year ended October 31, 2021, 2020, and 2019
(Expressed in U.S. dollars)
Step 3: Determine the transaction price
Step 4: Allocate the transaction price to the performance obligations in the contract
Step 5: Recognize revenue when (or as) the entity satisfies a performance obligation
The Company recognizes revenue from the following major sources:
| • | Services of recycling lithium-ion batteries which includes coordination of logistics and destruction of batteries |
| • | Sales of products which includes black mass, shredded metal and plastic |
Revenue is measured based on the consideration to which the Company expects to be entitled to in a contract with a customer. The Company recognizes revenue when it transfers control of a product or service to a customer. There are no significant financing components associated with the Company’s payment terms.
Recycling Services revenue is recognized at a point in time upon completion of the services. Prices for services are separately identifiable within each contract. A receivable is recognized by the Company when the services are completed as this represents the point in time at which the right to consideration becomes unconditional, as only the passage of time is required before payment is due.
For sale of products, revenue is recognized when control of the goods has transferred, being when the goods have been shipped to the customer’s location (delivery). A receivable is recognised by the Company when the goods are delivered to the customer as this represents the point in time at which the right to consideration becomes unconditional, as only the passage of time is required before payment is due. The Company estimates the amount of consideration to which it expects to be entitled under provisional pricing arrangements. The amount of consideration for black mass and mixed copper/aluminum sales is based on the mathematical product of: (i) market prices of the constituent metals at the date of settlement, (ii) product weight, and (iii) assay results (ratio of the constituent metals initially estimated by management and subsequently trued up to customer confirmation). Certain adjustments like handling and refining charges are also made per contractual terms with customers. Depending on the contractual terms with customers, the payment of receivables may take up to 12 months from date of shipment. Product sales and the related trade accounts receivables are measured at fair value at initial recognition and are
re-estimated
at each reporting period end using the market prices of the constituent metals at the respective measurement dates. Changes in fair value are recognized as an adjustment to profit and loss and the related accounts receivable.(r) | Share capital |
The Company records proceeds from the issuance of its common shares as equity. Incremental costs directly attributable to the issue of new common shares are shown in equity as a deduction, net of tax, from the proceeds.
(s) | Financing costs |
Professional, consulting, regulatory and other costs directly attributable to financing transactions are recorded as deferred financing costs until the financing transactions are completed, if the completion of the transaction is considered likely; otherwise they are expensed as incurred. Share issue costs are charged to share capital when the related shares are issued. Deferred financing costs related to financing transactions that are not completed are charged to earnings.
F-
39
Li-Cycle
Holdings Corp.Notes to the consolidated financial statements
Year ended October 31, 2021, 2020, and 2019
(Expressed in U.S. dollars)
(t) | Share-based compensation |
The Company accounts for stock options using the fair value-based method of accounting for share-based compensation. Fair values are determined using the Black-Scholes-Merton option pricing model (“BSM”). Management exercises judgment in determining the underlying share price volatility, expected life of the option, expected forfeitures and other parameters of the calculations. Compensation costs are recognized over the vesting period as an increase to share-based compensation expense and contributed surplus. If, and when, stock options are ultimately exercised, the applicable amounts of contributed surplus are transferred to share capital.
The Company accounts for RSUs under the current plan as equity settled share-based payments which are measured at fair value on the grant date. The expense for RSUs is recognized over the vesting period. Upon exercise of any RSUs, the grant date fair value of the instrument is transferred to share capital.
The Company accounts for outstanding RSUs by recognizing a liability for the goods or services acquired, measured initially at the fair value of the liability. At each reporting date until the liability is settled, and at the date of settlement, the fair value of the liability is remeasured, with any changes in fair value recognised in profit or loss for the year.
(u) | Significant accounting estimates and judgments |
The preparation of the financial statements in conformity with IFRS requires management to make judgements, estimates and assumptions that are based on historical experience and various other factors that are believed to be reasonable under the circumstances, the results of which affect the application of accounting policies and the reported amounts of assets, liabilities and expenses. Actual results may differ from these estimates.
Estimates and underlying assumptions are reviewed on an ongoing basis. Revisions to accounting estimates are recognized in the period in which the estimate is revised and in any future periods affected. Significant estimates include:
| (a) | the determination and valuation of deferred income tax assets and liabilities; |
| (b) | the determination of the useful life and impairment of the plant and equipment; |
| (c) | the valuation and measurement of the convertible debt and the related conversion features; |
| (d) | the valuation and recognition of ITCs; and |
| (e) | the valuation of share-based compensation. |
Critical judgements in applying accounting policies that have the most significant effect on the amounts recognized in the financial statements include the following:
| (a) | the determination of the functional currency of the Company and its subsidiaries; |
| (b) | the determination of the revenue recognition policy with regards to transaction price; |
| (c) | the evaluation of the Company’s ability to continue as a going concern; and |
| (d) | the valuation of inventory with regards to incremental cost to completion for raw materials and determination of net realizable value. |
| (e) | the valuation of the fair value of consideration transferred in the business combination |
F-
4
0
Li-Cycle
Holdings Corp.Notes to the consolidated financial statements
Year ended October 31, 2021, 2020, and 2019
(Expressed in U.S. dollars)
(v) | Leases |
The Company assesses whether a contract is or contains a lease, at inception of the contract. The Company recognises aasset and a corresponding lease liability with respect to all lease arrangements in which it is the lessee, except for short-term leases (defined as leases with a lease term of 12 months or less) and leases of low value assets (such as tablets and personal computers, small items of office furniture and telephones). For these leases, the Company recognises the lease payments as an operating expense on a straight-line basis over the term of the lease unless another systematic basis is more representative of the time pattern in which economic benefits from the leased assets are consumed.
right-of-use
The lease liability is initially measured at the present value of the lease payments that are not paid at the commencement date, discounted by using the rate implicit in the lease. If this rate cannot be readily determined, the Company uses its incremental borrowing rate.
Lease payments included in the measurement of the lease liability comprise:
| • | Fixed lease payments (including in-substance fixed payments), less any lease incentives receivable; |
| • | Variable lease payments that depend on an index or rate, initially measured using the index or rate at the commencement date; |
| • | The amount expected to be payable by the lessee under residual value guarantees; |
| • | The exercise price of purchase options, if the lessee is reasonably certain to exercise the options; and |
| • | Payments of penalties for terminating the lease, if the lease term reflects the exercise of an option to terminate the lease. |
The lease liability is presented as a separate line in the consolidated statement of financial position.
The lease liability is subsequently measured by increasing the carrying amount to reflect interest on the lease liability (using the effective interest method) and by reducing the carrying amount to reflect the lease payments made.
The Company remeasures the lease liability (and makes a corresponding adjustment to the relatedasset) whenever:
right-of-use
| • | The lease term has changed or there is a significant event or change in circumstances resulting in a change in the assessment of exercise of a purchase option, in which case the lease liability is remeasured by discounting the revised lease payments using a revised discount rate. |
| • | The lease payments change due to changes in an index or rate or a change in expected payment under a guaranteed residual value, in which cases the lease liability is remeasured by discounting the revised lease payments using an unchanged discount rate (unless the lease payments change is due to a change in a floating interest rate, in which case a revised discount rate is used). |
| • | A lease contract is modified and the lease modification is not accounted for as a separate lease, in which case the lease liability is remeasured based on the lease term of the modified lease by discounting the revised lease payments using a revised discount rate at the effective date of the modification. |
F-
4
1
Li-Cycle
Holdings Corp.Notes to the consolidated financial statements
Year ended October 31, 2021, 2020, and 2019
(Expressed in U.S. dollars)
The Company made several such adjustments during the periods presented, see Note 15. Theassets comprise the initial measurement of the corresponding lease liability, lease payments made at or before the commencement day, less any lease incentives received and any initial direct costs. They are subsequently measured at cost less accumulated depreciation and impairment losses.
right-of-use
Whenever the Company incurs an obligation for costs to dismantle and remove a leased asset, restore the site on which it is located or restore the underlying asset to the condition required by the terms and conditions of the lease, a provision is recognised and measured under IAS 37. To the extent that the costs relate to aasset, the costs are included in the relatedasset, unless those costs are incurred to produce inventories.
right-of-use
right-of-use
Right-of-use
right-of-use
right-of-use
right-of-use
Theassets are presented as a separate line in the consolidated statement of financial position.
right-of-use
The Company applies IAS 36 to determine whether aasset is impaired and accounts for any identified impairment loss as described in the ‘Property, Plant and Equipment’ policy.
right-of-use
Variable rents that do not depend on an index or rate are not included in the measurement the lease liability and theasset. The related payments are recognised as an expense in the period in which the event or condition that triggers those payments occurs.
right-of-use
As a practical expedient, IFRS 16 Leases (“IFRS 16”) permits a lessee not to separate
non-lease
components, and instead account for any lease and associatednon-lease
components as a single arrangement. The Company has used this practical expedient.(w) | Restoration provisions |
Provisions for the costs to restore leased plant assets to their original condition, as required by the terms and conditions of the lease, are recognised when the obligation is incurred, either at the commencement date or as a consequence of having used the underlying asset during a particular period of the lease, at the directors’ best estimate of the expenditure that would be required to restore the assets. Estimates are regularly reviewed and adjusted as appropriate for new circumstances.
Whenever the Company incurs an obligation for costs to dismantle and remove a leased asset, restore the site on which it is located or restore the underlying asset to the condition required by the terms and conditions of the lease, a provision is recognised and measured under IAS 37. To the extent that the costs relate to aasset, the costs are included in the relatedasset, unless those costs are incurred to produce inventories.
right-of-use
right-of-use
(x) | Intangible assets |
No intangible assets have been recognized to date.
F-
4
2
Li-Cycle
Holdings Corp.Notes to the consolidated financial statements
Year ended October 31, 2021, 2020, and 2019
(Expressed in U.S. dollars)
(y) | Changes in presentation |
The company has made the following changes in presentation for the financial statements for the twelve months ended October 31, 2021:
| • | The prior year results have been adjusted to conform with current year presentation on the Consolidated statements of loss and comprehensive loss. |
| • | Segregating trade accounts receivable from other receivables to provide more information regarding these balances. Please see Note 4. |
| • | Renaming of the profit and loss line item Fair value loss on restricted share units to Fair value loss on financial instruments to reflect new diverse financial instruments the Company is exposed to as at October 31, 2021. |
| • | Combining the previously separate profit and loss lines items of Office and administrative and Travel and entertainment in a single line to show similar items together |
| 2020 $ | 2019 $ | |||||||
Office and administrative | 316,401 | 355,361 | ||||||
Travel and entertainment | 160,332 | 137,943 | ||||||
| 476,733 | 493,304 | |||||||
3. Adoption of new and revised standards
Annual | Improvements to IFRS Standards |
The Company has adopted the amendments included in the Annual Improvements to IFRS Standards 2016–2018 Cycle as at November 1, 2020. The Annual Improvements include amendments to IFRS 9 Financial Instruments, IFRS 3 Business Combinations, IFRS 16 Leases, IAS 1 Presentation of Financial Statements, and IAS 8 Accounting policies, changes in accounting estimates and errors.
Management has assessed the impact of the adoption of the new standards and concluded it to be not material.
4. Accounts receivable
Aging Summary | October 31, 2021 | October 31, 2020 | ||||||
$ | $ | |||||||
Current | 3,181,294 | 540,824 | ||||||
1-30 days | 310,818 | — | ||||||
31-60 days | 120,604 | 21,455 | ||||||
61-90 days | 18,477 | — | ||||||
91 days and over | 441,508 | 9,021 | ||||||
4,072,701 | 571,300 | |||||||
For product sales, the Company estimates the amount of consideration to which it expects to be entitled under provisional pricing arrangements. For the twelve months ended October 31, 2021, the fair value gain
F-
4
3
Li-Cycle
Holdings Corp.Notes to the consolidated financial statements
Year ended October 31, 2021, 2020, and 2019
(Expressed in U.S. dollars)
arising from changes in estimates was
$805,789 (twelve months ended October 31, 2020: NaN).An insignificant portion of the receivables relate to services revenue which are initially measured at fair value and subsequently at amortized cost. For the period ended October 31, 2021 and 2020, the Company has assessed an allowance for credit loss of $NaN for service-related receivables based on its past experience, the credit ratings of its existing customers and economic trends.
October 31, 2021 | October 31, 2020 | |||||||
$ | $ | |||||||
Harmonized Sales Taxes receivable | 379,814 | 274,998 | ||||||
Other receivables | 593,331 | 43,931 | ||||||
973,145 | 318,929 | |||||||
5. | Prepayments and deposits |
October 31, 2021 | October 31, 2020 | |||||||
$ | $ | |||||||
Prepaid lease deposits | 886,951 | 33,501 | ||||||
Prepaid equipment deposits | 3,231,836 | — | ||||||
Prepaid insurance | 3,839,880 | 59,582 | ||||||
Other prepaids | 688,331 | 870,868 | ||||||
8,646,998 | 963,951 | |||||||
6. | Inventory |
October 31, 2021 | October 31, 2020 | |||||||
$ | $ | |||||||
Raw material | 850,416 | 140,419 | ||||||
Finished goods | 347,391 | 39,575 | ||||||
1,197,807 | 179,994 | |||||||
The cost of inventories recognized as an expense during the twelve months ended October 31, 2021 was $8.55 million (twelve months ended October 31, 2020: $0.82 million).
The cost of inventories recognized as an expense during the twelve months ended October 31, 2021 includes a write down of $2,316,936 for finished goods and write down of $552,429 for raw materials (twelve months ended October 31, 2020: $4,360 for finished goods and $53,764 for raw materials) in respect of adjustments of inventory to net realizable value. Net realizable value of inventory is calculated as the estimated consideration under provisional pricing arrangements less the estimated cost of completion and the estimated costs necessary to make the sale
.
F-
4
4
Li-Cycle
Holdings Corp.Notes to the consolidated financial statements
Year ended October 31, 2021, 2020, and 2019
(Expressed in U.S. dollars)
7. | Plant and equipment |
Plant equipment | Storage containers | Vehicles | Leasehold improvements | Total | ||||||||||||||||
| $ | $ | $ | $ | $ | ||||||||||||||||
Cost | ||||||||||||||||||||
At October 31, 2019 | 1,043,231 | 53,610 | 90,707 | 58,848 | 1,246,396 | |||||||||||||||
Additions | 3,519,013 | 13,914 | 68,243 | 1,506,493 | 5,107,663 | |||||||||||||||
Disposals | (150,690 | ) | — | — | — | (150,690 | ) | |||||||||||||
Foreign Exchange on Translation | 23,320 | 95 | (1,346 | ) | 11,860 | 33,929 | ||||||||||||||
At October 31, 2020 | 4,434,874 | 67,619 | 157,604 | 1,577,201 | 6,237,298 | |||||||||||||||
Additions | 17,674,983 | 62,017 | 4,642,255 | 22,379,255 | ||||||||||||||||
Disposals | — | (40,323 | ) | (40,323 | ) | |||||||||||||||
At October 31, 2021 | 22,109,857 | 67,619 | 179,298 | 6,219,456 | 28,576,230 | |||||||||||||||
Accumulated depreciation | ||||||||||||||||||||
At October 31, 2019 | (170,691 | ) | (1,397 | ) | (2,187 | ) | (11,329 | ) | (185,604 | ) | ||||||||||
Depreciation | (350,173 | ) | (5,977 | ) | (22,408 | ) | (115,958 | ) | (494,516 | ) | ||||||||||
Disposals | 43,744 | — | — | — | 43,744 | |||||||||||||||
Foreign Exchange on Translation | 2,462 | (36 | ) | (232 | ) | (536 | ) | 1,658 | ||||||||||||
At October 31, 2020 | (474,658 | ) | (7,410 | ) | (24,827 | ) | (127,823 | ) | (634,718 | ) | ||||||||||
Depreciation | (1,083,687 | ) | (6,762 | ) | (34,545 | ) | (437,113 | ) | (1,562,107 | ) | ||||||||||
Disposals | — | — | 10,058 | — | 10,058 | |||||||||||||||
At October 31, 2021 | (1,558,345 | ) | (14,172 | ) | (49,314 | ) | (564,936 | ) | (2,186,767 | ) | ||||||||||
Carrying amounts | — | |||||||||||||||||||
At October 31, 2019 | 872,540 | 52,213 | 88,520 | 47,519 | 1,060,792 | |||||||||||||||
At October 31, 2020 | 3,960,216 | 60,209 | 132,777 | 1,449,378 | 5,602,580 | |||||||||||||||
At October 31, 2021 | 20,551,512 | 53,447 | 129,984 | 5,654,520 | 26,389,463 | |||||||||||||||
At October 31, 2021, $17.72 million of the plant equipment and leasehold improvements were under construction (October 31, 2020: $1.92 million, October 31, 2019: $NaN).
8. | Related party transactions |
Remuneration of key management personnel
The remuneration of the executive officers and directors, who are the key management personnel of the Company, is set out below:
October 31, 2021 | October 31, 2020 | October 31, 2019 | ||||||||||
$ | $ | $ | ||||||||||
Salaries | 1,501,800 | 231,034 | 104,310 | |||||||||
Share-based compensation | 1,863,260 | 74,320 | 149,993 | |||||||||
Fees and benefits | 1,517,791 | 411,184 | 159,881 | |||||||||
4,882,851 | 716,538 | 414,184 | ||||||||||
F-
4
5
Li-Cycle
Holdings Corp.Notes to the consolidated financial statements
Year ended October 31, 2021, 2020, and 2019
(Expressed in U.S. dollars)
During the twelve months ended October 31, 2021, the Company paid directors and advisors for providing director services, consulting and fundraising activities. Total amounts paid for fiscal 2021 to directors in respect of these activities was $260,284 (2020: $181,383, 2019:$75,285).
Outstanding balances of remunerations of the executive officers and directors are summarized as follows:
October 31, 2021 | October 31, 2020 | October 31, 2019 | ||||||||||
$ | $ | $ | ||||||||||
Accounts payable and accrued liabilities | 771,255 | 316,465 | 85,386 | |||||||||
Restricted share units | — | 153,296 | — | |||||||||
Outstanding balances | 771,255 | 469,761 | 85,386 | |||||||||
Related-Party Lease
From January 1, 2019 to December 31, 2021, the Company leased certain office space from Ashlin BPG Marketing, which is controlled by certain members of the immediate family of the Company’s President and Chief Executive Officer. Under the terms of the lease, the Company was required to pay Cdn.
$4,500 per month plus applicable taxes, subject to 60 days’ notice of termination.Li-Cycle
terminated the lease, effective December 31, 2021. During the twelve months ended October 31, 2021, the Company incurred expenses of $39,866 in relation to this vendor, as compared to $35,505 for the twelve months ended October 31, 2020.Related-Party Expenses
The Company has engaged Fade In Production Pty. Ltd., which is controlled by certain members of the immediate family of the Executive Chair of
Li-Cycle,
to provide it with corporate video production services since 2017. During the twelve months ended October 31, 2021, the Company incurred expenses of $145,851 in relation to this vendor, as compared to $42,739 for the twelve months ended October 31, 2020.The Company has engaged Ashlin BPG Marketing, which is controlled by certain members of the immediate family of the Company’s President and Chief Executive Officer, to provide it with marketing items and employee gifts since April 1, 2020. During the twelve months ended October 31, 2021, the Company incurred expenses of $46,640 attributable to this vendor, as compared to $5,405
for the twelve months ended October 31, 2020.
The Company has engaged Consulero Inc., which is controlled by certain members of the immediate family of the Company’s President and Chief Executive Officer, to provide it with technology services since September 1, 2020. During the twelve months ended October 31, 2021, the Company incurred expenses of $103,040 attributable to this vendor, as compared to $46,515 for the twelve months ended October 31, 2020.
Consulting Agreements
On May 1, 2020, the Company entered into a consulting agreement with Atria Limited, a beneficial owner of more than 5% of the outstanding
Li-Cycle
Corp. shares at that time, for certain business development consulting services with fees payable inLi-Cycle
Corp. shares at a rate of 1,000Li-Cycle
Corp. shares per month, to a maximum of 12,000Li-Cycle
Corp. shares. On January 25, 2021,Li-Cycle
and Atria LimitedF-
4
6
Li-Cycle
Holdings Corp.Notes to the consolidated financial statements
Year ended October 31, 2021, 2020, and 2019
(Expressed in U.S. dollars)
entered into a letter agreement providing for the termination of the consulting agreement and the issuance and delivery to Atria Limited of
10,000Li-Cycle Corp. shares as full and final satisfaction of all obligations and liabilities of Li-Cycle to Atria Limited under the consulting agreement.
Director Consulting Agreements
Under the terms of an agreement dated July 19, 2019 between
Li-Cycle
and Anthony Tse, Mr. Tse provided consulting services toLi-Cycle
in relation to the proposed expansion of its operations in Asia and was entitled to a fee of $4,700 per month for such services. For the twelve months ended October 31, 2021, Mr. Tse was paid aggregate fees under this agreement of $56,400. The consulting agreement was terminated o
January 19, 2022.
n
January 19, 2022.
Under the terms of a consulting agreement dated July 19, 2019 between
Li-Cycle
and Rick Findlay, for the twelve months ended October 31, 2020, Mr. Findlay was paid aggregate fees of $1,332. For the twelve months ended October 31, 2021, there were 0 fees paid. The consulting agreement was terminated on June 25, 2021.Related-Party Promissory Notes
On June 16, 2021,
Li-Cycle
issued promissory notes (the “Promissory Notes”) for an aggregate principal amount of $7,000,000 as consideration for loans received from companies related to the Chief Executive Officer and the Executive Chair ofLi-Cycle,
respectively. The Promissory Notes bear interest at the rate of 10% per annum and mature on December 15, 2023. The Promissory Notes are unsecured and subordinate to indebtedness owing toLi-Cycle’s
senior lender, BDC Capital Inc.Li-Cycle
has the option of prepaying all or any portion of the principal and accrued interest of the Promissory Notes prior to the maturity date without penalty, subject to certain conditions. On August 17, 2021Li-Cycle
elected to repay the full balance of the promissory notes for a total of $7,113,151, including accrued interest.9. | Loans Payable |
BDC Loan | Other Loans | Total | ||||||||||
$ | $ | $ | ||||||||||
Balance at October 31, 2019 | — | 87,381 | 87,381 | |||||||||
Proceeds from loans payable | 2,153,110 | — | 2,153,110 | |||||||||
Repayment of loans payable | — | (12,881 | ) | (12,881 | ) | |||||||
Foreign exchange loss | 21,430 | (1,162 | ) | 20,268 | ||||||||
Balance at October 31, 2020 | 2,174,540 | 73,338 | 2,247,878 | |||||||||
Proceeds from loans payable | 3,091,220 | 7,000,000 | 10,091,220 | |||||||||
Repayment of loans payable | (5,507,298 | ) | (7,037,041 | ) | (12,544,339 | ) | ||||||
Foreign exchange loss | 241,538 | 3,451 | 244,989 | |||||||||
Balance at October 31, 2021 | — | 39,748 | 39,748 | |||||||||
(i) | BDC Capital Loan |
On December 16, 2019, the Company entered into a binding agreement with BDC Capital Inc. for a secured loan of Canadian dollars (C$7 million) to help finance the expansion plans of the Company
F-
4
7
Li-Cycle
Holdings Corp.Notes to the consolidated financial statements
Year ended October 31, 2021, 2020, and 2019
(Expressed in U.S. dollars)
(the “BDC Capital Loan”), which was to be distributed in up to three tranches, with the second and third tranches to be distributed based on the achievement of certain milestones by the Company. Pursuant to the BDC Capital Loan, each of the Company and
Li-Cycle
Inc. entered into general security agreements with BDC Capital Inc. granting the lender a general security interest over all assets of the Company andLi-Cycle
Inc., respectively. In addition,Li-Cycle
Inc. guaranteed the Company’s obligations under BDC Capital Loan under a guarantee agreement. The maturity date of the BDC Capital Loan was December 14, 2023. The base rate of interest was 16% per annum, paid monthly, plus additional accrued interest of 3% that could be reduced to 0% based on the achievement of certain milestones by the Company. Principal payments began on the first anniversary date of the loan and were made at C$175,000 per month with a balloon payment of C$700,000 at maturity.On February 10, 2020, the Company received the first tranche of the BDC Capital Loan for C$3 million. Transaction costs associated with the loan amounted to C$121,861 and were deducted from the loan balance.
On November 2, 2020, the Company received the second tranche of the BDC Capital Loan for C$2,000,000 upon the completion of the milestone for such additional funding.
On April 7, 2021, the Company received the third tranche of the BDC Capital Loan for C$2,000,000 upon the completion of the milestone for such additional funding.
On July 20, 2021,
Li-Cycle
signed an agreement with BDC Capital Inc to repay the BDC Capital Loan in full, conditional upon the closing ofLi-Cycle’s
business combination with Peridot Acquisition Corp. on August 10, 2021.On August 11, 2021, in accordance with the agreement to repay the BDC Capital Loan in full upon the closing of
Li-Cycle’s
business combination with Peridot Acquisition Corp.,Li-Cycle
paid BDC Capital Inc. $5.3 million (C$6.6 million) to settle the BDC Capital Loan, including additional interest expense of $0.7 million (C$0.9 million).(ii) | Promissory Notes |
On June 16, 2021,
Li-Cycle
issued promissory notes (the “Promissory Notes”) for an aggregate principal amount of $7,000,000 as consideration for loans received from companies related to the Chief Executive Officer and the Executive Chair ofLi-Cycle,
respectively. The Promissory Notes bore interest at the rate of 10% per annum and had a maturity date of December 15, 2023. The Promissory Notes were unsecured and subordinate to indebtedness owing toLi-Cycle’s
senior lender, BDC Capital Inc.Li-Cycle
had the option of prepaying all or any portion of the principal and accrued interest of the Promissory Notes prior to the maturity date without penalty, subject to certain conditions. On August 17, 2021,Li-Cycle
elected to repay the full balance of the promissory notes for a total of $7,113,151, including accrued interest.(iii) | Other Loans |
The Company’s remaining loans relate to company vehicles.
F-
4
8
Li-Cycle
Holdings Corp.Notes to the consolidated financial statements
Year ended October 31, 2021, 2020, and 2019
(Expressed in U.S. dollars)
10. | Convertible Debt |
October 31, 2021 | October 31, 2020 | October 31, 2019 | ||||||||||
$ | $ | $ | ||||||||||
Proceeds of issue of convertible debt | 100,000,000 | 386,190 | 386,190 | |||||||||
Transaction costs | (1,599,737 | ) | — | — | ||||||||
Net Proceeds from issue of convertible debt | 98,400,263 | 386,190 | 386,190 | |||||||||
Conversion feature at date of issue | 27,681,043 | 96,548 | 96,548 | |||||||||
Fair value (gain) loss on embedded derivative | 1,347,895 | — | — | |||||||||
Conversion into common shares | — | (96,548 | ) | — | ||||||||
Conversion feature at end of period | 29,028,938 | — | 96,548 | |||||||||
Debt component at date of issue (net of transaction costs) | 70,719,220 | 289,642 | 289,642 | |||||||||
Prior year interest plus accretion | — | 99,549 | 39,212 | |||||||||
Amortization of transaction costs | 26,662 | — | — | |||||||||
Accrued interest at 7% (2020 – 8%) | 641,667 | 4,956 | 30,114 | |||||||||
Accretion expense during the year | 461,351 | 4,975 | 30,223 | |||||||||
Conversion into common shares | — | (395,861 | ) | — | ||||||||
Foreign exchange on translation | — | (3,261 | ) | (4,984 | ) | |||||||
Debt component at end of period | 71,848,900 | — | 384,207 | |||||||||
On March 6, 2018, the Company obtained an investment from Sustainable Chemistry Alliance (“SCA”) for $386,190 with the issuance of a
3-year,
8% unsecured convertible debenture. Upon the completion of a qualified financing, and at either the Company’s or holder’s option, the debenture could be converted to common shares at a 20% discount to the effective share price of the qualifying transaction, or failing conversion, was to be repaid in full with full-term interest. Accrued interest was payable at the maturity date.The conversion feature has been recorded as an embedded derivative liability as the exercise price may be adjusted upon the issuance or deemed issuance of additional common shares at a price less than the conversion price contained in the convertible debenture. The fair value of the embedded derivative liability upon issuance was $96,548. The residual value of $289,643 was allocated to the convertible loan payable which has an effective interest rate of 9.62%.
On December 27, 2019, the convertible debenture with SCA was converted to common shares as a result of the additional funding exceeding $10 million and thereby triggering the “qualifying transaction” clause of the debenture agreement. Per the terms of the agreement, the principal amount of $386,190 plus accrued interest of $55,788 was converted at a 20% discount to the Series B share price of $40.05 resulting in the issuance of 13,436 common shares.
On September 29, 2021, the Company issued a convertible note (the “Note”) for a principal amount of $100,000,000 to Koch Strategic Platforms (“KSP”), a subsidiary of Koch Investments Group. The Note will mature on September 29, 2026 unless earlier repurchased, redeemed or converted. Interest on the Note will be payable semi-annually, and
Li-Cycle
is permitted to pay interest on the Note in cash or paymentin-kind
F-
49
Li-Cycle
Holdings Corp.Notes to the consolidated financial statements
Year ended October 31, 2021, 2020, and 2019
(Expressed in U.S. dollars)
(“PIK”), at its election. Interest payments made in cash will be based on an interest rate of LIBOR plus 5.0% per year, and PIK interest payments will be based on an interest rate of LIBOR plus 6.0% per year. Under the terms of the Note, LIBOR has a floor of 1% and a cap of 2%. With the retirement of the LIBOR at the end of 2021, the interest rates will instead be based on the sum of the Secured Overnight Financing Rate (“SOFR”) and the average spread between the SOFR and LIBOR during the three-month period of time ending on the date on which the LIBOR interest rate ceases to be published. The PIK election results in a new Note under the same terms as the original note, issued in lieu of interest payments with an issuance date on the applicable interest date. At October 31, 2021, the Company has elected to pay interest on the Note using the PIK election.
The conversion feature has been recorded as an embedded derivative liability since the conversion ratio does not always result in a conversion of a fixed dollar amount of liability for a fixed number of shares. The Note will have an initial conversion price of approximately
$13.43 perLi-Cycle
common share, subject to customary anti-dilution adjustments, which price was established based on 125% of the7-day
volume-weighted average price ofLi-Cycle’s
common shares prior to the date of the Note Purchase Agreement. Should the company’s share price be equal to or greater than $17.46, for a period of twenty consecutive days, the Company can force conversion of the noteLi-Cycle
will settle its conversion obligations through the delivery of its own Common Shares. At October 31, 2021, no conversions had taken place.The fair value of the embedded derivatives upon issuance was determined to be a liability of $27,681,043 whereas the remaining $72,318,957, net of transaction costs of $1,599,737, was allocated to the principal of the debt. During the twelve months ended October 31, 2021, the Company recognized a fair value loss of 1,347,895 on the embedded derivatives. The embedded derivatives were valued using the Barrier option pricing model. The assumptions used in the model were as follows:
| September 29, 2021 (issuance date) | October 31, 2021 | |||
Risk free interest rate | 1.06% | 1.23% | ||
Expected life of options | 5 years | 4.92 years | ||
Expected dividend yield | 0.0% | 0.0% | ||
Expected stock price volatility | 66% | 62% | ||
Share Price | 12.56 | 12.94 |
Expected volatility was determined by calculating the average implied volatility of a group of listed entities that are considered similar in nature to the Company.
11. | Warrants |
On August 10, 2021, the Company began trading warrants related to its common shares. These warrants were assumed as part of the business combination described in Note 1. On acquisition date, the Company assumed 23,000,000 warrants at the publicly traded fair market value of $2.10 per share for a total acquired liability of $48,299,987.
The total number of warrants is made up of 15,000,000 Public Placement Warrants (“Public Warrants”) and 8,000,000 Private Placement Warrants (“Private warrants”). All warrants have a 5 year term, expiring on September 24, 2025. The Public Warrants have an exercise price of $11.50 per share, with a redemption price of $0.01 per warrant if the share price is above $10.00, on a cashless basis. If the share price is above $18.00 for any 20 trading days within the 30 trading day period ending three trading days before the notice of redemption, the redemption price will be $0.10 on a cash basis. The Private Warrants have an exercise
F-
5
0
Li-Cycle
Holdings Corp.Notes to the consolidated financial statements
Year ended October 31, 2021, 2020, and 2019
(Expressed in U.S. dollars)
price of $
11.50per shares, redeemable only at such time that the share price of the Company is between $
10.00and $
18.00, at the above prices. The Private Warrants were not transferable until
30days after the close of the business combination, which has passed as of writing. If the Private Placement Warrants are transferred to parties other than the Company’s sponsor or its permitted transferees, the Private Placement Warrants will cease to be Private Placement Warrants and will become Public Warrants.
On October 15, 2021, 100 warrants were exercised for 100 shares for which the Company received $1,150.
Warrants are remeasured through profit or loss at each period end, using first level inputs. At October 31, 2021, the publicly traded fair market value for each warrant was $3.57 with a total liability of $82,109,334, recognizing a total loss of $33,809,634 in the twelve months ended October 31, 2021.
12. | Share capital and share-based compensation |
Authorized share capital
Li-Cycle
Corp. is authorized to issue an unlimited number of voting common shares, Class Anon-voting
common shares, preference shares and Class A preferred shares, in each case without par value. All issued shares are fully paid.Li-Cycle
Holdings Corp. is authorized to issue an unlimited number of voting common shares without par value. All issued shares are fully paid.For retrospective presentation, the number of
Li-Cycle
Corp.’s common shares and Class A preferred shares on the Consolidated Statements of Changes in Equity have been scaled by the exchange ratio of 1:39.91 for periods prior to the completion of the business combination on August 10, 2021.On March 23, 2018,
Li-Cycle
Corp. completed anon-brokered
private placement and issued 188,604 common shares for proceeds of $2,645,136 at $14.02 per share.On February 28, 2019,
Li-Cycle
Corp. issued 8,468 common shares to two shareholders as a finder’s fee for the Series A fundraising. These shares were valued at $118,759Between December 20 and December 27, 2019,
Li-Cycle
Corp. completed anon-brokered
private placement and issued 159,294 common shares for proceeds of $6,481,381 at $40.05 per share.On December 27, 2019, a convertible debenture was converted to 13,436 common shares of
Li-Cycle
Corp., representing proceeds of $492,409.On November 13, 2020,
Li-Cycle
Corp. completed a Series C private placement with two entities to purchase 281,138 Class A preferred shares at a price of $81.81 per share, for total proceeds of $23,000,000 and incurred transaction fees of $1,380,000.On January 25, 2021,
Li-Cycle
Corp. issued 12,000 shares as full and final satisfaction of all obligations under a consulting agreement for services the Company received up to May 2020.Between June 11 and June 24, 2021, 4 employees exercised stock options for a total of 25,664 common shares of
Li-Cycle
Corp., at an aggregate exercise price of $169,105.On August 10, 2021, the Company finalized the business combination described in Note 1. All outstanding common shares and Class A preferred shares of
Li-Cycle
Corp., 2,407,535 in total, were exchanged for 96,084,679 common shares ofLi-Cycle
Holdings Corp. at the exchange ratio of 1:39.91.Li-Cycle
Holdings Corp. issued an additional 65,671,374 common shares for net proceeds of $525,329,273. As part of this F-
5
1
Li-Cycle
Holdings Corp.Notes to the consolidated financial statements
Year ended October 31, 2021, 2020, and 2019
(Expressed in U.S. dollars)
transaction, all outstanding 9,829 Restricted Share Units of
Li-Cycle
Corp. were settled by issuance of additional 392,276 common shares ofLi-Cycle
Holdings Corp. and a cashless exercise of 28,779 stock options ofLi-Cycle
Corp. resulted in an additional 1,031,226 common shares ofLi-Cycle
Holdings Corp.On October 15,2021, a warrant holder exercised 100 warrants for a total of 100 common shares of
Li-Cycle
Holdings Corp. at an aggregate exercise price of $1,150.Long-term incentive plans
Stock options
Li-Cycle
Corp. had a stock option plan (the “2017 Plan”) approved by the Company’s shareholders that allows it to grant stock options, subject to regulatory terms and approval, to its officers, directors, employees and service providers. This Plan was effective from September 2017 through October 31, 2019.Each stock option converts into one common share of the Company on exercise. No amounts are paid or payable by the recipient on receipt of the option. The options carry neither rights to dividends nor voting rights. Options may be exercised at any time from the date of vesting to the date of their expiry. Options are exercisable at a price equal to the average market price of the Company’s common shares on the date of grant. The vesting period is
one-third
on the first-year anniversary of the grant, andone-third
every consecutive year thereafter. If the options remain unexercised after a period of 5 years from the date of grant, the options expire. Options are forfeited if the recipient terminates their contract with the Company before the options vest.On November 1, 2019,
Li-Cycle
Corp. adopted a new Long Term Incentive Plan (the “2019 LTIP”) approved by the Company’s shareholders that allowed it to grant stock options, restricted share units, deferred share units, stock appreciation rights, and other forms of equity compensation, subject to regulatory terms and approval, to its officers, directors, employees and service providers.For stock options issued under the 2019 LTIP, each stock option converts into one common share of the Company on exercise. No amounts are paid or payable by the recipient on receipt of the option. The options carry neither rights to dividends nor voting rights. Options may be exercised at any time from the date of vesting to the date of their expiry. Options are exercisable at a price equal to the fair market value of the Company’s common shares on the date of grant. The vesting period is
one-third
on the first-year anniversary of the grant, andone-third
every consecutive year thereafter. If the options remain unexercised after a period of 10 years from the date of grant, the options expire. Options are forfeited if the recipient terminates their contract with the Company before the options vest.On August 10, 2021,
Li-Cycle
Holdings Corp. adopted a new Long Term Incentive Plan (the “2021 LTIP”) approved by the Company’s shareholders that allows it to grant stock options, restricted share units, deferred share units, stock appreciation rights, and other forms of equity compensation, subject to regulatory terms and approval, to its officers, directors, employees and service providers.On August 10, 2021, all of the outstanding stock options of
Li-Cycle
Corp. under the 2017 Plan and the 2019 LTIP were vested and 19 employees exercised 28,779 stock options ofLi-Cycle
Corp. on a cashless basis. All remaining 106,307 stock options under the 2017 Plan and the 2019 LTIP were exchanged for 4,242,707 stock options under the 2021 LTIP plan at the exchange ratio of 1:39.91, while retaining original expiry dates.For stock options issued under the 2021 LTIP, each stock option converts into one common share of the Company on exercise. No amounts are paid or payable by the recipient on receipt of the option. The options
F-
5
2
Li-Cycle
Holdings Corp.Notes to the consolidated financial statements
Year ended October 31, 2021, 2020, and 2019
(Expressed in U.S. dollars)
carry neither rights to dividends nor voting rights. Options may be exercised at any time from the date of vesting to the date of their expiry. Options are exercisable at a price equal to the fair market value of the Company’s common shares on the date of grant. The vesting period is
one-third
on the first-year anniversary of the grant, andone-third
every consecutive year thereafter. If the options remain unexercised after a period of 10 years from the date of grant, the options expire. Options are forfeited if the recipient terminates their contract with the Company before the options vest.A summary of stock option activities is as follows:
Number of Li-Cycle Corp stock options | Weighted average exercise price of Li-Cycle Corpstock options | Number of Li-Cycle Holdings Corp stock options | Weighted average exercise price of Li-Cycle Holdings Corp stock options | |||||||||||||
| $ | $ | |||||||||||||||
Balance – October 31, 2018 | 58,320 | 2.49 | ||||||||||||||
Granted | 41,680 | 13.57 | ||||||||||||||
Balance – October 31, 2019 | 100,000 | 7.14 | ||||||||||||||
Granted | 33,500 | 39.66 | ||||||||||||||
Balance – October 31, 2020 | 133,500 | 15.35 | ||||||||||||||
Granted | 31,750 | 85.30 | ||||||||||||||
Exercised | (54,443 | ) | 24.58 | |||||||||||||
Forfeited | (4,500 | ) | 42.43 | |||||||||||||
Exchanged on August 10, 2021 | 106,307 | 31.62 | 4,242,707 | 0.79 | ||||||||||||
Granted | 1,053,846 | 10.93 | ||||||||||||||
Balance – October 31, 2021 | 5,296,553 | 2.81 | ||||||||||||||
As at October 31, 2021, 4,242,707 of the stock options (2020: 106,307, 2019: 29,440) were exercisable.
A summary of outstanding stock options is as follows:
Number of stock options | Exercise price | |||||||
| $ | ||||||||
Expiration dates | ||||||||
September 11, 2022 | 399,100 | 0.02 | ||||||
April 10, 2023 | 798,200 | 0.02 | ||||||
April 10, 2023 | 199,231 | 0.36 | ||||||
April 1, 2024 | 171,613 | 0.36 | ||||||
July 17, 2024 | 865,244 | 0.36 | ||||||
December 16, 2029 | 99,775 | 1.08 | ||||||
April 21, 2030 | 439,010 | 1.08 | ||||||
July 19, 2030 | 371,163 | 1.08 | ||||||
November 30, 2030 | 420,452 | 2.17 | ||||||
February 11, 2031 | 478,920 | 2.17 | ||||||
August 10, 2031 | 1,053,846 | 10.93 | ||||||
5,296,553 | ||||||||
F-
5
3
Li-Cycle
Holdings Corp.Notes to the consolidated financial statements
Year ended October 31, 2021, 2020, and 2019
(Expressed in U.S. dollars)
The Company recognized total expenses of $2.69 million related to stock options during the twelve months ended October 31, 2021 (2020: $0.33 million, 2019: $0.10 million).
The fair value of the stock options granted during the twelve months ended October 31, 2021 was determined to be $8.28 million (2020: $0.94 million, 2019: $0.31 million) using the Black-Scholes Merton option pricing model. The assumptions used in the stock option pricing model were as follows:
Risk free interest rate | 0.46% – 0.97% | |
Expected life of options | 6 | |
Expected dividend yield | 0.0% | |
Expected stock price volatility | 65% | |
Expected forfeiture rate | 0.0% |
Expected volatility was determined by calculating the average historical volatility of a group of listed entities that are considered similar in nature to the Company.
During the twelve months ended October 31, 2021, 23 employees exercised 2,172,820 stock options to acquire a total of 2,055,474 common shares at an aggregate exercise price aggregate exercise of $0.17 million. During the years ended October 31, 2020 and 2019, 0 stock options were exercised.
Restricted share units
Under the terms of the 2019 LTIP, restricted share units were issued to executives and directors. The RSUs vested immediately and were exercisable upon issuance. The RSUs represented the right to receive a distribution from
Li-Cycle
Corp. in an amount equal to the fair market value of an ordinary share ofLi-Cycle
Corp. at the time of distribution. The RSUs under the 2019 LTIP could be settled in shares, cash, or any combination of shares and cash, at the option of the holder. RSUs under the 2019 LTIP were classified as a liability on the consolidated statement of financial position.On August 10, 2021, all existing 9,829 RSUs under the 2019 LTIP were settled at the exchange ratio of 1:39.91, resulting in issuance of 392,276 common shares of
Li-Cycle
Holdings Corp.The Company has recorded a liability of $0 as at October 31, 2021 (October 31, 2020: $171,849) that represents the fair value of the RSUs outstanding under the 2019 LTIP and has recorded fair value loss of $3,096,940 for the twelve months ended October 31, 2021 (twelve months ended October 31, 2020:$83,424).
Under the terms of the 2021 LTIP, restricted share units of
Li-Cycle
Holdings Corp. have been issued to executives, directors, employees and advisors. The RSU vesting periods ranged from 1 year to 3 years. The RSUs represent the right to receive a distribution from the Company in an amount equal to the fair market value of an ordinary share ofLi-Cycle
Holdings Corp. at the time of distribution. The RSUs under the 2021 LTIP are expected to be settled in shares. The Company, at its sole discretion, may also settle in cash or a combination of cash and shares. The RSUs issued under the 2021 LTIP are classified as equity on the consolidated statement of financial position.The Company recognized share-based compensation expenses relating to RSUs totaling $1,293,030 in the twelve months ended October 31, 2021 (twelve months ended October 31, 2020: $88,425).
F-
5
4
Li-Cycle
Holdings Corp.Notes to the consolidated financial statements
Year ended October 31, 2021, 2020, and 2019
(Expressed in U.S. dollars)
A summary of RSU activities is as follows:
Number of Li-Cycle Corp RSU | Number of Li-Cycle Holdings Corp RSU | |||||||
Balance – October 31, 2018 | — | |||||||
Balance – October 31, 2019 | — | |||||||
Granted | 2,182 | |||||||
Balance – October 31, 2020 | 2,182 | |||||||
Granted | 7,647 | |||||||
Settled on August 10, 2021 | (9,829 | ) | ||||||
Subtotal | — | — | ||||||
Granted on or after August 10, 2021 | 716,763 | |||||||
Balance – October 31, 2021 | — | 716,763 | ||||||
13. | Financial instruments and financial risk factors |
Fair values
The Company’s financial instruments consist of cash, accounts receivables, accounts payable and accrued liabilities, loans payable. The fair values of the cash, trade receivables, accounts payable and accrued liabilities approximate their carrying amounts because of their current nature.
Fair value hierarchy levels 1 to 3 are based on the degree to which the fair value is observable:
| • | Level 1 fair value measurements are those derived from quoted prices (unadjusted) in active markets for identical assets or liabilities; |
| • | Level 2 fair value measurements are those derived from inputs other than quoted prices included within Level 1 that are observable for the asset or liability, either directly (i.e. as prices) or indirectly (i.e. derived from prices); and |
| • | Level 3 fair value measurements are those derived from valuation techniques that include inputs for the asset or liability that are not based on observable market data (unobservable inputs). |
There were no transfers between the levels during the current or prior year.
The Company’s financial assets measured at fair value on a recurring basis were calculated as follows:
| Balance | Quoted prices in active markets for identical assets (Level 1) | Significant other observable inputs (Level 2) | Significant unobservable inputs (Level 3) | |||||||||||||
| $ | $ | $ | $ | |||||||||||||
As at October 31, 2021 | ||||||||||||||||
Accounts receivable | 4,072,701 | — | 4,072,701 | — | ||||||||||||
| 4,072,701 | — | 4,072,701 | — | |||||||||||||
As at October 31, 2020 | ||||||||||||||||
Accounts receivable | 571,300 | — | 571,300 | — | ||||||||||||
| 571,300 | — | 571,300 | — | |||||||||||||
F-
5
5
Li-Cycle
Holdings Corp.Notes to the consolidated financial statements
Year ended October 31, 2021, 2020, and 2019
(Expressed in U.S. dollars)
See Note 4 above for additional details related to measurement of accounts receivable.
The Company’s financial liabilities measured at fair value on a recurring basis were calculated as follows:
| Balance | Quoted prices in active markets for identical assets (Level 1) | Significant other observable inputs (Level 2) | Significant unobservable inputs (Level 3) | |||||||||||||
| $ | $ | $ | $ | |||||||||||||
As at October 31, 2021 | ||||||||||||||||
Restricted share units | — | — | — | — | ||||||||||||
| Conversion feature of convertible debt | 29,028,938 | — | 29,028,938 | — | ||||||||||||
Warrants | 82,109,334 | 53,549,989 | 28,559,344 | — | ||||||||||||
| 111,138,272 | 53,549,989 | 57,588,282 | — | |||||||||||||
As at October 31, 2020 | ||||||||||||||||
Restricted share units | 171,849 | — | 171,849 | — | ||||||||||||
| 171,849 | — | 171,849 | — | |||||||||||||
Currency risk
It is management’s opinion that the Company is not exposed to significant currency risk as its cash is denominated in both Canadian and U.S. dollars and funds its operations accordingly.
At October 31, 2021, the Company had Canadian dollar denominated cash of approximately Cdn. $1.3 million and Canadian dollar denominated net liabilities and loans payable of approximately Cdn. $23.9 million. The remaining amounts were denominated in U.S. dollars and immaterial amounts of other currencies. Gains and losses arising upon translation of these amounts into U.S. dollars for inclusion in the
consolidated financial statements are recorded in other income and expenses as foreign exchange. A
5% strengthening of the Canadian dollar versus the U.S. dollar, at October
31,
2021, would have increased the foreign exchange loss for the year by approximately $
0.9 million while a
5% weakening of the Canadian dollar would have had approximately the equal but opposite effect. This analysis assumes that all other variables remain constant.
Interest rate risk
Interest rate risk is the risk arising from the effect of changes in prevailing interest rates on the Company’s financial instruments. The Company is exposed to interest rate risk, as it has variable interest rate debt, see Note 10.
Credit, liquidity, and market risks
Credit risks associated with cash are minimal as the Company deposits majority of its cash with a large Canadian financial institution. The Company’s credit risks associated with receivables are managed and exposure to potential loss is assessed as minimal.
Ultimate responsibility for liquidity risk management rests with the board of directors, which has established an appropriate liquidity risk management framework for the management of the Company’s short-term, medium and long-term funding and liquidity requirements.
F-
5
6
Li-Cycle
Holdings Corp.Notes to the consolidated financial statements
Year ended October 31, 2021, 2020, and 2019
(Expressed in U.S. dollars)
Market risks associated with short-term investments are assessed as minimal as they are considered short-term in nature.
All of the Company’s financial liabilities have contractual cash flows as follows:
| Carrying amount | Contractual cash flows | Year 1 | Year 2 | Year 3 | Year 4 | Year 5 | Thereafter | |||||||||||||||||||||||||
| $ | $ | $ | $ | $ | $ | $ | $ | |||||||||||||||||||||||||
As at October 31, 2021 | ||||||||||||||||||||||||||||||||
Accounts payable and accrued liabilities | 18,701,116 | 18,701,116 | 18,701,116 | — | — | — | — | — | ||||||||||||||||||||||||
Lease liabilities | 29,364,869 | 35,934,570 | 4,517,775 | 4,634,401 | 3,785,984 | 3,374,696 | 3,311,808 | 16,309,906 | ||||||||||||||||||||||||
Loan payable | 39,748 | 41,338 | 6,384 | 6,618 | 6,860 | 7,111 | 7,371 | 6,994 | ||||||||||||||||||||||||
Convertible Debt | 100,877,838 | 142,682,078 | — | — | — | — | 142,682,078 | — | ||||||||||||||||||||||||
Warrants | 82,109,334 | — | — | — | — | — | — | — | ||||||||||||||||||||||||
Restoration provisions | 334,233 | 302,049 | — | 84,582 | — | — | 54,842 | 162,625 | ||||||||||||||||||||||||
231,427,138 | 197,661,151 | 23,225,275 | 4,725,601 | 3,792,844 | 3,381,807 | 146,056,099 | 16,479,525 | |||||||||||||||||||||||||
| Carrying amount | Contractual cash flows | Year 1 | Year 2 | Year 3 | Year 4 | Year 5 | Thereafter | |||||||||||||||||||||||||
| $ | $ | $ | $ | $ | $ | $ | $ | |||||||||||||||||||||||||
As at October 31, 2020 | ||||||||||||||||||||||||||||||||
Accounts payable and accrued liabilities | 4,364,370 | 4,364,372 | 4,364,372 | — | — | — | — | — | ||||||||||||||||||||||||
Restricted share units | 171,849 | 171,849 | 171,849 | — | — | — | — | — | ||||||||||||||||||||||||
Lease liabilities | 3,613,170 | 4,529,662 | 805,946 | 680,943 | 568,434 | 584,269 | 479,833 | 1,410,237 | ||||||||||||||||||||||||
Loan payable | 2,247,878 | 2,628,652 | 1,782,888 | 845,763 | — | — | — | — | ||||||||||||||||||||||||
Restoration provisions | 321,400 | 333,866 | — | 81,166 | — | — | 52,627 | 200,074 | ||||||||||||||||||||||||
10,718,667 | 12,028,401 | 7,125,055 | 1,607,872 | 568,434 | 584,269 | 532,460 | 1,610,311 | |||||||||||||||||||||||||
Capital risk management
The Company manages its capital to ensure that entities in the Company will be able to continue as a going concern while maximizing the return to shareholders through the optimization of the debt and equity balance.
The capital structure of the Company consists of net debt (borrowings after deducting cash and bank balances) and equity of the Company (comprising issued share capital, contributed surplus and accumulated deficit as disclosed in Note 12).
The Company is not subject to any externally imposed capital requirements. The Company’s Board of Directors reviews the capital structure on a semi-annual basis. As part of this review, the Board considers the cost of capital and the risks associated with each class of capital.
F-
5
7
Li-Cycle
Holdings Corp.Notes to the consolidated financial statements
Year ended October 31, 2021, 2020, and 2019
(Expressed in U.S. dollars)
14. | Right-of-use assets |
Premises | Equipment | Total | ||||||||||
Cost | $ | $ | $ | |||||||||
At October 31, 2019 | 2,783,313 | 53,262 | 2,836,575 | |||||||||
Additions & modifications | 1,550,957 | 61,176 | 1,612,133 | |||||||||
Foreign Exchange on Translation | 19,731 | (629 | ) | 19,102 | ||||||||
At October 31, 2020 | 4,354,001 | 113,809 | 4,467,810 | |||||||||
Additions & modifications | 24,467,955 | 19,960 | 24,487,915 | |||||||||
At October 31, 2021 | 28,821,956 | 133,769 | 28,955,725 | |||||||||
Accumulated depreciation | ||||||||||||
At October 31, 2019 | — | — | — | |||||||||
Depreciation | (584,343 | ) | (16,391 | ) | (600,734 | ) | ||||||
Foreign Exchange on Translation | (7,810 | ) | (178 | ) | (7,988 | ) | ||||||
At October 31, 2020 | (592,153 | ) | (16,569 | ) | (608,722 | ) | ||||||
Depreciation | (1,302,026 | ) | (35,217 | ) | (1,337,243 | ) | ||||||
At October 31, 2021 | (1,894,179 | ) | (51,786 | ) | (1,945,965 | ) | ||||||
Carrying amounts | ||||||||||||
At October 31, 2019 | 2,783,313 | 53,262 | 2,836,575 | |||||||||
At October 31, 2020 | 3,761,848 | 97,240 | 3,859,088 | |||||||||
At October 31, 2021 | 26,927,777 | 81,983 | 27,009,760 | |||||||||
The weighted average lease term is five years.
15. | Lease liabilities |
The Company has the following lease liabilities as of October 31, 2021.
| Maturity analysis | Year 1 | Year 2 | Year 3 | Year 4 | Year 5 | Thereafter | Total | |||||||||||||||||||||
| Undiscounted | $ | $ | $ | $ | $ | $ | $ | |||||||||||||||||||||
Premises | 4,468,877 | 4,590,357 | 3,741,940 | 3,332,312 | 3,290,786 | 16,302,071 | 35,726,343 | |||||||||||||||||||||
Equipment | 48,898 | 44,044 | 44,044 | 42,384 | 21,022 | 7,835 | 208,227 | |||||||||||||||||||||
Total | 4,517,775 | 4,634,401 | 3,785,984 | 3,374,696 | 3,311,808 | 16,309,906 | 35,934,570 | |||||||||||||||||||||
| Lease liabilities | Current | Non-Current | Total | |||||||||
| Discounted | $ | $ | $ | |||||||||
Premises | 2,836,348 | 26,366,448 | 29,202,796 | |||||||||
Equipment | 32,447 | 129,626 | 162,073 | |||||||||
Total | 2,868,795 | 26,496,074 | 29,364,869 | |||||||||
F-
5
8
Li-Cycle
Holdings Corp.Notes to the consolidated financial statements
Year ended October 31, 2021, 2020, and 2019
(Expressed in U.S. dollars)
The Company has the following lease liabilities as of At October 31, 2020.
| Maturity analysis | Year 1 | Year 2 | Year 3 | Year 4 | Year 5 | Thereafter | Total | |||||||||||||||||||||
| Undiscounted | $ | $ | $ | $ | $ | $ | $ | |||||||||||||||||||||
Premises | 769,865 | 650,087 | 549,908 | 565,742 | 462,851 | 1,410,237 | 4,408,690 | |||||||||||||||||||||
Equipment | 36,081 | 30,856 | 18,526 | 18,526 | 16,982 | — | 120,972 | |||||||||||||||||||||
Total | 805,946 | 680,943 | 568,434 | 584,268 | 479,833 | 1,410,237 | 4,529,662 | |||||||||||||||||||||
| Lease liabilities | Current | Non-Current | Total | |||||||||
| Discounted | $ | $ | $ | |||||||||
Premises | 565,296 | 2,949,707 | 3,515,003 | |||||||||
Equipment | 26,059 | 72,108 | 98,167 | |||||||||
Total | 591,355 | 3,021,815 | 3,613,170 | |||||||||
In the twelve months ended October 31, 2021, the Company recognized an interest expense of $449,571 related to lease liabilities.
The Company’s lease obligations include leases for plant operations, storage facilities, and office space for employees. In the twelve months ended October 31, 2021, the Company has added 4 new premises leases, 1 new equipment lease and modified 6 leases.
16. | Restoration provisions |
The Company has a legal obligation to complete the site restoration and decommissioning of its leased plant properties in New York and Ontario. The provision for decommissioning and site restoration is determined using the estimated costs provided by the New York Department of Environmental Conservation and Ontario Ministry of the Environment, Conservation and Parks.
The following table represents the continuity of the restoration provision associated with the Company’s leased plant properties:
Restoration provisions at October 31, 2019 | $ | — | ||
Initial recognition | $ | 321,400 | ||
Interest Recognized | $ | — | ||
Restoration provisions at October 31, 2020 | $ | 321,400 | ||
Interest Recognized | 3,194 | |||
Foreign exchange recognized | 9,639 | |||
Restoration provisions at October 31, 2021 | $ | 334,233 | ||
The present value of the restoration provision of $334,233 was calculated using an average risk-free rate of 0.61%.
F-
59
Li-Cycle
Holdings Corp.Notes to the consolidated financial statements
Year ended October 31, 2021, 2020, and 2019
(Expressed in U.S. dollars)
17. | Accounts payable and accrued liabilities |
October 31, 2021 | October 31, 2020 | |||||||
$ | $ | |||||||
Accounts payable | 9,447,394 | 2,454,421 | ||||||
Accrued expenses | 6,452,754 | 1,177,377 | ||||||
Accrued compensation | 2,800,968 | 732,574 | ||||||
18,701,116 | 4,364,372 | |||||||
Accrued expenses include accruals for purchase of plant and equipment, audit fees, legal and consulting fees, and operational and inventory purchases.
18. | Commitments |
As of October 31, 2021, there were $6.9 million in committed purchase orders or agreements for equipment and services (October 31, 2020: $4.2 million).
19. | Loss per share |
For comparability, the weighted average number of ordinary shares and the number of potential common shares have been scaled by the exchange ratio of 1:39.91 for periods prior to the completion of the business combination on August 10, 2021.
| Year Ended October 31, | ||||||||||||
2021 | 2020 | 2019 | ||||||||||
Net loss | $ | (226,559,288 | ) | $ | (9,275,962 | ) | $ | (4,100,782 | ) | |||
Weighted average number of ordinary shares | 110,119,135 | 82,571,828 | 71,891,372 | |||||||||
Basic and diluted loss per share | $ | (2.06 | ) | $ | (0.11 | ) | $ | (0.06 | ) | |||
Adjustments for diluted loss per share were not made for the twelve months ended October 31, 2021, 2020 and 2019 as they would be anti-dilutive in nature. The following potential common shares are anti-dilutive and are therefore excluded from the weighted average number of common shares for the purpose of diluted earnings per share:
| Year Ended October 31, | ||||||||||||
2021 | 2020 | 2019 | ||||||||||
Stock options | 5,296,553 | 5,327,985 | 3,991,000 | |||||||||
Warrants | 22,999,894 | — | — | |||||||||
Convertible debt | 7,493,795 | — | 536,231 | |||||||||
Restricted share units | 716,763 | 87,084 | — | |||||||||
36,507,005 | 5,415,069 | 4,527,231 | ||||||||||
20. | Segment reporting |
The consolidated financial data presented in these financial statements is reviewed regularly by the Company’s chief operating decision maker (“CODM”) for making strategic decisions, allocations resources
F-
6
0
Li-Cycle
Holdings Corp.Notes to the consolidated financial statements
Year ended October 31, 2021, 2020, and 2019
(Expressed in U.S. dollars)
and assessing performance, in consultation with the Board of Directors. The Corporation’s CODM is its Chief Executive Officer.
During the twelve months ended October 31, 2021, the Company operated in Canada and began operations in the United States. Management has concluded that the customers, and the nature and method of distribution of goods and services delivered, if any, to these geographic regions are similar in nature. The risks and returns across the geographic regions are not dissimilar; therefore, the Company operates as a single operating segment.
The following is a summary of the Company’s geographical information:
| Canada | United States | Total | ||||||||||
| $ | $ | $ | ||||||||||
For the Year Ended October 31, 2021 | ||||||||||||
Revenue | 2,999,249 | 4,375,627 | 7,374,876 | |||||||||
Non-current assets | 15,476,877 | 37,922,346 | 53,399,223 | |||||||||
For the Year Ended October 31, 2020 | ||||||||||||
Revenue | 792,254 | — | 792,254 | |||||||||
Non-current assets | 3,395,049 | 6,066,619 | 9,461,668 | |||||||||
For the Year Ended October 31, 2019 | ||||||||||||
Revenue | 48,160 | — | 48,160 | |||||||||
Non-current assets | 1,060,792 | — | 1,060,792 | |||||||||
The Company does not currently have active operations in other geographical regions.
The following is a summary of the Company’s main customers:
| Year Ended October 31, | ||||||||||||
2021 | 2020 | 2019 | ||||||||||
% | % | % | ||||||||||
Revenue | ||||||||||||
Customer A | 42 | % | 67 | % | 0 | % | ||||||
Customer B | 52 | % | 0 | % | 0 | % | ||||||
Accounts Receivable | ||||||||||||
Customer A | 53 | % | 90 | % | 0 | % | ||||||
Customer B | 45 | % | 0 | % | 0 | % | ||||||
F-
6
1
Li-Cycle
Holdings Corp.Notes to the consolidated financial statements
Year ended October 31, 2021, 2020, and 2019
(Expressed in U.S. dollars)
21. | Government funding |
The Company has received government grants and investment tax credits from the Government of Canada and the Government of Ontario for research and development activities, as set forth below:
October 31, 2021 | October 31, 2020 | October 31, 2019 | ||||||||||
$ | $ | $ | ||||||||||
Research and development expenses, gross | 2,694,999 | 2,809,537 | 3,134,468 | |||||||||
Less: Government grants | (32,427 | ) | (2,032,869 | ) | (629,346 | ) | ||||||
Less: Investment tax credits | — | — | (393,464 | ) | ||||||||
Research and development expenses, net | 2,662,572 | 776,668 | 2,111,658 | |||||||||
In addition, for twelve months ended October 31, 2021, the Company has received $60,499 in other government grants recognized as an offset against employee salaries and benefits expenses (2020: $168,027, 2019:$10,916).
22. | Income taxes |
The recovery of income taxes differs from the amount obtained by applying the statutory Canadian Federal and Provincial income tax rates to the loss for the year as follows:
October 31, 2021 $ | October 31, 2020 $ | October 31, 2019 $ | ||||||||||
Net loss and comprehensive loss for the period before tax | (226,559,288 | ) | (9,275,962 | ) | (4,100,782 | ) | ||||||
Statutory tax rates | 26.5 | % | 26.5 | % | 26.5 | % | ||||||
(60,038,210 | ) | (2,458,130 | ) | (1,086,707 | ) | |||||||
Change in unrecognized deferred tax amounts | 8,799,310 | 2,365,715 | 993,703 | |||||||||
Non-deductible item and others | 51,238,900 | 92,415 | 93,004 | |||||||||
Income tax expense | — | — | — | |||||||||
The Company incurred significant transaction costs in the course of becoming a listed entity that have been recorded as a reduction in the proceeds related to the issuance of shares. The deferred tax asset associated with these expenses in the amount of $13 million has not been recorded as a deferred tax asset.
F-
6
2
Li-Cycle
Holdings Corp.Notes to the consolidated financial statements
Year ended October 31, 2021, 2020, and 2019
(Expressed in U.S. dollars)
At October 31, 2021,2020 and 2019, the Company has aggregate
non-capital
losses for Canadian income tax purposes of approximately $49 million, $13 million, and $4 million respectively that expire in the period 2037 to 2040. In addition, the Company has net operating losses for US income tax purposes of approximately $5 million that carryforward indefinitely. Management cannot assert that the realization of the income tax benefits related to these losses and other potential deferred income tax assets is more likely than not to be realized. Accordingly, the Company has not recognized the following deferred income tax assets in the consolidated financial statements:October 31, 2021 $ | October 31, 2020 $ | October 31, 2019 $ | ||||||||||
Tax losses and credits carryforwards | 14,341,855 | 3,799,216 | 1,163,353 | |||||||||
Share issuance costs | 12,647,471 | — | — | |||||||||
Convertible debt | 250,729 | — | — | |||||||||
Reserves and provisions | 233,840 | 84,464 | 24,164 | |||||||||
Other | 97,360 | — | — | |||||||||
Plant and equipment, due to differences in amortization | (2,732,757 | ) | (205,158 | ) | (184,536 | ) | ||||||
Right of use assets, net of lease liabilities | 615,993 | (65,395 | ) | — | ||||||||
25,454,491 | 3,613,127 | 1,002,981 | ||||||||||
Deferred tax assets not recognized | (25,454,491 | ) | (3,613,127 | ) | (1,002,981 | ) | ||||||
| — | — | — | ||||||||||
23. | Notes to the Consolidated Statements of Cash Flows |
Cash consists of cash deposits with financial institutions. Cash equivalents consists of overnight guaranteed investment certificates with financial institutions. As of October 31, 2021, the Company had cash on hand of $6,858,298 and cash equivalents in the form of overnight guaranteed investment certificates of $590,000,000.
Interest paid during the year amounted to $1,923,202 (2020 – $519,769, 2019 – $NaN).
Changes in liabilities arising from financing
activities
comprise the following:| Restricted share units | Lease liabilities | Loans payable | Restoration provisions | Convertible debt | Conversion feature of convertible debt | Deferred government funding | ||||||||||||||||||||||
Balance, October 31, 2019 | — | — | 87,381 | — | 384,207 | 94,985 | 1,067,318 | |||||||||||||||||||||
Cash changes: | ||||||||||||||||||||||||||||
Repayments of lease liabilities | (387,508) | |||||||||||||||||||||||||||
Proceeds from loans payable | 2,153,110 | |||||||||||||||||||||||||||
Repayment of loans payable | (12,881) | |||||||||||||||||||||||||||
Proceeds from government grants | 1,182,599 | |||||||||||||||||||||||||||
Total changes from financing cash flows | �� | (387,508) | 2,227,610 | — | 384,207 | 94,985 | 2,249,917 | |||||||||||||||||||||
Non-cash changes: | ||||||||||||||||||||||||||||
| New leases | 4,141,153 | |||||||||||||||||||||||||||
F-
6
3
Li-Cycle
Holdings Corp.Notes to the consolidated financial statements
Year ended October 31, 2021, 2020, and 2019
(Expressed in U.S. dollars)
| Restricted share units | Lease liabilities | Loans payable | Restoration provisions | Convertible debt | Conversion feature of convertible debt | Deferred government funding | ||||||||||||||||||||||
Grant of restricted share units | 88,425 | |||||||||||||||||||||||||||
Fair value loss on restricted share units | 84,454 | |||||||||||||||||||||||||||
Accrued interest and accretion | 9,931 | |||||||||||||||||||||||||||
New restoration provisions | 321,400 | |||||||||||||||||||||||||||
Conversion of convertible debt | (397,424) | (94,985) | ||||||||||||||||||||||||||
Amortization of government grants | (2,226,910) | |||||||||||||||||||||||||||
| Foreign exchange (gain) or loss | (1,030) | (140,475) | 20,268 | 3,286 | (23,007) | |||||||||||||||||||||||
Balance, October 31, 2020 | 171,849 | 3,613,170 | 2,247,878 | 321,400 | — | — | — | |||||||||||||||||||||
Cash changes: | ||||||||||||||||||||||||||||
Repayments of lease liabilities | (884,024) | |||||||||||||||||||||||||||
Proceeds from loans payable | 10,091,220 | |||||||||||||||||||||||||||
Repayment of loans payable | (12,544,339) | |||||||||||||||||||||||||||
Proceeds from convertible debt | 70,719,220 | 27,681,043 | — | |||||||||||||||||||||||||
Total changes from financing cash flows | — | (884,024) | (2,453,119) | — | 70,719,220 | 27,681,043 | — | |||||||||||||||||||||
Non-cash changes: | ||||||||||||||||||||||||||||
New leases | 26,261,895 | |||||||||||||||||||||||||||
Additions to restoration provision | ||||||||||||||||||||||||||||
Grant of restricted share units | 604,943 | |||||||||||||||||||||||||||
Fair value loss on restricted share units | 3,096,940 | |||||||||||||||||||||||||||
RSU FMV transfer to share capital on public transaction | (3,922,754) | |||||||||||||||||||||||||||
Accrued interest and accretion | 3,194 | 1,129,680 | ||||||||||||||||||||||||||
| Foreign exchange loss | 49,022 | 373,828 | 244,989 | 9,639 | ||||||||||||||||||||||||
New restoration provisions | — | |||||||||||||||||||||||||||
| Fair value loss on conversion feature of convertible debt | 1,347,895 | |||||||||||||||||||||||||||
Amortization of government grants | — | |||||||||||||||||||||||||||
Balance, October 31, 2021 | — | 29,364,869 | 39,748 | 334,233 | 71,848,900 | 29,028,938 | — | |||||||||||||||||||||
24. | Subsequent events |
On December 14, 2021, the Company announced a
non-binding
letter of intent with LG Chem, Ltd. (“LGC”) and LG Energy Solution, Ltd. (“LGES”) for a manufacturing scrap supply and nickel sulphateoff-take
agreement. Upon execution of the definitive commercial agreement related to the proposed supply andoff-take
arrangements, LGC and LGES will together make a $50 million investment to purchase common shares ofLi-Cycle
(each making a $25 million investment). Under the terms of the proposed investment, LG Chem and LG Energy Solution will each subscribe for 2,208,480 Common Shares at a price of $11.32 per share, for an aggregate investment in the Company of $50 million (the “Investment”). The subscription price per Common Share is based on a 30-day volume-weighted average price of the Common
F-
6
4
Li-Cycle
Holdings Corp.Notes to the consolidated financial statements
Year ended October 31, 2021, 2020, and 2019
(Expressed in U.S. dollars)
Shares prior to LGES’ investment committee approval of LGES’ participation in the Investment on October 28th, 2021. The closing of the Investment is conditional on the parties entering into mutually acceptable definitive commercial agreements regarding the supply of nickel-bearing
lithium-ion
battery scrap from LGES toLi-Cycle
and nickel sulphateoff-take
fromLi-Cycle
to LGES and LGC.On December 31, 2021, the Company exercised its election to pay interest on its $100,000,000 convertible note to Koch Strategic Platforms through a payment
in-kind
and issued a new note under the same terms as the original note, in lieu of interest payments, with an issuance date of December 31, 2021 for the amount of $1,827,778.On December 27, 2021, the Company announced that it will redeem all of its warrants to purchase common shares of the Company that remain outstanding at 5:00 p.m. New York City time on January 26, 2022 (the “Redemption Date”) for a redemption price of $0.10
per Warrant. Based on the Redemption Fair Market Value that was announced on January 11, 2022, Warrant holders who surrendered their Warrants on a “Make-Whole Exercise” prior to the Redemption Date received
0.253Common Shares per Warrant. As of January 30, 2022, (i) 9,678 warrants have been exercised at the exercise price of $11.50 per common share, and (ii) 22,540,651 warrants have been surrendered by holders in the Make-Whole Exercise. The remaining 449,665 unexercised warrants will be redeemed at $0.10 per warrant.
F-
6
5
Li-Cycle
Holdings Corp.
PROSPECTUS
, 2022
PART II
Information Not Required in Prospectus
Item 6. Indemnification of Directors and Officers
In accordance with the Business Corporations Act (Ontario) and pursuant to the Company’s
by-laws
subject to certain conditions, the Company shall indemnify, to the maximum extent permitted by law, (i) any director or officer of the Company; (ii) any former director or officer of the Company; (iii) any individual who acts or acted at the Company’s request as a director or officer, or in a similar capacity, of another entity, against all costs, charges and expenses reasonably incurred by the individual in respect of any civil, criminal, administrative, investigative or other proceeding in which the individual is involved because of that association with the Company or other entity. The Company shall advance monies to a director, officer or other individual for costs, charges and expenses reasonably incurred in connection with such a proceeding; provided that such individual must repay the monies if the individual does not fulfill the conditions described below.Indemnification is prohibited under the OBCA unless the individual (i) acted honestly and in good faith with a view to best interests of the Company, or the best interests of the other entity for which the individual acted as director or officer or in a similar capacity at the Company’s request; and (ii) in the case of a criminal or administrative action or proceeding that is enforced by a monetary penalty, the individual had reasonable grounds for believing that his or her conduct was lawful.
Item 7. Recent Sales of Unregistered Securities
The following list sets forth information regarding all securities sold or granted by us within the past three years that were not registered under the Securities Act and the consideration, if any, received by us for such securities.
In connection with the Business Combination, on August 10, 2021, we issued 96,476,955 common shares to former shareholders of
Li-Cycle
Corp. in exchange for their shares ofLi-Cycle
Corp. pursuant to the Business Combination Agreement.In connection with the Business Combination, on August 10, 2021, we issued 7,500,000 common shares to Peridot Class B Holders pursuant to the Business Combination Agreement.
In connection with the closing of the PIPE Financing, on August 10, 2021, we issued 31,549,000 common shares for a purchase price of $10.00 per share for aggregate proceeds of $315,490,000.
On September 29, 2021, we entered into the KSP Note Purchase Agreement with Spring Creek Capital, LLC and issued to Spring Creek Capital, LLC the KSP Note in the principal amount of $100,000,000. On December 31, 2021, we issued to Spring Creek Capital, LLC a PIK Note in the principal amount of $1,827,778. Spring Creek Capital, LLC assigned the KSP Note and the then-outstanding PIK Notes to an affiliate, Wood River Capital, LLC on May 1, 2022. On June 30, 2022, we issued to Wood River Capital, LLC a PIK Note in the principal amount of $4,095,740.
In connection with the LG Subscription, we issued (i) an initial tranche of 4,416,960 common shares, in the aggregate, at a price of $10.00 per share, for an aggregate initial tranche subscription price of approximately $44.2 million, and (ii) a second tranche of 883,392 common shares, in the aggregate, at a price of $6.60 per share (based on the volume-weighted average trading price of the Company’s common shares for the 5 trading days ending immediately prior to April 29, 2022), for an aggregate second tranche subscription price of approximately $5.8 million, for a total investment of $50.0 million. The LG Subscription was completed on May 11, 2022.
On May 5, 2022, we entered into the Glencore Note Purchase Agreement with Glencore and issued to Glencore on May 31, 2022, the Glencore Convertible Note in the aggregate principal amount of $200,000,000.
II-1
The foregoing securities issuances were made in reliance upon the exemption provided in Section 4(a)(2) of the Securities Act and/or Regulation D or Regulation S promulgated thereunder.
Item 8. Exhibits and Financial Statement Schedules.
(a) The following exhibits are included or incorporated by reference in this registration statement on
Form F-1:
The exhibits filed as part of this registration statement are listed in the index to exhibits immediately following the signature page to this registration statement, which index to exhibits is incorporated herein by reference.
Exhibit Index
II-2
II-3
II-4
| * | To be filed by amendment. |
| ** | Previously filed. |
| † | Indicates management contract or compensatory plan or arrangement. |
| †† | Certain of the exhibits and schedules to these exhibits have been omitted in accordance with Regulation S-K Item 601(a)(5). The registrant agrees to furnish a copy of all omitted exhibits and schedules to the SEC upon its request. |
| ††† | Pursuant to Item 601(b)(10)(iv) of Regulation S-K, portions of this exhibit have been omitted becauseLi-Cycle Corp. customarily and actually treats the omitted portions as private or confidential, and such portions are not material and would likely cause it competitive harm if publicly disclosed.Li-Cycle Holdings Corp. will supplementally provide an unredacted copy of this exhibit to the SEC or its staff upon request. |
All schedules have been omitted because they are not required, are not applicable or the information is otherwise set forth in the financial statements or notes thereto.
II-5
Item 9. Undertakings.
The undersigned registrant hereby undertakes:
To file, during any period in which offers or sales are being made, a post-effective amendment to this registration statement:
To include any prospectus required by Section 10(a)(3) of the Securities Act of 1933;
To reflect in the prospectus any facts or events arising after the effective date of the registration statement (or the most recent post-effective amendment thereof) which, individually or in the aggregate, represent a fundamental change in the information set forth in the registration statement. Notwithstanding the foregoing, any increase or decrease in volume of securities offered (if the total dollar value of securities offered would not exceed that which was registered) and any deviation from the low or high end of the estimated maximum offering range may be reflected in the form of prospectus filed with the Commission pursuant to Rule 424(b) if, in the aggregate, the changes in volume and price represent no more than 20% change in the maximum aggregate offering price set forth in the “Calculation of Registration Fee” table in the effective registration statement.
To include any material information with respect to the plan of distribution not previously disclosed in the registration statement or any material change to such information in the registration statement.
That, for the purpose of determining any liability under the Securities Act of 1933, each such post-effective amendment shall be deemed to be a new registration statement relating to the securities offered therein, and the offering of such securities at that time shall be deemed to be the initial bona fide offering thereof.
To remove from registration by means of a post-effective amendment any of the securities being registered which remain unsold at the termination of the offering.
That, for the purpose of determining liability under the Securities Act to any purchaser, each prospectus filed pursuant to Rule 424(b) as part of a registration statement relating to an offering, other than registration statements relying on Rule 430B or other than prospectuses filed in reliance on Rule 430A, will be deemed to be part of and included in the registration statement as of the date it is first used after effectiveness. Provided, however, that no statement made in a registration statement or prospectus that is part of the registration statement or made in a document incorporated or deemed incorporated by reference into the registration statement or prospectus that is part of the registration statement will, as to a purchaser with a time of contract of sale prior to such first use, supersede or modify any statement that was made in the registration statement or prospectus that was part of the registration statement or made in any such document immediately prior to such date of first use.
That, for the purpose of determining any liability under the Securities Act to any purchaser in the initial distribution of the securities, the undersigned registrant undertakes that in a primary offering of securities of the undersigned registrant pursuant to this registration statement, regardless of the underwriting method used to sell the securities to the purchaser, if the securities are offered or sold to such purchaser by means of any of the following communications, the undersigned registrant will be a seller to the purchaser and will be considered to offer or sell such securities to such purchaser:
| • | Any preliminary prospectus or prospectus of the undersigned registrant relating to the offering required to be filed pursuant to Rule 424; |
| • | Any free writing prospectus relating to the offering prepared by or on behalf of the undersigned registrant or used or referred to by the undersigned registrant; |
| • | The portion of any other free writing prospectus relating to the offering containing material information about the undersigned registrant or its securities provided by or on behalf of the undersigned registrant; and |
II-6
| • | Any other communication that is an offer in the offering made by the undersigned registrant to the purchaser. |
To file a post-effective amendment to the registration statement to include any financial statements required by Item 8.A of Form
20-F
at the start of any delayed offering or throughout a continuous offering.Insofar as indemnification for liabilities arising under the Securities Act of 1933 may be permitted to directors, officers and controlling persons of the registrant pursuant to the foregoing provisions, or otherwise, the registrant has been advised that in the opinion of the Securities and Exchange Commission such indemnification is against public policy as expressed in the Act and is, therefore, unenforceable. In the event that a claim for indemnification against such liabilities (other than the payment by the registrant of expenses incurred or paid by a director, officer or controlling person of the registrant in the successful defense of any action, suit or proceeding) is asserted by such director, officer or controlling person in connection with the securities being registered, the registrant will, unless in the opinion of its counsel the matter has been settled by controlling precedent, submit to a court of appropriate jurisdiction the question whether such indemnification by it is against public policy as expressed in the Act and will be governed by the final adjudication of such issue.
The undersigned registrant hereby undertakes as follows: that prior to any public reoffering of the securities registered hereunder through use of a prospectus which is a part of this registration statement, by any person or party who is deemed to be an underwriter within the meaning of Rule 145(c), the issuer undertakes that such reoffering prospectus will contain the information called for by the applicable registration form with respect to reofferings by persons who may be deemed underwriters, in addition to the information called for by the other items of the applicable form.
The registrant undertakes that every prospectus: (i) that is filed pursuant to the immediately preceding paragraph, or (ii) that purports to meet the requirements of Section 10(a)(3) of the Act and is used in connection with an offering of securities subject to Rule 415, will be filed as a part of an amendment to the registration statement and will not be used until such amendment is effective, and that, for purposes of determining any liability under the Securities Act of 1933, each such post-effective amendment shall be deemed to be a new registration statement relating to the securities offered therein, and the offering of such securities at that time shall be deemed to be the initial bona fide offering thereof.
The undersigned registrant hereby undertakes: (i) to respond to requests for information that is incorporated by reference into the prospectus pursuant to Item 4, 10(b), 11, or 13 of this form, within one business day of receipt of such request, and to send the incorporated documents by first class mail or other equally prompt means, and (ii) to arrange or provide for a facility in the United States for the purposes of responding to such requests. The undertaking in subparagraph (i) above include information contained in documents filed subsequent to the effective date of the registration statement through the date of responding to the request.
The undersigned registrant hereby undertakes to supply by means of a post-effective amendment all information concerning a transaction, and the company being acquired involved therein, that was not the subject of and included in the registration statement when it became effective.
II-7
SIGNATURES
Pursuant to the requirements of the Securities Act of 1933, as amended, the registrant certifies that it has reasonable grounds to believe that it meets all of the requirements for filing on Form
F-1
and has duly caused this registration statement to be signed on its behalf by the undersigned, thereunto duly authorized, in the city of Toronto, Ontario, Canada, on the 27th day of July, 2022.L I -C YCLE HOLDINGS CORP . | ||
| By: | /s/ Ajay Kochhar | |
Name: Ajay Kochhar Title: Co-Founder, President & CEO and Executive Director | ||
Pursuant to the requirements of the Securities Act of 1933, as amended, this registration statement has been signed by the following persons in the capacities and on the dates indicated.
Signature | Capacity | Date | ||
/s/ Ajay Kochhar Ajay Kochhar | Co-Founder, President & CEO and Executive Director (Principal Executive Officer) | July 27, 2022 | ||
/s/ Debbie Simpson Debbie Simpson | Chief Financial Officer (Principal Financial and Accounting Officer) | July 27, 2022 | ||
* Mark Wellings | Non-Executive Director | July 27, 2022 | ||
* Rick Findlay | Non-Executive Director | July 27, 2022 | ||
* Alan Levande | Non-Executive Director | July 27, 2022 | ||
* Scott Prochazka | Non-Executive Director | July 27, 2022 | ||
* Anthony Tse | Non-Executive Director | July 27, 2022 | ||
| *By: | /s/ Ajay Kochhar | |
| Ajay Kochhar | ||
Attorney-in-Fact | ||
II-8
AUTHORIZED REPRESENTATIVE
Pursuant to the requirement of the Securities Act of 1933, the undersigned, the duly undersigned representative in the United States of
Li-Cycle
Holdings Corp., has signed this registration statement in the City of Newark, State of Delaware, on July 27, 2022.| PUGLISI & ASSOCIATES | ||
| By: | /s/ Donald J. Puglisi | |
Name: Donald J. Puglisi Title: Managing Director | ||
II-9