united states
securities and exchange commission
washington, d.c. 20549
form n-csr
certified shareholder report of registered management
investment companies
Investment Company Act file number 811-23611
James Alpha Funds Trust
(Exact name of registrant as specified in charter)
515 Madison Avenue, 24th Floor, New York, NY 10022
(Address of principal executive offices) (Zip code)
Emile R. Molineaux
80 Arkay Drive, Suite 110, Hauppauge, NY 11788
(Name and address of agent for service)
Registrant's telephone number, including area code: 623-266-4567
Date of fiscal year end: 2/28
Date of reporting period: 2/29/2024
Item 1. Reports to Stockholders.

JAMES ALPHA FUNDS TRUST d/b/a EASTERLY FUNDS TRUST
CLASS A, C, I AND R6 SHARES
ANNUAL REPORT
February 29, 2024
THIS REPORT IS AUTHORIZED FOR DISTRIBUTION ONLY TO SHAREHOLDERS AND TO OTHERS WHO
HAVE RECEIVED A COPY OF THE PROSPECTUS.
February 29, 2024
Dear Fellow Shareholder:
We are pleased to provide you with this annual report on the economy and capital markets as well as performance of the Easterly Snow Capital Long/Short and Small Cap Value mutual funds. This report covers the annual period from February 28, 2023 through February 29, 2024. During the period, the Easterly Small Cap Value Fund (SNWIX) had a return of 16.4%, compared to a return of 5.6% for the Russell 2000 Value Index. For the same twelve-month period, the Long/Short Opportunity Fund (SNOIX) had a total return of 7.1%, compared to a return of 13.5% for the Russell 3000 Value Index. Consistent with our investment strategy, SNOIX utilized equity and ETF option contracts (derivative instruments) in an attempt to protect against investment principal and “hedge” or limit the overall equity exposure. Over the period, our use of equity options detracted 43 basis points from overall performance, while our use of ETF options reduced our total performance 104 bps. While we view this impact as material to performance, it was consistent with our investment objective for long-term capital appreciation and protection of investment principal. The use of derivatives did not cause the fund to realize higher than expected amounts of ordinary income, short-term capital gains or distributions.
Major indexes posted positive results for the period as better than expected economic data and declining inflation provided a supportive backdrop for equity performance. The outlook for economic growth has improved and with it, U.S. equity market valuations. The S&P 500 now trades at 20.4x forward earnings, above its long-term average of 16.6x. The rise in market valuations has been driven by an increased concentration of the of the largest stocks. As of 2/29/2024, the weight of the top 10 stocks in the S&P 500 increased to 33.6% of total market capitalization. Across the market cap spectrum, growth stocks significantly outpaced value stocks on relative terms. The valuation disparity between value and growth stocks widened, nearing levels last seen during the onset of the COVID Pandemic. The market’s valuation disparity continues to remain wide by historical standards.
The Federal funds rate is currently set between 5.25-5.5%, up 75 basis points from 12 months ago. The yield curve remains inverted but has narrowed over the past 12 months due to improving economic forecasts. Still, the length of the current inversion, as defined as the difference in the two-year US treasury note and 10-year bond, is the longest on record, highlighting persistent risk around recession. The Federal Reserve (Fed) has communicated that they no longer expect that a recession will be needed to bring inflation down and continue to forecast three rate reductions in 2024. With the Fed ending its sharpest tightening of monetary policy since the 1980s, many investors are now extrapolating that softening monetary policy conditions will support continued economic growth.
For now, with 2024 S&P 500 earnings estimates up 10% over the past twelve months, we expect markets to remain resilient despite contradicting signs of economic health. The Conference Board’s leading economic indicators crept up 0.1% in February, it’s the first increase since February 2022. At the same time, rising consumer debt, elevated corporate defaults and higher-for-longer interest rates are expected to weigh on US GDP growth. Against this fragmented backdrop, we think investors should avoid high growth names that are dependent on sustained earnings improvement. In our view, the direction of equity prices will be more modest than the past twelve months and driven by improving fundamentals across areas of the market that have already been in a recession.
The consistent application of our investment approach has led our Funds to outpace the broad-based indices over full market cycles. In turn, we continue to hold companies with compelling business fundamentals, skilled management teams, recurring cash flows and the flexibility to adapt to an inflationary environment. We believe the strong cash flow generation and capital flexibility of our businesses will provide meaningful protection if market fundamentals deteriorate. Thank you for your commitment and loyalty to Easterly Investment Partners.
20240328-3479084
| Easterly Snow Small Cap Value Fund |
| PORTFOLIO REVIEW (Unaudited) |
| February 29, 2024 |
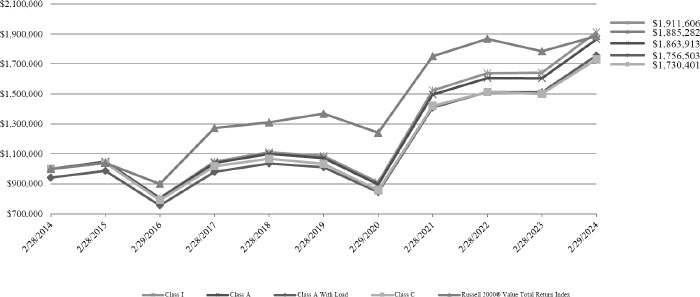
The Fund’s performance figures* for each of the periods ended February 29, 2024 compared to its benchmark:
| | | Annualized | Annualized | Annualized | Annualized |
| | 1 Year Return | 5 Year Return | 10 Year Return | Since Inception* | Since Inception** |
| Class I | 16.44% | 11.95% | 6.69% | 9.95% | N/A |
| Class A | 16.18% | 11.68% | 6.42% | 9.68% | N/A |
| Class A with load | 9.49% | 10.36% | 5.79% | 9.19% | N/A |
| Class C | 15.29% | 10.85% | 5.64% | 8.86% | N/A |
| Class R6 | 16.46% | N/A | N/A | N/A | 5.60% |
| Russell 2000® Value Total Return Index(a) | 5.61% | 6.62% | 6.55% | 8.86% | (2.94)% |
Performance data quoted above is historical. Past performance does not guarantee future results and current performance may be lower or higher than the performance data quoted. The investment return and principal value of an investment will fluctuate, so that shares when redeemed, may be worth more or less than their original cost. For more performance numbers current to the most recent month-end please call (833) 999-2636. The total operating expense ratio as stated in the fee table to the Portfolio’s prospectus dated July 1, 2023, is 2.20%, 2.45%, 3.20% and 2.20% for the I, A, C and R6 Classes, respectively.
| (a) | The Russell 2000® Value Total Return Index measures the performance of the small-cap segment of the US equity universe. The Russell 2000 is a subset of the Russell 3000® Index representing approximately 10% of the total market capitalization of that index. It includes approximately 2,000 of the smallest securities based on a combination of their market cap and current index membership. The Russell 2000 is constructed to provide a comprehensive and unbiased small-cap barometer and is completely reconstituted annually to ensure larger stocks do not distort the performance and characteristics of the true small-cap opportunity set. |
| * | Inception date for Class I, A and C is November 30, 2010. |
| ** | Inception date for Class R6 is November 4, 2021. |
A HYPOTHETICAL COMPARISON OF THE GROWTH OF $1,000,000 INVESTED IN THE
EASTERLY SNOW SMALL CAP VALUE FUND VS. BENCHMARK
| Top 10 Holdings by Industry | | % of Net Assets | |
| Banking | | | 14.9 | % |
| Insurance | | | 12.0 | % |
| Leisure Facilities & Services | | | 11.1 | % |
| Semiconductors | | | 8.3 | % |
| Oil & Gas Producers | | | 8.2 | % |
| Medical Equipment & Devices | | | 5.2 | % |
| Food | | | 4.8 | % |
| Retail - Discretionary | | | 4.3 | % |
| Commercial Support Services | | | 3.5 | % |
| Steel | | | 3.1 | % |
| Other/Cash & Equivalents | | | 24.6 | % |
| | | | 100.0 | % |
Please refer to the Schedule of Investments for a more detailed breakdown of the Fund’s assets.
| Easterly Snow Long/Short Opportunity Fund |
| PORTFOLIO REVIEW (Unaudited) |
| February 29, 2024 |
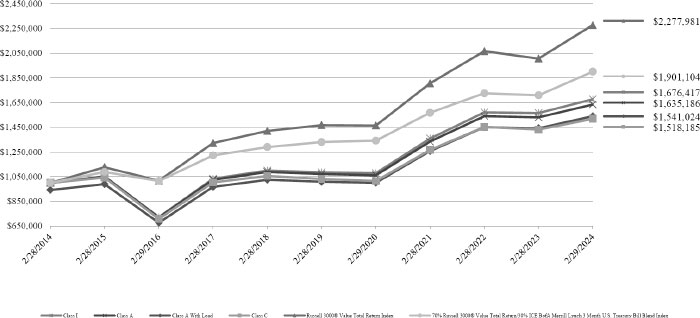
The Fund’s performance figures* for each of the periods ended February 29, 2024, compared to its benchmarks:
| | | Annualized | Annualized | Annualized | Annualized |
| | 1 Year Return | 5 Year Return | 10 Year Return | Since Inception* | Since Inception** |
| Class I | 7.07% | 9.09% | 5.30% | 6.05% | N/A |
| Class A | 6.84% | 8.83% | 5.04% | 5.80% | N/A |
| Class A with load | 0.70% | 7.55% | 4.42% | 5.44% | N/A |
| Class C | 5.99% | 8.03% | 4.26% | 5.03% | N/A |
| Class R6 | 7.10% | N/A | N/A | N/A | 3.96% |
| Russell 3000® Value Total Return Index(a) | 13.51% | 9.20% | 8.58% | 7.31% | 3.26% |
| 70% Russell 3000® Value Total Return/30% ICE BofA Merrill Lynch 3 Month U.S. Treasury Bill Blend Index(b) | 11.20% | 7.40% | 6.64% | 5.80% | 3.57% |
Performance data quoted above is historical. Past performance does not guarantee future results and current performance may be lower or higher than the performance data quoted. The investment return and principal value of an investment will fluctuate, so that shares when redeemed, may be worth more or less than their original cost. For more performance numbers current to the most recent month-end please call (833) 999-2636. The total operating expense ratio as stated in the fee table to the Portfolio’s prospectus dated July 1, 2023, is 1.36%, 1.61%, 2.35% and 1.36% for the I, A, C and R6 Classes, respectively.
| (a) | The Russell 3000® Value Total Return Index measures the performance of the largest 3,000 US companies representing approximately 97% of the investable US equity market. The Russell 3000 Index is constructed to provide a comprehensive, unbiased and stable barometer of the broad market and is completely reconstituted annually to ensure new and growing equities are included. |
| (b) | The 70% Russell 3000® Value Total Return/30% ICE BofA Merrill Lynch 3 Month U.S. Treasury Bill Blend Index consists of 70% Russell 3000® Value Total Return Index and 30% ICE BofA Merrill Lynch 3 Month U.S. Treasury Bill Index. The Russell 3000® Value Total Return Index measures the performance of the broad value segment of U.S. equity value universe. It includes those Russell 3000® companies with lower price-to-book ratios and lower forecasted growth values. The ICE BofA Merrill Lynch 3 Month U.S. Treasury Bill Index is an unmanaged market index of U.S. Treasury securities maturing in 90 days that assumes reinvestment of all income. |
| * | Inception date for Class I, A and C is April 28, 2006. |
| ** | Inception date for Class R6 is November 4, 2021. |
A HYPOTHETICAL COMPARISON OF THE GROWTH OF $1,000,000 INVESTED IN THE
EASTERLY SNOW LONG/SHORT OPPORTUNITY FUND VS. BENCHMARKS
| Top 10 Holdings by Industry | | % of Net Assets | |
| Oil & Gas Producers | | | 17.7 | % |
| Biotech & Pharma | | | 13.8 | % |
| Banking | | | 12.1 | % |
| Insurance | | | 7.6 | % |
| Semiconductors | | | 6.8 | % |
| Technology Hardware | | | 5.3 | % |
| Metals & Mining | | | 5.2 | % |
| Steel | | | 4.3 | % |
| Software | | | 3.9 | % |
| Exchange-Traded Funds | | | 3.8 | % |
| Other/Cash & Equivalents | | | 19.5 | % |
| | | | 100.0 | % |
Please refer to the Schedule of Investments for a more detailed breakdown of the Fund’s assets.
| EASTERLY SNOW SMALL CAP VALUE FUND |
| SCHEDULE OF INVESTMENTS |
| February 29, 2024 |
| Shares | | | | | Fair Value | |
| | | | | COMMON STOCKS — 94.2% | | | | |
| | | | | AEROSPACE & DEFENSE - 1.3% | | | | |
| | 9,038 | | | Barnes Group, Inc. | | $ | 315,788 | |
| | | | | | | | | |
| | | | | APPAREL & TEXTILE PRODUCTS - 1.1% | | | | |
| | 3,165 | | | Carter’s, Inc. | | | 256,207 | |
| | | | | | | | | |
| | | | | AUTOMOTIVE - 1.8% | | | | |
| | 4,847 | | | Modine Manufacturing Company(a) | | | 434,824 | |
| | | | | | | | | |
| | | | | BANKING - 14.9% | | | | |
| | 33,576 | | | Columbia Banking System, Inc. | | | 607,725 | |
| | 4,561 | | | Comerica, Inc. | | | 225,222 | |
| | 32,292 | | | First Commonwealth Financial Corporation | | | 420,765 | |
| | 40,644 | | | FNB Corporation | | | 542,191 | |
| | 35,954 | | | KeyCorporation | | | 513,064 | |
| | 3,813 | | | OFG Bancorp | | | 138,107 | |
| | 42,200 | | | Old National Bancorp | | | 693,345 | |
| | 11,907 | | | Zions Bancorp NA | | | 469,493 | |
| | | | | | | | 3,609,912 | |
| | | | | BIOTECH & PHARMA - 2.4% | | | | |
| | 16,112 | | | Collegium Pharmaceutical, Inc.(a) | | | 591,472 | |
| | | | | | | | | |
| | | | | CHEMICALS - 2.4% | | | | |
| | 10,452 | | | FMC Corporation | | | 589,388 | |
| | | | | | | | | |
| | | | | COMMERCIAL SUPPORT SERVICES - 3.5% | | | | |
| | 10,299 | | | ABM Industries, Inc. | | | 425,451 | |
| | 3,919 | | | AMN Healthcare Services, Inc.(a) | | | 220,522 | |
| | 11,247 | | | Cross Country Healthcare, Inc.(a) | | | 205,483 | |
| | | | | | | | 851,456 | |
| | | | | FOOD - 4.8% | | | | |
| | 36,701 | | | Pilgrim’s Pride Corporation(a) | | | 1,168,560 | |
See accompanying notes to financial statements.
| EASTERLY SNOW SMALL CAP VALUE FUND |
| SCHEDULE OF INVESTMENTS (Continued) |
| February 29, 2024 |
| Shares | | | | | Fair Value | |
| | | | | COMMON STOCKS — 94.2% (Continued) | | | | |
| | | | | HOME & OFFICE PRODUCTS - 1.0% | | | | |
| | 41,819 | | | ACCO Brands Corporation | | $ | 233,350 | |
| | | | | | | | | |
| | | | | | | | | |
| | | | | INDUSTRIAL SUPPORT SERVICES - 0.7% | | | | |
| | 1,095 | | | WESCO International, Inc. | | | 163,692 | |
| | | | | | | | | |
| | | | | INSURANCE - 12.0% | | | | |
| | 38,390 | | | CNO Financial Group, Inc. | | | 1,024,630 | |
| | 18,343 | | | Jackson Financial, Inc., Class A | | | 1,009,782 | |
| | 32,269 | | | Lincoln National Corporation | | | 888,688 | |
| | | | | | | | 2,923,100 | |
| | | | | LEISURE FACILITIES & SERVICES - 11.1% | | | | |
| | 35,389 | | | Bloomin’ Brands, Inc. | | | 961,873 | |
| | 21,344 | | | Brinker International, Inc.(a) | | | 989,081 | |
| | 42,500 | | | Cinemark Holdings, Inc.(a) | | | 739,925 | |
| | | | | | | | 2,690,879 | |
| | | | | MACHINERY - 2.8% | | | | |
| | 6,687 | | | Astec Industries, Inc. | | | 271,492 | |
| | 4,005 | | | Kennametal, Inc. | | | 101,086 | |
| | 5,157 | | | Terex Corporation | | | 295,754 | |
| | | | | | | | 668,332 | |
| | | | | MEDICAL EQUIPMENT & DEVICES - 5.2% | | | | |
| | 29,079 | | | Inmode Ltd.(a) | | | 639,738 | |
| | 16,718 | | | Integra LifeSciences Holdings Corporation(a) | | | 617,061 | |
| | | | | | | | 1,256,799 | |
| | | | | OIL & GAS PRODUCERS - 8.2% | | | | |
| | 17,593 | | | CNX Resources Corporation(a) | | | 368,573 | |
| | 71,026 | | | Crescent Point Energy Corporation | | | 518,490 | |
| | 33,768 | | | Delek US Holdings, Inc. | | | 861,422 | |
| | 4,308 | | | HF Sinclair Corporation | | | 239,094 | |
| | | | | | | | 1,987,579 | |
| | | | | REITS - 2.5% | | | | |
| | 25,310 | | | Highwoods Properties, Inc. | | | 618,830 | |
See accompanying notes to financial statements.
| EASTERLY SNOW SMALL CAP VALUE FUND |
| SCHEDULE OF INVESTMENTS (Continued) |
| February 29, 2024 |
| Shares | | | | | Fair Value | |
| | | | | COMMON STOCKS — 94.2% (Continued) | | | | |
| | | | | RETAIL - DISCRETIONARY - 4.3% | | | | |
| | 6,225 | | | Advance Auto Parts, Inc. | | $ | 420,437 | |
| | 15,094 | | | Urban Outfitters, Inc.(a) | | | 627,155 | |
| | | | | | | | 1,047,592 | |
| | | | | SEMICONDUCTORS - 8.3% | | | | |
| | 1,609 | | | Diodes, Inc.(a) | | | 109,380 | |
| | 34,781 | | | Photronics, Inc.(a) | | | 1,001,345 | |
| | 12,796 | | | Silicon Motion Technology Corporation - ADR | | | 905,829 | |
| | | | | | | | 2,016,554 | |
| | | | | SOFTWARE - 0.6% | | | | |
| | 2,100 | | | Ziff Davis, Inc.(a) | | | 144,396 | |
| | | | | | | | | |
| | | | | STEEL - 3.1% | | | | |
| | 14,092 | | | Commercial Metals Company | | | 760,968 | |
| | | | | | | | | |
| | | | | TECHNOLOGY HARDWARE - 2.2% | | | | |
| | 3,956 | | | Clearfield, Inc.(a) | | | 119,353 | |
| | 491 | | | Super Micro Computer, Inc.(a) | | | 425,264 | |
| | | | | | | | 544,617 | |
| | | | | | | | | |
| | | | | TOTAL COMMON STOCKS (Cost $18,452,990) | | | 22,874,295 | |
| | | | | | | | | |
| | | | | TOTAL INVESTMENTS - 94.2% (Cost $18,452,990) | | $ | 22,874,295 | |
| | | | | OTHER ASSETS IN EXCESS OF LIABILITIES - 5.8% | | | 1,408,585 | |
| | | | | NET ASSETS - 100.0% | | $ | 24,282,880 | |
| ADR | - American Depositary Receipt |
| | |
| LTD | - Limited Company |
| | |
| REITS | - Real Estate Investment Trust |
| | |
| (a) | Non-income producing security. |
See accompanying notes to financial statements.
| EASTERLY SNOW LONG/SHORT OPPORTUNITY FUND |
| SCHEDULE OF INVESTMENTS |
| February 29, 2024 |
| Shares | | | | | Fair Value | |
| | | | | COMMON STOCKS — 106.3% | | | | |
| | | | | AEROSPACE & DEFENSE - 1.0% | | | | |
| | 2,325 | | | Lockheed Martin Corporation, B | | $ | 995,658 | |
| | | | | | | | | |
| | | | | | | | | |
| | | | | APPAREL & TEXTILE PRODUCTS - 3.5% | | | | |
| | 24,627 | | | PVH Corporation | | | 3,365,772 | |
| | | | | | | | | |
| | | | | AUTOMOTIVE - 1.5% | | | | |
| | 43,770 | | | Phinia, Inc. | | | 1,497,809 | |
| | | | | | | | | |
| | | | | BANKING - 12.1% | | | | |
| | 29,670 | | | Bank of America Corporation | | | 1,024,208 | |
| | 44,320 | | | Citigroup, Inc. | | | 2,459,317 | |
| | 81,000 | | | FNB Corporation | | | 1,080,540 | |
| | 25,315 | | | JPMorgan Chase & Company | | | 4,710,109 | |
| | 43,583 | | | Wells Fargo & Company | | | 2,422,779 | |
| | | | | | | | 11,696,953 | |
| | | | | BIOTECH & PHARMA - 13.8% | | | | |
| | 12,765 | | | AbbVie, Inc. | | | 2,247,278 | |
| | 11,257 | | | Amgen, Inc. | | | 3,082,504 | |
| | 5,204 | | | Biogen, Inc.(a) | | | 1,129,216 | |
| | 6,960 | | | Johnson & Johnson | | | 1,123,205 | |
| | 454,190 | | | Optinose, Inc.(a) | | | 808,458 | |
| | 32,180 | | | Pacira BioSciences, Inc.(a) | | | 956,390 | |
| | 39,026 | | | Pfizer, Inc. | | | 1,036,531 | |
| | 21,500 | | | Sage Therapeutics, Inc.(a) | | | 461,820 | |
| | 52,696 | | | Sanofi - ADR | | | 2,521,504 | |
| | | | | | | | 13,366,906 | |
| | | | | CHEMICALS - 2.1% | | | | |
| | 10,720 | | | FMC Corporation | | | 604,501 | |
| | 18,350 | | | International Flavors & Fragrances, Inc. | | | 1,385,425 | |
| | | | | | | | 1,989,926 | |
| | | | | DIVERSIFIED INDUSTRIALS - 1.6% | | | | |
| | 20,350 | | | Pentair PLC | | | 1,583,027 | |
| | | | | | | | | |
See accompanying notes to financial statements.
| EASTERLY SNOW LONG/SHORT OPPORTUNITY FUND |
| SCHEDULE OF INVESTMENTS (Continued) |
| February 29, 2024 |
| Shares | | | | | Fair Value | |
| | | | | COMMON STOCKS — 106.3% (Continued) | | | | |
| | | | | ELECTRIC UTILITIES - 1.9% | | | | |
| | 33,760 | | | Vistra Corporation | | $ | 1,841,270 | |
| | | | | | | | | |
| | | | | ENTERTAINMENT CONTENT - 1.2% | | | | |
| | 10,500 | | | Walt Disney Company (The) | | | 1,171,590 | |
| | | | | | | | | |
| | | | | FOOD - 1.0% | | | | |
| | 17,320 | | | Kellogg Company | | | 955,198 | |
| | | | | | | | | |
| | | | | GAS & WATER UTILITIES - 1.0% | | | | |
| | 39,100 | | | UGI Corporation | | | 957,168 | |
| | | | | | | | | |
| | | | | HEALTH CARE FACILITIES & SERVICES - 1.5% | | | | |
| | 18,070 | | | Centene Corporation(a) | | | 1,417,230 | |
| | | | | | | | | |
| | | | | HOUSEHOLD PRODUCTS - 1.9% | | | | |
| | 98,940 | | | Kenvue, Inc. | | | 1,879,860 | |
| | | | | | | | | |
| | | | | INDUSTRIAL SUPPORT SERVICES - 2.3% | | | | |
| | 15,210 | | | WESCO International, Inc. | | | 2,273,742 | |
| | | | | | | | | |
| | | | | INSURANCE - 7.6% | | | | |
| | 66,420 | | | CNO Financial Group, Inc. | | | 1,772,750 | |
| | 20,480 | | | Hartford Financial Services Group, Inc. (The) | | | 1,962,803 | |
| | 36,090 | | | Lincoln National Corporation | | | 993,919 | |
| | 38,347 | | | MetLife, Inc. | | | 2,674,319 | |
| | | | | | | | 7,403,791 | |
| | | | | INTERNET MEDIA & SERVICES - 0.5% | | | | |
| | 13,020 | | | Match Group, Inc.(a) | | | 469,241 | |
| | | | | | | | | |
| | | | | LEISURE FACILITIES & SERVICES - 0.3% | | | | |
| | 10,700 | | | Bloomin’ Brands, Inc. | | | 290,826 | |
| | | | | | | | | |
| | | | | MACHINERY - 1.6% | | | | |
| | 18,010 | | | Kennametal, Inc. | | | 454,572 | |
See accompanying notes to financial statements.
| EASTERLY SNOW LONG/SHORT OPPORTUNITY FUND |
| SCHEDULE OF INVESTMENTS (Continued) |
| February 29, 2024 |
| Shares | | | | | Fair Value | |
| | | | | COMMON STOCKS — 106.3% (Continued) | | | | |
| | | | | MACHINERY - 1.6% (Continued) | | | | |
| | 18,804 | | | Terex Corporation | | $ | 1,078,410 | |
| | | | | | | | 1,532,982 | |
| | | | | MEDICAL EQUIPMENT & DEVICES - 2.2% | | | | |
| | 6,570 | | | Integra LifeSciences Holdings Corporation(a) | | | 242,499 | |
| | 14,957 | | | Zimmer Biomet Holdings, Inc. | | | 1,860,052 | |
| | | | | | | | 2,102,551 | |
| | | | | METALS & MINING - 5.2% | | | | |
| | 22,040 | | | Agnico Eagle Mines Ltd. | | | 1,059,242 | |
| | 172,886 | | | Alamos Gold, Inc., Class A | | | 2,041,784 | |
| | 830,222 | | | B2Gold Corporation | | | 1,992,533 | |
| | | | | | | | 5,093,559 | |
| | | | | OIL & GAS PRODUCERS - 17.7% | | | | |
| | 58,952 | | | Coterra Energy, Inc. | | | 1,519,783 | |
| | 16,900 | | | Delek US Holdings, Inc. | | | 431,119 | |
| | 46,180 | | | EQT Corporation | | | 1,715,587 | |
| | 8,400 | | | Exxon Mobil Corporation | | | 877,968 | |
| | 85,561 | | | Marathon Oil Corporation | | | 2,074,854 | |
| | 11,385 | | | Marathon Petroleum Corporation | | | 1,926,684 | |
| | 47,370 | | | Northern Oil and Gas, Inc. | | | 1,692,530 | |
| | 50,930 | | | Range Resources Corporation | | | 1,610,407 | |
| | 289,170 | | | Southwestern Energy Company(a) | | | 2,015,515 | |
| | 96,919 | | | Suncor Energy, Inc. | | | 3,330,136 | |
| | | | | | | | 17,194,583 | |
| | | | | RETAIL - CONSUMER STAPLES - 0.5% | | | | |
| | 6,400 | | | BJ’s Wholesale Club Holdings, Inc.(a) | | | 467,456 | |
| | | | | | | | | |
| | | | | RETAIL - DISCRETIONARY - 0.7% | | | | |
| | 9,800 | | | Advance Auto Parts, Inc. | | | 661,892 | |
| | | | | | | | | |
| | | | | SEMICONDUCTORS - 6.8% | | | | |
| | 13,510 | | | Advanced Micro Devices, Inc.(a) | | | 2,601,081 | |
| | 35,604 | | | Intel Corporation | | | 1,532,752 | |
| | 31,800 | | | Photronics, Inc.(a) | | | 915,522 | |
See accompanying notes to financial statements.
| EASTERLY SNOW LONG/SHORT OPPORTUNITY FUND |
| SCHEDULE OF INVESTMENTS (Continued) |
| February 29, 2024 |
| Shares | | | | | Fair Value | |
| | | | | COMMON STOCKS — 106.3% (Continued) | | | | |
| | | | | SEMICONDUCTORS - 6.8% (Continued) | | | | |
| | 21,361 | | | Silicon Motion Technology Corporation - ADR | | $ | 1,512,145 | |
| | | | | | | | 6,561,500 | |
| | | | | SOFTWARE - 3.9% | | | | |
| | 7,296 | | | Check Point Software Technologies Ltd.(a) | | | 1,170,424 | |
| | 48,561 | | | Open Text Corporation | | | 1,869,113 | |
| | 6,890 | | | Oracle Corporation | | | 769,475 | |
| | | | | | | | 3,809,012 | |
| | | | | STEEL - 4.3% | | | | |
| | 77,243 | | | Commercial Metals Company | | | 4,171,122 | |
| | | | | | | | | |
| | | | | TECHNOLOGY HARDWARE - 5.3% | | | | |
| | 11,960 | | | Cisco Systems, Inc. | | | 578,505 | |
| | 57,750 | | | NCR Atleos Corporation(a) | | | 1,256,640 | |
| | 82,420 | | | NCR Voyix Corporation(a) | | | 1,204,156 | |
| | 24,019 | | | NetApp, Inc. | | | 2,140,574 | |
| | | | | | | | 5,179,875 | |
| | | | | TRANSPORTATION & LOGISTICS - 1.7% | | | | |
| | 38,180 | | | Delta Air Lines, Inc. | | | 1,613,869 | |
| | | | | | | | | |
| | | | | TRANSPORTATION EQUIPMENT - 1.6% | | | | |
| | 14,000 | | | PACCAR, Inc. | | | 1,552,460 | |
| | | | | | | | | |
| | | | | TOTAL COMMON STOCKS (Cost $83,930,266) | | | 103,096,828 | |
| | | | | | | | | |
| | | | | EXCHANGE-TRADED FUNDS — 3.8% | | | | |
| | | | | EQUITY - 3.8% | | | | |
| | 18,000 | | | iShares Russell 2000 ETF | | | 3,667,140 | |
| | | | | | | | | |
| | | | | TOTAL EXCHANGE-TRADED FUNDS (Cost $3,462,522) | | | 3,667,140 | |
See accompanying notes to financial statements.
| EASTERLY SNOW LONG/SHORT OPPORTUNITY FUND |
| SCHEDULE OF INVESTMENTS (Continued) |
| February 29, 2024 |
| Principal | | | | | | | | | | Coupon Rate | | | | | | | | |
| Amount ($) | | | | | | | | | | (%) | | | | Maturity | | | Fair Value | |
| | | | | CORPORATE BONDS — 2.7% | | | | | | | | | | | |
| | | | | OIL & GAS SERVICES & EQUIPMENT — 0.8% | | | | | | | | | | | |
| | 1,000,000 | | | Transocean, Inc. | | | | | | | 6.8000 | | | | 03/15/38 | | | $ | 785,200 | |
| | | | | | | | | | | | | | | | | | | | | |
| | | | | RETAIL - DISCRETIONARY — 0.7% | | | | | | | | | | | |
| | 1,000,000 | | | Kohl’s Corporation | | 5.5500 | | | | 07/17/45 | | | | 676,265 | |
| | | | | | | | | | | | | | | | | | | | | |
| | | | | SPECIALTY FINANCE — 1.2% | | | | | | | | | | | |
| | 500,000 | | | Ally Financial, Inc. Series B | | 4.7000 | | | | 08/15/69 | | | | 430,399 | |
| | 1,000,000 | | | Ally Financial, Inc. | | 4.7000 | | | | 08/15/69 | | | | 787,500 | |
| | | | | | | | | | | | | | | | | | | | 1,217,899 | |
| | | | | TOTAL CORPORATE BONDS (Cost $2,367,258) | | | | | | | | | | 2,679,364 | |
| | | | | | | | | | | | | | | | |
| Contracts(b) | | | | | Broker/
Counterparty | | Expiration
Date | | Exercise
Price | | | Notional
Value | | | Fair Value | |
| | | | | EQUITY OPTIONS PURCHASED - 0.0% (c) | | | | | | | | |
| | | | | PUT OPTIONS PURCHASED - 0.0%(c) | | | | | | | | |
| | 200 | | | SPDR S&P 500 ETF Trust | | JEF | | 03/15/2024 | | $ | 425 | | | $ | 8,500,000 | | | $ | 1,800 | |
| | | | | TOTAL PUT OPTIONS PURCHASED (Cost - $35,545) | | | | | | | | |
| | | | | | | | | | | | | | | | | | | | | |
| | | | | TOTAL EQUITY OPTIONS PURCHASED (Cost - $35,545) | | | | | | | 1,800 | |
| | | | | | | | | | | | | | | | | | | | | |
| | | | | TOTAL INVESTMENTS - 112.8% (Cost $89,795,591) | | | | | | $ | 109,445,132 | |
| | | | | CALL OPTIONS WRITTEN - (1.7)% (Premiums received - $746,590) | | | | | | | (1,671,725 | ) |
| | | | | LIABILITIES IN EXCESS OF OTHER ASSETS - (11.1)% | | | | | | | (10,780,346 | ) |
| | | | | NET ASSETS - 100.0% | | | | | | $ | 96,993,061 | |
| | | | | | | | | | | | | | | | | | | | | |
| Contracts(b) | | | | | Counterparty | | Expiration
Date | | Exercise
Price | | | Notional
Value | | | Fair Value | |
| | | | | WRITTEN EQUITY OPTIONS - (1.7)% | | | | | | | | |
| | | | | CALL OPTIONS WRITTEN - (1.7)% | | | | | | | | | | | | | | |
| | 60 | | | Advanced Micro Devices, Inc. | | JEF | | 04/19/2024 | | $ | 140 | | | $ | 840,00 | | | $ | 325,800 | |
| | 75 | | | Advanced Micro Devices, Inc. | | JEF | | 05/17/2024 | | | 190 | | | | 1,425,000 | | | | 149,475 | |
| | 350 | | | Alamos Gold, Inc. | | JEF | | 03/15/2024 | | | 13 | | | | 455,000 | | | | 2,800 | |
| | 350 | | | Alamos Gold, Inc. | | JEF | | 06/21/2024 | | | 15 | | | | 525,000 | | | | 5,950 | |
| | 75 | | | Centene Corporation | | JEF | | 03/15/2024 | | | 80 | | | | 600,000 | | | | 6,900 | |
| | 240 | | | Commercial Metals Company | | JEF | | 03/15/2024 | | | 50 | | | | 1,200,000 | | | | 104,400 | |
| | 255 | | | Delta Air Lines, Inc. | | JEF | | 03/15/2024 | | | 40 | | | | 1,020,000 | | | | 63,750 | |
| | 125 | | | Delta Air Lines, Inc. | | JEF | | 06/21/2024 | | | 42 | | | | 525,000 | | | | 41,250 | |
| | 200 | | | Intel Corporation | | JEF | | 04/19/2024 | | | 50 | | | | 1,000,000 | | | | 7,000 | |
| | 180 | | | iShares Russell 2000 ETF | | JEF | | 03/15/2024 | | | 197 | | | | 3,546,000 | | | | 150,480 | |
| | 80 | | | NetApp, Inc. | | JEF | | 03/15/2024 | | | 90 | | | | 720,000 | | | | 26,480 | |
| | | | | | | | | | | | | | | | | | | | | |
See accompanying notes to financial statements.
| EASTERLY SNOW LONG/SHORT OPPORTUNITY FUND |
| SCHEDULE OF INVESTMENTS (Continued) |
| February 29, 2024 |
Contracts(b)
(continued) | | | | | Counterparty | | Expiration
Date | | Exercise
Price | | | Notional
Value | | | Fair Value | |
| | | | | WRITTEN EQUITY OPTIONS - (1.7)% (Continued) | | | | | | | | |
| | | | | CALL OPTIONS WRITTEN - (1.7)% (Continued) | | | | | | | | |
| | 110 | | | Pentair PLC | | JEF | | 05/17/2024 | | $ | 65 | | | $ | 715,000 | | | $ | 149,050 | |
| | 90 | | | PVH Corporation | | JEF | | 03/15/2024 | | | 105 | | | | 945,000 | | | | 283,950 | |
| | 120 | | | Range Resources Corporation | | JEF | | 03/15/2024 | | | 40 | | | | 480,000 | | | | 300 | |
| | 40 | | | SPDR S&P 500 ETF Trust | | JEF | | 03/15/2024 | | | 475 | | | | 1,900,000 | | | | 142,840 | |
| | 100 | | | Terex Corporation | | JEF | | 04/19/2024 | | | 60 | | | | 600,000 | | | | 18,500 | |
| | 150 | | | Vistra Corporation | | JEF | | 03/15/2024 | | | 45 | | | | 675,000 | | | | 142,050 | |
| | 50 | | | WESCO International, Inc. | | JEF | | 04/19/2024 | | | 155 | | | | 775,000 | | | | 23,000 | |
| | 50 | | | WESCO International, Inc. | | JEF | | 05/17/2024 | | | 165 | | | | 825,000 | | | | 27,750 | |
| | | | | TOTAL CALL OPTIONS WRITTEN (Proceeds - $746,590) | | | | | | | 1,671,725 | |
| | | | | | | | | | | | | | | | | | | | | |
| | | | | TOTAL EQUITY OPTIONS WRITTEN (Proceeds - $746,590) | | | | | | $ | 1,671,725 | |
See accompanying notes to financial statements.
| EASTERLY SNOW LONG/SHORT OPPORTUNITY FUND |
| SCHEDULE OF SECURITIES SOLD SHORT |
| February 29, 2024 |
| |
| Shares | | | | | Fair Value | |
| | | | | COMMON STOCKS — (6.9)% | | | | |
| | | | | ASSET MANAGEMENT - (1.1)% | | | | |
| | (7,780 | ) | | Ares Management Corporation, CLASS A | | $ | (1,031,861 | ) |
| | | | | | | | | |
| | | | | HOUSEHOLD PRODUCTS - (1.1)% | | | | |
| | (12,800 | ) | | Colgate-Palmolive Company | | | (1,107,456 | ) |
| | | | | | | | | |
| | | | | INSTITUTIONAL FINANCIAL SERVICES - (1.0)% | | | | |
| | (2,410 | ) | | Goldman Sachs Group, Inc. (The) | | | (937,610 | ) |
| | | | | | | | | |
| | | | | METALS & MINING - (1.4)% | | | | |
| | (13,150 | ) | | Newmont Corporation | | | (410,938 | ) |
| | (14,700 | ) | | Rio Tinto PLC - ADR | | | (948,591 | ) |
| | | | | | | | (1,359,529 | ) |
| | | | | OIL & GAS PRODUCERS - (1.7)% | | | | |
| | (4,140 | ) | | EOG Resources, Inc. | | | (473,864 | ) |
| | | | | | | | | |
See accompanying notes to financial statements.
| EASTERLY SNOW LONG/SHORT OPPORTUNITY FUND |
| SCHEDULE OF SECURITIES SOLD SHORT (Continued) |
| February 29, 2024 |
| Shares | | | | | Fair Value | |
| | | | | COMMON STOCKS — (6.9)% (Continued) | | | | |
| | | | | OIL & GAS PRODUCERS - (1.7)% (Continued) | | | | |
| | (14,800 | ) | | Occidental Petroleum Corporation | | $ | (897,028 | ) |
| | (19,930 | ) | | Permian Resources Corporation | | | (310,111 | ) |
| | | | | | | | (1,681,003 | ) |
| | | | | RETAIL - DISCRETIONARY - (0.6)% | | | | |
| | (550 | ) | | O’Reilly Automotive, Inc. | | | (598,081 | ) |
| | | | | | | | | |
| | | | | EXCHANGE-TRADED FUNDS — (22.1)% | | | | |
| | | | | EQUITY - (22.1)% | | | | |
| | (16,700 | ) | | iShares Russell 1000 Value ETF | | | (2,860,042 | ) |
| | (12,600 | ) | | iShares Russell 2000 Value ETF | | | (1,927,800 | ) |
| | (7,980 | ) | | iShares Russell 3000 ETF | | | (2,325,212 | ) |
| | (48,480 | ) | | VanEck Gold Miners ETF | | | (1,277,933 | ) |
| | (28,000 | ) | | Vanguard S&P 500 ETF | | | (13,074,040 | ) |
| | | | | | | | (21,465,027 | ) |
| | | | | | | | | |
| | | | | TOTAL SECURITIES SOLD SHORT - (Proceeds - $27,379,784) | | $ | (28,180,567 | ) |
| ADR | - American Depositary Receipt |
| | |
| ETF | - Exchange-Traded Fund |
| | |
| JEF | - Jefferies |
| | |
| LTD | - Limited Company |
| | |
| PLC | - Public Limited Company |
| | |
| SPDR | - Standard & Poor’s Depositary Receipt |
| (a) | Non-income producing security. |
| (b) | Each option contract allows the holder of the option to purchase or sell 100 shares of the underlying security. |
| (c) | Percentage rounds to less than 0.1%. |
See accompanying notes to financial statements.
| EASTERLY FUNDS |
| STATEMENTS OF ASSETS AND LIABILITIES |
| February 29, 2024 |
| |
| | | Easterly Snow | | | Easterly Snow | |
| | | Small Cap Value | | | Long/Short | |
| | | Fund | | | Opportunity Fund | |
| Assets: | | | | | | | | |
| Total Investments, at cost | | $ | 18,452,990 | | | $ | 89,795,591 | |
| Total Investments, at value | | $ | 22,874,295 | | | $ | 109,445,132 | |
| Cash | | | 1,365,113 | | | | 2,016,201 | |
| Deposit at Broker | | | — | | | | 15,134,053 | |
| Cash Collateral Held at Custodian | | | — | | | | 81,124 | |
| Receivable for fund shares sold | | | 12,771 | | | | — | |
| Interest and dividends receivable | | | 53,716 | | | | 270,242 | |
| Receivable from manager | | | 72 | | | | — | |
| Prepaid expenses and other assets | | | 29,313 | | | | 39,660 | |
| Total Assets | | | 24,335,280 | | | | 126,986,412 | |
| | | | | | | | | |
| Liabilities: | | | | | | | | |
| Options Written (premiums received $0 and $746,590) | | | — | | | | 1,671,725 | |
| Securities sold short (proceeds $0 and $27,379,784) | | | — | | | | 28,180,567 | |
| Administration fees payable | | | 10,132 | | | | 22,503 | |
| Payable to manager | | | — | | | | 50,118 | |
| Trustee fees payable | | | 3,604 | | | | 4,613 | |
| Payable for distribution (12b-1) fees | | | 3,012 | | | | 18,904 | |
| Compliance officer fees payable | | | 1,784 | | | | 1,470 | |
| Accrued expenses and other liabilities | | | 33,868 | | | | 43,451 | |
| Total Liabilities | | | 52,400 | | | | 29,993,351 | |
| | | | | | | | | |
| Net Assets | | $ | 24,282,880 | | | $ | 96,993,061 | |
| | | | | | | | | |
| Net Assets: | | | | | | | | |
| Paid in capital | | $ | 21,873,755 | | | $ | 78,730,272 | |
| Accumulated earnings | | | 2,409,125 | | | | 18,262,789 | |
| Net Assets | | $ | 24,282,880 | | | $ | 96,993,061 | |
| | | | | | | | | |
| Net Asset Value Per Share | | | | | | | | |
| Class A | | | | | | | | |
| Net Assets | | $ | 10,957,045 | | | $ | 48,966,399 | |
| Shares of beneficial interest outstanding (no par value; unlimited shares authorized) | | | 199,955 | | | | 1,509,121 | |
| Net asset value and redemption price per share | | $ | 54.80 | | | $ | 32.45 | |
| Offering price per share (maximum sales charge of 5.75%) | | $ | 58.14 | | | $ | 34.43 | |
| | | | | | | | | |
| Class C | | | | | | | | |
| Net Assets | | $ | 1,179,090 | | | $ | 2,677,840 | |
| Shares of beneficial interest outstanding | | | 23,878 | | | | 88,428 | |
| Net asset value/offering/redemption price per share (a) | | $ | 49.38 | | | $ | 30.28 | |
| | | | | | | | | |
| Class I | | | | | | | | |
| Net Assets | | $ | 12,146,688 | | | $ | 45,348,783 | |
| Shares of beneficial interest outstanding | | | 214,902 | | | | 1,382,949 | |
| Net asset value/offering/redemption price per share | | $ | 56.52 | | | $ | 32.79 | |
| | | | | | | | | |
| Class R6 | | | | | | | | |
| Net Assets | | $ | 57 | | | $ | 39 | |
| Shares of beneficial interest outstanding | | | 1 | | | | 1 | |
| Net asset value/offering/redemption price per share | | $ | 56.53 | (b) | | $ | 32.80 | (b) |
| | | | | | | | | |
| (a) | A contingent deferred sales charge (“CDSC”) of 1.00% may be charged on shares held less than 12 months. |
| (b) | Doesn’t recalculate due to rounding. |
See accompanying notes to financial statements.
| EASTERLY FUNDS |
| STATEMENTS OF OPERATIONS |
| For the Year Ended February 29, 2024 |
| |
| | | Easterly Snow | | | Easterly Snow | |
| | | Small Cap Value | | | Long/Short | |
| | | Fund | | | Opportunity Fund | |
| Investment Income: | | | | | | | | |
| Dividend income | | $ | 498,960 | | | $ | 2,268,342 | |
| Interest income | | | 54,117 | | | | 873,648 | |
| Less: Foreign withholding taxes | | | (3,742 | ) | | | (52,346 | ) |
| Total Investment Income | | | 549,335 | | | | 3,089,644 | |
| | | | | | | | | |
| Operating Expenses: | | | | | | | | |
| Management fees | | | 219,421 | | | | 758,116 | |
| Distribution (12b-1) fees | | | | | | | | |
| Class A Shares | | | 24,435 | | | | 119,818 | |
| Class C Shares | | | 13,323 | | | | 26,602 | |
| Dividend expenses | | | — | | | | 168,132 | |
| Legal fees | | | 66,802 | | | | 64,736 | |
| Shareholder servicing fees | | | 18,554 | | | | 68,979 | |
| Registration fees | | | 57,855 | | | | 50,106 | |
| Administration fees | | | 16,787 | | | | 63,873 | |
| Transfer Agent fees | | | 27,679 | | | | 28,262 | |
| Custodian fees | | | 25,986 | | | | 24,908 | |
| Trustees’ fees | | | 20,207 | | | | 18,142 | |
| Audit fees | | | 17,007 | | | | 19,050 | |
| Printing and postage expenses | | | 1,114 | | | | 8,840 | |
| Compliance officer fees | | | 7,191 | | | | 6,865 | |
| Insurance expenses | | | 1,166 | | | | 5,814 | |
| Miscellaneous expenses | | | 3,798 | | | | 3,696 | |
| Total Operating Expenses | | | 521,325 | | | | 1,435,939 | |
| Less: Fees waived | | | (194,993 | ) | | | — | |
| Net Operating Expenses | | | 326,332 | | | | 1,435,939 | |
| | | | | | | | | |
| Net Investment Income | | | 223,003 | | | | 1,653,705 | |
| | | | | | | | | |
| | | | | | | | | |
| Realized and Unrealized Gain/(Loss) on Investments: | | | | | | | | |
| Net realized gain/(loss) from: | | | | | | | | |
| Investments and Foreign currency transactions | | | 473,839 | | | | 1,312,758 | |
| Short Sales | | | — | | | | (1,302,373 | ) |
| Options Purchased | | | — | | | | (269,312 | ) |
| Options Written | | | — | | | | 645,295 | |
| Net realized gain | | | 473,839 | | | | 386,368 | |
| | | | | | | | | |
| Net change in unrealized appreciation/(depreciation) on: | | | | | | | | |
| Investments and Foreign currency translations | | | 2,372,815 | | | | 7,119,309 | |
| Short Sales | | | — | | | | (1,752,779 | ) |
| Options Purchased | | | — | | | | 810 | |
| Options Written | | | — | | | | (1,231,471 | ) |
| Net change in unrealized appreciation | | | 2,372,815 | | | | 4,135,869 | |
| | | | | | | | | |
| Net Realized and Unrealized Gain on Investments: | | | 2,846,654 | | | | 4,522,237 | |
| | | | | | | | | |
| Net Increase in Net Assets Resulting From Operations | | $ | 3,069,657 | | | $ | 6,175,942 | |
| | | | | | | | | |
See accompanying notes to financial statements.
| EASTERLY FUNDS |
| STATEMENTS OF CHANGES IN NET ASSETS |
| |
| | | Easterly Snow Small Cap Value Fund | | | Easterly Snow Long/Short Opportunity Fund | |
| | | | | | | | | | | | | |
| | | Year Ended | | | Year Ended | | | Year Ended | | | Year Ended | |
| | | February 29, 2024 | | | February 28, 2023 | | | February 29, 2024 | | | February 28, 2023 | |
| Operations: | | | | | | | | | | | | | | | | |
| Net investment income | | $ | 223,003 | | | $ | 58,662 | | | $ | 1,653,705 | | | $ | 1,206,588 | |
| Net realized gain/(loss) on investments | | | 473,839 | | | | (990,070 | ) | | | 386,368 | | | | 47,649 | |
| Net change in unrealized appreciation/(depreciation) on investments | | | 2,372,815 | | | | 1,066,937 | | | | 4,135,869 | | | | (1,949,209 | ) |
| Net increase/(decrease) in net assets resulting from operations | | | 3,069,657 | | | | 135,529 | | | | 6,175,942 | | | | (694,972 | ) |
| | | | | | | | | | | | | | | | | |
| Distributions to Shareholders: | | | | | | | | | | | | | | | | |
| Total Distributions: | | | | | | | | | | | | | | | | |
| Class I | | | (29,406 | ) | | | — | | | | (1,014,331 | ) | | | (2,963,119 | ) |
| Class A | | | (4,350 | ) | | | — | | | | (990,430 | ) | | | (3,142,717 | ) |
| Class C | | | — | | | | — | | | | (41,841 | ) | | | (174,207 | ) |
| Class R6 | | | (0 | ) * | | | — | | | | (1 | ) | | | (2 | ) |
| Total Dividends and Distributions to Shareholders | | | (33,756 | ) | | | — | | | | (2,046,603 | ) | | | (6,280,045 | ) |
| | | | | | | | | | | | | | | | | |
| Share Transactions of Beneficial Interest: | | | | | | | | | | | | | | | | |
| Net proceeds from shares sold | | | | | | | | | | | | | | | | |
| Class I | | | 2,370,958 | | | | 6,971,333 | | | | 946,681 | | | | 1,034,109 | |
| Class A | | | 109,541 | | | | 97,796 | | | | 748,670 | | | | 2,584,159 | |
| Class C | | | 29,061 | | | | 593,628 | | | | 25 | | | | 1,029 | |
| Class R6 | | | — | | | | — | | | | — | | | | — | |
| Reinvestment of dividends and distributions | | | | | | | | | | | | | | | | |
| Class I | | | 17,262 | | | | — | | | | 822,234 | | | | 2,432,241 | |
| Class A | | | 874 | | | | — | | | | 273,796 | | | | 923,263 | |
| Class C | | | — | | | | — | | | | 39,830 | | | | 165,874 | |
| Class R6 | | | 0 | * | | | — | | | | 1 | | | | 2 | |
| Cost of shares redeemed | | | | | | | | | | | | | | | | |
| Class I | | | (7,624,755 | ) | | | (1,844,443 | ) | | | (5,195,251 | ) | | | (1,614,637 | ) |
| Class A | | | (357,123 | ) | | | (307,902 | ) | | | (4,684,032 | ) | | | (1,523,432 | ) |
| Class C | | | (950,391 | ) | | | (235,843 | ) | | | (229,262 | ) | | | (344,251 | ) |
| Class R6 | | | — | | | | — | | | | — | | | | — | |
| Net increase/(decrease) in net assets from share transactions of beneficial interest | | | (6,404,573 | ) | | | 5,274,569 | | | | (7,277,308 | ) | | | 3,658,357 | |
| | | | | | | | | | | | | | | | | |
| Total Increase/(Decrease) in Net Assets | | | (3,368,672 | ) | | | 5,410,098 | | | | (3,147,969 | ) | | | (3,316,660 | ) |
| | | | | | | | | | | | | | | | | |
| Net Assets: | | | | | | | | | | | | | | | | |
| Beginning of year | | | 27,651,552 | | | | 22,241,454 | | | | 100,141,030 | | | | 103,457,690 | |
| End of year | | $ | 24,282,880 | | | $ | 27,651,552 | | | $ | 96,993,061 | | | $ | 100,141,030 | |
| | | | | | | | | | | | | | | | | |
| Share Activity | | | | | | | | | | | | | | | | |
| Shares sold | | | | | | | | | | | | | | | | |
| Class I | | | 49,446 | | | | 148,132 | | | | 31,284 | | | | 32,738 | |
| Class A | | | 2,151 | | | | 2,259 | | | | 24,492 | | | | 86,074 | |
| Class C | | | 645 | | | | 14,824 | | | | 1 | | | | 35 | |
| Class R6 | | | — | | | | — | | | | — | | | | — | |
| Shares Reinvested | | | | | | | | | | | | | | | | |
| Class I | | | 340 | | | | — | | | | 26,507 | | | | 81,021 | |
| Class A | | | 18 | | | | — | | | | 8,915 | | | | 31,065 | |
| Class C | | | — | | | | — | | | | 1,387 | | | | 5,960 | |
| Class R6 | | | 0 | ** | | | — | | | | 0 | ** | | | — | |
| Shares redeemed | | | | | | | | | | | | | | | | |
| Class I | | | (164,101 | ) | | | (40,837 | ) | | | (166,908 | ) | | | (51,544 | ) |
| Class A | | | (7,343 | ) | | | (6,647 | ) | | | (153,820 | ) | | | (48,398 | ) |
| Class C | | | (22,098 | ) | | | (5,827 | ) | | | (7,852 | ) | | | (11,627 | ) |
| Class R6 | | | — | | | | — | | | | — | | | | — | |
| Net increase/(decrease) in shares of beneficial interest | | | (140,942 | ) | | | 111,904 | | | | (235,994 | ) | | | 125,324 | |
| | | | | | | | | | | | | | | | | |
See accompanying notes to financial statements.
| EASTERLY FUNDS |
| FINANCIAL HIGHLIGHTS (For a share outstanding throughout each year) |
| |
| | | Easterly Snow Small Cap Value Fund | |
| | | Class A | |
| | | For the | | | For the | | | For the | | | For the | | | For the | |
| | | Year Ended | | | Year Ended | | | Year Ended | | | Year Ended | | | Year Ended | |
| | | February 29, | | | February 28, | | | February 28, | | | February 28, | | | February 29, | |
| | | 2024 | | | 2023 | | | 2022 | | | 2021 | | | 2020 | |
| Net Asset Value, Beginning of Year | | $ | 47.21 | | | $ | 47.22 | | | $ | 44.01 | | | $ | 26.39 | | | $ | 31.57 | |
| Income (Loss) from Investment Operations: | | | | | | | | | | | | | | | | | | | | |
| Net investment income (loss) (1) | | | 0.42 | | | | 0.10 | | | | (0.14 | ) | | | 0.09 | | | | 0.01 | |
| Net realized and unrealized gain (loss) | | | 7.19 | | | | (0.11 | ) | | | 3.36 | | | | 17.53 | | | | (5.19 | ) |
| Total from investment operations | | | 7.61 | | | | (0.01 | ) | | | 3.22 | | | | 17.62 | | | | (5.18 | ) |
| Dividends and Distributions: | | | | | | | | | | | | | | | | | | | | |
| Dividends from net investment income | | | (0.02 | ) | | | — | | | | (0.01 | ) | | | — | | | | — | |
| Total dividends and distributions | | | (0.02 | ) | | | — | | | | (0.01 | ) | | | — | | | | — | |
| | | | | | | | | | | | | | | | | | | | | |
| Redemption Fees | | | — | | | | — | | | | 0.00 | * | | | — | | | | — | |
| | | | | | | | | | | | | | | | | | | | | |
| Net Asset Value, End of Year | | $ | 54.80 | | | $ | 47.21 | | | $ | 47.22 | | | $ | 44.01 | | | $ | 26.39 | |
| | | | | | | | | | | | | | | | | | | | | |
| Total Return** | | | 16.14 | % (6) | | | (0.02 | )% (6) | | | 7.32 | % | | | 66.81 | % | | | (16.41 | )% |
| Ratios and Supplemental Data: | | | | | | | | | | | | | | | | | | | | |
| Net assets, end of year (000s) | | $ | 10,957 | | | $ | 9,683 | | | $ | 9,893 | | | $ | 9,223 | | | $ | 10,071 | |
| Ratio of gross operating expenses to average net assets including interest expense (2,3) | | | 2.35 | % | | | 2.45 | % | | | 2.39 | % | | | 3.82 | % | | | 2.41 | % |
| Ratio of net operating expenses to average net assets including interest expense (2,3) | | | 1.50 | % | | | 1.50 | % | | | 1.50 | % | | | 1.51 | % | | | 1.51 | % |
| Ratio of net investment income (loss) before expense reimbursement to average net assets (2,5) | | | 0.03 | % | | | (0.71 | )% | | | (1.18 | )% | | | (2.00 | )% | | | (0.90 | )% |
| Ratio of net investment income (loss) after expense reimbursement to average net assets (2,5) | | | 0.88 | % | | | 0.22 | % | | | (0.30 | )% | | | 0.30 | % | | | 0.02 | % |
| Portfolio Turnover Rate | | | 55 | % | | | 38 | % | | | 62 | % | | | 86 | % | | | 44 | % |
| | | | | | | | | | | | | | | | | | | | | |
| | | Easterly Snow Small Cap Value Fund | |
| | | Class C | |
| | | For the | | | For the | | | For the | | | For the | | | For the | |
| | | Year Ended | | | Year Ended | | | Year Ended | | | Year Ended | | | Year Ended | |
| | | February 29, | | | February 28, | | | February 28, | | | February 28, | | | February 29, | |
| | | 2024 | | | 2023 | | | 2022 | | | 2021 | | | 2020 | |
| Net Asset Value, Beginning of Year | | $ | 42.84 | | | $ | 43.17 | | | $ | 40.54 | | | $ | 24.48 | | | $ | 29.51 | |
| Income (Loss) from Investment Operations: | | | | | | | | | | | | | | | | | | | | |
| Net investment income (loss) (1) | | | 0.05 | | | | (0.22 | ) | | | (0.46 | ) | | | (0.10 | ) | | | (0.21 | ) |
| Net realized and unrealized gain (loss) | | | 6.49 | | | | (0.11 | ) | | | 3.09 | | | | 16.16 | | | | (4.82 | ) |
| Total from investment operations | | | 6.54 | | | | (0.33 | ) | | | 2.63 | | | | 16.06 | | | | (5.03 | ) |
| | | | | | | | | | | | | | | | | | | | | |
| Redemption Fees | | | — | | | | — | | | | 0.00 | * | | | — | | | | — | |
| | | | | | | | | | | | | | | | | | | | | |
| Net Asset Value, End of Year | | $ | 49.38 | | | $ | 42.84 | | | $ | 43.17 | | | $ | 40.54 | | | $ | 24.48 | |
| | | | | | | | | | | | | | | | | | | | | |
| Total Return** | | | 15.27 | % (6) | | | (0.76 | )% (6) | | | 6.49 | % | | | 65.60 | % | | | (17.05 | )% |
| Ratios and Supplemental Data: | | | | | | | | | | | | | | | | | | | | |
| Net assets, end of year (000s) | | $ | 1,179 | | | $ | 1,942 | | | $ | 1,569 | | | $ | 1,746 | | | $ | 2,695 | |
| Ratio of gross operating expenses to average net assets including interest expense (2,4) | | | 3.10 | % | | | 3.20 | % | | | 3.08 | % | | | 4.63 | % | | | 3.16 | % |
| Ratio of net operating expenses to average net assets including interest expense (2,4) | | | 2.25 | % | | | 2.25 | % | | | 2.25 | % | | | 2.26 | % | | | 2.26 | % |
| Ratio of net investment income (loss) before expense reimbursement to average net assets (2,5) | | | (0.73 | )% | | | (1.50 | )% | | | (1.88 | )% | | | (2.80 | )% | | | (1.64 | )% |
| Ratio of net investment income (loss) after expense reimbursement to average net assets (2,5) | | | 0.11 | % | | | (0.55 | )% | | | (1.05 | )% | | | (0.43 | )% | | | (0.73 | )% |
| Portfolio Turnover Rate | | | 55 | % | | | 38 | % | | | 62 | % | | | 86 | % | | | 44 | % |
| | | | | | | | | | | | | | | | | | | | | |
| * | Less than $0.005 cent per share. |
| ** | Assumes reinvestment of all dividends and distributions and does not assume the effects of any sales charges. Aggregate (not annualized) total return is shown for any period shorter than one year. Total return does not reflect the deduction of taxes that a shareholder would pay on distributions or on the redemption of shares. |
| (1) | Per share amounts calculated using the average shares method, which more appropriately presents the per share data for the year. |
| (2) | The ratios of expenses to average net assets and net investment income to average net assets do not reflect the expenses of the underlying investment companies in which the Fund invests. |
| (3) | Ratios to average net assets (excluding interest expense) |
| Expenses, before waiver and reimbursement | | | 2.35 | % | | | 2.45 | % | | | 2.39 | % | | | 3.80 | % | | | 2.40 | % |
| Expenses, net waiver and reimbursement | | | 1.50 | % | | | 1.50 | % | | | 1.50 | % | | | 1.50 | % | | | 1.50 | % |
| | | | | | | | | | | | | | | | | | | | | |
| (4) | Ratios to average net assets (excluding interest expense) |
| Expenses, before waiver and reimbursement | | | 3.10 | % | | | 3.20 | % | | | 3.08 | % | | | 4.62 | % | | | 3.15 | % |
| Expenses, net waiver and reimbursement | | | 2.25 | % | | | 2.25 | % | | | 2.25 | % | | | 2.25 | % | | | 2.25 | % |
| | | | | | | | | | | | | | | | | | | | | |
| (5) | Recognition of net investment income (loss) is affected by the timing and declaration of dividends by the underlying investment companies in which the Fund invests. |
| (6) | Includes adjustments in accordance with accounting principles generally accepted in the United States and, consequently, the net asset value for financial reporting purposes and the returns based upon those net asset values may differ from the net asset values and returns for shareholder transactions. |
See accompanying notes to financial statements.
| EASTERLY FUNDS |
| FINANCIAL HIGHLIGHTS (For a share outstanding throughout each year/period) |
| |
| | | Easterly Snow Small Cap Value Fund | |
| | | Class I | |
| | | For the | | | For the | | | For the | | | For the | | | For the | |
| | | Year Ended | | | Year Ended | | | Year Ended | | | Year Ended | | | Year Ended | |
| | | February 29, | | | February 28, | | | February 28, | | | February 28, | | | February 29, | |
| | | 2024 | | | 2023 | | | 2022 | | | 2021 | | | 2020 | |
| Net Asset Value, Beginning of Year | | $ | 48.68 | | | $ | 48.57 | | | $ | 45.23 | | | $ | 27.05 | | | $ | 32.28 | |
| Income (Loss) from Investment Operations: | | | | | | | | | | | | | | | | | | | | |
| Net investment income (loss) (1) | | | 0.56 | | | | 0.20 | | | | (0.03 | ) | | | 0.15 | | | | 0.09 | |
| Net realized and unrealized gain (loss) | | | 7.42 | | | | (0.09 | ) | | | 3.45 | | | | 18.03 | | | | (5.32 | ) |
| Total from investment operations | | | 7.98 | | | | 0.11 | | | | 3.42 | | | | 18.18 | | | | (5.23 | ) |
| Dividends and Distributions: | | | | | | | | | | | | | | | | | | | | |
| Dividends from net investment income | | | (0.14 | ) | | | — | | | | (0.08 | ) | | | — | | | | — | |
| Total dividends and distributions | | | (0.14 | ) | | | — | | | | (0.08 | ) | | | — | | | | — | |
| | | | | | | | | | | | | | | | | | | | | |
| Redemption Fees | | | — | | | | — | | | | 0.00 | * | | | 0.00 | * | | | 0.00 | * |
| | | | | | | | | | | | | | | | | | | | | |
| Net Asset Value, End of Year | | $ | 56.52 | | | $ | 48.68 | | | $ | 48.57 | | | $ | 45.23 | | | $ | 27.05 | |
| | | | | | | | | | | | | | | | | | | | | |
| Total Return** | | | 16.42 | % (8) | | | 0.23 | % (8) | | | 7.57 | % | | | 67.21 | % | | | (16.20 | )% |
| Ratios and Supplemental Data: | | | | | | | | | | | | | | | | | | | | |
| Net assets, end of year (000s) | | $ | 12,147 | | | $ | 16,026 | | | $ | 10,779 | | | $ | 7,926 | | | $ | 7,679 | |
| Ratio of gross operating expenses to average net assets including interest expense (2,3) | | | 2.09 | % | | | 2.20 | % | | | 2.14 | % | | | 3.58 | % | | | 2.16 | % |
| Ratio of net operating expenses to average net assets including interest expense (2,3) | | | 1.25 | % | | | 1.25 | % | | | 1.25 | % | | | 1.26 | % | | | 1.26 | % |
| Ratio of net investment income (loss) before expense reimbursement to average net assets (2,5) | | | 0.29 | % | | | (0.50 | )% | | | (0.95 | )% | | | (1.78 | )% | | | (0.63 | )% |
| Ratio of net investment income (loss) after expense reimbursement to average net assets (2,5) | | | 1.13 | % | | | 0.45 | % | | | (0.07 | )% | | | 0.54 | % | | | 0.27 | % |
| Portfolio Turnover Rate | | | 55 | % | | | 38 | % | | | 62 | % | | | 86 | % | | | 44 | % |
| | | | | | | | | | | | | | | | | | | | | |
| | | Easterly Snow Small Cap Value Fund | | | | | | | | | |
| | | Class R6*** | | | | | | | | | |
| | | For the | | | For the | | | For the | | | | | | | | | |
| | | Year Ended | | | Year Ended | | | Period Ended | | | | | | | | | |
| | | February 29, | | | February 28, | | | February 28, | | | | | | | | | |
| | | 2024 | | | 2023 | | | 2022 | | | | | | | | | |
| Net Asset Value, Beginning of Year/Period | | $ | 48.68 | | | $ | 48.57 | | | $ | 50.04 | | | | | | | | | |
| Income (Loss) from Investment Operations: | | | | | | | | | | | | | | | | | | | | |
| Net investment income (1) | | | 0.55 | | | | 0.20 | | | | — | | | | | | | | | |
| Net realized and unrealized gain (loss) | | | 7.44 | | | | (0.09 | ) | | | (1.39 | ) | | | | | | | | |
| Total from investment operations | | | 7.99 | | | | 0.11 | | | | (1.39 | ) | | | | | | | | |
| Dividends and Distributions: | | | | | | | | | | | | | | | | | | | | |
| Dividends from net investment income | | | (0.14 | ) | | | — | | | | (0.08 | ) | | | | | | | | |
| Total dividends and distributions | | | (0.14 | ) | | | — | | | | (0.08 | ) | | | | | | | | |
| | | | | | | | | | | | | | | | | | | | | |
| Net Asset Value, End of Year/Period | | $ | 56.53 | | | $ | 48.68 | | | $ | 48.57 | | | | | | | | | |
| | | | | | | | | | | | | | | | | | | | | |
| Total Return** | | | 16.44 | % (8) | | | 0.23 | % (8) | | | (2.77 | )% (6) | | | | | | | | |
| Ratios and Supplemental Data: | | | | | | | | | | | | | | | | | | | | |
| Net assets, end of year/period (000s) | | $ | 0 | **** | | $ | 0 | **** | | $ | 0 | **** | | | | | | | | |
| Ratio of gross operating expenses to average net assets excluding interest expense (2,4) | | | 2.09 | % | | | 2.20 | % | | | 2.14 | % (7) | | | | | | | | |
| Ratio of net operating expenses to average net assets including interest expense (2,4) | | | 1.00 | % | | | 1.00 | % | | | 1.00 | % (7) | | | | | | | | |
| Ratio of net investment income (loss) before expense reimbursement to average net assets (2,5) | | | 2.11 | % | | | 1.65 | % | | | 1.25 | % (7) | | | | | | | | |
| Ratio of net investment income (loss) after expense reimbursement to average net assets (2,5) | | | 2.14 | % | | | 0.45 | % | | | (0.02 | )% (7) | | | | | | | | |
| Portfolio Turnover Rate | | | 55 | % | | | 38 | % | | | 62 | % (6) | | | | | | | | |
| | | | | | | | | | | | | | | | | | | | | |
| * | Less than $0.005 cent per share. |
| ** | Assumes reinvestment of all dividends and distributions and does not assume the effects of any sales charges. Aggregate (not annualized) total return is shown for any period shorter than one year. Total return does not reflect the deduction of taxes that a shareholder would pay on distributions or on the redemption of shares. |
| *** | Class R6 commenced operations on November 4, 2021. |
| (1) | Per share amounts calculated using the average shares method, which more appropriately presents the per share data for the year/period. |
| (2) | The ratios of expenses to average net assets and net investment income to average net assets do not reflect the expenses of the underlying investment companies in which the Fund invests. |
| (3) | Ratios to average net assets (excluding interest expense) |
| Expenses, before waiver and reimbursement | | | 2.09 | % | | | 2.20 | % | | | 2.14 | % | | | 3.57 | % | | | 2.15 | % |
| Expenses, net waiver and reimbursement | | | 1.25 | % | | | 1.25 | % | | | 1.25 | % | | | 1.25 | % | | | 1.25 | % |
| | | | | | | | | | | | | | | | | | | | | |
| (4) | Ratios to average net assets (excluding interest expense) |
| Expenses, before waiver and reimbursement | | | 2.09 | % | | | 2.20 | % | | | 2.14 | % (7) |
| Expenses, net waiver and reimbursement | | | 1.00 | % | | | 1.00 | % | | | 1.00 | % (7) |
| | | | | | | | | | | | | |
| (5) | Recognition of net investment income (loss) is affected by the timing and declaration of dividends by the underlying investment companies in which the Fund invests. |
| (7) | Annualized for periods less than one year. |
| (8) | Includes adjustments in accordance with accounting principles generally accepted in the United States and, consequently, the net asset value for financial reporting purposes and the returns based upon those net asset values may differ from the net asset values and returns for shareholder transactions. |
See accompanying notes to financial statements.
| EASTERLY FUNDS |
| FINANCIAL HIGHLIGHTS (For a share outstanding throughout each year) |
| |
| | | Easterly Snow Long/Short Opportunity Fund | |
| | | Class A | |
| | | For the | | | For the | | | For the | | | For the | | | For the | |
| | | Year Ended | | | Year Ended | | | Year Ended | | | Year Ended | | | Year Ended | |
| | | February 29, | | | February 28, | | | February 28, | | | February 28, | | | February 29, | |
| | | 2024 | | | 2023 | | | 2022 | | | 2021 | | | 2020 | |
| Net Asset Value, Beginning of Year | | $ | 31.04 | | | $ | 33.38 | | | $ | 31.48 | | | $ | 25.42 | | | $ | 26.07 | |
| Income (Loss) from Investment Operations: | | | | | | | | | | | | | | | | | | | | |
| Net investment income (1) | | | 0.51 | | | | 0.36 | | | | 0.17 | | | | 0.16 | | | | 0.27 | |
| Net realized and unrealized gain (loss) | | | 1.57 | | | | (0.66 | ) | | | 4.63 | | | | 6.32 | | | | (0.44 | ) |
| Total from investment operations | | | 2.08 | | | | (0.30 | ) | | | 4.80 | | | | 6.48 | | | | (0.17 | ) |
| Dividends and Distributions: | | | | | | | | | | | | | | | | | | | | |
| Dividends from net investment income | | | (0.62 | ) | | | (0.16 | ) | | | (0.34 | ) | | | (0.42 | ) | | | (0.48 | ) |
| Distributions from realized gains | | | (0.05 | ) | | | (1.88 | ) | | | (2.56 | ) | | | — | | | | — | |
| Total dividends and distributions | | | (0.67 | ) | | | (2.04 | ) | | | (2.90 | ) | | | (0.42 | ) | | | (0.48 | ) |
| | | | | | | | | | | | | | | | | | | | | |
| Net Asset Value, End of Year | | $ | 32.45 | | | $ | 31.04 | | | $ | 33.38 | | | $ | 31.48 | | | $ | 25.42 | |
| | | | | | | | | | | | | | | | | | | | | |
| Total Return* | | | 6.80 | % (6) | | | (0.62 | )% (6) | | | 15.40 | % | | | 25.71 | % | | | (0.85 | )% |
| Ratios and Supplemental Data: | | | | | | | | | | | | | | | | | | | | |
| Net assets, end of year (000s) | | $ | 48,966 | | | $ | 50,585 | | | $ | 52,102 | | | $ | 46,551 | | | $ | 51,478 | |
| Ratio of gross operating expenses to average net assets including interest expense (2,3) | | | 1.61 | % | | | 1.61 | % | | | 1.65 | % | | | 2.04 | % | | | 1.70 | % |
| Ratio of net operating expenses to average net assets including interest expense (2,3) | | | 1.61 | % | | | 1.58 | % | | | 1.68 | % | | | 2.00 | % | | | 1.70 | % |
| Ratio of net investment income before expense reimbursement to average net assets (2,5) | | | 1.64 | % | | | 1.11 | % | | | 0.51 | % | | | 0.59 | % | | | 0.98 | % |
| Ratio of net investment income (loss) after expense reimbursement to average net assets (2,5) | | | 1.64 | % | | | 1.14 | % | | | 0.49 | % | | | 0.63 | % | | | 0.98 | % |
| Portfolio Turnover Rate | | | 73 | % | | | 58 | % | | | 51 | % | | | 74 | % | | | 54 | % |
| | | | | | | | | | | | | | | | | | | | | |
| | | Easterly Snow Long/Short Opportunity Fund | |
| | | Class C | |
| | | For the | | | For the | | | For the | | | For the | | | For the | |
| | | Year Ended | | | Year Ended | | | Year Ended | | | Year Ended | | | Year Ended | |
| | | February 29, | | | February 28, | | | February 28, | | | February 28, | | | February 29, | |
| | | 2024 | | | 2023 | | | 2022 | | | 2021 | | | 2020 | |
| Net Asset Value, Beginning of Year | | $ | 29.02 | | | $ | 31.41 | | | $ | 29.75 | | | $ | 23.85 | | | $ | 24.36 | |
| Income (Loss) from Investment Operations: | | | | | | | | | | | | | | | | | | | | |
| Net investment income (loss) (1) | | | 0.26 | | | | 0.12 | | | | (0.06 | ) | | | (0.03 | ) | | | 0.07 | |
| Net realized and unrealized gain (loss) | | | 1.46 | | | | (0.63 | ) | | | 4.38 | | | | 5.93 | | | | (0.44 | ) |
| Total from investment operations | | | 1.72 | | | | (0.51 | ) | | | 4.32 | | | | 5.90 | | | | (0.37 | ) |
| Dividends and Distributions: | | | | | | | | | | | | | | | | | | | | |
| Dividends from net investment income | | | (0.41 | ) | | | — | | | | (0.10 | ) | | | — | | | | (0.14 | ) |
| Distributions from realized gains | | | (0.05 | ) | | | (1.88 | ) | | | (2.56 | ) | | | — | | | | — | |
| Total dividends and distributions | | | (0.46 | ) | | | (1.88 | ) | | | (2.66 | ) | | | — | | | | (0.14 | ) |
| | | | | | | | | | | | | | | | | | | | | |
| Net Asset Value, End of Year | | $ | 30.28 | | | $ | 29.02 | | | $ | 31.41 | | | $ | 29.75 | | | $ | 23.85 | |
| | | | | | | | | | | | | | | | | | | | | |
| Total Return* | | | 5.99 | % | | | (1.37 | )% | | | 14.64 | % | | | 24.74 | % | | | (1.58 | )% |
| Ratios and Supplemental Data: | | | | | | | | | | | | | | | | | | | | |
| Net assets, end of year (000s) | | $ | 2,678 | | | $ | 2,754 | | | $ | 3,158 | | | $ | 3,938 | | | $ | 9,744 | |
| Ratio of gross operating expenses to average net assets including interest expense (2,4) | | | 2.36 | % | | | 2.35 | % | | | 2.32 | % | | | 2.79 | % | | | 2.45 | % |
| Ratio of net operating expenses to average net assets including interest expense (2,4) | | | 2.36 | % | | | 2.32 | % | | | 2.35 | % | | | 2.75 | % | | | 2.45 | % |
| Ratio of net investment income before expense reimbursement to average net assets (2,5) | | | 0.90 | % | | | 0.36 | % | | | (0.16 | )% | | | (0.18 | )% | | | 0.25 | % |
| Ratio of net investment income after expense reimbursement to average net assets (2,5) | | | 0.90 | % | | | 0.39 | % | | | (0.18 | )% | | | (0.14 | )% | | | 0.25 | % |
| Portfolio Turnover Rate | | | 73 | % | | | 58 | % | | | 51 | % | | | 74 | % | | | 54 | % |
| | | | | | | | | | | | | | | | | | | | | |
| * | Assumes reinvestment of all dividends and distributions and does not assume the effects of any sales charges. Aggregate (not annualized) total return is shown for any period shorter than one year. Total return does not reflect the deduction of taxes that a shareholder would pay on distributions or on the redemption of shares. |
| (1) | Per share amounts calculated using the average shares method, which more appropriately presents the per share data for the year. |
| (2) | The ratios of expenses to average net assets and net investment income to average net assets do not reflect the expenses of the underlying investment companies in which the Fund invests. |
| (3) | Ratios to average net assets (excluding interest expense) |
| Expenses, before waiver and reimbursement | | | 1.43 | % | | | 1.48 | % | | | 1.45 | % | | | 1.59 | % | | | 1.41 | % |
| Expenses, net waiver and reimbursement | | | 1.43 | % | | | 1.45 | % | | | 1.48 | % | | | 1.55 | % | | | 1.41 | % |
| | | | | | | | | | | | | | | | | | | | | |
| (4) | Ratios to average net assets (excluding interest expense) |
| Expenses, before waiver and reimbursement | | | 2.18 | % | | | 2.22 | % | | | 2.10 | % | | | 2.34 | % | | | 2.16 | % |
| Expenses, net waiver and reimbursement | | | 2.18 | % | | | 2.19 | % | | | 2.13 | % | | | 2.30 | % | | | 2.16 | % |
| | | | | | | | | | | | | | | | | | | | | |
| (5) | Recognition of net investment income (loss) is affected by the timing and declaration of dividends by the underlying investment companies in which the Fund invests. |
| (6) | Includes adjustments in accordance with accounting principles generally accepted in the United States and, consequently, the net asset value for financial reporting purposes and the returns based upon those net asset values may differ from the net asset values and returns for shareholder transactions. |
See accompanying notes to financial statements.
| EASTERLY FUNDS |
| FINANCIAL HIGHLIGHTS (For a share outstanding throughout each year/period) |
| |
| | | Easterly Snow Long/Short Opportunity Fund | |
| | | Class I | |
| | | For the | | | For the | | | For the | | | For the | | | For the | |
| | | Year Ended | | | Year Ended | | | Year Ended | | | Year Ended | | | Year Ended | |
| | | February 29, | | | February 28, | | | February 28, | | | February 28, | | | February 29, | |
| | | 2024 | | | 2023 | | | 2022 | | | 2021 | | | 2020 | |
| Net Asset Value, Beginning of Year | | $ | 31.37 | | | $ | 33.71 | | | $ | 31.76 | | | $ | 25.68 | | | $ | 26.34 | |
| Income (Loss) from Investment Operations: | | | | | | | | | | | | | | | | | | | | |
| Net investment income (1) | | | 0.59 | | | | 0.44 | | | | 0.25 | | | | 0.22 | | | | 0.34 | |
| Net realized and unrealized gain (loss) | | | 1.58 | | | | (0.66 | ) | | | 4.69 | | | | 6.39 | | | | (0.44 | ) |
| Total from investment operations | | | 2.17 | | | | (0.22 | ) | | | 4.94 | | | | 6.61 | | | | (0.10 | ) |
| Dividends and Distributions: | | | | | | | | | | | | | | | | | | | | |
| Dividends from net investment income | | | (0.70 | ) | | | (0.24 | ) | | | (0.43 | ) | | | (0.53 | ) | | | (0.56 | ) |
| Distributions from realized gains | | | (0.05 | ) | | | (1.88 | ) | | | (2.56 | ) | | | — | | | | — | |
| Total dividends and distributions | | | (0.75 | ) | | | (2.12 | ) | | | (2.99 | ) | | | (0.53 | ) | | | (0.56 | ) |
| | | | | | | | | | | | | | | | | | | | | |
| Net Asset Value, End of Year | | $ | 32.79 | | | $ | 31.37 | | | $ | 33.71 | | | $ | 31.76 | | | $ | 25.68 | |
| | | | | | | | | | | | | | | | | | | | | |
| Total Return* | | | 7.03 | % (8) | | | (0.36 | )% (8) | | | 15.69 | % | | | 26.00 | % | | | (0.60 | )% |
| Ratios and Supplemental Data: | | | | | | | | | | | | | | | | | | | | |
| Net assets, end of year (000s) | | $ | 45,349 | | | $ | 46,802 | | | $ | 48,198 | | | $ | 45,372 | | | $ | 44,559 | |
| Ratio of gross operating expenses to average net assets including interest expense (2,3) | | | 1.36 | % | | | 1.36 | % | | | 1.41 | % | | | 1.79 | % | | | 1.45 | % |
| Ratio of net operating expenses to average net assets including interest expense (2,3) | | | 1.36 | % | | | 1.33 | % | | | 1.44 | % | | | 1.75 | % | | | 1.45 | % |
| Ratio of net investment income (loss) before expense reimbursement to average net assets (2,7) | | | 1.90 | % | | | 1.36 | % | | | 0.75 | % | | | 0.79 | % | | | 1.24 | % |
| Ratio of net investment income (loss) after expense reimbursement to average net assets (2,7) | | | 1.90 | % | | | 1.39 | % | | | 0.72 | % | | | 0.83 | % | | | 1.24 | % |
| Portfolio Turnover Rate | | | 73 | % | | | 58 | % | | | 51 | % | | | 74 | % | | | 54 | % |
| | | | | | | | | | | | | | | | | | | | | |
| | | Easterly Snow Long/Short Opportunity Fund | | | | | | | | | |
| | | Class R6** | | | | | | | | | |
| | | For the | | | For the | | | For the | | | | | | | | | |
| | | Year Ended | | | Year Ended | | | Period Ended | | | | | | | | | |
| | | February 29, | | | February 28, | | | February 28, | | | | | | | | | |
| | | 2024 | | | 2023 | | | 2022 | | | | | | | | | |
| Net Asset Value, Beginning of Year/Period | | $ | 31.37 | | | $ | 33.71 | | | $ | 35.83 | | | | | | | | | |
| Income (Loss) from Investment Operations: | | | | | | | | | | | | | | | | | | | | |
| Net investment income (1) | | | 0.59 | | | | 0.44 | | | | 0.12 | | | | | | | | | |
| Net realized and unrealized gain (loss) | | | 1.59 | | | | (0.66 | ) | | | 0.75 | | | | | | | | | |
| Total from investment operations | | | 2.18 | | | | (0.22 | ) | | | 0.87 | | | | | | | | | |
| Dividends and Distributions: | | | | | | | | | | | | | | | | | | | | |
| Dividends from net investment income | | | (0.70 | ) | | | (0.24 | ) | | | (0.43 | ) | | | | | | | | |
| Distributions from realized gains | | | (0.05 | ) | | | (1.88 | ) | | | (2.56 | ) | | | | | | | | |
| Total dividends and distributions | | | (0.75 | ) | | | (2.12 | ) | | | (2.99 | ) | | | | | | | | |
| | | | | | | | | | | | | | | | | | | | | |
| Net Asset Value, End of Year/Period | | $ | 32.80 | | | $ | 31.37 | | | $ | 33.71 | | | | | | | | | |
| | | | | | | | | | | | | | | | | | | | | |
| Total Return* | | | 7.07 | % (8) | | | (0.36 | )% (8) | | | 2.55 | % (5) | | | | | | | | |
| Ratios and Supplemental Data: | | | | | | | | | | | | | | | | | | | | |
| Net assets, end of year/period (000s) | | $ | 0 | *** | | $ | 0 | *** | | $ | 0 | *** | | | | | | | | |
| Ratio of gross operating expenses to average net assets including interest expense (2,4) | | | 1.36 | % | | | 1.36 | % | | | 1.41 | % (6) | | | | | | | | |
| Ratio of net operating expenses to average net assets including interest expense (2,4) | | | 1.18 | % | | | 1.13 | % | | | 1.23 | % (6) | | | | | | | | |
| Ratio of net investment income (loss) before expense reimbursement to average net assets (2,7) | | | 2.54 | % | | | 2.25 | % | | | 1.49 | % (6) | | | | | | | | |
| Ratio of net investment income after expense reimbursement to average net assets (2,7) | | | 2.54 | % | | | 1.77 | % | | | 1.05 | % (6) | | | | | | | | |
| Portfolio Turnover Rate | | | 73 | % | | | 58 | % | | | 51 | % (5) | | | | | | | | |
| | | | | | | | | | | | | | | | | | | | | |
| * | Assumes reinvestment of all dividends and distributions and does not assume the effects of any sales charges. Aggregate (not annualized) total return is shown for any period shorter than one year. Total return does not reflect the deduction of taxes that a shareholder would pay on distributions or on the redemption of shares. |
| ** | R6 commenced operations on November 4, 2021. |
| (1) | Per share amounts calculated using the average shares method, which more appropriately presents the per share data for the year/period. |
| (2) | The ratios of expenses to average net assets and net investment income to average net assets do not reflect the expenses of the underlying investment companies in which the Fund invests. |
| (3) | Ratios to average net assets (excluding interest expense) |
| Expenses, before waiver and reimbursement | | | 1.18 | % | | | 1.23 | % | | | 1.18 | % | | | 1.34 | % | | | 1.16 | % |
| Expenses, net waiver and reimbursement | | | 1.18 | % | | | 1.20 | % | | | 1.21 | % | | | 1.30 | % | | | 1.16 | % |
| | | | | | | | | | | | | | | | | | | | | |
| (4) | Ratios to average net assets (excluding interest expense) |
| Expenses, before waiver and reimbursement | | | 1.18 | % | | | 1.23 | % | | | 1.18 | % (6) |
| Expenses, net waiver and reimbursement | | | 1.00 | % | | | 1.00 | % | | | 1.00 | % (6) |
| | | | | | | | | | | | | |
| (6) | Annualized for periods less than one year. |
| (7) | Recognition of net investment income (loss) by the Fund is affected by the timing of the declaration of dividends by the underlying investment companies in which the Fund invests. |
| (8) | Includes adjustments in accordance with accounting principles generally accepted in the United States and, consequently, the net asset value for financial reporting purposes and the returns based upon those net asset values may differ from the net asset values and returns for shareholder transactions. |
See accompanying notes to financial statements.
EASTERLY FUNDS
NOTES TO FINANCIAL STATEMENTS
Year Ended February 29, 2024
| 1. | ORGANIZATION AND SIGNIFICANT ACCOUNTING POLICIES |
James Alpha Fund Trust dba Easterly Funds Trust (the “Trust”) was organized on September 21, 2020, as a Delaware Statutory Trust and is registered under the Investment Company Act of 1940, as amended, as an open-end management investment company. The Trust currently consists of five series. These financial statements include the following two diversified series:
| Fund Name | Investment Objective |
| Easterly Snow Small Cap Value Fund | Long Term Capital Appreciation |
| Easterly Snow Long/Short Opportunity Fund | Long Term Capital Appreciation and protection of investment principal |
Currently, Easterly Snow Small Cap Value Fund and Easterly Snow Long/Short Opportunity Fund offers Class A, Class C, Class I and Class R6 shares. Class A shares are offered at net asset value plus a maximum sales load of 5.75%. Class C shares are offered subject to a CDSC of 1.00%. Class I and Class R6 shares are offered at net asset value. Each class represents an interest in the same assets of the applicable Fund, and the classes are identical except for differences in their sales charge structures, ongoing services, and distribution charges. Class R6 shares are only available to certain qualified investors and the minimum initial investment will vary depending on the type of qualified investor. All classes of shares have equal voting privileges except that each class has exclusive voting rights with respect to its service and/or distribution plans.
The following is a summary of significant accounting policies followed by the Funds in preparation of its financial statements. These policies are in conformity with accounting principles generally accepted in the United States of America (“GAAP”). The preparation of financial statements in conformity with GAAP requires management to make estimates and assumptions that affect the reported amounts of assets and liabilities and disclosure of contingent assets and liabilities at the date of the financial statements and the reported amounts of increases and decreases in net assets from operations during the reporting period. Actual results could differ from those estimates. Each Fund is an investment company and accordingly follows the investment company accounting and reporting guidance of the Financial Accounting Standards Board (FASB) Accounting Standard Codification Topic 946 “Financial Services – Investment Companies”.
(a) Valuation of Investments
Investment securities listed on a national securities exchange are valued at the last reported sale price on the valuation date. NASDAQ traded securities are valued at the NASDAQ Official Closing Price (NOCP). If there are no such reported sales, the securities are valued at the mean between current bid and ask. Short-term debt securities having a remaining maturity of sixty days or less may be valued at amortized cost or amortized value, which approximates market value. Options listed on a securities exchange or board of trade for which market quotations are readily available shall be valued at the last quoted sales price or, in the absence of a sale, at the mean between the last bid and ask price. Options not listed on a securities exchange or board of trade for which over-the-counter market quotations are readily available shall be valued at the mean of the current bid and asked prices. Debt securities may be valued at prices supplied by the Fund’s pricing services based on broker or dealer supplied valuations or matrix pricing, a method of valuing securities by reference to the value of other securities with similar characteristics, such as rating, interest rate and maturity. Any securities or other assets for which market quotations are not readily available are valued at their fair value as determined in good faith under procedures established by the Board of Trustees (the “Board”). There is no single standard for determining the fair value of such securities. Rather, in determining the fair value of a security, the board-appointed Valuation Designee shall take into account the relevant factors and surrounding circumstances, a few of which may include: (i) the nature and pricing history (if any) of the security; (ii) whether any dealer quotations for the security are available; and (iii) possible valuation methodologies that could be used to determine the fair value of a security.
Valuation of Fund of Funds – The Funds may invest in portfolios of open-end or closed-end investment companies (the “Underlying Funds”). The Underlying Funds value securities in their portfolios for which market quotations are readily available at their market values (generally the last reported sale price) and all other securities and assets at their fair value based upon the methods established by the board of directors of the Underlying Funds.
Open-end investment companies are valued at their respective net asset values as reported by such investment companies. The shares of many closed-end investment companies, after their initial public offering, frequently trade at a price per share, which is different than the net asset value per share. The difference represents a market premium or market discount of such shares. There can be no assurances that the market discount or market premium on shares of any closed-end investment company purchased by the Funds will not change.
EASTERLY FUNDS
NOTES TO FINANCIAL STATEMENTS
Year Ended February 29, 2024 (Continued)
The Funds utilize various methods to measure the fair value of most of its investments on a recurring basis. GAAP establishes a hierarchy that prioritizes inputs to valuation methods. The three levels of input are:
Level 1 – Unadjusted quoted prices in active markets for identical assets and liabilities that the Funds have the ability to access.
Level 2 – Observable inputs other than quoted prices included in level 1 that are observable for the asset or liability, either directly or indirectly. These inputs may include quoted prices for the identical instrument on an inactive market, prices for similar instruments, interest rates, prepayment speeds, credit risk, yield curves, default rates and similar data.
Level 3 – Unobservable inputs for the asset or liability, to the extent relevant observable inputs are not available, representing the Funds’ own assumptions about the assumptions a market participant would use in valuing the asset or liability, and would be based on the best information available.
The availability of observable inputs can vary from security to security and is affected by a wide variety of factors, including, for example, the type of security, whether the security is new and not yet established in the marketplace, the liquidity of markets, and other characteristics particular to the security. To the extent that valuation is based on models or inputs that are less observable or unobservable in the market, the determination of fair value requires more judgment. Accordingly, the degree of judgment exercised in determining fair value is greatest for instruments categorized in Level 3.
The inputs used to measure fair value may fall into different levels of the fair value hierarchy. In such cases, for disclosure purposes, the level in the fair value hierarchy within which the fair value measurement falls in its entirety, is determined based on the lowest level input that is significant to the fair value measurement in its entirety.
The inputs or methodology used for valuing securities are not necessarily an indication of the risk associated with investing in those securities. The following tables summarize the inputs used as of February 29, 2024, for the Fund’ assets and liabilities measured at fair value:
| Small Cap Value | | | | | | | | | | | | |
| | | | | | | | | | | | | |
| Assets* | | Level 1 | | | Level 2 | | | Level 3 | | | Total | |
| Common Stocks | | $ | 22,874,295 | | | $ | — | | | $ | — | | | $ | 22,874,295 | |
| Total | | $ | 22,874,295 | | | $ | — | | | $ | — | | | $ | 22,874,295 | |
| Long/Short Opportunity | | | | | | | | | | | | |
| | | | | | | | | | | | | |
| Assets* | | Level 1 | | | Level 2 | | | Level 3 | | | Total | |
| Common Stocks | | $ | 103,096,828 | | | $ | — | | | $ | — | | | $ | 103,096,828 | |
| Exchange Traded Funds | | | 3,667,140 | | | | — | | | | — | | | | 3,667,140 | |
| Corporate Bonds | | | — | | | | 2,679,364 | | | | — | | | | 2,679,364 | |
| Total | | $ | 106,763,968 | | | $ | 2,679,364 | | | $ | — | | | $ | 109,443,332 | |
| Asset Derivatives | | | | | | | | | | | | | | | | |
| Put Options Purchased | | $ | — | | | $ | 1,800 | | | $ | — | | | $ | 1,800 | |
| Total Assets | | $ | 106,763,968 | | | $ | 2,681,164 | | | $ | — | | | $ | 109,445,132 | |
| Liability Derivatives | | | | | | | | | | | | | | | | |
| Call Options Written | | $ | — | | | $ | 1,671,725 | | | $ | — | | | $ | 1,671,725 | |
| Common Stocks | | | 6,715,540 | | | | — | | | | — | | | | 6,715,540 | |
| Exchange Traded Funds | | | 21,465,027 | | | | — | | | | — | | | | 21,465,027 | |
| Total Liabilities | | $ | 28,180,567 | | | $ | 1,671,725 | | | $ | — | | | $ | 29,852,292 | |
There were no level 3 securities held during the period.
| * | Refer to the Schedules of Investments for industry or category classifications. |
(b) Federal Income Tax
It is each Fund’s policy to continue to qualify as a regulated investment company by complying with the provisions of the Internal Revenue Code that are applicable to regulated investment companies and to distribute substantially all of its taxable income and net realized gains to shareholders. Therefore, no federal income tax provision is required.
EASTERLY FUNDS
NOTES TO FINANCIAL STATEMENTS
Year Ended February 29, 2024 (Continued)
The Funds recognize the tax benefits of uncertain tax positions only when the position is “more likely than not” to be sustained assuming examination by tax authorities. Management has analyzed the Fund’s tax positions and has concluded that no liability for unrecognized tax benefits should be recorded related to uncertain tax positions taken on returns filed for open tax years ended February 28, 2021 through February 28, 2023 or expected to be taken in the Funds’ February 29, 2024 year-end tax returns. The Funds identify its major tax jurisdictions as U.S. Federal, New York and foreign jurisdictions where the Funds make significant investments. The Funds recognize interest and penalties, if any, related to unrecognized tax benefits as income tax expense in the Statements of Operations. During the year ended February 29, 2024, the Funds did not incur any interest or penalties.
(c) Security Transactions and Other Income
Security transactions are reflected for financial reporting purposes as of the trade date. Dividend income is recognized on the ex-dividend date, and interest income is recognized on an accrual basis including premium amortized and discount accreted. Realized gains or losses from sales of securities are determined by comparing the identified cost of the security lot sold with the net sales proceeds. Withholding taxes on foreign dividends have been provided for in accordance with the Trust’s understanding of the applicable country’s tax rules and rates.
(d) Dividends and Distributions
The following table summarizes each Fund’s intended dividend and capital gain declaration policy:
| | | Income | | Capital |
| Fund | | Dividends | | Gains |
| Easterly Snow Small Cap Value | | Annually | | Annually |
| Easterly Snow Long/Short Opportunity | | Annually | | Annually |
Each Fund records dividends and distributions to its shareholders on the ex-dividend date. The amount of dividends and distributions from net investment income and net realized gains are determined in accordance with federal income tax regulations, which may differ from GAAP. These “book-tax” differences are either permanent or temporary in nature. To the extent these differences are permanent in nature, such amounts are reclassified within the net asset accounts based on their federal tax-basis treatment; temporary differences do not require reclassification. To the extent dividends and distributions exceed current and accumulated earnings and profits for federal income tax purposes, they are reported as distributions of paid-in-surplus or tax return of capital. These reclassifications have no effect on net assets, results from operations or net asset value per share of each Fund.
(e) Allocation of Expenses
Expenses of the Trust that are directly identifiable to a specific fund are charged to that fund. Expenses, which are not readily identifiable to a specific fund, are allocated in such a manner as deemed equitable, taking into consideration the nature and type of expense and the relative sizes of the funds in the Trust.
(f) Indemnification
The Trust indemnifies its Officers and Trustees for certain liabilities that may arise from the performance of their duties to the Trust. Additionally, in the normal course of business, the Funds enter into contracts that contain a variety of representations and warranties and which provide general indemnities. The Funds’ maximum exposure under these arrangements is unknown, as this would involve future claims that may be made against the Funds that have not yet occurred. However, based on experience, the risk of loss due to these warranties and indemnities appears to be remote.
(g) Other
The preparation of the financial statements in accordance with accounting principles generally accepted in the United States of America requires management to make estimates and assumptions that affect the reported amounts and disclosures in the financial statements. Actual results could differ from those estimates.
Foreign currency. Investment securities and other assets and liabilities denominated in foreign currencies are translated into U.S. dollar amounts at the date of valuation. Purchases and sales of investment securities and income and expense items denominated in foreign currencies are translated into U.S. dollar amounts on the respective dates of such transactions. The Trust does not isolate that
EASTERLY FUNDS
NOTES TO FINANCIAL STATEMENTS
Year Ended February 29, 2024 (Continued)
portion of the results of operations resulting from changes in foreign exchange rates on investments from the fluctuations arising from changes in market prices of securities held. Such fluctuations are included with the net realized and unrealized gain or loss from investments.
Reported net realized foreign exchange gains or losses arise from sales of foreign currencies, currency gains or losses realized between the trade and settlement dates on securities transactions, and the difference between the amounts of dividends, interest, and foreign withholding taxes recorded on the company’s books and the U.S. dollar equivalent of the amounts actually received or paid. Net unrealized foreign exchange gains and losses arise from changes in the fair values of assets and liabilities, other than investments in securities at fiscal period end, resulting from changes in exchange rates.
| 2. | MANAGEMENT FEE, ADMINISTRATION FEE AND OTHER TRANSACTIONS WITH AFFILIATES |
(a) Easterly Investment Partners LLC acts as investment manager for the Funds pursuant to the terms of a Management Agreement with the Trust, on behalf of the Funds (the “Management Agreement”). Under the terms of the Management Agreement, the Manager manages the investment operations of the Funds in accordance with each Fund’s respective investment policies and restrictions. Each investment sub-advisor is responsible for the day-to-day management of its Fund’s portfolios. Easterly Investment Partners LLC serves the Funds in a supervision capacity with responsibility to monitor the performance of the Funds’ outside service providers, assist in the review of financial statements and other regulatory filings and board meeting materials related to each Fund. The management fees are payable to Easterly Investment Partners LLC monthly by each Fund and are computed daily as shown in the table below.
(b) Pursuant to an operating expense limitation agreement between Easterly Investment Partners LLC and the Funds, Easterly Investment Partners LLC has contractually agreed to waive all or a portion of its advisory fee and/or pay expenses of the Fund so that total annual Fund operating expenses (excluding front-end and contingent deferred sales loads, leverage, interest and tax expenses, dividends and interest on short positions, brokerage commissions, expenses incurred in connection with any merger, reorganization or liquidation, extraordinary or non-routine expenses and Acquired Fund Fees and Expenses) do not exceed the expense limitation shown in the table below, and is based on the Funds’ average daily net assets. This operating expense limitation agreement cannot be terminated during its term. Easterly Investment Partners LLC is permitted to seek reimbursement from the Fund, subject to limitations, for management fees waived and Fund expenses it paid within three (3) years on a rolling basis in which such management fees were waived or expenses paid, as long as the reimbursement does not cause the Fund’s operating expenses to exceed (i) the expense cap in place at the time the fees were waived or the expenses were incurred; or (ii) the current expense cap, whichever is less. The expense limitation agreement will be in effect through June 30, 2024.
| | | | | | | | | | | | | | | Managament | | | | |
| | | | | | | | | | | | | | | Fee Waived/ | | | | |
| | | Management | | Expenses Limitation | | | | Expenses Reimbursed | | | | |
| Fund | | Agreement | | Cl A | | Cl C | | Cl I | | CL R6 | | Expires | | YTD 2/29/2024 | | | Recaptured | |
| Small Cap Value | | 0.95% | | 1.50% | | 2.25% | | 1.25% | | 1.00% | | 6/30/2024 | | $ | 194,993 | | | | — | |
| Long/Short Opportunity | | 0.80% | | 1.55% | | 2.30% | | 1.30% | | 1.00% | | 6/30/2024 | | | — | | | | — | |
The following table shows the available waived expenses and expiration date for each Fund subject to potential recovery.
| Fund | | 2/28/2025 | | | 2/28/2026 | | | 2/28/2027 | |
| Small Cap Value | | $ | 136,896 | | | $ | 199,708 | | | $ | 194,993 | |
| Long/Short Opportunity | | | — | | | | — | | | | — | |
EASTERLY FUNDS
NOTES TO FINANCIAL STATEMENTS
Year Ended February 29, 2024 (Continued)
(c) Effective October 2, 2023, Easterly Securities LLC (the “Distributor”) is the Trust’s Distributor and is an affiliate of the Advisor. The Trust with respect to the Funds have adopted a Plan of Distribution pursuant to Rule 12b-1 under the 1940 Act (the “Plan”) with respect to the sale and distribution of Class A and C shares of the Funds. The Plan rovides that the Fund will pay the Distributor and other entities, including a broker-dealer affiliate of the Adviser, are paid pursuant to the Plans provided and the expenses borne by the distributor and others in the distribution of Fund shares a fee, which is accrued daily and paid monthly, at the annual rate of 0.25% of the average daily net assets of Class A shares and 1.00% of the average daily net assets of each of the Funds’ Class C shares. Prior to October 2, 2023, Ultimus Fund Distributors, LLC (“UFD”) was the Trust’s Distributor. For the year ended February 29, 2024, pursuant to the Plan, Class A and Class C shares paid the amounts of:
| | | Easterly Securities, LLC | | | Ultimus Fund Distributors, LLC | |
| Fund | | Class A | | | Class C | | | Class A | | | Class C | |
| Small Cap Value | | $ | 10,455 | | | $ | 4,818 | | | $ | 13,980 | | | $ | 8,505 | |
| Long/Short Opportunity | | | 49,024 | | | | 10,989 | | | | 70,794 | | | | 15,613 | |
For the year ended February 29, 2024, the Distributor received and retained sales charges on sales of the Funds’ Class A and Class C shares as follows:
| | | Easterly Securities, LLC | | | Ultimus Fund Distributors, LLC | |
| | | Received | | | Retained | | | Received | | | Retained | |
| Fund | | Class A | | | Class C | | | Class A | | | Class C | | | Class A | | | Class C | | | Class A | | | Class C | |
| Small Cap Value | | $ | 1,726 | | | $ | 60 | | | $ | 226 | | | $ | — | | | $ | — | | | $ | 230 | | | $ | — | | | $ | — | |
| Long/Short Opportunity | | | 23 | | | | — | | | | 3 | | | | — | | | | 381 | | | | — | | | | 50 | | | | — | |
(d) Ultimus Fund Solutions, LLC (“UFS”), provides administrative, fund accounting and transfer agency services to the Funds pursuant to agreements with the Trust, for which it receives from each Fund: (i) a minimum annual fee or basis points in decreasing amounts as assets reach certain breakpoints; and (ii) any related out-of-pocket expenses.
In addition, certain affiliates of the Distributor provide services to the Trust as follows:
Northern Lights Compliance Services, LLC (“NLCS”) – NLCS, an affiliate of UFS, provides a Chief Compliance Officer to the Trust, as well as related compliance services, pursuant to a consulting agreement between NLCS and the Trust. Under the terms of such agreement, NLCS receives customary fees from the Funds.
Blu Giant, LLC (“Blu Giant”) – Blu Giant, an affiliate of UFS, provides EDGAR conversion and filing services as well as print management services for the Trust on an ad-hoc basis. For the provision of these services, Blu Giant receives customary fees from the Funds.
Certain employees of UFS and NLCS are also officers of the Trust and are not paid any fees directly by the Trust for serving in such capacity.
| 3. | INVESTMENT TRANSACTIONS |
(a) For the year ended February 29, 2024, the cost of purchases and proceeds from sales of investment securities, other than short-term securities, for the Funds were as follows:
| Fund | | Purchase | | | Sales | |
| Small Cap Value | | $ | 12,184,705 | | | $ | 18,787,975 | |
| Long/Short Opportunity | | | 82,060,867 | | | | 66,130,886 | |
(b) Other Investment Companies or Exchange Traded Funds – The Fund may invest in shares of other investment companies, including money market mutual funds, other mutual funds or exchange traded funds (“ETFs”). An ETF generally is an open-end investment company, unit investment trust or a portfolio of securities deposited with a depository in exchange for depository receipts. ETFs provide investors the opportunity to buy or sell throughout the day an entire portfolio of securities in a single security. Although index mutual funds are similar to index based ETFs, they are generally sold and redeemed only once per day at market close. The ETFs in which a Fund invests may be subject to liquidity risk. Liquidity risk exists when particular investments are difficult to purchase or sell, possibly preventing the sale of the security at an advantageous time or price. To the extent that the ETFs in which a Fund invests hold securities of companies with smaller market capitalizations or securities with substantial market risk, they will have a greater exposure to liquidity risk. In addition, ETFs are subject to the following risks that do not apply to conventional mutual funds that can be found in “Exchange-Traded Funds” below: (1) the market price of the ETF’s shares may trade at a discount to their net asset value; (2) an active trading market for an ETF’s shares may not develop or be maintained; or (3) trading of an ETF’s shares may be halted if the listing exchange deem such action appropriate, the shares are de-listed from the exchange, or the activation of market-wide “circuit breakers” (which are tied to large decreases in stock prices) halts stock trading generally. Additionally, ETFs have management fees, which increase their cost. In addition to the advisory and operational fees a Portfolio bears directly in connection with its own operation, the Portfolio also bears its pro rata portion of the advisory and operational expenses incurred indirectly through investments in other investment companies.
EASTERLY FUNDS
NOTES TO FINANCIAL STATEMENTS
Year Ended February 29, 2024 (Continued)
(c) Options Contracts – Certain Funds may enter into options contracts. An option contract is a contract in which the writer of the option grants the buyer of the option the right to purchase from (call option), or sell to (put option), the writer a designated instrument at a specified price within a specified period of time. Certain options, including options on indices, will require cash settlement by the Fund if the option is exercised.
Premiums paid when put or call options are purchased by the Fund, represent investments, which are marked-to-market daily. When a purchase option expires, the Fund will realize a loss in the amount of the premium paid. When the Fund enters into a closing sales transaction, the Fund will realize a gain or loss depending on whether the proceeds from the closing sales transaction are greater or less than the premium paid for the option. When the Fund exercises a put option, it will realize a gain or loss from the sale of the underlying security and the proceeds from such sale will be decreased by the premium originally paid. When the Fund exercises a call option, the cost of the security, which the Fund purchases upon exercise, will be increased by the premium originally paid.
Certain Funds may write covered call options. This means that the Fund will own the security subject to the option or an option to purchase the same underlying security, having an exercise price equal to or less than the exercise price of the covered option, or will establish and maintain with its custodian for the term of the option, an account consisting of cash, U.S. government securities or other liquid securities having a value equal to the fluctuating market value of the securities on which the Fund holds a covered call position.
When a Fund writes a call option, an amount equal to the premium received by the Fund is recorded as a liability, the value of which is marked-to-market daily. When a written option expires, the Fund realizes a gain equal to the amount of the premium received. When the Fund enters into a closing purchase transaction, the Fund realizes a gain or loss depending upon whether the cost of the closing transaction is greater or less than the premium originally received, without regard to any unrealized gain or loss on the underlying security, and the liability related to such option is eliminated. When a written call option is exercised the proceeds of the security sold will be increased by the premium originally received.
The liability representing a Fund’s obligation under an exchange traded written option or investment in a purchased option is valued at the last sale price or, in the absence of a sale, the last available bid price.
The Funds may enter into options for hedging purposes. The risk associated with purchasing options is limited to the premium originally paid. The risk in writing a covered call option is that the Fund gives up the opportunity to participate in any increase in the price of the underlying security beyond the exercise price.
(c) The Easterly Long/Short Opportunity Fund may sell a security it does not own in anticipation of a decline in the fair value of that security. When the Fund sells a security short, it must borrow the security sold short and deliver it to the broker-dealer through which it made the short sale. A gain, limited to the price at which the Fund sold the security short, or a loss, unlimited in size, will be recognized upon the termination of a short sale. For financial statement purposes, an amount equal to the settlement amount is included in the Statement of Assets and Liabilities as a liability. The amount of the liability is subsequently marked to market to reflect the current value of the short positions. Subsequent fluctuations in the market prices of the securities sold, but not yet purchased, may require purchasing the securities at prices which could differ from the amount reflected in the Statement of Assets and Liabilities. The Fund is liable for any dividends or interest payable on securities while those securities are in a short position. Such amounts are recorded on the ex-dividend date as dividend or interest expense. As collateral for its short positions, the Fund is required under the 1940 Act to maintain segregated assets consisting of cash, cash equivalents or liquid securities.
The derivatives are not accounted for as hedging instruments under GAAP. The effect of derivative instruments on the Statements of Assets and Liabilities at February 29, 2024, were as follows:
| | | | | | | Location of derivatives on | | Fair value of asset/liability | |
| Fund | | Derivative | | Risk Type | | Statements of Assets and Liabilities | | derivatives | |
| Long/Short Opportunity | | | | | | | | |
| | | Put options purchased | | Equity | | Investments in securities, at value | | $ | 1,800 | |
| | | Call options written | | Equity | | Options written | | | (1,671,725 | ) |
| | | | | | | Totals | | $ | (1,669,925 | ) |
EASTERLY FUNDS
NOTES TO FINANCIAL STATEMENTS
Year Ended February 29, 2024 (Continued)
The effect of derivative instruments on the Statements of Operations for the year ended February 29, 2024, were as follows:
| | | | | | | Realized and unrealized gain | |
| Portfolio Derivative | | Location of gain (loss) on derivatives | | Risk Type | | (loss) on derivatives | |
| Long/Short Opportunity | |
| | Option Contracts | | | | | | |
| | | Net realized loss on options purchased | | Equity | | $ | (269,312 | ) |
| | | Net realized gain on options written | | Equity | | | 645,295 | |
| | | Net change in unrealized appreciation on options purchased | | Equity | | | 810 | |
| | | Net change in unrealized depreciation on options written | | Equity | | | (1,231,471 | ) |
| | | | | | | $ | (854,678 | ) |
The average notional value of the derivative instruments for the Easterly Long/Short Opportunity during the year ended February 29, 2024, was as follows:
| Options Purchased | | | Options Written | |
| $ | 7,679,000 | | | $ | 16,210,425 | |
The Fund is not subject to any Master Netting Arrangements, therefore the Fund did not offset any assets or liabilities.
| 4. | AGGREGATE UNREALIZED APPRECIATION AND DEPRECIATION – TAX BASIS |
| | | Cost for | | | Gross | | | Gross | | | Tax Net | |
| | | Federal Tax | | | Unrealized | | | Unrealized | | | Unrealized | |
| Portfolio | | Purposes | | | Appreciation | | | Depreciation | | | Appreciation/(Depreciation) | |
| Small Cap Value | | $ | 18,645,147 | | | $ | 4,919,327 | | | $ | (690,179 | ) | | $ | 4,229,148 | |
| Long/Short Opportunity | | | 61,790,634 | | | | 22,939,220 | | | | (5,137,015 | ) | | | 17,802,205 | |
| 5. | DISTRIBUTIONS TO SHAREHOLDERS AND TAX COMPONENTS OF CAPITAL |
The tax character of fund distributions paid for the years ended February 29, 2024, and February 28, 2023, was as follows:
| | | For the year ended February 29, 2024: | | | | |
| | | Ordinary | | | Long-Term | | | Return | | | | |
| Portfolio | | Income | | | Capital Gains | | | Of Capital | | | Total | |
| Small Cap Value | | $ | 33,756 | | | $ | — | | | $ | — | | | $ | 33,756 | |
| Long/Short Opportunity | | | 1,909,851 | | | | 136,752 | | | | — | | | | 2,046,603 | |
| | | | | | | | | | | | | | | | | |
| | | For the year ended February 28, 2023: | | | | |
| | | Ordinary | | | Long-Term | | | Return | | | | |
| Portfolio | | Income | | | Capital Gains | | | Of Capital | | | Total | |
| Small Cap Value | | $ | — | | | $ | — | | | $ | — | | | $ | — | |
| Long/Short Opportunity | | | 1,082,299 | | | | 5,197,746 | | | | — | | | | 6,280,045 | |
As of February 29, 2024, the components of accumulated earnings/ (deficit) on a tax basis were as follows:
| | | Undistributed | | | Undistributed | | | Post October Loss | | | Capital Loss | | | Other | | | Unrealized | | | Total | |
| | | Ordinary | | | Long-Term | | | and | | | Carry | | | Book/Tax | | | Appreciation/ | | | Accumulated | |
| Portfolio | | Income | | | Capital Gains | | | Late Year Loss | | | Forwards | | | Differences | | | (Depreciation) | | | Earnings/(Deficits) | |
| Small Cap Value | | $ | 223,018 | | | $ | — | | | $ | — | | | $ | (2,043,032 | ) | | $ | — | | | $ | 4,229,139 | | | $ | 2,409,125 | |
| Long/Short Opportunity | | | 329,803 | | | | 131,500 | | | | — | | | | — | | | | — | | | | 17,801,486 | | | | 18,262,789 | |
The difference between book basis and tax basis undistributed net investment income (loss), accumulated net realized gains (losses), and unrealized appreciation/(depreciation) from investments is primarily attributable to the tax deferral of losses on wash sales and perpetual bonds. The unrealized appreciation (depreciation) in the table above includes unrealized foreign currency losses of $9 for the Easterly Snow Small Cap Value Fund and $719 for the Easterly Snow Long/Short Opportunity Fund.
EASTERLY FUNDS
NOTES TO FINANCIAL STATEMENTS
Year Ended February 29, 2024 (Continued)
At February 29, 2024, the Easterly Snow Small Cap Value Fund had capital loss carry forwards for federal income tax purposes available to offset future capital gains, along with capital loss carryforwards utilized as follows:
| | | | | | | | | | | | CLCF | |
| Portfolio | | Short-Term | | | Long-Term | | | Total | | | Utilized | |
| Small Cap Value | | $ | 1,400,441 | | | $ | 642,591 | | | $ | 2,043,032 | | | $ | 563,918 | |
| Long/Short Opportunity | | | — | | | | — | | | | — | | | | — | |
During the fiscal year ended February 29, 2024, the Easterly Snow Long/Short Opportunity Fund utilized tax equalization which is the use of earnings and profits distributions to shareholders on redemption of shares as part of the dividends paid deduction for income tax purposes. Permanent book and tax differences, primarily attributable to the use of equalization resulted in reclassifications for the Fund for the fiscal year ended February 29, 2024, as follows:
| | | | | | Accumulated | |
| Portfolio | | Paid In Capital | | | Earnings (Losses) | |
| Small Cap Value | | $ | — | | | $ | — | |
| Long/Short Opportunity | | | 89,641 | | | | (89,641 | ) |
The beneficial ownership, either directly or indirectly, of more than 25% of the voting securities of a Fund creates a presumption of control of the Fund under Section 2(a)(9) of the 1940 Act. As of February 29, 2024, the shareholders that own 25% or more of the voting securities are as follows:
| | | | | | Long/Short | |
| Owner | | Small Cap Value | | | Opportunity | |
| Merrill Lynch | | | 42.0 | % | | | 42.0 | % |
| 7. | RECENT REGULATORY UPDATES |
On January 24, 2023, the SEC adopted rule and form amendments to require mutual funds and ETFs to transmit concise and visually engaging streamlined annual and semiannual reports to shareholders that highlight key information. Other information, including financial statements, will not appear in a streamlined shareholder report but must be available online, delivered free of charge upon request, and filed on a semiannual basis on Form N-CSR. The rule and form amendments have a compliance date of July 24, 2024. At this time, management is evaluating the impact of these amendments on the shareholder reports for the Funds.
Subsequent events after the date of the Statements of Assets and Liabilities have been evaluated through the date the financial statements were issued. Management has determined that no events or transactions occurred requiring adjustment or disclosure in the financial statements.
REPORT OF INDEPENDENT REGISTERED PUBLIC ACCOUNTING FIRM
To the Shareholders and Board of Trustees
of James Alpha Funds Trust d/b/a Easterly
Funds Trust
Opinion on the Financial Statements
We have audited the accompanying statements of assets and liabilities of Easterly Snow Small Cap Value Fund, and Easterly Snow Long/Short Opportunity Fund, (collectively referred to as the “Funds”), each a series of the James Alpha Funds Trust d/b/a Easterly Funds Trust, including the schedules of investments, as of February 29, 2024, the related statements of operations for the year then ended, the statements of changes in net assets for the two years in the period then ended and the financial highlights for each of the three years in the period then ended, and the related notes (collectively referred to as the “financial statements”). In our opinion, the financial statements present fairly, in all material respects, the financial position of the Funds as of February 29, 2024 the results of its operations for the year then ended, the changes in its net assets and the financial highlights for each of the three years in the period then ended, in conformity with accounting principles generally accepted in the United States of America.
The financial highlights for each of the two years in the period ended February 28, 2021 have been audited by other auditors, whose report dated April 28, 2021 expressed unqualified opinions on such statement and financial highlights.
Basis for Opinion
These financial statements are the responsibility of the Funds’ management. Our responsibility is to express an opinion on the Fund’s financial statements based on our audit. We are a public accounting firm registered with the Public Company Accounting Oversight Board (United States) (“PCAOB”) and are required to be independent with respect to the Funds in accordance with the U.S. federal securities laws and the applicable rules and regulations of the Securities and Exchange Commission and the PCAOB. We have served as the auditor of one or more of the funds in the Trust since 2011.
We conducted our audits in accordance with the standards of the PCAOB. Those standards require that we plan and perform the audits to obtain reasonable assurance about whether the financial statements are free of material misstatement, whether due to error or fraud. The Funds are not required to have, nor were we engaged to perform, an audit of the Funds’ internal control over financial reporting. As part of our audits we are required to obtain an understanding of internal control over financial reporting, but not for the purpose of expressing an opinion on the effectiveness of the Funds’ internal control over financial reporting. Accordingly, we express no such opinion.
Our audits included performing procedures to assess the risks of material misstatement of the financial statements, whether due to error or fraud, and performing procedures that respond to those risks. Such procedures included examining, on a test basis, evidence regarding the amounts and disclosures in the financial statements. Our audits also included evaluating the accounting principles used and significant estimates made by management, as well as evaluating the overall presentation of the financial statements. Our procedures included confirmation of securities owned as of February 29, 2024 by correspondence with custodians. We believe that our audits provide a reasonable basis for our opinion.

TAIT, WELLER & BAKER LLP
Philadelphia, Pennsylvania
April 29, 2024
| EASTERLY FUNDS |
| SUPPLEMENTAL INFORMATION (Unaudited) |
Shareholders of funds will pay ongoing expenses, such as advisory fees, distribution and services fees (12b-1 fees), and other fund expenses. The following examples are intended to help the shareholder understand the ongoing cost (in dollars) of investing in a fund and to compare these costs with the ongoing costs of investing in other mutual funds. Please note, the expenses shown in the tables are meant to highlight ongoing costs only and do not reflect any transactional costs, such as sales charges (loads), or contingent deferred sales charges (CDSCs) on redemptions.
This example is based on an investment of $1,000 invested at the beginning of the period and held for the entire period from September 1, 2023 through February 29, 2024.
Actual Expenses: The first table provides information about actual account values and actual expenses. The shareholder may use the information in this line, together with the amount invested, to estimate the expenses that would be paid over the period. Simply divide account value by $1,000 (for example, an $8,600 account value divided by $1,000 = 8.6), then multiply the result by the number under the heading entitled “Expenses Paid” to estimate the expenses paid on the account during the period.
| | Beginning Account | | Ending Account | | Expense Paid | | Expense Ratio |
| | Value - 09/01/2023 | | Value - 02/29/2024 | | 09/01/2023-02/29/2024* | | [Annualized] |
| Actual Expenses | | | | | | | |
| Easterly Snow Small Cap Value - Class A | $1,000.00 | | $1,099.60 | | $7.83 | | 1.50% |
| Easterly Snow Small Cap Value - Class C | 1,000.00 | | 1,095.40 | | 11.72 | | 2.25% |
| Easterly Snow Small Cap Value - Class I | 1,000.00 | | 1,100.90 | | 6.53 | | 1.25% |
| Easterly Snow Small Cap Value - Class R6 | 1,000.00 | | 1,101.10 | | 5.22 | | 1.00% |
| Easterly Snow Long/Short Opportunity - Class A | 1,000.00 | | 1,056.10 | | 8.69 | | 1.70% |
| Easterly Snow Long/Short Opportunity - Class C | 1,000.00 | | 1,051.90 | | 12.50 | | 2.45% |
| Easterly Snow Long/Short Opportunity - Class I | 1,000.00 | | 1,057.20 | | 7.42 | | 1.45% |
| Easterly Snow Long/Short Opportunity - Class R6 | 1,000.00 | | 1,057.50 | | 5.12 | | 1.00% |
Hypothetical Examples for Comparison Purposes: The second table below provides information about hypothetical account values and hypothetical expenses based on the fund’s actual expense ratio and an assumed rate of return of 5% per year before expenses, which is not the fund’s actual return. The hypothetical account values and expenses may not be used to estimate the actual ending account balance or expenses paid for the period. This information may be used to compare the ongoing costs of investing in the fund and other mutual funds. To do so, a shareholder would compare this 5% hypothetical example with the 5% hypothetical examples that appear in the shareholder reports of the other mutual funds.
| | Beginning Account | | Ending Account | | Expense Paid | | Expense Ratio |
| Hypothetical | Value - 09/01/2023 | | Value - 02/29/2024 | | 09/01/2023-02/29/2024* | | [Annualized] |
| [5% Return Before Expenses] | | | | | | | |
| Easterly Snow Small Cap Value - Class A | $1,000.00 | | $1,017.40 | | $7.52 | | 1.50% |
| Easterly Snow Small Cap Value - Class C | 1,000.00 | | 1,013.67 | | 11.27 | | 2.25% |
| Easterly Snow Small Cap Value - Class I | 1,000.00 | | 1,018.65 | | 6.27 | | 1.25% |
| Easterly Snow Small Cap Value - Class R6 | 1,000.00 | | 1,019.89 | | 5.02 | | 1.00% |
| Easterly Snow Long/Short Opportunity - Class A | 1,000.00 | | 1,016.41 | | 8.52 | | 1.70% |
| Easterly Snow Long/Short Opportunity - Class C | 1,000.00 | | 1,012.68 | | 12.26 | | 2.45% |
| Easterly Snow Long/Short Opportunity - Class I | 1,000.00 | | 1,017.65 | | 7.27 | | 1.45% |
| Easterly Snow Long/Short Opportunity - Class R6 | 1,000.00 | | 1,019.89 | | 5.02 | | 1.00% |
| * | Expenses are equal to the Funds annualized expense ratio multiplies by the number of days in the period (182) divided by the number of days in the fiscal year (366). |
| EASTERLY FUNDS |
| SUPPLEMENTAL INFORMATION (Unaudited) |
| February 29, 2024 |
The Trustees and executive officers of the Trust, and their principal occupations during the past five years, are set forth in the table below. Darrell Crate is an “interested person” of the Trust (as that term is defined in the 1940 Act) by virtue of their position as an officer of Easterly.
Name, Year of
Birth,
and Address | Position(s)
Held with
Trust | Term*/
Length
of
Time
Served | Principal
Occupation(s) During
Past 5 Years | Number
of
Funds in
Fund
Complex
Overseen | Other
Directorships
Held by
Trustee
During Past 5
Years |
| INTERESTED TRUSTEE: |
Darrell Crate,
Year of Birth: 1967
515 Madison Avenue
24th Floor
New York, NY 10022 | President and Chairperson of the Board | Since 2021 | Chief Executive Officer of Easterly Funds LLC (2020 – Present); Managing Principal of Easterly Asset Management LP (2016 – Present); Managing Partner of Easterly Capital LLC (2015 – Present) | 5 | Chairman of the Board and Director of Easterly Government Properties Inc. (2015 – Present). |
| INDEPENDENT TRUSTEES: |
Neil Medugno,
Year of Birth: 1957
515 Madison Avenue
24th Floor
New York, NY 10022 | Trustee | Since 2021 | Retired (2017 – Present) | 5 | Trustee of Six Circles Trust (2018 - Present) |
A. Clayton Spencer,
Year of Birth: 1954
515 Madison Avenue
24th Floor
New York, NY 10022 | Trustee | Since 2023 | President of Bates College (2012 – 2023) | 5 | Not Applicable |
| EASTERLY FUNDS |
| SUPPLEMENTAL INFORMATION (Unaudited) |
| February 29, 2024 |
Name, Year of
Birth,
and Address | Position(s)
Held with
Trust | Term*/
Length
of
Time
Served | Principal
Occupation(s) During
Past 5 Years | Number of
Funds in
Fund
Complex
Overseen | Other
Directorships
Held by
Trustee
During Past 5
Years |
| OFFICERS: |
Michael Montague,
Year of Birth: 1975
515 Madison Avenue
24th Floor
New York, NY 10022 | Treasurer | Since 2021 | Chief Operating Officer of Easterly Funds LLC (2010 – Present); Chief Operating Officer, James Alpha Management, LLC (2006 – Present); Chief Financial Officer, Easterly Asset Management LP (2023 – Present) | Not Applicable | Not Applicable |
Emile Molineaux,
Year of Birth: 1962
4221 North 203rd Street,
Ste. 100
Elkhorn, NE 68022 | Chief Compliance Officer | Since 2021 | Senior Compliance Officer of Northern Lights Compliance Services, LLC (2011 – Present) | Not Applicable | Not Applicable |
Chad Bitterman,
Year of Birth: 1972
4221 North 203rd Street,
Ste. 100
Elkhorn, NE 68022 | Anti-Money Laundering Compliance Officer | Since 2021 | Compliance Officer of Northern Lights Compliance Services, LLC (2010 – Present) | Not Applicable | Not Applicable |
Amaris Miller,
Year of Birth: 1992
515 Madison Avenue
24th Floor
New York, NY 10022 | Secretary | Since 2021 | Chief Operating Officer, Easterly Asset Management Operations LLC (2021 – Present); Senior Management Consultant, The Poirier Group (2018 – 2021) | Not Applicable | Not Applicable |
Ken Juster,
Year of Birth: 1976
515 Madison Avenue
24th Floor
New York, NY 10022 | Chief Legal Officer | Since 2022 | General Counsel of Easterly Asset Management LP (2022 – Present); Partner, Cooley LLP (2018 – 2022) | Not Applicable | Not Applicable |
Erik Naviloff,
Year of Birth: 1968
4221 North 203rd Street,
Ste. 100
Elkhorn, NE 68022 | Assistant Treasurer | Since 2021 | Vice President, Ultimus Fund Solutions, LLC (2011 – present) | Not Applicable | Not Applicable |
Timothy Burdick,
Year of Birth: 1986
4221 North 203rd Street,
Ste. 100
Elkhorn, NE 68022 | Assistant Secretary | Since 2021 | Vice President, Ultimus Fund Solutions, LLC (2022 – present); Assistant Vice President, Ultimus Fund Solutions, LLC (2019 – 2022); Senior Program Compliance Manager, CJ Affiliate (2016 – 2019) | Not Applicable | Not Applicable |
| * | Each Trustee will serve an indefinite term until they resign or retire and/or their successor, if any, is duly elected and qualified. Officers of the Trust serve at the pleasure of the Board. |
The Funds’ SAI includes additional information about the Trustees and is available free of charge, upon request, by calling toll-free at 1-888-814-8180.
PRIVACY NOTICE
JAMES ALPHA FUNDS TRUST dba EASTERLY FUNDS TRUST
March 2021
| FACTS | WHAT DOES JAMES ALPHA FUNDS TRUST dba EASTERLY FUNDS TRUST DO WITH YOUR PERSONAL INFORMATION? |
| | |
| Why? | Financial companies choose how they share your personal information. Federal law gives consumers the right to limit some, but not all sharing. Federal law also requires us to tell you how we collect, share, and protect your personal information. Please read this notice carefully to understand what we do. |
| | |
| What? | The types of personal information we collect and share depends on the product or service that you have with us. This information can include: ● Social Security number and wire transfer instructions ● account transactions and transaction history ● investment experience and purchase history When you are no longer our customer, we continue to share your information as described in this notice. |
| | |
| How? | All financial companies need to share customers’ personal information to run their everyday business. In the section below, we list the reasons financial companies can share their customers’ personal information; the reasons James Alpha Funds Trust chooses to share; and whether you can limit this sharing. |
| | |
Reasons we can share your personal
information: | Does James Alpha Funds Trust
dba Easterly Funds Trust
share information? | Can you limit
this sharing? |
For our everyday business purposes - such as to process your transactions, maintain your account(s), respond to court orders and legal investigations, or report to credit bureaus. | YES | NO |
For our marketing purposes - to offer our products and services to you. | YES | YES |
| For joint marketing with other financial companies. | NO | We don’t share |
For our affiliates’ everyday business purposes - information about your transactions and records. | NO | We don’t share |
For our affiliates’ everyday business purposes - information about your credit worthiness. | NO | We don’t share |
| For nonaffiliates to market to you | NO | We don’t share |
| | | |
| QUESTIONS? | Call (888) 814-8180 | | |
| What we do: |
| How does James Alpha Funds Trust dba Easterly Funds Trust protect my personal information? | To protect your personal information from unauthorized access and use, we use security measures that comply with federal law. These measures include computer safeguards and secured files and buildings. Our service providers are held accountable for adhering to strict policies and procedures to prevent any misuse of your nonpublic personal information. |
| How does James Alpha Funds Trust dba Easterly Funds Trust collect my personal information? | We collect your personal information, for example, when you ● open an account or deposit money ● direct us to buy securities or direct us to sell your securities ● seek advice about your investments We also collect your personal information from others, such as credit bureaus, affiliates, or other companies. |
| Why can’t I limit all sharing? | Federal law gives you the right to limit only: ● sharing for affiliates’ everyday business purposes – information about your creditworthiness. ● affiliates from using your information to market to you. ● sharing for nonaffiliates to market to you. State laws and individual companies may give you additional rights to limit sharing. |
| |
| Definitions |
| Affiliates | Companies related by common ownership or control. They can be financial and nonfinancial companies. ● James Alpha Funds Trust dba Easterly Funds Trust does not share with our affiliates. |
| Nonaffiliates | Companies not related by common ownership or control. They can be financial and nonfinancial companies. ● James Alpha Funds Trust dba Easterly Funds Trust does not share with nonaffiliates so they can market to you. |
| Joint marketing | A formal agreement between nonaffiliated financial companies that together market financial products or services to you. ● James Alpha Funds Trust dba Easterly Funds Trust doesn’t jointly market. |
How to Obtain Proxy Voting Information
Information regarding how the Portfolios voted proxies relating to portfolio securities during the most recent twelve month period ended June 30 as well as a description of the policies and procedures that the Portfolios use to determine how to vote proxies is available without charge, upon request, by calling 1-833-999-2636 or by referring to the Securities and Exchange Commission’s (“SEC”) website at http://www.sec.gov.
How to Obtain 1st and 3rd Fiscal Quarter Portfolio Holdings
Funds file a complete schedule of portfolio holdings with the Securities and Exchange Commission (the “SEC”) for the first and third quarters of each fiscal year as an exhibit to its reports on Form N-PORT, within sixty days after the end of the period. Form N-PORT reports are available at the SEC’s website at www.sec.gov.
EASTERLYSNOW-AR24
Item 2. Code of Ethics.
(a) As of the end of the period covered by this report, the registrant has adopted a code of ethics that applies to the registrant's principal executive officer, principal financial officer, principal accounting officer or controller, or persons performing similar functions, regardless of whether these individuals are employed by the registrant or a third party.
(b) For purposes of this item, “code of ethics” means written standards that are reasonably designed to deter wrongdoing and to promote:
| (1) | Honest and ethical conduct, including the ethical handling of actual or apparent conflicts of interest between personal and professional relationships; |
| (2) | Full, fair, accurate, timely, and understandable disclosure in reports and documents that a registrant files with, or submits to, the Commission and in other public communications made by the registrant; |
(3) Compliance with applicable governmental laws, rules, and regulations;
| (4) | The prompt internal reporting of violations of the code to an appropriate person or persons identified in the code; and |
(5) Accountability for adherence to the code.
(c) Amendments: During the period covered by the report, there have not been any amendments to the provisions of the code of ethics.
(d) Waivers: During the period covered by the report, the registrant has not granted any express or implicit waivers from the provisions of the code of ethics.
Item 3. Audit Committee Financial Expert.
(a) The registrant’s board of trustees has determined that Neil Medugno is an audit committee financial expert as defined in Item 3 of Form N-CSR. Mr. Medugno is independent for purposes of this Item 3.
Item 4. Principal Accountant Fees and Services.
Audit Fees The aggregate fees billed for each of the last two fiscal years for professional services rendered by the registrant's principal accountant for the audit of the registrant's annual financial statements or services that are normally provided by the accountant in connection with statutory and regulatory filings or engagements for those fiscal years are as follows:
Registrant
(a) FYE 2/28/23 $29,000
FYE 2/29/24 $29,000
Registrant
FYE 2/28/23 $ 0.00
FYE 2/29/24 $ 0.00
Registrant
FYE 2/28/23 $5,000
FYE 2/29/24 $5,000
Preparation of Federal & State income tax returns, assistance with calculation of required income, capital gain and excise distributions and preparation of Federal excise tax returns.
Registrant
FYE 2/28/23 $ 0.00
FYE 2/29/24 $ 0.00
| (e) | (1) Audit Committee’s Pre-Approval Policies |
The registrant’s Audit Committee is required to pre-approve all audit services and, when appropriate, any non-audit services (including audit-related, tax and all other services) to the registrant. The registrant’s Audit Committee also is required to pre-approve, when appropriate, any non-audit services (including audit-related, tax and all other services) to its adviser, or any entity controlling, controlled by or under common control with the adviser that provides ongoing services to the registrant, to the extent that the services may be determined to have an impact on the operations or financial reporting of the registrant. Services are reviewed on an engagement by engagement basis by the Audit Committee.
| (2) | Percentages of Services Approved by the Audit Committee |
Registrant
Audit-Related Fees: 100.00%
Tax Fees: 100.00%
All Other Fees: 100.00%
| (f) | During the audit of registrant's financial statements for the most recent fiscal year, less than 50 percent of the hours expended on the principal accountant's engagement were attributed to work performed by persons other than the principal accountant's full-time, permanent employees. |
| (g) | All non-audit fees billed by the registrant's principal accountant for services rendered to the registrant for the fiscal year ended February 29, 2024, are disclosed in (b)-(d) above. There were no audit or non-audit services performed by the registrant's principal accountant for the registrant's adviser. |
| (h) | Not applicable. |
(i) (j) | Not applicable. Not applicable. |
Item 5. Audit Committee of Listed Companies. Not applicable to open-end investment companies.
Item 6. Schedule of Investments. See Item 1.
Item 7. Disclosure of Proxy Voting Policies and Procedures for Closed-End Funds. Not applicable to
open-end investment companies.
Item 8. Portfolio Managers of Closed-End Management Investment Companies. Not applicable to open-end investment companies.
Item 9. Purchases of Equity Securities by Closed-End Management Investment Company and Affiliated Purchasers. Not applicable to open-end investment companies.
Item 10. Submission of Matters to a Vote of Security Holders. None.
Item 11. Controls and Procedures.
(a) Based on an evaluation of the Registrant’s disclosure controls and procedures as of a date within 90 days of filing date of this Form N-CSR, the principal executive officer and principal financial officer of the Registrant have concluded that the disclosure controls and procedures of the Registrant are reasonably designed to ensure that the information required in filings on Form N-CSR is recorded, processed, summarized, and reported by the filing date, including that information required to be disclosed is accumulated and communicated to the Registrant’s management, including the Registrant’s principal executive officer and principal financial officer, as appropriate to allow timely decisions regarding required disclosure.
(b) There were no significant changes in the Registrant’s internal control over financial reporting (as defined in Rule 30a-3(d) under the 1940 Act) that occurred during the period covered by this report that have materially affected, or are reasonably likely to materially affect, the Registrant’s internal control over financial reporting.
Item 12. Disclosure of Securities Lending Activities for Closed-End Management Investment Companies. Not applicable to open-end investment companies.
Item 13. Exhibits.
(a)(1) Code of Ethics for Principal Executive and Senior Financial Officers is attached hereto.
(a)(2) Certification(s) required by Section 302 of the Sarbanes-Oxley Act of 2002 (and Item 11(a)(2) of Form N-CSR) are filed herewith.
(a)(3) Not applicable.
(b) Certification(s) required by Section 906 of the Sarbanes-Oxley Act of 2002 (and Item 11(b) of Form N-CSR) are filed herewith.
SIGNATURES
Pursuant to the requirements of the Securities Exchange Act of 1934 and the Investment Company Act of 1940, the registrant has duly caused this report to be signed on its behalf by the undersigned, thereunto duly authorized.
(Registrant) The James Alpha Funds Trust
By (Signature and Title)
* /s/ Darrell Crate
Darrell Crate, President and Chief Executive Officer
Date 05/06/2024
Pursuant to the requirements of the Securities Exchange Act of 1934 and the Investment Company Act of 1940, this report has been signed below by the following persons on behalf of the registrant and in the capacities and on the dates indicated.
By (Signature and Title)
* /s/ Darrell Crate
Darrell Crate, President and Chief Executive Officer
Date 05/06/2024
By (Signature and Title)
* /s/ Michael Montague
Michael Montague, Treasurer and Principal Financial Officer
Date 05/06/2024
* Print the name and title of each signing officer under his or her signature.