united states
securities and exchange commission
washington, d.c. 20549
form n-csr
certified shareholder report of registered management
investment companies
Investment Company Act file number 811-23611
James Alpha Funds Trust
(Exact name of registrant as specified in charter)
515 Madison Avenue, 24th Floor, New York, NY 10022
(Address of principal executive offices) (Zip code)
Emile R. Molineaux
80 Arkay Drive, Suite 110, Hauppauge, NY 11788
(Name and address of agent for service)
Registrant's telephone number, including area code: 888-814-8180
Date of fiscal year end: 8/31
Date of reporting period: 8/31/2023
Item 1. Reports to Stockholders.
| |
| |
| |
| |
| |
 |
| |
| JAMES ALPHA FUNDS TRUST d/b/a EASTERLY FUNDS TRUST |
| |
| |
| |
| |
| |
| CLASS A, C, I AND R6 SHARES |
| |
| |
| |
| |
| |
| |
| |
| |
| |
| |
| ANNUAL REPORT |
| AUGUST 31, 2023 |
| |
| |
| |
| |
| |
| |
| |
| |
| |
| |
| |
| |
| |
| |
| |
| |
| |
| |
| |
| |
| THIS REPORT IS AUTHORIZED FOR DISTRIBUTION ONLY TO SHAREHOLDERS AND TO OTHERS WHO HAVE RECEIVED A COPY OF THE PROSPECTUS. |
| |
| |
| |
| |
| |
James Alpha Funds Trust d/b/a Easterly Funds Trust
ANNUAL REPORT TO SHAREHOLDERS
September 15, 2023
Dear Shareholder:
We are pleased to provide you with this annual report on the investment strategies and performance of the funds in the James Alpha Funds Trust d/b/a Easterly Funds Trust (the “Trust”). This report covers the twelve months from September 1, 2022 through August 31, 2023.
We believe that successful investing requires discipline and patience. Try to stay focused on your long-term investment goals. Don’t let short-term stock and bond market fluctuations or investment manias change your long-term investment strategy. In our opinion, the Easterly Funds are managed by some of the world’s leading institutional investment advisory firms. It is our belief that combining the strength of the Trust’s performance with a well-designed asset allocation plan can help you to achieve your long-term investment goals.
ECONOMIC OVERVIEW
As measured by Real Gross Domestic Product (GDP), the value of the production of goods and services in the United States accelerated to an annualized growth rate (AGR) of 2.1% during the second quarter of 2023. The economy added an average of 271,000 nonfarm payroll jobs per month over the last year. This happened while the unemployment rate held a low 3.8% level in August and the inflation decreased to 3.2% from above 9% a year ago. Small businesses and consumer sentiments started to increase during the summer of 2023 indicating less risk of a potential recession. This market has been largely controlled by the Federal Reserve, who have signaled their commitment to tightening financial conditions in order to get inflation under control. This is a material break from a decades long precedent where the Fed has been there to provide support during market turmoil. Time will tell whether the Fed is able to engineer its desired ’soft landing’ or if their actions will induce an economic recession. So far it has been working while FED maintained its policy to fight against inflation. Following the Fed’s July 2023 meeting, Powell stated “We intend to keep policy restrictive until we’re confident inflation is coming down sustainably to our 2% target, and we’re prepared to further tighten if that’s appropriate.”
Interest Rates: Treasury yields bottomed in August 2020 and have increased ever since, although the rise has been volatile. In the twelve months since the end of August 2022, 10-year treasury rate has risen from 3.2% to 4.1%. With the Fed continuing to hike rates and aggressively reducing its balance sheet, we believe the environment is supportive for the current interest rates range, and yields will remain steady over the next 12 months.
FUND SPECIFIC OVERVIEW
Real Estate (JARIX)
Global real estate stocks posted a loss for the period between September 1, 2022 and August 31, 2023, as multiple exogenous factors weighed on the capital markets during the year (e.g., central bank tightening to rein in inflation, the war in Ukraine, China’s transition from COVID lock-downs to re-opening its economy, and the regional bank mini-crisis) and continued to distract investors, causing them to keep their attention focused mostly away from industry and company fundamentals. The FTSE EPRA Nareit Developed Index (the “Index”) had a total return of -4.20%, while the Easterly Global Real Estate Fund (the “Fund”) generated a total net return of -6.78%, underperforming the Index by 258 basis points.
20231026-3194948
A historical review of listed real estate returns during periods of high inflation serves as a reminder that real estate values tend to increase with inflation, as rising inflation is typically consistent with a growing economy – the most important driver of demand for most property types. Additionally, commercial real estate leases often incorporate annual rent escalators, helping to provide additional protection of real estate cash flows during inflationary periods.
Higher energy prices, particularly in Europe, reduced consumer spending and negatively impacted sectors exposed to discretionary spending. Notably, the Fund was positioned defensively in Europe, with a substantial portion of its European holdings invested in German residential companies, whose fundamentals are not only unimpacted by rising energy prices but are in fact bolstered by increased demand for housing, spurred by the tide of migrants fleeing Ukraine. Other European positions were similarly insulated from the economic fallout of the conflict in Ukraine, with Specialty property type positions (e.g., Cell Towers, Student Housing and Medical Office Buildings) representing the bulk of the Fund’s remaining European exposure.
The regional bank mini-crisis, thus far, has revealed the lagged effect of rate hikes to date—and the resulting duration mismatch that created an inherent instability among the deposit base. Uncertainty among lenders over the regulatory response (what adjustments if any will be made to the current $250k per account FDIC insurance limit) will likely have a chilling effect on their willingness to make new loans and/or re-finance existing ones. The flipside is that the resulting tightening of credit will do some of the Fed’s work for it, thus shifting the narrative around future rate hikes from “higher for longer” to “just high for longer.” Thus, the path forward in terms of potential impact on the business of commercial real estate will be determined largely, if not solely by the Fed and the Treasury acting in concert to contain and thus prevent the isolated challenges at a small number of regional banks from evolving into widespread contagion that could present a systemic challenge.
Finally, as it relates to the highly challenging outlook for office buildings, particularly those located in Central Business Districts, the impact of fundamental changes in how companies manage their office space needs in the new world order of hybrid work models, owners of office buildings will experience significant headwinds over the next five plus years as existing leases expire and tenants downsize their space needs. The ensuing erosion of value will in some ways be similar to the secular decline in regional malls resulting from the “Amazon effect,” i.e., the disruptive impact of e-commerce. Just as the commercial real estate industry writ large managed to thrive in the face of substantial value destruction in the regional mall sector (which at one time had a larger market capitalization than the office sector), it is certainly plausible that the coming difficulties in the office sector can be contained without spreading to other sectors or the funding markets for commercial real estate.
Despite the macroeconomic and geopolitical stress that is capturing headlines, our outlook for the global real estate market continues to be constructive. Real estate fundamentals and earnings growth remain healthy in an environment characterized by low supply in many sectors, paired with high construction costs. Our high conviction, benchmark-agnostic investment approach allows us to maintain a laser-focus on identifying and owning only the 50 highest-quality companies in our investable universe. We have high conviction in our fundamental research and confidence in the management teams of the companies we own. While global capital markets continue to experience periods of market fixation on non-fundamental factors, we believe our portfolio is well positioned as investor attention turns back to fundamentals.
Hedged Equity (JDIEX)
The investment environment early in the period was characterized by concerns that the Federal reserve would over tighten policy in its efforts to rein in inflationary forces. The four 50 basis point hikes from June through November put equities on notice and spiked the VIX up into the 30+ range in the 4th
20231026-3194948
quarter. This hurt September equity returns as the enormity of the increases began to be absorbed. However, the markets began to position for a slowing pace of inflation expecting Chair Powell’s hopes for a disinflationary path to translate into equity exuberance. While the rhetoric helped drive improved hopes over the next several months for a pause or pivot in FED hikes, the reality did not quite match the expectation. Despite solid economic data and earnings that (while softer) did meet expectations, the concerns around FED policy kept volatility somewhat elevated into March of 2023 leading to a very volatile period despite positive equity returns. Through that period from 8/31/22 until the close of the 1st qtr. 2023 JDIEX delivered 5.45% returns vs the S&P’s 4.95%. Much of that improved return came from the ability of the strategy to collect income from the options positioning in the fund. The period that followed was markedly different in that the market’s hopes for a more dovish FED and moderating inflation with still solid growth allowed for a goldilocks scenario to gain credibility. During that subsequent 3/31 - 8/31/23 period the VIX dropped from the 20 level to 13 and the S&P gained 10.45% vs JDIEX providing 5.08% gains. While the fund’s performance still lay in the middle of its targeted 40-60% of the S&P the impact of reduced volatility could clearly be seen. Over the 8/31/22 - 8/31/23 period, JDIEX gained 10.80% vs the SPX 15.92%. JDIEX provided a very solid 68% participation rate, which looks particularly attractive considering our ~40% of the market’s volatility level. Given the drop in volatility, the manager’s use of shorter dated options expiries while seeking to maximize income of the overlay resulted in a better than one would expect participation rate.
The transitional period of underlying fundamentals and still very involved FOMC gave a very bi-modal feel to the period. Between dovish and hawkish datapoints and FED meetings that all were in play, trading ranges for both equities and the VIX were quite wide. As the period progressed, however, greater bullishness took hold making it imperative to actively manage the overlay structure to optimize the best levels from which to defend (the put spreads) without giving up excessive upside (the short calls). While market momentum and technical indicators became positive after the first quarter, it is important to note that both global and domestic economic datapoints showed some risk of recession. With very strong consumer and services sector data, however, those calls for recession have been held at bay. Both the labor and inflation data have to date allowed for the safe landing narrative to hold true. Additional impetus was also felt as the summer progressed in the hopes of an AI led tech sector and overall productivity boom. Despite that powerful AI driven hope, as the period ended, there were rumblings that tech and high PE stocks, which have powered the S&P, may be growing vulnerable to price for perfection realities if inflation, earnings, the macro, and geopolitical levers stop pulling in such synchronized fashion. As such, August was a more difficult month for the index and the fund defended appropriately. While the downdraft was relatively small, we point out that many of those priced for perfection factors remain in place and make a strong case for the defensive approach the fund takes. As we have said before, the market correction process is rarely a one-time event or straight-line process. We continue to see volatility levels as too complacent but can never predict when spikes will come. We remain committed as a result, to a systematic approach executed by the managers that reconciles the levels of volatility, equity price levels, and the skew of bullishness and bearishness in the market mathematically to keep the options positions in a net neutral to positive carry.
The fund has not changed its distribution policy since the last report.
The fund accesses exposure to the S&P 500 by entering into a 13-month swap with Goldman Sachs for up to 130% of the return of the index. The second way the fund uses derivatives is through the put spread collar strategy the fund uses. The fund remains long the market to a 30% level (the excess achieved in the swap) and generally targets between 40-60% S&P exposure which can, in market declines, move towards zero exposure if the market approaches our short put within expiry constraints. The derivatives strategy targets a positive carry result which trades off some upside for meaningful downside protection.
Both the investment process and results were consistent in keeping with the stated policy and objectives.
20231026-3194948
COMPARING THE FUND PERFORMANCE TO BENCHMARKS
When reviewing the performance of the funds against their benchmarks, it is important to note that the Trust is designed to help investors to implement an asset allocation strategy to meet their individual needs as well as select individual investments within each asset category among the myriad of choices available. Each Easterly Fund was formed to represent an asset class, and each portfolio’s institutional money manager was selected based on their ability to manage money within that class.
Therefore, the Easterly Funds may be able to help investors to properly implement their asset allocation decisions and keep their investments within the risk parameters that they establish with their investment consultants. Without the intended asset class consistency of the Easterly Funds, even the most carefully crafted allocation strategy could be negated. Furthermore, we believe the benchmarks do not necessarily provide precise standards against which to measure the portfolios, in that the characteristics of the benchmarks can vary widely at different points in time from the Easterly Funds (e.g., characteristics such as: average market capitalizations, price-to-earnings and price-to-book ratios, bond quality ratings and maturities, etc.) . In addition, the benchmarks can potentially have a survivor bias built into them (i.e., the performance of only funds that are still in existence may remain part of the benchmark’s performance while funds that do not exist anymore may be removed from the benchmark’s performance).
ELECTRONIC DELIVERY AVAILABLE
This report can be delivered to you electronically. Electronic delivery can help simplify your record keeping. With electronic delivery, you’ll receive an email with a link to your James Alpha Funds Trust quarterly statement, daily confirmations and/or semi-annual and annual reports each time one is available. You have the ability to choose which items you want delivered electronically. Choose one item or all items. It’s up to you. Please call our Customer Service Department toll-free at (833) 999-2636 for instructions on how to establish electronic delivery.
Investors should consider the investment objectives, risks, charges and expenses of the Easterly Funds carefully. This and other information about the Easterly Funds is contained in your prospectus, which should be read carefully. To obtain an additional copy of the prospectus, please call 888.814.8180. Past performance is not indicative of future results. Investments in stocks, bonds and mutual funds are not guaranteed and the principal value and investment return can fluctuate. Consequently, investors may receive back less than invested.
The S&P 500 is an unmanaged, capitalization-weighted index. It is not possible to invest directly in the S&P 500.
The security holdings discussed may not be representative of the Funds’ current or future investments. Fund holdings are subject to change and should not be considered to be investment advice. Any statements not of a factual nature constitute opinions which are subject to change without notice. Information contained herein was obtained from recognized statistical services and other sources believed to be reliable and we therefore cannot make any representation as to its completeness or accuracy.
Easterly Funds, LLC serves as the Adviser to the Easterly Fund family of mutual funds and related portfolios. Easterly Funds, LLC is registered as investment advisers with the SEC. Effective 10/2/2023, the Easterly mutual funds are distributed by Easterly Securities, LLC. Although Easterly Funds, LLC is a registered investment adviser, registration itself does not imply and should not be interpreted to imply any particular level of skill or training.
20231026-3194948
Easterly Global Real Estate Fund
PORTFOLIO REVIEW (Unaudited)
August 31, 2023
The Fund’s performance figures* for the year ended August 31, 2023, as compared to its benchmark:
| | | Annualized | Annualized | Annualized | Annualized | Annualized | Annualized |
| | One Year | Five Year | Ten Year | Since Inception (a) | Since Inception (b) | Since Inception (c) | Since Inception (d) |
| Class A | (7.06)% | 1.35% | 5.01% | 6.92% | n/a | n/a | n/a |
| Class A With Load | (12.41)% | 0.16% | 4.39% | 6.47% | n/a | n/a | n/a |
| Class C | (7.80)% | 0.58% | 4.28% | n/a | 5.90% | n/a | n/a |
| Class I | (6.78)% | 1.73% | 5.50% | n/a | n/a | 5.96% | n/a |
| Class R6 | (6.61)% | 1.93% | n/a | n/a | n/a | n/a | 3.28% |
FTSE EPRA/NAREIT
Developed Net Index (e) | (4.20)% | 0.52% | 4.18% | 5.92% | 5.72% | 4.46% | 1.59% |
Comparison of the Change in Value of a $1,000,000 Investment
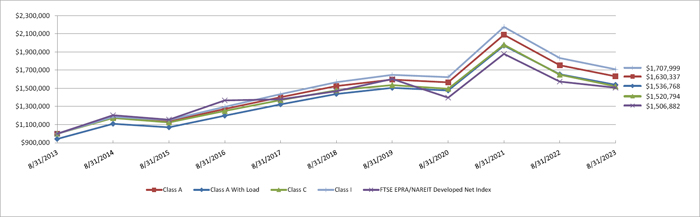
Performance data quoted above is historical. Past performance does not guarantee future results and current performance may be lower or higher than the performance data quoted. The investment return and principal value of an investment will fluctuate, so that shares when redeemed, may be worth more or less than their original cost. For more performance numbers current to the most recent month-end please call (833) 999-2636. The total operating expense ratio as stated in the fee table to the Fund’s prospectus dated December 31, 2022, is 1.36%, 2.11%, 1.11% and 1.11% for the A, C, I and R6 Classes, respectively.
| (a) | Inception date for Class A is October 26, 2009. |
| (b) | Inception date for Class C is January 5, 2012. |
| (c) | Inception date for Class I is August 1, 2011. |
| (d) | Inception date for Class R6 is August 17, 2017. |
| (e) | The FTSE EPRA/NAREIT Developed Net Index is designed to represent general trends in eligible real estate equities worldwide. Relevant real estate activities are defined as the ownership, disposure and development of income-producing real estate. |
| Top 10 Holdings by Country | | % of Net Assets | |
| United States | | | 45.5 | % |
| Germany | | | 10.2 | % |
| Japan | | | 9.4 | % |
| United Kingdom | | | 8.9 | % |
| Spain | | | 6.9 | % |
| Hong Kong | | | 5.5 | % |
| Cayman Islands | | | 3.5 | % |
| Bermuda | | | 2.4 | % |
| Singapore | | | 2.1 | % |
| Canada | | | 1.5 | % |
| Other/Cash & Equivalents | | | 4.1 | % |
| | | | 100.0 | % |
Please refer to the Schedule of Investments for a more detailed breakdown of the Fund’s assets.
Easterly Hedged Equity Fund
PORTFOLIO REVIEW (Unaudited)
August 31, 2023
The Fund’s performance figures* for the year ended August 31, 2023, as compared to its benchmark:
| | | Annualized | Annualized | Annualized |
| | One Year | Five Year | Since Inception (a) | Since Inception (b) |
| Class A | 10.45% | 6.47% | 5.28% | n/a |
| Class A With Load | 8.28% | 5.21% | 4.51% | n/a |
| Class C | 9.70% | 5.61% | 4.47% | n/a |
| Class I | 10.80% | 6.73% | 5.62% | n/a |
| Class R6 | 11.10% | 7.16% | n/a | 7.42% |
| S&P 500 Total Return Index (c) | 15.94% | 11.12% | 11.96% | 12.75% |
Comparison of the Change in Value of a $1,000,000 Investment
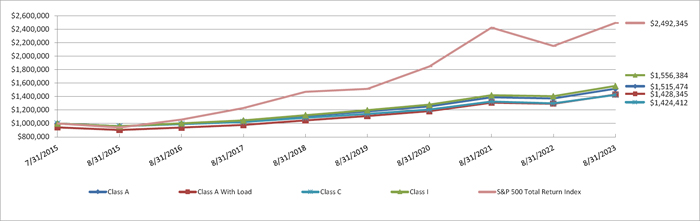
Performance data quoted above is historical. Past performance does not guarantee future results and current performance may be lower or higher than the performance data quoted. The investment return and principal value of an investment will fluctuate, so that shares when redeemed, may be worth more or less than their original cost. For more performance numbers current to the most recent month-end please call (833) 999-2636. The total operating expense ratio as stated in the fee table to the Fund’s prospectus dated December 31, 2022, is 2.10%, 2.85%, 1.85% and 1.85% for the A, C, I and R6 Classes, respectively.
| (a) | Inception date for Class A, C and I is July 31, 2015. |
| (b) | Inception date for Class R6 is August 17, 2017. |
| (c) | The S&P 500 Total Return Index is an unmanaged free-float capitalization-weighted index which measures the performance of 500 large-cap common stocks actively traded in the United States. Index returns assume reinvestment of dividends. Investors may not invest in the Index directly. Unlike the Fund’s returns, the Index does not reflect any fees or expenses. |
| Top 10 Holdings by Security Type | | % of Net Assets | |
| Exchange Traded Funds | | | 91.9 | % |
| Put Options Purchased | | | 0.4 | % |
| Put Options Written | | | (0.1 | )% |
| Call Options Written | | | (1.1 | )% |
| Other/Cash & Equivalents | | | 8.9 | % |
| | | | 100.0 | % |
Please refer to the Schedule of Investments for a more detailed breakdown of the Fund’s assets.
| EASTERLY GLOBAL REAL ESTATE FUND |
| SCHEDULE OF INVESTMENTS |
| August 31, 2023 |
| Shares | | | | | Fair Value | |
| | | | | COMMON STOCKS — 97.8% | | | | |
| | | | | Bermuda - 2.4% | | | | |
| | 3,335,447 | | | Hongkong Land Holdings Ltd. | | $ | 11,840,837 | |
| | | | | | | | | |
| | | | | Canada - 1.5% | | | | |
| | 209,885 | | | Canadian Apartment Properties REIT | | | 7,527,675 | |
| | | | | | | | | |
| | | | | Cayman Islands - 3.5% | | | | |
| | 571,760 | | | CK Asset Holdings Ltd. | | | 3,154,844 | |
| | 4,003,464 | | | ESR Group Ltd. | | | 6,007,316 | |
| | 487,957 | | | GDS Holdings Ltd. - ADR(a) | | | 5,835,966 | |
| | 568,505 | | | Wharf Real Estate Investment Company Ltd. | | | 2,369,293 | |
| | | | | | | | 17,367,419 | |
| | | | | France - 1.2% | | | | |
| | 229,632 | | | Klepierre S.A. | | | 6,068,774 | |
| | | | | | | | | |
| | | | | Germany - 10.2% | | | | |
| | 864,650 | | | Deutsche Wohnen S.E. | | | 19,812,462 | |
| | 1,379,456 | | | Instone Real Estate Group A.G. | | | 8,821,112 | |
| | 950,506 | | | TAG Immobilien A.G.(a) | | | 10,780,985 | |
| | 489,472 | | | Vonovia S.E. | | | 11,750,555 | |
| | | | | | | | 51,165,114 | |
| | | | | Guernsey - 0.7% | | | | |
| | 3,376,570 | | | Sirius Real Estate Ltd. | | | 3,721,533 | |
| | | | | | | | | |
| | | | | Hong Kong - 5.5% | | | | |
| | 5,568,225 | | | Link REIT | | | 27,607,498 | |
| | | | | | | | | |
| | | | | Japan - 9.4% | | | | |
| | 18,274 | | | Japan Hotel REIT Investment Corporation | | | 9,263,251 | |
| | 2,323,497 | | | Mitsubishi Estate Company Ltd. | | | 29,601,316 | |
| | 2,368 | | | Mitsui Fudosan Logistics Park, Inc. | | | 8,059,762 | |
| | | | | | | | 46,924,329 | |
| | | | | Singapore - 2.1% | | | | |
| | 4,763,417 | | | Keppel DC REIT | | | 7,749,598 | |
| | | | | | | | | |
See accompanying notes to financial statements.
| EASTERLY GLOBAL REAL ESTATE FUND |
| SCHEDULE OF INVESTMENTS (Continued) |
| August 31, 2023 |
| Shares | | | | | Fair Value | |
| | | | | COMMON STOCKS — 97.8% (Continued) | | | | |
| | | | | Singapore - 2.1% (Continued) | | | | |
| | 2,609,628 | | | Mapletree Pan Asia Commercial Trust | | $ | 2,933,111 | |
| | | | | | | | 10,682,709 | |
| | | | | Spain - 6.9% | | | | |
| | 895,755 | | | Cellnex Telecom S.A. | | | 34,277,568 | |
| | | | | | | | | |
| | | | | United Kingdom - 8.9% | | | | |
| | 15,982,849 | | | Assura PLC | | | 9,278,155 | |
| | 5,586,591 | | | Empiric Student Property PLC | | | 6,167,259 | |
| | 3,250,002 | | | Grainger PLC | | | 9,710,627 | |
| | 411,379 | | | Great Portland Estates PLC | | | 2,186,475 | |
| | 605,512 | | | Segro PLC | | | 5,644,608 | |
| | 954,848 | | | UNITE Group PLC (The) | | | 11,356,119 | |
| | | | | | | | 44,343,243 | |
| | | | | United States - 45.5% | | | | |
| | 969,085 | | | Acadia Realty Trust | | | 14,429,676 | |
| | 140,404 | | | Alexandria Real Estate Equities, Inc. | | | 16,334,601 | |
| | 24,738 | | | Americold Realty Trust, Inc. | | | 832,434 | |
| | 586,479 | | | Broadstone Net Lease, Inc. | | | 9,483,365 | |
| | 76,014 | | | Camden Property Trust | | | 8,180,627 | |
| | 57,423 | | | CBRE Group, Inc., Class A(a) | | | 4,883,826 | |
| | 463,810 | | | CoreCivic, Inc.(a) | | | 4,990,596 | |
| | 1,022,175 | | | DigitalBridge Group, Inc. | | | 17,806,289 | |
| | 368,532 | | | Easterly Government Properties, Inc. | | | 4,927,273 | |
| | 1,069,204 | | | Ellington Financial, Inc. | | | 14,295,257 | |
| | 197,265 | | | Elme Communities | | | 3,033,936 | |
| | 440,546 | | | Equity Commonwealth | | | 8,383,590 | |
| | 859,032 | | | GEO Group, Inc. (The)(a) | | | 6,219,391 | |
| | 842,606 | | | Independence Realty Trust, Inc. | | | 14,181,059 | |
| | 213,704 | | | Kilroy Realty Corporation | | | 7,896,363 | |
| | 173,910 | | | Prologis, Inc. | | | 21,599,622 | |
| | 25,000 | | | Realty Income Corporation | | | 1,401,000 | |
| | 692,494 | | | Retail Opportunity Investments Corporation | | | 9,320,969 | |
| | 36,005 | | | SBA Communications Corporation | | | 8,084,203 | |
| | 191,039 | | | Sun Communities, Inc. | | | 23,386,995 | |
| | | | | | | | | |
See accompanying notes to financial statements.
| EASTERLY GLOBAL REAL ESTATE FUND |
| SCHEDULE OF INVESTMENTS (Continued) |
| August 31, 2023 |
| Shares | | | | | Fair Value | |
| | | | | COMMON STOCKS — 97.8% (Continued) | | | | |
| | | | | United States - 45.5% (Continued) | | | | |
| | 560,566 | | | UDR, Inc. | | $ | 22,366,583 | |
| | 118,949 | | | Ventas, Inc. | | | 5,195,692 | |
| | | | | | | | 227,233,347 | |
| | | | | | | | | |
| | | | | TOTAL COMMON STOCKS (Cost $871,103,510) | | | 488,760,046 | |
| | | | | | | | | |
| | | | | TOTAL INVESTMENTS – 97.8% (Cost $871,103,510) | | $ | 488,760,046 | |
| | | | | OTHER ASSETS IN EXCESS OF LIABILITIES – 2.2% | | | 11,170,583 | |
| | | | | NET ASSETS - 100.0% | | $ | 499,930,629 | |
ADR - American Depositary Receipt
Ltd. - Limited Company
PLC - Public Limited Company
REIT - Real Estate Investment Trust
A.G. - Aktiengesellschaft
S.A. - Société Anonyme
S.E. - Societas Europeae
| (a) | Non-income producing security. |
See accompanying notes to financial statements.
| EASTERLY GLOBAL REAL ESTATE FUND |
| SCHEDULE OF INVESTMENTS (Continued) |
| August 31, 2023 |
Forward Currency Contracts
| Units to | | | | | | US Dollar | | | | | Settlement | | Unrealized | |
| Receive/Deliver | | | In Exchange For | | | Value | | | Counterparty | | Date | | Appreciation/(Depreciation) | |
| To Sell: | | | | | | | | | | | | | | | | | |
| $ | (353,008,058 | ) JPY | | $ | (2,416,324 | ) USD | | $ | (2,426,822 | ) | | Brown Brothers Harriman | | 9/1/2023 | | $ | (10,498 | ) |
| | (412,744,750 | ) JPY | | | (2,837,240 | ) USD | | | (2,837,494 | ) | | Brown Brothers Harriman | | 9/5/2023 | | | (254 | ) |
| | | | | | | | | | | | | | | | | | | |
| | | | | | | | | | | | | | | Total: | | $ | (10,752 | ) |
Currency Abbreviations:
JPY - Japanes Yen
USD - U.S. Dollar
See accompanying notes to financial statements.
| EASTERLY HEDGED EQUITY FUND |
| SCHEDULE OF INVESTMENTS |
| August 31, 2023 |
| Shares | | | | | | | | | | | | | | | Fair Value | |
| | | | | EXCHANGE-TRADED FUNDS — 91.9% | | | | | | |
| | | | | EQUITY - 91.9% | | | | | | | | | | |
| | 242,500 | | | SPDR S&P 500 ETF Trust(a) | | | | $ | 109,209,875 | |
| | | | | TOTAL EXCHANGE-TRADED FUNDS (Cost $91,812,151) | | | | | | |
| | | | | | | | | | | | | | | | | | | | | |
| Contracts(b) | | | | | Counterparty | | Expiration Date | | Exercise Price | | | Notional Value | | | | | |
| | | | | INDEX OPTIONS PURCHASED - 0.4% | | | | | | | | | | | | |
| | | | | PUT OPTIONS PURCHASED - 0.4% | | | | | | | | | | | | |
| | 50 | | | S&P 500 Index | | PER | | 09/01/2023 | | $ | 4,400 | | | $ | 22,538,300 | | | $ | 1,500 | |
| | 100 | | | S&P 500 Index | | PER | | 09/08/2023 | | | 4,375 | | | | 45,076,600 | | | | 19,750 | |
| | 210 | | | S&P 500 Index | | PER | | 09/15/2023 | | | 4,325 | | | | 94,660,860 | | | | 94,500 | |
| | 150 | | | S&P 500 Index | | PER | | 09/29/2023 | | | 4,350 | | | | 67,614,900 | | | | 243,000 | |
| | 55 | | | S&P 500 Index | | PER | | 09/29/2023 | | | 4,415 | | | | 24,792,130 | | | | 139,425 | |
| | | | | TOTAL PUT OPTIONS PURCHASED (Cost - $2,156,717) | | | | | 498,175 | |
| | | | | | | | | | | | | | | | | | | | | |
| | | | | TOTAL INVESTMENTS – 92.3% (Cost $93,968,868) | | | | | | | $ | 109,708,050 | |
| | | | | PUT OPTIONS WRITTEN - (0.1)% (Proceeds - $561,202) | | | | | (144,250 | ) |
| | | | | CALL OPTIONS WRITTEN - (1.1)% (Proceeds - $691,127) | | | | | (1,341,400 | ) |
| | | | | OTHER ASSETS IN EXCESS OF LIABILITIES – 8.9% | | | | | | 10,614,007 | |
| | | | | NET ASSETS - 100.0% | | | | | | | | $ | 118,836,407 | |
| | | | | | | | | | | | | | | | | | | | | |
| Contracts(b) | | | | | Counterparty | | Expiration Date | | Exercise Price | | | Notional Value | | | | | |
| | | | | WRITTEN INDEX OPTIONS - (0.1)% | | | | | | | | | | | | |
| | | | | PUT OPTIONS WRITTEN - (0.1)% | | | | | | | | | | | | |
| | 50 | | | S&P 500 Index | | PER | | 09/01/2023 | | $ | 4,180 | | | $ | 22,538,300 | | | $ | 750 | |
| | 100 | | | S&P 500 Index | | PER | | 09/08/2023 | | | 4,160 | | | | 45,076,600 | | | | 6,750 | |
| | 210 | | | S&P 500 Index | | PER | | 09/15/2023 | | | 4,100 | | | | 94,660,860 | | | | 30,975 | |
| | 150 | | | S&P 500 Index | | PER | | 09/29/2023 | | | 4,130 | | | | 67,614,900 | | | | 69,750 | |
| | 55 | | | S&P 500 Index | | PER | | 09/29/2023 | | | 4,200 | | | | 24,792,130 | | | | 36,025 | |
| | | | | TOTAL PUT OPTIONS WRITTEN (Proceeds - $561,202) | | | | | | 144,250 | |
| | | | | | | | | | | | | | | | | | | | | |
| | | | | WRITTEN EQUITY OPTIONS - (1.1)% | | | | | | | |
| | | | | CALL OPTIONS WRITTEN- (1.1)% | | | | | | |
| | 500 | | | SPDR S&P 500 ETF Trust | | PER | | 09/01/2023 | | | 441 | | | | 22,517,500 | | | | 491,000 | |
| | 500 | | | SPDR S&P 500 ETF Trust | | PER | | 09/15/2023 | | | 448 | | | | 22,517,500 | | | | 296,000 | |
| | 250 | | | SPDR S&P 500 ETF Trust | | PER | | 09/15/2023 | | | 450 | | | | 11,258,750 | | | | 115,500 | |
| | | | | | | | | | | | | | | | | | | | | |
See accompanying notes to financial statements.
| EASTERLY HEDGED EQUITY FUND |
| SCHEDULE OF INVESTMENTS (Continued) |
| August 31, 2023 |
| Contracts(b) | | | | | Counterparty | | Expiration Date | | Exercise Price | | | Notional Value | | | Fair Value | |
| | | | | WRITTEN EQUITY OPTIONS - (1.1)% (Continued) | | | | | | | | | | | | |
| | | | | CALL OPTIONS WRITTEN - (1.1)% (Continued) | | | | | | | | | | | | |
| | 450 | | | SPDR S&P 500 ETF Trust | | PER | | 09/15/2023 | | $ | 455 | | | $ | 20,265,750 | | | $ | 96,750 | |
| | 450 | | | SPDR S&P 500 ETF Trust | | PER | | 09/22/2023 | | | 450 | | | | 20,265,750 | | | | 245,250 | |
| | 300 | | | SPDR S&P 500 ETF Trust | | PER | | 09/29/2023 | | | 456 | | | | 13,510,500 | | | | 96,900 | |
| | | | | TOTAL CALL OPTIONS WRITTEN (Proceeds - $691,127) | | | | | 1,341,400 | |
ETF - Exchange-Traded Fund
SPDR - Standard & Poor’s Depositary Receipt
PER - Pershing
| (a) | A portion of this security is held as collateral for written options. |
| (b) | Each option contract allows the holder of the option to purchase or sell 100 shares of the underlying security. |
See accompanying notes to financial statements.
| EASTERLY HEDGED EQUITY FUND |
| SCHEDULE OF INVESTMENTS (Continued) |
| August 31, 2023 |
TOTAL RETURN SWAP
| | | | | | | | | | | | | | | | | | | | | | Upfront | | | Unrealized | |
| | | Payment | | | | | | | | | | | | Number Of | | Maturity | | Notional | | | Payments/ | | | Appreciation/ | |
| Description | | Frequency | | Long/Short | | Currency | | Index | | Spread | | Counterparty | | Contracts | | Date | | Amount | | | Receipts | | | (Depreciation) | |
| SPDR S&P 500 ETF Trust | | Monthly | | Long | | USD | | Federal Funds Rate | | 0.55% | | Goldman Sachs | | 15,000 | | 10/2/2023 | | $ | 6,004,950 | | | $ | — | | | $ | 552,901 | |
| SPDR S&P 500 ETF Trust | | Monthly | | Long | | USD | | Federal Funds Rate | | 0.55% | | Goldman Sachs | | 10,000 | | 5/20/2024 | | | 4,125,191 | | | | — | | | | 310,116 | |
| SPDR S&P 500 ETF Trust | | Monthly | | Long | | USD | | Federal Funds Rate | | 0.55% | | Goldman Sachs | | 67,500 | | 8/21/2024 | | | 30,522,150 | | | | — | | | | (311,597 | ) |
| | | | | | | | | | | | | | | | | | | | | | | | | | | | 551,420 | |
See accompanying notes to financial statements.
| STATEMENTS OF ASSETS AND LIABILITIES |
| August 31, 2023 |
| | | Easterly | | | Easterly | |
| | | Global Real Estate | | | Hedged Equity | |
| | | Fund | | | Fund | |
| | | | | | | |
| Assets: | | | | | | | | |
| Total Investments, at cost | | $ | 871,103,510 | | | $ | 93,968,868 | |
| Total Investments, at value | | | 488,760,046 | | | | 109,708,050 | |
| Cash | | | 3,883,413 | | | | 8,606,365 | |
| Foreign Cash (Cost $164,327, $0) | | | 165,576 | | | | — | |
| Deposit at Broker | | | — | | | | 1,635,216 | |
| Unrealized appreciation on swaps | | | — | | | | 863,017 | |
| Interest and dividends receivable | | | 1,928,902 | | | | — | |
| Receivable for securities sold | | | 8,499,809 | | | | 35,724 | |
| Receivable for fund shares sold | | | 115,406 | | | | 131,228 | |
| Prepaid expenses and other assets | | | 39,754 | | | | 32,703 | |
| Total Assets | | | 503,392,906 | | | | 121,012,303 | |
| | | | | | | | | |
| Liabilities: | | | | | | | | |
| Options Written (premiums received $0, $1,252,329) | | | — | | | | 1,485,650 | |
| Payable for securities purchased | | | 1,402,968 | | | | 138,626 | |
| Payable to manager | | | 359,569 | | | | 83,761 | |
| Payable for distribution (12b-1) fees | | | 77,821 | | | | 1,191 | |
| Payable for fund shares redeemed | | | 1,310,828 | | | | 80,323 | |
| Administration fees payable | | | 63,160 | | | | 23,168 | |
| Trustee fees payable | | | 3,589 | | | | 3,919 | |
| Unrealized depreciation on forward currency contracts | | | 10,752 | | | | — | |
| Unrealized depreciation on swaps | | | — | | | | 311,597 | |
| Accrued expenses and other liabilities | | | 233,590 | | | | 47,661 | |
| Total Liabilities | | | 3,462,277 | | | | 2,175,896 | |
| | | | | | | | | |
| Net Assets | | $ | 499,930,629 | | | $ | 118,836,407 | |
| | | | | | | | | |
| Net Assets: | | | | | | | | |
| Paid in capital | | | 898,366,871 | | | | 110,677,268 | |
| Accumulated earnings (loss) | | | (398,436,242 | ) | | | 8,159,139 | |
| Net Assets | | $ | 499,930,629 | | | $ | 118,836,407 | |
| | | | | | | | | |
| Net Asset Value Per Share | | | | | | | | |
| Class A | | | | | | | | |
| Net Assets | | $ | 56,486,609 | | | $ | 3,347,511 | |
| Shares of beneficial interest outstanding [$0 par value, unlimited shares authorized] | | | 4,360,006 | | | | 310,683 | |
| Net asset value, redemption price per share | | $ | 12.96 | | | $ | 10.77 | |
| Offering price per share (maximum sales charge of 5.75% and 5.75%, respectively) | | $ | 13.75 | | | $ | 11.43 | |
| | | | | | | | | |
| Class C | | | | | | | | |
| Net Assets | | $ | 34,242,680 | | | $ | 459,654 | |
| Shares of beneficial interest outstanding [$0 par value, unlimited shares authorized] | | | 2,634,144 | | | | 43,721 | |
| Net asset value, offering price per share (a) | | $ | 13.00 | | | $ | 10.51 | |
| | | | | | | | | |
| Class I | | | | | | | | |
| Net Assets | | $ | 376,980,300 | | | $ | 113,263,732 | |
| Shares of beneficial interest outstanding [$0 par value, unlimited shares authorized] | | | 27,513,907 | | | | 10,333,699 | |
| Net asset value, redemption price and offering price per share | | $ | 13.70 | | | $ | 10.96 | |
| | | | | | | | | |
| Class R6 | | | | | | | | |
| Net Assets | | $ | 32,221,040 | | | $ | 1,765,510 | |
| Shares of beneficial interest outstanding [$0 par value, unlimited shares authorized] | | | 2,313,680 | | | | 156,335 | |
| Net asset value, redemption price and offering price per share | | $ | 13.93 | | | $ | 11.29 | |
| | | | | | | | | |
| (a) | Redemption price per C share varies based on length of time shares are held. |
See accompanying notes to financial statements.
| STATEMENTS OF OPERATIONS |
| For the Year Ended August 31, 2023 |
| | | Easterly | | | Easterly | |
| | | Global Real Estate | | | Hedged Equity | |
| | | Fund | | | Fund | |
| | | | | | | |
| Investment Income: | | | | | | | | |
| Dividend income | | $ | 17,494,489 | | | $ | 1,345,156 | |
| Interest income | | | 81,167 | | | | 140,281 | |
| Less: Foreign withholding taxes | | | (70,511 | ) | | | — | |
| Total Investment Income | | | 17,505,145 | | | | 1,485,437 | |
| | | | | | | | | |
| Operating Expenses: | | | | | | | | |
| Management fees | | | 5,333,095 | | | | 1,180,990 | |
| Distribution (12b-1) fees | | | | | | | | |
| Class A Shares | | | 169,942 | | | | 6,387 | |
| Class C Shares | | | 409,440 | | | | 3,684 | |
| Shareholder servicing fees | | | 776,078 | | | | 87,765 | |
| Administration fees | | | 401,028 | | | | 113,623 | |
| Registration fees | | | 108,117 | | | | 36,459 | |
| Custodian fees | | | 65,793 | | | | 21,072 | |
| Legal fees | | | 63,985 | | | | 67,559 | |
| Printing and postage expense | | | 63,928 | | | | 9,061 | |
| Audit fees | | | 41,501 | | | | 19,512 | |
| Trustees’ fees | | | 17,480 | | | | 15,241 | |
| Compliance officer fees | | | 8,250 | | | | 6,691 | |
| Interest Expense | | | — | | | | 101,745 | |
| Insurance expense | | | 25,313 | | | | 3,427 | |
| Miscellaneous expenses | | | 15,457 | | | | 6,387 | |
| Total Operating Expenses | | | 7,499,407 | | | | 1,679,603 | |
| Less: Expenses waived and/or reimbursed | | | (664,778 | ) | | | (355,145 | ) |
| Net Operating Expenses | | | 6,834,629 | | | | 1,324,458 | |
| | | | | | | | | |
| Net Investment Income | | | 10,670,516 | | | | 160,979 | |
| | | | | | | | | |
| Realized and Unrealized Gain (Loss) on Investments: | | | | | | | | |
| Net realized gain (loss) from: | | | | | | | | |
| Investments and Foreign currency transactions | | | (20,483,354 | ) | | | 993,984 | |
| Options purchased | | | — | | | | (11,040,817 | ) |
| Options written | | | 1,054,208 | | | | 9,816,199 | |
| Swaps | | | — | | | | (259,679 | ) |
| Net realized loss from: | | | (19,429,146 | ) | | | (490,313 | ) |
| | | | | | | | | |
| Net change in unrealized appreciation (depreciation) on: | | | | | | | | |
| Investments and Foreign currency transactions | | | (47,189,949 | ) | | | 12,868,633 | |
| Options purchased | | | — | | | | (7,460,213 | ) |
| Options written | | | — | | | | 1,548,457 | |
| Swaps | | | — | | | | 3,807,593 | |
| | | | | | | | | |
| Net change in unrealized appreciation (depreciation) | | | (47,189,949 | ) | | | 10,764,470 | |
| | | | | | | | | |
| Net Realized and Unrealized Gain (Loss) on investments | | | (66,619,095 | ) | | | 10,274,157 | |
| | | | | | | | | |
| Net Increase (Decrease) in Net Assets Resulting From Operations | | $ | (55,948,579 | ) | | $ | 10,435,136 | |
See accompanying notes to financial statements.
| STATEMENTS OF CHANGES IN NET ASSETS |
| | | Easterly | | | Easterly | |
| | | Global Real Estate Fund | | | Hedged Equity Fund | |
| | | | | | | | | | | | | |
| | | Year Ended | | | Year Ended | | | Year Ended | | | Year Ended | |
| | | August 31, 2023 | | | August 31, 2022 | | | August 31, 2023 | | | August 31, 2022 | |
| | | | | | | | | | | | | | | | | |
| Operations: | | | | | | | | | | | | | | | | |
| Net investment income (loss) | | $ | 10,670,516 | | | $ | 8,831,585 | | | $ | 160,979 | | | $ | (30,416 | ) |
| Net realized gain (loss) on investments, options, swaps and foreign currency transactions | | | (19,429,146 | ) | | | 53,090,350 | | | | (490,313 | ) | | | 5,594,111 | |
| Net change in unrealized appreciation (depreciation) on investments, options, swaps and foreign currency transactions | | | (47,189,949 | ) | | | (210,858,339 | ) | | | 10,764,470 | | | | (5,775,863 | ) |
| Net increase (decrease) in net assets resulting from operations | | | (55,948,579 | ) | | | (148,936,404 | ) | | | 10,435,136 | | | | (212,168 | ) |
| | | | | | | | | | | | | | | | | |
| Distributions to Shareholders: | | | | | | | | | | | | | | | | |
| Total Distributions Paid: | | | | | | | | | | | | | | | | |
| Class A | | | (2,994,528 | ) | | | (10,389,606 | ) | | | (52,730 | ) | | | (159,839 | ) |
| Class C | | | (1,532,971 | ) | | | (5,756,611 | ) | | | (9,205 | ) | | | (46,485 | ) |
| Class I | | | (18,980,290 | ) | | | (58,618,796 | ) | | | (1,701,742 | ) | | | (3,349,453 | ) |
| Class R6 | | | (1,722,951 | ) | | | (2,967,024 | ) | | | (233,071 | ) | | | (1,728,423 | ) |
| Total Dividends and Distributions to Shareholders | | | (25,230,740 | ) | | | (77,732,037 | ) | | | (1,996,748 | ) | | | (5,284,200 | ) |
| | | | | | | | | | | | | | | | | |
| Share Transactions of Beneficial Interest: | | | | | | | | | | | | | | | | |
| Beneficial Interest: | | | | | | | | | | | | | | | | |
| Net proceeds from shares sold | | | | | | | | | | | | | | | | |
| Class A | | | 4,782,117 | | | | 16,302,732 | | | | 2,116,408 | | | | 229,649 | |
| Class C | | | 1,088,594 | | | | 4,775,820 | | | | 158,993 | | | | 58,000 | |
| Class I | | | 79,179,790 | | | | 230,263,714 | | | | 70,237,091 | | | | 39,952,049 | |
| Class R6 | | | 11,825,628 | | | | 40,438,846 | | | | 245,626 | | | | 2,178,179 | |
| Reinvestment of dividends and distributions | | | | | | | | | | | | | | | | |
| Class A | | | 2,715,520 | | | | 9,136,407 | | | | 50,354 | | | | 148,171 | |
| Class C | | | 1,412,599 | | | | 4,933,360 | | | | 9,204 | | | | 41,686 | |
| Class I | | | 13,897,461 | | | | 40,226,193 | | | | 1,596,104 | | | | 1,869,684 | |
| Class R6 | | | 1,171,675 | | | | 2,542,936 | | | | 181,506 | | | | 1,035,979 | |
| Cost of shares redeemed | | | | | | | | | | | | | | | | |
| Class A | | | (37,528,473 | ) | | | (17,161,581 | ) | | | (583,456 | ) | | | (560,903 | ) |
| Class C | | | (15,121,168 | ) | | | (16,200,811 | ) | | | (99,271 | ) | | | (424,084 | ) |
| Class I | | | (228,192,330 | ) | | | (208,222,388 | ) | | | (28,314,246 | ) | | | (9,900,348 | ) |
| Class R6 | | | (25,860,842 | ) | | | (13,394,297 | ) | | | (10,375,514 | ) | | | (8,048,979 | ) |
| | | | | | | | | | | | | | | | | |
| Net increase (decrease) in net assets from share transactions of beneficial interest | | | (190,629,429 | ) | | | 93,640,931 | | | | 35,222,799 | | | | 26,579,083 | |
| | | | | | | | | | | | | | | | | |
| Total Increase (Decrease) in Net Assets | | | (271,808,748 | ) | | | (133,027,510 | ) | | | 43,661,187 | | | | 21,082,715 | |
| | | | | | | | | | | | | | | | | |
| Net Assets: | | | | | | | | | | | | | | | | |
| Beginning of year | | | 771,739,377 | | | | 904,766,887 | | | | 75,175,220 | | | | 54,092,505 | |
| End of year | | $ | 499,930,629 | | | $ | 771,739,377 | | | $ | 118,836,407 | | | $ | 75,175,220 | |
| | | | | | | | | | | | | | | | | |
| Share Activity | | | | | | | | | | | | | | | | |
| Shares sold | | | | | | | | | | | | | | | | |
| Class A | | | 365,902 | | | | 937,001 | | | | 208,051 | | | | 21,445 | |
| Class C | | | 81,935 | | | | 273,452 | | | | 15,453 | | | | 5,409 | |
| Class I | | | 5,679,009 | | | | 12,693,288 | | | | 6,768,998 | | | | 3,941,739 | |
| Class R6 | | | 840,457 | | | | 2,232,739 | | | | 23,538 | | | | 201,456 | |
| Shares Reinvested | | | | | | | | | | | | | | | | |
| Class A | | | 214,237 | | | | 516,499 | | | | 5,045 | | | | 14,344 | |
| Class C | | | 110,770 | | | | 276,044 | | | | 940 | | | | 4,083 | |
| Class I | | | 1,038,822 | | | | 2,167,738 | | | | 157,562 | | | | 178,746 | |
| Class R6 | | | 86,167 | | | | 134,943 | | | | 17,419 | | | | 96,640 | |
| Shares Redeemed | | | | | | | | | | | | | | | | |
| Class A | | | (2,924,600 | ) | | | (1,010,377 | ) | | | (56,444 | ) | | | (51,643 | ) |
| Class C | | | (1,137,526 | ) | | | (942,378 | ) | | | (9,940 | ) | | | (40,623 | ) |
| Class I | | | (16,475,176 | ) | | | (11,788,231 | ) | | | (2,711,746 | ) | | | (956,371 | ) |
| Class R6 | | | (1,830,175 | ) | | | (745,543 | ) | | | (969,938 | ) | | | (765,085 | ) |
| Net increase (decrease) in shares of beneficial interest | | | (13,950,178 | ) | | | 4,745,175 | | | | 3,448,938 | | | | 2,650,140 | |
See accompanying notes to financial statements.
| FINANCIAL HIGHLIGHTS (For a share outstanding throughout each year) |
| Easterly Global Real Estate Fund |
| | | CLASS A | |
| | | | | | | | | | | | | | | | |
| | | Year Ended | | | Year Ended | | | Year Ended | | | Year Ended | | | Year Ended | |
| | | August 31, | | | August 31, | | | August 31, | | | August 31, | | | August 31, | |
| | | 2023 | | | 2022 | | | 2021 | | | 2020 | | | 2019 | |
| Net Asset Value, Beginning of Year | | $ | 14.56 | | | $ | 18.94 | | | $ | 15.56 | | | $ | 17.81 | | | $ | 18.73 | |
| Income (Loss) from Investment Operations: | | | | | | | | | | | | | | | | | | | | |
| Net investment income (1) | | | 0.20 | | | | 0.14 | | | | 0.11 | | | | 0.19 | | | | 0.09 | |
| Net realized and unrealized gain (loss) | | | (1.25 | ) | | | (2.93 | ) | | | 4.85 | | | | (0.51 | ) | | | 0.65 | |
| Total from investment operations | �� | | (1.05 | ) | | | (2.79 | ) | | | 4.96 | | | | (0.32 | ) | | | 0.74 | |
| Dividends and Distributions: | | | | | | | | | | | | | | | | | | | | |
| Dividends from net investment income | | | (0.19 | ) | | | (0.41 | ) | | | (0.28 | ) | | | (0.28 | ) | | | (0.64 | ) |
| Distributions from realized gains | | | (0.36 | ) | | | (1.18 | ) | | | (1.30 | ) | | | (1.65 | ) | | | (1.02 | ) |
| Total dividends and distributions | | | (0.55 | ) | | | (1.59 | ) | | | (1.58 | ) | | | (1.93 | ) | | | (1.66 | ) |
| Net Asset Value, End of Year | | $ | 12.96 | | | $ | 14.56 | | | $ | 18.94 | | | $ | 15.56 | | | $ | 17.81 | |
| Total Return* | | | (7.06 | )% | | | (16.03 | )% | | | 33.47 | % | | | (1.93 | )% | | | 4.67 | % |
| Ratios and Supplemental Data: | | | | | | | | | | | | | | | | | | | | |
| Net assets, end of year (000s) | | $ | 56,487 | | | $ | 97,639 | | | $ | 118,587 | | | $ | 88,222 | | | $ | 104,815 | |
| Ratio of gross operating expenses to average net assets | | | 1.42 | % | | | 1.36 | % | | | 1.51 | % | | | 1.60 | % | | | 1.60 | % |
| Ratio of net operating expenses to average net assets | | | 1.42 | % | | | 1.36 | % | | | 1.51 | % | | | 1.60 | % | | | 1.60 | % |
| Ratio of net investment income after expense reimbursement/recoupment to average net assets | | | 1.53 | % | | | 0.80 | % | | | 0.64 | % | | | 1.16 | % | | | 0.52 | % |
| Portfolio Turnover Rate | | | 12 | % | | | 116 | % | | | 160 | % | | | 187 | % | | | 172 | % |
| | | | | | | | | | | | | | | | | | | | | |
| | | CLASS C | |
| | | | | | | | | | | | | | | | |
| | | Year Ended | | | Year Ended | | | Year Ended | | | Year Ended | | | Year Ended | |
| | | August 31, | | | August 31, | | | August 31, | | | August 31, | | | August 31, | |
| | | 2023 | | | 2022 | | | 2021 | | | 2020 | | | 2019 | |
| Net Asset Value, Beginning of Year | | $ | 14.63 | | | $ | 19.06 | | | $ | 15.68 | | | $ | 17.95 | | | $ | 18.89 | |
| Income (Loss) from Investment Operations: | | | | | | | | | | | | | | | | | | | | |
| Net investment income (loss) (1) | | | 0.10 | | | | 0.01 | | | | (0.02 | ) | | | 0.07 | | | | (0.04 | ) |
| Net realized and unrealized gain (loss) | | | (1.26 | ) | | | (2.94 | ) | | | 4.89 | | | | (0.51 | ) | | | 0.65 | |
| Total from investment operations | | | (1.16 | ) | | | (2.93 | ) | | | 4.87 | | | | (0.44 | ) | | | 0.61 | |
| Dividends and Distributions: | | | | | | | | | | | | | | | | | | | | |
| Dividends from net investment income | | | (0.11 | ) | | | (0.32 | ) | | | (0.19 | ) | | | (0.18 | ) | | | (0.53 | ) |
| Distributions from realized gains | | | (0.36 | ) | | | (1.18 | ) | | | (1.30 | ) | | | (1.65 | ) | | | (1.02 | ) |
| Total dividends and distributions | | | (0.47 | ) | | | (1.50 | ) | | | (1.49 | ) | | | (1.83 | ) | | | (1.55 | ) |
| Net Asset Value, End of Year | | $ | 13.00 | | | $ | 14.63 | | | $ | 19.06 | | | $ | 15.68 | | | $ | 17.95 | |
| Total Return* | | | (7.80 | )% | | | (16.64 | )% | | | 32.51 | % | | | (2.62 | )% | | | 3.87 | % |
| Ratios and Supplemental Data: | | | | | | | | | | | | | | | | | | | | |
| Net assets, end of year (000s) | | $ | 34,243 | | | $ | 52,362 | | | $ | 75,701 | | | $ | 65,907 | | | $ | 80,048 | |
| Ratio of gross operating expenses to average net assets | | | 2.17 | % | | | 2.11 | % | | | 2.26 | % | | | 2.35 | % | | | 2.37 | % |
| Ratio of net operating expenses to average net assets | | | 2.17 | % | | | 2.11 | % | | | 2.26 | % | | | 2.35 | % | | | 2.37 | % |
| Ratio of net investment income (loss) after expense reimbursement/recoupment to average net assets | | | 0.79 | % | | | 0.05 | % | | | (0.11 | )% | | | 0.42 | % | | | (0.25 | )% |
| Portfolio Turnover Rate | | | 12 | % | | | 116 | % | | | 160 | % | | | 187 | % | | | 172 | % |
| | | | | | | | | | | | | | | | | | | | | |
| (1) | Per share amounts calculated using the average shares method, which more appropriately presents the per share data for the period. |
| * | Assumes reinvestment of all dividends and distributions and does not assume the effects of any sales charges. Aggregate (not annualized) total return is shown for any period shorter than one year. Total return does not reflect the deduction of taxes that a shareholder would pay on distributions or on the redemption of shares. |
See accompanying notes to financial statements.
| FINANCIAL HIGHLIGHTS (For a share outstanding throughout each year) |
| Easterly Global Real Estate Fund |
| | | CLASS I | |
| | | | | | | | | | | | | | | | |
| | | Year Ended | | | Year Ended | | | Year Ended | | | Year Ended | | | Year Ended | |
| | | August 31, | | | August 31, | | | August 31, | | | August 31, | | | August 31, | |
| | | 2023 | | | 2022 | | | 2021 | | | 2020 | | | 2019 | |
| Net Asset Value, Beginning of Year | | $ | 15.34 | | | $ | 19.84 | | | $ | 16.19 | | | $ | 18.42 | | | $ | 19.29 | |
| Income (Loss) from Investment Operations: | | | | | | | | | | | | | | | | | | | | |
| Net investment income (1) | | | 0.27 | | | | 0.20 | | | | 0.18 | | | | 0.28 | | | | 0.17 | |
| Net realized and unrealized gain (loss) | | | (1.34 | ) | | | (3.07 | ) | | | 5.08 | | | | (0.54 | ) | | | 0.66 | |
| Total from investment operations | | | (1.07 | ) | | | (2.87 | ) | | | 5.26 | | | | (0.26 | ) | | | 0.83 | |
| Dividends and Distributions: | | | | | | | | | | | | | | | | | | | | |
| Dividends from net investment income | | | (0.21 | ) | | | (0.45 | ) | | | (0.31 | ) | | | (0.32 | ) | | | (0.68 | ) |
| Distributions from realized gains | | | (0.36 | ) | | | (1.18 | ) | | | (1.30 | ) | | | (1.65 | ) | | | (1.02 | ) |
| Total dividends and distributions | | | (0.57 | ) | | | (1.63 | ) | | | (1.61 | ) | | | (1.97 | ) | | | (1.70 | ) |
| Net Asset Value, End of Year | | $ | 13.70 | | | $ | 15.34 | | | $ | 19.84 | | | $ | 16.19 | | | $ | 18.42 | |
| Total Return* | | | (6.78 | )% | | | (15.74 | )% | | | 34.06 | % | | | (1.51 | )% | | | 5.06 | % |
| Ratios and Supplemental Data: | | | | | | | | | | | | | | | | | | | | |
| Net assets, end of year (000s) | | $ | 376,980 | | | $ | 571,664 | | | $ | 678,440 | | | $ | 544,432 | | | $ | 643,866 | |
| Ratio of gross operating expenses to average net assets | | | 1.17 | % | | | 1.11 | % | | | 1.26 | % | | | 1.35 | % | | | 1.33 | % |
| Ratio of net operating expenses to average net assets | | | 1.04 | % | | | 1.04 | % | | | 1.12 | % | | | 1.19 | % | | | 1.19 | % |
| Ratio of net investment income after expense reimbursement/recoupment to average net assets | | | 1.92 | % | | | 1.12 | % | | | 1.02 | % | | | 1.68 | % | | | 0.93 | % |
| Portfolio Turnover Rate | | | 12 | % | | | 116 | % | | | 160 | % | | | 187 | % | | | 172 | % |
| | | | | | | | | | | | | | | | |
| | | CLASS R6 | |
| | | | | | | | | | | | | | | | |
| | | Year Ended | | | Year Ended | | | Year Ended | | | Year Ended | | | Year Ended | |
| | | August 31, | | | August 31, | | | August 31, | | | August 31, | | | August 31, | |
| | | 2023 | | | 2022 | | | 2021 | | | 2020 | | | 2019 | |
| Net Asset Value, Beginning of Year | | $ | 15.56 | | | $ | 20.09 | | | $ | 16.35 | | | $ | 18.55 | | | $ | 19.35 | |
| Income (Loss) from Investment Operations: | | | | | | | | | | | | | | | | | | | | |
| Net investment income (1) | | | 0.29 | | | | 0.23 | | | | 0.22 | | | | 0.31 | | | | 0.22 | |
| Net realized and unrealized gain (loss) | | | (1.35 | ) | | | (3.13 | ) | | | 5.13 | | | | (0.54 | ) | | | 0.69 | |
| Total from investment operations | | | (1.06 | ) | | | (2.90 | ) | | | 5.35 | | | | (0.23 | ) | | | 0.91 | |
| Dividends and Distributions: | | | | | | | | | | | | | | | | | | | | |
| Dividends from net investment income | | | (0.21 | ) | | | (0.45 | ) | | | (0.31 | ) | | | (0.32 | ) | | | (0.69 | ) |
| Distributions from realized gains | | | (0.36 | ) | | | (1.18 | ) | | | (1.30 | ) | | | (1.65 | ) | | | (1.02 | ) |
| Total dividends and distributions | | | (0.57 | ) | | | (1.63 | ) | | | (1.61 | ) | | | (1.97 | ) | | | (1.71 | ) |
| Net Asset Value, End of Year | | $ | 13.93 | | | $ | 15.56 | | | $ | 20.09 | | | $ | 16.35 | | | $ | 18.55 | |
| Total Return* | | | (6.61 | )% | | | (15.69 | )% | | | 34.29 | % | | | (1.32 | )% | | | 5.44 | % |
| Ratios and Supplemental Data: | | | | | | | | | | | | | | | | | | | | |
| Net assets, end of year (000s) | | $ | 32,221 | | | $ | 50,074 | | | $ | 32,039 | | | $ | 31,355 | | | $ | 12,238 | |
| Ratio of gross operating expenses to average net assets | | | 1.17 | % | | | 1.11 | % | | | 1.26 | % | | | 1.36 | % | | | 1.33 | % |
| Ratio of net operating expenses to average net assets | | | 0.94 | % | | | 0.94 | % | | | 0.97 | % | | | 1.00 | % | | | 0.88 | % |
| Ratio of net investment income after expense reimbursement/recoupment to average net assets | | | 2.02 | % | | | 1.30 | % | | | 1.18 | % | | | 1.86 | % | | | 1.20 | % |
| Portfolio Turnover Rate | | | 12 | % | | | 116 | % | | | 160 | % | | | 187 | % | | | 172 | % |
| | | | | | | | | | | | | | | | | | | | | |
| (1) | Per share amounts calculated using the average shares method, which more appropriately presents the per share data for the period. |
| * | Assumes reinvestment of all dividends and distributions and does not assume the effects of any sales charges. Aggregate (not annualized) total return is shown for any period shorter than one year. Total return does not reflect the deduction of taxes that a shareholder would pay on distributions or on the redemption of shares. |
See accompanying notes to financial statements.
| FINANCIAL HIGHLIGHTS (For a share outstanding throughout each year) |
| Easterly Hedged Equity Fund |
| | | CLASS A | |
| | | | | | | | | | | | | | | | |
| | | Year Ended | | | Year Ended | | | Year Ended | | | Year Ended | | | Year Ended | |
| | | August 31, | | | August 31, | | | August 31, | | | August 31, | | | August 31, | |
| | | 2023 | | | 2022 | | | 2021 | | | 2020 | | | 2019 | |
| Net Asset Value, Beginning of Year | | $ | 9.99 | | | $ | 11.18 | | | $ | 10.83 | | | $ | 10.42 | | | $ | 10.80 | |
| Income (Loss) from Investment Operations: | | | | | | | | | | | | | | | | | | | | |
| Net investment loss (1) | | | (0.01 | ) | | | (0.03 | ) | | | (0.08 | ) | | | (0.05 | ) | | | (0.13 | ) |
| Net realized and unrealized gain (loss) | | | 1.03 | | | | (0.06 | ) | | | 1.17 | | | | 0.72 | | | | 0.75 | |
| Total from investment operations | | | 1.02 | | | | (0.09 | ) | | | 1.09 | | | | 0.67 | | | | 0.62 | |
| Dividends and Distributions: | | | | | | | | | | | | | | | | | | | | |
| Dividends from net investment income | | | — | | | | (1.10 | ) | | | (0.74 | ) | | | — | | | | (0.31 | ) |
| Distributions from realized gains | | | (0.24 | ) | | | — | | | | — | | | | (0.26 | ) | | | (0.69 | ) |
| Total dividends and distributions | | | (0.24 | ) | | | (1.10 | ) | | | (0.74 | ) | | | (0.26 | ) | | | (1.00 | ) |
| Net Asset Value, End of Year | | $ | 10.77 | | | $ | 9.99 | | | $ | 11.18 | | | $ | 10.83 | | | $ | 10.42 | |
| Total Return* | | | 10.45 | % | | | (1.17 | )% | | | 10.67 | % | | | 6.56 | % | | | 6.26 | % |
| Ratios and Supplemental Data: | | | | | | | | | | | | | | | | | | | | |
| Net assets, end of year (000s) | | $ | 3,348 | | | $ | 1,538 | | | $ | 1,899 | | | $ | 1,537 | | | $ | 519 | |
| Ratio of gross operating expenses (including dividend and interest expense) to average net assets (2) | | | 1.95 | % | | | 2.02 | % | | | 2.04 | % | | | 2.07 | % | | | 2.22 | % |
| Ratio of net operating expenses (including dividend and interest expense) to average net assets (3) | | | 1.61 | % | | | 1.54 | % | | | 2.04 | % | | | 2.01 | % | | | 2.20 | % |
| Ratio of net investment loss (including dividend and interest expense) after expense reimbursement/recoupment to average net assets | | | (0.14 | )% | | | (0.33 | )% | | | (0.73 | )% | | | (0.44 | )% | | | (1.28 | )% |
| Portfolio Turnover Rate | | | 12 | % | | | 23 | % | | | 44 | % | | | 173 | % | | | 245 | % |
| | | | | | | | | | | | | | | | |
| | | CLASS C | |
| | | | | | | | | | | | | | | | |
| | | Year Ended | | | Year Ended | | | Year Ended | | | Year Ended | | | Year Ended | |
| | | August 31, | | | August 31, | | | August 31, | | | August 31, | | | August 31, | |
| | | 2023 | | | 2022 | | | 2021 | | | 2020 | | | 2019 | |
| Net Asset Value, Beginning of Year | | $ | 9.82 | | | $ | 10.90 | | | $ | 10.57 | | | $ | 10.28 | | | $ | 10.66 | |
| Income (Loss) from Investment Operations: | | | | | | | | | | | | | | | | | | | | |
| Net investment loss (1) | | | (0.08 | ) | | | (0.10 | ) | | | (0.14 | ) | | | (0.14 | ) | | | (0.18 | ) |
| Net realized and unrealized gain (loss) | | | 1.01 | | | | (0.08 | ) | | | 1.12 | | | | 0.69 | | | | 0.72 | |
| Total from investment operations | | | 0.93 | | | | (0.18 | ) | | | 0.98 | | | | 0.55 | | | | 0.54 | |
| Dividends and Distributions: | | | | | | | | | | | | | | | | | | | | |
| Dividends from net investment income | | | — | | | | (0.90 | ) | | | (0.65 | ) | | | — | | | | (0.23 | ) |
| Distributions from realized gains | | | (0.24 | ) | | | — | | | | — | | | | (0.26 | ) | | | (0.69 | ) |
| Total dividends and distributions | | | (0.24 | ) | | | (0.90 | ) | | | (0.65 | ) | | | (0.26 | ) | | | (0.92 | ) |
| Net Asset Value, End of Year | | $ | 10.51 | | | $ | 9.82 | | | $ | 10.90 | | | $ | 10.57 | | | $ | 10.28 | |
| Total Return* | | | 9.70 | % | | | (1.95 | )% | | | 9.77 | % | | | 5.47 | % + | | | 5.51 | % + |
| Ratios and Supplemental Data: | | | | | | | | | | | | | | | | | | | | |
| Net assets, end of year (000s) | | $ | 460 | | | $ | 366 | | | $ | 746 | | | $ | 1,781 | | | $ | 524 | |
| Ratio of gross operating expenses (including dividend and interest expense) to average net assets (4) | | | 2.70 | % | | | 2.77 | % | | | 2.68 | % | | | 2.81 | % | | | 2.96 | % |
| Ratio of net operating expenses (including dividend and interest expense) to average net assets (5) | | | 2.36 | % | | | 2.29 | % | | | 2.68 | % | | | 2.94 | % | | | 2.96 | % |
| Ratio of net investment loss (including dividend and interest expense) after expense reimbursement/recoupment to average net assets | | | (0.81 | )% | | | (1.02 | )% | | | (1.31 | )% | | | (1.36 | )% | | | (1.74 | )% |
| Portfolio Turnover Rate | | | 12 | % | | | 23 | % | | | 44 | % | | | 173 | % | | | 245 | % |
| | | | | | | | | | | | | | | | | | | | | |
| (1) | Per share amounts calculated using the average shares method, which more appropriately presents the per share data for the period. |
| (2) | Ratio of gross expenses to average net assets (excluding dividend and interest expenses) for the Easterly Hedged Equity Fund - Class A: |
| | | | 1.84 | % | | | 1.99 | % | | | 1.99 | % | | | 2.05 | % | | | 2.19 | % |
| (3) | Ratio of net operating expenses to average net assets (excluding dividend and interest expenses) for the Easterly Hedged Equity Fund - Class A: |
| | | | 1.50 | % | | | 1.51 | % | | | 1.99 | % | | | 1.99 | % | | | 2.17 | % |
| (4) | Ratio of gross expenses to average net assets (excluding dividend and interest expenses) for the Easterly Hedged Equity Fund - Class C: |
| | | | 2.59 | % | | | 2.74 | % | | | 2.63 | % | | | 2.79 | % | | | 2.93 | % |
| (5) | Ratio of net operating expenses to average net assets (excluding dividend and interest expenses) for the Easterly Hedged Equity Fund - Class C: |
| | | | 2.25 | % | | | 2.26 | % | | | 2.63 | % | | | 2.92 | % | | | 2.93 | % |
| + | Includes adjustments in accordance with accounting principles generally accepted in the United States and, consequently, the net asset value for financial reporting purposes and the returns based upon those net asset values may differ from the net asset values and returns for shareholder transactions. |
| * | Assumes reinvestment of all dividends and distributions and does not assume the effects of any sales charges. Aggregate (not annualized) total return is shown for any period shorter than one year. Total return does not reflect the deduction of taxes that a shareholder would pay on distributions or on the redemption of shares. |
See accompanying notes to financial statements.
| FINANCIAL HIGHLIGHTS (For a share outstanding throughout each year) |
| Easterly Hedged Equity Fund |
| | | CLASS I | |
| | | | | | | | | | | | | | | | |
| | | Year Ended | | | Year Ended | | | Year Ended | | | Year Ended | | | Year Ended | |
| | | August 31, | | | August 31, | | | August 31, | | | August 31, | | | August 31, | |
| | | 2023 | | | 2022 | | | 2021 | | | 2020 | | | 2019 | |
| Net Asset Value, Beginning of Year | | $ | 10.13 | | | $ | 11.33 | | | $ | 10.96 | | | $ | 10.53 | | | $ | 10.90 | |
| Income (Loss) from Investment Operations: | | | | | | | | | | | | | | | | | | | | |
| Net investment income (loss) (1) | | | 0.01 | | | | (0.01 | ) | | | (0.06 | ) | | | (0.03 | ) | | | (0.10 | ) |
| Net realized and unrealized gain (loss) | | | 1.06 | | | | (0.07 | ) | | | 1.19 | | | | 0.72 | | | | 0.76 | |
| Total from investment operations | | | 1.07 | | | | (0.08 | ) | | | 1.13 | | | | 0.69 | | | | 0.66 | |
| Dividends and Distributions: | | | | | | | | | | | | | | | | | | | | |
| Dividends from net investment income | | | — | | | | (1.12 | ) | | | (0.76 | ) | | | — | | | | (0.34 | ) |
| Distributions from realized gains | | | (0.24 | ) | | | — | | | | — | | | | (0.26 | ) | | | (0.69 | ) |
| Total dividends and distributions | | | (0.24 | ) | | | (1.12 | ) | | | (0.76 | ) | | | (0.26 | ) | | | (1.03 | ) |
| Net Asset Value, End of Year | | $ | 10.96 | | | $ | 10.13 | | | $ | 11.33 | | | $ | 10.96 | | | $ | 10.53 | |
| Total Return* | | | 10.80 | % | | | (0.98 | )% | | | 10.91 | % | | | 6.69 | % | | | 6.68 | % |
| Ratios and Supplemental Data: | | | | | | | | | | | | | | | | | | | | |
| Net assets, end of year (000s) | | $ | 113,264 | | | $ | 61,982 | | | $ | 33,478 | | | $ | 41,145 | | | $ | 19,673 | |
| Ratio of gross operating expenses (including dividend and interest expense) to average net assets (2) | | | 1.70 | % | | | 1.77 | % | | | 1.84 | % | | | 1.82 | % | | | 1.99 | % |
| Ratio of net operating expenses (including dividend and interest expense) to average net assets (3) | | | 1.36 | % | | | 1.29 | % | | | 1.84 | % | | | 1.81 | % | | | 1.86 | % |
| Ratio of net investment income (loss) (including dividend and interest expense) after expense reimbursement/recoupment to average net assets | | | 0.14 | % | | | (0.13 | )% | | | (0.51 | )% | | | (0.29 | )% | | | (0.93 | )% |
| Portfolio Turnover Rate | | | 12 | % | | | 23 | % | | | 44 | % | | | 173 | % | | | 245 | % |
| | | | | | | | | | | | | | | | |
| | | CLASS R6 | |
| | | | | | | | | | | | | | | | |
| | | Year Ended | | | Year Ended | | | Year Ended | | | Year Ended | | | Year Ended | |
| | | August 31, | | | August 31, | | | August 31, | | | August 31, | | | August 31, | |
| | | 2023 | | | 2022 | | | 2021 | | | 2020 | | | 2019 | |
| Net Asset Value, Beginning of Year | | $ | 10.40 | | | $ | 11.58 | | | $ | 11.13 | | | $ | 10.64 | | | $ | 10.95 | |
| Income (Loss) from Investment Operations: | | | | | | | | | | | | | | | | | | | | |
| Net investment income (loss) (1) | | | 0.07 | | | | 0.02 | | | | (0.02 | ) | | | 0.02 | | | | — | |
| Net realized and unrealized gain (loss) | | | 1.06 | | | | (0.08 | ) | | | 1.23 | | | | 0.73 | | | | 0.72 | |
| Total from investment operations | | | 1.13 | | | | (0.06 | ) | | | 1.21 | | | | 0.75 | | | | 0.72 | |
| Dividends and Distributions: | | | | | | | | | | | | | | | | | | | | |
| Dividends from net investment income | | | — | | | | (1.12 | ) | | | (0.76 | ) | | | — | | | | (0.34 | ) |
| Distributions from realized gains | | | (0.24 | ) | | | — | | | | — | | | | (0.26 | ) | | | (0.69 | ) |
| Total dividends and distributions | | | (0.24 | ) | | | (1.12 | ) | | | (0.76 | ) | | | (0.26 | ) | | | (1.03 | ) |
| Net Asset Value, End of Year | | $ | 11.29 | | | $ | 10.40 | | | $ | 11.58 | | | $ | 11.13 | | | $ | 10.64 | |
| Total Return* | | | 11.10 | % | | | (0.77 | )% | | | 11.49 | % | | | 7.19 | % | | | 7.23 | % |
| Ratios and Supplemental Data: | | | | | | | | | | | | | | | | | | | | |
| Net assets, end of year (000s) | | $ | 1,766 | | | $ | 11,289 | | | $ | 17,970 | | | $ | 9,702 | | | $ | 13,365 | |
| Ratio of gross operating expenses (including dividend and interest expense) to average net assets (4) | | | 1.70 | % | | | 1.77 | % | | | 1.84 | % | | | 1.81 | % | | | 1.94 | % |
| Ratio of net operating expenses (including dividend and interest expense) to average net assets (5) | | | 1.10 | % | | | 1.03 | % | | | 1.38 | % | | | 1.36 | % | | | 1.33 | % |
| Ratio of net investment income (loss) (including dividend and interest expense) after expense reimbursement/recoupment to average net assets | | | 0.64 | % | | | 0.20 | % | | | (0.20 | )% | | | 0.16 | % | | | (0.03 | )% |
| Portfolio Turnover Rate | | | 12 | % | | | 23 | % | | | 44 | % | | | 173 | % | | | 245 | % |
| | | | | | | | | | | | | | | | | | | | | |
| (1) | Per share amounts calculated using the average shares method, which more appropriately presents the per share data for the period. |
| (2) | Ratio of gross expenses to average net assets (excluding dividend and interest expenses) for the Easterly Hedged Equity Fund - Class I: |
| | | | 1.59 | % | | | 1.74 | % | | | 1.79 | % | | | 1.79 | % | | | 1.95 | % |
| (3) | Ratio of net operating expenses to average net assets (excluding dividend and interest expenses) for the Easterly Hedged Equity Fund - Class I: |
| | | | 1.25 | % | | | 1.26 | % | | | 1.79 | % | | | 1.79 | % | | | 1.82 | % |
| (4) | Ratio of gross expenses to average net assets (excluding dividend and interest expenses) for the Easterly Hedged Equity Fund - Class R6: |
| | | | 1.59 | % | | | 1.74 | % | | | 1.79 | % | | | 1.78 | % | | | 1.90 | % |
| (5) | Ratio of net operating expenses to average net assets (excluding dividend and interest expenses) for the Easterly Hedged Equity Fund - Class R6: |
| | | | 0.99 | % | | | 1.00 | % | | | 1.33 | % | | | 1.34 | % | | | 1.30 | % |
| * | Assumes reinvestment of all dividends and distributions and does not assume the effects of any sales charges. Aggregate (not annualized) total return is shown for any period shorter than one year. Total return does not reflect the deduction of taxes that a shareholder would pay on distributions or on the redemption of shares. |
See accompanying notes to financial statements.
| NOTES TO FINANCIAL STATEMENTS |
| Year Ended August 31, 2023 |
| 1. | ORGANIZATION AND SIGNIFICANT ACCOUNTING POLICIES |
James Alpha Funds Trust (the “Trust”) was organized in 2020, as a Delaware Statutory Trust and is registered under the Investment Company Act of 1940, as amended, as an open-end management investment company. The Trust currently consists of five series. Easterly Funds LLC serves as the Funds’ advisor. These financial statements include the following two series:
| Fund | Sub-Advisor |
| Easterly Global Real Estate Fund | Ranger Global Real Estate Advisors, LLC |
| Easterly Hedged Equity Fund | EAB Investment Group, LLC |
Ultimus Fund Solutions, LLC (the “Administrator”), serves the Trust as administrator, custody administrator, transfer agent and fund accounting agent. Ultimus Fund Distributors, LLC (“NLD” or the “Distributor”) is the Trust’s Distributor.
The Easterly Global Real Estate Fund and the Easterly Hedged Equity Fund are diversified Funds.
| Fund | Primary Objective |
| Easterly Global Real Estate | Total return through a combination of current income and capital appreciation |
| Easterly Hedged Equity | Capital appreciation |
Easterly Hedged Equity is a “fund of funds”, in that the Fund will generally invest in other investment companies. Currently, each Fund offers Class A, Class C, Class I and Class R6 shares. Class A shares of each fund are offered at net asset value plus a maximum sales load of 5.75%. Class C shares are offered subject to a CDSC of 1.00%. Class I and Class R6 shares are offered at net asset value. Each class represents an interest in the same assets of the applicable Fund, and the classes are identical except for differences in their sales charge structures, ongoing service and distribution charges. Class R6 shares are only available to certain qualified investors and the minimum initial investment will vary depending on the type of qualified investor. All classes of shares have equal voting privileges except that each class has exclusive voting rights with respect to its service and/or distribution plans. Fund level income and expenses, and realized and unrealized capital gains and losses are allocated to each class of shares based on their relative net assets within each Fund. Class specific expenses are allocated to that share class.
The following is a summary of significant accounting policies followed by the Funds in preparation of its financial statements. These policies are in conformity with accounting principles generally accepted in the United States of America (“GAAP”). The preparation of financial statements in conformity with GAAP requires management to make estimates and assumptions that affect the reported amounts of assets and liabilities and disclosure of contingent assets and liabilities at the date of the financial statements and the reported amounts of increases and decreases in net assets from operations during the reporting period. Actual results could differ from those estimates. Each Fund is an investment company and accordingly follows the investment company accounting and reporting guidance of the Financial Accounting Standards Board (FASB) Accounting Standard Codification Topic 946 “Financial Services – Investment Companies” including FASB Accounting Standard Update ASU 2013-08.
(a) Valuation of Investments
Investment securities listed on a national securities exchange are valued at the last reported sale price on the valuation date. NASDAQ traded securities are valued at the NASDAQ Official Closing Price (NOCP). If there are no such reported sales, the securities are valued at the mean between current bid and ask. Debt securities (other than short-term obligations) are valued each day by an independent pricing service approved by the Board of Trustees using methods which include current market quotations from a major market maker in the securities and trader-reviewed “matrix” prices. Short-term debt securities having a remaining maturity of sixty days or less may be valued at amortized cost or amortized value, which approximates market value. U.S. Government Money Market values all of its securities on the basis of amortized cost, which approximates market value. Options listed on a securities exchange or board of trade for which market quotations are readily available shall be valued at the last quoted sales price or, in the absence of a sale, at the mean between the last bid and ask price. Options not listed on a securities exchange or board of trade for which over-the-counter market quotations are readily available shall be valued at the mean of the current bid and asked prices. Futures are valued based on their daily settlement value. Swap transactions are valued through an independent pricing service or at fair value based on daily price reporting from the swap counterparty issuing the swap. Total return swaps on securities listed on an exchange shall be valued at the last quoted sales price or, in the absence of a sale, at the mean between the current bid and ask prices. Any securities or other assets for which market quotations are not readily available are valued at their fair value as determined in good faith under procedures established by the Board of Trustees (the “Board”). There is no single standard for determining the fair value of such securities. Rather, in determining the fair value of a security, the board-appointed Valuation Designee shall take into account the relevant factors and surrounding circumstances, a few of which may include: (i) the nature and pricing history (if any) of the security; (ii) whether any dealer quotations for the security are available; and (iii) possible valuation methodologies that could be used to determine the fair value of a security. The Easterly Global Real Estate Fund uses fair value prices as provided by an independent pricing vendor on a daily basis for those securities traded on a foreign exchange. Foreign currency and Forward currency exchange contracts are valued daily at the London close each day. The ability of issuers of debt securities held by the Funds to meet their obligations may be affected by economic or political developments in a specific state, industry or region. Investments in foreign countries may involve certain considerations and risks not typically associated with domestic investments, including, but not limited to, the possibility of future political and economic developments and the level of government supervision and regulation of foreign securities markets.
Valuation of Underlying Funds – The Funds may invest in portfolios of open-end or closed-end investment companies (the “underlying funds”). Underlying open-end investment companies are valued at their respective net asset values as reported by such investment companies. The underlying funds value securities in their portfolios for which market quotations are readily available at their market values (generally the last reported sale price) and all other securities and assets at their fair value by the methods established by the boards of the underlying funds. The shares of many closed-end investment companies, after their initial public offering, frequently trade at a price per share, which is different than the net asset value per share. The difference represents a market premium or market discount of such shares. There can be no assurances that the market discount or market premium on shares of any closed-end investment company purchased by the Funds will not change.
| NOTES TO FINANCIAL STATEMENTS |
| Year Ended August 31, 2023 (Continued) |
The Funds utilize various methods to measure the fair value of most of its investments on a recurring basis. GAAP establishes a hierarchy that prioritizes inputs to valuation methods. The three levels of input are:
Level 1 – Unadjusted quoted prices in active markets for identical assets and liabilities that the Funds have the ability to access.
Level 2 – Observable inputs other than quoted prices included in level 1 that are observable for the asset or liability, either directly or indirectly. These inputs may include quoted prices for the identical instrument on an inactive market, prices for similar instruments, interest rates, prepayment speeds, credit risk, yield curves, default rates and similar data.
Level 3 – Unobservable inputs for the asset or liability, to the extent relevant observable inputs are not available, representing the Funds’ own assumptions about the assumptions a market participant would use in valuing the asset or liability, and would be based on the best information available.
The availability of observable inputs can vary from security to security and is affected by a wide variety of factors, including, for example, the type of security, whether the security is new and not yet established in the marketplace, the liquidity of markets, and other characteristics particular to the security. To the extent that valuation is based on models or inputs that are less observable or unobservable in the market, the determination of fair value requires more judgment. Accordingly, the degree of judgment exercised in determining fair value is greatest for instruments categorized in Level 3.
The inputs used to measure fair value may fall into different levels of the fair value hierarchy. In such cases, for disclosure purposes, the level in the fair value hierarchy within which the fair value measurement falls in its entirety, is determined based on the lowest level input that is significant to the fair value measurement in its entirety.
The inputs or methodology used for valuing securities are not necessarily an indication of the risk associated with investing in those securities. The following tables summarize the inputs used as of August 31, 2023, for the Funds’ assets and liabilities measured at fair value:
| Easterly Global Real Estate Fund | |
| | | | | | | | | | | | | |
| Assets* | | Level 1 | | | Level 2 | | | Level 3 | | | Total | |
| Common Stock | | $ | 252,437,825 | | | $ | 236,322,221 | | | $ | — | | | $ | 488,760,046 | |
| Total | | $ | 252,437,825 | | | $ | 236,322,221 | | | $ | — | | | $ | 488,760,046 | |
| Derivatives | | | | | | | | | | | | | | | | |
| Forward Currency Contracts | | $ | — | | | $ | (10,752 | ) | | $ | — | | | $ | (10,752 | ) |
| Total | | $ | — | | | $ | (10,752 | ) | | $ | — | | | $ | (10,752 | ) |
| | | | | | | | | | | | | | | | | |
| Easterly Hedged Equity Fund | |
| Assets* | | Level 1 | | | Level 2 | | | Level 3 | | | Total | |
| Exchange Traded Funds | | $ | 109,209,875 | | | $ | — | | | $ | — | | | $ | 109,209,875 | |
| Put Options Purchased | | | — | | | | 498,175 | | | | — | | | | 498,175 | |
| Total Return Swaps | | | — | | | | 863,017 | | | | — | | | | 863,017 | |
| Total | | $ | 109,209,875 | | | $ | 1,361,192 | | | $ | — | | | $ | 110,571,067 | |
| Derivatives* - Liabilities | | | | | | | | | | | | | | | | |
| Call Options Written | | $ | (1,341,400 | ) | | $ | — | | | $ | — | | | $ | (1,341,400 | ) |
| Put Options Written | | | — | | | | (144,250 | ) | | | — | | | | (144,250 | ) |
| Total Return Swaps | | | — | | | | (311,597 | ) | | | — | | | | (311,597 | ) |
| Total | | $ | (1,341,400 | ) | | $ | (455,847 | ) | | $ | — | | | $ | (1,797,247 | ) |
It is the Funds’ policy to recognize transfers into and out of Levels at the end of the reporting period.
The Funds did not hold any Level 3 securities during the period.
| * | Refer to the Schedules of Investments for industry or category classifications. |
(b) Federal Income Tax
It is each Fund’s policy to continue to qualify as a regulated investment company by complying with the provisions of the Internal Revenue Code that are applicable to regulated investment companies and to distribute substantially all of its taxable income and net realized gains to shareholders. Therefore, no federal income tax provision is required.
Capital loss carry forwards, as of each Fund’s most recent tax year-ended August 31, 2023 (for the tax year ended December 31, 2022 for the Easterly Global Real Estate Fund), available to offset future capital gains, utilized capital gains, if any, are as follows:
| | | | | | | | | Capital Loss Carry Forward | | | | |
| | | Short-Term | | | Long-Term | | | Utilized | | | Total | |
| Easterly Global Real Estate Fund | | $ | — | | | $ | — | | | $ | — | | | $ | — | |
| Easterly Hedged Equity Fund | | | — | | | | — | | | | 1,748,567 | | | | — | |
The Funds recognize the tax benefits of uncertain tax positions only when the position is “more likely than not” to be sustained assuming examination by tax authorities. Management has reviewed the tax positions taken on its 2020-2022 returns and expected to be taken in the Funds’ 2023 returns and concluded that no liability for unrecognized tax benefits should be recorded related to uncertain tax positions. The Funds identify its major tax jurisdictions as U.S. Federal, Arizona and
| NOTES TO FINANCIAL STATEMENTS |
| Year Ended August 31, 2023 (Continued) |
foreign jurisdictions where the Funds make significant investments. The Funds recognize interest and penalties, if any, related to unrecognized tax benefits as income tax expense in the Statements of Operations. During year ended August 31, 2023, the Funds did not incur any interest or penalties.
(c) Security Transactions and Other Income
Security transactions are reflected for financial reporting purposes as of the trade date. Dividend income is recognized on the ex-dividend date, and interest income is recognized on an accrual basis including premium amortized and discount accreted. All paydown gains and losses are classified as interest income in the accompanying Statements of Operations in accordance with U.S. GAAP. Discounts and premiums on securities purchased are accreted and amortized, over the lives of the respective securities with a corresponding increase/decrease in the cost basis of that security using the yield to maturity method, or where applicable, the first call date of the security. Realized gains or losses from sales of securities are determined by comparing the identified cost of the security lot sold with the net sales proceeds. Withholding taxes on foreign dividends have been provided for in accordance with the Trust’s understanding of the applicable country’s tax rules and rates.
(d) Dividends and Distributions
The following table summarizes each Fund’s intended dividend and capital gain declaration policy:
| Fund | | Income Dividends | | Capital Gains |
| Easterly Global Real Estate Fund | | Quarterly | | Quarterly |
| Easterly Hedged Equity Fund | | Annually | | Annually |
Each Fund records dividends and distributions to its shareholders on the ex-dividend date. The amount of dividends and distributions from net investment income and net realized gains are determined in accordance with federal income tax regulations, which may differ from GAAP. These “book-tax” differences are either permanent or temporary in nature. To the extent these differences are permanent in nature, such amounts are reclassified within the net asset accounts based on their federal tax-basis treatment; temporary differences do not require reclassification. To the extent dividends and distributions exceed current and accumulated earnings and profits for federal income tax purposes, they are reported as distributions of paid-in-surplus or tax return of capital. These reclassifications have no effect on net assets, results from operations or net asset value per share of each Fund.
(e) Allocation of Expenses
Expenses of the Trust that are directly identifiable to a specific fund are charged to that fund. Expenses incurred by the Trust that do not relate to a specific Fund of the Trust are allocated to the individual Funds on an equal basis or another reasonable basis.
(f) Repurchase Agreements
In connection with transactions in repurchase agreements, it is the Trust’s policy that its custodian take possession of the underlying collateral securities, the fair value of which exceeds the principal amount of the repurchase transaction, including accrued interest, at all times. If the seller defaults, and the fair value of the collateral declines, realization of the collateral by the Trust may be delayed or limited.
(g) Indemnification
The Trust indemnifies its Officers and Trustees for certain liabilities that may arise from the performance of their duties to the Trust. Additionally, in the normal course of business, the Funds enter into contracts that contain a variety of representations and warranties and which provide general indemnities. The Funds’ maximum exposure under these arrangements is unknown, as this would involve future claims that may be made against the Funds that have not yet occurred. However, based on experience, the risk of loss due to these warranties and indemnities appears to be remote.
(h) Other
The preparation of the financial statements in accordance with accounting principles generally accepted in the United States of America requires management to make estimates and assumptions that affect the reported amounts and disclosures in the financial statements. Actual results could differ from those estimates.
Foreign currency. Investment securities and other assets and liabilities denominated in foreign currencies are translated into U.S. dollar amounts at the date of valuation. Purchases and sales of investment securities and income and expense items denominated in foreign currencies are translated into U.S. dollar amounts on the respective dates of such transactions. The Trust does not isolate that portion of the results of operations resulting from changes in foreign exchange rates on investments from the fluctuations arising from changes in market prices of securities held. Such fluctuations are included with the net realized and unrealized gain or loss from investments.
Reported net realized foreign exchange gains or losses arise from sales of foreign currencies, currency gains or losses realized between the trade and settlement dates on securities transactions, and the difference between the amounts of dividends, interest, and foreign withholding taxes recorded on the company’s books and the U.S. dollar equivalent of the amounts actually received or paid. Net unrealized foreign exchange gains and losses arise from changes in the fair values of assets and liabilities, other than investments in securities at fiscal period end, resulting from changes in exchange rates.
Real Estate Investment Trust (“REIT”). The Easterly Global Real Estate Fund recharacterizes distributions received from REIT investments based on information provided by the REIT into the following categories: ordinary income, long-term capital gains, and return of capital. If information is not available on a timely basis from the REIT, the recharacterization will be estimated based on available information which may include the previous year’s allocation. If new or additional information becomes available from the REIT at a later date, a recharacterization will be made in the following year.
| NOTES TO FINANCIAL STATEMENTS |
| Year Ended August 31, 2023 (Continued) |
Market Disruptions Risk. The Funds are subject to investment and operational risks associated with financial, economic and other global market developments and disruptions, including the recent spread of an infectious respiratory illness caused by a novel strain of coronavirus (known as COVID-19), which can negatively impact the securities markets and cause the Funds to lose value.
| 2. | MANAGEMENT FEE, ADMINISTRATION FEE AND OTHER TRANSACTIONS WITH AFFILIATES |
(a) Easterly Funds, LLC acts as investment manager for the Funds pursuant to the terms of a Management Agreement with the Trust, on behalf of the Funds (the “Management Agreement”). Under the terms of the Management Agreement, the Manager manages the investment operations of the Funds in accordance with each Fund’s respective investment policies and restrictions. Each investment sub-advisor is responsible for the day-to-day management of its Fund’s portfolios. Easterly Funds, LLC serves the Funds in a supervision capacity with responsibility to monitor the performance of the Funds’ outside service providers, assist in the review of financial statements and other regulatory filings and board meeting materials related to each Fund. The management fees are payable to Easterly Funds, LLC monthly by each Fund and are computed daily as shown in the table below. The Funds’ subadvisors are paid by the manager, not the Funds.
(b) Pursuant to an operating expense limitation agreement between Easterly Funds, LLC and the Funds, Easterly Funds, LLC has contractually agreed to waive all or a portion of its advisory fee and/or pay expenses of the Fund so that total annual Fund operating expenses (excluding front-end and contingent deferred sales loads, leverage, interest and tax expenses, dividends and interest on short positions, brokerage commissions, expenses incurred in connection with any merger, reorganization or liquidation, extraordinary or non-routine expenses and Acquired Fund Fees and Expenses) do not exceed the expense limitation shown in the table below, and is based on the Funds’ average daily net assets. This operating expense limitation agreement cannot be terminated during its term. Easterly Funds, LLC is permitted to seek reimbursement from the Fund, subject to limitations, for management fees waived and Fund expenses it paid within three (3) years of the end of the fiscal year in which such management fees were waived or expenses paid, as long as the reimbursement does not cause the Fund’s operating expenses to exceed (i) the expense cap in place at the time the fees were waived or the expenses were incurred; or (ii) the current expense cap, whichever is less. The expense limitation agreement will be in effect through December 31, 2023.
| | | | | | | | | | | | | | | | Management | |
| | | | | | | | | | | | | | | | Fee Waived/ | |
| | | Management | | Expense Limitation | | | | | Expenses Reimbursed | |
| Fund | | Agreement | | Cl A | | Cl C | | Cl I | | CL R6 | | Expires | | | YTD 8/31/2023 | |
| Easterly Global Real Estate Fund | | 0.90% | | 1.69% | | 2.37% | | 1.04% | | 0.94% | | | 12/31/2023 | | | $ | 664,778 | |
| Easterly Hedged Equity Fund* | | 1.20% | | 1.50% | | 2.25% | | 1.25% | | 0.99% | | | 12/31/2023 | | | | 355,145 | |
| * | Prior to September 7, 2021 the expense limitation was as 1.99%, 3.00%, 1.79% and 1.34% for Class A, Class C, Class I and Class R6, respectively. |
The following table shows the available waived expenses and expiration date for each Fund subject to potential recovery.
| Fund | | 8/31/2024 | | | 8/31/2025 | | | 8/31/2026 | |
| Easterly Global Real Estate Fund | | $ | 951,023 | | | $ | 498,797 | | | $ | 664,778 | |
| Easterly Hedged Equity Fund | | | 44,773 | | | | 320,557 | | | | 355,145 | |
(c) Ultimus Fund Distributors, LLC (“UFD”) is the Trust’s Distributor. The Trust with respect to the Funds has adopted a Plan of Distribution pursuant to Rule 12b-1 under the 1940 Act (the “Plan”) with respect to the sale and distribution of Class A and C shares of the Funds. The Plan provides that the Funds will pay UFD and other entities, including a broker-dealer affiliate of the Adviser, are paid pursuant to the Plans provided and the expenses borne by the distributor and others in the distribution of Fund shares a fee, which is accrued daily and paid monthly, at the annual rate of 0.25% of the average daily net assets of Class A shares and 1.00% of the average daily net assets of each of the Funds’ Class C shares. The aggregate of such service fee payments will not exceed 0.25% of average daily net assets.
For the year ended August 31, 2023, UFD received sales charges on sales of the Funds’ Class A shares.
| Fund | | UFD Sales Charges | |
| | | Class A | |
| Easterly Global Real Estate Fund | | $ | 42,417 | |
| Easterly Hedged Equity Fund | | | 4,349 | |
For the year ended August 31, 2023 CDSC fees were as follows.
| Fund | | CDSC Fees | |
| | | Class A | |
| Easterly Global Real Estate Fund | | $ | 5,000 | |
| | | | | |
| | | Class C | |
| Easterly Global Real Estate Fund | | $ | 316 | |
| Easterly Hedged Equity Fund | | | 23 | |
(d) Ultimus Fund Solutions, LLC (“UFS”), an affiliate of UFD provides administrative, fund accounting and transfer agency services to the Funds pursuant to agreements with the Trust, for which it receives from each Fund: (i) a minimum annual fee or basis points in decreasing amounts as assets reach certain breakpoints; and (ii) any related out-of-pocket expenses.
| NOTES TO FINANCIAL STATEMENTS |
| Year Ended August 31, 2023 (Continued) |
In addition, certain affiliates of the Distributor provide services to the Trust as follows:
Northern Lights Compliance Services, LLC (“NLCS”) - NLCS, an affiliate of UFS and the Distributor, provides a Chief Compliance Officer to the Trust, as well as related compliance services, pursuant to a consulting agreement between NLCS and the Trust. Under the terms of such agreement, NLCS receives customary fees from the Funds.
Blu Giant, LLC (“Blu Giant”) – Blu Giant, an affiliate of UFS and the Distributor, provides EDGAR conversion and filing services as well as print management services for the Trust on an ad-hoc basis. For the provision of these services, Blu Giant receives customary fees from the Funds.
Certain employees of UFS and NLCS are also officers of the Trust, and are not paid any fees directly by the Trust for serving in such capacity.
| 3. | INVESTMENT TRANSACTIONS |
(a) For the year ended August 31, 2023, the cost of purchases and proceeds from sales of investment securities, other than short-term securities, for the Funds were as follows:
| Fund | | Purchases | | | Sales | |
| Easterly Global Real Estate Fund | | $ | 67,890,556 | | | $ | 278,401,092 | |
| Easterly Hedged Equity Fund | | | 43,371,424 | | | | 10,265,063 | |
(b) Certain Funds may enter into options contracts. An option contract is a contract in which the writer of the option grants the buyer of the option the right to purchase from (call option), or sell to (put option), the writer a designated instrument at a specified price within a specified period of time. Certain options, including options on indices, will require cash settlement by the Fund if the option is exercised.
Premiums paid when put or call options are purchased by the Fund, represent investments, which are marked-to-market daily. When a purchase option expires, the Fund will realize a loss in the amount of the premium paid. When the Fund enters into a closing sales transaction, the Fund will realize a gain or loss depending on whether the proceeds from the closing sales transaction are greater or less than the premium paid for the option. When the Fund exercises a put option, it will realize a gain or loss from the sale of the underlying security and the proceeds from such sale will be decreased by the premium originally paid. When the Fund exercises a call option, the cost of the security, which the Fund purchases upon exercise, will be increased by the premium originally paid.
Certain Funds may write covered call options. This means that the Fund will own the security subject to the option or an option to purchase the same underlying security, having an exercise price equal to or less than the exercise price of the covered option, or will establish and maintain with its custodian for the term of the option, an account consisting of cash, U.S. government securities or other liquid securities having a value equal to the fluctuating market value of the securities on which the Fund holds a covered call position.
When a Fund writes a call option, an amount equal to the premium received by the Fund is recorded as a liability, the value of which is marked-to-market daily. When a written option expires, the Fund realizes a gain equal to the amount of the premium received. When the Fund enters into a closing purchase transaction, the Fund realizes a gain or loss depending upon whether the cost of the closing transaction is greater or less than the premium originally received, without regard to any unrealized gain or loss on the underlying security, and the liability related to such option is eliminated. When a written call option is exercised the proceeds of the security sold will be increased by the premium originally received.
The liability representing a Fund’s obligation under an exchange traded written option or investment in a purchased option is valued at the last sale price or, in the absence of a sale, the last available bid price.
The Funds may enter into options for hedging purposes. The risk associated with purchasing options is limited to the premium originally paid. The risk in writing a covered call option is that the Fund gives up the opportunity to participate in any increase in the price of the underlying security beyond the exercise price.
(c) Certain Funds may enter into futures contracts. The Funds are subject to equity price risk in the normal course of pursuing their investment objective. To manage equity price risk, the Funds may enter into futures contracts. Upon entering into a futures contract with a broker, the Funds are required to deposit in a segregated account a specified amount of cash or U.S. government securities. Futures contracts are valued daily and unrealized gains or losses are recorded in a “variation margin” account. Periodically, the Funds receive from or pays to the broker a specified amount of cash based upon changes in the variation margin account. When a contract is closed, the Funds recognize a realized gain or loss. Futures contracts have market risks, including the risk that the change in the value of the contract may not correlate with changes in the value of the underlying securities. With futures contracts, there is minimal counterparty credit risk to the Funds since futures are exchange traded and the exchange’s clearinghouse, as counterparty to all exchange traded futures, guarantees the futures against default. Futures contracts outstanding at period end are listed after the Funds’ portfolio of investments.
(d) Certain Funds may enter into foreign currency exchange contracts. Because various Funds may invest in securities denominated in foreign currencies, they may seek to hedge foreign currency risks by engaging in foreign currency exchange transactions. These may include buying or selling foreign currencies on a spot basis, entering into foreign currency forward contracts, and buying and selling foreign currency options, foreign currency futures, and options on foreign currency futures. Currency exchange rates may fluctuate significantly over short periods and can be subject to unpredictable change based on such factors as political developments and currency controls by foreign governments.
(e) Swap Agreements – Certain funds are subject to equity price risk and/or interest rate risk in the normal course of pursuing their respective investment objectives. The Funds may enter into various swap transactions for investment purposes or to manage interest rate, equity, foreign exchange (currency), commodity or credit risk. These would be two-party contracts entered into primarily to exchange the returns (or differentials in rates of returns) earned or realized on particular pre-determined investments or instruments.
| NOTES TO FINANCIAL STATEMENTS |
| Year Ended August 31, 2023 (Continued) |
The gross returns to be exchanged or “swapped” between parties are calculated with respect to a notional amount, i.e., the return on or increase in value of a particular dollar amount invested at a particular interest rate, in a particular foreign currency, or in a “basket” of securities representing a particular index or market segment. Changes in the value of swap agreements are recognized as unrealized gains or losses in the Statements of Operations by “marking to market” on a daily basis to reflect the value of the swap agreement at the end of each trading day. Payments received or paid at the beginning of the agreement are reflected as such on the Statements of Assets and Liabilities and may be referred to as upfront payments. The Funds amortize upfront payments and/or accrue for the fixed payment stream on swap agreements on a daily basis with the net amount recorded as a component of unrealized gain or loss on the Statements of Operations. A liquidation payment received or made at the termination of the swap agreement is recorded as a realized gain or loss on the Statements of Operations. The Funds segregate liquid securities having a value at least equal to the amount of their current obligation under any swap transaction. Entering into these agreements involves, to varying degrees, lack of liquidity and elements of credit, market, and counterparty risk in excess of amounts recognized on the Statements of Assets and Liabilities. The Funds’ maximum risk of loss from counterparty credit risk is the discounted net value of the cash flows to be received from the counterparty over the contract’s remaining life, to the extent that that amount is positive.
(f) Short Sales – Certain funds may sell securities short. A short sale is a transaction in which the Fund sells a security it does not own or have the right to acquire (or that it owns but does not wish to deliver) in anticipation that the market price of that security will decline.
When the Fund makes a short sale, the broker-dealer through which the short sale is made must borrow the security sold short and deliver it to the party purchasing the security. The Fund is required to make a margin deposit in connection with such short sales; the Fund may have to pay a fee to borrow particular securities and will often be obligated to pay over any dividends and accrued interest on borrowed securities.
If the price of the security sold short increases between the time of the short sale and the time the Fund covers its short position, the Fund will incur a loss; conversely, if the price declines, the Fund will realize a capital gain. Any gain will be decreased, and any loss increased, by the transaction costs described above. The successful use of short selling may be adversely affected by imperfect correlation between movements in the price of the security sold short and the securities being hedged.
To the extent the Fund sells securities short, it will provide collateral to the broker-dealer and (except in the case of short sales “against the box”) will maintain additional asset coverage in the form of cash, U.S. government securities or other liquid securities with its custodian in a segregated account in an amount at least equal to the difference between the current market value of the securities sold short and any amounts required to be deposited as collateral with the selling broker (not including the proceeds of the short sale). A short sale is “against the box” to the extent the Fund contemporaneously owns, or has the right to obtain at no added cost, securities identical to those sold short.
(g) Other Investment Companies or Exchange Traded Funds – Certain Funds may invest up to 100% of their net assets in shares of affiliated and unaffiliated investment companies, including money market mutual funds, other mutual funds or exchange-traded funds (“ETFs”). An ETF generally is an open-end investment company, unit investment trust or a portfolio of securities deposited with a depository in exchange for depository receipts. ETFs provide investors the opportunity to buy or sell throughout the day an entire portfolio of securities in a single security. Although index mutual funds are similar to index-based ETFs, they are generally sold and redeemed only once per day at market close. The ETFs in which a Fund invests may be subject to liquidity risk. Liquidity risk exists when particular investments are difficult to purchase or sell, possibly preventing the sale of the security at an advantageous time or price. To the extent that the ETFs in which a Fund invests hold securities of companies with smaller market capitalizations or securities with substantial market risk, they will have a greater exposure to liquidity risk. In addition, ETFs are subject to the following risks that do not apply to conventional mutual funds that can be found in “Exchange-Traded Funds” below: (1) the market price of the ETF’s shares may trade at a discount to their net asset value; (2) an active trading market for an ETF’s shares may not develop or be maintained; or (3) trading of an ETF’s shares may be halted if the listing exchange deem such action appropriate, the shares are de-listed from the exchange, or the activation of market-wide “circuit breakers” (which are tied to large decreases in stock prices) halts stock trading generally. Additionally, ETFs have management fees, which increase their cost. In addition to the advisory and operational fees a Fund bears directly in connection with its own operation, the Fund also bears its pro rata portion of the advisory and operational expenses incurred indirectly through investments in other investment companies.
The derivatives are not accounted for as hedging instruments under GAAP. The effect of derivative instruments on the Statements of Assets and Liabilities at August 31, 2023, were as follows:
| | | | | | | Location of derivatives on Statements | | Fair value of asset/liability | |
| Fund | | Derivative | | Risk Type | | of Assets and Liabilities | | derivatives | |
| Easterly Global Real Estate Fund | | | | |
| | | Forward Exchange Contracts | | Foreign Exchange | | Unrealized depreciation on forward currency exchange contracts | | $ | (10,752 | ) |
| | | | | | | Total | | $ | (10,752 | ) |
| Easterly Hedged Equity Fund | | | | |
| | | Put options purchased | | Equity | | Investments, at value | | $ | 498,175 | |
| | | Call options written | | Equity | | Options written | | | (1,341,400 | ) |
| | | Put options written | | Equity | | Options written | | | (144,250 | ) |
| | | Swap Contracts | | Equity | | Unrealized appreciation on swaps | | | 863,017 | |
| | | Swap Contracts | | Equity | | Unrealized depreciation on swaps | | | (311,597 | ) |
| | | | | | | Total | | $ | (436,055 | ) |
| NOTES TO FINANCIAL STATEMENTS |
| Year Ended August 31, 2023 (Continued) |
The effect of derivative instruments on the Statements of Operations for the year ended August 31, 2023, were as follows:
| | | | | | | | | Realized and unrealized gain (loss) | |
| Fund | | Derivative | | Location of gain (loss) on derivatives | | Risk Type | | on derivatives | |
| Easterly Global Real Estate Fund | | | | |
| | | Forward Currency Contracts | | | | |
| | | | | Net realized gain on Investments and foreign currency translations | | | | | | |
| | | | | | | Foreign Exchange | | $ | 17,877 | |
| | | | | Net change in unrealized appreciation on investments and foreign currency transactions | | | | | | |
| | | | | | | Foreign Exchange | | | 1,267 | |
| | | | | | | Total | | $ | 19,144 | |
| | | Options | | | | |
| | | | | Net realized gain on options written | | | | | | |
| | | | | | | Equity | | $ | 1,054,208 | |
| | | | | | | Total | | $ | 1,054,208 | |
| Easterly Hedged Equity Fund | | | | |
| | | Options | | | | |
| | | | | Net realized loss on options purchased | | | | | | |
| | | | | | | Equity | | $ | (11,040,817 | ) |
| | | | | Net realized gain on options written | | | | | | |
| | | | | | | Equity | | | 9,816,199 | |
| | | | | | | Total | | $ | (1,224,618 | ) |
| | | | | Net change in unrealized depreciation on options purchased | | | | | | |
| | | | | | | Equity | | $ | (7,460,213 | ) |
| | | | | Net change in unrealized appreciation on options written | | | | | | |
| | | | | | | Equity | | | 1,548,457 | |
| | | | | | | Total | | $ | (5,911,756 | ) |
| | | Swaps | | | | |
| | | | | Net realized loss on swaps | | | | | | |
| | | | | | | Equity | | $ | (259,679 | ) |
| | | | | Net change in unrealized appreciation on swaps | | | | | | |
| | | | | | | Equity | | $ | 3,807,593 | |
| | | | | | | Total | | $ | 3,547,914 | |
The average notional value of the derivative instruments for the Funds during the year ended August 31, 2023 was as follows:
| Easterly Global Real Estate Fund |
| Options Purchased | |
| $ | 22,298,866 | |
| Easterly Hedged Equity Fund | |
| | |
| Options Purchased | | | Options Written | | | Total Return Swaps | |
| $ | 213,666,564 | | | $ | 288,537,151 | | | $ | 38,122,257 | |
During the year ended August 31, 2023, the Easterly Hedged Equity Fund was not subject to any master netting arrangements. The following table shows additional information regarding the offsetting of assets and liabilities at August 31, 2023 for the Easterly Hedged Equity Fund.
| Easterly Hedged Equity Fund | | Net Amounts | | | Financial | | | Cash | | | Net | |
| | | | | Gross Amounts of | | | Gross Amounts of | | | Presented in the | | | Instruments | | | Collateral | | | Amount | |
| Description | | Counterparty | | Recognized Assets | | | Recognized Liabilities | | | Statement of Assets & Liabilities | | | Pledged | | | Pledged | | | of Assets & Liabilities | |
| Unrealized appreciation on total return swaps | | Goldman Sachs | | $ | 863,017 | (1) | | $ | — | | | $ | 863,017 | | | $ | — | | | $ | — | | | $ | — | |
| Unrealized depreciation on total return swaps | | Goldman Sachs | | | — | | | | (311,597 | ) (1) | | | (311,597 | ) | | | — | | | | 311,597 | (2) | | | — | |
| Options Purchased | | Pershing | | | 498,175 | (1) | | | — | | | | 498,175 | | | | — | | | | — | | | | — | |
| Options Writen | | Pershing | | | — | | | | (1,485,650) (1) | | | | (1,485,650 | ) | | | 1,485,650 | (2) | | | — | | | | — | |
| | | | | $ | 1,361,192 | | | $ | (1,797,247 | ) | | $ | (436,055 | ) | | $ | 1,485,650 | | | $ | 311,597 | | | $ | — | |
| (1) | Value as presented in the Portfolio of Investments. |
| (2) | The amount is limited to the derivative liability balance and does not include excess collateral pledged to the counterparty. Total collateral amounts are presented in the Statements of Assets and Liabilities. |
| NOTES TO FINANCIAL STATEMENTS |
| Year Ended August 31, 2023 (Continued) |
| 4. | AGGREGATE UNREALIZED APPRECIATION AND DEPRECIATION – TAX BASIS |
The identified cost of investments in securities owned by each Fund for federal income tax purposes, and its respective gross unrealized appreciation and depreciation at August 31, 2023, were as follows:
| | | | | | Gross | | | Gross | | | Net Unrealized | |
| | | Tax | | | Unrealized | | | Unrealized | | | Appreciation/ | |
| | | Cost | | | Appreciation | | | Depreciation | | | (Depreciation) | |
| Easterly Global Real Estate Fund | | $ | 872,365,703 | | | $ | 5,277,604 | | | $ | (388,883,261 | ) | | $ | (383,605,657 | ) |
| Easterly Hedged Equity Fund | | | 91,638,543 | | | | 59,104,128 | | | | (41,968,851 | ) | | | 17,135,277 | |
| 5. | DISTRIBUTIONS TO SHAREHOLDERS AND TAX COMPONENTS OF CAPITAL |
The tax character of dividends paid during the periods ended August 31, 2023 and August 31, 2022 (for the period ended December 31, 2022 and December 31, 2021 for the Easterly Global Real Estate Fund) was as follows:
| For fiscal year ended | | Ordinary | | | Long-Term | | | Return of | | | | |
| 8/31/2023 | | Income | | | Capital Gains | | | Capital | | | Total | |
| Easterly Global Real Estate Fund | | $ | 35,573,869 | | | $ | 1,374,452 | | | $ | — | | | $ | 36,948,321 | |
| Easterly Hedged Equity Fund | | | — | | | | 1,996,748 | | | | — | | | | 1,996,748 | |
| | | | | | | | | | | | | | | | | |
| For fiscal year ended | | Ordinary | | | Long-Term | | | Return of | | | | |
| 8/31/2022 | | Income | | | Capital Gains | | | Capital | | | Total | |
| Easterly Global Real Estate Fund | | $ | 87,769,047 | | | $ | 2,303,721 | | | $ | — | | | $ | 90,072,768 | |
| Easterly Hedged Equity Fund | | | 5,284,200 | | | | — | | | | — | | | | 5,284,200 | |
As of the Easterly Hedged Equity Fund’s tax year-ended August 31, 2023 (for the Easterly Global Real Estate Fund in which its December 31, 2022 components of distributable earnings have been adjusted for August 31, 2023 activity), the components of distributable earnings on a tax basis were as follows:
| | | Undistributed | | | Undistributed | | | Post October Loss | | | Capital Loss | | | Other | | | Unrealized | | | Total | |
| | | Ordinary | | | Long-Term | | | and | | | Carry | | | Book/Tax | | | Appreciation/ | | | Accumulated | |
| | | Income | | | Capital Gains | | | Late Year Loss | | | Forwards | | | Differences | | | (Depreciation) | | | Earnings/(Deficits) | |
| Easterly Global Real Estate Fund | | $ | 789,287 | | | $ | — | | | $ | — | | | $ | (15,543,127 | ) | | $ | — | | | $ | (383,682,402 | ) | | $ | (398,436,242 | ) |
| Easterly Hedged Equity Fund | | | — | | | | — | | | | (8,927,110 | ) | | | — | | | | (49,028 | ) | | | 17,135,277 | | | | 8,159,139 | |
The difference between book basis and tax basis unrealized appreciation (depreciation), undistributed net investment income (loss) and accumulated net realized gain (loss) from security transactions are primarily attributable to the tax deferral of losses on wash sales, and mark-to-market on option and swap contracts and passive foreign investment companies. The unrealized appreciation (depreciation) in the table above includes unrealized foreign currency losses of $(76,745) for the Easterly Global Real Estate Fund. In addition, the amount listed under other book/tax differences for the Easterly Hedged Equity Fund are primarily attributable to the tax deferral of losses on straddles.
Late year losses incurred after December 31 within the fiscal year are deemed to arise on the first business day of the following fiscal year for tax purposes. The Easterly Hedged Equity Fund incurred and elected to defer such late year losses of $118,813.
Capital losses incurred after October 31 within the fiscal year are deemed to arise on the first business day of the following fiscal year for tax purposes. The Easterly Hedged Equity Fund incurred and elected to defer such capital losses of $8,808,297.
Permanent book and tax differences, primarily attributable to the book/tax basis treatment of net operating losses and distributions in excess, resulted in reclassifications for the Funds for the fiscal year ended August 31, 2023 as follows:
| Paid | | | | |
| In | | | Accumulated | |
| Capital | | | Earnings (Losses) | |
| $ | (921,573 | ) | | $ | 921,573 | |
| | (1,275,159 | ) | | | 1,275,159 | |
| 6. | UNDERLYING INVESTMENTS IN OTHER INVESTMENT COMPANIES |
Each underlying fund, including each exchange-traded fund (“ETF”), is subject to specific risks, depending on the nature of the underlying fund. These risks could include liquidity risk, sector risk, foreign and related currency risk, as well as risks associated with real estate investments and commodities. Investors in the Fund will indirectly bear fees and expenses charged by the underlying investment companies in which the Fund invests in addition to the Fund’s direct fees and expenses.
The performance of the Easterly Hedged Equity Fund will be directly affected by the performance of the SPDR S&P 500 ETF Trust. The Trust seeks to provide investment results that, before expenses, correspond generally to the price and yield performance of the S&P 500 Index. The financial statements of the SPDR S&P 500 ETF Trust, including the schedule of investments, can be found on the Securities and Exchange Commission’s (“SEC”) website www.sec.gov and should be read in conjunction with the Fund’s financial statements. As of August 31, 2023, the percentage of net assets invested in the SPDR S&P 500 ETF Trust was 91.9%.
| NOTES TO FINANCIAL STATEMENTS |
| Year Ended August 31, 2023 (Continued) |
| 7. | RECENT REGULATORY UPDATES |
On January 24, 2023, the SEC adopted rule and form amendments to require mutual funds and ETFs to transmit concise and visually engaging streamlined annual and semiannual reports to shareholders that highlight key information. Other information, including financial statements, will not appear in a streamlined shareholder report but must be available online, delivered free of charge upon request, and filed on a semiannual basis on Form N-CSR. The rule and form amendments have a compliance date of July 24, 2024. At this time, management is evaluating the impact of these amendments on the shareholder reports for the Funds.
Subsequent events after the date of the Statements of Assets and Liabilities have been evaluated through the date the financial statements were issued. Management has determined that no events or transactions occurred requiring adjustment or disclosure in the financial statements other than the following. Effective October 2, 2023, Easterly Securities, LLC replaced Ultimus Fund Distributors, LLC as the Funds’ distributor.
REPORT OF INDEPENDENT REGISTERED PUBLIC ACCOUNTING FIRM
To the Shareholders and Board of Trustees
of James Alpha Funds Trust d/b/a Easterly
Funds Trust
Opinion on the Financial Statements
We have audited the accompanying statements of assets and liabilities of Easterly Global Real Estate Fund, and Easterly Hedged Equity Fund, referred to as the (“Funds”) each a series of the James Alpha Funds Trust d/b/a Easterly Funds Trust, including the schedules of investments, as of August 31, 2023, the related statements of operations, the statement of changes in net assets for the two years in the period then ended and the financial highlights for each of the five years in the period then ended, and the related notes (collectively referred to as the “financial statements”). In our opinion, the financial statements present fairly, in all material respects, the financial position of the Funds as of August 31, 2023, the results of their operations for the year then ended, the changes in their net assets for the two years in the period then ended and the financial highlights for each of the five years in the period then ended, in conformity with accounting principles generally accepted in the United States of America.
Basis for Opinion
These financial statements are the responsibility of the Funds’ management. Our responsibility is to express an opinion on the Funds’ financial statements based on our audits. We are a public accounting firm registered with the Public Company Accounting Oversight Board (United States) (“PCAOB”) and are required to be independent with respect to the Funds in accordance with the U.S. federal securities laws and the applicable rules and regulations of the Securities and Exchange Commission and the PCAOB. We have served as the auditor of one or more of the funds in the Trust since 2011.
We conducted our audits in accordance with the standards of the PCAOB. Those standards require that we plan and perform the audits to obtain reasonable assurance about whether the financial statements are free of material misstatement, whether due to error or fraud. The Funds are not required to have, nor were we engaged to perform, an audit of the Funds’ internal control over financial reporting. As part of our audits we are required to obtain an understanding of internal control over financial reporting, but not for the purpose of expressing an opinion on the effectiveness of the Funds’ internal control over financial reporting. Accordingly, we express no such opinion.
Our audits included performing procedures to assess the risks of material misstatement of the financial statements, whether due to error or fraud, and performing procedures that respond to those risks. Such procedures included examining, on a test basis, evidence regarding the amounts and disclosures in the financial statements. Our audits also included evaluating the accounting principles used and significant estimates made by management, as well as evaluating the overall presentation of the financial statements. Our procedures included confirmation of securities owned as of August 31, 2023 by correspondence with the custodian and brokers; when replies were not received from brokers, we performed other auditing procedures. We believe that our audits provide a reasonable basis for our opinion.
TAIT, WELLER & BAKER LLP
Philadelphia, Pennsylvania
October 27, 2023
| SUPPLEMENTAL INFORMATION (Unaudited) |
| August 31, 2023 |
Shareholders of funds will pay ongoing expenses, such as advisory fees, distribution and services fees (12b-1 fees), and other fund expenses. The following examples are intended to help the shareholder understand the ongoing cost (in dollars) of investing in a fund and to compare these costs with the ongoing costs of investing in other mutual funds. Please note, the expenses shown in the tables are meant to highlight ongoing costs only and do not reflect any transactional costs, such as sales charges (loads), or contingent deferred sales charges (CDSCs) on redemptions.
This example is based on an investment of $1,000 invested at the beginning of the period and held for the six-month period from March 1, 2023, through August 31, 2023.
Actual Expenses: The first table provides information about actual account values and actual expenses. The shareholder may use the information in this line, together with the amount invested, to estimate the expenses that would be paid over the period. Simply divide account value by $1,000 (for example, an $8,600 account value divided by $1,000 = 8.6), then multiply the result by the number under the heading entitled “Expenses Paid” to estimate the expenses paid on the account during the period.
| | | Beginning Account | | | Ending Account | | | Expense Paid | | | Expense Ratio |
| | | Value - 3/1/2023 | | | Value - 8/31/2023 | | | 3/1/2023-8/31/2023* | | | [Annualized] |
| Actual Expenses: | | | | | | | | | | | |
| Easterly Global Real Estate Investments Fund - Class A | | $ | 1,000.00 | | | $ | 972.20 | | | $ | 7.09 | | | 1.43% |
| Easterly Global Real Estate Investments Fund - Class C | | $ | 1,000.00 | | | $ | 968.10 | | | $ | 10.80 | | | 2.18% |
| Easterly Global Real Estate Investments Fund - Class I | | $ | 1,000.00 | | | $ | 973.60 | | | $ | 5.17 | | | 1.04% |
| Easterly Global Real Estate Investments Fund - Class R6 | | $ | 1,000.00 | | | $ | 974.70 | | | $ | 4.68 | | | 0.94% |
| Easterly Hedged Equity Fund - Class A | | $ | 1,000.00 | | | $ | 1,068.50 | | | $ | 7.83 | | | 1.50% |
| Easterly Hedged Equity Fund - Class C | | $ | 1,000.00 | | | $ | 1,064.80 | | | $ | 11.73 | | | 2.25% |
| Easterly Hedged Equity Fund - Class I | | $ | 1,000.00 | | | $ | 1,070.30 | | | $ | 6.54 | | | 1.25% |
| Easterly Hedged Equity Fund - Class R6 | | $ | 1,000.00 | | | $ | 1,071.20 | | | $ | 5.16 | | | 0.99% |
Hypothetical Examples for Comparison Purposes: The second table below provides information about hypothetical account values and hypothetical expenses based on the fund’s actual expense ratio and an assumed rate of return of 5% per year before expenses, which is not the fund’s actual return. The hypothetical account values and expenses may not be used to estimate the actual ending account balance or expenses paid for the period. This information may be used to compare the ongoing costs of investing in the fund and other mutual funds. To do so, a shareholder would compare this 5% hypothetical example with the 5% hypothetical examples that appear in the shareholder reports of the other mutual funds.
| | | Beginning Account | | | Ending Account | | | Expense Paid | | | Expense Ratio |
| Hypothetical | | Value - 3/1/2023 | | | Value - 8/31/2023 | | | 3/1/2023-8/31/2023* | | | [Annualized] |
| [5% Return Before Expenses] | | | | | | | | | | | | | | |
| Easterly Global Real Estate Investments Fund - Class A | | $ | 1,000.00 | | | $ | 1,018.01 | | | $ | 7.26 | | | 1.43% |
| Easterly Global Real Estate Investments Fund - Class C | | $ | 1,000.00 | | | $ | 1,014.23 | | | $ | 11.05 | | | 2.18% |
| Easterly Global Real Estate Investments Fund - Class I | | $ | 1,000.00 | | | $ | 1,019.96 | | | $ | 5.30 | | | 1.04% |
| Easterly Global Real Estate Investments Fund - Class R6 | | $ | 1,000.00 | | | $ | 1,020.47 | | | $ | 4.79 | | | 0.94% |
| Easterly Hedged Equity Fund - Class A | | $ | 1,000.00 | | | $ | 1,017.63 | | | $ | 7.64 | | | 1.50% |
| Easterly Hedged Equity Fund - Class C | | $ | 1,000.00 | | | $ | 1,013.84 | | | $ | 11.44 | | | 2.25% |
| Easterly Hedged Equity Fund - Class I | | $ | 1,000.00 | | | $ | 1,018.89 | | | $ | 6.37 | | | 1.25% |
| Easterly Hedged Equity Fund - Class R6 | | $ | 1,000.00 | | | $ | 1,020.22 | | | $ | 5.04 | | | 0.99% |
| * | Expenses are equal to the Portfolio’s annualized expense ratio, multiplied by the average account value over the period, multiplied by 184/365 (to reflect the days in reporting period). |
| SUPPLEMENTAL INFORMATION (UNAUDITED) |
| August 31, 2023 |
LIQUIDITY RISK MANAGEMENT PROGRAM
The Funds have adopted and implemented a written liquidity risk management program as required by Rule 22e-4 (the “Liquidity Rule”) under the Investment Company Act. The program is reasonably designed to assess and manage each Fund’s liquidity risk, taking into consideration, among other factors, each respective Fund’s investment strategy and the liquidity of its portfolio investments during normal and reasonably foreseeable stressed conditions; its short and long-term cash flow projections; and its cash holdings and access to other funding sources.
During the fiscal period ended August 31, 2023, the Trust’s Liquidity Risk Management Program Committee (the “Committee”) reviewed the Funds’ investments and determined that the Funds held adequate levels of cash and highly liquid investments to meet shareholder redemption activities in accordance with applicable requirements. Accordingly, the Committee concluded that (i) the Funds’ liquidity risk management program is reasonably designed to prevent violations of the Liquidity Rule and (ii) the Funds’ liquidity risk management program has been effectively implemented.
| SUPPLEMENTAL INFORMATION (Unaudited) |
| August 31, 2023 |
TRUSTEES AND OFFICERS
The Trustees and executive officers of the Trust, and their principal occupations during the past five years, are set forth in the table below. Darrell Crate is an “interested person” of the Trust (as that term is defined in the 1940 Act) by virtue of their position as an officer of Easterly.
Name, Year of
Birth, and
Address | Position(s)
Held with
Trust | Term*/
Length
of
Time
Served | Principal
Occupation(s) During
Past 5 Years | Number
of
Funds in
Fund
Complex
Overseen | Other
Directorships
Held by Trustee During Past 5
Years |
| INTERESTED TRUSTEE: |
Darrell Crate,
Year of Birth:
1967
515 Madison
Avenue
24th Floor
New York, NY
10022 | President and Chairperson of the Board | Since 2021 | Chief Executive Officer of Easterly Funds LLC (2020 – Present) and Managing Principal of Easterly Asset Management LP (2016 – Present); Managing Partner of Easterly Capital LLC (2015 – Present) | 5 | Chairman of the Board and Director of Easterly Government Properties Inc. (2015 – Present); Chairman of the Board and Director of Easterly Acquisition Corp. (2015 to 2018) |
| INDEPENDENT TRUSTEES: |
Neil Medugno,
Year of Birth:
1957
515 Madison
Avenue
24th Floor
New York, NY
10022 | Trustee | Since 2021 | Retired; Partner, Wellington Management Company LLP, Chief Financial Officer, Wellington Funds Group (investment management) (1994–2017) | 5 | Trustee of Six Circles Trust (2018 – Present) |
A. Clayton
Spencer,
Year of Birth:
1954
515 Madison
Avenue
24th Floor
New York, NY
10022 | Trustee | Since 2023 | President of Bates College (2012 – present). | 5 | None |
| OFFICERS: |
Michael
Montague,
Year of Birth:
1975
515 Madison
Avenue
24th Floor
New York, NY
10022 | Treasurer | Since 2021 | Chief Operating Officer of Easterly Funds LLC and James Alpha Management, LLC | Not Applicable | Not Applicable |
SUPPLEMENTAL INFORMATION (Unaudited) (Continued)
August 31, 2023
| OFFICERS (Continued): |
Emile
Molineaux,
Year of Birth:
1962
4221 North
203rd Street,
Ste. 100
Elkhorn, NE
68022 | Chief Compliance Officer | Since 2021 | Senior Compliance Officer (2011 –Present) Northern Lights Compliance Services, LLC | Not Applicable | Not Applicable |
Chad
Bitterman,
Year of Birth:
1972
4221 North
203rd Street,
Ste. 100
Elkhorn, NE
68022 | Anti-Money Laundering Compliance Officer | Since 2021 | Compliance Officer (2010 – Present) Northern Lights Compliance Services, LLC | Not Applicable | Not Applicable |
Amaris Sahota,
Year of Birth:
1992
515 Madison
Avenue
24th Floor
New York, NY
10022 | Secretary | Since 2021 | Chief Operating Officer, Easterly Management Operations LLC ( 2021 – Present); Senior Management Consultant, The Poirier Group (2018 – 2021); Investment Consultant, Sun Life Financial (2015 – 2018) | Not Applicable | Not Applicable |
Ken Juster,
Year of Birth:
1976
515 Madison
Avenue
24th Floor
New York, NY
10022 | Chief Legal Officer | Since 2022 | General Counsel of Easterly Asset Management LP (2022 – Present); Partner, Cooley LLP (2018 – 2022); Partner, White & Case LLP (2017 – 2018) | Not Applicable | Not Applicable |
Erik Naviloff,
Year of Birth:
1968
4221 North
203rd Street,
Ste. 100
Elkhorn, NE
68022 | Assistant Treasurer | Since 2021 | Vice President, Ultimus Fund Solutions, LLC (2011 – present) | Not Applicable | Not Applicable |
Timothy
Burdick,
Year of Birth:
1986
4221 North
203rd Street,
Ste. 100
Elkhorn, NE
68022 | Assistant Secretary | Since 2021 | Vice President, Ultimus Fund Solutions, LLC (2022 – present); Assistant Vice President, Ultimus Fund Solutions, LLC (2019 –2022); Senior Program Compliance Manager, CJ Affiliate (2016 – 2019) | Not Applicable | Not Applicable |
| * | Each Trustee will serve an indefinite term until they resign or retire and/or their successor, if any, is duly elected and qualified. Officers of the Trust serve at the pleasure of the Board. |
The Fund’s Statement of Additional Information includes additional information about the Trustees and is available free of charge, upon request, by calling toll-free at 1-833-999-2636.
PRIVACY NOTICE
JAMES ALPHA FUNDS TRUST
March 2021
| FACTS | WHAT DOES JAMES ALPHA FUNDS TRUST DO WITH YOUR PERSONAL INFORMATION? |
| | |
| Why? | Financial companies choose how they share your personal information. Federal law gives consumers the right to limit some, but not all sharing. Federal law also requires us to tell you how we collect, share, and protect your personal information. Please read this notice carefully to understand what we do. |
| | |
| What? | The types of personal information we collect and share depends on the product or service that you have with us. This information can include: ● Social Security number and wire transfer instructions ● account transactions and transaction history ● investment experience and purchase history When you are no longer our customer, we continue to share your information as described in this notice. |
| | |
| How? | All financial companies need to share customers’ personal information to run their everyday business. In the section below, we list the reasons financial companies can share their customers’ personal information; the reasons James Alpha Funds Trust chooses to share; and whether you can limit this sharing. |
| | |
Reasons we can share your personal
information: | Does James Alpha Funds Trust
share information? | Can you limit
this sharing? |
For our everyday business purposes - such as to process your transactions, maintain your account(s), respond to court orders and legal investigations, or report to credit bureaus. | YES | NO |
For our marketing purposes - to offer our products and services to you. | YES | YES |
| For joint marketing with other financial companies. | NO | We don’t share |
For our affiliates’ everyday business purposes - information about your transactions and records. | NO | We don’t share |
For our affiliates’ everyday business purposes - information about your credit worthiness. | NO | We don’t share |
| For nonaffiliates to market to you | NO | We don’t share |
| | | |
| QUESTIONS? | Call (888) 814-8180 | | |
| What we do: |
How does James Alpha Funds Trust
protect my personal information? | To protect your personal information from unauthorized access and use, we use security measures that comply with federal law. These measures include computer safeguards and secured files and buildings. Our service providers are held accountable for adhering to strict policies and procedures to prevent any misuse of your nonpublic personal information. |
How does James Alpha Funds Trust
collect my personal information? | We collect your personal information, for example, when you ● open an account or deposit money ● direct us to buy securities or direct us to sell your securities ● seek advice about your investments We also collect your personal information from others, such as credit bureaus, affiliates, or other companies. |
| Why can’t I limit all sharing? | Federal law gives you the right to limit only: ● sharing for affiliates’ everyday business purposes – information about your creditworthiness. ● affiliates from using your information to market to you. ● sharing for nonaffiliates to market to you. State laws and individual companies may give you additional rights to limit sharing. |
| |
| Definitions |
| Affiliates | Companies related by common ownership or control. They can be financial and nonfinancial companies. ● James Alpha Funds Trust does not share with our affiliates. |
| Nonaffiliates | Companies not related by common ownership or control. They can be financial and nonfinancial companies. ● James Alpha Funds Trust does not share with nonaffiliates so they can market to you. |
| Joint marketing | A formal agreement between nonaffiliated financial companies that together market financial products or services to you. ● James Alpha Funds Trust doesn’t jointly market. |
How to Obtain Proxy Voting Information
Information regarding how the Portfolios voted proxies relating to portfolio securities during the most recent twelve month period ended June 30 as well as a description of the policies and procedures that the Portfolios use to determine how to vote proxies is available without charge, upon request, by calling 1-833-999-2636 or by referring to the Securities and Exchange Commission’s (“SEC”) website at http://www.sec.gov.
How to Obtain 1st and 3rd Fiscal Quarter Portfolio Holdings
Funds file a complete schedule of portfolio holdings with the Securities and Exchange Commission (the “SEC”) for the first and third quarters of each fiscal year as an exhibit to its reports on Form N-PORT, within sixty days after the end of the period. Form N-PORT reports are available at the SEC’s website at www.sec.gov.
Easterly Funds-AR23
Item 2. Code of Ethics.
(a) As of the end of the period covered by this report, the registrant has adopted a code of ethics that applies to the registrant's principal executive officer, principal financial officer, principal accounting officer or controller, or persons performing similar functions, regardless of whether these individuals are employed by the registrant or a third party.
(b) For purposes of this item, “code of ethics” means written standards that are reasonably designed to deter wrongdoing and to promote:
| (1) | Honest and ethical conduct, including the ethical handling of actual or apparent conflicts of interest between personal and professional relationships; |
| (2) | Full, fair, accurate, timely, and understandable disclosure in reports and documents that a registrant files with, or submits to, the Commission and in other public communications made by the registrant; |
(3) Compliance with applicable governmental laws, rules, and regulations;
| (4) | The prompt internal reporting of violations of the code to an appropriate person or persons identified in the code; and |
(5) Accountability for adherence to the code.
(c) Amendments: During the period covered by the report, there have not been any amendments to the provisions of the code of ethics.
(d) Waivers: During the period covered by the report, the registrant has not granted any express or implicit waivers from the provisions of the code of ethics.
Item 3. Audit Committee Financial Expert.
The Registrant’s board of trustees has determined that Neil Medugno is an audit committee financial expert, as defined in Item 3 of Form N-CSR. Mr. Medugno is independent for purposes of this Item 3.
Item 4. Principal Accountant Fees and Services.
| (a) Audit Fees | | 2022 | | 2023 |
| | | | | | |
| Easterly Global Real Estate Fund | | $ | 38,500 | | | $ | 38,500 |
| Easterly Hedged Equity Fund | | $ | 16,500 | | | $ | 17,000 |
| | | | | | | | |
| | | | | | | | |
| (b) Audit-Related Fees | | | 2022 | | | | 2023 |
| | | | | | | | |
| Easterly Global Real Estate Fund | | | None | | | | None |
| Easterly Hedged Equity Fund | | | None | | | | None |
| | | | | | | | |
| | | | | | | | |
| (c) Tax Fees | | | 2022 | | | | 2023 |
| | | | | | | | |
| Easterly Global Real Estate Fund | | $ | 3,500 | | | $ | 3,500 |
| Easterly Hedged Equity Fund | | $ | 2,500 | | | $ | 2,500 |
Preparation of Federal & State income tax returns, assistance with calculation of required income, capital gain and excise distributions and preparation of Federal excise tax returns.
| (d) All Other Fees | | | 2022 | | | | 2023 | |
| | | | | | | | | |
| Easterly Global Real Estate Fund | | | None | | | | None | |
| Easterly Hedged Equity Fund | | | None | | | | None | |
(e) (1) Audit Committee’s Pre-Approval Policies
The registrant’s Audit Committee is required to pre-approve all audit services and, when appropriate, any non-audit services (including audit-related, tax and all other services) to the registrant. The registrant’s Audit Committee also is required to pre-approve, when appropriate, any non-audit services (including audit-related, tax and all other services) to its adviser, or any entity controlling, controlled by or under common control with the adviser that provides ongoing services to the registrant, to the extent that the services may be determined to have an impact on the operations or financial reporting of the registrant. Services are reviewed on an engagement by engagement basis by the Audit Committee.
(2) Percentages of Services Approved by the Audit Committee
| Easterly Global Real Estate Fund | | 2022 | | 2023 |
| Audit-Related Fees: | | | 0.00 | % | | | 0.00 | % |
| Tax Fees: | | | 0.00 | % | | | 0.00 | % |
| All Other Fees: | | | 0.00 | % | | | 0.00 | % |
| |
| Easterly Hedged Equity Fund | | 2022 | | 2023 |
| Audit-Related Fees: | | | 0.00 | % | | | 0.00 | % |
| Tax Fees: | | | 0.00 | % | | | 0.00 | % |
| All Other Fees: | | | 0.00 | % | | | 0.00 | % |
(f) During the audit of registrant's financial statements for the most recent fiscal year, less than 50 percent of the hours expended on the principal accountant's engagement were attributed to work performed by persons other than the principal accountant's full-time, permanent employees.
(g) The aggregate non-audit fees billed by the registrant's accountant for services rendered to the registrant, and rendered to the registrant's investment adviser (not including any sub-adviser whose role is primarily portfolio management and is subcontracted with or overseen by another investment adviser), and any entity controlling, controlled by, or under common control with the adviser that provides ongoing services to the registrant:
| | | 2022 | | 2023 |
| Easterly Global Real Estate Fund | | | $ | 3,500 | | | $ | 3,500 |
| Easterly Hedged Equity Fund | | | $ | 2,500 | | | $ | 2,500 |
(h) The registrant's audit committee has considered whether the provision of non-audit services to the registrant's investment adviser (not including any sub-adviser whose role is primarily portfolio management and is subcontracted with or overseen by another investment adviser), and any entity controlling, controlled by, or under common control with the investment adviser that provides ongoing services to the registrant, that were not pre-approved pursuant to paragraph (c)(7)(ii) of Rule 2-01 of Regulation S-X, is compatible with maintaining the principal accountant's independence.
(i) Not applicable
(j) Not applicable
Item 5. Audit Committee of Listed Companies. Not applicable to open-end investment companies.
Item 6. Schedule of Investments. See Item 1.
Item 7. Disclosure of Proxy Voting Policies and Procedures for Closed-End Funds. Not applicable to
open-end investment companies.
Item 8. Portfolio Managers of Closed-End Management Investment Companies. Not applicable to open-end investment companies.
Item 9. Purchases of Equity Securities by Closed-End Management Investment Company and Affiliated Purchasers. Not applicable to open-end investment companies.
Item 10. Submission of Matters to a Vote of Security Holders. None.
Item 11. Controls and Procedures.
(a) Based on an evaluation of the Registrant’s disclosure controls and procedures as of a date within 90 days of filing date of this Form N-CSR, the principal executive officer and principal financial officer of the Registrant have concluded that the disclosure controls and procedures of the Registrant are reasonably designed to ensure that the information required in filings on Form N-CSR is recorded, processed, summarized, and reported by the filing date, including that information required to be disclosed is accumulated and communicated to the Registrant’s management, including the Registrant’s principal executive officer and principal financial officer, as appropriate to allow timely decisions regarding required disclosure.
(b) There were no significant changes in the Registrant’s internal control over financial reporting that occurred during the period covered by this report that have materially affected, or are reasonably likely to materially affect, the Registrant’s internal control over financial reporting.
Item 12. Disclosure of Securities Lending Activities for Closed-Ended Management Investment Companies.
Not applicable
Item 13. Exhibits.
(a)(1) Code of Ethics filed herewith.
(a)(2) Certification(s) required by Section 302 of the Sarbanes-Oxley Act of 2002 (and Item 11(a)(2) of Form N-CSR) are filed herewith.
(a)(3) Not applicable.
(b) Certification(s) required by Section 906 of the Sarbanes-Oxley Act of 2002 (and Item 11(b) of Form N-CSR) are filed herewith.
SIGNATURES
Pursuant to the requirements of the Securities Exchange Act of 1934 and the Investment Company Act of 1940, the registrant has duly caused this report to be signed on its behalf by the undersigned, thereunto duly authorized.
(Registrant) James Alpha Funds Trust
By (Signature and Title)
* /s/ Darrell Crate
Darrell Crate, President and Chief Executive Officer
Date 11/7/23
Pursuant to the requirements of the Securities Exchange Act of 1934 and the Investment Company Act of 1940, this report has been signed below by the following persons on behalf of the registrant and in the capacities and on the dates indicated.
By (Signature and Title)
* /s/ Michael Montague
Michael Montague, Treasurer and Principal Financial Officer
Date 11/7/23
By (Signature and Title)
* /s/ Darrell Crate
Darrell Crate, President and Chief Executive Officer
Date 11/7/23
* Print the name and title of each signing officer under his or her signature.