UNITED STATES
SECURITIES AND EXCHANGE COMMISSION
Washington, D.C. 20549
FORM N-CSR
CERTIFIED SHAREHOLDER REPORT OF REGISTERED
MANAGEMENT INVESTMENT COMPANIES
Investment Company Act file number (811-23645)
NEOS ETF Trust
(Exact name of registrant as specified in charter)
13 Riverside Avenue
Westport, CT 06880
(Address of principal executive offices) (Zip code)
Garrett Paolella, President
13 Riverside Avenue
Westport, CT 06880
(Name and address of agent for service)
(203) 298-7300
Registrant’s telephone number, including area code
Date of fiscal year end: May 31
Date of reporting period: May 31, 2024
Item 1. Reports to Stockholders.
(a) A copy of the report transmitted to shareholders pursuant to Rule 30e-1 under the Investment Company Act of 1940, as amended (“Act”), is filed herewith.
| | |
| Kurv Yield Premium Strategy Amazon (AMZN) ETF | |
| AMZP (Principal U.S. Listing Exchange: CBOE) |
| Annual Shareholder Report | May 31, 2024 |
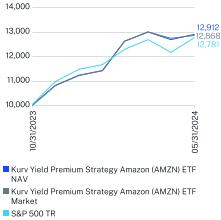
This annual shareholder report contains important information about the Kurv Yield Premium Strategy Amazon (AMZN) ETF for the period since inception of October 31, 2023, to May 31, 2024. You can find additional information about the Fund at https://www.kurvinvest.com/etf/amzp. You can also request this information by contacting us at (833) 955-5878.
What were the Fund costs for the past year?
(based on a hypothetical $10,000 investment)
| | |
Fund Name | Costs of a $10,000 investment | Costs paid as a percentage of a $10,000 investment |
| Kurv Yield Premium Strategy Amazon (AMZN) ETF | $66* | 0.99% |
| * | Amount shown reflects the expenses of the Fund from inception date through May 31, 2024. Expenses would be higher if the Fund had been in operations for the full year. |
How did the Fund perform last year and what affected its performance?
For the period since inception of October 31, 2023, to May 31, 2024, the Fund performed well with stable distributions as well as share price improvement. Option premiums received from covered call (short call position) contributed to total return.
WHAT FACTORS INFLUENCED PERFORMANCE
- Performance of Amazon stock
- Amount of premiums received from writing out-of-the-money call options
Long exposure to Amazon stock contributed to performance as Amazon stock price rose during the period. Income generated from the covered call positions contributed to preformance.
The Fund maintained the long exposure to Amazon stock via synthetic long positions (long call options and short put options both with the same strike). The Fund wrote out-of-the-money call options, receiving premiums to generate income while allowing some upside price appreciation potential. The remaining cash was invested in U.S. T-Bills to generate additional income.
For the period ended May 31, 2024, the Fund’s performance was 28.68% (Market) and 29.12% (NAV).
| |
Top Contributors |
↑ | Long exposure to Amazon stock |
↑ | Premiums received from writing out-of-the money call options |
How did the Fund perform?*,,†
The $10,000 chart reflects a hypothetical $10,000 investment. The chart uses total return NAV performance and assumes reinvestment of dividends and capital gains. Fund expenses, management fees were deducted.
CUMULATIVE PERFORMANCE ($)
CUMULATIVE TOTAL RETURN (%)
| |
| | Since Inception
(10/31/2023) |
Kurv Yield Premium Strategy Amazon (AMZN) ETF NAV | 29.12 |
Kurv Yield Premium Strategy Amazon (AMZN) ETF Market | 28.68 |
S&P 500 TR | 27.81 |
Visit https://www.kurvinvest.com/etf/amzp for more recent performance information.
| * | The Fund’s past performance is not a good predictor of how the Fund will perform in the future. The graph and table do not reflect the deduction of taxes that a shareholder would pay on Fund distributions or redemption of Fund shares. |
| † | The Fund’s Cumulative Total Returns are based on net asset values calculated for shareholder transactions which are not reflective of adjustments required pursuant to GAAP. Accordingly, differences may exist between this data and similar information reported in the financial statements. |
| Kurv Yield Premium Strategy Amazon (AMZN) ETF | PAGE 1 | TSR_AR_78433H733 |
Householding
To reduce Fund expenses, only one copy of most shareholder documents may be mailed to shareholders with multiple accounts at the same address (Householding). If you would prefer that your Kurv Investment Management LLC documents not be householded, please contact Kurv Investment Management LLC at (833) 955-5878, or contact your financial intermediary. Your instructions will typically be effective within 30 days of receipt by Kurv Investment Management LLC or your financial intermediary.
Key Fund Statistics (as of May 31, 2024)
| |
Net Assets | $1,188,981 |
Number of Holdings | 7 |
| |
Net Advisory Fee | $4,419 |
Portfolio Turnover | 0% |
Visit https://www.kurvinvest.com/etf/amzp for more recent performance information.
What did the Fund invest in? (as of May 31, 2024)
| |
Issuer Breakdown | (%) |
United States Treasury Bill | 101.7% |
Money Market Funds | 2.1% |
Amazon.com Inc. | -5.3% |
| |
Security Type | (%) |
Short-Term Investments | 103.8% |
Purchased Options | 1.9% |
Options Written | -7.2% |
Cash & Other | 1.5% |
For additional information about the Fund, including its prospectus, financial infromation, holdings, proxy information and other important materials, scan the QR code or visit https://www.kurvinvest.com/etf/amzp.
Distributor: Foreside Fund Services, LLC.
| Kurv Yield Premium Strategy Amazon (AMZN) ETF | PAGE 2 | TSR_AR_78433H733 |
129121286812781
| | |
| Kurv Yield Premium Strategy Apple (AAPL) ETF | |
| AAPY (Principal U.S. Listing Exchange: CBOE) |
| Annual Shareholder Report | May 31, 2024 |
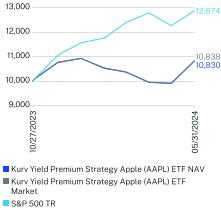
This annual shareholder report contains important information about the Kurv Yield Premium Strategy Apple (AAPL) ETF for the period since inception of October 27, 2023, to May 31, 2024. You can find additional information about the Fund at https://www.kurvinvest.com/etf/aapy. You can also request this information by contacting us at (833) 955-5878.
What were the Fund costs for the past year?
(based on a hypothetical $10,000 investment)
| | |
Fund Name | Costs of a $10,000 investment | Costs paid as a percentage of a $10,000 investment |
| Kurv Yield Premium Strategy Apple (AAPL) ETF | $61* | 0.99% |
| * | Amount shown reflects the expenses of the Fund from inception date through May 31, 2024. Expenses would be higher if the Fund had been in operations for the full year. |
How did the Fund perform last year and what affected its performance?
For the period since inception of October 27, 2023, to May 31, 2024, the Fund performed well with stable distributions as well as share price improvement. Option premiums received from covered calls (short call position) contributed to total return.
WHAT FACTORS INFLUENCED PERFORMANCE
- Performance of Apple stock
- The amount of premiums received from writing out-of-the-money call options
Long exposure to Apple stock contributed to performance as Apple stock price rose during the period. Income generated from the covered call positions contributed to performance.
The Fund maintained long exposure to Apple stock via synthetic long positions (long call options and short put options both with the same strike). The Fund wrote out-of-the-money call options, receiving premiums to generate income while allowing some upside price appreciation potential. The remaining cash was invested in U.S. T-Bills to generate additional income.
For the period ended May 31, 2024, the Fund’s performance was 8.38% (Market) and 8.30% (NAV).
| |
Top Contributors |
↑ | Long exposure to Apple stock |
↑ | Premiums received from writing out-of-the money call options |
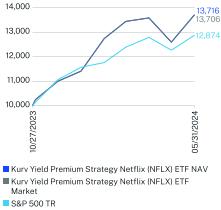
How did the Fund perform?*,,†
The $10,000 chart reflects a hypothetical $10,000 investment. The chart uses total return NAV performance and assumes reinvestment of dividends and capital gains. Fund expenses, management fees were deducted.
CUMULATIVE PERFORMANCE ($)
CUMULATIVE TOTAL RETURN (%)
| |
| | Since Inception
(10/27/2023) |
Kurv Yield Premium Strategy Apple (AAPL) ETF NAV | 8.30 |
Kurv Yield Premium Strategy Apple (AAPL) ETF Market | 8.38 |
S&P 500 TR | 28.74 |
Visit https://www.kurvinvest.com/etf/aapy for more recent performance information.
| * | The Fund’s past performance is not a good predictor of how the Fund will perform in the future. The graph and table do not reflect the deduction of taxes that a shareholder would pay on Fund distributions or redemption of Fund shares. |
| † | The Fund’s Cumulative Total Returns are based on net asset values calculated for shareholder transactions which are not reflective of adjustments required pursuant to GAAP. Accordingly, differences may exist between this data and similar information reported in the financial statements. |
| Kurv Yield Premium Strategy Apple (AAPL) ETF | PAGE 1 | TSR_AR_78433H725 |
Householding
To reduce Fund expenses, only one copy of most shareholder documents may be mailed to shareholders with multiple accounts at the same address (Householding). If you would prefer that your Kurv Investment Management LLC documents not be householded, please contact Kurv Investment Management LLC at (833) 955-5878, or contact your financial intermediary. Your instructions will typically be effective within 30 days of receipt by Kurv Investment Management LLC or your financial intermediary.
Key Fund Statistics (as of May 31, 2024)
| |
Net Assets | $762,400 |
Number of Holdings | 6 |
| |
Net Advisory Fee | $3,243 |
Portfolio Turnover | 0% |
Visit https://www.kurvinvest.com/etf/aapy for more recent performance information.
What did the Fund invest in? (as of May 31, 2024)
| |
Issuer Breakdown | (%) |
United States Treasury Bill | 88.9% |
Money Market Funds | 2.9% |
Apple, Inc. | 8.7% |
| |
Security Type | (%) |
Short-Term Investments | 91.8% |
Purchased Options | 10.0% |
Options Written | -1.3% |
Cash & Other | -0.5% |
For additional information about the Fund, including its prospectus, financial infromation, holdings, proxy information and other important materials, scan the QR code or visit https://www.kurvinvest.com/etf/aapy.
Distributor: Foreside Fund Services, LLC.
| Kurv Yield Premium Strategy Apple (AAPL) ETF | PAGE 2 | TSR_AR_78433H725 |
108301083812874
| | |
| Kurv Yield Premium Strategy Google (GOOGL) ETF | |
| GOOP (Principal U.S. Listing Exchange: CBOE) |
| Annual Shareholder Report | May 31, 2024 |
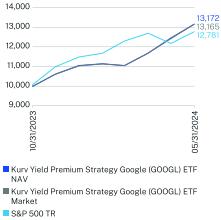
This annual shareholder report contains important information about the Kurv Yield Premium Strategy Google (GOOGL) ETF for the period since inception of October 31, 2023, to May 31, 2024. You can find additional information about the Fund at https://www.kurvinvest.com/etf/goop. You can also request this information by contacting us at (833) 955-5878.
What were the Fund costs for the past year?
(based on a hypothetical $10,000 investment)
| | |
Fund Name | Costs of a $10,000 investment | Costs paid as a percentage of a $10,000 investment |
| Kurv Yield Premium Strategy Google (GOOGL) ETF | $67* | 0.99% |
| * | Amount shown reflects the expenses of the Fund from inception date through May 31, 2024. Expenses would be higher if the Fund had been in operations for the full year. |
How did the Fund perform last year and what affected its performance?
For the period since inception of October 31, 2023, to May 31, 2024, the Fund performed well with stable distributions as well as share price improvement. Option premiums received from covered calls (short call position) contributed to total return.
WHAT FACTORS INFLUENCED PERFORMANCE
- Performance of Google stock
- Amount of premium received from writing out-of–the-money call options
Long exposure to Google stock contributed to performance as Google stock price rose during the period. Income generated from the covered call positions contributed to performance.
The Fund maintained long exposure to Google stock via synthetic long positions (long call options and short put options both with the same strike). The Fund wrote out-of-the-money call options, receiving premiums to generate income while allowing some upside price appreciation potential. The remaining cash was invested in U.S. T-Bills to generate additional income.
For the period ended May 31, 2024, the Fund’s performance was 31.65% (Market) and 31.72% (NAV).
| |
Top Contributors |
↑ | Long exposure to Google stock |
↑ | Premiums received from writing out-of-the money call options |
How did the Fund perform?*,,†
The $10,000 chart reflects a hypothetical $10,000 investment. The chart uses total return NAV performance and assumes reinvestment of dividends and capital gains. Fund expenses, management fees were deducted.
CUMULATIVE PERFORMANCE ($)
CUMULATIVE TOTAL RETURN (%)
| |
| | Since Inception
(10/31/2023) |
Kurv Yield Premium Strategy Google (GOOGL) ETF NAV | 31.72 |
Kurv Yield Premium Strategy Google (GOOGL) ETF Market | 31.65 |
S&P 500 TR | 27.81 |
Visit https://www.kurvinvest.com/etf/goop for more recent performance information.
| * | The Fund’s past performance is not a good predictor of how the Fund will perform in the future. The graph and table do not reflect the deduction of taxes that a shareholder would pay on Fund distributions or redemption of Fund shares. |
| † | The Fund’s Cumulative Total Returns are based on net asset values calculated for shareholder transactions which are not reflective of adjustments required pursuant to GAAP. Accordingly, differences may exist between this data and similar information reported in the financial statements. |
| Kurv Yield Premium Strategy Google (GOOGL) ETF | PAGE 1 | TSR_AR_78433H717 |
Householding
To reduce Fund expenses, only one copy of most shareholder documents may be mailed to shareholders with multiple accounts at the same address (Householding). If you would prefer that your Kurv Investment Management LLC documents not be householded, please contact Kurv Investment Management LLC at (833) 955-5878, or contact your financial intermediary. Your instructions will typically be effective within 30 days of receipt by Kurv Investment Management LLC or your financial intermediary.
Key Fund Statistics (as of May 31, 2024)
| |
Net Assets | $1,535,777 |
Number of Holdings | 6 |
| |
Net Advisory Fee | $3,716 |
Portfolio Turnover | 0% |
Visit https://www.kurvinvest.com/etf/goop for more recent performance information.
What did the Fund invest in? (as of May 31, 2024)
| |
Issuer Breakdown | (%) |
United States Treasury Bill | 87.9% |
Money Market Funds | 1.9% |
Alphabet, Inc. | 9.7% |
| |
Security Type | (%) |
Short-Term Investments | 89.8% |
Purchased Options | 11.2% |
Options Written | -1.5% |
Cash & Other | 0.5% |
For additional information about the Fund, including its prospectus, financial infromation, holdings, proxy information and other important materials, scan the QR code or visit https://www.kurvinvest.com/etf/goop.
Distributor: Foreside Fund Services, LLC.
| Kurv Yield Premium Strategy Google (GOOGL) ETF | PAGE 2 | TSR_AR_78433H717 |
131721316512781
| | |
| Kurv Yield Premium Strategy Microsoft (MSFT) ETF | |
| MSFY (Principal U.S. Listing Exchange: CBOE) |
| Annual Shareholder Report | May 31, 2024 |
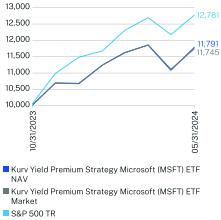
This annual shareholder report contains important information about the Kurv Yield Premium Strategy Microsoft (MSFT) ETF for the period since inception of October 31, 2023, to May 31, 2024. You can find additional information about the Fund at https://www.kurvinvest.com/etf/msft. You can also request this information by contacting us at (833) 955-5878.
What were the Fund costs for the past year?
(based on a hypothetical $10,000 investment)
| | |
Fund Name | Costs of a $10,000 investment | Costs paid as a percentage of a $10,000 investment |
| Kurv Yield Premium Strategy Microsoft (MSFT) ETF | $63* | 0.99% |
| * | Amount shown reflects the expenses of the Fund from inception date through May 31, 2024. Expenses would be higher if the Fund had been in operations for the full year. |
How did the Fund perform last year and what affected its performance?
For the period since inception of October 31, 2023, to May 31, 2024, the Fund performed well with stable distributions as well as share price improvement. Option premiums received from covered calls (short call position) contributed to total return.
WHAT FACTORS INFLUENCED PERFORMANCE
- Performance of the Microsoft stock
- Amount of premium received from writing out-of–the-money call options
Long exposure to Microsoft stock contributed performance as Microsoft stock price rose during the period. Income generated from covered call positions contributed to performance.
The Fund maintained the long exposure to Microsoft stock via synthetic long positions (long call options and short put options both with the same strike). The Fund wrote out-of-the-money call options, receiving premiums to generate income while allowing some upside price appreciation potential. The remaining cash was invested in U.S. T-Bills to generate additional income.
For the period ended May 31, 2024, the Fund’s performance was 17.45% (Market) and 17.91% (NAV).
| |
Top Contributors |
↑ | Long exposure to Microsoft stock |
↑ | Premiums received from writing out-of-the money call options |
How did the Fund perform?*,,†
The $10,000 chart reflects a hypothetical $10,000 investment. The chart uses total return NAV performance and assumes reinvestment of dividends and capital gains. Fund expenses, management fees were deducted.
CUMULATIVE PERFORMANCE ($)
CUMULATIVE TOTAL RETURN (%)
| |
| | Since Inception
(10/31/2023) |
Kurv Yield Premium Strategy Microsoft (MSFT) ETF NAV | 17.91 |
Kurv Yield Premium Strategy Microsoft (MSFT) ETF Market | 17.45 |
S&P 500 TR | 27.81 |
Visit https://www.kurvinvest.com/etf/msft for more recent performance information.
| * | The Fund’s past performance is not a good predictor of how the Fund will perform in the future. The graph and table do not reflect the deduction of taxes that a shareholder would pay on Fund distributions or redemption of Fund shares. |
| † | The Fund’s Cumulative Total Returns are based on net asset values calculated for shareholder transactions which are not reflective of adjustments required pursuant to GAAP. Accordingly, differences may exist between this data and similar information reported in the financial statements. |
| Kurv Yield Premium Strategy Microsoft (MSFT) ETF | PAGE 1 | TSR_AR_78433H782 |
Householding
To reduce Fund expenses, only one copy of most shareholder documents may be mailed to shareholders with multiple accounts at the same address (Householding). If you would prefer that your Kurv Investment Management LLC documents not be householded, please contact Kurv Investment Management LLC at (833) 955-5878, or contact your financial intermediary. Your instructions will typically be effective within 30 days of receipt by Kurv Investment Management LLC or your financial intermediary.
Key Fund Statistics (as of May 31, 2024)
| |
Net Assets | $1,102,140 |
Number of Holdings | 4 |
| |
Net Advisory Fee | $3,953 |
Portfolio Turnover | 0% |
Visit https://www.kurvinvest.com/etf/msft for more recent performance information.
What did the Fund invest in? (as of May 31, 2024)
| |
Issuer Breakdown | (%) |
United States Treasury Bill | 100.7% |
Money Market Funds | 2.7% |
Microsoft Corp. | -4.2% |
| |
Security Type | (%) |
Short-Term Investments | 103.4% |
Options Written | -4.2% |
Cash & Other | 0.8% |
For additional information about the Fund, including its prospectus, financial infromation, holdings, proxy information and other important materials, scan the QR code or visit https://www.kurvinvest.com/etf/msft.
Distributor: Foreside Fund Services, LLC.
| Kurv Yield Premium Strategy Microsoft (MSFT) ETF | PAGE 2 | TSR_AR_78433H782 |
117911174512781
| | |
| Kurv Yield Premium Strategy Netflix (NFLX) ETF | |
| NFLP (Principal U.S. Listing Exchange: CBOE) |
| Annual Shareholder Report | May 31, 2024 |
This annual shareholder report contains important information about the Kurv Yield Premium Strategy Netflix (NFLX) ETF for the period since inception of October 27, 2023, to May 31, 2024. You can find additional information about the Fund at https://www.kurvinvest.com/etf/nflp. You can also request this information by contacting us at (833) 955-5878.
What were the Fund costs for the past year?
(based on a hypothetical $10,000 investment)
| | |
Fund Name | Costs of a $10,000 investment | Costs paid as a percentage of a $10,000 investment |
| Kurv Yield Premium Strategy Netflix (NFLX) ETF | $70* | 0.99% |
| * | Amount shown reflects the expenses of the Fund from inception date through May 31, 2024. Expenses would be higher if the Fund had been in operations for the full year. |
How did the Fund perform last year and what affected its performance?
For the period since inception of October 27, 2023, to May 31, 2024, the Fund performed well with stable distributions as well as share price improvement. Option premiums received from covered calls (short call position) contributed to total return.
WHAT FACTORS INFLUENCED PERFORMANCE
- Performance of Netflix stock
- Amount of premium received from writing out-of-the-money call option
Long exposure to Netflix stock contributed to performance as Netflix stock price rose during the period. Income generated from covered call positions contributed to performance.
The Fund maintained long exposure to Netflix stock via synthetic long positions (long call options and short put options both with the same strike). The Fund wrote out-of-the-money call options, receiving premiums to generate income while allowing some upside price appreciation potential. The remaining cash was invested in U.S. T-Bills to generate additional income.
For the period ended May 31, 2024, the Fund’s performance was 37.06% (Market) and 37.16% (NAV).
| |
Top Contributors |
↑ | Long exposure to Netflix stock |
↑ | Premiums received from writing out-of-the money call options |
How did the Fund perform?*,,†
The $10,000 chart reflects a hypothetical $10,000 investment. The chart uses total return NAV performance and assumes reinvestment of dividends and capital gains. Fund expenses, management fees were deducted.
CUMULATIVE PERFORMANCE ($)
CUMULATIVE TOTAL RETURN (%)
| |
| | Since Inception
(10/27/2023) |
Kurv Yield Premium Strategy Netflix (NFLX) ETF NAV | 37.16 |
Kurv Yield Premium Strategy Netflix (NFLX) ETF Market | 37.06 |
S&P 500 TR | 28.74 |
Visit https://www.kurvinvest.com/etf/nflp for more recent performance information.
| * | The Fund’s past performance is not a good predictor of how the Fund will perform in the future. The graph and table do not reflect the deduction of taxes that a shareholder would pay on Fund distributions or redemption of Fund shares. |
| † | The Fund’s Cumulative Total Returns are based on net asset values calculated for shareholder transactions which are not reflective of adjustments required pursuant to GAAP. Accordingly, differences may exist between this data and similar information reported in the financial statements. |
| Kurv Yield Premium Strategy Netflix (NFLX) ETF | PAGE 1 | TSR_AR_78433H774 |
Householding
To reduce Fund expenses, only one copy of most shareholder documents may be mailed to shareholders with multiple accounts at the same address (Householding). If you would prefer that your Kurv Investment Management LLC documents not be householded, please contact Kurv Investment Management LLC at (833) 955-5878, or contact your financial intermediary. Your instructions will typically be effective within 30 days of receipt by Kurv Investment Management LLC or your financial intermediary.
Key Fund Statistics (as of May 31, 2024)
| |
Net Assets | $939,124 |
Number of Holdings | 6 |
| |
Net Advisory Fee | $3,645 |
Portfolio Turnover | 0% |
Visit https://www.kurvinvest.com/etf/nflp for more recent performance information.
What did the Fund invest in? (as of May 31, 2024)
| |
Issuer Breakdown | (%) |
United States Treasury Bill | 97.6% |
Money Market Funds | 1.9% |
Netflix, Inc. | 0.7% |
| |
Security Type | (%) |
Short-Term Investments | 99.5% |
Purchased Options | 6.1% |
Options Written | -5.4% |
Cash & Other | -0.2% |
For additional information about the Fund, including its prospectus, financial infromation, holdings, proxy information and other important materials, scan the QR code or visit https://www.kurvinvest.com/etf/nflp.
Distributor: Foreside Fund Services, LLC.
| Kurv Yield Premium Strategy Netflix (NFLX) ETF | PAGE 2 | TSR_AR_78433H774 |
137161370612874
| | |
| Kurv Yield Premium Strategy Tesla (TSLA) ETF | |
| TSLP (Principal U.S. Listing Exchange: CBOE) |
| Annual Shareholder Report | May 31, 2024 |
This annual shareholder report contains important information about the Kurv Yield Premium Strategy Tesla (TSLA) ETF for the period since inception of October 27, 2023, to May 31, 2024. You can find additional information about the Fund at https://www.kurvinvest.com/etf/tslp. You can also request this information by contacting us at (833) 955-5878.
What were the Fund costs for the past year?
(based on a hypothetical $10,000 investment)
| | |
Fund Name | Costs of a $10,000 investment | Costs paid as a percentage of a $10,000 investment |
| Kurv Yield Premium Strategy Tesla (TSLA) ETF | $57* | 0.99% |
| * | Amount shown reflects the expenses of the Fund from inception date through May 31, 2024. Expenses would be higher if the Fund had been in operations for the full year. |
How did the Fund perform last year and what affected its performance?
For the period since inception of October 27, 2023, to May 31, 2024, the Fund outperformed the underlying stock. Option premiums received from covered call (short call position) contributed to soften the negative total return.
WHAT FACTORS INFLUENCED PERFORMANCE
- Performance of Tesla stock
- Amount of premium received from writing out-of–the-money call option
Long exposure to Tesla stock detracted from performance as Tesla stock price fell during the period.
The Fund maintained long exposure to Tesla stock via synthetic long positions (long call options and short put options both with the same strike). The Fund wrote out-of-the-money call options, receiving premiums to generate income while allowing some upside price appreciation potential. The remaining cash was invested in U.S. T-Bills to generate additional income.
For the period ended May 31, 2024, the Fund’s performance was -7.54% (Market) and -7.62% (NAV).
| |
Top Contributors |
↑ | Premiums received from writing out-of-the money call options |
| |
Top Detractors |
↓ | Long exposure to Tesla stock |
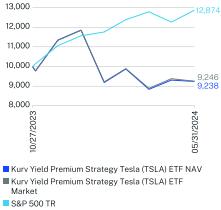
How did the Fund perform?*,,†
The $10,000 chart reflects a hypothetical $10,000 investment. The chart uses total return NAV performance and assumes reinvestment of dividends and capital gains. Fund expenses, management fees were deducted.
CUMULATIVE PERFORMANCE ($)
CUMULATIVE TOTAL RETURN (%)
| |
| | Since Inception
(10/27/2023) |
Kurv Yield Premium Strategy Tesla (TSLA) ETF NAV | -7.62 |
Kurv Yield Premium Strategy Tesla (TSLA) ETF Market | -7.54 |
S&P 500 TR | 28.74 |
Visit https://www.kurvinvest.com/etf/tslp for more recent performance information.
| * | The Fund’s past performance is not a good predictor of how the Fund will perform in the future. The graph and table do not reflect the deduction of taxes that a shareholder would pay on Fund distributions or redemption of Fund shares. |
| † | The Fund’s Cumulative Total Returns are based on net asset values calculated for shareholder transactions which are not reflective of adjustments required pursuant to GAAP. Accordingly, differences may exist between this data and similar information reported in the financial statements. |
| Kurv Yield Premium Strategy Tesla (TSLA) ETF | PAGE 1 | TSR_AR_78433H766 |
Householding
To reduce Fund expenses, only one copy of most shareholder documents may be mailed to shareholders with multiple accounts at the same address (Householding). If you would prefer that your Kurv Investment Management LLC documents not be householded, please contact Kurv Investment Management LLC at (833) 955-5878, or contact your financial intermediary. Your instructions will typically be effective within 30 days of receipt by Kurv Investment Management LLC or your financial intermediary.
Key Fund Statistics (as of May 31, 2024)
| |
Net Assets | $2,971,161 |
Number of Holdings | 7 |
| |
Net Advisory Fee | $7,660 |
Portfolio Turnover | 0% |
Visit https://www.kurvinvest.com/etf/tslp for more recent performance information.
What did the Fund invest in? (as of May 31, 2024)
| |
Issuer Breakdown | (%) |
United States Treasury Bill | 103.8% |
Money Market Funds | 2.0% |
Tesla, Inc. | -8.1% |
| |
Security Type | (%) |
Short-Term Investments | 105.8% |
Purchased Options | 4.7% |
Options Written | -12.8% |
Cash & Other | 2.3% |
For additional information about the Fund, including its prospectus, financial infromation, holdings, proxy information and other important materials, scan the QR code or visit https://www.kurvinvest.com/etf/tslp.
Distributor: Foreside Fund Services, LLC.
| Kurv Yield Premium Strategy Tesla (TSLA) ETF | PAGE 2 | TSR_AR_78433H766 |
9238924612874
Item 2. Code of Ethics.
The registrant has adopted a code of ethics that applies to the registrant’s principal executive officer and principal financial officer. The registrant has not made any substantive amendments to its code of ethics during the period covered by this report. The registrant has not granted any waivers from any provisions of the code of ethics during the period covered by this report.
A copy of the registrant’s Code of Ethics is filed herewith.
Item 3. Audit Committee Financial Expert.
The registrant’s board of [trustees/directors] has determined that there is at least one audit committee financial expert serving on its audit committee. John Jacobs is the “audit committee financial expert” and is considered to be “independent” as each term is defined in Item 3 of Form N-CSR.
Item 4. Principal Accountant Fees and Services.
The registrant has engaged its principal accountant to perform audit services, audit-related services, tax services and other services during the past two fiscal years. “Audit services” refer to performing an audit of the registrant’s annual financial statements or services that are normally provided by the accountant in connection with statutory and regulatory filings or engagements for those fiscal years. “Audit-related services” refer to the assurance and related services by the principal accountant that are reasonably related to the performance of the audit. “Tax services” refer to professional services rendered by the principal accountant for tax compliance, tax advice, and tax planning. “Other services” provided by the principal accountant were Cohen & Company, Ltd. The following table details the aggregate fees billed or expected to be billed for each of the last two fiscal years for audit fees, audit-related fees, tax fees and other fees by the principal accountant.
| | FYE 5/31/24 | FYE 5/31/23 |
| (a) Audit Fees | $63,000 | None |
| (b) Audit-Related Fees | None | None |
| (c) Tax Fees | $18,000 | None |
| (d) All Other Fees | None | None |
(e)(1) The audit committee has adopted pre-approval policies and procedures that require the audit committee to pre-approve all audit and non-audit services of the registrant, including services provided to any entity affiliated with the registrant.
(e)(2) The percentage of fees billed by Cohen & Company, Ltd applicable to non-audit services pursuant to waiver of pre-approval requirement were as follows:
| | FYE 5/31/24 | FYE 5/31/23 |
| Audit-Related Fees | 0% | 0% |
| Tax Fees | 0% | 0% |
| All Other Fees | 0% | 0% |
(f) N/A
(g) The following table indicates the non-audit fees billed or expected to be billed by the registrant’s accountant for services to the registrant and to the registrant’s investment adviser (and any other controlling entity, etc.—not sub-adviser) for the last two years.
| Non-Audit Related Fees | FYE 5/31/24 | FYE 5/31/23 |
| Registrant | None | None |
| Registrant’s Investment Adviser | None | None |
(h) The audit committee of the board of trustees/directors has considered whether the provision of non-audit services that were rendered to the registrant’s investment adviser is compatible with maintaining the principal accountant’s independence and has concluded that the provision of such non-audit services by the accountant has not compromised the accountant’s independence.
(i) Not applicable.
(j) Not applicable.
Item 5. Audit Committee of Listed Registrants.
(a) The registrant is an issuer as defined in Rule 10A-3 under the Securities Exchange Act of 1934, (the “Act”) and has a separately-designated standing audit committee established in accordance with Section 3(a)(58)(A) of the Act. The independent members of the committee [, consisting of the entire Board,] are as follows: Sharon Cheever, John Jacobs, Richard Keary and Robert Sherry.
(b) Not applicable.
Item 6. Investments.
| (a) | Schedule of Investments is included within the financial statements filed under Item 7(a) of this Form. |
Item 7. Financial Statements and Financial Highlights for Open-End Investment Companies.
(a) The registrant’s Financial Statements are filed herewith.
Financial Statements
May 31, 2024
| | | | | | | |
NEOS ETF Trust | | | | | | |
Kurv Yield Premium Strategy Amazon (AMZN) ETF | | | | AMZP | | | | CBOE BZX Exchange, Inc. |
Kurv Yield Premium Strategy Apple (AAPL) ETF | | | | AAPY | | | | CBOE BZX Exchange, Inc. |
Kurv Yield Premium Strategy Google (GOOGL) ETF | | | | GOOP | | | | CBOE BZX Exchange, Inc. |
Kurv Yield Premium Strategy Microsoft (MSFT) ETF | | | | MSFY | | | | CBOE BZX Exchange, Inc. |
Kurv Yield Premium Strategy Netflix (NFLX) ETF | | | | NFLP | | | | CBOE BZX Exchange, Inc. |
Kurv Yield Premium Strategy Tesla (TSLA) ETF | | | | TSLP | | | | CBOE BZX Exchange, Inc. |
| | | | | | | |
Back to Table of Contents
Kurv Yield Premium Strategy Amazon (AMZN) ETF
Schedule of Investments
as of May 31, 2024
| | | | | | | | | | |
PURCHASED OPTIONS - 1.9%(a)(b)
|
Call Options - 1.9%
| | | | | | | | | |
Amazon.com, Inc., Expiration: 07/19/2024; Exercise Price: $185(d) | | | $1,182,148 | | | 67 | | | $22,546 |
TOTAL PURCHASED OPTIONS
(Cost $69,982) | | | | | | | | | 22,546 |
SHORT-TERM INVESTMENTS - 103.8%
|
Money Market Funds - 2.1%
| | | Shares | | | |
Northern U.S. Government Money Market Fund, 5.04%(c)(d) | | | | | | 24,851 | | | 24,851 |
U.S. Treasury Bills - 101.7%
| | | Par | | | |
5.27%, 06/11/2024(d)(e) | | | | | | $525,000 | | | 524,386 |
5.27%, 06/27/2024(d)(e) | | | | | | 171,000 | | | 170,401 |
5.28%, 07/11/2024(d)(e) | | | | | | 517,000 | | | 514,126 |
| | | | | | | | | 1,208,913 |
TOTAL SHORT-TERM INVESTMENTS
(Cost $1,233,441) | | | | | | | | | 1,233,764 |
TOTAL INVESTMENTS - 105.7%
|
(Cost $1,303,423) | | | | | | | | | $1,256,310 |
Liabilities in Excess of Other Assets - (5.7)% | | | | | | | | | (67,329) |
TOTAL NET ASSETS - 100.0% | | | | | | | | | $1,188,981 |
Percentages are stated as a percent of net assets.
(a)
| FLexible EXchange® Options. |
(b)
| 100 shares per contract. |
(c)
| The rate shown represents the 7-day effective yield as of May 31, 2024. |
(d)
| All or a portion of security has been pledged as collateral. The total value of assets committed as collateral as of May 31, 2024 is $1,256,310. |
(e)
| The rate shown is the effective yield as of May 31, 2024. |
The accompanying notes are an integral part of these financial statements.
Back to Table of Contents
Kurv Yield Premium Strategy Amazon (AMZN) ETF
Schedule of Written Options
as of May 31, 2024
| | | | | | | | | | |
WRITTEN OPTIONS - (7.2)%(a)(b)
|
Call Options - (1.3)%
|
Amazon.com, Inc., Expiration: 07/19/2024; Exercise Price: $187 | | | $(1,182,148) | | | (67) | | | $(15,410) |
Put Options - (5.9)%
|
Amazon.com, Inc., Expiration: 07/19/2024; Exercise Price: $185 | | | (1,182,148) | | | (67) | | | (69,656) |
TOTAL WRITTEN OPTIONS
|
(Premiums received $85,673) | | | | | | | | | $(85,066) |
Percentages are stated as a percent of net assets.
(a)
| FLexible EXchange® Options.
|
(b)
| 100 shares per contract. |
The accompanying notes are an integral part of these financial statements.
Back to Table of Contents
Kurv Yield Premium Strategy Apple (AAPL) ETF
Schedule of Investments
as of May 31, 2024
| | | | | | | | | | |
PURCHASED OPTIONS - 10.0%(a)(b)
|
Call Options - 10.0%
| | | | | | | | | |
Apple, Inc., Expiration: 07/19/2024; Exercise Price: $175(d) | | | $749,775 | | | 39 | | | $76,291 |
TOTAL PURCHASED OPTIONS
(Cost $32,297) | | | | | | | | | 76,291 |
SHORT-TERM INVESTMENTS - 91.8%
|
Money Market Funds - 2.9%
| | | Shares | | | |
Northern U.S. Government Money Market Fund, 5.04%(c)(d) | | | | | | 22,351 | | | 22,351 |
U.S. Treasury Bills - 88.9%
| | | Par | | | |
5.28%, 06/27/2024(d)(e) | | | | | | $282,000 | | | 281,012 |
5.30%, 07/11/2024(d)(e) | | | | | | 399,000 | | | 396,783 |
| | | | | | | | | 677,795 |
TOTAL SHORT-TERM INVESTMENTS
(Cost $699,962) | | | | | | | | | 700,146 |
TOTAL INVESTMENTS - 101.8%
|
(Cost $732,259) | | | | | | | | | $776,437 |
Liabilities in Excess of Other Assets - (1.8)% | | | | | | | | | (14,037) |
TOTAL NET ASSETS - 100.0% | | | | | | | | | $762,400 |
| | | | | | | | | | |
Percentages are stated as a percent of net assets.
(a)
| FLexible EXchange® Options. |
(b)
| 100 shares per contract. |
(c)
| The rate shown represents the 7-day effective yield as of May 31, 2024. |
(d)
| All or a portion of security has been pledged as collateral. The total value of assets committed as collateral as of May 31, 2024 is $776,437. |
(e)
| The rate shown is the effective yield as of May 31, 2024. |
The accompanying notes are an integral part of these financial statements.
Back to Table of Contents
Kurv Yield Premium Strategy Apple (AAPL) ETF
Schedule of Written Options
as of May 31, 2024
| | | | | | | | | | |
WRITTEN OPTIONS - (1.3)%(a)(b)
|
Call Options - (0.9)%
|
Apple, Inc., Expiration: 07/19/2024; Exercise Price: $202 | | | $(749,775) | | | (39) | | | $(7,293) |
Put Options - (0.4)%
|
Apple, Inc., Expiration: 07/19/2024; Exercise Price: $175 | | | (749,775) | | | (39) | | | (2,923) |
TOTAL WRITTEN OPTIONS
|
(Premiums received $41,346) | | | | | | | | | $(10,216) |
| | | | | | | | | | |
Percentages are stated as a percent of net assets.
(a)
| FLexible EXchange® Options. |
(b)
| 100 shares per contract. |
The accompanying notes are an integral part of these financial statements.
Back to Table of Contents
Kurv Yield Premium Strategy Google (GOOGL) ETF
Schedule of Investments
as of May 31, 2024
| | | | | | | | | | |
PURCHASED OPTIONS - 11.2%(a)(b)
|
Call Options - 11.2%
| | | | | | | | | |
Alphabet, Inc., Expiration: 07/19/2024; Exercise Price: $155(d) | | | $1,518,000 | | | 88 | | | $171,409 |
TOTAL PURCHASED OPTIONS
(Cost $128,498) | | | | | | | | | 171,409 |
SHORT-TERM INVESTMENTS - 89.8%
|
Money Market Funds - 1.9%
| | | | | | Shares | | | |
Northern U.S. Government Money Market Fund, 5.04%(c)(d) | | | | | | 28,633 | | | 28,633 |
U.S. Treasury Bills - 87.9%
| | | | | | Par | | | |
5.27%, 06/27/2024(d)(e) | | | | | | $318,000 | | | 316,886 |
5.29%, 07/11/2024(d)(e) | | | | | | 1,040,000 | | | 1,034,220 |
| | | | | | | | | 1,351,106 |
TOTAL SHORT-TERM INVESTMENTS
(Cost $1,379,383) | | | | | | | | | 1,379,739 |
TOTAL INVESTMENTS - 101.0%
(Cost $1,507,881) | | | | | | | | | $1,551,148 |
Liabilities in Excess of Other Assets - (1.0)% | | | | | | | | | (15,371) |
TOTAL NET ASSETS - 100.0% | | | | | | | | | $1,535,777 |
| | | | | | | | | | |
Percentages are stated as a percent of net assets.
(a)
| FLexible EXchange® Options. |
(b)
| 100 shares per contract. |
(c)
| The rate shown represents the 7-day effective yield as of May 31, 2024. |
(d)
| All or a portion of security has been pledged as collateral. The total value of assets committed as collateral as of May 31, 2024 is $1,551,148. |
(e)
| The rate shown is the effective yield as of May 31, 2024. |
The accompanying notes are an integral part of these financial statements.
Back to Table of Contents
Kurv Yield Premium Strategy Google (GOOGL) ETF
Schedule of Written Options
as of May 31, 2024
| | | | | | | | | | |
WRITTEN OPTIONS - (1.5)%(a)(b)
|
Call Options - (1.0)%
| | | | | | | | | |
Alphabet, Inc., Expiration: 07/19/2024; Exercise Price: $183 | | | $(1,518,000) | | | (88) | | | $(15,488) |
Put Options - (0.5)%
| | | | | | | | | |
Alphabet, Inc., Expiration: 07/19/2024; Exercise Price: $155 | | | (1,518,000) | | | (88) | | | (7,682) |
TOTAL WRITTEN OPTIONS |
(Premiums received $68,019) | | | | | | | | | $(23,170) |
Percentages are stated as a percent of net assets.
(a)
| FLexible EXchange® Options. |
(b)
| 100 shares per contract. |
The accompanying notes are an integral part of these financial statements.
Back to Table of Contents
Kurv Yield Premium Strategy Microsoft (MSFT) ETF
Schedule of Investments
as of May 31, 2024
| |
SHORT-TERM INVESTMENTS - 103.4%
|
Money Market Funds - 2.7%
| | | | | | Shares | | | |
Northern U.S. Government Money Market Fund, 5.04%(a)(b) | | | | | | 30,224 | | | 30,224 |
U.S. Treasury Bills - 100.7%
| | | Par | | | |
5.27%, 06/27/2024(b)(c) | | | | | | $106,000 | | | 105,629 |
5.29%, 07/11/2024(b)(c) | | | | | | 1,009,000 | | | 1,003,392 |
| | | | | | | | | 1,109,021 |
TOTAL SHORT-TERM INVESTMENTS
(Cost $1,138,951) | | | | | | | | | 1,139,245 |
TOTAL INVESTMENTS - 103.4%
|
(Cost $1,138,951) | | | | | | | | | $1,139,245 |
Liabilities in Excess of Other Assets - (3.4)% | | | | | | | | | (37,105) |
TOTAL NET ASSETS - 100.0% | | | | | | | | | 1,102,140 |
| | | | | | | | | | |
Percentages are stated as a percent of net assets.
(a)
| The rate shown represents the 7-day effective yield as of May 31, 2024.
|
(b)
| All or a portion of security has been pledged as collateral. The total value of assets committed as collateral as of May 31, 2024 is $1,139,245.
|
(c)
| The rate shown is the effective yield as of May 31, 2024. |
The accompanying notes are an integral part of these financial statements.
Back to Table of Contents
Kurv Yield Premium Strategy Microsoft (MSFT) ETF
Schedule of Written Options
as of May 31, 2024
| | | | | | | | | | |
WRITTEN OPTIONS - (4.2)%(a)(b)
|
Put Options - (4.2)%
|
Microsoft Corp., Expiration: 07/19/2024; Exercise Price: $430 | | | (1,079,338) | | | (26) | | | (45,788) |
TOTAL WRITTEN OPTIONS
(Premiums received $52,745) | | | | | | | | | $(45,788) |
| | | | | | | | | | |
Percentages are stated as a percent of net assets.
(a)
| FLexible EXchange® Options. |
(b)
| 100 shares per contract. |
The accompanying notes are an integral part of these financial statements.
Back to Table of Contents
Kurv Yield Premium Strategy Netflix (NFLX) ETF
Schedule of Investments
as of May 31, 2024
| | | | | | | | | | |
PURCHASED OPTIONS - 6.1%(a)(b)
|
Call Options - 6.1%
|
Netflix, Inc., Expiration: 07/19/2024; Exercise Price: $630(d) | | | $898,268 | | | 14 | | | $57,690 |
TOTAL PURCHASED OPTIONS
(Cost $47,754) | | | | | | | | | 57,690 |
SHORT-TERM INVESTMENTS - 99.5%
|
Money Market Funds - 1.9%
| | | Shares | | | |
Northern U.S. Government Money Market Fund, 5.04%(c)(d) | | | | | | 18,172 | | | 18,172 |
U.S. Treasury Bills - 97.6%
| | | Par | | | |
5.28%, 06/27/2024(d)(e) | | | | | | $457,000 | | | 455,399 |
5.30%, 07/11/2024(d)(e) | | | | | | 463,000 | | | 460,427 |
| | | | | | | | | 915,826 |
TOTAL SHORT-TERM INVESTMENTS
(Cost $933,738) | | | | | | | | | 933,998 |
TOTAL INVESTMENTS - 105.6%
|
(Cost $981,492) | | | | | | | | | $991,688 |
Liabilities in Excess of Other Assets - (5.6)% | | | | | | | | | (52,564) |
TOTAL NET ASSETS - 100.0% | | | | | | | | | $939,124 |
| | | | | | | | | | |
Percentages are stated as a percent of net assets.
(a)
| FLexible EXchange® Options. |
(b)
| 100 shares per contract. |
(c)
| The rate shown represents the 7-day effective yield as of May 31, 2024. |
(d)
| All or a portion of security has been pledged as collateral. The total value of assets committed as collateral as of May 31, 2024 is $991,688.
|
(e)
| The rate shown is the effective yield as of May 31, 2024. |
The accompanying notes are an integral part of these financial statements.
Back to Table of Contents
Kurv Yield Premium Strategy Netflix (NFLX) ETF
Schedule of Written Options
as of May 31, 2024
| | | | | | | | | | |
WRITTEN OPTIONS - (5.4)%(a)(b)
|
Call Options - (1.7)%
|
Netflix, Inc., Expiration: 07/19/2024; Exercise Price: $700 | | | $(898,268) | | | (14) | | | $(16,268) |
Put Options - (3.7)%
|
Netflix, Inc., Expiration: 07/19/2024; Exercise Price: $630 | | | (898,268) | | | (14) | | | (34,238) |
TOTAL WRITTEN OPTIONS
|
(Premiums received $103,945) | | | | | | | | | $(50,506) |
Percentages are stated as a percent of net assets.
(a)
| FLexible EXchange® Options. |
(b)
| 100 shares per contract. |
The accompanying notes are an integral part of these financial statements.
Back to Table of Contents
Kurv Yield Premium Strategy Tesla (TSLA) ETF
Schedule of Investments
as of May 31, 2024
| | | | | | | | | | |
PURCHASED OPTIONS - 4.7%(a)(b)
|
Call Options - 4.7%
| | | | | | | | | |
Tesla, Inc., Expiration: 07/19/2024; Exercise Price: $190.00(d) | | | $2,956,128 | | | 166 | | | $139,071 |
TOTAL PURCHASED OPTIONS
(Cost $223,143) | | | | | | | | | 139,071 |
SHORT-TERM INVESTMENTS - 105.8%
|
Money Market Funds - 2.0%
| | | Shares | | | |
Northern U.S. Government Money Market Fund, 5.04%(c)(d) | | | | | | 60,860 | | | 60,860 |
U.S. Treasury Bills - 103.8%
| | | Par | | | |
5.27%, 06/11/2024(d)(e) | | | | | | $505,000 | | | 504,409 |
5.25%, 06/27/2024(d)(e) | | | | | | 609,000 | | | 606,867 |
5.29%, 07/11/2024(d)(e) | | | | | | 1,984,000 | | | 1,972,974 |
| | | | | | | | | 3,084,250 |
TOTAL SHORT-TERM INVESTMENTS
(Cost $3,144,296) | | | | | | | | | 3,145,110 |
TOTAL INVESTMENTS - 110.5%
|
(Cost $3,367,439) | | | | | | | | | $3,284,181 |
Liabilities in Excess of Other Assets - (10.5)% | | | | | | | | | (313,020) |
TOTAL NET ASSETS - 100.0% | | | | | | | | | $2,971,161 |
Percentages are stated as a percent of net assets.
(a)
| FLexible EXchange® Options. |
(b)
| 100 shares per contract. |
(c)
| The rate shown represents the 7-day effective yield as of May 31, 2024. |
(d)
| All or a portion of security has been pledged as collateral. The total value of assets committed as collateral as of May 31, 2024 is $3,284,181. |
(e)
| The rate shown is the effective yield as of May 31, 2024. |
The accompanying notes are an integral part of these financial statements.
Back to Table of Contents
Kurv Yield Premium Strategy Tesla (TSLA) ETF
Schedule of Written Options
as of May 31, 2024
| | | | | | | | | | |
WRITTEN OPTIONS - (12.8)%(a)(b)
|
Call Options - (2.4)%
| | | | | | | | | |
Tesla, Inc., Expiration: 07/19/2024; Exercise Price: $205 | | | $(2,956,128) | | | (166) | | | $(70,218) |
Put Options - (10.4)%
| | | | | | | | | |
Tesla, Inc., Expiration: 07/19/2024; Exercise Price: $190 | | | (2,956,128) | | | (166) | | | (309,017) |
TOTAL WRITTEN OPTIONS
|
(Premiums received $444,636) | | | | | | | | | $(379,235) |
| | | | | | | | | | |
Percentages are stated as a percent of net assets.
(a)
| FLexible EXchange® Options. |
(b)
| 100 shares per contract. |
The accompanying notes are an integral part of these financial statements.
Back to Table of Contents
Statements of Assets and Liabilities
May 31, 2024
| | | | | | | | | | | | | | | | | | | |
ASSETS:
| | | | | | | | | | | | | | | | | | |
Investments, at value | | | $1,256,310 | | | $776,437 | | | $1,551,148 | | | $1,139,245 | | | $991,688 | | | $3,284,181 |
Receivable for investments
sold | | | 15,309 | | | 20,759 | | | 15,464 | | | 11,687 | | | 59,777 | | | 69,969 |
Cash | | | 4,125 | | | 3,934 | | | 8,574 | | | 3,936 | | | 1,400 | | | 10,414 |
Dividends and interest receivable | | | 113 | | | 118 | | | 103 | | | 134 | | | 129 | | | 236 |
Total assets | | | 1,275,857 | | | 801,248 | | | 1,575,289 | | | 1,155,002 | | | 1,052,994 | | | 3,364,800 |
LIABILITIES:
| | | | | | | | | | | | | | | | | | |
Written option contracts, at value | | | 85,066 | | | 10,216 | | | 23,170 | | | 45,788 | | | 50,506 | | | 379,235 |
Payable to adviser | | | 906 | | | 625 | | | 950 | | | 769 | | | 730 | | | 1,871 |
Payable for investments
purchased | | | 904 | | | 28,007 | | | 15,392 | | | 6,305 | | | 62,634 | | | 12,533 |
Total liabilities | | | 86,876 | | | 38,848 | | | 39,512 | | | 52,862 | | | 113,870 | | | 393,639 |
NET ASSETS | | | $1,188,981 | | | $762,400 | | | $1,535,777 | | | $1,102,140 | | | $939,124 | | | $2,971,161 |
NET ASSETS CONSISTS OF:
| | | | | | | | | | | | | | | | | | |
Paid-in capital | | | $1,108,449 | | | $712,815 | | | $1,408,949 | | | $1,055,845 | | | $794,356 | | | $3,229,161 |
Total distributable earnings/
(accumulated losses) | | | 80,532 | | | 49,585 | | | 126,828 | | | 46,295 | | | 144,768 | | | (258,000) |
Total net assets | | | $1,188,981 | | | $762,400 | | | $1,535,777 | | | $1,102,140 | | | $939,124 | | | $2,971,161 |
Net assets | | | $1,188,981 | | | $762,400 | | | $1,535,777 | | | $1,102,140 | | | $939,124 | | | $2,971,161 |
Shares issued and outstanding(a) | | | 40,000 | | | 30,000 | | | 50,000 | | | 40,000 | | | 30,000 | | | 150,000 |
Net asset value per share | | | $29.72 | | | $25.41 | | | $30.72 | | | $27.55 | | | $31.30 | | | $19.81 |
COST:
| | | | | | | | | | | | | | | | | | |
Investments, at cost | | | $1,303,423 | | | $732,259 | | | $1,507,881 | | | $1,138,951 | | | $981,492 | | | $3,367,439 |
PROCEEDS:
| | | | | | | | | | | | | | | | | | |
Written options premium | | | $85,673 | | | $41,346 | | | $68,019 | | | $52,745 | | | $103,945 | | | $444,636 |
| | | | | | | | | | | | | | | | | | | |
(a)
| Unlimited shares authorized without par value. |
The accompanying notes are an integral part of these financial statements.
Back to Table of Contents
Statements of Operations
For the Periods Ended May 31, 2024
| | | | | | | | | | | | | | | | | | | |
INVESTMENT INCOME:
| | | | | | | | | | | | | | | | | | |
Dividend income | | | $523 | | | $687 | | | $508 | | | $522 | | | $708 | | | $1,529 |
Interest income | | | 22,509 | | | 16,941 | | | 19,032 | | | 20,382 | | | 18,343 | | | 47,562 |
Total investment income | | | 23,032 | | | 17,628 | | | 19,540 | | | 20,904 | | | 19,051 | | | 49,091 |
EXPENSES:
| | | | | | | | | | | | | | | | | | |
Investment advisory fee | | | 5,133 | | | 3,767 | | | 4,317 | | | 4,592 | | | 4,234 | | | 8,898 |
Total expenses | | | 5,133 | | | 3,767 | | | 4,317 | | | 4,592 | | | 4,234 | | | 8,898 |
Expense waived by Adviser | | | (714) | | | (524) | | | (601) | | | (639) | | | (589) | | | (1,238) |
Net expenses | | | 4,419 | | | 3,243 | | | 3,716 | | | 3,953 | | | 3,645 | | | 7,660 |
NET INVESTMENT INCOME | | | 18,613 | | | 14,385 | | | 15,824 | | | 16,951 | | | 15,406 | | | 41,431 |
REALIZED AND UNREALIZED GAIN/(LOSS)
| | | | | | | | | | | | | | | | | | |
Net realized gain/(loss) from:
| | | | | | | | | | | | | | | | | | |
Investments | | | 112,120 | | | 22,267 | | | 29,678 | | | 20,853 | | | 135,658 | | | (66,231) |
Written option contracts expired or closed | | | 67,538 | | | (47,990) | | | 46,357 | | | 48,797 | | | (5,157) | | | (173,912) |
Net gains/(losses) realized on the disposal of investments in violation of restrictions | | | — | | | — | | | — | | | — | | | — | | | 0 |
Net realized gain/(loss) | | | 179,658 | | | (25,723) | | | 76,035 | | | 69,650 | | | 130,501 | | | (240,143) |
Net change in unrealized appreciation/
(depreciation) on:
| | | | | | | | | | | | | | | | | | |
Investments | | | (47,113) | | | 44,178 | | | 43,267 | | | 294 | | | 10,196 | | | (83,257) |
Written option contracts | | | 607 | | | 31,130 | | | 44,849 | | | 6,957 | | | 53,439 | | | 65,400 |
Net change in unrealized appreciation/(depreciation) | | | (46,506) | | | 75,308 | | | 88,116 | | | 7,251 | | | 63,635 | | | (17,857) |
Net realized and unrealized gain/(loss) | | | 133,152 | | | 49,585 | | | 164,151 | | | 76,901 | | | 194,136 | | | (258,000) |
NET INCREASE/(DECREASE) IN NET ASSETS RESULTING FROM OPERATIONS | | | $151,765 | | | $63,970 | | | $179,975 | | | $93,852 | | | $209,542 | | | $(216,569) |
| | | | | | | | | | | | | | | | | | | |
(a)
| Inception date of the Fund was October 31, 2023. |
(b)
| Inception date of the Fund was October 27, 2023. |
The accompanying notes are an integral part of these financial statements.
Back to Table of Contents
Statements of Changes in Net Assets
| | | | | | | | | | | | | |
OPERATIONS:
| | | | | | | | | | | | |
Net investment income | | | $18,613 | | | $14,385 | | | $15,824 | | | $16,951 |
Net realized gain/(loss) | | | 179,658 | | | (25,723) | | | 76,035 | | | 69,650 |
Net change in unrealized appreciation/
(depreciation) | | | (46,506) | | | 75,308 | | | 88,116 | | | 7,251 |
Net increase in net assets from operations | | | 151,765 | | | 63,970 | | | 179,975 | | | 93,852 |
DISTRIBUTIONS TO SHAREHOLDERS:
| | | | | | | | | | | | |
Distributions from distributable earnings | | | (71,233) | | | (14,385) | | | (53,148) | | | (47,557) |
Distributions from tax return of capital | | | — | | | (25,322) | | | — | | | — |
Total distributions to shareholders | | | (71,233) | | | (39,707) | | | (53,148) | | | (47,557) |
CAPITAL TRANSACTIONS:
| | | | | | | | | | | | |
Subscriptions | | | 1,713,015 | | | 738,137 | | | 1,408,950 | | | 1,055,845 |
Redemptions | | | (604,566) | | | — | | | — | | | — |
Net increase in net assets from capital transactions | | | 1,108,449 | | | 738,137 | | | 1,408,950 | | | 1,055,845 |
NET INCREASE IN NET ASSETS | | | 1,188,981 | | | 762,400 | | | 1,535,777 | | | 1,102,140 |
NET ASSETS:
| | | | | | | | | | | | |
Beginning of the period | | | — | | | — | | | — | | | — |
End of the period | | | $1,188,981 | | | $762,400 | | | $1,535,777 | | | $1,102,140 |
SHARES TRANSACTIONS
| | | | | | | | | | | | |
Subscriptions | | | 60,000 | | | 30,000 | | | 50,000 | | | 40,000 |
Redemptions | | | (20,000) | | | — | | | — | | | — |
Total increase in shares outstanding | | | 40,000 | | | 30,000 | | | 50,000 | | | 40,000 |
| | | | | | | | | | | | | |
(a)
| Inception date of the Fund was October 31, 2023. |
(b)
| Inception date of the Fund was October 27, 2023. |
The accompanying notes are an integral part of these financial statements.
Back to Table of Contents
Statements of Changes in Net Assets
| | | | | | | |
OPERATIONS:
| | | | | | |
Net investment income | | | $15,406 | | | $41,431 |
Net realized gain/(loss) | | | 130,501 | | | (240,143) |
Net change in unrealized appreciation/(depreciation) | | | 63,635 | | | (17,857) |
Net increase/(decrease) in net assets from operations | | | 209,542 | | | (216,569) |
DISTRIBUTIONS TO SHAREHOLDERS:
| | | | | | |
Distributions from distributable earnings | | | (64,774) | | | (41,431) |
Distributions from tax return of capital | | | — | | | (179,927) |
Total distributions to shareholders | | | (64,774) | | | (221,358) |
CAPITAL TRANSACTIONS:
| | | | | | |
Subscriptions | | | 794,356 | | | 3,787,610 |
Redemptions | | | — | | | (378,522) |
Net increase in net assets from capital transactions | | | 794,356 | | | 3,409,088 |
NET INCREASE IN NET ASSETS | | | 939,124 | | | 2,971,161 |
NET ASSETS:
| | | | | | |
Beginning of the period | | | — | | | — |
End of the period | | | $939,124 | | | $2,971,161 |
SHARES TRANSACTIONS
| | | | | | |
Subscriptions | | | 30,000 | | | 170,000 |
Redemptions | | | — | | | (20,000) |
Total increase in shares outstanding | | | 30,000 | | | 150,000 |
| | | | | | | |
(a)
| Inception date of the Fund was October 27, 2023. |
The accompanying notes are an integral part of these financial statements.
Back to Table of Contents
Kurv Yield Premium Strategy Amazon (AMZN) ETF
Financial Highlights
For a share outstanding throughout the period presented
| | | | |
PER SHARE DATA:
| | | |
Net asset value, beginning of period | | | $25.00 |
INVESTMENTS OPERATIONS:
| | | |
Net investment income(b) | | | 0.71 |
Net realized and unrealized gain on investments | | | 6.39 |
Total from investment operations | | | 7.10 |
LESS DISTRIBUTIONS FROM:
| | | |
From net investment income | | | (2.38) |
Total distributions | | | (2.38) |
|
Net asset value, end of period | | | $29.72 |
|
TOTAL RETURN(c)(f) | | | 29.08% |
SUPPLEMENTAL DATA AND RATIOS:
| | | |
Net assets, end of period (in thousands) | | | $1,189 |
Ratio of expenses to average net assets:
| | | |
Before expense waived(d) | | | 1.15% |
After expense waived(d) | | | 0.99% |
Ratio of net investment income to average net assets(d) | | | 4.15% |
Portfolio turnover rate(c)(e) | | | 0% |
| | | | |
(a)
| Inception date of the Fund was October 31, 2023. |
(b)
| Net investment income per share has been calculated based on average shares outstanding during the period. |
(c)
| Not annualized for periods less than one year. |
(d)
| Annualized for periods less than one year. |
(e)
| Portfolio turnover rate exclude in-kind transactions. |
(f)
| Net asset value total return is calculated assuming an initial investment made at the net asset value at the beginning of the period, reinvestment of all dividends and distributions at net asset value during the period and redemption on the last day of the period at net asset value. |
The accompanying notes are an integral part of these financial statements.
Back to Table of Contents
Kurv Yield Premium Strategy Apple (AAPL) ETF
Financial Highlights
For a share outstanding throughout the period presented
| | | | |
PER SHARE DATA:
| | | |
Net asset value, beginning of period | | | $25.00 |
INVESTMENTS OPERATIONS:
| | | |
Net investment income(b) | | | 0.66 |
Net realized and unrealized gain on investments | | | 1.50 |
Total from investment operations | | | 2.16 |
LESS DISTRIBUTIONS FROM:
| | | |
From net investment income | | | (0.69) |
Return of capital | | | (1.06) |
Total distributions | | | (1.75) |
Net asset value, end of period | | | $25.41 |
TOTAL RETURN(c)(f) | | | 8.84% |
SUPPLEMENTAL DATA AND RATIOS:
| | | |
Net assets, end of period (in thousands) | | | $762 |
Ratio of expenses to average net assets:
| | | |
Before expense waived(d) | | | 1.15% |
After expense waived(d) | | | 0.99% |
Ratio of net investment income to average net assets(d) | | | 4.39% |
Portfolio turnover rate(c)(e) | | | 0% |
| | | | |
(a)
| Inception date of the Fund was October 27, 2023. |
(b)
| Net investment income per share has been calculated based on average shares outstanding during the period. |
(c)
| Not annualized for periods less than one year. |
(d)
| Annualized for periods less than one year. |
(e)
| Portfolio turnover rate exclude in-kind transactions. |
(f)
| Net asset value total return is calculated assuming an initial investment made at the net asset value at the beginning of the period, reinvestment of all dividends and distributions at net asset value during the period and redemption on the last day of the period at net asset value. |
The accompanying notes are an integral part of these financial statements.
Back to Table of Contents
Kurv Yield Premium Strategy Google (GOOGL) ETF
Financial Highlights
For a share outstanding throughout the period presented
| | | | |
PER SHARE DATA:
| | | |
Net asset value, beginning of period | | | $25.00 |
INVESTMENTS OPERATIONS:
| | | |
Net investment income(b) | | | 0.69 |
Net realized and unrealized gain on investments | | | 7.04 |
Total from investment operations | | | 7.73 |
LESS DISTRIBUTIONS FROM:
| | | |
From net investment income | | | (2.01) |
Total distributions | | | (2.01) |
|
Net asset value, end of period | | | $30.72 |
|
TOTAL RETURN(c)(f) | | | 31.98% |
SUPPLEMENTAL DATA AND RATIOS:
| | | |
Net assets, end of period (in thousands) | | | $1,536 |
Ratio of expenses to average net assets:
| | | |
Before expense waived(d) | | | 1.15% |
After expense waived(d) | | | 0.99% |
Ratio of net investment income to average net assets(d) | | | 4.22% |
Portfolio turnover rate(c)(e) | | | 0% |
(a)
| Inception date of the Fund was October 31, 2023. |
(b)
| Net investment income per share has been calculated based on average shares outstanding during the period. |
(c)
| Not annualized for periods less than one year. |
(d)
| Annualized for periods less than one year. |
(e)
| Portfolio turnover rate exclude in-kind transactions. |
(f)
| Net asset value total return is calculated assuming an initial investment made at the net asset value at the beginning of the period, reinvestment of all dividends and distributions at net asset value during the period and redemption on the last day of the period at net asset value. |
The accompanying notes are an integral part of these financial statements.
Back to Table of Contents
Kurv Yield Premium Strategy Microsoft (MSFT) ETF
Financial Highlights
For a share outstanding throughout the period presented
| | | | |
PER SHARE DATA:
| | | |
Net asset value, beginning of period | | | $25.00 |
INVESTMENTS OPERATIONS:
| | | |
Net investment income(b) | | | 0.68 |
Net realized and unrealized gain on investments | | | 3.69 |
Total from investment operations | | | 4.37 |
LESS DISTRIBUTIONS FROM:
| | | |
From net investment income | | | (1.82) |
Total distributions | | | (1.82) |
|
Net asset value, end of period | | | $27.55 |
|
TOTAL RETURN(c)(f) | | | 17.80% |
SUPPLEMENTAL DATA AND RATIOS:
| | | |
Net assets, end of period (in thousands) | | | $1,102 |
Ratio of expenses to average net assets:
| | | |
Before expense waived(d) | | | 1.15% |
After expense waived(d) | | | 0.99% |
Ratio of net investment income to average net assets(d) | | | 4.24% |
Portfolio turnover rate(c)(e) | | | 0% |
(a)
| Inception date of the Fund was October 31, 2023. |
(b)
| Net investment income per share has been calculated based on average shares outstanding during the period. |
(c)
| Not annualized for periods less than one year. |
(d)
| Annualized for periods less than one year. |
(e)
| Portfolio turnover rate exclude in-kind transactions. |
(f)
| Net asset value total return is calculated assuming an initial investment made at the net asset value at the beginning of the period, reinvestment of all dividends and distributions at net asset value during the period and redemption on the last day of the period at net asset value. |
The accompanying notes are an integral part of these financial statements.
Back to Table of Contents
Kurv Yield Premium Strategy Netflix (NFLX) ETF
Financial Highlights
For a share outstanding throughout the period presented
| | | | |
PER SHARE DATA:
| | | |
Net asset value, beginning of period | | | $25.00 |
INVESTMENTS OPERATIONS:
| | | |
Net investment income(b) | | | 0.74 |
Net realized and unrealized gain on investments | | | 8.57 |
Total from investment operations | | | 9.31 |
LESS DISTRIBUTIONS FROM:
| | | |
From net investment income | | | (3.01) |
Total distributions | | | (3.01) |
|
Net asset value, end of period | | | $31.30 |
|
TOTAL RETURN(c)(f) | | | 38.55% |
SUPPLEMENTAL DATA AND RATIOS:
| | | |
Net assets, end of period (in thousands) | | | $939 |
Ratio of expenses to average net assets:
| | | |
Before expense waived(d) | | | 1.15% |
After expense waived(d) | | | 0.99% |
Ratio of net investment income to average net assets(d) | | | 4.18% |
Portfolio turnover rate(c)(e) | | | 0% |
(a)
| Inception date of the Fund was October 27, 2023. |
(b)
| Net investment income per share has been calculated based on average shares outstanding during the period. |
(c)
| Not annualized for periods less than one year. |
(d)
| Annualized for periods less than one year. |
(e)
| Portfolio turnover rate exclude in-kind transactions. |
(f)
| Net asset value total return is calculated assuming an initial investment made at the net asset value at the beginning of the period, reinvestment of all dividends and distributions at net asset value during the period and redemption on the last day of the period at net asset value. |
The accompanying notes are an integral part of these financial statements.
Back to Table of Contents
Kurv Yield Premium Strategy Tesla (TSLA) ETF
Financial Highlights
For a share outstanding throughout the period presented
| | | | |
PER SHARE DATA:
| | | |
Net asset value, beginning of period | | | $25.00 |
INVESTMENTS OPERATIONS:
| | | |
Net investment income(b) | | | 0.68 |
Net realized and unrealized loss on investments | | | (2.38) |
Total from investment operations | | | (1.70) |
LESS DISTRIBUTIONS FROM:
| | | |
From net investment income | | | (1.28) |
Return of capital | | | (2.21) |
Total distributions | | | (3.49) |
Net asset value, end of period | | | $19.81 |
TOTAL RETURN(c)(f)(g) | | | −7.71% |
SUPPLEMENTAL DATA AND RATIOS:
| | | |
Net assets, end of period (in thousands) | | | $2,971 |
Ratio of expenses to average net assets:
| | | |
Before expense waived(d) | | | 1.15% |
After expense waived(d) | | | 0.99% |
Ratio of net investment income to average net assets(d) | | | 5.35% |
Portfolio turnover rate(c)(e) | | | 0% |
| | | | |
(a)
| Inception date of the Fund was October 27, 2023. |
(b)
| Net investment income per share has been calculated based on average shares outstanding during the period. |
(c)
| Not annualized for periods less than one year. |
(d)
| Annualized for periods less than one year. |
(e)
| Portfolio turnover rate exclude in-kind transactions. |
(f)
| If the fund had not been reimbursed for $17,249.78 for the amount of the trade error, the total return would be (8.25%), for a total return reduction of (0.54%). |
(g)
| Net asset value total return is calculated assuming an initial investment made at the net asset value at the beginning of the period, reinvestment of all dividends and distributions at net asset value during the period and redemption on the last day of the period at net asset value. |
The accompanying notes are an integral part of these financial statements.
Back to Table of Contents
NEOS ETF Trust
Notes to the Financial Statements
May 31, 2024
NOTE 1 – ORGANIZATION
The NEOS ETF Trust (the “Trust”), formerly the SHP ETF Trust, was organized as a Delaware statutory trust on February 1, 2021 and is authorized to issue multiple series or portfolios. The Trust is an open-end investment company, registered under the Investment Company Act of 1940, as amended (the “1940 Act”). The Trust currently consists of thirteen operational exchange-traded funds (“ETFs”), six of which are presented herein, Kurv Yield Premium Strategy Amazon (AMZN) ETF, Kurv Yield Premium Strategy Apple (AAPL) ETF, Kurv Yield Premium Strategy Google (GOOGL) ETF, Kurv Yield Premium Strategy Microsoft (MSFT) ETF, Kurv Yield Premium Strategy Netflix (NFLX) ETF, and Kurv Yield Premium Strategy Tesla (TSLA) ETF, (collectively, the “Funds” or individually, a “Fund”). These financial statements relate only to the Funds. The Funds are each a non-diversified series of the Trust. The investment objective of each Fund is to seek to provide current income.
Kurv Investment Management LLC (the “Adviser”) is the investment adviser to each Fund.
NEOS Investment Management, LLC (the “Sub-Adviser”) is the investment sub-adviser to each Fund.
NOTE 2 – SUMMARY OF SIGNIFICANT ACCOUNTING POLICIES
The Funds, follow accounting and reporting guidance under Financial Accounting Standards Board (“FASB”) Accounting Standards Codification Topic 946, “Financial Services – Investment Companies” including Accounting Standards Update 2013-08.
The following is a summary of significant accounting policies consistently followed by the Funds in the preparation of their financial statements. These financial statements have been prepared in conformity with accounting principles generally accepted in the United States of America (“GAAP”).
A.
| Investment Valuation. The net asset value (“NAV”) of each Fund’s shares is calculated each business day as of the close of regular trading on the New York Stock Exchange (“NYSE”), generally 4:00 p.m., Eastern Time. NAV per share is computed by dividing the net assets of each Fund by each Fund’s number of shares outstanding. |
When calculating the NAV of each Fund’s shares, securities held by the Funds are valued at market quotations when reliable market quotations are readily available. Exchange traded securities and instruments (including equity securities, depositary receipts and ETFs) are generally valued at the last reported sale price on the principal exchange on which such securities are traded (at the NASDAQ Official Closing Price for NASDAQ listed securities), as of the close of regular trading on the NYSE on the day the securities are being valued or, if there are no sales, at the mean of the most recent bid and asked prices. Over-the-counter securities and instruments not traded on an exchange are generally valued at the last traded price. Investments in open-end regulated investment companies are valued at NAV. In the absence of a recorded transaction sale price; or if the last sale price is unavailable, securities are valued at the mean between last bid and ask, as quoted. If an ask price is unavailable, the last bid price is used. Such valuations would typically be categorized as Level 1 or Level 2 in the fair value hierarchy described below.
Options traded on an exchange (other than Flexible Exchange (“FLEX”) options) are generally valued at the 4:00 pm EST bid/ask mean price on the exchange or OTC market on which they principally trade. If the 4:00 pm bid/ask mean price is not available, then options shall be valued at the 4:15 pm EST bid/ask mean price. If neither bid/ask mean price is available, then options shall be valued at the last reported settlement price on the exchange or OTC market on which they principally trade.
FLEX Options are generally valued at the last sale price on the exchange on which they principally trade. If there is no exchange price for the valuation day available, FLEX Options shall be valued at a Theoretical price provided by a Pricing Service.
When reliable market quotations are not readily available, securities are priced at their fair value as determined in good faith by the Adviser in accordance with the Trust’s valuation guidelines. Pursuant to Rule 2a-5 under the 1940 Act, each Fund has designated the Adviser as its “Valuation Designee” to perform all of the fair value determinations as well as to perform all of the responsibilities that may be performed by the Valuation Designee in accordance with Rule 2a-5. The Valuation Designee is authorized to make all necessary
Back to Table of Contents
NEOS ETF Trust
Notes to the Financial Statements
May 31, 2024 (Continued)
determinations of the fair values of portfolio securities and other assets for which market quotations are not readily available or if it is deemed that the prices obtained from brokers and dealers or independent pricing services are unreliable. The Funds may use fair value pricing in a variety of circumstances, including but not limited to, situations when the value of a security has been materially affected by events occurring after the close of the market on which such security is principally traded (such as a corporate action or other news that may materially affect the price of such security) or trading in such security has been suspended or halted. Such valuations would typically be categorized as Level 2 or Level 3 in the fair value hierarchy described below. Fair value pricing involves subjective judgments and it is possible that a fair value determination for a security is materially different than the value that could be realized upon the sale of such security. As of May 31, 2024, there were no securities internally fair valued and/or valued using a Level 3 valuation.
The Funds disclose the fair value of their investments in a hierarchy that distinguishes between: (1) market participant assumptions developed based on market data obtained from sources independent of the Funds (observable inputs) and (2) the Funds’ own assumptions about market participant assumptions developed based on the best information available under the circumstances (unobservable inputs).
The three levels defined by the hierarchy are as follows:
Level 1 –
Quoted prices in active markets for identical assets that the Funds have the ability to access.
Level 2 –
Other significant observable inputs (including quoted prices for similar securities, interest rates, prepayment speeds, credit risk, etc.).
Level 3 –
Significant unobservable inputs (including the Funds’ own assumptions in determining the fair value of investments).
The inputs or methodology used for valuing securities are not necessarily an indication of the risk associated with investing in those securities.
The following is a summary of the inputs used to value each Fund’s investments as of May 31, 2024:
Kurv Yield Premium Strategy Amazon (AMZN) ETF
| | | | | | | | | | | | | |
Assets:
| | | | | | | | | | | | |
Purchased Options | | | $— | | | $22,546 | | | $ — | | | $22,546 |
Money Market Funds | | | 24,851 | | | — | | | — | | | 24,851 |
U.S. Treasury Bills | | | — | | | 1,208,913 | | | — | | | 1,208,913 |
Total Assets | | | $ 24,851 | | | $ 1,231,459 | | | $— | | | $1,256,310 |
Liabilities:
| | | | | | | | | | | | |
Written Options | | | $— | | | $(85,066) | | | $— | | | $(85,066) |
Total Liabilities | | | $— | | | $(85,066) | | | $ — | | | $(85,066) |
| | | | | | | | | | | | | |
Refer to the Schedule of Investments for industry classifications.
Back to Table of Contents
NEOS ETF Trust
Notes to the Financial Statements
May 31, 2024 (Continued)
Kurv Yield Premium Strategy Apple (AAPL) ETF
| | | | | | | | | | | | | |
Assets:
| | | | | | | | | | | | |
Purchased Options | | | $— | | | $76,291 | | | $ — | | | $76,291 |
Money Market Funds | | | 22,351 | | | — | | | — | | | 22,351 |
U.S. Treasury Bills | | | — | | | 677,795 | | | — | | | 677,795 |
Total Assets | | | $ 22,351 | | | $ 754,086 | | | $— | | | $776,437 |
Liabilities:
| | | | | | | | | | | | |
Written Options | | | $ — | | | $ (10,216) | | | $ — | | | $ (10,216) |
Total Liabilities | | | $— | | | $(10,216) | | | $— | | | $(10,216) |
| | | | | | | | | | | | | |
Refer to the Schedule of Investments for additional information.
Kurv Yield Premium Strategy Google (GOOGL) ETF
| | | | | | | | | | | | | |
Assets:
| | | | | | | | | | | | |
Purchased Options | | | $— | | | $171,409 | | | $ — | | | $171,409 |
Money Market Funds | | | 28,633 | | | — | | | — | | | 28,633 |
U.S. Treasury Bills | | | — | | | 1,351,106 | | | — | | | 1,351,106 |
Total Assets | | | $ 28,633 | | | $ 1,522,515 | | | $— | | | $ 1,551,148 |
Liabilities:
| | | | | | | | | | | | |
Written Options | | | $— | | | $(23,170) | | | $— | | | $(23,170) |
Total Liabilities | | | $— | | | $(23,170) | | | $— | | | $(23,170) |
| | | | | | | | | | | | | |
Refer to the Schedule of Investments for additional information.
Kurv Yield Premium Strategy Microsoft (MSFT) ETF
| | | | | | | | | | | | | |
Assets:
| | | | | | | | | | | | |
Money Market Funds | | | 30,224 | | | — | | | — | | | 30,224 |
U.S. Treasury Bills | | | — | | | 1,109,021 | | | — | | | 1,109,021 |
Total Assets | | | $ 30,224 | | | $ 1,109,021 | | | $— | | | $ 1,139,245 |
Liabilities:
| | | | | | | | | | | | |
Written Options | | | $— | | | $(45,788) | | | $— | | | $(45,788) |
Total Liabilities | | | $— | | | $(45,788) | | | $— | | | $(45,788) |
| | | | | | | | | | | | | |
Refer to the Schedule of Investments for additional information.
Back to Table of Contents
NEOS ETF Trust
Notes to the Financial Statements
May 31, 2024 (Continued)
Kurv Yield Premium Strategy Netflix (NFLX) ETF
| | | | | | | | | | | | | |
Assets:
| | | | | | | | | | | | |
Purchased Options | | | $— | | | $57,690 | | | $ — | | | $57,690 |
Money Market Funds | | | 18,172 | | | — | | | — | | | 18,172 |
U.S. Treasury Bills | | | — | | | 915,826 | | | — | | | 915,826 |
Total Assets | | | $ 18,172 | | | $ 973,516 | | | $— | | | $ 991,688 |
Liabilities:
| | | | | | | | | | | | |
Written Options | | | $ — | | | $ (50,506) | | | $ — | | | $ (50,506) |
Total Liabilities | | | $— | | | $(50,506) | | | $— | | | $(50,506) |
| | | | | | | | | | | | | |
Refer to the Schedule of Investments for additional information.
Kurv Yield Premium Strategy Tesla (TSLA) ETF
| | | | | | | | | | | | | |
Assets:
| | | | | | | | | | | | |
Purchased Options | | | $— | | | $139,071 | | | $ — | | | $139,071 |
Money Market Funds | | | 60,860 | | | — | | | — | | | 60,860 |
U.S. Treasury Bills | | | — | | | 3,084,250 | | | — | | | 3,084,250 |
Total Assets | | | $ 60,860 | | | $ 3,223,321 | | | $— | | | $ 3,284,181 |
Liabilities:
| | | | | | | | | | | | |
Written Options | | | $— | | | $(379,235) | | | $— | | | $(379,235) |
Total Liabilities | | | $— | | | $(379,235) | | | $— | | | $(379,235) |
| | | | | | | | | | | | | |
Refer to the Schedule of Investments for additional information.
B.
| Written Option Contracts. The Funds are subject to equity price risk in the normal course of pursuing their investment objectives. The Funds write (sell) put or call options for hedging purposes, volatility management purposes, or otherwise to gain, or reduce, long or short exposure to one or more asset classes or issuers. When the Funds write (sell) an option, an amount equal to the premium received by the Fund is included in the Statement of Assets and Liabilities as an asset and an equivalent liability. The amount of the liability is subsequently priced daily to reflect the current value of the option written. Refer to Note 2 (A). for a pricing description. By writing an option, the Funds may become obligated during the term of the option to deliver or purchase the securities underlying the option at the exercise price if the option is exercised. These contracts may involve market risk in excess of the amounts receivable or payable reflected on the Statement of Assets and Liabilities. Refer to Note 2 (H). for further derivative disclosures and Note 2 (D). for further counterparty risk disclosure. |
When an option expires on its stipulated expiration date or the Funds enters into a closing purchase transaction, the Funds realize gains or losses if the cost of the closing purchase transaction differs from the premium received when the option was sold without regard to any unrealized appreciation or depreciation on the underlying security, and the liability related to such option is eliminated. When a written call option is exercised, the premium originally received decreases the cost basis of the security and the Funds realize gains or losses from the sale of the underlying security. When a written put option is exercised, the cost of the security acquired is decreased by the premium received for the put.
C.
| Purchased Option Contracts. The Funds are subject to equity price risk in the normal course of pursuing their investment objectives. The Funds will purchase call or put options. When the Funds purchase an option contract, an amount equal to the premiums paid is included in the value of investments on the Statement of Assets and Liabilities, and is subsequently priced daily to reflect the value of the purchased option contract. Refer to Note 2 (A). for a pricing description. Refer to Note 2 (H). for further derivative disclosures and |
Back to Table of Contents
NEOS ETF Trust
Notes to the Financial Statements
May 31, 2024 (Continued)
Note 2 (D). for further counterparty risk disclosure. When option contracts expire or are closed, realized gains or losses are recognized without regard to any unrealized appreciation or depreciation on the underlying securities that may be held by the Funds. If the Funds exercise a call option, the cost of the security acquired is increased by the premium paid for the call. If the Funds exercise a put option, the premium paid for the put option increases the cost of the underlying security and a gain or loss is realized from the sale of the underlying security.
D.
| Counterparty Risk. The Funds help manage counterparty credit risk by entering into agreements only with counterparties the Adviser believes have the financial resources to honor its obligations. The Adviser considers the credit worthiness of each counterparty to a contract in evaluating potential credit risk. Written options contracts sold on an exchange do not expose the Funds to counterparty risk; the exchange’s clearinghouse guarantees the options against counterparty non-performance. Over-the-counter options counterparty risk includes the risk of loss of the full amount of any net unrealized appreciation. |
E.
| Use of Estimates. The preparation of the financial statements in conformity with GAAP requires management to make estimates and assumptions that affect the reported amounts of assets and liabilities and disclosure of contingent assets and liabilities at the date of the financial statement. Actual results could differ from those estimates. |
F.
| Federal Income Taxes. Each Fund intends to qualify as a regulated investment company (“RIC”) under Subchapter M of the Internal Revenue Code of 1986, as amended. If so qualified, the Funds will not be subject to federal income tax to the extent each Fund distributes substantially all its taxable net investment income and net capital gains to its shareholders. Therefore, no provision for federal income tax should be required. Management of the Funds is required to determine whether a tax position taken by the Funds is more likely than not to be sustained upon examination by the applicable taxing authority. Based on its analysis, Management has concluded that there are no significant uncertain tax positions that would require recognition in the financial statements as of May 31, 2024. The Funds recognize interest and penalties, if any, related to unrecognized tax benefits as income tax expense on the Statements of Operations. Management of the Funds are required to determine whether a tax position taken by the Funds is more likely than not to be sustained upon examination by the applicable taxing authority. Based on its analysis, Management has concluded that the Funds do not have any unrecognized tax benefits or uncertain tax positions that would require a provision for income tax. Accordingly, the Funds did not incur any interest or penalties for the period ended May 31, 2024. |
G.
| Distributions to Shareholders. Each Fund expects to declare and distribute all of its net investment income, if any, to shareholders as dividends monthly. The Funds will distribute net realized capital gains, if any, at least annually. The Funds may distribute such income dividends and capital gains more frequently, if necessary, to reduce or eliminate federal excise or income taxes on the Funds. The amount of any distribution will vary, and there is no guarantee the Funds will pay either an income dividend or a capital gains distribution. |
H.
| Derivatives. The Funds may utilize derivative instruments such as options and other instruments with similar characteristics to the extent that they are consistent with the Funds’ respective investment objectives and limitations. The use of these instruments may involve additional investment risks, including the possibility of illiquid markets or imperfect correlation between the value of the instruments and the underlying securities. Derivatives also may create leverage which will amplify the effect of their performance on the Funds and may produce significant losses.
|
For the period ended May 31, 2024, the Funds’ average derivative volume is described below:
| | | | |
Kurv Yield Premium Strategy Amazon (AMZN) ETF
| | | |
Purchased Option Contracts | | | $46,380 |
Written Option Contracts | | | $ (49,613) |
| | | | |
Back to Table of Contents
NEOS ETF Trust
Notes to the Financial Statements
May 31, 2024 (Continued)
| | | | |
Kurv Yield Premium Strategy Apple (AAPL) ETF
| | | |
Purchased Option Contracts | | | $ 30,406 |
Written Option Contracts | | | $ (30,307) |
Kurv Yield Premium Strategy Google (GOOGL) ETF
| | | |
Purchased Option Contracts | | | $44,792 |
Written Option Contracts | | | $ (38,458) |
Kurv Yield Premium Strategy Microsoft (MSFT) ETF
| | | |
Purchased Option Contracts | | | $32,321 |
Written Option Contracts | | | $ (35,636) |
Kurv Yield Premium Strategy Netflix (NFLX) ETF
| | | |
Purchased Option Contracts | | | $57,880 |
Written Option Contracts | | | $ (39,348) |
Kurv Yield Premium Strategy Tesla (TSLA) ETF
| | | |
Purchased Option Contracts | | | $79,261 |
Written Option Contracts | | | $(278,298) |
| | | | |
The Funds have adopted authoritative standards regarding disclosure about derivatives and hedging activities and how they affect the Funds’ Statement of Assets and Liabilities and Statement of Operations.
Statements of Assets and Liabilities
Fair values of derivative instruments as of May 31, 2024:
| | | | | | | |
Kurv Yield Premium Strategy Amazon (AMZN) ETF
| | | | | | | | | |
Purchased Option Contracts:
| | | | | | | | | |
Equity | | | Investments, at value | | | $22,546 | | | $— |
Written Option Contracts:
| | | | | | | | | |
Equity | | | Written option contracts, at value | | | — | | | 85,066 |
Total Derivatives not accounted for as hedging instruments | | | | | | $22,546 | | | $85,066 |
Kurv Yield Premium Strategy Apple (AAPL) ETF
| | | | | | | | | |
Purchased Option Contracts:
| | | | | | | | | |
Equity | | | Investments, at value | | | $76,291 | | | $— |
Written Option Contracts:
| | | | | | | | | |
Equity | | | Written option contracts, at value | | | — | | | 10,216 |
Total Derivatives not accounted for as hedging instruments | | | | | | $76,291 | | | $10,216 |
| | | | | | | | | | |
Back to Table of Contents
NEOS ETF Trust
Notes to the Financial Statements
May 31, 2024 (Continued)
| | | | | | | |
Kurv Yield Premium Strategy Google (GOOGL) ETF
| | | | | | | | | |
Purchased Option Contracts:
| | | | | | | | | |
Equity | | | Investments, at value | | | $171,409 | | | $— |
Written Option Contracts:
| | | | | | | | | |
Equity | | | Written option contracts, at value | | | — | | | 23,170 |
Total Derivatives not accounted for as hedging instruments | | | | | | $171,409 | | | $23,170 |
Kurv Yield Premium Strategy Microsoft (MSFT) ETF
| | | | | | | | | |
Purchased Option Contracts:
| | | | | | | | | |
Equity | | | Investments, at value | | | $— | | | $— |
Written Option Contracts:
| | | | | | | | | |
Equity | | | Written option contracts, at value | | | — | | | 45,788 |
Total Derivatives not accounted for as hedging instruments | | | | | | $— | | | $45,788 |
Kurv Yield Premium Strategy Netflix (NFLX) ETF
| | | | | | | | | |
Purchased Option Contracts:
| | | | | | | | | |
Equity | | | Investments, at value | | | $57,690 | | | $— |
Written Option Contracts:
| | | | | | | | | |
Equity | | | Written option contracts, at value | | | — | | | 50,506 |
Total Derivatives not accounted for as hedging instruments | | | | | | $57,690 | | | $50,506 |
Kurv Yield Premium Strategy (TSLA) Tesla ETF
| | | | | | | | | |
Purchased Option Contracts:
| | | | | | | | | |
Equity | | | Investments, at value | | | $139,071 | | | $— |
Written Option Contracts:
| | | | | | | | | |
Equity | | | Written option contracts, at value | | | — | | | 379,235 |
Total Derivatives not accounted for as hedging instruments | | | | | | $139,071 | | | $379,235 |
| | | | | | | | | | |
Statements of Operations
The effect of derivative instruments on the Statements of Operations for the period ended May 31, 2024:
| | | | |
Kurv Yield Premium Strategy Amazon (AMZN) ETF
|
Derivatives Not Accounted for as Hedging Instruments
|
Equity Contracts | | | $ 112,120 | | | $ 67,538 | | | $ 179,658 |
Total | | | $112,120 | | | $67,538 | | | $179,658 |
| | | | | | | | | | |
Back to Table of Contents
NEOS ETF Trust
Notes to the Financial Statements
May 31, 2024 (Continued)
| | | | |
Kurv Yield Premium Strategy Apple (AAPL) ETF
|
Derivatives Not Accounted for as Hedging Instruments
|
Equity Contracts | | | $ 22,267 | | | $(47,990) | | | $ (25,723) |
Total | | | $22,267 | | | $(47,990) | | | $(25,723) |
Kurv Yield Premium Strategy Google (GOOGL) ETF
|
Derivatives Not Accounted for as Hedging Instruments
|
Equity Contracts | | | $ 29,678 | | | $ 46,357 | | | $76,035 |
Total | | | $29,678 | | | $46,357 | | | $76,035 |
Kurv Yield Premium Strategy Microsoft (MSFT) ETF
|
Derivatives Not Accounted for as Hedging Instruments
|
Equity Contracts | | | $ 20,853 | | | $ 48,797 | | | $69,650 |
Total | | | $20,853 | | | $48,797 | | | $69,650 |
| | | | | | | | | | |
| |
Kurv Yield Premium Strategy Netflix (NFLX) ETF
|
Derivatives Not Accounted for as Hedging Instruments
|
Equity Contracts | | | $ 135,658 | | | $ (5,157) | | | $ 130,501 |
Total | | | $135,658 | | | $ (5,157) | | | $130,501 |
| | | | | | | | | | |
| | |
Kurv Yield Premium Strategy Tesla (TSLA) ETF
| |
Derivatives Not Accounted for as Hedging Instruments
| |
Equity Contracts | | | $ (66,231) | | | $ (173,912) | | | $ (240,143) |
Total | | | $(66,231) | | | $(173,912) | | | $ (240,143) |
| | | | | | | | | | |
| | | | |
Kurv Yield Premium Strategy Amazon (AMZN) ETF
|
Derivatives Not Accounted for as Hedging Instruments
|
Equity Contracts | | | $ (47,113) | | | $ 607 | | | $ (46,506 ) |
Total | | | $(47,113) | | | $607 | | | $(46,506 ) |
| | | | | | | | | | |
| |
Kurv Yield Premium Strategy Apple (AAPL) ETF
|
Derivatives Not Accounted for as Hedging Instruments
|
Equity Contracts | | | $ 44,178 | | | $ 31,130 | | | $ 75,308 |
Total | | | $44,178 | | | $31,130 | | | $75,308 |
| | | | | | | | | | |
| |
Kurv Yield Premium Strategy Google (GOOGL) ETF
|
Derivatives Not Accounted for as Hedging Instruments
|
Equity Contracts | | | $ 43,267 | | | $ 44,849 | | | $ 88,116 |
Total | | | $43,267 | | | $44,849 | | | $88,116 |
| | | | | | | | | | |
Back to Table of Contents
NEOS ETF Trust
Notes to the Financial Statements
May 31, 2024 (Continued)
| | | | |
Kurv Yield Premium Strategy Microsoft (MSFT) ETF
|
Derivatives Not Accounted for as Hedging Instruments
|
Equity Contracts | | | $ 294 | | | $ 6,957 | | | $ 7,251 |
Total | | | $294 | | | $6,957 | | | $7,251 |
Kurv Yield Premium Strategy Netflix (NFLX) ETF
|
Derivatives Not Accounted for as Hedging Instruments
|
Equity Contracts | | | $ 10,196 | | | $ 53,439 | | | $ 63,635 |
Total | | | $10,196 | | | $53,439 | | | $63,635 |
| | | | | | | | | | |
| |
Kurv Yield Premium Strategy Tesla (TSLA) ETF
|
Derivatives Not Accounted for as Hedging Instruments
|
Equity Contracts | | | $ (83,257) | | | $ 65,400 | | | $ (17,857) |
Total | | | $(83,257) | | | $65,400 | | | $(17,857) |
| | | | | | | | | | |
*
| The amounts disclosed are included in the realized gain (loss) on investments in securities. |
**
| The amounts disclosed are included in the change in unrealized appreciation (depreciation) on investments in securities. |
I.
| Reclassification of Capital Accounts. GAAP requires that certain components of net assets relating to permanent differences be reclassified between financial and tax reporting. |
For the year ended May 31, 2024, there were no reclass adjustments.
NOTE 3 – INVESTMENT ADVISORY AND OTHER AGREEMENTS
Management
The Adviser acts as each Fund’s investment adviser pursuant to an investment advisory agreement with the Trust (the “Investment Advisory Agreement”).
NEOS Investment Management, LLC acts as the sub-adviser to each of the Funds pursuant to investment sub-advisory agreement with the Adviser (the “Sub-Advisory-Agreement”).
Under the terms of the Investment Advisory Agreement between the Trust, on behalf of the Funds, and the Adviser, the Adviser provides investment management services to the Funds and is responsible for the day-to-day operations of the Funds, subject to the oversight of the Board of Trustees (the “Board”) and the officers of the Trust. The Adviser administers the Funds’ business affairs, provides office facilities and equipment and certain clerical, bookkeeping and administrative services. The Adviser, on behalf of the Funds, has entered into a Sub-Advisory Agreement with the Sub-Adviser. The Sub-Adviser is responsible for the day-to-day management of each Fund’s portfolio, subject to the supervision and oversight of the Adviser and the Board. The Adviser oversees the Sub-Adviser for compliance with the Funds’ investment objectives, policies, strategies and restrictions. The Board oversees the Adviser and the Sub-Adviser, establishes policies that they must follow in their advisory activities, and oversees the hiring and termination of sub-adviser recommended by the Adviser.
Pursuant to the Investment Advisory Agreement, each Fund pays the Adviser a monthly unitary management fee at an annual rate of 1.15%, based on each Fund’s average daily net assets.
Back to Table of Contents
NEOS ETF Trust
Notes to the Financial Statements
May 31, 2024 (Continued)
Under the Investment Advisory Agreement, the Adviser has agreed to pay all expenses incurred by the Funds except for the management fee, interest, taxes, brokerage commissions and other expenses incurred in placing orders for the purchase and sale of securities and other investment instruments, acquired fund fees and expenses (“AFFE”), extraordinary expenses, and distribution fees and expenses paid by the Funds under any distribution plan adopted pursuant to Rule 12b-1 under the 1940 Act.
Pursuant to the Sub-Advisory Agreement, the Adviser compensates the Sub-Adviser out of the management fees it receives from the Funds.
The Adviser has contractually agreed to waive its fees and reimburse expenses to the extent necessary to keep total annual operating expenses of each Fund (excluding amounts payable pursuant to any plan adopted in accordance with Rule 12b-1, interest expense, taxes, brokerage commissions, other expenditures which are capitalized in accordance with generally accepted accounting principles, and extraordinary expenses) from exceeding 0.99% of the average daily net assets of each Fund until at least December 31, 2024, unless earlier terminated by the Board of Trustees (the “Board”) of NEOS ETF Trust (the “Trust”) with 60 days’ written notice to the Adviser. The Adviser may not terminate the fee waiver during the contractual period.
For the period ended May 31, 2024, the table below represents the amount each Fund incurred in management fees:
| | | | |
Kurv Yield Premium Strategy Amazon (AMZN) ETF | | | $5,133 |
Kurv Yield Premium Strategy Apple (AAPL) ETF | | | 3,767 |
Kurv Yield Premium Strategy Google (GOOGL) ETF | | | 4,317 |
Kurv Yield Premium Strategy Microsoft (MSFT) ETF | | | 4,592 |
Kurv Yield Premium Strategy Netflix (NFLX) ETF | | | 4,234 |
Kurv Yield Premium Strategy Tesla (TSLA) ETF | | | 8,898 |
| | | | |
Each Fund has agreed that it will repay the Adviser for fees and expenses waived or reimbursed for each Fund pursuant to the contractual expense limitation described above. Such repayment would increase each Fund’s expenses and would appear on the Statements of Operations as “Repayment of prior expenses waived and/or reimbursed by the Adviser.” However, repayment would only occur up to the point of each Fund’s expense cap.
Any such repayment must be made within three years from the date the expense was borne by the Adviser. Any such repayment made under any prior expense cap cannot cause each Fund’s Operating Expenses to exceed the lower of 0.99% of average daily net assets or the annual rate of daily net assets for each Fund under the terms of a prior expense cap. For the period ended May 31, 2024, the Funds did not repay expenses to the Adviser.
Back to Table of Contents
NEOS ETF Trust
Notes to the Financial Statements
May 31, 2024 (Continued)
As of May 31, 2024, the amounts eligible for repayment and the associated period of expiration are as follows:
| | | | |
Kurv Yield Premium Strategy Amazon (AMZN) ETF | | | $714 |
Kurv Yield Premium Strategy Apple (AAPL) ETF | | | 524 |
Kurv Yield Premium Strategy Google (GOOGL) ETF | | | 601 |
Kurv Yield Premium Strategy Microsoft (MSFT) ETF | | | 639 |
Kurv Yield Premium Strategy Netflix (NFLX) ETF | | | 589 |
Kurv Yield Premium Strategy Tesla (TSLA) ETF | | | 1,238 |
| | | | |
* Represents total eligible renouncement available for the amounts that were waived in the current fiscal period.
Administrator, Custodian, Transfer Agent and Accounting Agent
U.S. Bancorp Fund Services, LLC dba U.S. Bank Global Fund Services (“Fund Services”), an indirect wholly-owned subsidiary of U.S. Bancorp, serves as the Funds’ administrator and, in that capacity performs various administrative and accounting services for the Funds. Fund Services also serves as the Funds’ fund accountant, transfer agent, dividend disbursing agent and registrar. Fund Services prepares various federal and state regulatory filings, reports and returns for the Funds, including regulatory compliance monitoring and financial reporting; prepares reports and materials to be supplied to the trustees; monitors the activities of the Funds’ custodian, transfer agent and accountants; reviews the Funds’ advisory fee expense accrual and coordinates the preparation and payment of the advisory fees. U.S. Bank, N.A., an affiliate of Fund Services, serves as the Funds’ custodian. For the period ended May 31, 2024, there were no fees incurred from the service providers described above as the Adviser bore all such costs.
Distributor and Fund Officers
Foreside Fund Services, LLC (the “Distributor”) serves as the principal underwriter for shares of the Funds and acts as each Fund’s distributor in a continuous public offering of the Funds’ shares and serves as the distributor of Creation Units for the Funds. Shares are continuously offered for sale by the Trust through the Distributor only in Creation Units, as described further in Note 7. Shares in less than Creation Units are not distributed by the Distributor. The Distributor is a broker-dealer registered under the Securities Exchange Act of 1934, as amended, and a member of the Financial Industry Regulatory Authority, Inc. (“FINRA”).
Foreside Fund Officer Services, LLC, an affiliate of the Distributor, provides the Trust with a Chief Compliance Officer and Principal Financial Officer.
NOTE 4 – RELATED PARTIES
As of May 31, 2024, certain officers of the Trust were affiliated with the Distributor, and received no fees from the Trust for serving as officers.
NOTE 5 – PURCHASES AND SALES OF SECURITIES
The costs of purchases and sales of securities, excluding short-term securities and in-kind transactions, during the period ended May 31, 2024, were as follows:
| | | | | | | |
Kurv Yield Premium Strategy Amazon (AMZN) ETF | | | $ — | | | $ — |
Kurv Yield Premium Strategy Apple (AAPL) ETF | | | — | | | — |
Kurv Yield Premium Strategy Google (GOOGL) ETF | | | — | | | — |
Kurv Yield Premium Strategy Microsoft (MSFT) ETF | | | — | | | — |
Kurv Yield Premium Strategy Netflix (NFLX) ETF | | | — | | | — |
Kurv Yield Premium Strategy Tesla (TSLA) ETF | | | — | | | — |
| | | | | | | |
Back to Table of Contents
NEOS ETF Trust
Notes to the Financial Statements
May 31, 2024 (Continued)
The costs of purchases and sales of in-kind transactions, during the period ended May 31, 2024, were as follows:
| | | | | | | |
Kurv Yield Premium Strategy Amazon (AMZN) ETF | | | $ — | | | $ — |
Kurv Yield Premium Strategy Apple (AAPL) ETF | | | — | | | — |
Kurv Yield Premium Strategy Google (GOOGL) ETF | | | — | | | — |
Kurv Yield Premium Strategy Microsoft (MSFT) ETF | | | — | | | — |
Kurv Yield Premium Strategy Netflix (NFLX) ETF | | | — | | | — |
Kurv Yield Premium Strategy Tesla (TSLA) ETF | | | — | | | — |
| | | | | | | |
NOTE 6 – TAX MATTERS
The tax character of the distributions paid during the period ended May 31, 2024 are as follows:
| | | | | | | |
Kurv Yield Premium Strategy Amazon (AMZN) ETF | | | $71,233 | | | $— |
Kurv Yield Premium Strategy Apple (AAPL) ETF | | | 14,385 | | | 25,322 |
Kurv Yield Premium Strategy Google (GOOGL) ETF | | | 53,148 | | | — |
Kurv Yield Premium Strategy Microsoft (MSFT) ETF | | | 47,557 | | | — |
Kurv Yield Premium Strategy Netflix (NFLX) ETF | | | 64,774 | | | — |
Kurv Yield Premium Strategy Tesla (TSLA) ETF | | | 41,431 | | | 179,927 |
| | | | | | | |
Net capital losses incurred after October 31 and late year losses incurred after December 31 and within the taxable year are deemed to arise on the first business day of each Fund’s next taxable year. For the period ended May 31, 2023, the Funds did not have any late year losses nor post October losses. Capital loss carry forwards will retain their character as either short-term or long-term capital losses. At May 31, 2024, the following capital loss carry forwards were available:
| | | | | | | | | | |
Kurv Yield Premium Strategy Amazon (AMZN) ETF | | | $— | | | $ — | | | $— |
Kurv Yield Premium Strategy Apple (AAPL) ETF | | | 25,724 | | | — | | | 25,724 |
Kurv Yield Premium Strategy Google (GOOGL) ETF | | | — | | | — | | | — |
Kurv Yield Premium Strategy Microsoft (MSFT) ETF | | | — | | | — | | | — |
Kurv Yield Premium Strategy Netflix (NFLX) ETF | | | — | | | — | | | — |
Kurv Yield Premium Strategy Tesla (TSLA) ETF | | | 240,143 | | | — | | | 240,143 |
| | | | | | | | | | |
As of May 31, 2024, the components of accumulated earnings (losses) for income tax purposes were as follows:
| | | | | | | | | | |
Federal income tax cost of investments | | | $1,217,750 | | | $690,913 | | | $1,439,862 |
Aggregate gross unrealized appreciation | | | 1,031 | | | 75,309 | | | 99,896 |
Aggregate gross unrealized (depreciation) | | | (47,537) | | | — | | | (11,780) |
Net unrealized appreciation (depreciation) | | | (46,506) | | | 75,309 | | | 88,116 |
Undistributed Ordinary Income | | | 127,038 | | | — | | | 38,711 |
Undistributed Long Term Capital Gains | | | — | | | — | | | — |
Distributable Earnings | | | 127,038 | | | — | | | 38,711 |
| | | | | | | | | | |
Back to Table of Contents
NEOS ETF Trust
Notes to the Financial Statements
May 31, 2024 (Continued)
| | | | | | | | | | |
Accumulated capital and other gain/(loss) | | | $ — | | | $ (25,724) | | | $ 1 |
Total distributable earnings (accumulated loss) | | | 80,532 | | | 49,585 | | | 126,828 |
| | | | | | | | | | |
| | | | | | | | | | |
Federal income tax cost of investments | | | $1,086,206 | | | $877,547 | | | $2,922,803 |
Aggregate gross unrealized appreciation | | | 7,251 | | | 63,656 | | | 66,214 |
Aggregate gross unrealized (depreciation) | | | — | | | (21) | | | (84,071) |
Net unrealized appreciation (depreciation) | | | 7,251 | | | 63,635 | | | (17,857) |
Undistributed Ordinary Income | | | 39,044 | | | 81,133 | | | — |
Undistributed Long Term Capital Gains | | | — | | | — | | | — |
Distributable Earnings | | | 39,044 | | | 81,133 | | | — |
Accumulated capital and other gain/(loss) | | | — | | | — | | | (240,143) |
Total distributable earnings (accumulated loss) | | | 46,295 | | | 144,768 | | | (258,000) |
| | | | | | | | | | |
NOTE 7 – SHARE TRANSACTIONS
Each Fund currently offers one class of shares, which has no front-end sales loads, no deferred sales charges, and no redemption fees. The standard fixed transaction fees for the Kurv Yield Premium Strategy Amazon (AMZN) ETF, Kurv Yield Premium Strategy Apple (AAPL) ETF, Kurv Yield Premium Strategy Google (GOOGL) ETF, Kurv Yield Premium Strategy Microsoft (MSFT) ETF, Kurv Yield Premium Strategy Netflix (NFLX) ETF and Kurv Yield Premium Strategy Tesla (TSLA) ETF are $300, payable to the Custodian. Additionally, a variable transaction fee may be charged by the Funds of up to a maximum of 2% of the value of the Creation Units (inclusive of any transaction fees charged), for each creation or redemption. Variable transaction fees are imposed to compensate the Funds for the transaction costs associated with creation and redemption transactions. The Adviser may adjust or waive the transaction fees from time to time. The Funds may each issue an unlimited number of shares of beneficial interest, with no par value. All shares of the Funds have equal rights and privileges.
Shares of the Kurv Yield Premium Strategy Amazon (AMZN) ETF, Kurv Yield Premium Strategy Apple (AAPL) ETF, Kurv Yield Premium Strategy Google (GOOGL) ETF, Kurv Yield Premium Strategy Microsoft (MSFT) ETF, Kurv Yield Premium Strategy Netflix (NFLX) ETF and Kurv Yield Premium Strategy Tesla (TSLA) ETF are listed and traded on the CBOE BZX Exchange, Inc. (the “Exchange”). Market prices for the Shares may be different from their NAV. The Funds will issue and redeem Shares on a continuous basis at NAV only in large blocks of Shares, typically 10,000 Shares, called “Creation Units.” Creation Unit transactions are conducted in exchange for the deposit or delivery of a designated basket of in-kind securities and/or cash. Once created, Shares generally will trade in the secondary market in amounts less than a Creation Unit and at market prices that change throughout the day. Except when aggregated in Creation Units, shares are not redeemable securities of the Funds. Shares of the Funds may only be purchased or redeemed by certain financial institutions (“Authorized Participants”). An Authorized Participant is either (i) a broker-dealer or other participant in the clearing process through the Continuous Net Settlement System of the National Securities Clearing Corporation (“NSCC”) or (ii) a participant in the Depository Trust Company (“DTC”) and, in each case, must have executed a Participant Agreement with the Funds’ Distributor. Most retail investors will not qualify as Authorized Participants or have the resources to buy and sell whole Creation Units. Therefore, they will be unable to purchase or redeem shares directly from the Funds. Rather, most retail investors will purchase shares in the secondary market with the assistance of a broker and will be subject to customary brokerage commissions or fees.
Back to Table of Contents
NEOS ETF Trust
Notes to the Financial StatementS
May 31, 2024
Note 8 – BENEFICIAL OWNERSHIP
The beneficial ownership, either directly or indirectly, of more than 25% of the voting securities of a fund creates a presumption of control of the fund, under Section 2(a)(9) of the 1940 Act. As of the date of these financial statements, Kurv Investment Management LLC, the advisor to Kurv Yield Premium Strategy Amazon (AMZN) ETF, Kurv Yield Premium Strategy Apple (AAPL) ETF, Kurv Yield Premium Strategy Google (GOOGL) ETF, Kurv Yield Premium Strategy Microsoft (MSFT) ETF, Kurv Yield Premium Strategy Netflix (NFLX) ETF and Kurv Yield Premium Strategy Tesla (TSLA) ETF has no voting power of the shares outstanding of the Funds. Additionally, as of the date of these financial statements, NEOS Investment Management, LLC, the sub-adviser to the Kurv Yield Premium Strategy Amazon (AMZN) ETF, Kurv Yield Premium Strategy Apple (AAPL) ETF, Kurv Yield Premium Strategy Google (GOOGL) ETF, Kurv Yield Premium Strategy Microsoft (MSFT) ETF, Kurv Yield Premium Strategy Netflix (NFLX) ETF and Kurv Yield Premium Strategy Tesla (TSLA) ETF, has no voting power of the shares outstanding of the Funds.
Note 9 – PRINCIPAL RISKS
As with all ETFs, shareholders of the Funds are subject to the risk that their investment could lose money. The Funds are subject to the principal risks, any of which may adversely affect each Fund’s NAV, trading price, yield, total return and ability to meet their investment objectives.
This section discusses certain principal risks encounter by the Funds.
Single Issuer Risk. Issuer-specific attributes may cause an investment in the Funds to be more volatile than a traditional pooled investment which diversifies risk or the market generally. The value of each Fund, which focuses on an individual security, may be more volatile than a traditional pooled investment or the market as a whole and may perform differently from the value of a traditional pooled investment or the market as a whole.
Indirect Investment in AMZN Risk. Amazon faces risks associated with intense competition across different industries, including physical, e-commerce omnichannel retail, e-commerce services, web and infrastructure computing services, electronic devices, digital content, advertising, grocery, and transportation and logistics services; the expansion into new products, services, technologies and geographic regions; its international activities; the variability in the demand for its products and services; intellectual property rights; risks relating to successfully optimizing and operating its fulfilment network and data centers; data loss or other security breaches; maintaining key senior management personnel and the ability to hire and retain highly skilled and other key personnel; maintaining good supplier relationships, including content and technology licensors; the success of acquisitions or joint ventures or other investments; its rapidly evolving and expanding business model; and legal, regulatory and litigation issues.
Indirect Investment in APPL Risk. Apple’s business can be impacted by political events, trade and other international disputes, war, terrorism, natural disasters, public health issues, industrial accidents and other business interruptions. Global markets for Apple’s products and services are highly competitive and subject to rapid technological change, and the company may be unable to compete effectively in these markets.
Indirect Investment in GOOGL Risk. Google generates a significant portion of its revenues from advertising, and reduced spending by advertisers, a loss of partners, or new and existing technologies that block ads online and/or affect its ability to customize ads could harm its business. Google’s ongoing investment in new businesses, products, services, and technologies is inherently risky, and could divert management attention and harm its financial condition and operating results.
Indirect Investment in MSFT Risk. Microsoft Corporation is not affiliated with the Trust, the Fund, the Adviser, the Sub-Adviser, or their respective affiliates and is not involved with this offering in any way and has no obligation to consider your Shares in taking any corporate actions that might affect the value of Shares. Investors in the Fund will not have voting rights and will not be able to influence management of Microsoft Corporation but will be exposed to the performance of MSFT (the underlying stock). Investors in the Fund will not have rights to receive dividends or other distributions or any other rights with respect to the underlying stock but will be subject to declines in the performance of the underlying stock. MSFT Trading Risk. The trading price of MSFT may be highly volatile and could continue to be subject to wide fluctuations in response to various factors.
Back to Table of Contents
NEOS ETF Trust
Notes to the Financial StatementS
May 31, 2024 (Continued)
Indirect Investment in NFLX Risk. Netflix, Inc. faces risks related to maintaining and expanding membership for its streaming services; competition in the entertainment video market; disruptions from the ongoing COVID-19 pandemic; unforeseen costs or liability in connection with content that is acquired, produced, licensed and/or distributed through its service; the ability to manage change and growth in its business; costs and challenges associated with strategic acquisitions and investments; regulatory changes and legal issues; protecting its intellectual property; consumer data privacy issues; and network operators handling and changing data access.
Indirect Investment in TSLA Risk. Tesla, Inc. is not affiliated with the Trust, the Fund, the Adviser, the Sub-Adviser, or their respective affiliates and is not involved with this offering in any way and has no obligation to consider your Shares in taking any corporate actions that might affect the value of Shares. Investors in the Fund will not have voting rights and will not be able to influence management of Tesla, Inc. but will be exposed to the performance of TSLA (the underlying stock). Investors in the Fund will not have rights to receive dividends or other distributions or any other rights with respect to the underlying stock but will be subject to declines in the performance of the underlying stock. TSLA Trading Risk. The trading price of TSLA may be highly volatile and could continue to be subject to wide fluctuations in response to various factors.
A more complete description of the principal risks to which each Fund is subject is included in the Funds’ prospectus under the heading “Principal Risks of Investing”.
Note 10 – GUARANTEES AND INDEMNIFICATIONS
In the normal course of business, the Trust, on behalf of the Funds, enters into contracts with third-party service providers that contain a variety of representations and warranties and that provide general indemnifications. Additionally, under the Trust organizational documents, the officers and Trustees are indemnified against certain liabilities arising out of the performance of their duties to the Trust. The Funds’ maximum exposure under these arrangements is unknown, as it involves possible future claims that may or may not be made against the Funds. The Adviser is of the view that the risk of loss to the Funds in connection with the Funds’ indemnification obligations is remote; however, there can be no assurance that such obligations will not result in material liabilities that adversely affect the Funds.
Note 11 – Payments by Affiliates
During the period ended May 31, 2024, Kurv Yield Premium Strategy Tesla (TSLA) ETF had a trade error which resulted in a $17, 250 loss to the Fund. The Sub-Advisor reimbursed the Fund $17,250 for the amount of the trade error. If the fund had not been reimbursed for the amount of the trade error, the total return would be (8.25%), for a total return reduction of (0.54%).
Note 12 – SUBSEQUENT EVENTS
Management has evaluated subsequent events and transactions for potential recognition or disclosure through the date the financial statements were issued and has determined that there are no material events that would require recognition of disclosure in the Funds’ financial statements.
Back to Table of Contents
REPORT OF INDEPENDENT REGISTERED PUBLIC ACCOUNTING FIRM
To the Shareholders of Kurv ETFs and
Board of Trustees of NEOS ETF Trust
Opinion on the Financial Statements
We have audited the accompanying statements of assets and liabilities, including the schedules of investments and written options (as applicable), of Kurv ETFs (the “Funds”) comprising of the Funds listed below, each a series of NEOS ETF Trust, as of May 31, 2024, and the related statements of operations and changes in net assets, the financial highlights for each of the periods indicated below (collectively referred to as the “financial statements”) and related notes. In our opinion, the financial statements present fairly, in all material respects, the financial position of the Funds as of May 31, 2024, the results of their operations, the changes in net assets, and the financial highlights for each of the periods indicated below in conformity with accounting principles generally accepted in the United States of America.
| | | | | | | | | | |
Kurv Yield Premium Strategy Apple (AAPL) ETF, Kurv Yield Premium Strategy Netflix (NFLX) ETF, and Kurv Yield Premium Strategy Tesla (TSLA) ETF | | | For the period from October 27, 2023 (commencement
of operations) through May 31, 2024 |
Kurv Yield Premium Strategy Amazon (AMZN) ETF, Kurv Yield Premium Strategy Google (GOOGL) ETF, and Kurv Yield Premium Strategy Microsoft (MFST) ETF | | | For the period from October 31, 2023 (commencement
of operations) through May 31, 2024 |
| | | | |
Basis for Opinion
These financial statements are the responsibility of the Funds’ management. Our responsibility is to express an opinion on the Funds’ financial statements based on our audits. We are a public accounting firm registered with the Public Company Accounting Oversight Board (United States) (“PCAOB”) and are required to be independent with respect to the Funds in accordance with the U.S. federal securities laws and the applicable rules and regulations of the Securities and Exchange Commission and the PCAOB.
We conducted our audits in accordance with the standards of the PCAOB. Those standards require that we plan and perform the audits to obtain reasonable assurance about whether the financial statements are free of material misstatement whether due to error or fraud.
Our audits included performing procedures to assess the risks of material misstatement of the financial statements, whether due to error or fraud, and performing procedures that respond to those risks. Such procedures included examining, on a test basis, evidence regarding the amounts and disclosures in the financial statements. Our procedures included confirmation of securities owned as of May 31, 2024, by correspondence with the custodian and brokers. Our audits also included evaluating the accounting principles used and significant estimates made by management, as well as evaluating the overall presentation of the financial statements. We believe that our audits provide a reasonable basis for our opinion.
We have served as the auditor of one or more of the Funds in the NEOS ETF Trust since 2023.
COHEN & COMPANY, LTD.
Philadelphia, Pennsylvania
July 29, 2024
Back to Table of Contents
NEOS ETF Trust
Other Non-Audited Information
TAX INFORMATION
For the fiscal year ended May 31, 2024, certain dividends paid by the Funds may be subject to reduced tax rates, as provided for by the Jobs and Growth Tax Relief Reconciliation Act of 2003. The percentage of dividends declared from ordinary income designated as qualified dividend income was as follows:
| | | | |
Kurv Yield Premium Strategy Amazon (AMZN) ETF | | | 0.00% |
Kurv Yield Premium Strategy Apple (AAPL) ETF | | | 0.00% |
Kurv Yield Premium Strategy Google (GOOGL) ETF | | | 0.00% |
Kurv Yield Premium Strategy Microsoft (MSFT) ETF | | | 0.00% |
Kurv Yield Premium Strategy Netflix (NFLX) ETF | | | 0.00% |
Kurv Yield Premium Strategy Tesla (TSLA) ETF | | | 0.00% |
| | | | |
For corporate shareholders, the percent of ordinary income distributions qualifying for the corporate dividends received deduction for the year ended May 31, 2024 were as follows:
| | | | |
Kurv Yield Premium Strategy Amazon (AMZN) ETF | | | 0.00% |
Kurv Yield Premium Strategy Apple (AAPL) ETF | | | 0.00% |
Kurv Yield Premium Strategy Google (GOOGL) ETF | | | 0.00% |
Kurv Yield Premium Strategy Microsoft (MSFT) ETF | | | 0.00% |
Kurv Yield Premium Strategy Netflix (NFLX) ETF | | | 0.00% |
Kurv Yield Premium Strategy Tesla (TSLA) ETF | | | 0.00% |
| | | | |
For the year ended May 31, 2024, the percentage of taxable ordinary income distributions that are designated as short-term capital gain distributions under Internal Revenue Code Section 871(k)(2)(C) for the Funds were as follows:
| | | | |
Kurv Yield Premium Strategy Amazon (AMZN) ETF | | | 73.87% |
Kurv Yield Premium Strategy Apple (AAPL) ETF | | | 0.00% |
Kurv Yield Premium Strategy Google (GOOGL) ETF | | | 70.23% |
Kurv Yield Premium Strategy Microsoft (MSFT) ETF | | | 64.36% |
Kurv Yield Premium Strategy Netflix (NFLX) ETF | | | 76.22% |
Kurv Yield Premium Strategy Tesla (TSLA) ETF | | | 0.00% |
| | | | |
FREQUENCY DISTRIBUTION OF PREMIUMS AND DISCOUNTS
Information regarding how often shares of the Funds traded on the Exchanges at a price above (i.e., at a premium) or below (i.e., at a discount) the NAV of the Funds are available on the Funds’ website at www.kurvinvest.com.
HOUSEHOLDING
Householding is an option available to certain fund investors. Householding is a method of delivery, based on the preference of the individual investor, in which a single copy of certain shareholder documents can be delivered to investors who share the same address, even if their accounts are registered under different names. Please contact your broker-dealer if you are interested in enrolling in householding and receiving a single copy of the prospectuses and other shareholder documents, or if you are currently enrolled in householding and wish to change your householding status.
DISCLOSURE OF PORTFOLIO HOLDINGS
The Funds file their complete schedules of portfolio holdings with the Securities and Exchange Commission (“SEC”) for the first and third quarters of each fiscal year to date as exhibits to their reports on Form N-PORT. The Funds’ Form N-PORT reports are available on the SEC’s website at www.sec.gov. They may also be reviewed and copied at the SEC’s Public Reference Room in Washington, D.C. Information about the Public Reference Room may be obtained by calling 1-800-SEC-0330. In addition, the Funds’ full portfolio holdings are updated daily and available on the Funds’ website at www.kurvinvest.com.
Back to Table of Contents
NEOS ETF Trust
Other Non-Audited Information (Continued)
PROXY VOTING POLICIES AND PROCEDURES
A description of the policies and procedures the Funds uses to determine how to vote proxies relating to portfolio securities is provided in the Statements of Additional Information (“SAIs”). The SAI is available without charge upon request by calling toll-free at (833) 833-1311, by accessing the SEC’s website at http://www.sec.gov, or by accessing the Funds’ website at www.kurvinvest.com. Information on how the Funds’ voted proxies relating to portfolio securities during the most recent 12-month period ended June 30 are available without charge, upon request, by calling (833) 833-1311 or by accessing the website of the SEC.
TRUSTEES AND OFFICERS
Information regarding the Trustees and Officer is provided in the SAI. The SAI is available without charge upon request by calling toll-free at (833) 833-1311, by accessing the SEC’s website at http://www.sec.gov, or by accessing the Fund’s website at www.kurvinvest.com.
Back to Table of Contents
NEOS ETF Trust
Changes in and Disagreements with Accountants for Open-End Management Investment Companies (Unaudited)
An open-end management investment company registered on Form N-1A [17 CFR 239.15A and 17 CFR 274.11A] must disclose the information concerning changes in and disagreements with accountants and on accounting and financial disclosure required by Item 304 of Regulation S-K [17 CFR 229.304].
Response: This is not applicable to the Registrant.
Back to Table of Contents
NEOS ETF Trust
Proxy Disclosures for Open-End Management Investment Companies (Unaudited)
If any matter was submitted during the period covered by the report to a vote of shareholders of an open-end management investment company registered on Form N-1A [17 CFR 239.15A and 17 CFR 274.11A], through the solicitation of proxies or otherwise, the company must furnish the following information:
(1)
| The date of the meeting and whether it was an annual or special meeting. |
(2)
| If the meeting involved the election of directors, the name of each director elected at the meeting and the name of each other director whose term of office as a director continued after the meeting. |
(3)
| A brief description of each matter voted upon at the meeting and the number of votes cast for, against or withheld, as well as the number of abstentions and broker non-votes as to each such matter, including a separate tabulation with respect to each matter or nominee for office. |
Response: This is not applicable to the Registrant.
Back to Table of Contents
NEOS ETF Trust
Remuneration Paid to Directors, Officers, and Others of Open-End Management Investment Companies (Unaudited)
Unless the following information is disclosed as part of the financial statements included in Item 7, an open-end management investment company registered on Form N-1A [17 CFR 239.15A and 17 CFR 274.11A] must disclose the aggregate remuneration paid by the company during the period covered by the report to:
(1)
| All directors and all members of any advisory board for regular compensation; |
(2)
| Each director and each member of an advisory board for special compensation; |
(4)
| Each person of whom any officer or director of the Fund is an affiliated person |
Response: Each current Independent Trustee is paid an annual retainer of $19,000 for his or her services as a Board member to the Trust, together with out-of-pocket expenses in accordance with the Board’s policy on travel and other business expenses relating to attendance at meetings.
Independent Trustee fees are paid by the adviser to each series of the Trust through the applicable adviser’s unitary management fee, and not by the Fund. Annual Trustee fees may be reviewed periodically and changed by the Board.
The Trust does not have a bonus, profit sharing, pension or retirement plan.
Back to Table of Contents
NEOS ETF Trust
Statement Regarding Basis for Approval of Investment Advisory Contract (Unaudited)
If the board of directors approved any investment advisory contract during the Fund’s most recent fiscal half-year, discuss in reasonable detail the material factors and the conclusions with respect thereto that formed the basis for the board’s approval. Include the following in the discussion:
(1)
| Factors relating to both the board’s selection of the investment adviser and approval of the advisory fee and any other amounts to be paid by the Fund under the contract. These factors would include, but not be limited to, a discussion of the nature, extent, and quality of the services to be provided by the investment adviser; the investment performance of the Fund and the investment adviser; the costs of the services to be provided and profits to be realized by the investment adviser and its affiliates from the relationship with the Fund; the extent to which economies of scale would be realized as the Fund grows; and whether fee levels reflect these economies of scale for the benefit of Fund investors. Also indicate in the discussion whether the board relied upon comparisons of the services to be rendered and the amounts to be paid under the contract with those under other investment advisory contracts, such as contracts of the same 14 and other investment advisers with other registered investment companies or other types of clients (e.g., pension funds and other institutional investors). If the board relied upon such comparisons, describe the comparisons and how they assisted the board in concluding that the contract should be approved; and |
(2)
| If applicable, any benefits derived or to be derived by the investment adviser from the relationship with the Fund such as soft dollar arrangements by which brokers provide research to the Fund or its investment adviser in return for allocating Fund brokerage. |
Response: The Investment Advisory Contract was approved at the June 20, 2023, meeting of the Board of Trustees for a 2-year period. The contract will be renewed in 2025. No statement will be included in this report.
(b) Financial Highlights are included within the financial statements filed under Item 7(a) of this Form.
Item 8. Changes in and Disagreements with Accountants for Open-End Investment Companies.
Response included within Item 7(a) of this Form.
Item 9. Proxy Disclosure for Open-End Investment Companies.
Response included within Item 7(a) of this Form.
Item 10. Remuneration Paid to Directors, Officers, and Others of Open-End Investment Companies.
Response included within Item 7(a) of this Form.
Item 11. Statement Regarding Basis for Approval of Investment Advisory Contract.
Response included within Item 7(a) of this Form.
Item 12. Disclosure of Proxy Voting Policies and Procedures for Closed-End Management Investment Companies.
Not applicable to open-end investment companies.
Item 13. Portfolio Managers of Closed-End Management Investment Companies.
Not applicable to open-end investment companies.
Item 14. Purchases of Equity Securities by Closed-End Management Investment Company and Affiliated Purchasers.
Not applicable to open-end investment companies.
Item 15. Submission of Matters to a Vote of Security Holders.
There have been no material changes to the procedures by which shareholders may recommend nominees to the registrant’s board of Trustees.
Item 16. Controls and Procedures.
(a) The Registrant’s Principal Executive Officer and Principal Financial Officer have reviewed the Registrant’s disclosure controls and procedures (as defined in Rule 30a-3(c) under the Investment Company Act of 1940 (the “Act”)) as of a date within 90 days of the filing of this report, as required by Rule 30a-3(b) under the Act and Rules 13a-15(b) or 15d-15(b) under the
Securities Exchange Act of 1934. Based on their review, such officers have concluded that the disclosure controls and procedures are effective in ensuring that information required to be disclosed in this report is appropriately recorded, processed, summarized and reported and made known to them by others within the Registrant and by the Registrant’s service provider.
(b) There were no changes in the Registrant’s internal control over financial reporting (as defined in Rule 30a-3(d) under the Act) that occurred during the period covered by this report that have materially affected, or are reasonably likely to materially affect, the Registrant’s internal control over financial reporting.
Item 17. Disclosure of Securities Lending Activities for Closed-End Management Investment Companies.
Not applicable to open-end investment companies.
Item 18. Recovery of Erroneously Awarded Compensation.
(a) Not Applicable.
(b) Not Applicable.
Item 19. Exhibits.
(2) A separate certification for each principal executive officer and principal financial officer pursuant to Section 302 of the Sarbanes-Oxley Act of 2002. Filed herewith.
SIGNATURES
Pursuant to the requirements of the Securities Exchange Act of 1934 and the Investment Company Act of 1940, the registrant has duly caused this report to be signed on its behalf by the undersigned, thereunto duly authorized.
| | NEOS ETF Trust | |
| | | |
| | By: | /s/ Garrett Paolella | |
| | | Garrett Paolella | |
| | | President/Principal Executive Officer | |
Pursuant to the requirements of the Securities Exchange Act of 1934 and the Investment Company Act of 1940, this report has been signed below by the following persons on behalf of the registrant and in the capacities and on the dates indicated.
| | By: | /s/ Garrett Paolella | |
| | | Garrett Paolella | |
| | | President/Principal Executive Officer | |
| | By: | /s/ Josh Hunter | |
| | | Josh Hunter | |
| | | Treasurer/Principal Financial Officer | |