UNITED STATES
SECURITIES AND EXCHANGE COMMISSION
Washington, D.C. 20549
FORM N-CSR
CERTIFIED SHAREHOLDER REPORT OF REGISTERED
MANAGEMENT INVESTMENT COMPANIES
Investment Company Act file number (811-23645)
NEOS ETF Trust
(Exact name of registrant as specified in charter)
13 Riverside Avenue
Westport, CT 06880
(Address of principal executive offices) (Zip code)
Garrett Paolella, President
13 Riverside Avenue
Westport, CT 06880
(Name and address of agent for service)
(203) 298-7300
Registrant's telephone number, including area code
Date of fiscal year end: May 31
Date of reporting period: May 31, 2024
Item 1. Reports to Stockholders.
(a) A copy of the report transmitted to shareholders pursuant to Rule 30e-1 under the Investment Company Act of 1940, as amended (“Act”), is filed herewith.
| | |
| NEOS Enhanced Income 1-3 Month T-Bill ETF | |
| CSHI (Principal U.S. Listing Exchange: NYSE Arca) |
| Annual Shareholder Report | May 31, 2024 |
This annual shareholder report contains important information about the NEOS Enhanced Income 1-3 Month T-Bill ETF for the period of June 1, 2023 to May 31, 2024. You can find additional information about the Fund at www.neosfunds.com. You can also request this information by contacting us at (866) 498-5677.
WHAT WERE THE FUND COSTS FOR THE PAST YEAR? (based on a hypothetical $10,000 investment)
| | |
Fund Name | Costs of a $10,000 investment | Costs paid as a percentage of a $10,000 investment |
| NEOS Enhanced Income 1-3 Month T-Bill ETF | $39 | 0.38% |
HOW DID THE FUND PERFORM LAST YEAR AND WHAT AFFECTED ITS PERFORMANCE?
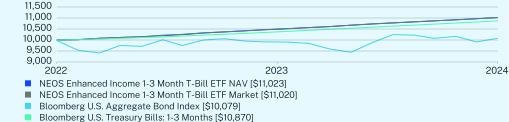
For the fiscal year ended May 31, 2024, the NEOS Enhanced Income 1-3 Month T Bill ETF market value return was 5.74% and its net asset value (“NAV”) return was 5.80% compared to its reference index, the Bloomberg 1-3 Month U.S. Treasury Bill Index, which returned 5.51%. The Fund’s market value per share as of the market close of the last trading day of the reporting period was $49.80. We believe the Fund’s outperformance relative to its reference index for the reporting period is attributable to the put options overlay, which generated additional monthly income for the Fund while maintaining tax efficiency.
HOW DID THE FUND PERFORM SINCE INCEPTION?
The $10,000 chart reflects a hypothetical $10,000 investment. The chart uses total return NAV performance and assumes reinvestment of dividends and capital gains. Fund expenses, including management fees were deducted.
CUMULATIVE PERFORMANCE (Initial Investment of $10,000)
ANNUAL AVERAGE TOTAL RETURN (%)
| | |
| | 1 Year | Since Inception
(08/30/2022) |
NEOS Enhanced Income 1-3 Month T-Bill ETF NAV | 5.80 | 5.71 |
NEOS Enhanced Income 1-3 Month T-Bill ETF Market | 5.74 | 5.70 |
Bloomberg U.S. Aggregate Bond Index | 1.31 | 0.45 |
Bloomberg U.S. Treasury Bills: 1-3 Months | 5.51 | 4.87 |
Visit www.neosfunds.com for more recent performance information.
The Fund’s past performance is not a good predictor of how the Fund will perform in the future. The graph and table do not reflect the deduction of taxes that a shareholder would pay on Fund distributions or redemption of Fund shares.
| NEOS Enhanced Income 1-3 Month T-Bill ETF | PAGE 1 | TSR_AR_78433H501 |
KEY FUND STATISTICS (as of May 31, 2024)
| |
Net Assets | $441,773,695 |
Number of Holdings | 23 |
Net Advisory Fee | $915,994 |
Portfolio Turnover | 0% |
30-Day SEC Yield | 5.06% |
30-Day SEC Yield Unsubsidized | 5.06% |
Distribution Yield | 5.54% |
Visit www.neosfunds.com for more recent performance information.
WHAT DID THE FUND INVEST IN? (as of May 31, 2024)
| |
Top 10 Issuers | (% of net assets) |
United States Treasury Bills | 99.8% |
First American Treasury Obligations Fund | 0.2% |
Northern U.S. Government Select Money Market Fund | 0.1% |
S&P 500 Index | 0.0% |
HOW HAS THE FUND CHANGED?
During the year the Fund changed its name from the NEOS Enhanced Income Cash Alternative ETF to the NEOS Enhanced Income 1-3 Month T-Bill ETF to better reflect the holdings of the ETF.
MANAGED DISTRIBUTIONS
While the NEOS Enhanced Income 1-3 Month T-Bill ETF does not have a specific level of distribution, the Fund seeks to generate monthly income in a tax efficient manner. During the period, 9% of the Fund’s distributions were treated as return of capital and 6% were treated as capital gains. Distributions in excess of the Fund’s current and accumulated earnings and profits are treated as a tax-free return of a shareholder’s investment to the extent of the shareholders basis in the Funds shares, and generally as capital gain thereafter. A return of capital, which for tax purposes is treated as a return of a shareholder’s investment, reduces a shareholder’s basis in the Funds shares, thus reducing any loss or increasing any gain on a subsequent taxable disposition of Fund shares.
For additional information about the Fund; including its prospectus, financial information, holdings and proxy information, scan the QR code or visit www.neosfunds.com
The Fund is distributed by Foreside Fund Services, LLC.
HOUSEHOLDING
To reduce Fund expenses, only one copy of most shareholder documents may be mailed to shareholders with multiple accounts at the same address (Householding). If you would prefer that your NEOS Investment Management, LLC documents not be householded, please contact NEOS Investment Management, LLC at (866) 498-5677, or contact your financial intermediary. Your instructions will typically be effective within 30 days of receipt by NEOS Investment Management, LLC or your financial intermediary.
| NEOS Enhanced Income 1-3 Month T-Bill ETF | PAGE 2 | TSR_AR_78433H501 |
104181102310422110209949100791030210870
| | |
| NEOS Enhanced Income Aggregate Bond ETF | |
| BNDI (Principal U.S. Listing Exchange: NYSE Arca) |
| Annual Shareholder Report | May 31, 2024 |
This annual shareholder report contains important information about the NEOS Enhanced Income Aggregate Bond ETF for the period of June 1, 2023 to May 31, 2024. You can find additional information about the Fund at www.neosfunds.com. You can also request this information by contacting us at (866) 498-5677.
WHAT WERE THE FUND COSTS FOR THE PAST YEAR? (based on a hypothetical $10,000 investment)
| | |
Fund Name | Costs of a $10,000 investment | Costs paid as a percentage of a $10,000 investment |
| NEOS Enhanced Income Aggregate Bond ETF | $55 | 0.55% |
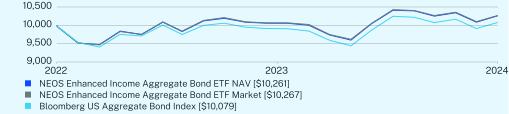
HOW DID THE FUND PERFORM LAST YEAR AND WHAT AFFECTED ITS PERFORMANCE?
For the fiscal year ended May 31, 2024, the NEOS Enhanced Income Aggregate Bond ETF market value return was 1.69% and its net asset value (“NAV”) return was 1.74% compared to its reference index, the Bloomberg U.S. Aggregate Bond Index, which returned 1.31%. The Fund’s market value per share as of the market close of the last trading day of the reporting period was $46.65. We believe the Fund’s relative outperformance during the reporting period is attributable to its put options overlay, which generated additional monthly income for the Fund while maintaining tax efficiency.
HOW DID THE FUND PERFORM SINCE INCEPTION?
The $10,000 chart reflects a hypothetical $10,000 investment. The chart uses total return NAV performance and assumes reinvestment of dividends and capital gains. Fund expenses, including management fees were deducted.
CUMULATIVE PERFORMANCE (Initial Investment of $10,000)
ANNUAL AVERAGE TOTAL RETURN (%)
| | |
| | 1 Year | Since Inception
(08/30/2022) |
NEOS Enhanced Income Aggregate Bond ETF NAV | 1.74 | 1.48 |
NEOS Enhanced Income Aggregate Bond ETF Market | 1.69 | 1.51 |
Bloomberg US Aggregate Bond Index | 1.31 | 0.45 |
Visit www.neosfunds.com for more recent performance information.
The Fund’s past performance is not a good predictor of how the Fund will perform in the future. The graph and table do not reflect the deduction of taxes that a shareholder would pay on Fund distributions or redemption of Fund shares.
| NEOS Enhanced Income Aggregate Bond ETF | PAGE 1 | TSR_AR_78433H402 |
KEY FUND STATISTICS (as of May 31, 2024)
| |
Net Assets | $11,188,552 |
Number of Holdings | 10 |
Net Advisory Fee | $31,745 |
Portfolio Turnover | 1% |
30-Day SEC Yield | 2.88% |
30-Day SEC Yield Unsubsidized | 2.85% |
Distribution Yield | 5.06% |
Visit www.neosfunds.com for more recent performance information.
WHAT DID THE FUND INVEST IN? (as of May 31, 2024)
| |
Top 10 Issuers | (% of net assets) |
Vanguard Total Bond Market ETF | 49.9% |
iShares Core U.S. Aggregate Bond ETF | 49.8% |
First American Treasury Obligations Fund | 0.2% |
Northern U.S. Government Select Money Market Fund | 0.1% |
S&P 500 Index | 0.0% |
MANAGED DISTRIBUTIONS
While the NEOS Enhanced Income Aggregate Bond ETF does not have a specific level of distribution, the Fund seeks to generate monthly income in a tax efficient manner. During the period, 36% of the Fund’s distributions were treated as return of capital and 9% were treated as capital gains. Distributions in excess of the Fund’s current and accumulated earnings and profits are treated as a tax-free return of a shareholder’s investment to the extent of the shareholders basis in the Funds shares, and generally as capital gain thereafter. A return of capital, which for tax purposes is treated as a return of a shareholder’s investment, reduces a shareholder’s basis in the Funds shares, thus reducing any loss or increasing any gain on a subsequent taxable disposition of Fund shares.
For additional information about the Fund; including its prospectus, financial information, holdings and proxy information, scan the QR code or visit www.neosfunds.com
The Fund is distributed by Foreside Fund Services, LLC.
HOUSEHOLDING
To reduce Fund expenses, only one copy of most shareholder documents may be mailed to shareholders with multiple accounts at the same address (Householding). If you would prefer that your NEOS Investment Management, LLC documents not be householded, please contact NEOS Investment Management, LLC at (866) 498-5677, or contact your financial intermediary. Your instructions will typically be effective within 30 days of receipt by NEOS Investment Management, LLC or your financial intermediary.
| NEOS Enhanced Income Aggregate Bond ETF | PAGE 2 | TSR_AR_78433H402 |
10085102611009610267994910079
| | |
| NEOS Nasdaq-100® High Income ETF | |
| QQQI (Principal U.S. Listing Exchange: NASDAQ) |
| Annual Shareholder Report | May 31, 2024 |
This annual shareholder report contains important information about the NEOS Nasdaq-100® High Income ETF for the period of January 30, 2024 to May 31, 2024. You can find additional information about the Fund at www.neosfunds.com. You can also request this information by contacting us at (866) 498-5677.
WHAT WERE THE FUND COSTS FOR THE PAST YEAR? (based on a hypothetical $10,000 investment)
| | |
Fund Name | Costs of a $10,000 investment | Costs paid as a percentage of a $10,000 investment |
| NEOS Nasdaq-100® High Income ETF | $23* | 0.68% |
*Amount shown reflects the expenses of the Fund from inception date through May 31, 2024. Expenses would be higher if the Fund had been in operations for the full year.
HOW DID THE FUND PERFORM LAST YEAR AND WHAT AFFECTED ITS PERFORMANCE?
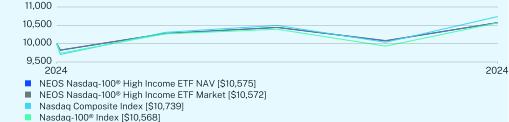
From January 30, 2024, the Fund’s inception date, through May 31, 2024, the NEOS Nasdaq-100® High Income ETF market value return was 5.72% and its net asset value (“NAV”) return was 5.75% compared to its reference index, the Nasdaq-100® Index, which returned 5.68%. The Fund’s market value per share as of the market close of the last trading day of the reporting period was $50.42.
We believe the Fund’s relative outperformance during the reporting period is attributable to the active laddered call strategy utilizing NDX Index options which allowed for the underlying equities to participate with more of the upside during market moves higher and dampen the downside during months when the Nasdaq-100® Index moved lower.
| |
Top Contributors |
| ↑ | NVIDIA Corp |
| ↑ | Meta Platforms Inc. CL A |
| ↑ | Qualcomm Inc |
| |
Top Detractors |
| ↓ | Adobe Inc. |
| ↓ | Intel Corp |
| ↓ | Tesla Inc. |
HOW DID THE FUND PERFORM SINCE INCEPTION?
The $10,000 chart reflects a hypothetical $10,000 investment. The chart uses total return NAV performance and assumes reinvestment of dividends and capital gains. Fund expenses, including management fees were deducted.
CUMULATIVE PERFORMANCE (Initial Investment of $10,000)
| NEOS Nasdaq-100® High Income ETF | PAGE 1 | TSR_AR_78433H675 |
CUMULATIVE TOTAL RETURN (%)
| |
| | Since Inception
(01/30/2024) |
NEOS Nasdaq-100® High Income ETF NAV | 5.75 |
NEOS Nasdaq-100® High Income ETF Market | 5.72 |
NASDAQ Composite Index | 7.39 |
NASDAQ-100® Index | 5.68 |
Visit www.neosfunds.com for more recent performance information.
The Fund’s Cumulative Total Returns are based on net asset values calculated for shareholder transactions which are not reflective of adjustments required pursuant to GAAP. Accordingly, differences may exist between this data and similar information reported in the financial statements.
The Fund’s past performance is not a good predictor of how the Fund will perform in the future. The graph and table do not reflect the deduction of taxes that a shareholder would pay on Fund distributions or redemption of Fund shares.
KEY FUND STATISTICS (as of May 31, 2024)
| |
Net Assets | $215,817,287 |
Number of Holdings | 104 |
Net Advisory Fee | $175,260 |
Portfolio Turnover | 3% |
30-Day SEC Yield | 0.28% |
30-Day SEC Yield Unsubsidized | 0.28% |
Distribution Yield | 14.56% |
Visit www.neosfunds.com for more recent performance information.
WHAT DID THE FUND INVEST IN? (as of May 31, 2024)
Sector Breakdown (% of net assets)
| |
Top 10 Issuers | (% of net assets) |
Microsoft Corp. | 8.7% |
Apple, Inc. | 8.1% |
NVIDIA Corp. | 7.6% |
Alphabet, Inc. | 5.7% |
Amazon.com, Inc. | 5.2% |
Meta Platforms, Inc. | 4.6% |
Broadcom, Inc. | 4.5% |
Costco Wholesale Corp. | 2.6% |
Tesla, Inc. | 2.5% |
Advanced Micro Devices, Inc. | 2.0% |
MANAGED DISTRIBUTIONS
While the NEOS Nasdaq-100® High Income ETF does not have a specified level of distribution, the Fund seeks to generate high monthly income in a tax efficient manner with the potential for equity appreciation. During the period, 98% of the Fund’s distributions were treated as return of capital. Distributions in excess of the Fund’s current and accumulated earnings and profits are treated as a tax-free return of a shareholder’s investment to the extent of the shareholders basis in the Funds shares, and generally as capital gain thereafter. A return of capital, which for tax purposes is treated as a
| NEOS Nasdaq-100® High Income ETF | PAGE 2 | TSR_AR_78433H675 |
return of a shareholder’s investment, reduces a shareholder’s basis in the Funds shares, thus reducing any loss or increasing any gain on a subsequent taxable disposition of Fund shares.
For additional information about the Fund; including its prospectus, financial information, holdings and proxy information, scan the QR code or visit www.neosfunds.com
The Fund is distributed by Foreside Fund Services, LLC.
HOUSEHOLDING
To reduce Fund expenses, only one copy of most shareholder documents may be mailed to shareholders with multiple accounts at the same address (Householding). If you would prefer that your NEOS Investment Management, LLC documents not be householded, please contact NEOS Investment Management, LLC at (866) 498-5677, or contact your financial intermediary. Your instructions will typically be effective within 30 days of receipt by NEOS Investment Management, LLC or your financial intermediary.
| NEOS Nasdaq-100® High Income ETF | PAGE 3 | TSR_AR_78433H675 |
1057510572107391056851.016.112.46.66.34.51.41.40.50.2
| | |
| NEOS S&P 500 High Income ETF | |
| SPYI (Principal U.S. Listing Exchange: Cboe BZX) |
| Annual Shareholder Report | May 31, 2024 |
This annual shareholder report contains important information about the NEOS S&P 500 High Income ETF for the period of June 1, 2023 to May 31, 2024. You can find additional information about the Fund at www.neosfunds.com. You can also request this information by contacting us at (866) 498-5677.
WHAT WERE THE FUND COSTS FOR THE PAST YEAR? (based on a hypothetical $10,000 investment)
| | |
Fund Name | Costs of a $10,000 investment | Costs paid as a percentage of a $10,000 investment |
| NEOS S&P 500 High Income ETF | $73 | 0.68% |
HOW DID THE FUND PERFORM LAST YEAR AND WHAT AFFECTED ITS PERFORMANCE?
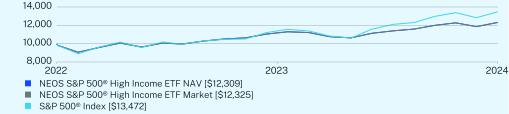
For the fiscal year ended May 31, 2024, the NEOS S&P 500® High Income ETF market value return was 15.76% and its net asset value (“NAV”) return was 15.79% compared to its reference index, the S&P 500® Index, which returned 28.19%. The Fund’s market value per share as of the market close of the last trading day of the reporting period was $49.58. We believe the Fund’s relative underperformance during the reporting period is attributable to the active short SPX Index laddered call strategy which prevented the underlying equity portfolio from fully participating with the market upside during the sharp rally in the S&P 500® Index for specific months.
| |
Top Contributors |
| ↑ | NVIDIA Corp |
| ↑ | Amazon.com Inc |
| ↑ | Meta Platforms Inc. CL A |
| |
Top Detractors |
| ↓ | Bristol-Myers Squibb Co |
| ↓ | Nike Inc. Class B. |
| ↓ | Pfizer Inc. |
HOW DID THE FUND PERFORM SINCE INCEPTION?
The $10,000 chart reflects a hypothetical $10,000 investment. The chart uses total return NAV performance and assumes reinvestment of dividends and capital gains. Fund expenses, including management fees were deducted.
CUMULATIVE PERFORMANCE (Initial Investment of $10,000)
| NEOS S&P 500 High Income ETF | PAGE 1 | TSR_AR_78433H303 |
ANNUAL AVERAGE TOTAL RETURN (%)
| | |
| | 1 Year | Since Inception
(08/30/2022) |
NEOS S&P 500® High Income ETF NAV | 15.79 | 12.58 |
NEOS S&P 500® High Income ETF Market | 15.76 | 12.66 |
S&P 500® Index | 28.19 | 18.53 |
Visit www.neosfunds.com for more recent performance information.
The Fund’s past performance is not a good predictor of how the Fund will perform in the future. The graph and table do not reflect the deduction of taxes that a shareholder would pay on Fund distributions or redemption of Fund shares.
KEY FUND STATISTICS (as of May 31, 2024)
| |
Net Assets | $1,383,897,779 |
Number of Holdings | 506 |
Net Advisory Fee | $3,831,430 |
Portfolio Turnover | 14% |
30-Day SEC Yield | 0.84% |
30-Day SEC Yield Unsubsidized | 0.84% |
Distribution Yield | 12.11% |
Visit www.neosfunds.com for more recent performance information.
WHAT DID THE FUND INVEST IN? (as of May 31, 2024)
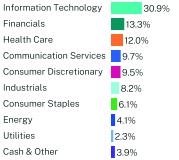
Sector Breakdown (% of net assets)
| |
Top 10 Issuers | (% of net assets) |
Microsoft Corp. | 7.1% |
Apple, Inc. | 6.5% |
NVIDIA Corp. | 6.3% |
Alphabet, Inc. | 4.5% |
Amazon.com, Inc. | 3.7% |
Meta Platforms, Inc. | 2.4% |
Berkshire Hathaway, Inc. | 1.8% |
Eli Lilly & Co. | 1.5% |
JPMorgan Chase & Co. | 1.4% |
Broadcom, Inc. | 1.4% |
MANAGED DISTRIBUTIONS
While the NEOS S&P 500® High Income ETF does not have a speficic level of distribution, the Fund seeks to generate high monthly income in a tax efficient manner with the potential for equity appreciation in rising markets. During the period, 87% of the Fund’s distributions were treated as return of capital and 4% were treated as capital gains. Distributions in excess of the Fund’s current and accumulated earnings and profits are treated as a tax-free return of a shareholder’s investment to the extent of the shareholders basis in the Funds shares, and generally as capital gain thereafter. A return of capital, which for tax purposes is treated as a return of a shareholder’s investment, reduces a shareholder’s basis in the Funds shares, thus reducing any loss or increasing any gain on a subsequent taxable disposition of Fund shares.
| NEOS S&P 500 High Income ETF | PAGE 2 | TSR_AR_78433H303 |
For additional information about the Fund; including its prospectus, financial information, holdings and proxy information, scan the QR code or visit www.neosfunds.com
The Fund is distributed by Foreside Fund Services, LLC.
HOUSEHOLDING
To reduce Fund expenses, only one copy of most shareholder documents may be mailed to shareholders with multiple accounts at the same address (Householding). If you would prefer that your NEOS Investment Management, LLC documents not be householded, please contact NEOS Investment Management, LLC at (866) 498-5677, or contact your financial intermediary. Your instructions will typically be effective within 30 days of receipt by NEOS Investment Management, LLC or your financial intermediary.
| NEOS S&P 500 High Income ETF | PAGE 3 | TSR_AR_78433H303 |
10631123091064712325105101347230.913.312.09.79.58.26.14.12.33.9
Item 2. Code of Ethics.
The registrant has adopted a code of ethics that applies to the registrant’s principal executive officer and principal financial officer. The registrant has not made any substantive amendments to its code of ethics during the period covered by this report. The registrant has not granted any waivers from any provisions of the code of ethics during the period covered by this report.
A copy of the registrant’s Code of Ethics is filed herewith.
Item 3. Audit Committee Financial Expert.
The registrant’s board of trustees has determined that there is at least one audit committee financial expert serving on its audit committee. John Jacobs is the “audit committee financial expert” and is considered to be “independent” as each term is defined in Item 3 of Form N-CSR.
Item 4. Principal Accountant Fees and Services.
The registrant has engaged its principal accountant to perform audit services, audit-related services, tax services and/or other services during the past two fiscal years. “Audit services” refer to performing an audit of the registrant's annual financial statements or services that are normally provided by the accountant in connection with statutory and regulatory filings or engagements for those fiscal years. “Audit-related services” refer to the assurance and related services by the principal accountant that are reasonably related to the performance of the audit. “Tax services” refer to professional services rendered by the principal accountant for tax compliance, tax advice, and tax planning. “Other services” refer to other services rendered by the registrant’s principal accountant to the Registrant other than those reported under the "audit services", "audit-related services", and "tax services”. The following table details the aggregate fees billed or expected to be billed for each of the last two fiscal years for audit fees, audit-related fees, tax fees and other fees by the principal accountant.
| | FYE 5/31/24 | FYE 5/31/23 |
| (a) Audit Fees | $42,000 | $30,000 |
| (b) Audit-Related Fees | None | None |
| (c) Tax Fees | $12,000 | $9,000 |
| (d) All Other Fees | None | None |
(e)(1) The audit committee has adopted pre-approval policies and procedures that require the audit committee to pre-approve all audit and non-audit services of the registrant, including services provided to any entity affiliated with the registrant.
(e)(2) The percentage of fees billed by Cohen & Company, Ltd applicable to non-audit services pursuant to waiver of pre-approval requirement were as follows:
| | FYE 5/31/24 | FYE 5/31/23 |
| Audit-Related Fees | 0% | 0% |
| Tax Fees | 0% | 0% |
| All Other Fees | 0% | 0% |
(f) Not applicable
(g) The following table indicates the non-audit fees billed or expected to be billed by the registrant’s accountant for services to the registrant and to the registrant’s investment adviser (and any other controlling entity, etc.—not sub-adviser) for the last two years.
| Non-Audit Related Fees | FYE 5/31/24 | FYE 5/31/23 |
| Registrant | None | None |
| Registrant’s Investment Adviser | None | None |
(h) Because no non-audit services were rendered, the audit committee of the board of trustees did not consider whether the provision of non-audit services that were rendered to the registrant's investment adviser is compatible with maintaining the principal accountant's independence and has concluded that the provision of such non-audit services by the accountant has not compromised the accountant’s independence.
(i) Not applicable.
(j) Not applicable.
Item 5. Audit Committee of Listed Registrants.
(a) The registrant is an issuer as defined in Rule 10A-3 under the Securities Exchange Act of 1934, (the “Act”) and has a separately-designated standing audit committee established in accordance with Section 3(a)(58)(A) of the Act. The independent members of the committee are as follows: Sharon Cheever, John Jacobs, Richard Keary and Robert Sherry.
(b) Not applicable.
Item 6. Investments.
| (a) | Schedule of Investments is included within the financial statements filed under Item 7(a) of this Form. |
Item 7. Financial Statements and Financial Highlights for Open-End Investment Companies.
(a) The registrant’s Financial Statements are filed herewith.
Financial Statements
May 31, 2024
| | | | | | | |
NEOS ETF Trust | | | | | | |
NEOS Enhanced Income 1-3 Month T-Bill ETF | | | | CSHI | | | | NYSE Arca |
NEOS Enhanced Income Aggregate Bond ETF | | | | BNDI | | | | NYSE Arca |
NEOS Nasdaq-100® High Income ETF | | | | QQQI | | | | NASDAQ |
NEOS S&P 500® High Income ETF | | | | SPYI | | | | Cboe BZX Exchange, Inc. |
| | | | | | | |
TABLE OF CONTENTS
| | | | |
| | | |
| | | |
| | | |
Statements of Changes in Net Assets
| | | |
| | | |
| | | |
| | | |
| | | |
Financial Highlights
| |
| | | |
| | | |
| | | |
| | | |
| | | |
| | | |
| | | |
| | | |
| | | |
| | | |
| | | |
| | | | |
Back to Table of Contents
NEOS Enhanced Income 1-3 Month T-Bill ETF
Schedule of Investments
as of May 31, 2024
| | | | | | | | | | |
PURCHASED OPTIONS - 0.0%(a)(b)(c)
|
Put Options - 0.0%(c)
| | | | | | | | | |
S&P 500 Index
| | | | | | | | | |
Expiration: 06/13/2024; Exercise Price: $4,775.00(d) | | | $110,299,959 | | | 209 | | | $21,423 |
Expiration: 06/13/2024; Exercise Price: $4,600.00(d) | | | 110,299,959 | | | 209 | | | 14,108 |
Expiration: 06/13/2024; Exercise Price: $4,550.00(d) | | | 110,299,959 | | | 209 | | | 13,062 |
Expiration: 06/13/2024; Exercise Price: $4,500.00(d) | | | 110,299,959 | | | 209 | | | 12,017 |
Total Put Options | | | | | | | | | 60,610 |
TOTAL PURCHASED OPTIONS
(Cost $118,317) | | | | | | | | | 60,610 |
| | | | | | Shares | | | |
SHORT-TERM INVESTMENTS - 100.1%
|
Money Market Funds - 0.3%
| | | | | | | | | |
First American Treasury Obligations Fund - Class X, 5.22%(d)(e) | | | | | | 1,088,487 | | | 1,088,487 |
Northern U.S. Government Select Money Market Fund, 5.03%(d)(e) | | | | | | 379,829 | | | 379,829 |
| | | | | | | | | 1,468,316 |
U.S. Treasury Bills - 99.8%
| | | | | | Par | | | |
5.26%, 06/04/2024(f) | | | | | | $34,452,000 | | | 34,446,985 |
5.29%, 06/06/2024(f) | | | | | | 39,254,000 | | | 39,236,853 |
5.28%, 06/11/2024(f) | | | | | | 35,504,000 | | | 35,462,464 |
5.29%, 06/20/2024(f) | | | | | | 39,229,000 | | | 39,131,560 |
5.23%, 06/25/2024(f) | | | | | | 34,157,000 | | | 34,047,136 |
5.26%, 06/27/2024(f) | | | | | | 32,870,000 | | | 32,754,856 |
5.29%, 07/05/2024(f) | | | | | | 35,893,000 | | | 35,724,881 |
5.30%, 07/09/2024(f) | | | | | | 31,612,000 | | | 31,445,602 |
5.31%, 07/18/2024(f) | | | | | | 31,612,000 | | | 31,404,434 |
5.30%, 08/01/2024(f) | | | | | | 36,262,000 | | | 35,949,996 |
5.30%, 08/08/2024(f) | | | | | | 37,085,000 | | | 36,728,737 |
5.29%, 08/20/2024(f) | | | | | | 14,971,000 | | | 14,801,029 |
5.31%, 08/22/2024(f) | | | | | | 39,795,000 | | | 39,332,494 |
| | | | | | | | | 440,467,027 |
TOTAL SHORT-TERM INVESTMENTS
(Cost $441,814,451) | | | | | | | | | 441,935,343 |
TOTAL INVESTMENTS - 100.1%
(Cost $441,932,768) | | | | | | | | | $441,995,953 |
Liabilities in Excess of Other Assets - (0.1)% | | | | | | | | | (222,258) |
TOTAL NET ASSETS - 100.0% | | | | | | | | | $441,773,695 |
Percentages are stated as a percent of net assets.
(b)
| 100 shares per contract. |
(c)
| Represents less than 0.05% of net assets. |
(d)
| All or a portion of security has been pledged as collateral. The total value of assets committed as collateral as of May 31, 2024 is $1,528,926. |
(e)
| The rate shown represents the 7-day effective yield as of May 31, 2024. |
(f)
| The rate shown is the effective yield as of May 31, 2024. |
The accompanying notes are an integral part of these financial statements.
Back to Table of Contents
NEOS Enhanced Income 1-3 Month T-Bill ETF
Schedule of Written Options
as of May 31, 2024
| | | | | | | | | | |
WRITTEN OPTIONS - 0.0%(a)(b)(c)
|
Put Options - 0.0%(b)
| | | | | | | | | |
S&P 500 Index
| | | | | | | | | |
Expiration: 06/13/2024; Exercise Price: $4,750.00 | | | $ (110,299,959) | | | (209) | | | $(20,377) |
Expiration: 06/13/2024; Exercise Price: $4,825.00 | | | (110,299,959) | | | (209) | | | (24,557) |
Expiration: 06/13/2024; Exercise Price: $4,875.00 | | | (110,299,959) | | | (209) | | | (28,738) |
Expiration: 06/13/2024; Exercise Price: $4,925.00 | | | (110,299,959) | | | (209) | | | (36,053) |
Total Put Options | | | | | | | | | (109,725) |
TOTAL WRITTEN OPTIONS
(Premiums received $245,135) | | | | | | | | | (109,725) |
| | | | | | | | | | |
Percentages are stated as a percent of net assets.
(b)
| Represents less than 0.05% of net assets. |
(c)
| 100 shares per contract. |
The accompanying notes are an integral part of these financial statements.
Back to Table of Contents
NEOS Enhanced Income Aggregate Bond ETF
Schedule of Investments
as of May 31, 2024
| | | | | | | | | | |
EXCHANGE TRADED FUNDS - 99.7%
|
iShares Core U.S. Aggregate Bond ETF(a) | | | | | | 57,785 | | | $5,577,408 |
Vanguard Total Bond Market ETF(a) | | | | | | 77,913 | | | 5,581,688 |
TOTAL EXCHANGE TRADED FUNDS
(Cost $11,314,540) | | | | | | | | | 11,159,096 |
| | | Notional Amount | | | Contracts | | | |
PURCHASED OPTIONS - 0.0%(b)(c)(d)
|
Put Options - 0.0%(d)
| | | | | | | | | |
S&P 500 Index
| | | | | | | | | |
Expiration: 06/13/2024; Exercise Price: $4,800.00(e) | | | 3,694,257 | | | 7 | | | 753 |
Expiration: 06/13/2024; Exercise Price: $4,700.00(e) | | | 3,694,257 | | | 7 | | | 577 |
Expiration: 06/13/2024; Exercise Price: $4,650.00(e) | | | 3,694,257 | | | 7 | | | 543 |
Total Put Options | | | | | | | | | 1,873 |
TOTAL PURCHASED OPTIONS
(Cost $3,571) | | | | | | | | | 1,873 |
| | | | | | Shares | | | |
SHORT-TERM INVESTMENTS - 0.3%
| |
Money Market Funds - 0.3%
| | | | | | | | | |
First American Treasury Obligations Fund - Class X, 5.22%(e)(f) | | | | | | 16,829 | | | 16,829 |
Northern U.S. Government Select Money Market Fund, 5.03%(e)(f) | | | | | | 14,771 | | | 14,771 |
TOTAL SHORT-TERM INVESTMENTS
(Cost $31,600) | | | | | | | | | 31,600 |
TOTAL INVESTMENTS - 100.0%
(Cost $11,349,711) | | | | | | | | | $11,192,569 |
Liabilities in Excess of Other Assets - 0.0%(d) | | | | | | | | | (4,017) |
TOTAL NET ASSETS - 100.0% | | | | | | | | | $11,188,552 |
Percentages are stated as a percent of net assets.
(a)
| Fair value of this security exceeds 25% of the Fund’s net assets. Additional information for this security, including the financial statements, is available from the SEC’s EDGAR database at www.sec.gov. |
(c)
| 100 shares per contract. |
(d)
| Represents less than 0.05% of net assets. |
(e)
| All or a portion of security has been pledged as collateral. The total value of assets committed as collateral as of May 31, 2024 is $38,182. |
(f)
| The rate shown represents the 7-day effective yield as of May 31, 2024. |
The accompanying notes are an integral part of these financial statements.
Back to Table of Contents
NEOS Enhanced Income Aggregate Bond ETF
Schedule of Written Options
as of May 31, 2024
| | | | | | | | | | |
WRITTEN OPTIONS - 0.0%(a)(b)(c)
|
Put Options - 0.0%(b)
| | | | | | | | | |
S&P 500 Index
| | | | | | | | | |
Expiration: 06/13/2024; Exercise Price: $4,900.00 | | | $ (3,694,257) | | | (7) | | | $ (1,068) |
Expiration: 06/13/2024; Exercise Price: $4,950.00 | | | (3,694,257) | | | (7) | | | (1,365) |
Expiration: 06/13/2024; Exercise Price: $4,980.00 | | | (3,694,257) | | | (7) | | | (1,610) |
Total Put Options | | | | | | | | | (4,043) |
TOTAL WRITTEN OPTIONS
(Premiums received $9,058) | | | | | | | | | (4,043) |
Percentages are stated as a percent of net assets.
(b)
| Represents less than 0.05% of net assets. |
(c)
| 100 shares per contract. |
The accompanying notes are an integral part of these financial statements.
Back to Table of Contents
NEOS Nasdaq-100® High Income ETF
Schedule of Investments
as of May 31, 2024
| | | | | | | |
COMMON STOCKS - 100.8%(a)
|
Automobiles - 2.5%
|
Tesla, Inc.(b) | | | 29,960 | | | $5,335,277 |
Beverages - 2.7%
| | | |
Coca-Cola Europacific Partners PLC | | | 6,848 | | | 504,766 |
Keurig Dr. Pepper, Inc. | | | 21,828 | | | 747,609 |
Monster Beverage Corp.(b) | | | 16,264 | | | 844,427 |
PepsiCo, Inc. | | | 21,400 | | | 3,700,060 |
| | | | | | 5,796,862 |
Biotechnology - 4.0%
| | | |
Amgen, Inc. | | | 8,132 | | | 2,487,172 |
Biogen, Inc.(b) | | | 2,140 | | | 481,371 |
Gilead Sciences, Inc. | | | 19,688 | | | 1,265,348 |
Moderna, Inc.(b) | | | 5,992 | | | 854,160 |
Regeneron Pharmaceuticals, Inc.(b) | | | 1,712 | | | 1,678,034 |
Vertex Pharmaceuticals, Inc.(b) | | | 3,852 | | | 1,753,970 |
| | | | | | 8,520,055 |
Broadline Retail - 6.2%
| | | |
Amazon.com, Inc.(b) | | | 63,050 | | | 11,124,542 |
MercadoLibre, Inc.(b) | | | 428 | | | 738,548 |
PDD Holdings, Inc. - ADR(b) | | | 10,700 | | | 1,602,646 |
| | | | | | 13,465,736 |
Chemicals - 1.4%
| | | |
Linde plc | | | 6,886 | | | 2,998,991 |
Commercial Services & Supplies - 0.8%
| | | |
Cintas Corp. | | | 1,284 | | | 870,514 |
Copart, Inc.(b) | | | 15,408 | | | 817,548 |
| | | | | | 1,688,062 |
Communications Equipment - 1.4%
| | | |
Cisco Systems, Inc. | | | 65,484 | | | 3,045,006 |
Consumer Staples Distribution & Retail - 2.9%
| | | |
Costco Wholesale Corp. | | | 6,848 | | | 5,546,127 |
Dollar Tree, Inc.(b) | | | 3,424 | | | 403,861 |
Walgreens Boots Alliance, Inc. | | | 14,124 | | | 229,091 |
| | | | | | 6,179,079 |
Electric Utilities - 1.4%
| | | |
American Electric Power Co., Inc. | | | 8,132 | | | 733,913 |
Constellation Energy Corp. | | | 5,136 | | | 1,115,796 |
Exelon Corp. | | | 15,836 | | | 594,642 |
Xcel Energy, Inc. | | | 8,560 | | | 474,652 |
| | | | | | 2,919,003 |
Electronic Equipment, Instruments & Components - 0.2%
| | | |
CDW Corp. | | | 2,140 | | | 478,547 |
| | | | | | | |
The accompanying notes are an integral part of these financial statements.
Back to Table of Contents
NEOS Nasdaq-100® High Income ETF
Schedule of Investments
as of May 31, 2024 (Continued)
| | | | | | | |
COMMON STOCKS - (Continued)
|
Energy Equipment & Services - 0.2%
| | | |
Baker Hughes Co. | | | 15,836 | | | $530,189 |
Entertainment - 2.5%
| | | |
Electronic Arts, Inc. | | | 4,280 | | | 568,726 |
Netflix, Inc.(b) | | | 6,420 | | | 4,119,200 |
Take-Two Interactive Software, Inc.(b) | | | 2,568 | | | 411,805 |
Warner Bros. Discovery, Inc.(b) | | | 39,376 | | | 324,458 |
| | | | | | 5,424,189 |
Financial Services - 0.5%
| | | |
PayPal Holdings, Inc.(b) | | | 16,692 | | | 1,051,429 |
Food Products - 1.0%
| | | |
Kraft Heinz Co. | | | 19,688 | | | 696,364 |
Mondelez International, Inc. - Class A | | | 21,400 | | | 1,466,542 |
| | | | | | 2,162,906 |
Ground Transportation - 0.8%
| | | |
CSX Corp. | | | 30,816 | | | 1,040,040 |
Old Dominion Freight Line, Inc. | | | 3,424 | | | 600,056 |
| | | | | | 1,640,096 |
Health Care Equipment & Supplies - 1.9%
| | | |
Dexcom, Inc.(b) | | | 5,992 | | | 711,670 |
GE HealthCare Technologies, Inc. | | | 7,276 | | | 567,528 |
IDEXX Laboratories, Inc.(b) | | | 1,284 | | | 638,084 |
Intuitive Surgical, Inc.(b) | | | 5,564 | | | 2,237,395 |
| | | | | | 4,154,677 |
Hotels, Restaurants & Leisure - 2.7%
| | | |
Airbnb, Inc. - Class A(b) | | | 6,420 | | | 930,451 |
Booking Holdings, Inc. | | | 428 | | | 1,616,278 |
DoorDash, Inc. - Class A(b) | | | 5,992 | | | 659,779 |
Marriott International, Inc. - Class A | | | 4,708 | | | 1,088,348 |
Starbucks Corp. | | | 18,404 | | | 1,476,369 |
| | | | | | 5,771,225 |
Industrial Conglomerates - 0.9%
| | | |
Honeywell International, Inc.
| | | 9,958 | | | 2,013,408 |
Interactive Media & Services - 10.3%
| | | |
Alphabet, Inc. - Class A(b) | | | 35,961 | | | 6,203,273 |
Alphabet, Inc. - Class C(b) | | | 34,339 | | | 5,973,612 |
Meta Platforms, Inc. - Class A | | | 21,415 | | | 9,997,164 |
| | | | | | 22,174,049 |
IT Services - 0.3%
| | | |
Cognizant Technology Solutions Corp. - Class A | | | 8,132 | | | 537,932 |
MongoDB, Inc.(b) | | | 856 | | | 202,067 |
| | | | | | 739,999 |
| | | | | | | |
The accompanying notes are an integral part of these financial statements.
Back to Table of Contents
NEOS Nasdaq-100® High Income ETF
Schedule of Investments
as of May 31, 2024 (Continued)
| | | | | | | |
COMMON STOCKS - (Continued)
|
Life Sciences Tools & Services - 0.1%
| | | |
Illumina, Inc.(b) | | | 2,568 | | | $267,791 |
Machinery - 0.4%
| | | |
PACCAR, Inc. | | | 8,560 | | | 920,200 |
Media - 1.8%
| | | |
Charter Communications, Inc. - Class A(b) | | | 2,140 | | | 614,437 |
Comcast Corp. - Class A | | | 62,916 | | | 2,518,528 |
Sirius XM Holdings, Inc. | | | 61,632 | | | 173,802 |
Trade Desk, Inc. - Class A(b) | | | 7,276 | | | 675,067 |
| | | | | | 3,981,834 |
Oil, Gas & Consumable Fuels - 0.2%
|
Diamondback Energy, Inc. | | | 2,568 | | | 511,700 |
Pharmaceuticals - 0.3%
|
AstraZeneca PLC - ADR | | | 8,988 | | | 701,244 |
Professional Services - 1.3%
|
Automatic Data Processing, Inc. | | | 6,420 | | | 1,572,387 |
Paychex, Inc. | | | 5,564 | | | 668,570 |
Verisk Analytics, Inc. | | | 2,140 | | | 540,949 |
| | | | | | 2,781,906 |
Real Estate Management & Development - 0.2%
|
CoStar Group, Inc.(b) | | | 6,420 | | | 501,851 |
Semiconductors & Semiconductor Equipment - 25.2%(c)
|
Advanced Micro Devices, Inc.(b) | | | 25,359 | | | 4,232,417 |
Analog Devices, Inc. | | | 7,704 | | | 1,806,511 |
Applied Materials, Inc. | | | 12,903 | | | 2,775,177 |
ASML Holding NV | | | 1,284 | | | 1,233,089 |
Broadcom, Inc. | | | 7,289 | | | 9,683,801 |
GLOBALFOUNDRIES, Inc.(b) | | | 8,988 | | | 440,412 |
Intel Corp. | | | 66,854 | | | 2,062,446 |
KLA Corp. | | | 2,140 | | | 1,625,394 |
Lam Research Corp. | | | 2,140 | | | 1,995,422 |
Marvell Technology, Inc. | | | 14,124 | | | 971,872 |
Microchip Technology, Inc. | | | 8,560 | | | 832,289 |
Micron Technology, Inc. | | | 17,976 | | | 2,247,000 |
NVIDIA Corp. | | | 15,026 | | | 16,473,455 |
NXP Semiconductors NV | | | 3,852 | | | 1,048,129 |
ON Semiconductor Corp.(b) | | | 6,848 | | | 500,178 |
QUALCOMM, Inc. | | | 17,976 | | | 3,668,003 |
Texas Instruments, Inc. | | | 14,210 | | | 2,771,092 |
| | | | | | 54,366,687 |
| | | | | | | |
The accompanying notes are an integral part of these financial statements.
Back to Table of Contents
NEOS Nasdaq-100® High Income ETF
Schedule of Investments
as of May 31, 2024 (Continued)
| | | | | | | |
COMMON STOCKS - (Continued)
|
Software - 15.8%
|
Adobe, Inc.(b) | | | 6,921 | | | $3,078,184 |
ANSYS, Inc.(b) | | | 1,284 | | | 407,606 |
Atlassian Corp. - Class A(b) | | | 2,568 | | | 402,817 |
Autodesk, Inc.(b) | | | 3,424 | | | 690,278 |
Cadence Design Systems, Inc.(b) | | | 4,280 | | | 1,225,407 |
Crowdstrike Holdings, Inc. - Class A(b) | | | 3,424 | | | 1,074,006 |
Datadog, Inc. - Class A(b) | | | 4,708 | | | 518,727 |
Fortinet, Inc.(b) | | | 11,984 | | | 710,891 |
Intuit, Inc. | | | 4,280 | | | 2,467,163 |
Microsoft Corp. | | | 45,046 | | | 18,699,946 |
Palo Alto Networks, Inc.(b) | | | 5,136 | | | 1,514,658 |
Roper Technologies, Inc. | | | 1,712 | | | 912,085 |
Synopsys, Inc.(b) | | | 2,140 | | | 1,200,112 |
Workday, Inc. - Class A(b) | | | 3,424 | | | 724,005 |
Zscaler, Inc.(b) | | | 2,140 | | | 363,714 |
| | | | | | 33,989,599 |
Specialty Retail - 0.7%
| | | |
O’Reilly Automotive, Inc.(b) | | | 856 | | | 824,550 |
Ross Stores, Inc. | | | 5,564 | | | 777,625 |
| | | | | | 1,602,175 |
Technology Hardware, Storage & Peripherals - 8.1%
| | | |
Apple, Inc. | | | 91,143 | | | 17,522,242 |
Textiles, Apparel & Luxury Goods - 0.3%
| | | |
Lululemon Athletica, Inc.(b) | | | 1,712 | | | 534,127 |
Trading Companies & Distributors - 0.3%
| | | |
Fastenal Co. | | | 9,416 | | | 621,268 |
Wireless Telecommunication Services - 1.5%
| | | |
T-Mobile US, Inc. | | | 18,404 | | | 3,219,964 |
TOTAL COMMON STOCKS
(Cost $212,517,490) | | | | | | 217,611,373 |
SHORT-TERM INVESTMENTS - 0.8%
| |
Money Market Funds - 0.8%
| | | | | | |
First American Treasury Obligations Fund - Class X, 5.22%(d) | | | 1,671,393 | | | 1,671,393 |
TOTAL SHORT-TERM INVESTMENTS
(Cost $1,671,393) | | | | | | 1,671,393 |
TOTAL INVESTMENTS - 101.6%
(Cost $214,188,883) | | | | | | $219,282,766 |
Liabilities in Excess of Other Assets - (1.6)% | | | | | | (3,465,479) |
TOTAL NET ASSETS - 100.0% | | | | | | $215,817,287 |
The accompanying notes are an integral part of these financial statements.
Back to Table of Contents
NEOS Nasdaq-100® High Income ETF
Schedule of Investments
as of May 31, 2024 (Continued)
Percentages are stated as a percent of net assets.
The Global Industry Classification Standard (“GICS®”) was developed by and/or is the exclusive property of MSCI, Inc. (“MSCI”) and Standard & Poor’s Financial Services LLC (“S&P”). GICS® is a service mark of MSCI and S&P and has been licensed for use by U.S. Bank Global Fund Services.
ADR - American Depositary Receipt
NV - Naamloze Vennootschap
PLC - Public Limited Company
(a)
| All or a portion of security has been pledged as collateral. The total value of assets committed as collateral as of May 31, 2024 is $217,611,373. |
(b)
| Non-income producing security. |
(c)
| To the extent that the Fund invests more heavily in a particular industry or sector of the economy, its performance will be especially sensitive to developments that significantly affect those industries or sectors. |
(d)
| The rate shown represents the 7-day effective yield as of May 31, 2024. |
The accompanying notes are an integral part of these financial statements.
Back to Table of Contents
NEOS Nasdaq-100® High Income ETF
Schedule of Written Options
as of May 31, 2024
| | | | | | | | | | |
WRITTEN OPTIONS - (1.3)%(a)(b)
|
Call Options - (1.3)%
|
NASDAQ-100 Index
|
Expiration: 07/19/2024; Exercise Price: $18,700.00 | | | $(81,561,260) | | | (44) | | | $ (1,651,100) |
Expiration: 07/19/2024; Exercise Price: $18,950.00 | | | (81,561,260) | | | (44) | | | (1,115,180) |
Total Call Options | | | | | | | | | (2,766,280) |
TOTAL WRITTEN OPTIONS
(Premiums received $2,723,595) | | | | | | | | | (2,766,280) |
| | | | | | | | | | |
Percentages are stated as a percent of net assets.
(b)
| 100 shares per contract. |
The accompanying notes are an integral part of these financial statements.
Back to Table of Contents
NEOS S&P 500® High Income ETF
Schedule of Investments
as of May 31, 2024
| | | | | | | |
COMMON STOCKS - 98.3%(a)
| | | | | | |
Aerospace & Defense - 1.4%
| | | | | | |
Axon Enterprise, Inc.(b) | | | 982 | | | $276,600 |
Boeing Co.(b) | | | 17,624 | | | 3,130,199 |
General Dynamics Corp. | | | 6,476 | | | 1,941,311 |
Howmet Aerospace, Inc. | | | 12,066 | | | 1,021,387 |
Huntington Ingalls Industries, Inc. | | | 554 | | | 140,217 |
L3Harris Technologies, Inc. | | | 5,960 | | | 1,339,987 |
Lockheed Martin Corp. | | | 6,394 | | | 3,007,354 |
Northrop Grumman Corp. | | | 3,636 | | | 1,639,000 |
RTX Corp. | | | 48,203 | | | 5,196,765 |
Textron, Inc. | | | 6,050 | | | 530,040 |
TransDigm Group, Inc. | | | 771 | | | 1,035,630 |
| | | | | | 19,258,490 |
Air Freight & Logistics - 0.4%
|
C.H. Robinson Worldwide, Inc. | | | 975 | | | 84,211 |
Expeditors International of Washington, Inc. | | | 3,687 | | | 445,758 |
FedEx Corp. | | | 6,520 | | | 1,655,819 |
United Parcel Service, Inc. - Class B | | | 23,313 | | | 3,238,875 |
| | | | | | 5,424,663 |
Automobile Components - 0.1%
| | | |
Aptiv PLC(b) | | | 6,521 | | | 542,939 |
BorgWarner, Inc. | | | 6,520 | | | 232,503 |
| | | | | | 775,442 |
Automobiles - 1.5%
| | | |
Ford Motor Co. | | | 132,812 | | | 1,611,010 |
General Motors Co. | | | 45,655 | | | 2,054,018 |
Tesla, Inc.(b) | | | 93,328 | | | 16,619,850 |
| | | | | | 20,284,878 |
Banks - 3.6%
| | | |
Bank of America Corp. | | | 233,519 | | | 9,338,425 |
Citigroup, Inc. | | | 64,798 | | | 4,037,563 |
Citizens Financial Group, Inc. | | | 14,800 | | | 522,292 |
Comerica, Inc. | | | 3,498 | | | 179,237 |
Fifth Third Bancorp | | | 22,754 | | | 851,455 |
Huntington Bancshares, Inc. | | | 48,382 | | | 673,477 |
JPMorgan Chase & Co. | | | 98,004 | | | 19,858,551 |
KeyCorp | | | 31,270 | | | 449,350 |
M&T Bank Corp. | | | 3,747 | | | 568,045 |
PNC Financial Services Group, Inc. | | | 12,068 | | | 1,899,383 |
Regions Financial Corp. | | | 31,178 | | | 603,294 |
Truist Financial Corp. | | | 45,120 | | | 1,703,280 |
US Bancorp | | | 50,893 | | | 2,063,711 |
Wells Fargo & Co. | | | 123,603 | | | 7,406,292 |
| | | | | | 50,154,355 |
| | | | | | | |
The accompanying notes are an integral part of these financial statements.
Back to Table of Contents
NEOS S&P 500® High Income ETF
Schedule of Investments
as of May 31, 2024 (Continued)
| | | | | | | |
COMMON STOCKS - (Continued)
|
Beverages - 1.4%
| | | |
Brown-Forman Corp. - Class B | | | 3,747 | | | $171,837 |
Coca-Cola Co. | | | 131,739 | | | 8,290,335 |
Constellation Brands, Inc. - Class A | | | 3,746 | | | 937,362 |
Keurig Dr. Pepper, Inc. | | | 31,479 | | | 1,078,156 |
Molson Coors Beverage Co. - Class B | | | 3,747 | | | 205,373 |
Monster Beverage Corp.(b) | | | 23,557 | | | 1,223,080 |
PepsiCo, Inc. | | | 45,678 | | | 7,897,726 |
| | | | | | 19,803,869 |
Biotechnology - 2.0%
| | | |
AbbVie, Inc. | | | 59,447 | | | 9,585,234 |
Amgen, Inc. | | | 17,406 | | | 5,323,625 |
Biogen, Inc.(b) | | | 3,679 | | | 827,554 |
Gilead Sciences, Inc. | | | 42,194 | | | 2,711,809 |
Incyte Corp.(b) | | | 3,747 | | | 216,539 |
Moderna, Inc.(b) | | | 9,292 | | | 1,324,575 |
Regeneron Pharmaceuticals, Inc.(b) | | | 3,136 | | | 3,073,782 |
Vertex Pharmaceuticals, Inc.(b) | | | 8,562 | | | 3,898,621 |
| | | | | | 26,961,739 |
Broadline Retail - 3.8%
| | | |
Amazon.com, Inc.(b) | | | 294,211 | | | 51,910,589 |
eBay, Inc. | | | 17,180 | | | 931,500 |
Etsy, Inc.(b) | | | 975 | | | 61,883 |
| | | | | | 52,903,972 |
Building Products - 0.5%
| | | |
A.O. Smith Corp. | | | 975 | | | 81,549 |
Allegion PLC | | | 973 | | | 118,531 |
Builders FirstSource, Inc.(b) | | | 3,378 | | | 543,149 |
Carrier Global Corp. | | | 28,244 | | | 1,784,738 |
Johnson Controls International PLC | | | 22,777 | | | 1,637,894 |
Masco Corp. | | | 6,443 | | | 450,494 |
Trane Technologies PLC | | | 6,487 | | | 2,124,233 |
| | | | | | 6,740,588 |
Capital Markets - 2.6%
| | | |
Ameriprise Financial, Inc. | | | 3,066 | | | 1,338,646 |
Bank of New York Mellon Corp. | | | 25,637 | | | 1,528,222 |
BlackRock, Inc. | | | 3,604 | | | 2,782,396 |
Blackstone, Inc. | | | 23,095 | | | 2,782,948 |
Cboe Global Markets, Inc. | | | 3,118 | | | 539,383 |
Charles Schwab Corp. | | | 48,894 | | | 3,582,952 |
CME Group, Inc. | | | 11,641 | | | 2,362,890 |
FactSet Research Systems, Inc. | | | 530 | | | 214,258 |
Franklin Resources, Inc. | | | 8,894 | | | 209,898 |
Goldman Sachs Group, Inc. | | | 9,289 | | | 4,240,614 |
Intercontinental Exchange, Inc. | | | 17,919 | | | 2,399,354 |
The accompanying notes are an integral part of these financial statements.
Back to Table of Contents
NEOS S&P 500® High Income ETF
Schedule of Investments
as of May 31, 2024 (Continued)
| | | | | | | |
COMMON STOCKS - (Continued)
|
Capital Markets - (Continued)
|
Invesco Ltd. | | | 14,535 | | | $228,345 |
MarketAxess Holdings, Inc. | | | 527 | | | 104,836 |
Moody’s Corp. | | | 3,746 | | | 1,487,125 |
Morgan Stanley | | | 42,476 | | | 4,155,852 |
MSCI, Inc. | | | 973 | | | 481,810 |
Nasdaq, Inc. | | | 11,362 | | | 670,699 |
Northern Trust Corp. | | | 6,197 | | | 522,035 |
Raymond James Financial, Inc. | | | 5,933 | | | 728,276 |
S&P Global, Inc. | | | 9,299 | | | 3,975,415 |
State Street Corp. | | | 9,275 | | | 701,097 |
T. Rowe Price Group, Inc. | | | 6,426 | | | 757,176 |
| | | | | | 35,794,227 |
Chemicals - 1.4%
| | | |
Air Products and Chemicals, Inc. | | | 6,416 | | | 1,711,147 |
Albemarle Corp. | | | 3,280 | | | 402,095 |
Celanese Corp. | | | 974 | | | 148,087 |
CF Industries Holdings, Inc. | | | 3,748 | | | 298,828 |
Corteva, Inc. | | | 23,071 | | | 1,290,592 |
Dow, Inc. | | | 23,043 | | | 1,327,968 |
DuPont de Nemours, Inc. | | | 14,266 | | | 1,172,095 |
Eastman Chemical Co. | | | 975 | | | 98,797 |
Ecolab, Inc. | | | 6,520 | | | 1,513,944 |
FMC Corp. | | | 975 | | | 59,426 |
International Flavors & Fragrances, Inc. | | | 6,521 | | | 627,190 |
Linde PLC | | | 15,053 | | | 6,555,883 |
LyondellBasell Industries NV - Class A | | | 6,520 | | | 648,218 |
Mosaic Co. | | | 9,536 | | | 294,948 |
PPG Industries, Inc. | | | 6,520 | | | 856,793 |
Sherwin-Williams Co. | | | 6,520 | | | 1,980,776 |
| | | | | | 18,986,787 |
Commercial Services & Supplies - 0.6%
| | | |
Cintas Corp. | | | 2,868 | | | 1,944,418 |
Copart, Inc.(b) | | | 28,737 | | | 1,524,785 |
Republic Services, Inc. | | | 6,157 | | | 1,140,215 |
Rollins, Inc. | | | 6,520 | | | 297,899 |
Veralto Corp. | | | 6,370 | | | 627,955 |
Waste Management, Inc. | | | 11,724 | | | 2,470,598 |
| | | | | | 8,005,870 |
Communications Equipment - 0.7%
| | | |
Arista Networks, Inc.(b) | | | 6,520 | | | 1,940,678 |
Cisco Systems, Inc. | | | 137,359 | | | 6,387,193 |
F5, Inc.(b) | | | 833 | | | 140,752 |
Juniper Networks, Inc. | | | 9,294 | | | 331,517 |
Motorola Solutions, Inc. | | | 3,747 | | | 1,367,318 |
| | | | | | 10,167,458 |
| | | | | | | |
The accompanying notes are an integral part of these financial statements.
Back to Table of Contents
NEOS S&P 500® High Income ETF
Schedule of Investments
as of May 31, 2024 (Continued)
| | | | | | | |
COMMON STOCKS - (Continued)
|
Construction & Engineering - 0.1%
| | | |
Quanta Services, Inc. | | | 3,682 | | | $1,016,011 |
Construction Materials - 0.1%
| | | |
Martin Marietta Materials, Inc. | | | 862 | | | 493,133 |
Vulcan Materials Co. | | | 3,509 | | | 897,497 |
| | | | | | 1,390,630 |
Consumer Finance - 0.6%
| | | |
American Express Co. | | | 17,953 | | | 4,308,720 |
Capital One Financial Corp. | | | 11,931 | | | 1,642,063 |
Discover Financial Services | | | 8,461 | | | 1,037,826 |
Synchrony Financial | | | 14,052 | | | 615,478 |
| | | | | | 7,604,087 |
Consumer Staples Distribution & Retail - 2.0%
| | | |
Costco Wholesale Corp. | | | 14,460 | | | 11,711,009 |
Dollar General Corp. | | | 6,378 | | | 873,212 |
Dollar Tree, Inc.(b) | | | 6,227 | | | 734,475 |
Kroger Co. | | | 20,804 | | | 1,089,505 |
Sysco Corp. | | | 16,963 | | | 1,235,246 |
Target Corp. | | | 14,741 | | | 2,301,955 |
Walgreens Boots Alliance, Inc. | | | 23,314 | | | 378,153 |
Walmart, Inc. | | | 144,123 | | | 9,477,528 |
| | | | | | 27,801,083 |
Containers & Packaging - 0.2%
| | | |
Amcor PLC | | | 48,326 | | | 491,475 |
Avery Dennison Corp. | | | 972 | | | 221,218 |
Ball Corp. | | | 9,294 | | | 645,282 |
International Paper Co. | | | 11,447 | | | 516,145 |
Packaging Corp. of America | | | 973 | | | 178,536 |
Westrock Co. | | | 6,521 | | | 349,787 |
| | | | | | 2,402,443 |
Distributors - 0.1%
| | | |
Genuine Parts Co. | | | 3,615 | | | 521,066 |
LKQ Corp. | | | 6,520 | | | 280,556 |
Pool Corp. | | | 537 | | | 195,226 |
| | | | | | 996,848 |
Diversified Telecommunication Services - 0.7%
| | | |
AT&T, Inc. | | | 241,595 | | | 4,401,861 |
Verizon Communications, Inc. | | | 142,691 | | | 5,871,735 |
| | | | | | 10,273,596 |
Electric Utilities - 1.7%
| | | |
Alliant Energy Corp. | | | 6,520 | | | 335,715 |
American Electric Power Co., Inc. | | | 17,281 | | | 1,559,610 |
Constellation Energy Corp. | | | 9,294 | | | 2,019,121 |
The accompanying notes are an integral part of these financial statements.
Back to Table of Contents
NEOS S&P 500® High Income ETF
Schedule of Investments
as of May 31, 2024 (Continued)
| | | | | | | |
COMMON STOCKS - (Continued)
|
Electric Utilities - (Continued)
|
Duke Energy Corp. | | | 25,674 | | | $2,659,056 |
Edison International | | | 11,977 | | | 920,432 |
Entergy Corp. | | | 6,267 | | | 704,975 |
Evergy, Inc. | | | 6,520 | | | 356,383 |
Eversource Energy | | | 11,504 | | | 681,382 |
Exelon Corp. | | | 33,758 | | | 1,267,613 |
FirstEnergy Corp. | | | 17,139 | | | 690,016 |
NextEra Energy, Inc. | | | 68,390 | | | 5,472,568 |
NRG Energy, Inc. | | | 6,461 | | | 523,341 |
PG&E Corp. | | | 71,238 | | | 1,320,753 |
Pinnacle West Capital Corp. | | | 974 | | | 76,810 |
PPL Corp. | | | 23,565 | | | 691,161 |
Southern Co. | | | 36,754 | | | 2,945,466 |
Xcel Energy, Inc. | | | 17,615 | | | 976,752 |
| | | | | | 23,201,154 |
Electrical Equipment - 0.7%
| | | |
AMETEK, Inc. | | | 6,520 | | | 1,105,662 |
Eaton Corp. PLC | | | 12,067 | | | 4,016,501 |
Emerson Electric Co. | | | 17,887 | | | 2,006,206 |
GE Vernova, Inc.(b) | | | 8,849 | | | 1,556,539 |
Generac Holdings, Inc.(b) | | | 858 | | | 126,306 |
Hubbell, Inc. | | | 745 | | | 289,723 |
Rockwell Automation, Inc. | | | 3,255 | | | 838,260 |
| | | | | | 9,939,197 |
Electronic Equipment, Instruments & Components - 0.6%
| | | |
Amphenol Corp. - Class A | | | 19,921 | | | 2,636,943 |
CDW Corp. | | | 3,530 | | | 789,379 |
Corning, Inc. | | | 25,600 | | | 953,856 |
Jabil, Inc. | | | 3,433 | | | 408,184 |
Keysight Technologies, Inc.(b) | | | 3,747 | | | 518,884 |
TE Connectivity Ltd. | | | 9,295 | | | 1,391,461 |
Teledyne Technologies, Inc.(b) | | | 656 | | | 260,399 |
Trimble, Inc.(b) | | | 8,435 | | | 469,661 |
Zebra Technologies Corp. - Class A(b) | | | 712 | | | 222,386 |
| | | | | | 7,651,153 |
Energy Equipment & Services - 0.3%
| | | |
Baker Hughes Co. | | | 33,960 | | | 1,136,981 |
Halliburton Co. | | | 28,708 | | | 1,053,583 |
Schlumberger NV | | | 48,110 | | | 2,207,768 |
| | | | | | 4,398,332 |
Entertainment - 1.3%
| | | |
Electronic Arts, Inc. | | | 6,521 | | | 866,510 |
Live Nation Entertainment, Inc.(b) | | | 3,625 | | | 339,807 |
Netflix, Inc.(b) | | | 14,390 | | | 9,232,912 |
The accompanying notes are an integral part of these financial statements.
Back to Table of Contents
NEOS S&P 500® High Income ETF
Schedule of Investments
as of May 31, 2024 (Continued)
| | | | | | | |
COMMON STOCKS - (Continued)
|
Entertainment - (Continued)
|
Take-Two Interactive Software, Inc.(b) | | | 3,746 | | | $600,709 |
Walt Disney Co. | | | 61,866 | | | 6,428,496 |
Warner Bros. Discovery, Inc.(b) | | | 73,970 | | | 609,513 |
| | | | | | 18,077,947 |
Financial Services - 4.4%
| | | |
Berkshire Hathaway, Inc. - Class B(b) | | | 61,832 | | | 25,623,181 |
Corpay, Inc.(b) | | | 972 | | | 260,175 |
Fidelity National Information Services, Inc. | | | 19,835 | | | 1,505,080 |
Fiserv, Inc.(b) | | | 19,953 | | | 2,988,161 |
Global Payments, Inc. | | | 8,595 | | | 875,401 |
Jack Henry & Associates, Inc. | | | 972 | | | 160,069 |
Mastercard, Inc. - Class A | | | 28,094 | | | 12,559,985 |
PayPal Holdings, Inc.(b) | | | 36,521 | | | 2,300,458 |
Visa, Inc. - Class A | | | 53,662 | | | 14,620,748 |
| | | | | | 60,893,258 |
Food Products - 0.7%
| | | |
Archer-Daniels-Midland Co. | | | 17,375 | | | 1,084,895 |
Bunge Global SA | | | 3,689 | | | 396,900 |
Campbell Soup Co. | | | 3,748 | | | 166,336 |
Conagra Brands, Inc. | | | 14,841 | | | 443,449 |
General Mills, Inc. | | | 19,675 | | | 1,352,656 |
Hershey Co. | | | 3,745 | | | 740,873 |
Hormel Foods Corp. | | | 9,002 | | | 278,882 |
J.M. Smucker Co. | | | 974 | | | 108,737 |
Kellogg Co. | | | 6,520 | | | 393,417 |
Kraft Heinz Co. | | | 26,017 | | | 920,221 |
Lamb Weston Holdings, Inc. | | | 3,675 | | | 324,466 |
McCormick & Co., Inc. | | | 6,520 | | | 470,874 |
Mondelez International, Inc. - Class A | | | 45,430 | | | 3,113,318 |
Tyson Foods, Inc. - Class A | | | 8,950 | | | 512,388 |
| | | | | | 10,307,412 |
Gas Utilities - 0.0%(c)
| | | |
Atmos Energy Corp. | | | 3,738 | | | 433,309 |
Ground Transportation - 1.0%
| | | |
CSX Corp. | | | 65,682 | | | 2,216,768 |
JB Hunt Transport Services, Inc. | | | 973 | | | 156,410 |
Norfolk Southern Corp. | | | 6,473 | | | 1,455,130 |
Old Dominion Freight Line, Inc. | | | 5,818 | | | 1,019,605 |
Uber Technologies, Inc.(b) | | | 68,458 | | | 4,419,648 |
Union Pacific Corp. | | | 20,127 | | | 4,685,968 |
| | | | | | 13,953,529 |
| | | | | | | |
The accompanying notes are an integral part of these financial statements.
Back to Table of Contents
NEOS S&P 500® High Income ETF
Schedule of Investments
as of May 31, 2024 (Continued)
| | | | | | | |
COMMON STOCKS - (Continued)
|
Health Care Equipment & Supplies - 2.4%
| | | |
Abbott Laboratories | | | 57,319 | | | $5,857,429 |
Align Technology, Inc.(b) | | | 972 | | | 250,008 |
Baxter International, Inc. | | | 17,013 | | | 579,973 |
Becton Dickinson and Co. | | | 9,017 | | | 2,091,673 |
Boston Scientific Corp.(b) | | | 48,578 | | | 3,671,039 |
Cooper Cos., Inc. | | | 3,925 | | | 370,167 |
Dexcom, Inc.(b) | | | 11,988 | | | 1,423,815 |
Edwards Lifesciences Corp.(b) | | | 20,032 | | | 1,740,580 |
GE HealthCare Technologies, Inc. | | | 12,066 | | | 941,148 |
Hologic, Inc.(b) | | | 6,520 | | | 481,046 |
IDEXX Laboratories, Inc.(b) | | | 1,161 | | | 576,959 |
Insulet Corp.(b) | | | 972 | | | 172,229 |
Intuitive Surgical, Inc.(b) | | | 11,538 | | | 4,639,661 |
Medtronic PLC | | | 45,076 | | | 3,667,834 |
ResMed, Inc. | | | 3,711 | | | 765,691 |
Solventum Corp.(b) | | | 4,033 | | | 239,318 |
STERIS PLC | | | 3,041 | | | 677,778 |
Stryker Corp. | | | 11,328 | | | 3,863,867 |
Teleflex, Inc. | | | 654 | | | 136,732 |
Zimmer Biomet Holdings, Inc. | | | 6,226 | | | 716,924 |
| | | | | | 32,863,871 |
Health Care Providers & Services - 2.4%
| | | |
Cardinal Health, Inc. | | | 6,520 | | | 647,240 |
Cencora, Inc. | | | 3,746 | | | 848,731 |
Centene Corp.(b) | | | 17,373 | | | 1,243,733 |
Cigna Corp. | | | 9,054 | | | 3,120,190 |
CVS Health Corp. | | | 42,756 | | | 2,548,258 |
DaVita, Inc.(b) | | | 4 | | | 588 |
Elevance Health, Inc. | | | 6,520 | | | 3,510,890 |
HCA Healthcare, Inc. | | | 6,077 | | | 2,064,661 |
Henry Schein, Inc.(b) | | | 975 | | | 67,607 |
Humana, Inc. | | | 3,366 | | | 1,205,432 |
Labcorp Holdings, Inc. | | | 973 | | | 189,647 |
McKesson Corp. | | | 3,514 | | | 2,001,539 |
Molina Healthcare, Inc.(b) | | | 809 | | | 254,495 |
Quest Diagnostics, Inc. | | | 974 | | | 138,279 |
UnitedHealth Group, Inc. | | | 31,079 | | | 15,395,604 |
Universal Health Services, Inc. - Class B | | | 847 | | | 160,761 |
| | | | | | 33,397,655 |
Hotels, Restaurants & Leisure - 1.6%
| | | |
Airbnb, Inc. - Class A(b) | | | 14,347 | | | 2,079,311 |
Booking Holdings, Inc. | | | 488 | | | 1,842,859 |
Caesars Entertainment, Inc.(b) | | | 6,305 | | | 224,206 |
Carnival Corp.(b) | | | 33,920 | | | 511,513 |
The accompanying notes are an integral part of these financial statements.
Back to Table of Contents
NEOS S&P 500® High Income ETF
Schedule of Investments
as of May 31, 2024 (Continued)
| | | | | | | |
COMMON STOCKS - (Continued)
|
Hotels, Restaurants & Leisure - (Continued)
|
Chipotle Mexican Grill, Inc.(b) | | | 384 | | | $1,201,736 |
Darden Restaurants, Inc. | | | 3,333 | | | 501,250 |
Domino’s Pizza, Inc. | | | 487 | | | 247,678 |
Expedia Group, Inc.(b) | | | 3,514 | | | 396,590 |
Hilton Worldwide Holdings, Inc. | | | 8,543 | | | 1,713,726 |
Las Vegas Sands Corp. | | | 9,295 | | | 418,554 |
Marriott International, Inc. - Class A | | | 6,757 | | | 1,562,016 |
McDonald’s Corp. | | | 23,348 | | | 6,044,564 |
MGM Resorts International(b) | | | 8,767 | | | 352,170 |
Norwegian Cruise Line Holdings Ltd.(b) | | | 14,229 | | | 236,201 |
Royal Caribbean Cruises Ltd.(b) | | | 6,520 | | | 962,874 |
Starbucks Corp. | | | 37,419 | | | 3,001,752 |
Wynn Resorts Ltd. | | | 974 | | | 92,413 |
Yum! Brands, Inc. | | | 8,879 | | | 1,220,241 |
| | | | | | 22,609,654 |
Household Durables - 0.3%
| | | |
D.R. Horton, Inc. | | | 9,168 | | | 1,355,031 |
Garmin Ltd. | | | 3,746 | | | 613,782 |
Lennar Corp. - Class A | | | 6,520 | | | 1,045,482 |
Mohawk Industries, Inc.(b) | | | 4 | | | 488 |
NVR, Inc.(b) | | | 41 | | | 314,910 |
PulteGroup, Inc. | | | 6,320 | | | 741,462 |
| | | | | | 4,071,155 |
Household Products - 1.3%
| | | |
Church & Dwight Co., Inc. | | | 6,520 | | | 697,705 |
Clorox Co. | | | 3,384 | | | 445,199 |
Colgate-Palmolive Co. | | | 26,393 | | | 2,453,493 |
Kimberly-Clark Corp. | | | 9,295 | | | 1,239,024 |
Procter & Gamble Co. | | | 79,271 | | | 13,043,250 |
| | | | | | 17,878,671 |
Independent Power and Renewable Electricity Producers - 0.0%(c)
| | | |
AES Corp. | | | 22,603 | | | 487,999 |
Industrial Conglomerates - 0.9%
| | | |
3M Co. | | | 17,615 | | | 1,763,966 |
General Electric Co. | | | 36,657 | | | 6,053,537 |
Honeywell International, Inc. | | | 20,804 | | | 4,206,361 |
| | | | | | 12,023,864 |
Insurance - 2.1%
| | | |
Aflac, Inc. | | | 17,355 | | | 1,559,694 |
Allstate Corp. | | | 6,520 | | | 1,092,230 |
American International Group, Inc. | | | 23,021 | | | 1,814,515 |
Aon PLC - Class A | | | 6,112 | | | 1,721,384 |
Arch Capital Group Ltd.(b) | | | 11,831 | | | 1,214,215 |
| | | | | | | |
The accompanying notes are an integral part of these financial statements.
Back to Table of Contents
NEOS S&P 500® High Income ETF
Schedule of Investments
as of May 31, 2024 (Continued)
| | | | | | | |
COMMON STOCKS - (Continued)
|
Insurance - (Continued)
|
Arthur J Gallagher & Co. | | | 6,323 | | | $1,601,806 |
Assurant, Inc. | | | 731 | | | 126,807 |
Brown & Brown, Inc. | | | 6,520 | | | 583,605 |
Chubb Ltd. | | | 12,068 | | | 3,268,256 |
Cincinnati Financial Corp. | | | 3,746 | | | 440,455 |
Everest Group Ltd. | | | 605 | | | 236,513 |
Globe Life, Inc. | | | 973 | | | 80,525 |
Hartford Financial Services Group, Inc. | | | 9,170 | | | 948,636 |
Loews Corp. | | | 3,748 | | | 287,846 |
Marsh & McLennan Cos., Inc. | | | 15,156 | | | 3,146,082 |
MetLife, Inc. | | | 20,262 | | | 1,466,361 |
Principal Financial Group, Inc. | | | 6,380 | | | 523,415 |
Progressive Corp. | | | 19,744 | | | 4,169,538 |
Prudential Financial, Inc. | | | 11,657 | | | 1,402,920 |
Travelers Cos., Inc. | | | 6,500 | | | 1,402,050 |
W.R. Berkley Corp. | | | 6,152 | | | 498,497 |
Willis Towers Watson PLC | | | 3,096 | | | 790,378 |
| | | | | | 28,375,728 |
Interactive Media & Services - 6.9%
| | | |
Alphabet, Inc. - Class A(b) | | | 191,836 | | | 33,091,710 |
Alphabet, Inc. - Class C(b) | | | 161,625 | | | 28,116,285 |
Match Group, Inc.(b) | | | 8,741 | | | 267,737 |
Meta Platforms, Inc. - Class A | | | 71,423 | | | 33,342,399 |
| | | | | | 94,818,131 |
IT Services - 0.9%
| | | |
Accenture PLC - Class A | | | 20,369 | | | 5,749,965 |
Akamai Technologies, Inc.(b) | | | 3,746 | | | 345,531 |
Cognizant Technology Solutions Corp. - Class A | | | 16,921 | | | 1,119,324 |
EPAM Systems, Inc.(b) | | | 805 | | | 143,234 |
Gartner, Inc.(b) | | | 972 | | | 407,919 |
International Business Machines Corp. | | | 30,922 | | | 5,159,336 |
VeriSign, Inc.(b) | | | 973 | | | 169,613 |
| | | | | | 13,094,922 |
Leisure Products - 0.0%(b)
| | | |
Hasbro, Inc. | | | 3,478 | | | 207,915 |
Life Sciences Tools & Services - 1.2%
| | | |
Agilent Technologies, Inc. | | | 9,046 | | | 1,179,689 |
Bio-Rad Laboratories, Inc. - Class A(b) | | | 291 | | | 83,476 |
Bio-Techne Corp. | | | 3,746 | | | 289,154 |
Charles River Laboratories International, Inc.(b) | | | 713 | | | 148,618 |
Danaher Corp. | | | 20,786 | | | 5,337,845 |
Illumina, Inc.(b) | | | 3,746 | | | 390,633 |
IQVIA Holdings, Inc.(b) | | | 5,860 | | | 1,283,867 |
| | | | | | | |
The accompanying notes are an integral part of these financial statements.
Back to Table of Contents
NEOS S&P 500® High Income ETF
Schedule of Investments
as of May 31, 2024 (Continued)
| | | | | | | |
COMMON STOCKS - (Continued)
|
Life Sciences Tools & Services - (Continued)
|
Mettler-Toledo International, Inc.(b) | | | 303 | | | $425,439 |
Revvity, Inc. | | | 975 | | | 106,529 |
Thermo Fisher Scientific, Inc. | | | 12,026 | | | 6,830,527 |
Waters Corp.(b) | | | 826 | | | 255,151 |
West Pharmaceutical Services, Inc. | | | 972 | | | 322,131 |
| | | | | | 16,653,059 |
Machinery - 1.6%
| | | |
Caterpillar, Inc. | | | 17,052 | | | 5,772,443 |
Cummins, Inc. | | | 3,634 | | | 1,023,807 |
Deere & Co. | | | 8,705 | | | 3,262,286 |
Dover Corp. | | | 3,610 | | | 663,590 |
Fortive Corp. | | | 11,529 | | | 858,219 |
IDEX Corp. | | | 972 | | | 202,798 |
Illinois Tool Works, Inc. | | | 8,791 | | | 2,134,015 |
Ingersoll Rand, Inc. | | | 12,068 | | | 1,122,927 |
Nordson Corp. | | | 756 | | | 177,448 |
Otis Worldwide Corp. | | | 12,068 | | | 1,197,146 |
PACCAR, Inc. | | | 17,237 | | | 1,852,978 |
Parker-Hannifin Corp. | | | 3,449 | | | 1,833,213 |
Pentair PLC | | | 3,746 | | | 304,849 |
Snap-on, Inc. | | | 736 | | | 200,825 |
Stanley Black & Decker, Inc. | | | 3,746 | | | 326,539 |
Westinghouse Air Brake Technologies Corp. | | | 3,747 | | | 634,105 |
Xylem, Inc. | | | 6,672 | | | 940,885 |
| | | | | | 22,508,073 |
Media - 0.6%
| | | |
Charter Communications, Inc. - Class A(b) | | | 3,064 | | | 879,736 |
Comcast Corp. - Class A | | | 135,528 | | | 5,425,186 |
Fox Corp. - Class A | | | 6,764 | | | 232,885 |
Fox Corp. - Class B | | | 3,497 | | | 111,694 |
Interpublic Group of Cos., Inc. | | | 11,970 | | | 375,499 |
News Corp. - Class A | | | 11,923 | | | 324,186 |
News Corp. - Class B | | | 975 | | | 27,183 |
Omnicom Group, Inc. | | | 3,748 | | | 348,414 |
Paramount Global - Class B | | | 15,063 | | | 179,400 |
| | | | | | 7,904,183 |
Metals & Mining - 0.4%
| | | |
Freeport-McMoRan, Inc. | | | 48,151 | | | 2,539,002 |
Newmont Corp. | | | 37,616 | | | 1,577,615 |
Nucor Corp. | | | 6,740 | | | 1,138,049 |
Steel Dynamics, Inc. | | | 3,753 | | | 502,414 |
| | | | | | 5,757,080 |
The accompanying notes are an integral part of these financial statements.
Back to Table of Contents
NEOS S&P 500® High Income ETF
Schedule of Investments
as of May 31, 2024 (Continued)
| | | | | | | |
COMMON STOCKS - (Continued)
|
Multi-Utilities - 0.6%
| | | |
Ameren Corp. | | | 6,521 | | | $478,446 |
CenterPoint Energy, Inc. | | | 20,388 | | | 622,038 |
CMS Energy Corp. | | | 9,043 | | | 569,076 |
Consolidated Edison, Inc. | | | 11,448 | | | 1,082,408 |
Dominion Energy, Inc. | | | 28,282 | | | 1,524,965 |
DTE Energy Co. | | | 6,200 | | | 722,486 |
NiSource, Inc. | | | 12,068 | | | 350,696 |
Public Service Enterprise Group, Inc. | | | 16,880 | | | 1,278,829 |
Sempra | | | 20,386 | | | 1,570,334 |
WEC Energy Group, Inc. | | | 9,294 | | | 753,093 |
| | | | | | 8,952,371 |
Oil, Gas & Consumable Fuels - 3.8%
| | | |
APA Corp. | | | 9,265 | | | 282,860 |
Chevron Corp. | | | 59,373 | | | 9,636,238 |
ConocoPhillips | | | 39,838 | | | 4,640,330 |
Coterra Energy, Inc. | | | 25,391 | | | 724,151 |
Devon Energy Corp. | | | 20,552 | | | 1,008,692 |
Diamondback Energy, Inc. | | | 3,747 | | | 746,627 |
EOG Resources, Inc. | | | 19,796 | | | 2,465,592 |
EQT Corp. | | | 12,065 | | | 495,751 |
Exxon Mobil Corp. | | | 151,115 | | | 17,719,745 |
Hess Corp. | | | 8,851 | | | 1,363,939 |
Kinder Morgan, Inc. | | | 65,128 | | | 1,269,345 |
Marathon Oil Corp. | | | 19,771 | | | 572,568 |
Marathon Petroleum Corp. | | | 11,926 | | | 2,106,251 |
Occidental Petroleum Corp. | | | 20,821 | | | 1,301,313 |
ONEOK, Inc. | | | 19,756 | | | 1,600,236 |
Phillips 66 | | | 14,416 | | | 2,048,658 |
Targa Resources Corp. | | | 6,430 | | | 760,219 |
Valero Energy Corp. | | | 11,376 | | | 1,787,625 |
Williams Cos., Inc. | | | 40,224 | | | 1,669,698 |
| | | | | | 52,199,838 |
Passenger Airlines - 0.2%
| | | |
American Airlines Group, Inc.(b) | | | 20,682 | | | 237,843 |
Delta Air Lines, Inc. | | | 20,554 | | | 1,048,665 |
Southwest Airlines Co. | | | 19,883 | | | 533,660 |
United Airlines Holdings, Inc.(b) | | | 9,534 | | | 505,206 |
| | | | | | 2,325,374 |
Personal Care Products - 0.1%
| | | |
Kenvue, Inc. | | | 57,161 | | | 1,103,207 |
The Estee Lauder Companies, Inc. - Class A | | | 6,520 | | | 804,307 |
| | | | | | 1,907,514 |
The accompanying notes are an integral part of these financial statements.
Back to Table of Contents
NEOS S&P 500® High Income ETF
Schedule of Investments
as of May 31, 2024 (Continued)
| | | | | | | |
COMMON STOCKS - (Continued)
|
Pharmaceuticals - 4.0%
| | | |
Bristol-Myers Squibb Co. | | | 68,153 | | | $2,800,407 |
Catalent, Inc.(b) | | | 3,747 | | | 201,551 |
Eli Lilly & Co. | | | 26,063 | | | 21,380,521 |
Johnson & Johnson | | | 81,571 | | | 11,964,019 |
Merck & Co., Inc. | | | 84,987 | | | 10,669,268 |
Pfizer, Inc. | | | 191,380 | | | 5,484,951 |
Viatris, Inc. | | | 39,918 | | | 423,131 |
Zoetis, Inc. | | | 14,717 | | | 2,495,414 |
| | | | | | 55,419,262 |
Professional Services - 0.6%
| | | |
Automatic Data Processing, Inc. | | | 12,361 | | | 3,027,456 |
Broadridge Financial Solutions, Inc. | | | 3,300 | | | 662,541 |
Dayforce, Inc.(b) | | | 3,746 | | | 185,277 |
Equifax, Inc. | | | 3,376 | | | 781,173 |
Jacobs Solutions, Inc. | | | 3,416 | | | 475,986 |
Leidos Holdings, Inc. | | | 3,579 | | | 526,292 |
Paychex, Inc. | | | 9,295 | | | 1,116,887 |
Paycom Software, Inc. | | | 682 | | | 99,108 |
Robert Half International, Inc. | | | 974 | | | 62,560 |
Verisk Analytics, Inc. | | | 3,678 | | | 929,725 |
| | | | | | 7,867,005 |
Real Estate Management & Development - 0.1%
| | | |
CBRE Group, Inc. - Class A(b) | | | 9,204 | | | 810,596 |
CoStar Group, Inc.(b) | | | 12,068 | | | 943,356 |
| | | | | | 1,753,952 |
Semiconductors & Semiconductor Equipment - 11.6%
| | | |
Advanced Micro Devices, Inc.(b) | | | 53,710 | | | 8,964,199 |
Analog Devices, Inc. | | | 16,868 | | | 3,955,377 |
Applied Materials, Inc. | | | 28,238 | | | 6,073,429 |
Broadcom, Inc. | | | 14,407 | | | 19,140,420 |
Enphase Energy, Inc.(b) | | | 3,558 | | | 455,068 |
First Solar, Inc.(b) | | | 3,150 | | | 856,044 |
Intel Corp. | | | 143,334 | | | 4,421,854 |
KLA Corp. | | | 3,552 | | | 2,697,851 |
Lam Research Corp. | | | 3,490 | | | 3,254,216 |
Microchip Technology, Inc. | | | 17,469 | | | 1,698,511 |
Micron Technology, Inc. | | | 36,807 | | | 4,600,875 |
Monolithic Power Systems, Inc. | | | 665 | | | 489,194 |
NVIDIA Corp. | | | 79,263 | | | 86,898,405 |
NXP Semiconductors NV | | | 8,552 | | | 2,326,999 |
ON Semiconductor Corp.(b) | | | 14,273 | | | 1,042,500 |
Qorvo, Inc.(b) | | | 974 | | | 95,832 |
QUALCOMM, Inc. | | | 37,050 | | | 7,560,052 |
Skyworks Solutions, Inc. | | | 3,746 | | | 347,104 |
The accompanying notes are an integral part of these financial statements.
Back to Table of Contents
NEOS S&P 500® High Income ETF
Schedule of Investments
as of May 31, 2024 (Continued)
| | | | | | | |
COMMON STOCKS - (Continued)
|
Semiconductors & Semiconductor Equipment - (Continued)
|
Teradyne, Inc. | | | 3,746 | | | $527,961 |
Texas Instruments, Inc. | | | 29,223 | | | 5,698,777 |
| | | | | | 161,104,668 |
Software - 10.3%
| | | |
Adobe, Inc.(b) | | | 14,629 | | | 6,506,394 |
ANSYS, Inc.(b) | | | 2,866 | | | 909,812 |
Autodesk, Inc.(b) | | | 6,297 | | | 1,269,475 |
Cadence Design Systems, Inc.(b) | | | 8,771 | | | 2,511,225 |
Fair Isaac Corp.(b) | | | 344 | | | 443,736 |
Fortinet, Inc.(b) | | | 20,465 | | | 1,213,984 |
Gen Digital, Inc. | | | 17,805 | | | 442,098 |
Intuit, Inc. | | | 8,894 | | | 5,126,857 |
Microsoft Corp. | | | 236,857 | | | 98,326,446 |
Oracle Corp. | | | 53,608 | | | 6,282,321 |
Palo Alto Networks, Inc.(b) | | | 9,327 | | | 2,750,626 |
PTC, Inc.(b) | | | 3,315 | | | 584,236 |
Roper Technologies, Inc. | | | 3,145 | | | 1,675,530 |
Salesforce, Inc. | | | 31,800 | | | 7,455,192 |
ServiceNow, Inc.(b) | | | 6,175 | | | 4,056,543 |
Synopsys, Inc.(b) | | | 3,746 | | | 2,100,757 |
Tyler Technologies, Inc.(b) | | | 586 | | | 281,491 |
| | | | | | 141,936,723 |
Specialty Retail - 1.7%
| | | |
AutoZone, Inc.(b) | | | 245 | | | 678,635 |
Bath & Body Works, Inc. | | | 6,472 | | | 336,156 |
Best Buy Co., Inc. | | | 3,748 | | | 317,905 |
CarMax, Inc.(b) | | | 3,747 | | | 263,264 |
Home Depot, Inc. | | | 33,798 | | | 11,317,936 |
Lowe’s Cos., Inc. | | | 17,993 | | | 3,981,671 |
O’Reilly Automotive, Inc.(b) | | | 826 | | | 795,653 |
Ross Stores, Inc. | | | 9,295 | | | 1,299,069 |
TJX Companies, Inc. | | | 37,508 | | | 3,867,075 |
Tractor Supply Co. | | | 3,156 | | | 900,375 |
Ulta Beauty, Inc.(b) | | | 686 | | | 271,032 |
| | | | | | 24,028,771 |
Technology Hardware, Storage & Peripherals - 6.8%
| | | |
Apple, Inc. | | | 467,251 | | | 89,829,005 |
Hewlett Packard Enterprise Co. | | | 42,690 | | | 753,478 |
HP, Inc. | | | 28,682 | | | 1,046,893 |
NetApp, Inc. | | | 6,227 | | | 749,918 |
Seagate Technology Holdings PLC | | | 3,748 | | | 349,464 |
Super Micro Computer, Inc.(b) | | | 991 | | | 777,449 |
Western Digital Corp.(b) | | | 9,482 | | | 713,900 |
| | | | | | 94,220,107 |
The accompanying notes are an integral part of these financial statements.
Back to Table of Contents
NEOS S&P 500® High Income ETF
Schedule of Investments
as of May 31, 2024 (Continued)
| | | | | | | |
COMMON STOCKS - (Continued)
|
Textiles, Apparel & Luxury Goods - 0.4%
| | | |
Deckers Outdoor Corp.(b) | | | 504 | | | $551,336 |
Lululemon Athletica, Inc.(b) | | | 3,260 | | | 1,017,087 |
NIKE, Inc. - Class B | | | 40,128 | | | 3,814,166 |
Ralph Lauren Corp. | | | 3 | | | 561 |
Tapestry, Inc. | | | 6,508 | | | 283,033 |
| | | | | | 5,666,183 |
Tobacco - 0.6%
| | | |
Altria Group, Inc. | | | 59,460 | | | 2,750,025 |
Philip Morris International, Inc. | | | 51,465 | | | 5,217,522 |
| | | | | | 7,967,547 |
Trading Companies & Distributors - 0.2%
| | | |
Fastenal Co. | | | 17,920 | | | 1,182,361 |
United Rentals, Inc. | | | 946 | | | 633,262 |
W.W. Grainger, Inc. | | | 615 | | | 566,698 |
| | | | | | 2,382,321 |
Water Utilities - 0.0%(c)
| | | |
American Water Works Co., Inc. | | | 3,747 | | | 489,995 |
Wireless Telecommunication Services - 0.2%
| | | |
T-Mobile US, Inc. | | | 17,028 | | | 2,979,219 |
TOTAL COMMON STOCKS
(Cost $1,232,261,124) | | | | | | 1,359,455,137 |
REAL ESTATE INVESTMENT TRUSTS - 1.9%(a)
| | | | | | |
Alexandria Real Estate Equities, Inc. | | | 3,746 | | | 445,774 |
American Tower Corp. | | | 14,777 | | | 2,892,450 |
AvalonBay Communities, Inc. | | | 3,633 | | | 700,007 |
Boston Properties, Inc. | | | 3,666 | | | 222,416 |
Camden Property Trust | | | 974 | | | 99,981 |
Crown Castle, Inc. | | | 14,326 | | | 1,468,415 |
Digital Realty Trust, Inc. | | | 9,181 | | | 1,334,367 |
Equinix, Inc. | | | 2,958 | | | 2,256,895 |
Equity Residential | | | 11,442 | | | 744,073 |
Essex Property Trust, Inc. | | | 894 | | | 232,252 |
Extra Space Storage, Inc. | | | 6,261 | | | 906,405 |
Federal Realty Investment Trust | | | 972 | | | 98,124 |
Healthpeak Properties, Inc. | | | 17,568 | | | 349,603 |
Host Hotels & Resorts, Inc. | | | 23,050 | | | 413,517 |
Invitation Homes, Inc. | | | 17,941 | | | 624,167 |
Iron Mountain, Inc. | | | 9,027 | | | 728,389 |
Kimco Realty Corp. | | | 20,244 | | | 391,924 |
Mid-America Apartment Communities, Inc. | | | 3,282 | | | 438,836 |
Prologis, Inc. | | | 31,078 | | | 3,433,808 |
Public Storage | | | 3,746 | | | 1,025,767 |
Realty Income Corp. | | | 20,388 | | | 1,081,787 |
The accompanying notes are an integral part of these financial statements.
Back to Table of Contents
NEOS S&P 500® High Income ETF
Schedule of Investments
as of May 31, 2024 (Continued)
| | | | | | | |
REAL ESTATE INVESTMENT TRUSTS - (Continued)
|
Regency Centers Corp. | | | 3,746 | | | $230,005 |
SBA Communications Corp. | | | 3,155 | | | 620,525 |
Simon Property Group, Inc. | | | 9,294 | | | 1,406,275 |
UDR, Inc. | | | 9,181 | | | 354,570 |
Ventas, Inc. | | | 12,068 | | | 606,538 |
VICI Properties, Inc. | | | 34,252 | | | 983,375 |
Welltower, Inc. | | | 17,660 | | | 1,830,812 |
Weyerhaeuser Co. | | | 23,395 | | | 702,552 |
TOTAL REAL ESTATE INVESTMENT TRUSTS
(Cost $26,373,384) | | | | | | 26,623,609 |
CONTINGENT VALUE RIGHTS - 0.0%(c)
| | | | | | |
Abiomed, Inc.(b)(d) | | | 2 | | | 0 |
TOTAL CONTINGENT VALUE RIGHTS
(Cost $0) | | | | | | 0 |
SHORT-TERM INVESTMENTS - 1.1%
| | | | | | |
Money Market Funds - 1.1%
| | | | | | |
First American Treasury Obligations Fund - Class X, 5.22%(e) | | | 15,840,504 | | | 15,840,504 |
TOTAL SHORT-TERM INVESTMENTS
(Cost $15,840,504) | | | | | | 15,840,504 |
TOTAL INVESTMENTS - 101.3%
(Cost $1,274,475,012) | | | | | | $1,401,919,250 |
Liabilities in Excess of Other Assets - (1.3)% | | | | | | (18,021,471) |
TOTAL NET ASSETS - 100.0% | | | | | | $1,383,897,779 |
Percentages are stated as a percent of net assets.
The Global Industry Classification Standard (“GICS®”) was developed by and/or is the exclusive property of MSCI, Inc. (“MSCI”) and Standard & Poor’s Financial Services LLC (“S&P”). GICS® is a service mark of MSCI and S&P and has been licensed for use by U.S. Bank Global Fund Services.
NV - Naamloze Vennootschap
PLC - Public Limited Company
SA - Sociedad Anónima
(a)
| All or a portion of security has been pledged as collateral. The total value of assets committed as collateral as of May 31, 2024 is $1,386,078,746. |
(b)
| Non-income producing security. |
(c)
| Represents less than 0.05% of net assets. |
(d)
| Fair value determined using significant unobservable inputs in accordance with procedures established by and under the supervision of the Adviser, acting as Valuation Designee. These securities represented $0 or 0.0% of net assets as of May 31, 2024. |
(e)
| The rate shown represents the 7-day effective yield as of May 31, 2024. |
The accompanying notes are an integral part of these financial statements.
Back to Table of Contents
NEOS S&P 500® HIGH INCOME ETF
Schedule of Written Options
as of May 31, 2024
| | | | | | | | | | |
WRITTEN OPTIONS - (1.1)% (a)(b)
|
Call Options - (1.1)%
| | | | | | | | | |
S&P 500 Index
| | | | | | | | | |
Expiration: 07/19/2024; Exercise Price: $5,320.00 | | | $(593,719,875) | | | (1,125) | | | $(9,253,125) |
Expiration: 07/19/2024; Exercise Price: $5,370.00 | | | (593,719,875) | | | (1,125) | | | (6,350,625) |
Total Call Options | | | | | | | | | (15,603,750) |
TOTAL WRITTEN OPTIONS
(Premiums received $14,400,742) | | | | | | | | | (15,603,750) |
| | | | | | | | | | |
Percentages are stated as a percent of net assets.
(b)
| 100 shares per contract. |
The accompanying notes are an integral part of these financial statements.
Back to Table of Contents
Statements of Assets and Liabilities
May 31, 2024
| | | | | | | | | | | | | |
ASSETS:
| | | | | | | | | | | | |
Investments, at value | | | $441,995,953 | | | $11,192,569 | | | $219,282,766 | | | $1,401,919,250 |
Dividends and interest receivable | | | 28,499 | | | 241 | | | 125,394 | | | 1,654,606 |
Receivable for investments sold | | | — | | | — | | | 3,666,308 | | | 20,073,788 |
Receivable for fund shares sold | | | — | | | — | | | 10,081,880 | | | 4,949,630 |
Deposit at broker for option contracts | | | — | | | 4,709 | | | — | | | — |
Other assets | | | — | | | — | | | — | | | 3 |
Total assets | | | 442,024,452 | | | 11,197,519 | | | 233,156,348 | | | 1,428,597,277 |
|
LIABILITIES:
| | | | | | | | | | | | |
Written option contracts, at value | | | 109,725 | | | 4,043 | | | 2,766,280 | | | 15,603,750 |
Payable to adviser | | | 141,032 | | | 4,924 | | | 96,582 | | | 734,459 |
Payable for investments purchased | | | — | | | — | | | 14,476,199 | | | 28,361,289 |
Total liabilities | | | 250,757 | | | 8,967 | | | 17,339,061 | | | 44,699,498 |
NET ASSETS | | | $441,773,695 | | | $11,188,552 | | | $215,817,287 | | | $1,383,897,779 |
|
Net Assets Consists of:
| | | | | | | | | | | | |
Paid-in capital | | | $441,652,803 | | | $11,346,378 | | | $211,287,214 | | | $1,312,552,099 |
Total distributable earnings/(accumulated
losses) | | | 120,892 | | | (157,826) | | | 4,530,073 | | | 71,345,680 |
Total net assets | | | $441,773,695 | | | $11,188,552 | | | $215,817,287 | | | $1,383,897,779 |
Net assets | | | $441,773,695 | | | $11,188,552 | | | $215,817,287 | | | $1,383,897,779 |
Shares issued and outstanding(a) | | | 8,870,000 | | | 240,000 | | | 4,280,000 | | | 27,960,000 |
Net asset value per share | | | $49.81 | | | $46.62 | | | $50.42 | | | $49.50 |
COST:
| | | | | | | | | | | | |
Investments, at cost | | | $441,932,768 | | | $11,349,711 | | | $214,188,883 | | | $1,274,475,012 |
|
PROCEEDS:
|
Written options premium | | | $245,135 | | | $9,058 | | | $2,723,595 | | | $14,400,742 |
| | | | | | | | | | | | | |
(a)
| Unlimited shares authorized without par value. |
The accompanying notes are an integral part of these financial statements.
Back to Table of Contents
Statements of Operations
For the Periods Ended May 31, 2024
| | | | | | | | | | | | | |
INVESTMENT INCOME:
|
Dividend income | | | $— | | | $185,831 | | | $227,839 | | | $8,584,194 |
Less: Dividend withholding taxes | | | — | | | — | | | (349) | | | (1,718) |
Interest income | | | 12,946,933 | | | 1,994 | | | 25,834 | | | 370,061 |
Total investment income | | | 12,946,933 | | | 187,825 | | | 253,324 | | | 8,952,537 |
|
EXPENSES:
| | | | | | | | | | | | |
Investment advisory fee | | | 915,994 | | | 33,466 | | | 175,260 | | | 3,831,430 |
Total expenses | | | 915,994 | | | 33,466 | | | 175,260 | | | 3,831,430 |
Expense waiver by Adviser | | | — | | | (1,721) | | | — | | | — |
Net expenses | | | 915,994 | | | 31,745 | | | 175,260 | | | 3,831,430 |
NET INVESTMENT INCOME | | | 12,030,939 | | | 156,080 | | | 78,064 | | | 5,121,107 |
REALIZED AND UNREALIZED GAIN/(LOSS)
| | | | | | | | | | | | |
Net realized gain/(loss) from:
| | | | | | | | | | | | |
Investments | | | (2,094,707) | | | (62,094) | | | (69,815) | | | (4,068,221) |
In-kind redemptions | | | (242) | | | — | | | — | | | 3,122,739 |
Written option contracts expired or closed | | | 3,556,051 | | | 103,092 | | | (451,310) | | | (46,414,338) |
Net realized gain/(loss) | | | 1,461,102 | | | 40,998 | | | (521,125) | | | (47,359,820) |
Net change in unrealized appreciation/(depreciation) on:
| | | | | | | | | | | | |
Investments | | | 88,127 | | | (128,929) | | | 5,093,883 | | | 126,898,467 |
Written option contracts | | | 104,594 | | | 4,027 | | | (42,685) | | | (1,209,356) |
Net change in unrealized appreciation/(depreciation) | | | 192,721 | | | (124,902) | | | 5,051,198 | | | 125,689,111 |
Net realized and unrealized gain/(loss) | | | 1,653,823 | | | (83,904) | | | 4,530,073 | | | 78,329,291 |
NET INCREASE IN NET ASSETS RESULTING FROM OPERATIONS | | | $13,684,762 | | | $72,176 | | | $4,608,137 | | | $83,450,398 |
| | | | | | | | | | | | | |
(a)
| The Fund commenced investment operations on January 30, 2024. |
The accompanying notes are an integral part of these financial statements.
Back to Table of Contents
Statements of Changes in Net Assets
| | | | | | | |
OPERATIONS:
| | | | | | | | | | | | |
Net investment income | | | $12,030,939 | | | $644,812 | | | $156,080 | | | $16,864 |
Net realized gain | | | 1,461,102 | | | 290,414 | | | 40,998 | | | 16,541 |
Net change in unrealized appreciation/(depreciation) | | | 192,721 | | | 5,874 | | | (124,902) | | | (27,225) |
Net increase in net assets from operations | | | 13,684,762 | | | 941,100 | | | 72,176 | | | 6,180 |
|
DISTRIBUTIONS TO SHAREHOLDERS:
| | | | | | | | | | | | |
Distributions to shareholders | | | (13,553,733) | | | (951,625) | | | (202,156) | | | (34,026) |
Return of capital | | | (1,282,823) | | | (29,184) | | | (112,364) | | | (9,004) |
Total distributions to shareholders | | | (14,836,556) | | | (980,809) | | | (314,520) | | | (43,030) |
|
CAPITAL TRANSACTIONS:
| | | | | | | | | | | | |
Subscriptions | | | 413,865,914 | | | 101,652,426 | | | 9,497,973 | | | 1,969,773 |
Redemptions | | | (71,049,803) | | | (1,503,339) | | | — | | | — |
Net increase in net assets from capital transactions | | | 342,816,111 | | | 100,149,087 | | | 9,497,973 | | | 1,969,773 |
NET INCREASE IN NET ASSETS | | | 341,664,317 | | | 100,109,378 | | | 9,255,629 | | | 1,932,923 |
NET ASSETS:
| | | | | | | | | | | | |
Beginning of the year | | | 100,109,378 | | | — | | | 1,932,923 | | | — |
End of the year | | | $441,773,695 | | | $100,109,378 | | | $11,188,552 | | | $1,932,923 |
SHARES TRANSACTIONS
| | | | | | | | | | | | |
Subscriptions | | | 8,290,000 | | | 2,030,000 | | | 200,000 | | | 40,000 |
Redemptions | | | (1,420,000) | | | (30,000) | | | — | | | — |
Total increase in shares outstanding | | | 6,870,000 | | | 2,000,000 | | | 200,000 | | | 40,000 |
(a)
| Inception date of the Fund was August 30, 2022. |
The accompanying notes are an integral part of these financial statements.
Back to Table of Contents
Statements of Changes in Net Assets (Continued)
| | | | | | | |
OPERATIONS:
| | | | | | | | | |
Net investment income | | | $78,064 | | | $5,121,107 | | | $45,704 |
Net realized gain/(loss) | | | (521,125) | | | (47,359,820) | | | 70,319 |
Net change in unrealized appreciation | | | 5,051,198 | | | 125,689,111 | | | 552,119 |
Net increase in net assets from operations | | | 4,608,137 | | | 83,450,398 | | | 668,142 |
|
DISTRIBUTIONS TO SHAREHOLDERS:
| | | | | | | | | |
Distributions to shareholders | | | (78,064) | | | (9,548,376) | | | (188,945) |
Return of capital | | | (4,355,312) | | | (62,890,517) | | | (246,419) |
Total distributions to shareholders | | | (4,433,376) | | | (72,438,893) | | | (435,364) |
|
CAPITAL TRANSACTIONS:
| | | | | | | | | |
Subscriptions | | | 215,642,525 | | | 1,362,850,824 | | | 26,285,280 |
Redemptions | | | — | | | (15,527,100) | | | (955,508) |
ETF transaction fees (See Note 7) | | | 1 | | | — | | | — |
Net increase in net assets from capital transactions | | | 215,642,526 | | | 1,347,323,724 | | | 25,329,772 |
NET INCREASE IN NET ASSETS | | | 215,817,287 | | | 1,358,335,229 | | | 25,562,550 |
|
NET ASSETS:
| | | | | | | | | |
Beginning of the year | | | — | | | 25,562,550 | | | — |
End of the year | | | $215,817,287 | | | $1,383,897,779 | | | $25,562,550 |
|
SHARES TRANSACTIONS
| | | | | | | | | |
Subscriptions | | | 4,280,000 | | | 27,750,000 | | | 550,000 |
Redemptions | | | — | | | (320,000) | | | (20,000) |
Total increase in shares outstanding | | | 4,280,000 | | | 27,430,000 | | | 530,000 |
(a)
| Inception date of the Fund was January 30, 2024. |
(b)
| Inception date of the Fund was August 30, 2022. |
The accompanying notes are an integral part of these financial statements.
Back to Table of Contents
NEOS Enhanced Income 1-3 Month T-Bill ETF
Financial Highlights
| | | | | | | |
PER SHARE DATA:
| | | | | | |
Net asset value, beginning of period | | | $50.05 | | | $50.00 |
INVESTMENTS OPERATIONS:
| | | | | | |
Net investment income(b) | | | 2.49 | | | 1.73 |
Net realized and unrealized gain on investments | | | 0.34 | | | 0.32 |
Total from investment operations | | | 2.83 | | | 2.05 |
|
LESS DISTRIBUTIONS FROM:
| | | | | | |
From net investment income | | | (2.61) | | | (1.31) |
From net realized gains | | | (0.20) | | | (0.63) |
Return of capital | | | (0.26) | | | (0.06) |
Total distributions | | | (3.07) | | | (2.00) |
Net asset value, end of period | | | $49.81 | | | $50.05 |
Total Return(c) | | | 5.80% | | | 4.18% |
|
SUPPLEMENTAL DATA AND RATIOS:
| | | | | | |
Net assets, end of period (in thousands) | | | $441,774 | | | $100,109 |
Ratio of expenses to average net assets(d) | | | 0.38% | | | 0.38% |
Ratio of net investment income to average net assets(d) | | | 4.99% | | | 4.58% |
Portfolio turnover rate(c)(e) | | | 0% | | | 0% |
(a)
| Inception date of the Fund was August 30, 2022. |
(b)
| Net investment income per share has been calculated based on average shares outstanding during the year or period. |
(c)
| Not annualized for periods less than one year. |
(d)
| Annualized for periods less than one year. |
(e)
| Portfolio turnover rate excludes in-kind transactions and short-term options. |
The accompanying notes are an integral part of these financial statements.
Back to Table of Contents
NEOS Enhanced Income Aggregate Bond ETF
Financial Highlights
| | | | | | | |
PER SHARE DATA:
| | | | | | |
Net asset value, beginning of period | | | $48.32 | | | $49.77 |
INVESTMENTS OPERATIONS:
| | | | | | |
Net investment income(b) | | | 1.27 | | | 0.78 |
Net realized and unrealized loss on investments | | | (0.47) | | | (0.40) |
Total from investment operations | | | 0.80 | | | 0.38 |
LESS DISTRIBUTIONS FROM:
| | | | | | |
From net investment income | | | (1.46) | | | (0.72) |
From net realized gains | | | (0.24) | | | (0.73) |
Return of capital | | | (0.80) | | | (0.38) |
Total distributions | | | (2.50) | | | (1.83) |
Net asset value, end of period | | | $46.62 | | | $48.32 |
Total Return(c) | | | 1.74% | | | 0.85% |
SUPPLEMENTAL DATA AND RATIOS:
| | | | | | |
Net assets, end of period (in thousands) | | | $11,189 | | | $1,933 |
Ratio of expenses to average net assets:
| | | | | | |
Before expense waivers(d) | | | 0.58% | | | 0.58% |
After expense waivers(d) | | | 0.55% | | | 0.55% |
Ratio of net investment income to average net assets(d) | | | 2.71% | | | 2.14% |
Portfolio turnover rate(c)(e) | | | 1% | | | 0% |
(a)
| Inception date of the Fund was August 30, 2022. |
(b)
| Net investment income per share has been calculated based on average shares outstanding during the year or period. |
(c)
| Not annualized for periods less than one year.
|
(d)
| Annualized for periods less than one year. |
(e)
| Portfolio turnover rate exclude in-kind transactions and short-term options. |
The accompanying notes are an integral part of these financial statements.
Back to Table of Contents
NEOS Nasdaq-100® High Income ETF
Financial Highlights
| | | | |
PER SHARE DATA:
| | | |
Net asset value, beginning of period | | | $50.00 |
INVESTMENTS OPERATIONS:
| | | |
Net investment income(b) | | | 0.05 |
Net realized and unrealized gain on investments | | | 2.77 |
Total from investment operations | | | 2.82 |
LESS DISTRIBUTIONS FROM:
| | | |
From net investment income | | | (0.04) |
Return of capital | | | (2.36) |
Total distributions | | | (2.40) |
ETF transaction fees per share | | | 0.00(c) |
Net asset value, end of period | | | $50.42 |
Total Return(d) | | | 5.78% |
SUPPLEMENTAL DATA AND RATIOS:
| | | |
Net assets, end of period (in thousands) | | | $215,817 |
Ratio of expenses to average net assets(e) | | | 0.68% |
Ratio of net investment income to average net assets(e) | | | 0.30% |
Portfolio turnover rate(d)(f) | | | 3% |
(a)
| Inception date of the Fund was January 30, 2024. |
(b)
| Net investment income per share has been calculated based on average shares outstanding during the period. |
(c)
| Amount represents less than $0.005 per share.
|
(d)
| Not annualized for periods less than one year. |
(e)
| Annualized for periods less than one year. |
(f)
| Portfolio turnover rate exclude in-kind transactions and short-term options. |
The accompanying notes are an integral part of these financial statements.
Back to Table of Contents
NEOS S&P 500® High Income ETF
Financial Highlights
| | | | | | | |
PER SHARE DATA:
| | | | | | |
Net asset value, beginning of period | | | $48.23 | | | $49.67 |
INVESTMENTS OPERATIONS:
| | | | | | |
Net investment income(b) | | | 0.44 | | | 0.49 |
Net realized and unrealized gain on investments | | | 6.71 | | | 2.34 |
Total from investment operations | | | 7.15 | | | 2.83 |
LESS DISTRIBUTIONS FROM:
| | | | | | |
From net investment income | | | (0.79) | | | (0.44) |
From net realized gains | | | (0.32) | | | (1.40) |
Return of capital | | | (4.77) | | | (2.43) |
Total distributions | | | (5.88) | | | (4.27) |
Net asset value, end of period | | | $49.50 | | | $48.23 |
Total Return(c) | | | 15.79% | | | 6.31% |
SUPPLEMENTAL DATA AND RATIOS:
| | | | | | |
Net assets, end of period (in thousands) | | | $1,383,898 | | | $25,563 |
Ratio of expenses to average net assets(d) | | | 0.68% | | | 0.68% |
Ratio of net investment income to average net assets(d) | | | 0.91% | | | 1.37% |
Portfolio turnover rate(c)(e) | | | 14% | | | 21% |
(a)
| Inception date of the Fund was August 30, 2022. |
(b)
| Net investment income per share has been calculated based on average shares outstanding during the year or period. |
(c)
| Not annualized for periods less than one year. |
(d)
| Annualized for periods less than one year. |
(e)
| Portfolio turnover rate exclude in-kind transactions and short-term options. |
The accompanying notes are an integral part of these financial statements.
Back to Table of Contents
NEOS ETF Trust
Notes to the Financial Statements
May 31, 2024
NOTE 1 – ORGANIZATION
The NEOS ETF Trust (the “Trust”), formerly the SHP ETF Trust, was organized as a Delaware statutory trust on February 1, 2021 and is authorized to issue multiple series or portfolios. The Trust is an open-end investment company, registered under the Investment Company Act of 1940, as amended (the “1940 Act”). The Trust currently consists of thirteen operational exchange-traded funds (“ETFs”), four of which are presented herein, NEOS Enhanced Income 1-3 Year T-Bill ETF (the “NEOS 1-3 Year T-Bill ETF”)(formerly NEOS Enhanced Income Credit Alternative ETF), NEOS Enhanced Income Aggregate Bond ETF (the “NEOS Aggregate Bond ETF”), NEOS Nasdaq-100® High Income ETF (the “NEOS Nasdaq-100® ETF”) and NEOS S&P 500® High Income ETF (the “NEOS S&P 500® ETF”), (collectively, the “Funds” or individually, a “Fund”). These financial statements relate only to the Funds. The Funds are each a diversified series of the Trust. The investment objective of the NEOS 1-3 Year T-Bill ETF and the NEOS Aggregate Bond ETF is to seek to generate monthly income in a tax efficient manner and the investment objective of the NEOS Nasdaq-100® ETF and NEOS S&P 500® ETF is to seek to generate high monthly income in a tax efficient manner with the potential for equity appreciation in rising markets.
NEOS Investment Management, LLC (the “Adviser”) is the investment adviser to each Fund.
NOTE 2 – SUMMARY OF SIGNIFICANT ACCOUNTING POLICIES
The Trust follows accounting and reporting guidance under Financial Accounting Standards Board (“FASB”) Accounting Standards Codification Topic 946, “Financial Services — Investment Companies” including Accounting Standards Update 2013-08.
The following is a summary of significant accounting policies consistently followed by the Funds in the preparation of their financial statements. These financial statements have been prepared in conformity with accounting principles generally accepted in the United States of America (“GAAP”).
A.
| Investment Valuation. The net asset value (“NAV”) of each Fund’s shares is calculated each business day as of the close of regular trading on the New York Stock Exchange (“NYSE”), generally 4:00 p.m., Eastern Time. NAV per share is computed by dividing the net assets of each Fund by each Fund’s number of shares outstanding. |
When calculating the NAV of each Fund’s shares, securities held by the Funds are valued at market quotations when reliable market quotations are readily available. Exchange traded securities and instruments (including equity securities, depositary receipts and ETFs) are generally valued at the last reported sale price on the principal exchange on which such securities are traded (at the NASDAQ Official Closing Price for NASDAQ listed securities), as of the close of regular trading on the NYSE on the day the securities are being valued or, if there are no sales, at the mean of the most recent bid and asked prices. Over-the-counter securities and instruments not traded on an exchange are generally valued at the last traded price. Investments in open-end regulated investment companies are valued at NAV. In the absence of a recorded transaction sale price; or if the last sale price is unavailable, securities are valued at the mean between last bid and ask, as quoted. If an ask price is unavailable, the last bid price is used. Such valuations would typically be categorized as Level 1 or Level 2 in the fair value hierarchy described below.
Options traded on an exchange are generally valued at the 4:00 p.m., Eastern Time bid/ask mean price on the exchange or OTC market on which they principally trade. If the 4:00 p.m. bid/ask mean price is not available, then options shall be valued at the 4:15 p.m. Eastern Time bid/ask mean price. If neither bid/ask mean price is available, then options shall be valued at the last reported settlement price on the exchange or OTC market on which they principally trade.
When reliable market quotations are not readily available, securities are priced at their fair value as determined in good faith by the Adviser in accordance with the Trust’s valuation guidelines. Pursuant to Rule 2a-5 under the 1940 Act, each Fund has designated the Adviser as its “Valuation Designee” to perform all of the fair value determinations as well as to perform all of the responsibilities that may be performed by the Valuation Designee in accordance with Rule 2a-5. The Valuation Designee is authorized to make all necessary determinations of the fair values of portfolio securities and other assets for which market quotations are not readily available or if it is deemed that the prices obtained from brokers and dealers or independent pricing services are unreliable. The Funds may use fair value pricing in a variety of circumstances, including
Back to Table of Contents
NEOS ETF Trust
Notes to the Financial Statements
May 31, 2024 (Continued)
but not limited to, situations when the value of a security has been materially affected by events occurring after the close of the market on which such security is principally traded (such as a corporate action or other news that may materially affect the price of such security) or trading in such security has been suspended or halted. Such valuations would typically be categorized as Level 2 or Level 3 in the fair value hierarchy described below. Fair value pricing involves subjective judgments and it is possible that a fair value determination for a security is materially different than the value that could be realized upon the sale of such security. As of May 31, 2024, there was one security within the NEOS S&P 500® ETF that was internally fair valued and/or valued using a Level 3 valuation. Refer to below for further valuation disclosures.
The Funds disclose the fair value of their investments in a hierarchy that distinguishes between: (1) market participant assumptions developed based on market data obtained from sources independent of the Funds (observable inputs) and (2) the Funds’ own assumptions about market participant assumptions developed based on the best information available under the circumstances (unobservable inputs).
The three levels defined by the hierarchy are as follows:
Level 1 –
Quoted prices in active markets for identical assets that the Funds have the ability to access.
Level 2 –
Other significant observable inputs (including quoted prices for similar securities, interest rates, prepayment speeds, credit risk, etc.).
Level 3 –
Significant unobservable inputs (including the Funds’ own assumptions in determining the fair value of investments).
The inputs or methodology used for valuing securities are not necessarily an indication of the risk associated with investing in those securities.
The following is a summary of the inputs used to value each Fund’s investments as of May 31, 2024:
NEOS 1-3 Year T-Bill ETF
| | | | | | | | | | | | | |
Assets:
| | | | | | | | | | | | |
Purchased Options* | | | $ — | | | $60,610 | | | $ — | | | $60,610 |
Money Market Funds | | | 1,468,316 | | | — | | | — | | | 1,468,316 |
U.S. Treasury Bills | | | — | | | 440,467,027 | | | — | | | 440,467,027 |
Total Assets | | | $1,468,316 | | | $440,527,637 | | | $— | | | $441,995,953 |
Liabilities:
| | | | | | | | | | | | |
Written Options* | | | — | | | (109,725) | | | — | | | (109,725) |
Total Liabilities | | | $— | | | $(109,725) | | | $— | | | $(109,725) |
NEOS Aggregate Bond ETF
| | | | | | | | | | | | | |
Assets:
| | | | | | | | | | | | |
Exchange Traded Funds | | | $11,159,096 | | | $ — | | | $ — | | | $11,159,096 |
Purchased Options* | | | — | | | 1,873 | | | — | | | 1,873 |
Money Market Funds | | | 31,600 | | | — | | | — | | | 31,600 |
Total Assets | | | $11,190,696 | | | $1,873 | | | $— | | | $11,192,569 |
Liabilities:
| | | | | | | | | | | | |
Written Options* | | | — | | | (4,043) | | | — | | | (4,043) |
Total Liabilities | | | $ — | | | $(4,043) | | | $ — | | | $(4,043) |
Back to Table of Contents
NEOS ETF Trust
Notes to the Financial Statements
May 31, 2024 (Continued)
NEOS Nasdaq-100® ETF
| | | | | | | | | | | | | |
Assets:
| | | | | | | | | | | | |
Common Stocks** | | | $217,611,373 | | | $ — | | | $ — | | | $ 217,611,373 |
Money Market Funds | | | 1,671,393 | | | — | | | — | | | 1,671,393 |
Total Assets | | | $219,282,766 | | | $— | | | — | | | $219,282,766 |
Liabilities:
| | | | | | | | | | | | |
Written Options* | | | — | | | (2,766,280) | | | — | | | (2,766,280) |
Total Liabilities | | | $— | | | $(2,766,280) | | | $ — | | | $(2,766,280) |
| | | | | | | | | | | | | |
NEOS S&P 500® ETF
| | | | | | | | | | | | | |
Assets:
| | | | | | | | | | | | |
Common Stocks** | | | $1,359,455,137 | | | $ — | | | $ — | | | $1,359,455,137 |
Real Estate Investment Trusts | | | 26,623,609 | | | — | | | — | | | 26,623,609 |
Contingent Value Rights | | | — | | | — | | | 0*** | | | 0*** |
Money Market Funds | | | 15,840,504 | | | — | | | — | | | 15,840,504 |
Total Assets | | | $1,401,919,250 | | | $— | | | $0*** | | | $1,401,919,250 |
Liabilities:
| | | | | | | | | | | | |
Written Options* | | | — | | | (15,603,750) | | | — | | | (15,603,750) |
Total Liabilities | | | $— | | | $(15,603,750) | | | $— | | | $(15,603,750) |
| | | | | | | | | | | | | |
*
| The tables above are based on market values or unrealized appreciation/(depreciation) rather than the notional amounts of derivatives. The uncertainties surrounding the valuation inputs for a derivative are likely to be more significant to a Fund’s NAV than the uncertainties surrounding inputs for a non-derivative security with the same market value. |
**
| See Schedule of Investments for segregation by industry. |
***
| Represents amount less than $0.50. |
Management has determined that the amount of Level 3 securities compared to total net assets is not material for the NEOS S&P 500® High Income ETF; therefore, the rollforward of Level 3 securities are not shown for the year ended May 31, 2024.
Significant unobservable valuation inputs monitored by the Adviser, the Valuation Designee pursuant to Rule 2a-5, under the supervision of the Board of Trustees for restricted securities or Level 3 investments as of May 31, 2024 for the NEOS S&P 500® ETF are as follows:
| | | | | | | | | | | | | |
Contingent Value Rights* | | | $ 0** | | | Projected Final
Distribution | | | Discount of Projected
Distribution | | | $ 35.00 |
| | | | | | | | | | | | | |
*
| This Level 3 security was received through a corporate action. The security is being kept open due to the potential of an additional distribution. Based on the evaluation of the likelihood of an additional distribution, the security is being priced at zero. |
**
| Represents amount less than $0.50. |
B.
| Written Option Contracts. The Funds are subject to equity price risk in the normal course of pursuing their investment objectives. The Funds write (sell) put or call options for hedging purposes, volatility management purposes, or otherwise to gain, or reduce, long or short exposure to one or more asset classes or issuers. When the Funds write (sell) an option, an amount equal to the premium received by the Fund is included in the Statement of Assets and Liabilities as an asset and an equivalent liability. The amount of the liability is |
Back to Table of Contents
NEOS ETF Trust
Notes to the Financial Statements
May 31, 2024 (Continued)
subsequently priced daily to reflect the current value of the option written. Refer to Note 2 (A). for a pricing description. By writing an option, the Funds may become obligated during the term of the option to deliver or purchase the securities underlying the option at the exercise price if the option is exercised. These contracts may involve market risk in excess of the amounts receivable or payable reflected on the Statement of Assets and Liabilities. Refer to Note 2 (H). for further derivative disclosures and Note 2 (D). for further counterparty risk disclosure.
When an option expires on its stipulated expiration date or the Funds enters into a closing purchase transaction, the Funds realize gains or losses if the cost of the closing purchase transaction differs from the premium received when the option was sold without regard to any unrealized appreciation or depreciation on the underlying security, and the liability related to such option is eliminated. When a written call option is exercised, the premium originally received decreases the cost basis of the security and the Funds realize gains or losses from the sale of the underlying security. When a written put option is exercised, the cost of the security acquired is decreased by the premium received for the put.
C.
| Purchased Option Contracts. The Funds are subject to equity price risk in the normal course of pursuing their investment objectives. The Funds will purchase call or put options. When the Funds purchase an option contract, an amount equal to the premiums paid is included in the value of investments on the Statement of Assets and Liabilities and is subsequently priced daily to reflect the value of the purchased option contract. Refer to Note 2 (A). for a pricing description. Refer to Note 2 (H). for further derivative disclosures and Note 2 (D). for further counterparty risk disclosure. When option contracts expire or are closed, realized gains or losses are recognized without regard to any unrealized appreciation or depreciation on the underlying securities that may be held by the Funds. If the Funds exercise a call option, the cost of the security acquired is increased by the premium paid for the call. If the Funds exercise a put option, the premium paid for the put option increases the cost of the underlying security and a gain or loss is realized from the sale of the underlying security. |
D.
| Counterparty Risk. The Funds help manage counterparty credit risk by entering into agreements only with counterparties the Adviser believes have the financial resources to honor its obligations. The Adviser considers the credit worthiness of each counterparty to a contract in evaluating potential credit risk. Written options contracts sold on an exchange do not expose the Funds to counterparty risk; the exchange’s clearinghouse guarantees the options against counterparty non-performance. Over-the-counter options counterparty risk includes the risk of loss of the full amount of any net unrealized appreciation. |
E.
| Use of Estimates. The preparation of the financial statements in conformity with GAAP requires management to make estimates and assumptions that affect the reported amounts of assets and liabilities and disclosure of contingent assets and liabilities at the date of the financial statement. Actual results could differ from those estimates. |
F.
| Federal Income Taxes. Each Fund intends to qualify as a regulated investment company (“RIC”) under Subchapter M of the Internal Revenue Code of 1986, as amended. If so qualified, the Funds will not be subject to federal income tax to the extent each Fund distributes substantially all its taxable net investment income and net capital gains to its shareholders. Therefore, no provision for federal income tax should be required. Management of the Funds is required to determine whether a tax position taken by the Funds is more likely than not to be sustained upon examination by the applicable taxing authority. Based on its analysis, Management has concluded that there are no significant uncertain tax positions that would require recognition in the financial statements as of May 31, 2024. The Funds recognize interest and penalties, if any, related to unrecognized tax benefits as income tax expense on the Statements of Operations. Management of the Funds are required to determine whether a tax position taken by the Funds is more likely than not to be sustained upon examination by the applicable taxing authority. Based on its analysis, Management has concluded that the Funds do not have any unrecognized tax benefits or uncertain tax positions that would require a provision for income tax. Accordingly, the Funds did not incur any interest or penalties for the period ended May 31, 2024. |
Back to Table of Contents
NEOS ETF Trust
Notes to the Financial Statements
May 31, 2024 (Continued)
G.
| Distributions to Shareholders. Each Fund expects to declare and distribute all of its net investment income, if any, to shareholders as dividends monthly. The Funds will distribute net realized capital gains, if any, at least annually. The Funds may distribute such income dividends and capital gains more frequently, if necessary, to reduce or eliminate federal excise or income taxes on the Funds. |
The amount of any distribution will vary, and there is no guarantee the Funds will pay either an income dividend or a capital gains distribution.
H.
| Derivatives. The Funds may utilize derivative instruments such as options and other instruments with similar characteristics to the extent that they are consistent with the Funds’ respective investment objectives and limitations. The use of these instruments may involve additional investment risks, including the possibility of illiquid markets or imperfect correlation between the value of the instruments and the underlying securities. Derivatives also may create leverage which will amplify the effect of their performance on the Funds and may produce significant losses.
|
For the year or period ended May 31, 2024, the Funds’ average derivative volume is described below:
| | | | | | | |
NEOS 1-3 Year T-Bill ETF
|
Purchased Options | | | 526 | | | $254,110,111 |
Written Options | | | 526 | | | $254,110,111 |
NEOS Aggregate Bond ETF
|
Purchased Options | | | 12 | | | $6,029,221 |
Written Options | | | 12 | | | $6,029,221 |
NEOS Nasdaq-100® ETF
|
Written Options | | | 31 | | | $56,930,494 |
NEOS S&P 500® ETF
|
Written Options | | | 1,063 | | | $522,215,131 |
The Funds have adopted authoritative standards regarding disclosure about derivatives and hedging activities and how they affect the Funds’ Statement of Assets and Liabilities and Statement of Operations.
Statements of Assets and Liabilities
Fair values of derivative instruments as of May 31, 2024:
| | | | | | | |
NEOS 1-3 Year T-Bill ETF
| | | | | | | | | |
Purchased Options:
| | | | | | | | | |
Equity | | | Investments, at value | | | $60,610 | | | $— |
Written Options:
| | | | | | | | | |
Equity | | | Written option contracts, at value | | | — | | | 109,725 |
Total Derivatives not accounted for as hedging instruments | | | | | | $60,610 | | | $109,725 |
Back to Table of Contents
NEOS ETF Trust
Notes to the Financial Statements
May 31, 2024 (Continued)
| | | | | | | |
NEOS Aggregate Bond ETF
| | | | | | | | | |
Purchased Options:
| | | | | | | | | |
Equity | | | Investments, at value | | | $1,873 | | | $— |
Written Options:
| | | | | | | | | |
Equity | | | Written option contracts, at value | | | — | | | 4,043 |
Total Derivatives not accounted for as hedging instruments | | | | | | $1,873 | | | $4,043 |
NEOS NASDAQ-100® ETF
| | | | | | | | | |
Written Options:
| | | | | | | | | |
Equity | | | Written option contracts, at value | | | $— | | | $2,766,280 |
Total Derivatives not accounted for as hedging instruments | | | | | | $— | | | $2,766,280 |
NEOS S&P 500® ETF
| | | | | | | | | |
Written Options:
| | | | | | | | | |
Equity | | | Written option contracts, at value | | | $— | | | $15,603,750 |
Total Derivatives not accounted for as hedging instruments | | | | | | $— | | | $15,603,750 |
Statements of Operations
The effect of derivative instruments on the Statements of Operations for the period ended May 31, 2024:
| | | | |
NEOS 1-3 Year T-Bill ETF
|
Derivatives Not Accounted for as Hedging Instruments
|
Equity Contracts | | | $ (2,092,936) | | | $3,556,051 | | | $1,463,115 |
Total | | | $ (2,092,936) | | | $3,556,051 | | | $1,463,115 |
NEOS Aggregate Bond ETF
|
Derivatives Not Accounted for as Hedging Instruments
|
Equity Contracts | | | $(59,610) | | | $103,092 | | | $43,482 |
Total | | | $(59,610) | | | $103,092 | | | $43,482 |
NEOS NASDAQ-100® ETF
|
Derivatives Not Accounted for as Hedging Instruments
|
Equity Contracts | | | | | | $(451,310) | | | $(451,310) |
Total | | | | | | $(451,310) | | | $(451,310) |
NEOS S&P 500® ETF
|
Derivatives Not Accounted for as Hedging Instruments
|
Equity Contracts | | | | | | $(46,414,338) | | | $(46,414,338) |
Total | | | | | | $(46,414,338) | | | $(46,414,338) |
Back to Table of Contents
NEOS ETF Trust
Notes to the Financial Statements
May 31, 2024 (Continued)
| | | | |
NEOS 1-3 Year T-Bill ETF
|
Derivatives Not Accounted for as Hedging Instruments
|
Equity Contracts | | | $ (43,143) | | | $104,594 | | | $61,451 |
Total | | | $ (43,143) | | | $104,594 | | | $61,451 |
NEOS Aggregate Bond ETF
|
Derivatives Not Accounted for as Hedging Instruments
|
Equity Contracts | | | $(1,331) | | | $4,027 | | | $2,696 |
Total | | | $(1,331) | | | $4,027 | | | $2,696 |
NEOS NASDAQ-100® ETF
|
Derivatives Not Accounted for as Hedging Instruments
|
Equity Contracts | | | | | | $(42,685) | | | $(42,685) |
Total | | | | | | $(42,685) | | | $(42,685) |
NEOS S&P 500® ETF
|
Derivatives Not Accounted for as Hedging Instruments
|
Equity Contracts | | | | | | $(1,209,356) | | | $(1,209,356) |
Total | | | | | | $(1,209,356) | | | $(1,209,356) |
*
| The amounts disclosed are included in the realized gain (loss) on investments. |
**
| The amounts disclosed are included in the change in unrealized appreciation (depreciation) on investments. |
I.
| Reclassification of Capital Accounts. GAAP requires that certain components of net assets relating to permanent differences be reclassified between financial and tax reporting. These reclassifications have no effect on net assets of NAV per share and are primarily due to differing book and tax treatments for in-kind redemptions. For the period ended May 31, 2024, the following adjustments were made: |
| | | | | | | |
NEOS 1-3 Year T-Bill ETF | | | $242 | | | $(242) |
NEOS Aggregate Bond ETF | | | — | | | — |
NEOS Nasdaq-100® ETF | | | — | | | — |
NEOS S&P 500® ETF | | | (3,035,539) | | | 3,035,539 |
NOTE 3 – INVESTMENT ADVISORY AND OTHER AGREEMENTS
Management
The Adviser acts as each Fund’s investment adviser pursuant to an investment advisory agreement with the Trust (the “Investment Advisory Agreement”).
Under the terms of the Investment Advisory Agreement between the Trust, on behalf of the Funds, and the Adviser, the Adviser provides investment management services to the Funds and oversees the day-to-day operations of the Funds, subject to the supervision of the Board of Trustees (the “Board”) and the officers of the Trust. The Adviser administers the Funds’ business affairs, provides office facilities and equipment and certain clerical, bookkeeping and administrative services.
Pursuant to the Investment Advisory Agreement, the NEOS 1-3 Year T-Bill ETF pays the Adviser a monthly unitary management fee at an annual rate of 0.38%, the NEOS Aggregate Bond ETF pays the Adviser a monthly unitary
Back to Table of Contents
NEOS ETF Trust
Notes to the Financial Statements
May 31, 2024 (Continued)
management fee at an annual rate of 0.58% and the NEOS Nasdaq-100® ETF and NEOS S&P 500® ETFpay the Adviser a monthly unitary management fee at the annual rate of 0.68%, based on each Fund’s average daily net assets. For the periods ended May 31, 2024, NEOS 1-3 Year T-Bill ETF, NEOS Aggregate Bond ETF, NEOS Nasdaq-100® ETF and NEOS S&P 500® ETF incurred $915,994, $33,466, $175,260 and $3,831,430, respectively, in management fees. Additionally, for the year ended May 31, 2024, the Adviser waived $1,721 of management fees with respect to the NEOS Aggregate Bond ETF.
Under the Investment Advisory Agreement, the Adviser has agreed to pay all expenses incurred by the Funds except for the management fee, interest, taxes, brokerage commissions and other expenses incurred in placing orders for the purchase and sale of securities and other investment instruments, acquired fund fees and expenses (“AFFE”), extraordinary expenses, and distribution fees and expenses paid by the Funds under any distribution plan adopted pursuant to Rule 12b-1 under the 1940 Act.
For the NEOS Aggregate Bond ETF, the Adviser contractually has agreed to waive its management fee and/or reimburse expenses so that AFFE and total annual Fund operating expenses, excluding portfolio transaction and other investment-related costs (including brokerage fees and commissions); taxes; borrowing costs (such as interest and dividend expenses on securities sold short); fees and expenses associated with investments in other collective investment vehicles or derivative instruments (including for example option and swap fees and expenses); any administrative and/or shareholder servicing fees payable pursuant to a plan adopted by the Board; expenses incurred in connection with any merger or reorganization; extraordinary expenses (such as litigation expenses, indemnification of Trust officers and Trustees and contractual indemnification of Fund service providers); and other expenses that the Trustees agree have not been incurred in the ordinary course of the Fund’s business, do not exceed 0.58% through September 28, 2024. This expense cap may not be terminated prior to this date except by the Board.
The NEOS Aggregate Bond ETF has agreed that it will repay the Adviser for fees and expenses waived or reimbursed for the Fund pursuant to the contractual expense limitation described above. Such repayment would increase the Fund’s expenses and would appear on the Statements of Operations as “Repayment of prior expenses waived and/or reimbursed by the Adviser.” However, repayment would only occur up to the point of the Fund’s expense cap.
Any such repayment must be made within three years from the date the expense was borne by the Adviser. Any such repayment made under any prior expense cap cannot cause the Fund’s Operating Expenses to exceed the lower of 0.58% of average daily net assets or the annual rate of daily net assets for the Fund under the terms of a prior expense cap. For the year ended May 31, 2024, NEOS Aggregate Bond ETF did not repay expenses to the Adviser.
As of May 31, 2024, the amounts eligible for repayment and the associated periods of expiration are as follows:
| | | | | | | | | | |
NEOS Aggregate Bond ETF | | | $ 234 | | | $ 1,721 | | | $ 1,955 |
| | | | | | | | | | |
Administrator, Custodian, Transfer Agent and Accounting Agent
U.S. Bancorp Fund Services, LLC dba U.S. Bank Global Fund Services (“Fund Services”), an indirect wholly-owned subsidiary of U.S. Bancorp, serves as the Funds’ administrator and, in that capacity performs various administrative and accounting services for the Funds. Fund Services also serves as the Funds’ fund accountant, transfer agent, dividend disbursing agent and registrar. Fund Services prepares various federal and state regulatory filings, reports and returns for the Funds, including regulatory compliance monitoring and financial reporting; prepares reports and materials to be supplied to the trustees; monitors the activities of the Funds’ custodian, transfer agent and accountants; reviews the Funds’ advisory fee expense accrual and coordinates the preparation and payment of the advisory fees. U.S. Bank, N.A., an affiliate of Fund Services, serves as the Funds’ custodian. For the period ended May 31, 2024, there were no fees incurred from the service providers described above as the Adviser bore all such costs.
Back to Table of Contents
NEOS ETF Trust
Notes to the Financial Statements
May 31, 2024 (Continued)
Distributor and Fund Officers
Foreside Fund Services, LLC (the “Distributor”) serves as the principal underwriter for shares of the Funds and acts as each Fund’s distributor in a continuous public offering of the Funds’ shares and serves as the distributor of Creation Units for the Funds. Shares are continuously offered for sale by the Trust through the Distributor only in Creation Units, as described further in Note 7. Shares in less than Creation Units are not distributed by the Distributor. The Distributor is a broker-dealer registered under the Securities Exchange Act of 1934, as amended, and a member of the Financial Industry Regulatory Authority, Inc. (“FINRA”).
Foreside Fund Officer Services, LLC, an affiliate of the Distributor, provides the Trust with a Chief Compliance Officer and Principal Financial Officer.
NOTE 4 – RELATED PARTIES
As of May 31, 2024, certain officers and Trustees of the Trust were also officers or employees of the Adviser or affiliated with the Distributor and received no fees from the Trust for serving as officers.
NOTE 5 – PURCHASES AND SALES OF SECURITIES
The costs of purchases and sales of securities, excluding short-term securities and in-kind transactions, during the year or period ended May 31, 2024, were as follows:
| | | | | | | |
NEOS 1-3 Year T-Bill ETF | | | $— | | | $— |
NEOS Aggregate Bond ETF | | | 2,362,604 | | | 70,877 |
NEOS Nasdaq-100® ETF | | | 6,048,919 | | | 1,886,161 |
NEOS S&P 500® ETF | | | 80,227,029 | | | 83,278,027 |
The costs of purchases and sales of in-kind transactions, during the year or period ended May 31, 2024, were as follows:
| | | | | | | |
NEOS 1-3 Year T-Bill ETF | | | $— | | | $— |
NEOS Aggregate Bond ETF | | | 7,081,461 | | | — |
NEOS Nasdaq-100® ETF | | | 208,424,547 | | | — |
NEOS S&P 500® ETF | | | 1,251,089,085 | | | 12,542,735 |
NOTE 6 – TAX MATTERS
The tax character of the distributions paid during the periods ended May 31, 2024 and May 31, 2023 are as follows:
| | | | |
NEOS 1-3 Year T-Bill ETF | | | $ 12,638,994 | | | $914,739 | | | $1,282,823 |
NEOS Aggregate Bond ETF | | | 174,451 | | | 27,705 | | | 112,364 |
NEOS Nasdaq-100® ETF | | | 78,064 | | | — | | | 4,355,312 |
NEOS S&P 500® ETF | | | 6,874,469 | | | 2,673,907 | | | 62,890,517 |
Back to Table of Contents
NEOS ETF Trust
Notes to the Financial Statements
May 31, 2024 (Continued)
| | | | |
NEOS 1-3 Year T-Bill ETF | | | $767,388 | | | $184,237 | | | $29,184 |
NEOS Aggregate Bond ETF | | | 23,595 | | | 10,431 | | | 9,004 |
NEOS S&P 500® ETF | | | 105,622 | | | 83,323 | | | 246,419 |
| | | | | | | | | | |
NEOS Nasdaq-100® ETF commenced operations on January 30, 2024, thus there were no distributions made during the period ended May 31, 2023.
Net capital losses incurred after October 31 and late year losses incurred after December 31 and within the taxable year are deemed to arise on the first business day of each Fund’s next taxable year. For the period ended May 31, 2024, the Funds did not have any late year losses. NEOS S&P 500® ETF had $20,397,379 of short term post October losses and $31,208,655 of long term post October losses. Capital loss carry forwards will retain their character as either short-term or long-term capital losses. At May 31, 2024, NEOS Nasdaq-100® ETF had $197,033 of short-term capital loss carryover and $296,397 of long-term capital loss carryover. No other Funds have any short or long-term capital loss carryovers available.
As of May 31, 2024, the components of accumulated earnings (losses) for income tax purposes were as follows:
| | | | | | | | | | | | | |
Federal income tax cost of investments | | | $ 441,875,062 | | | $ 11,350,395 | | | $ 214,259,263 | | | $1,278,967,535 |
Aggregate gross unrealized appreciation | | | 120,891 | | | — | | | 10,432,841 | | | 158,176,076 |
Aggregate gross unrealized (depreciation) | | | — | | | (157,826) | | | (5,409,338) | | | (35,224,361) |
Net unrealized appreciation (depreciation) | | | 120,891 | | | (157,826) | | | 5,023,503 | | | 122,951,715 |
Undistributed Ordinary Income | | | — | | | — | | | — | | | — |
Undistributed Long Term Capital Gains | | | — | | | — | | | — | | | — |
Distributable Earnings | | | — | | | — | | | — | | | — |
Accumulated capital and other gain/(loss) | | | 1 | | | — | | | (493,430) | | | (51,606,035) |
Total distributable earnings (accumulated loss) | | | 120,892 | | | (157,826) | | | 4,530,073 | | | 71,345,680 |
| | | | | | | | | | | | | |
NOTE 7 – SHARE TRANSACTIONS
Each Fund currently offers one class of shares, which has no front-end sales loads, no deferred sales charges, and no redemption fees. The standard fixed transaction fees for the NEOS 1-3 Year T-Bill ETF and NEOS Aggregate Bond ETF are $300, and the NEOS S&P 500® ETF and NEOS Nasdaq-100® ETF is $500, payable to the Custodian. Additionally, a variable transaction fee may be charged by the Funds of up to a maximum of 2% of the value of the Creation Units (inclusive of any transaction fees charged), for each creation or redemption. Variable transaction fees are imposed to compensate the Funds for the transaction costs associated with creation and redemption transactions. The Adviser may adjust or waive the transaction fees from time to time. The Funds may each issue an unlimited number of shares of beneficial interest, with no par value. All shares of the Funds have equal rights and privileges.
Shares of the NEOS Cash Alternative ETF and NEOS Aggregate Bond ETF are listed and traded on the NYSE Arca, Inc., shares of the NEOS S&P 500® ETF are listed and traded on the Cboe BZX Exchange, Inc. and shares of the NEOS Nasdaq-100® ETF are listed and traded on NASDAQ (the “Exchanges”). Market prices for the Shares may be different from their NAV. The Funds will issue and redeem Shares on a continuous basis at NAV only in large blocks of Shares, typically 10,000 Shares, called “Creation Units.” Creation Unit transactions are conducted in exchange for the deposit or delivery of a designated basket of in-kind securities and/or cash. Once created, Shares generally will trade in the secondary market in amounts less than a Creation Unit and at market prices that change throughout the day. Except when aggregated in Creation Units, shares are not redeemable securities of the Funds. Shares of the Funds may only be
Back to Table of Contents
NEOS ETF Trust
Notes to the Financial Statements
May 31, 2024 (Continued)
purchased or redeemed by certain financial institutions (“Authorized Participants”). An Authorized Participant is either (i) a broker-dealer or other participant in the clearing process through the Continuous Net Settlement System of the National Securities Clearing Corporation (“NSCC”) or (ii) a participant in the Depository Trust Company (“DTC”) and, in each case, must have executed a Participant Agreement with the Funds’ Distributor. Most retail investors will not qualify as Authorized Participants or have the resources to buy and sell whole Creation Units. Therefore, they will be unable to purchase or redeem shares directly from the Funds. Rather, most retail investors will purchase shares in the secondary market with the assistance of a broker and will be subject to customary brokerage commissions or fees.
NOTE 8 – BENEFICIAL OWNERSHIP
The beneficial ownership, either directly or indirectly, of more than 25% of the voting securities of a fund creates a presumption of control of the fund, under Section 2(a)(9) of the 1940 Act. As of the date of these financial statements, NEOS Investment Management, LLC, the adviser to the NEOS Enhanced Income Cash Alternative ETF, NEOS S&P 500® High Income ETF, NEOS Enhanced Income Aggregate Bond ETF and NEOS Nasdaq-100® ETF, has no voting power of the shares outstanding of the Funds.
NOTE 9 – PRINCIPAL RISKS
As with all ETFs, shareholders of the Funds are subject to the risk that their investment could lose money. The Funds are subject to the principal risks, any of which may adversely affect each Fund’s NAV, trading price, yield, total return and ability to meet their investment objectives. A description of principal risks is included in each prospectus under the heading “Principal Risks of Investing in the Fund”.
NOTE 10 – GUARANTEES AND INDEMNIFICATIONS
In the normal course of business, the Trust, on behalf of the Funds, enters into contracts with third-party service providers that contain a variety of representations and warranties and that provide general indemnifications. Additionally, under the Trust organizational documents, the officers and Trustees are indemnified against certain liabilities arising out of the performance of their duties to the Trust. The Funds’ maximum exposure under these arrangements is unknown, as it involves possible future claims that may or may not be made against the Funds. The Adviser is of the view that the risk of loss to the Funds in connection with the Funds’ indemnification obligations is remote; however, there can be no assurance that such obligations will not result in material liabilities that adversely affect the Funds.
NOTE 11 – SUBSEQUENT EVENTS
Management has evaluated subsequent events and transactions for potential recognition or disclosure through the date the financial statements were issued.
Management has determined that there are no material events that would require recognition or disclosure in the Funds’ financial statements.
Back to Table of Contents
NEOS ETF Trust
Report of Independent Registered Public Accounting Firm
To the Shareholders of NEOS ETFs and
Board of Trustees of NEOS ETF Trust
Opinion on the Financial Statements
We have audited the accompanying statements of assets and liabilities, including the schedules of investments and written options (as applicable), of NEOS ETFs comprising the funds listed below (the “Funds”), each a series of NEOS ETF Trust (formerly SHP ETF Trust), as of May 31, 2024, and the related statements of operations, the statements of changes in net assets and the financial highlights for each of the periods indicated below (collectively referred to as the “financial statements”) and related notes. In our opinion, the financial statements present fairly, in all material respects, the financial position of the Funds as of May 31, 2024, the results of their operations, the changes in net assets and the financial highlights for the periods indicated below in conformity with accounting principles generally accepted in the United States of America.
| | | | | | | | | | |
NEOS Enhanced Income 1-3 Month T-Bill ETF (formerly NEOS Enhanced Income Credit Alternative ETF), NEOS Enhanced Income Aggregate Bond ETF, and NEOS S&P 500® High Income ETF | | | For the year ended May 31, 2024 | | | For the year ended May 31, 2024 and for the period from August 30, 2022 (commencement of operations) to May 31, 2023 |
NEOS Nasdaq-100® High Income ETF | | | For the period from January 30, 2024 (commencement of operations) to
May 31, 2024 |
| | | | |
Basis for Opinion
These financial statements are the responsibility of the Funds’ management. Our responsibility is to express an opinion on the Funds’ financial statements based on our audits. We are a public accounting firm registered with the Public Company Accounting Oversight Board (United States) (“PCAOB”) and are required to be independent with respect to the Funds in accordance with the U.S. federal securities laws and the applicable rules and regulations of the Securities and Exchange Commission and the PCAOB.
We conducted our audits in accordance with the standards of the PCAOB. Those standards require that we plan and perform the audits to obtain reasonable assurance about whether the financial statements are free of material misstatement whether due to error or fraud.
Our audits included performing procedures to assess the risks of material misstatement of the financial statements, whether due to error or fraud, and performing procedures that respond to those risks. Such procedures included examining, on a test basis, evidence regarding the amounts and disclosures in the financial statements. Our procedures included confirmation of securities owned as of May 31, 2024, by correspondence with the custodian and brokers; when replies were not received from brokers, we performed other auditing procedures. Our audits also included evaluating the accounting principles used and significant estimates made by management, as well as evaluating the overall presentation of the financial statements. We believe that our audits provide a reasonable basis for our opinion.
We have served as the auditor of one or more of the Funds in the NEOS ETF Trust since 2023.
COHEN & COMPANY, LTD.
Philadelphia, Pennsylvania
July 29, 2024
Back to Table of Contents
NEOS ETF Trust
Other Non-Audited Information
May 31, 2024 (Unaudited)
TAX INFORMATION
For the fiscal period ended May 31, 2024, certain dividends paid by the Funds may be subject to reduced tax rates, as provided for by the Jobs and Growth Tax Relief Reconciliation Act of 2003. The percentage of dividends declared from ordinary income designated as qualified dividend income was as follows:
| | | | | |
NEOS Enhanced Income 1-3 Year T-Bill ETF | | | 0.00% | |
NEOS Enhanced Income Aggregate Bond ETF | | | 0.00% | |
NEOS Nasdaq-100® High Income ETF | | | 0.00% | |
NEOS S&P 500® High Income ETF | | | 100.00% | |
For corporate shareholders, the percent of ordinary income distributions qualifying for the corporate dividends received deduction for the period ended May 31, 2024 were as follows:
| | | | | |
NEOS Enhanced Income 1-3 Year T-Bill ETF | | | 0.00% | |
NEOS Enhanced Income Aggregate Bond ETF | | | 0.00% | |
NEOS Nasdaq-100® High Income ETF | | | 0.00% | |
NEOS S&P 500® High Income ETF | | | 100.00% | |
For the period ended May 31, 2024, the percentage of taxable ordinary income distributions that are designated as short-term capital gain distributions under Internal Revenue Code Section 871(k)(2)(C) for the Funds were as follows:
| | | | | |
NEOS Enhanced Income 1-3 Year T-Bill ETF | | | 4.81% | |
NEOS Enhanced Income Aggregate Bond ETF | | | 11.00% | |
NEOS Nasdaq-100® High Income ETF | | | 0.00% | |
NEOS S&P 500® High Income ETF | | | 25.51% | |
FREQUENCY DISTRIBUTION OF PREMIUMS AND DISCOUNTS
Information regarding how often shares of the Funds traded on the Exchanges at a price above (i.e., at a premium) or below (i.e., at a discount) the NAV of the Funds are available on the Funds’ website at www.neosfunds.com.
HOUSEHOLDING
Householding is an option available to certain fund investors. Householding is a method of delivery, based on the preference of the individual investor, in which a single copy of certain shareholder documents can be delivered to investors who share the same address, even if their accounts are registered under different names. Please contact your broker-dealer if you are interested in enrolling in householding and receiving a single copy of the prospectuses and other shareholder documents, or if you are currently enrolled in householding and wish to change your householding status.
DISCLOSURE OF PORTFOLIO HOLDINGS
The Funds file their complete schedules of portfolio holdings with the Securities and Exchange Commission (“SEC”) for the first and third quarters of each fiscal year to date as exhibits to their reports on Form N-PORT. The Funds’ Form N-PORT reports are available on the SEC’s website at www.sec.gov. They may also be reviewed and copied at the SEC’s Public Reference Room in Washington, D.C. Information about the Public Reference Room may be obtained by calling 1-800-SEC-0330. In addition, the Funds’ full portfolio holdings are updated daily and available on the Funds’ website at www.neosfunds.com.
Back to Table of Contents
NEOS ETF Trust
Other Non-Audited Information
May 31, 2024 (Unaudited) (Continued)
PROXY VOTING POLICIES AND PROCEDURES
A description of the policies and procedures the Funds uses to determine how to vote proxies relating to portfolio securities is provided in the Statements of Additional Information (“SAIs”). The SAI is available without charge upon request by calling toll-free at (833) 833-1311, by accessing the SEC’s website at http://www.sec.gov, or by accessing the Funds’ website at www.neosfunds.com. Information on how the Funds’ voted proxies relating to portfolio securities during the most recent 12-month period ended June 30 is available without charge, upon request, by calling (833) 833-1311 or by accessing the website of the SEC.
Back to Table of Contents
NEOS ETF Trust
Changes in and Disagreements with Accountants for Open-End Management Investment COMPANIES (UNAUDITED)
An open-end management investment company registered on Form N-1A [17 CFR 239.15A and 17 CFR 274.11A] must disclose the information concerning changes in and disagreements with accountants and on accounting and financial disclosure required by Item 304 of Regulation S-K [17 CFR 229.304].
Response: This is not applicable to the Registrant.
Back to Table of Contents
NEOS ETF Trust
Proxy Disclosures for Open-End Management Investment COMPANIES (UNAUDITED)
If any matter was submitted during the period covered by the report to a vote of shareholders of an open-end management investment company registered on Form N-1A [17 CFR 239.15A and 17 CFR 274.11A], through the solicitation of proxies or otherwise, the company must furnish the following information:
(1)
| The date of the meeting and whether it was an annual or special meeting. |
(2)
| If the meeting involved the election of directors, the name of each director elected at the meeting and the name of each other director whose term of office as a director continued after the meeting. |
(3)
| A brief description of each matter voted upon at the meeting and the number of votes cast for, against or withheld, as well as the number of abstentions and broker non-votes as to each such matter, including a separate tabulation with respect to each matter or nominee for office. |
Response: This is not applicable to the Registrant.
Back to Table of Contents
NEOS ETF Trust
Remuneration Paid to Directors, Officers, and Others of Open-End Management Investment COMPANIES (UNAUDITED)
Unless the following information is disclosed as part of the financial statements included in Item 7, an open-end management investment company registered on Form N-1A [17 CFR 239.15A and 17 CFR 274.11A] must disclose the aggregate remuneration paid by the company during the period covered by the report to:
(1)
| All directors and all members of any advisory board for regular compensation; |
(2)
| Each director and each member of an advisory board for special compensation; |
(4)
| Each person of whom any officer or director of the Fund is an affiliated person |
Response: Each current Independent Trustee is paid an annual retainer of $19,000 for his or her services as a Board member to the Trust, together with out-of-pocket expenses in accordance with the Board’s policy on travel and other business expenses relating to attendance at meetings.
Independent Trustee fees are paid by the adviser to each series of the Trust through the applicable adviser’s unitary management fee, and not by the Fund. Annual Trustee fees may be reviewed periodically and changed by the Board.
The Trust does not have a bonus, profit sharing, pension or retirement plan.
Back to Table of Contents
NEOS ETF Trust
Statement Regarding Basis for Approval of Investment Advisory
CONTRACT (UNAUDITED)
If the board of directors approved any investment advisory contract during the Fund’s most recent fiscal half-year, discuss in reasonable detail the material factors and the conclusions with respect thereto that formed the basis for the board’s approval. Include the following in the discussion:
(1)
| Factors relating to both the board’s selection of the investment adviser and approval of the advisory fee and any other amounts to be paid by the Fund under the contract. These factors would include, but not be limited to, a discussion of the nature, extent, and quality of the services to be provided by the investment adviser; the investment performance of the Fund and the investment adviser; the costs of the services to be provided and profits to be realized by the investment adviser and its affiliates from the relationship with the Fund; the extent to which economies of scale would be realized as the Fund grows; and whether fee levels reflect these economies of scale for the benefit of Fund investors. Also indicate in the discussion whether the board relied upon comparisons of the services to be rendered and the amounts to be paid under the contract with those under other investment advisory contracts, such as contracts of the same and other investment advisers with other registered investment companies or other types of clients (e.g., pension funds and other institutional investors). If the board relied upon such comparisons, describe the comparisons and how they assisted the board in concluding that the contract should be approved; and |
(2)
| If applicable, any benefits derived or to be derived by the investment adviser from the relationship with the Fund such as soft dollar arrangements by which brokers provide research to the Fund or its investment adviser in return for allocating Fund brokerage. |
Response: The Advisory Agreement was approved by a majority of the Board, including the Independent Trustees, at a meeting held on December 12, 2023. The Board reviewed the materials provided by NEOS Investment Management, LLC (“NEOS” or the “Adviser”) in advance of the meeting, conferred with representatives prior to the meeting and further reviewed materials at the meeting. The Trustees were assisted by independent legal counsel throughout the Advisory Agreement review process. The Board relied upon the advice of independent legal counsel and their own business judgment in determining the material factors to be considered in evaluating the Advisory Agreement with respect to the NEOS Nasdaq 100 High Income ETF (the “New ETF”) and the weight to be given to each such factor. The conclusions reached by the Trustees were based on a comprehensive evaluation of all of the information provided and were not the result of any one factor. Moreover, each Trustee may have afforded different weight to the various factors in reaching his or her conclusions with respect to the Advisory Agreement.
Nature, Extent and Quality of Service. The Board reviewed materials provided by NEOS related to the proposed approval of the Advisory Agreement for the New ETF, a review of the professional personnel who will be performing services for the New ETF, NEOS’s compliance and risk management infrastructure, its financial strength and resources, and its investment process. The Board also noted the extensive responsibilities that NEOS will have as investment adviser to the New ETF, including: its adherence to the New ETF’s investment strategy and restrictions, buying and selling of securities and other transactions, reviewing its performance, voting the proxies received by the New ETF and oversight of, and its role in the creation of custom or redemption baskets for authorized participants; oversight of the daily valuation of the New ETF’s portfolio holdings including its role as Valuation Designee for the New ETF; oversight of general compliance with federal and state laws; and implementation of Board directives as they relate to the New ETF. The Board also considered research support available to, and management capabilities of, the New ETF’s management personnel and that NEOS will provide oversight of day-to-day Fund operations, including fund accounting, tax matters, administration, compliance and legal assistance in meeting disclosure and regulatory requirements. The Board discussed the extent of the NEOS’ research capabilities, the quality of its compliance infrastructure and the experience of its fund management personnel.
Additionally, the Board received satisfactory responses from the representatives of NEOS with respect to a series of questions, including: whether NEOS was involved in any lawsuits or pending regulatory actions; whether the management of other accounts would conflict with its management of the Trust and the New ETF; and whether there are procedures in place to adequately allocate trades among its respective clients.
The Board reviewed the description provided on the practices for monitoring compliance with the New ETF’s investment limitations, noting that NEOS’s CCO would periodically review the portfolio managers’ performance of
Back to Table of Contents
NEOS ETF Trust
Statement Regarding Basis for Approval of Investment Advisory
CONTRACT (UNAUDITED) (Continued)
their duties to ensure compliance under NEOS’s compliance program. The Board concluded that NEOS had sufficient quality and depth of personnel, resources, investment methods and compliance policies and procedures to perform its duties under the Advisory Agreement and that the nature, overall quality and extent of the management services to be provided by NEOS to the New ETF would be satisfactory.
Performance. Because the New ETF had not commenced operations, the Board was not able to review its performance. The Board considered the performance of the other series in the Trust advised by NEOS and concluded that NEOS had the potential to deliver strong returns for shareholders.
Fees and Expenses. As to the costs of the services to be provided by NEOS, the Board discussed the comparison of advisory fees and total operating expense data and reviewed the New ETF’s advisory fee, which was a unitary fee, and overall expenses compared to peer funds and other funds advised by NEOS. The Board recalled NEOS’ discussion regarding the resources that will be required to manage the New ETF compared to those of its peers. The Board was aware that under the unitary fee arrangement, NEOS is contractually obligated to pay the fees of the New ETF’s service providers, with the exception of NEOS’s advisory fee and certain other expenses.
With respect to the New ETF, the Board noted that NEOS proposed an advisory fee of 0.68%. The Board compared this fee to the fees charged by a group of peer funds assembled by NEOS that invest in stocks comprising the Nasdaq 100 or similar index and utilize call options to generate income. The Board recalled NEOS assertion that the expertise and resources required to create the product and support the models supported the higher fee.
Economies of Scale. The Board reviewed NEOS’ asset projections and noted NEOS’ assertion that the asset levels at which economies of scale would be achieved were unlikely to be realized in the near term. They acknowledged NEOS’s statement regarding the challenges involved with attempting to forecast future growth and fee levels. The Board considered, however, NEOS’ willingness to discuss the matter of economies for the New ETF as its size materially increased. The Board agreed to monitor and revisit this issue at the appropriate time.
Profitability. The Board considered the level of profits that could be expected to accrue to NEOS with respect to the New ETF based on profitability projections and analyses reviewed by the Board and the selected financial information of NEOS provided by NEOS to the Board. After review and discussion, the Board concluded the anticipated profit from NEOS’s relationship with the New ETF would not be excessive.
Conclusion. Having requested and received such information from NEOS as the Board believed to be reasonably necessary to evaluate the terms of the Advisory Agreement, and as assisted by the advice of counsel, the Board concluded that NEOS’ advisory fee for the New ETF was not unreasonable, and that approval of the Advisory Agreement was in the best interest of future shareholders of the New ETF.
(b) Financial Highlights are included within the financial statements filed under Item 7(a) of this Form.
Item 8. Changes in and Disagreements with Accountants for Open-End Investment Companies.
See Item 7(a).
Item 9. Proxy Disclosure for Open-End Investment Companies.
See Item 7(a).
Item 10. Remuneration Paid to Directors, Officers, and Others of Open-End Investment Companies.
See Item 7(a).
Item 11. Statement Regarding Basis for Approval of Investment Advisory Contract.
See Item 7(a).
Item 12. Disclosure of Proxy Voting Policies and Procedures for Closed-End Management Investment Companies.
Not applicable to open-end investment companies.
Item 13. Portfolio Managers of Closed-End Management Investment Companies.
Not applicable to open-end investment companies.
Item 14. Purchases of Equity Securities by Closed-End Management Investment Company and Affiliated Purchasers.
Not applicable to open-end investment companies.
Item 15. Submission of Matters to a Vote of Security Holders.
There have been no material changes to the procedures by which shareholders may recommend nominees to the registrant’s board of trustees.
Item 16. Controls and Procedures.
(a) The Registrant’s Principal Executive Officer and Principal Financial Officer have reviewed the Registrant's disclosure controls and procedures (as defined in Rule 30a-3(c) under the Investment Company Act of 1940 (the “Act”)) as of a date within 90 days of the filing of this report, as required by Rule 30a-3(b) under the Act and Rules 13a-15(b) or 15d-15(b) under the Securities Exchange Act of 1934. Based on their review, such officers have concluded that the disclosure controls and procedures are effective in ensuring that information required to be disclosed in this report is appropriately recorded, processed, summarized and reported and made known to them by others within the Registrant and by the Registrant’s service provider.
(b) There were no changes in the Registrant's internal control over financial reporting (as defined in Rule 30a-3(d) under the Act) that occurred during the period covered by this report that have materially affected, or are reasonably likely to materially affect, the Registrant's internal control over financial reporting.
Item 17. Disclosure of Securities Lending Activities for Closed-End Management Investment Companies.
Not applicable to open-end investment companies.
Item 18. Recovery of Erroneously Awarded Compensation.
(a) Not Applicable.
(b) Not Applicable.
Item 19. Exhibits.
(a) (1) Any code of ethics or amendment thereto, that is the subject of the disclosure required by Item 2, to the extent that the registrant intends to satisfy Item 2 requirements through filing an exhibit. Filed herewith
(2) A separate certification for each principal executive officer and principal financial officer pursuant to Section 302 of the Sarbanes-Oxley Act of 2002. Filed herewith.
(b) Certifications pursuant to Section 906 of the Sarbanes-Oxley Act of 2002. Furnished herewith.
SIGNATURES
Pursuant to the requirements of the Securities Exchange Act of 1934 and the Investment Company Act of 1940, the registrant has duly caused this report to be signed on its behalf by the undersigned, thereunto duly authorized.
| | By: | /s/ Garrett Paolella | |
| | | Garrett Paolella | |
| | | President/Principal Executive Officer | |
Pursuant to the requirements of the Securities Exchange Act of 1934 and the Investment Company Act of 1940, this report has been signed below by the following persons on behalf of the registrant and in the capacities and on the dates indicated.
| | By: | /s/ Garrett Paolella | |
| | | Garrett Paolella | |
| | | President/Principal Executive Officer | |
| | By: | /s/ Josh Hunter | |
| | | Josh Hunter | |
| | | Treasurer/Principal Financial Officer | |