
Exhibit (c)(3) – Preliminary Working Draft; All Figures Subject to Change / Update – Project Cactus Discussion Materials November 5, 2022

– Preliminary Working Draft; All Figures Subject to Change / Update – Disclaimer This presentation has been prepared by Centerview Partners LLC (“Centerview”) for use solely by the Special Committee of the Board of Directors (the “Special Committee”) of Cactus (the “Company”) in connection with its evaluation of a proposed transaction involving the Company and for no other purpose. The information contained herein is based upon information supplied by or on behalf of the Company and publicly available information, and portions of the information contained herein may be based upon statements, estimates and forecasts provided by the Company. Centerview has relied upon the accuracy and completeness of the foregoing information, and has not assumed any responsibility for any independent verification of such information or for any independent evaluation or appraisal of any of the assets or liabilities (contingent or otherwise) of the Company or any other entity, or concerning the solvency or fair value of the Company or any other entity. With respect to financial forecasts, Centerview has assumed that such forecasts have been reasonably prepared on bases reflecting the best currently available estimates and judgments of the management of the Company as to the future financial performance of the Company, and at the Special Committee’s direction Centerview has relied upon such forecasts, as provided by the Company’s management, with respect to the Company. Centerview assumes no responsibility for and expresses no view as to such forecasts or the assumptions on which they are based. The information set forth herein is based upon economic, monetary, market and other conditions as in effect on, and the information made available to us as of, the date hereof, unless indicated otherwise and Centerview assumes no obligation to update or otherwise revise these materials. The financial analysis in this presentation is complex and is not necessarily susceptible to a partial analysis or summary description. In performing this financial analysis, Centerview has considered the results of its analysis as a whole and did not necessarily attribute a particular weight to any particular portion of the analysis considered. Furthermore, selecting any portion of Centerview’s analysis, without considering the analysis as a whole, would create an incomplete view of the process underlying its financial analysis. Centerview may have deemed various assumptions more or less probable than other assumptions, so the reference ranges resulting from any particular portion of the analysis described above should not be taken to be Centerview’s view of the actual value of the Company. These materials and the information contained herein are confidential, were not prepared with a view toward public disclosure, and may not be disclosed publicly or made available to third parties without the prior written consent of Centerview. These materials and any other advice, written or oral, rendered by Centerview are intended solely for the benefit and use of the Special Committee (in its capacity as such) in its consideration of the proposed transaction, and are not for the benefit of, and do not convey any rights or remedies for any holder of securities of or any other person. Centerview will not be responsible for and has not provided any tax, accounting, actuarial, legal or other specialist advice. These materials are not intended to provide the sole basis for evaluating the proposed transaction, and this presentation does not represent a fairness opinion, recommendation, valuation or opinion of any kind, and is necessarily incomplete and should be viewed solely in conjunction with the oral presentation provided by Centerview. 1

– Preliminary Working Draft; All Figures Subject to Change / Update – Special Committee “Roadmap Dashboard” Discussed in prior meeting Evaluate B Bonsai’ onsai’s s C Conte ontextualizin xtualizing g F Fr rame amewo wor rk k Reach Proposal and Negotiate 10/24 10/24 B Bonsai’ onsai’s s fo for r Agreement Develop with Bonsai P Pr ro oposal posal P Pr ro oposal posal Neg Nego otiation tiation with Bonsai Response H Ho ow w does the does the What ar What are e Offer value vs. Wh What ar at are e k key ey Bonsai off Bonsai offe er r Bonsai neg nego otiation tiation potential value t terms of erms of price compar price compare e Becomes d dynamics in ynamics in of executing on the pr the proposal? oposal? to r to re ecent stoc cent stock k Unfriendly se selected other lected other mgmt. outlook perf performance? ormance? transactions transactions? ? Bonsai Wh What other at other Economic and Pr Pro ocess, cess, timing timing Withdraws Items to clarify Items to clarify ffactors should actors should Non-Economic a and tactical nd tactical Proposal with Bonsai with Bonsai b be tak e taken into en into Terms of Bonsai considerations considerations consideration consideration? ? proposal Assessment of Negotiation Levers Management Outlook A Financial analysis (1) Offer value / Premium Necessary regulatory clearances Learnings from diligence B Majority of the minority vote Buyer bridge loan C Key drivers of Management Outlook Reverse termination fee Minimal R&W D Potential opportunities / risks Financing contingency / backstop Ticking construct E Comparison vs. expectations Focus for today’s discussion 2 (1) For example, expiration of HSR waiting period. To be confirmed.

ƒƒƒƒƒƒƒ – Preliminary Working Draft; All Figures Subject to Change / Update – Executive Summary On 10/24, Bonsai submitted a proposal (“10/24 Proposal”) to acquire the Class A shares that it does not currently own (~27.5mm) for $6.25 per share in cash – Since the announcement, Cactus has traded up to $6.87 per share On 11/2, Centerview and S&C had a call with Bonsai to clarify aspects of the 10/24 Proposal and communicate to Bonsai that the Special Committee is evaluating the 10/24 Proposal On 11/3, the Special Committee approved management’s latest outlook (the Situation “Management Outlook”) for use in Centerview’s analysis Update Today we have provided an assessment based on the Management Outlook, including: A ––– Financial analysis B ––– Learnings from diligence C ––– Key drivers of the Management Outlook D ––– Potential opportunities and risks E ––– Comparison vs. consensus expectations Align on counterproposal to Bonsai Centerview and S&C to provide counterproposal to Bonsai Next Steps Continue advancing financing processes 3 Source: FactSet as of November 3, 2022.

– Preliminary Working Draft; All Figures Subject to Change / Update – A Financial Analysis Ill Illustrative Analysis At Various Prices 30% premia 10/24 Bonsai 58% premia Proposal Share Price $6.25 $7.00 $8.00 $9.00 $10.00 $11.00 % Premium / (Discount) to: Current Price (11/3/22) $6.87 (9%) +2% +16% +31% +46% +60% Closing Price Prior to 10/24 Proposal $5.03 +24% +39% +59% +79% +99% +119% (1) 20-Day VWAP $6.71 (7%) +4% +19% +34% +49% +64% Price Before BBG Rumor (10/10/22) $7.35 (15%) (5%) +9% +22% +36% +50% Implied Equity Value $1,807 $2,026 $2,319 $2,613 $2,911 $3,210 (2) Plus: Net Debt 1,409 1,409 1,409 1,409 1,409 1,409 Implied Enterprise Value ($mm) $3,216 $3,435 $3,728 $4,022 $4,320 $4,619 Implied EV / EBITDA (Management) (3) 2022E ($7) n.a. n.a. n.a. n.a. n.a. n.a. 2023E 130 24.7x 26.4x 28.7x 31.0x 33.2x 35.5x 2024E 213 15.1x 16.2x 17.5x 18.9x 20.3x 21.7x Implied EV / EBITDA (Consensus) 2022E $37 85.9x 91.8x 99.6x 107.4x 115.4x 123.4x 2023E 151 21.3x 22.8x 24.7x 26.7x 28.7x 30.6x 2024E 164 19.6x 20.9x 22.7x 24.5x 26.3x 28.1x Source: Management Outlook and FactSet as of November 3, 2022. Note: Dollars in millions, except per share amounts. (1) Reflects 20 trading days as of day of Bonsai proposal – reflects market close prior to Bonsai proposal 4 (2) Net debt excludes NCI that is related to Up-C structure. Net debt as of September 30, 2022. (3) Negative multiples presented as “n.a.”.
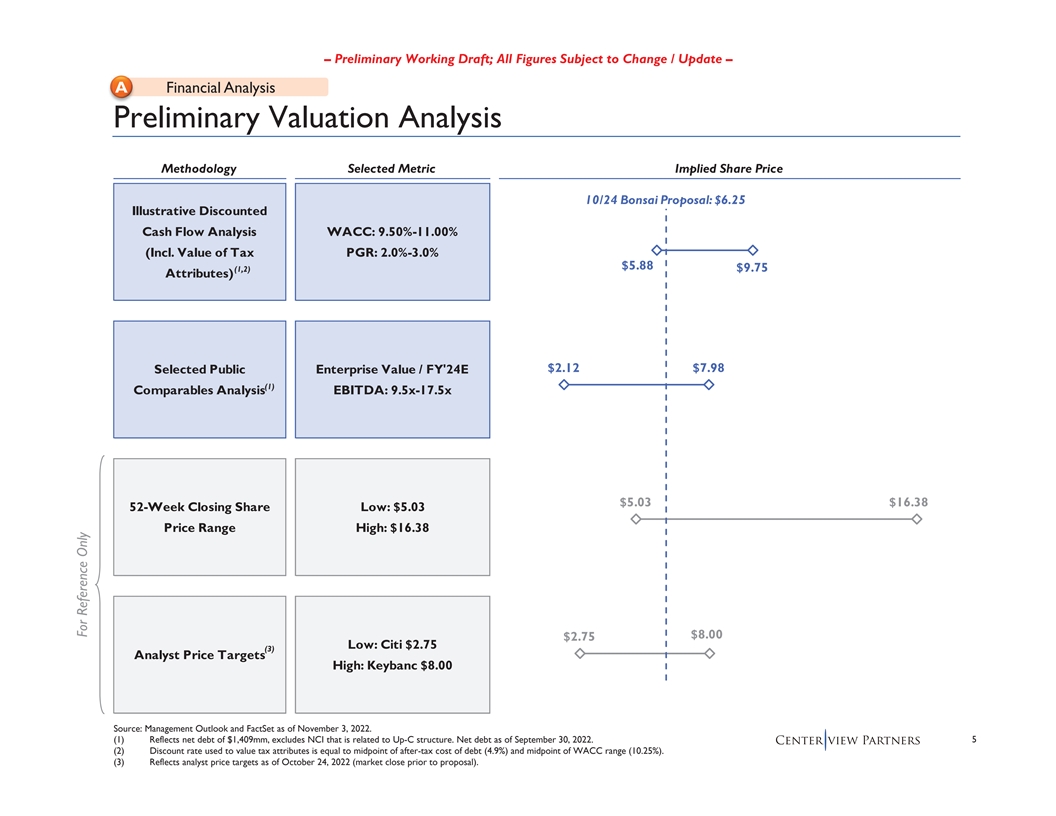
– Preliminary Working Draft; All Figures Subject to Change / Update – A Financial Analysis Preliminary Valuation Analysis Pr Methodology Selected Metric Implied Share Price 10/24 Bonsai Proposal: $6.25 Illustrative Discounted Cash Flow Analysis WACC: 9.50%-11.00% (Incl. Value of Tax PGR: 2.0%-3.0% $5.88 (1,2) $9.75 Attributes) $2.12 $7.98 Selected Public Enterprise Value / FY'24E (1) Comparables Analysis EBITDA: 9.5x-17.5x $5.03 $16.38 52-Week Closing Share Low: $5.03 Price Range High: $16.38 $8.00 $2.75 Low: Citi $2.75 (3) Analyst Price Targets High: Keybanc $8.00 Source: Management Outlook and FactSet as of November 3, 2022. (1) Reflects net debt of $1,409mm, excludes NCI that is related to Up-C structure. Net debt as of September 30, 2022. 5 (2) Discount rate used to value tax attributes is equal to midpoint of after-tax cost of debt (4.9%) and midpoint of WACC range (10.25%). (3) Reflects analyst price targets as of October 24, 2022 (market close prior to proposal). For Reference Only

ƒƒƒƒƒƒƒ – Preliminary Working Draft; All Figures Subject to Change / Update – B L Learnings From Diligence Summary of Diligence S Centerview reviewed recent board updates, strategy presentations, analyst models, budgets, debt and equity capitalization and other information provided by management Historical Several diligence calls with management to understand Cactus’s historical strategy, industry and Recent dynamics and Cactus’s historical and recent business trends and financial performance Financial Performance Subsequent calls with management to discuss Cactus’s strategy and provided follow-up questions and data requests Centerview and members of Cactus’s management team discussed on multiple calls key areas of diligence of the Management Outlook, including, but not limited to: – FY2023 budget and cash flow forecast – Go forward expectations for growth of the outdoor grill category – New product development plans Management – Impact of cost inflation and foreign exchange Outlook – Cost savings and productivity initiatives – Investments in marketing and advertising – Capital expenditure plan – Net working capital – Mechanics of profit interest units, LTIP plan and options Several discussions with Cactus management team and its tax advisors to understand the tax attributes covered under Cactus’s tax receivables agreement Tax Follow-up discussions with the management team and tax advisors to update the TRA schedule Attributes to estimate the potential tax benefits available to Cactus under the Management Outlook Additional discussions with the management team on Cactus’s NOL carryforwards 6
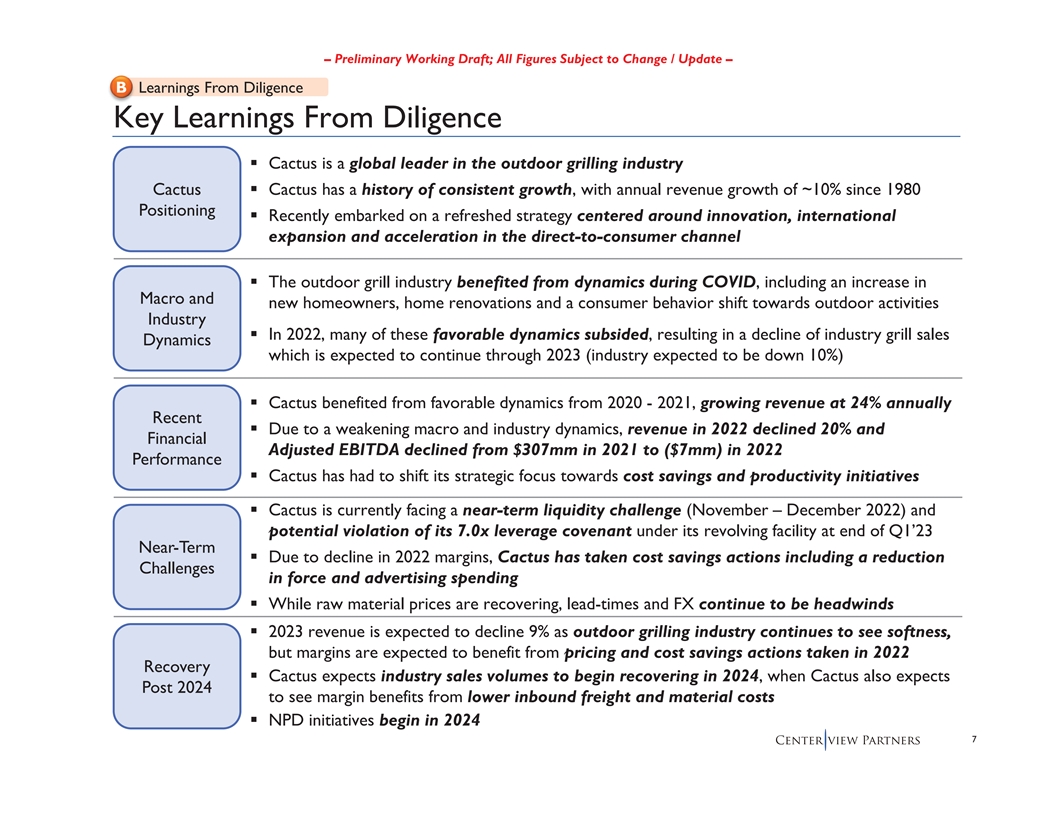
ƒƒƒƒƒƒƒƒƒƒƒƒƒƒ – Preliminary Working Draft; All Figures Subject to Change / Update – B L Learnings From Diligence Ke Key Learnings From Diligence Cactus is a global leader in the outdoor grilling industry Cactus Cactus has a history of consistent growth, with annual revenue growth of ~10% since 1980 Positioning Recently embarked on a refreshed strategy centered around innovation, international expansion and acceleration in the direct-to-consumer channel The outdoor grill industry benefited from dynamics during COVID, including an increase in Macro and new homeowners, home renovations and a consumer behavior shift towards outdoor activities Industry In 2022, many of these favorable dynamics subsided, resulting in a decline of industry grill sales Dynamics which is expected to continue through 2023 (industry expected to be down 10%) Cactus benefited from favorable dynamics from 2020 - 2021, growing revenue at 24% annually Recent Due to a weakening macro and industry dynamics, revenue in 2022 declined 20% and Financial Adjusted EBITDA declined from $307mm in 2021 to ($7mm) in 2022 Performance Cactus has had to shift its strategic focus towards cost savings and productivity initiatives Cactus is currently facing a near-term liquidity challenge (November – December 2022) and potential violation of its 7.0x leverage covenant under its revolving facility at end of Q1’23 Near-Term Due to decline in 2022 margins, Cactus has taken cost savings actions including a reduction Challenges in force and advertising spending While raw material prices are recovering, lead-times and FX continue to be headwinds 2023 revenue is expected to decline 9% as outdoor grilling industry continues to see softness, but margins are expected to benefit from pricing and cost savings actions taken in 2022 Recovery Cactus expects industry sales volumes to begin recovering in 2024, when Cactus also expects Post 2024 to see margin benefits from lower inbound freight and material costs NPD initiatives begin in 2024 7

– Preliminary Working Draft; All Figures Subject to Change / Update – C K Key Drivers of Management Outlook Overview of Management Outlook O Grill Units Sold (mm) YoY Growth (%) ’19-’21 ’22-27E CAGR: 19% CAGR: 7% 21% 18% 17% 5.62 5.45 5.12 10% 10% 10% 4.66 4.51 Grill Units 4.23 4.10 3.86 3.59 Sold (25%) (13%) 2020 2021 2022E 2023E 2024E 2025E 2026E 2027E 2019 2020 2021 2022E 2023E 2024E 2025E 2026E 2027E Revenue ($mm) YoY Growth (%) ’19-’21 ’22-’27E CAGR: 24% CAGR: 7% 30% $2,274 18% 18% $2,070 10% $1,982 10% 10% $1,886 Revenue $1,710 $1,587 $1,525 $1,450 $1,296 (20%) (9%) 2019 2020 2021 2022E 2023E 2024E 2025E 2026E 2027E 2020 2021 2022E 2023E 2024E 2025E 2026E 2027E EBITDA ($mm) Margin (%) $468 21% 17% 15% $350 15% 15% 14% $307 12% EBITDA $256 $227 9% $213 $189 $130 (0%) ($7) 2019 2020 2021 2022E 2023E 2024E 2025E 2026E 2027E 2019 2020 2021 2022E 2023E 2024E 2025E 2026E 2027E Historicals Management Outlook 8 Source: Management Outlook. Note: Dollars in millions.

999999 – Preliminary Working Draft; All Figures Subject to Change / Update – D P Potential Opportunities and Risks Potential Opportunities and Risks Of Management Outlook P Cactus management has highlighted the below opportunities and risks Potential Opportunities Potential Risks Refreshed strategy to drive product leadership ? Recovery of outdoor grilling industry in 2024 and consumer focus ? NPD pipeline not realized until 2024 Evolving the organization and supply chain to be more agile and consumer-centric ? Success of NPD launches vs. expectations Strong pipeline of new product initiatives that ? FX is potentially a continued headwind will be released starting in 2024 Increased level of investment in working media ? Recovery of international markets and R&D beginning in 2024 ? Impact of recent headcount reduction and Efficiencies from opening of Poland plant decreased advertising spend Potential benefits and reduced lead times from ? Potential reaction from customers and suppliers moving sourcing to Mexico given near-term liquidity challenges 9

– Preliminary Working Draft; All Figures Subject to Change / Update – E C Comparison vs. Expectations C Comparison of Revenue Outlook vs. Consensus Estimates Q4’22E 2023E 2024E Implied YoY Growth Implied YoY Growth Implied YoY Growth $1,710 $262 (25%) (0%) 18% $1,667 (9%) $1,450 (45%) $194 4% $1,479 (15%) $1,385 (52%) $168 (53%) (18%) 6% $162 $1,299 $1,398 Management Outlook Consensus Median Analyst Estimates 10 Source: Management Outlook and Wall Street Research as of October 24, 2022 (market close prior to proposal). Note: Dollars in millions.
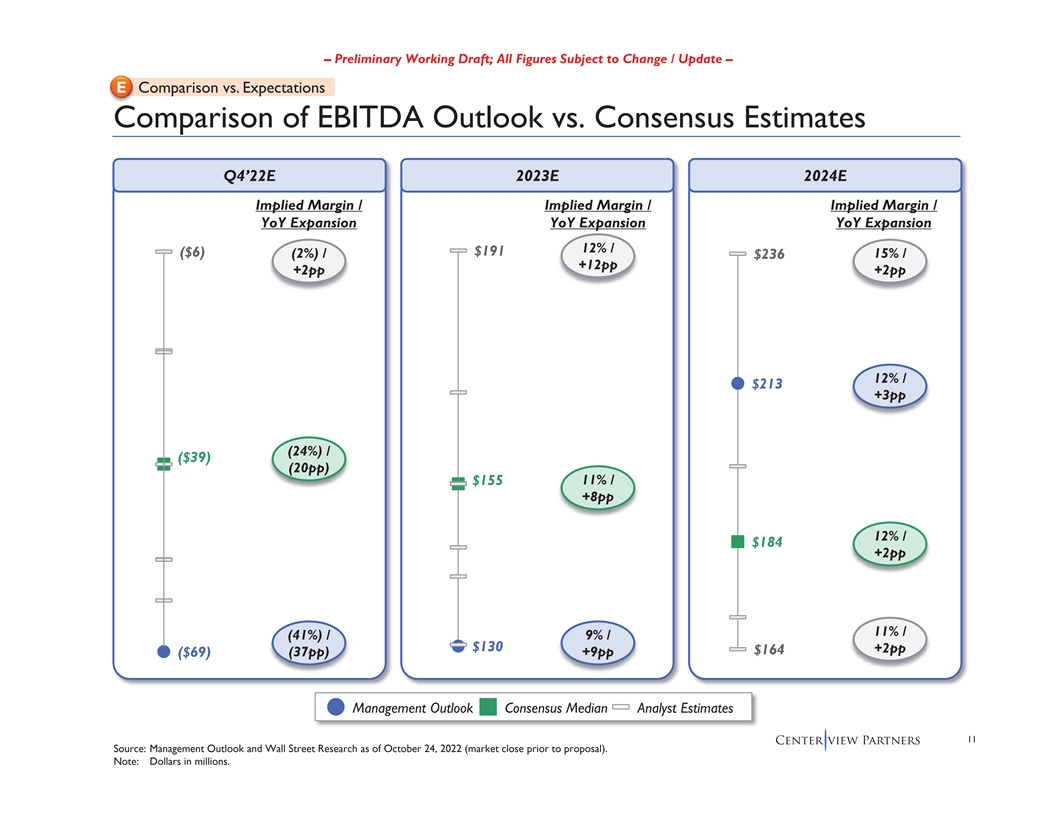
– Preliminary Working Draft; All Figures Subject to Change / Update – E C Comparison vs. Expectations C Comparison of EBITDA Outlook vs. Consensus Estimates Q4’22E 2023E 2024E Implied Margin / Implied Margin / Implied Margin / YoY Expansion YoY Expansion YoY Expansion 12% / $191 ($6) (2%) / $236 15% / +12pp +2pp +2pp 12% / $213 +3pp (24%) / ($39) (20pp) $155 11% / +8pp 12% / $184 +2pp 11% / (41%) / 9% / $130 +2pp $164 (37pp) +9pp ($69) Management Outlook Consensus Median Analyst Estimates 11 Source: Management Outlook and Wall Street Research as of October 24, 2022 (market close prior to proposal). Note: Dollars in millions.
ƒƒƒƒ – Preliminary Working Draft; All Figures Subject to Change / Update – Next Steps Discuss and align on offer price for a counterproposal Discuss potential non-economic terms to consider in negotiations with Bonsai Centerview and S&C to prepare counterproposal term-sheet and respond to Bonsai Continue advancing financing workstreams 12

Supporting Materials

ƒƒ ƒƒƒƒ – Preliminary Working Draft; All Figures Subject to Change / Update – Valuation Methodologies Discounted cash flow analysis based on Management Outlook and Management Extrapolations as provided by Cactus management Illustrative Discounted Cash Flow Analysis Benefits of tax attributes under Cactus’s tax receivable agreement and from NOLs are added to the discounted cash flow analysis Selected comparable public companies include peers that operate in the outdoor and home durables markets Selected Public Comparables Assumes EV / ’24E EBITDA multiples applied to Cactus Management Outlook 2024E EBITDA 52-Week Closing Share Price Low to high range of Cactus trading levels over the past 52 weeks Range Analyst Price Targets Low to high range of analyst price targets for Cactus 14 For reference only

– Preliminary Working Draft; All Figures Subject to Change / Update – Preliminary Discounted Cash Flow Analysis Management Outlook Management Extrapolation Fiscal Year Ending September, Terminal 2023E 2024E 2025E 2026E 2027E 2028E 2029E 2030E 2031E 2032E Year Revenue $1,450 $1,710 $1,886 $2,070 $2,274 $2,445 $2,591 $2,716 $2,811 $2,881 $2,881 Growth (%) (9%) 18% 10% 10% 10% 8% 6% 5% 3% 2% Gross Profit $537 $665 $746 $873 $1,012 $1,094 $1,166 $1,229 $1,279 $1,318 $1,318 Margin (%) 37% 39% 40% 42% 44% 45% 45% 45% 45% 46% 46% Illustrative Adjusted EBITDA $130 $213 $256 $350 $468 $506 $552 $596 $636 $672 $672 Margin (%) 9% 12% 14% 17% 21% 21% 21% 22% 23% 23% 23% Discounted (–) D&A (66) (69) (68) (70) (70) (70) (70) (70) (70) (70) (86) Free Cash Adjusted EBIT $64 $144 $187 $280 $399 $436 $482 $526 $566 $602 $586 Flow (–) SBC (35) (26) (26) (28) (29) (31) (32) (33) (33) (34) (34) (–) Taxes (7) (28) (39) (61) (89) (97) (108) (118) (128) (137) (133) NOPAT $22 $90 $123 $192 $281 $308 $342 $375 $405 $432 $420 (–) CapEx (72) (77) (122) (81) (79) (73) (78) (81) (84) (86) (86) (–) Increase in NWC 61 16 2 29 8 (4) (7) (6) (5) (4) (4) (+) D&A 66696870707070707070 86 uFCF $77 $98 $70 $210 $280 $300 $327 $357 $386 $412 $416 PV of FCF $73 $84 $54 $146 $175 $169 $166 $163 $159 $153 $154 Implied TEV Implied Share Price Implied Exit Multiple PGR PGR PGR WACC 2.0% 2.5% 3.0% 2.0% 2.5% 3.0% 2.0% 2.5% 3.0% Illustrative 9.50% $3,845 $4,024 $4,230 $8.40 $9.00 $9.70 8.8x 9.5x 10.2x Sensitivities 10.25% 3,435 3,573 3,730 7.00 7.47 8.01 8.0x 8.6x 9.2x 11.00% 3,095 3,204 3,327 5.83 6.21 6.63 7.4x 7.9x 8.4x Excludes Present Value of Tax Source: Management Outlook. (1) Attributes of ~$0.05 15 Note: Dollars in millions. Reflects Cactus balance sheet as of September 30, 2022. (1) Tax attributes under Cactus’s tax receivable agreement and utilization of NOLs are analyzed separately. Discount rate used to value tax attributes is equal to midpoint of after-tax cost of debt (4.9%) and midpoint of WACC range (10.25%).

– Preliminary Working Draft; All Figures Subject to Change / Update – Preliminary Valuation Of Cactus Tax Attributes Cash Flow Benefit of TRAs and NOLs 2023E 2024E 2025E 2026E 2027E 2028E 2029E 2030E+ Total TRA Benefit $0.0 $0.1 $0.6 $0.9 $1.1 $1.4 $1.2 $6.0 TRA Cash Flow (x) 15% 15% 15% 15% 15% 15% 15% 15% 0.15 Benefit TRA Benefit to Cactus $0.01 $0.02 $0.08 $0.13 $0.16 $0.21 $0.17 $0.90 Memo: Taxable Income: ($15) ($4) $6 $26 $26 $26 $26 Cash Flow Value of NOLs Used – – $5 $21 $21 $21 $11 Tax Shield from NOLs (x) Tax Rate 24% 24% 24% 24% 24% 24% 24% FV of NOL Benefit – – $1.24 $5.03 $5.00 $4.97 $2.56 Discount PV of Implied Value Rate Tax Attr. Per Share (1) 4.88% $0.01 $0.01 $1.15 $4.27 $4.07 $3.89 $1.96 $0.53 $15.96 $0.06 Present Value of Tax Attributes 7.56% $0.01 $0.01 $1.06 $3.86 $3.59 $3.34 $1.64 $0.40 $13.97 $0.05 (2) 10.25% $0.01 $0.01 $0.99 $3.50 $3.17 $2.88 $1.38 $0.30 $12.29 $0.04 Source: Management figures. 16 (1) Reflects after-tax cost of debt. (2) Reflects midpoint of WACC.
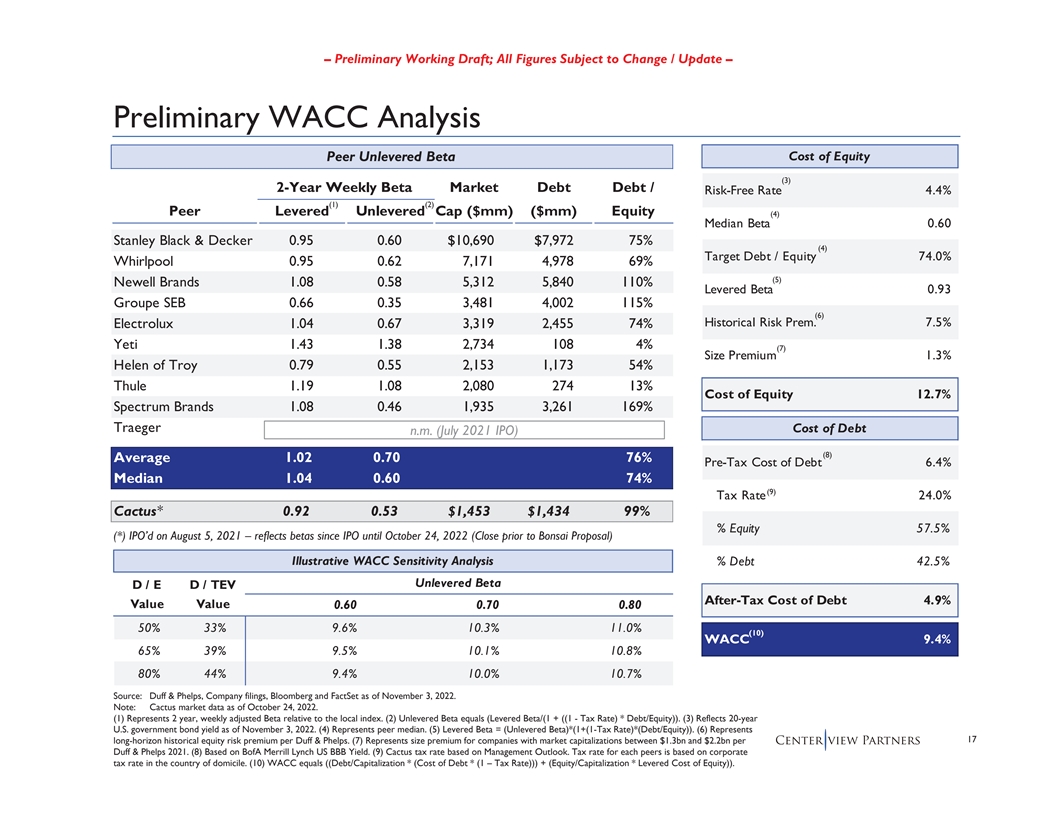
– Preliminary Working Draft; All Figures Subject to Change / Update – Preliminary WACC Analysis Peer Unlevered Beta Cost of Equity (3) 2-Year Weekly Beta Market Debt Debt / Risk-Free Rate 4.4% (1) (2) Peer Levered Unlevered Cap ($mm) ($mm) Equity (4) Median Beta 0.60 Stanley Black & Decker 0.95 0.60 $10,690 $7,972 75% (4) Target Debt / Equity 74.0% Whirlpool 0.95 0.62 7,171 4,978 69% (5) Newell Brands 1.08 0.58 5,312 5,840 110% Levered Beta 0.93 Groupe SEB 0.66 0.35 3,481 4,002 115% (6) Historical Risk Prem. 7.5% Electrolux 1.04 0.67 3,319 2,455 74% Yeti 1.43 1.38 2,734 108 4% (7) Size Premium 1.3% Helen of Troy 0.79 0.55 2,153 1,173 54% Thule 1.19 1.08 2,080 274 13% Cost of Equity 12.7% Spectrum Brands 1.08 0.46 1,935 3,261 169% Traeger Cost of Debt n.m. (July 2021 IPO) (8) Average 1.02 0.70 76% Pre-Tax Cost of Debt 6.4% Median 1.04 0.60 74% (9) Tax Rate 24.0% Cactus* 0.92 0.53 $1,453 $1,434 99% % Equity 57.5% (*) IPO’d on August 5, 2021 – reflects betas since IPO until October 24, 2022 (Close prior to Bonsai Proposal) Illustrative WACC Sensitivity Analysis % Debt 42.5% Unlevered Beta D / E D / TEV After-Tax Cost of Debt 4.9% Value Value 0.60 0.70 0.80 50% 33% 9.6% 10.3% 11.0% (10) WACC 9.4% 65% 39% 9.5% 10.1% 10.8% 80% 44% 9.4% 10.0% 10.7% Source: Duff & Phelps, Company filings, Bloomberg and FactSet as of November 3, 2022. Note: Cactus market data as of October 24, 2022. (1) Represents 2 year, weekly adjusted Beta relative to the local index. (2) Unlevered Beta equals (Levered Beta/(1 + ((1 - Tax Rate) * Debt/Equity)). (3) Reflects 20-year U.S. government bond yield as of November 3, 2022. (4) Represents peer median. (5) Levered Beta = (Unlevered Beta)*(1+(1-Tax Rate)*(Debt/Equity)). (6) Represents 17 long-horizon historical equity risk premium per Duff & Phelps. (7) Represents size premium for companies with market capitalizations between $1.3bn and $2.2bn per Duff & Phelps 2021. (8) Based on BofA Merrill Lynch US BBB Yield. (9) Cactus tax rate based on Management Outlook. Tax rate for each peers is based on corporate tax rate in the country of domicile. (10) WACC equals ((Debt/Capitalization * (Cost of Debt * (1 – Tax Rate))) + (Equity/Capitalization * Levered Cost of Equity)).
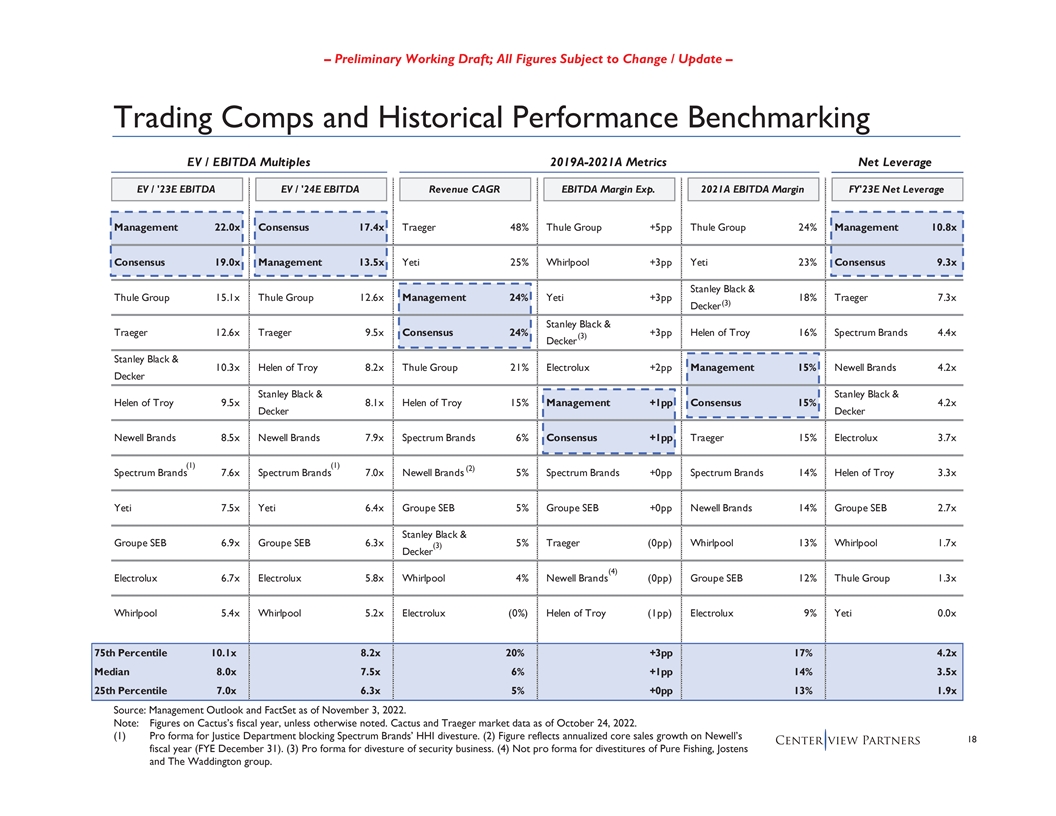
– Preliminary Working Draft; All Figures Subject to Change / Update – Trading Comps and Historical Performance Benchmarking EV / EBITDA Multiples 2019A-2021A Metrics Net Leverage EV / '23E EBITDA EV / '24E EBITDA Revenue CAGR EBITDA Margin Exp. 2021A EBITDA Margin FY'23E Net Leverage Management 22.0x Consensus 17.4x Traeger 48% Thule Group +5pp Thule Group 24% Management 10.8x Consensus 19.0x Management 13.5x Yeti 25% Whirlpool +3pp Yeti 23% Consensus 9.3x Stanley Black & Thule Group 15.1x Thule Group 12.6x Management 24% Yeti +3pp 18% Traeger 7.3x (3) Decker Stanley Black & Traeger 12.6x Traeger 9.5x Consensus 24% +3pp Helen of Troy 16% Spectrum Brands 4.4x (3) Decker Stanley Black & 10.3x Helen of Troy 8.2x Thule Group 21% Electrolux +2pp Management 15% Newell Brands 4.2x Decker Stanley Black & Stanley Black & Helen of Troy 9.5x 8.1x Helen of Troy 15% Management +1pp Consensus 15% 4.2x Decker Decker Newell Brands 8.5x Newell Brands 7.9x Spectrum Brands 6% Consensus +1pp Traeger 15% Electrolux 3.7x (1) (1) (2) Spectrum Brands 7.6x Spectrum Brands 7.0x Newell Brands 5% Spectrum Brands +0pp Spectrum Brands 14% Helen of Troy 3.3x Yeti 7.5x Yeti 6.4x Groupe SEB 5% Groupe SEB +0pp Newell Brands 14% Groupe SEB 2.7x Stanley Black & Groupe SEB 6.9x Groupe SEB 6.3x 5% Traeger (0pp) Whirlpool 13% Whirlpool 1.7x (3) Decker (4) Electrolux 6.7x Electrolux 5.8x Whirlpool 4% Newell Brands (0pp) Groupe SEB 12% Thule Group 1.3x Whirlpool 5.4x Whirlpool 5.2x Electrolux (0%) Helen of Troy (1pp) Electrolux 9% Yeti 0.0x 75th Percentile 10.1x 8.2x 20% +3pp 17% 4.2x Median 8.0x 7.5x 6% +1pp 14% 3.5x 25th Percentile 7.0x 6.3x 5% +0pp 13% 1.9x Source: Management Outlook and FactSet as of November 3, 2022. Note: Figures on Cactus’s fiscal year, unless otherwise noted. Cactus and Traeger market data as of October 24, 2022. (1) Pro forma for Justice Department blocking Spectrum Brands’ HHI divesture. (2) Figure reflects annualized core sales growth on Newell’s 18 fiscal year (FYE December 31). (3) Pro forma for divesture of security business. (4) Not pro forma for divestitures of Pure Fishing, Jostens and The Waddington group.

– Preliminary Working Draft; All Figures Subject to Change / Update – Trading Comps and Projected Performance Benchmarking EV / EBITDA Multiples 2021A-2024E Expected Metrics Net Leverage EV / '23E EBITDA EV / '24E EBITDA Revenue CAGR EBITDA Margin Exp. 2023E EBITDA Margin FY'23E Net Leverage Management 22.0x Consensus 17.4x Yeti 13% Helen of Troy +3pp Yeti 21% Management 10.8x Consensus 19.0x Management 13.5x Electrolux 3% Newell Brands +0pp Thule Group 18% Consensus 9.3x Stanley Black & Thule Group 15.1x Thule Group 12.6x 2% Electrolux (0pp) Helen of Troy 17% Traeger 7.3x Decker Traeger 12.6x Traeger 9.5x Groupe SEB 2% Groupe SEB (0pp) Newell Brands 13% Spectrum Brands 4.4x Stanley Black & 10.3x Helen of Troy 8.2x Traeger 1% Spectrum Brands (1pp) Spectrum Brands 13% Newell Brands 4.2x Decker Stanley Black & Stanley Black & Helen of Troy 9.5x 8.1x Helen of Troy (0%) Yeti (1pp) Groupe SEB 11% 4.2x Decker Decker Stanley Black & Newell Brands 8.5x Newell Brands 7.9x Spectrum Brands (1%) Traeger (2pp) 11% Electrolux 3.7x Decker (1) (1) Spectrum Brands 7.6x Spectrum Brands 7.0x Thule Group (2%) Whirlpool (3pp) Consensus 11% Helen of Troy 3.3x Yeti 7.5x Yeti 6.4x Newell Brands (4%) Thule Group (3pp) Traeger 11% Groupe SEB 2.7x Groupe SEB 6.9x Groupe SEB 6.3x Whirlpool (4%) Management (3pp) Whirlpool 10% Whirlpool 1.7x Stanley Black & Electrolux 6.7x Electrolux 5.8x Management (5%) (4pp) Management 9% Thule Group 1.3x Decker Whirlpool 5.4x Whirlpool 5.2x Consensus (10%) Consensus (4pp) Electrolux 8% Yeti 0.0x 75th Percentile 10.1x 8.2x 4% (0pp) 16% 4.2x Median 8.0x 7.5x 1% (1pp) 12% 3.5x 25th Percentile 7.0x 6.3x (1%) (2pp) 11% 1.9x Source: Management Outlook and FactSet as of November 3, 2022. 19 Note: Figures on Cactus’s fiscal year. Cactus and Traeger market data as of October 24, 2022. (1) Pro forma for Justice Department blocking Spectrum Brands’ HHI divesture.
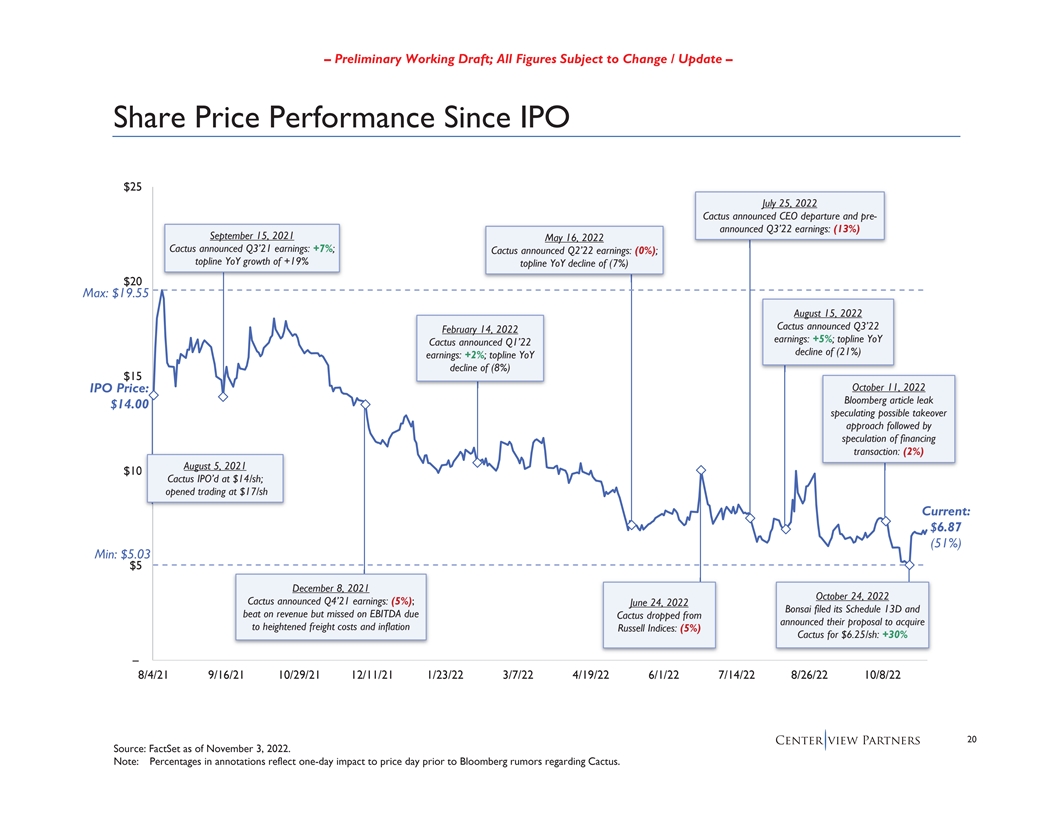
– Preliminary Working Draft; All Figures Subject to Change / Update – Share Price Performance Since IPO $25 July 25, 2022 Cactus announced CEO departure and pre- announced Q3’22 earnings: (13%) September 15, 2021 May 16, 2022 Cactus announced Q3’21 earnings: +7%; Cactus announced Q2’22 earnings: (0%); topline YoY growth of +19% topline YoY decline of (7%) $20 Max: $19.55 August 15, 2022 Cactus announced Q3’22 February 14, 2022 earnings: +5%; topline YoY Cactus announced Q1’22 decline of (21%) earnings: +2%; topline YoY decline of (8%) $15 October 11, 2022 IPO Price: Bloomberg article leak $14.00 speculating possible takeover approach followed by speculation of financing transaction: (2%) August 5, 2021 $10 0 Cactus IPO’d at $14/sh; opened trading at $17/sh Current: $6.87 (51%) Min: $5.03 $5 December 8, 2021 October 24, 2022 Cactus announced Q4’21 earnings: (5%); June 24, 2022 Bonsai filed its Schedule 13D and beat on revenue but missed on EBITDA due Cactus dropped from announced their proposal to acquire to heightened freight costs and inflation Russell Indices: (5%) Cactus for $6.25/sh: +30% – 8/4/21 9/16/21 10/29/21 12/11/21 1/23/22 3/7/22 4/19/22 6/1/22 7/14/22 8/26/22 10/8/22 20 Source: FactSet as of November 3, 2022. Note: Percentages in annotations reflect one-day impact to price day prior to Bloomberg rumors regarding Cactus.
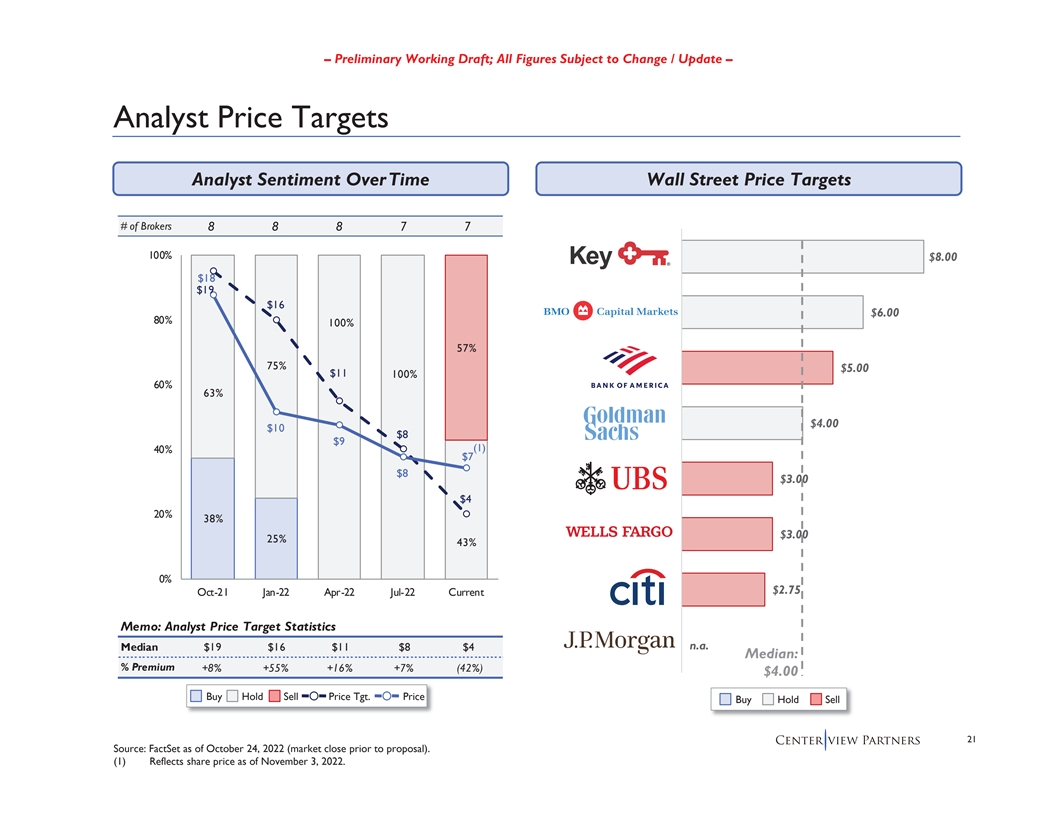
– Preliminary Working Draft; All Figures Subject to Change / Update – Analyst Price Targets Analyst Sentiment Over Time Wall Street Price Targets # of Brokers 88877 100% $8.00 $18 $19 $16 $6.00 80% 100% 57% 75% $5.00 $11 100% 60% 63% $4.00 $10 $8 $9 (1) 40% $7 $8 $3.00 $4 20% 38% $3.00 25% 43% 0% $2.75 Oct-21 Jan-22 Apr-22 Jul-22 Current Memo: Analyst Price Target Statistics n.a. Median $19 $16 $11 $8 $4 Median: % Premium +8% +55% +16% +7% (42%) $4.00 Buy Hold Sell Price Tgt. Price Buy Hold Sell 21 Source: FactSet as of October 24, 2022 (market close prior to proposal). (1) Reflects share price as of November 3, 2022.
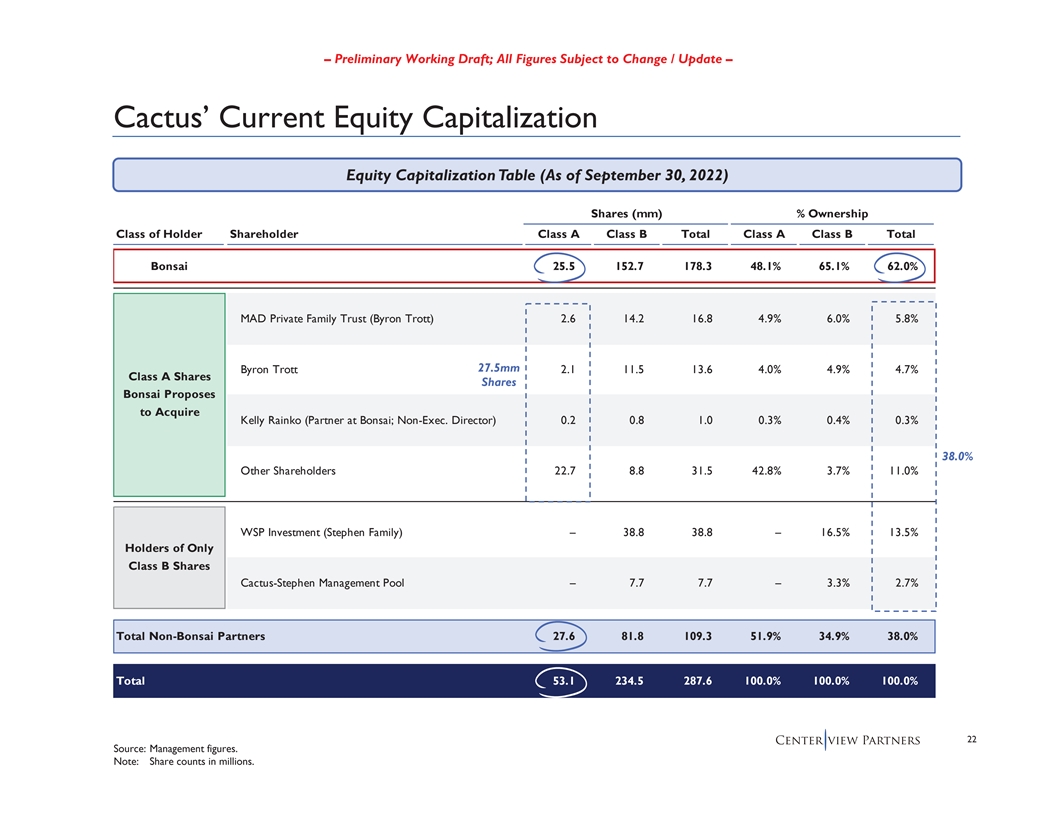
– Preliminary Working Draft; All Figures Subject to Change / Update – Cactus’ Current Equity Capitalization Equity Capitalization Table (As of September 30, 2022) Shares (mm) % Ownership Class of Holder Shareholder Class A Class B Total Class A Class B Total Bonsai 25.5 152.7 178.3 48.1% 65.1% 62.0% MAD Private Family Trust (Byron Trott) 2.6 14.2 16.8 4.9% 6.0% 5.8% 27.5mm Byron Trott 2.1 11.5 13.6 4.0% 4.9% 4.7% Class A Shares Shares Bonsai Proposes to Acquire Kelly Rainko (Partner at Bonsai; Non-Exec. Director) 0.2 0.8 1.0 0.3% 0.4% 0.3% 38.0% Other Shareholders 22.7 8.8 31.5 42.8% 3.7% 11.0% WSP Investment (Stephen Family) – 38.8 38.8 – 16.5% 13.5% Holders of Only Class B Shares Cactus-Stephen Management Pool – 7.7 7.7 – 3.3% 2.7% Total Non-Bonsai Partners 27.6 81.8 109.3 51.9% 34.9% 38.0% Total 53.1 234.5 287.6 100.0% 100.0% 100.0% 22 Source: Management figures. Note: Share counts in millions.
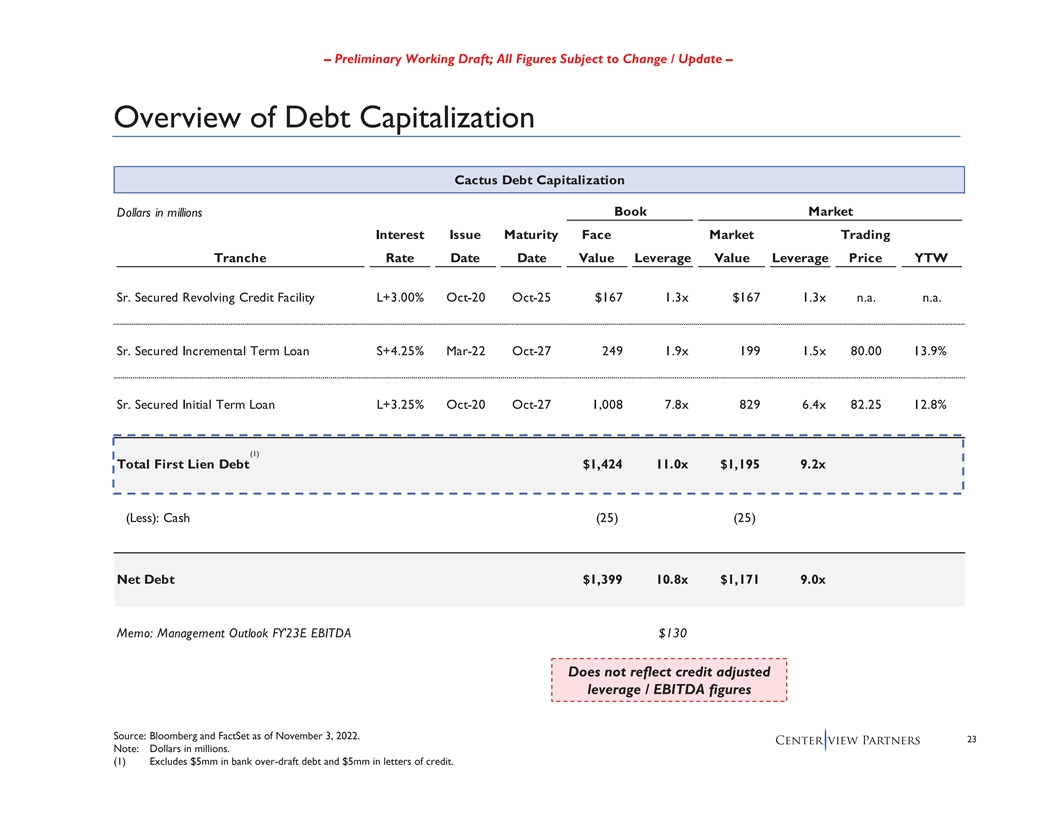
– Preliminary Working Draft; All Figures Subject to Change / Update – Overview of Debt Capitalization Cactus Debt Capitalization Book Market Dollars in millions Interest Issue Maturity Face Market Trading Tranche Rate Date Date Value Leverage Value Leverage Price YTW Sr. Secured Revolving Credit Facility L+3.00% Oct-20 Oct-25 $167 1.3x $167 1.3x n.a. n.a. Sr. Secured Incremental Term Loan S+4.25% Mar-22 Oct-27 249 1.9x 199 1.5x 80.00 13.9% Sr. Secured Initial Term Loan L+3.25% Oct-20 Oct-27 1,008 7.8x 829 6.4x 82.25 12.8% (1) Total First Lien Debt $1,424 11.0x $1,195 9.2x (Less): Cash (25) (25) Net Debt $1,399 10.8x $1,171 9.0x Memo: Management Outlook FY'23E EBITDA $130 Does not reflect credit adjusted leverage / EBITDA figures Source: Bloomberg and FactSet as of November 3, 2022. 23 Note: Dollars in millions. (1) Excludes $5mm in bank over-draft debt and $5mm in letters of credit.
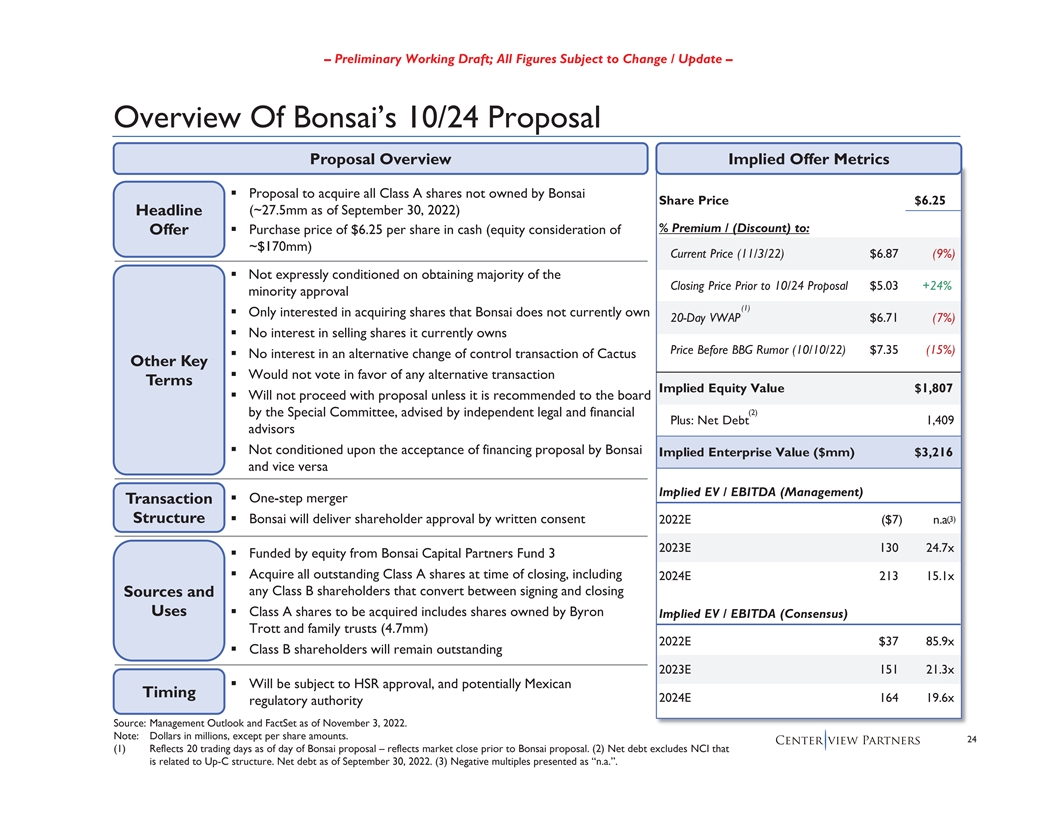
ƒƒƒƒƒƒƒƒƒƒƒƒƒƒƒƒ – Preliminary Working Draft; All Figures Subject to Change / Update – Overview Of Bonsai’s 10/24 Proposal Proposal Overview Implied Offer Metrics Proposal to acquire all Class A shares not owned by Bonsai Share Price $6.25 (~27.5mm as of September 30, 2022) Headline % Premium / (Discount) to: Offer Purchase price of $6.25 per share in cash (equity consideration of ~$170mm) Current Price (11/3/22) $6.87 (9%) Not expressly conditioned on obtaining majority of the Closing Price Prior to 10/24 Proposal $5.03 +24% minority approval (1) Only interested in acquiring shares that Bonsai does not currently own 20-Day VWAP $6.71 (7%) No interest in selling shares it currently owns Price Before BBG Rumor (10/10/22) $7.35 (15%) No interest in an alternative change of control transaction of Cactus Other Key Would not vote in favor of any alternative transaction Terms Implied Equity Value $1,807 Will not proceed with proposal unless it is recommended to the board (2) by the Special Committee, advised by independent legal and financial Plus: Net Debt 1,409 advisors Not conditioned upon the acceptance of financing proposal by Bonsai Implied Enterprise Value ($mm) $3,216 and vice versa Implied EV / EBITDA (Management) One-step merger Transaction (3) Structure Bonsai will deliver shareholder approval by written consent 2022E ($7) n.a. 2023E 130 24.7x Funded by equity from Bonsai Capital Partners Fund 3 Acquire all outstanding Class A shares at time of closing, including 2024E 213 15.1x any Class B shareholders that convert between signing and closing Sources and Uses Class A shares to be acquired includes shares owned by Byron Implied EV / EBITDA (Consensus) Trott and family trusts (4.7mm) 2022E $37 85.9x Class B shareholders will remain outstanding 2023E 151 21.3x Will be subject to HSR approval, and potentially Mexican Timing 2024E 164 19.6x regulatory authority Source: Management Outlook and FactSet as of November 3, 2022. Note: Dollars in millions, except per share amounts. 24 (1) Reflects 20 trading days as of day of Bonsai proposal – reflects market close prior to Bonsai proposal. (2) Net debt excludes NCI that is related to Up-C structure. Net debt as of September 30, 2022. (3) Negative multiples presented as “n.a.”.

– Preliminary Working Draft; All Figures Subject to Change / Update – Premia in Selected Precedent Minority “Squeeze Out” Transactions (1) Selected Precedent Minority “Squeeze Out” Transactions Implied Initial Bid Premium to Initial to Final Bid Premium to % of Equity Enterprise Unaffected 20-Day Final Bid Unaffected 20-Day (2) (3) (4) (3) Date Target Acquiror Owned Value Price VWAP % Increase Price VWAP Jun-22 Convey TPG Capital 75% $1.1 66% 48% 17% 143% 106% Nov-20 Urovant Sumitovant Biopharma 72% 0.7 55% 53% 30% 96% 103% Aug-20 Akcea Ionis Pharmaceuticals 76% 1.5 42% 39% 13% 59% 59% Aug-20 Hudson Dufry AG 57% 1.1 24% 9% 23% 50% 59% Nov-19 AVX KYOCERA Corp 72% 2.9 30% 27% 12% 45% 42% Jun-18 Foundation Medicine Roche 57% 5.3 30% 38% 3% 29% 40% Nov-16 Synutra Investor Group 64% 0.8 54% 30% 2% 58% 33% Sep-16Federal-Mogul Icahn 82%4.441%65%32%101%136% (5) Mar-16 Crown Media Hallmark 90% 2.1 2% 13% -% 2% 13% Sep-13 Cornerstone Therapeutics Chiesi Farmaceutici 58% 0.3 22% 20% 45% 78% 74% Mar-13 Sauer-Danfoss Danfoss 76% 2.6 24% 24% 19% 49% 48% 25th Percentile 61% 24% 22% 7% 47% 41% Median 72% 30% 30% 17% 58% 59% 75th Percentile 76% 48% 43% 27% 87% 89% Source: FactSet as of November 3, 2022. Note: Dollars in billions. (1) All cash, minority “squeeze out” transactions with U.S. targets and over $100mm in equity consideration over the last 10 years with offers from only single acquiror. Excludes transactions in real-estate, energy, financial institutions and oil and gas industries (n=11). (2) Reflects unaffected date of first bid. (3) Reflects 20 trading days. (4) Reflects unaffected date of transaction announcement. 25 (5) On June 24, 2013, Hallmark filed an amendment to its Schedule 13D disclosing it was evaluating a “short-form merger to eliminate the minority stockholders”. Final price reflects 151% premium to share price on June 24, 2013.
Update on Financing Process

– Preliminary Working Draft; All Figures Subject to Change / Update – Process Overview Outreach focused on alternative and also traditional lenders that we perceived to have an interest in the space Alternative Traditional Stage # of Participants Lenders Lenders Parties Contacted 1 14 6 20 NDAs Executed / 2 10 2 Information Distributed 12 Parties Submitting 3 61 7 Preliminary Questions Indication of Interest 4 3- 3 (“IoI”) Received Expecting further proposals 27
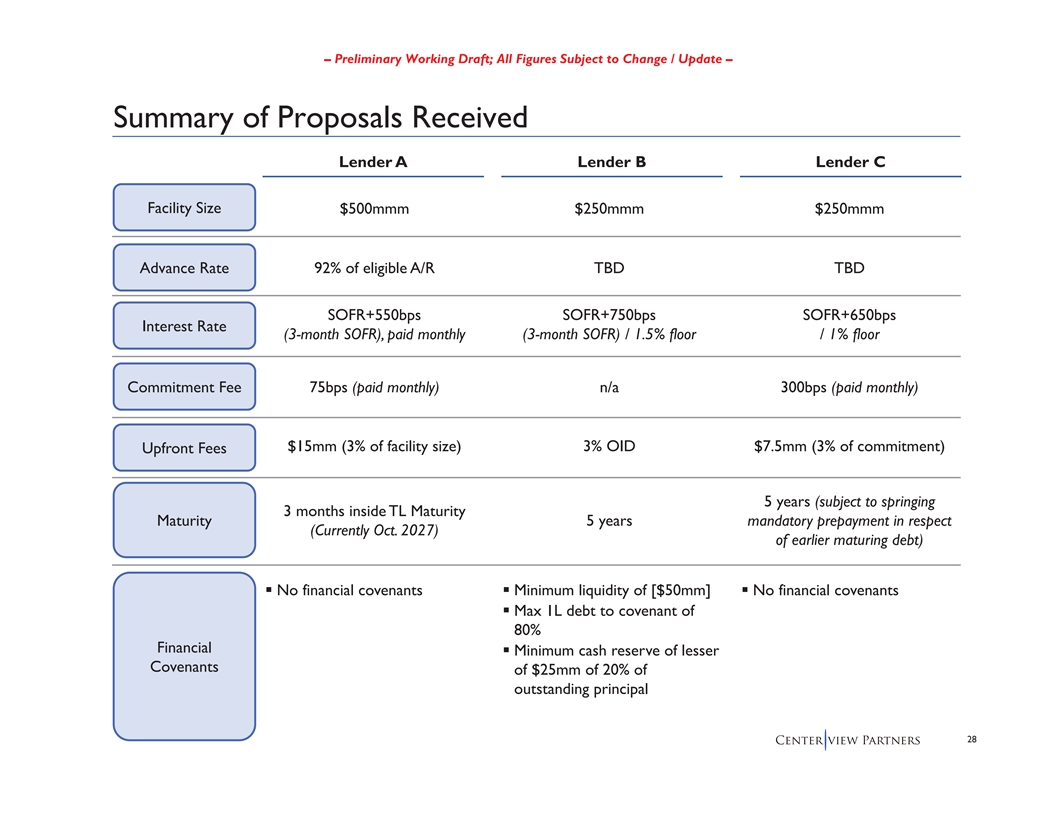
ƒ ƒƒƒ ƒ – Preliminary Working Draft; All Figures Subject to Change / Update – Summary of Proposals Received Lender A Lender B Lender C Facility Size $500mmm $250mmm $250mmm Advance Rate 92% of eligible A/R TBD TBD SOFR+550bps SOFR+750bps SOFR+650bps Interest Rate (3-month SOFR), paid monthly (3-month SOFR) / 1.5% floor / 1% floor Commitment Fee 75bps (paid monthly) n/a 300bps (paid monthly) $15mm (3% of facility size) 3% OID $7.5mm (3% of commitment) Upfront Fees 5 years (subject to springing 3 months inside TL Maturity 5 years mandatory prepayment in respect Maturity (Currently Oct. 2027) of earlier maturing debt) No financial covenants Minimum liquidity of [$50mm] No financial covenants Max 1L debt to covenant of 80% Financial Minimum cash reserve of lesser Covenants of $25mm of 20% of outstanding principal 28

ƒƒƒƒƒƒƒƒƒ ƒƒƒƒ ƒƒƒƒƒƒƒ – Preliminary Working Draft; All Figures Subject to Change / Update – Summary of Proposals Received (Cont’d) Lender A Lender B Lender C NC-1, 101 for life NC-2 / 103 / 102 / 101 0-18 months: Yield maintenance Call Protection 19-30 months: 104 31-42 months: 102 Meetings with management Satisfactory completion of Receipt of customary third- commercial, legal, financial and party field examination Detailed review of tax due diligence projections and Management call to discuss understanding of assumptions Satisfactory completion of legal current trading environment documentation and go-forward strategy / Confirmatory diligence initiatives regarding Cactus’s account Lender B’s investment controls, invoicing and cash committee approval Receipt of 5-year three Due Diligence management systems statement cash flow model and Approvals Satisfactory response to all Discussion with FTI / Required questions submitted in management to understand diligence tracker underlying drivers and assumptions Confirmatory field exams to be conducted by Lender A Receipt and review of major prior to closing customer contracts and purchase orders Customary legal and tax due diligence Customary legal and KYC / AML diligence 29

– Preliminary Working Draft; All Figures Subject to Change / Update – Reflects Working Draft Projections as of 10/10/22 Liquidity Implied by Lender A’s Non-Binding Proposal (1) Liquidity (Cash, Receivable and Revolver Availability) Base Liquidity Base + Bonsai Term Loan ($61.2mm) $450 (2) Base + Bonsai + Lender A $400 $350 $274 $300 $250 $200 $150 $100 $50 $0 ($67) ($50) ($128) ($100) ($150) Sep-22 Oct-22 Nov-22 Dec-22 Jan-23 Feb-23 Mar-23 Apr-23 May-23 Jun-23 Jul-23 Aug-23 Sep-23 Net Forecasted A/R $66 $125 $65 $84 $213 $328 $445 $448 $367 $275 $67 $172 $114 Source: Management. Note: Dollars in millions. (1) Does not include costs of raising incremental financing or covenant amendment / waiver. Includes cash of $2.5mm and LOCs outstanding. Excludes ~47.5mm in cash sitting in other entities. (2) Assumes 92% borrowing base and excludes 7.5% of total base due to receivables being associated with “smaller jurisdictions” per Lender A’s 30 non-binding proposal. Assumes an additional 10% illustrative estimate for other reserves, exclusions and dilution adjustments. Assumes $500mm facility size with 3% upfront costs. Assumes capital injection at start of Jan 2023.

ƒƒƒ ƒƒ ƒ ƒƒ – Preliminary Working Draft; All Figures Subject to Change / Update – Alternatives for Qualified Opinion Management and Davis Polk are currently communicating with Ernst & Young to better understand the opinion language that may be included in the 10K when filed in December. At this time we are aware of 3 potential scenarios: Scenario 1 Scenario 2 Scenario 3 An “explanatory paragraph” does not A qualified opinion that Ernst & Young A qualified opinion that Ernst & Young represent a qualified opinion and attributes to a potential near term attributes to an impending liquidity Description further embellishes upon the liquidity leverage covenant violation issue and covenant risk factors already in the Company’s 3Q disclosure Default Under Secured No Yes No Credit Facility? May have a more mild public relations More impactful public relations and Risk of this form of opinion may be and supplier impact than a qualified supplier message than the explanatory mitigated by closing upon an AR opinion and would provide time after paragraph financing facility and/or other incr. the 10K release to close on capital prior to the 10K release Supplier issues could impact future incremental financing and a covenant Ernst & Young will require time Considerations liquidity needs waiver before a 10K is delivered to modify their opinion A qualified opinion of this type would be an impactful public relations and supplier message A qualified opinion attributed to near term liquidity constraints could be a meaningful issue for the Company, as well as Bonsai: – The event of default created by an opinion of this type will require a waiver from a majority of lenders (including term lenders), which will be expensive to obtain and will weigh on cash flows whether or not Bonsai is able to take the Company private – Bonsai is incentivized to avoid this scenario Given these potential paths: Recommend the Special Committee push forward on the AR financing process by proceeding quickly with Lender A, subject to them clarifying and modifying certain aspects of their proposal (e.g., fees) Bonsai’s strong incentive to avoid a qualified opinion due to liquidity may limit interest from alternative capital providers, recommend testing that hypothesis with a small group of alternative investors already under NDA 31
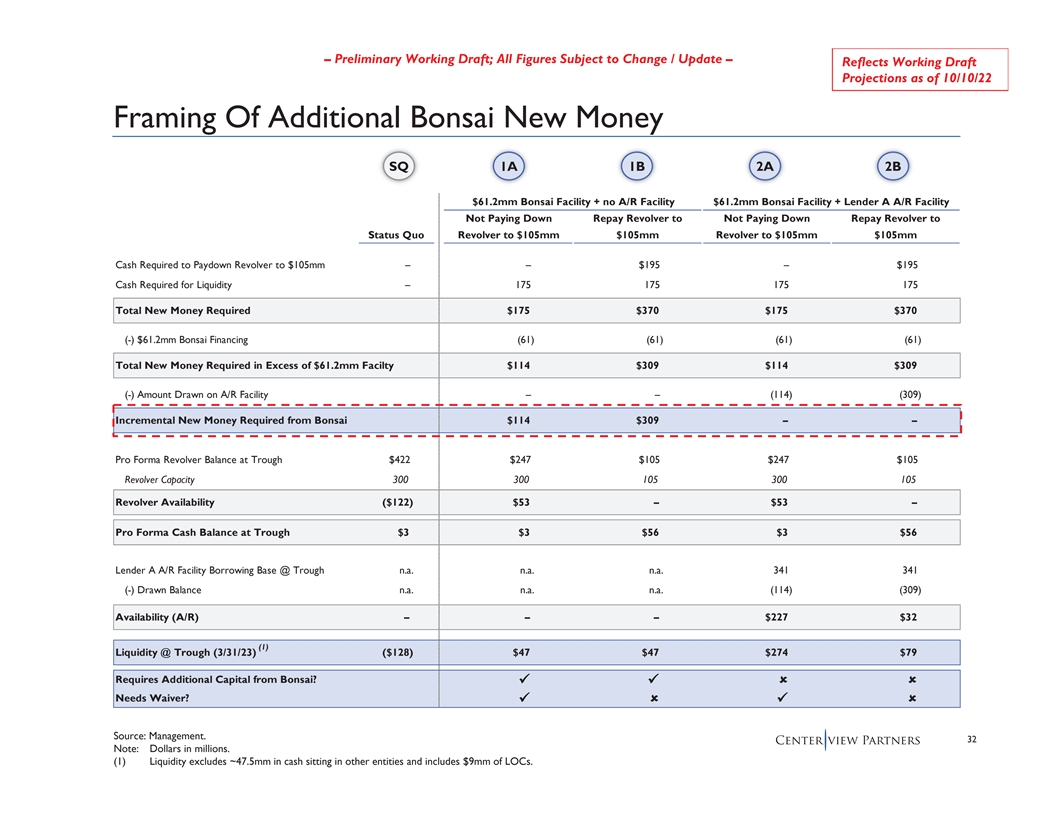
88 8 9 8 9 99 – Preliminary Working Draft; All Figures Subject to Change / Update – Reflects Working Draft Projections as of 10/10/22 Framing Of Additional Bonsai New Money SQ 1A 1B 2A 2B $61.2mm Bonsai Facility + no A/R Facility $61.2mm Bonsai Facility + Lender A A/R Facility Not Paying Down Repay Revolver to Not Paying Down Repay Revolver to Status Quo Revolver to $105mm $105mm Revolver to $105mm $105mm Cash Required to Paydown Revolver to $105mm – – $195 – $195 Cash Required for Liquidity – 175 175 175 175 Total New Money Required $175 $370 $175 $370 (-) $61.2mm Bonsai Financing (61) (61) (61) (61) Total New Money Required in Excess of $61.2mm Facilty $114 $309 $114 $309 (-) Amount Drawn on A/R Facility – – (114) (309) Incremental New Money Required from Bonsai $114 $309 – – Pro Forma Revolver Balance at Trough $422 $247 $105 $247 $105 Revolver Capacity 300 300 105 300 105 Revolver Availability ($122) $53 – $53 – Pro Forma Cash Balance at Trough $3 $3 $56 $3 $56 Lender A A/R Facility Borrowing Base @ Trough n.a. n.a. n.a. 341 341 (-) Drawn Balance n.a. n.a. n.a. (114) (309) Availability (A/R) – – – $227 $32 (1) Liquidity @ Trough (3/31/23) ($128) $47 $47 $274 $79 Requires Additional Capital from Bonsai? Needs Waiver? Source: Management. 32 Note: Dollars in millions. (1) Liquidity excludes ~47.5mm in cash sitting in other entities and includes $9mm of LOCs.