Exhibit (c)(5) – Preliminary Working Draft; All Figures Subject to Change / Update – Project Cactus Discussion Materials November 21, 2022

– Preliminary Working Draft; All Figures Subject to Change / Update – Disclaimer This presentation has been prepared by Centerview Partners LLC (“Centerview”) for use solely by the Special Committee of the Board of Directors (the “Special Committee”) of Cactus (the “Company”) in connection with its evaluation of a proposed transaction involving the Company and for no other purpose. The information contained herein is based upon information supplied by or on behalf of the Company and publicly available information, and portions of the information contained herein may be based upon statements, estimates and forecasts provided by the Company. Centerview has relied upon the accuracy and completeness of the foregoing information, and has not assumed any responsibility for any independent verification of such information or for any independent evaluation or appraisal of any of the assets or liabilities (contingent or otherwise) of the Company or any other entity, or concerning the solvency or fair value of the Company or any other entity. With respect to financial forecasts, Centerview has assumed that such forecasts have been reasonably prepared on bases reflecting the best currently available estimates and judgments of the management of the Company as to the future financial performance of the Company, and at the Special Committee’s direction Centerview has relied upon such forecasts, as provided by the Company’s management, with respect to the Company. Centerview assumes no responsibility for and expresses no view as to such forecasts or the assumptions on which they are based. The information set forth herein is based upon economic, monetary, market and other conditions as in effect on, and the information made available to us as of, the date hereof, unless indicated otherwise and Centerview assumes no obligation to update or otherwise revise these materials. The financial analysis in this presentation is complex and is not necessarily susceptible to a partial analysis or summary description. In performing this financial analysis, Centerview has considered the results of its analysis as a whole and did not necessarily attribute a particular weight to any particular portion of the analysis considered. Furthermore, selecting any portion of Centerview’s analysis, without considering the analysis as a whole, would create an incomplete view of the process underlying its financial analysis. Centerview may have deemed various assumptions more or less probable than other assumptions, so the reference ranges resulting from any particular portion of the analysis described above should not be taken to be Centerview’s view of the actual value of the Company. These materials and the information contained herein are confidential, were not prepared with a view toward public disclosure, and may not be disclosed publicly or made available to third parties without the prior written consent of Centerview. These materials and any other advice, written or oral, rendered by Centerview are intended solely for the benefit and use of the Special Committee (in its capacity as such) in its consideration of the proposed transaction, and are not for the benefit of, and do not convey any rights or remedies for any holder of securities of or any other person. Centerview will not be responsible for and has not provided any tax, accounting, actuarial, legal or other specialist advice. These materials are not intended to provide the sole basis for evaluating the proposed transaction, and this presentation does not represent a fairness opinion, recommendation, valuation or opinion of any kind, and is necessarily incomplete and should be viewed solely in conjunction with the oral presentation provided by Centerview. 1

– Preliminary Working Draft; All Figures Subject to Change / Update – Special Committee “Roadmap Dashboard” Discussed in previous meetings Focus for today Evaluate B Bonsai’ onsai’s s C Conte ontextualizin xtualizing g F Fr rame amewo wor rk k Reach Proposal and Negotiate 10/24 10/24 B Bonsai’ onsai’s s fo for r Agreement Develop with Bonsai P Pr ro oposal posal P Pr ro oposal posal Neg Nego otiation tiation with Bonsai Response H Ho ow w does the does the Wh What ar at are e Offer value vs. Wh What ar at are e k key ey Bonsai off Bonsai offe er r Bonsai neg nego otiation tiation potential value t terms of erms of price compar price compare e Becomes d dynamics in ynamics in of executing on the pr the proposal? oposal? to r to re ecent stoc cent stock k Unfriendly se selected other lected other mgmt. outlook perf performance? ormance? transactions transactions? ? Bonsai What other What other Economic and P Pr ro ocess, cess, timing timing Withdraws Items to clarify Items to clarify ffactors should actors should Non-Economic a and tactical nd tactical Proposal with Bonsai with Bonsai b be tak e taken into en into Terms of Bonsai considerations considerations consideration consideration? ? proposal Assessment o Assessment of f Negotiation Levers M Mana anag gement Outlo ement Outlook ok F Financial anal inancial analysi ysis s (1) Offer value / Premium Necessary regulatory clearances Learnings fr Learnings from diligence om diligence Majority of the minority vote Buyer bridge loan K Ke ey driv y drivers of Management ers of Management Outloo Outlook k Reverse termination fee Minimal R&W P Potential oppor otential opport tunities / risks unities / risks Financing contingency / backstop Ticking construct C Comparison vs. omparison vs. expectations expectations 2 (1) For example, expiration of HSR waiting period. To be confirmed.

– Preliminary Working Draft; All Figures Subject to Change / Update – Illustrative Analysis At Various Prices 30% premia 58% premia Bonsai Proposals Counterproposals 11/7 11/19 11/10 11/6 10/24 Share Price $6.25 $6.55 $7.50 $8.00 $8.50 $9.00 $9.45 $9.75 % Premium / (Discount) to: Current Price (11/18/22) $7.43 (16%) (12%) +1% +8% +14% +21% +27% +31% Closing Price Prior to 10/24 Proposal $5.03 +24% +30% +49% +59% +69% +79% +88% +94% (1) 20-Day VWAP $6.71 (7%) (2%) +12% +19% +27% +34% +41% +45% Price Before BBG Rumor (10/10/22) $7.35 (15%) (11%) +2% +9% +16% +22% +29% +33% Implied Equity Value $1,807 $1,895 $2,172 $2,319 $2,466 $2,613 $2,747 $2,836 (2) Plus: Net Debt 1,409 1,409 1,409 1,409 1,409 1,409 1,409 1,409 Implied Enterprise Value ($mm) $3,216 $3,304 $3,581 $3,728 $3,875 $4,022 $4,156 $4,245 Implied EV / EBITDA (Management) (3) 2022E ($1) n.a. n.a. n.a. n.a. n.a. n.a. n.a. n.a. 2023E 130 24.7x 25.4x 27.6x 28.7x 29.8x 31.0x 32.0x 32.7x 2024E 213 15.1x 15.5x 16.8x 17.5x 18.2x 18.9x 19.5x 20.0x Implied EV / EBITDA (Consensus) 2022E $37 85.9x 88.2x 95.6x 99.6x 103.5x 107.4x 111.0x 113.4x 2023E 151 21.3x 21.9x 23.7x 24.7x 25.7x 26.7x 27.6x 28.2x 2024E 164 19.6x 20.1x 21.8x 22.7x 23.6x 24.5x 25.3x 25.8x Source: Management Outlook and FactSet as of November 18, 2022. Note: Dollars in millions, except per share amounts. (1) Reflects 20 trading days as of day of 10/24 Bonsai proposal – reflects market close prior to Bonsai proposal. 3 (2) Net debt excludes NCI that is related to Up-C structure. Net debt as of September 30, 2022. (3) Negative multiples presented as “n.a.”.
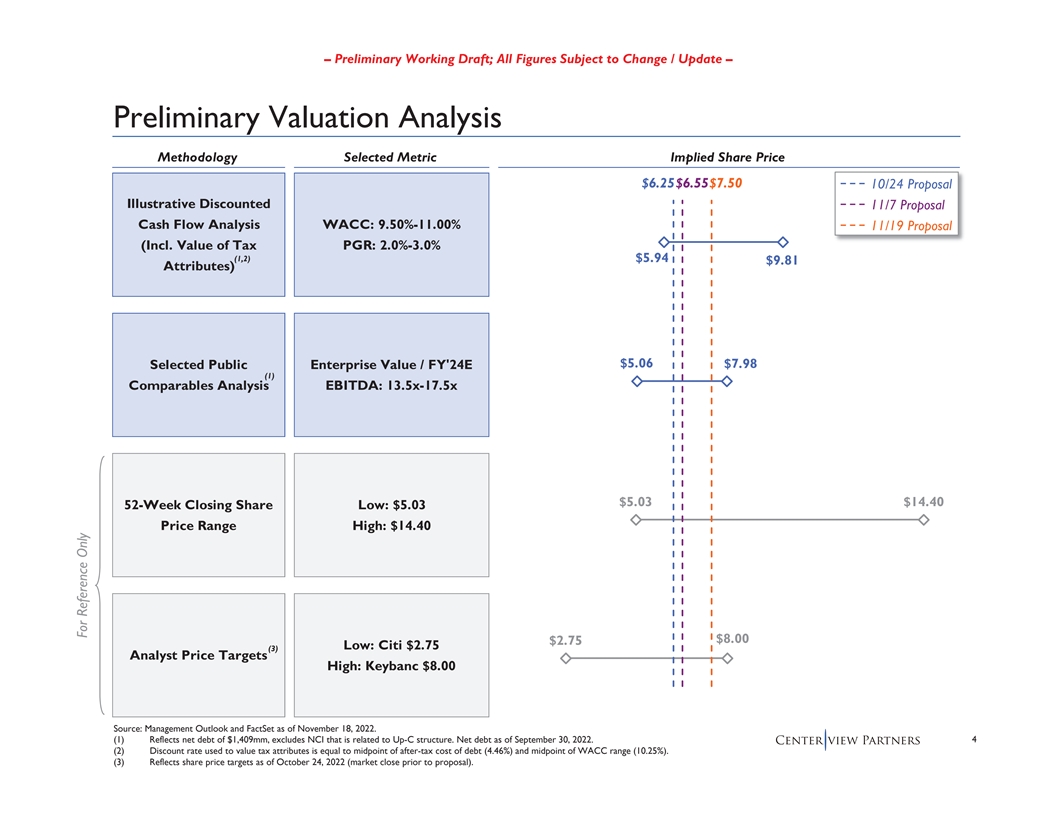
– Preliminary Working Draft; All Figures Subject to Change / Update – Preliminary Valuation Analysis Methodology Selected Metric Implied Share Price $6.25$6.55$7.50 10/24 Proposal Illustrative Discounted 11/7 Proposal Cash Flow Analysis WACC: 9.50%-11.00% 11/19 Proposal (Incl. Value of Tax PGR: 2.0%-3.0% (1,2) $5.94 $9.81 Attributes) $5.06 $7.98 Selected Public Enterprise Value / FY'24E (1) Comparables Analysis EBITDA: 13.5x-17.5x $5.03 $14.40 52-Week Closing Share Low: $5.03 Price Range High: $14.40 $8.00 $2.75 Low: Citi $2.75 (3) Analyst Price Targets High: Keybanc $8.00 Source: Management Outlook and FactSet as of November 18, 2022. (1) Reflects net debt of $1,409mm, excludes NCI that is related to Up-C structure. Net debt as of September 30, 2022. 4 (2) Discount rate used to value tax attributes is equal to midpoint of after-tax cost of debt (4.46%) and midpoint of WACC range (10.25%). (3) Reflects share price targets as of October 24, 2022 (market close prior to proposal). For Reference Only
Supporting Materials
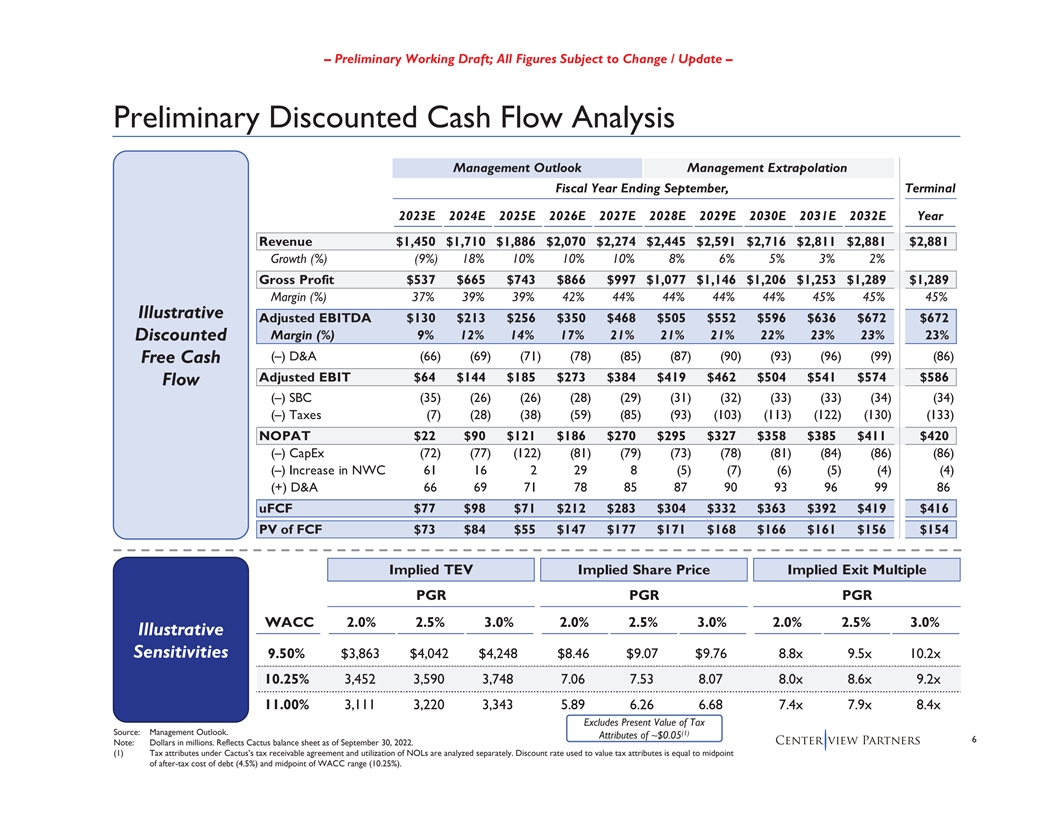
– Preliminary Working Draft; All Figures Subject to Change / Update – Preliminary Discounted Cash Flow Analysis Management Outlook Management Extrapolation Fiscal Year Ending September, Terminal 2023E 2024E 2025E 2026E 2027E 2028E 2029E 2030E 2031E 2032E Year Revenue $1,450 $1,710 $1,886 $2,070 $2,274 $2,445 $2,591 $2,716 $2,811 $2,881 $2,881 Growth (%) (9%) 18% 10% 10% 10% 8% 6% 5% 3% 2% Gross Profit $537 $665 $743 $866 $997 $1,077 $1,146 $1,206 $1,253 $1,289 $1,289 Margin (%) 37% 39% 39% 42% 44% 44% 44% 44% 45% 45% 45% Illustrative Adjusted EBITDA $130 $213 $256 $350 $468 $505 $552 $596 $636 $672 $672 Margin (%) 9% 12% 14% 17% 21% 21% 21% 22% 23% 23% 23% Discounted (–) D&A (66) (69) (71) (78) (85) (87) (90) (93) (96) (99) (86) Free Cash Adjusted EBIT $64 $144 $185 $273 $384 $419 $462 $504 $541 $574 $586 Flow (–) SBC (35) (26) (26) (28) (29) (31) (32) (33) (33) (34) (34) (–) Taxes (7) (28) (38) (59) (85) (93) (103) (113) (122) (130) (133) NOPAT $22 $90 $121 $186 $270 $295 $327 $358 $385 $411 $420 (–) CapEx (72) (77) (122) (81) (79) (73) (78) (81) (84) (86) (86) (–) Increase in NWC 61 16 2 29 8 (5) (7) (6) (5) (4) (4) (+) D&A 66697178858790939699 86 uFCF $77 $98 $71 $212 $283 $304 $332 $363 $392 $419 $416 PV of FCF $73 $84 $55 $147 $177 $171 $168 $166 $161 $156 $154 Implied TEV Implied Share Price Implied Exit Multiple PGR PGR PGR WACC 2.0% 2.5% 3.0% 2.0% 2.5% 3.0% 2.0% 2.5% 3.0% Illustrative Sensitivities 9.50% $3,863 $4,042 $4,248 $8.46 $9.07 $9.76 8.8x 9.5x 10.2x 10.25% 3,452 3,590 3,748 7.06 7.53 8.07 8.0x 8.6x 9.2x 11.00% 3,111 3,220 3,343 5.89 6.26 6.68 7.4x 7.9x 8.4x Excludes Present Value of Tax Source: Management Outlook. (1) Attributes of ~$0.05 6 Note: Dollars in millions. Reflects Cactus balance sheet as of September 30, 2022. (1) Tax attributes under Cactus’s tax receivable agreement and utilization of NOLs are analyzed separately. Discount rate used to value tax attributes is equal to midpoint of after-tax cost of debt (4.5%) and midpoint of WACC range (10.25%).
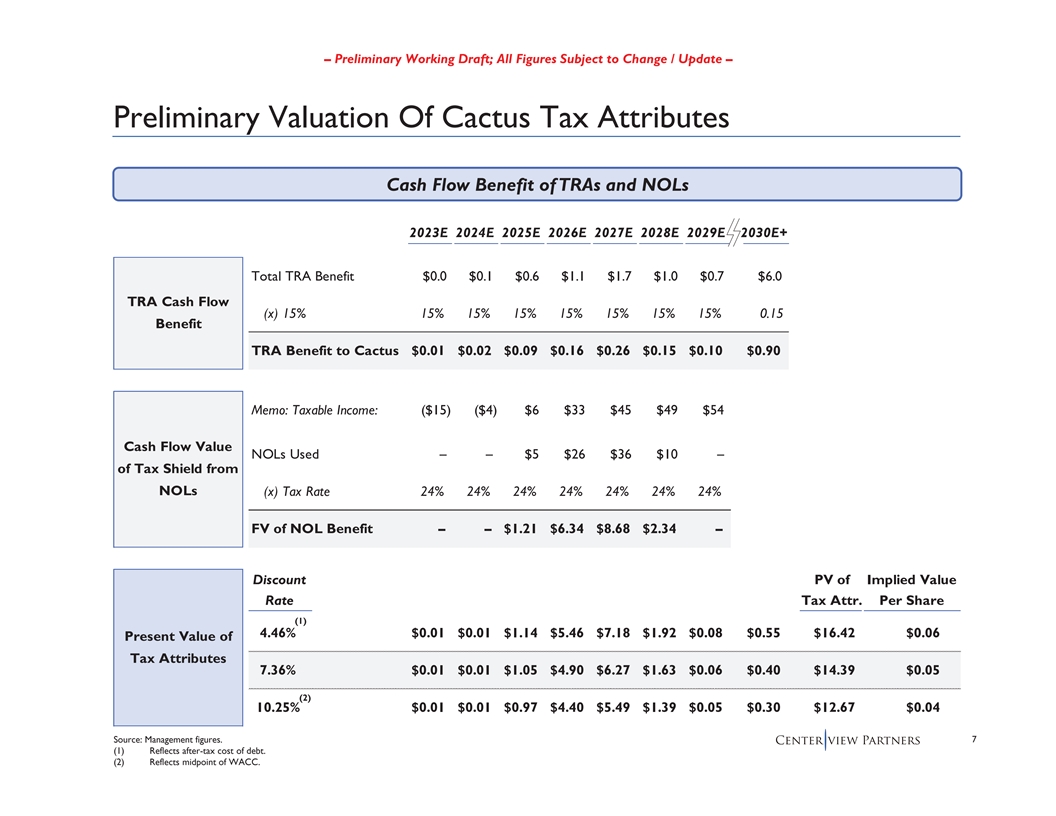
– Preliminary Working Draft; All Figures Subject to Change / Update – Preliminary Valuation Of Cactus Tax Attributes Cash Flow Benefit of TRAs and NOLs 2023E 2024E 2025E 2026E 2027E 2028E 2029E 2030E+ Total TRA Benefit $0.0 $0.1 $0.6 $1.1 $1.7 $1.0 $0.7 $6.0 TRA Cash Flow (x) 15% 15% 15% 15% 15% 15% 15% 15% 0.15 Benefit TRA Benefit to Cactus $0.01 $0.02 $0.09 $0.16 $0.26 $0.15 $0.10 $0.90 Memo: Taxable Income: ($15) ($4) $6 $33 $45 $49 $54 Cash Flow Value NOLs Used – – $5 $26 $36 $10 – of Tax Shield from NOLs (x) Tax Rate 24% 24% 24% 24% 24% 24% 24% FV of NOL Benefit – – $1.21 $6.34 $8.68 $2.34 – Discount PV of Implied Value Rate Tax Attr. Per Share (1) 4.46% $0.01 $0.01 $1.14 $5.46 $7.18 $1.92 $0.08 $0.55 $16.42 $0.06 Present Value of Tax Attributes 7.36% $0.01 $0.01 $1.05 $4.90 $6.27 $1.63 $0.06 $0.40 $14.39 $0.05 (2) 10.25% $0.01 $0.01 $0.97 $4.40 $5.49 $1.39 $0.05 $0.30 $12.67 $0.04 Source: Management figures. 7 (1) Reflects after-tax cost of debt. (2) Reflects midpoint of WACC.

– Preliminary Working Draft; All Figures Subject to Change / Update – Preliminary WACC Analysis Peer Unlevered Beta Cost of Equity (3) 2-Year Weekly Beta Market Debt Debt / Risk-Free Rate 4.1% (1) (2) Peer Levered Unlevered Cap ($mm) ($mm) Equity (4) Median Beta 0.65 Stanley Black & Decker 0.99 0.65 $11,963 $7,972 67% (4) Whirlpool 1.05 0.72 8,182 4,978 61% Target Debt / Equity 66.6% Newell Brands 1.12 0.61 5,579 5,840 105% (5) Levered Beta 0.98 Groupe SEB 0.76 0.43 4,293 4,249 99% (6) Electrolux 1.13 0.74 3,791 2,591 68% Historical Risk Prem. 7.5% Yeti 1.61 1.58 3,693 102 3% (7) Size Premium 1.3% Thule Group 1.35 1.23 2,423 290 12% Helen of Troy 0.88 0.63 2,297 1,173 51% Cost of Equity 12.8% Spectrum Brands 1.10 0.50 2,090 3,157 151% Traeger n.m. (July 2021 IPO) Cost of Debt Average 1.11 0.79 68% (8) Pre-Tax Cost of Debt 5.9% Median 1.10 0.65 67% (9) * Cactus 0.92 0.53 $1,453 $1,434 99% Tax Rate 24.0% (*) IPO’d on August 5, 2021 – reflects betas since IPO until October 24, 2022 (Close prior to Bonsai Proposal) % Equity 60.0% Illustrative WACC Sensitivity Analysis % Debt 40.0% D / E D / TEV Unlevered Beta Value Value 0.65 0.75 0.85 After-Tax Cost of Debt 4.5% 50% 33% 9.6% 10.3% 11.0% 65% 39% 9.5% 10.1% 10.8% (10) WACC 9.4% 80% 44% 9.4% 10.0% 10.7% Source: Duff & Phelps, Company filings, Bloomberg and FactSet as of November 18, 2022. Note: Cactus market data as of October 24, 2022. (1) Represents 2 year, weekly adjusted Beta relative to the local index. (2) Unlevered Beta equals (Levered Beta/(1 + ((1 - Tax Rate) * Debt/Equity)). (3) Reflects 20-year U.S. government bond yield as of November 18, 2022. (4) Represents peer median. (5) Levered Beta = (Unlevered Beta)*(1+(1-Tax Rate)*(Debt/Equity)). (6) Represents 8 long-horizon historical equity risk premium per Duff & Phelps. (7) Represents size premium for companies with market capitalizations between $1.3bn and $2.2bn per Duff & Phelps 2021. (8) Based on BofA Merrill Lynch US BBB Yield. (9) Cactus tax rate based on Management Outlook. Tax rate for each peers is based on corporate tax rate in the country of domicile. (10) WACC equals ((Debt/Capitalization * (Cost of Debt * (1 – Tax Rate))) + (Equity/Capitalization * Levered Cost of Equity)).

– Preliminary Working Draft; All Figures Subject to Change / Update – Trading Comps and Historical Performance Benchmarking EV / EBITDA Multiples 2019A-2021A Metrics Net Leverage EV / '23E EBITDA EV / '24E EBITDA Revenue CAGR EBITDA Margin Exp. 2021A EBITDA Margin FY'23E Net Leverage (2) Management 22.0x Consensus 17.4x Traeger 47% Thule Group +5pp Thule Group 24% Management 10.8x Consensus 19.0x Thule Group 14.4x Yeti 25% Whirlpool +3pp Yeti 23% Consensus 9.3x Stanley Black & Traeger 18.8x Traeger 13.7x Management 24% Yeti +3pp 18% Traeger 8.9x Decker Stanley Black & Thule Group 15.9x Management 13.5x Consensus 24% +3pp Helen of Troy 16% Spectrum Brands 4.9x Decker Stanley Black & Stanley Black & Stanley Black & 11.6x 9.3x Thule Group 21% Electrolux +2pp Management 15% 4.3x Decker Decker Decker Yeti 10.5x Yeti 9.1x Helen of Troy 15% Management +1pp Consensus 15% Newell Brands 4.2x Helen of Troy 10.0x Helen of Troy 9.0x Spectrum Brands 6% Consensus +1pp Traeger 15% Helen of Troy 3.3x (3) (1) (1) Spectrum Brands 9.5x Spectrum Brands 8.4x Newell Brands 5% Spectrum Brands +0pp Spectrum Brands 14% Groupe SEB 2.7x Newell Brands 8.7x Newell Brands 8.3x Groupe SEB 5% Groupe SEB +0pp Newell Brands 14% Electrolux 1.8x Stanley Black & (4) Groupe SEB 7.7x Groupe SEB 7.0x 5% Newell Brands (0pp) Whirlpool 13% Whirlpool 1.6x Decker Whirlpool 5.8x Whirlpool 5.6x Whirlpool 4% Helen of Troy (1pp) Groupe SEB 12% Thule Group 1.3x (2) Electrolux 5.7x Electrolux 4.7x Electrolux (0%) Traeger (1pp) Electrolux 9% Yeti 0.1x 75th Percentile 11.3x 9.3x 20% +3pp 17% 4.3x 9.8x 8.7x 6% +1pp 14% 3.0x Median 25th Percentile 8.0x 7.3x 5% (0pp) 13% 1.6x Source: Management Outlook and FactSet as of November 18, 2022. Note: Figures on Cactus’s fiscal year, unless otherwise noted. Cactus market data as of October 24, 2022. (1) Pro forma for Justice Department blocking Spectrum Brands’ HHI divesture. (2) Figures on Traeger’s fiscal year due to lack ofdata. (3) 9 Figure reflects annualized core sales growth on Newell’s fiscal year (FYE December 31). (4) Not pro forma for divestitures of Pure Fishing, Jostens and The Waddington group.
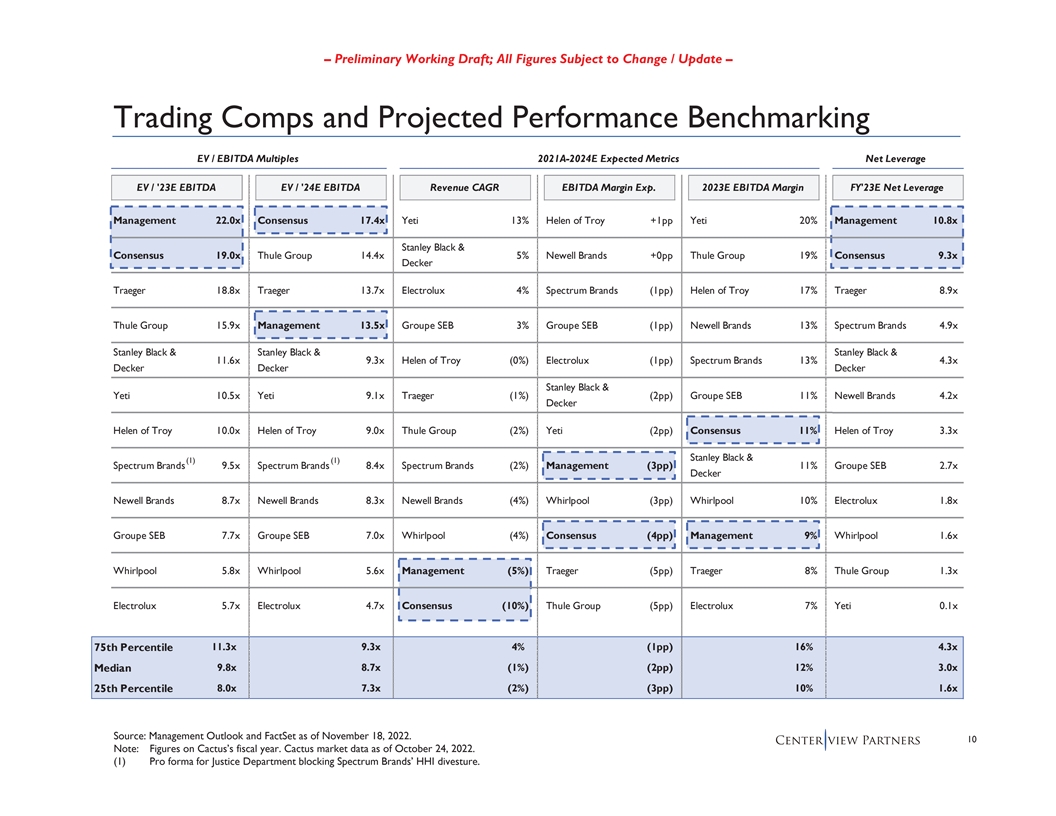
– Preliminary Working Draft; All Figures Subject to Change / Update – Trading Comps and Projected Performance Benchmarking EV / EBITDA Multiples 2021A-2024E Expected Metrics Net Leverage EV / '23E EBITDA EV / '24E EBITDA Revenue CAGR EBITDA Margin Exp. 2023E EBITDA Margin FY'23E Net Leverage Management 22.0x Consensus 17.4x Yeti 13% Helen of Troy +1pp Yeti 20% Management 10.8x Stanley Black & Consensus 19.0x Thule Group 14.4x 5% Newell Brands +0pp Thule Group 19% Consensus 9.3x Decker Traeger 18.8x Traeger 13.7x Electrolux 4% Spectrum Brands (1pp) Helen of Troy 17% Traeger 8.9x Thule Group 15.9x Management 13.5x Groupe SEB 3% Groupe SEB (1pp) Newell Brands 13% Spectrum Brands 4.9x Stanley Black & Stanley Black & Stanley Black & 11.6x 9.3x Helen of Troy (0%) Electrolux (1pp) Spectrum Brands 13% 4.3x Decker Decker Decker Stanley Black & Yeti 10.5x Yeti 9.1x Traeger (1%) (2pp) Groupe SEB 11% Newell Brands 4.2x Decker Helen of Troy 10.0x Helen of Troy 9.0x Thule Group (2%) Yeti (2pp) Consensus 11% Helen of Troy 3.3x Stanley Black & (1) (1) Spectrum Brands 9.5x Spectrum Brands 8.4x Spectrum Brands (2%) Management (3pp) 11% Groupe SEB 2.7x Decker Newell Brands 8.7x Newell Brands 8.3x Newell Brands (4%) Whirlpool (3pp) Whirlpool 10% Electrolux 1.8x Groupe SEB 7.7x Groupe SEB 7.0x Whirlpool (4%) Consensus (4pp) Management 9% Whirlpool 1.6x Whirlpool 5.8x Whirlpool 5.6x Management (5%) Traeger (5pp) Traeger 8% Thule Group 1.3x Electrolux 5.7x Electrolux 4.7x Consensus (10%) Thule Group (5pp) Electrolux 7% Yeti 0.1x 75th Percentile 11.3x 9.3x 4% (1pp) 16% 4.3x 9.8x 8.7x (1%) (2pp) 12% 3.0x Median 25th Percentile 8.0x 7.3x (2%) (3pp) 10% 1.6x Source: Management Outlook and FactSet as of November 18, 2022. 10 Note: Figures on Cactus’s fiscal year. Cactus market data as of October 24, 2022. (1) Pro forma for Justice Department blocking Spectrum Brands’ HHI divesture.

– Preliminary Working Draft; All Figures Subject to Change / Update – Analyst Price Targets Analyst Sentiment Over Time Wall Street Price Targets # of Brokers 88877 $8.00 100% $18 $19 $16 $6.00 80% 100% 57% $5.00 75% $11 100% 60% 63% $4.00 $10 $8 $9 40% (1) $7 $8 $3.00 $4 20% 38% $3.00 25% 43% 0% $2.75 Oct-21 Jan-22 Apr-22 Jul-22 Current Memo: Analyst Price Target Statistics Median $19 $16 $11 $8 $4 n.a. Median: % Premium +8% +55% +16% +7% (46%) $4.00 Buy Hold Sell Price Tgt. Price Buy Hold Sell 11 Source: FactSet as of October 24, 2022 (market close prior to proposal). (1) Reflects share price as of November 18, 2022.