0001859808 tsr:bench202411014226_1258Member 2021-09-30
UNITED STATES
SECURITIES AND EXCHANGE COMMISSION
Washington, D.C. 20549
FORM N-CSR
CERTIFIED SHAREHOLDER REPORT OF REGISTERED
MANAGEMENT INVESTMENT COMPANIES
| Investment Company Act file number | 811-23703 |
| |
| MassMutual Advantage Funds |
| (Exact name of registrant as specified in charter) |
| 1295 State Street, Springfield, MA | 01111 |
| (Address of principal executive offices) | (Zip code) |
| | |
| Douglas Steele |
| 1295 State Street, Springfield, MA 01111 |
| (Name and address of agent for service) |
| |
| | | |
| Registrant’s telephone number, including area code: | (413) 744-1000 | |
| Date of fiscal year end: | 09/30/2024 | |
| | | |
| Date of reporting period: | 09/30/2024 | |
Item 1. Reports to Stockholders.
| (a) | The Reports to Stockholders are attached herewith. |
| | |
MassMutual Clinton Limited Term Municipal Fund | |
| Class I | MMZPX |
| Annual Shareholder Report | September 30, 2024 |
This annual shareholder report contains important information about the MassMutual Clinton Limited Term Municipal Fund (the “Fund”) for the period of February 1, 2024 to September 30, 2024. You can find additional information about the Fund at https://www.massmutual.com/product-performance/mutual-funds. You can also request this information by contacting us at 1-888-309-3539 or by sending an email request to fundinfo@massmutual.com.
WHAT WERE THE FUND COSTS FOR THE LAST YEAR?
This example shows the expenses you would have paid over the past year, based on a hypothetical $10,000 investment. This table reflects any applicable waivers or expense limitations.
| | |
Class Name | Costs of a $10,000 investment1 | Costs paid as a percentage of a $10,000 investment1 |
| Class I | $19 | 0.29% |
| 1 | The expenses shown in this table are for less than a full reporting period. The expenses paid over a full reporting period would be higher. |
HOW DID THE FUND PERFORM?
The municipal bond market has realized strong gains over the trailing one-year period. The market benefited from sharply lower yields, although much of the decrease occurred in the fourth quarter of 2023. More recently, the third quarter of 2024 was likewise a period of lower market yields, in response to lower inflation data. This led the U.S. Federal Reserve to cut its policy interest rate by 0.50% in September 2024. During the period, the market also benefited from strong demand, driven by greater investor interest due to lower inflation (higher real tax-equivalent yields), desire to access higher yields in the near term against an outlook of lower yields, and a potentially higher tax environment in 2025.
Top contributors to the Fund’s performance relative to the Bloomberg 5-Year Municipal Bond Index:
• Issue selection in total and particularly in local authority municipal bonds
• Issue selection in state general obligation issues
Top detractors to the Fund’s performance relative to the Bloomberg 5-Year Municipal Bond Index:
• Interest rate sensitivity including both duration and yield curve effects
• Sector allocation effect in total and, in particular, an underweight to gas forward issues
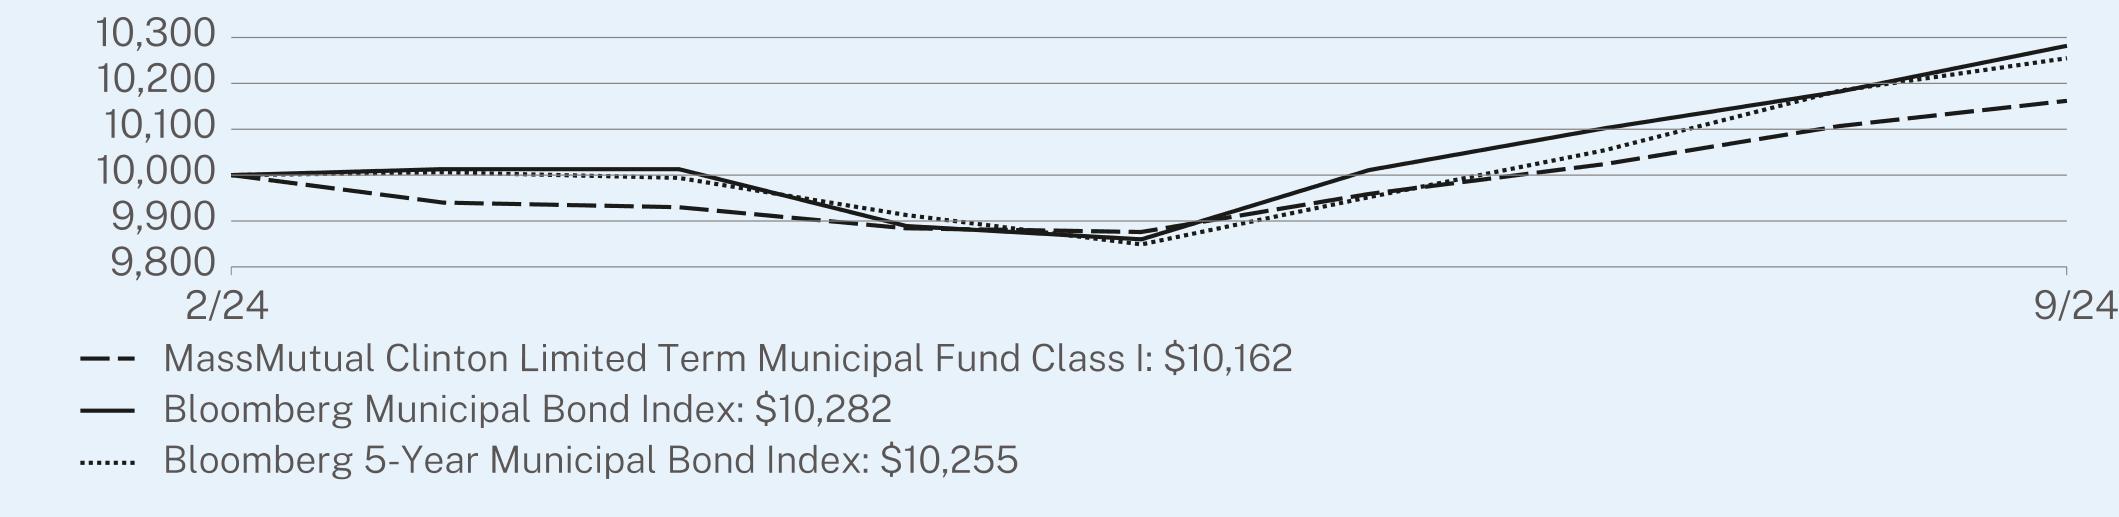
Performance shown is past performance and does not guarantee future results. The graph and table below do not reflect the deduction of taxes that a shareholder would pay on Fund distributions or redemption of Fund shares. The graph and table below assume reinvestment of dividends and capital gain distributions.
GROWTH OF A HYPOTHETICAL $10,000 INVESTMENT (February 1, 2024 through September 30, 2024)
This graph shows the performance of a hypothetical $10,000 investment in the share class noted over a ten-year period or since inception, if shorter, as compared to the performance of a broad-based securities market index, and, if applicable, one or more indexes that MML Investment Advisers, LLC believes more closely reflects the market segments in which the Fund invests or is a better comparison for the Fund’s investment strategy. This graph includes the deduction of the maximum applicable sales charge, if any.
| MM202912-309770 | PAGE 1 | TSR-AR-IT316 |
The index or indexes shown above are unmanaged, cannot be purchased directly, and, with the exception of any peer group index, do not incur expenses.
AVERAGE ANNUAL TOTAL RETURNS (%) (as of September 30, 2024)
| |
| | Since Inception
(02/01/2024) |
Class I - without sales charge | 1.62 |
Bloomberg Municipal Bond Index | 2.82 |
Bloomberg 5-Year Municipal Bond Index | 2.55 |
Performance results reflect any applicable waivers or expense limitations in effect during these periods, without which performance would have been lower. The investment return and principal value of shares of the Fund fluctuate, so your shares, when sold, may be worth more or less than their original cost. Current performance of the Fund may be lower or higher than the performance quoted. Performance data current to the most recent month-end may be obtained at https://www.massmutual.com/product-performance/mutual-funds or by calling 1-888-309-3539 or by sending an email request to fundinfo@massmutual.com.
WHAT ARE SOME KEY FUND STATISTICS? (as of September 30, 2024)
| |
Total Net Assets (Millions) | $49.9 |
Total Number of Portfolio Holdings (includes derivative positions, if any) | 33 |
Total Advisory Fees Paid During the Reporting Period | $78,835 |
Portfolio Turnover Rate | 70% |
WHAT DID THE FUND INVEST IN? (as of September 30, 2024)
Derivative values, if any, are excluded from the table(s) below.
| |
Portfolio Characteristics
(% of Total Investments) | |
Municipal Obligations | 100.0% |
| |
Largest States
(% of Total Investments) | |
Texas | 16.8% |
New York | 13.2% |
Pennsylvania | 11.9% |
Illinois | 11.5% |
Virginia | 8.0% |
South Carolina | 7.1% |
California | 6.3% |
New Jersey | 5.9% |
Maryland | 5.4% |
Florida | 4.2% |
| MM202912-309770 | PAGE 2 | TSR-AR-IT316 |
| |
| WHERE CAN I FIND ADDITIONAL INFORMATION ABOUT THE FUND? |
For additional information about the Fund, including its prospectus, financial information, holdings, and proxy voting information, scan the QR code or visit https://www.massmutual.com/product-performance/mutual-funds. |
| MM202912-309770 | PAGE 3 | TSR-AR-IT316 |
100001016210000102821000010255
| | |
MassMutual Clinton Limited Term Municipal Fund | |
| Class Y | MMZQX |
| Annual Shareholder Report | September 30, 2024 |
This annual shareholder report contains important information about the MassMutual Clinton Limited Term Municipal Fund (the “Fund”) for the period of February 1, 2024 to September 30, 2024. You can find additional information about the Fund at https://www.massmutual.com/product-performance/mutual-funds. You can also request this information by contacting us at 1-888-309-3539 or by sending an email request to fundinfo@massmutual.com.
WHAT WERE THE FUND COSTS FOR THE LAST YEAR?
This example shows the expenses you would have paid over the past year, based on a hypothetical $10,000 investment. This table reflects any applicable waivers or expense limitations.
| | |
Class Name | Costs of a $10,000 investment1 | Costs paid as a percentage of a $10,000 investment1 |
| Class Y | $26 | 0.39% |
| 1 | The expenses shown in this table are for less than a full reporting period. The expenses paid over a full reporting period would be higher. |
HOW DID THE FUND PERFORM?
The municipal bond market has realized strong gains over the trailing one-year period. The market benefited from sharply lower yields, although much of the decrease occurred in the fourth quarter of 2023. More recently, the third quarter of 2024 was likewise a period of lower market yields, in response to lower inflation data. This led the U.S. Federal Reserve to cut its policy interest rate by 0.50% in September 2024. During the period, the market also benefited from strong demand, driven by greater investor interest due to lower inflation (higher real tax-equivalent yields), desire to access higher yields in the near term against an outlook of lower yields, and a potentially higher tax environment in 2025.
Top contributors to the Fund’s performance relative to the Bloomberg 5-Year Municipal Bond Index:
• Issue selection in total and particularly in local authority municipal bonds
• Issue selection in state general obligation issues
Top detractors to the Fund’s performance relative to the Bloomberg 5-Year Municipal Bond Index:
• Interest rate sensitivity including both duration and yield curve effects
• Sector allocation effect in total and, in particular, an underweight to gas forward issues
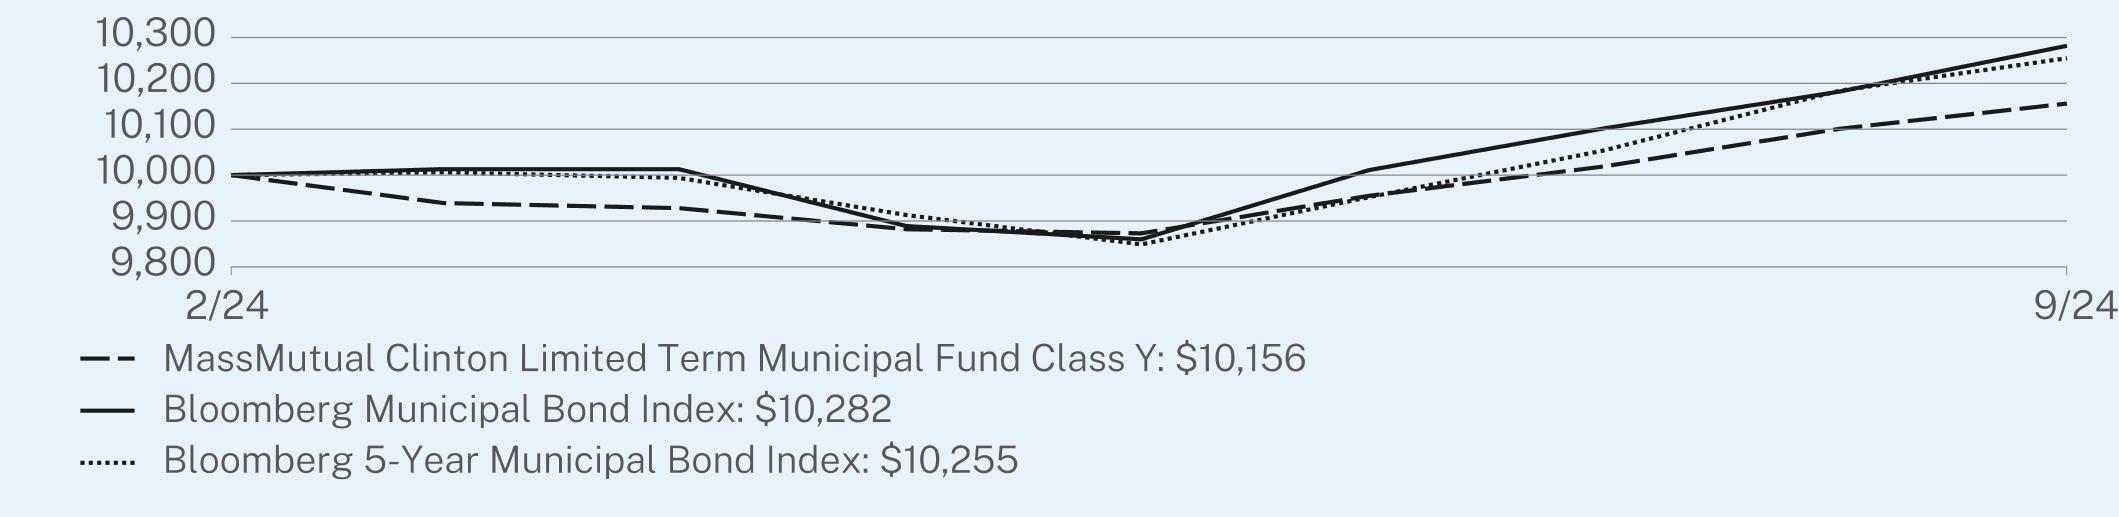
Performance shown is past performance and does not guarantee future results. The graph and table below do not reflect the deduction of taxes that a shareholder would pay on Fund distributions or redemption of Fund shares. The graph and table below assume reinvestment of dividends and capital gain distributions.
GROWTH OF A HYPOTHETICAL $10,000 INVESTMENT (February 1, 2024 through September 30, 2024)
This graph shows the performance of a hypothetical $10,000 investment in the share class noted over a ten-year period or since inception, if shorter, as compared to the performance of a broad-based securities market index, and, if applicable, one or more indexes that MML Investment Advisers, LLC believes more closely reflects the market segments in which the Fund invests or is a better comparison for the Fund’s investment strategy. This graph includes the deduction of the maximum applicable sales charge, if any.
| MM202912-309770 | PAGE 1 | TSR-AR-IT31Y |
The index or indexes shown above are unmanaged, cannot be purchased directly, and, with the exception of any peer group index, do not incur expenses.
AVERAGE ANNUAL TOTAL RETURNS (%) (as of September 30, 2024)
| |
| | Since Inception
(02/01/2024) |
Class Y - without sales charge | 1.56 |
Bloomberg Municipal Bond Index | 2.82 |
Bloomberg 5-Year Municipal Bond Index | 2.55 |
Performance results reflect any applicable waivers or expense limitations in effect during these periods, without which performance would have been lower. The investment return and principal value of shares of the Fund fluctuate, so your shares, when sold, may be worth more or less than their original cost. Current performance of the Fund may be lower or higher than the performance quoted. Performance data current to the most recent month-end may be obtained at https://www.massmutual.com/product-performance/mutual-funds or by calling 1-888-309-3539 or by sending an email request to fundinfo@massmutual.com.
WHAT ARE SOME KEY FUND STATISTICS? (as of September 30, 2024)
| |
Total Net Assets (Millions) | $49.9 |
Total Number of Portfolio Holdings (includes derivative positions, if any) | 33 |
Total Advisory Fees Paid During the Reporting Period | $78,835 |
Portfolio Turnover Rate | 70% |
WHAT DID THE FUND INVEST IN? (as of September 30, 2024)
Derivative values, if any, are excluded from the table(s) below.
| |
Portfolio Characteristics
(% of Total Investments) | |
Municipal Obligations | 100.0% |
| |
Largest States
(% of Total Investments) | |
Texas | 16.8% |
New York | 13.2% |
Pennsylvania | 11.9% |
Illinois | 11.5% |
Virginia | 8.0% |
South Carolina | 7.1% |
California | 6.3% |
New Jersey | 5.9% |
Maryland | 5.4% |
Florida | 4.2% |
| MM202912-309770 | PAGE 2 | TSR-AR-IT31Y |
| |
| WHERE CAN I FIND ADDITIONAL INFORMATION ABOUT THE FUND? |
For additional information about the Fund, including its prospectus, financial information, holdings, and proxy voting information, scan the QR code or visit https://www.massmutual.com/product-performance/mutual-funds. |
| MM202912-309770 | PAGE 3 | TSR-AR-IT31Y |
100001015610000102821000010255
| | |
MassMutual Clinton Limited Term Municipal Fund | |
| Class A | MMJDX |
| Annual Shareholder Report | September 30, 2024 |
This annual shareholder report contains important information about the MassMutual Clinton Limited Term Municipal Fund (the “Fund”) for the period of February 1, 2024 to September 30, 2024. You can find additional information about the Fund at https://www.massmutual.com/product-performance/mutual-funds. You can also request this information by contacting us at 1-888-309-3539 or by sending an email request to fundinfo@massmutual.com.
WHAT WERE THE FUND COSTS FOR THE LAST YEAR?
This example shows the expenses you would have paid over the past year, based on a hypothetical $10,000 investment. This table reflects any applicable waivers or expense limitations.
| | |
Class Name | Costs of a $10,000 investment1 | Costs paid as a percentage of a $10,000 investment1 |
| Class A | $43 | 0.64% |
| 1 | The expenses shown in this table are for less than a full reporting period. The expenses paid over a full reporting period would be higher. |
HOW DID THE FUND PERFORM?
The municipal bond market has realized strong gains over the trailing one-year period. The market benefited from sharply lower yields, although much of the decrease occurred in the fourth quarter of 2023. More recently, the third quarter of 2024 was likewise a period of lower market yields, in response to lower inflation data. This led the U.S. Federal Reserve to cut its policy interest rate by 0.50% in September 2024. During the period, the market also benefited from strong demand, driven by greater investor interest due to lower inflation (higher real tax-equivalent yields), desire to access higher yields in the near term against an outlook of lower yields, and a potentially higher tax environment in 2025.
Top contributors to the Fund’s performance relative to the Bloomberg 5-Year Municipal Bond Index:
• Issue selection in total and particularly in local authority municipal bonds
• Issue selection in state general obligation issues
Top detractors to the Fund’s performance relative to the Bloomberg 5-Year Municipal Bond Index:
• Interest rate sensitivity including both duration and yield curve effects
• Sector allocation effect in total and, in particular, an underweight to gas forward issues
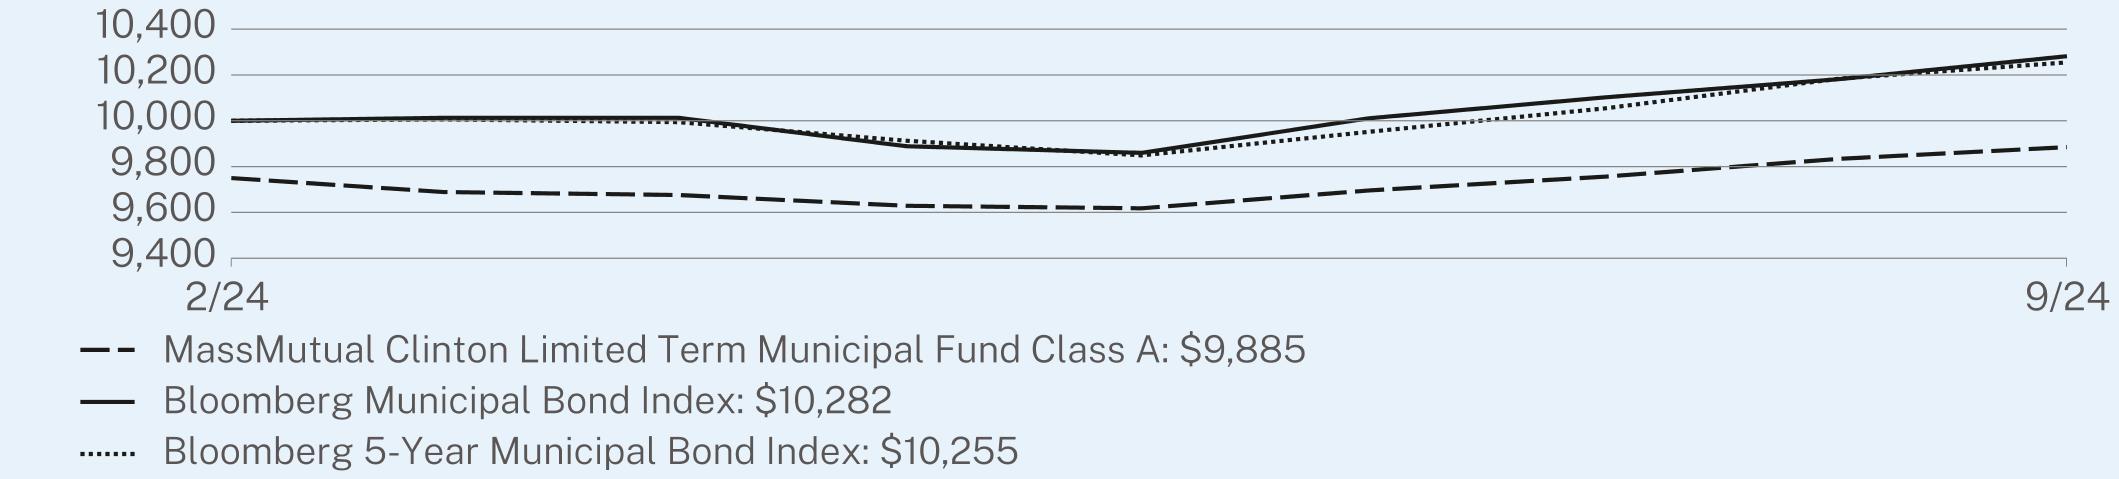
Performance shown is past performance and does not guarantee future results. The graph and table below do not reflect the deduction of taxes that a shareholder would pay on Fund distributions or redemption of Fund shares. The graph and table below assume reinvestment of dividends and capital gain distributions.
GROWTH OF A HYPOTHETICAL $10,000 INVESTMENT (February 1, 2024 through September 30, 2024)
This graph shows the performance of a hypothetical $10,000 investment in the share class noted over a ten-year period or since inception, if shorter, as compared to the performance of a broad-based securities market index, and, if applicable, one or more indexes that MML Investment Advisers, LLC believes more closely reflects the market segments in which the Fund invests or is a better comparison for the Fund’s investment strategy. This graph includes the deduction of the maximum applicable sales charge, if any.
| MM202912-309770 | PAGE 1 | TSR-AR-IT312 |
The index or indexes shown above are unmanaged, cannot be purchased directly, and, with the exception of any peer group index, do not incur expenses.
AVERAGE ANNUAL TOTAL RETURNS (%) (as of September 30, 2024)
| |
| | Since Inception
(02/01/2024) |
Class A - without sales charge | 1.39 |
Class A - with maximum sales charge | -1.15 |
Bloomberg Municipal Bond Index | 2.82 |
Bloomberg 5-Year Municipal Bond Index | 2.55 |
Performance results reflect any applicable waivers or expense limitations in effect during these periods, without which performance would have been lower. The investment return and principal value of shares of the Fund fluctuate, so your shares, when sold, may be worth more or less than their original cost. Current performance of the Fund may be lower or higher than the performance quoted. Performance data current to the most recent month-end may be obtained at https://www.massmutual.com/product-performance/mutual-funds or by calling 1-888-309-3539 or by sending an email request to fundinfo@massmutual.com.
WHAT ARE SOME KEY FUND STATISTICS? (as of September 30, 2024)
| |
Total Net Assets (Millions) | $49.9 |
Total Number of Portfolio Holdings (includes derivative positions, if any) | 33 |
Total Advisory Fees Paid During the Reporting Period | $78,835 |
Portfolio Turnover Rate | 70% |
WHAT DID THE FUND INVEST IN? (as of September 30, 2024)
Derivative values, if any, are excluded from the table(s) below.
| |
Portfolio Characteristics
(% of Total Investments) | |
Municipal Obligations | 100.0% |
| |
Largest States
(% of Total Investments) | |
Texas | 16.8% |
New York | 13.2% |
Pennsylvania | 11.9% |
Illinois | 11.5% |
Virginia | 8.0% |
South Carolina | 7.1% |
California | 6.3% |
New Jersey | 5.9% |
Maryland | 5.4% |
Florida | 4.2% |
| MM202912-309770 | PAGE 2 | TSR-AR-IT312 |
| |
| WHERE CAN I FIND ADDITIONAL INFORMATION ABOUT THE FUND? |
For additional information about the Fund, including its prospectus, financial information, holdings, and proxy voting information, scan the QR code or visit https://www.massmutual.com/product-performance/mutual-funds. |
| MM202912-309770 | PAGE 3 | TSR-AR-IT312 |
9750988510000102821000010255
| | |
MassMutual Clinton Municipal Fund | |
| Class I | MMZVX |
| Annual Shareholder Report | September 30, 2024 |
This annual shareholder report contains important information about the MassMutual Clinton Municipal Fund (the “Fund”) for the period of February 1, 2024 to September 30, 2024. You can find additional information about the Fund at https://www.massmutual.com/product-performance/mutual-funds. You can also request this information by contacting us at 1-888-309-3539 or by sending an email request to fundinfo@massmutual.com.
WHAT WERE THE FUND COSTS FOR THE LAST YEAR?
This example shows the expenses you would have paid over the past year, based on a hypothetical $10,000 investment. This table reflects any applicable waivers or expense limitations.
| | |
Class Name | Costs of a $10,000 investment1 | Costs paid as a percentage of a $10,000 investment1 |
| Class I | $27 | 0.41% |
| 1 | The expenses shown in this table are for less than a full reporting period. The expenses paid over a full reporting period would be higher. |
HOW DID THE FUND PERFORM?
The municipal bond market has realized strong gains over the trailing one-year period. The market benefited from sharply lower yields, although much of the decrease occurred in the fourth quarter of 2023. More recently, the third quarter of 2024 was likewise a period of lower market yields, in response to lower inflation data. This led the U.S. Federal Reserve to cut its policy interest rate by 0.50% in September 2024. During the period, the market also benefited from strong demand, driven by greater investor interest due to lower inflation (higher real tax-equivalent yields), desire to access higher yields in the near term against an outlook of lower yields, and a potentially higher tax environment in 2025.
Top contributors to the Fund’s performance relative to the Bloomberg Municipal Bond Index:
• Issue selection in state general obligation municipal bonds
• Overweight allocation to local authority municipal obligations of various issue types
Top detractors to the Fund’s performance relative to the Bloomberg Municipal Bond Index:
• Interest rate sensitivity including duration and yield curve effects
• Overweight allocation to local general obligation bonds
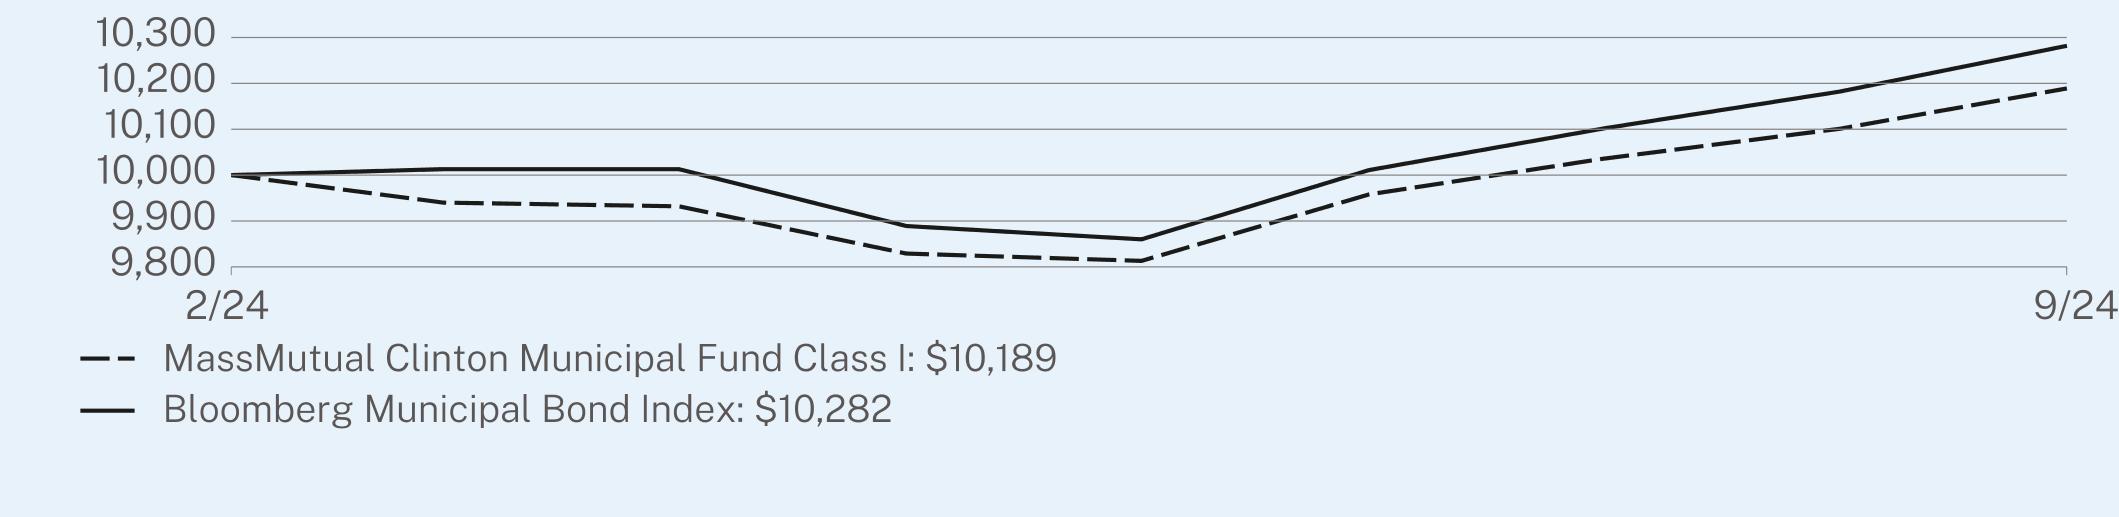
Performance shown is past performance and does not guarantee future results. The graph and table below do not reflect the deduction of taxes that a shareholder would pay on Fund distributions or redemption of Fund shares. The graph and table below assume reinvestment of dividends and capital gain distributions.
GROWTH OF A HYPOTHETICAL $10,000 INVESTMENT (February 1, 2024 through September 30, 2024)
This graph shows the performance of a hypothetical $10,000 investment in the share class noted over a ten-year period or since inception, if shorter, as compared to the performance of a broad-based securities market index, and, if applicable, one or more indexes that MML Investment Advisers, LLC believes more closely reflects the market segments in which the Fund invests or is a better comparison for the Fund’s investment strategy. This graph includes the deduction of the maximum applicable sales charge, if any.
| MM202912-309770 | PAGE 1 | TSR-AR-IT326 |
The index or indexes shown above are unmanaged, cannot be purchased directly, and, with the exception of any peer group index, do not incur expenses.
AVERAGE ANNUAL TOTAL RETURNS (%) (as of September 30, 2024)
| |
| | Since Inception
(02/01/2024) |
Class I - without sales charge | 1.89 |
Bloomberg Municipal Bond Index | 2.82 |
Performance results reflect any applicable waivers or expense limitations in effect during these periods, without which performance would have been lower. The investment return and principal value of shares of the Fund fluctuate, so your shares, when sold, may be worth more or less than their original cost. Current performance of the Fund may be lower or higher than the performance quoted. Performance data current to the most recent month-end may be obtained at https://www.massmutual.com/product-performance/mutual-funds or by calling 1-888-309-3539 or by sending an email request to fundinfo@massmutual.com.
WHAT ARE SOME KEY FUND STATISTICS? (as of September 30, 2024)
| |
Total Net Assets (Millions) | $50.7 |
Total Number of Portfolio Holdings (includes derivative positions, if any) | 30 |
Total Advisory Fees Paid During the Reporting Period | $114,904 |
Portfolio Turnover Rate | 76% |
WHAT DID THE FUND INVEST IN? (as of September 30, 2024)
Derivative values, if any, are excluded from the table(s) below.
| |
Portfolio Characteristics
(% of Total Investments) | |
Municipal Obligations | 100.0% |
| |
Largest States
(% of Total Investments) | |
Texas | 25.8% |
New York | 17.4% |
Illinois | 14.5% |
Pennsylvania | 8.5% |
New Jersey | 7.3% |
Virginia | 5.8% |
Alabama | 5.0% |
Nebraska | 3.2% |
Michigan | 2.6% |
Arizona | 2.3% |
| MM202912-309770 | PAGE 2 | TSR-AR-IT326 |
| |
| WHERE CAN I FIND ADDITIONAL INFORMATION ABOUT THE FUND? |
For additional information about the Fund, including its prospectus, financial information, holdings, and proxy voting information, scan the QR code or visit https://www.massmutual.com/product-performance/mutual-funds. |
| MM202912-309770 | PAGE 3 | TSR-AR-IT326 |
10000101891000010282
| | |
MassMutual Clinton Municipal Fund | |
| Class Y | MMZWX |
| Annual Shareholder Report | September 30, 2024 |
This annual shareholder report contains important information about the MassMutual Clinton Municipal Fund (the “Fund”) for the period of February 1, 2024 to September 30, 2024. You can find additional information about the Fund at https://www.massmutual.com/product-performance/mutual-funds. You can also request this information by contacting us at 1-888-309-3539 or by sending an email request to fundinfo@massmutual.com.
WHAT WERE THE FUND COSTS FOR THE LAST YEAR?
This example shows the expenses you would have paid over the past year, based on a hypothetical $10,000 investment. This table reflects any applicable waivers or expense limitations.
| | |
Class Name | Costs of a $10,000 investment1 | Costs paid as a percentage of a $10,000 investment1 |
| Class Y | $34 | 0.51% |
| 1 | The expenses shown in this table are for less than a full reporting period. The expenses paid over a full reporting period would be higher. |
HOW DID THE FUND PERFORM?
The municipal bond market has realized strong gains over the trailing one-year period. The market benefited from sharply lower yields, although much of the decrease occurred in the fourth quarter of 2023. More recently, the third quarter of 2024 was likewise a period of lower market yields, in response to lower inflation data. This led the U.S. Federal Reserve to cut its policy interest rate by 0.50% in September 2024. During the period, the market also benefited from strong demand, driven by greater investor interest due to lower inflation (higher real tax-equivalent yields), desire to access higher yields in the near term against an outlook of lower yields, and a potentially higher tax environment in 2025.
Top contributors to the Fund’s performance relative to the Bloomberg Municipal Bond Index:
• Issue selection in state general obligation municipal bonds
• Overweight allocation to local authority municipal obligations of various issue types
Top detractors to the Fund’s performance relative to the Bloomberg Municipal Bond Index:
• Interest rate sensitivity including duration and yield curve effects
• Overweight allocation to local general obligation bonds
Performance shown is past performance and does not guarantee future results. The graph and table below do not reflect the deduction of taxes that a shareholder would pay on Fund distributions or redemption of Fund shares. The graph and table below assume reinvestment of dividends and capital gain distributions.
GROWTH OF A HYPOTHETICAL $10,000 INVESTMENT (February 1, 2024 through September 30, 2024)
This graph shows the performance of a hypothetical $10,000 investment in the share class noted over a ten-year period or since inception, if shorter, as compared to the performance of a broad-based securities market index, and, if applicable, one or more indexes that MML Investment Advisers, LLC believes more closely reflects the market segments in which the Fund invests or is a better comparison for the Fund’s investment strategy. This graph includes the deduction of the maximum applicable sales charge, if any.
| MM202912-309770 | PAGE 1 | TSR-AR-IT32Y |
The index or indexes shown above are unmanaged, cannot be purchased directly, and, with the exception of any peer group index, do not incur expenses.
AVERAGE ANNUAL TOTAL RETURNS (%) (as of September 30, 2024)
| |
| | Since Inception
(02/01/2024) |
Class Y - without sales charge | 1.82 |
Bloomberg Municipal Bond Index | 2.82 |
Performance results reflect any applicable waivers or expense limitations in effect during these periods, without which performance would have been lower. The investment return and principal value of shares of the Fund fluctuate, so your shares, when sold, may be worth more or less than their original cost. Current performance of the Fund may be lower or higher than the performance quoted. Performance data current to the most recent month-end may be obtained at https://www.massmutual.com/product-performance/mutual-funds or by calling 1-888-309-3539 or by sending an email request to fundinfo@massmutual.com.
WHAT ARE SOME KEY FUND STATISTICS? (as of September 30, 2024)
| |
Total Net Assets (Millions) | $50.7 |
Total Number of Portfolio Holdings (includes derivative positions, if any) | 30 |
Total Advisory Fees Paid During the Reporting Period | $114,904 |
Portfolio Turnover Rate | 76% |
WHAT DID THE FUND INVEST IN? (as of September 30, 2024)
Derivative values, if any, are excluded from the table(s) below.
| |
Portfolio Characteristics
(% of Total Investments) | |
Municipal Obligations | 100.0% |
| |
Largest States
(% of Total Investments) | |
Texas | 25.8% |
New York | 17.4% |
Illinois | 14.5% |
Pennsylvania | 8.5% |
New Jersey | 7.3% |
Virginia | 5.8% |
Alabama | 5.0% |
Nebraska | 3.2% |
Michigan | 2.6% |
Arizona | 2.3% |
| MM202912-309770 | PAGE 2 | TSR-AR-IT32Y |
| |
| WHERE CAN I FIND ADDITIONAL INFORMATION ABOUT THE FUND? |
For additional information about the Fund, including its prospectus, financial information, holdings, and proxy voting information, scan the QR code or visit https://www.massmutual.com/product-performance/mutual-funds. |
| MM202912-309770 | PAGE 3 | TSR-AR-IT32Y |
10000101821000010282
| | |
MassMutual Clinton Municipal Fund | |
| Class A | MMZUX |
| Annual Shareholder Report | September 30, 2024 |
This annual shareholder report contains important information about the MassMutual Clinton Municipal Fund (the “Fund”) for the period of February 1, 2024 to September 30, 2024. You can find additional information about the Fund at https://www.massmutual.com/product-performance/mutual-funds. You can also request this information by contacting us at 1-888-309-3539 or by sending an email request to fundinfo@massmutual.com.
WHAT WERE THE FUND COSTS FOR THE LAST YEAR?
This example shows the expenses you would have paid over the past year, based on a hypothetical $10,000 investment. This table reflects any applicable waivers or expense limitations.
| | |
Class Name | Costs of a $10,000 investment1 | Costs paid as a percentage of a $10,000 investment1 |
| Class A | $51 | 0.76% |
| 1 | The expenses shown in this table are for less than a full reporting period. The expenses paid over a full reporting period would be higher. |
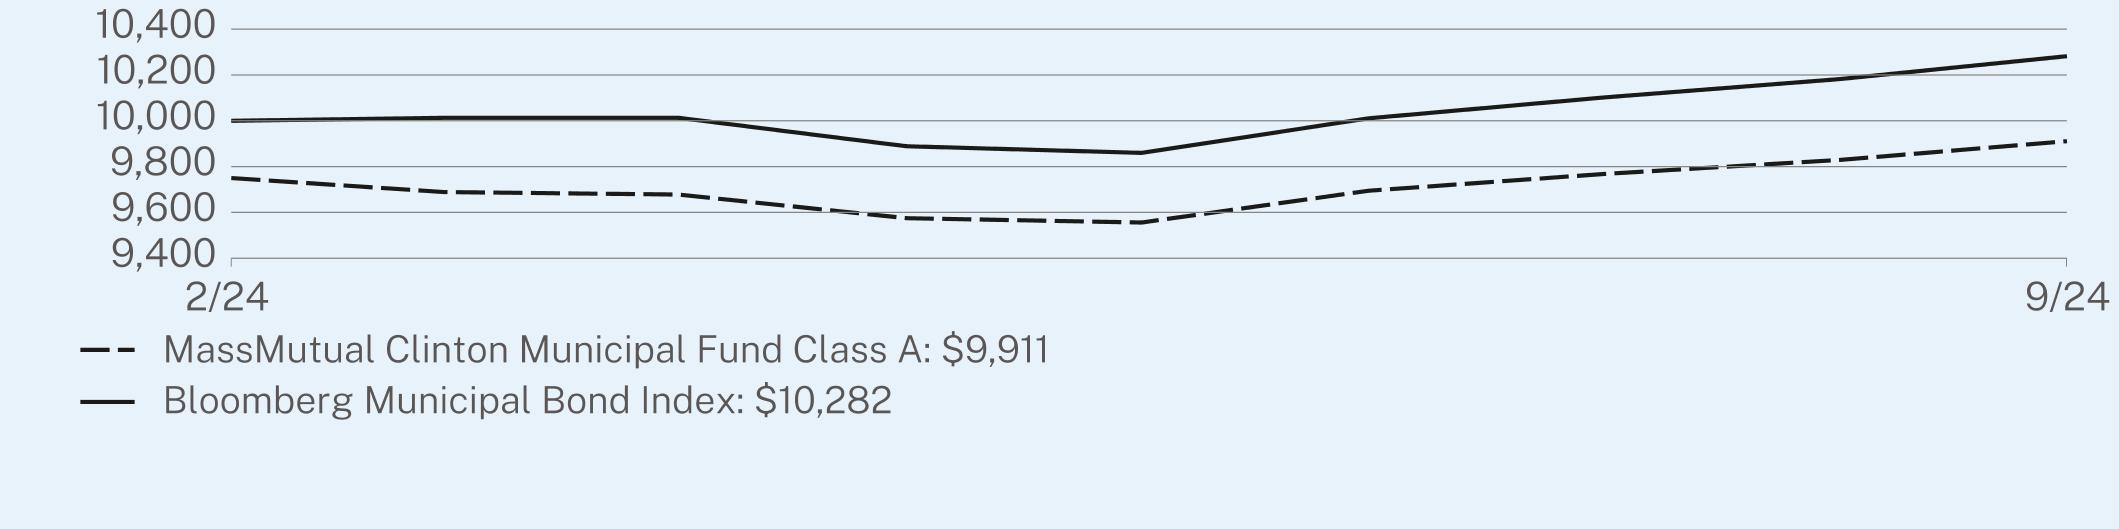
HOW DID THE FUND PERFORM?
The municipal bond market has realized strong gains over the trailing one-year period. The market benefited from sharply lower yields, although much of the decrease occurred in the fourth quarter of 2023. More recently, the third quarter of 2024 was likewise a period of lower market yields, in response to lower inflation data. This led the U.S. Federal Reserve to cut its policy interest rate by 0.50% in September 2024. During the period, the market also benefited from strong demand, driven by greater investor interest due to lower inflation (higher real tax-equivalent yields), desire to access higher yields in the near term against an outlook of lower yields, and a potentially higher tax environment in 2025.
Top contributors to the Fund’s performance relative to the Bloomberg Municipal Bond Index:
• Issue selection in state general obligation municipal bonds
• Overweight allocation to local authority municipal obligations of various issue types
Top detractors to the Fund’s performance relative to the Bloomberg Municipal Bond Index:
• Interest rate sensitivity including duration and yield curve effects
• Overweight allocation to local general obligation bonds
Performance shown is past performance and does not guarantee future results. The graph and table below do not reflect the deduction of taxes that a shareholder would pay on Fund distributions or redemption of Fund shares. The graph and table below assume reinvestment of dividends and capital gain distributions.
GROWTH OF A HYPOTHETICAL $10,000 INVESTMENT (February 1, 2024 through September 30, 2024)
This graph shows the performance of a hypothetical $10,000 investment in the share class noted over a ten-year period or since inception, if shorter, as compared to the performance of a broad-based securities market index, and, if applicable, one or more indexes that MML Investment Advisers, LLC believes more closely reflects the market segments in which the Fund invests or is a better comparison for the Fund’s investment strategy. This graph includes the deduction of the maximum applicable sales charge, if any.
| MM202912-309770 | PAGE 1 | TSR-AR-IT322 |
The index or indexes shown above are unmanaged, cannot be purchased directly, and, with the exception of any peer group index, do not incur expenses.
AVERAGE ANNUAL TOTAL RETURNS (%) (as of September 30, 2024)
| |
| | Since Inception
(02/01/2024) |
Class A - without sales charge | 1.65 |
Class A - with maximum sales charge | -0.89 |
Bloomberg Municipal Bond Index | 2.82 |
Performance results reflect any applicable waivers or expense limitations in effect during these periods, without which performance would have been lower. The investment return and principal value of shares of the Fund fluctuate, so your shares, when sold, may be worth more or less than their original cost. Current performance of the Fund may be lower or higher than the performance quoted. Performance data current to the most recent month-end may be obtained at https://www.massmutual.com/product-performance/mutual-funds or by calling 1-888-309-3539 or by sending an email request to fundinfo@massmutual.com.
WHAT ARE SOME KEY FUND STATISTICS? (as of September 30, 2024)
| |
Total Net Assets (Millions) | $50.7 |
Total Number of Portfolio Holdings (includes derivative positions, if any) | 30 |
Total Advisory Fees Paid During the Reporting Period | $114,904 |
Portfolio Turnover Rate | 76% |
WHAT DID THE FUND INVEST IN? (as of September 30, 2024)
Derivative values, if any, are excluded from the table(s) below.
| |
Portfolio Characteristics
(% of Total Investments) | |
Municipal Obligations | 100.0% |
| |
Largest States
(% of Total Investments) | |
Texas | 25.8% |
New York | 17.4% |
Illinois | 14.5% |
Pennsylvania | 8.5% |
New Jersey | 7.3% |
Virginia | 5.8% |
Alabama | 5.0% |
Nebraska | 3.2% |
Michigan | 2.6% |
Arizona | 2.3% |
| MM202912-309770 | PAGE 2 | TSR-AR-IT322 |
| |
| WHERE CAN I FIND ADDITIONAL INFORMATION ABOUT THE FUND? |
For additional information about the Fund, including its prospectus, financial information, holdings, and proxy voting information, scan the QR code or visit https://www.massmutual.com/product-performance/mutual-funds. |
| MM202912-309770 | PAGE 3 | TSR-AR-IT322 |
975099111000010282
| | |
MassMutual Clinton Municipal Credit Opportunities Fund | |
| Class I | MMJBX |
| Annual Shareholder Report | September 30, 2024 |
This annual shareholder report contains important information about the MassMutual Clinton Municipal Credit Opportunities Fund (the “Fund”) for the period of February 1, 2024 to September 30, 2024. You can find additional information about the Fund at https://www.massmutual.com/product-performance/mutual-funds. You can also request this information by contacting us at 1-888-309-3539 or by sending an email request to fundinfo@massmutual.com.
WHAT WERE THE FUND COSTS FOR THE LAST YEAR?
This example shows the expenses you would have paid over the past year, based on a hypothetical $10,000 investment. This table reflects any applicable waivers or expense limitations.
| | |
Class Name | Costs of a $10,000 investment1 | Costs paid as a percentage of a $10,000 investment1 |
| Class I | $36 | 0.54% |
| 1 | The expenses shown in this table are for less than a full reporting period. The expenses paid over a full reporting period would be higher. |
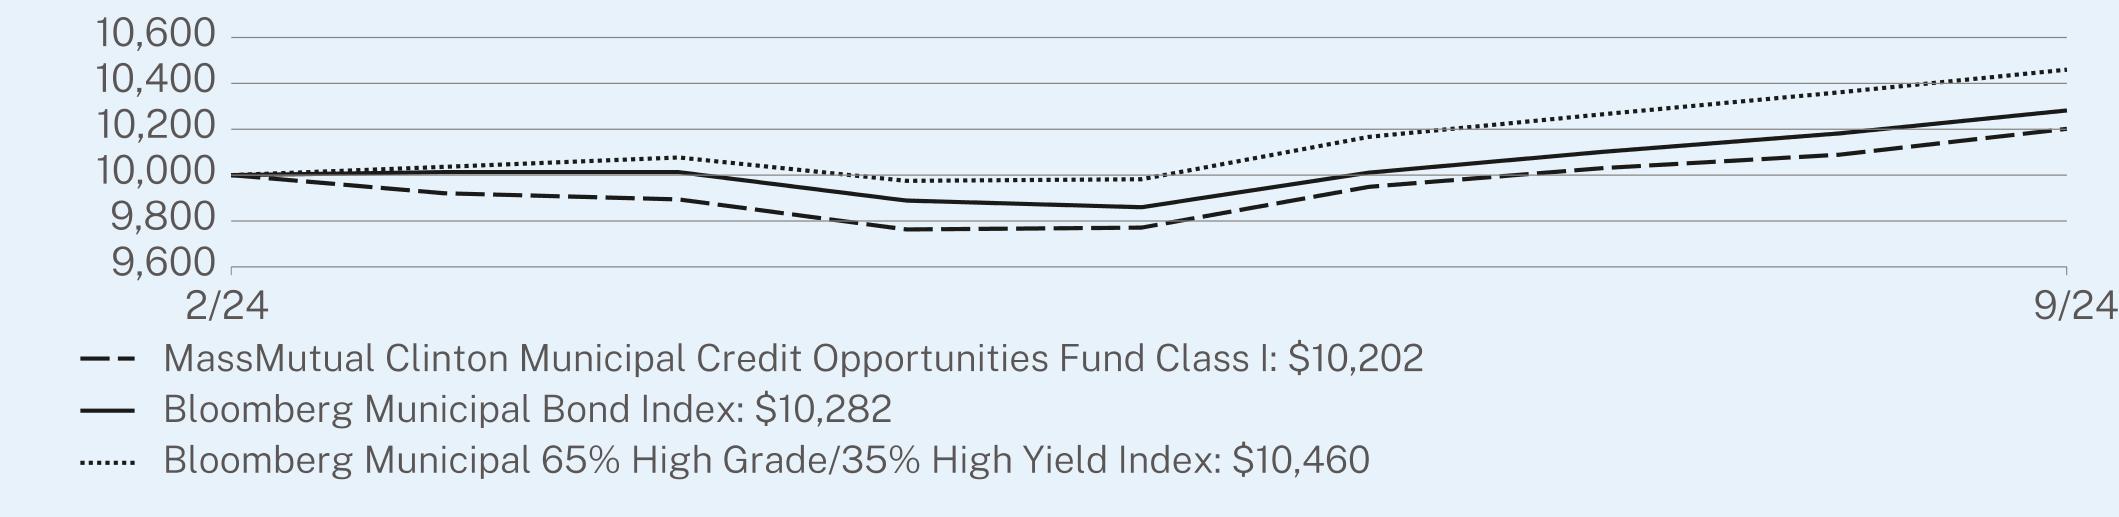
HOW DID THE FUND PERFORM?
The municipal bond market has realized strong gains over the trailing one-year period. The market benefited from sharply lower yields, although much of the decrease occurred in the fourth quarter of 2023. More recently, the third quarter of 2024 was likewise a period of lower market yields, in response to lower inflation data. This led the U.S. Federal Reserve to cut its policy interest rate by 0.50% in September 2024. During the period, the market also benefited from strong demand, driven by greater investor interest due to lower inflation (higher real tax-equivalent yields), desire to access higher yields in the near term against an outlook of lower yields, and a potentially higher tax environment in 2025.
Top contributors to the Fund’s performance relative to the Bloomberg Municipal 65% High Grade/35% High Yield Index:
• Issue selection in municipal bonds within the higher education sector
• Issue selection among municipal toll road issues
Top detractors to the Fund’s performance relative to the Bloomberg Municipal 65% High Grade/35% High Yield Index:
• Selection effect among local authority hospital, lifecare, and other revenue issues
• Interest rate sensitivity including both duration and yield curve effects
Performance shown is past performance and does not guarantee future results. The graph and table below do not reflect the deduction of taxes that a shareholder would pay on Fund distributions or redemption of Fund shares. The graph and table below assume reinvestment of dividends and capital gain distributions.
GROWTH OF A HYPOTHETICAL $10,000 INVESTMENT (February 1, 2024 through September 30, 2024)
This graph shows the performance of a hypothetical $10,000 investment in the share class noted over a ten-year period or since inception, if shorter, as compared to the performance of a broad-based securities market index, and, if applicable, one or more indexes that MML Investment Advisers, LLC believes more closely reflects the market segments in which the Fund invests or is a better comparison for the Fund’s investment strategy. This graph includes the deduction of the maximum applicable sales charge, if any.
| MM202912-309770 | PAGE 1 | TSR-AR-IT336 |
The index or indexes shown above are unmanaged, cannot be purchased directly, and, with the exception of any peer group index, do not incur expenses.
AVERAGE ANNUAL TOTAL RETURNS (%) (as of September 30, 2024)
| |
| | Since Inception
(02/01/2024) |
Class I - without sales charge | 2.02 |
Bloomberg Municipal Bond Index | 3.21 |
Bloomberg Municipal 65% High Grade/35% High Yield Index | 5.07 |
Performance results reflect any applicable waivers or expense limitations in effect during these periods, without which performance would have been lower. The investment return and principal value of shares of the Fund fluctuate, so your shares, when sold, may be worth more or less than their original cost. Current performance of the Fund may be lower or higher than the performance quoted. Performance data current to the most recent month-end may be obtained at https://www.massmutual.com/product-performance/mutual-funds or by calling 1-888-309-3539 or by sending an email request to fundinfo@massmutual.com.
WHAT ARE SOME KEY FUND STATISTICS? (as of September 30, 2024)
| |
Total Net Assets (Millions) | $50.1 |
Total Number of Portfolio Holdings (includes derivative positions, if any) | 30 |
Total Advisory Fees Paid During the Reporting Period | $157,261 |
Portfolio Turnover Rate | 121% |
WHAT DID THE FUND INVEST IN? (as of September 30, 2024)
Derivative values, if any, are excluded from the table(s) below.
| |
Portfolio Characteristics
(% of Total Investments) | |
Municipal Obligations | 100.0% |
| |
Largest States
(% of Total Investments) | |
New York | 29.1% |
Illinois | 16.2% |
Florida | 8.2% |
Colorado | 6.3% |
Pennsylvania | 6.3% |
Alabama | 5.0% |
Tennessee | 4.5% |
Nebraska | 4.4% |
North Carolina | 4.2% |
Texas | 4.1% |
| MM202912-309770 | PAGE 2 | TSR-AR-IT336 |
| |
| WHERE CAN I FIND ADDITIONAL INFORMATION ABOUT THE FUND? |
For additional information about the Fund, including its prospectus, financial information, holdings, and proxy voting information, scan the QR code or visit https://www.massmutual.com/product-performance/mutual-funds. |
| MM202912-309770 | PAGE 3 | TSR-AR-IT336 |
100001020210000102821000010460
| | |
MassMutual Clinton Municipal Credit Opportunities Fund | |
| Class Y | MMJCX |
| Annual Shareholder Report | September 30, 2024 |
This annual shareholder report contains important information about the MassMutual Clinton Municipal Credit Opportunities Fund (the “Fund”) for the period of February 1, 2024 to September 30, 2024. You can find additional information about the Fund at https://www.massmutual.com/product-performance/mutual-funds. You can also request this information by contacting us at 1-888-309-3539 or by sending an email request to fundinfo@massmutual.com.
WHAT WERE THE FUND COSTS FOR THE LAST YEAR?
This example shows the expenses you would have paid over the past year, based on a hypothetical $10,000 investment. This table reflects any applicable waivers or expense limitations.
| | |
Class Name | Costs of a $10,000 investment1 | Costs paid as a percentage of a $10,000 investment1 |
| Class Y | $43 | 0.64% |
| 1 | The expenses shown in this table are for less than a full reporting period. The expenses paid over a full reporting period would be higher. |
HOW DID THE FUND PERFORM?
The municipal bond market has realized strong gains over the trailing one-year period. The market benefited from sharply lower yields, although much of the decrease occurred in the fourth quarter of 2023. More recently, the third quarter of 2024 was likewise a period of lower market yields, in response to lower inflation data. This led the U.S. Federal Reserve to cut its policy interest rate by 0.50% in September 2024. During the period, the market also benefited from strong demand, driven by greater investor interest due to lower inflation (higher real tax-equivalent yields), desire to access higher yields in the near term against an outlook of lower yields, and a potentially higher tax environment in 2025.
Top contributors to the Fund’s performance relative to the Bloomberg Municipal 65% High Grade/35% High Yield Index:
• Issue selection in municipal bonds within the higher education sector
• Issue selection among municipal toll road issues
Top detractors to the Fund’s performance relative to the Bloomberg Municipal 65% High Grade/35% High Yield Index:
• Selection effect among local authority hospital, lifecare, and other revenue issues
• Interest rate sensitivity including both duration and yield curve effects
Performance shown is past performance and does not guarantee future results. The graph and table below do not reflect the deduction of taxes that a shareholder would pay on Fund distributions or redemption of Fund shares. The graph and table below assume reinvestment of dividends and capital gain distributions.
GROWTH OF A HYPOTHETICAL $10,000 INVESTMENT (February 1, 2024 through September 30, 2024)
This graph shows the performance of a hypothetical $10,000 investment in the share class noted over a ten-year period or since inception, if shorter, as compared to the performance of a broad-based securities market index, and, if applicable, one or more indexes that MML Investment Advisers, LLC believes more closely reflects the market segments in which the Fund invests or is a better comparison for the Fund’s investment strategy. This graph includes the deduction of the maximum applicable sales charge, if any.
| MM202912-309770 | PAGE 1 | TSR-AR-IT33Y |
The index or indexes shown above are unmanaged, cannot be purchased directly, and, with the exception of any peer group index, do not incur expenses.
AVERAGE ANNUAL TOTAL RETURNS (%) (as of September 30, 2024)
| |
| | Since Inception
(02/01/2024) |
Class Y - without sales charge | 1.95 |
Bloomberg Municipal Bond Index | 3.21 |
Bloomberg Municipal 65% High Grade/35% High Yield Index | 5.07 |
Performance results reflect any applicable waivers or expense limitations in effect during these periods, without which performance would have been lower. The investment return and principal value of shares of the Fund fluctuate, so your shares, when sold, may be worth more or less than their original cost. Current performance of the Fund may be lower or higher than the performance quoted. Performance data current to the most recent month-end may be obtained at https://www.massmutual.com/product-performance/mutual-funds or by calling 1-888-309-3539 or by sending an email request to fundinfo@massmutual.com.
WHAT ARE SOME KEY FUND STATISTICS? (as of September 30, 2024)
| |
Total Net Assets (Millions) | $50.1 |
Total Number of Portfolio Holdings (includes derivative positions, if any) | 30 |
Total Advisory Fees Paid During the Reporting Period | $157,261 |
Portfolio Turnover Rate | 121% |
WHAT DID THE FUND INVEST IN? (as of September 30, 2024)
Derivative values, if any, are excluded from the table(s) below.
| |
Portfolio Characteristics
(% of Total Investments) | |
Municipal Obligations | 100.0% |
| |
Largest States
(% of Total Investments) | |
New York | 29.1% |
Illinois | 16.2% |
Florida | 8.2% |
Colorado | 6.3% |
Pennsylvania | 6.3% |
Alabama | 5.0% |
Tennessee | 4.5% |
Nebraska | 4.4% |
North Carolina | 4.2% |
Texas | 4.1% |
| MM202912-309770 | PAGE 2 | TSR-AR-IT33Y |
| |
| WHERE CAN I FIND ADDITIONAL INFORMATION ABOUT THE FUND? |
For additional information about the Fund, including its prospectus, financial information, holdings, and proxy voting information, scan the QR code or visit https://www.massmutual.com/product-performance/mutual-funds. |
| MM202912-309770 | PAGE 3 | TSR-AR-IT33Y |
100001019510000102821000010460
| | |
MassMutual Clinton Municipal Credit Opportunities Fund | |
| Class A | MMJAX |
| Annual Shareholder Report | September 30, 2024 |
This annual shareholder report contains important information about the MassMutual Clinton Municipal Credit Opportunities Fund (the “Fund”) for the period of February 1, 2024 to September 30, 2024. You can find additional information about the Fund at https://www.massmutual.com/product-performance/mutual-funds. You can also request this information by contacting us at 1-888-309-3539 or by sending an email request to fundinfo@massmutual.com.
WHAT WERE THE FUND COSTS FOR THE LAST YEAR?
This example shows the expenses you would have paid over the past year, based on a hypothetical $10,000 investment. This table reflects any applicable waivers or expense limitations.
| | |
Class Name | Costs of a $10,000 investment1 | Costs paid as a percentage of a $10,000 investment1 |
| Class A | $59 | 0.89% |
| 1 | The expenses shown in this table are for less than a full reporting period. The expenses paid over a full reporting period would be higher. |
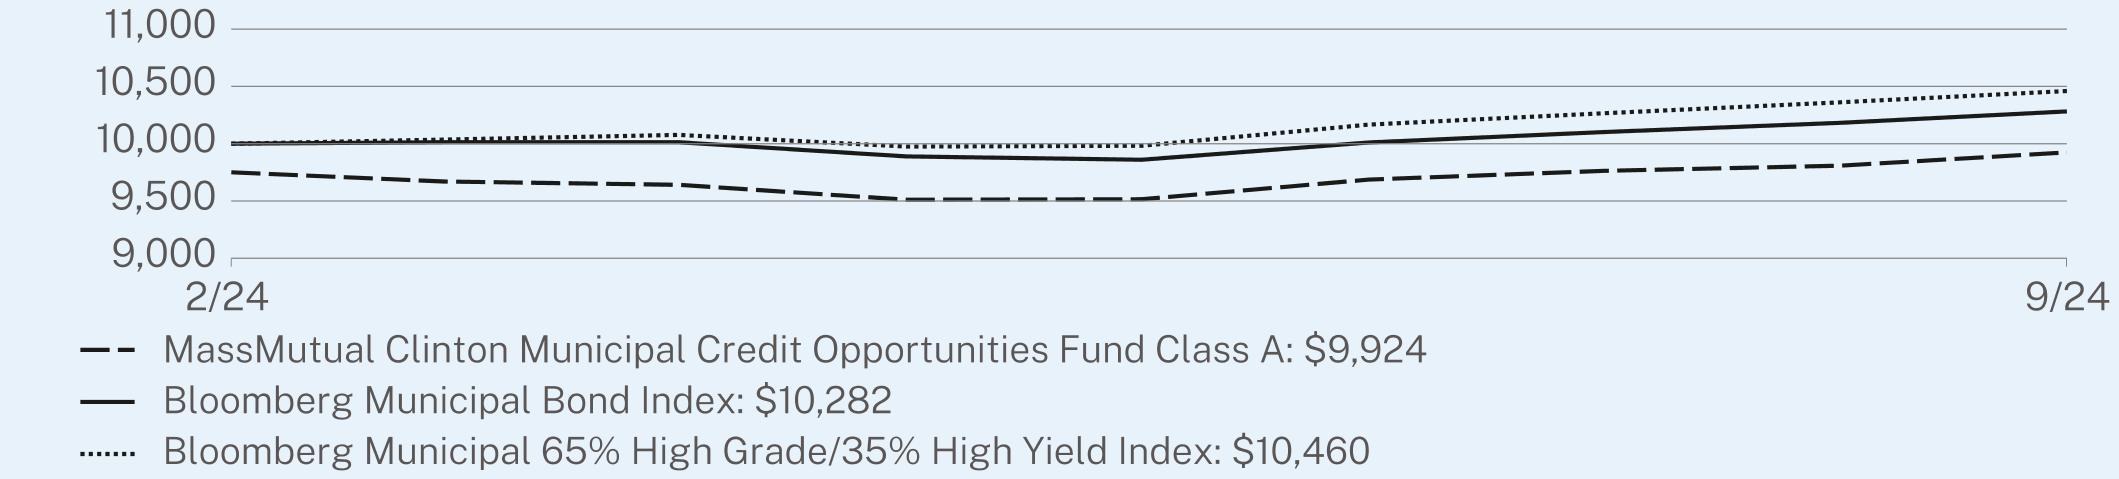
HOW DID THE FUND PERFORM?
The municipal bond market has realized strong gains over the trailing one-year period. The market benefited from sharply lower yields, although much of the decrease occurred in the fourth quarter of 2023. More recently, the third quarter of 2024 was likewise a period of lower market yields, in response to lower inflation data. This led the U.S. Federal Reserve to cut its policy interest rate by 0.50% in September 2024. During the period, the market also benefited from strong demand, driven by greater investor interest due to lower inflation (higher real tax-equivalent yields), desire to access higher yields in the near term against an outlook of lower yields, and a potentially higher tax environment in 2025.
Top contributors to the Fund’s performance relative to the Bloomberg Municipal 65% High Grade/35% High Yield Index:
• Issue selection in municipal bonds within the higher education sector
• Issue selection among municipal toll road issues
Top detractors to the Fund’s performance relative to the Bloomberg Municipal 65% High Grade/35% High Yield Index:
• Selection effect among local authority hospital, lifecare, and other revenue issues
• Interest rate sensitivity including both duration and yield curve effects
Performance shown is past performance and does not guarantee future results. The graph and table below do not reflect the deduction of taxes that a shareholder would pay on Fund distributions or redemption of Fund shares. The graph and table below assume reinvestment of dividends and capital gain distributions.
GROWTH OF A HYPOTHETICAL $10,000 INVESTMENT (February 1, 2024 through September 30, 2024)
This graph shows the performance of a hypothetical $10,000 investment in the share class noted over a ten-year period or since inception, if shorter, as compared to the performance of a broad-based securities market index, and, if applicable, one or more indexes that MML Investment Advisers, LLC believes more closely reflects the market segments in which the Fund invests or is a better comparison for the Fund’s investment strategy. This graph includes the deduction of the maximum applicable sales charge, if any.
| MM202912-309770 | PAGE 1 | TSR-AR-IT332 |
The index or indexes shown above are unmanaged, cannot be purchased directly, and, with the exception of any peer group index, do not incur expenses.
AVERAGE ANNUAL TOTAL RETURNS (%) (as of September 30, 2024)
| |
| | Since Inception
(02/01/2024) |
Class A - without sales charge | 1.78 |
Class A - with maximum sales charge | -0.76 |
Bloomberg Municipal Bond Index | 2.82 |
Bloomberg Municipal 65% High Grade/35% High Yield Index | 4.60 |
Performance results reflect any applicable waivers or expense limitations in effect during these periods, without which performance would have been lower. The investment return and principal value of shares of the Fund fluctuate, so your shares, when sold, may be worth more or less than their original cost. Current performance of the Fund may be lower or higher than the performance quoted. Performance data current to the most recent month-end may be obtained at https://www.massmutual.com/product-performance/mutual-funds or by calling 1-888-309-3539 or by sending an email request to fundinfo@massmutual.com.
WHAT ARE SOME KEY FUND STATISTICS? (as of September 30, 2024)
| |
Total Net Assets (Millions) | $50.1 |
Total Number of Portfolio Holdings (includes derivative positions, if any) | 30 |
Total Advisory Fees Paid During the Reporting Period | $157,261 |
Portfolio Turnover Rate | 121% |
WHAT DID THE FUND INVEST IN? (as of September 30, 2024)
Derivative values, if any, are excluded from the table(s) below.
| |
Portfolio Characteristics
(% of Total Investments) | |
Municipal Obligations | 100.0% |
| |
Largest States
(% of Total Investments) | |
New York | 29.1% |
Illinois | 16.2% |
Florida | 8.2% |
Colorado | 6.3% |
Pennsylvania | 6.3% |
Alabama | 5.0% |
Tennessee | 4.5% |
Nebraska | 4.4% |
North Carolina | 4.2% |
Texas | 4.1% |
| MM202912-309770 | PAGE 2 | TSR-AR-IT332 |
| |
| WHERE CAN I FIND ADDITIONAL INFORMATION ABOUT THE FUND? |
For additional information about the Fund, including its prospectus, financial information, holdings, and proxy voting information, scan the QR code or visit https://www.massmutual.com/product-performance/mutual-funds. |
| MM202912-309770 | PAGE 3 | TSR-AR-IT332 |
9750992410000102821000010460
| | |
MassMutual Global Floating Rate Fund | |
| Class I | BXFIX |
| Annual Shareholder Report | September 30, 2024 |
This annual shareholder report contains important information about the MassMutual Global Floating Rate Fund (the “Fund”) for the period of October 1, 2023 to September 30, 2024. You can find additional information about the Fund at https://www.massmutual.com/product-performance/mutual-funds. You can also request this information by contacting us at 1-888-309-3539 or by sending an email request to fundinfo@massmutual.com.
This report describes changes to the Fund that occurred during the reporting period.
WHAT WERE THE FUND COSTS FOR THE LAST YEAR?
This example shows the expenses you would have paid over the past year, based on a hypothetical $10,000 investment. This table reflects any applicable waivers or expense limitations.
| | |
Class Name | Costs of a $10,000 investment | Costs paid as a percentage of a $10,000 investment |
| Class I | $77 | 0.74% |
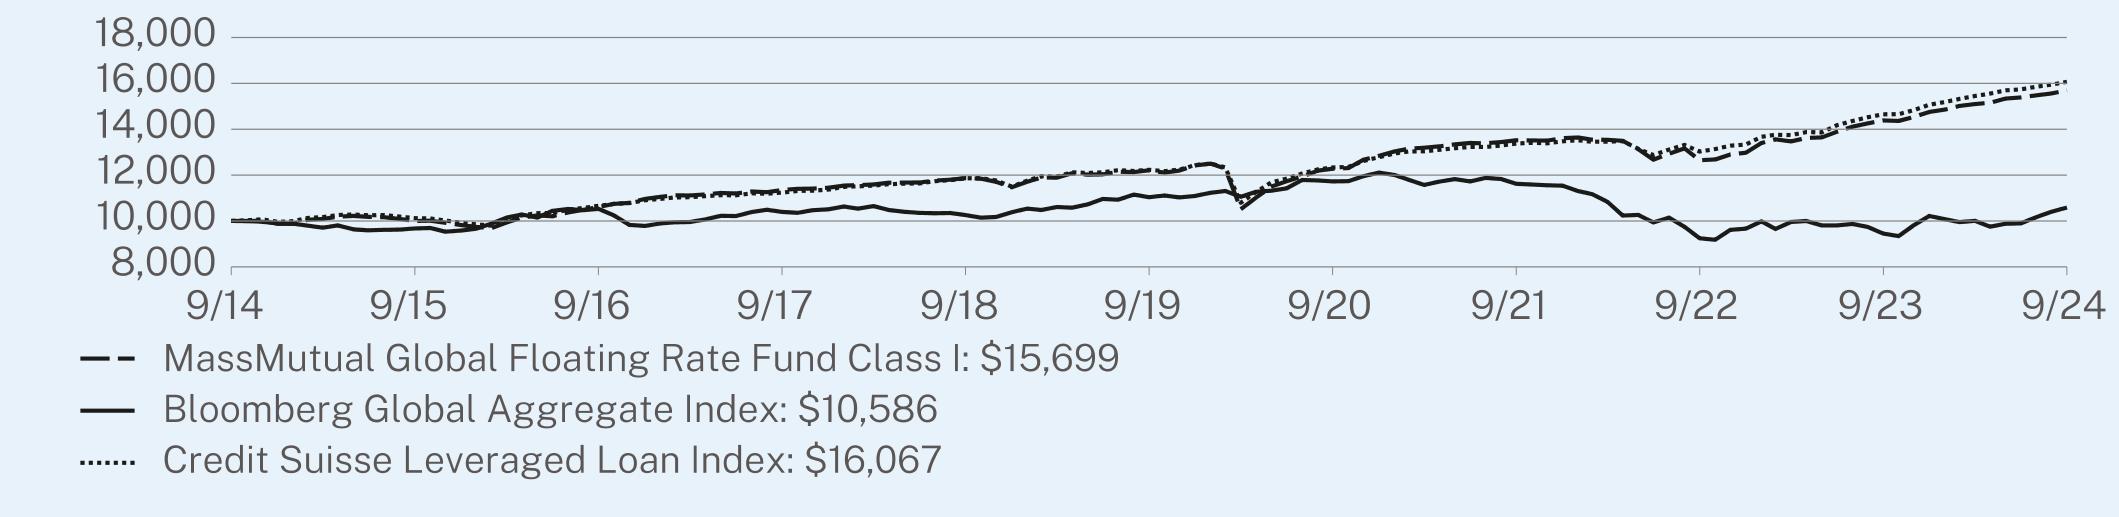
HOW DID THE FUND PERFORM?
Global bond markets were broadly, and strongly, positive for the trailing one-year period. During the period, central banks responded to lower inflation data and began to lower policy interest rates, which was favorable for bond prices and returns. Macroeconomic sentiment centered, particularly more recently, on a soft-landing scenario in the U.S., providing a supportive credit risk environment. During the period, narrowing credit spreads were a positive return driver in the global bond market, in addition to the response to lower bond market yields. This resulted in broad gains across varied market sectors, including government bonds, investment grade and high yield corporate securities, mortgage- and asset-backed instruments, and emerging market issues.
Top contributors to the Fund’s performance relative to the Credit Suisse Leveraged Loan Index:
• The Fund’s investment in U.S. bank loans contributed more than European loans
• Despite the more recent fall in yields, coupon income was additive
• Selection among B and CCC rated loans
Top detractors to the Fund’s performance relative to the Credit Suisse Leveraged Loan Index:
• The Fund’s allocation and selection among European bank loans as U.S. bank loans outperformed
• Cash allocation as the asset class return was strong in the period
Performance shown is past performance and does not guarantee future results. The graph and table below do not reflect the deduction of taxes that a shareholder would pay on Fund distributions or redemption of Fund shares. The graph and table below assume reinvestment of dividends and capital gain distributions.
GROWTH OF A HYPOTHETICAL $10,000 INVESTMENT (October 1, 2014 through September 30, 2024)
This graph shows the performance of a hypothetical $10,000 investment in the share class noted over a ten-year period or since inception, if shorter, as compared to the performance of a broad-based securities market index, and, if applicable, one or more indexes that MML Investment Advisers, LLC believes more closely reflects the market segments in which the Fund invests or is a better comparison for the Fund’s investment strategy. This graph includes the deduction of the maximum applicable sales charge, if any.
| MM202912-309770 | PAGE 1 | TSR-AR-2BCA4 |
The index or indexes shown above are unmanaged, cannot be purchased directly, and, with the exception of any peer group index, do not incur expenses.
AVERAGE ANNUAL TOTAL RETURNS (%) (as of September 30, 2024)
| | | |
| | 1 Year | 5 Year | 10 Year |
Class I - without sales charge | 9.13 | 5.16 | 4.61 |
Bloomberg Global Aggregate Index1 | 11.99 | -0.83 | 0.57 |
Credit Suisse Leveraged Loan Index | 9.65 | 5.60 | 4.86 |
| 1 | Effective July 24, 2024, the Bloomberg Global Aggregate Index replaced the Credit Suisse Leveraged Loan Index as a broad measure of market performance in accordance with new regulatory disclosure requirements. The Fund continues to use the Credit Suisse Leveraged Loan Index as a supplemental benchmark that MML Investment Advisers, LLC believes more closely reflects the market segments in which the Fund invests. |
The Fund is the successor to the Barings Global Floating Rate Fund (the “Predecessor Fund”), a mutual fund with substantially similar investment objectives, policies, and restrictions, as a result of the reorganization of the Predecessor Fund into the Fund on December 13, 2021. The performance provided is that of the Predecessor Fund prior to December 13, 2021, and is that of the Fund after December 13, 2021.
Performance results reflect any applicable waivers or expense limitations in effect during these periods, without which performance would have been lower. The investment return and principal value of shares of the Fund fluctuate, so your shares, when sold, may be worth more or less than their original cost. Current performance of the Fund may be lower or higher than the performance quoted. Performance data current to the most recent month-end may be obtained at https://www.massmutual.com/product-performance/mutual-funds or by calling 1-888-309-3539 or by sending an email request to fundinfo@massmutual.com.
WHAT ARE SOME KEY FUND STATISTICS? (as of September 30, 2024)
| |
Total Net Assets (Millions) | $127.5 |
Total Number of Portfolio Holdings (includes derivative positions, if any) | 253 |
Total Advisory Fees Paid During the Reporting Period | $891,432 |
Portfolio Turnover Rate | 61% |
| MM202912-309770 | PAGE 2 | TSR-AR-2BCA4 |
WHAT DID THE FUND INVEST IN? (as of September 30, 2024)
Derivative values, if any, are excluded from the table(s) below.
| |
Portfolio Characteristics
(% of Total Investments) | |
Bank Loans | 87.7% |
Corporate Debt | 6.3% |
Repurchase Agreement | 5.1% |
Common Stock | 0.9% |
Warrants | 0.0% |
Rights | 0.0% |
| |
Largest Countries
(% of Total Investments) | |
United States | 65.8% |
United Kingdom | 9.4% |
Germany | 4.8% |
France | 2.1% |
Belgium | 2.0% |
Switzerland | 1.6% |
Netherlands | 1.5% |
Sweden | 1.2% |
Canada | 1.1% |
Spain | 1.0% |
HOW HAS THE FUND CHANGED?
The following is a summary of certain changes to the Fund since October 1, 2023. For more complete information, you may review the Fund’s prospectus, including any applicable supplements, at https://www.massmutual.com/product-performance/mutual-funds or upon request at 1-888-309-3539 or fundinfo@massmutual.com.
Effective February 1, 2024, the Class L shares of the Fund were re-named as Class A shares.
Effective February 1, 2024, the maximum front-end sales charge on Class A shares of the Fund increased from 3.00% to 4.25%.
| |
| WHERE CAN I FIND ADDITIONAL INFORMATION ABOUT THE FUND? |
For additional information about the Fund, including its prospectus, financial information, holdings, and proxy voting information, scan the QR code or visit https://www.massmutual.com/product-performance/mutual-funds. |
| MM202912-309770 | PAGE 3 | TSR-AR-2BCA4 |
100001000010611113501186912207122831352012649143861569910000967410528103961025911038117261162092469453105861000010123106651123711863122331233513378130271465216067
| | |
MassMutual Global Floating Rate Fund | |
| Class Y | BXFYX |
| Annual Shareholder Report | September 30, 2024 |
This annual shareholder report contains important information about the MassMutual Global Floating Rate Fund (the “Fund”) for the period of October 1, 2023 to September 30, 2024. You can find additional information about the Fund at https://www.massmutual.com/product-performance/mutual-funds. You can also request this information by contacting us at 1-888-309-3539 or by sending an email request to fundinfo@massmutual.com.
This report describes changes to the Fund that occurred during the reporting period.
WHAT WERE THE FUND COSTS FOR THE LAST YEAR?
This example shows the expenses you would have paid over the past year, based on a hypothetical $10,000 investment. This table reflects any applicable waivers or expense limitations.
| | |
Class Name | Costs of a $10,000 investment | Costs paid as a percentage of a $10,000 investment |
| Class Y | $76 | 0.73% |
HOW DID THE FUND PERFORM?
Global bond markets were broadly, and strongly, positive for the trailing one-year period. During the period, central banks responded to lower inflation data and began to lower policy interest rates, which was favorable for bond prices and returns. Macroeconomic sentiment centered, particularly more recently, on a soft-landing scenario in the U.S., providing a supportive credit risk environment. During the period, narrowing credit spreads were a positive return driver in the global bond market, in addition to the response to lower bond market yields. This resulted in broad gains across varied market sectors, including government bonds, investment grade and high yield corporate securities, mortgage- and asset-backed instruments, and emerging market issues.
Top contributors to the Fund’s performance relative to the Credit Suisse Leveraged Loan Index:
• The Fund’s investment in U.S. bank loans contributed more than European loans
• Despite the more recent fall in yields, coupon income was additive
• Selection among B and CCC rated loans
Top detractors to the Fund’s performance relative to the Credit Suisse Leveraged Loan Index:
• The Fund’s allocation and selection among European bank loans as U.S. bank loans outperformed
• Cash allocation as the asset class return was strong in the period
Performance shown is past performance and does not guarantee future results. The graph and table below do not reflect the deduction of taxes that a shareholder would pay on Fund distributions or redemption of Fund shares. The graph and table below assume reinvestment of dividends and capital gain distributions.
GROWTH OF A HYPOTHETICAL $10,000 INVESTMENT (October 1, 2014 through September 30, 2024)
This graph shows the performance of a hypothetical $10,000 investment in the share class noted over a ten-year period or since inception, if shorter, as compared to the performance of a broad-based securities market index, and, if applicable, one or more indexes that MML Investment Advisers, LLC believes more closely reflects the market segments in which the Fund invests or is a better comparison for the Fund’s investment strategy. This graph includes the deduction of the maximum applicable sales charge, if any.
| MM202912-309770 | PAGE 1 | TSR-AR-2BCAY |
The index or indexes shown above are unmanaged, cannot be purchased directly, and, with the exception of any peer group index, do not incur expenses.
AVERAGE ANNUAL TOTAL RETURNS (%) (as of September 30, 2024)
| | | |
| | 1 Year | 5 Year | 10 Year |
Class Y - without sales charge | 9.22 | 5.17 | 4.60 |
Bloomberg Global Aggregate Index1 | 11.99 | -0.83 | 0.57 |
Credit Suisse Leveraged Loan Index | 9.65 | 5.60 | 4.86 |
| 1 | Effective July 24, 2024, the Bloomberg Global Aggregate Index replaced the Credit Suisse Leveraged Loan Index as a broad measure of market performance in accordance with new regulatory disclosure requirements. The Fund continues to use the Credit Suisse Leveraged Loan Index as a supplemental benchmark that MML Investment Advisers, LLC believes more closely reflects the market segments in which the Fund invests. |
The Fund is the successor to the Barings Global Floating Rate Fund (the “Predecessor Fund”), a mutual fund with substantially similar investment objectives, policies, and restrictions, as a result of the reorganization of the Predecessor Fund into the Fund on December 13, 2021. The performance provided is that of the Predecessor Fund prior to December 13, 2021, and is that of the Fund after December 13, 2021.
Performance results reflect any applicable waivers or expense limitations in effect during these periods, without which performance would have been lower. The investment return and principal value of shares of the Fund fluctuate, so your shares, when sold, may be worth more or less than their original cost. Current performance of the Fund may be lower or higher than the performance quoted. Performance data current to the most recent month-end may be obtained at https://www.massmutual.com/product-performance/mutual-funds or by calling 1-888-309-3539 or by sending an email request to fundinfo@massmutual.com.
WHAT ARE SOME KEY FUND STATISTICS? (as of September 30, 2024)
| |
Total Net Assets (Millions) | $127.5 |
Total Number of Portfolio Holdings (includes derivative positions, if any) | 253 |
Total Advisory Fees Paid During the Reporting Period | $891,432 |
Portfolio Turnover Rate | 61% |
| MM202912-309770 | PAGE 2 | TSR-AR-2BCAY |
WHAT DID THE FUND INVEST IN? (as of September 30, 2024)
Derivative values, if any, are excluded from the table(s) below.
| |
Portfolio Characteristics
(% of Total Investments) | |
Bank Loans | 87.7% |
Corporate Debt | 6.3% |
Repurchase Agreement | 5.1% |
Common Stock | 0.9% |
Warrants | 0.0% |
Rights | 0.0% |
| |
Largest Countries
(% of Total Investments) | |
United States | 65.8% |
United Kingdom | 9.4% |
Germany | 4.8% |
France | 2.1% |
Belgium | 2.0% |
Switzerland | 1.6% |
Netherlands | 1.5% |
Sweden | 1.2% |
Canada | 1.1% |
Spain | 1.0% |
HOW HAS THE FUND CHANGED?
The following is a summary of certain changes to the Fund since October 1, 2023. For more complete information, you may review the Fund’s prospectus, including any applicable supplements, at https://www.massmutual.com/product-performance/mutual-funds or upon request at 1-888-309-3539 or fundinfo@massmutual.com.
Effective February 1, 2024, the Class L shares of the Fund were re-named as Class A shares.
Effective February 1, 2024, the maximum front-end sales charge on Class A shares of the Fund increased from 3.00% to 4.25%.
| |
| WHERE CAN I FIND ADDITIONAL INFORMATION ABOUT THE FUND? |
For additional information about the Fund, including its prospectus, financial information, holdings, and proxy voting information, scan the QR code or visit https://www.massmutual.com/product-performance/mutual-funds. |
| MM202912-309770 | PAGE 3 | TSR-AR-2BCAY |
10000999410603113391185712186122601349412623143561568010000967410528103961025911038117261162092469453105861000010123106651123711863122331233513378130271465216067
| | |
MassMutual Global Floating Rate Fund | |
| Class A | BXFAX |
| Annual Shareholder Report | September 30, 2024 |
This annual shareholder report contains important information about the MassMutual Global Floating Rate Fund (the “Fund”) for the period of October 1, 2023 to September 30, 2024. You can find additional information about the Fund at https://www.massmutual.com/product-performance/mutual-funds. You can also request this information by contacting us at 1-888-309-3539 or by sending an email request to fundinfo@massmutual.com.
This report describes changes to the Fund that occurred during the reporting period.
WHAT WERE THE FUND COSTS FOR THE LAST YEAR?
This example shows the expenses you would have paid over the past year, based on a hypothetical $10,000 investment. This table reflects any applicable waivers or expense limitations.
| | |
Class Name | Costs of a $10,000 investment | Costs paid as a percentage of a $10,000 investment |
| Class A | $102 | 0.98% |
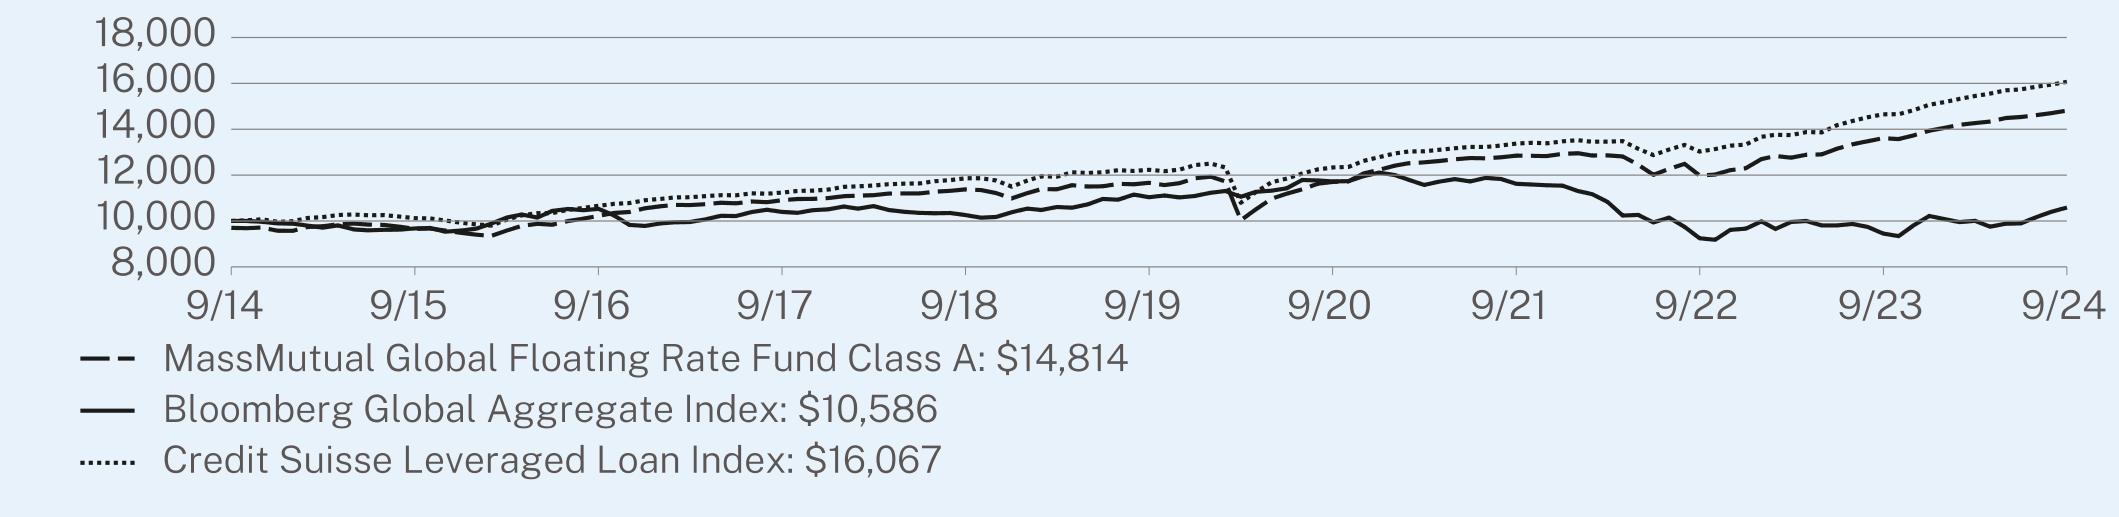
HOW DID THE FUND PERFORM?
Global bond markets were broadly, and strongly, positive for the trailing one-year period. During the period, central banks responded to lower inflation data and began to lower policy interest rates, which was favorable for bond prices and returns. Macroeconomic sentiment centered, particularly more recently, on a soft-landing scenario in the U.S., providing a supportive credit risk environment. During the period, narrowing credit spreads were a positive return driver in the global bond market, in addition to the response to lower bond market yields. This resulted in broad gains across varied market sectors, including government bonds, investment grade and high yield corporate securities, mortgage- and asset-backed instruments, and emerging market issues.
Top contributors to the Fund’s performance relative to the Credit Suisse Leveraged Loan Index:
• The Fund’s investment in U.S. bank loans contributed more than European loans
• Despite the more recent fall in yields, coupon income was additive
• Selection among B and CCC rated loans
Top detractors to the Fund’s performance relative to the Credit Suisse Leveraged Loan Index:
• The Fund’s allocation and selection among European bank loans as U.S. bank loans outperformed
• Cash allocation as the asset class return was strong in the period
Performance shown is past performance and does not guarantee future results. The graph and table below do not reflect the deduction of taxes that a shareholder would pay on Fund distributions or redemption of Fund shares. The graph and table below assume reinvestment of dividends and capital gain distributions.
GROWTH OF A HYPOTHETICAL $10,000 INVESTMENT (October 1, 2014 through September 30, 2024)
This graph shows the performance of a hypothetical $10,000 investment in the share class noted over a ten-year period or since inception, if shorter, as compared to the performance of a broad-based securities market index, and, if applicable, one or more indexes that MML Investment Advisers, LLC believes more closely reflects the market segments in which the Fund invests or is a better comparison for the Fund’s investment strategy. This graph includes the deduction of the maximum applicable sales charge, if any.
| MM202912-309770 | PAGE 1 | TSR-AR-2BCA1 |
The index or indexes shown above are unmanaged, cannot be purchased directly, and, with the exception of any peer group index, do not incur expenses.
AVERAGE ANNUAL TOTAL RETURNS (%) (as of September 30, 2024)
| | | |
| | 1 Year | 5 Year | 10 Year |
Class A - without sales charge | 8.83 | 4.90 | 4.33 |
Class A - with maximum sales charge | 4.60 | 4.26 | 4.01 |
Bloomberg Global Aggregate Index1 | 11.99 | -0.83 | 0.57 |
Credit Suisse Leveraged Loan Index | 9.65 | 5.60 | 4.86 |
| 1 | Effective July 24, 2024, the Bloomberg Global Aggregate Index replaced the Credit Suisse Leveraged Loan Index as a broad measure of market performance in accordance with new regulatory disclosure requirements. The Fund continues to use the Credit Suisse Leveraged Loan Index as a supplemental benchmark that MML Investment Advisers, LLC believes more closely reflects the market segments in which the Fund invests. |
The Fund is the successor to the Barings Global Floating Rate Fund (the “Predecessor Fund”), a mutual fund with substantially similar investment objectives, policies, and restrictions, as a result of the reorganization of the Predecessor Fund into the Fund on December 13, 2021. The performance provided is that of the Predecessor Fund prior to December 13, 2021, and is that of the Fund after December 13, 2021.
Performance results reflect any applicable waivers or expense limitations in effect during these periods, without which performance would have been lower. The investment return and principal value of shares of the Fund fluctuate, so your shares, when sold, may be worth more or less than their original cost. Current performance of the Fund may be lower or higher than the performance quoted. Performance data current to the most recent month-end may be obtained at https://www.massmutual.com/product-performance/mutual-funds or by calling 1-888-309-3539 or by sending an email request to fundinfo@massmutual.com.
WHAT ARE SOME KEY FUND STATISTICS? (as of September 30, 2024)
| |
Total Net Assets (Millions) | $127.5 |
Total Number of Portfolio Holdings (includes derivative positions, if any) | 253 |
Total Advisory Fees Paid During the Reporting Period | $891,432 |
Portfolio Turnover Rate | 61% |
| MM202912-309770 | PAGE 2 | TSR-AR-2BCA1 |
WHAT DID THE FUND INVEST IN? (as of September 30, 2024)
Derivative values, if any, are excluded from the table(s) below.
| |
Portfolio Characteristics
(% of Total Investments) | |
Bank Loans | 87.7% |
Corporate Debt | 6.3% |
Repurchase Agreement | 5.1% |
Common Stock | 0.9% |
Warrants | 0.0% |
Rights | 0.0% |
| |
Largest Countries
(% of Total Investments) | |
United States | 65.8% |
United Kingdom | 9.4% |
Germany | 4.8% |
France | 2.1% |
Belgium | 2.0% |
Switzerland | 1.6% |
Netherlands | 1.5% |
Sweden | 1.2% |
Canada | 1.1% |
Spain | 1.0% |
HOW HAS THE FUND CHANGED?
The following is a summary of certain changes to the Fund since October 1, 2023. For more complete information, you may review the Fund’s prospectus, including any applicable supplements, at https://www.massmutual.com/product-performance/mutual-funds or upon request at 1-888-309-3539 or fundinfo@massmutual.com.
Effective February 1, 2024, the Class L shares of the Fund were re-named as Class A shares.
Effective February 1, 2024, the maximum front-end sales charge on Class A shares of the Fund increased from 3.00% to 4.25%.
| |
| WHERE CAN I FIND ADDITIONAL INFORMATION ABOUT THE FUND? |
For additional information about the Fund, including its prospectus, financial information, holdings, and proxy voting information, scan the QR code or visit https://www.massmutual.com/product-performance/mutual-funds. |
| MM202912-309770 | PAGE 3 | TSR-AR-2BCA1 |
9700966010223109081137811664117051285011982136121481410000967410528103961025911038117261162092469453105861000010123106651123711863122331233513378130271465216067
| | |
MassMutual Global Floating Rate Fund | |
| Class C | BXFCX |
| Annual Shareholder Report | September 30, 2024 |
This annual shareholder report contains important information about the MassMutual Global Floating Rate Fund (the “Fund”) for the period of October 1, 2023 to September 30, 2024. You can find additional information about the Fund at https://www.massmutual.com/product-performance/mutual-funds. You can also request this information by contacting us at 1-888-309-3539 or by sending an email request to fundinfo@massmutual.com.
This report describes changes to the Fund that occurred during the reporting period.
WHAT WERE THE FUND COSTS FOR THE LAST YEAR?
This example shows the expenses you would have paid over the past year, based on a hypothetical $10,000 investment. This table reflects any applicable waivers or expense limitations.
| | |
Class Name | Costs of a $10,000 investment | Costs paid as a percentage of a $10,000 investment |
| Class C | $180 | 1.73% |
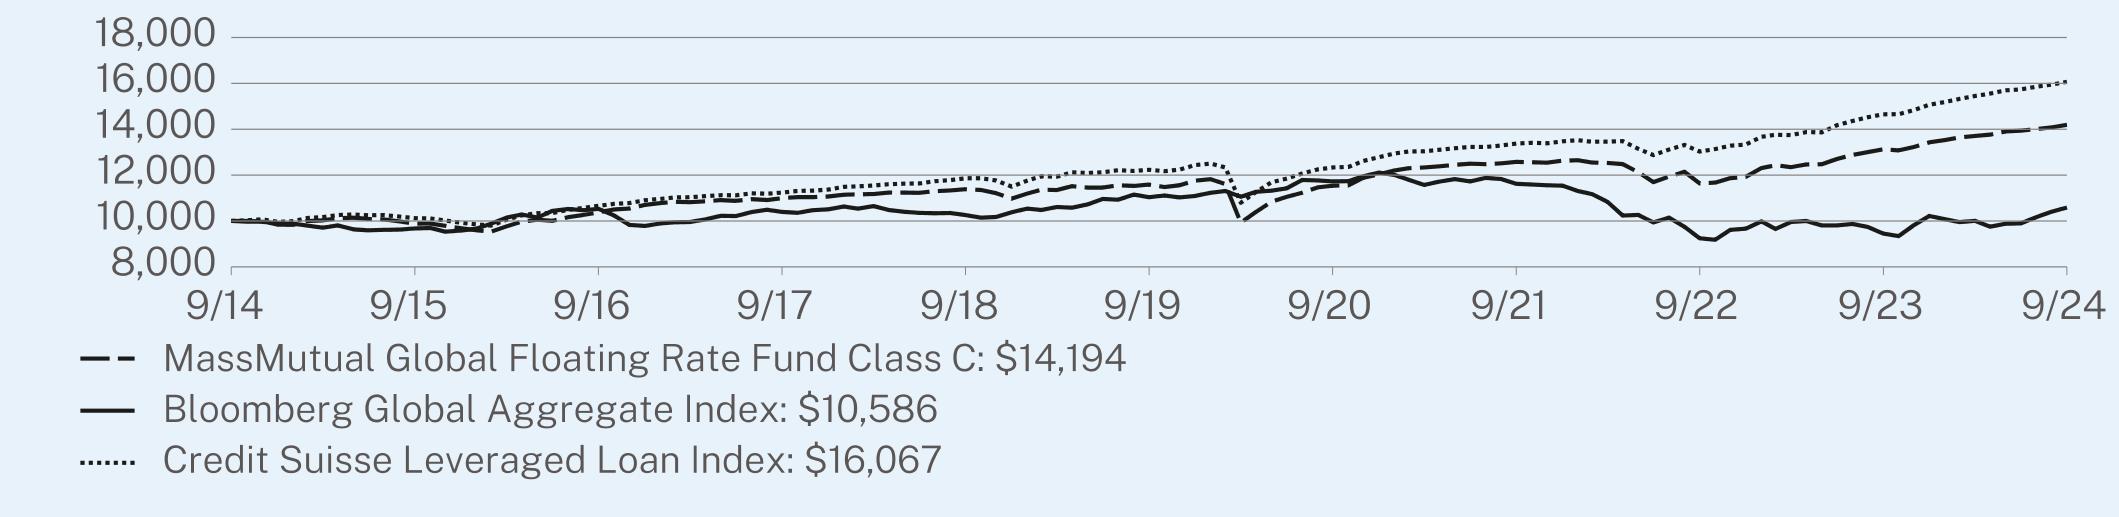
HOW DID THE FUND PERFORM?
Global bond markets were broadly, and strongly, positive for the trailing one-year period. During the period, central banks responded to lower inflation data and began to lower policy interest rates, which was favorable for bond prices and returns. Macroeconomic sentiment centered, particularly more recently, on a soft-landing scenario in the U.S., providing a supportive credit risk environment. During the period, narrowing credit spreads were a positive return driver in the global bond market, in addition to the response to lower bond market yields. This resulted in broad gains across varied market sectors, including government bonds, investment grade and high yield corporate securities, mortgage- and asset-backed instruments, and emerging market issues.
Top contributors to the Fund’s performance relative to the Credit Suisse Leveraged Loan Index:
• The Fund’s investment in U.S. bank loans contributed more than European loans
• Despite the more recent fall in yields, coupon income was additive
• Selection among B and CCC rated loans
Top detractors to the Fund’s performance relative to the Credit Suisse Leveraged Loan Index:
• The Fund’s allocation and selection among European bank loans as U.S. bank loans outperformed
• Cash allocation as the asset class return was strong in the period
Performance shown is past performance and does not guarantee future results. The graph and table below do not reflect the deduction of taxes that a shareholder would pay on Fund distributions or redemption of Fund shares. The graph and table below assume reinvestment of dividends and capital gain distributions.
GROWTH OF A HYPOTHETICAL $10,000 INVESTMENT (October 1, 2014 through September 30, 2024)
This graph shows the performance of a hypothetical $10,000 investment in the share class noted over a ten-year period or since inception, if shorter, as compared to the performance of a broad-based securities market index, and, if applicable, one or more indexes that MML Investment Advisers, LLC believes more closely reflects the market segments in which the Fund invests or is a better comparison for the Fund’s investment strategy. This graph includes the deduction of the maximum applicable sales charge, if any.
| MM202912-309770 | PAGE 1 | TSR-AR-2BCA3 |
The index or indexes shown above are unmanaged, cannot be purchased directly, and, with the exception of any peer group index, do not incur expenses.
AVERAGE ANNUAL TOTAL RETURNS (%) (as of September 30, 2024)
| | | |
| | 1 Year | 5 Year | 10 Year |
Class C - without sales charge | 8.14 | 4.14 | 3.56 |
Class C - with maximum sales charge | 7.14 | 4.14 | 3.56 |
Bloomberg Global Aggregate Index1 | 11.99 | -0.83 | 0.57 |
Credit Suisse Leveraged Loan Index | 9.65 | 5.60 | 4.86 |
| 1 | Effective July 24, 2024, the Bloomberg Global Aggregate Index replaced the Credit Suisse Leveraged Loan Index as a broad measure of market performance in accordance with new regulatory disclosure requirements. The Fund continues to use the Credit Suisse Leveraged Loan Index as a supplemental benchmark that MML Investment Advisers, LLC believes more closely reflects the market segments in which the Fund invests. |
The Fund is the successor to the Barings Global Floating Rate Fund (the “Predecessor Fund”), a mutual fund with substantially similar investment objectives, policies, and restrictions, as a result of the reorganization of the Predecessor Fund into the Fund on December 13, 2021. The performance provided is that of the Predecessor Fund prior to December 13, 2021, and is that of the Fund after December 13, 2021.
Performance results reflect any applicable waivers or expense limitations in effect during these periods, without which performance would have been lower. The investment return and principal value of shares of the Fund fluctuate, so your shares, when sold, may be worth more or less than their original cost. Current performance of the Fund may be lower or higher than the performance quoted. Performance data current to the most recent month-end may be obtained at https://www.massmutual.com/product-performance/mutual-funds or by calling 1-888-309-3539 or by sending an email request to fundinfo@massmutual.com.
WHAT ARE SOME KEY FUND STATISTICS? (as of September 30, 2024)
| |
Total Net Assets (Millions) | $127.5 |
Total Number of Portfolio Holdings (includes derivative positions, if any) | 253 |
Total Advisory Fees Paid During the Reporting Period | $891,432 |
Portfolio Turnover Rate | 61% |
| MM202912-309770 | PAGE 2 | TSR-AR-2BCA3 |
WHAT DID THE FUND INVEST IN? (as of September 30, 2024)
Derivative values, if any, are excluded from the table(s) below.
| |
Portfolio Characteristics
(% of Total Investments) | |
Bank Loans | 87.7% |
Corporate Debt | 6.3% |
Repurchase Agreement | 5.1% |
Common Stock | 0.9% |
Warrants | 0.0% |
Rights | 0.0% |
| |
Largest Countries
(% of Total Investments) | |
United States | 65.8% |
United Kingdom | 9.4% |
Germany | 4.8% |
France | 2.1% |
Belgium | 2.0% |
Switzerland | 1.6% |
Netherlands | 1.5% |
Sweden | 1.2% |
Canada | 1.1% |
Spain | 1.0% |
HOW HAS THE FUND CHANGED?
The following is a summary of certain changes to the Fund since October 1, 2023. For more complete information, you may review the Fund’s prospectus, including any applicable supplements, at https://www.massmutual.com/product-performance/mutual-funds or upon request at 1-888-309-3539 or fundinfo@massmutual.com.
Effective February 1, 2024, the Class L shares of the Fund were re-named as Class A shares.
Effective February 1, 2024, the maximum front-end sales charge on Class A shares of the Fund increased from 3.00% to 4.25%.
| |
| WHERE CAN I FIND ADDITIONAL INFORMATION ABOUT THE FUND? |
For additional information about the Fund, including its prospectus, financial information, holdings, and proxy voting information, scan the QR code or visit https://www.massmutual.com/product-performance/mutual-funds. |
| MM202912-309770 | PAGE 3 | TSR-AR-2BCA3 |
10000988510380109971138611586115401257811639131261419410000967410528103961025911038117261162092469453105861000010123106651123711863122331233513378130271465216067
| | |
MassMutual Global Credit Income Opportunities Fund | |
| Class I | BXITX |
| Annual Shareholder Report | September 30, 2024 |
This annual shareholder report contains important information about the MassMutual Global Credit Income Opportunities Fund (the “Fund”) for the period of October 1, 2023 to September 30, 2024. You can find additional information about the Fund at https://www.massmutual.com/product-performance/mutual-funds. You can also request this information by contacting us at 1-888-309-3539 or by sending an email request to fundinfo@massmutual.com.
This report describes changes to the Fund that occurred during the reporting period.
WHAT WERE THE FUND COSTS FOR THE LAST YEAR?
This example shows the expenses you would have paid over the past year, based on a hypothetical $10,000 investment. This table reflects any applicable waivers or expense limitations.
| | |
Class Name | Costs of a $10,000 investment | Costs paid as a percentage of a $10,000 investment |
| Class I | $90 | 0.85% |
HOW DID THE FUND PERFORM?
Global bond markets were broadly, and strongly, positive for the trailing one-year period. During the period, central banks responded to lower inflation data and began to lower policy interest rates, which was favorable for bond prices and returns. Macroeconomic sentiment centered, particularly more recently, on a soft-landing scenario in the U.S., providing a supportive credit risk environment. During the period, narrowing credit spreads were a positive return driver in the global bond market, in addition to the response to lower bond market yields. This resulted in broad gains across varied market sectors, including government bonds, investment grade and high yield corporate securities, mortgage- and asset-backed instruments, and emerging market issues.
Top contributors to the Fund’s performance relative to the FTSE 3 Month US T Bill Index + 500 bps:
• Interest rate sensitivity aided absolute and relative return
• Corporate high yield allocation, given higher returns in the class compared to other asset classes
Top detractors to the Fund’s performance relative to the FTSE 3 Month US T Bill Index + 500 bps:
• Bank loan allocation as high yield bonds outperformed
• Allocation to lower-returning technology sector
Performance shown is past performance and does not guarantee future results. The graph and table below do not reflect the deduction of taxes that a shareholder would pay on Fund distributions or redemption of Fund shares. The graph and table below assume reinvestment of dividends and capital gain distributions.
GROWTH OF A HYPOTHETICAL $10,000 INVESTMENT (October 1, 2014 through September 30, 2024)
This graph shows the performance of a hypothetical $10,000 investment in the share class noted over a ten-year period or since inception, if shorter, as compared to the performance of a broad-based securities market index, and, if applicable, one or more indexes that MML Investment Advisers, LLC believes more closely reflects the market segments in which the Fund invests or is a better comparison for the Fund’s investment strategy. This graph includes the deduction of the maximum applicable sales charge, if any.
| MM202912-309770 | PAGE 1 | TSR-AR-2BCB4 |
The index or indexes shown above are unmanaged, cannot be purchased directly, and, with the exception of any peer group index, do not incur expenses.
AVERAGE ANNUAL TOTAL RETURNS (%) (as of September 30, 2024)
| | | |
| | 1 Year | 5 Year | 10 Year |
Class I - without sales charge | 12.45 | 4.42 | 4.38 |
Bloomberg Global Aggregate Index1 | 11.99 | -0.83 | 0.57 |
FTSE 3 Month US T Bill Index + 500 bps1 | 10.93 | 7.51 | 6.75 |
Bloomberg Multiverse Index | 12.25 | -0.63 | 0.74 |
| 1 | Effective July 24, 2024, the Bloomberg Global Aggregate Index replaced the Bloomberg Multiverse Index as a broad measure of market performance in accordance with new regulatory disclosure requirements. |
The Fund is the successor to the Barings Global Credit Income Opportunities Fund (the “Predecessor Fund”), a mutual fund with substantially similar investment objectives, policies, and restrictions, as a result of the reorganization of the Predecessor Fund into the Fund on December 13, 2021. The performance provided is that of the Predecessor Fund prior to December 13, 2021, and is that of the Fund after December 13, 2021.
Performance results reflect any applicable waivers or expense limitations in effect during these periods, without which performance would have been lower. The investment return and principal value of shares of the Fund fluctuate, so your shares, when sold, may be worth more or less than their original cost. Current performance of the Fund may be lower or higher than the performance quoted. Performance data current to the most recent month-end may be obtained at https://www.massmutual.com/product-performance/mutual-funds or by calling 1-888-309-3539 or by sending an email request to fundinfo@massmutual.com.
WHAT ARE SOME KEY FUND STATISTICS? (as of September 30, 2024)
| |
Total Net Assets (Millions) | $148.3 |
Total Number of Portfolio Holdings (includes derivative positions, if any) | 451 |
Total Advisory Fees Paid During the Reporting Period | $972,880 |
Portfolio Turnover Rate | 62% |
| MM202912-309770 | PAGE 2 | TSR-AR-2BCB4 |
WHAT DID THE FUND INVEST IN? (as of September 30, 2024)
Derivative values, if any, are excluded from the table(s) below.
| |
Portfolio Characteristics
(% of Total Investments) | |
Bank Loans | 48.8% |
Corporate Debt | 33.4% |
Repurchase Agreement | 10.9% |
Non-U.S. Government Agency Obligations | 4.6% |
Investment of Cash Collateral from Securities Loaned | 1.7% |
Common Stock | 0.4% |
Sovereign Debt Obligations | 0.2% |
Warrants | 0.0% |
Rights | 0.0% |
| |
Largest Countries
(% of Total Investments) | |
United States | 48.0% |
United Kingdom | 9.8% |
Germany | 4.0% |
Spain | 3.2% |
Netherlands | 2.5% |
Ireland | 2.4% |
France | 2.4% |
Cayman Islands | 2.1% |
Luxembourg | 1.8% |
Belgium | 1.3% |
HOW HAS THE FUND CHANGED?
The following is a summary of certain changes to the Fund since October 1, 2023. For more complete information, you may review the Fund’s prospectus, including any applicable supplements, at https://www.massmutual.com/product-performance/mutual-funds or upon request at 1-888-309-3539 or fundinfo@massmutual.com.
Effective February 1, 2024, the Class L shares of the Fund were re-named as Class A shares.
Effective February 1, 2024, the maximum front-end sales charge on Class A shares of the Fund increased from 4.00% to 4.25%.
| |
| WHERE CAN I FIND ADDITIONAL INFORMATION ABOUT THE FUND? |
For additional information about the Fund, including its prospectus, financial information, holdings, and proxy voting information, scan the QR code or visit https://www.massmutual.com/product-performance/mutual-funds. |
| MM202912-309770 | PAGE 3 | TSR-AR-2BCB4 |
100009879106431171812145123671229714029121731365515355100009674105281039610259110381172611620924694531058610000105021105011677124531338414198149161576017327192201000096441053410474103361111511781117289341959310768
| | |
MassMutual Global Credit Income Opportunities Fund | |
| Class Y | BXIYX |
| Annual Shareholder Report | September 30, 2024 |
This annual shareholder report contains important information about the MassMutual Global Credit Income Opportunities Fund (the “Fund”) for the period of October 1, 2023 to September 30, 2024. You can find additional information about the Fund at https://www.massmutual.com/product-performance/mutual-funds. You can also request this information by contacting us at 1-888-309-3539 or by sending an email request to fundinfo@massmutual.com.
This report describes changes to the Fund that occurred during the reporting period.
WHAT WERE THE FUND COSTS FOR THE LAST YEAR?
This example shows the expenses you would have paid over the past year, based on a hypothetical $10,000 investment. This table reflects any applicable waivers or expense limitations.
| | |
Class Name | Costs of a $10,000 investment | Costs paid as a percentage of a $10,000 investment |
| Class Y | $96 | 0.90% |
HOW DID THE FUND PERFORM?
Global bond markets were broadly, and strongly, positive for the trailing one-year period. During the period, central banks responded to lower inflation data and began to lower policy interest rates, which was favorable for bond prices and returns. Macroeconomic sentiment centered, particularly more recently, on a soft-landing scenario in the U.S., providing a supportive credit risk environment. During the period, narrowing credit spreads were a positive return driver in the global bond market, in addition to the response to lower bond market yields. This resulted in broad gains across varied market sectors, including government bonds, investment grade and high yield corporate securities, mortgage- and asset-backed instruments, and emerging market issues.
Top contributors to the Fund’s performance relative to the FTSE 3 Month US T Bill Index + 500 bps:
• Interest rate sensitivity aided absolute and relative return
• Corporate high yield allocation, given higher returns in the class compared to other asset classes
Top detractors to the Fund’s performance relative to the FTSE 3 Month US T Bill Index + 500 bps:
• Bank loan allocation as high yield bonds outperformed
• Allocation to lower-returning technology sector
Performance shown is past performance and does not guarantee future results. The graph and table below do not reflect the deduction of taxes that a shareholder would pay on Fund distributions or redemption of Fund shares. The graph and table below assume reinvestment of dividends and capital gain distributions.
GROWTH OF A HYPOTHETICAL $10,000 INVESTMENT (October 1, 2014 through September 30, 2024)
This graph shows the performance of a hypothetical $10,000 investment in the share class noted over a ten-year period or since inception, if shorter, as compared to the performance of a broad-based securities market index, and, if applicable, one or more indexes that MML Investment Advisers, LLC believes more closely reflects the market segments in which the Fund invests or is a better comparison for the Fund’s investment strategy. This graph includes the deduction of the maximum applicable sales charge, if any.
| MM202912-309770 | PAGE 1 | TSR-AR-2BCBY |
The index or indexes shown above are unmanaged, cannot be purchased directly, and, with the exception of any peer group index, do not incur expenses.
AVERAGE ANNUAL TOTAL RETURNS (%) (as of September 30, 2024)
| | | |
| | 1 Year | 5 Year | 10 Year |
Class Y - without sales charge | 12.40 | 4.40 | 4.37 |
Bloomberg Global Aggregate Index1 | 11.99 | -0.83 | 0.57 |
FTSE 3 Month US T Bill Index + 500 bps | 10.93 | 7.51 | 6.75 |
Bloomberg Multiverse Index | 12.25 | -0.63 | 0.74 |
| 1 | Effective July 24, 2024, the Bloomberg Global Aggregate Index replaced the Bloomberg Multiverse Index as a broad measure of market performance in accordance with new regulatory disclosure requirements. |
The Fund is the successor to the Barings Global Credit Income Opportunities Fund (the “Predecessor Fund”), a mutual fund with substantially similar investment objectives, policies, and restrictions, as a result of the reorganization of the Predecessor Fund into the Fund on December 13, 2021. The performance provided is that of the Predecessor Fund prior to December 13, 2021, and is that of the Fund after December 13, 2021.
Performance results reflect any applicable waivers or expense limitations in effect during these periods, without which performance would have been lower. The investment return and principal value of shares of the Fund fluctuate, so your shares, when sold, may be worth more or less than their original cost. Current performance of the Fund may be lower or higher than the performance quoted. Performance data current to the most recent month-end may be obtained at https://www.massmutual.com/product-performance/mutual-funds or by calling 1-888-309-3539 or by sending an email request to fundinfo@massmutual.com.
WHAT ARE SOME KEY FUND STATISTICS? (as of September 30, 2024)
| |
Total Net Assets (Millions) | $148.3 |
Total Number of Portfolio Holdings (includes derivative positions, if any) | 451 |
Total Advisory Fees Paid During the Reporting Period | $972,880 |
Portfolio Turnover Rate | 62% |
| MM202912-309770 | PAGE 2 | TSR-AR-2BCBY |
WHAT DID THE FUND INVEST IN? (as of September 30, 2024)
Derivative values, if any, are excluded from the table(s) below.
| |
Portfolio Characteristics
(% of Total Investments) | |
Bank Loans | 48.8% |
Corporate Debt | 33.4% |
Repurchase Agreement | 10.9% |
Non-U.S. Government Agency Obligations | 4.6% |
Investment of Cash Collateral from Securities Loaned | 1.7% |
Common Stock | 0.4% |
Sovereign Debt Obligations | 0.2% |
Warrants | 0.0% |
Rights | 0.0% |
| |
Largest Countries
(% of Total Investments) | |
United States | 48.0% |
United Kingdom | 9.8% |
Germany | 4.0% |
Spain | 3.2% |
Netherlands | 2.5% |
Ireland | 2.4% |
France | 2.4% |
Cayman Islands | 2.1% |
Luxembourg | 1.8% |
Belgium | 1.3% |
HOW HAS THE FUND CHANGED?
The following is a summary of certain changes to the Fund since October 1, 2023. For more complete information, you may review the Fund’s prospectus, including any applicable supplements, at https://www.massmutual.com/product-performance/mutual-funds or upon request at 1-888-309-3539 or fundinfo@massmutual.com.
Effective February 1, 2024, the Class L shares of the Fund were re-named as Class A shares.
Effective February 1, 2024, the maximum front-end sales charge on Class A shares of the Fund increased from 4.00% to 4.25%.
| |
| WHERE CAN I FIND ADDITIONAL INFORMATION ABOUT THE FUND? |
For additional information about the Fund, including its prospectus, financial information, holdings, and proxy voting information, scan the QR code or visit https://www.massmutual.com/product-performance/mutual-funds. |
| MM202912-309770 | PAGE 3 | TSR-AR-2BCBY |
100009879106431171812144123651229514027121671364115333100009674105281039610259110381172611620924694531058610000105021105011677124531338414198149161576017327192201000096441053410474103361111511781117289341959310768
| | |
MassMutual Global Credit Income Opportunities Fund | |
| Class A | BXIAX |
| Annual Shareholder Report | September 30, 2024 |
This annual shareholder report contains important information about the MassMutual Global Credit Income Opportunities Fund (the “Fund”) for the period of October 1, 2023 to September 30, 2024. You can find additional information about the Fund at https://www.massmutual.com/product-performance/mutual-funds. You can also request this information by contacting us at 1-888-309-3539 or by sending an email request to fundinfo@massmutual.com.
This report describes changes to the Fund that occurred during the reporting period.
WHAT WERE THE FUND COSTS FOR THE LAST YEAR?
This example shows the expenses you would have paid over the past year, based on a hypothetical $10,000 investment. This table reflects any applicable waivers or expense limitations.
| | |
Class Name | Costs of a $10,000 investment | Costs paid as a percentage of a $10,000 investment |
| Class A | $123 | 1.16% |
HOW DID THE FUND PERFORM?
Global bond markets were broadly, and strongly, positive for the trailing one-year period. During the period, central banks responded to lower inflation data and began to lower policy interest rates, which was favorable for bond prices and returns. Macroeconomic sentiment centered, particularly more recently, on a soft-landing scenario in the U.S., providing a supportive credit risk environment. During the period, narrowing credit spreads were a positive return driver in the global bond market, in addition to the response to lower bond market yields. This resulted in broad gains across varied market sectors, including government bonds, investment grade and high yield corporate securities, mortgage- and asset-backed instruments, and emerging market issues.
Top contributors to the Fund’s performance relative to the FTSE 3 Month US T Bill Index + 500 bps:
• Interest rate sensitivity aided absolute and relative return
• Corporate high yield allocation, given higher returns in the class compared to other asset classes
Top detractors to the Fund’s performance relative to the FTSE 3 Month US T Bill Index + 500 bps:
• Bank loan allocation as high yield bonds outperformed
• Allocation to lower-returning technology sector
Performance shown is past performance and does not guarantee future results. The graph and table below do not reflect the deduction of taxes that a shareholder would pay on Fund distributions or redemption of Fund shares. The graph and table below assume reinvestment of dividends and capital gain distributions.
GROWTH OF A HYPOTHETICAL $10,000 INVESTMENT (October 1, 2014 through September 30, 2024)
This graph shows the performance of a hypothetical $10,000 investment in the share class noted over a ten-year period or since inception, if shorter, as compared to the performance of a broad-based securities market index, and, if applicable, one or more indexes that MML Investment Advisers, LLC believes more closely reflects the market segments in which the Fund invests or is a better comparison for the Fund’s investment strategy. This graph includes the deduction of the maximum applicable sales charge, if any.
| MM202912-309770 | PAGE 1 | TSR-AR-2BCB1 |
The index or indexes shown above are unmanaged, cannot be purchased directly, and, with the exception of any peer group index, do not incur expenses.
AVERAGE ANNUAL TOTAL RETURNS (%) (as of September 30, 2024)
| | | |
| | 1 Year | 5 Year | 10 Year |
Class A - without sales charge | 12.12 | 4.13 | 4.11 |
Class A - with maximum sales charge | 6.68 | 3.29 | 3.71 |
Bloomberg Global Aggregate Index1 | 11.99 | -0.83 | 0.57 |
FTSE 3 Month US T Bill Index + 500 bps | 10.93 | 7.51 | 6.75 |
Bloomberg Multiverse Index | 12.25 | -0.63 | 0.74 |
| 1 | Effective July 24, 2024, the Bloomberg Global Aggregate Index replaced the Bloomberg Multiverse Index as a broad measure of market performance in accordance with new regulatory disclosure requirements. |
The Fund is the successor to the Barings Global Credit Income Opportunities Fund (the “Predecessor Fund”), a mutual fund with substantially similar investment objectives, policies, and restrictions, as a result of the reorganization of the Predecessor Fund into the Fund on December 13, 2021. The performance provided is that of the Predecessor Fund prior to December 13, 2021, and is that of the Fund after December 13, 2021.
Performance results reflect any applicable waivers or expense limitations in effect during these periods, without which performance would have been lower. The investment return and principal value of shares of the Fund fluctuate, so your shares, when sold, may be worth more or less than their original cost. Current performance of the Fund may be lower or higher than the performance quoted. Performance data current to the most recent month-end may be obtained at https://www.massmutual.com/product-performance/mutual-funds or by calling 1-888-309-3539 or by sending an email request to fundinfo@massmutual.com.
WHAT ARE SOME KEY FUND STATISTICS? (as of September 30, 2024)
| |
Total Net Assets (Millions) | $148.3 |
Total Number of Portfolio Holdings (includes derivative positions, if any) | 451 |
Total Advisory Fees Paid During the Reporting Period | $972,880 |
Portfolio Turnover Rate | 62% |
| MM202912-309770 | PAGE 2 | TSR-AR-2BCB1 |
WHAT DID THE FUND INVEST IN? (as of September 30, 2024)
Derivative values, if any, are excluded from the table(s) below.
| |
Portfolio Characteristics
(% of Total Investments) | |
Bank Loans | 48.8% |
Corporate Debt | 33.4% |
Repurchase Agreement | 10.9% |
Non-U.S. Government Agency Obligations | 4.6% |
Investment of Cash Collateral from Securities Loaned | 1.7% |
Common Stock | 0.4% |
Sovereign Debt Obligations | 0.2% |
Warrants | 0.0% |
Rights | 0.0% |
| |
Largest Countries
(% of Total Investments) | |
United States | 48.0% |
United Kingdom | 9.8% |
Germany | 4.0% |
Spain | 3.2% |
Netherlands | 2.5% |
Ireland | 2.4% |
France | 2.4% |
Cayman Islands | 2.1% |
Luxembourg | 1.8% |
Belgium | 1.3% |
HOW HAS THE FUND CHANGED?
The following is a summary of certain changes to the Fund since October 1, 2023. For more complete information, you may review the Fund’s prospectus, including any applicable supplements, at https://www.massmutual.com/product-performance/mutual-funds or upon request at 1-888-309-3539 or fundinfo@massmutual.com.
Effective February 1, 2024, the Class L shares of the Fund were re-named as Class A shares.
Effective February 1, 2024, the maximum front-end sales charge on Class A shares of the Fund increased from 4.00% to 4.25%.
| |
| WHERE CAN I FIND ADDITIONAL INFORMATION ABOUT THE FUND? |
For additional information about the Fund, including its prospectus, financial information, holdings, and proxy voting information, scan the QR code or visit https://www.massmutual.com/product-performance/mutual-funds. |
| MM202912-309770 | PAGE 3 | TSR-AR-2BCB1 |
96259484101941119511574117571166113271114821284014396100009674105281039610259110381172611620924694531058610000105021105011677124531338414198149161576017327192201000096441053410474103361111511781117289341959310768
| | |
MassMutual Global Credit Income Opportunities Fund | |
| Class C | BXICX |
| Annual Shareholder Report | September 30, 2024 |
This annual shareholder report contains important information about the MassMutual Global Credit Income Opportunities Fund (the “Fund”) for the period of October 1, 2023 to September 30, 2024. You can find additional information about the Fund at https://www.massmutual.com/product-performance/mutual-funds. You can also request this information by contacting us at 1-888-309-3539 or by sending an email request to fundinfo@massmutual.com.
This report describes changes to the Fund that occurred during the reporting period.
WHAT WERE THE FUND COSTS FOR THE LAST YEAR?
This example shows the expenses you would have paid over the past year, based on a hypothetical $10,000 investment. This table reflects any applicable waivers or expense limitations.
| | |
Class Name | Costs of a $10,000 investment | Costs paid as a percentage of a $10,000 investment |
| Class C | $206 | 1.95% |
HOW DID THE FUND PERFORM?
Global bond markets were broadly, and strongly, positive for the trailing one-year period. During the period, central banks responded to lower inflation data and began to lower policy interest rates, which was favorable for bond prices and returns. Macroeconomic sentiment centered, particularly more recently, on a soft-landing scenario in the U.S., providing a supportive credit risk environment. During the period, narrowing credit spreads were a positive return driver in the global bond market, in addition to the response to lower bond market yields. This resulted in broad gains across varied market sectors, including government bonds, investment grade and high yield corporate securities, mortgage- and asset-backed instruments, and emerging market issues.
Top contributors to the Fund’s performance relative to the FTSE 3 Month US T Bill Index + 500 bps:
• Interest rate sensitivity aided absolute and relative return
• Corporate high yield allocation, given higher returns in the class compared to other asset classes
Top detractors to the Fund’s performance relative to the FTSE 3 Month US T Bill Index + 500 bps:
• Bank loan allocation as high yield bonds outperformed
• Allocation to lower-returning technology sector
Performance shown is past performance and does not guarantee future results. The graph and table below do not reflect the deduction of taxes that a shareholder would pay on Fund distributions or redemption of Fund shares. The graph and table below assume reinvestment of dividends and capital gain distributions.
GROWTH OF A HYPOTHETICAL $10,000 INVESTMENT (October 1, 2014 through September 30, 2024)
This graph shows the performance of a hypothetical $10,000 investment in the share class noted over a ten-year period or since inception, if shorter, as compared to the performance of a broad-based securities market index, and, if applicable, one or more indexes that MML Investment Advisers, LLC believes more closely reflects the market segments in which the Fund invests or is a better comparison for the Fund’s investment strategy. This graph includes the deduction of the maximum applicable sales charge, if any.
| MM202912-309770 | PAGE 1 | TSR-AR-2BCB3 |
The index or indexes shown above are unmanaged, cannot be purchased directly, and, with the exception of any peer group index, do not incur expenses.
AVERAGE ANNUAL TOTAL RETURNS (%) (as of September 30, 2024)
| | | |
| | 1 Year | 5 Year | 10 Year |
Class C - without sales charge | 11.27 | 3.36 | 3.33 |
Class C - with maximum sales charge | 10.27 | 3.36 | 3.33 |
Bloomberg Global Aggregate Index1 | 11.99 | -0.83 | 0.57 |
FTSE 3 Month US T Bill Index + 500 bps | 10.93 | 7.51 | 6.75 |
Bloomberg Multiverse Index | 12.25 | -0.63 | 0.74 |
| 1 | Effective July 24, 2024, the Bloomberg Global Aggregate Index replaced the Bloomberg Multiverse Index as a broad measure of market performance in accordance with new regulatory disclosure requirements. |
The Fund is the successor to the Barings Global Credit Income Opportunities Fund (the “Predecessor Fund”), a mutual fund with substantially similar investment objectives, policies, and restrictions, as a result of the reorganization of the Predecessor Fund into the Fund on December 13, 2021. The performance provided is that of the Predecessor Fund prior to December 13, 2021, and is that of the Fund after December 13, 2021.
Performance results reflect any applicable waivers or expense limitations in effect during these periods, without which performance would have been lower. The investment return and principal value of shares of the Fund fluctuate, so your shares, when sold, may be worth more or less than their original cost. Current performance of the Fund may be lower or higher than the performance quoted. Performance data current to the most recent month-end may be obtained at https://www.massmutual.com/product-performance/mutual-funds or by calling 1-888-309-3539 or by sending an email request to fundinfo@massmutual.com.
WHAT ARE SOME KEY FUND STATISTICS? (as of September 30, 2024)
| |
Total Net Assets (Millions) | $148.3 |
Total Number of Portfolio Holdings (includes derivative positions, if any) | 451 |
Total Advisory Fees Paid During the Reporting Period | $972,880 |
Portfolio Turnover Rate | 62% |
| MM202912-309770 | PAGE 2 | TSR-AR-2BCB3 |
WHAT DID THE FUND INVEST IN? (as of September 30, 2024)
Derivative values, if any, are excluded from the table(s) below.
| |
Portfolio Characteristics
(% of Total Investments) | |
Bank Loans | 48.8% |
Corporate Debt | 33.4% |
Repurchase Agreement | 10.9% |
Non-U.S. Government Agency Obligations | 4.6% |
Investment of Cash Collateral from Securities Loaned | 1.7% |
Common Stock | 0.4% |
Sovereign Debt Obligations | 0.2% |
Warrants | 0.0% |
Rights | 0.0% |
| |
Largest Countries
(% of Total Investments) | |
United States | 48.0% |
United Kingdom | 9.8% |
Germany | 4.0% |
Spain | 3.2% |
Netherlands | 2.5% |
Ireland | 2.4% |
France | 2.4% |
Cayman Islands | 2.1% |
Luxembourg | 1.8% |
Belgium | 1.3% |
HOW HAS THE FUND CHANGED?
The following is a summary of certain changes to the Fund since October 1, 2023. For more complete information, you may review the Fund’s prospectus, including any applicable supplements, at https://www.massmutual.com/product-performance/mutual-funds or upon request at 1-888-309-3539 or fundinfo@massmutual.com.
Effective February 1, 2024, the Class L shares of the Fund were re-named as Class A shares.
Effective February 1, 2024, the maximum front-end sales charge on Class A shares of the Fund increased from 4.00% to 4.25%.
| |
| WHERE CAN I FIND ADDITIONAL INFORMATION ABOUT THE FUND? |
For additional information about the Fund, including its prospectus, financial information, holdings, and proxy voting information, scan the QR code or visit https://www.massmutual.com/product-performance/mutual-funds. |
| MM202912-309770 | PAGE 3 | TSR-AR-2BCB3 |
100009780104341137211670117661158213090112401247113877100009674105281039610259110381172611620924694531058610000105021105011677124531338414198149161576017327192201000096441053410474103361111511781117289341959310768
| | |
MassMutual Emerging Markets Debt Blended Total Return Fund | |
| Class I | BXEIX |
| Annual Shareholder Report | September 30, 2024 |
This annual shareholder report contains important information about the MassMutual Emerging Markets Debt Blended Total Return Fund (the “Fund”) for the period of October 1, 2023 to September 30, 2024. You can find additional information about the Fund at https://www.massmutual.com/product-performance/mutual-funds. You can also request this information by contacting us at 1-888-309-3539 or by sending an email request to fundinfo@massmutual.com.
This report describes changes to the Fund that occurred during the reporting period.
WHAT WERE THE FUND COSTS FOR THE LAST YEAR?
This example shows the expenses you would have paid over the past year, based on a hypothetical $10,000 investment. This table reflects any applicable waivers or expense limitations.
| | |
Class Name | Costs of a $10,000 investment | Costs paid as a percentage of a $10,000 investment |
| Class I | $101 | 0.94% |
HOW DID THE FUND PERFORM?
Global bond markets were broadly, and strongly, positive for the trailing one-year period. During the period, central banks responded to lower inflation data and began to lower policy interest rates, which was favorable for bond prices and returns. Macroeconomic sentiment centered, particularly more recently, on a soft-landing scenario in the U.S., providing a supportive credit risk environment. During the period, narrowing credit spreads were a positive return driver in the global bond market, in addition to the response to lower bond market yields. This resulted in broad gains across varied market sectors, including government bonds, investment grade and high yield corporate securities, mortgage- and asset-backed instruments, and emerging market issues.
Top contributors to the Fund’s performance relative to the Bloomberg Emerging Markets Hard Currency (USD) Aggregate Index:
• The emerging market sovereign hard currency portfolio aided performance the most
• The corporate portfolio particularly Mexican companies was favorable
Top detractors to the Fund’s performance relative to the Bloomberg Emerging Markets Hard Currency (USD) Aggregate Index:
• Local rates exposure
• Various currency exposures as part of the foreign exchange hedging strategy
Performance shown is past performance and does not guarantee future results. The graph and table below do not reflect the deduction of taxes that a shareholder would pay on Fund distributions or redemption of Fund shares. The graph and table below assume reinvestment of dividends and capital gain distributions.
GROWTH OF A HYPOTHETICAL $10,000 INVESTMENT (October 21, 2015 through September 30, 2024)
This graph shows the performance of a hypothetical $10,000 investment in the share class noted over a ten-year period or since inception, if shorter, as compared to the performance of a broad-based securities market index, and, if applicable, one or more indexes that MML Investment Advisers, LLC believes more closely reflects the market segments in which the Fund invests or is a better comparison for the Fund’s investment strategy. This graph includes the deduction of the maximum applicable sales charge, if any.
| MM202912-309770 | PAGE 1 | TSR-AR-2BCE4 |
The index or indexes shown above are unmanaged, cannot be purchased directly, and, with the exception of any peer group index, do not incur expenses.
AVERAGE ANNUAL TOTAL RETURNS (%) (as of September 30, 2024)
| | | |
| | 1 Year | 5 Year | Since Inception
(10/21/2015) |
Class I - without sales charge | 15.73 | 2.47 | 4.06 |
Bloomberg Emerging Markets Hard Currency (USD) Aggregate Index | 17.23 | 1.07 | 3.11 |
The Fund is the successor to the Barings Emerging Markets Debt Blended Total Return Fund (the “Predecessor Fund”), a mutual fund with substantially similar investment objectives, policies, and restrictions, as a result of the reorganization of the Predecessor Fund into the Fund on December 13, 2021. The performance provided is that of the Predecessor Fund prior to December 13, 2021, and is that of the Fund after December 13, 2021.
Performance results reflect any applicable waivers or expense limitations in effect during these periods, without which performance would have been lower. The investment return and principal value of shares of the Fund fluctuate, so your shares, when sold, may be worth more or less than their original cost. Current performance of the Fund may be lower or higher than the performance quoted. Performance data current to the most recent month-end may be obtained at https://www.massmutual.com/product-performance/mutual-funds or by calling 1-888-309-3539 or by sending an email request to fundinfo@massmutual.com.
WHAT ARE SOME KEY FUND STATISTICS? (as of September 30, 2024)
| |
Total Net Assets (Millions) | $27.8 |
Total Number of Portfolio Holdings (includes derivative positions, if any) | 159 |
Total Advisory Fees Paid During the Reporting Period | $321,969 |
Portfolio Turnover Rate | 52% |
WHAT DID THE FUND INVEST IN? (as of September 30, 2024)
Derivative values, if any, are excluded from the table(s) below.
| |
Portfolio Characteristics
(% of Total Investments) | |
Sovereign Debt Obligations | 58.8% |
Corporate Debt | 36.1% |
Repurchase Agreement | 3.3% |
Investment of Cash Collateral from Securities Loaned | 1.8% |
Derivatives | 0.0% |
| |
Largest Countries
(% of Total Investments) | |
Colombia | 8.5% |
South Africa | 6.8% |
Chile | 4.9% |
Mexico | 4.8% |
Peru | 4.8% |
Czech Republic | 4.8% |
Turkey | 4.5% |
Tajikistan | 3.6% |
Paraguay | 3.2% |
Brazil | 3.0% |
| MM202912-309770 | PAGE 2 | TSR-AR-2BCE4 |
HOW HAS THE FUND CHANGED?
The following is a summary of certain changes to the Fund since October 1, 2023. For more complete information, you may review the Fund’s prospectus, including any applicable supplements, at https://www.massmutual.com/product-performance/mutual-funds or upon request at 1-888-309-3539 or fundinfo@massmutual.com.
Effective February 1, 2024, the Class L shares of the Fund were re-named as Class A shares.
Effective February 1, 2024, the maximum front-end sales charge on Class A shares of the Fund increased from 4.00% to 4.25%.
Prior to July 1, 2024, MML Investment Advisers, LLC had agreed to cap the fees and expenses of the Fund (other than extraordinary legal and other expenses, Acquired Fund Fees and Expenses, interest expense, expenses related to borrowings, securities lending, leverage, taxes, and brokerage, short sale dividend and loan expense, or other non-recurring or unusual expenses such as organizational expenses and shareholder meeting expenses, as applicable) through January 31, 2025, to the extent that Total Annual Fund Operating Expenses after Expense Reimbursement would otherwise exceed 0.95%, 0.95%, 1.20%, and 1.95% for Classes I, Y, A, and C, respectively.
On July 1, 2024, this agreement was replaced by a new agreement with MML Investment Advisers, LLC to cap the fees and expenses of the Fund (other than extraordinary legal and other expenses, Acquired Fund Fees and Expenses, interest expense, expenses related to borrowings, securities lending, leverage, taxes, and brokerage, short sale dividend and loan expense, or other non-recurring or unusual expenses such as organizational expenses and shareholder meeting expenses, as applicable) through January 31, 2026, to the extent that Total Annual Fund Operating Expenses after Expense Reimbursement would otherwise exceed 0.89%, 0.95%, 1.16%, and 1.89%, for Classes I, Y, A, and C, respectively.
| |
| WHERE CAN I FIND ADDITIONAL INFORMATION ABOUT THE FUND? |
For additional information about the Fund, including its prospectus, financial information, holdings, and proxy voting information, scan the QR code or visit https://www.massmutual.com/product-performance/mutual-funds. |
| MM202912-309770 | PAGE 3 | TSR-AR-2BCE4 |
1000010732120341135212639144471563210864123381427910000110671163011436124741301713427103371122413158
| | |
MassMutual Emerging Markets Debt Blended Total Return Fund | |
| Class Y | BXEYX |
| Annual Shareholder Report | September 30, 2024 |
This annual shareholder report contains important information about the MassMutual Emerging Markets Debt Blended Total Return Fund (the “Fund”) for the period of October 1, 2023 to September 30, 2024. You can find additional information about the Fund at https://www.massmutual.com/product-performance/mutual-funds. You can also request this information by contacting us at 1-888-309-3539 or by sending an email request to fundinfo@massmutual.com.
This report describes changes to the Fund that occurred during the reporting period.
WHAT WERE THE FUND COSTS FOR THE LAST YEAR?
This example shows the expenses you would have paid over the past year, based on a hypothetical $10,000 investment. This table reflects any applicable waivers or expense limitations.
| | |
Class Name | Costs of a $10,000 investment | Costs paid as a percentage of a $10,000 investment |
| Class Y | $102 | 0.95% |
HOW DID THE FUND PERFORM?
Global bond markets were broadly, and strongly, positive for the trailing one-year period. During the period, central banks responded to lower inflation data and began to lower policy interest rates, which was favorable for bond prices and returns. Macroeconomic sentiment centered, particularly more recently, on a soft-landing scenario in the U.S., providing a supportive credit risk environment. During the period, narrowing credit spreads were a positive return driver in the global bond market, in addition to the response to lower bond market yields. This resulted in broad gains across varied market sectors, including government bonds, investment grade and high yield corporate securities, mortgage- and asset-backed instruments, and emerging market issues.
Top contributors to the Fund’s performance relative to the Bloomberg Emerging Markets Hard Currency (USD) Aggregate Index:
• The emerging market sovereign hard currency portfolio aided performance the most
• The corporate portfolio particularly Mexican companies was favorable
Top detractors to the Fund’s performance relative to the Bloomberg Emerging Markets Hard Currency (USD) Aggregate Index:
• Local rates exposure
• Various currency exposures as part of the foreign exchange hedging strategy
Performance shown is past performance and does not guarantee future results. The graph and table below do not reflect the deduction of taxes that a shareholder would pay on Fund distributions or redemption of Fund shares. The graph and table below assume reinvestment of dividends and capital gain distributions.
GROWTH OF A HYPOTHETICAL $10,000 INVESTMENT (October 21, 2015 through September 30, 2024)
This graph shows the performance of a hypothetical $10,000 investment in the share class noted over a ten-year period or since inception, if shorter, as compared to the performance of a broad-based securities market index, and, if applicable, one or more indexes that MML Investment Advisers, LLC believes more closely reflects the market segments in which the Fund invests or is a better comparison for the Fund’s investment strategy. This graph includes the deduction of the maximum applicable sales charge, if any.
| MM202912-309770 | PAGE 1 | TSR-AR-2BCEY |
The index or indexes shown above are unmanaged, cannot be purchased directly, and, with the exception of any peer group index, do not incur expenses.
AVERAGE ANNUAL TOTAL RETURNS (%) (as of September 30, 2024)
| | | |
| | 1 Year | 5 Year | Since Inception
(10/21/2015) |
Class Y - without sales charge | 15.75 | 2.41 | 4.03 |
Bloomberg Emerging Markets Hard Currency (USD) Aggregate Index | 17.23 | 1.07 | 3.11 |
The Fund is the successor to the Barings Emerging Markets Debt Blended Total Return Fund (the “Predecessor Fund”), a mutual fund with substantially similar investment objectives, policies, and restrictions, as a result of the reorganization of the Predecessor Fund into the Fund on December 13, 2021. The performance provided is that of the Predecessor Fund prior to December 13, 2021, and is that of the Fund after December 13, 2021.
Performance results reflect any applicable waivers or expense limitations in effect during these periods, without which performance would have been lower. The investment return and principal value of shares of the Fund fluctuate, so your shares, when sold, may be worth more or less than their original cost. Current performance of the Fund may be lower or higher than the performance quoted. Performance data current to the most recent month-end may be obtained at https://www.massmutual.com/product-performance/mutual-funds or by calling 1-888-309-3539 or by sending an email request to fundinfo@massmutual.com.
WHAT ARE SOME KEY FUND STATISTICS? (as of September 30, 2024)
| |
Total Net Assets (Millions) | $27.8 |
Total Number of Portfolio Holdings (includes derivative positions, if any) | 159 |
Total Advisory Fees Paid During the Reporting Period | $321,969 |
Portfolio Turnover Rate | 52% |
WHAT DID THE FUND INVEST IN? (as of September 30, 2024)
Derivative values, if any, are excluded from the table(s) below.
| |
Portfolio Characteristics
(% of Total Investments) | |
Sovereign Debt Obligations | 58.8% |
Corporate Debt | 36.1% |
Repurchase Agreement | 3.3% |
Investment of Cash Collateral from Securities Loaned | 1.8% |
Derivatives | 0.0% |
| |
Largest Countries
(% of Total Investments) | |
Colombia | 8.5% |
South Africa | 6.8% |
Chile | 4.9% |
Mexico | 4.8% |
Peru | 4.8% |
Czech Republic | 4.8% |
Turkey | 4.5% |
Tajikistan | 3.6% |
Paraguay | 3.2% |
Brazil | 3.0% |
| MM202912-309770 | PAGE 2 | TSR-AR-2BCEY |
HOW HAS THE FUND CHANGED?
The following is a summary of certain changes to the Fund since October 1, 2023. For more complete information, you may review the Fund’s prospectus, including any applicable supplements, at https://www.massmutual.com/product-performance/mutual-funds or upon request at 1-888-309-3539 or fundinfo@massmutual.com.
Effective February 1, 2024, the Class L shares of the Fund were re-named as Class A shares.
Effective February 1, 2024, the maximum front-end sales charge on Class A shares of the Fund increased from 4.00% to 4.25%.
Prior to July 1, 2024, MML Investment Advisers, LLC had agreed to cap the fees and expenses of the Fund (other than extraordinary legal and other expenses, Acquired Fund Fees and Expenses, interest expense, expenses related to borrowings, securities lending, leverage, taxes, and brokerage, short sale dividend and loan expense, or other non-recurring or unusual expenses such as organizational expenses and shareholder meeting expenses, as applicable) through January 31, 2025, to the extent that Total Annual Fund Operating Expenses after Expense Reimbursement would otherwise exceed 0.95%, 0.95%, 1.20%, and 1.95% for Classes I, Y, A, and C, respectively.
On July 1, 2024, this agreement was replaced by a new agreement with MML Investment Advisers, LLC to cap the fees and expenses of the Fund (other than extraordinary legal and other expenses, Acquired Fund Fees and Expenses, interest expense, expenses related to borrowings, securities lending, leverage, taxes, and brokerage, short sale dividend and loan expense, or other non-recurring or unusual expenses such as organizational expenses and shareholder meeting expenses, as applicable) through January 31, 2026, to the extent that Total Annual Fund Operating Expenses after Expense Reimbursement would otherwise exceed 0.89%, 0.95%, 1.16%, and 1.89%, for Classes I, Y, A, and C, respectively.
| |
| WHERE CAN I FIND ADDITIONAL INFORMATION ABOUT THE FUND? |
For additional information about the Fund, including its prospectus, financial information, holdings, and proxy voting information, scan the QR code or visit https://www.massmutual.com/product-performance/mutual-funds. |
| MM202912-309770 | PAGE 3 | TSR-AR-2BCEY |
1000010732120341135312640144401562210843123151423610000110671163011436124741301713427103371122413158
| | |
MassMutual Emerging Markets Debt Blended Total Return Fund | |
| Class A | BXEAX |
| Annual Shareholder Report | September 30, 2024 |
This annual shareholder report contains important information about the MassMutual Emerging Markets Debt Blended Total Return Fund (the “Fund”) for the period of October 1, 2023 to September 30, 2024. You can find additional information about the Fund at https://www.massmutual.com/product-performance/mutual-funds. You can also request this information by contacting us at 1-888-309-3539 or by sending an email request to fundinfo@massmutual.com.
This report describes changes to the Fund that occurred during the reporting period.
WHAT WERE THE FUND COSTS FOR THE LAST YEAR?
This example shows the expenses you would have paid over the past year, based on a hypothetical $10,000 investment. This table reflects any applicable waivers or expense limitations.
| | |
Class Name | Costs of a $10,000 investment | Costs paid as a percentage of a $10,000 investment |
| Class A | $128 | 1.19% |
HOW DID THE FUND PERFORM?
Global bond markets were broadly, and strongly, positive for the trailing one-year period. During the period, central banks responded to lower inflation data and began to lower policy interest rates, which was favorable for bond prices and returns. Macroeconomic sentiment centered, particularly more recently, on a soft-landing scenario in the U.S., providing a supportive credit risk environment. During the period, narrowing credit spreads were a positive return driver in the global bond market, in addition to the response to lower bond market yields. This resulted in broad gains across varied market sectors, including government bonds, investment grade and high yield corporate securities, mortgage- and asset-backed instruments, and emerging market issues.
Top contributors to the Fund’s performance relative to the Bloomberg Emerging Markets Hard Currency (USD) Aggregate Index:
• The emerging market sovereign hard currency portfolio aided performance the most
• The corporate portfolio particularly Mexican companies was favorable
Top detractors to the Fund’s performance relative to the Bloomberg Emerging Markets Hard Currency (USD) Aggregate Index:
• Local rates exposure
• Various currency exposures as part of the foreign exchange hedging strategy
Performance shown is past performance and does not guarantee future results. The graph and table below do not reflect the deduction of taxes that a shareholder would pay on Fund distributions or redemption of Fund shares. The graph and table below assume reinvestment of dividends and capital gain distributions.
GROWTH OF A HYPOTHETICAL $10,000 INVESTMENT (October 21, 2015 through September 30, 2024)
This graph shows the performance of a hypothetical $10,000 investment in the share class noted over a ten-year period or since inception, if shorter, as compared to the performance of a broad-based securities market index, and, if applicable, one or more indexes that MML Investment Advisers, LLC believes more closely reflects the market segments in which the Fund invests or is a better comparison for the Fund’s investment strategy. This graph includes the deduction of the maximum applicable sales charge, if any.
| MM202912-309770 | PAGE 1 | TSR-AR-2BCE1 |
The index or indexes shown above are unmanaged, cannot be purchased directly, and, with the exception of any peer group index, do not incur expenses.
AVERAGE ANNUAL TOTAL RETURNS (%) (as of September 30, 2024)
| | | |
| | 1 Year | 5 Year | Since Inception
(10/21/2015) |
Class A - without sales charge | 15.61 | 2.21 | 3.80 |
Class A - with maximum sales charge | 10.02 | 1.38 | 3.33 |
Bloomberg Emerging Markets Hard Currency (USD) Aggregate Index | 17.23 | 1.07 | 3.11 |
The Fund is the successor to the Barings Emerging Markets Debt Blended Total Return Fund (the “Predecessor Fund”), a mutual fund with substantially similar investment objectives, policies, and restrictions, as a result of the reorganization of the Predecessor Fund into the Fund on December 13, 2021. The performance provided is that of the Predecessor Fund prior to December 13, 2021, and is that of the Fund after December 13, 2021.
Performance results reflect any applicable waivers or expense limitations in effect during these periods, without which performance would have been lower. The investment return and principal value of shares of the Fund fluctuate, so your shares, when sold, may be worth more or less than their original cost. Current performance of the Fund may be lower or higher than the performance quoted. Performance data current to the most recent month-end may be obtained at https://www.massmutual.com/product-performance/mutual-funds or by calling 1-888-309-3539 or by sending an email request to fundinfo@massmutual.com.
WHAT ARE SOME KEY FUND STATISTICS? (as of September 30, 2024)
| |
Total Net Assets (Millions) | $27.8 |
Total Number of Portfolio Holdings (includes derivative positions, if any) | 159 |
Total Advisory Fees Paid During the Reporting Period | $321,969 |
Portfolio Turnover Rate | 52% |
| MM202912-309770 | PAGE 2 | TSR-AR-2BCE1 |
WHAT DID THE FUND INVEST IN? (as of September 30, 2024)
Derivative values, if any, are excluded from the table(s) below.
| |
Portfolio Characteristics
(% of Total Investments) | |
Sovereign Debt Obligations | 58.8% |
Corporate Debt | 36.1% |
Repurchase Agreement | 3.3% |
Investment of Cash Collateral from Securities Loaned | 1.8% |
Derivatives | 0.0% |
| |
Largest Countries
(% of Total Investments) | |
Colombia | 8.5% |
South Africa | 6.8% |
Chile | 4.9% |
Mexico | 4.8% |
Peru | 4.8% |
Czech Republic | 4.8% |
Turkey | 4.5% |
Tajikistan | 3.6% |
Paraguay | 3.2% |
Brazil | 3.0% |
HOW HAS THE FUND CHANGED?
The following is a summary of certain changes to the Fund since October 1, 2023. For more complete information, you may review the Fund’s prospectus, including any applicable supplements, at https://www.massmutual.com/product-performance/mutual-funds or upon request at 1-888-309-3539 or fundinfo@massmutual.com.
Effective February 1, 2024, the Class L shares of the Fund were re-named as Class A shares.
Effective February 1, 2024, the maximum front-end sales charge on Class A shares of the Fund increased from 4.00% to 4.25%.
Prior to July 1, 2024, MML Investment Advisers, LLC had agreed to cap the fees and expenses of the Fund (other than extraordinary legal and other expenses, Acquired Fund Fees and Expenses, interest expense, expenses related to borrowings, securities lending, leverage, taxes, and brokerage, short sale dividend and loan expense, or other non-recurring or unusual expenses such as organizational expenses and shareholder meeting expenses, as applicable) through January 31, 2025, to the extent that Total Annual Fund Operating Expenses after Expense Reimbursement would otherwise exceed 0.95%, 0.95%, 1.20%, and 1.95% for Classes I, Y, A, and C, respectively.
On July 1, 2024, this agreement was replaced by a new agreement with MML Investment Advisers, LLC to cap the fees and expenses of the Fund (other than extraordinary legal and other expenses, Acquired Fund Fees and Expenses, interest expense, expenses related to borrowings, securities lending, leverage, taxes, and brokerage, short sale dividend and loan expense, or other non-recurring or unusual expenses such as organizational expenses and shareholder meeting expenses, as applicable) through January 31, 2026, to the extent that Total Annual Fund Operating Expenses after Expense Reimbursement would otherwise exceed 0.89%, 0.95%, 1.16%, and 1.89%, for Classes I, Y, A, and C, respectively.
| |
| WHERE CAN I FIND ADDITIONAL INFORMATION ABOUT THE FUND? |
For additional information about the Fund, including its prospectus, financial information, holdings, and proxy voting information, scan the QR code or visit https://www.massmutual.com/product-performance/mutual-funds. |
| MM202912-309770 | PAGE 3 | TSR-AR-2BCE1 |
102791149410815120131369614780102481159313402110671163011436124741301713427103371122413158
| | |
MassMutual Emerging Markets Debt Blended Total Return Fund | |
| Class C | BXECX |
| Annual Shareholder Report | September 30, 2024 |
This annual shareholder report contains important information about the MassMutual Emerging Markets Debt Blended Total Return Fund (the “Fund”) for the period of October 1, 2023 to September 30, 2024. You can find additional information about the Fund at https://www.massmutual.com/product-performance/mutual-funds. You can also request this information by contacting us at 1-888-309-3539 or by sending an email request to fundinfo@massmutual.com.
This report describes changes to the Fund that occurred during the reporting period.
WHAT WERE THE FUND COSTS FOR THE LAST YEAR?
This example shows the expenses you would have paid over the past year, based on a hypothetical $10,000 investment. This table reflects any applicable waivers or expense limitations.
| | |
Class Name | Costs of a $10,000 investment | Costs paid as a percentage of a $10,000 investment |
| Class C | $208 | 1.94% |
HOW DID THE FUND PERFORM?
Global bond markets were broadly, and strongly, positive for the trailing one-year period. During the period, central banks responded to lower inflation data and began to lower policy interest rates, which was favorable for bond prices and returns. Macroeconomic sentiment centered, particularly more recently, on a soft-landing scenario in the U.S., providing a supportive credit risk environment. During the period, narrowing credit spreads were a positive return driver in the global bond market, in addition to the response to lower bond market yields. This resulted in broad gains across varied market sectors, including government bonds, investment grade and high yield corporate securities, mortgage- and asset-backed instruments, and emerging market issues.
Top contributors to the Fund’s performance relative to the Bloomberg Emerging Markets Hard Currency (USD) Aggregate Index:
• The emerging market sovereign hard currency portfolio aided performance the most
• The corporate portfolio particularly Mexican companies was favorable
Top detractors to the Fund’s performance relative to the Bloomberg Emerging Markets Hard Currency (USD) Aggregate Index:
• Local rates exposure
• Various currency exposures as part of the foreign exchange hedging strategy
Performance shown is past performance and does not guarantee future results. The graph and table below do not reflect the deduction of taxes that a shareholder would pay on Fund distributions or redemption of Fund shares. The graph and table below assume reinvestment of dividends and capital gain distributions.
GROWTH OF A HYPOTHETICAL $10,000 INVESTMENT (October 21, 2015 through September 30, 2024)
This graph shows the performance of a hypothetical $10,000 investment in the share class noted over a ten-year period or since inception, if shorter, as compared to the performance of a broad-based securities market index, and, if applicable, one or more indexes that MML Investment Advisers, LLC believes more closely reflects the market segments in which the Fund invests or is a better comparison for the Fund’s investment strategy. This graph includes the deduction of the maximum applicable sales charge, if any.
| MM202912-309770 | PAGE 1 | TSR-AR-2BCE3 |
The index or indexes shown above are unmanaged, cannot be purchased directly, and, with the exception of any peer group index, do not incur expenses.
AVERAGE ANNUAL TOTAL RETURNS (%) (as of September 30, 2024)
| | | |
| | 1 Year | 5 Year | Since Inception
(10/21/2015) |
Class C - without sales charge | 14.63 | 1.40 | 3.01 |
Class C - with maximum sales charge | 13.63 | 1.42 | 3.03 |
Bloomberg Emerging Markets Hard Currency (USD) Aggregate Index | 17.23 | 1.07 | 3.11 |
The Fund is the successor to the Barings Emerging Markets Debt Blended Total Return Fund (the “Predecessor Fund”), a mutual fund with substantially similar investment objectives, policies, and restrictions, as a result of the reorganization of the Predecessor Fund into the Fund on December 13, 2021. The performance provided is that of the Predecessor Fund prior to December 13, 2021, and is that of the Fund after December 13, 2021.
Performance results reflect any applicable waivers or expense limitations in effect during these periods, without which performance would have been lower. The investment return and principal value of shares of the Fund fluctuate, so your shares, when sold, may be worth more or less than their original cost. Current performance of the Fund may be lower or higher than the performance quoted. Performance data current to the most recent month-end may be obtained at https://www.massmutual.com/product-performance/mutual-funds or by calling 1-888-309-3539 or by sending an email request to fundinfo@massmutual.com.
WHAT ARE SOME KEY FUND STATISTICS? (as of September 30, 2024)
| |
Total Net Assets (Millions) | $27.8 |
Total Number of Portfolio Holdings (includes derivative positions, if any) | 159 |
Total Advisory Fees Paid During the Reporting Period | $321,969 |
Portfolio Turnover Rate | 52% |
| MM202912-309770 | PAGE 2 | TSR-AR-2BCE3 |
WHAT DID THE FUND INVEST IN? (as of September 30, 2024)
Derivative values, if any, are excluded from the table(s) below.
| |
Portfolio Characteristics
(% of Total Investments) | |
Sovereign Debt Obligations | 58.8% |
Corporate Debt | 36.1% |
Repurchase Agreement | 3.3% |
Investment of Cash Collateral from Securities Loaned | 1.8% |
Derivatives | 0.0% |
| |
Largest Countries
(% of Total Investments) | |
Colombia | 8.5% |
South Africa | 6.8% |
Chile | 4.9% |
Mexico | 4.8% |
Peru | 4.8% |
Czech Republic | 4.8% |
Turkey | 4.5% |
Tajikistan | 3.6% |
Paraguay | 3.2% |
Brazil | 3.0% |
HOW HAS THE FUND CHANGED?
The following is a summary of certain changes to the Fund since October 1, 2023. For more complete information, you may review the Fund’s prospectus, including any applicable supplements, at https://www.massmutual.com/product-performance/mutual-funds or upon request at 1-888-309-3539 or fundinfo@massmutual.com.
Effective February 1, 2024, the Class L shares of the Fund were re-named as Class A shares.
Effective February 1, 2024, the maximum front-end sales charge on Class A shares of the Fund increased from 4.00% to 4.25%.
Prior to July 1, 2024, MML Investment Advisers, LLC had agreed to cap the fees and expenses of the Fund (other than extraordinary legal and other expenses, Acquired Fund Fees and Expenses, interest expense, expenses related to borrowings, securities lending, leverage, taxes, and brokerage, short sale dividend and loan expense, or other non-recurring or unusual expenses such as organizational expenses and shareholder meeting expenses, as applicable) through January 31, 2025, to the extent that Total Annual Fund Operating Expenses after Expense Reimbursement would otherwise exceed 0.95%, 0.95%, 1.20%, and 1.95% for Classes I, Y, A, and C, respectively.
On July 1, 2024, this agreement was replaced by a new agreement with MML Investment Advisers, LLC to cap the fees and expenses of the Fund (other than extraordinary legal and other expenses, Acquired Fund Fees and Expenses, interest expense, expenses related to borrowings, securities lending, leverage, taxes, and brokerage, short sale dividend and loan expense, or other non-recurring or unusual expenses such as organizational expenses and shareholder meeting expenses, as applicable) through January 31, 2026, to the extent that Total Annual Fund Operating Expenses after Expense Reimbursement would otherwise exceed 0.89%, 0.95%, 1.16%, and 1.89%, for Classes I, Y, A, and C, respectively.
| |
| WHERE CAN I FIND ADDITIONAL INFORMATION ABOUT THE FUND? |
For additional information about the Fund, including its prospectus, financial information, holdings, and proxy voting information, scan the QR code or visit https://www.massmutual.com/product-performance/mutual-funds. |
| MM202912-309770 | PAGE 3 | TSR-AR-2BCE3 |
106331180611029121641376214744101441139113055110671163011436124741301713427103371122413158
Item 2. Code of Ethics.
As of September 30, 2024, the Registrant adopted a Code of Ethics that applies to the Principal Executive Officer, Principal Financial Officer, and other senior financial officers pursuant to the Sarbanes-Oxley Act of 2002. For the year ended September 30, 2024, there were no reportable amendments to any provision of the Code of Ethics and the Registrant did not grant any waivers, including implicit waivers, from any provisions of the Code of Ethics. A copy of its Code of Ethics is filed with this Form N-CSR under Item 19(a)(1).
Item 3. Audit Committee Financial Expert.
The Registrant’s Board of Trustees has determined that Nabil N. El-Hage, a member of the Audit Committee, is an audit committee financial expert as defined by the Securities and Exchange Commission (the “SEC”). Mr. El-Hage is “independent” as defined by the SEC for purposes of audit committee financial expert determinations.
Item 4. Principal Accountant Fees and Services.
References below to Deloitte & Touche LLP include its affiliates where applicable.
| (a) | AUDIT FEES: The aggregate fees billed to the Registrant for professional services rendered by its independent auditors, Deloitte & Touche LLP, for the audit of the Registrant’s annual financial statements for the fiscal years ended 2024 and 2023 were $263,811 and $233,560, respectively. |
| | | |
| (b) | AUDIT-RELATED FEES: No such fees were billed to the Registrant by Deloitte & Touche LLP for the fiscal years ended 2024 and 2023. No such fees were billed to the Registrant’s adviser and any entity controlling, controlled by, or under common control with the adviser that provides ongoing services to the Registrant by Deloitte & Touche LLP* for the fiscal years ended 2024 and 2023. |
| | | |
| (c) | TAX FEES: No such fees were billed to the Registrant by Deloitte & Touche LLP for the fiscal years ended 2024 and 2023. No such fees were billed to the Registrant’s adviser and any entity controlling, controlled by, or under common control with the adviser that provides ongoing services to the Registrant by Deloitte & Touche LLP* for the fiscal years ended 2024 and 2023. |
| | | |
| (d) | ALL OTHER FEES: No such fees were billed to the Registrant by Deloitte & Touche LLP for the fiscal years ended 2024 and 2023. No such fees were billed to the Registrant’s adviser and any entity controlling, controlled by, or under common control with the adviser that provides ongoing services to the Registrant by Deloitte & Touche LLP* for the fiscal years ended 2024 and 2023. |
| | | |
| (e) | (1) AUDIT COMMITTEE PRE-APPROVAL POLICY: All services to be performed for the Registrant by Deloitte & Touche LLP must be pre-approved by the audit committee. All services performed during the fiscal years ended 2024 and 2023 were pre-approved by the committee. |
| | | |
| | (2) | Not applicable. |
| | | |
| | (f) | Not applicable. |
| | | |
| | (g) | The aggregate non-audit fees billed by Deloitte & Touche LLP for services rendered to the Registrant, the Registrant’s adviser and any entity controlling, controlled by, or under common control with the adviser that provides ongoing services to the Registrant, for the fiscal years ended 2024 and 2023 were $760,661 and $692,517, respectively. |
| | * | Refers to fees that were required to be approved by the audit committee for services that relate directly to the operations and financial reporting of the Registrant. |
| (h) | The audit committee considers whether the provision of non-audit services by Deloitte & Touche LLP to the Registrant’s adviser and any entity controlling, controlled by, or under common control with the adviser that provides ongoing services to the Registrant that were not pre-approved pursuant to paragraph (c)(7)(ii) of Rule 2-01 of Regulation S-X is compatible with maintaining Deloitte & Touche LLP’s independence. |
| | | |
Item 5. Audit Committee of Listed Registrants.
Not applicable.
Item 6. Investments.
| (a) | Please see portfolio of investments contained in the financial statements filed under Item 7 of this form N-CSR. |
TABLE OF CONTENTS
Table of Contents
Please note the Annual Financial Statements and Other Information only contains Items 7-11 of Form N-CSR. All items required by Form N-CSR are filed with the Securities and Exchange Commission.
| |
Item 7. Financial Statements and Financial Highlights for Open-End Management Investment Companies.
|
Portfolios of Investments
| | | |
| | | |
| | | |
| | | |
| | | |
| | | |
| | | |
| | | |
| | | |
| | | |
| | | |
| | | |
| | | |
| | | |
| | | |
| | | |
| | | |
| | | |
| | | | |
This material must be preceded or accompanied by a current prospectus (or summary prospectus, if available) for the applicable MassMutual Funds. Investors should consider a Fund’s investment objective, risks, and charges and expenses carefully before investing. This and other information about the investment company is available in the prospectus (or summary prospectus, if available). Read it carefully before investing.
TABLE OF CONTENTS
Item 7. Financial Statements and Financial Highlights for Open-End Management Investment Companies.
| | | |
| | MassMutual Clinton Limited Term Municipal Fund — Portfolio of Investments | |
| | | |
| | | | | | | |
Bonds & Notes — 99.2%
| | | | | | |
Municipal Obligations — 99.2%
| | | |
Arizona — 2.3%
| | | | | | |
Maricopa County Industrial Development Authority, AZ, Revenue Bonds, Series D,
5.000% 12/01/34 | | | $ 1,000,000 | | | $ 1,159,886 |
California — 6.2%
| | | | | | |
City of Los Angeles Department of Airports, CA, Revenue Bonds, Series A, 5.000% 5/15/36 | | | 1,000,000 | | | 1,059,611 |
Santa Ana Unified School District, CA, General Obligation, Series B, 0.000% 8/01/30 | | | 2,435,000 | | | 2,059,957 |
| | | | | | 3,119,568 |
Florida — 4.2%
| | | | | | |
State of Florida, General Obligation, Series A, 5.000% 6/01/26 | | | 2,000,000 | | | 2,085,626 |
Georgia — 0.6%
| | | | | | |
Fayette County Development Authority, GA
| | | | | | |
Revenue Bonds, 5.000% 10/01/26 | | | 150,000 | | | 155,733 |
Revenue Bonds, 5.000% 10/01/27 | | | 150,000 | | | 158,229 |
| | | | | | 313,962 |
Illinois — 11.4%
| | | | | | |
City of Chicago, IL, General Obligation, Series A,
4.000% 1/01/35 | | | 2,400,000 | | | 2,408,881 |
City of Chicago, IL, Waterworks Revenue, Revenue Bonds, Series A1, 5.000% 11/01/28 | | | 1,225,000 | | | 1,282,180 |
State of Illinois, General Obligation, Series A, 5.000% 11/01/24 | | | 2,005,000 | | | 2,007,513 |
| | | | | | 5,698,574 |
Maryland — 5.3%
| | | | | | |
County of Howard, MD, General Obligation, Series A,
5.000% 8/15/34 | | | 500,000 | | | 592,116 |
State of Maryland, General Obligation, Series GRO, 5.000% 3/15/26 | | | 2,000,000 | | | 2,072,602 |
| | | | | | 2,664,718 |
Nebraska — 3.3%
| | | | | | |
Central Plains Energy Project, NE, Revenue Bonds, Series A,
5.000% 9/01/32 | | | 1,500,000 | | | 1,624,749 |
| | | | | | | |
| | | | | | | |
New Jersey — 5.9%
| | | | | | |
New Jersey Economic Development Authority, Revenue Bonds, Series MMM, 4.000%
6/15/35 | | | $ 1,290,000 | | | $ 1,323,043 |
State of New Jersey, General Obligation, Series A,
5.000% 6/01/25 | | | 1,600,000 | | | 1,623,036 |
| | | | | | 2,946,079 |
New York — 13.1%
| | | | | | |
Metropolitan Transportation Authority, NY
| | | |
Revenue Bonds, Series E,
5.000% 11/15/32 | | | 2,000,000 | | | 2,221,744 |
Revenue Bonds, Series A,
5.250% 11/15/27 | | | 1,700,000 | | | 1,791,001 |
New York City Transitional Finance Authority, NY, Future Tax
Secured Revenue, Revenue
Bonds, Series C4,
4.050% VMIG1 11/01/36 | | | 200,000 | | | 200,000 |
Port Authority of New York & New Jersey, Revenue Bonds,
5.000% 9/01/27 | | | 2,300,000 | | | 2,302,956 |
| | | | | | 6,515,701 |
North Carolina — 0.4%
| | | | | | |
Charlotte-Mecklenburg Hospital Authority, NC, Revenue Bonds, Series C,
4.000% VMIG1 1/15/37 | | | 200,000 | | | 200,000 |
Pennsylvania — 11.9%
| | | | | | |
Commonwealth of Pennsylvania, General Obligation, Series 2ND, 5.000% 9/15/29 | | | 2,320,000 | | | 2,426,537 |
Lehigh County General Purpose Authority, PA
| | | | | | |
Revenue Bonds, 5.000% 2/01/34 | | | 500,000 | | | 554,875 |
Revenue Bonds, 5.000% 2/01/37 | | | 525,000 | | | 576,197 |
Pennsylvania Turnpike Commission, Revenue Bonds, Series 1ST,
5.000% 6/01/26 | | | 2,270,000 | | | 2,358,477 |
| | | | | | 5,916,086 |
South Carolina — 7.1%
| | | | | | |
South Carolina Jobs-Economic Development Authority, Revenue Bonds, Series A, 5.000% 11/01/31 | | | 2,100,000 | | | 2,385,025 |
| | | | | | | |
| | | | | |
The accompanying notes are an integral part of the financial statements. | | | | |
| | | 1
| |
| | | | | |
TABLE OF CONTENTS
| | MassMutual Clinton Limited Term Municipal Fund — Portfolio of Investments (Continued) | |
| | | | | | | |
South Carolina Public Service Authority, Revenue Bonds, Series B, 4.000% 12/01/38 | | | $ 1,120,000 | | | $ 1,145,280 |
| | | | | | 3,530,305 |
Texas — 16.7%
| | | | | | |
City of San Antonio, TX, General Obligation, 5.000% 2/01/26 | | | 2,390,000 | | | 2,468,230 |
Fort Worth Independent School District, TX, General Obligation, 5.000% 2/15/25 | | | 1,500,000 | | | 1,510,789 |
Mansfield Independent School District, TX, General Obligation,
4.000% 2/15/31 | | | 1,845,000 | | | 1,849,701 |
Tarrant County Cultural Education Facilities Finance Corp., TX, Revenue Bonds, Series A,
5.000% 7/01/32 | | | 2,200,000 | | | 2,490,157 |
| | | | | | 8,318,877 |
Virginia — 7.9%
| | | | | | |
County of Arlington, VA, General Obligation, Series B,
5.000% 8/15/26 | | | 1,800,000 | | | 1,885,038 |
Virginia Commonwealth Transportation Board, Revenue Bonds,
5.000% 3/15/26 | | | 2,000,000 | | | 2,071,437 |
| | | | | | 3,956,475 |
| | | | | | | |
| | | | | | | |
Wisconsin — 2.9%
| | | | | | |
University of Wisconsin Hospitals & Clinics
| | | | | | |
Revenue Bonds, Series A,
5.000% 4/01/29 | | | $ 745,000 | | | $821,541 |
Revenue Bonds, Series A,
5.000% 4/01/30 | | | 575,000 | | | 642,768 |
| | | | | | 1,464,309 |
TOTAL MUNICIPAL OBLIGATIONS
(Cost $49,267,473) | | | | | | 49,514,915 |
TOTAL BONDS & NOTES
(Cost $49,267,473) | | | | | | 49,514,915 |
TOTAL LONG-TERM INVESTMENTS
(Cost $49,267,473) | | | | | | 49,514,915 |
TOTAL INVESTMENTS — 99.2%
(Cost $49,267,473) (a) | | | | | | 49,514,915 |
Other Assets/(Liabilities) — 0.8% | | | | | | 409,842 |
NET ASSETS — 100.0% | | | | | | $49,924,757 |
| | | | | | | |
Notes to Portfolio of Investments
Percentages are stated as a percent of net assets.
(a)
| See Note 6 for aggregate cost for federal tax purposes. |
| | | | | |
| | | The accompanying notes are an integral part of the financial statements.
| |
2
| | | | |
| | | | | |
TABLE OF CONTENTS
| | | |
| | MassMutual Clinton Municipal Fund — Portfolio of Investments | |
| | | |
| | | | | | | |
Bonds & Notes — 98.8%
| | | | | | |
Municipal Obligations — 98.8%
| | | |
Alabama — 4.9%
| | | | | | |
County of Jefferson, AL, Sewer Revenue, Revenue Bonds,
5.250% 10/01/43 | | | $ 2,250,000 | | | $ 2,487,016 |
Arizona — 2.3%
| | | | | | |
Maricopa County Industrial Development Authority, AZ, Revenue Bonds, Series D,
5.000% 12/01/34 | | | 1,000,000 | | | 1,159,886 |
Florida — 2.0%
| | | | | | |
State of Florida, General Obligation, Series A, 5.000% 6/01/26 | | | 1,000,000 | | | 1,042,813 |
Illinois — 14.4%
| | | | | | |
Chicago O’Hare International Airport, IL, Revenue Bonds, Series B, 5.000% 1/01/39 | | | 2,375,000 | | | 2,447,660 |
City of Chicago, IL, General Obligation, Series A,
4.000% 1/01/35 | | | 2,400,000 | | | 2,408,881 |
State of Illinois, General Obligation, Series C, 5.000% 12/01/45 | | | 2,250,000 | | | 2,431,676 |
| | | | | | 7,288,217 |
Michigan — 2.6%
| | | | | | |
Grand Rapids Public Schools, MI, General Obligation,
5.000% 5/01/35 | | | 1,125,000 | | | 1,320,033 |
Nebraska — 3.2% | | | | | | |
Central Plains Energy Project, NE, Revenue Bonds, Series A,
5.000% 9/01/32 | | | 1,500,000 | | | 1,624,749 |
New Jersey — 7.2%
| | | | | | |
New Jersey Economic Development Authority, Revenue Bonds, Series MMM, 4.000% 6/15/35 | | | 1,290,000 | | | 1,323,043 |
State of New Jersey, General Obligation, Series A,
5.000% 6/01/25 | | | 2,300,000 | | | 2,333,115 |
| | | | | | 3,656,158 |
New York — 17.2% | | | | | | |
City of New York, NY, General Obligation, Series C,
4.000% 8/01/40 | | | 2,425,000 | | | 2,473,320 |
| | | | | | | |
| | | | | | | |
Empire State Development Corp., NY, Revenue Bonds, Series A,
4.000% 3/15/43 | | | $ 2,235,000 | | | $ 2,255,302 |
Metropolitan Transportation Authority, NY, Revenue Bonds, Series A, 5.250% 11/15/27 | | | 1,405,000 | | | 1,480,210 |
New York City Transitional Finance Authority, NY, Future Tax Secured Revenue, Revenue Bonds, Series C4,
4.050% VMIG1 11/01/36 | | | 200,000 | | | 200,000 |
Port Authority of New York &
New Jersey, Revenue Bonds,
5.000% 9/01/27 | | | 2,300,000 | | | 2,302,956 |
| | | | | | 8,711,788 |
Oklahoma — 1.0%
| | | | | | |
Oklahoma Water Resources Board, Revenue Bonds, Series A,
4.000% 10/01/48 | | | 505,000 | | | 505,317 |
Pennsylvania — 8.4%
| | | | | | |
Commonwealth of Pennsylvania, General Obligation, Series 2ND, 5.000% 9/15/29 | | | 2,300,000 | | | 2,405,619 |
Lehigh County General Purpose Authority, PA
| | | | | | |
Revenue Bonds, 5.000% 2/01/40 | | | 815,000 | | | 880,615 |
Revenue Bonds, 5.000% 2/01/41 | | | 900,000 | | | 968,806 |
| | | | | | 4,255,040 |
South Carolina — 2.3%
| | | | | | |
South Carolina Public Service Authority, Revenue Bonds, Series B, 4.000% 12/01/38 | | | 1,120,000 | | | 1,145,280 |
Tennessee — 2.2%
| | | | | | |
Metropolitan Government Nashville & Davidson County Sports Authority, TN, Revenue Bonds, Series A, 5.000% 7/01/41 | | | 1,000,000 | | | 1,112,016 |
Texas — 25.4%
| | | | | | |
Bexar County Hospital District, TX, General Obligation,
5.000% 2/15/48 | | | 1,500,000 | | | 1,628,379 |
Central Texas Turnpike System, TX, Revenue Bonds, Series C,
5.000% 8/15/32 | | | 1,115,000 | | | 1,271,241 |
City of San Antonio, TX, General Obligation, 5.000% 2/01/26 | | | 2,390,000 | | | 2,468,230 |
| | | | | | | |
| | | | | |
The accompanying notes are an integral part of the financial statements. | | | | |
| | | 3
| |
| | | | | |
TABLE OF CONTENTS
| | MassMutual Clinton Municipal Fund — Portfolio of Investments (Continued) | |
| | | | | | | |
Clifton Higher Education Finance Corp., TX, Revenue Bonds, Series A, 5.000% 8/15/34 | | | $ 1,160,000 | | | $ 1,326,943 |
County of Parker, TX, General Obligation, 4.000% 2/15/40 | | | 1,600,000 | | | 1,632,952 |
Hurst-Euless-Bedford Independent School District, TX, General Obligation, 4.000% 8/15/40 | | | 2,000,000 | | | 2,088,073 |
Tarrant County Cultural Education Facilities Finance Corp., TX, Revenue Bonds, Series A,
5.000% 7/01/32 | | | 2,200,000 | | | 2,490,157 |
| | | | | | 12,905,975 |
Virginia — 5.7%
| | | | | | |
Commonwealth of Virginia, General Obligation, Series A,
4.000% 6/01/40 | | | 1,715,000 | | | 1,840,378 |
County of Arlington, VA, General Obligation, Series B,
5.000% 8/15/26 | | | 1,000,000 | | | 1,047,243 |
| | | | | | 2,887,621 |
TOTAL MUNICIPAL OBLIGATIONS
(Cost $49,943,704) | | | | | | 50,101,909 |
TOTAL BONDS & NOTES
(Cost $49,943,704) | | | | | | 50,101,909 |
TOTAL LONG-TERM INVESTMENTS
(Cost $49,943,704) | | | | | | 50,101,909 |
TOTAL INVESTMENTS — 98.8% (Cost $49,943,704) (a) | | | | | | 50,101,909 |
Other Assets/(Liabilities) — 1.2% | | | | | | 601,049 |
NET ASSETS — 100.0% | | | | | | $50,702,958 |
| | | | | | | |
Notes to Portfolio of Investments
Percentages are stated as a percent of net assets.
(a)
| See Note 6 for aggregate cost for federal tax purposes. |
| | | | | |
| | | The accompanying notes are an integral part of the financial statements.
| |
4
| | | | |
| | | | | |
TABLE OF CONTENTS
| | | |
| | MassMutual Clinton Municipal Credit Opportunities Fund — Portfolio of Investments | |
| | | |
| | | | | | | |
Bonds & Notes — 99.3%
| | | | | | |
Municipal Obligations — 99.3%
| | | |
Alabama — 5.0%
| | | | | | |
County of Jefferson, AL, Sewer Revenue, Revenue Bonds,
5.250% 10/01/43 | | | $ 2,250,000 | | | $ 2,487,016 |
Arizona — 2.8%
| | | | | | |
Maricopa County Industrial Development Authority, AZ
| | | | | | |
Revenue Bonds, Series D,
5.000% 12/01/34 | | | 750,000 | | | 869,914 |
Revenue Bonds, Series D,
5.000% 12/01/44 | | | 500,000 | | | 551,594 |
| | | | | | 1,421,508 |
Colorado — 6.3%
| | | | | | |
Colorado Educational & Cultural Facilities Authority, Revenue Bonds, Series A, 5.500% 4/01/44 (a) | | | 1,000,000 | | | 1,049,015 |
Colorado Health Facilities Authority, Revenue Bonds, Series A2,
5.000% 8/01/44 | | | 2,000,000 | | | 2,084,817 |
| | | | | | 3,133,832 |
Florida — 8.2%
| | | | | | |
Capital Trust Authority, FL,
Revenue Bonds, Series A,
5.000% 6/01/54 (a) | | | 1,000,000 | | | 1,012,560 |
Florida Development Finance Corp.
| | | | | | |
Revenue Bonds, 4.000% 11/15/38 | | | 2,000,000 | | | 2,048,344 |
Revenue Bonds, 5.000% 7/01/41 | | | 1,000,000 | | | 1,030,138 |
| | | | | | 4,091,042 |
Georgia — 3.3%
| | | | | | |
Private Colleges & Universities Authority, GA, Revenue Bonds, 4.000% 4/01/44 | | | 1,690,000 | | | 1,676,162 |
Illinois — 16.1%
| | | | | | |
Chicago Board of Education, IL, General Obligation, Series A, 5.000% 12/01/40 | | | 1,750,000 | | | 1,805,858 |
Chicago O’Hare International Airport, IL, Revenue Bonds, Series B, 5.000% 1/01/39 | | | 1,375,000 | | | 1,417,066 |
City of Chicago, IL, General Obligation, Series A,
4.000% 1/01/35 | | | 2,400,000 | | | 2,408,881 |
State of Illinois, General Obligation, Series C, 5.000% 12/01/45 | | | 2,250,000 | | | 2,431,676 |
| | | | | | 8,063,481 |
| | | | | | | |
| | | | | | | |
Indiana — 3.3%
| | | | | | |
Indiana Finance Authority, Revenue Bonds, Series A, 5.500% 3/01/44 | | | $ 1,500,000 | | | $ 1,627,263 |
Missouri — 2.1%
| | | | | | |
Lees Summit Industrial Development Authority, MO, Revenue Bonds, Series A, 5.000% 8/15/39 | | | 1,000,000 | | | 1,074,773 |
Nebraska — 4.3%
| | | | | | |
Central Plains Energy Project, NE, Revenue Bonds, Series A,
5.000% 9/01/32 | | | 2,000,000 | | | 2,166,332 |
New York — 28.9%
| | | | | | |
City of New York, NY, General Obligation, Series C,
4.000% 8/01/40 | | | 2,425,000 | | | 2,473,320 |
Dutchess County Local Development Corp., NY, Revenue Bonds, Series A, 5.000% 7/01/51 | | | 2,375,000 | | | 2,439,180 |
Empire State Development Corp., NY, Revenue Bonds, Series A,
4.000% 3/15/43 | | | 2,240,000 | | | 2,260,347 |
Metropolitan Transportation Authority, NY, Revenue Bonds, Series A, 5.250% 11/15/49 | | | 1,500,000 | | | 1,649,172 |
New York City Transitional Finance Authority, NY, Future Tax Secured Revenue, Revenue Bonds, Series C4,
4.050% VMIG1 11/01/36 | | | 800,000 | | | 800,000 |
New York State Dormitory Authority, Revenue Bonds,
5.000% 7/01/40 | | | 1,850,000 | | | 2,038,253 |
New York State Thruway Authority, Revenue Bonds, Series N,
4.000% 1/01/47 | | | 1,690,000 | | | 1,689,187 |
Onondaga Civic Development Corp., NY, Revenue Bonds, Series A, 5.125% 8/01/44 | | | 1,095,000 | | | 1,124,312 |
| | | | | | 14,473,771 |
North Carolina — 4.2%
| | | | | | |
North Carolina Medical Care Commission, Revenue Bonds, Series A, 5.125% 10/01/54 | | | 2,000,000 | | | 2,093,661 |
| | | | | | | |
| | | | | |
The accompanying notes are an integral part of the financial statements. | | | | |
| | | 5
| |
| | | | | |
TABLE OF CONTENTS
| | MassMutual Clinton Municipal Credit Opportunities Fund — Portfolio of Investments (Continued) | |
| | | | | | | |
Pennsylvania — 6.2%
| | | | | | |
Lehigh County General Purpose Authority, PA
| | | | | | |
Revenue Bonds, 5.000% 2/01/41 | | | $ 480,000 | | | $ 516,696 |
Revenue Bonds, 5.000% 2/01/42 | | | 1,445,000 | | | 1,549,028 |
Philadelphia Authority for Industrial Development, PA, Revenue Bonds, 5.000% 6/15/39 (a) | | | 1,000,000 | | | 1,042,580 |
| | | | | | 3,108,304 |
Tennessee — 4.5%
| | | | | | |
Shelby County Health Educational & Housing Facilities Board, TN, Revenue Bonds, Series A,
5.250% 9/01/39 | | | 2,000,000 | | | 2,241,424 |
Texas — 4.1%
| | | | | | |
Texas Private Activity Bond Surface Transportation Corp., Revenue Bonds, Series A,
4.000% 12/31/35 | | | 2,000,000 | | | 2,052,037 |
TOTAL MUNICIPAL OBLIGATIONS
(Cost $49,199,401) | | | | | | 49,710,606 |
TOTAL BONDS & NOTES
(Cost $49,199,401) | | | | | | 49,710,606 |
TOTAL LONG-TERM INVESTMENTS
(Cost $49,199,401) | | | | | | 49,710,606 |
TOTAL INVESTMENTS — 99.3%
(Cost $49,199,401) (b) | | | | | | 49,710,606 |
Other Assets/(Liabilities) — 0.7% | | | | | | 373,520 |
NET ASSETS — 100.0% | | | | | | $50,084,126 |
| | | | | | | |
Notes to Portfolio of Investments
Percentages are stated as a percent of net assets.
(a)
| Security is exempt from registration under Regulation S or Rule 144A of the Securities Act of 1933. These securities are considered restricted and may be resold in transactions exempt from registration. At September 30, 2024, the aggregate market value of these securities amounted to $3,104,155 or 6.20% of net assets.
|
(b)
| See Note 6 for aggregate cost for federal tax purposes. |
| | | | | |
| | | The accompanying notes are an integral part of the financial statements.
| |
6
| | | | |
| | | | | |
TABLE OF CONTENTS
| | | |
| | MassMutual Global Floating Rate Fund — Portfolio of Investments | |
| | | |
| | | | | | | |
Equities — 0.8%
| | | | | | |
Common Stock — 0.8%
| | | | | | |
Communication Services — 0.5%
| | | | | | |
Learfield Communications,
Inc. (a) | | | 9,599 | | | $ 645,533 |
Consumer Discretionary — 0.1%
| | | | | | |
Serta Simmons, Inc. (Acquired 6/29/23, Cost $328,814) (a) (b) | | | 22,009 | | | 123,250 |
Consumer Staples — 0.2%
| | | | | | |
CTI Foods Holding Co.
LLC (a) (c) (d) | | | 8,019 | | | 239,447 |
Financials — 0.0%
| | | | | | |
Campfire Topco Ltd. (a) (c) (d) | | | 1,484,798 | | | — |
Jubilee Topco Ltd., A1
shares (a) (c) (d) | | | 689 | | | — |
Jubilee Topco Ltd., A2
shares (a) (c) (d) | | | 335,454 | | | — |
Jubilee Topco Ltd., A3
shares (a) (c) (d) | | | 215,760 | | | — |
Jubilee Topco Ltd., A4
shares (a) (c) (d) | | | 180,109 | | | — |
| | | | | | — |
Health Care — 0.0%
| | | | | | |
Don Jersey Topco Ltd.
(Acquired 8/03/20-6/23/23,
Cost $234,326) (a) (b) (c) (d) | | | 353,106 | | | 58,539 |
Information Technology — 0.0%
| | | | | | |
Travelex Topco Ltd. (a) (c) (d) | | | 3,524 | | | — |
TOTAL COMMON STOCK
(Cost $1,373,292) | | | | | | 1,066,769 |
TOTAL EQUITIES
(Cost $1,373,292) | | | | | | 1,066,769 |
| | | Principal
Amount | | | |
Bonds & Notes — 92.3%
| | | | | | |
Bank Loans — 86.1%
| | | | | | |
Advertising — 0.5%
| | | | | | |
Clear Channel Outdoor Holdings, Inc., 2024 Term Loan, 1 mo. USD Term SOFR + 4.000%
8.960% VRN 8/23/28 | | | $ 436,761 | | | 434,813 |
Wood Mackenzie Ltd., 2024 Term Loan B, 3 mo. USD Term SOFR + 3.500% 8.604% VRN 2/07/31 | | | 225,849 | | | 226,075 |
| | | | | | 660,888 |
| | | | | | | |
| | | | | | | |
Aerospace & Defense — 0.6%
| | | | | | |
TransDigm, Inc.
| | | | | | |
2023 Term Loan J, 3 mo. USD Term SOFR + 2.500%
7.104% VRN 2/28/31 | | | $ 352,852 | | | $ 351,370 |
2024 Term Loan, 3 mo. U.S. (Fed) Prime Rate + 1.500%,
7.320% VRN 1/19/32 | | | 378,788 | | | 377,208 |
| | | | | | 728,578 |
Airlines — 1.4%
| | | | | | |
Air Canada, 2024 Term Loan B,
3 mo. USD Term SOFR + 2.500% 7.253% VRN 3/21/31 | | | 502,216 | | | 502,843 |
American Airlines, Inc., 2021 Term Loan, 3 mo. USD Term SOFR + 4.750% 10.294% VRN 4/20/28 | | | 759,768 | | | 780,343 |
United Airlines, Inc., 2024 Term Loan B, 3 mo. USD Term SOFR + 2.750% 8.033% VRN 2/22/31 | | | 555,602 | | | 555,775 |
| | | | | | 1,838,961 |
Apparel — 0.6%
| | | | | | |
Samsonite International SA, 2024 Term Loan B, 1 mo. USD Term SOFR + 2.000%
6.845% VRN 6/21/30 | | | 705,882 | | | 707,061 |
Banks — 0.7%
| | | | | | |
AqGen Island Holdings, Inc., Term Loan, 1 mo. USD Term SOFR + 3.500% 8.460% VRN 8/02/28 | | | 827,219 | | | 825,672 |
Building Materials — 1.6%
| | | | | | |
Emrld Borrower LP, Term Loan B,
3 mo. USD Term SOFR + 2.500% 7.557% VRN 5/31/30 | | | 721,360 | | | 719,557 |
MI Windows and Doors LLC, 2024 Term Loan B2, 1 mo. USD Term SOFR + 3.500%
8.345% VRN 3/28/31 | | | 167,366 | | | 167,505 |
Nvent Electric Public Ltd. Co., Term Loan B, 0.000% 9/12/31 (e) | | | 431,034 | | | 430,496 |
Wilsonart LLC, 2024 Term Loan B,
3 mo. USD Term SOFR + 4.250% 8.854% VRN 8/05/31 | | | 724,376 | | | 715,922 |
| | | | | | 2,033,480 |
Chemicals — 3.2%
| | | | | | |
AAP Buyer, Inc., Term Loan B,
3 mo. USD Term SOFR + 3.250% 7.854% VRN 9/09/31 | | | 175,850 | | | 176,509 |
| | | | | | | |
| | | | | |
The accompanying notes are an integral part of the financial statements. | | | | |
| | | 7
| |
| | | | | |
TABLE OF CONTENTS
| | MassMutual Global Floating Rate Fund — Portfolio of Investments (Continued) | |
| | | | | | | |
CPC Acquisition Corp., Term Loan, 3 mo. USD Term SOFR + 3.750% 8.615% VRN 12/29/27 | | | $ 520,192 | | | $ 451,594 |
Flint Group Packaging INKS
North America Holdings LLC
| | | | | | |
EUR PIK 2nd lien Holdco Term Loan, 3 mo. EURIBOR + 0.100% 3.798% VRN 12/30/27
EUR (f) | | | 259,744 | | | 54,791 |
EUR PIK Holdco Term Loan,
3 mo. EURIBOR + 0.100% 3.798% VRN 12/30/27
EUR (f) | | | 194,776 | | | 191,204 |
INEOS Quattro Holdings UK Ltd., 2023 EUR 1st Lien Term Loan B, 1 mo. EURIBOR + 4.500% 7.878% VRN 2/04/29 EUR (f) | | | 500,000 | | | 556,096 |
New Arclin US Holding Corp., 2021 Term Loan, 1 mo. USD Term SOFR + 3.500%
8.445% VRN 9/30/28 | | | 593,809 | | | 592,918 |
Nouryon Finance BV, 2024 Incremental Term Loan B2,
3 mo. USD Term SOFR + 3.500% 8.821% VRN 4/03/28 | | | 216,476 | | | 216,656 |
Olympus Water US Holding Corp., 2024 USD Term Loan B,
3 mo. USD Term SOFR + 3.500% 8.104% VRN 6/20/31 | | | 840,614 | | | 839,984 |
PMHC II, Inc., 2022 Term Loan B,
3 mo. USD Term SOFR + 4.250% 9.704% VRN 4/23/29 | | | 864,583 | | | 842,882 |
Polar US Borrower LLC, 2024 Term Loan B1A, 1 mo. USD Term SOFR + 5.500%
10.457% VRN 10/16/28 | | | 163,022 | | | 119,821 |
| | | | | | 4,042,455 |
Commercial Services — 6.6%
| | | | | | |
APX Group, Inc., 2021 Term Loan B, 3 mo. U.S. (Fed) Prime Rate + 1.750%, 3 mo. USD Term SOFR + 2.750%
8.296% - 9.750% VRN 7/10/28 | | | 697,182 | | | 696,639 |
AVSC Holding Corp., 2020 Term Loan B1, 1 mo. USD Term SOFR + 3.000%
8.195% VRN 3/03/25 | | | 10 | | | 10 |
BIFM US Finance LLC, 2024 Term Loan, 1 mo. USD Term SOFR + 4.250% 9.095% VRN 5/31/28 | | | 221,018 | | | 221,709 |
| | | | | | | |
| | | | | | | |
Boost Newco Borrower LLC, 2024 USD Term Loan B, 3 mo. USD Term SOFR + 2.500%
7.104% VRN 1/31/31 | | | $551,687 | | | $ 551,455 |
CHG Healthcare Services, Inc., 2024 Term Loan B2, 1 mo. USD Term SOFR + 3.500%
8.460% VRN 9/29/28 | | | 212,058 | | | 212,263 |
Fleet Midco I Ltd., 2024 1st Lien Term Loan B, 6 mo. USD Term SOFR + 2.750%
7.578% VRN 2/21/31 | | | 181,924 | | | 181,469 |
Fugue Finance BV, 2023 EUR Term Loan B, 3 mo. EURIBOR + 4.250%
7.755% VRN 1/31/28 EUR (f) | | | 1,000,000 | | | 1,118,604 |
Mavis Tire Express Services Corp., 2024 Term Loan, 1 mo. USD Term SOFR + 3.500%
8.345% VRN 5/04/28 | | | 738,702 | | | 737,779 |
OMNIA Partners LLC, 2024 Term Loan B, 3 mo. USD Term SOFR + 3.250%
8.529% VRN 7/25/30 | | | 275,965 | | | 276,506 |
Spin Holdco, Inc., 2021 Term Loan, 3 mo. USD Term SOFR + 4.000% 9.256% VRN 3/04/28 | | | 640,051 | | | 557,913 |
Techem Verwaltungsgesellschaft 675 mbH, 2024 EUR Term Loan B,
1 mo. EURIBOR + 3.750%
7.292% VRN 7/15/29 EUR (f) | | | 1,000,000 | | | 1,114,452 |
Verisure Holding AB, 2021 EUR Term Loan, 3 mo. EURIBOR + 3.000%
6.345% VRN 3/27/28 EUR (f) | | | 1,375,000 | | | 1,531,101 |
Vortex Opco LLC
| | | | | | |
Second Out Term Loan, 3 mo. USD Term SOFR + 4.250% 9.118% VRN 12/17/28 | | | 374,035 | | | 266,032 |
First Out Term Loan, 3 mo. USD Term SOFR + 6.250%
11.003% VRN 4/30/30 | | | 120,766 | | | 125,295 |
Wand NewCo 3, Inc., 2024 1st Lien Term Loan B, 1 mo. USD Term SOFR + 3.250%
8.095% VRN 1/30/31 | | | 819,101 | | | 817,709 |
| | | | | | 8,408,936 |
Computers — 1.7%
| | | | | | |
Fortress Intermediate 3, Inc., Term Loan B, 1 mo. USD Term SOFR + 3.750% 8.595% VRN 6/27/31 | | | 306,346 | | | 305,580 |
| | | | | | | |
| | | | | |
| | | The accompanying notes are an integral part of the financial statements.
| |
8
| | | | |
| | | | | |
TABLE OF CONTENTS
| | MassMutual Global Floating Rate Fund — Portfolio of Investments (Continued) | |
| | | | | | | |
Magenta Security Holdings LLC, 2024 Super Priority Term Loan, 0.000% 7/27/28 (e) | | | $4,067 | | | $ 4,135 |
McAfee LLC, 2024 USD Term Loan B, 1 mo. USD Term SOFR + 3.250% 8.451% VRN 3/01/29 | | | 811,785 | | | 807,978 |
SITEL Worldwide Corp., 2021 USD Term Loan, 1 mo. USD Term SOFR + 3.750%
8.710% VRN 8/28/28 | | | 786,304 | | | 512,277 |
Vision Solutions, Inc.
| | | | | | |
2021 Incremental Term Loan,
3 mo. USD Term SOFR +
4.000% 9.514% VRN
4/24/28 | | | 337,632 | | | 328,138 |
2021 2nd Lien Term Loan,
3 mo. USD Term SOFR +
7.250% 12.764% VRN
4/23/29 | | | 270,186 | | | 251,611 |
| | | | | | 2,209,719 |
Cosmetics & Personal Care — 0.5%
|
Journey Personal Care Corp., 2021 Term Loan B, 1 mo. USD Term SOFR + 4.250%
9.210% VRN 3/01/28 | | | 579,709 | | | 578,260 |
Distribution & Wholesale — 0.3%
| | | | | | |
Gates Global LLC, 2024 Term Loan B5, 1 mo. USD Term SOFR + 2.250% 7.095% VRN 6/04/31 | | | 439,007 | | | 439,591 |
Diversified Financial Services — 2.2%
|
Advisor Group, Inc., 2024 Term Loan, 1 mo. USD Term SOFR + 4.000% 8.845% VRN 8/17/28 | | | 292,841 | | | 289,423 |
CPI Holdco B LLC, Term Loan, 1 mo. USD Term SOFR + 2.000% 6.845% VRN 5/19/31 | | | 522,372 | | | 519,666 |
Flint Group Midco Ltd., USD Opco Term Loan, 3 mo. USD Term SOFR + 4.250%
9.795% VRN 12/31/26 | | | 4,502 | | | 4,281 |
Flint Group Topco Ltd.
| | | | | | |
USD First Lien HoldCo Facility, 3 mo. USD Term SOFR +
0.362% 5.645% VRN 12/30/27 | | | 1,176,592 | | | 1,031,730 |
USD Second Lien HoldCo Facility, 3 mo. USD Term
SOFR + 0.362% 5.645% VRN
12/30/27 | | | 1,569,049 | | | 288,313 |
| | | | | | | |
| | | | | | | |
Franklin Square Holdings LP, 2024 Term Loan B, 1 mo. USD Term SOFR + 2.250%
7.095% VRN 4/25/31 | | | $ 703,150 | | | $ 702,271 |
| | | | | | 2,835,684 |
Electric — 1.1%
| | | | | | |
Alpha Generation LLC, Term Loan B, 0.000% 9/19/31 (e) | | | 223,090 | | | 223,050 |
Calpine Corp., Term Loan B9, 1 mo. USD Term SOFR + 2.000% 6.845% VRN 1/31/31 | | | 248,750 | | | 247,840 |
Constellation Renewables, LLC, 2020 Term Loan, 3 mo. USD Term SOFR + 2.250%
7.307% VRN 12/15/27 | | | 786,302 | | | 786,695 |
EFS Cogen Holdings I LLC, 2020 Term Loan B, 3 mo. USD Term SOFR + 3.500%
9.096% VRN 10/01/27 | | | 130,930 | | | 130,957 |
| | | | | | 1,388,542 |
Electrical Components & Equipment — 0.4%
|
SGB-SMIT Management GmbH, EUR Term Loan B, 1 mo. EURIBOR + 4.000% 7.378% - 7.378% VRN 4/18/28 EUR (f) | | | 429,322 | | | 478,496 |
Engineering & Construction — 0.8%
|
Brown Group Holding LLC
| | | | | | |
Term Loan B, 1 mo. USD Term SOFR + 2.750%
7.595% VRN 7/01/31 | | | 190,090 | | | 189,509 |
2022 Incremental Term Loan B2, 1 mo. USD Term SOFR +
2.750% , 3 mo. USD Term
SOFR + 2.750%,
7.595% - 8.002% VRN 7/01/31 | | | 301,310 | | | 300,472 |
DG Investment Intermediate Holdings 2, Inc., 2021 Term Loan, 1 mo. USD Term SOFR + 3.750%, 8.710% VRN 3/31/28 | | | 250,665 | | | 249,570 |
Energize HoldCo LLC, 2021 1st Lien Term Loan, 1 mo. USD Term SOFR + 3.750%
8.710% VRN 12/08/28 | | | 237,440 | | | 236,996 |
| | | | | | 976,547 |
Entertainment — 2.8%
| | | | | | |
Bally’s Corp., 2021 Term Loan B, 3 mo. USD Term SOFR + 3.250% 8.794% VRN 10/02/28 | | | 362,943 | | | 345,250 |
| | | | | | | |
| | | | | |
The accompanying notes are an integral part of the financial statements. | | | | |
| | | 9
| |
| | | | | |
TABLE OF CONTENTS
| | MassMutual Global Floating Rate Fund — Portfolio of Investments (Continued) | |
| | | | | | | |
CTI Foods Holding Co. LLC
| | | | | | |
2024 First Out Incremental Term Loan, 3 mo. USD Term
SOFR + 10.000%
15.388% VRN 5/01/26 (c) (d) | | | $83,521 | | | $ 83,521 |
2024 LIFO Term Loan, 3 mo. USD Term SOFR + 10.000%
15.388% VRN 3/15/27 (c) (d) | | | 169,442 | | | 169,442 |
Motion Finco SARL,
2023 EUR Term Loan B, 3 mo. EURIBOR + 3.750%
7.095% VRN 11/12/29 EUR (f) | | | 1,000,000 | | | 1,086,801 |
Scientific Games Holdings LP, 2024 USD Term Loan B, 3 mo. USD Term SOFR + 3.000%
8.318% VRN 4/04/29 | | | 751,788 | | | 746,833 |
Technicolor Creative Studios, Inc.
| | | | | | |
EUR PIK Super Senior Term Loan, 3 mo. EURIBOR +
0.000% 0.000% VRN 3/31/26
EUR (c) (d) (f) | | | 110,963 | | | 225,915 |
2023 EUR PIK Reinstated
Term Loan B, 6 mo.
EURIBOR + 0.500%
4.054% VRN 9/15/26 EUR (f) | | | 610,076 | | | 5,093 |
2023 EUR PIK Incremental New Money Term Loan, 3 mo. EURIBOR + 0.000% 4.172% VRN 7/31/26 EUR (c) (d) (f) | | | 57,426 | | | — |
2023 EUR PIK Term Loan, 3 mo. EURIBOR + 5.000% 5.844% VRN 3/27/33 EUR (c) (d) (f) | | | 246,435 | | | — |
2023 EUR PIK New Money Tranche, 3 mo. EURIBOR + 0.500% 11.500% VRN 7/31/26
EUR (c) (d) (f) | | | 128,030 | | | — |
2023 EUR PIK New Money Tranche A2 Undrawn, 3 mo. EURIBOR + 0.500%
11.500% VRN 7/31/26
EUR (f) | | | 105,348 | | | 11,727 |
EUR PIK Tranche 3 Note Term Loan, 1 yr. EURIBOR + 15.000% 18.116% VRN 3/31/26
EUR (c) (d) (f) | | | 33,289 | | | 67,775 |
EUR PIK Tranche 2 Note Term Loan, 1 yr. EURIBOR + 15.000% 18.684% VRN 3/31/26
EUR (c) (d) (f) | | | 66,578 | | | 135,550 |
| | | | | | | |
| | | | | | | |
Vue Entertainment International Ltd.
| | | | | | |
2023 EUR Floating PIK Reinstated Term Loan B, 2 mo. EURIBOR + 0.000% 3.593% VRN 12/31/27 EUR (f) | | | $245,827 | | | $ 165,554 |
2023 EUR Floating PIK Term Loan, 2 mo. EURIBOR + 0.100% 3.593% VRN 12/31/27
EUR (f) | | | 156,883 | | | 174,635 |
2023 EUR Floating PIK Super Senior Term Loan, 3 mo. EURIBOR + 4.000% 7.873% VRN 6/30/27 EUR (f) | | | 88,996 | | | 101,377 |
Vue International Bidco PLC, 2022 EUR Term Loan, 6 mo. EURIBOR + 8.000%
11.844% VRN 6/30/27 EUR (f) | | | 146,160 | | | 160,258 |
WMG Acquisition Corp.,
2024 Term Loan B, 1 mo. USD Term SOFR + 1.750%
6.595% VRN 1/24/31 | | | 123,686 | | | 123,506 |
| | | | | | 3,603,237 |
Environmental Controls — 0.2%
| | | | | | |
Madison IAQ LLC,
Term Loan, 6 mo. USD
Term SOFR + 2.750%
7.889% VRN 6/21/28 | | | 187,808 | | | 187,554 |
Food — 1.7%
| | | | | | |
CHG PPC Parent LLC,
2021 Term Loan, 1 mo. USD
Term SOFR + 2.750%
7.710% VRN 12/08/28 | | | 487,402 | | | 485,272 |
CTI Foods Holding Co. LLC
| | | | | | |
First Out Term Loan, 3 mo. USD Term SOFR + 7.000%
12.388% VRN 5/01/26 | | | 329,247 | | | 329,299 |
Second Out Term Loan, 3 mo. USD Term SOFR + 9.000%
14.388% VRN 5/01/26 | | | 220,776 | | | 209,773 |
Froneri International Ltd.,
2020 EUR Term Loan B1,
6 mo. EURIBOR + 2.125%
5.715% VRN 1/29/27 EUR (f) | | | 1,000,000 | | | 1,111,936 |
| | | | | | 2,136,280 |
Hand & Machine Tools — 0.1%
| | | | | | |
Madison Safety & Flow LLC, 2024 Term Loan B,
0.000% 9/19/31 (e) | | | 118,336 | | | 118,188 |
| | | | | | | |
| | | | | |
| | | The accompanying notes are an integral part of the financial statements.
| |
10
| | | | |
| | | | | |
TABLE OF CONTENTS
| | MassMutual Global Floating Rate Fund — Portfolio of Investments (Continued) | |
| | | | | | | |
Health Care - Products — 1.2%
| | | | | | |
Lifescan Global Corp.,
2023 Term Loan, 3 mo. USD Term SOFR + 6.500%
11.728% VRN 12/31/26 | | | $859,725 | | | $ 343,890 |
Medline Borrower LP,
2024 Term Loan B, 1 mo. USD Term SOFR + 2.750%
7.595% VRN 10/23/28 | | | 1,136,775 | | | 1,136,661 |
| | | | | | 1,480,551 |
Health Care - Services — 7.8%
| | | | | | |
Aveanna Healthcare LLC,
2021 2nd Lien Term Loan, 3 mo. USD Term SOFR + 7.000%
12.207% VRN 12/10/29 | | | 292,998 | | | 274,870 |
Catalent Pharma Solutions, Inc., 2021 Term Loan B3, 1 mo. USD Term SOFR + 2.000%
7.034% VRN 2/22/28 | | | 587,407 | | | 586,673 |
Charlotte Buyer, Inc., 2024 Term Loan B, 1 mo. USD Term SOFR + 4.750% 9.854% VRN 2/11/28 | | | 497,475 | | | 501,206 |
Concentra Health Services, Inc., Term Loan B, 1 mo. USD Term SOFR + 2.250%
7.095% VRN 7/28/31 | | | 173,210 | | | 172,777 |
Electron BidCo, Inc., 2021 Term Loan, 1 mo. USD Term SOFR + 3.000% 7.960% VRN 11/01/28 | | | 419,514 | | | 419,828 |
Heartland Dental LLC, 2024 Term Loan, 1 mo. USD Term SOFR + 4.500% 9.345% VRN 4/28/28 | | | 495,006 | | | 485,829 |
LifePoint Health, Inc., 2024 1st Lien Term Loan B, 0.000% 5/16/31 (e) | | | 702,212 | | | 700,808 |
Medical Solutions Holdings, Inc.
| | | | | | |
2021 1st Lien Term Loan, 1 mo. USD Term SOFR + 3.500%
8.852% VRN 11/01/28 | | | 10,027 | | | 7,570 |
2021 2nd Lien Term Loan, 3 mo. USD Term SOFR + 7.000% 12.352% VRN 11/01/29 | | | 294,737 | | | 191,579 |
Mehilainen Yhtiot Oy, 2024 EUR New Money Term Loan B5B, 0.000% 8/05/31 EUR (e) (f) | | | 848,223 | | | 943,727 |
Midwest Physician Administrative Services LLC, 2021 Term Loan, 3 mo. USD Term SOFR + 3.000% 7.865% VRN 3/12/28 | | | 734,116 | | | 661,226 |
Parexel International Corp., 2024 Term Loan B, 1 mo. USD Term SOFR + 3.000%
7.845% VRN 11/15/28 | | | 750,032 | | | 749,890 |
| | | | | | | |
| | | | | | | |
Radiology Partners, Inc., 2024 Extended Term Loan B, 3 mo. USD Term SOFR + 3.500% 1.500% - 8.883% VRN 1/31/29 | | | $1,561,332 | | | $ 1,525,233 |
Radnet Management, Inc., 2024 Term Loan B, 3 mo. USD Term SOFR + 2.500% 7.779% VRN 4/18/31 | | | 780,382 | | | 780,710 |
Select Medical Corp.,
2023 Term Loan B1, 1 mo. USD Term SOFR + 3.000%
7.845% VRN 3/06/27 | | | 177,357 | | | 177,948 |
Team Health Holdings, Inc., 2022 Term Loan B, 3 mo. USD Term SOFR + 5.250%
10.502% VRN 3/02/27 | | | 138,198 | | | 131,872 |
Tunstall Group Holdings Ltd.
| | | | | | |
2023 EUR Reinstated Term Loan B (Acquired 11/30/23-5/31/24,
Cost $352,044), 6 mo. EURIBOR
+ 0.100% 3.868% VRN 12/20/27 EUR (b) (f) | | | 348,738 | | | 310,558 |
2023 EUR Super Senior Term Loan (Acquired 11/30/23-5/31/24, Cost $123,163), 6 mo.
EURIBOR + 12.000%
15.768% VRN 12/18/26
EUR (b) (c) (d) (f) | | | 117,547 | | | 122,996 |
US Anesthesia Partners, Inc.,
2021 Term Loan, 1 mo. USD Term SOFR + 4.250%
9.565% VRN 10/01/28 | | | 55,516 | | | 54,308 |
Vivalto Sante SAS, 2021 EUR Term Loan, 3 mo. EURIBOR + 3.350% 6.695% VRN 7/21/28 EUR (f) | | | 1,000,000 | | | 1,107,183 |
| | | | | | 9,906,791 |
Holding Company - Diversified — 0.8%
|
CEP IV Investment 16 SARL, USD 2nd Lien Term Loan, 3 mo. USD Term SOFR + 9.250%
14.267% VRN 10/01/27 | | | 1,157,599 | | | 1,030,263 |
Home Furnishing — 0.4%
| | | | | | |
Mattress Firm, Inc., 2021 Term Loan B, 3 mo. USD Term SOFR + 4.250% 9.846% VRN 9/25/28 | | | 458,236 | | | 457,828 |
Insurance — 5.2%
| | | | | | |
Alliant Holdings Intermediate LLC, 2023 Term Loan B6, 1 mo. USD Term SOFR + 3.000%
7.965% VRN 11/06/30 | | | 660,876 | | | 657,261 |
| | | | | | | |
| | | | | |
The accompanying notes are an integral part of the financial statements. | | | | |
| | | 11
| |
| | | | | |
TABLE OF CONTENTS
| | MassMutual Global Floating Rate Fund — Portfolio of Investments (Continued) | |
| | | | | | | |
AmWINS Group, Inc., 2021 Term Loan B, 1 mo. USD Term SOFR + 2.250% 7.210% VRN 2/19/28 | | | $710,869 | | | $ 709,454 |
Assured Partners, Inc., 2024 Incremental Term Loan B5, 1 mo. USD Term SOFR + 3.500% 8.345% VRN 2/14/31 | | | 1,077,917 | | | 1,076,645 |
Asurion LLC
| | | | | | |
2024 Term Loan B12, 1 mo. USD Term SOFR + 4.250%
9.095% VRN 9/13/30 | | | 437,346 | | | 429,146 |
2021 Second Lien Term Loan B4, 1 mo. USD Term SOFR+ 5.250% 10.210% VRN 1/20/29 | | | 1,051,724 | | | 969,889 |
Broadstreet Partners, Inc., 2024 Term Loan B4, 1 mo. USD Term SOFR + 3.250% 8.095% VRN 6/13/31 | | | 665,000 | | | 662,094 |
HUB International Ltd., 2024 1st Lien Term Loan B, 3 mo. USD Term SOFR + 3.000%
8.255% VRN 6/20/30 | | | 223,038 | | | 222,681 |
Sedgwick Claims Management Services, Inc., 2023 Term Loan B, 3 mo. USD Term SOFR + 3.000% 8.252% VRN 7/31/31 | | | 1,024,624 | | | 1,022,318 |
USI, Inc., 2024 Term Loan (2029), 3 mo. USD Term SOFR + 2.750% 7.354% VRN 11/22/29 | | | 900,814 | | | 897,814 |
| | | | | | 6,647,302 |
Internet — 1.5%
| | | | | | |
ION Trading Technologies SARL, 2021 EUR Term Loan B, 3 mo. EURIBOR + 4.250% 7.595% VRN 4/03/28 EUR (f) | | | 870,750 | | | 929,399 |
MH Sub I LLC, 2023 Term Loan, 1 mo. USD Term SOFR + 4.250% 9.095% VRN 5/03/28 | | | 493,750 | | | 490,284 |
Proofpoint, Inc., 2024 Term Loan, 1 mo. USD Term SOFR + 3.000% 7.845% VRN 8/31/28 | | | 433,576 | | | 433,255 |
| | | | | | 1,852,938 |
Investment Companies — 0.0%
| | | | | | |
Hurtigruten ASA, 2024 EUR Holdco Term Loan (Acquired 9/30/24, Cost $426,982), 3 mo. EURIBOR + 0.020% 0.020% - 14.770% VRN 2/23/29 EUR (b) (f) | | | 735,610 | | | 46,576 |
Leisure Time — 1.9%
| | | | | | |
City Football Group Ltd., 2024 Term Loan, 1 mo. USD Term SOFR + 3.000% 7.969% VRN 7/22/30 | | | 787,665 | | | 782,412 |
| | | | | | | |
| | | | | | | |
Hurtigruten ASA
| | | | | | |
2024 EUR Term Loan B (Acquired 8/23/24, Cost $405,742), 6 mo. EURIBOR + 6.500% 9.910% VRN 9/30/27 EUR (b) (f) | | | $415,100 | | | $ 321,599 |
2024 EUR OpCo Exit Term Loan (Acquired 9/16/24, Cost $296,578), 3 mo. EURIBOR + 7.500% 10.910% VRN 6/30/27 EUR (b) (f) | | | 317,686 | | | 358,551 |
Sabre GLBL, Inc.
| | | | | | |
2021 Term Loan B2, 1 mo. USD Term SOFR + 3.500% 8.460% VRN 12/17/27 | | | 465,931 | | | 433,702 |
2021 Term Loan B1, 1 mo. USD Term SOFR + 3.500% 8.460% VRN 12/17/27 | | | 296,537 | | | 276,026 |
Topgolf Callaway Brands Corp., Term Loan B, 1 mo. USD Term SOFR + 3.000%
7.845% VRN 3/18/30 | | | 294,163 | | | 289,569 |
| | | | | | 2,461,859 |
Lodging — 2.0%
| | | | | | |
Casper BidCo SAS, 2024 EUR Term Loan B, 1 mo. EURIBOR + 4.250% 7.625% VRN 3/21/31 EUR (f) | | | 1,000,000 | | | 1,115,175 |
Hilton Grand Vacations Borrower LLC
| | | | | | |
2024 Incremental Term Loan B,
1 mo. USD Term SOFR +
2.250% 7.095% VRN 1/17/31 | | | 408,347 | | | 404,774 |
2021 Term Loan B, 1 mo. USD Term SOFR + 2.500%
7.345% VRN 8/02/28 | | | 122,972 | | | 122,127 |
One Hotels GmbH, EUR Term Loan B, 3 mo. EURIBOR + 4.500%
8.211% VRN 4/02/31 EUR (f) | | | 500,000 | | | 556,970 |
Station Casinos LLC, 2024 Term Loan B, 1 mo. USD Term SOFR + 2.250% 7.095% VRN 3/14/31 | | | 369,561 | | | 367,779 |
| | | | | | 2,566,825 |
Media — 4.2%
| | | | | | |
A-L Parent LLC, 2023 Take Back Term Loan, 1 mo. USD Term SOFR + 5.500%
10.345% VRN 6/30/28 | | | 552,769 | | | 550,696 |
Cumulus Media New Holdings, Inc., 2024 Term Loan B, 3 mo. USD Term SOFR + 5.000%
10.241% VRN 5/02/29 | | | 512,172 | | | 222,026 |
| | | | | | | |
| | | | | |
| | | The accompanying notes are an integral part of the financial statements.
| |
12
| | | | |
| | | | | |
TABLE OF CONTENTS
| | MassMutual Global Floating Rate Fund — Portfolio of Investments (Continued) | |
| | | | | | | |
DirecTV Financing LLC, 2024 Term Loan, 1 mo. USD Term SOFR + 5.250% 10.210% VRN 8/02/29 | | | $869,570 | | | $ 854,083 |
McGraw-Hill Global Education Holdings LLC, 2024 Term Loan B, 3 mo. USD Term SOFR + 4.000% 8.604% VRN 8/06/31 | | | 432,301 | | | 433,922 |
Sinclair Television Group, Inc., Term Loan B2B, 3 mo. USD Term SOFR + 2.500%
8.014% VRN 9/30/26 | | | 448,377 | | | 432,684 |
UPC Financing Partnership, 2021 USD Term Loan AX, 1 mo. USD Term SOFR + 2.925%
8.136% VRN 1/31/29 | | | 1,000,000 | | | 994,030 |
VMED O2 UK Holdco 4 Ltd., 2023 EUR Term Loan Z, 1 mo. EURIBOR + 3.425%
6.861% VRN 10/15/31 EUR (f) | | | 700,000 | | | 774,763 |
Ziggo BV, 2019 EUR Term Loan H, 1 mo. EURIBOR + 3.000% 6.436% VRN 1/31/29 EUR (f) | | | 1,000,000 | | | 1,092,690 |
| | | | | | 5,354,894 |
Metal Fabricate & Hardware — 0.4%
|
Grinding Media, Inc., 2021 Term Loan B, 3 mo. USD Term SOFR + 4.000% 9.569% VRN 10/12/28 | | | 268,136 | | | 267,466 |
Tiger Acquisition LLC, 2021 Term Loan, 1 mo. USD Term SOFR + 3.250% 8.195% VRN 6/01/28 | | | 176,448 | | | 175,345 |
| | | | | | 442,811 |
Mining — 0.2%
| | | | | | |
Arsenal AIC Parent LLC, 2024 1st Lien Term Loan B, 1 mo. USD Term SOFR + 3.250% 8.095% VRN 8/18/30 | | | 285,769 | | | 285,198 |
Oil & Gas Services — 0.3%
| | | | | | |
Apro LLC, 2024 Term Loan B, 1 mo. USD Term SOFR + 3.750% 8.868% VRN 7/09/31 | | | 393,701 | | | 394,685 |
Packaging & Containers — 5.0%
| | | | | | |
Altium Packaging LLC,
2024 Term Loan B, 1 mo. USD Term SOFR + 2.500%
7.345% VRN 6/11/31 (e) | | | 430,018 | | | 427,063 |
Charter NEX US, Inc., 2024 Term Loan B, 1 mo. USD Term SOFR + 3.250% 8.095% VRN 12/01/27 | | | 1,193,844 | | | 1,193,725 |
| | | | | | | |
| | | | | | | |
Clydesdale Acquisition Holdings, Inc., Term Loan B, 1 mo. USD Term SOFR + 3.175%
8.020% VRN 4/13/29 | | | $1,073,354 | | | $ 1,067,269 |
Graham Packaging Co., Inc., 2024 Term Loan B, 1 mo. USD Term SOFR + 2.500%, 7.345% VRN 8/04/27 | | | 223,340 | | | 223,022 |
Mauser Packaging Solutions Holding Co., 2024 Term Loan B, 1 mo. USD Term SOFR + 3.500% 8.701% VRN 4/15/27 | | | 864,729 | | | 865,931 |
Polar US Borrower LLC,
Second Out Term Loan A1, 3 mo. USD Term SOFR + 4.600% 9.848% VRN 10/02/28 | | | 399,290 | | | 318,266 |
Pretium PKG Holdings, Inc., 2021 2nd Lien Term Loan, 3 mo. USD Term SOFR + 6.750% 12.068% VRN 10/01/29 | | | 254,237 | | | 98,199 |
Proampac PG Borrower LLC, 2024 Term Loan, 3 mo. USD Term SOFR + 4.000%
9.118% - 9.301% VRN 9/15/28 | | | 794,188 | | | 794,783 |
Ring Container Technologies Group LLC, 2024 Term Loan B, 1 mo. USD Term SOFR + 2.750% 7.595% VRN 8/12/28 | | | 634,773 | | | 633,846 |
Trident TPI Holdings, Inc., 2024 Term Loan B6,
0.000% 9/15/28 (e) | | | 783,383 | | | 783,908 |
| | | | | | 6,406,012 |
Pharmaceuticals — 5.3%
| | | | | | |
Amneal Pharmaceuticals LLC, 2023 Term Loan B, 1 mo. USD Term SOFR + 5.500% 10.345% VRN 5/04/28 | | | 655,876 | | | 662,711 |
Elanco Animal Health, Inc., Term Loan B, 1 mo. USD Term SOFR + 1.750% 7.051% VRN 8/01/27 | | | 672,649 | | | 670,920 |
Gainwell Acquisition Corp., Term Loan B, 3 mo. USD Term SOFR + 4.000% 8.704% VRN 10/01/27 | | | 439,912 | | | 417,731 |
Grifols Worldwide Operations USA, Inc., 2019 USD Term Loan B, 3 mo. USD Term SOFR + 2.000% 7.402% VRN 11/15/27 | | | 680,838 | | | 660,732 |
IVC Acquisition Ltd., 2023 EUR Term Loan B, 6 mo. EURIBOR + 5.000% 8.795% VRN 12/12/28 EUR (f) | | | 1,237,000 | | | 1,377,338 |
| | | | | | | |
| | | | | |
The accompanying notes are an integral part of the financial statements. | | | | |
| | | 13
| |
| | | | | |
TABLE OF CONTENTS
| | MassMutual Global Floating Rate Fund — Portfolio of Investments (Continued) | |
| | | | | | | |
Jazz Financing Lux SARL, 2024 1st Lien Term Loan B, 1 mo. USD Term SOFR + 2.250%
7.095% VRN 5/05/28 | | | $ 780,652 | | | $ 779,606 |
Nidda Healthcare Holding AG, 2020 EUR Term Loan B1, 3 mo. EURIBOR + 3.500%
6.895% VRN 8/21/26 EUR (f) | | | 1,425,000 | | | 1,584,350 |
Organon & Co, 2024 USD Term Loan B, 1 mo. USD Term SOFR + 2.500% 7.465% VRN 5/19/31 | | | 337,400 | | | 336,135 |
Vizient, Inc., 2024 Term Loan B, 1 mo. USD Term SOFR + 2.000% 6.845% VRN 8/01/31 | | | 325,203 | | | 325,366 |
| | | | | | 6,814,889 |
Pipelines — 0.7%
| | | | | | |
Buckeye Partners LP, 2024 Term Loan B2, 1 mo. USD Term SOFR + 2.000%
6.845% VRN 11/22/30 | | | 298,502 | | | 298,018 |
Buckeye Partners, LP, 2024 Term Loan B5, 1 mo. USD Term SOFR + 1.750% 6.595% VRN 11/01/26 | | | 180,052 | | | 179,977 |
Freeport LNG Investments LLLP, Term Loan B, 3 mo. USD Term SOFR + 3.500%
9.044% VRN 12/21/28 | | | 128,501 | | | 127,249 |
GIP Pilot Acquisition Partners LP, 2024 Term Loan B, 3 mo. USD Term SOFR + 2.500% 7.818% VRN 10/04/30 | | | 217,711 | | | 217,891 |
Whitewater Whistler Holdings LLC, 2024 Term Loan B, 3 mo. USD Term SOFR + 2.250% 6.854% VRN 2/15/30 (e) | | | 121,478 | | | 121,083 |
| | | | | | 944,218 |
Real Estate — 0.3%
| | | | | | |
CoreLogic, Inc., Term Loan, 1 mo. USD Term SOFR + 3.500% 8.460% VRN 6/02/28 | | | 306,379 | | | 302,877 |
Cushman & Wakefield US Borrower LLC, 2020 Term Loan B, 1 mo. USD Term SOFR + 2.750% 7.710% VRN 8/21/25 | | | 12,637 | | | 12,629 |
| | | | | | 315,506 |
Retail — 2.2%
| | | | | | |
1011778 B.C. Unlimited Liability Co., 2024 Term Loan B6, 1 mo. USD Term SOFR + 1.750% 6.595% VRN 9/20/30 | | | 555,650 | | | 549,499 |
| | | | | | | |
| | | | | | | |
Gulfside Supply, Inc., Term Loan B, 3 mo. USD Term SOFR + 3.000% 8.286% VRN 6/17/31 | | | $187,036 | | | $ 186,802 |
Harbor Freight Tools USA, Inc., 2024 Term Loan B, 1 mo. USD Term SOFR + 2.500%, 6 mo. USD Term SOFR + 2.500% 7.241% - 7.345% VRN 6/05/31 | | | 744,386 | | | 732,409 |
IRB Holding Corp., 2024 Term Loan B, 1 mo. USD Term SOFR + 2.750% 7.695% VRN 12/15/27 | | | 609,730 | | | 608,816 |
Kodiak Building Partners, Inc., Term Loan B, 3 mo. USD Term SOFR + 3.250% 7.918% VRN 3/12/28 | | | 245,460 | | | 245,327 |
LBM Acquisition LLC, 2024 Incremental Term Loan B, 1 mo. USD Term SOFR + 3.750% 8.968% VRN 6/06/31 | | | 210,359 | | | 206,021 |
White Cap Buyer LLC, 2024 Term Loan B, 1 mo. USD Term SOFR + 3.250% 8.095% VRN 10/19/29 | | | 324,137 | | | 321,625 |
| | | | | | 2,850,499 |
Semiconductors — 0.3%
| | | | | | |
MKS Instruments, Inc.,
2024 USD Term Loan B, 1 mo. USD Term SOFR + 2.250% 7.170% VRN 8/17/29 | | | 422,437 | | | 422,015 |
Software — 10.4%
| | | | | | |
AppLovin Corp.
| | | | | | |
2024 Term Loan (2028), 1 mo. USD Term SOFR + 2.500% 7.345% VRN 10/25/28 | | | 447,581 | | | 447,263 |
2024 Term Loan (2030), 1 mo. USD Term SOFR + 2.500% 7.345% VRN 8/16/30 | | | 240,726 | | | 240,425 |
Ascend Learning LLC, 2021 Term Loan, 1 mo. USD Term SOFR + 3.500% 8.445% VRN 12/11/28 | | | 509,852 | | | 507,267 |
Athenahealth Group, Inc., 2022 Term Loan B, 1 mo. USD Term SOFR + 3.250% 8.095% VRN 2/15/29 | | | 1,046,773 | | | 1,039,142 |
Banff Merger Sub, Inc., 2024 Term Loan B, 3 mo. USD Term SOFR + 3.750% 9.005% VRN 7/30/31 | | | 816,894 | | | 814,713 |
BCPE Pequod Buyer, Inc., USD Term Loan B,
0.000% 9/19/31 (e) | | | 800,493 | | | 796,658 |
Central Parent, Inc., 2024 Term Loan B, 3 mo. USD Term SOFR + 3.250% 7.854% VRN 7/06/29 | | | 317,690 | | | 314,091 |
| | | | | | | |
| | | | | |
| | | The accompanying notes are an integral part of the financial statements.
| |
14
| | | | |
| | | | | |
TABLE OF CONTENTS
| | MassMutual Global Floating Rate Fund — Portfolio of Investments (Continued) | |
| | | | | | | |
Cloud Software Group, Inc., 2024 USD Term Loan B, 3 mo. USD Term SOFR + 4.000% 8.604% VRN 3/30/29 | | | $ 664,570 | | | $ 661,313 |
Cloudera, Inc., 2021 Term Loan, 1 mo. USD Term SOFR + 3.750% 8.695% VRN 10/08/28 | | | 599,055 | | | 581,832 |
Cotiviti Corp., 2024 Term Loan, 1 mo. USD Term SOFR + 3.250% 8.451% VRN 5/01/31 | | | 745,363 | | | 744,431 |
Darktrace PLC, Term Loan,
0.000% 7/02/31 (e) | | | 408,998 | | | 402,237 |
Genesys Cloud Services Holdings II LLC, Term Loan B, 1 mo. USD Term SOFR + 3.750% 8.710% VRN 12/01/27 | | | 205,753 | | | 205,780 |
Ivanti Software, Inc., 2021 Term Loan B, 3 mo. USD Term SOFR + 4.250% 9.833% VRN 12/01/27 | | | 467,334 | | | 395,547 |
Loyalty Ventures, Inc., Term Loan B, 0.000% 11/03/27 | | | 1,440,555 | | | 100,839 |
MedAssets Software Intermediate Holdings, Inc.
| | | | | | |
2021 Term Loan (Acquired 1/11/22, Cost $424,642), 1 mo. USD Term SOFR + 4.000% 8.960% VRN 12/18/28 (b) | | | 423,673 | | | 288,097 |
2021 2nd Lien Term Loan (Acquired 11/19/21, Cost $305,172), 1 mo. USD Term SOFR + 6.750% 11.710% VRN 12/17/29 (b) | | | 308,219 | | | 127,976 |
Mitchell International, Inc.
| | | | | | |
2024 1st Lien Term Loan, 1 mo. USD Term SOFR + 3.250% 8.095% VRN 6/17/31 | | | 748,212 | | | 736,555 |
2024 2nd Lien Term Loan, 1 mo. USD Term SOFR + 5.250% 10.095% VRN 6/17/32 | | | 500,000 | | | 490,835 |
Playtika Holding Corp., 2021 Term Loan, 1 mo. USD Term SOFR + 2.750% 7.710% VRN 3/13/28 | | | 243,950 | | | 242,074 |
Project Boost Purchaser LLC, 2024 Term Loan, 3 mo. USD Term SOFR + 3.500%
8.786% VRN 7/16/31 | | | 923,744 | | | 922,959 |
Project Ruby Ultimate Parent Corp., 2021 Term Loan, 1 mo. USD Term SOFR + 3.250%
8.210% VRN 3/10/28 | | | 740,409 | | | 738,788 |
| | | | | | | |
| | | | | | | |
Quest Software US Holdings, Inc., 2022 Term Loan, 3 mo. USD Term SOFR + 4.250%
9.652% VRN 2/01/29 | | | $528,930 | | | $ 351,738 |
Sophia LP, 2024 Term Loan B, 1 mo. USD Term SOFR + 3.500% 8.445% VRN 10/09/29 | | | 334,275 | | | 334,954 |
Sovos Compliance LLC, 2021 Term Loan, 1 mo. USD Term SOFR + 4.500% 9.460% VRN 8/11/28 | | | 492,401 | | | 491,731 |
SS&C Technologies Inc.,
2024 Term Loan B8, 1 mo. USD Term SOFR + 2.000% 6.845% VRN 5/09/31 | | | 546,328 | | | 546,235 |
Thunder Generation Funding LLC, Term Loan B,
0.000% 9/27/31 (e) | | | 679,028 | | | 678,180 |
Veritas US, Inc., 2021 USD Term Loan B (Acquired 12/14/21, Cost $117,359), 1 mo. USD Term SOFR + 5.000%
9.960% VRN 9/01/25 (b) | | | 117,359 | | | 109,690 |
| | | | | | 13,311,350 |
Telecommunications — 7.7%
| | | | | | |
Altice Financing SA, 2022 EUR Term Loan, 3 mo. EURIBOR + 5.000% 8.685% VRN 10/31/27 EUR (f) | | | 994,951 | | | 983,397 |
Consolidated Communications, Inc., 2021 Term Loan B, 1 mo. USD Term SOFR + 3.500%
8.460% VRN 10/02/27 (e) | | | 324,308 | | | 314,864 |
Delta TopCo, Inc., 2024 Term Loan, 6 mo. USD Term SOFR + 3.500% 8.198% VRN 11/30/29 | | | 720,504 | | | 718,703 |
Eircom Finco SARL, 2024 EUR Term Loan B, 1 mo. EURIBOR + 3.250% 6.760% VRN 5/15/29 EUR (f) | | | 1,000,000 | | | 1,115,776 |
Iridium Satellite LLC, 2024 Term Loan B, 1 mo. USD Term SOFR + 2.250% 7.095% VRN 9/20/30 | | | 205,046 | | | 201,168 |
Level 3 Financing, Inc.
| | | | | | |
2024 Extended Term Loan B1, 1 mo. USD Term SOFR +
6.560% 11.414% VRN 4/15/29 | | | 386,062 | | | 393,686 |
2024 Extended Term Loan B2, 1 mo. USD Term SOFR +
6.560% 11.414% VRN 4/15/30 | | | 388,894 | | | 395,214 |
| | | | | | | |
| | | | | |
The accompanying notes are an integral part of the financial statements. | | | | |
| | | 15
| |
| | | | | |
TABLE OF CONTENTS
| | MassMutual Global Floating Rate Fund — Portfolio of Investments (Continued) | |
| | | | | | | |
Lorca Holdco Ltd., 2024 EUR Term Loan B3, 6 mo. EURIBOR + 3.500% 7.195% VRN 3/25/31 EUR (f) | | | $1,000,000 | | | $ 1,113,183 |
Matterhorn Telecom SA, 2020 EUR Term Loan B, 3 mo. EURIBOR + 2.625% 6.080% VRN 9/15/26 EUR (f) | | | 852,727 | | | 950,523 |
Nuuday AS, EUR Term Loan B, 6 mo. EURIBOR + 6.500% 9.897% VRN 2/03/28 EUR (f) | | | 1,000,000 | | | 1,119,762 |
Telenet International Finance SARL, 2020 EUR Term Loan AQ,
1 mo. EURIBOR + 2.250%
5.686% VRN 4/30/29 EUR (f) | | | 1,295,933 | | | 1,415,735 |
Zegona Communications PLC, EUR Term Loan B, 3 mo. EURIBOR + 4.250% 7.886% VRN 7/17/29 EUR (f) | | | 1,000,000 | | | 1,114,596 |
| | | | | | 9,836,607 |
Transportation — 1.3%
| | | | | | |
Anarafe SLU, 2024 EUR PIK Super Senior Term Loan, 3 mo. EURIBOR + 10.000% 13.636% - 13.636% VRN 6/12/25
EUR (f) | | | 1,987 | | | 2,212 |
First Student Bidco, Inc.
| | | | | | |
Term Loan C, 3 mo. USD Term SOFR + 3.000%
7.668% VRN 7/21/28 | | | 162,179 | | | 162,247 |
Term Loan B, 3 mo. USD Term SOFR + 3.000%
7.865% VRN 7/21/28 | | | 530,415 | | | 530,638 |
Genesee & Wyoming Inc., 2024 Term Loan B, 3 mo. USD Term SOFR + 2.000%
6.604% VRN 4/10/31 | | | 491,343 | | | 490,115 |
Kenan Advantage Group, Inc., 2024 Term Loan B4, 1 mo. USD Term SOFR + 3.250% 8.095% VRN 1/25/29 | | | 485,863 | | | 483,030 |
| | | | | | 1,668,242 |
TOTAL BANK LOANS
(Cost $113,647,753) | | | | | | 109,695,988 |
Corporate Debt — 6.2%
| | | | | | |
Commercial Services — 2.4%
| | | | | | |
ADT Security Corp.
4.125% 8/01/29 (g) | | | 1,000,000 | | | 955,142 |
| | | | | | | |
| | | | | | | |
BCP V Modular Services Finance II PLC 4.750% 11/30/28
EUR (f) (g) | | | $ 1,000,000 | | | $ 1,082,538 |
Travelex Issuerco 2 PLC, (Acquired 5/07/24-8/05/24, Cost $898,279), 12.500% 8/05/25
GBP (b) (f) (g) | | | 699,741 | | | 1,051,825 |
| | | | | | 3,089,505 |
Cosmetics & Personal Care — 0.6%
|
Coty, Inc. 5.000% 4/15/26 (g) | | | 750,000 | | | 746,749 |
Diversified Financial Services — 0.0%
|
Travelex Financing PLC, (Acquired 1/13/20, Cost $274,355),
8.000% 5/15/22
EUR (b) (f) (g) (h) | | | 250,000 | | | 1,044 |
Health Care - Services — 0.6%
| | | | | | |
Tenet Healthcare Corp. 4.250% 6/01/29 | | | 750,000 | | | 723,130 |
Internet — 0.6%
| | | | | | |
Engineering - Ingegneria Informatica - SpA 11.125% 5/15/28
EUR (f) (g) | | | 200,000 | | | 225,969 |
United Group BV 4.000% 11/15/27 EUR (f) (g) | | | 500,000 | | | 543,384 |
| | | | | | 769,353 |
Machinery - Diversified — 0.0%
| | | | | | |
Galapagos SA 1.000% 6/15/21 EUR (f) (g) (h) | | | 20,000 | | | 111 |
Media — 0.5%
| | | | | | |
Tele Columbus AG 10.000% 1/01/29 EUR (f) (g) | | | 745,223 | | | 653,266 |
Packaging & Containers — 0.5%
| | | | | | |
Pactiv Evergreen Group Issuer LLC/Pactiv Evergreen Group Issuer, Inc. 4.375% 10/15/28 (g) | | | 750,000 | | | 718,380 |
Retail — 0.0%
| | | | | | |
House of Fraser Funding PLC 1.000% 9/15/20 GBP (f) (g) (h) | | | 300,000 | | | 200 |
Telecommunications — 0.9%
| | | | | | |
Odido Holding BV 3.750% 1/15/29 EUR (f) (g) | | | 500,000 | | | 546,139 |
Vmed O2 UK Financing I PLC 4.500% 7/15/31 GBP (f) (g) | | | 500,000 | | | 576,560 |
| | | | | | 1,122,699 |
| | | | | | | |
| | | | | |
| | | The accompanying notes are an integral part of the financial statements.
| |
16
| | | | |
| | | | | |
TABLE OF CONTENTS
| | MassMutual Global Floating Rate Fund — Portfolio of Investments (Continued) | |
| | | | | | | |
Transportation — 0.1%
| | | | | | |
Anarafe SL 15.386% 12/31/26 EUR (f) (g) | | | $ 75,139 | | | $ 101,206 |
TOTAL CORPORATE DEBT (Cost $8,224,629) | | | | | | 7,925,643 |
TOTAL BONDS & NOTES
(Cost $121,872,382) | | | | | | 117,621,631 |
| | | | | | | |
| | | | | | | |
Rights — 0.0%
| | | | | | |
Industrial — 0.0%
| | | | | | |
Silk Topco AS, CVR (a) (c) (d) | | | 105,906 | | | — |
TOTAL RIGHTS
(Cost $0) | | | | | | — |
Warrants — 0.0%
| | | | | | |
Technology — 0.0%
| | | | | | |
Travelex Topco Ltd. (a) | | | 285 | | | 7,621 |
TOTAL WARRANTS
(Cost $0) | | | | | | 7,621 |
TOTAL LONG-TERM INVESTMENTS
(Cost $123,245,674) | | | | | | 118,696,021 |
| | | | | | | |
| | | | | | | |
Short-Term Investments — 5.0%
|
Repurchase Agreement — 5.0%
| | | | | | |
Fixed Income Clearing Corp., Repurchase Agreement, dated 9/30/24, 1.520%, due 10/01/24 (i) | | | $6,330,491 | | | 6,330,491 |
TOTAL SHORT-TERM INVESTMENTS
|
(Cost $6,330,491) | | | | | | 6,330,491 |
TOTAL INVESTMENTS — 98.1%
|
(Cost $129,576,165) (j) | | | | | | 125,026,512 |
Other Assets/
(Liabilities) — 1.9% | | | | | | 2,453,875 |
NET ASSETS — 100.0% | | | | | | $127,480,387 |
| | | | | | | |
Abbreviation Legend
| | | | | |
CVR | | | Contingent Value Rights
| |
EURIBOR | | | Euro Inter-Bank Offered Rate
| |
PIK | | | Payment in kind
| |
SOFR | | | Secured Overnight Financing Rate
| |
VRN | | | Variable Rate Note | |
| | | | | |
Notes to Portfolio of Investments
Percentages are stated as a percent of net assets.
(a)
| Non-income producing security.
|
(b)
| Restricted security. Certain securities are restricted to resale. At September 30, 2024, these securities amounted to a value of $2,920,701 or 2.29% of net assets. The Fund generally bears the costs, if any, associated with the disposition of restricted securities.
|
(c)
| Investment is valued using significant unobservable inputs.
|
(d)
| This security is fair valued in good faith in accordance with procedures approved by the Board of Trustees. At September 30, 2024, these securities amounted to a value of $1,103,185 or 0.87% of net assets.
|
(e)
| All or a portion of the security represents unsettled bank loan commitments at September 30, 2024, where the rate will be determined at time of settlement.
|
(f)
| The principal amount of the security is in foreign currency. The market value is in U.S. dollars.
|
(g)
| Security is exempt from registration under Regulation S or Rule 144A of the Securities Act of 1933. These securities are considered restricted and may be resold in transactions exempt from registration. At September 30, 2024, the aggregate market value of these securities amounted to $7,202,513 or 5.65% of net assets.
|
(h)
| Security is currently in default due to bankruptcy or failure to make payment of principal or interest of the issuer. Income is not being accrued. At September 30, 2024, these securities amounted to a value of $1,355 or 0.00% of net assets.
|
(i)
| Maturity value of $6,330,759. Collateralized by U.S. Government Agency obligations with a rate of 3.625%, maturity date of 2/15/53, and an aggregate market value, including accrued interest, of $6,457,253.
|
(j)
| See Note 6 for aggregate cost for federal tax purposes. |
| | | | | |
The accompanying notes are an integral part of the financial statements. | | | | |
| | | 17
| |
| | | | | |
TABLE OF CONTENTS
| | MassMutual Global Floating Rate Fund — Portfolio of Investments (Continued) | |
Country weightings, as a percentage of net assets, is as follows:
United States | | | 64.5% |
United Kingdom | | | 9.1% |
Germany | | | 4.7% |
France | | | 2.1% |
Belgium | | | 1.9% |
Switzerland | | | 1.5% |
Netherlands | | | 1.5% |
Sweden | | | 1.2% |
Canada | | | 1.1% |
Spain | | | 1.0% |
Denmark | | | 0.9% |
Ireland | | | 0.9% |
| | | | |
Portugal | | | 0.8% |
Finland | | | 0.7% |
Norway | | | 0.6% |
Slovenia | | | 0.4% |
Italy | | | 0.2% |
Luxembourg | | | 0.0% |
Lithuania | | | 0.0% |
Total Long-Term Investments | | | 93.1% |
Short-Term Investments and Other Assets and
Liabilities | | | 6.9% |
Net Assets | | | 100.0% |
| | | | |
Forward contracts
| | | | | | | | | | | | | |
Canadian Imperial Bank of Commerce*
| | | 10/23/24 | | | USD | | | 2,350,509 | | | GBP | | | 1,783,171 | | | $(33,480) |
Morgan Stanley & Co. LLC*
| | | 10/23/24 | | | USD | | | 30,391,582 | | | EUR | | | 27,288,140 | | | (10,498) |
| | | | | | $(43,978) |
| | | | | | | |
* Contracts are subject to a master netting agreement or similar agreement.
Currency Legend
| | | | | |
EUR | | | Euro
| |
GBP | | | British Pound
| |
USD | | | U.S. Dollar | |
| | | | | |
| | | | | |
| | | The accompanying notes are an integral part of the financial statements.
| |
18
| | | | |
| | | | | |
TABLE OF CONTENTS
| | | |
| | MassMutual Global Credit Income Opportunities Fund — Portfolio of Investments | |
| | | |
| | | | | | | |
Equities — 0.4%
| | | | | | |
Common Stock — 0.4%
| | | | | | |
Germany — 0.0%
| | | | | | |
Campfire Topco Ltd. (a) (b) (c) | | | 448,154 | | | $— |
Lithuania — 0.0%
| | | | | | |
Jubilee Topco Ltd., A3
shares (a) (b) (c) | | | 233,558 | | | — |
Spain — 0.0%
| | | | | | |
Bahia De Las Isletas SL
Class A (a) (b) (c) | | | 5,454,162 | | | — |
United Kingdom — 0.1%
| | | | | | |
Don Jersey Topco Ltd.
(Acquired 8/03/20-1/11/22,
Cost $205,530) (a) (b) (c) (d) | | | 292,774 | | | 48,537 |
Jubilee Topco Ltd., A1
shares (a) (b) (c) | | | 746 | | | — |
Jubilee Topco Ltd., A2
shares (a) (b) (c) | | | 363,125 | | | — |
Jubilee Topco Ltd., A4
shares (a) (b) (c) | | | 194,966 | | | — |
KCA DEUTAG Drilling Ltd. (a) | | | 2,731 | | | 191,989 |
Travelex Topco Ltd. (a) (b) (c) | | | 9,365 | | | — |
| | | | | | 240,526 |
United States — 0.3%
| | | | | | |
Learfield Communications, Inc. (a) | | | 4,698 | | | 315,940 |
Serta Simmons, Inc. (Acquired 6/29/23, Cost $220,156) (a) (d) | | | 14,736 | | | 82,522 |
| | | | | | 398,462 |
TOTAL COMMON STOCK
(Cost $697,657) | | | | | | 638,988 |
TOTAL EQUITIES
(Cost $697,657) | | | | | | 638,988 |
| | | | | | | |
| | | | | | | |
Bonds & Notes — 90.9%
| | | | | | |
Bank Loans — 51.0%
| | | | | | |
Belgium — 1.1%
| | | | | | |
CEP IV Investment 16 SARL, USD 2nd Lien Term Loan, 3 mo. USD Term SOFR + 9.250%
14.267% VRN 10/01/27 | | | $1,350,532 | | | 1,201,974 |
| | | | | | | |
| | | | | | | |
Telenet Financing USD LLC, 2020 USD Term Loan AR, 1 mo. USD Term SOFR + 2.000%
7.211% VRN 4/30/28 | | | $500,000 | | | $481,250 |
| | | | | | 1,683,224 |
Czech Republic — 0.3%
| | | | | | |
AI Sirona (Luxembourg) Acquisition SARL, 2024 EUR Term Loan B,
1 mo. EURIBOR + 4.000%
7.378% VRN 9/30/28 EUR (e) | | | 444,444 | | | 496,702 |
Denmark — 0.4%
| | | | | | |
Auris Luxembourg III SARL, 2024 EUR Term Loan B3, 6 mo. EURIBOR + 4.500%
8.268% VRN 2/28/29 EUR (e) | | | 500,000 | | | 556,113 |
Finland — 0.3%
| | | | | | |
Spa Holdings 3 Oy, USD Term Loan B, 3 mo. USD Term SOFR + 3.750%, 8.615% VRN 2/04/28 | | | 496,259 | | | 495,019 |
France — 1.1%
| | | | | | |
Casper BidCo SAS, 2024 EUR Term Loan B, 1 mo. EURIBOR + 4.250% 7.625% VRN 3/21/31 EUR (e) | | | 500,000 | | | 557,587 |
CCP Lux Holding SARL, 2023
EUR Term Loan B, 3 mo. EURIBOR + 4.750%
8.458% VRN 1/05/28 EUR (e) | | | 500,000 | | | 556,575 |
Cerba Healthcare SAS, 2021
EUR Term Loan B, 1 mo. EURIBOR + 3.700%
7.078% VRN 6/30/28 EUR (e) | | | 500,000 | | | 489,747 |
Technicolor Creative Studios, Inc.
| | | | | | |
EUR PIK Super Senior Term Loan, 3 mo. EURIBOR + 0.000% 0.000% VRN 3/31/26
EUR (b) (c) (e) | | | 7,820 | | | 15,921 |
2023 EUR PIK Reinstated Term Loan B, 6 mo. EURIBOR + 0.500%
4.054% VRN 9/15/26 EUR (e) | | | 203,359 | | | 1,698 |
2023 EUR PIK Incremental New Money Term Loan, 3 mo. EURIBOR + 0.000% 4.172% VRN 7/31/26 EUR (b) (c) (e) | | | 19,142 | | | — |
2023 EUR PIK Term Loan, 3 mo. EURIBOR + 5.000%
5.844% VRN 3/27/33
EUR (b) (c) (e) | | | 82,145 | | | — |
| | | | | | | |
| | | | | |
The accompanying notes are an integral part of the financial statements. | | | | |
| | | 19
| |
| | | | | |
TABLE OF CONTENTS
| | MassMutual Global Credit Income Opportunities Fund — Portfolio of Investments (Continued) | |
| | | | | | | |
EUR PIK Tranche 3 Note Term Loan, 1 yr. EURIBOR + 15.000%
18.116% VRN 3/31/26
EUR (b) (c) (e) | | | $2,346 | | | $4,776 |
EUR PIK Tranche 2 Note Term Loan, 1 yr. EURIBOR + 15.000%
18.684% VRN 3/31/26
EUR (b) (c) (e) | | | 4,692 | | | 9,553 |
| | | | | | 1,635,857 |
Germany — 2.8%
| | | | | | |
CeramTec AcquiCo GmbH, 2022 EUR Term Loan B, 3 mo. EURIBOR + 3.500%
7.005% VRN 3/16/29 EUR (e) | | | 500,000 | | | 554,237 |
DexKo Global, Inc., 2021 EUR German Term Loan, 3 mo. EURIBOR + 4.000%
7.345% VRN 10/04/28 EUR (e) | | | 85,500 | | | 91,684 |
Dynamo Newco II GmbH, EUR Term Loan B, 0.000% 9/26/31
EUR (e) (f) | | | 500,000 | | | 556,230 |
Flint Group Midco Ltd., USD Opco Term Loan, 3 mo. USD Term
SOFR + 4.250%
9.795% VRN 12/31/26 | | | 175,774 | | | 167,131 |
Flint Group Packaging INKS North America Holdings LLC
| | | | | | |
EUR PIK 2nd lien Holdco Term Loan, 3 mo. EURIBOR + 0.100%
3.798% VRN 12/30/27 EUR (e) | | | 388,302 | | | 81,909 |
EUR PIK Holdco Term Loan, 3 mo. EURIBOR + 0.100%
3.798% VRN 12/30/27 EUR (e) | | | 291,178 | | | 285,839 |
EUR Opco Term Loan, 3 mo. EURIBOR + 4.250%
7.948% VRN 12/31/26 EUR (e) | | | 556,180 | | | 588,286 |
Flint Group Topco Ltd.
| | | | | | |
USD First Lien HoldCo Facility, 3 mo. USD Term SOFR + 0.362%
5.645% VRN 12/30/27 | | | 93,600 | | | 82,076 |
USD Second Lien HoldCo Facility, 3 mo. USD Term SOFR + 0.362% 5.645% VRN 12/30/27 | | | 124,820 | | | 22,936 |
Nidda Healthcare Holding AG, 2020 EUR Term Loan B1, 1 mo. EURIBOR + 3.500%
6.895% VRN 8/21/26 EUR (e) | | | 500,000 | | | 555,912 |
One Hotels GmbH, EUR Term Loan B, 3 mo.
EURIBOR + 4.500%
8.211% VRN 4/02/31 EUR (e) | | | 500,000 | | | 556,970 |
| | | | | | | |
| | | | | | | |
Techem Verwaltungsgesellschaft 675 GmbH, 2024 EUR Term Loan B,
1 mo. EURIBOR + 3.750%
7.292% VRN 7/15/29 EUR (e) | | | $500,000 | | | $557,226 |
| | | | | | 4,100,436 |
Ireland — 0.4%
| | | | | | |
Virgin Media Ireland Ltd., EUR Term Loan, 1 mo. EURIBOR + 3.575% 7.011% VRN 7/15/29 EUR (e) | | | 500,000 | | | 551,415 |
Luxembourg — 1.5%
| | | | | | |
Albion Financing 3 SARL, 2024 EUR Term Loan B, 3 mo. EURIBOR + 4.250%
7.958% VRN 8/16/29 EUR (e) | | | 510,000 | | | 569,591 |
Arvos HoldCo SARL, 2024 USD HoldCo Term Loan B2 (Acquired 4/09/24, Cost $2,945), 3 mo. USD Term SOFR + 0.500%
0.500% VRN 11/29/27 (d) | | | 48,317 | | | 12,804 |
Arvos Holding GmbH, 2024 USD Opco Term Loan B4, 3 mo. USD Term SOFR + 5.500%
11.014% VRN 8/29/27 | | | 277,979 | | | 232,112 |
Ineos Finance PLC, 2024 EUR 1st Lien Term Loan B, 1 mo. EURIBOR + 3.500%
6.878% VRN 6/23/31 EUR (e) | | | 500,000 | | | 553,853 |
Piolin Bidco SAU, 2024 EUR Term Loan B4, 6 mo. EURIBOR + 4.500%
8.178% VRN 9/16/29 EUR (e) | | | 500,000 | | | 553,814 |
Venga Finance SARL, 2024 Term Loan, 3 mo. USD Term
SOFR + 4.250%
9.569% VRN 6/28/29 | | | 296,220 | | | 296,738 |
| | | | | | 2,218,912 |
Netherlands — 1.9%
| | | | | | |
Nobian Finance BV, EUR Term Loan B, 1 mo. EURIBOR + 3.400% 6.942% VRN 7/01/26 EUR (e) | | | 519,423 | | | 578,063 |
Nouryon Finance BV
| | | | | | |
2024 USD Term Loan B1, 3 mo. USD Term SOFR + 3.500%
8.628% VRN 4/03/28 | | | 499,402 | | | 499,402 |
2024 Incremental Term Loan B2, 3 mo. USD Term
SOFR + 3.500%
8.821% VRN 4/03/28 | | | 115,454 | | | 115,550 |
| | | | | | | |
| | | | | |
| | | The accompanying notes are an integral part of the financial statements.
| |
20
| | | | |
| | | | | |
TABLE OF CONTENTS
| | MassMutual Global Credit Income Opportunities Fund — Portfolio of Investments (Continued) | |
| | | | | | | |
Pegasus BidCo BV, 2024 EUR Term Loan, 3 mo. EURIBOR + 3.750% 7.292% VRN 7/12/29 EUR (e) | | | $469,970 | | | $523,345 |
TMF Group Holding BV, 2024 EUR Term Loan B, 3 mo. EURIBOR + 3.750%
7.455% VRN 5/03/28 EUR (e) | | | 500,000 | | | 558,044 |
Ziggo BV, 2019 EUR Term Loan H, 1 mo. EURIBOR + 3.000%
6.436% VRN 1/31/29 EUR (e) | | | 500,000 | | | 546,345 |
| | | | | | 2,820,749 |
Norway — 0.2%
| | | | | | |
Hurtigruten ASA
| | | | | | |
2024 EUR Holdco Term Loan (Acquired 9/30/24, Cost $213,505), 3 mo. EURIBOR + 0.020%,
0.020% VRN 2/23/29
EUR (d) (e) | | | 367,805 | | | 23,288 |
2024 EUR Term Loan B (Acquired 8/23/24, Cost $202,888), 6 mo. EURIBOR + 6.500%
9.910% VRN 9/30/27
EUR (d) (e) | | | 207,550 | | | 160,800 |
2024 EUR OpCo Exit Term Loan (Acquired 9/16/24, Cost $148,289), 6 mo. EURIBOR + 7.500%, 10.910% VRN 6/30/27
EUR (d) (e) | | | 158,843 | | | 179,275 |
| | | | | | 363,363 |
Portugal — 0.3%
| | | | | | |
Altice Financing SA, 2023 EUR Term Loan, 3 mo. EURIBOR + 5.000% 8.658% VRN 10/31/27 EUR (e) | | | 496,250 | | | 490,487 |
Spain — 1.9%
| | | | | | |
Anarafe SLU, 2024 EUR PIK Super Senior Term Loan, 3 mo.
EURIBOR + 10.000%
13.636% VRN 6/12/25 EUR (e) | | | 843 | | | 938 |
Areas Worldwide SA, 2024 EUR Term Loan B3, 3 mo.
EURIBOR + 5.000%
8.738% VRN 12/31/29 EUR (e) | | | 500,000 | | | 555,117 |
Boluda Towage SL, 2024 EUR Term Loan B, 3 mo. EURIBOR + 3.750% 7.255% VRN 1/31/30 EUR (e) | | | 500,000 | | | 558,094 |
| | | | | | | |
| | | | | | | |
Dorna Sports SL, 2022 EUR Term Loan B, 6 mo. EURIBOR + 3.250% 6.922% VRN 3/30/29 EUR (e) | | | $500,000 | | | $556,747 |
HNVR Holdco Ltd., 2024 EUR Term Loan D2, 6 mo.
EURIBOR + 4.250%
8.092% VRN 9/12/27 EUR (e) | | | 500,000 | | | 557,905 |
Lorca Holdco Ltd., 2024 EUR
Term Loan B3, 6 mo.
EURIBOR + 3.500%
7.195% VRN 3/25/31 EUR (e) | | | 500,000 | | | 556,591 |
| | | | | | 2,785,392 |
Sweden — 0.8%
| | | | | | |
Verisure Holding AB, 2021 EUR Term Loan, 3 mo. EURIBOR + 3.000% 6.345% VRN 3/27/28 EUR (e) | | | 1,000,000 | | | 1,113,528 |
Switzerland — 0.8%
| | | | | | |
Ineos Finance PLC, 2024 EUR Term Loan B, 1 mo. EURIBOR + 4.000% 7.378% VRN 2/07/31 EUR (e) | | | 500,000 | | | 557,009 |
UPC Broadband Holding BV, 2021 EUR Term Loan AY, 1 mo. EURIBOR + 2.925%
6.361% VRN 1/31/29 EUR (e) | | | 500,000 | | | 556,040 |
| | | | | | 1,113,049 |
United Kingdom — 5.1%
| | | | | | |
BCP V Modular Services Holdings IV Ltd., 2024 EUR Term Loan B, 3 mo. EURIBOR + 4.175%
7.520% VRN 12/15/28 EUR (e) | | | 500,000 | | | 545,872 |
City Football Group Ltd., 2024 Term Loan, 1 mo. USD Term SOFR + 3.000% 7.969% VRN 7/22/30 | | | 904,691 | | | 898,657 |
Froneri International Ltd., 2020 EUR Term Loan B1, 6 mo. EURIBOR + 2.125%
5.715% VRN 1/29/27 EUR (e) | | | 500,000 | | | 555,968 |
Fugue Finance BV, 2023 EUR Term Loan B, 3 mo. EURIBOR + 4.250% 7.755% VRN 1/31/28 EUR (e) | | | 750,000 | | | 838,953 |
INEOS Quattro Holdings UK Ltd., 2023 EUR 1st Lien Term Loan B,
1 mo. EURIBOR + 4.500%
7.878% VRN 4/02/29 EUR (e) | | | 500,000 | | | 556,096 |
| | | | | | | |
| | | | | |
The accompanying notes are an integral part of the financial statements. | | | | |
| | | 21
| |
| | | | | |
TABLE OF CONTENTS
| | MassMutual Global Credit Income Opportunities Fund — Portfolio of Investments (Continued) | |
| | | | | | | |
IVC Acquisition Ltd., 2023 EUR Term Loan B, 6 mo. EURIBOR + 5.000% 8.795% VRN 12/12/28 EUR (e) | | | $500,000 | | | $556,725 |
Lernen Bidco Ltd., EUR Term Loan B1, 6 mo. EURIBOR + 4.250% 8.034% VRN 4/25/29 EUR (e) | | | 500,000 | | | 556,636 |
Motion Finco SARL, 2023 EUR Term Loan B, 3 mo. EURIBOR + 3.750% 7.095% VRN 11/12/29 EUR (e) | | | 500,000 | | | 543,401 |
Summer (BC) Holdco B SARL, 2024 EUR Term Loan B, 3 mo. EURIBOR + 4.500%
7.969% VRN 1/31/29 EUR (e) | | | 432,997 | | | 483,094 |
Tunstall Group Holdings Ltd., 2023 EUR Reinstated Term Loan B (Acquired 11/30/23-5/31/24,
Cost $333,574), 6 mo.
EURIBOR + 0.100%
3.868% VRN 12/20/27
EUR (d) (e) | | | 306,527 | | | 272,968 |
Vue Entertainment International Ltd.
|
2023 EUR Floating PIK Reinstated Term Loan B, 2 mo.
EURIBOR + 0.000%
3.593% VRN 12/31/27 EUR (e) | | | 266,106 | | | 179,210 |
2023 EUR Floating PIK Term Loan, 2 mo. EURIBOR + 0.100%
3.593% VRN 12/31/27 EUR (e) | | | 169,825 | | | 189,040 |
2023 EUR Floating PIK Super Senior Term Loan, 3 mo.
EURIBOR + 4.000%
7.873% VRN 6/30/27 EUR (e) | | | 96,338 | | | 109,740 |
Vue International Bidco PLC, 2022 EUR Term Loan, 6 mo.
EURIBOR + 8.000%
11.844% VRN 6/30/27 EUR (e) | | | 158,216 | | | 173,477 |
Zegona Communications PLC, EUR Term Loan B, 3 mo. EURIBOR + 4.250%
7.886% VRN 7/17/29 EUR (e) | | | 1,000,000 | | | 1,114,596 |
| | | | | | 7,574,433 |
United States — 32.1%
| | | | | | |
8th Avenue Food & Provisions, Inc.
| | | | | | |
2018 1st Lien Term Loan, 1 mo. USD Term SOFR + 3.750%
8.710% VRN 10/01/25 | | | 652,636 | | | 630,747 |
| | | | | | | |
| | | | | | | |
2021 Incremental Term Loan, 1 mo. USD Term
SOFR + 4.750%
9.710% VRN 10/01/25 | | | $114,731 | | | $111,002 |
A-L Parent LLC, 2023 Take Back Term Loan, 1 mo. USD Term SOFR + 5.500%
10.345% VRN 6/30/28 | | | 567,505 | | | 565,377 |
AAP Buyer, Inc., Term Loan B, 3 mo. USD Term
SOFR + 3.250%
7.854% VRN 9/09/31 | | | 105,510 | | | 105,906 |
Ahead DB Holdings LLC, 2024 Term Loan B3, 1 mo. USD Term SOFR + 3.500%
8.355% VRN 2/01/31 | | | 251,894 | | | 252,038 |
AlixPartners LLP, 2021 USD Term Loan B, 1 mo. USD Term SOFR + 2.500%
7.460% VRN 2/04/28 | | | 395,359 | | | 395,556 |
Alliance Laundry Systems LLC, 2024 Term Loan B, 1 mo. USD Term SOFR + 3.500%
8.345% VRN 8/19/31 | | | 187,617 | | | 187,747 |
Alpha Generation LLC, Term Loan B, 0.000% 9/19/31 (f) | | | 133,854 | | | 133,830 |
Altium Packaging LLC, 2024 Term Loan B, 1 mo. USD Term
SOFR + 2.500%
7.345% VRN 6/11/31 | | | 299,250 | | | 297,194 |
Amentum Government Services Holdings LLC, 2024 Term Loan B, 0.000% 7/30/31 (f) | | | 170,309 | | | 169,671 |
Apro LLC, 2024 Term Loan B, 1 mo. USD Term
SOFR + 3.750%
8.868% VRN 7/09/31 | | | 196,850 | | | 197,343 |
AqGen Island Holdings, Inc., Term Loan, 1 mo. USD Term
SOFR + 3.500%
8.460% VRN 8/02/28 | | | 141,736 | | | 141,471 |
Arsenal AIC Parent LLC, 2024 1st Lien Term Loan B, 1 mo. USD Term SOFR + 3.250%
8.095% VRN 8/18/30 | | | 171,461 | | | 171,119 |
Ascend Learning LLC, 2021 Term Loan, 1 mo. USD Term
SOFR + 3.500%
8.445% VRN 12/11/28 | | | 641,751 | | | 638,498 |
| | | | | | | |
| | | | | |
| | | The accompanying notes are an integral part of the financial statements.
| |
22
| | | | |
| | | | | |
TABLE OF CONTENTS
| | MassMutual Global Credit Income Opportunities Fund — Portfolio of Investments (Continued) | |
| | | | | | | |
Assured Partners, Inc., 2024 Incremental Term Loan B5, 1 mo. USD Term
SOFR + 3.500%
8.345% VRN 2/14/31 | | | $323,375 | | | $322,993 |
Asurion LLC
| | | | | | |
2022 Term Loan B10, 1 mo. USD Term SOFR + 4.000%
8.945% VRN 8/19/28 | | | 292,747 | | | 287,677 |
2021 Second Lien Term Loan B4, 1 mo. USD Term SOFR + 5.250% 10.210% VRN 1/20/29 | | | 375,862 | | | 346,616 |
Athenahealth Group, Inc., 2022 Term Loan B, 1 mo. USD Term
SOFR + 3.250%,
8.095% VRN 2/15/29 | | | 651,185 | | | 646,438 |
AVSC Holding Corp., 2020 Term Loan B1, 1 mo. USD Term
SOFR + 3.000%
8.195% VRN 3/03/25 | | | 12 | | | 12 |
Banff Merger Sub, Inc., 2024 Term Loan B, 3 mo. USD Term
SOFR + 3.750%
9.005% VRN 7/30/31 (f) | | | 553,301 | | | 551,823 |
BCPE North Star US HoldCo 2, Inc., Term Loan, 1 mo. USD Term SOFR + 4.000%, 3 mo. U.S. (Fed) Prime Rate + 3.000%,
8.960% - 11.000%
VRN 6/09/28 | | | 238,149 | | | 224,977 |
BCPE Pequod Buyer, Inc., USD Term Loan B,
0.000% 9/19/31 (f) | | | 400,246 | | | 398,329 |
Berlin Packaging LLC, 2024 Term Loan B, 1 mo. USD Term
SOFR + 3.750%, 3 mo. USD Term SOFR + 3.750%
8.418% - 8.951% VRN 6/09/31 | | | 114,757 | | | 114,634 |
Boost Newco Borrower LLC, 2024 USD Term Loan B, 3 mo. USD Term SOFR + 2.500%
7.104% VRN 1/31/31 | | | 514,908 | | | 514,692 |
Broadstreet Partners, Inc., 2024 Term Loan B4, 1 mo. USD Term
SOFR + 3.250%
8.095% VRN 6/13/31 | | | 291,420 | | | 290,147 |
Caesars Entertainment, Inc., 2024 Term Loan B1, 1 mo. USD Term SOFR + 2.750%
7.595% VRN 2/06/31 | | | 324,433 | | | 324,027 |
| | | | | | | |
| | | | | | | |
Calpine Construction Finance Co. LP, 2023 Refinancing Term Loan B, 1 mo. USD Term SOFR + 2.000% 6.845% VRN 7/31/30 | | | $300,000 | | | $297,918 |
Carnival Corp., 2024 Term Loan B1, 1 mo. USD Term SOFR + 2.750% 7.595% VRN 10/18/28 | | | 678,668 | | | 679,096 |
Central Parent, Inc., 2024 Term Loan B, 3 mo. USD Term
SOFR + 3.250%
7.854% VRN 7/06/29 | | | 360,418 | | | 356,334 |
Charter NEX US, Inc., 2024 Term Loan B, 1 mo. USD Term
SOFR + 3.250%
8.095% VRN 12/01/27 | | | 208,166 | | | 208,145 |
Clear Channel Outdoor Holdings, Inc., 2024 Term Loan, 1 mo. USD Term SOFR + 4.000%
8.960% VRN 8/23/28 | | | 232,939 | | | 231,900 |
Cloud Software Group, Inc., 2024 USD Term Loan B, 3 mo. USD Term SOFR + 4.000%
8.604% VRN 3/30/29 | | | 160,987 | | | 160,198 |
Cloudera, Inc.
| | | | | | |
2021 Term Loan, 1 mo. USD Term SOFR + 3.750%
8.695% VRN 10/08/28 | | | 54,103 | | | 52,547 |
2021 Second Lien Term Loan, 1 mo. USD Term SOFR + 6.000% 10.945% VRN 10/08/29 | | | 266,667 | | | 249,779 |
Clydesdale Acquisition Holdings, Inc., Term Loan B, 1 mo. USD Term SOFR + 3.175%
8.020% VRN 4/13/29 | | | 329,430 | | | 327,562 |
CoreLogic, Inc., Term Loan, 1 mo. USD Term SOFR + 3.500%
8.460% VRN 6/02/28 | | | 294,684 | | | 291,315 |
Cotiviti Corp., 2024 Term Loan, 1 mo. USD Term
SOFR + 3.250%
8.451% VRN 5/01/31 | | | 298,145 | | | 297,772 |
CPC Acquisition Corp., Term Loan,
3 mo. USD Term SOFR + 3.750% 8.615% VRN 12/29/27 | | | 479,227 | | | 416,031 |
Creative Artists Agency LLC, 2024 1st Lien Term Loan B,
0.000% 9/12/31 (f) | | | 110,944 | | | 110,805 |
Darktrace PLC, Term Loan, 0.000% 7/02/31 (f) | | | 327,198 | | | 321,790 |
Delta TopCo, Inc., 2024 Term Loan,
6 mo. USD Term SOFR + 3.500% 8.198% VRN 11/30/29 | | | 379,767 | | | 378,817 |
| | | | | | | |
| | | | | |
The accompanying notes are an integral part of the financial statements. | | | | |
| | | 23
| |
| | | | | |
TABLE OF CONTENTS
| | MassMutual Global Credit Income Opportunities Fund — Portfolio of Investments (Continued) | |
| | | | | | | |
DexKo Global, Inc., 2021 EUR Term Loan B, 3 mo. EURIBOR + 4.000% 7.345% VRN 10/04/28 EUR (e) | | | $164,500 | | | $176,398 |
DG Investment Intermediate Holdings 2, Inc., 2021 Term Loan, 0.000% 3/31/28 (f) | | | 513,471 | | | 511,227 |
DXP Enterprises, Inc., 2024 Term Loan B, 0.000% 10/11/30 (f) | | | 232,558 | | | 232,674 |
Edelman Financial Center LLC, 2024 2nd Lien Term Loan, 1 mo. USD Term SOFR + 5.250%
10.095% VRN 10/06/28 | | | 300,000 | | | 298,626 |
Elanco Animal Health, Inc., Term Loan B, 1 mo. USD Term
SOFR + 1.750%
7.051% VRN 8/01/27 | | | 204,049 | | | 203,524 |
Electron BidCo, Inc., 2021 Term Loan, 1 mo. USD Term SOFR + 3.000% 7.960% VRN 11/01/28 | | | 248,092 | | | 248,278 |
Emrld Borrower LP, Term Loan B, 3 mo. USD Term SOFR + 2.500% 7.557% VRN 5/31/30 | | | 546,623 | | | 545,257 |
Fiesta Purchaser, Inc., 2024 Term Loan B, 1 mo. USD Term
SOFR + 4.000%
8.845% VRN 2/12/31 | | | 167,980 | | | 167,942 |
First Student Bidco, Inc.
| | | | | | |
Term Loan C, 3 mo. USD Term SOFR + 3.000%
7.668% VRN 7/21/28 | | | 65,828 | | | 65,856 |
Term Loan B, 3 mo. USD Term SOFR + 3.000%
7.865% VRN 7/21/28 | | | 215,225 | | | 215,316 |
Five Star Intermediate Holding LLC, Term Loan, 3 mo. USD Term SOFR + 4.250%
9.189% VRN 5/05/29 (f) | | | 421,081 | | | 409,922 |
Fleet Midco I Ltd., 2024 1st Lien Term Loan B, 6 mo. USD Term
SOFR + 2.750%
7.578% VRN 2/21/31 | | | 181,924 | | | 181,469 |
Fluid-Flow Products, Inc., Term Loan, 1 mo. USD Term SOFR + 3.750% 8.710% VRN 3/31/28 | | | 197,449 | | | 197,252 |
Franklin Square Holdings LP, 2024 Term Loan B, 1 mo. USD Term SOFR + 2.250%
7.095% VRN 4/25/31 | | | 328,137 | | | 327,726 |
| | | | | | | |
| | | | | | | |
Freeport LNG Investments LLLP, Term Loan B, 3 mo. USD Term SOFR + 3.500% 9.044% VRN 12/21/28 | | | $494,251 | | | $489,432 |
Frontier Communications Corp., 2024 Term Loan B, 3 mo. USD Term SOFR + 3.500%
8.832% VRN 7/01/31 | | | 200,000 | | | 201,000 |
Gainwell Acquisition Corp., Term Loan B, 3 mo. USD Term
SOFR + 4.000%
8.704% VRN 10/01/27 | | | 294,643 | | | 279,787 |
Gates Global LLC, 2024 Term Loan B5, 1 mo. USD Term
SOFR + 2.250%
7.095% VRN 6/04/31 | | | 540,998 | | | 541,717 |
Genesee & Wyoming Inc., 2024 Term Loan B, 3 mo. USD Term
SOFR + 2.000%
6.604% VRN 4/10/31 | | | 229,293 | | | 228,720 |
GHX Ultimate Parent Corp., 2024 Term Loan B, 3 mo. USD Term SOFR + 4.000%
9.126% VRN 6/30/27 | | | 296,261 | | | 297,002 |
Graham Packaging Co., Inc., 2024 Term Loan B, 1 mo. USD Term SOFR + 2.500%, 3 mo. U.S. (Fed) Prime Rate + 1.500%
10.000% VRN 8/04/27 (f) | | | 225,347 | | | 225,027 |
Great Outdoors Group LLC, 2021 Term Loan B2, 1 mo. USD Term
SOFR + 3.750%
8.710% VRN 3/06/28 | | | 594,513 | | | 593,895 |
Grifols SA, EUR 2019 Term Loan B, 3 mo. EURIBOR + 2.250%
5.886% VRN 11/15/27 EUR (e) | | | 680,836 | | | 734,423 |
Grinding Media, Inc., 2021 Term Loan B, 3 mo. USD Term
SOFR + 4.000%
9.569% VRN 10/12/28 | | | 191,065 | | | 190,587 |
Harbor Freight Tools USA, Inc., 2024 Term Loan B, 1 mo. USD Term SOFR + 2.500%, 6 mo. USD Term SOFR + 2.500%
7.241% - 7.345% VRN 6/05/31 | | | 400,000 | | | 393,564 |
HUB International Ltd., 2024 1st Lien Term Loan B, 3 mo. USD Term SOFR + 3.000%
8.225% VRN 6/20/30 | | | 273,191 | | | 272,754 |
Indy US Bidco LLC,
2024 USD Term Loan B,
0.000% 3/06/28 (f) | | | 208,333 | | | 207,291 |
| | | | | | | |
| | | | | |
| | | The accompanying notes are an integral part of the financial statements.
| |
24
| | | | |
| | | | | |
TABLE OF CONTENTS
| | MassMutual Global Credit Income Opportunities Fund — Portfolio of Investments (Continued) | |
| | | | | | | |
IPS Corp., 2021 Term Loan, 1 mo. USD Term SOFR + 3.500%
8.345% VRN 10/02/28 | | | $336,649 | | | $333,807 |
IRB Holding Corp., 2024 Term Loan B, 1 mo. USD Term
SOFR + 2.750% 7.695% VRN 12/15/27 | | | 645,361 | | | 644,393 |
Ivanti Software, Inc., 2021 Term Loan B, 3 mo. USD Term
SOFR + 4.250%
9.833% VRN 12/01/27 | | | 243,034 | | | 205,701 |
Journey Personal Care Corp., 2021 Term Loan B, 1 mo. USD Term SOFR + 4.250%
9.210% VRN 3/01/28 | | | 558,401 | | | 557,005 |
Kohler Energy Co. LLC, USD Term Loan B, 3 mo. USD Term
SOFR + 4.750%
9.354% VRN 5/01/31 | | | 462,019 | | | 466,062 |
LBM Acquisition LLC, Term Loan B, 1 mo. USD Term SOFR + 3.750% 8.695% VRN 12/17/27 | | | 239,905 | | | 238,165 |
Level 3 Financing, Inc.
| | | | | | |
2024 Extended Term Loan B1, 1 mo. USD Term SOFR + 6.560% 11.414% VRN 4/15/29 (f) | | | 174,488 | | | 177,934 |
2024 Extended Term Loan B2, 1 mo. USD Term SOFR + 6.560% 11.414% VRN 4/15/30 (f) | | | 475,512 | | | 483,239 |
LifePoint Health, Inc., 2024 Term Loan B, 3 mo. USD Term
SOFR + 4.750%
10.054% VRN 11/16/28 | | | 584,628 | | | 583,459 |
Lifescan Global Corp., 2023 Term Loan, 3 mo. USD Term
SOFR + 6.500%
11.728% VRN 12/31/26 | | | 111,773 | | | 44,709 |
Lightning Power LLC, Term Loan B, 3 mo. USD Term SOFR + 3.250% 8.346% VRN 8/18/31 | | | 187,891 | | | 188,179 |
LSF11 A5 Holdco LLC, 2024 Term Loan B, 1 mo. USD Term
SOFR + 3.500%
8.460% VRN 10/15/28 | | | 296,203 | | | 295,409 |
Magenta Security Holdings LLC, 2024 Third Out Term Loan, 3 mo. U.S. (Fed) Prime Rate + 5.250%, 3 mo. USD Term
SOFR + 6.750% 11.626% VRN 7/27/28 | | | 53,322 | | | 15,597 |
| | | | | | | |
| | | | | | | |
Mattress Firm, Inc., 2021 Term Loan B, 3 mo. USD Term SOFR + 4.250% 9.846% VRN 9/25/28 | | | $279,208 | | | $278,960 |
Mavis Tire Express Services Corp., 2024 Term Loan, 1 mo. USD Term SOFR + 3.500%
8.354% VRN 5/04/28 (f) | | | 546,367 | | | 545,684 |
McAfee LLC, 2024 USD Term Loan B, 1 mo. USD Term SOFR + 3.250% 8.451% VRN 3/01/29 | | | 328,604 | | | 327,063 |
McGraw-Hill Global Education Holdings LLC, 2024 Term Loan B, 3 mo. USD Term
SOFR + 4.000%,
3 mo. U.S. (Fed) Prime Rate + 3.000%, 8.604% VRN 8/06/31 | | | 172,250 | | | 172,896 |
MedAssets Software Intermediate Holdings, Inc.
| | | | | | |
2021 Term Loan (Acquired 3/08/23, Cost $188,477), 1 mo. USD Term SOFR + 4.000%
8.960% VRN 12/18/28 (d) | | | 196,474 | | | 133,602 |
2021 2nd Lien Term Loan (Acquired 11/19/21, Cost $203,405), 1 mo. USD Term SOFR + 6.750% 11.710% VRN 12/17/29 (d) | | | 205,479 | | | 85,317 |
Medical Solutions Holdings, Inc., 2021 2nd Lien Term Loan, 3 mo. USD Term SOFR + 7.000%
12.352% VRN 11/01/29 | | | 147,368 | | | 95,789 |
Medline Borrower LP, 2024 Term Loan B, 1 mo. USD Term
SOFR + 2.750%
7.595% VRN 10/23/28 | | | 815,002 | | | 814,920 |
MH Sub I LLC, 2023 Term Loan,
1 mo. USD Term SOFR + 4.250%, 9.095% VRN 5/03/28 | | | 493,750 | | | 490,284 |
Midwest Physician Administrative Services LLC, 2021 Term Loan,
3 mo. USD Term SOFR + 3.000% 7.865% VRN 3/12/28 | | | 423,135 | | | 381,122 |
Mitchell International, Inc.
| | | | | | |
2024 1st Lien Term Loan, 1 mo. USD Term SOFR + 3.250%
8.095% VRN 6/17/31 | | | 349,166 | | | 343,726 |
2024 2nd Lien Term Loan, 1 mo. USD Term SOFR + 5.250%
10.095% VRN 6/17/32 | | | 197,802 | | | 194,176 |
| | | | | | | |
| | | | | |
The accompanying notes are an integral part of the financial statements. | | | | |
| | | 25
| |
| | | | | |
TABLE OF CONTENTS
| | MassMutual Global Credit Income Opportunities Fund — Portfolio of Investments (Continued) | |
| | | | | | | |
MKS Instruments, Inc., 2024 USD Term Loan B, 1 mo. USD Term SOFR + 2.250%
7.170% VRN 8/17/29 | | | $169,463 | | | $169,293 |
Motel 6, Term Loan B, 1 mo. USD Term SOFR + 5.000%
10.065% VRN 9/09/26 | | | 141,687 | | | 141,709 |
NAPA Management Services Corp., Term Loan B, 1 mo. USD Term SOFR + 5.250%
10.195% VRN 2/23/29 | | | 358,287 | | | 336,493 |
Neptune Bidco US, Inc., 2022 USD Term Loan B, 3 mo. USD Term SOFR + 5.000%
10.404% VRN 4/11/29 | | | 145,462 | | | 136,267 |
New Arclin US Holding Corp., 2021 Term Loan, 1 mo. USD Term SOFR + 3.500%
8.445% VRN 9/30/28 | | | 193,391 | | | 193,101 |
Nvent Electric Public Ltd. Co., Term Loan B, 0.000% 9/12/31 (f) | | | 215,517 | | | 215,248 |
Olympus Water US Holding Corp., 2024 USD Term Loan B, 3 mo. USD Term SOFR + 3.500%
8.104% VRN 6/20/31 | | | 230,083 | | | 229,911 |
OMNIA Partners LLC, 2024 Term Loan B, 3 mo. USD Term
SOFR + 3.250%
8.529% VRN 7/25/30 | | | 166,667 | | | 166,993 |
Oryx Midstream Services Permian Basin LLC, 2024 Term Loan B,
1 mo. USD Term SOFR + 3.000% 8.225% VRN 10/05/28 | | | 483,691 | | | 483,652 |
Padagis LLC, Term Loan B, 3 mo. USD Term SOFR + 4.750% 10.326% VRN 7/06/28 | | | 345,260 | | | 321,092 |
Parexel International Corp., 2024 Term Loan B, 1 mo. USD Term
SOFR + 3.000%
7.845% VRN 11/15/28 | | | 285,472 | | | 285,418 |
Peraton Corp., Term Loan B, 1 mo. USD Term SOFR + 3.750%
8.695% VRN 2/01/28 | | | 644,457 | | | 618,814 |
PMHC II, Inc., 2022 Term Loan B,
3 mo. USD Term SOFR + 4.250% 9.704% VRN 4/23/29 | | | 237,018 | | | 231,069 |
Polar US Borrower LLC
| | | | | | |
2024 Term Loan B1A, 1 mo. USD Term SOFR + 5.550%
10.457% VRN 10/16/28 | | | 200,000 | | | 147,000 |
| | | | | | | |
| | | | | | | |
2024 Term Loan B1B, 3 mo. U.S. (Fed) Prime Rate + 4.500%
13.000% VRN 10/16/28 (f) | | | $298,772 | | | $218,104 |
Pretium Packaging LLC
| | | | | | |
Second Out Term Loan A1, 3 mo. USD Term SOFR + 4.600%
9.848% VRN 10/02/28 | | | 78,038 | | | 62,202 |
First Out Term Loan A, 3 mo. USD Term SOFR + 5.000%
10.248% VRN 10/02/28 (f) | | | 696,538 | | | 707,857 |
Pro Mach Group, Inc., 2024
1st Lien Term Loan B, 3 mo. USD Term SOFR + 3.500%
8.345% VRN 8/31/28 | | | 165,631 | | | 166,080 |
Proampac PG Borrower LLC, 2024 Term Loan, 3 mo. USD Term SOFR + 4.000%
9.118% - 9.301% VRN 9/15/28 | | | 496,256 | | | 496,628 |
Project Boost Purchaser LLC, 2024 Term Loan, 3 mo. USD Term SOFR + 3.500%
8.786% VRN 7/16/31 | | | 250,000 | | | 249,788 |
Project Ruby Ultimate Parent Corp., 2021 Term Loan, 1 mo. USD Term SOFR + 3.250%,
8.210% VRN 3/10/28 | | | 394,255 | | | 393,392 |
Prometric Holdings, Inc., 2024 Term Loan, 1 mo. USD Term
SOFR + 4.750%
9.710% VRN 1/31/28 | | | 297,754 | | | 299,094 |
Quest Software US Holdings, Inc., 2022 Term Loan, 3 mo. USD Term SOFR + 4.250%
9.652% VRN 2/01/29 | | | 704,996 | | | 468,822 |
Quikrete Holdings, Inc., 2024 Term Loan B, 1 mo. USD Term
SOFR + 2.500%
7.345% VRN 4/14/31 | | | 174,078 | | | 174,078 |
Radiology Partners, Inc., 2024 Extended Term Loan B, 3 mo. USD Term SOFR + 3.500%
8.883% VRN 1/31/29 (f) | | | 775,671 | | | 757,738 |
Raising Cane’s Restaurants LLC, 2024 Term Loan B, 1 mo. USD Term SOFR + 2.000%
7.014% VRN 9/18/31 (f) | | | 541,110 | | | 540,775 |
Recess Holdings, Inc., 2024 Term Loan B, 3 mo. USD Term
SOFR + 4.500%
9.752% VRN 2/20/30 | | | 258,971 | | | 259,683 |
| | | | | | | |
| | | | | |
| | | The accompanying notes are an integral part of the financial statements.
| |
26
| | | | |
| | | | | |
TABLE OF CONTENTS
| | MassMutual Global Credit Income Opportunities Fund — Portfolio of Investments (Continued) | |
| | | | | | | |
RelaDyne, Inc., 2023 Incremental Term Loan, 1 mo. USD Term
SOFR + 4.500%
9.345% VRN 12/22/28 | | | $147,325 | | | $147,203 |
Renaissance Holding Corp., 2024 Term Loan, 1 mo. USD Term SOFR + 4.250%
9.095% VRN 4/05/30 (f) | | | 498,744 | | | 498,235 |
Resonetics LLC, 2024 Term Loan,
1 mo. USD Term SOFR + 3.750% 8.715% VRN 6/18/31 | | | 250,000 | | | 250,118 |
Ryan Specialty Group LLC, 2024 USD Term Loan B, 1 mo. USD Term SOFR + 2.250%
7.095% VRN 9/15/31 | | | 144,878 | | | 144,561 |
Scientific Games Holdings LP, 2024 USD Term Loan B, 3 mo. USD Term SOFR + 3.000%
8.318% VRN 4/04/29 | | | 350,000 | | | 347,694 |
Sedgwick Claims Management Services, Inc., 2023 Term Loan B, 3 mo. USD Term SOFR + 3.000% 8.252% VRN 7/31/31 | | | 520,234 | | | 519,064 |
Select Medical Corp., 2023 Term Loan B1, 1 mo. USD Term
SOFR + 3.000%
7.845% VRN 3/06/27 | | | 64,221 | | | 64,435 |
SITEL Worldwide Corp., 2021 USD Term Loan, 1 mo. USD Term SOFR + 3.750%
8.710% VRN 8/28/28 | | | 149,231 | | | 97,224 |
Skopima Merger Sub, Inc., Term Loan B, 1 mo. USD Term
SOFR + 4.000%
8.960% VRN 5/12/28 | | | 144,551 | | | 144,190 |
Sovos Compliance LLC, 2021 Term Loan, 1 mo. USD Term
SOFR + 4.500%,
9.460% VRN 8/11/28 | | | 345,562 | | | 345,092 |
Spin Holdco, Inc., 2021 Term Loan,
3 mo. USD Term SOFR + 4.000% 9.256% VRN 3/04/28 | | | 247,185 | | | 215,464 |
Summer (BC) Holdco B SARL, 2024 EUR Term Loan, 3 mo.
EURIBOR + 4.500%
7.969% VRN 1/31/29 EUR (e) | | | 67,003 | | | 74,756 |
Tacala LLC, 2024 Term Loan, 1 mo. USD Term SOFR + 4.000%
8.845% VRN 1/31/31 | | | 178,141 | | | 178,186 |
Third Coast Infrastructure LLC, Term Loan B, 0.000% 9/25/30 (f) | | | 367,538 | | | 364,781 |
| | | | | | | |
| | | | | | | |
Thunder Generation Funding LLC, Term Loan B, 0.000% 9/27/31 (f) | | | $407,417 | | | $406,908 |
Tiger Acquisition LLC, 2021 Term Loan, 1 mo. USD Term
SOFR + 3.250%
8.195% VRN 6/01/28 | | | 410,162 | | | 407,599 |
TransDigm, Inc., 2023 Term Loan J, 3 mo. USD Term SOFR + 2.500% 7.104% VRN 2/28/31 | | | 796,005 | | | 792,662 |
Trident TPI Holdings, Inc., 2024 Term Loan B6, 3 mo. USD Term SOFR + 4.000% 8.604% VRN 9/15/28 | | | 357,168 | | | 357,407 |
Triton Water Holdings, Inc., Term Loan, 3 mo. USD Term SOFR + 3.250%, 8.115% VRN 3/31/28 | | | 1,703 | | | 1,699 |
UKG, Inc., 2024 Term Loan B, 3 mo. USD Term SOFR + 3.250%
8.555% VRN 2/10/31 | | | 383,256 | | | 383,256 |
USI, Inc., 2024 Term Loan (2029), 3 mo. USD Term SOFR + 2.750% 7.354% VRN 11/22/29 | | | 248,127 | | | 247,300 |
Varsity Brands, Inc., 2024 Term Loan B, 3 mo. USD Term
SOFR + 3.750% 8.821% VRN 8/26/31 (f) | | | 365,827 | | | 363,160 |
Virgin Media Bristol LLC, 2023 USD Term Loan Y, 6 mo. USD Term SOFR + 3.250%
8.656% VRN 3/31/31 | | | 700,000 | | | 667,723 |
Vision Solutions, Inc., 2021 Incremental Term Loan, 3 mo. USD Term SOFR + 4.000%
9.514% VRN 4/24/28 | | | 149,614 | | | 145,407 |
Vistra Zero Operating Company LLC, Term Loan B, 1 mo. USD Term SOFR + 2.750%
7.595% VRN 4/30/31 | | | 172,876 | | | 173,265 |
Vortex Opco LLC
| | | | | | |
Second Out Term Loan, 3 mo. USD Term SOFR + 4.250%
9.118% VRN 12/17/28 | | | 322,716 | | | 229,532 |
First Out Term Loan, 3 mo. USD Term SOFR + 6.250%
11.003% VRN 4/30/30 | | | 411,974 | | | 427,423 |
VS Buyer LLC, 2024 Term Loan B,
1 mo. USD Term SOFR + 3.250% 8.347% VRN 4/11/31 | | | 138,644 | | | 138,586 |
| | | | | | | |
| | | | | |
The accompanying notes are an integral part of the financial statements. | | | | |
| | | 27
| |
| | | | | |
TABLE OF CONTENTS
| | MassMutual Global Credit Income Opportunities Fund — Portfolio of Investments (Continued) | |
| | | | | | | |
Wand NewCo 3, Inc., 2024 1st Lien Term Loan B, 1 mo. USD Term SOFR + 3.250%
8.095% VRN 1/30/31 | | | $559,757 | | | $558,806 |
WeddingWire, Inc., 2023 Term Loan, 1 mo. USD Term SOFR + 4.500%, 9.345% - 9.611% VRN 1/31/28 | | | 248,750 | | | 248,596 |
WestJet Loyalty LP, Term Loan B, 3 mo. USD Term SOFR + 3.750% 8.354% VRN 2/14/31 | | | 466,406 | | | 460,963 |
White Cap Buyer LLC, 2024 Term Loan B, 1 mo. USD Term
SOFR + 3.250%
8.095% VRN 10/19/29 | | | 242,441 | | | 240,562 |
Wood Mackenzie Ltd., 2024 Term Loan B, 3 mo. USD Term
SOFR + 3.500%
8.604% VRN 2/07/31 | | | 225,849 | | | 226,075 |
Zayo Group Holdings, Inc., 2022 USD Incremental Term Loan B, 0.000% 3/09/27 (f) | | | 299,233 | | | 275,219 |
| | | | | | 47,547,189 |
TOTAL BANK LOANS
(Cost $75,659,681) | | | | | | 75,545,868 |
Corporate Debt — 34.9%
| | | | | | |
Argentina — 0.1%
| | | | | | |
Transportadora de Gas del Sur SA 8.500% 7/24/31 (g) | | | 171,000 | | | 177,986 |
Austria — 0.3%
| | | | | | |
ams-OSRAM AG
| | | | | | |
Convertible, 2.125% 11/03/27
EUR (e) (g) | | | 300,000 | | | 266,321 |
10.500% 3/30/29 EUR (e) (g) | | | 200,000 | | | 230,368 |
| | | | | | 496,689 |
Belgium — 0.2%
| | | | | | |
Elia Group SA 5 yr. EURIBOR ICE Swap + 2.506%
5.850% VRN EUR (e) (g) (h) | | | 300,000 | | | 349,503 |
Brazil — 0.6%
| | | | | | |
Embraer Netherlands Finance BV 7.000% 7/28/30 (g) | | | 400,000 | | | 435,611 |
Minerva Luxembourg SA
8.875% 9/13/33 (g) | | | 250,000 | | | 272,591 |
Oceanica Lux
13.000% 10/02/29 (g) (i) | | | 200,000 | | | 197,500 |
| | | | | | 905,702 |
| | | | | | | |
| | | | | | | |
Canada — 0.8%
| | | | | | |
1011778 BC ULC/New Red Finance, Inc.
5.625% 9/15/29 (g) | | | $174,000 | | | $176,514 |
1375209 BC Ltd.
9.000% 1/30/28 (g) (j) | | | 259,000 | | | 256,699 |
Enbridge, Inc., Series NC5, 5 yr.
CMT + 3.785%
8.250% VRN 1/15/84 | | | 551,000 | | | 583,665 |
Parkland Corp.
6.625% 8/15/32 (g) | | | 206,000 | | | 209,127 |
| | | | | | 1,226,005 |
Chile — 0.4%
| | | | | | |
Banco de Credito e Inversiones SA
5 yr. CMT + 4.944%
8.750% VRN (g) (h) | | | 200,000 | | | 215,351 |
Sable International Finance Ltd. 7.125% 10/15/32 (g) (i) | | | 214,000 | | | 214,803 |
VTR Comunicaciones SpA
4.375% 4/15/29 (g) | | | 200,000 | | | 171,085 |
| | | | | | 601,239 |
China — 0.0%
| | | | | | |
Sunac China Holdings Ltd.
| | | | | | |
1.000% 9/30/32 (g) | | | 67,718 | | | 6,546 |
6.000% 9/30/26 (g) | | | 28,261 | | | 3,338 |
6.250% 9/30/27 (g) | | | 28,295 | | | 2,979 |
6.750% 9/30/28 (g) | | | 85,092 | | | 7,524 |
7.000% 9/30/29 (g) | | | 88,177 | | | 6,728 |
| | | | | | 27,115 |
France — 1.4%
| | | | | | |
Accor SA 5 yr. EUR Swap + 4.105% 7.250%
VRN EUR (e) (g) (h) | | | 200,000 | | | 246,151 |
Electricite de France SA
| | | | | | |
5 yr. EUR Swap + 2.860%
2.625% VRN EUR (e) (g) (h) | | | 200,000 | | | 208,326 |
5 yr. EUR Swap + 3.970%
3.375% VRN EUR (e) (g) (h) | | | 600,000 | | | 608,514 |
5 yr. U.K. Government
Bond + 3.775%
7.375% VRN GBP (e) (g) (h) | | | 100,000 | | | 136,571 |
iliad SA
5.625% 2/15/30 EUR (e) (g) | | | 300,000 | | | 352,746 |
Orange SA 5 yr. EUR
Swap + 2.659%
5.375% VRN EUR (e) (g) (h) | | | 400,000 | | | 474,487 |
| | | | | | 2,026,795 |
| | | | | | | |
| | | | | |
| | | The accompanying notes are an integral part of the financial statements.
| |
28
| | | | |
| | | | | |
TABLE OF CONTENTS
| | MassMutual Global Credit Income Opportunities Fund — Portfolio of Investments (Continued) | |
| | | | | | | |
Germany — 1.4%
| | | | | | |
APCOA Holdings GmbH 3 mo. EURIBOR + 5.000%
8.685% FRN 1/15/27
EUR (e) (g) | | | $169,000 | | | $188,498 |
Bayer AG
| | | | | | |
5 yr. EUR Swap + 3.108%
3.125% VRN 11/12/79
EUR (e) (g) | | | 400,000 | | | 419,762 |
5 yr. EUR Swap + 4.458%
5.375% VRN 3/25/82
EUR (e) (g) | | | 200,000 | | | 220,709 |
5 yr. EUR Swap + 3.896%
7.000% VRN 9/25/83
EUR (e) (g) | | | 200,000 | | | 237,905 |
Mahle GmbH
6.500% 5/02/31 EUR (e) (g) | | | 150,000 | | | 162,130 |
Volkswagen International Finance NV 5 yr. EUR Swap + 2.924%
3.748% VRN EUR (e) (g) (h) | | | 300,000 | | | 320,182 |
Wintershall Dea Finance 2 BV | | | | | | |
5 yr. EUR Swap + 2.924%
2.499% VRN EUR (e) (g) (h) | | | 300,000 | | | 320,520 |
5 yr. EUR Swap + 3.319%
3.000% VRN EUR (e) (g) (h) | | | 200,000 | | | 205,682 |
| | | | | | 2,075,388 |
Ghana — 0.5%
| | | | | | |
Tullow Oil PLC 7.000% 3/01/25 (g) | | | 787,000 | | | 746,622 |
Greece — 0.1%
| | | | | | |
Piraeus Bank SA 1 yr. EURIBOR ICE Swap + 1.723% 4.625% VRN 7/17/29 EUR (e) (g) | | | 182,000 | | | 207,729 |
India — 0.1%
| | | | | | |
Continuum Green Energy India Pvt/Co-Issuers
7.500% 6/26/33 (g) | | | 200,000 | | | 210,000 |
Indonesia — 0.3%
| | | | | | |
Medco Maple Tree Pte. Ltd.
8.960% 4/27/29 (g) | | | 400,000 | | | 421,998 |
Ireland — 0.3%
| | | | | | |
GGAM Finance Ltd.
| | | | | | |
5.875% 3/15/30 (g) | | | 221,000 | | | 221,290 |
8.000% 2/15/27 (g) | | | 200,000 | | | 209,002 |
| | | | | | 430,292 |
| | | | | | | |
| | | | | | | |
Italy — 0.4%
| | | | | | |
Cerved Group SpA 3 mo.
EURIBOR + 5.250%
8.731% FRN 2/15/29
EUR (e) (g) | | | $199,000 | | | $215,624 |
Engineering - Ingegneria
Informatica - SpA
11.125% 5/15/28 EUR (e) (g) | | | 300,000 | | | 338,954 |
| | | | | | 554,578 |
Kazakhstan — 0.1%
| | | | | | |
Tengizchevroil Finance Co. International Ltd.
4.000% 8/15/26 (g) | | | 200,000 | | | 195,230 |
Luxembourg — 0.4%
| | | | | | |
Cidron Aida Finco SARL
5.000% 4/01/28 EUR (e) (g) | | | 100,000 | | | 108,126 |
Matterhorn Telecom SA
3.125% 9/15/26 EUR (e) (g) | | | 250,000 | | | 274,831 |
Summer BC Holdco A SARL
9.250% 10/31/27 EUR (e) (g) | | | 180,211 | | | 200,100 |
| | | | | | 583,057 |
Macau — 0.2%
| | | | | | |
MGM China Holdings Ltd.
7.125% 6/26/31 (g) | | | 300,000 | | | 308,734 |
Netherlands — 0.8%
| | | | | | |
Odido Group Holding BV
5.500% 1/15/30 EUR (e) (g) | | | 500,000 | | | 543,022 |
Titan Holdings II BV
5.125% 7/15/29 EUR (e) (g) | | | 500,000 | | | 564,923 |
| | | | | | 1,107,945 |
Norway — 0.2%
| | | | | | |
Var Energi ASA 5 yr. EURIBOR ICE Swap + 4.765%
7.862% VRN 11/15/83
EUR (e) (g) | | | 250,000 | | | 305,420 |
Peru — 0.2%
| | | | | | |
Banco BBVA Peru SA 5 yr.
CMT + 2.002%
6.200% VRN 6/07/34 (g) | | | 300,000 | | | 310,140 |
Puerto Rico — 0.1%
| | | | | | |
LCPR Senior Secured Financing DAC 6.750% 10/15/27 (g) | | | 200,000 | | | 183,006 |
Republic of Korea — 0.2%
| | | | | | |
Woori Bank 5 yr. CMT + 2.277% 6.375% VRN (g) (h) | | | 210,000 | | | 215,309 |
| | | | | | | |
| | | | | |
The accompanying notes are an integral part of the financial statements. | | | | |
| | | 29
| |
| | | | | |
TABLE OF CONTENTS
| | MassMutual Global Credit Income Opportunities Fund — Portfolio of Investments (Continued) | |
| | | | | | | |
Russia — 0.0%
| | | | | | |
Sovcombank Via SovCom Capital DAC 5 yr. CMT + 6.380%
7.750% (g) (h) (k) | | | $500,000 | | | $14,063 |
Saudi Arabia — 0.3%
| | | | | | |
Al Rajhi Bank 5 yr. CMT + 1.888% 6.375% VRN (g) (h) | | | 250,000 | | | 261,881 |
Greensaif Pipelines Bidco SARL 6.103% 8/23/42 (g) | | | 200,000 | | | 207,078 |
| | | | | | 468,959 |
Slovenia — 0.2%
| | | | | | |
Nova Ljubljanska Banka DD 5 yr. EURIBOR ICE Swap + 4.230% 6.875% VRN 1/24/34
EUR (e) (g) | | | 200,000 | | | 236,544 |
Spain — 1.4%
| | | | | | |
Anarafe SL 3 mo. EURIBOR + 12.750%
15.386% 12/31/26 EUR (e) (g) | | | 92,446 | | | 124,516 |
Cellnex Telecom SA, Convertible, 0.750% 11/20/31 EUR (e) (g) | | | 300,000 | | | 293,979 |
Grifols SA
3.875% 10/15/28 EUR (e) (g) | | | 200,000 | | | 206,916 |
Kaixo Bondco Telecom SA 5.125% 9/30/29 EUR (e) (g) | | | 600,000 | | | 667,055 |
Telefonica Europe BV
| | | | | | |
6 yr. EUR Swap + 2.866% 2.880% VRN EUR (e) (g) (h) | | | 100,000 | | | 106,063 |
7 yr. EUR Swap + 3.347% 6.135% VRN EUR (e) (g) (h) | | | 600,000 | | | 713,323 |
| | | | | | 2,111,852 |
Tanzania, United Republic Of — 0.3%
| | | |
HTA Group Ltd.
7.500% 6/04/29 (g) | | | 367,000 | | | 372,505 |
Turkey — 1.0%
| | | | | | |
Akbank TAS 5 yr. CMT + 5.270% 9.369% VRN (g) (h) | | | 200,000 | | | 207,182 |
QNB Finansbank AS
7.250% 5/21/29 (g) | | | 397,000 | | | 417,842 |
Turkiye Garanti Bankasi AS 5 yr. CMT + 4.090%
8.375% VRN 2/28/34 (g) | | | 220,000 | | | 225,735 |
Ulker Biskuvi Sanayi AS
7.875% 7/08/31 (g) | | | 222,000 | | | 230,562 |
WE Soda Investments Holding PLC 9.500% 10/06/28 (g) | | | 306,000 | | | 317,962 |
| | | | | | 1,399,283 |
| | | | | | | |
| | | | | | | |
United Arab Emirates — 0.4%
| | | | | | |
DP World Salaam 5 yr. CMT + 5.750% 6.000% VRN (g) (h) | | | $555,000 | | | $554,334 |
United Kingdom — 4.3%
| | | | | | |
CPUK Finance Ltd.
7.875% 8/28/29 GBP (e) (g) | | | 200,000 | | | 273,841 |
Heathrow Finance PLC
6.625% 3/01/31 GBP (e) (g) | | | 250,000 | | | 334,521 |
House of Fraser Funding PLC
1.000% 9/15/20 GBP (e) (g) (k) | | | 150,000 | | | 100 |
KCA Deutag Pikco PLC
15.000% 12/01/27 | | | 117,766 | | | 121,005 |
KCA Deutag UK Finance PLC
9.875% 12/01/25 (g) | | | 500,000 | | | 502,502 |
1 day USD SOFR + 9.000%
14.199% FRN 12/01/25 | | | 143,476 | | | 146,130 |
Macquarie Airfinance Holdings Ltd.
| | | | | | |
8.125% 3/30/29 (g) | | | 139,000 | | | 147,215 |
8.375% 5/01/28 (g) | | | 131,000 | | | 137,721 |
Ocado Group PLC
| | | | | | |
Convertible, 0.750% 1/18/27
GBP (e) (g) | | | 100,000 | | | 111,281 |
3.875% 10/08/26 GBP (e) (g) | | | 300,000 | | | 377,020 |
10.500% 8/08/29 GBP (e) (g) | | | 170,000 | | | 224,450 |
Pinewood Finco PLC
6.000% 3/27/30 GBP (e) (g) | | | 300,000 | | | 402,204 |
Travelex Financing PLC, (Acquired 1/13/20, Cost $1,178,955), 8.000% 5/15/22
EUR (d) (e) (g) (k) | | | 1,050,000 | | | 4,383 |
Travelex Issuerco 2 PLC, (Acquired 5/07/24-8/05/24, Cost $2,385,415), 12.500% 8/05/25 GBP (d) (e) (g) | | | 1,855,994 | | | 2,789,862 |
TVL Finance PLC
10.250% 4/28/28 GBP (e) (g) | | | 100,000 | | | 140,045 |
Vodafone Group PLC
| | | | | | |
5 yr. EUR Swap + 3.477% 3.000% VRN 8/27/80
EUR (e) (g) | | | 500,000 | | | 518,608 |
5 yr. EUR Swap + 3.489% 6.500% VRN 8/30/84
EUR (e) (g) | | | 150,000 | | | 183,670 |
| | | | | | 6,414,558 |
United States — 17.6%
| | | | | | |
AdaptHealth LLC
4.625% 8/01/29 (g) | | | 500,000 | | | 463,048 |
Albertsons Cos., Inc./Safeway, Inc./
New Albertsons LP/
Albertsons LLC
6.500% 2/15/28 (g) (j) | | | 154,000 | | | 156,803 |
| | | | | | | |
| | | | | |
| | | The accompanying notes are an integral part of the financial statements.
| |
30
| | | | |
| | | | | |
TABLE OF CONTENTS
| | MassMutual Global Credit Income Opportunities Fund — Portfolio of Investments (Continued) | |
| | | | | | | |
Alliant Holdings Intermediate LLC/Alliant Holdings Co-Issuer 7.000% 1/15/31 (g) | | | $251,000 | | | $257,926 |
Alpha Generation LLC
6.750% 10/15/32 (g) | | | 288,000 | | | 292,060 |
Alta Equipment Group, Inc.
9.000% 6/01/29 (g) | | | 150,000 | | | 134,320 |
American Airlines, Inc./AAdvantage Loyalty IP Ltd.
| | | | | | |
5.500% 4/20/26 (g) | | | 347,083 | | | 346,093 |
5.750% 4/20/29 (g) | | | 114,000 | | | 113,811 |
AmWINS Group, Inc.
6.375% 2/15/29 (g) | | | 183,000 | | | 187,465 |
Arcosa, Inc.
6.875% 8/15/32 (g) | | | 56,000 | | | 58,606 |
Ardagh Metal Packaging Finance USA LLC/Ardagh Metal Packaging Finance PLC
4.000% 9/01/29 (g) (j) | | | 300,000 | | | 267,785 |
Arsenal AIC Parent LLC
8.000% 10/01/30 (g) | | | 312,000 | | | 334,802 |
Avient Corp.
7.125% 8/01/30 (g) | | | 140,000 | | | 145,969 |
Bath & Body Works, Inc.
6.875% 11/01/35 | | | 189,000 | | | 196,938 |
Bausch Health Cos., Inc.
| | | | | | |
5.500% 11/01/25 (g) (j) | | | 414,000 | | | 404,440 |
14.000% 10/15/30 (g) (j) | | | 200,000 | | | 182,650 |
Caesars Entertainment, Inc.
6.500% 2/15/32 (g) | | | 58,000 | | | 59,996 |
Carvana Co.
14.000% 6/01/31 (g) | | | 100,000 | | | 117,792 |
CCO Holdings LLC/CCO Holdings Capital Corp.
4.250% 2/01/31 (g) | | | 325,000 | | | 286,562 |
CHS/Community Health Systems, Inc.
| | | | | | |
5.625% 3/15/27 (g) | | | 150,000 | | | 147,610 |
10.875% 1/15/32 (g) | | | 300,000 | | | 330,596 |
Clear Channel Outdoor Holdings, Inc.
| | | | | | |
7.500% 6/01/29 (g) | | | 150,000 | | | 129,189 |
7.875% 4/01/30 (g) | | | 156,000 | | | 163,129 |
Cloud Software Group, Inc.
| | | | | | |
6.500% 3/31/29 (g) | | | 154,000 | | | 153,225 |
9.000% 9/30/29 (g) | | | 126,000 | | | 128,219 |
Clydesdale Acquisition Holdings, Inc. 6.625% 4/15/29 (g) | | | 155,000 | | | 156,470 |
6.875% 1/15/30 (g) | | | 101,000 | | | 103,145 |
8.750% 4/15/30 (g) (j) | | | 180,000 | | | 182,780 |
| | | | | | | |
| | | | | | | |
Consolidated Communications, Inc. 6.500% 10/01/28 (g) | | | $400,000 | | | $377,683 |
CSC Holdings LLC
4.625% 12/01/30 (g) | | | 300,000 | | | 152,248 |
Directv Financing LLC/Directv Financing Co-Obligor, Inc.
5.875% 8/15/27 (g) | | | 356,000 | | | 349,532 |
EnLink Midstream Partners LP
5.600% 4/01/44 | | | 206,000 | | | 196,882 |
EQM Midstream Partners LP
4.500% 1/15/29 (g) | | | 170,000 | | | 166,306 |
4.750% 1/15/31 (g) | | | 354,000 | | | 342,781 |
ESC Briggs & Stratton, Inc.
6.875% 12/15/49 (b) (c) (k) | | | 514,000 | | | — |
Focus Financial Partners LLC
6.750% 9/15/31 (g) | | | 436,000 | | | 440,162 |
Frontier Communications Holdings LLC 6.000% 1/15/30 (g) | | | 500,000 | | | 499,131 |
Genesee & Wyoming, Inc.
6.250% 4/15/32 (g) | | | 108,000 | | | 111,062 |
Genesis Energy LP/Genesis Energy Finance Corp.
| | | | | | |
8.000% 1/15/27 | | | 500,000 | | | 511,150 |
8.250% 1/15/29 | | | 111,000 | | | 114,936 |
GFL Environmental, Inc.
| | | | | | |
6.750% 1/15/31 (g) | | | 150,000 | | | 157,325 |
Graham Packaging Co., Inc.
| | | | | | |
7.125% 8/15/28 (g) | | | 207,000 | | | 204,958 |
HCA, Inc.
| | | | | | |
5.450% 9/15/34 | | | 106,000 | | | 109,068 |
Herbalife Ltd., Convertible,
| | | | | | |
4.250% 6/15/28 | | | 197,000 | | | 144,133 |
Herbalife Nutrition Ltd./HLF Financing, Inc.
7.875% 9/01/25 (g) | | | 372,000 | | | 370,619 |
Hilton Grand Vacations Borrower Escrow LLC/Hilton Grand Vacations Borrower Escrow, Inc.
6.625% 1/15/32 (g) | | | 109,000 | | | 110,336 |
ITT Holdings LLC
6.500% 8/01/29 (g) | | | 400,000 | | | 378,941 |
JBS USA Holding Lux SARL/JBS USA Food Co./JBS Lux Co. SARL
| | | | | | |
3.750% 12/01/31 | | | 150,000 | | | 137,959 |
5.500% 1/15/30 | | | 586,000 | | | 593,562 |
Level 3 Financing, Inc.
11.000% 11/15/29 (g) | | | 412,000 | | | 456,321 |
Life Time, Inc.
8.000% 4/15/26 (g) | | | 317,000 | | | 319,952 |
| | | | | | | |
| | | | | |
The accompanying notes are an integral part of the financial statements. | | | | |
| | | 31
| |
| | | | | |
TABLE OF CONTENTS
| | MassMutual Global Credit Income Opportunities Fund — Portfolio of Investments (Continued) | |
| | | | | | | |
LifePoint Health, Inc.
11.000% 10/15/30 (g) | | | $301,000 | | | $339,644 |
Lightning Power LLC
7.250% 8/15/32 (g) | | | 30,000 | | | 31,546 |
Live Nation Entertainment, Inc. 4.750% 10/15/27 (g) (j) | | | 250,000 | | | 246,465 |
LSF11 A5 HoldCo LLC
6.625% 10/15/29 (g) | | | 200,000 | | | 194,528 |
MasTec, Inc.
4.500% 8/15/28 (g) | | | 554,000 | | | 544,206 |
Mauser Packaging Solutions Holding Co.
| | | | | | |
7.875% 4/15/27 (g) | | | 200,000 | | | 206,636 |
9.250% 4/15/27 (g) | | | 311,000 | | | 318,891 |
McGraw-Hill Education, Inc.
7.375% 9/01/31 (g) | | | 215,000 | | | 223,078 |
Midcap Financial Issuer Trust
5.625% 1/15/30 (g) | | | 250,000 | | | 230,322 |
Midwest Gaming Borrower LLC/Midwest Gaming Finance Corp.
4.875% 5/01/29 (g) | | | 300,000 | | | 287,751 |
Mileage Plus Holdings LLC/Mileage Plus Intellectual Property Assets Ltd.
6.500% 6/20/27 (g) | | | 130,350 | | | 131,971 |
NCL Corp. Ltd.
6.250% 3/01/30 (g) | | | 219,000 | | | 218,757 |
Neogen Food Safety Corp.
8.625% 7/20/30 (g) | | | 413,000 | | | 457,121 |
Neptune Bidco US, Inc.
9.290% 4/15/29 (g) | | | 150,000 | | | 146,932 |
Newell Brands, Inc.
| | | | | | |
5.700% STEP 4/01/26 | | | 200,000 | | | 200,491 |
6.625% 9/15/29 | | | 150,000 | | | 151,867 |
7.000% STEP 4/01/46 | | | 100,000 | | | 89,539 |
NGL Energy Operating LLC/NGL Energy Finance Corp.
| | | | | | |
8.125% 2/15/29 (g) | | | 83,000 | | | 85,104 |
8.375% 2/15/32 (g) | | | 247,000 | | | 254,547 |
Novelis Corp.
3.875% 8/15/31 (g) | | | 246,000 | | | 224,884 |
OI European Group BV
6.250% 5/15/28 EUR (e) (g) | | | 130,000 | | | 150,716 |
Olympus Water US Holding Corp.
| | | | | | |
4.250% 10/01/28 (g) (j) | | | 210,000 | | | 200,527 |
7.125% 10/01/27 (g) | | | 285,000 | | | 290,868 |
Organon & Co./Organon Foreign Debt Co-Issuer BV
| | | | | | |
5.125% 4/30/31 (g) (j) | | | 200,000 | | | 188,424 |
6.750% 5/15/34 (g) | | | 200,000 | | | 206,554 |
| | | | | | | |
| | | | | | | |
Pactiv Evergreen Group Issuer LLC/Pactiv Evergreen Group Issuer, Inc.
4.375% 10/15/28 (g) | | | $204,000 | | | $195,399 |
Pentair Finance SARL
5.900% 7/15/32 | | | 750,000 | | | 802,818 |
Performance Food Group, Inc.
6.125% 9/15/32 (g) | | | 202,000 | | | 206,415 |
Permian Resources Operating LLC 7.000% 1/15/32 (g) | | | 124,000 | | | 129,001 |
Perrigo Finance Unlimited Co.
| | | | | | |
5.375% 9/30/32 EUR (e) | | | 100,000 | | | 113,263 |
6.125% 9/30/32 | | | 154,000 | | | 155,189 |
PetSmart, Inc./PetSmart Finance Corp. 7.750% 2/15/29 (g) | | | 500,000 | | | 493,583 |
Phinia, Inc.
6.625% 10/15/32 (g) | | | 297,000 | | | 299,452 |
Pike Corp.
5.500% 9/01/28 (g) | | | 655,000 | | | 641,499 |
PRA Group, Inc.
8.375% 2/01/28 (g) | | | 140,000 | | | 144,944 |
PROG Holdings, Inc.
6.000% 11/15/29 (g) | | | 567,000 | | | 559,345 |
Regal Rexnord Corp.
6.050% 4/15/28 | | | 500,000 | | | 519,859 |
Royal Caribbean Cruises Ltd.
5.625% 9/30/31 (g) | | | 100,000 | | | 101,313 |
Ryan Specialty LLC
5.875% 8/01/32 (g) | | | 58,000 | | | 58,966 |
Sabre GLBL, Inc., Convertible, 7.320% 8/01/26 | | | 200,000 | | | 223,100 |
Service Properties Trust
4.950% 2/15/27 (j) | | | 175,000 | | | 165,652 |
Standard Industries, Inc.
| | | | | | |
3.375% 1/15/31 (g) | | | 9,000 | | | 8,018 |
4.375% 7/15/30 (g) | | | 100,000 | | | 94,650 |
T-Mobile USA, Inc.
3.375% 4/15/29 | | | 750,000 | | | 719,819 |
Terex Corp.
6.250% 10/15/32 (g) (i) | | | 247,000 | | | 247,000 |
TransDigm, Inc.
6.750% 8/15/28 (g) | | | 258,000 | | | 265,556 |
Trident TPI Holdings, Inc.
12.750% 12/31/28 (g) | | | 318,000 | | | 353,019 |
UGI International LLC
2.500% 12/01/29 EUR (e) (g) | | | 500,000 | | | 518,639 |
UKG, Inc.
6.875% 2/01/31 (g) | | | 109,000 | | | 112,630 |
US Foods, Inc.
5.750% 4/15/33 (g) (i) | | | 151,000 | | | 151,162 |
| | | | | | | |
| | | | | |
| | | The accompanying notes are an integral part of the financial statements.
| |
32
| | | | |
| | | | | |
TABLE OF CONTENTS
| | MassMutual Global Credit Income Opportunities Fund — Portfolio of Investments (Continued) | |
| | | | | | | |
Veritas US, Inc./Veritas Bermuda Ltd., (Acquired 10/03/23, Cost $315,671), 7.500% 9/01/25
(d) (g) (j) | | | $341,000 | | | $319,905 |
Vibrantz Technologies, Inc.
9.000% 2/15/30 (g) | | | 250,000 | | | 233,547 |
Vortex Opco LLC
8.000% 4/30/30 (g) | | | 248,227 | | | 99,291 |
Walgreens Boots Alliance, Inc.
| | | | | | |
3.200% 4/15/30 | | | 135,000 | | | 109,523 |
4.800% 11/18/44 (j) | | | 28,000 | | | 20,952 |
8.125% 8/15/29 (j) | | | 300,000 | | | 299,425 |
Watco Cos. LLC/Watco Finance Corp. 7.125% 8/01/32 (g) | | | 167,000 | | | 174,059 |
Zayo Group Holdings, Inc.
| | | | | | |
4.000% 3/01/27 (g) (j) | | | 62,000 | | | 55,455 |
6.125% 3/01/28 (g) | | | 120,000 | | | 99,600 |
| | | | | | 26,059,893 |
Uzbekistan — 0.1%
| | | | | | |
Uzbek Industrial & Construction Bank ATB
8.950% 7/24/29 (g) | | | 200,000 | | | 200,800 |
Zambia — 0.2%
| | | | | | |
First Quantum Minerals Ltd.
9.375% 3/01/29 (g) | | | 245,000 | | | 259,686 |
TOTAL CORPORATE DEBT
(Cost $51,646,260) | | | | | | 51,758,959 |
Non-U.S. Government Agency Obligations — 4.8%
|
Cayman Islands — 2.2%
| | | | | | |
ARES XLVIII CLO Ltd., Series 2018-48A, Class E, 3 mo. USD Term SOFR + 5.462%
10.744% FRN 7/20/30 (g) | | | 800,000 | | | 792,345 |
Cedar Funding IV CLO Ltd., Series 2014-4A, Class ERR, 3 mo. USD Term SOFR + 6.872% 12.155% FRN 7/23/34 (g) | | | 1,000,000 | | | 993,450 |
Madison Park Funding XIII Ltd., Series 2014-13A, Class SUB, 7.790% VRN 4/19/30 (g) (l) | | | 500,000 | | | 32,500 |
Madison Park Funding XXVII Ltd., Series 2018-27A, Class D, 3 mo. USD Term SOFR + 5.262% 10.544% FRN 4/20/30 (g) | | | 500,000 | | | 500,549 |
Madison Park Funding XXVIII Ltd., Series 2018-28A, Class F,
3 mo. USD Term SOFR + 7.862% 13.163% FRN
7/15/30 (g) | | | 500,000 | | | 471,101 |
| | | | | | | |
| | | | | | | |
Magnetite VII Ltd., (Acquired 5/16/18, Cost $1,761,735),
5.000% VRN 1/15/28
(d) (g) (l) | | | $2,000,000 | | | $77,476 |
Wellfleet CLO Ltd., Series 2018-1A, Class E, 3 mo. USD Term
SOFR + 5.762%
11.047% FRN 7/17/31 (g) | | | 500,000 | | | 456,272 |
| | | | | | 3,323,693 |
Ireland — 1.9%
| | | | | | |
Bain Capital Euro CLO DAC, Series 2021-2A, Class E, 3 mo. EURIBOR + 6.220%
9.882% FRN 7/17/34
EUR (e) (g) | | | 800,000 | | | 865,547 |
BlackRock European CLO VII DAC, Series 7X, Class E, 3 mo.
EURIBOR + 5.170%
8.855% FRN 10/15/31
EUR (e) (g) | | | 725,000 | | | 803,495 |
Tymon Park CLO DAC, Series 1A, Class DRR, 3 mo.
EURIBOR + 6.160%
9.848% FRN 7/21/34
EUR (e) (g) | | | 1,000,000 | | | 1,119,316 |
| | | | | | 2,788,358 |
United Kingdom — 0.7%
| | | | | | |
Canyon Capital CLO Ltd.,
Series 2022-2A, Class E, 3 mo. USD Term SOFR + 6.000%
11.286% FRN 1/15/36 (g) | | | 1,000,000 | | | 1,002,111 |
TOTAL NON-U.S. GOVERNMENT AGENCY OBLIGATIONS
(Cost $9,411,699) | | | | | | 7,114,162 |
Sovereign Debt Obligations — 0.2%
|
Uzbekistan — 0.2%
| | | | | | |
National Bank of Uzbekistan
8.500% 7/05/29 (g) | | | 300,000 | | | 305,157 |
TOTAL SOVEREIGN DEBT OBLIGATIONS
(Cost $297,132) | | | | | | 305,157 |
TOTAL BONDS & NOTES
(Cost $137,014,772) | | | | | | 134,724,146 |
| | | | | | | |
| | | | | |
The accompanying notes are an integral part of the financial statements. | | | | |
| | | 33
| |
| | | | | |
TABLE OF CONTENTS
| | MassMutual Global Credit Income Opportunities Fund — Portfolio of Investments (Continued) | |
| | | | | | | |
Warrants — 0.0%
| | | | | | |
United Kingdom — 0.0%
| | | | | | |
Travelex Topco Ltd. (a) | | | 837 | | | $22,381 |
TOTAL WARRANTS
(Cost $0) | | | | | | 22,381 |
Rights — 0.0%
| | | | | | |
Norway — 0.0%
| | | | | | |
Silk Topco AS, CVR (a) (b) (c) | | | 52,953 | | | — |
United Kingdom — 0.1%
| | | | | | |
Innovation Group PLC (a) (b) (c) | | | 21,315 | | | — |
Innovation Group PLC (a) (b) (c) | | | 83,667 | | | — |
TOTAL RIGHTS
(Cost $0) | | | | | | — |
TOTAL LONG-TERM INVESTMENTS
(Cost $137,712,429) | | | | | | 135,385,515 |
Short-Term Investments — 13.2%
|
Investment of Cash Collateral from
Securities Loaned — 1.8%
| | | |
State Street Navigator Securities Lending Government Money Market Portfolio (m) | | | 2,683,060 | | | 2,683,060 |
| | | | | | | |
| | | | | | | |
Repurchase Agreement — 11.4%
| | | | | | |
Fixed Income Clearing Corp., Repurchase Agreement, dated 9/30/24, 1.520%,
due 10/01/24 (n) | | | $16,887,395 | | | 16,887,395 |
TOTAL SHORT-TERM INVESTMENTS
(Cost $19,570,455) | | | | | | 19,570,455 |
TOTAL INVESTMENTS — 104.5%
(Cost $157,282,884) (o) | | | | | | 154,955,970 |
Other Assets/
(Liabilities) — (4.5)% | | | | | | (6,630,556) |
NET ASSETS — 100.0% | | | | | | $148,325,414 |
| | | | | | | |
Abbreviation Legend
| | | | | |
CLO | | | Collateralized Loan Obligation | |
CMT | | | Constant Maturity Treasury Index | |
CVR | | | Contingent Value Rights | |
EURIBOR | | | Euro Inter-Bank Offered Rate | |
| | | | | |
| | | | | |
FRN | | | Floating Rate Note | |
ICE | | | Inter-Continental Exchange | |
PIK | | | Payment in kind | |
SOFR | | | Secured Overnight Financing Rate | |
STEP | | | Step Coupon Bond | |
VRN | | | Variable Rate Note | |
| | | | | |
Notes to Portfolio of Investments
Percentages are stated as a percent of net assets.
(a)
| Non-income producing security. |
(b)
| This security is fair valued in good faith in accordance with procedures approved by the Board of Trustees. At September 30, 2024, these securities amounted to a value of $78,787 or 0.05% of net assets.
|
(c)
| Investment is valued using significant unobservable inputs.
|
(d)
| Restricted security. Certain securities are restricted to resale. At September 30, 2024, these securities amounted to a value of $4,190,739 or 2.83% of net assets. The Fund generally bears the costs, if any, associated with the disposition of restricted securities.
|
(e)
| The principal amount of the security is in foreign currency. The market value is in U.S. dollars.
|
(f)
| All or a portion of the security represents unsettled bank loan commitments at September 30, 2024, where the rate will be determined at time of settlement.
|
(g)
| Security is exempt from registration under Regulation S or Rule 144A of the Securities Act of 1933. These securities are considered restricted and may be resold in transactions exempt from registration. At September 30, 2024, the aggregate market value of these securities amounted to $52,751,353 or 35.56% of net assets.
|
(h)
| Security is perpetual and has no stated maturity date.
|
(i)
| A portion of this security is purchased on a when-issued, delayed-delivery or forward commitment basis. (Note 2).
|
(j)
| Denotes all or a portion of security on loan. The total value of securities on loan as of September 30, 2024, was $2,627,901 or 1.77% of net assets. (Note 2).
|
(k)
| Security is currently in default due to bankruptcy or failure to make payment of principal or interest of the issuer. Income is not being accrued. At September 30, 2024, these securities amounted to a value of $18,546 or 0.01% of net assets.
|
(l)
| Certain variable rate securities are not based on a published reference rate and spread but are determined by the issuer or agent and are based on current market conditions. These securities do not indicate a reference rate and spread in their description above. The rates shown are the current interest rates at September 30, 2024.
|
(m)
| Represents investment of security lending cash collateral. (Note 2).
|
(n)
| Maturity value of $16,888,108. Collateralized by U.S. Government Agency obligations with rates ranging from 2.125% - 3.625%, maturity dates ranging from 2/15/53 – 2/15/54, and an aggregate market value, including accrued interest, of $17,225,318. |
(o)
| See Note 6 for aggregate cost for federal tax purposes. |
| | | | | |
| | | The accompanying notes are an integral part of the financial statements.
| |
34
| | | | |
| | | | | |
TABLE OF CONTENTS
| | MassMutual Global Credit Income Opportunities Fund — Portfolio of Investments (Continued) | |
Forward contracts
| | | | | | | | | | | | | |
Bank of America N.A.* | | | 10/23/24 | | | USD | | | 4,711,444 | | | GBP | | | 3,573,326 | | | $(65,871) |
Morgan Stanley & Co. LLC* | | | 10/23/24 | | | USD | | | 39,472,829 | | | EUR | | | 35,439,238 | | | (10,498) |
Morgan Stanley & Co. LLC* | | | 10/23/24 | | | USD | | | 98,049 | | | CAD | | | 133,156 | | | (457) |
| | | | | | | | | | | | | | | | | | $ (76,826) |
| | | | | | | | | | | | | | | | | | | |
Futures contracts
| | | | | | | | | | | | | |
Long | | | | | | | | | | | | |
U.S. Treasury Note 5 Year | | | 12/31/24 | | | 163 | | | $17,936,682 | | | $ (25,783) |
| | | | | | | | | | | | | |
*
| Contracts are subject to a master netting agreement or similar agreement. |
Currency Legend
| | | | | |
CAD | | | Canadian Dollar | |
EUR | | | Euro | |
GBP | | | British Pound | |
USD | | | U.S. Dollar | |
| | | | | |
| | | | | |
The accompanying notes are an integral part of the financial statements. | | | | |
| | | 35
| |
| | | | | |
TABLE OF CONTENTS
| | | |
| | MassMutual Emerging Markets Debt Blended Total Return Fund — Portfolio of Investments | |
| | | |
| | | | | | | |
Bonds & Notes — 93.9%
| | | | | | |
Corporate Debt — 35.8%
| | | | | | |
Argentina — 1.4%
| | | | | | |
Pampa Energia SA
7.950% 9/10/31 (a) | | | $200,000 | | | $203,000 |
Transportadora de Gas del Sur SA 8.500% 7/24/31 (a) | | | 171,000 | | | 177,986 |
| | | | | | 380,986 |
Brazil — 1.7%
| | | | | | |
BRF SA 5.750% 9/21/50 (a) | | | 200,000 | | | 173,486 |
Samarco Mineracao SA
9.000% 6/30/31 (a) | | | 313,651 | | | 293,866 |
| | | | | | 467,352 |
Chile — 2.9%
| | | | | | |
Banco de Credito e Inversiones SA
5 yr. CMT + 4.944%
8.750% VRN (a) (b) (c) | | | 373,000 | | | 401,631 |
Sable International Finance Ltd. 7.125% 10/15/32 (a) (f) | | | 200,000 | | | 200,750 |
VTR Comunicaciones SpA
4.375% 4/15/29 (a) | | | 250,000 | | | 213,856 |
| | | | | | 816,237 |
China — 0.8%
| | | | | | |
Prosus NV 3.832% 2/08/51 (a) | | | 306,000 | | | 215,385 |
Colombia — 3.5%
| | | | | | |
Bancolombia SA 5 yr.
CMT + 4.320%
8.625% VRN 12/24/34 | | | 385,000 | | | 413,317 |
Colombia Telecomunicaciones SA
ESP 4.950% 7/17/30 (a) | | | 200,000 | | | 171,247 |
Termocandelaria Power SA
7.750% 9/17/31 (a) | | | 373,000 | | | 381,993 |
| | | | | | 966,557 |
Dominican Republic — 0.9%
| | | | | | |
Aeropuertos Dominicanos Siglo XXI SA
7.000% 6/30/34 (a) | | | 240,000 | | | 251,376 |
Ghana — 1.2%
| | | | | | |
Tullow Oil PLC
10.250% 5/15/26 (a) | | | 354,000 | | | 321,310 |
India — 2.4%
| | | | | | |
Continuum Green Energy India Pvt/Co-Issuers
7.500% 6/26/33 (a) | | | 250,000 | | | 262,500 |
| | | | | | | |
| | | | | | | |
India Cleantech Energy
4.700% 8/10/26 (a) | | | $ 430,204 | | | $416,480 |
| | | | | | 678,980 |
Indonesia — 1.3%
| | | | | | |
Medco Maple Tree Pte. Ltd.
8.960% 4/27/29 (a) | | | 350,000 | | | 369,249 |
Mexico — 2.0%
| | | | | | |
Banco Mercantil del Norte SA
10 yr. CMT + 5.034%
6.625% VRN (a) (b) | | | 334,000 | | | 310,627 |
Infraestructura Energetica Nova SAPI de CV 4.750% 1/15/51 (a) | | | 312,000 | | | 241,619 |
| | | | | | 552,246 |
Morocco — 1.2%
| | | | | | |
OCP SA 5.125% 6/23/51 (a) | | | 412,000 | | | 334,750 |
Nigeria — 0.9%
| | | | | | |
IHS Netherlands Holdco BV 8.000% 9/18/27 (a) | | | 250,000 | | | 250,523 |
Paraguay — 0.9%
| | | | | | |
Rutas 2 & 7 Finance Ltd.
0.000% 9/30/36 (a) | | | 359,907 | | | 259,376 |
Peru — 2.3%
| | | | | | |
Banco Internacional del Peru SAA Interbank 1 yr. CMT + 3.652% 7.625% VRN 1/16/34 (a) | | | 257,000 | | | 277,619 |
Pluspetrol Camisea SA/Pluspetrol Lote 56 SA 6.240% 7/03/36 (a) | | | 331,000 | | | 354,704 |
| | | | | | 632,323 |
Republic of Korea — 0.8%
| | | | | | |
Woori Bank 5 yr. CMT + 2.277% 6.375% VRN (a) (b) | | | 210,000 | | | 215,309 |
Russia — 0.4%
| | | | | | |
Sovcombank Via SovCom Capital DAC 7.750% (a) (b) (d) | | | 1,450,000 | | | 40,781 |
8.000% 4/07/30 (a) (d) | | | 1,165,000 | | | 58,250 |
| | | | | | 99,031 |
Saudi Arabia — 1.2%
| | | | | | |
Greensaif Pipelines Bidco SARL 6.510% 2/23/42 (a) | | | 321,000 | | | 345,529 |
Senegal — 2.0%
| | | | | | |
European Bank for Reconstruction & Development
0.000% 11/10/30 TRY (e) | | | 203,000,000 | | | 549,090 |
| | | | | | | |
| | | | | |
| | | The accompanying notes are an integral part of the financial statements.
| |
36
| | | | |
| | | | | |
TABLE OF CONTENTS
| | MassMutual Emerging Markets Debt Blended Total Return Fund — Portfolio of Investments (Continued) | |
| | | | | | | |
Tanzania, United Republic Of — 1.1%
| |
HTA Group Ltd.
7.500% 6/04/29 (a) | | | $306,000 | | | $310,590 |
Thailand — 0.8%
| | | | | | |
Muangthai Capital PCL
6.875% 9/30/28 (a) | | | 235,000 | | | 236,601 |
Turkey — 3.6%
| | | | | | |
Akbank TAS 5 yr. CMT + 5.270% 9.369% VRN (a) (b) | | | 250,000 | | | 258,978 |
QNB Finansbank AS
7.250% 5/21/29 (a) | | | 276,000 | | | 290,490 |
Ulker Biskuvi Sanayi AS
7.875% 7/08/31 (a) | | | 222,000 | | | 230,523 |
WE Soda Investments Holding PLC 9.500% 10/06/28 (a) | | | 214,000 | | | 222,365 |
| | | | | | 1,002,356 |
United States — 1.8%
| | | | | | |
Gabon Blue Bond Master Trust
6.097% 8/01/38 (a) | | | 300,000 | | | 302,269 |
Inter-American Development Bank 6.550% 2/27/31 CRC (e) | | | 100,000,000 | | | 192,341 |
| | | | | | 494,610 |
Uzbekistan — 0.7%
| | | | | | |
Uzbek Industrial & Construction Bank ATB 8.950% 7/24/29 (a) | | | 200,000 | | | 200,800 |
TOTAL CORPORATE DEBT
(Cost $12,293,435) | | | | | | 9,950,566 |
Sovereign Debt Obligations — 58.1%
| |
Albania — 2.1%
| | | | | | |
Albania Government International Bond
5.900% 6/09/28 EUR (a) (e) | | | 510,000 | | | 593,650 |
Angola — 1.4%
| | | | | | |
Angolan Government International Bond 9.375% 5/08/48 (a) (c) | | | 460,000 | | | 388,700 |
Armenia — 1.0%
| | | | | | |
Republic of Armenia International Bond 3.600% 2/02/31 (a) | | | 340,000 | | | 289,316 |
Bahamas — 1.2%
| | | | | | |
Bahamas Government International Bond 8.950% 10/15/32 (a) | | | 340,000 | | | 346,344 |
| | | | | | | |
| | | | | | | |
Brazil — 1.3%
| | | | | | |
Brazilian Government International Bond
| | | | | | |
4.750% 1/14/50 | | | $200,000 | | | $152,809 |
7.125% 5/13/54 | | | 200,000 | | | 206,923 |
| | | | | | 359,732 |
Chile — 2.0%
| | | | | | |
Bonos de la Tesoreria de la Republica en pesos
| | | | | | |
5.800% 10/01/34 CLP (a) (e) | | | 185,000,000 | | | 218,017 |
6.200% 10/01/40 CLP (a) (e) | | | 250,000,000 | | | 323,656 |
| | | | | | 541,673 |
Colombia — 4.9%
| | | | | | |
Colombia Government International Bond
| | | | | | |
8.000% 11/14/35 | | | 200,000 | | | 212,900 |
8.750% 11/14/53 | | | 410,000 | | | 448,798 |
Colombia TES
7.250% 10/26/50 COP (e) | | | 4,300,000,000 | | | 704,976 |
| | | | | | 1,366,674 |
Costa Rica — 2.1%
| | | | | | |
Costa Rica Government International Bond
6.125% 2/19/31 (a) | | | 350,000 | | | 362,486 |
7.300% 11/13/54 (a) | | | 200,000 | | | 220,753 |
| | | | | | 583,239 |
Czech Republic — 4.7%
| | | | | | |
Czech Republic Government Bond 0.950% 5/15/30 CZK (a) (e) | | | 9,800,000 | | | 378,077 |
1.500% 4/24/40 CZK (e) | | | 20,350,000 | | | 640,714 |
2.500% 8/25/28 CZK (a) (e) | | | 7,000,000 | | | 299,559 |
| | | | | | 1,318,350 |
Dominican Republic — 1.5%
| | | | | | |
Dominican Republic International Bond
| | | | | | |
6.000% 2/22/33 (a) | | | 240,000 | | | 245,062 |
6.600% 6/01/36 (a) | | | 150,000 | | | 159,075 |
| | | | | | 404,137 |
Egypt — 1.0%
| | | | | | |
Egypt Government International Bond
7.625% 5/29/32 (a) | | | 310,000 | | | 274,455 |
Guatemala — 1.5%
| | | | | | |
Guatemala Government Bond 4.650% 10/07/41 (a) | | | 490,000 | | | 404,202 |
| | | | | | | |
| | | | | |
The accompanying notes are an integral part of the financial statements. | | | | |
| | | 37
| |
| | | | | |
TABLE OF CONTENTS
| | MassMutual Emerging Markets Debt Blended Total Return Fund — Portfolio of Investments (Continued) | |
| | | | | | | |
Hungary — 1.9%
| | | | | | |
Hungary Government International Bond
3.000% 4/25/41 HUF (e) | | | $295,000,000 | | | $540,496 |
Ivory Coast — 2.0%
| | | | | | |
Ivory Coast Government International Bond
| | | | | | |
5.750% STEP 12/31/32 (a) | | | 249,924 | | | 238,754 |
5.875% 10/17/31 EUR (a) (e) | | | 300,000 | | | 315,995 |
| | | | | | 554,749 |
Jamaica — 0.9%
| | | | | | |
Jamaica Government International Bond
7.875% 7/28/45 | | | 200,000 | | | 247,125 |
Jordan — 0.8%
| | | | | | |
Jordan Government International Bond
7.375% 10/10/47 (a) | | | 238,000 | | | 218,067 |
Mexico — 2.8%
| | | | | | |
Mexican Bonos
8.000% 11/07/47 MXN (e) | | | 12,000,000 | | | 513,519 |
Mexico Government International Bond
6.338% 5/04/53 | | | 270,000 | | | 268,105 |
| | | | | | 781,624 |
Morocco — 1.3%
| | | | | | |
Morocco Government International Bond
5.500% 12/11/42 (a) | | | 370,000 | | | 351,014 |
Paraguay — 2.2%
| | | | | | |
Paraguay Government International Bond
| | | | | | |
5.400% 3/30/50 (a) | | | 330,000 | | | 307,419 |
7.900% 2/09/31 PYG (a) (e) | | | 2,381,000,000 | | | 311,988 |
| | | | | | 619,407 |
Peru — 2.5%
| | | | | | |
Peru Government Bond
6.850% 2/12/42 PEN (e) | | | 2,509,000 | | | 692,704 |
Romania — 2.0%
| | | | | | |
Romanian Government International Bond
4.625% 4/03/49 EUR (a) (e) | | | 600,000 | | | 561,464 |
Serbia — 2.9%
| | | | | | |
Serbia International Bond
2.050% 9/23/36 EUR (a) (e) | | | 979,000 | | | 811,146 |
| | | | | | | |
| | | | | | | |
South Africa — 6.8%
| | | | | | |
Republic of South Africa Government International Bond 7.300% 4/20/52 | | | $490,000 | | | $487,050 |
8.750% 1/31/44 ZAR (e) | | | 13,850,000 | | | 671,314 |
8.750% 2/28/48 ZAR (e) | | | 15,000,000 | | | 727,133 |
| | | | | | 1,885,497 |
Sri Lanka — 2.9%
| | | | | | |
Sri Lanka Government International Bond
| | | | | | |
6.825% 7/18/26 (a) (d) | | | 200,000 | | | 112,024 |
7.550% 3/28/30 (a) (d) | | | 465,000 | | | 260,434 |
7.850% 3/14/29 (a) (d) | | | 750,000 | | | 419,923 |
| | | | | | 792,381 |
Tajikistan — 3.6%
| | | | | | |
Republic of Tajikistan International Bond
7.125% 9/14/27 (a) | | | 1,015,000 | | | 995,177 |
Turkey — 0.8%
| | | | | | |
Turkiye Government International Bond
9.375% 1/19/33 | | | 200,000 | | | 234,000 |
TOTAL SOVEREIGN DEBT OBLIGATIONS
(Cost $15,992,279) | | | | | | 16,155,323 |
TOTAL BONDS & NOTES
(Cost $28,285,714) | | | | | | 26,105,889 |
TOTAL PURCHASED
OPTIONS (#) — 0.4%
(Cost $124,124) | | | | | | 121,719 |
TOTAL LONG-TERM INVESTMENTS
(Cost $28,409,838) | | | | | | 26,227,608 |
| | | | | | | |
| | | | | | | |
Short-Term Investments — 5.2%
| |
Investment of Cash Collateral from Securities Loaned — 1.8%
| | | | | | |
State Street Navigator Securities Lending Government Money Market Portfolio (g) | | | 499,350 | | | 499,350 |
| | | | | | | |
| | | | | |
| | | The accompanying notes are an integral part of the financial statements.
| |
38
| | | | |
| | | | | |
TABLE OF CONTENTS
| | MassMutual Emerging Markets Debt Blended Total Return Fund — Portfolio of Investments (Continued) | |
| | | | | | | |
Repurchase Agreement — 3.3%
| | | | | | |
Fixed Income Clearing Corp., Repurchase Agreement, dated 9/30/24, 1.520%,
due 10/01/24 (h) | | | $904,902 | | | $ 904,902 |
| | | | | | | |
| | | | |
Sovereign Debt Obligations — 0.1%
| | | |
Egypt Treasury Bills
0.000% 3/18/25 EGP (e) | | | 1,400,000 | | | 25,591 |
| | | | | | 25,591 |
TOTAL SHORT-TERM INVESTMENTS
(Cost $1,430,390) | | | | | | 1,429,843 |
TOTAL INVESTMENTS — 99.5%
(Cost $29,840,228) (i) | | | | | | 27,657,451 |
Other Assets/
(Liabilities) — 0.5% | | | | | | 138,003 |
NET ASSETS — 100.0% | | | | | | $27,795,454 |
| | | | | | | |
Abbreviation Legend
| | | | | |
CMT | | | Constant Maturity Treasury Index | |
STEP | | | Step Coupon Bond | |
VRN | | | Variable Rate Note | |
| | | | | |
Notes to Portfolio of Investments
Percentages are stated as a percent of net assets.
(a)
| Security is exempt from registration under Regulation S or Rule 144A of the Securities Act of 1933. These securities are considered restricted and may be resold in transactions exempt from registration. At September 30, 2024, the aggregate market value of these securities amounted to $18,202,575 or 65.49% of net assets. |
(b)
| Security is perpetual and has no stated maturity date. |
(c)
| Denotes all or a portion of security on loan. The total value of securities on loan as of September 30, 2024, was $488,920 or 1.76% of net assets. (Note 2). |
(d)
| Security is currently in default due to bankruptcy or failure to make payment of principal or interest of the issuer. Income is not being accrued. At September 30, 2024, these securities amounted to a value of $891,412 or 3.21% of net assets. |
(e)
| The principal amount of the security is in foreign currency. The market value is in U.S. dollars. |
(f)
A portion of this security is purchased on a when-issued, delayed-delivery or forward commitment basis. (Note 2).
(g)
| Represents investment of security lending cash collateral. (Note 2). |
(h)
| Maturity value of $904,940. Collateralized by U.S. Government Agency obligations with a rate of 2.125%, maturity date of 2/15/54, and an aggregate market value, including accrued interest, of $923,122. |
(i)
| See Note 6 for aggregate cost for federal tax purposes. |
(#) OTC Options Purchased
| | | | | | | | | | | | | | | | | | | | | | | | | | | | |
Call
| | | | | | | | | | | | | | | | | | | | | | | | | |
USD Call CHF Put | | | Goldman Sachs International* | | | 11/22/24 | | | 0.89 | | | 1,282,000 | | | USD 1,282,000 | | | $701 | | | $2,615 | | | $(1,914) | |
USD Call CHF Put | | | Goldman Sachs International* | | | 12/17/24 | | | 0.85 | | | 912,000 | | | USD 912,000 | | | 8,410 | | | 9,778 | | | (1,368) | |
USD Call CHF Put | | | Goldman Sachs International* | | | 12/17/24 | | | 0.87 | | | 912,000 | | | USD 912,000 | | | 3,165 | | | 4,048 | | | (883) | |
USD Call ZAR Put | | | Morgan Stanley & Co. LLC* | | | 11/27/24 | | | 18.21 | | | 214,000 | | | USD 214,000 | | | 1,430 | | | 4,469 | | | (3,039) | |
USD Call ZAR Put | | | Morgan Stanley & Co. LLC* | | | 11/27/24 | | | 18.59 | | | 214,000 | | | USD 214,000 | | | 838 | | | 2,990 | | | (2,152) | |
| | | | | | | | | | | | | | | | | | $ 14,544 | | | $ 23,900 | | | $ (9,356) | |
Put
| | | | | | | | | | | | | | | | | | | | | | | | | |
USD Put BRL Call | | | Bank of America N.A.* | | | 10/04/24 | | | 5.37 | | | 428,000 | | | USD 428,000 | | | $631 | | | $3,350 | | | $(2,719) | |
USD Put BRL Call | | | Bank of America N.A.* | | | 10/04/24 | | | 5.59 | | | 321,000 | | | USD 321,000 | | | 8,161 | | | 6,638 | | | 1,523 | |
USD Put BRL Call | | | Bank of America N.A.* | | | 11/04/24 | | | 5.46 | | | 892,000 | | | USD 892,000 | | | 14,266 | | | 6,579 | | | 7,687 | |
USD Put BRL Call | | | Bank of America N.A.* | | | 11/04/24 | | | 5.67 | | | 535,000 | | | USD 535,000 | | | 22,810 | | | 10,361 | | | 12,449 | |
USD Put MXN Call | | | Goldman Sachs International* | | | 10/31/24 | | | 17.92 | | | 842,000 | | | USD 842,000 | | | 119 | | | 5,819 | | | (5,700) | |
USD Put MXN Call | | | Goldman Sachs International* | | | 10/31/24 | | | 18.56 | | | 842,000 | | | USD 842,000 | | | 850 | | | 15,745 | | | (14,895) | |
USD Put KRW Call | | | Goldman Sachs International* | | | 11/11/24 | | | 1,307.00 | | | 838,000 | | | USD 838,000 | | | 8,891 | | | 4,173 | | | 4,718 | |
USD Put KRW Call | | | Goldman Sachs International* | | | 11/11/24 | | | 1,333.00 | | | 558,000 | | | USD 558,000 | | | 11,926 | | | 5,714 | | | 6,212 | |
USD Put ZAR Call | | | Morgan Stanley & Co. LLC* | | | 10/03/24 | | | 17.69 | | | 428,000 | | | USD 428,000 | | | $10,227 | | | $3,189 | | | $7,038 | |
| | | | | | | | | | | | | | | | | | | | | | | | | | |
| | | | | |
The accompanying notes are an integral part of the financial statements. | | | | |
| | | 39
| |
| | | | | |
TABLE OF CONTENTS
| | MassMutual Emerging Markets Debt Blended Total Return Fund — Portfolio of Investments (Continued) | |
| | | | | | | | | | | | | | | | | | | | | | | | | | | | |
USD Put BRL Call | | | Morgan Stanley & Co. LLC* | | | 10/23/24 | | | 5.36 | | | 437,000 | | | USD 437,000 | | | 2,493 | | | 2,980 | | | (487) | |
USD Put BRL Call | | | Morgan Stanley & Co. LLC* | | | 10/23/24 | | | 5.55 | | | 437,000 | | | USD 437,000 | | | 10,540 | | | 7,853 | | | 2,687 | |
USD Put MXN Call | | | Morgan Stanley & Co. LLC* | | | 2/06/25 | | | 18.06 | | | 940,000 | | | USD 940,000 | | | 3,047 | | | 6,692 | | | (3,645) | |
USD Put MXN Call | | | Morgan Stanley & Co. LLC* | | | 2/06/25 | | | 19.13 | | | 940,000 | | | USD 940,000 | | | 13,214 | | | 21,131 | | | (7,917) | |
| | | | | | | | | | | | | | | | | | $107,175 | | | $100,224 | | | $6,951 | |
| | | | | | | | | | | | | | | | | | $ 121,719 | | | $ 124,124 | | | $(2,405) | |
| | | | | | | | | | | | | | | | | | | | | | | | | | |
OTC Options Written
| | | | | | | | | | | | | | | | | | | | | | | | | |
Call | | | | | | | | | | | | | | | | | | | | | | | | | | | |
USD Call MXN Put | | | Goldman Sachs International* | | | 10/31/24 | | | 18.90 | | | 842,000 | | | USD | | | 842,000 | | | $(39,646) | | | $(23,702) | | | $(15,944) |
USD Call MXN Put | | | Morgan Stanley & Co. LLC* | | | 11/06/24 | | | 19.63 | | | 940,000 | | | USD | | | 940,000 | | | (24,033) | | | (30,644) | | | 6,611 |
| | | | | | | | | | | | | | | | | | | | | $(63,679) | | | $(54,346) | | | $(9,333) |
Put | | | | | | | | | | | | | | | | | | | | | | | | | | | |
USD Put CHF Call | | | Goldman Sachs International* | | | 12/17/24 | | | 0.84 | | | 912,000 | | | USD | | | 912,000 | | | $(12,400) | | | $(14,204) | | | $1,804 |
USD Put BRL Call | | | Morgan Stanley & Co. LLC* | | | 11/04/24 | | | 5.67 | | | 317,000 | | | USD | | | 317,000 | | | (13,515) | | | (13,067) | | | (448) |
| | | | | | | | | | | | | | | | | | | | | $(25,915) | | | $(27,271) | | | $1,356 |
| | | | | | | | | | | | | | | | | | | | | $ (89,594) | | | $ (81,617) | | | $(7,977) |
| | | | | | | | | | | | | | | | | | | | | | | | | | | | |
Forward contracts
| | | | | | | | | | | | | |
Bank of America N.A.* | | | 10/15/24 | | | HUF | | | 92,726,000 | | | USD | | | 262,363 | | | $(2,694) |
Bank of America N.A.* | | | 11/05/24 | | | MXN | | | 34,438,934 | | | USD | | | 1,804,185 | | | (64,008) |
Bank of America N.A.* | | | 11/19/24 | | | USD | | | 972,946 | | | CNH | | | 6,903,009 | | | (15,499) |
BNP Paribas SA* | | | 10/22/24 | | | THB | | | 30,782,097 | | | USD | | | 856,963 | | | 100,964 |
Citibank N.A.* | | | 10/08/24 | | | USD | | | 977,195 | | | COP | | | 3,982,065,930 | | | 31,225 |
Citibank N.A.* | | | 11/05/24 | | | CLP | | | 468,085,585 | | | USD | | | 489,251 | | | 31,116 |
Citibank N.A.* | | | 11/05/24 | | | USD | | | 516,138 | | | CLP | | | 468,085,585 | | | (4,228) |
Citibank N.A.* | | | 11/19/24 | | | USD | | | 1,047,592 | | | PHP | | | 59,796,548 | | | (17,356) |
Citibank N.A.* | | | 3/07/25 | | | NGN | | | 386,912,000 | | | USD | | | 226,000 | | | (5,755) |
Citibank N.A.* | | | 4/15/25 | | | EGP | | | 40,250,219 | | | USD | | | 750,000 | | | 17,291 |
Goldman Sachs International* | | | 10/15/24 | | | RON | | | 4,470,475 | | | USD | | | 980,854 | | | 19,111 |
Goldman Sachs International* | | | 10/15/24 | | | USD | | | 2,919,221 | | | ZAR | | | 53,661,122 | | | (183,296) |
Goldman Sachs International* | | | 11/05/24 | | | USD | | | 1,785,947 | | | MXN | | | 34,438,934 | | | 45,769 |
Goldman Sachs International* | | | 11/12/24 | | | PLN | | | 12,428,628 | | | USD | | | 3,139,335 | | | 86,704 |
Goldman Sachs International* | | | 11/12/24 | | | USD | | | 2,676,631 | | | EUR | | | 2,439,054 | | | (42,965) |
Goldman Sachs International* | | | 11/19/24 | | | USD | | | 232,000 | | | THB | | | 7,469,240 | | | (861) |
Goldman Sachs International* | | | 4/23/25 | | | BRL | | | 1,895,250 | | | USD | | | 350,000 | | | (12,297) |
Goldman Sachs International* | | | 4/28/25 | | | TRY | | | 20,577,813 | | | USD | | | 437,500 | | | 51,324 |
Goldman Sachs International* | | | 5/09/25 | | | TRY | | | 59,508,825 | | | USD | | | 1,303,500 | | | 95,965 |
Goldman Sachs International* | | | 5/09/25 | | | USD | | | 977,000 | | | TRY | | | 41,527,385 | | | 403 |
HSBC Bank PLC* | | | 10/15/24 | | | USD | | | 2,045,098 | | | CHF | | | 1,808,455 | | | (94,854) |
HSBC Bank PLC* | | | 10/22/24 | | | USD | | | 954,374 | | | THB | | | 30,782,097 | | | $(3,552) |
| | | | | | | | | | | | | | | | | | | |
| | | | | |
| | | The accompanying notes are an integral part of the financial statements.
| |
40
| | | | |
| | | | | |
TABLE OF CONTENTS
| | MassMutual Emerging Markets Debt Blended Total Return Fund — Portfolio of Investments (Continued) | |
| | | | | | | | | | | | | |
HSBC Bank PLC* | | | 11/12/24 | | | HUF | | | 411,503,199 | | | USD | | | 1,124,736 | | | 26,443 |
HSBC Bank PLC* | | | 11/12/24 | | | USD | | | 1,085,448 | | | CHF | | | 914,670 | | | (269) |
HSBC Bank PLC* | | | 11/12/24 | | | USD | | | 2,327,918 | | | CZK | | | 53,739,976 | | | (46,657) |
HSBC Bank PLC* | | | 11/12/24 | | | USD | | | 1,257,000 | | | PLN | | | 4,816,070 | | | 6,916 |
HSBC Bank PLC* | | | 11/19/24 | | | THB | | | 53,448,528 | | | USD | | | 1,539,194 | | | 127,115 |
JP Morgan Chase Bank N.A.* | | | 10/08/24 | | | BRL | | | 18,099,409 | | | USD | | | 3,294,575 | | | 25,286 |
JP Morgan Chase Bank N.A.* | | | 10/08/24 | | | USD | | | 2,369,000 | | | BRL | | | 12,956,535 | | | (7,536) |
JP Morgan Chase Bank N.A.* | | | 11/12/24 | | | USD | | | 545,000 | | | HUF | | | 193,754,411 | | | 2,972 |
Morgan Stanley & Co. LLC* | | | 10/09/24 | | | PEN | | | 1,464,068 | | | USD | | | 386,716 | | | 8,194 |
Morgan Stanley & Co. LLC* | | | 10/15/24 | | | ZAR | | | 3,818,375 | | | USD | | | 214,000 | | | 6,766 |
Morgan Stanley & Co. LLC* | | | 10/15/24 | | | CHF | | | 1,808,455 | | | USD | | | 2,143,034 | | | (3,082) |
Morgan Stanley & Co. LLC* | | | 11/05/24 | | | BRL | | | 5,416,918 | | | USD | | | 949,987 | | | 40,590 |
Morgan Stanley & Co. LLC* | | | 11/12/24 | | | EUR | | | 262,119 | | | USD | | | 287,279 | | | 4,989 |
Morgan Stanley & Co. LLC* | | | 11/12/24 | | | USD | | | 433,870 | | | ZAR | | | 8,010,020 | | | (28,162) |
Morgan Stanley & Co. LLC* | | | 11/19/24 | | | USD | | | 2,746,414 | | | SGD | | | 3,619,444 | | | (76,517) |
| | | | | | | | | | | | | | | | | | $ 119,555 |
| | | | | | | | | | | | | | | | | | | |
OTC Credit Default Swaps-Sell Protection†
| | | | | | | | | | | | | | | | | | | | | | | | | | | | |
Republic of Indonesia | | | 1.000% | | | Quarterly | | | Bank of America N.A.* | | | BBB** | | | 12/20/29 | | | USD | | | 1,280,000 | | | $18,609 | | | $16,086 | | | $2,523 |
Republic of Indonesia | | | 1.000% | | | Quarterly | | | Bank of America N.A.* | | | BBB** | | | 12/20/29 | | | USD | | | 900,000 | | | 13,085 | | | 11,311 | | | 1,774 |
Republic of Philippines | | | 1.000% | | | Quarterly | | | Bank of America N.A.* | | | BBB** | | | 12/20/29 | | | USD | | | 600,000 | | | 11,818 | | | 10,610 | | | 1,208 |
Republic of Peru | | | 1.000% | | | Quarterly | | | Morgan Stanley & Co. LLC* | | | BBB** | | | 12/20/29 | | | USD | | | 1,300,000 | | | 14,402 | | | 11,007 | | | 3,395 |
United Mexican States | | | 1.000% | | | Quarterly | | | Morgan Stanley & Co. LLC* | | | BBB** | | | 12/20/29 | | | USD | | | 1,345,000 | | | (12,861) | | | (11,592) | | | (1,269) |
| | | $45,053 | | | $37,422 | | | $7,631 |
| | | | | | | | | | |
Centrally Cleared Interest Rate Swaps
| | | | | | | | | | | | | | | | | | | |
Fixed 11.225% | | | Maturity | | | BRL CETIP | | | Maturity | | | 1/03/33 | | | BRL | | | 1,126,210 | | | $18,837 | | | $ — | | | $18,837 |
Fixed 11.135% | | | Maturity | | | BRL CETIP | | | Maturity | | | 1/03/33 | | | BRL | | | 1,116,462 | | | 20,110 | | | — | | | 20,110 |
Fixed 11.200% | | | Maturity | | | BRL CETIP | | | Maturity | | | 1/03/33 | | | BRL | | | 1,128,797 | | | 19,286 | | | — | | | 19,286 |
Fixed 11.165% | | | Maturity | | | BRL CETIP | | | Maturity | | | 1/03/33 | | | BRL | | | 1,237,773 | | | 21,762 | | | — | | | 21,762 |
Fixed 11.175% | | | Maturity | | | BRL CETIP | | | Maturity | | | 1/03/33 | | | BRL | | | 1,130,913 | | | 19,726 | | | — | | | 19,726 |
Fixed 1.808% | | | Quarterly | | | 3-Month
CNY-CNREPOFIX=
CFXS-Reuters | | | Quarterly | | | 8/30/29 | | | CNY | | | 8,000,000 | | | (313) | | | — | | | (313) |
6-Month CZK PRIBOR | | | Semi-Annually | | | Fixed 3.660% | | | Annually | | | 4/08/29 | | | CZK | | | 8,033,000 | | | 8,100 | | | — | | | 8,100 |
| | | | | | | | | | | | | | | | | | | | | | | | | | | | |
| | | | | |
The accompanying notes are an integral part of the financial statements. | | | | |
| | | 41
| |
| | | | | |
TABLE OF CONTENTS
| | MassMutual Emerging Markets Debt Blended Total Return Fund — Portfolio of Investments (Continued) | |
| | | | | | | | | | | | | | | | | | | |
6-Month CZK PRIBOR | | | Semi-Annually | | | Fixed 3.690% | | | Annually | | | 4/08/29 | | | CZK | | | 16,065,000 | | | $17,093 | | | $— | | | $17,093 |
6-Month CZK PRIBOR | | | Semi-Annually | | | Fixed 3.740% | | | Annually | | | 4/09/29 | | | CZK | | | 14,668,000 | | | 16,963 | | | — | | | 16,963 |
6-Month CZK PRIBOR | | | Semi-Annually | | | Fixed 3.720% | | | Annually | | | 4/09/29 | | | CZK | | | 8,033,000 | | | 8,992 | | | — | | | 8,992 |
6-Month CZK PRIBOR | | | Semi-Annually | | | Fixed 3.850% | | | Annually | | | 4/12/29 | | | CZK | | | 10,000,000 | | | 13,621 | | | — | | | 13,621 |
6-Month HUF BUBOR | | | Semi-Annually | | | Fixed 8.760% | | | Annually | | | 10/27/25 | | | HUF | | | 917,000,000 | | | 71,858 | | | — | | | 71,858 |
Fixed 7.675% | | | Annually | | | 6-Month HUF
BUBOR | | | Semi-Annually | | | 10/27/33 | | | HUF | | | 111,000,000 | | | (42,380) | | | — | | | (42,380) |
| | | | | | | | | | | | | | | | | | | | | $193,655 | | | $ — | | | $193,655 |
| | | | | | | | | | | | | | | | | | | | | | | | | | | | |
OTC Currency Swaps
| | | | | | | | | | | | | | | | | | | |
Fixed 5.875% | | | EUR | | | 300,000 | | | Annually | | | Fixed 8.460% | | | USD | | | 330,000 | | | Semi-Annually | | | Citibank N.A.* | | | 10/17/31 | | | $ 18,531 | | | $ (270) | | | $ 18,801 |
| | | | | | | | | | | | | | | | | | | | | | | | | | | | | | | | | | | | | |
*
| Contracts are subject to a master netting agreement or similar agreement. |
**
| Ratings used in the weighted average are from Moody’s Investors Service, Inc., S&P Global Ratings, or Fitch Ratings, whichever is thehighest for each constituent. All ratings are as of the report date and do not reflect subsequent changes. |
†
| For each credit derivative with sold protection, the credit ratings of the entities referenced, as rated by any rating organization, are included in the equivalent S&P Global Ratings. The reference entity rating represents the creditworthiness of the underlying issuer. As the credit rating declines, the likelihood of payment by the fund increases. Notional amounts represent the maximum potential amount of future payments (undiscounted) the Fund could be required to make under the credit derivatives with sold protection. |
Currency Legend
BRL | | | Brazilian Real | |
CHF | | | Swiss Franc | |
CLP | | | Chilean Peso | |
CNH | | | Offshore Chinese Yuan | |
CNY | | | Chinese Yuan Renminbi | |
COP | | | Colombian Peso | |
CRC | | | Costa Rican Colon | |
CZK | | | Czech Koruna | |
EGP | | | Egyptian Pound | |
EUR | | | Euro | |
HUF | | | Hungarian Forint | |
KRW | | | South Korean Won | |
MXN | | | Mexican Peso | |
| | | | | |
NGN | | | Nigerian Naira | |
PEN | | | Peruvian New Sol | |
PHP | | | Philippine Peso | |
PLN | | | Polish Zloty | |
PYG | | | Paraguay Guarani | |
RON | | | New Romanian Leu | |
SGD | | | Singapore Dollar | |
THB | | | Thai Baht | |
TRY | | | New Turkish Lira | |
USD | | | U.S. Dollar | |
ZAR | | | South African Rand | |
| | | | | |
| | | | | |
| | | The accompanying notes are an integral part of the financial statements.
| |
42
| | | | |
| | | | | |
TABLE OF CONTENTS
Statements of Assets and Liabilities
September 30, 2024
| | | | | | | |
Assets:
| | | | | | |
Investments, at value (Note 2) (a) | | | $ 49,514,915 | | | $ 50,101,909 |
Repurchase agreements, at value (Note 2) (b) | | | — | | | — |
Total investments (c) | | | 49,514,915 | | | 50,101,909 |
Cash | | | 85,253 | | | 18,085 |
Foreign currency, at value (d) | | | — | | | — |
Receivables from:
| | | | | | |
Investments sold
| | | | | | |
Regular delivery | | | — | | | — |
Open forward contracts (Note 2) | | | — | | | — |
Fund shares sold | | | — | | | 200,000 |
Cash collateral pledged for open derivatives (Note 2) | | | — | | | — |
Investment adviser (Note 3) | | | 38,665 | | | 38,212 |
Variation margin on open derivative instruments (Note 2) | | | — | | | — |
Interest and dividends | | | 499,743 | | | 573,159 |
Foreign tax reclaims | | | — | | | — |
Open swap agreements, at value (Note 2) | | | — | | | — |
Prepaid expenses | | | 21,151 | | | 21,151 |
Due from broker | | | — | | | — |
Unrealized appreciation on:
| | | | | | |
Unfunded bank loan commitments | | | — | | | — |
Total assets | | | 50,159,727 | | | 50,952,516 |
Liabilities:
| | | | | | |
Payables for:
| | | | | | |
Investments purchased
| | | | | | |
Regular delivery | | | — | | | — |
Delayed delivery | | | — | | | — |
Written options outstanding, at value (Note 2) (e) | | | — | | | — |
Distributions (Note 2) | | | 122,802 | | | 132,647 |
Open forward contracts (Note 2) | | | — | | | — |
Interest and dividends | | | — | | | — |
Fund shares redeemed | | | — | | | — |
Cash Collateral held for securities on loan (Note 2) | | | — | | | — |
Open swap agreements, at value (Note 2) | | | — | | | — |
Trustees’ fees and expenses (Note 3) | | | 2 | | | 2 |
Variation margin on open derivative instruments (Note 2) | | | — | | | — |
Affiliates (Note 3):
| | | | | | |
Administration fees | | | 5,405 | | | 5,432 |
Investment advisory fees | | | 10,140 | | | 14,868 |
Distribution fees | | | 64 | | | 64 |
Due to custodian | | | — | | | — |
Accrued expense and other liabilities | | | 96,557 | | | 96,545 |
Unrealized depreciation on: | | | | | | |
Unfunded bank loan commitments | | | — | | | — |
Total liabilities | | | 234,970 | | | 249,558 |
Net assets | | | $49,924,757 | | | $50,702,958 |
Net assets consist of:
| | | | | | |
Paid-in capital | | | $49,999,938 | | | $50,775,409 |
Accumulated earnings (loss) | | | (75,181) | | | (72,451) |
Net assets | | | $49,924,757 | | | $50,702,958 |
(a) Cost of investments: | | | $49,267,473 | | | $49,943,704 |
(b) Cost of repurchase agreements: | | | $— | | | $— |
(c) Securities on loan with market value of: | | | $— | | | $— |
(d) Cost of foreign currency: | | | $— | | | $— |
(e) Premiums received on written options: | | | $— | | | $— |
| | | | | | | |
| | | | | |
The accompanying notes are an integral part of the financial statements. | | | | |
| | | 43
| |
| | | | | |
TABLE OF CONTENTS
| | | | | | | | | | |
|
$ 49,710,606 | | | $ 118,696,021 | | | $ 138,068,575 | | | $ 26,752,549 |
— | | | 6,330,491 | | | 16,887,395 | | | 904,902 |
49,710,606 | | | 125,026,512 | | | 154,955,970 | | | 27,657,451 |
3,543 | | | 361,193 | | | — | | | 24,275 |
— | | | 1,633,282 | | | 746,998 | | | 102,346 |
|
|
— | | | 3,413,203 | | | 1,011,149 | | | 8,978 |
— | | | — | | | — | | | 729,143 |
— | | | 1,725,228 | | | 7,353 | | | 3,190 |
— | | | 210,000 | | | 316,000 | | | 352,719 |
37,722 | | | 45,697 | | | 54,329 | | | 27,720 |
— | | | — | | | — | | | 11,075 |
585,639 | | | 1,586,059 | | | 1,931,250 | | | 477,412 |
— | | | — | | | 90,911 | | | 26,984 |
— | | | — | | | — | | | 76,445 |
21,151 | | | 16,682 | | | 13,430 | | | 12,486 |
— | | | 250,000 | | | — | | | — |
|
— | | | 4,462 | | | — | | | — |
50,358,661 | | | 134,272,318 | | | 159,127,390 | | | 29,510,224 |
|
|
|
— | | | 5,978,678 | | | 6,412,977 | | | — |
— | | | — | | | 812,000 | | | 200,000 |
— | | | — | | | — | | | 89,594 |
152,201 | | | 25,147 | | | 180,344 | | | 106,714 |
— | | | 43,978 | | | 76,826 | | | 609,588 |
— | | | — | | | — | | | 18,309 |
— | | | 383,663 | | | 61,117 | | | 13,032 |
— | | | — | | | 2,683,060 | | | 499,350 |
— | | | — | | | — | | | 12,861 |
2 | | | 38 | | | 2 | | | 6 |
— | | | — | | | 59,851 | | | — |
|
5,425 | | | 34,173 | | | 39,713 | | | 21,752 |
20,309 | | | 68,576 | | | 91,480 | | | 18,304 |
118 | | | 22,996 | | | 63,109 | | | 1,261 |
— | | | — | | | 100,573 | | | — |
96,480 | | | 234,682 | | | 220,845 | | | 123,999 |
|
— | | | — | | | 79 | | | — |
274,535 | | | 6,791,931 | | | 10,801,976 | | | 1,714,770 |
$50,084,126 | | | $127,480,387 | | | $148,325,414 | | | $27,795,454 |
|
$50,199,247 | | | $167,522,296 | | | $187,724,901 | | | $65,632,659 |
(115,121) | | | (40,041,909) | | | (39,399,487) | | | (37,837,205) |
$50,084,126 | | | $127,480,387 | | | $148,325,414 | | | $27,795,454 |
|
$49,199,401 | | | $123,245,674 | | | $140,395,489 | | | $28,935,326 |
$— | | | $6,330,491 | | | $16,887,395 | | | $904,902 |
$— | | | $— | | | $2,627,901 | | | $488,920 |
$— | | | $1,631,962 | | | $748,288 | | | $102,361 |
$— | | | $— | | | $— | | | $81,617 |
| | | | | | | | | | |
| | | | | |
| | | The accompanying notes are an integral part of the financial statements.
| |
44
| | | | |
| | | | | |
TABLE OF CONTENTS
| | | |
| | MassMutual Funds (Continued) | |
| | | |
Statements of Assets and Liabilities
September 30, 2024
| | | | | | | |
Class I shares:
| | | | | | |
Net assets | | | $ 49,725,057 | | | $ 49,726,525 |
Shares outstanding (a) | | | 4,980,000 | | | 4,980,000 |
Net asset value, offering price and redemption price per share | | | $9.98 | | | $9.99 |
Class Y shares:
| | | | | | |
Net assets | | | $99,850 | | | $876,581 |
Shares outstanding (a) | | | 10,000 | | | 87,773 |
Net asset value, offering price and redemption price per share | | | $9.98 | | | $9.99 |
Class A shares:
| | | | | | |
Net assets | | | $99,850 | | | $99,852 |
Shares outstanding (a) | | | 10,000 | | | 10,000 |
Net asset value and redemption price per share | | | $9.98 | | | $9.99 |
Maximum offering price per share (100/[100-maximum sales charge] of net asset value) | | | $10.24 | | | $10.25 |
Class C shares:
| | | | | | |
Net assets | | | | | | |
Shares outstanding (a) | | | | | | |
Net asset value, offering price and redemption price per share | | | | | | |
| | | | | | | |
(a)
| Authorized unlimited number of shares with no par value. |
*
| Class L shares were renamed to Class A shares on February 1, 2024. |
| | | | | |
The accompanying notes are an integral part of the financial statements. | | | | |
| | | 45
| |
| | | | | |
TABLE OF CONTENTS
| | | | | | | | | | |
|
$ 49,682,451 | | | $ 23,566,654 | | | $ 3,244,858 | | | $ 1,356,664 |
4,980,000 | | | 2,684,798 | | | 416,514 | | | 172,467 |
$9.98 | | | $8.78 | | | $7.79 | | | $7.87 |
|
$201,993 | | | $79,948,278 | | | $53,252,550 | | | $25,251,882 |
20,242 | | | 9,108,573 | | | 6,832,689 | | | 3,219,502 |
$9.98 | | | $8.78 | | | $7.79 | | | $7.84 |
|
$199,682 | | | $20,286,059 | | | $89,119,998 | | | $1,049,332 |
20,016 | | | 2,314,685 | | | 11,437,325 | | | 133,531 |
$9.98 | | | $8.76 | | | $7.79 | | | $7.86 |
$10.24 | | | $9.15 | | | $8.14 | | | $8.21 |
|
| | | $3,679,396 | | | $2,708,008 | | | $137,576 |
| | | 421,147 | | | 347,670 | | | 17,537 |
| | | $8.74 | | | $7.79 | | | $7.84 |
| | | | | | | | | | |
| | | | | |
| | | The accompanying notes are an integral part of the financial statements.
| |
46
| | | | |
| | | | | |
TABLE OF CONTENTS
| | | |
| | MassMutual Funds (Continued) | |
| | | |
Statements of Operations
For the Year Ended September 30, 2024
| | | | | | | |
Investment income (Note 2):
| | | | | | |
Interest (a) | | | $ 988,875 | | | $ 1,099,605 |
Securities lending net income | | | — | | | — |
Total investment income | | | 988,875 | | | 1,099,605 |
Expenses (Note 3):
| | | | | | |
Investment advisory fees | | | 78,835 | | | 114,904 |
Custody fees | | | 35,850 | | | 35,850 |
Interest expense (Note 7) | | | — | | | — |
Trustee reporting | | | 4,250 | | | 4,250 |
Audit and tax fees | | | 50,500 | | | 50,500 |
Commitment & Service Expenses | | | — | | | — |
Legal fees | | | 49,701 | | | 49,633 |
Proxy fees | | | 2,217 | | | 2,217 |
Accounting & Administration fees | | | 6,999 | | | 6,999 |
Shareholder reporting fees | | | 15,513 | | | 15,510 |
Trustees’ fees | | | 2,047 | | | 2,045 |
Registration and filing fees | | | 44,122 | | | 44,121 |
Transfer agent fees | | | 19,446 | | | 19,446 |
| | | 309,480 | | | 345,475 |
Administration fees:
| | | | | | |
Class Y | | | 66 | | | 92 |
Class A | | | 66 | | | 66 |
Class C | | | — | | | — |
Distribution and Service fees:
| | | | | | |
Class A | | | 164 | | | 164 |
Class C | | | — | | | — |
Total expenses | | | 309,776 | | | 345,797 |
Expenses waived (Note 3):
| | | | | | |
Class I fees reimbursed by adviser | | | (213,364) | | | (209,860) |
Class Y fees reimbursed by adviser | | | (429) | | | (591) |
Class A fees reimbursed by adviser | | | (429) | | | (422) |
Class C fees reimbursed by adviser | | | — | | | — |
Net expenses: | | | 95,554 | | | 134,924 |
Net investment income (loss) | | | 893,321 | | | 964,681 |
Realized and unrealized gain (loss):
| | | | | | |
Net realized gain (loss) on:
| | | | | | |
Investment transactions | | | (320,142) | | | (221,016) |
Futures contracts | | | — | | | — |
Written options | | | — | | | — |
Swap agreements | | | — | | | — |
Foreign currency transactions | | | — | | | — |
Forward contracts | | | — | | | — |
Net realized gain (loss) | | | (320,142) | | | (221,016) |
Net change in unrealized appreciation (depreciation) on:
| | | | | | |
Investment transactions | | | 247,442 | | | 158,205 |
Futures contracts | | | — | | | — |
Unfunded bank loan commitments | | | — | | | — |
Written options | | | — | | | — |
Swap agreements | | | — | | | — |
Translation of assets and liabilities in foreign currencies | | | — | | | — |
Forward contracts | | | — | | | — |
Net change in unrealized appreciation (depreciation) | | | 247,442 | | | 158,205 |
Net realized gain (loss) and change in unrealized appreciation (depreciation) | | | (72,700) | | | (62,811) |
Net increase (decrease) in net assets resulting from operations | | | $820,621 | | | $901,870 |
(a) Net of foreign withholding tax of: | | | $— | | | $— |
| | | | | | | |
+
| Commenced operations on February 1, 2024. |
*
| Class L shares were renamed to Class A shares on February 1, 2024. |
| | | | | |
The accompanying notes are an integral part of the financial statements. | | | | |
| | | 47
| |
| | | | | |
TABLE OF CONTENTS
| | | | | | | | | | |
|
$ 1,260,125 | | | $ 13,360,075 | | | $ 12,887,965 | | | $ 3,151,487 |
— | | | 934 | | | 11,928 | | | 1,446 |
1,260,125 | | | 13,361,009 | | | 12,899,893 | | | 3,152,933 |
|
157,261 | | | 891,432 | | | 972,880 | | | 321,969 |
35,850 | | | 73,161 | | | 73,410 | | | 57,347 |
— | | | 25,772 | | | — | | | — |
4,250 | | | 17,656 | | | 12,679 | | | 2,434 |
50,500 | | | 104,920 | | | 103,501 | | | 77,876 |
— | | | 183,471 | | | 196,940 | | | — |
49,525 | | | 10,959 | | | 5,324 | | | 1,649 |
2,217 | | | 1,579 | | | 1,579 | | | 1,579 |
6,999 | | | 39,222 | | | 51,741 | | | 27,521 |
15,029 | | | 68,333 | | | 47,179 | | | 25,710 |
2,040 | | | 13,471 | | | 11,557 | | | 3,999 |
44,121 | | | 65,157 | | | 63,595 | | | 61,041 |
19,448 | | | 31,448 | | | 29,920 | | | 30,105 |
387,240 | | | 1,526,581 | | | 1,570,305 | | | 611,230 |
|
94 | | | 61,294 | | | 20,243 | | | 23,434 |
91 | | | 7,923 | | | 49,949 | | | 392 |
— | | | 1,247 | | | 854 | | | — |
|
228 | | | 49,521 | | | 208,123 | | | 4,900 |
— | | | 41,556 | | | 28,471 | | | 2,041 |
387,653 | | | 1,688,122 | | | 1,877,945 | | | 641,997 |
|
(209,128) | | | (92,054) | | | (11,304) | | | (8,224) |
(606) | | | (380,126) | | | (145,689) | | | (208,861) |
(586) | | | (79,967) | | | (300,477) | | | (9,567) |
— | | | (16,322) | | | (8,245) | | | (954) |
177,333 | | | 1,119,653 | | | 1,412,230 | | | 414,391 |
1,082,792 | | | 12,241,356 | | | 11,487,663 | | | 2,738,542 |
|
|
(624,706) | | | (8,731,854) | | | (7,859,777) | | | (1,773,115) |
— | | | — | | | — | | | 54,734 |
— | | | — | | | — | | | 209,388 |
— | | | — | | | — | | | (22,242) |
— | | | 142,120 | | | 252,209 | | | (10,904) |
— | | | (870,991) | | | (1,231,909) | | | (1,546,278) |
(624,706) | | | (9,460,725) | | | (8,839,477) | | | (3,088,417) |
|
511,205 | | | 9,919,281 | | | 12,852,939 | | | 6,077,117 |
— | | | — | | | (25,783) | | | (186,918) |
— | | | 6,584 | | | (45,905) | | | — |
— | | | — | | | — | | | (87,734) |
— | | | — | | | — | | | 263,741 |
— | | | 48,829 | | | 1,632 | | | 49 |
— | | | (827,384) | | | (665,195) | | | 297,022 |
511,205 | | | 9,147,310 | | | 12,117,688 | | | 6,363,277 |
(113,501) | | | (313,415) | | | 3,278,211 | | | 3,274,860 |
$969,291 | | | $11,927,941 | | | $14,765,874 | | | $6,013,402 |
$— | | | $— | | | $4,389 | | | $6,535 |
| | | | | | | | | | |
| | | | | |
| | | The accompanying notes are an integral part of the financial statements.
| |
48
| | | | |
| | | | | |
TABLE OF CONTENTS
| | | |
| | MassMutual Funds (Continued) | |
| | | |
Statements of Changes in Net Assets
| | | | |
Increase (Decrease) in Net Assets:
| | | |
Operations:
| | | |
Net investment income (loss) | | | $893,321 |
Net realized gain (loss) | | | (320,142) |
Net change in unrealized appreciation (depreciation) | | | 247,442 |
Net increase (decrease) in net assets resulting from operations | | | 820,621 |
Distributions to shareholders (Note 2):
| | | |
Class I | | | (892,575) |
Class Y | | | (1,727) |
Class A | | | (1,562) |
Total distributions | | | (895,864) |
Net fund share transactions (Note 5):
| | | |
Class I | | | 49,800,000 |
Class Y | | | 100,000 |
Class A | | | 100,000 |
Increase (decrease) in net assets from fund share transactions | | | 50,000,000 |
Total increase (decrease) in net assets | | | 49,924,757 |
Net assets
| | | |
End of year | | | $ 49,924,757 |
| | | | |
+
| Commenced operations on February 1, 2024. |
| | | | | |
The accompanying notes are an integral part of the financial statements. | | | | |
| | | 49
| |
| | | | | |
TABLE OF CONTENTS
| | | | |
|
|
$964,681 | | | $1,082,792 |
(221,016) | | | (624,706) |
158,205 | | | 511,205 |
901,870 | | | 969,291 |
|
(969,984) | | | (1,078,623) |
(2,681) | | | (3,089) |
(1,718) | | | (2,761) |
(974,383) | | | (1,084,473) |
|
49,800,000 | | | 49,800,000 |
875,471 | | | 200,986 |
100,000 | | | 198,322 |
50,775,471 | | | 50,199,308 |
50,702,958 | | | 50,084,126 |
|
$ 50,702,958 | | | $ 50,084,126 |
| | | | |
| | | | | |
| | | The accompanying notes are an integral part of the financial statements.
| |
50
| | | | |
| | | | | |
TABLE OF CONTENTS
| | | |
| | MassMutual Funds (Continued) | |
| | | |
Statements of Changes in Net Assets
| | | | |
Increase (Decrease) in Net Assets:
| | | | | | |
Operations:
| | | | | | |
Net investment income (loss) | | | $12,241,356 | | | $19,239,228 |
Net realized gain (loss) | | | (9,460,725) | | | (28,503,195) |
Net change in unrealized appreciation (depreciation) | | | 9,147,310 | | | 39,144,587 |
Net increase (decrease) in net assets resulting from operations | | | 11,927,941 | | | 29,880,620 |
Distributions to shareholders (Note 2):
| | | | | | |
Class I | | | (1,622,913) | | | (5,090,797) |
Class Y | | | (5,327,917) | | | (11,457,208) |
Class A | | | (1,166,988) | | | (2,222,854) |
Class C | | | (224,169) | | | (361,573) |
Total distributions | | | (8,341,987) | | | (19,132,432) |
Tax return of capital:
| | | | | | |
Class I | | | (811,350) | | | (178,421) |
Class Y | | | (2,663,611) | | | (401,549) |
Class A | | | (583,417) | | | (77,906) |
Class C | | | (112,070) | | | (12,672) |
Total tax return of capital | | | (4,170,448) | | | (670,548) |
Net fund share transactions (Note 5):
| | | | | | |
Class I | | | (31,206,213) | | | (16,929,786) |
Class Y | | | (29,998,314) | | | (90,220,996) |
Class A | | | 31,634 | | | (27,695,008) |
Class C | | | (636,260) | | | (1,686,240) |
Increase (decrease) in net assets from fund share transactions | | | (61,809,153) | | | (136,532,030) |
Total increase (decrease) in net assets | | | (62,393,647) | | | (126,454,390) |
Net assets
| | | | | | |
Beginning of year | | | 189,874,034 | | | 316,328,424 |
End of year | | | $ 127,480,387 | | | $ 189,874,034 |
| | | | | | | |
*
| Class L shares were renamed to Class A shares on February 1, 2024. |
| | | | | |
The accompanying notes are an integral part of the financial statements. | | | | |
| | | 51
| |
| | | | | |
TABLE OF CONTENTS
| | | | |
|
|
$11,487,663 | | | $10,493,787 | | | $2,738,542 | | | $3,332,986 |
(8,839,477) | | | (13,557,068) | | | (3,088,417) | | | (15,708,898) |
12,117,688 | | | 17,770,011 | | | 6,363,277 | | | 19,420,931 |
14,765,874 | | | 14,706,730 | | | 6,013,402 | | | 7,045,019 |
|
(265,735.00) | | | (404,830) | | | (101,735) | | | — |
(3,404,770) | | | (4,417,151) | | | (2,328,710) | | | — |
(6,823,922) | | | (5,273,992) | | | (111,376) | | | — |
(212,417) | | | (246,158) | | | (10,050) | | | — |
(10,706,844) | | | (10,342,131) | | | (2,551,871) | | | — |
|
(18,254) | | | (4,252) | | | — | | | (115,347) |
(233,882) | | | (46,391) | | | — | | | (2,953,589) |
(468,753) | | | (55,390) | | | — | | | (155,975) |
(14,592) | | | (2,585) | | | — | | | (23,170) |
(735,481) | | | (108,618) | | | — | | | (3,248,081) |
|
83,989 | | | (2,607,266) | | | (581,815) | | | — |
5,015,941 | | | (17,568,890) | | | (18,833,290) | | | (14,835,978) |
11,131,205 | | | 15,228,855 | | | (1,305,752) | | | (1,231,324) |
(294,670) | | | (1,180,733) | | | (176,817) | | | (214,452) |
15,936,465 | | | (6,128,034) | | | (20,897,674) | | | (16,281,754) |
19,260,014 | | | (1,872,053) | | | (17,436,143) | | | (12,484,816) |
|
129,065,400 | | | 130,937,453 | | | 45,231,597 | | | 57,716,413 |
$ 148,325,414 | | | $ 129,065,400 | | | $ 27,795,454 | | | $ 45,231,597 |
| | | | | | | | | | |
| | | | | |
| | | The accompanying notes are an integral part of the financial statements.
| |
52
| | | | |
| | | | | |
TABLE OF CONTENTS
| | | |
| | MassMutual Funds (Continued) | |
| | | |
Financial Highlights (For a share outstanding throughout each period)
MassMutual Clinton Limited Term Municipal Fund
| | | | | | | | | | | | | | | | | | | | | | | |
Class I |
9/30/24g | | | $10.00 | | | $0.18 | | | $(0.02) | | | $0.16 | | | $(0.18) | | | $(0.18) | | | $9.98 | | | 1.62%b | | | $49,725 | | | 0.94%a | | | 0.29%a | | | 2.72%a | |
Class Y |
9/30/24g | | | $10.00 | | | $0.17 | | | $(0.02) | | | $0.15 | | | $(0.17) | | | $(0.17) | | | $9.98 | | | 1.56%b | | | $100 | | | 1.04%a | | | 0.39%a | | | 2.62%a | |
Class A |
9/30/24g | | | $10.00 | | | $0.16 | | | $(0.02) | | | $0.14 | | | $(0.16) | | | $(0.16) | | | $9.98 | | | 1.39%b | | | $100 | | | 1.29%a | | | 0.64%a | | | 2.37%a | |
| | | | | | | | | | | | | | | | | | | | | | | | | | | | | | | | | | | | | | |
| | | | |
Portfolio turnover rate | | | 70% |
| | | | |
b
| Percentage represents the results for the period and is not annualized. |
c
| Per share amount calculated on the average shares method. |
g
| Fund commenced operations on February 1, 2024. |
j
| Computed after giving effect to an agreement by MML Advisers to waive certain fees and expenses of the Fund. |
m
| Total return excludes sales charges, if any, and would be lower for the period presented if it reflected these charges. |
q
| Excludes fees and expenses incurred indirectly as a result of investments in underlying funds, as applicable. |
z
| The net asset values and total returns have been calculated on net assets which include adjustments made in accordance with U.S. generally accepted accounting principles required at period end for financial reporting purposes. |
| | | | | |
The accompanying notes are an integral part of the financial statements. | | | | |
| | | 53
| |
| | | | | |
TABLE OF CONTENTS
| | | |
| | MassMutual Funds (Continued) | |
| | | |
Financial Highlights (For a share outstanding throughout each period)
MassMutual Clinton Municipal Fund
| | | | | | | | | | | | | | | | | | | | | | | |
Class I |
9/30/24g | | | $10.00 | | | $0.19 | | | $(0.01) | | | $0.18 | | | $(0.19) | | | $(0.19) | | | $9.99 | | | 1.89%b | | | $49,727 | | | 1.05%a | | | 0.41%a | | | 2.94%a | |
Class Y |
9/30/24g | | | $10.00 | | | $0.19 | | | $(0.01) | | | $0.18 | | | $(0.19) | | | $(0.19) | | | $9.99 | | | 1.82%b | | | $877 | | | 1.15%a | | | 0.51%a | | | 2.95%a | |
Class A |
9/30/24g | | | $10.00 | | | $0.17 | | | $(0.01) | | | $0.16 | | | $(0.17) | | | $(0.17) | | | $9.99 | | | 1.65%b | | | $100 | | | 1.40%a | | | 0.76%a | | | 2.59%a | |
| | | | | | | | | | | | | | | | | | | | | | | | | | | | | | | | | | | | | | |
| | | | |
Portfolio turnover rate | | | 76% |
| | | | |
b
| Percentage represents the results for the period and is not annualized. |
c
| Per share amount calculated on the average shares method. |
g
| Fund commenced operations on February 1, 2024. |
j
| Computed after giving effect to an agreement by MML Advisers to waive certain fees and expenses of the Fund. |
m
| Total return excludes sales charges, if any, and would be lower for the period presented if it reflected these charges. |
q
| Excludes fees and expenses incurred indirectly as a result of investments in underlying funds, as applicable. |
z
| The net asset values and total returns have been calculated on net assets which include adjustments made in accordance with U.S. generally accepted accounting principles required at period end for financial reporting purposes. |
| | | | | |
| | | The accompanying notes are an integral part of the financial statements.
| |
54
| | | | |
| | | | | |
TABLE OF CONTENTS
| | | |
| | MassMutual Funds (Continued) | |
| | | |
Financial Highlights (For a share outstanding throughout each period)
MassMutual Clinton Municipal Credit Opportunities Fund
| | | | | | | | | | | | | | | | | | | | | | | |
Class I |
9/30/24g | | | $10.00 | | | $0.22 | | | $(0.02) | | | $0.20 | | | $(0.22) | | | $(0.22) | | | $9.98 | | | 2.02%b | | | $49,682 | | | 1.18%a | | | 0.54%a | | | 3.31%a | |
Class Y |
9/30/24g | | | $10.00 | | | $0.22 | | | $(0.03) | | | $0.19 | | | $(0.21) | | | $(0.21) | | | $9.98 | | | 1.95%b | | | $202 | | | 1.28%a | | | 0.64%a | | | 3.30%a | |
Class A |
9/30/24g | | | $10.00 | | | $0.20 | | | $(0.03) | | | $0.17 | | | $(0.19) | | | $(0.19) | | | $9.98 | | | 1.78%b | | | $200 | | | 1.53%a | | | 0.89%a | | | 3.03%a | |
| | | | | | | | | | | | | | | | | | | | | | | | | | | | | | | | | | | | | | |
| | | | |
Portfolio turnover rate | | | 121% |
| | | | |
b
| Percentage represents the results for the period and is not annualized. |
c
| Per share amount calculated on the average shares method. |
g
| Fund commenced operations on February 1, 2024. |
j
| Computed after giving effect to an agreement by MML Advisers to waive certain fees and expenses of the Fund. |
m
| Total return excludes sales charges, if any, and would be lower for the period presented if it reflected these charges. |
q
| Excludes fees and expenses incurred indirectly as a result of investments in underlying funds, as applicable. |
z
| The net asset values and total returns have been calculated on net assets which include adjustments made in accordance with U.S. generally accepted accounting principles required at period end for financial reporting purposes. |
| | | | | |
The accompanying notes are an integral part of the financial statements. | | | | |
| | | 55
| |
| | | | | |
TABLE OF CONTENTS
| | | |
| | MassMutual Funds (Continued) | |
| | | |
Financial Highlights (For a share outstanding throughout each period)
MassMutual Global Floating Rate Fund
| | | | | | | | | | | | | | | | | | | |
Class I* | | | | | | | | | | | | | | | | | | | | | | | | | | | | | | | | | | | | | | | | | | | | | |
9/30/24 | | | $8.82 | | | $0.81 | | | $(0.05) | | | $0.76 | | | $(0.53) | | | $— | | | $(0.27) | | | $(0.80) | | | $8.78 | | | 9.00% | | | $23,567 | | | 1.11% | | | 0.75% | | | 0.74% | | | 9.18% |
9/30/23 | | | 8.45 | | | 0.73 | | | 0.40 | | | 1.13 | | | (0.73) | | | — | | | (0.03) | | | (0.76) | | | 8.82 | | | 13.86% | | | 54,920 | | | 0.92% | | | 0.75% | | | 0.73% | | | 8.46% |
9/30/22 | | | 9.43 | | | 0.39 | | | (0.98) | | | (0.59) | | | (0.39) | | | — | | | — | | | (0.39) | | | 8.45 | | | (6.44%) | | | 69,071 | | | 0.88% | | | 0.77% | | | 0.77% | | | 4.26% |
9/30/21 | | | 9.43 | | | 0.08 | | | — | | | 0.08 | | | (0.08) | | | — | | | — | | | (0.08) | | | 9.43 | | | 0.90%b | | | 72,615 | | | 0.90%a | | | N/A | | | 0.75%a | | | 3.39%a |
6/30/21 | | | 8.58 | | | 0.38 | | | 0.83 | | | 1.21 | | | (0.36) | | | — | | | — | | | (0.36) | | | 9.43 | | | 14.19% | | | 64,969 | | | 0.92% | | | N/A | | | 0.75% | | | 4.15% |
6/30/20 | | | 9.28 | | | 0.43 | | | (0.66) | | | (0.23) | | | (0.36) | | | (0.03) | | | (0.08) | | | (0.47) | | | 8.58 | | | (2.47%) | | | 39,483 | | | 0.92% | | | N/A | | | 0.75% | | | 4.87% |
Class Y* | | | | | | | | | | | | | | | | | | | | | | | | | | | | | | | | | | | | | | | | | | | |
9/30/24 | | | $8.81 | | | $0.79 | | | $(0.02) | | | $0.77 | | | $(0.53) | | | $— | | | $(0.27) | | | $(0.80) | | | $8.78 | | | 9.10% | | | $79,948 | | | 1.18% | | | 0.75% | | | 0.73% | | | 8.95% |
9/30/23 | | | 8.44 | | | 0.72 | | | 0.40 | | | 1.12 | | | (0.72) | | | — | | | (0.03) | | | (0.75) | | | 8.81 | | | 13.86% | | | 110,308 | | | 0.98% | | | 0.75% | | | 0.73% | | | 8.37% |
9/30/22 | | | 9.42 | | | 0.38 | | | (0.97) | | | (0.59) | | | (0.39) | | | — | | | — | | | (0.39) | | | 8.44 | | | (6.45%) | | | 194,665 | | | 0.94% | | | 0.77% | | | 0.77% | | | 4.12% |
9/30/21 | | | 9.42 | | | 0.08 | | | — | | | 0.08 | | | (0.08) | | | — | | | — | | | (0.08) | | | 9.42 | | | 0.89%b | | | 293,545 | | | 0.93%a | | | N/A | | | 0.75%a | | | 3.39%a |
6/30/21 | | | 8.58 | | | 0.37 | | | 0.83 | | | 1.20 | | | (0.36) | | | — | | | — | | | (0.36) | | | 9.42 | | | 14.19% | | | 256,020 | | | 0.95% | | | N/A | | | 0.75% | | | 4.08% |
6/30/20 | | | 9.27 | | | 0.44 | | | (0.66) | | | (0.22) | | | (0.36) | | | (0.03) | | | (0.08) | | | (0.47) | | | 8.58 | | | (2.54%) | | | 131,302 | | | 0.99% | | | N/A | | | 0.75% | | | 4.89% |
Class A* | | | | | | | | | | | | | | | | | | | | | | | | | | | | | | | | | | | | | | | | | | | | | |
9/30/24g | | | $8.79 | | | $0.76 | | | $(0.02) | | | $0.74 | | | $(0.51) | | | $— | | | $(0.26) | | | $(0.77) | | | $8.76 | | | 8.83% | | | $20,286 | | | 1.40% | | | 1.00% | | | 0.98% | | | 8.69% |
9/30/23 | | | 8.42 | | | 0.69 | | | 0.41 | | | 1.10 | | | (0.71) | | | — | | | (0.02) | | | (0.73) | | | 8.79 | | | 13.61% | | | 20,319 | | | 1.20% | | | 1.00% | | | 0.99% | | | 8.02% |
9/30/22 | | | 9.41 | | | 0.36 | | | (0.98) | | | (0.62) | | | (0.37) | | | — | | | — | | | (0.37) | | | 8.42 | | | (6.76%) | | | 46,797 | | | 1.17% | | | 1.02% | | | 1.02% | | | 3.99% |
9/30/21 | | | 9.40 | | | 0.07 | | | 0.01 | | | 0.08 | | | (0.07) | | | — | | | — | | | (0.07) | | | 9.41 | | | 0.83%b | | | 53,368 | | | 1.20%a | | | N/A | | | 1.00%a | | | 3.13%a |
6/30/21 | | | 8.56 | | | 0.36 | | | 0.81 | | | 1.17 | | | (0.33) | | | — | | | — | | | (0.33) | | | 9.40 | | | 13.90% | | | 45,630 | | | 1.25% | | | N/A | | | 1.00% | | | 3.93% |
6/30/20 | | | 9.26 | | | 0.41 | | | (0.66) | | | (0.25) | | | (0.34) | | | (0.03) | | | (0.08) | | | (0.45) | | | 8.56 | | | (2.79%) | | | 37,431 | | | 1.22% | | | N/A | | | 1.00% | | | 4.63% |
Class C* | | | | | | | | | | | | | | | | | | | | | | | | | | | | | | | | | | | | | | | | | | | |
9/30/24 | | | $8.76 | | | $0.69 | | | $(0.00) d | | | $0.69 | | | $(0.47) | | | $— | | | $(0.24) | | | $(0.71) | | | $8.74 | | | 8.14% | | | $3,679 | | | 2.14% | | | 1.75% | | | 1.73% | | | 7.92% |
9/30/23 | | | 8.40 | | | 0.64 | | | 0.39 | | | 1.03 | | | (0.65) | | | — | | | (0.02) | | | (0.67) | | | 8.76 | | | 12.64% | | | 4,327 | | | 1.95% | | | 1.75% | | | 1.73% | | | 7.45% |
9/30/22 | | | 9.37 | | | 0.29 | | | (0.96) | | | (0.67) | | | (0.30) | | | — | | | — | | | (0.30) | | | 8.40 | | | (7.35%) | | | 5,795 | | | 1.93% | | | 1.77% | | | 1.77% | | | 3.21% |
9/30/21 | | | 9.37 | | | 0.06 | | | (0.01) | | | 0.05 | | | (0.05) | | | — | | | — | | | (0.05) | | | 9.37 | | | 0.64%b | | | 6,766 | | | 1.99%a | | | N/A | | | 1.75%a | | | 2.39%a |
6/30/21 | | | 8.53 | | | 0.29 | | | 0.81 | | | 1.10 | | | (0.26) | | | — | | | — | | | (0.26) | | | 9.37 | | | 13.08% | | | 6,714 | | | 2.05% | | | N/A | | | 1.75% | | | 3.20% |
6/30/20 | | | 9.22 | | | 0.35 | | | (0.66) | | | (0.31) | | | (0.29) | | | (0.03) | | | (0.06) | | | (0.38) | | | 8.53 | | | (3.52%) | | | 6,494 | | | 2.04% | | | N/A | | | 1.75% | | | 3.88% |
| | | | | | | | | | | | | | | | | | | | | | | | | | | | | | | | | | | | | | | | | | | | | | |
| | | | | | | | | | |
Portfolio turnover rate
| | | 61% | | | 20% | | | 40% | | | 9% | | | 43% | | | 37% |
| | | | | | | | | | | | | | | | | | | |
*
| On December 13, 2021, the Barings Global Floating Rate Fund (the “Predecessor Fund”) was reorganized into the MassMutual Global Floating Rate Fund (the “Fund”) and shareholders of the Predecessor Fund received a proportional distribution of the same class of shares, or Class L shares in the case of Class A shares, of the Fund. Information shown prior to December 13, 2021 is that of the Predecessor Fund, and is that of the Fund after December 13, 2021. The Predecessor Fund changed its fiscal year end to September 30th prior to the reorganization. |
b
| Percentage represents the results for the period and is not annualized. |
c
| Per share amount calculated on the average shares method. |
d
| Amount is less than $0.005 per share. |
g
| Class L shares were renamed Class A shares on February 1, 2024. |
j
| Computed after giving effect to agreements by MML Advisers and Barings LLC to waive certain fees and expenses of the Fund and the Predecessor Fund (Note 1), respectively. |
m
| Total return excludes sales charges, if any, and would be lower for the period presented if it reflected these charges. |
p
| Interest expense incurred as a result of entering into line of credit transactions is included in the Fund’s net expenses in the Statements of Operations. |
q
| Excludes fees and expenses incurred indirectly as a result of investments in underlying funds, as applicable. |
z
| The net asset values and total returns have been calculated on net assets which include adjustments made in accordance with U.S. generally accepted accounting principles required at period end for financial reporting purposes. |
| | | | | |
| | | The accompanying notes are an integral part of the financial statements.
| |
56
| | | | |
| | | | | |
TABLE OF CONTENTS
| | | |
| | MassMutual Funds (Continued) | |
| | | |
Financial Highlights (For a share outstanding throughout each period)
MassMutual Global Credit Income Opportunities Fund
| | | | | | | | | | | | | | | | | | | |
Class I* | | | | | | | | | | | | | | | | | | | | | | | | | | | | | | | | | | | | | | | | | | |
9/30/24 | | | $7.58 | | | $0.70 | | | $0.21 | | | $0.91 | | | $(0.66) | | | $(0.04) | | | $(0.70) | | | $7.79 | | | 12.45% | | | $3,245 | | | 1.21% | | | NA | | | 0.85% | | | 9.10% |
9/30/23 | | | 7.35 | | | 0.64 | | | 0.23 | | | 0.87 | | | (0.63) | | | (0.01) | | | (0.64) | | | 7.58 | | | 12.17% | | | 3,075 | | | 1.00% | | | NA | | | 0.85% | | | 8.48% |
9/30/22 | | | 9.04 | | | 0.51 | | | (1.66) | | | (1.15) | | | (0.54) | | | — | | | (0.54) | | | 7.35 | | | (13.23%) | | | 5,536 | | | 1.14% | | | 0.89% | | | 0.89% | | | 6.10% |
9/30/21 | | | 9.08 | | | 0.11 | | | (0.04) | | | 0.07 | | | (0.11) | | | — | | | (0.11) | | | 9.04 | | | 0.81%b | | | 6,405 | | | 1.15%a | | | NA | | | 0.95%a | | | 4.96%a |
6/30/21 | | | 8.14 | | | 0.48 | | | 0.92 | | | 1.40 | | | (0.46) | | | — | | | (0.46) | | | 9.08 | | | 17.51% | | | 21,492 | | | 1.08% | | | NA | | | 0.95% | | | 5.50% |
6/30/20 | | | 8.93 | | | 0.48 | | | (0.79) | | | (0.31) | | | (0.41) | | | (0.07) | | | (0.48) | | | 8.14 | | | (3.45%) | | | 21,606 | | | 1.07% | | | NA | | | 0.95% | | | 5.60% |
Class Y* | | | | | | | | | | | | | | | | | | | | | | | | | | | | | | | | | | | | | | | | | | |
9/30/24 | | | $7.58 | | | $0.70 | | | $0.20 | | | $0.90 | | | $(0.65) | | | $(0.04) | | | $(0.69) | | | $7.79 | | | 12.40% | | | $53,253 | | | 1.26% | | | NA | | | 0.90% | | | 9.03% |
9/30/23 | | | 7.35 | | | 0.63 | | | 0.23 | | | 0.86 | | | (0.62) | | �� | (0.01) | | | (0.63) | | | 7.58 | | | 12.11% | | | 47,254 | | | 1.04% | | | NA | | | 0.90% | | | 8.36% |
9/30/22 | | | 9.04 | | | 0.50 | | | (1.66) | | | (1.16) | | | (0.53) | | | — | | | (0.53) | | | 7.35 | | | (13.26%) | | | 62,827 | | | 1.17% | | | 0.93% | | | 0.93% | | | 6.01% |
9/30/21 | | | 9.08 | | | 0.11 | | | (0.04) | | | 0.07 | | | (0.11) | | | — | | | (0.11) | | | 9.04 | | | 0.80%b | | | 115,478 | | | 1.20%a | | | NA | | | 0.95%a | | | 5.01%a |
6/30/21 | | | 8.14 | | | 0.47 | | | 0.93 | | | 1.40 | | | (0.46) | | | — | | | (0.46) | | | 9.08 | | | 17.52% | | | 173,113 | | | 1.12% | | | NA | | | 0.95% | | | 5.35% |
6/30/20 | | | 8.93 | | | 0.48 | | | (0.79) | | | (0.31) | | | (0.41) | | | (0.07) | | | (0.48) | | | 8.14 | | | (3.44%) | | | 90,254 | | | 1.10% | | | NA | | | 0.95% | | | 5.60% |
Class A* | | | | | | | | | | | | | | | | | | | | | | | | | | | | | | | | | | | | | | | | | | |
9/30/24g | | | $7.58 | | | $0.68 | | | $0.20 | | | $0.88 | | | $(0.63) | | | $(0.04) | | | $(0.67) | | | $7.79 | | | 12.12% | | | $89,120 | | | 1.52% | | | NA | | | 1.16% | | | 8.79% |
9/30/23 | | | 7.35 | | | 0.62 | | | 0.22 | | | 0.84 | | | (0.60) | | | (0.01) | | | (0.61) | | | 7.58 | | | 11.82% | | | 75,808 | | | 1.30% | | | NA | | | 1.16% | | | 8.21% |
9/30/22 | | | 9.04 | | | 0.48 | | | (1.66) | | | (1.18) | | | (0.51) | | | — | | | (0.51) | | | 7.35 | | | (13.48%) | | | 58,591 | | | 1.42% | | | 1.19% | | | 1.19% | | | 5.81% |
9/30/21 | | | 9.08 | | | 0.10 | | | (0.03) | | | 0.07 | | | (0.11) | | | — | | | (0.11) | | | 9.04 | | | 0.79%b | | | 52,875 | | | 1.37%a | | | NA | | | 1.20%a | | | 4.56%a |
6/30/21 | | | 8.14 | | | 0.48 | | | 0.90 | | | 1.38 | | | (0.44) | | | — | | | (0.44) | | | 9.08 | | | 17.18% | | | 9,795 | | | 1.39% | | | NA | | | 1.20% | | | 5.65% |
6/30/20 | | | 8.93 | | | 0.46 | | | (0.79) | | | (0.33) | | | (0.40) | | | (0.06) | | | (0.46) | | | 8.14 | | | (3.69%) | | | 44,860 | | | 1.32% | | | NA | | | 1.20% | | | 5.35% |
Class C* | | | | | | | | | | | | | | | | | | | | | | | | | | | | | | | | | | | | | | | | | | |
9/30/24 | | | $7.58 | | | $0.62 | | | $0.21 | | | $0.83 | | | $(0.58) | | | $(0.04) | | | $(0.62) | | | $7.79 | | | 11.27% | | | $2,708 | | | 2.24% | | | NA | | | 1.95% | | | 8.00% |
9/30/23 | | | 7.34 | | | 0.55 | | | 0.24 | | | 0.79 | | | (0.54) | | | (0.01) | | | (0.55) | | | 7.58 | | | 11.10% | | | 2,928 | | | 2.02% | | | NA | | | 1.95% | | | 7.32% |
9/30/22 | | | 9.04 | | | 0.42 | | | (1.67) | | | (1.25) | | | (0.45) | | | — | | | (0.45) | | | 7.34 | | | (14.25%) | | | 3,983 | | | 2.18% | | | 1.97% | | | 1.97% | | | 5.00% |
9/30/21 | | | 9.08 | | | 0.09 | | | (0.04) | | | 0.05 | | | (0.09) | | | — | | | (0.09) | | | 9.04 | | | 0.56%b | | | 5,914 | | | 2.24%a | | | NA | | | 1.95%a | | | 3.96%a |
6/30/21 | | | 8.13 | | | 0.39 | | | 0.93 | | | 1.32 | | | (0.37) | | | — | | | (0.37) | | | 9.08 | | | 16.42% | | | 5,846 | | | 2.19% | | | NA | | | 1.95% | | | 4.49% |
6/30/20 | | | 8.92 | | | 0.39 | | | (0.78) | | | (0.39) | | | (0.35) | | | (0.05) | | | (0.40) | | | 8.13 | | | (4.41%) | | | 7,421 | | | 2.18% | | | NA | | | 1.95% | | | 4.60% |
| | | | | | | | | | | | | | | | | | | | | | | | | | | | | | | | | | | | | | | | | | | |
| | | | | | | | | | |
Portfolio turnover rate
| | | 62% | | | 53% | | | 44% | | | 15% | | | 71% | | | 64% |
| | | | | | | | | | | | | | | | | | | |
*
| On December 13, 2021, the Barings Global Credit Income Opportunities Fund (the “Predecessor Fund”) was reorganized into the MassMutual Global Credit Income Opportunities Fund (the “Fund”) and shareholders of the Predecessor Fund received a proportional distribution of the same class of shares, or Class L shares in the case of Class A shares, of the Fund. Information shown prior to December 13, 2021 is that of the Predecessor Fund, and is that of the Fund after December 13, 2021. The Predecessor Fund changed its fiscal year end to September 30th prior to the reorganization. |
b
| Percentage represents the results for the period and is not annualized. |
c
| Per share amount calculated on the average shares method. |
g
| Class L shares were renamed Class A shares on February 1, 2024. |
j
| Computed after giving effect to agreements by MML Advisers and Barings LLC to waive certain fees and expenses of the Fund and the Predecessor Fund (Note 1), respectively. |
m
| Total return excludes sales charges, if any, and would be lower for the period presented if it reflected these charges. |
p
| Interest expense incurred as a result of entering into line of credit transactions is included in the Fund’s net expenses in the Statements of Operations. |
q
| Excludes fees and expenses incurred indirectly as a result of investments in underlying funds, as applicable. |
z
| The net asset values and total returns have been calculated on net assets which include adjustments made in accordance with U.S. generally accepted accounting principles required at period end for financial reporting purposes. |
| | | | | |
The accompanying notes are an integral part of the financial statements. | | | | |
| | | 57
| |
| | | | | |
TABLE OF CONTENTS
| | | |
| | MassMutual Funds (Continued) | |
| | | |
Financial Highlights (For a share outstanding throughout each period)
MassMutual Emerging Markets Debt Blended Total Return Fund
| | | | | | | | | | | | | | | | | | | | | | |
Class I* | | | | | | | | | | | | | | | | | | | | | | | | | | | | | | | | | | | | | | | | | | |
9/30/24 | | | $7.22 | | | $0.48 | | | $0.62 | | | $1.10 | | | $(0.45) | | | $— | | | $— | | | $(0.45) | | | $7.87 | | | 15.73% | | | $1,357 | | | 1.42% | | | 0.94% | | | 6.39% |
9/30/23 | | | 6.78 | | | 0.47 | | | 0.43 | | | 0.90 | | | — | | | — | | | (0.46) | | | (0.46) | | | 7.22 | | | 13.40% | | | 1,800 | | | 1.09% | | | 0.97% | | | 6.47% |
9/30/22 | | | 10.61 | | | 0.44 | | | (3.54) | | | (3.10) | | | (0.47) | | | (0.17) | | | (0.09) | | | (0.73) | | | 6.78 | | | (30.40%) | | | 1,691 | | | 1.67% | | | 1.00% | | | 5.90% |
9/30/21 | | | 11.00 | | | 0.11 | | | (0.37) | | | (0.26) | | | (0.13) | | | — | | | — | | | (0.13) | | | 10.61 | | | (2.44%)b | | | 1 | | | 706.64%a | | | 0.95%a | | | 3.98%a |
6/30/21 | | | 10.43 | | | 0.57 | | | 0.80 | | | 1.37 | | | (0.60) | | | (0.20) | | | — | | | (0.80) | | | 11.00 | | | 13.70% | | | 1 | | | 1.29% | | | 0.95% | | | 5.26% |
6/30/20 | | | 10.06 | | | 0.69 | | | 0.32 | | | 1.01 | | | (0.64) | | | — | | | — | | | (0.64) | | | 10.43 | | | 10.39% | | | 14,563 | | | 1.40% | | | 0.95% | | | 6.99% |
Class Y* | | | | | | | | | | | | | | | | | | | | | | | | | | | | | | | | | | | | | | | | | | |
9/30/24 | | | $7.19 | | | $0.48 | | | $0.62 | | | $1.10 | | | $(0.45) | | | $— | | | $— | | | $(0.45) | | | $7.84 | | | 15.75% | | | $25,252 | | | 1.48% | | | 0.95% | | | 6.40% |
9/30/23 | | | 6.75 | | | 0.47 | | | 0.43 | | | 0.90 | | | — | | | — | | | (0.46) | | | (0.46) | | | 7.19 | | | 13.42% | | | 40,950 | | | 1.15% | | | 0.97% | | | 6.50% |
9/30/22 | | | 10.59 | | | 0.48 | | | (3.59) | | | (3.11) | | | (0.47) | | | (0.17) | | | (0.09) | | | (0.73) | | | 6.75 | | | (30.59)% | | | 52,350 | | | 1.31% | | | 0.97% | | | 5.55% |
9/30/21 | | | 10.99 | | | 0.12 | | | (0.38) | | | (0.26) | | | (0.14) | | | — | | | — | | | (0.14) | | | 10.59 | | | (2.38%)b | | | 127,650 | | | 1.26%a | | | 0.95%a | | | 4.48%a |
6/30/21 | | | 10.42 | | | 0.53 | | | 0.84 | | | 1.37 | | | (0.60) | | | (0.20) | | | — | | | (0.80) | | | 10.99 | | | 13.61% | | | 111,221 | | | 1.34% | | | 0.95% | | | 4.90% |
6/30/20 | | | 10.06 | | | 0.67 | | | 0.33 | | | 1.00 | | | (0.64) | | | — | | | — | | | (0.64) | | | 10.42 | | | 10.33% | | | 33,429 | | | 1.42% | | | 0.95% | | | 6.84% |
Class A* | | | | | | | | | | | | | | | | | | | | | | | | | | | | | | | | | | | | | | | | | | |
9/30/24g | | | $7.19 | | | $0.46 | | | $0.64 | | | $1.10 | | | $(0.43) | | | $— | | | $— | | | $(0.43) | | | $7.86 | | | 15.77% | | | $1,049 | | | 1.68% | | | 1.19% | | | 6.13% |
9/30/23 | | | 6.76 | | | 0.46 | | | 0.41 | | | 0.87 | | | — | | | — | | | (0.44) | | | (0.44) | | | 7.19 | | | 12.97% | | | 2,186 | | | 1.37% | | | 1.22% | | | 6.29% |
9/30/22 | | | 10.59 | | | 0.47 | | | (3.59) | | | (3.12) | | | (0.45) | | | (0.17) | | | (0.09) | | | (0.71) | | | 6.76 | | | (30.66%) | | | 3,199 | | | 1.53% | | | 1.21% | | | 5.19% |
9/30/21 | | | 10.99 | | | 0.12 | | | (0.39) | | | (0.27) | | | (0.13) | | | — | | | — | | | (0.13) | | | 10.59 | | | (2.44%)b | | | 17,660 | | | 1.60%a | | | 1.20%a | | | 4.24%a |
6/30/21 | | | 10.42 | | | 0.51 | | | 0.84 | | | 1.35 | | | (0.58) | | | (0.20) | | | — | | | (0.78) | | | 10.99 | | | 13.32% | | | 17,491 | | | 1.73% | | | 1.20% | | | 4.71% |
6/30/20 | | | 10.06 | | | 0.60 | | | 0.38 | | | 0.98 | | | (0.62) | | | — | | | — | | | (0.62) | | | 10.42 | | | 10.11% | | | 6,443 | | | 2.08% | | | 1.20% | | | 6.21% |
Class C* | | | | | | | | | | | | | | | | | | | | | | | | | | | | | | | | | | | | | | | | | | |
9/30/24 | | | $7.19 | | | $0.40 | | | $0.63 | | | $1.03 | | | $(0.38) | | | $— | | | $— | | | $(0.38) | | | $7.84 | | | 14.63% | | | $138 | | | 2.41% | | | 1.94% | | | 5.37% |
9/30/23 | | | 6.76 | | | 0.40 | | | 0.42 | | | 0.82 | | | — | | | — | | | (0.39) | | | (0.39) | | | 7.19 | | | 12.14% | | | 296 | | | 2.10% | | | 1.97% | | | 5.47% |
9/30/22 | | | 10.59 | | | 0.39 | | | (3.58) | | | (3.19) | | | (0.39) | | | (0.17) | | | (0.08) | | | (0.64) | | | 6.76 | | | (31.20%) | | | 477 | | | 2.64% | | | 1.98% | | | 4.68% |
9/30/21 | | | 10.99 | | | 0.09 | | | (0.38) | | | (0.29) | | | (0.11) | | | — | | | — | | | (0.11) | | | 10.59 | | | (2.62%)b | | | 583 | | | 3.43%a | | | 1.95%a | | | 3.48%a |
6/30/21 | | | 10.42 | | | 0.43 | | | 0.83 | | | 1.26 | | | (0.49) | | | (0.20) | | | — | | | (0.69) | | | 10.99 | | | 12.51% | | | 463 | | | 4.40% | | | 1.95% | | | 3.98% |
6/30/20 | | | 10.06 | | | 0.60 | | | 0.31 | | | 0.91 | | | (0.55) | | | — | | | — | | | (0.55) | | | 10.42 | | | 9.28% | | | 225 | | | 5.29% | | | 1.95% | | | 6.09% |
| | | | | | | | | | | | | | | | | | | | | | | | | | | | | | | | | | | | | | | | | | | |
| | | | | | | | | | |
Portfolio turnover rate
| | | 52% | | | 43% | | | 55% | | | 10% | | | 52% | | | 127% |
| | | | | | | | | | | | | | | | | | | |
*
| On December 13, 2021, the Barings Emerging Markets Debt Blended Total Return Fund (the “Predecessor Fund”) was reorganized into the MassMutual Emerging Markets Debt Blended Total Return Fund (the “Fund”) and shareholders of the Predecessor Fund received a proportional distribution of the same class of shares, or Class L shares in the case of Class A shares, of the Fund. Information shown prior to December 13, 2021 is that of the Predecessor Fund, and is that of the Fund after December 13, 2021. The Predecessor Fund changed its fiscal year end to September 30th prior to the reorganization. |
b
| Percentage represents the results for the period and is not annualized. |
c
| Per share amount calculated on the average shares method. |
g
| Class L shares were renamed Class A shares on February 1, 2024. |
j
| Computed after giving effect to agreements by MML Advisers and Barings LLC to waive certain fees and expenses of the Fund and the Predecessor Fund (Note 1), respectively. |
m
| Total return excludes sales charges, if any, and would be lower for the period presented if it reflected these charges. |
q
| Excludes fees and expenses incurred indirectly as a result of investments in underlying funds, as applicable. |
z
| The net asset values and total returns have been calculated on net assets which include adjustments made in accordance with U.S. generally accepted accounting principles required at period end for financial reporting purposes. |
| | | | | |
| | | The accompanying notes are an integral part of the financial statements.
| |
58
| | | | |
| | | | | |
TABLE OF CONTENTS
| | | |
| | Notes to Financial Statements | |
| | | |
MassMutual Advantage Funds (the “Trust”) is registered under the Investment Company Act of 1940, as amended (the “1940 Act”), as an open-end management investment company. The Trust is organized under the laws of the Commonwealth of Massachusetts as a Massachusetts business trust pursuant to an Agreement and Declaration of Trust dated April 26, 2021. The Trust consists of the following series (each individually referred to as a “Fund” or collectively as the “Funds”):
MassMutual Clinton Limited Term Municipal Fund (“MM Clinton Limited Term Municipal Fund”)
MassMutual Clinton Municipal Fund (“MM Clinton Municipal Fund”)
MassMutual Clinton Municipal Credit Opportunities Fund (“MM Clinton Municipal Credit Opportunities Fund”)
MassMutual Global Floating Rate Fund (“Global Floating Rate Fund”)
MassMutual Global Credit Income Opportunities Fund (“Global Credit Income Opportunities Fund”)
MassMutual Emerging Markets Debt Blended Total Return Fund (“Emerging Markets Debt Blended Total Return Fund”)
The MM Clinton Limited Term Municipal Fund, MM Clinton Municipal Fund, and MM Clinton Municipal Credit Opportunities Fund each commenced operations on February 1, 2024.
On December 13, 2021, the assets of each of the Barings Global Floating Rate Fund, Barings Global Credit Income Opportunities Fund, and Barings Emerging Markets Debt Blended Total Return Fund (each, a “Predecessor Fund,” and together the “Predecessor Funds”) were transferred to the Global Floating Rate Fund, Global Credit Income Opportunities Fund, and Emerging Markets Debt Blended Total Return Fund, respectively, in exchange for shares of the corresponding Fund and the assumption by that Fund of all of the liabilities of the corresponding Predecessor Fund. Shareholders of the Predecessor Funds received a proportional distribution of the same class of shares, or Class L shares in the case of Class A shares, of the corresponding Fund. At the time of this reorganization, each of the Funds was a newly formed series of the Trust, which at the time, was itself a newly created Massachusetts business trust. Each of the Predecessor Funds was the accounting and performance survivor in its respective reorganization, and each corresponding Fund, as the corporate survivor in its respective reorganization, adopted the accounting and performance history of the corresponding Predecessor Fund.
Effective February 1, 2024, Class L shares were renamed Class A shares for the Global Floating Rate Fund, Global Credit Income Opportunities Fund, and Emerging Markets Debt Blended Total Return Fund.
Each share class of a Fund represents an interest in the same portfolio of assets. The principal difference among the classes is the level of service and administration fees, and shareholder and distribution service expenses borne by the classes. Because each class will have different fees and expenses, performance and share prices will vary between the classes. The classes of shares are offered to different types of investors, as outlined in the Funds’ Prospectus.
2.
| Significant Accounting Policies |
The following is a summary of significant accounting policies followed consistently by each Fund in the preparation of the financial statements in conformity with accounting principles generally accepted in the United States of America (“generally accepted accounting principles”). The preparation of the financial statements in accordance with generally accepted accounting principles requires management to make estimates and assumptions that affect the reported amounts and disclosures in the financial statements. Actual results could differ from those estimates.
Each Fund is an investment company and accordingly follows the investment company accounting and reporting guidance of the Financial Accounting Standards Board Accounting Standards Codification Topic 946, Financial Services – Investment Companies.
Investment Valuation
The net asset value of each Fund’s shares is determined once daily as of the close of regular trading on the New York Stock Exchange (“NYSE”), on each day the NYSE is open for trading (a “business day”). The NYSE normally closes at 4:00 p.m. Eastern Time, but may close earlier on some days. If the NYSE is scheduled to close early, the business day will be considered to end as of the time of the NYSE’s scheduled close. A Fund will not treat an intraday disruption in NYSE trading or other event that causes an unscheduled closing of the NYSE as a close of business of the NYSE for these purposes; instead, MML Investment Advisers, LLC (“MML Advisers”) will determine the fair value of a Fund’s securities in accordance with MML Advisers’ fair valuation
TABLE OF CONTENTS
| | Notes to Financial Statements (Continued) | |
policy and procedures. On holidays and other days when the NYSE is closed, each Fund’s net asset value generally is not calculated and the Funds do not anticipate accepting buy or sell orders. However, the value of each Fund’s assets may still be affected on such days to the extent that a Fund holds foreign securities that trade on days that foreign securities markets are open.
Equity securities and derivative contracts that are actively traded on a national securities exchange or contract market are valued on the basis of information furnished by a pricing service, which provides the last reported sale price, or, in the case of futures contracts, the settlement price, for securities or derivatives listed on the exchange or contract market or the official closing price on the NASDAQ National Market System (“NASDAQ System”), or in the case of over-the-counter (“OTC”) securities for which an official closing price is unavailable or not reported on the NASDAQ System, the last reported bid price. Portfolio securities traded on more than one national securities exchange are valued at the last price at the close of the exchange representing the principal market for such securities. Debt securities are valued on the basis of valuations furnished by a pricing service, which generally determines valuations taking into account factors such as institutional-size trading in similar securities, yield, quality, coupon rate, maturity, type of issue, trading characteristics, and other market data. Shares of other open-end mutual funds are valued at their closing net asset values as reported on each business day.
Investments for which market quotations are readily available are marked to market daily based on those quotations. Market quotations may be provided by third party vendors or market makers, and may be determined on the basis of a variety of factors, such as broker quotations, financial modeling, and other market data, such as market indexes and yield curves, counterparty information, and foreign exchange rates. U.S. Government and agency securities may be valued on the basis of market quotations or using a model that may incorporate market observable data such as reported sales of similar securities, broker quotes, yields, bids, offers, quoted market prices, and reference data. The fair values of OTC derivative contracts, including forward, swap, and option contracts related to interest rates, foreign currencies, credit standing of reference entities, equity prices, or commodity prices, may be based on market quotations or may be modeled using a series of techniques, including simulation models, depending on the contract and the terms of the transaction. The fair values of asset-backed securities and mortgage-backed securities are estimated based on models that consider the estimated cash flows of each debt tranche of the issuer, established benchmark yield, and estimated tranche-specific spread to the benchmark yield based on the unique attributes of the tranche, including, but not limited to, prepayment speed assumptions and attributes of the collateral.
The Board of Trustees (“Trustees”) have designated MML Advisers as the Funds’ “valuation designee,” responsible for determining the fair value, in good faith, of securities and other instruments held by the Funds for which market quotations are not readily available or for which such market quotations or values are considered by MML Advisers or a subadviser to be unreliable (including, for example, certain foreign securities, thinly-traded securities, certain restricted securities, certain initial public offerings, or securities whose values may have been affected by a significant event). It is possible that a significant amount of a Fund’s assets will be subject to fair valuation in accordance with MML Advisers’ fair valuation policy and procedures. The fair value determined for an investment by MML Advisers may differ from recent market prices for the investment and may be significantly different from the value realized upon the sale of such investment.
The Funds may invest in securities that are traded principally in foreign markets and that trade on weekends and other days when the Funds do not price their shares. As a result, the values of the Funds’ portfolio securities may change on days when the prices of the Funds’ shares are not calculated. The prices of the Funds’ shares will reflect any such changes when the prices of the Funds’ shares are next calculated, which is the next business day. The Funds may use fair value pricing more frequently for securities primarily traded in foreign markets because, among other things, most foreign markets close well before the Funds value their securities. The earlier close of these foreign markets gives rise to the possibility that significant events, including broad market moves, may have occurred in the interim. The Funds’ investments may be priced based on fair values provided by a third-party vendor, based on certain factors and methodologies applied by such vendor, in the event that there is movement in the U.S. market, between the close of the foreign market and the time the Funds calculate their net asset values. All assets and liabilities expressed in foreign currencies are converted into U.S. dollars at the mean between the buying and selling rates of such currencies against the U.S. dollar at the end of each business day.
Investments in equity or debt issued by privately held companies or funds (“Private Company” or collectively, the “Private Companies”) and any other investments fair valued using significant unobservable inputs may be fair valued using alternate valuation approaches including, but not limited to, the following:
Market approach: considers factors including the price of recent investments in the same or similar security or financial metrics of comparable securities.
TABLE OF CONTENTS
| | Notes to Financial Statements (Continued) | |
Income approach: considers factors including expected future cash flows, security specific risks, and corresponding discount rates.
Cost approach: considers factors including the value of the security’s underlying assets and liabilities.
Investments in series of preferred stock issued by Private Companies are typically valued utilizing the Market approach in determining the enterprise value of the company. Such investments often contain rights and preferences that differ from other series of preferred and common stock of the same issuer. Valuation techniques such as the current value method (“CVM”), an option pricing model (“OPM”), a probability weighted expected return model (“PWERM”), or a hybrid of those techniques are used in allocating enterprise value of the company, as deemed appropriate under the circumstances. The CVM allocates value among the various parts of a company’s capital structure assuming that the value of convertible preferred stock is represented by the most favorable claim the preferred stockholders have on the enterprise value as of the valuation date. The use of OPM and PWERM techniques involve a determination of the exit scenarios of the investment in order to appropriately allocate the enterprise value of the company among the various parts of its capital structure.
The Private Companies are not subject to the public company disclosure, timing, and reporting standards as other investments held by a Fund. Typically, the most recently available information for a Private Company is as of a date that is earlier than the date a Fund is calculating its net asset value. This factor may result in a difference between the value of the investment and the price a Fund could receive upon the sale of the investment.
Fair value is defined as the price that would be received to sell an asset or paid to transfer a liability in an orderly transaction between market participants at the measurement date. A three-tier hierarchy is utilized to maximize the use of observable market data inputs and minimize the use of unobservable inputs and to establish classification of fair value measurements for disclosure purposes. Inputs refer broadly to the assumptions that market participants would use in pricing the asset or liability, including assumptions about risk, for example, the risk inherent in a particular valuation technique used to measure fair value (such as a pricing model) and/or the risk inherent in the inputs to the valuation technique. Inputs may be observable or unobservable. Observable inputs are inputs that reflect the assumptions market participants would use in pricing the asset or liability and are developed based on market data obtained from sources independent of the reporting entity. Unobservable inputs are inputs that reflect the reporting entity’s own assumptions about the assumptions market participants would use in pricing the asset or liability and are developed based on the best information available in the circumstances. The three-tier hierarchy of inputs is summarized in the three broad Levels listed below. The inputs or methodology used for valuing investments are not necessarily an indication of the risk associated with investing in those investments and the determination of the significance of a particular input to the fair value measurement in its entirety requires judgment and consideration of factors specific to each security.
Level 1 – quoted prices (unadjusted) in active markets for identical investments that the Funds can access at the measurement date
Level 2 – other significant observable inputs (including fair value factors, quoted prices for similar investments, interest rates, prepayment speeds, credit risk, etc.)
Level 3 – significant unobservable inputs, to the extent observable inputs are not available (including the Funds’ own assumptions in determining the fair value of investments)
The availability of observable inputs can vary from security to security and is affected by a wide variety of factors, including, for example, the type of security, whether the security is new and not yet established in the marketplace, the liquidity of markets, and other characteristics particular to the security. To the extent that valuation is based on models or inputs that are less observable or unobservable in the market, the determination of fair value requires more judgment. Accordingly, the degree of judgment exercised in determining fair value is greatest for instruments categorized in Level 3.
Changes in valuation techniques may result in transfers in or out of an investment’s assigned Level within the hierarchy. In addition, in periods of market dislocation, the observability of prices and inputs may be reduced for many instruments. This condition, as well as changes related to liquidity of investments, could cause a security to be reclassified between Levels.
In certain cases, the inputs used to measure fair value may fall into different Levels of the fair value hierarchy. In such cases, for disclosure purposes, the Level in the fair value hierarchy within which the fair value measurement falls is determined based on the lowest Level input that is significant to the overall fair value measurement.
The MM Clinton Limited Term Municipal Fund, MM Clinton Municipal Fund, and MM Clinton Municipal Credit Opportunities Fund characterized all investments at Level 2, as of September 30, 2024. For each Fund noted in the preceding sentences, the level classification by major category of investments is the same as the category presentation in the Portfolio of Investments.
TABLE OF CONTENTS
| | Notes to Financial Statements (Continued) | |
The following is the aggregate value by input level, as of September 30, 2024, for the remaining Funds’ investments:
| | | | | | | | | | | | | |
Global Floating Rate Fund | | | | | | | | | | | | |
Asset Investments | | | | | | | | | | | | |
Common Stock | | | $768,783 | | | $— | | | $297,986 | | | $1,066,769 |
Bank Loans | | | — | | | 108,890,789 | | | 805,199 | | | 109,695,988 |
Corporate Debt | | | — | | | 7,925,643 | | | — | | | 7,925,643 |
Rights | | | — | | | — | | | —+ | | | — |
Warrants | | | — | | | 7,621 | | | — | | | 7,621 |
Short-Term Investments | | | — | | | 6,330,491 | | | — | | | 6,330,491 |
Unfunded Bank Loan Commitments* | | | — | | | 4,462 | | | — | | | 4,462 |
Total Investments | | | $768,783 | | | $123,159,006 | | | $1,103,185 | | | $125,030,974 |
Liability Derivatives | | | | | | | | | | | | |
Forward Contracts | | | $— | | | $(43,978) | | | $— | | | $(43,978) |
Global Credit Income Opportunities Fund | | | | | | | | | | | | |
Asset Investments | |
Common Stock | | | | | | | | | | | | |
Germany | | | $— | | | $— | | | $—+ | | | $— |
Lithuania | | | — | | | — | | | —+ | | | — |
Spain | | | — | | | — | | | —+ | | | — |
United Kingdom | | | 191,989 | | | — | | | 48,537 | | | 240,526 |
United States | | | 398,462 | | | — | | | — | | | 398,462 |
Bank Loans | | | — | | | 75,515,618 | | | 30,250 | | | 75,545,868 |
Corporate Debt | | | — | | | 51,758,959 | | | —+ | | | 51,758,959 |
Non-U.S. Government Agency Obligations | | | — | | | 7,114,162 | | | — | | | 7,114,162 |
Sovereign Debt Obligations | | | — | | | 305,157 | | | — | | | 305,157 |
Warrants | | | — | | | 22,381 | | | — | | | 22,381 |
Rights | | | — | | | — | | | —+ | | | — |
Short-Term Investments | | | 2,683,060 | | | 16,887,395 | | | — | | | 19,570,455 |
Total Investments | | | $3,273,511 | | | $151,603,672 | | | $78,787 | | | $154,955,970 |
Liability Investments | | | | | | | | | | | | |
Unfunded Bank Loan Commitments* | | | $— | | | $(79) | | | $— | | | $(79) |
Liability Derivatives | | | | | | | | | | | | |
Forward Contracts | | | $— | | | $(76,826) | | | $— | | | $(76,826) |
Futures Contracts | | | (25,783) | | | — | | | — | | | (25,783) |
Total | | | $(25,783) | | | $(76,826) | | | $— | | | $(102,609) |
Emerging Markets Debt Blended Total Return Fund
| | | | | | | | | | | | |
Asset Investments
| | | | | | | | | | | | |
Corporate Debt | | | $ — | | | $9,950,566 | | | $ — | | | $9,950,566 |
Sovereign Debt Obligations | | | — | | | 16,155,323 | | | — | | | 16,155,323 |
Purchased Options | | | — | | | 121,719 | | | — | | | 121,719 |
Short-Term Investments | | | 499,350 | | | 930,493 | | | — | | | 1,429,843 |
Total Investments | | | $499,350 | | | $27,158,101 | | | $— | | | $27,657,451 |
| | | | | | | | | | | | | |
TABLE OF CONTENTS
| | Notes to Financial Statements (Continued) | |
| | | | | | | | | | | | | |
Emerging Markets Debt Blended Total Return Fund (Continued)
| |
Asset Derivatives
| | | | | | | | | | | | |
Forward Contracts | | | $ — | | | $ 729,143 | | | $ — | | | $ 729,143 |
Swap Agreements | | | — | | | 312,793 | | | — | | | 312,793 |
Total | | | $— | | | $1,041,936 | | | $— | | | $1,041,936 |
Liability Derivatives
| | | | | | | | | | | | |
Forward Contracts | | | $— | | | $(609,588) | | | $— | | | $(609,588) |
Swap Agreements | | | — | | | (55,554) | | | — | | | (55,554) |
Written Options | | | — | | | (89,594) | | | — | | | (89,594) |
Total | | | $— | | | $(754,736) | | | $— | | | $(754,736) |
| | | | | | | | | | | | | |
*
| Unfunded bank loan commitments are valued at the unrealized appreciation (depreciation) on the commitment. |
+
| Represents a security at $0 value as of September 30, 2024. |
For certain Funds the Statement of Assets and Liabilities shows receivables from investments sold on a delayed delivery basis, as well as any applicable liabilities for investments purchased on a delayed delivery basis and amounts due to custodian. These amounts approximate fair value and would be categorized at Level 2 for each applicable Fund as of September 30, 2024.
The Funds, with the exception of the Global Floating Rate Fund and Global Credit Income Opportunities Fund, had no Level 3 transfers during the year ended September 30, 2024. The Global Floating Rate Fund and Global Credit Income Opportunities Fund, had Level 3 transfers during the year ended September 30, 2024; however, none of the transfers individually or collectively had a material impact on the Global Floating Rate Fund or Global Credit Income Opportunities Fund.
Derivative Instruments
Derivatives are financial instruments whose values are based on the values of one or more underlying indicators, such as a security, asset, currency, interest rate, or index. Derivative transactions can create investment leverage and may be highly volatile. Losses from derivatives can be substantially greater than the derivatives’ original cost and can sometimes be unlimited. A Fund may not be able to close out a derivative transaction at a favorable time or price.
TABLE OF CONTENTS
| | Notes to Financial Statements (Continued) | |
At September 30, 2024, and during the year then ended, the Fund(s) had the following derivatives and transactions in derivatives, grouped into the indicated risk categories:
| | | | | | | | | | | | | |
Global Floating Rate Fund |
Liability Derivatives |
Forward Contracts^ | | | $ — | | | $(43,978) | | | $ — | | | $(43,978) |
Realized Gain (Loss)# | | | | | | | | | | | | |
Forward Contracts | | | $— | | | $(870,991) | | | $— | | | $(870,991) |
Change in Appreciation (Depreciation)## | | | | | | | | | | | | |
Forward Contracts | | | $— | | | $(827,384) | | | $— | | | $(827,384) |
Global Credit Income Opportunities Fund |
Liability Derivatives | | | | | | | | | | | | |
Forward Contracts^ | | | $— | | | $(76,826) | | | $— | | | $(76,826) |
Futures Contracts^^ | | | — | | | — | | | (25,783) | | | (25,783) |
Total Value | | | $— | | | $(76,826) | | | $(25,783) | | | $(102,609) |
Realized Gain (Loss)# | | | | | | | | | | | | |
Forward Contracts | | | $— | | | $(1,231,909) | | | $— | | | $(1,231,909) |
Change in Appreciation (Depreciation)## | | | | | | | | | | | | |
Forward Contracts | | | $— | | | $(665,195) | | | $— | | | $(665,195) |
Futures Contracts | | | — | | | — | | | (25,783) | | | (25,783) |
Total Change in Appreciation (Depreciation) | | | $— | | | $(665,195) | | | $(25,783) | | | $(690,978) |
Emerging Markets Debt Blended Total Return Fund |
Asset Derivatives | | | | | | | | | | | | |
Purchased Options* | | | $— | | | $121,719 | | | $— | | | $121,719 |
Forward Contracts* | | | — | | | 729,143 | | | — | | | 729,143 |
Swap Agreements* | | | 57,914 | | | 18,531 | | | — | | | 76,445 |
Swap Agreements^^,^^^ | | | — | | | — | | | 236,348 | | | 236,348 |
Total Value | | | $57,914 | | | $869,393 | | | $236,348 | | | $1,163,655 |
Liability Derivatives |
Forward Contracts^ | | | $— | | | $(609,588) | | | $— | | | $(609,588) |
Swap Agreements^ | | | (12,861) | | | — | | | — | | | (12,861) |
Swap Agreements^^,^^^ | | | — | | | — | | | (42,693) | | | (42,693) |
Written Options^ | | | — | | | (89,594) | | | — | | | (89,594) |
Total Value | | | $(12,861) | | | $(699,182) | | | $(42,693) | | | $(754,736) |
Realized Gain (Loss)# |
Purchased Options | | | $— | | | $(166,792) | | | $— | | | $(166,792) |
Forward Contracts | | | — | | | (1,546,278) | | | — | | | (1,546,278) |
Futures Contracts | | | — | | | — | | | 54,734 | | | 54,734 |
Swap Agreements | | | 125,134 | | | (4,449) | | | (142,927) | | | (22,242) |
Written Options | | | — | | | 209,388 | | | — | | | 209,388 |
Total Realized Gain (Loss) | | | $125,134 | | | $(1,508,131) | | | $(88,193) | | | $(1,471,190) |
| | | | | | | | | | | | | |
TABLE OF CONTENTS
| | Notes to Financial Statements (Continued) | |
| | | | | | | | | | | | | | |
Emerging Markets Debt Blended Total Return Fund (Continued) |
Change in Appreciation (Depreciation)## |
Purchased Options | | | $ — | | | $ 117,265 | | | $ — | | | $ 117,265 | |
Forward Contracts | | | — | | | 297,022 | | | — | | | 297,022 | |
Futures Contracts | | | — | | | — | | | (186,918) | | | (186,918) | |
Swap Agreements | | | 21,842 | | | (36,708) | | | 278,607 | | | 263,741 | |
Written Options | | | — | | | (87,734) | | | — | | | (87,734) | |
Total Change in Appreciation (Depreciation) | | | $21,842 | | | $289,845 | | | $91,689 | | | $403,376 | |
| | | | | | | | | | | | | | |
*
| Statements of Assets and Liabilities location: Investments, at value, or Receivables from: open forward contracts or open swap agreements, at value, as applicable. |
^
| Statements of Assets and Liabilities location: Payables for: open forward contracts, open swap agreements, at value, or written options outstanding, at value, as applicable. |
^^
| Cumulative appreciation (depreciation) on futures contracts and centrally cleared swaps is reported in “Futures Contracts” and “Swap Agreements” in each applicable Fund’s Portfolio of Investments. Only current day’s variation margin, if any, is reported within the Statements of Assets and Liabilities. |
^^^
| Represents centrally cleared swaps, which are not subject to a master netting agreement or similar agreement. |
#
| Statements of Operations location: Amounts are included in net realized gain (loss) on investment transactions, forward contracts, futures contracts, swap agreements, or written options, as applicable. |
##
| Statements of Operations location: Amounts are included in net change in unrealized appreciation (depreciation) on investment transactions, forward contracts, futures contracts, swap agreements, or written options, as applicable. |
For the year ended September 30, 2024, the average balances for each derivative type were as follows:
| | | | |
Futures Contracts:
| | | | | | | | | |
Average number of contracts - long | | | — | | | 163 | | | 40 |
Average number of contracts - short | | | — | | | — | | | 83 |
Forward Contracts:
| | | | | | | | | |
Average notional amounts purchased - in USD | | | $3,008,493 | | | $1,072,958 | | | $27,010,846 |
Average notional amounts sold - in USD | | | $37,087,484 | | | $39,339,362 | | | $27,225,286 |
Swap Agreements:
| | | | | | | | | |
Credit Default Swaps:
| | | | | | | | | |
Average notional amounts - sell protection | | | $— | | | $— | | | $6,916,667 |
Interest Rate Swaps:
| | | | | | | | | |
Average notional amounts | | | $— | | | $— | | | $2,035,803,482 |
Currency Swaps:
| | | | | | | | | |
Average notional amounts | | | $— | | | $— | | | $380,371 |
Options:
| | | | | | | | | |
Average shares/units outstanding of Purchased Options | | | — | | | — | | | 6,539,304 |
Average shares/units outstanding of Written Options | | | — | | | — | | | 2,480,607 |
| | | | | | | | | | |
TABLE OF CONTENTS
| | Notes to Financial Statements (Continued) | |
The Portfolio of Investments included in a Fund’s financial statements shows the assets or liabilities of the Fund associated with individual derivatives transactions. The terms of many of those transactions contemplate that derivatives receivables and payables between the same two parties may be netted and that the parties will collateralize certain obligations. The following tables provide an illustration of the possible effect of netting provisions and of collateral (delivered or received) on a Fund’s derivatives exposure as of September 30, 2024. Netting arrangements vary among different counterparties, and the actual disposition of derivatives receivables and payables, and of collateral, in a bankruptcy or insolvency can be complicated and difficult to predict.
The following table presents derivative assets by counterparty net of amounts available for offset under a master netting agreement (“MNA”) or similar agreement and net of the related collateral received by the Fund(s) as of September 30, 2024.
| | | | | | | | | | | | | |
Emerging Markets Debt Blended Total Return Fund | | | | | | | | | | | | |
Bank of America N.A. | | | $ 89,380 | | | $ (82,201) | | | $ — | | | $ 7,179 |
BNP Paribas SA | | | 100,964 | | | — | | | — | | | 100,964 |
Citibank N.A. | | | 98,163 | | | (27,339) | | | — | | | 70,824 |
Goldman Sachs International | | | 333,338 | | | (291,465) | | | — | | | 41,873 |
HSBC Bank PLC | | | 160,474 | | | (145,332) | | | — | | | 15,142 |
JP Morgan Chase Bank N.A. | | | 28,258 | | | (7,536) | | | — | | | 20,722 |
Morgan Stanley & Co. LLC | | | 116,730 | | | (116,730) | | | — | | | — |
| | | $927,307 | | | $(670,603) | | | $— | | | $ 256,704 |
| | | | | | | | | | | | | |
The following table presents derivative liabilities by counterparty net of amounts available for offset under an MNA or similar agreement and net of the related collateral pledged by the Fund(s) as of September 30, 2024.
| | | | | | | | | | | | | |
Global Floating Rate Fund | | | | | | | | | | | | |
Canadian Imperial Bank of Commerce | | | $ (33,480) | | | $ — | | | $ 33,480 | | | $ — |
Morgan Stanley & Co. LLC | | | (10,498) | | | — | | | — | | | (10,498) |
| | | $(43,978) | | | $— | | | $ 33,480 | | | $(10,498) |
Global Credit Income Opportunities Fund | | | | | | | | | | | | |
Bank of America N.A. | | | $(65,871) | | | $— | | | $ 60,000 | | | $(5,871) |
Morgan Stanley & Co. LLC | | | (10,955) | | | — | | | — | | | (10,955) |
| | | $(76,826) | | | $— | | | $ 60,000 | | | $(16,826) |
Emerging Markets Debt Blended Total Return Fund | | | | | | | | | | | | |
Bank of America N.A. | | | $(82,201) | | | $82,201 | | | $— | | | $— |
BNP Paribas SA | | | — | | | — | | | — | | | — |
Citibank N.A. | | | (27,339) | | | 27,339 | | | — | | | — |
Goldman Sachs International | | | (291,465) | | | 291,465 | | | — | | | — |
HSBC Bank PLC | | | (145,332) | | | 145,332 | | | — | | | — |
JP Morgan Chase Bank N.A. | | | (7,536) | | | 7,536 | | | — | | | — |
Morgan Stanley & Co. LLC | | | (158,170) | | | 116,730 | | | — | | | (41,440) |
| | | $(712,043) | | | $670,603 | | | $— | | | $(41,440) |
| | | | | | | | | | | | | |
*
| Represents the net amount receivable from the counterparty in the event of default. |
TABLE OF CONTENTS
| | Notes to Financial Statements (Continued) | |
**
| Represents the net amount payable to the counterparty in the event of default. |
***
| The amount presented here may be less than the total amount of collateral received/pledged as the net amount of derivative assets and liabilities for a counterparty cannot be less than $0. |
†
| The amount presented here may be less than the total amount shown in the Statements of Assets and Liabilities as some derivatives held by the counterparty are not covered within an MNA or similar agreement. |
Such agreements typically permit a single net payment in the event of default, including the bankruptcy or insolvency of the counterparty. The Fund(s) and counterparties may not be permitted to sell, re-pledge, or use the collateral they receive. In the event that cash collateral is restricted for use, the balance will be reflected as restricted cash within the Statement of Assets and Liabilities.
Further details regarding the derivatives and other investments held by the Fund(s) during the year ended September 30, 2024, are discussed below.
Foreign Currency Exchange Transactions
A Fund may enter into foreign currency exchange transactions for hedging purposes in order to protect against uncertainty in the level of future foreign currency exchange rates, or for other, non-hedging purposes.
Forward Foreign Currency Contracts and Foreign Currency Options. A Fund may enter into foreign currency exchange transactions, including foreign currency forward contracts. These contracts call for the Fund to deliver in the future an amount of one currency in return for an amount of another currency, at an exchange rate determined at the time the contract is entered into. Forward contracts are private contractual arrangements and a Fund is subject to the risk that its counterparty will not, or will not be able to, perform its obligations. This type of arrangement may require the Fund to post margin. A Fund may also buy and sell options on currencies. When the Fund buys an option, its loss should generally be limited to the amount of the premium paid and any transaction costs. If a Fund sells an option on a currency, it is subject generally to the same risks as if it had entered into a futures contract or forward contract with respect to that currency. A Fund may enter into foreign currency exchange transactions in order to hedge against changes in the values of the assets or liabilities denominated in one or more foreign currencies, or otherwise to increase or reduce a Fund’s exposure to various foreign currencies. The use of foreign currency exchange transactions may create investment leverage.
Whenever a Fund enters into a foreign currency exchange transaction, it is subject to the risk that the value of the transaction will move in a direction unfavorable to it. When the Fund uses the transactions for hedging purposes, it is likely that the Fund will have an asset or liability that will offset any loss (or gain) on the transactions, at least in part. If a Fund enters into foreign currency exchange transactions other than for hedging purposes (for example, seeking to profit from an anticipated change in the values of currencies by creating directional exposures in the portfolio with respect to one or more currencies), it will generally be subject to the same risks, but is less likely to have assets or liabilities that will offset any losses on the transactions. There can be no assurance that a Fund will be able to terminate any foreign currency exchange transaction prior to its maturity in order to limit its loss on the transaction.
Forward foreign currency contracts are marked to market daily and the change in their value is recorded by the Funds as an unrealized gain or loss. Forward foreign currency contracts are valued at the settlement price established through dealers or other market sources on the day which they are traded. When a forward foreign currency contract is extinguished, through delivery or offset by entering into another forward foreign currency contract, the Funds record a realized gain or loss equal to the difference between the value of the contract at the time it was opened and the value of the contract at the time it was extinguished or offset. The notional or contractual amounts of these instruments do not necessarily represent the amounts potentially subject to risk. The measurement of the risk associated with these instruments is meaningful only when all related and offsetting transactions and counterparty risks are considered. For information regarding the accounting treatment of options, see “Options, Rights, and Warrants” below.
Foreign Currency Swaps. A Fund may also enter into currency swaps, as an alternative to the transactions described above. Currency swaps involve the individually negotiated exchange by a Fund with another party of a series of payments in specified currencies in amounts determined pursuant to the terms of the swap agreement. For a description of risks associated with swap transactions and the accounting treatment, see “Swap Agreements” below.
A Fund’s current exposure to a counterparty is the unrealized appreciation (depreciation) on the contract.
TABLE OF CONTENTS
| | Notes to Financial Statements (Continued) | |
Futures Contracts
A Fund may seek to manage a variety of different risks, such as interest rate risk, equity price risk, and currency risk, through the use of futures contracts. A Fund may use interest rate futures contracts to adjust the interest rate sensitivity (duration) of its portfolio or the credit exposure of the portfolio. Interest rate futures contracts obligate the long or short holder to take or make delivery of a specified quantity of a financial instrument, such as a specific fixed income security, during a specified future period at a specified price. A Fund may use index futures contracts to hedge against broad market risks to its portfolio or to gain broad market exposure when it holds uninvested cash or as an inexpensive substitute for cash investments directly in securities or other assets, including commodities and precious metals. Securities index futures contracts are contracts to buy or sell units of a securities index at a specified future date at a price agreed upon when the contract is made and are settled in cash. Positions in futures contracts may be closed out only on an exchange or board of trade which provides a market for such futures. Because futures contracts are exchange-traded, they typically have minimal exposure to counterparty risk.
Parties to a futures contract are not required to post the entire notional amount of the contract, but rather a small percentage of that amount (by way of margin), both at the time they enter into futures transactions, and then on a daily basis if their positions decline in value; as a result, futures contracts are highly leveraged. Such payments are known as variation margin and are recorded by the Funds as unrealized gains or losses. Because futures markets are highly leveraged, they can be extremely volatile, and there can be no assurance that the pricing of a futures contract will correlate precisely with the pricing of the asset or index underlying it or the asset or liability of the Fund that is the subject of the hedge. It may not always be possible for a Fund to enter into a closing transaction with respect to a futures contract it has entered into, at a favorable time or price. When a Fund enters into a futures transaction, it is subject to the risk that the value of the futures contract will move in a direction unfavorable to it. When a Fund uses futures contracts for hedging purposes, it is likely that the Fund will have an asset or liability that will offset any loss (or gain) on the transactions, at least in part.
When a futures contract is closed, the Fund records a realized gain or loss equal to the difference between the value of the contract at the time it was opened and the value at the time it was closed. Futures contracts are valued at the settlement price established each day by the board of trade or exchange on which they are traded.
Swap Agreements
Swap agreements are typically two-party contracts entered into primarily by institutional investors. In a standard “swap” transaction, two parties agree to exchange the returns (or differentials in rates of return) earned or realized on particular predetermined investments or instruments or rates, which may be adjusted for an interest factor. The gross returns to be exchanged or “swapped” between the parties are generally calculated with respect to a “notional amount,” (i.e., the return on or increase in value of a particular dollar amount invested at a particular interest rate or in a “basket” of securities representing a particular index).
Interest Rate Swaps. When a Fund enters into an interest rate swap, it typically agrees to make payments to its counterparty based on a specified long- or short-term interest rate, and will receive payments from its counterparty based on another interest rate. Other forms of interest rate swap agreements include, among others, interest rate caps, under which, in return for a specified payment stream, one party agrees to make payments to the other to the extent that interest rates exceed a specified rate, or “cap”; interest rate floors, under which, in return for a specified payment stream, one party agrees to make payments to the other to the extent that interest rates fall below a specified rate, or “floor”; and interest rate collars, under which a party sells a cap and purchases a floor or vice versa in an attempt to protect itself against interest rate movements exceeding given minimum or maximum levels. A Fund may enter into an interest rate swap in order, for example, to hedge against the effect of interest rate changes on the value of specific securities in its portfolio, or to adjust the interest rate sensitivity (duration) or the credit exposure of its portfolio overall, or otherwise as a substitute for a direct investment in debt securities.
Credit Default Swaps. A Fund also may enter into credit default swap transactions, as a “buyer” or “seller” of credit protection. In a credit default swap, one party provides what is in effect insurance against a default or other adverse credit event affecting an issuer of debt securities (typically referred to as a “reference entity”). In general, the buyer of credit protection is obligated to pay the protection seller an upfront amount or a periodic stream of payments over the term of the swap. If a “credit event” occurs, the buyer has the right to deliver to the seller bonds or other obligations of the reference entity (with a value up to the full notional value of the swap), and to receive a payment equal to the par value of the bonds or other obligations. Credit events that would trigger a request that the seller make payment are specific to each credit default swap agreement, but generally include bankruptcy, failure to pay, restructuring, acceleration, default, or repudiation/moratorium. When a Fund buys protection, it may or may not own securities of the reference entity. If it does own securities of the reference entity, the swap serves as a hedge against a decline in the
TABLE OF CONTENTS
| | Notes to Financial Statements (Continued) | |
value of the securities due to the occurrence of a credit event involving the issuer of the securities. If the Fund does not own securities of the reference entity, the credit default swap may be seen to create a short position in the reference entity. If a Fund is a buyer and no credit event occurs, the Fund will typically recover nothing under the swap, but will have had to pay the required upfront payment and stream of continuing payments under the swap. When a Fund sells protection under a credit default swap, the position may have the effect of creating leverage in the Fund’s portfolio through the Fund’s indirect long exposure to the issuer or securities on which the swap is written. When a Fund sells protection, it may do so either to earn additional income or to create a “synthetic” long position.
Whenever a Fund enters into a swap agreement, it takes on counterparty risk — the risk that its counterparty will be unable or unwilling to meet its obligations under the swap agreement. The Fund also takes the risk that the market will move against its position in the swap agreement. In the case of an interest rate swap, the value of the swap may increase or decrease depending on changes in interest rates. In the case of a credit default swap, the swap will become more or less valuable depending on the credit of the issuer of the underlying security, and, if a credit event occurs under a swap where the Fund is the seller of credit protection, the Fund could be required to purchase the security at par value, resulting in a significant loss to the Fund. When the Fund enters into any type of swap for hedging purposes, it is likely that the Fund will have an asset or liability that will offset any loss (or gain) on the swap, at least in part. Swap agreements may be non-transferable or otherwise highly illiquid, and a Fund may not be able to terminate or transfer a swap agreement at any particular time or at an acceptable price.
Centrally Cleared Swaps. Certain clearinghouses currently offer clearing for limited types of derivatives transactions, principally certain interest rate swaps, certain index swaps, and credit derivatives. In a cleared derivative transaction, a Fund typically enters into the transaction with a financial institution counterparty, and performance of the transaction is effectively guaranteed by a central clearinghouse, thereby reducing or eliminating the Fund’s exposure to the credit risk of its original counterparty. The Fund will be required to post amounts (“initial margin”) with the clearinghouse or at the instruction of the clearinghouse. The initial margin required by a clearinghouse may be greater than the initial margin the Fund would be required to post in an uncleared transaction. If cash is deposited as the initial margin, it is shown as collateral on a Fund’s Statement of Assets and Liabilities. Swap agreements are marked to market daily and subsequent payments (“variation margin”) are made or received by a Fund depending on whether unrealized gains or losses are incurred. These amounts are reflected as receivables or payables on a Fund’s Statement of Assets and Liabilities (“Variation margin on open derivative instruments”) and as a component of net change in unrealized appreciation (depreciation) on a Fund’s Statement of Operations. Only a limited number of transaction types are currently eligible for clearing.
During the term of a swap transaction, changes in the value of the swap are recognized as unrealized gains or losses by marking to market to reflect the market value of the swap. When the swap is terminated, a Fund will record a realized gain or loss equal to the difference, if any, between the proceeds from (or cost of) the closing transaction and a Fund’s basis in the agreement. Upfront swap premium payments paid or received by a Fund, if any, are recorded within the value of the open swap agreement on the Fund’s Statement of Assets and Liabilities and represent payments paid or received upon entering into the swap agreement to compensate for differences between stated terms of the swap agreement and prevailing market conditions (credit spreads, currency exchange rates, and other relevant factors). These upfront payments are recorded as realized gain or loss on the Fund’s Statement of Operations upon termination or maturity of the swap agreement.
During the term of a swap transaction, the periodic net payments can be made for a set period of time or may be triggered by a predetermined credit event. The net periodic payments may be based on a fixed or variable interest rate, the change in market value of a specified security, basket of securities or index, or the return generated by a security. These periodic payments received or made by the Funds are recorded in the accompanying Statements of Operations as realized gains and losses, respectively.
A Fund’s current exposure to a counterparty is the fair value of the transaction.
Options, Rights, and Warrants
A Fund may purchase and sell put and call options on portfolio securities or an index of securities to enhance investment performance or to protect against changes in market prices. A Fund that invests in debt securities may also purchase and sell put and call options to adjust the interest rate sensitivity of its portfolio or the credit exposure of the portfolio.
Call Options. A call option gives the holder the right to purchase, and obligates the writer to sell, a security at the strike price at any time before the expiration date in the case of an American-style option or only on the expiration date in the case of a European-style option.
TABLE OF CONTENTS
| | Notes to Financial Statements (Continued) | |
Put Options. A put option gives the holder the right to sell, and obligates the writer to buy, a security at the exercise price.
Writing put and call options. A Fund may write call options on a security it owns, in a “directional” strategy hoping to realize a greater current return through the receipt of premiums. In return for the option premium, the Fund takes the risk that it will have to forego any increase in the value of the security over the strike price. When a Fund has written a call option on a security it does not own, its exposure on such an option is theoretically unlimited. A Fund may enter into closing purchase transactions in order to realize a profit or limit a loss on a previously written call option or, in the case of a call option on a security it owns, to free itself to sell the underlying security or to write another call on the security, or protect a security from being called in an unexpected market rise. Any profits from a closing purchase transaction in the case of a call option on a security a Fund owns may be offset by a decline in the value of the underlying security. Conversely, because increases in the market price of a call option will generally reflect increases in the market price of the underlying security, any loss resulting from a closing purchase transaction relating to a call option on a security a Fund owns is likely to be offset in whole or in part by unrealized appreciation of the underlying security owned by the Fund. A Fund may not be able to close out a call option that it has previously written. A Fund may write put options in order to enhance its current return by taking a long directional position as to a security or index of securities. By writing a put option, the Fund assumes the risk that it may be required to purchase the underlying security for an exercise price higher than its then current market value, resulting in a potential capital loss unless the security later appreciates in value. A Fund may terminate a put option that it has written before it expires by entering into a closing purchase transaction. Any loss from this transaction may be partially or entirely offset by the premium received on the terminated option. A Fund may not be able to close out a put option that it has previously written.
When a Fund writes a call or put option, an amount equal to the premium received is recorded as a liability. Premiums received from writing options which expire are treated as realized gains. Premiums received from writing options which are exercised or closed are added to the proceeds or offset against the amount paid on the underlying investment to determine the realized gain or loss.
Purchasing put and call options. A Fund may purchase put options to protect portfolio holdings against a decline in market value of a security or securities held by it. A Fund may also purchase a put option hoping to profit from an anticipated decline in the value of the underlying security. If the Fund holds the security underlying the option, the option premium and any transaction costs will reduce any profit the Fund might have realized had it sold the underlying security instead of buying the put option. A Fund may purchase call options to hedge against an increase in the price of securities that the Fund wants ultimately to buy. A Fund may also purchase a call option as a long directional investment hoping to profit from an anticipated increase in the value of the underlying security. In order for a call option to be profitable, the market price of the underlying security must rise sufficiently above the exercise price to cover the premium and transaction costs. These costs will reduce any profit the Fund might have realized had it bought the underlying security at the time it purchased the call option.
When a Fund purchases an option, it runs the risk that it will lose its entire investment in the option in a relatively short period of time, unless the Fund exercises the option or enters into a closing sale transaction before the option’s expiration. If the price of the underlying security does not rise (in the case of a call) or fall (in the case of a put) to an extent sufficient to cover the option premium and transaction costs, the Fund will lose part or all of its investment in the option. This contrasts with an investment by a Fund in the underlying security, since the Fund will not realize a loss if the security’s price does not change. Premiums paid for purchasing options that expire are treated as realized losses.
OTC Options. OTC options purchased or sold by a Fund are not traded on securities or options exchanges or backed by clearinghouses. Rather, they are entered into directly between a Fund and the counterparty to the option. In the case of an OTC option purchased by the Fund, the value of the option to the Fund will depend on the willingness and ability of the option writer to perform its obligations to the Fund. In addition, OTC options may not be transferable and there may be little or no secondary market for them, so they may be considered illiquid. It may not be possible to enter into closing transactions with respect to OTC options or otherwise to terminate such options, and as a result a Fund may be required to remain obligated on an unfavorable OTC option until its expiration. OTC options are valued using prices supplied by a primary pricing source, selected pursuant to procedures approved by the Trustees.
Rights and Warrants. A Fund may purchase or hold warrants or rights in order to gain exposure to the underlying security without owning the security, including, for example, cases where the Fund hopes to lock in the price today of a security it may wish to purchase in the future. Warrants generally give the holder the right, but not the obligation, to buy a security at a stated price. In order for a warrant to be profitable, the market price of the underlying security must rise sufficiently above the exercise price to cover any premium and transaction costs. Rights may similarly confer on the holder the right to purchase or acquire securities, including
TABLE OF CONTENTS
| | Notes to Financial Statements (Continued) | |
through participation in a so-called rights offering. Bonds may be issued with warrants or other rights attached to purchase or acquire equity or other debt securities, typically of the bond issuer. The market prices of bonds with warrants or rights attached to purchase equity securities or bonds may, to some degree, reflect changes in the values of the underlying securities.
When a Fund purchases or otherwise acquires warrants or other rights, it runs the risk that it will lose its entire investment in the warrants or rights, unless the Fund exercises the warrant or right, acquires the underlying securities, or enters into a closing transaction before expiration. If the price of the underlying security does not rise to an extent sufficient to cover any premium and transaction costs, the Fund will lose part or all of its investment. Any premiums or purchase price paid for warrants or other rights that expire are treated as realized losses. Warrants and similar rights differ from options in that they are typically written by the issuer of the security underlying the warrant or right. Although some warrants and rights may be non-transferable, others may be traded over-the-counter or on an exchange.
Hybrid Instruments
A hybrid instrument may be a debt security, preferred stock, warrant, convertible security, certificate of deposit, or other evidence of indebtedness on which a portion of or all interest payments, and/or the principal or stated amount payable at maturity, redemption, or retirement, is determined by reference to one or more underlying assets, indexes, economic factors, or other benchmarks. Because hybrid instruments may be designed to provide indirect exposures to virtually any type of derivative instrument, a Fund may invest in a hybrid instrument for any purpose it might engage in derivatives transactions. Hybrid instruments may take a number of forms, including, for example, debt instruments with interest or principal payments or redemption terms determined by reference to the value of an index, security, or other measure at a future time, preferred stock with dividend rates determined by reference to the value of a currency, or convertible securities where the conversion terms relate to a particular commodity. The risks of investing in a hybrid instrument may, depending on the nature of the instrument, reflect a combination of the risks of investing in securities, options, futures, currencies or other types of investments, and will depend upon the terms of the instrument. Such risks generally depend upon factors unrelated to the operations or credit quality of the issuer of the hybrid instrument, and may not be foreseen by the purchaser, such as financial or market developments, economic and political events, the supply and demand of the underlying assets, and interest rate movements. Hybrid instruments may be highly volatile and their use by a Fund may not be successful. The terms of a hybrid instrument may create investment leverage. Hybrid instruments are typically privately issued, presenting credit risk of the issuer, and may be highly illiquid and difficult to value.
Bank Loans
A Fund may invest in bank loans including, for example, corporate loans, loan participations, direct debt, bank debt, and bridge debt. A Fund may invest in a loan by lending money to a borrower directly as part of a syndicate of lenders. In a syndicated loan, the agent that originated and structured the loan typically administers and enforces the loan on behalf of the syndicate. Failure by the agent to fulfill its obligations may delay or adversely affect receipt of payment by a Fund. A Fund may also invest in loans through novations, assignments, and participation interests. In a novation, a Fund typically assumes all of the rights of a lending institution in a loan, including the right to receive payments of principal and interest and other amounts directly from the borrower and to enforce its rights as a lender directly against the borrower. When a Fund takes an assignment of a loan, the Fund acquires some or all of the interest of another lender (or assignee) in the loan. In such cases, the Fund may be required generally to rely upon the assignor to demand payment and enforce rights under the loan. If a Fund acquires a participation in the loan, the Fund purchases an indirect interest in a loan held by a third party and the Fund typically will have a contractual relationship only with the third party loan investor, not with the borrower. As a result, a Fund may have the right to receive payments of principal, interest, and any fees to which it is entitled only from the loan investor selling the participation and only upon receipt by such loan investor of such payments from the borrower. In such cases, a Fund assumes the credit risk of both the borrower and the loan investor selling the participation, and the Fund may be unable to realize some or all of the value of its interest in the loan in the event of the insolvency of the third party.
Changes in the financial condition of the borrower or economic conditions or other circumstances may reduce the capacity of the borrower to make principal and interest payments on such instruments and may lead to defaults. The value of any collateral securing a bank loan may decline after the Fund invests, and there is a risk that the value of the collateral may not be sufficient to cover the amount owed to the Fund.
Certain Funds may receive or pay fees associated with investments in bank loans. These fees are included as interest income on a Fund’s Statement of Operations. These fees include all income and expenses associated with the processing and maintenance of these types of loans, including but not limited to consent fee income, amendment fees, and closing fees.
TABLE OF CONTENTS
| | Notes to Financial Statements (Continued) | |
The Global Floating Rate Fund and Global Credit Income Opportunities Fund entered into certain bank loan agreements which are unfunded (“commitments”). The Global Floating Rate Fund and Global Credit Income Opportunities Fund are obligated to fund these commitments at the borrower’s discretion. At September 30, 2024, the Global Floating Rate Fund and Global Credit Income Opportunities Fund had sufficient cash and/or securities to cover these commitments.
Commitment interest is marked to market daily, and any unrealized appreciation (depreciation) is included in the Statement of Assets and Liabilities. Any change in the unrealized appreciation (depreciation) is shown in the Statement of Operations. At September 30, 2024, the Global Floating Rate Fund and Global Credit Income Opportunities Fund had the following commitments:
| | | | | | | | | | | | | | | | |
Global Floating Rate Fund | | | Mehilainen Yhtiot Oy | | | $151,777 | | | $164,404 | | | $168,866 | | | $4,462 |
Global Credit Income Opportunities Fund | | | DG Investment Intermediate Holdings 2, Inc. | | | $41,382 | | | $41,281 | | | $41,202 | | | $(79) |
| | | | | | | | | | | | | | | | |
Repurchase Agreements
Each Fund may enter into repurchase agreements with certain banks and broker-dealers whereby a Fund acquires a security for cash and obtains a simultaneous commitment from the seller to repurchase the security at an agreed upon price and date. A Fund, through its custodian, takes possession of the securities collateralizing the repurchase agreement in a segregated account. Repurchase agreements must be fully collateralized at all times, but involve some risk to a Fund if the other party should default on its obligation and the Fund is delayed or prevented from recovering the collateral, or if the Fund is required to return collateral to a borrower at a time when it may realize a loss on the investment of that collateral.
When-Issued, Delayed-Delivery, Forward Commitment, and To-Be-Announced Transactions
A Fund may enter into when-issued, delayed-delivery, forward commitment, or to-be-announced (“TBA”) transactions (collectively, the “Forward Transactions”) in order to lock in the purchase price of the underlying security, or in order to adjust the interest rate exposure of the Fund’s existing portfolio. In Forward Transactions, a Fund commits to purchase or sell particular securities, with payment and delivery to take place at a future date. In the case of TBA purchase commitments, the unit price and the estimated principal amount are established when the Fund enters into a commitment, with the actual principal amount being within a specified range of the estimate. Although a Fund does not typically pay for the securities in these types of transactions until they are delivered, it immediately assumes the risks of ownership, including the risk of price fluctuation. As a result, each of these types of transactions may create investment leverage in a Fund’s portfolio and increase the volatility of the Fund. If a Fund’s counterparty fails to deliver a security purchased in a Forward Transaction, there may be a loss, and the Fund may have missed an opportunity to make an alternative investment.
These securities are valued on the basis of valuations furnished by a pricing service, selected pursuant to procedures approved by the Trustees, which determines valuations taking into account appropriate factors such as institutional-size trading in similar groups of securities, yield, quality, coupon rate, maturity, type of issue, trading characteristics, and other market data. Securities for which no market quotation is available are valued at fair value by MML Advisers. A Fund records on a daily basis the unrealized appreciation (depreciation) based upon changes in the values of these securities. When a Forward Transaction is closed, a Fund records a realized gain or loss equal to the difference between the value of the transaction at the time it was opened and the value of the transaction at the time it was closed.
TABLE OF CONTENTS
| | Notes to Financial Statements (Continued) | |
Mortgage- and Asset-Backed Securities
A Fund may invest in mortgage- and asset-backed securities. Mortgage-backed securities, including collateralized mortgage obligations and certain stripped mortgage- backed securities, represent a participation in, or are secured by, mortgage loans. Mortgage-backed securities may include securities that are issued or guaranteed by U.S. Government agencies or instrumentalities or other issuers, including private companies. Asset-backed securities are generally structured like mortgage-backed securities, but instead of mortgage loans or interests in mortgage loans, the underlying assets may include such items as consumer loans or receivables and they may be backed by collateralized debt obligations (“CDOs”), including collateralized bond obligations and collateralized loan obligations (“CLOs”).
Investments in mortgage- and asset-backed securities subject a Fund to credit risk, interest rate risk, extension risk, and prepayment risk, among other risks. Certain of these risks may be higher for investments in mortgage-backed securities composed of subprime mortgages and investments in CDOs and CLOs backed by pools of high-risk, below investment grade debt securities. Mortgage-backed and asset-backed securities not issued by a government agency generally involve greater credit risk than securities issued by government agencies. Payment of principal and interest generally depends on the cash flows generated by the underlying assets and the terms of the security. A Fund’s investments in mortgage-backed securities may make a Fund’s net asset value more susceptible to economic, market, political, and other developments affecting the residential and commercial real estate markets and the servicing of mortgage loans secured by real estate properties. Payments on mortgage-backed and many asset-backed investments typically include both interest and partial payment of principal. Principal may also be prepaid voluntarily, or as a result of refinancing or foreclosure. A Fund may have to invest the proceeds from prepaid investments in other investments with less attractive terms and yields. Investments that receive only the interest portion or the principal portion of payments on the underlying assets may be highly volatile. See a Fund’s Portfolio of Investments, if applicable, for mortgage-related and other asset-backed securities as of September 30, 2024.
Municipal Securities
A Fund may invest in municipal securities. Municipal securities are debt obligations or other instruments or participations therein issued by or on behalf of (or that are otherwise treated for U.S. federal tax purposes as issued by or an obligation of) states, territories (including Puerto Rico, Guam, and the U.S. Virgin Islands), and possessions of the United States and the District of Columbia and their political subdivisions, agencies, or instrumentalities. Generally, interest received on municipal securities is exempt from U.S. federal income tax, but it may be subject to state and local taxes.
Issuers in a state, territory, or possession in which a Fund invests may experience significant financial difficulties for various reasons, and municipal securities issued by such issuers (and the instrumentalities thereof) are subject to the risk of unfavorable developments in the relevant municipality. The amount of public information available about municipal securities is generally less than for corporate equities or bonds, meaning that the investment performance of municipal securities may be more dependent on the analytical abilities of the investment adviser than stock or corporate bond investments. The secondary market for municipal securities also tends to be less well-developed and less liquid than many other securities markets, which may limit a Fund’s ability to sell its municipal securities at attractive prices. Because many municipal securities are issued to finance similar projects, conditions in certain industries can significantly affect a Fund and the overall municipal market. The differences between the price at which an obligation can be purchased and the price at which it can be sold may widen during periods of market distress or volatility. Less liquid securities can become more difficult to value and be subject to erratic price movements. The increased presence of non-traditional participants (such as proprietary trading desks of investment banks and hedge funds) or the absence of traditional participants (such as individuals, insurance companies, banks, and life insurance companies) in the municipal markets may lead to greater volatility in the markets because non-traditional participants may trade more frequently or in greater volume. Income from tax-exempt municipal securities could be declared taxable because of changes in tax laws, adverse interpretations by the relevant taxing authority, court decisions, or the non-compliant conduct of the issuer of a security. See a Fund’s Portfolio of Investments, if applicable, for municipal securities as of September 30, 2024.
TABLE OF CONTENTS
| | Notes to Financial Statements (Continued) | |
Securities Lending
Each Fund, other than the MM Clinton Limited Term Municipal Fund, MM Clinton Municipal Fund, and MM Clinton Municipal Credit Opportunities Fund, may lend its securities; however, lending cannot exceed 33% of the total assets of the Fund taken at current value. The Funds’ securities lending activities are governed by a Securities Lending Agency Agreement (“Lending Agreement”) between each Fund and the lending agent (“Agent”). The Lending Agreement authorizes the Agent to lend portfolio securities held by a Fund to approved borrowers (each, a “Borrower”).
Each Fund expects that in connection with any securities on loan, the loan will be secured continuously by collateral consisting of cash (U.S. currency) and/or securities (U.S. Treasury and Agency obligations) adjusted daily to have value at least equal to the current market value of the securities loaned. The market value of the loaned securities is determined at the close of business of a Fund and any additional collateral is delivered to the Fund the next business day. The Funds bear the risk of loss with respect to the investment of cash collateral. As with other extensions of credit, the Funds may bear the risk of delay in recovery of the loaned securities or even loss of rights in the collateral should the Borrower of the securities fail financially. Pursuant to the Lending Agreement, the Agent has provided indemnification to the Funds in the event of default by a Borrower with respect to a loan. The Funds receive compensation for lending their securities in the form of a securities loan fee paid by the Borrower, as well as a share of the income earned on investment of the cash collateral received for the loaned securities. At September 30, 2024, the Funds’ collateral was equal to or greater than 100% of the market value of securities on loan and all of the Funds’ cash collateral was invested in the State Street Navigator Securities Lending Government Money Market Portfolio.
Subject to the terms of the Lending Agreement and the agreement between the Agent and the applicable Borrower (“Borrowing Agreement”), security loans can be terminated by the Agent, the Fund, or the Borrower and the related securities must be returned within the earlier of the customary settlement period for such securities or the period of time specified in the Borrowing Agreement.
The Funds employ the Agent to implement their securities lending program and the Agent receives a fee from the Funds for its services. In addition, the Funds may be required to pay a rebate to the Borrower. Accordingly, a Fund’s compensation for lending its securities is reduced by any such fees or rebate paid to the Agent or Borrower, respectively. Income received by the Funds in securities lending transactions during the year ended September 30, 2024, is reflected as securities lending income on the Statement of Operations.
Accounting for Investment Transactions
Investment transactions are accounted for on the trade date. Realized gains and losses on sales of investments and unrealized appreciation and depreciation of investments are computed by the specific identification cost method. Proceeds received from litigation, if any, are included in realized gains on investment transactions for any investments that are no longer held in the portfolio and as a reduction in cost for investments that continue to be held in the portfolio. Interest income, adjusted for amortization of discounts and premiums on debt securities, is earned from the settlement date and is recorded on the accrual basis. Dividend income is recorded on the ex-dividend date. Withholding taxes on foreign interest, dividends, and capital gains have been provided for in accordance with the applicable country’s tax rules and rates. Foreign dividend income is recorded on the ex-dividend date or as soon as practicable after the Fund determines the existence of a dividend declaration after exercising reasonable due diligence. Distributions received on securities that represent a return of capital or capital gains are recorded as a reduction of cost of investments and/or as a realized gain.
Foreign Currency Translation
The books and records of the Funds are maintained in U.S. dollars. The market values of foreign currencies, foreign securities, and other assets and liabilities denominated in foreign currencies are translated into U.S. dollars at the mean of the buying and selling rates of such currencies against the U.S. dollar at the end of each business day. Purchases and sales of foreign securities and income and expense items are translated at the rates of exchange prevailing on the respective dates of such transactions. The Funds do not isolate that portion of the results of operations arising from changes in the exchange rates from that portion arising from changes in the market prices of securities. Net realized foreign currency gains and losses resulting from changes in exchange rates include foreign currency gains and losses between trade date and settlement date on investment securities transactions, foreign currency transactions, and the difference between the amounts of dividends or interest recorded on the books of the Funds and the amount actually received.
TABLE OF CONTENTS
| | Notes to Financial Statements (Continued) | |
Allocation of Operating Activity
In maintaining the records for the Funds, the income and expense accounts are allocated daily to each class of shares. Investment income and loss, and unrealized and realized gains or losses are prorated among the classes of shares based on the relative net assets of each. Expenses are allocated to each class of shares depending on the nature of the expenditures. Administration and service fees, if any, which are directly attributable to a class of shares, are charged to that class’s operations. Expenses of a Fund not directly attributable to the operations of any specific class of shares of the Fund are prorated among the classes to which the expense relates based on relative net assets.
Foreign Securities
The Global Credit Income Opportunities Fund invests a significant amount of its assets in foreign securities and the Emerging Markets Debt Blended Total Return Fund invests substantially all of its assets in foreign securities. The Global Floating Rate Fund may also invest in foreign securities. The other Funds may also invest in foreign securities. Foreign securities, including American Depositary Receipts, are subject to additional risks compared to securities of U.S. issuers, including international trade, currency, political, regulatory, public health, and diplomatic risks. In addition, fluctuations in currency exchange rates may favorably or unfavorably affect the values of foreign securities and the price of a Fund’s shares. Emerging markets securities are subject to greater risks than securities issued in developed foreign markets, including less liquidity, less stringent investor protection and disclosure standards, less reliable settlement practices, greater price volatility, higher relative rates of inflation, greater political, economic, and social instability, greater custody and operational risks, greater risk of new or inconsistent government treatment of or restrictions on issuers and instruments, and greater volatility in currency exchange rates, and are more susceptible to environmental problems.
Market Risk
The value of a Fund’s portfolio securities may decline, at times sharply and unpredictably, as a result of unfavorable market-induced changes affecting particular industries, sectors, or issuers. Stock and bond markets can decline significantly in response to issuer, market, economic, industry, political, regulatory, geopolitical, public health, and other conditions, as well as investor perceptions of these conditions. A Fund is subject to risks affecting issuers, such as management performance, financial leverage, industry problems, and reduced demand for goods or services.
Federal Income Tax
It is each Fund’s intent to continue to comply with the provisions of Subchapter M of the Internal Revenue Code of 1986, as amended (the “Code”), applicable to a regulated investment company. Under such provisions, the Funds would not be subject to U.S. federal income taxes on their ordinary income and net realized capital gains to the extent they are distributed or deemed to have been distributed to their shareholders. Therefore, the Funds have not made any provision for U.S. federal income tax.
Dividends and Distributions to Shareholders
Dividends from net investment income are declared daily and paid monthly. Dividends from net investment income may also be distributed at other times throughout the year as required to satisfy tax or regulatory requirements. Distributions of any net realized capital gains of each Fund are declared and paid annually and at other times as may be required to satisfy tax or regulatory requirements.
Distributions to shareholders are recorded on the ex-dividend date. Income and capital gain distributions are determined in accordance with income tax regulations, which may differ from generally accepted accounting principles. As a result, net investment income and net realized capital gains on investment transactions for a reporting period may differ significantly from distributions during such period.
TABLE OF CONTENTS
| | Notes to Financial Statements (Continued) | |
3.
| Investment Advisory Fees and Other Transactions |
Investment Advisory Fees and Investment Subadvisers
MML Advisers, a wholly-owned subsidiary of Massachusetts Mutual Life Insurance Company (“MassMutual”), serves as investment adviser to each Fund. Under the investment advisory agreements between MML Advisers and the Trust on behalf of each Fund, MML Advisers is responsible for providing investment management services for each Fund. In return for these services, MML Advisers receives investment advisory fees, based upon each Fund’s average daily net assets, computed and accrued daily and payable monthly, at the following annual rates:
| | | | | |
MM Clinton Limited Term Municipal Fund+ | | | 0.24% on the first $500 million; and
0.23% on any excess over $500 million | |
MM Clinton Municipal Fund+ | | | 0.35% on the first $500 million; and
0.34% on any excess over $500 million | |
MM Clinton Municipal Credit Opportunities Fund+ | | | 0.48% on the first $500 million; and
0.47% on any excess over $500 million | |
Global Floating Rate Fund | | | 0.65% | |
Global Credit Income Opportunities Fund | | | 0.75% | |
Emerging Markets Debt Blended Total Return Fund | | | 0.75% | |
| | | | | |
+
| Commenced operations on February 1, 2024. |
MML Advisers has entered into investment subadvisory agreements with Barings LLC (“Barings”), a wholly-owned subsidiary of MM Asset Management Holding LLC, itself a wholly-owned subsidiary of MassMutual Holding LLC, a controlled subsidiary of MassMutual, on behalf of certain Funds. These agreements provide that Barings manage the investment and reinvestment of assets of these Funds. Barings receives a subadvisory fee from MML Advisers, based upon each Fund’s average daily net assets, at the following annual rates:
| | | | |
Global Floating Rate Fund* | | | 0.30% |
Global Credit Income Opportunities Fund* | | | 0.30% |
Emerging Markets Debt Blended Total Return Fund* | | | 0.35% |
| | | | |
*
| Baring International Investment Limited (“BIIL”), a wholly-owned subsidiary of Barings, serves as a sub-subadviser of the Fund. BIIL receives a sub-subadvisory fee from Barings, based upon a portion of the subadvisory fee Barings receives from MML Advisers, in an amount equal to the following percentage of the subadvisory fee received by Barings: 35% of the subadvisory fee for Global Floating Rate Fund, 35% of the subadvisory fee for Global Credit Income Opportunities Fund, and 50% of the subadvisory fee for Emerging Markets Debt Blended Total Return Fund. |
MML Advisers has also entered into investment subadvisory agreements for certain Funds with the unaffiliated investment subadviser(s) shown in the following table. MML Advisers pays a subadvisory fee to each of these subadvisers based upon the aggregate net assets under management which include (1) the average daily net assets of the specified Fund which it manages, and, if applicable, (2) the average daily net assets of other Funds or accounts of MML Advisers or its affiliates for which the subadviser provides subadvisory services.
| | | | |
MM Clinton Limited Term Municipal Fund
MM Clinton Municipal Fund
MM Clinton Municipal Credit Opportunities Fund | | | Clinton Investment Management, LLC
Clinton Investment Management, LLC
Clinton Investment Management, LLC |
| | | | |
The Funds’ subadvisory fees are paid monthly by MML Advisers out of the investment advisory fees previously disclosed above.
TABLE OF CONTENTS
| | Notes to Financial Statements (Continued) | |
Administration Fees
Under an Administrative and Shareholder Services Agreement between the Trust and MML Advisers, on behalf of each Fund, MML Advisers is obligated to provide certain administrative and shareholder services. In return for these services, MML Advisers receives an administrative services fee, based upon the average daily net assets of the applicable class of shares of the Funds, at the following annual rates:
| | | | | | | | | | | | | |
MM Clinton Limited Term Municipal Fund+ | | | None | | | 0.10% | | | 0.10% | | | N/A |
MM Clinton Municipal Fund+ | | | None | | | 0.10% | | | 0.10% | | | N/A |
MM Clinton Municipal Credit Opportunities Fund+ | | | None | | | 0.10% | | | 0.10% | | | N/A |
Global Floating Rate Fund | | | None | | | 0.07% | | | 0.04% | | | 0.03% |
Global Credit Income Opportunities Fund | | | None | | | 0.05% | | | 0.06% | | | 0.03% |
Emerging Markets Debt Blended Total Return Fund | | | None | | | 0.06% | | | 0.02% | | | None |
| | | | | | | | | | | | | |
+
| Commenced operations on February 1, 2024. |
Distribution and Service Fees
MML Distributors, LLC (the “Distributor”) acts as distributor to each Fund. Pursuant to a 12b-1 Plan adopted by the Trust, Class A shares of each Fund pay an annual fee of 0.25% of the average daily net assets of the class; and Class C shares of each applicable Fund pay an annual fee of 1.00% of the average daily net assets of the class, to the Distributor. Such payments compensate the Distributor for services provided and expenses incurred by it for purposes of promoting the sale of the relevant class of shares, reducing redemptions of shares, or maintaining or improving services provided to each Fund’s shareholders. The Distributor is a wholly-owned subsidiary of MassMutual.
Expense Caps and Waivers
Effective July 1, 2024, MML Advisers has agreed to cap the fees and expenses of the Funds noted below (other than extraordinary legal and other expenses, Acquired Fund Fees and Expenses#, interest expense, expenses related to borrowings, securities lending, leverage, taxes, and brokerage, short sale dividend and loan expense, or other non-recurring or unusual expenses such as organizational expenses and shareholder meeting expenses, as applicable) through January 31, 2026, based upon the average daily net assets of the applicable class of shares of the Funds, as follows:
| | | | | | | | | | | | | |
Emerging Markets Debt Blended Total Return Fund | | | 0.89% | | | 0.95% | | | 1.16% | | | 1.89% |
| | | | | | | | | | | | | |
#
| Acquired Fund Fees and Expenses are borne indirectly by a Fund through investments in other pooled investment vehicles. |
Prior to July 1, 2024, MML Advisers agreed to cap the fees and expenses of the Funds noted below (other than extraordinary legal and other expenses, Acquired Fund Fees and Expenses#, interest expense, expenses related to borrowings, securities lending, leverage, taxes, and brokerage, short sale dividend and loan expense, or other non-recurring or unusual expenses such as organizational expenses and shareholder meeting expenses, as applicable), based upon the average daily net assets of the applicable class of shares of the Funds, as follows:
| | | | | | | | | | | | | |
Emerging Markets Debt Blended Total Return Fund | | | 0.95% | | | 0.95% | | | 1.20% | | | 1.95% |
| | | | | | | | | | | | | |
#
| Acquired Fund Fees and Expenses are borne indirectly by a Fund through investments in other pooled investment vehicles. |
MML Advisers has agreed to cap the fees and expenses of the Funds noted below (other than extraordinary legal and other expenses, Acquired Fund Fees and Expenses#, interest expense, expenses related to borrowings (with the exception of interest and borrowing expenses related to the Fund’s dedicated line of credit for the Global Floating Rate Fund and Global Credit Income
TABLE OF CONTENTS
| | Notes to Financial Statements (Continued) | |
Opportunities Fund), securities lending, leverage, taxes, and brokerage, short sale dividend and loan expense, or other non-
recurring or unusual expenses such as organizational expenses and shareholder meeting expenses, as applicable) through
January 31, 2025, based upon the average daily net assets of the applicable class of shares of the Funds, as follows:
| | | | | | | | | | | | | |
MM Clinton Limited Term Municipal Fund+ | | | 0.29% | | | 0.39% | | | 0.64% | | | N/A |
MM Clinton Municipal Fund+ | | | 0.41% | | | 0.51% | | | 0.76% | | | N/A |
MM Clinton Municipal Credit Opportunities Fund+ | | | 0.54% | | | 0.64% | | | 0.89% | | | N/A |
Global Floating Rate Fund | | | 0.75% | | | 0.75% | | | 1.00% | | | 1.75% |
Global Credit Income Opportunities Fund | | | 0.85% | | | 0.90% | | | 1.16% | | | 1.95% |
| | | | | | | | | | | | | |
#
| Acquired Fund Fees and Expenses are borne indirectly by a Fund through investments in other pooled investment vehicles. |
+
| Commenced operations on February 1, 2024. |
Expense caps and waiver amounts are reflected as a reduction of expenses on the Statements of Operations.
Deferred Compensation
Trustees of the Funds who are not officers or employees of MassMutual may elect to defer receipt of their annual fees in accordance with terms of a Non-Qualified Deferred Compensation Plan. Amounts deferred shall accrue interest or earnings and shall be recorded on the Funds’ books as other liabilities. Deferred compensation is included within Payables for Trustees’ fees and expenses in the Statements of Assets and Liabilities.
Other
Certain officers and trustees of the Funds may also be employees of MassMutual. The compensation of a trustee who is not an employee of MassMutual is borne by the Funds.
The following table shows beneficial ownership of Funds’ shares by related parties at September 30, 2024:
| | | | |
MM Clinton Limited Term Municipal Fund | | | 100.0% |
MM Clinton Municipal Fund | | | 98.9% |
MM Clinton Municipal Credit Opportunities Fund | | | 99.6% |
Global Floating Rate Fund | | | 87.7% |
Global Credit Income Opportunities Fund | | | 86.2% |
Emerging Markets Debt Blended Total Return Fund | | | 87.7% |
| | | | |
TABLE OF CONTENTS
| | Notes to Financial Statements (Continued) | |
4.
| Purchases and Sales of Investments |
Cost of purchases and proceeds from sales of investment securities (excluding short-term investments) for the year ended September 30, 2024, were as follows:
| | | | | | | |
MM Clinton Limited Term Municipal Fund | | | $9,466,875 | | | $71,127,311 | | | $9,191,635 | | | $23,415,268 |
MM Clinton Municipal Fund | | | 5,785,313 | | | 82,746,648 | | | 5,657,937 | | | 32,395,459 |
MM Clinton Municipal Credit Opportunities Fund | | | 9,466,875 | | | 102,353,780 | | | 9,213,733 | | | 52,613,045 |
Global Floating Rate Fund | | | — | | | 77,556,531 | | | — | | | 137,690,752 |
Global Credit Income Opportunities Fund | | | — | | | 83,327,158 | | | — | | | 75,403,489 |
Emerging Markets Debt Blended Total Return Fund | | | — | | | 20,433,201 | | | — | | | 41,434,461 |
| | | | | | | | | | | | | |
The Funds may purchase from, or sell securities to, other affiliated Funds under procedures adopted by the Trustees. These procedures have been designed to ensure that cross trades conducted by the Funds comply with Rule 17a-7 under the 1940 Act. The Funds did not have any cross trade activity during the year.
TABLE OF CONTENTS
| | Notes to Financial Statements (Continued) | |
5.
| Capital Share Transactions |
Changes in shares outstanding for each Fund were as follows:
| | | | |
MM Clinton Limited Term Municipal Fund Class I+
|
Sold | | | 4,980,000 | | | $ 49,800,000 |
Issued as reinvestment of dividends | | | — | | | — |
Redeemed | | | — | | | — |
Net increase (decrease) | | | 4,980,000 | | | $49,800,000 |
MM Clinton Limited Term Municipal Fund Class Y+
|
Sold | | | 10,000 | | | $100,000 |
Issued as reinvestment of dividends | | | — | | | — |
Net increase (decrease) | | | 10,000 | | | $100,000 |
MM Clinton Limited Term Municipal Fund Class A+
|
Sold | | | 10,000 | | | $100,000 |
Issued as reinvestment of dividends | | | — | | | — |
Redeemed | | | — | | | — |
Net increase (decrease) | | | 10,000 | | | $100,000 |
MM Clinton Municipal Fund Class I+
|
Sold | | | 4,980,000 | | | $49,800,000 |
Issued as reinvestment of dividends | | | — | | | — |
Redeemed | | | — | | | — |
Net increase (decrease) | | | 4,980,000 | | | $49,800,000 |
MM Clinton Municipal Fund Class Y+
|
Sold | | | 87,726 | | | $875,000 |
Issued as reinvestment of dividends | | | 47 | | | 471 |
Net increase (decrease) | | | 87,773 | | | $875,471 |
MM Clinton Municipal Fund Class A+
|
Sold | | | 10,000 | | | $100,000 |
Issued as reinvestment of dividends | | | — | | | — |
Redeemed | | | — | | | — |
Net increase (decrease) | | | 10,000 | | | $100,000 |
MM Clinton Municipal Credit Opportunities Fund Class I+
|
Sold | | | 4,980,000 | | | $49,800,000 |
Issued as reinvestment of dividends | | | — | | | — |
Redeemed | | | — | | | — |
Net increase (decrease) | | | 4,980,000 | | | $49,800,000 |
MM Clinton Municipal Credit Opportunities Fund Class Y+
|
Sold | | | 20,142 | | | $200,000 |
Issued as reinvestment of dividends | | | 100 | | | 986 |
Net increase (decrease) | | | 20,242 | | | $200,986 |
MM Clinton Municipal Credit Opportunities Fund Class A+
|
Sold | | | 19,933 | | | $197,500 |
Issued as reinvestment of dividends | | | 83 | | | 822 |
Redeemed | | | — | | | — |
Net increase (decrease) | | | 20,016 | | | $198,322 |
| | | | | | | |
TABLE OF CONTENTS
| | Notes to Financial Statements (Continued) | |
| | | | | | | |
Global Floating Rate Fund Class I
|
Sold | | | 1,142,967 | | | $10,058,099 | | | 1,621 | | | $14,073 |
Issued as reinvestment of dividends | | | 258,503 | | | 2,268,137 | | | 607,368 | | | 5,259,627 |
Redeemed | | | (4,946,156) | | | (43,532,449) | | | (2,555,829) | | | (22,203,486) |
Net increase (decrease) | | | (3,544,686) | | | $(31,206,213) | | | (1,946,840) | | | $(16,929,786) |
Global Floating Rate Fund Class Y |
Sold | | | 1,934,948 | | | $16,995,203 | | | 2,748,368 | | | $23,886,652 |
Issued as reinvestment of dividends | | | 836,488 | | | 7,342,378 | | | 1,228,132 | | | 10,609,440 |
Redeemed | | | (6,188,430) | | | (54,335,895) | | | (14,521,701) | | | (124,717,088) |
Net increase (decrease) | | | (3,416,994) | | | $(29,998,314) | | | (10,545,201) | | | $(90,220,996) |
Global Floating Rate Fund Class A++ |
Sold | | | 392,949 | | | $3,457,171 | | | 476,446 | | | $4,103,604 |
Issued as reinvestment of dividends | | | 194,276 | | | 1,703,071 | | | 261,060 | | | 2,247,597 |
Redeemed | | | (584,304) | | | (5,128,608) | | | (3,980,884) | | | (34,046,209) |
Net increase (decrease) | | | 2,921 | | | $31,634 | | | (3,243,378) | | | $(27,695,008) |
Global Floating Rate Fund Class C |
Sold | | | 3,458 | | | $30,123 | | | 2,951 | | | $25,149 |
Issued as reinvestment of dividends | | | 38,149 | | | 333,351 | | | 43,389 | | | 373,362 |
Redeemed | | | (114,375) | | | (999,734) | | | (242,746) | | | (2,084,751) |
Net increase (decrease) | | | (72,768) | | | $(636,260) | | | (196,406) | | | $(1,686,240) |
Global Credit Income Opportunities Fund Class I |
Sold | | | — | | | $— | | | — | | | $— |
Issued as reinvestment of dividends | | | 36,802 | | | 283,989 | | | 54,318 | | | 409,082 |
Redeemed | | | (25,840) | | | (200,000) | | | (402,360) | | | (3,016,348) |
Net increase (decrease) | | | 10,962 | | | $83,989 | | | (348,042) | | | $(2,607,266) |
Global Credit Income Opportunities Fund Class Y |
Sold | | | 2,582,510 | | | $20,050,548 | | | 990,553 | | | $7,493,074 |
Issued as reinvestment of dividends | | | 172,756 | | | 1,333,058 | | | 229,376 | | | 1,726,010 |
Redeemed | | | (2,152,644) | | | (16,367,665) | | | (3,542,818) | | | (26,787,974) |
Net increase (decrease) | | | 602,622 | | | $5,015,941 | | | (2,322,889) | | | $(17,568,890) |
Global Credit Income Opportunities Fund Class A++ |
Sold | | | 870,082 | | | $6,729,332 | | | 2,453,939 | | | $18,589,975 |
Issued as reinvestment of dividends | | | 934,556 | | | 7,214,111 | | | 696,363 | | | 5,253,285 |
Redeemed | | | (362,756) | | | (2,812,238) | | | (1,131,734) | | | (8,614,405) |
Net increase (decrease) | | | 1,441,882 | | | $11,131,205 | | | 2,018,568 | | | $15,228,855 |
Global Credit Income Opportunities Fund Class C |
Sold | | | 73,374 | | | $566,185 | | | 17,472 | | | $134,258 |
Issued as reinvestment of dividends | | | 28,028 | | | 216,207 | | | 31,079 | | | 234,160 |
Redeemed | | | (139,956) | | | (1,077,062) | | | (204,738) | | | (1,549,151) |
Net increase (decrease) | | | (38,554) | | | $(294,670) | | | (156,187) | | | $(1,180,733) |
| | | | | | | | | | | | | |
TABLE OF CONTENTS
| | Notes to Financial Statements (Continued) | |
| | | | | | | |
Emerging Markets Debt Blended Total Return Fund
Class I |
Sold | | | — | | | $— | | | — | | | $— |
Issued as reinvestment of dividends | | | 7,690 | | | 58,185 | | | — | | | — |
Redeemed | | | (84,726) | | | (640,000) | | | — | | | — |
Net increase (decrease) | | | (77,036) | | | $(581,815) | | | — | | | $— |
Emerging Markets Debt Blended Total Return Fund
Class Y |
Sold | | | 781,303 | | | $5,791,337 | | | 1,003,749 | | | $7,363,524 |
Issued as reinvestment of dividends | | | 156,467 | | | 1,169,782 | | | 238,394 | | | 1,739,158 |
Redeemed | | | (3,411,711) | | | (25,794,409) | | | (3,299,366) | | | (23,938,660) |
Net increase (decrease) | | | (2,473,941) | | | $(18,833,290) | | | (2,057,223) | | | $(14,835,978) |
Emerging Markets Debt Blended Total Return Fund
Class A++ |
Sold | | | 637,860 | | | $4,716,839 | | | 268,794 | | | $1,830,900 |
Issued as reinvestment of dividends | | | 14,157 | | | 105,972 | | | 19,811 | | | 144,470 |
Redeemed | | | (822,379) | | | (6,128,563) | | | (458,136) | | | (3,206,694) |
Net increase (decrease) | | | (170,362) | | | $(1,305,752) | | | (169,531) | | | $(1,231,324) |
Emerging Markets Debt Blended Total Return Fund
Class C |
Sold | | | — | | | $— | | | 3,403 | | | $25,000 |
Issued as reinvestment of dividends | | | 1,337 | | | 10,004 | | | 2,628 | | | 19,194 |
Redeemed | | | (24,942) | | | (186,821) | | | (35,508) | | | (258,646) |
Net increase (decrease) | | | (23,605) | | | $(176,817) | | | (29,477) | | | $(214,452) |
| | | | | | | | | | | | | |
+
| Fund commenced operations on February 1, 2024. |
++
| Class L shares were renamed Class A shares on February 1, 2024. |
Unless waived, purchases of Class A shares are subject to a front-end sales charge of up to 5.50% of the amount purchased. A portion of the front-end sales charge may be retained by the Distributor. The Distributor retained the following amounts during the year ended September 30, 2024:
| | | | |
Global Floating Rate Fund | | | $ 3,765 |
Global Credit Income Opportunities Fund | | | 36,183 |
Emerging Markets Debt Blended Total Return Fund | | | 700 |
| | | | |
Unless waived, redemptions of Class A shares made within 18 months of purchase from initial investments of $1 million or more (or $500,000 or more for holders of Class A shares of the Global Floating Rate Fund, Global Credit Income Opportunities Fund, and Emerging Markets Debt Blended Total Return Fund prior to February 1, 2024), or $250,000 or more for municipal bond funds, and redemptions of Class C shares made within 12 months of purchase are subject to a contingent deferred sales charge of 1.00% of the amount redeemed. The Distributor receives all contingent deferred sales charges. The Distributor retained $2 for the Global Floating Rate Fund during the period ended September 30, 2024.
TABLE OF CONTENTS
| | Notes to Financial Statements (Continued) | |
With respect to Class A and Class C shares, the Distributor may pay an up-front commission to financial intermediaries through which sales are made as described in the Funds’ Prospectus.
6.
| Federal Income Tax Information |
At September 30, 2024, the aggregate cost of investments and the unrealized appreciation (depreciation) in the value of all investments owned by the Fund(s), as computed on a U.S. federal income tax basis, were as follows:
| | | | | | | | | | | | | |
MM Clinton Limited Term Municipal Fund | | | $49,267,473 | | | $351,993 | | | $(104,551) | | | $247,442 |
MM Clinton Municipal Fund | | | 49,943,704 | | | 286,482 | | | (128,277) | | | 158,205 |
MM Clinton Municipal Credit Opportunities Fund | | | 49,199,401 | | | 599,983 | | | (88,778) | | | 511,205 |
Global Floating Rate Fund | | | 129,933,837 | | | 2,549,257 | | | (7,500,560) | | | (4,951,303) |
Global Credit Income Opportunities Fund | | | 157,512,678 | | | 4,378,793 | | | (7,038,110) | | | (2,659,317) |
Emerging Markets Debt Blended Total Return Fund | | | 30,084,686 | | | 1,988,664 | | | (4,094,756) | | | (2,106,092) |
| | | | | | | | | | | | | |
Net capital loss carryforwards may be applied against any net realized taxable gains in succeeding years. Capital losses may be carried forward indefinitely, and retain the character of the original loss.
At September 30, 2024, the following Fund(s) had accumulated capital loss carryforwards:
| | | | | | | |
MM Clinton Limited Term Municipal Fund | | | $(320,142) | | | $— |
MM Clinton Municipal Fund | | | (221,016) | | | — |
MM Clinton Municipal Credit Opportunities Fund | | | (624,706) | | | — |
Global Floating Rate Fund | | | (6,834,902) | | | (26,734,399) |
Global Credit Income Opportunities Fund | | | (5,958,114) | | | (30,289,693) |
Emerging Markets Debt Blended Total Return Fund* | | | (9,200,568) | | | (26,472,011) |
| | | | | | | |
*
| A portion of these amounts are subject to IRC 382-383 which is carried forward to future years to offset future realized gains subject to certain limitations. |
The following Fund(s) elected to defer to the fiscal year beginning October 1, 2024, late year ordinary losses:
| | | | |
Global Floating Rate Fund | | | $1,478,413 |
Global Credit Income Opportunities Fund | | | 409,320 |
| | | | |
Generally accepted accounting principles in the United States of America require that only distributions in excess of tax basis earnings and profits be reported in the financial statements as a return of capital.
TABLE OF CONTENTS
| | Notes to Financial Statements (Continued) | |
The tax character of distributions (including capital gain dividends, if any, designated pursuant to Section 852 of the Code) paid during the year ended September 30, 2024, was as follows:
| | | | | | | | | | | | | |
MM Clinton Limited Term Municipal Fund | | | $872,293 | | | $23,571 | | | $ — | | | $ — |
MM Clinton Municipal Fund | | | 964,243 | | | 10,140 | | | — | | | — |
MM Clinton Municipal Credit Opportunities Fund | | | 1,065,680 | | | 18,793 | | | — | | | — |
Global Floating Rate Fund | | | — | | | 8,341,987 | | | — | | | 4,170,448 |
Global Credit Income Opportunities Fund | | | — | | | 10,706,844 | | | — | | | 735,481 |
Emerging Markets Debt Blended Total Return Fund | | | — | | | 2,551,871 | | | — | | | — |
| | | | | | | | | | | | | |
The tax character of distributions (including capital gain dividends, if any, designated pursuant to Section 852 of the Code) paid during the year ended September 30, 2023, was as follows:
| | | | | | | | | | |
Global Floating Rate Fund | | | $ 19,132,432 | | | $ — | | | $ 670,548 |
Global Credit Income Opportunities Fund | | | 10,342,131 | | | — | | | 108,618 |
Emerging Markets Debt Blended Total Return Fund | | | — | | | — | | | 3,284,964 |
| | | | | | | | | | |
Capital accounts within the financial statements are periodically adjusted for permanent differences between book and tax accounting. These adjustments have no impact on net assets or the results of operations. Temporary book and tax accounting differences will reverse in subsequent periods. At September 30, 2024, temporary book and tax accounting differences were primarily attributable to the deferral of wash sale losses, deferred Trustee compensation, and other temporary basis adjustments.
At September 30, 2024, the components of distributable earnings on a tax basis were as follows:
| | | | | | | | | | | | | | | | | | | |
MM Clinton Limited Term Municipal Fund | | | $201,160 | | | $— | | | $(320,142) | | | $(203,641) | | | $247,442 | | | $(75,181) |
MM Clinton Municipal Fund | | | 203,812 | | | — | | | (221,016) | | | (213,452) | | | 158,205 | | | (72,451) |
MM Clinton Municipal Credit Opportunities Fund | | | 231,332 | | | — | | | (624,706) | | | (232,952) | | | 511,205 | | | (115,121) |
Global Floating Rate Fund | | | — | | | — | | | (35,047,714) | | | (25,147) | | | (4,969,048) | | | (40,041,909) |
Global Credit Income Opportunities Fund | | | — | | | — | | | (36,657,127) | | | (180,344) | | | (2,562,016) | | | (39,399,487) |
Emerging Markets Debt Blended Total Return Fund | | | — | | | 54,442 | | | (35,672,579) | | | (106,714) | | | (2,112,354) | | | (37,837,205) |
| | | | | | | | | | | | | | | | | | | |
The Funds did not have any unrecognized tax benefits at September 30, 2024, nor were there any increases or decreases in unrecognized tax benefits for the year then ended. The Funds recognize interest and penalties, if any, related to unrecognized tax benefits as an income tax expense in the Statements of Operations. During the year ended September 30, 2024, the Funds did not incur any such interest or penalties. The Funds are subject to examination by U.S. federal and state tax authorities for returns filed for the prior three fiscal years, or the returns filed to date for Funds in existence less than three years. Foreign taxes are provided for based on the Funds’ understanding of the tax rules and rates that exist in the foreign markets in which they invest.
TABLE OF CONTENTS
| | Notes to Financial Statements (Continued) | |
The Trust (the “Borrower”) on behalf of the Global Floating Rate Fund and Global Credit Income Opportunities Fund has entered into a Credit Agreement (the “Credit Agreement”) with State Street Bank and Trust Company (the “Bank”). The Credit Agreement provides for a revolving credit facility of $85,000,000, $150,000,000 prior to July 11, 2024, (the “Facility Amount”) to be utilized for temporary or emergency purposes to fund shareholder redemptions or for other short-term liquidity purposes. Per the Credit Agreement, outstanding principal on the loan shall bear interest at a variable rate per annum equal to the higher of (a) the Federal Funds Rate as in effect on the day of the borrowing plus 1.25% and (b) the Overnight Bank Funding Rate as in effect on the day of the borrowing plus 1.25%. In addition, the Borrower shall pay to the Bank a commitment fee at the rate of 0.25% per annum on the daily unused portion of the Facility Amount.
The Global Floating Rate Fund utilized a portion of the Facility Amount on multiple dates from the period January 17, 2024 through January 25, 2024 with an average borrowing amount of $15,666,667. The average interest rate during the period was 6.58% and total interest paid amounted to $25,772. The commitment fees made by the Funds are recorded in the accompanying Statements of Operations as Commitment & Service Expenses.
Under the Funds’ organizational documents, current and former Trustees and Officers are provided with specified rights to indemnification against liabilities arising in connection with the performance of their duties to the Funds, and shareholders are indemnified against personal liability for obligations of the Funds. In the normal course of business, the Funds may also enter into contracts that provide general indemnifications. The Funds’ maximum exposure under these arrangements is unknown as this would be dependent on future claims that may be made against the Funds. The risk of material loss from such claims is considered remote.
TABLE OF CONTENTS
| | | |
| | Report of Independent Registered Public Accounting Firm | |
| | | |
To the Board of Trustees of MassMutual Advantage Funds and Shareholders of MassMutual Clinton Limited Term Municipal Fund, MassMutual Clinton Municipal Fund, MassMutual Clinton Municipal Credit Opportunities Fund, MassMutual Global Floating Rate Fund, MassMutual Global Credit Income Opportunities Fund and MassMutual Emerging Markets Debt Blended Total Return Fund:
Opinion on the Financial Statements and Financial Highlights
We have audited the accompanying statements of assets and liabilities of MassMutual Clinton Limited Term Municipal Fund, MassMutual Clinton Municipal Fund, MassMutual Clinton Municipal Credit Opportunities Fund, MassMutual Global Floating Rate Fund, MassMutual Global Credit Income Opportunities Fund and MassMutual Emerging Markets Debt Blended Total Return Fund (the “Funds”), each a fund of MassMutual Advantage Funds, including the portfolios of investments, as of September 30, 2024, the related statements of operations, the statements of changes in net assets, the financial highlights for the periods indicated in the table below, and the related notes. In our opinion, the financial statements and financial highlights present fairly, in all material respects, the financial position of each of the Funds as of September 30, 2024, and the results of their operations, the changes in their net assets, and the financial highlights for the periods indicated in the table below, in conformity with accounting principles generally accepted in the United States of America.
| | | | | | | | | | | | |
| | MassMutual Clinton Limited Term Municipal Fund, MassMutual Clinton Municipal Fund, MassMutual Clinton Municipal Credit Opportunities Fund
| | | For the period February 1, 2024 (commencement of operations) through September 30, 2024 | | | For the period February 1, 2024 (commencement of operations) through September 30, 2024 | | | For the period February 1, 2024 (commencement of operations) through September 30, 2024 | |
| | MassMutual Global Floating Rate Fund, MassMutual Global Credit Income Opportunities Fund, and MassMutual Emerging Markets Debt Blended Total Return Fund
| | | For the year ended September 30, 2024 | | | For each of the two years in the period ended September 30, 2024 | | | For each of the three years in the period ended September 30, 2024, the period from July 1, 2021 through September 30, 2021, and each of the two years in the period ended June 30, 2021. | |
| | | | | | | | | | | | |
Basis for Opinion
These financial statements and financial highlights are the responsibility of the Funds’ management. Our responsibility is to express an opinion on the Funds’ financial statements and financial highlights based on our audits. We are a public accounting firm registered with the Public Company Accounting Oversight Board (United States) (PCAOB) and are required to be independent with respect to the Funds in accordance with the U.S. federal securities laws and the applicable rules and regulations of the Securities and Exchange Commission and the PCAOB.
We conducted our audits in accordance with the standards of the PCAOB. Those standards require that we plan and perform the audit to obtain reasonable assurance about whether the financial statements and financial highlights are free of material misstatement, whether due to error or fraud. The Funds are not required to have, nor were we engaged to perform, an audit of their internal control over financial reporting. As part of our audits we are required to obtain an understanding of internal control over financial reporting but not for the purpose of expressing an opinion on the effectiveness of the Funds’ internal control over financial reporting. Accordingly, we express no such opinion.
Our audits included performing procedures to assess the risks of material misstatement of the financial statements and financial highlights, whether due to error or fraud, and performing procedures that respond to those risks. Such procedures included examining, on a test basis, evidence regarding the amounts and disclosures in the financial statements and financial highlights. Our audits also included evaluating the accounting principles used and significant estimates made by management, as well as evaluating the overall presentation of the financial statements and financial highlights. Our procedures included confirmation of securities owned as of September 30, 2024, by correspondence with the custodian, brokers and agent banks; when replies were not received from brokers or agent banks, we performed other auditing procedures. We believe that our audits provide a reasonable basis for our opinion.
/s/ Deloitte & Touche LLP
Boston, Massachusetts
November 26, 2024
We have served as the auditor of one or more MassMutual investment companies since 1995.
TABLE OF CONTENTS
| | | |
| | Federal Tax Information (Unaudited) | |
| | | |
Dividends Received Deduction
Each Fund reports the maximum amount allowable of its net taxable income as eligible for the corporate dividend received deduction.
Qualified Dividend Income
Under Section 854(b)(2) of the Code, the Fund(s) hereby designate the maximum amounts as qualified dividends for purposes of the maximum rate under Section 1(h)(11) of the Code for the year ended September 30, 2024.
The Fund(s) intend to pass through the maximum amount allowable as Section 163(j) Interest Dividends as defined in the Treasury Regulations §1.163(j)-1(b).
TABLE OF CONTENTS
Item 8. Changes in and Disagreements with Accountants for Open-End Management Investment Companies.
Not applicable.
TABLE OF CONTENTS
Item 9. Proxy Disclosures for Open-End Management Investment Companies.
Not applicable.
TABLE OF CONTENTS
Item 10. Remuneration Paid to Directors, Officers, and Others of Open-End Management Investment Companies.
This information is disclosed as part of the financial statements for each Fund as part of Item 7: Financial Statements and Financial Highlights for Open-End Management Investment Companies.
TABLE OF CONTENTS
Item 11. Statement Regarding Basis for Approval of Investment Advisory Contract.
Trustees’ Approval of Investment Advisory Contracts
At their meetings in May and June 2024, the Contract Committee (the “Committee”) and the Trustees, including the Trustees who are not “interested persons” (as such term is defined in the 1940 Act) of the Trust, MML Advisers, or the subadvisers (the “Independent Trustees”), considered and re-approved the existing advisory and subadvisory agreements (collectively, the “Contracts”)for each of the Global Floating Rate Fund, Global Credit Income Opportunities Fund, and Emerging Markets Debt Blended Total Return Fund, as applicable. In preparation for the meetings, the Trustees requested, and MML Advisers and the subadvisers provided in advance, certain materials relevant to the consideration of the Contracts (the “Meeting Materials”). In all of their deliberations, the Trustees were advised by independent counsel.
The Committee received in advance of the meetings (i) a memorandum from MML Advisers discussing the nature and quality of the services it provides as investment adviser to the Funds; (ii) a profitability analysis prepared by MML Advisers; and (iii) a fee and performance study report (the “Third-Party Report”) with respect to each Fund prepared by an independent third-party vendor (the “Third-Party”). The Third-Party Report provided detailed comparative advisory fee, total expense, and performance information for each Fund to assist the Committee in its evaluation of the Contracts. The Committee also considered information presented to it throughout the year regarding MML Advisers and each of the subadvisers.
The Committee considered the nature, scope, and quality of services MML Advisers provides to the Funds, including: (i) the financial condition, stability, and business strategy of MML Advisers; (ii) the capabilities of MML Advisers with respect to regulatory compliance and its ability to monitor compliance with the investment policies of the Funds; (iii) MML Advisers’ ability to provide investment oversight and provide for administrative and shareholder services to the Funds; and (iv) the experience and qualifications of the personnel of MML Advisers that perform, or oversee the performance of, the services provided to the Funds, and the needs of the Funds for administrative and shareholder services. The Committee noted that it had received in the Meeting Materials or during the course of the past year: (i) detailed information regarding MML Advisers’ ability to provide investment oversight and provide for administrative and shareholder services to the Funds; and (ii) a wide range of information about the subadvisers and their personnel with responsibility for providing services to the Funds, as applicable, and the fees payable to each subadviser by MML Advisers. MML Advisers reviewed with the Committee in detail the work MML Advisers does in its oversight roles, the expertise it brings to these roles, the size of its teams, and the financial commitment it has made to provide those services.
The Committee then reviewed and considered, for each Fund separately, the detailed information presented in the Third-Party Report regarding: (i) Fund expenses, including, among other things, both the Fund’s net advisory fee and total net expense ratio against peer funds; and (ii) the Fund’s relative performance (over various time periods against funds in its “category” and a benchmark index). In connection with the Committee’s review, MML Advisers provided commentary and analysis regarding each Fund’s expenses and performance and a recommendation as to the action to be taken by the Committee. Throughout the discussion, MML Advisers responded to Committee members’ questions and provided additional information concerning each Fund.
The Committee reviewed the expense and performance information for each Fund. (References to any performance periods are to periods ended December 31, 2023, except as otherwise noted. In all cases, the comparative expense information is that of a Fund’s “peer group” and the comparative performance information is that of a Fund’s “performance category.”)
The Committee considered that the total net expense ratio for the Global Floating Rate Fund was at the 58th percentile of its peer group and its net advisory fee was in the 29th percentile of its peer group.
As to the Global Credit Income Opportunities Fund, the Committee considered MML Advisers’ statement that the Fund’s total net expense ratio and net advisory fee were each at the 86th percentile of the Fund’s peer group, and that they were ten basis points and 16 basis points above median, respectively. The Committee further considered that MML Advisers waived 21 basis points during the year due to the Fund’s expense cap. The Committee considered MML Advisers’ view that the Fund’s investment strategy is unique and that the Fund has generally performed favorably, improving to the 24th percentile of its performance category in the one-year period.
As to the Emerging Markets Debt Blended Total Return Fund, the Committee considered MML Advisers’ statement that the Fund’s total net expense ratio was at the 93rd percentile of its peer group. The Committee also considered MML Advisers’ proposal to lower the Fund’s expense cap. The Committee considered MML Advisers’ statement that, if the proposed expense cap had been implemented in the prior year, the cap would have increased the effective expense waiver to 19 basis points. The Committee further considered MML Advisers’ statement that the Fund’s proposed net expense ratio is expected to fall from six basis points above to in-line with the peer group median, and the net advisory fee is expected to fall from 12 to six basis points above the peer group median.
The Committee determined on the basis of these factors that the levels of the Funds’ net advisory fees, in light of the total net expenses of the Funds generally, were consistent with the continuation of the Contracts.
TABLE OF CONTENTS
The Committee considered that each of the Funds achieved three-year investment performance above the medians of their performance categories, except the Emerging Markets Debt Blended Total Return Fund.
As to the Emerging Markets Debt Blended Total Return Fund, the Committee considered that the Fund performed at the 94th percentile of its performance category for the three-year period. The Committee considered that, although underperformance due to volatile market conditions in 2021 and 2022 negatively impacted the Fund’s three-year performance, the Fund has generally performed favorably over the long term, including five-year performance at the 23rd percentile of its performance category. The Committee also considered MML Advisers’ positive statements about the Fund’s potentially strong positioning in the future.
The Committee determined on the basis of these factors and on other factors and information considered by the Committee that the Funds’ performance, for the various periods presented, were generally consistent with the continuation of the Contracts.
The Committee also reviewed and considered information included in the Meeting Materials, or discussed at the meeting and during the course of the year, concerning economies of scale and the profitability of MML Advisers’ advisory relationship with the various Funds, including: (i) a description of MML Advisers’ revenues from the Funds (including advisory fees and administrative and shareholder services fees, as applicable) and the expense allocation methodology employed by MML Advisers; and (ii) profitability information with respect to each individual Fund. The discussions included consideration of the intangible benefits derived by MML Advisers and its affiliates resulting from their relationships with the Funds and any so-called “fallout benefits” to MML Advisers (which were not considered to be substantial in any event), such as any reputational value derived from serving as investment adviser to the Funds, and benefits accruing to subadvisers (including sub-subadvisers, as applicable) due to so-called “soft-dollar arrangements.”
Prior to the votes being taken to approve the Contracts, the Committee met separately in executive session to discuss the appropriateness of such contracts. The Committee weighed the foregoing matters in light of the advice given to them by their independent legal counsel as to the law applicable to the review of investment advisory contracts. In arriving at a decision, the Committee did not identify any single matter as all-important or controlling. The foregoing summary does not detail all of the matters considered.
As to each of the Funds, the Committee concluded that: (i) it was satisfied with the nature, extent, and quality of services provided, and expected to be provided in the future, under the Contracts, including the level of MML Advisers’ oversight of each Fund and the subadvisory process; (ii) MML Advisers’ levels of profitability from its relationship with the various Funds are not excessive and the advisory fees payable under the advisory agreements and each Fund’s total net expenses are fair and reasonable; (iii) the investment processes, research capabilities, and philosophies of the subadvisers appear well suited to the Funds, as applicable, given their investment objectives and policies; (iv) either the relative or absolute performance of a Fund (in each case, taking into account the applicable investment strategy and risk profile of the Fund), or the steps MML Advisers has proposed in respect of the underperformance of a Fund, are sufficient to warrant continuation of the Contracts for each of the Funds; and (v) the terms of the Contracts are fair and reasonable with respect to each Fund and are in the best interests of each Fund’s shareholders.
Item 12. Disclosure of Proxy Voting Policies and Procedures for Closed-End Management Investment Companies.
Not applicable.
Item 13. Portfolio Managers of Closed-End Management Investment Companies.
Not applicable.
Item 14. Purchases of Equity Securities by Closed-End Management Investment Company and Affiliated Purchasers.
Not applicable.
Item 15. Submission of Matters to a Vote of Security Holders.
Not applicable.
Item 16. Controls and Procedures.
(a) The Registrant’s Principal Executive Officer and Principal Financial Officer have concluded that the Registrant’s disclosure controls and procedures (as defined in Rule 30a-3(c) under the Investment Company Act of 1940, as amended (the “1940 Act”) (17 CFR 270.30a-3(c))) are effective, as of a date within 90 days of the filing date of this Form N-CSR, to provide reasonable assurance that the information required to be disclosed by the Registrant on Form N-CSR is recorded, processed, summarized, and reported within the time periods specified in the SEC’s rules and forms, based on their evaluation of these disclosure controls and procedures required by Rule 30a-3(b) under the 1940 Act (17 CFR 270.30a-3(b)) and Rules 13a-15(b) or 15d-15(b) under the Securities Exchange Act of 1934 (17 CFR 240.13a-15(b) or 240.15d-15(b)).
(b) There were no changes in the Registrant’s internal control over financial reporting (as defined in Rule 30a-3(d) under the 1940 Act (17 CFR 270.30a-3(d))) that occurred during the period covered by this report that has materially affected, or is reasonably likely to materially affect, the Registrant’s internal control over financial reporting.
Item 17. Disclosure of Securities Lending Activities for Closed-End Management Investment Companies.
Not applicable.
Item 18. Recovery of Erroneously Awarded Compensation.
Not applicable.
Item 19. Exhibits.
(a)(1) Code of Ethics (Item 2) Attached.
(a)(2) Any policy required by the listing standards adopted pursuant to Rule 10D-1 under the Exchange Act of 1934 (17 CFR 240.10D-1) - Not applicable.
(a)(3) Certifications of the Principal Executive Officer and Principal Financial Officer of the Registrant as required by Rule 30a-2(a) under the 1940 Act (17 CFR 270.30a-2(a)) are attached hereto as Exhibit 99CERT.
(a)(4) Any written solicitation to purchase securities under Rule 23c-1 under the 1940 Act (17 CFR 270.23c-1) – Not applicable.
(a)(5) Change in Registrant’s independent public accountant – Not applicable.
(b) Certifications pursuant to Section 906 of the Sarbanes-Oxley Act of 2002 as required by Rule 30a-2(b), under the 1940 Act (17 CFR 270.30a-2(b)), Rule 15d-14(b) under the Securities Exchange Act of 1934 (17 CFR 240.15d-14(b)) and Section 1350 of Chapter 63 of Title 18 of the United States Code (18 U.S.C. 1350) are attached hereto as Exhibit 99.906CERT.
SIGNATURES
Pursuant to the requirements of the Securities Exchange Act of 1934 and the Investment Company Act of 1940, the registrant has duly caused this report to be signed on its behalf by the undersigned, thereunto duly authorized.
| (Registrant) | MassMutual Advantage Funds | |
| | | |
| By (Signature and Title) | /s/ Douglas Steele | |
| | Douglas Steele, President and Principal Executive Officer | |
Pursuant to the requirements of the Securities Exchange Act of 1934 and the Investment Company Act of 1940, this report has been signed below by the following persons on behalf of the registrant and in the capacities and on the dates indicated.
| By (Signature and Title) | /s/ Douglas Steele | |
| | Douglas Steele, President and Principal Executive Officer | |
| By (Signature and Title) | /s/ Renée Hitchcock | |
| | Renée Hitchcock, Treasurer and Principal Financial Officer | |