UNITED STATES
SECURITIES AND EXCHANGE COMMISSION
Washington, D.C. 20549
FORM N-CSR
CERTIFIED SHAREHOLDER REPORT OF REGISTERED
MANAGEMENT INVESTMENT COMPANIES
| Investment Company Act file number | 811-23703 |
| MassMutual Advantage Funds | |
| (Exact name of registrant as specified in charter) | |
| 1295 State Street, Springfield, MA | 01111 |
| (Address of principal executive offices) | (Zip code) |
| Andrea Anastasio |
| 1295 State Street, Springfield, MA 01111 |
| (Name and address of agent for service) |
| Registrant's telephone number, including area code: | (413) 744-1000 |
| Date of fiscal year end: | 9/30/2023 | �� |
| Date of reporting period: | 9/30/2023 |
Item 1. Reports to Stockholders.
| (a) | The Report to Stockholders is attached herewith. |

Table of Contents | |
This material must be preceded or accompanied by a current prospectus (or summary prospectus, if available) for the applicable MassMutual Funds. Investors should consider a Fund’s investment objective, risks, and charges and expenses carefully before investing. This and other information about the investment company is available in the prospectus (or summary prospectus, if available). Read it carefully before investing.
[THIS PAGE INTENTIONALLY LEFT BLANK]
MassMutual Funds Annual Report – Economic and Market Overview (Unaudited) |
September 30, 2023
Global markets continue to reward retirement investors
During the fiscal year ended September 30, 2023, U.S. stocks were up over 21%, in a market environment where the U.S. Federal Reserve (the “Fed”) raised interest rates by nearly 3% in an effort to combat heightened inflation by curtailing economic activity. Stocks in foreign developed markets and emerging markets also experienced significant gains during the fiscal year, aided by a weaker U.S. dollar. Global stock gains during the period were driven by a resilient consumer, surprisingly strong economic activity, strong suggestions of a generative artificial intelligence (“AI”) revolution, and investors’ improving earnings expectations. U.S. bond investors experienced slightly positive returns in the rising interest rate environment, fueled by aggressive interest rate hikes by the Fed that were aimed at reducing demand-driven inflationary pressures.
Market highlights
● | For the reporting period from October 1, 2022 through September 30, 2023, U.S. stocks were up over 21%, in a market environment where economic activity remained strong, despite the Fed continuing to raise interest rates in an effort to combat high inflation. |
● | In the fourth quarter of 2022, investors experienced a stock market rally, as fears generally lessened regarding high inflation, high interest rates, high energy prices, and a global recession. |
● | The first quarter of 2023 was a continuation of the prior quarter, aided by the excitement around generative AI. Investors remained generally enthusiastic, notwithstanding a relatively unexpected banking crisis in March, which resulted in the takeover of certain U.S. regional banks by U.S. regulators and the bailout of Credit Suisse Group by the Swiss government. |
● | In the second quarter of 2023, global stocks exhibited strength thanks in part to a resilient U.S. economy, receding inflationary pressures, banking sector stability, and the resolution of the debt ceiling crisis. |
● | The third quarter of 2023 was difficult for global stocks and bonds, as investors grew increasingly concerned over inflation, a possible U.S. government shutdown, and higher prolonged interest rates from the Fed. |
● | Foreign stocks in developed markets and emerging markets also experienced strong gains in the fiscal year, aided by falling energy costs, a resilient consumer, and the weakening of the U.S. dollar. |
● | U.S. bond investors experienced slightly positive returns in the rising interest rate environment, fueled by aggressive Fed interest rate hikes aimed at reducing demand-driven inflationary pressures. |
Market environment
For the fiscal year beginning on October 1, 2022, global stock investors experienced significant gains. During this period, U.S. stock prices rose sharply in response, with the S&P 500 Index® (“S&P 500”)1 entering bull market territory after rising more than 20% from its previous highs. Investors breathed a sigh of relief as the possibility of a recession lessened in the face of robust economic activity and falling inflation during the period. Consumer sentiment rose sharply, up 19.4% in the period,2 aided by lower inflation, low unemployment, and positive wage growth. In MassMutual’s view, the strong economic growth may be unsustainable, as more Americans are borrowing to make ends meet, resulting in consumer loan levels at record highs, having increased by 5.8% year-over-year.3
1 The S&P 500 Index measures the performance of 500 widely held stocks in the U.S. equity market. Standard and Poor’s chooses member companies for the Index based on market size, liquidity, and industry group representation. Included are the stocks of industrial, financial, utility, and transportation companies. Since mid-1989, this composition has been more flexible and the number of issues in each sector has varied. The Index is market capitalization-weighted. The Index does not reflect any deduction for fees, expenses, or taxes and cannot be purchased directly by investors.
2 August 2023, University of Michigan: Consumer Sentiment (UMCSENT), retrieved from FRED, Federal Reserve Bank of St. Louis;
https://fred.stlouisfed.org/series/UMCSENT, October 5, 2023.
3 August 2023, Board of Governors of the Federal Reserve System (US), Consumer Loans, All Commercial Banks [CONSUMER], retrieved from FRED, Federal Reserve Bank of St. Louis; https://fred.stlouisfed.org/series/CONSUMER, October 5, 2023.
1
MassMutual Funds Annual Report – Economic and Market Overview (Unaudited) (Continued) |
As a result, the broad-market S&P 500 rose 21.62% for the period. The technology-heavy NASDAQ Composite Index4 performed even better, rising 26.11% for the period. The more economically sensitive Dow Jones Industrial AverageSM5 was up 19.18% for the period. During the reporting period, small-cap stocks underperformed their larger-cap peers, while growth stocks outperformed their value brethren. The information technology and communication services sectors were each up by 35% or more for the period. The utilities sector was the weakest performer for the fiscal year, down 7.02% over the period, hurt by the sharp rise in interest rates that made the stock dividend yields less attractive. The real estate sector also ended the period in the red, declining 1.84%.
Developed international markets, as measured by the MSCI EAFE® Index,6 outperformed their domestic peers, ending the fiscal year up 25.65%. Emerging-market stocks, as measured by the MSCI Emerging Markets Index,7 also rose sharply, ending up 11.70% for the period. Investors shifted back into developed international and emerging-market stocks during the period in response to lower-than-expected energy costs, a more resilient consumer, and stronger-than-expected economic activity.
Bond yields rose sharply during the fiscal year, with the 10-year U.S. Treasury bond yield rising from 3.83% on October 1, 2022 to close the period at 4.59%. During the period, rising yields produced falling bond prices, and bond index returns suffered. The Bloomberg U.S. Aggregate Bond Index8 ended the period up 0.64%. Investment-grade corporate bonds fared better. The Bloomberg U.S. Corporate Bond Index,9 which tracks investment-grade corporate bonds, ended the period with a 3.65% gain. The Bloomberg U.S. Corporate High-Yield Bond Index10 also ended the period higher, rising 10.28%.
Review and maintain your strategy
At MassMutual, looking out for each other isn’t just a nice idea; it’s how we’ve done business for more than 170 years. Since 1851, we’ve had a single purpose: to help people secure their future and protect the ones they love. While the current market volatility, including the reality of market sell-offs, can test an investor’s mettle, we’d like to remind you that, as a retirement investor, it’s important to maintain perspective and have realistic expectations about the future performance of your investment accounts. As described in this report, financial markets can reverse suddenly, with little or no notice. That’s why we continue to believe that retirement investors should create and maintain a plan that focuses on their goals, how long they have to invest, and
4 The NASDAQ Composite Index measures the performance of all domestic and international based common type stocks listed on the NASDAQ Stock Market. It includes common stocks, ordinary shares, ADRs, shares of beneficial interest or limited partnership interests, and tracking stocks. The Index is market capitalization-weighted. The Index does not reflect any deduction for fees, expenses, or taxes and cannot be purchased directly by investors.
5 The Dow Jones Industrial Average Index measures the performance of stocks of 30 U.S. blue-chip companies covering all industries with the exception of transportation and utilities. It is price-weighted. The Index does not reflect any deduction for fees, expenses, or taxes and cannot be purchased directly by investors.
6 The MSCI EAFE Index measures the performance of the large- and mid-cap segments of developed markets, excluding the U.S. and Canada equity securities. It is free float-adjusted market-capitalization weighted. The Index does not reflect any deduction for fees or expenses and cannot be purchased directly by investors.
7 The MSCI Emerging Markets Index measures the performance of the large- and mid-cap segments of emerging market equity securities. It is free float-adjusted market-capitalization weighted. The Index does not reflect any deduction for fees or expenses and cannot be purchased directly by investors.
8 The Bloomberg U.S. Aggregate Bond Index measures the performance of investment grade, U.S. dollar-denominated, fixed-rate taxable bond market securities, including Treasuries, government-related and corporate securities, mortgage-backed securities (MBS) (agency fixed-rate and hybrid ARM pass-throughs), asset-backed securities (ABS), and commercial mortgage-backed securities (CMBS). It rolls up into other Bloomberg flagship indexes, such as the multi-currency Global Aggregate Index and the U.S. Universal Index, which includes high yield and emerging markets debt. The Index does not reflect any deduction for fees, expenses, or taxes and cannot be purchased directly by investors.
9 The Bloomberg U.S. Corporate Bond Index measures the performance of the investment grade, U.S. dollar-denominated, fixed-rate, taxable corporate bond market. It includes U.S. dollar-denominated securities publicly issued by U.S. and non-U.S. industrial, utility, and financial issuers that meet specified maturity, liquidity, and quality requirements. The Index does not reflect any deduction for fees, expenses, or taxes and cannot be purchased directly by investors.
10 The Bloomberg U.S. Corporate High-Yield Bond Index measures the performance of U.S. dollar-denominated, non-investment grade, fixed-rate, taxable corporate bonds, including corporate bonds, fixed-rate bullet, putable, and callable bonds, SEC Rule 144A securities, original issue zeros, pay-in-kind bonds, fixed-rate and fixed-to-floating capital securities. The Index does not reflect any deduction for fees, expenses, or taxes and cannot be purchased directly by investors.
2
MassMutual Funds Annual Report – Economic and Market Overview (Unaudited) (Continued) |
how comfortable they are with market volatility. Our multi-managed and sub-advised mutual funds tap into the deep expertise of seasoned asset managers who are committed to helping long-term investors prepare for retirement – in all market conditions. As always, we recommend that you work with a personal financial professional, who can help you define an investment strategy that aligns with your comfort level with respect to market volatility, how long you have to save and invest, and your specific financial goals. Thank you for your confidence in MassMutual.
The information provided is the opinion of MML Investment Advisers, LLC (“MML Advisers”) and is subject to change without notice. It is not to be construed as tax, legal, or investment advice. Of course, past performance does not guarantee future results.
Underwriter: MML Distributors, LLC (MMLD), Member FINRA and SIPC (www.FINRA.org and www.SIPC.org), 1295 State Street, Springfield, MA 01111-0001. Investment advisory services are provided to the Funds by MML Advisers. MMLD and MML Advisers are subsidiaries of MassMutual.
©2023 Massachusetts Mutual Life Insurance Company (MassMutual®), Springfield, MA 01111-0001. All rights reserved. www.MassMutual.com.
3
MassMutual Global Floating Rate Fund – Portfolio Manager Report (Unaudited) |
What is the investment approach of MassMutual Global Floating Rate Fund, and who is the Fund’s subadviser?
This Fund seeks a high level of current income with preservation of capital as a secondary goal. Under normal circumstances, the Fund invests at least 80% of its net assets (plus the amount of any borrowings for investment purposes) in income-producing floating rate debt securities, consisting of floating rate loans, bonds, and notes, issued primarily by North American and Western European companies. The Fund’s subadviser is Barings LLC (Barings). In addition, Baring International Investment Limited serves as a sub-subadviser for the Fund.
How did the Fund perform during the 12 months ended September 30, 2023?
The Fund’s Class I shares returned 13.74%, outperforming the 12.47% return of the Credit Suisse Leveraged Loan Index* (the “benchmark”), which is designed to mirror the investable universe of the U.S. dollar-denominated leveraged loan market. The Fund underperformed the 16.44% return of the Credit Suisse Western European Leveraged Loan Index, which is designed to mirror the investable universe of the Western European leveraged loan market, with loans denominated in U.S. and Western European currencies. Finally, the Fund outperformed the 13.35% return of the Custom Global Loan Index, which comprises the market-capitalization weighted average of the Credit Suisse Leveraged Loan Index and the Credit Suisse Western European Leveraged Loan Index.
* Effective February 1, 2023, the Credit Suisse Leveraged Loan Index became the Fund’s primary performance benchmark index because it is an appropriate broad-based securities market index. Information is also provided for the Credit Suisse Western European Leveraged Loan Index and the Custom Global Loan Index, which MML Advisers believes may provide a more useful comparison.
For a discussion on the economic and market environment during the 12-month period ended September 30, 2023, please see the Economic and Market Overview, beginning on page 1.
Subadviser discussion of factors that contributed to the Fund’s performance
For the fiscal year ended September 30, 2023, a combination of modest price appreciation and the return from interest income was the primary driver of performance for the Fund and the benchmark. Since the Fund primarily invests in senior secured loans that have a floating-rate coupon, the return from interest income materially increased during the reporting period, compared to recent fiscal years, due to the increase in short-term base rates. As such, interest income was a primary driver of the elevated total return. Sentiment in the secondary market was generally positive for the asset class, as there was only one month during the reporting period in which the Fund had a negative monthly total return. Though the Fund and the loan market were not immune to the negative sentiment caused by the uncertainty in the regional banking sector during the reporting period, the Fund and the loan market did not have direct exposure to the affected companies, and therefore trading weakness in that respect was limited in the loan market.
To provide some context to relative performance, the Fund’s holdings across rating categories outperformed during the period, with the highest positive impact to relative performance coming from the single-B rating category, as that was the category the Fund had the largest exposure to during the period. Within industry sectors, most of the outperformance was the result of outperformance by the Fund’s holdings within sectors rather than relative sector positioning. Though spread across a wider range of sectors, outperforming sectors included the information technology, health care, and leisure sectors, which included areas of the market that underperformed the prior fiscal year when sentiment was weaker. Partially detracting from relative results was underperformance within the diversified media and manufacturing sectors, as well as the Fund’s cash allocation, given the strong performance for the market during the period. Finally, the Fund typically invests across the North American and European senior secured loan markets. During the period, the Fund’s North American holdings led the outperformance.
At a Fund holdings level, the Fund’s top contributors to total return were Asurion, a provider of technology protection services; Virgin Media, a broadband services provider; and Quest Software, an enterprise software solutions provider. The Fund’s top detractors from total return were CWT, a business travel company; Technicolor, a creative and technology provider for the media industry; and Team Health, a provider of outsourced physician staffing and administrative services.
4
MassMutual Global Floating Rate Fund – Portfolio Manager Report (Unaudited) (Continued) |
Derivatives are securities that derive their value from the performance of one or more other investments and take the form of a contract between two or more parties. Derivatives can be used for hedging, speculation, or both. During the reporting period, the Fund’s derivative usage was limited to currency forwards used to passively hedge currency exposure for non-U.S. dollar-denominated debt back to the Fund’s base currency, which is the U.S. dollar, and did not have a material impact on the Fund’s performance.
Subadviser outlook
Barings observes that the senior secured loan market has been a beneficiary of the increases in short-term interest rates in recent years by exhibiting less price sensitivity to rate increases than fixed-rate markets and a higher contribution to total return from the elevated coupon levels. This provided positive performance for the asset class over the past year. However, in Fund management’s view, it is also supportive of the relative value for the senior secured loan market into the new year, as yield levels remain elevated driven by the higher coupons.
From a fundamental perspective, default activity during the reporting period increased from the prior period, as companies navigated the impacts from higher inflation and financing costs. However, in Fund management’s view, default rates in the coming fiscal year are expected to remain manageable and near longer-term averages, as many borrowers from the market have been focused on proactively addressing their capital needs and utilizing a supportive primary market to refinance their debt and push out maturities. As a result, Barings continues to view relative value for the market as compelling through a combination of elevated yields and manageable defaults, although as some uncertainty remains, a credit-intensive approach will, in Fund management’s opinion, be critical in the months ahead.
MassMutual Global Floating Rate Fund | |
Bank Loans | 87.7% |
Corporate Debt | 3.9% |
Common Stock | 1.0% |
Warrants | 0.0% |
Total Long-Term Investments | 92.6% |
Short-Term Investments and Other Assets and Liabilities | 7.4% |
Net Assets | 100.0% |
5
MassMutual Global Floating Rate Fund – Portfolio Manager Report (Unaudited) (Continued) |
GROWTH OF $10,000 INVESTMENT - Class I

The graph above illustrates a representative class of the Fund’s historical performance+ for the past 10 fiscal years or since inception (for Funds lacking 10-year records) in comparison to its benchmark index, as well as one or more additional indexes, if applicable. The performance of other share classes will be greater than or less than the class depicted above.
Average Annual Total Returns+ (for the periods ended 09/30/2023) | ||||
| Inception Date | 1 Year | 5 Years | 10 Years |
Class I | 9/16/2013 | 13.74% | 3.92% | 4.08% |
Class Y | 9/16/2013 | 13.73% | 3.90% | 4.06% |
Class L | 9/16/2013 | 13.61% | 3.65% | 3.79% |
Class L (sales load deducted)* | 9/16/2013 | 9.23% | 3.02% | 3.48% |
Class C | 9/16/2013 | 12.77% | 2.89% | 3.04% |
Class C (CDSC fees deducted)* | 9/16/2013 | 11.77% | 2.89% | 3.04% |
Credit Suisse Leveraged Loan Index# | 12.47% | 4.31% | 4.33% | |
Credit Suisse Western European Leveraged Loan Index | 16.44% | 5.41% | 5.26% | |
Custom Global Loan Index | 13.35% | 4.55% | 4.51% | |
# Benchmark
* Class L (sales load deducted) returns include the 3.00% maximum sales charge and Class C (CDSC fees deducted) returns include the 1.00% maximum contingent deferred sales charge for the first 12 months shown.
+ The Fund is the successor to the Barings Global Floating Rate Fund (the “Predecessor Fund”), a mutual fund with substantially similar investment objectives, policies, and restrictions, as a result of the reorganization of the Predecessor Fund into the Fund on December 13, 2021. The performance provided is that of the Predecessor Fund prior to December 13, 2021, and is that of the Fund after December 13, 2021. Performance shown for Class L shares prior to December 13, 2021 reflects the performance of Class A shares of the Predecessor Fund.
Generally accepted accounting principles require adjustments to be made to the net assets of the Fund at period end for financial reporting purposes only, and as such, the total return based on the unadjusted net asset value per share may differ from the total return reported in the financial highlights.
Performance results in the graph and table are shown both with and without the imposition of the maximum applicable sales charge (if applicable) and reflect the percentage change in net asset value, including reinvestment of dividends and capital gains distributions. Investors should note that the Fund is a professionally managed mutual fund, while the index or indexes shown above are unmanaged, cannot be purchased directly, and, with the exception of any peer group index, do not incur expenses.
Performance data quoted in the graph and table represents past performance; past performance is not predictive of future results. The investment return and principal value of shares of the Fund fluctuate, so your shares, when sold, may be worth more or less than their original cost. Current performance of the Fund may be lower or higher than the performance quoted. The performance shown does not reflect the deduction of taxes, if any, that a shareholder would pay on Fund distributions or the redemption of Fund shares. Performance data current to the most recent month end may be obtained by calling 1-888-309-3539.
Investors should read the Fund’s prospectus with regard to the Fund’s investment objectives, risks, and charges and expenses in conjunction with these financial statements. Employee retirement benefit plans that invest plan assets in the Separate Investment Accounts (SIAs) may be subject to certain charges as set forth in their respective Plan Documents. Total return figures would be lower for the periods presented if they reflected these charges.
6
MassMutual Global Credit Income Opportunities Fund – Portfolio Manager Report (Unaudited) |
What is the investment approach of MassMutual Global Credit Income Opportunities Fund, and who is the Fund’s subadviser?
This Fund seeks an absolute return, primarily through current income and secondarily through capital appreciation. Under normal circumstances, the Fund invests at least 80% of its net assets (plus the amount of any borrowings for investment purposes) in debt instruments (consisting of loans, bonds, and notes). The Fund may invest in a wide range of debt instruments of issuers based in U.S. and non-U.S. markets, including emerging markets, as well as over-the-counter and exchange-traded derivatives. The Fund’s subadviser is Barings LLC (Barings). In addition, Baring International Investment Limited serves as a sub-subadviser for the Fund.
How did the Fund perform during the 12 months ended September 30, 2023?
The Fund’s Class I shares returned 12.17%, outperforming, by a wide margin, the 2.69% return of the Bloomberg Multiverse Index* (the “benchmark”), which measures the performance of bonds in the global fixed-income bond market. It represents the union of the Global Aggregate Index and the Global High-Yield Index and captures investment grade and high yield securities in all eligible currencies. The Fund outperformed, by a wide margin, the 10.58% return** of the 3 Month USD LIBOR (London Interbank Offered Rate), which measures the performance of the U.S. dollar-denominated ICE LIBOR rate with a maturity of 3 months. LIBOR indicates the interest rate that banks pay when they borrow from each other on an unsecured basis. It is used to determine payments made under derivatives by a wide range of counterparties including small businesses, large financial institutions, and public authorities. The Fund outperformed, by a wide margin, the 9.94% return*** of the FTSE 3 Month US T Bill Index****, which measures the performance of the last three 3-month Treasury bill month-end rates.
* Effective July 1, 2023, the Bloomberg Multiverse Index became the Fund’s performance benchmark index rather than the 3 Month USD LIBOR plus 500 basis points (5.00%) because LIBOR expired on June 30, 2023 and the Bloomberg Multiverse Index represents an appropriate broad-based securities market index for the Fund.
** Return shown for the 3 Month USD LIBOR reflects the Index’s return for the reporting period, plus 500 basis points (5.00%). From July 1, 2023-September 30, 2023, the 3 Month USD LIBOR was calculated using the Synthetic 3 Month USD LIBOR of CME Term Secured Overnight Financing Rate plus the International Swaps and Derivatives Association/Alternative Reference Rates Committee Spread Adjustment of 26 basis points.
*** Return shown for the FTSE 3 Month US T Bill Index reflects the Index’s return for the reporting period, plus 500 basis points (5.00%).
**** Effective July 1, 2023, the FTSE 3 Month US T Bill Index plus 500 basis points (5.00%) became the Fund’s performance supplemental index because the FTSE 3 Month US T Bill Index plus 500 basis points (5.00%) closely represents the Fund’s investment strategy.
For a discussion on the economic and market environment during the 12-month period ended September 30, 2023, please see the Economic and Market Overview, beginning on page 1.
Subadviser discussion of factors that contributed to the Fund’s performance
For the fiscal year ended September 30, 2023, a combination of modest price appreciation and the return from interest income was the primary driver of performance for the Fund. The Fund held a meaningful exposure to floating-rate assets, including senior secured loans and collateralized loan obligations (CLOs). As these asset classes have floating-rate coupons, the return from interest income materially increased during the reporting period, compared to recent fiscal years, due to the increase in short-term base rates. As a result, holdings in these markets outperformed the Fund’s holdings in the fixed-rate high yield bond market overall.
The top-performing asset class for the Fund was its CLO holdings, although as the Fund had a smaller allocation to this market during the reporting period, its senior secured loan holdings had a larger contribution to total return.
7
MassMutual Global Credit Income Opportunities Fund – Portfolio Manager Report (Unaudited) (Continued) |
By region, the Fund’s North American senior secured loan holdings outperformed its loan holdings in Europe. Within high yield bonds, the Fund’s European high yield bond holdings outperformed their counterparts in North America and both outperformed holdings in hard currency corporate credits in Asia due to underperformance in the housing sector in China. Despite the detraction from that sector in China, for the Fund as a whole, the housing sector was a marginally positive contributor to total return, with other credits offsetting the detraction.
Looking elsewhere, most sectors in which the Fund was invested during the period finished the period with a positive total return. Top-contributing sectors included the information technology, health care, and energy sectors, with each including some areas of the sector or credits also experiencing some price recovery in addition to income. Finally, given the positive total return across the markets that the Fund invested in, the Fund’s cash exposure was a modest detractor from relative performance.
At the Fund holdings level, the Fund’s top contributors to total return were Global Aircraft Leasing, a global aircraft lessor; Quest Software, an enterprise software solutions provider; and Tullow Oil, a United Kingdom-based exploration and production company. The Fund’s top detractors from total return were Shimao Group Holdings, a China-based real estate development company; Vue Cinemas, a European cinema chain; and Technicolor, a creative and technology provider for the media industry.
Derivatives are securities that derive their value from the performance of one or more other investments and take the form of a contract between two or more parties. Derivatives can be used for hedging, speculation, or both. During the reporting period, derivative usage was primarily limited to currency forwards used to passively hedge currency exposure for non-U.S. dollar-denominated debt back to the Fund’s base currency, which is the U.S. dollar, and did not have a material impact on the Fund’s performance. Other derivative usage was limited to a small position in a put option for hedging purposes and did not have a material impact on the Fund’s performance during the period.
Subadviser outlook
Barings notes that the aftermath of central bank rate hikes over and before the reporting period includes, but is not limited to, elevated yields across credit markets. For fixed-rate markets, such as high yield bonds, the increase in yields has been driven by discounted trading levels, whereas for floating-rate markets, such as senior secured loans and CLOs, it has been the increase in floating-rate coupons. Though high yield credit markets in general performed well during the reporting period, the elevated yields, in Fund management’s view, provide a compelling argument for relative value into the new year. From a fundamental perspective, default activity during the reporting period has increased from the prior period, with slightly higher activity in the senior secured loan market versus the high yield bond market due to the higher rating profile of the high yield bond market and fixed financing costs. However, in Fund management’s view, the volume of defaults in both markets is expected to remain manageable, as high yield borrowers have been focused on proactively addressing their capital needs and utilizing a supportive primary market to refinance their debt to push out maturities. Therefore, while there remains some uncertainty across global economies, Barings believes the relative value remains attractive through a combination of higher yields and manageable defaults, though Fund management views a credit-intensive approach as being critical to navigating the months ahead.
MassMutual Global Credit Income | |
Corporate Debt | 41.5% |
Bank Loans | 41.0% |
Non-U.S. Government Agency Obligations | 9.4% |
Common Stock | 0.5% |
Warrants | 0.0% |
Total Long-Term Investments | 92.4% |
Short-Term Investments and Other Assets and Liabilities | 7.6% |
Net Assets | 100.0% |
8
MassMutual Global Credit Income Opportunities Fund – Portfolio Manager Report (Unaudited) (Continued) |
GROWTH OF $10,000 INVESTMENT - Class I
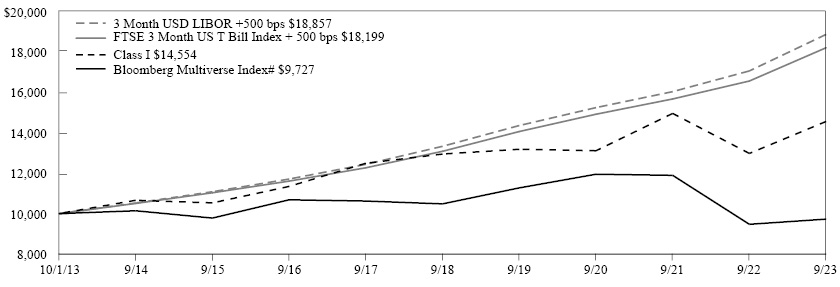
The graph above illustrates a representative class of the Fund’s historical performance+ for the past 10 fiscal years or since inception (for Funds lacking 10-year records) in comparison to its benchmark index, as well as one or more additional indexes, if applicable. The performance of other share classes will be greater than or less than the class depicted above.
Average Annual Total Returns+ (for the periods ended 09/30/2023) | ||||
| Inception Date | 1 Year | 5 Years | 10 Years |
Class I | 9/16/2013 | 12.17% | 2.37% | 3.82% |
Class Y | 9/16/2013 | 12.12% | 2.35% | 3.81% |
Class L | 9/16/2013 | 11.82% | 2.10% | 3.56% |
Class L (sales load deducted)* | 9/16/2013 | 6.39% | 1.27% | 3.16% |
Class C | 9/16/2013 | 10.95% | 1.34% | 2.78% |
Class C (CDSC fees deducted)* | 9/16/2013 | 9.95% | 1.34% | 2.78% |
Bloomberg Multiverse Index# | 2.69% | -1.48% | -0.28% | |
3 Month USD LIBOR +500 bps | 10.58% | 7.19% | 6.55% | |
FTSE 3 Month US T Bill Index + 500 bps | 9.94% | 6.83% | 6.17% | |
# Benchmark
* Class L (sales load deducted) returns include the 4.00% maximum sales charge and Class C (CDSC fees deducted) returns include the 1.00% maximum contingent deferred sales charge for the first 12 months shown.
+ The Fund is the successor to the Barings Global Credit Income Opportunities Fund (the “Predecessor Fund”), a mutual fund with substantially similar investment objectives, policies, and restrictions, as a result of the reorganization of the Predecessor Fund into the Fund on December 13, 2021. The performance provided is that of the Predecessor Fund prior to December 13, 2021, and is that of the Fund after December 13, 2021. Performance shown for Class L shares prior to December 13, 2021 reflects the performance of Class A shares of the Predecessor Fund.
Generally accepted accounting principles require adjustments to be made to the net assets of the Fund at period end for financial reporting purposes only, and as such, the total return based on the unadjusted net asset value per share may differ from the total return reported in the financial highlights.
Performance results in the graph and table are shown both with and without the imposition of the maximum applicable sales charge (if applicable) and reflect the percentage change in net asset value, including reinvestment of dividends and capital gains distributions. Investors should note that the Fund is a professionally managed mutual fund, while the index or indexes shown above are unmanaged, cannot be purchased directly, and, with the exception of any peer group index, do not incur expenses.
Performance data quoted in the graph and table represents past performance; past performance is not predictive of future results. The investment return and principal value of shares of the Fund fluctuate, so your shares, when sold, may be worth more or less than their original cost. Current performance of the Fund may be lower or higher than the performance quoted. The performance shown does not reflect the deduction of taxes, if any, that a shareholder would pay on Fund distributions or the redemption of Fund shares. Performance data current to the most recent month end may be obtained by calling 1-888-309-3539.
Investors should read the Fund’s prospectus with regard to the Fund’s investment objectives, risks, and charges and expenses in conjunction with these financial statements. Employee retirement benefit plans that invest plan assets in the Separate Investment Accounts (SIAs) may be subject to certain charges as set forth in their respective Plan Documents. Total return figures would be lower for the periods presented if they reflected these charges.
9
MassMutual Emerging Markets Debt Blended Total Return Fund – Portfolio Manager Report (Unaudited) |
What is the investment approach of MassMutual Emerging Markets Debt Blended Total Return Fund, and who is the Fund’s subadviser?
This Fund seeks to achieve maximum total return, consistent with preservation of capital and prudent investment management, through high current income generation and, where appropriate, capital appreciation. The Fund invests in debt securities, derivatives, and other instruments that are economically tied to emerging market countries or countries with relatively low gross national product per capita and with the potential for rapid economic growth. Under normal circumstances, the Fund will invest at least 80% of its net assets (plus the amount of any borrowings for investment purposes) in (i) securities denominated in currencies of the emerging market countries, (ii) fixed income securities or debt instruments issued by emerging market entities or sovereign nations, and/or (iii) debt instruments denominated in or based on the currencies, interest rates, or issues of emerging market countries. The Fund focuses its investments in Asia, Africa, the Middle East, Latin America, and the developing countries of Europe. The Fund’s subadviser is Barings LLC (Barings). In addition, Baring International Investment Limited serves as a sub-subadviser for the Fund.
How did the Fund perform during the 12 months ended September 30, 2023?
The Fund’s Class I shares returned 13.57%, outperforming the 8.57% return of the Bloomberg Emerging Markets Hard Currency (USD) Aggregate Index* (the “benchmark”), which measures the performance of USD, EUR, and GBP-denominated debt from sovereign, quasi-sovereign, and corporate Emerging Markets issuers. Country eligibility and classification as Emerging Markets is rules-based and reviewed annually using the World Bank income group and International Monetary Fund country classifications. The Fund outperformed the 11.06% return of the Custom Emerging Markets Debt Blended Total Return Index, which is a blend of 50% JPMorgan Government Bond Index – Emerging Markets Global Diversified (GBI-EMGD), 30% JPMorgan EMBI Global Diversified, and 20% JPMorgan CEMBI Broad Diversified.
* Effective February 1, 2023, the Bloomberg Emerging Markets Hard Currency (USD) Aggregate Index became the Fund’s performance benchmark index rather than the Custom Emerging Markets Debt Blended Total Return Index because the Bloomberg Emerging Markets Hard Currency (USD) Aggregate Index is an appropriate broad-based securities market index and is well aligned with the Fund’s investment strategy.
For a discussion on the economic and market environment during the 12-month period ended September 30, 2023, please see the Economic and Market Overview, beginning on page 1.
Subadviser discussion of factors that contributed to the Fund’s performance
During the fiscal year ended September 30, 2023, broader emerging-market (EM) debt asset classes experienced strong returns for different reasons. In the EM local space, strong returns were led by interest rates, as many emerging-market central banks were starting their monetary easing during the reporting period. Currencies were also additive, though less so against a slightly weaker U.S. dollar compared to the prior fiscal year. In the hard currency space, sovereign and corporate returns were led by spread tightening, while a significant rise in U.S. Treasury yields put pressure on the asset class, causing some detractions. High yield significantly outperformed investment-grade during the reporting period.
The Fund’s local interest rate exposure was additive during the fiscal year, as the Fund was positioned well for the end of the EM central bank tightening cycle and subsequent easing that started in calendar year 2023, given generally well-behaved inflation in many EM economies. Sovereign and corporate hard currency positions were also additive, given the rally seen in both asset classes during the reporting period. The Fund performed well there, given the bias towards high yield credits, specifically in the BB space. On the other hand, currency exposures were a drag on performance. Though the Fund has historically had a long EM foreign exchange trading bias, the individual currency exposures in the Fund did not translate into positive returns during the reporting period.
Derivatives are securities that derive their value from the performance of one or more other investments and take the form of a contract between two or more parties. Derivatives can be used for hedging, speculation, or both. The Fund typically does use derivative instruments in managing its portfolio, both from a hedging perspective as well as for speculation to gain credit risk, local interest rate risk and currency risk. Currency derivatives (primarily currency forwards) were detractors from performance during the reporting period, while interest rate derivatives (U.S. Treasury futures and interest rate swaps) and credit derivatives (short credit default swaps) contributed to performance.
10
MassMutual Emerging Markets Debt Blended Total Return Fund – Portfolio Manager Report (Unaudited) (Continued) |
Subadviser outlook
Barings observes that, looking ahead, risks abound in the form of uncertainty over U.S. Federal Reserve policy, emerging drivers of inflation, and growing political uncertainty. But Fund management observes that it is worth noting that these headwinds are mainly macro-driven, rather than credit risks or default concerns for EM sovereigns and corporates. In particular, Fund management observes that, as of the end of the reporting period, EM credit continues to benefit from relatively healthy fundamentals, especially for higher-quality issuers. As of the end of the reporting period, a number of EM countries were experiencing declining inflation, which in some cases, was allowing central banks to cut rates. This has led Fund management to be more constructive on local interest rates, specifically in countries like Korea, Peru, and the Czech Republic. However, if the U.S. economy remains strong, particularly in the face of weakness in China and Europe, Fund management believes that EM currencies could face headwinds, which could, in turn, limit further rate cutting.
MassMutual Emerging Markets | |
Sovereign Debt Obligations | 58.9% |
Corporate Debt | 34.8% |
Purchased Options | 0.1% |
Total Long-Term Investments | 93.8% |
Short-Term Investments and Other Assets and Liabilities | 6.2% |
Net Assets | 100.0% |
11
MassMutual Emerging Markets Debt Blended Total Return Fund – Portfolio Manager Report (Unaudited) (Continued) |
GROWTH OF $10,000 INVESTMENT - Class I
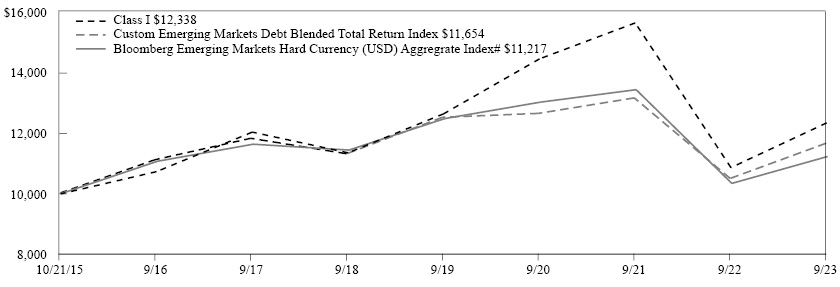
The graph above illustrates a representative class of the Fund’s historical performance+ for the past 10 fiscal years or since inception (for Funds lacking 10-year records) in comparison to its benchmark index, as well as one or more additional indexes, if applicable. The performance of other share classes will be greater than or less than the class depicted above.
Average Annual Total Returns+ (for the periods ended 09/30/2023) | ||||
| Inception Date | 1 Year | 5 Years | Since |
Class I | 10/21/2015 | 13.57% | 1.68% | 2.68% |
Class Y | 10/21/2015 | 13.58% | 1.64% | 2.66% |
Class L | 10/21/2015 | 13.12% | 1.40% | 2.40% |
Class L (sales load deducted)* | 10/21/2015 | 7.64% | 0.57% | 1.88% |
Class C | 10/21/2015 | 12.29% | 0.65% | 1.65% |
Class C (CDSC fees deducted)* | 10/21/2015 | 11.29% | 0.65% | 1.65% |
Bloomberg Emerging Markets Hard Currency (USD) Aggregrate Index# | 8.57% | -0.37% | 1.46% | |
Custom Emerging Markets Debt Blended Total Return Index | 11.06% | 0.60% | 1.94% | |
# Benchmark
* Class L (sales load deducted) returns include the 4.00% maximum sales charge and Class C (CDSC fees deducted) returns include the 1.00% maximum contingent deferred sales charge for the first 12 months shown.
+ The Fund is the successor to the Barings Emerging Markets Debt Blended Total Return Fund (the “Predecessor Fund”), a mutual fund with substantially similar investment objectives, policies, and restrictions, as a result of the reorganization of the Predecessor Fund into the Fund on December 13, 2021. The performance provided is that of the Predecessor Fund prior to December 13, 2021, and is that of the Fund after December 13, 2021. Performance shown for Class L shares prior to December 13, 2021 reflects the performance of Class A shares of the Predecessor Fund.
Generally accepted accounting principles require adjustments to be made to the net assets of the Fund at period end for financial reporting purposes only, and as such, the total return based on the unadjusted net asset value per share may differ from the total return reported in the financial highlights.
Performance results in the graph and table are shown both with and without the imposition of the maximum applicable sales charge (if applicable) and reflect the percentage change in net asset value, including reinvestment of dividends and capital gains distributions. Investors should note that the Fund is a professionally managed mutual fund, while the index or indexes shown above are unmanaged, cannot be purchased directly, and, with the exception of any peer group index, do not incur expenses.
Performance data quoted in the graph and table represents past performance; past performance is not predictive of future results. The investment return and principal value of shares of the Fund fluctuate, so your shares, when sold, may be worth more or less than their original cost. Current performance of the Fund may be lower or higher than the performance quoted. The performance shown does not reflect the deduction of taxes, if any, that a shareholder would pay on Fund distributions or the redemption of Fund shares. Performance data current to the most recent month end may be obtained by calling 1-888-309-3539.
Investors should read the Fund’s prospectus with regard to the Fund’s investment objectives, risks, and charges and expenses in conjunction with these financial statements. Employee retirement benefit plans that invest plan assets in the Separate Investment Accounts (SIAs) may be subject to certain charges as set forth in their respective Plan Documents. Total return figures would be lower for the periods presented if they reflected these charges.
12
MassMutual Global Emerging Markets Equity Fund – Portfolio Manager Report (Unaudited) |
What is the investment approach of MassMutual Global Emerging Markets Equity Fund, and who is the Fund’s subadviser?
This Fund seeks to achieve long-term capital growth. Under normal market conditions, the Fund will invest at least 80% of its net assets (plus the amount of any borrowings for investment purposes) in equity and equity-related securities, including convertible securities, preferred stocks, options, and warrants, of issuers that are economically tied to one or more emerging market countries. The Fund may invest in fixed income securities or debt instruments issued by emerging market entities or sovereign nations. The Fund’s subadviser is Barings LLC (Barings). In addition, Baring International Investment Limited serves as a sub-subadviser for the Fund.
How did the Fund perform during the 12 months ended September 30, 2023?
The Fund’s Class I shares returned 11.84%, outperforming the 11.70% return of the MSCI Emerging Markets Index (the “benchmark”), which measures the performance of the large- and mid-cap segments of emerging market equity securities. It is free float-adjusted market-capitalization weighted.
For a discussion on the economic and market environment during the 12-month period ended September 30, 2023, please see the Economic and Market Overview, beginning on page 1.
Subadviser discussion of factors that contributed to the Fund’s performance
For the fiscal year ended September 30, 2023, in absolute terms, the Fund’s performance was strongest during the first half of the reporting period, reflecting hopes of a strong rebound for the Chinese economy after policymakers relaxed COVID-19 restrictions at the end of calendar year 2022. During this time, markets also reacted positively to signs that interest rates across the U.S. and Europe were potentially reaching a peak, as inflation showed signs of cooling. Emerging markets were weaker throughout the latter six months of the reporting period, as China’s economic recovery showed signs of faltering. However, this was not enough to offset the Fund’s strong returns earlier in the period.
In absolute terms, the Fund’s holdings in the information technology sector were some of the best performers, with the share prices of some companies benefiting from the opportunities presented by generative artificial intelligence. Holdings in the utilities and consumer staples sector declined on an absolute basis. The Fund’s top-performing holdings on a relative basis were Korean multinational Samsung Electronics, South African gold miner AngloGold, and Korean commercial bank Hana Financial. The largest detractors were wind power company China Longyuan Power and ecommerce sites JD.com and Meituan, all of which are listed in Hong Kong.
Value-style equities outperformed their growth counterparts over the reporting period. While this proved to be a meaningful headwind for the Fund’s “growth at a reasonable price” approach, the Fund still managed to outperform relative to the benchmark.
Subadviser outlook
In the short term, Barings believes that global markets are likely to remain volatile as investors weigh up a potential peak in monetary tightening later this year by the U.S. Federal Reserve against a backdrop of deteriorating corporate earnings. In Fund management’s view, the outlook for emerging markets is more constructive, as the policy cycle has also already peaked in many countries and in some is already easing. Barings observes that China’s reopening and policy stimulus would likely help lift economic activity domestically, but also in broader emerging markets, which could support a recovery in corporate earnings in the remainder of 2023 and beyond.
The recent reversal in the U.S. dollar is also an important tailwind for the asset class, which Fund management believes has the potential to continue, as economic activity and inflationary pressures potentially ease in the U.S.
13
MassMutual Global Emerging Markets Equity Fund – Portfolio Manager Report (Unaudited) (Continued) |
MassMutual Global Emerging | |
Taiwan Semiconductor Manufacturing Co. Ltd. | 8.7% |
Samsung Electronics Co. Ltd. | 7.7% |
Tencent Holdings Ltd. | 5.8% |
Alibaba Group Holding Ltd. | 4.3% |
HDFC Bank Ltd. ADR | 3.5% |
Reliance Industries Ltd. GDR | 3.5% |
Axis Bank Ltd. GDR | 2.7% |
Hana Financial Group, Inc. | 2.6% |
Hyundai Motor Co. | 2.1% |
Ping An Insurance Group Co. of China Ltd. Class H | 2.0% |
42.9% | |
MassMutual Global Emerging | |
Financial | 29.1% |
Technology | 21.2% |
Communications | 17.2% |
Consumer, Cyclical | 12.2% |
Industrial | 6.1% |
Basic Materials | 5.0% |
Energy | 3.5% |
Consumer, Non-cyclical | 2.5% |
Utilities | 2.0% |
Total Long-Term Investments | 98.8% |
Short-Term Investments and Other Assets and Liabilities | 1.2% |
Net Assets | 100.0% |
14
MassMutual Global Emerging Markets Equity Fund – Portfolio Manager Report (Unaudited) (Continued) |
GROWTH OF $10,000 INVESTMENT - Class I
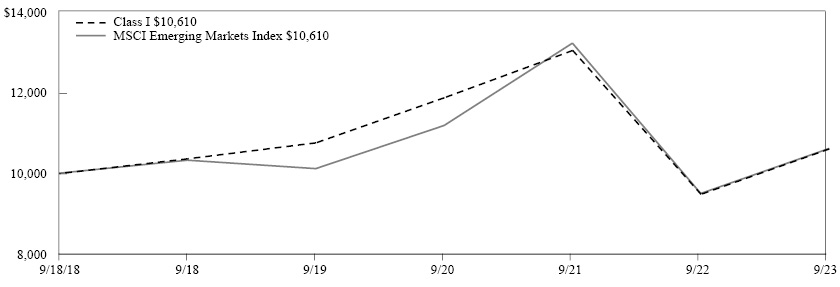
The graph above illustrates a representative class of the Fund’s historical performance+ for the past 10 fiscal years or since inception (for Funds lacking 10-year records) in comparison to its benchmark index, as well as one or more additional indexes, if applicable. The performance of other share classes will be greater than or less than the class depicted above.
Average Annual Total Returns+ (for the periods ended 09/30/2023) | ||||
| Inception Date | 1 Year | 5 Years | Since Inception |
Class I | 9/18/2018 | 11.84% | 0.47% | 1.18% |
Class Y | 9/18/2018 | 11.83% | 0.47% | 1.18% |
Class L | 9/18/2018 | 11.63% | 0.23% | 0.94% |
Class L (sales load deducted)* | 9/18/2018 | 6.20% | -0.59% | 0.12% |
Class C | 9/18/2018 | 10.74% | -0.53% | 0.17% |
Class C (CDSC fees deducted)* | 9/18/2018 | 9.74% | -0.53% | 0.17% |
MSCI Emerging Markets Index | 11.70% | 0.55% | 1.18% | |
* Class L (sales load deducted) returns include the 4.00% maximum sales charge and Class C (CDSC fees deducted) returns include the 1.00% maximum contingent deferred sales charge for the first 12 months shown.
+ The Fund is the successor to the Barings Global Emerging Markets Equity Fund (the “Predecessor Fund”), a mutual fund with substantially similar investment objectives, policies, and restrictions, as a result of the reorganization of the Predecessor Fund into the Fund on December 13, 2021. The performance provided is that of the Predecessor Fund prior to December 13, 2021, and is that of the Fund after December 13, 2021. Performance shown for Class L shares prior to December 13, 2021 reflects the performance of Class A shares of the Predecessor Fund.
Generally accepted accounting principles require adjustments to be made to the net assets of the Fund at period end for financial reporting purposes only, and as such, the total return based on the unadjusted net asset value per share may differ from the total return reported in the financial highlights.
Performance results in the graph and table are shown both with and without the imposition of the maximum applicable sales charge (if applicable) and reflect the percentage change in net asset value, including reinvestment of dividends and capital gains distributions. Investors should note that the Fund is a professionally managed mutual fund, while the index or indexes shown above are unmanaged, cannot be purchased directly, and, with the exception of any peer group index, do not incur expenses.
Performance data quoted in the graph and table represents past performance; past performance is not predictive of future results. The investment return and principal value of shares of the Fund fluctuate, so your shares, when sold, may be worth more or less than their original cost. Current performance of the Fund may be lower or higher than the performance quoted. The performance shown does not reflect the deduction of taxes, if any, that a shareholder would pay on Fund distributions or the redemption of Fund shares. Performance data current to the most recent month end may be obtained by calling 1-888-309-3539.
Investors should read the Fund’s prospectus with regard to the Fund’s investment objectives, risks, and charges and expenses in conjunction with these financial statements. Employee retirement benefit plans that invest plan assets in the Separate Investment Accounts (SIAs) may be subject to certain charges as set forth in their respective Plan Documents. Total return figures would be lower for the periods presented if they reflected these charges.
15
MassMutual Global Floating Rate Fund – Portfolio of Investments |
September 30, 2023 |
Number of | Value | |||||||
EQUITIES — 1.0% | ||||||||
COMMON STOCK — 1.0% | ||||||||
Communications — 0.2% | ||||||||
Media — 0.2% | ||||||||
Learfield Communications, Inc. (a) (b) | 9,599 | $ | 364,762 | |||||
Telecommunications — 0.0% | ||||||||
Vantiva SA (a) (c) | 88,751 | 14,438 | ||||||
| 379,200 | ||||||||
Consumer, Cyclical — 0.2% | ||||||||
Entertainment — 0.0% | ||||||||
Technicolor Creative Studios SA (Acquired 6/08/23, Cost $158,820) (a) (d) | 29,944 | 51,550 | ||||||
Home Furnishing — 0.2% | ||||||||
Serta Simmons, Inc. (a) (b) | 22,009 | 330,135 | ||||||
| 381,685 | ||||||||
Consumer, Non-cyclical — 0.4% | ||||||||
Food — 0.3% | ||||||||
CTI Foods Holding Co. LLC (a) (b) (e) | 4,657 | 516,135 | ||||||
Health Care – Services — 0.1% | ||||||||
Don Jersey Topco Ltd. (Acquired 8/03/20-6/23/23, Cost $234,326) (a) (b) (d) (e) | 353,106 | 150,789 | ||||||
| 666,924 | ||||||||
Energy — 0.2% | ||||||||
Oil & Gas Services — 0.2% | ||||||||
KCA Deutag International Ltd. (a) | 7,834 | 438,704 | ||||||
Financial — 0.0% | ||||||||
Diversified Financial Services — 0.0% | ||||||||
Campfire Topco Ltd. (a) (b) (e) | 1,484,798 | — | ||||||
Travelex Topco Ltd. (a) (b) (e) | 3,602 | — | ||||||
| — | ||||||||
Investment Companies — 0.0% | ||||||||
Jubilee Topco Ltd. (a) (b) (e) | 689,952 | — | ||||||
| — | ||||||||
Industrial — 0.0% | ||||||||
Transportation — 0.0% | ||||||||
Bahia De Las Isletas SL, Class A2 (a) (b) (e) | 688 | — | ||||||
Bahia De Las Isletas SL, Class A3 (a) (b) (e) | 98 | — | ||||||
Bahia De Las Isletas SL, Class B2 (a) (b) (e) | 876 | — | ||||||
Bahia De Las Isletas SL, Class B3 (a) (b) (e) | 125 | — | ||||||
| — | ||||||||
| — | ||||||||
Number of | Value | |||||||
TOTAL COMMON STOCK (Cost $1,904,142) | $ | 1,866,513 | ||||||
TOTAL EQUITIES (Cost $1,904,142) | 1,866,513 | |||||||
Principal | ||||||||
BONDS & NOTES — 91.6% | ||||||||
BANK LOANS — 87.7% | ||||||||
Advertising — 1.0% | ||||||||
Clear Channel Outdoor Holdings, Inc., Term Loan B, 1 mo. USD Term SOFR + 3.500%, 3 mo. USD Term SOFR + 3.500% | ||||||||
8.818% - 9.131% VRN 8/21/26 | $ | 990,009 | 959,893 | |||||
Summer (BC) Holdco B Sarl, USD Term Loan B1, 3 mo. USD Term SOFR + 5.000% | ||||||||
10.661% VRN 12/04/26 | 997,409 | 963,747 | ||||||
| 1,923,640 | ||||||||
Aerospace & Defense — 0.4% | ||||||||
TransDigm, Inc., 2023 Term Loan I, 3 mo. USD Term SOFR + 3.250% | ||||||||
8.640% VRN 8/24/28 | 854,627 | 854,491 | ||||||
Airlines — 2.2% | ||||||||
Air Canada, 2021 Term Loan B, 3 mo. USD Term SOFR + 3.500% | ||||||||
9.128% VRN 8/11/28 | 766,464 | 766,303 | ||||||
American Airlines, Inc. | ||||||||
2023 Term Loan B, 3 mo. USD Term SOFR + 2.750% | ||||||||
8.543% VRN 2/15/28 | 874,776 | 867,621 | ||||||
2021 Term Loan, 3 mo. USD Term SOFR + 4.750% | ||||||||
10.338% VRN 4/20/28 | 962,373 | 990,282 | ||||||
Kestrel Bidco, Inc., Term Loan B, 3 mo. USD Term SOFR + 3.000% | ||||||||
8.420% VRN 12/11/26 | 556,782 | 544,488 | ||||||
United Airlines, Inc., 2021 Term Loan B, 1 mo. USD Term SOFR + 3.750% | ||||||||
9.182% VRN 4/21/28 | 930,492 | 930,706 | ||||||
| 4,099,400 | ||||||||
Apparel — 0.5% | ||||||||
Crocs, Inc. ., 2023 Term Loan B, 1 mo. USD Term SOFR + 3.000%, 3 mo. USD Term SOFR + 3.000% | ||||||||
8.318% - 8.540% VRN 2/20/29 | 658,516 | 659,563 | ||||||
The accompanying notes are an integral part of the financial statements.
16
MassMutual Global Floating Rate Fund – Portfolio of Investments (Continued) |
Principal | Value | |||||||
Hanesbrands, Inc., 2023 Term Loan B, 1 mo. USD Term SOFR + 3.750% | ||||||||
9.066% VRN 3/08/30 | $ | 118,638 | $ | 115,969 | ||||
Samsonite International SA, 2023 Term Loan, 1 mo. USD Term SOFR + 2.750% | ||||||||
8.066% VRN 6/21/30 | 238,524 | 238,674 | ||||||
| 1,014,206 | ||||||||
Auto Parts & Equipment — 0.3% | ||||||||
DexKo Global, Inc., 2021 USD Term Loan B, | ||||||||
0.000% 10/04/28 (f) | 518,673 | 504,881 | ||||||
Banks — 0.4% | ||||||||
AqGen Ascensus, Inc., 2021 2nd Lien Term Loan, 3 mo. USD Term SOFR + 6.500% | ||||||||
12.030% VRN 8/02/29 | 250,358 | 236,746 | ||||||
AqGen Island Holdings, Inc., Term Loan, | ||||||||
0.000% 8/02/28 (f) | 485,030 | 479,273 | ||||||
| 716,019 | ||||||||
Beverages — 0.3% | ||||||||
Amphora Finance Ltd., 2018 GBP Term Loan B, 6 mo. SONIA + 4.750% | ||||||||
9.378% VRN 5/23/25 GBP (g) | 500,000 | 228,006 | ||||||
Triton Water Holdings, Inc., Term Loan, 3 mo. USD Term SOFR + 3.250% | ||||||||
8.902% VRN 3/31/28 | 368,222 | 358,402 | ||||||
| 586,408 | ||||||||
Biotechnology — 0.6% | ||||||||
Advanz Pharma Corp., 2021 EUR Term Loan B, 1 mo. EUR EURIBOR + 4.500% | ||||||||
8.358% VRN 6/01/28 EUR (g) | 1,000,000 | 1,049,321 | ||||||
Building Materials — 0.8% | ||||||||
CP Atlas Buyer, Inc., 2021 Term Loan B, 1 mo. USD Term SOFR + 3.750% | ||||||||
9.166% VRN 11/23/27 | 231,773 | 218,108 | ||||||
Emrld Borrower LP, Term Loan B, 3 mo. USD Term SOFR + 3.000%, | ||||||||
8.316% VRN 5/31/30 (f) | 445,161 | 444,329 | ||||||
LSF10 XL Bidco SCA, 2021 EUR Term Loan B4, 3 mo. EUR EURIBOR + 3.925% | ||||||||
8.147% VRN 4/12/28 EUR (g) | 853,470 | 773,921 | ||||||
| 1,436,358 | ||||||||
Principal | Value | |||||||
Chemicals — 4.7% | ||||||||
Ascend Performance Materials Operations LLC, 2021 Term Loan B, 3 mo. USD Term SOFR + 4.750% | ||||||||
10.317% VRN 8/27/26 | $ | 746,173 | $ | 728,683 | ||||
Consolidated Energy Finance SA, Term Loan B, 3 mo. USD Term SOFR + 2.500% | ||||||||
7.916% VRN 5/07/25 | 36,747 | 36,342 | ||||||
CPC Acquisition Corp., Term Loan, 3 mo. USD Term SOFR + 3.750% | ||||||||
9.150% VRN 12/29/27 | 1,520,192 | 1,251,437 | ||||||
Cyanco Intermediate 2 Corp., 2023 Term Loan B, 1 mo. USD Term SOFR + 4.750% | ||||||||
10.066% VRN 7/10/28 | 1,242,714 | 1,243,099 | ||||||
Flint Group Packaging INKS North America Holdings LLC | ||||||||
EUR PIK 2nd lien Holdco Term Loan, 3 mo. EUR EURIBOR + 0.100% | ||||||||
3.793% VRN 12/31/27 EUR (g) | 233,177 | 49,305 | ||||||
EUR PIK Holdco Term Loan, 3 mo. EUR EURIBOR + 0.100% | ||||||||
3.794% VRN 12/31/27 EUR (g) | 174,854 | 129,714 | ||||||
EUR Opco Term Loan, 3 mo. EUR EURIBOR + 4.250% | ||||||||
7.944% VRN 12/31/26 EUR (g) | 369,226 | 361,867 | ||||||
Kraton Corp., 2022 USD Term Loan, 3 mo. USD Term SOFR + 3.250% | ||||||||
8.921% VRN 3/15/29 | 395,129 | 389,573 | ||||||
LSF11 A5 Holdco LLC, Term Loan, 1 mo. USD Term SOFR + 3.500% | ||||||||
8.810% VRN 10/15/28 | 679,692 | 662,870 | ||||||
New Arclin US Holding Corp., 2021 Term Loan, 1 mo. USD Term SOFR + 3.750% | ||||||||
9.166% VRN 9/30/28 | 871,966 | 860,387 | ||||||
Olympus Water US Holding Corporation, 2021 USD Term Loan B, 3 mo. USD Term SOFR + 3.750% | ||||||||
9.402% VRN 11/09/28 | 915,710 | 902,304 | ||||||
PMHC II, Inc., 2022 Term Loan B, 3 mo. USD Term SOFR + 4.250% | ||||||||
9.698% VRN 4/23/29 | 786,909 | 740,945 | ||||||
Polar US Borrower LLC, 2018 1st Lien Term Loan, 3 mo. USD Term SOFR + 4.750% | ||||||||
9.721% - 10.151% VRN 10/15/25 | 1,214,853 | 970,364 | ||||||
The accompanying notes are an integral part of the financial statements.
17
MassMutual Global Floating Rate Fund – Portfolio of Investments (Continued) |
Principal | Value | |||||||
Starfruit Finco BV, 2023 Term Loan B, 3 mo. USD Term SOFR + 4.000% | ||||||||
9.347% VRN 4/03/28 | $ | 218,112 | $ | 215,205 | ||||
Trinseo Materials Operating S.C.A, 2021 Term Loan B2, 1 mo. USD Term SOFR + 2.500% | ||||||||
7.931% VRN 5/03/28 | 474,483 | 397,109 | ||||||
| 8,939,204 | ||||||||
Commercial Services — 8.0% | ||||||||
APX Group, Inc., 2021 Term Loan B, 3 mo. USD LIBOR + 3.250%, 3 mo. U.S. (Fed) Prime Rate + 2.250% | ||||||||
0.087% - 11.750% VRN 7/10/28 | 706,167 | 705,185 | ||||||
AVSC Holding Corp., 2020 Term Loan B1, 1 mo. USD Term SOFR + 3.250% | ||||||||
8.568% VRN 3/03/25 | 644,122 | 619,014 | ||||||
BCP V Modular Services Holdings IV Ltd., EUR Term Loan B, 3 mo. EUR EURIBOR + 4.425% | ||||||||
8.397% VRN 12/15/28 EUR (g) | 1,000,000 | 990,812 | ||||||
CoreLogic, Inc. | ||||||||
Term Loan, 1 mo. USD Term SOFR + 3.500% | ||||||||
8.931% VRN 6/02/28 | 559,537 | 515,938 | ||||||
2nd Lien Term Loan, 1 mo. USD Term SOFR + 6.500% | ||||||||
11.931% VRN 6/04/29 | 532,670 | 446,554 | ||||||
Eagle Bidco Ltd., 2021 GBP Term Loan B, 1 mo. SONIA + 4.750% | ||||||||
9.718% VRN 3/20/28 GBP (g) | 500,000 | 582,677 | ||||||
Ensono LP, 2021 Term Loan, 1 mo. USD Term SOFR + 4.000% | ||||||||
9.431% VRN 5/26/28 | 635,747 | 610,793 | ||||||
Fugue Finance BV, EUR Term Loan, 2 mo. EUR EURIBOR + 4.750% | ||||||||
8.114% VRN 1/31/28 EUR (g) | 1,000,000 | 1,056,817 | ||||||
Lernen Bidco Ltd., 2023 EUR Extended Term Loan B, 3 mo. EUR EURIBOR + 4.750% | ||||||||
8.482% VRN 4/25/29 EUR (g) | 2,000,000 | 2,104,583 | ||||||
Mavis Tire Express Services Corp., 2021 Term Loan B, 1 mo. USD Term SOFR + 4.000% | ||||||||
9.431% VRN 5/04/28 | 746,183 | 743,572 | ||||||
Neptune Bidco US, Inc., 2022 USD Term Loan B, 3 mo. USD Term SOFR + 5.000% | ||||||||
10.398% VRN 4/11/29 | 996,255 | 894,557 | ||||||
Principal | Value | |||||||
OMNIA Partners LLC, Term Loan B, 3 mo. USD Term SOFR + 4.250% | ||||||||
9.601% VRN 7/25/30 | $ | 252,899 | $ | 252,952 | ||||
PECF USS Intermediate Holding III Corp., Term Loan B, 1 mo. USD Term SOFR + 4.250% | ||||||||
9.568% VRN 12/15/28 (f) | 673,734 | 538,084 | ||||||
Prometric Holdings, Inc., 1st Lien Term Loan, 3 mo. USD Term SOFR + 3.000% | ||||||||
8.684% VRN 1/29/25 | 972,010 | 960,832 | ||||||
Sabre GLBL, Inc. | ||||||||
2021 Term Loan B2, 1 mo. USD Term SOFR + 3.500% | ||||||||
8.931% VRN 12/17/27 | 465,931 | 406,525 | ||||||
2021 Term Loan B1, 1 mo. USD Term SOFR + 3.500% | ||||||||
8.931% VRN 12/17/27 | 298,172 | 260,155 | ||||||
Spin Holdco, Inc., 2021 Term Loan, 3 mo. USD Term SOFR + 4.000% | ||||||||
9.664% VRN 3/04/28 | 646,684 | 557,564 | ||||||
Techem Verwaltungsgesellschaft 675 mbH, EUR Term Loan B4, 6 mo. EUR EURIBOR + 2.375% | ||||||||
6.275% VRN 7/15/25 EUR (g) | 1,000,000 | 1,053,899 | ||||||
Verisure Holding AB, 2021 EUR Term Loan, 3 mo. EUR EURIBOR + 3.000% | ||||||||
6.972% VRN 3/27/28 EUR (g) | 1,375,000 | 1,435,940 | ||||||
Wand NewCo 3, Inc., 2020 Term Loan, 1 mo. USD Term SOFR + 2.750% | ||||||||
8.166% VRN 2/05/26 | 483,568 | 480,323 | ||||||
| 15,216,776 | ||||||||
Computers — 2.5% | ||||||||
Ahead DB Holdings LLC, 2021 Term Loan B, 3 mo. USD Term SOFR + 3.750% | ||||||||
9.240% VRN 10/18/27 | 419,814 | 415,616 | ||||||
Magenta Buyer LLC, 2021 USD 1st Lien Term Loan, 3 mo. USD Term SOFR + 5.000% | ||||||||
10.631% VRN 7/27/28 | 671,350 | 497,545 | ||||||
McAfee LLC, 2022 USD Term Loan B, 1 mo. USD Term SOFR + 3.750% | ||||||||
9.180% VRN 3/01/29 | 766,439 | 747,516 | ||||||
Peraton Corp., Term Loan B, 1 mo. USD Term SOFR + 3.750% | ||||||||
9.166% VRN 2/01/28 | 706,626 | 704,421 | ||||||
The accompanying notes are an integral part of the financial statements.
18
MassMutual Global Floating Rate Fund – Portfolio of Investments (Continued) |
Principal | Value | |||||||
Redstone Holdco 2 LP, 2021 Term Loan, 1 mo. USD Term SOFR + 4.750% | ||||||||
10.184% VRN 4/27/28 | $ | 299,265 | $ | 254,938 | ||||
SITEL Worldwide Corp., 2021 USD Term Loan, 1 mo. USD Term SOFR + 3.750% | ||||||||
9.181% VRN 8/28/28 | 1,045,050 | 1,017,293 | ||||||
Vision Solutions, Inc. | ||||||||
2021 Incremental Term Loan, 1 mo. USD Term SOFR + 4.000% | ||||||||
9.613% VRN 4/24/28 | 415,889 | 402,285 | ||||||
2021 2nd Lien Term Loan, 1 mo. USD Term SOFR + 7.250% | ||||||||
12.863% VRN 4/23/29 | 770,186 | 689,594 | ||||||
| 4,729,208 | ||||||||
Cosmetics & Personal Care — 0.5% | ||||||||
Journey Personal Care Corp., 2021 Term Loan B, 6 mo. USD LIBOR + 4.250% | ||||||||
9.981% VRN 3/01/28 | 1,036,472 | 974,284 | ||||||
Distribution & Wholesale — 0.4% | ||||||||
Fluid-Flow Products, Inc., Term Loan, 3 mo. USD Term SOFR + 3.750%, | ||||||||
9.855% VRN 3/31/28 | 717,431 | 710,034 | ||||||
Diversified Financial Services — 3.6% | ||||||||
Advisor Group, Inc., 2023 Term Loan B, 3 mo. USD Term SOFR + 4.500% | ||||||||
9.816% VRN 8/17/28 (f) | 294,310 | 293,851 | ||||||
AllSpring Buyer LLC, Term Loan B, 3 mo. USD Term SOFR + 3.250% | ||||||||
8.650% VRN 11/01/28 | 797,982 | 789,252 | ||||||
Campfire Bidco Ltd. | ||||||||
USD Opco Term Loan, 3 mo. USD Term SOFR + 4.250% | ||||||||
9.856% VRN 12/31/26 | 2,192,840 | 2,037,982 | ||||||
EUR Super Senior Term Loan, 3 mo. EUR EURIBOR + 8.000% | ||||||||
11.770% VRN 6/30/26 EUR (g) | 335,910 | 356,139 | ||||||
Campfire TopCo Ltd. | ||||||||
USD First Lien HoldCo Facility, 3 mo. USD Term SOFR + 0.100% | ||||||||
5.706% VRN 12/31/27 | 1,038,461 | 732,115 | ||||||
USD Second Lien HoldCo Facility, 3 mo. USD Term SOFR + 0.100% | ||||||||
5.706% VRN 12/31/27 | 1,384,843 | 279,281 | ||||||
Principal | Value | |||||||
Castlelake Aviation Ltd., Term Loan B, 3 mo. USD Term SOFR + 2.750% | ||||||||
8.421% VRN 10/22/26 | $ | 1,123,778 | $ | 1,121,227 | ||||
Deerfield Dakota Holding LLC, 2021 USD 2nd Lien Term Loan, 1 mo. USD Term SOFR + 6.750% | ||||||||
12.402% VRN 4/07/28 | 857,143 | 805,714 | ||||||
VFH Parent LLC, 2022 Term Loan B, 1 mo. USD Term SOFR + 3.000% | ||||||||
8.418% VRN 1/13/29 | 518,809 | 514,161 | ||||||
| 6,929,722 | ||||||||
Electric — 0.9% | ||||||||
Arvos BidCo Sarl | ||||||||
EUR 1st Lien Term Loan B1 (Acquired 8/31/23, Cost $1,027,918), 3 mo. EUR EURIBOR + 5.500% | ||||||||
9.283% VRN 8/29/24 EUR (d) (g) | 889,475 | 423,179 | ||||||
USD 1st Lien Term Loan B1 (Acquired 7/31/23, Cost $126,658), 3 mo. USD LIBOR + 5.761% | ||||||||
11.131% VRN 8/29/24 (d) | 126,765 | 50,706 | ||||||
USD 1st Lien Term Loan B2 (Acquired 7/31/23, Cost $126,659), 3 mo. USD LIBOR + 5.761% | ||||||||
11.131% VRN 8/29/24 (d) | 126,765 | 50,706 | ||||||
Calpine Construction Finance Co. LP, 2023 Refinancing Term Loan B, 1 mo. USD Term SOFR + 2.250% | ||||||||
7.566% VRN 7/31/30 | 461,509 | 458,708 | ||||||
Edgewater Generation LLC, Term Loan, 1 mo. USD Term SOFR + 3.750% | ||||||||
9.181% VRN 12/13/25 | 572,532 | 555,465 | ||||||
EFS Cogen Holdings I LLC, 2020 Term Loan B, | ||||||||
0.000% 10/01/27 (f) | 149,644 | 148,667 | ||||||
| 1,687,431 | ||||||||
Electrical Components & Equipment — 0.5% | ||||||||
CEP IV Investment 16 Sarl, EUR Term Loan B, 3 mo. EUR EURIBOR + 4.750% | ||||||||
8.545% VRN 10/03/26 EUR (g) | 500,000 | 486,113 | ||||||
SGB-SMIT Management GmbH, EUR Term Loan B, 1 mo. EUR EURIBOR + 4.500% | ||||||||
8.214% VRN 4/18/28 EUR (g) | 458,692 | 452,824 | ||||||
| 938,937 | ||||||||
The accompanying notes are an integral part of the financial statements.
19
MassMutual Global Floating Rate Fund – Portfolio of Investments (Continued) |
Principal | Value | |||||||
Engineering & Construction — 0.6% | ||||||||
DG Investment Intermediate Holdings 2, Inc., 2021 Term Loan, 1 mo. USD Term SOFR + 3.750% | ||||||||
9.181% VRN 3/31/28 | $ | 715,275 | $ | 702,014 | ||||
US Anesthesia Partners, Inc., 2021 Term Loan, 1 mo. USD Term SOFR + 3.500% | ||||||||
8.931% VRN 5/12/28 | 433,904 | 426,311 | ||||||
| 1,128,325 | ||||||||
Entertainment — 3.2% | ||||||||
Bally’s Corp., 2021 Term Loan B, 3 mo. USD Term SOFR + 3.250% | ||||||||
8.838% VRN 10/02/28 | 748,101 | 732,062 | ||||||
International Park Holdings BV, 2023 EUR Term Loan B, 6 mo. EUR EURIBOR + 5.000% | ||||||||
8.794% VRN 12/14/26 EUR (g) | 500,000 | 528,128 | ||||||
Motion Finco Sarl, EUR Term Loan B, 3 mo. EUR EURIBOR + 3.000% | ||||||||
6.972% VRN 11/12/26 EUR (g) | 1,000,000 | 1,049,765 | ||||||
Scientific Games Holdings LP, 2022 USD Term Loan B, 3 mo. USD Term SOFR + 3.500% | ||||||||
8.768% VRN 4/04/29 | 982,718 | 976,164 | ||||||
Technicolor Creative Studios | ||||||||
2023 EUR PIK Term Loan (Acquired 6/08/23, Cost $8,442), 3 mo. EUR EURIBOR + 0.500% | ||||||||
0.500% VRN 6/08/33 EUR (b) (d) (e) (g) | 246,435 | — | ||||||
2023 EUR PIK Term Loan (Acquired 4/03/23, Cost $109,571), 3 mo. EUR EURIBOR + 0.5000% | ||||||||
4.215% VRN 7/31/26 EUR (d) (g) | 105,348 | 104,140 | ||||||
2023 EUR PIK Reinstated Term Loan B (Acquired 6/08/23, Cost $488,305), 6 mo. EUR EURIBOR + 0.500% | ||||||||
4.294% VRN 9/15/26 EUR (d) (g) | 610,076 | 334,479 | ||||||
2023 EUR PIK Reinstated Term Loan B (Acquired 4/03/23, Cost $111,279), 6 mo. EUR EURIBOR + 0.500% | ||||||||
15.335% VRN 7/31/26 EUR (d) (g) | 115,320 | 113,998 | ||||||
Vue International Bidco PLC | ||||||||
2023 EUR PIK Term Loan, 6 mo. EUR EURIBOR + 2.000% | ||||||||
4.859% VRN 12/31/27 EUR (g) | 698,672 | 341,022 | ||||||
2022 EUR Term Loan, 6 mo. EUR EURIBOR + 8.000% | ||||||||
12.072% VRN 6/30/27 EUR (g) | 145,796 | 148,362 | ||||||
Principal | Value | |||||||
William Morris Endeavor Entertainment LLC, 2018 1st Lien Term Loan, 1 mo. USD Term SOFR + 2.750% | ||||||||
8.181% VRN 5/18/25 | $ | 1,193,349 | $ | 1,190,198 | ||||
WMG Acquisition Corp., 2021 Term Loan G, 1 mo. USD Term SOFR + 2.125% | ||||||||
7.556% VRN 1/20/28 | 518,991 | 518,488 | ||||||
| 6,036,806 | ||||||||
Environmental Controls — 0.9% | ||||||||
Gopher Resource LLC, 1st Lien Term Loan, 3 mo. USD LIBOR + 3.250% | ||||||||
8.981% VRN 3/06/25 | 1,042,374 | 870,382 | ||||||
Madison IAQ LLC, Term Loan, 1 mo. USD Term SOFR + 3.250% | ||||||||
8.689% VRN 6/21/28 | 805,224 | 790,931 | ||||||
| 1,661,313 | ||||||||
Food — 1.2% | ||||||||
BCPE North Star US HoldCo 2, Inc., Term Loan, 3 mo. USD LIBOR + 4.000% | ||||||||
9.652% VRN 6/09/28 | 301,520 | 268,353 | ||||||
CHG PPC Parent LLC, 2021 Term Loan, 1 mo. USD Term SOFR + 3.000% | ||||||||
8.318% VRN 12/08/28 | 492,467 | 488,158 | ||||||
CTI Foods Holding Co. LLC | ||||||||
First Out Term Loan, 3 mo. USD Term SOFR + 7.000% | ||||||||
12.861% VRN 5/03/24 | 308,326 | 308,034 | ||||||
Second Out Term Loan, 3 mo. USD Term SOFR + 9.000% | ||||||||
14.861% VRN 5/03/24 | 204,535 | 194,114 | ||||||
Deoleo Financial, Ltd., EUR Senior Term Loan (Acquired 6/24/20, Cost $62,999), 3 mo. EUR EURIBOR + 5.500% | ||||||||
9.441% VRN 6/24/25 EUR (b) (d) (g) | 55,872 | 56,117 | ||||||
Froneri International Ltd., 2020 EUR Term Loan B1, 6 mo. EUR EURIBOR + 2.125% | ||||||||
6.097% VRN 1/29/27 EUR (g) | 1,000,000 | 1,039,457 | ||||||
| 2,354,233 | ||||||||
Health Care – Products — 2.8% | ||||||||
Auris Luxembourg III Sarl, EUR Term Loan B1A, 6 mo. EUR EURIBOR + 4.000% | ||||||||
7.781% VRN 2/27/26 EUR (g) | 1,000,000 | 1,027,340 | ||||||
The accompanying notes are an integral part of the financial statements.
20
MassMutual Global Floating Rate Fund – Portfolio of Investments (Continued) |
Principal | Value | |||||||
Embecta Corp., Term Loan B, 6 mo. USD Term SOFR + 3.000% | ||||||||
8.337% VRN 3/30/29 | $ | 362,179 | $ | 354,313 | ||||
Iris BidCo GmbH, EUR Term Loan B, 3 mo. EUR EURIBOR + 5.000% | ||||||||
8.714% VRN 6/29/28 EUR (g) | 650,000 | 669,654 | ||||||
Lifescan Global Corp., 2023 Term Loan, 3 mo. USD Term SOFR + 6.500% | ||||||||
11.747% VRN 12/31/26 | 943,480 | 743,774 | ||||||
Medline Borrower LP, USD Term Loan B, 1 mo. USD Term SOFR + 3.250% | ||||||||
8.681% VRN 10/23/28 | 2,462,500 | 2,454,374 | ||||||
| 5,249,455 | ||||||||
Health Care – Services — 4.7% | ||||||||
Aveanna Healthcare LLC, 2021 2nd Lien Term Loan, 3 mo. USD Term SOFR + 7.000% | ||||||||
12.572% VRN 12/10/29 | 1,497,326 | 973,262 | ||||||
Envision Healthcare Corp. | ||||||||
2022 Third Out Term Loan, 3 mo. USD Term SOFR + 3.750% | ||||||||
8.992% VRN 3/31/27 | 367,879 | 552 | ||||||
2022 First Out Term Loan, 3 mo. USD Term SOFR + 7.875% | ||||||||
13.275% VRN 3/31/27 | 145,176 | 169,613 | ||||||
ICON Luxembourg Sarl, LUX Term Loan, 3 mo. USD Term SOFR + 2.250% | ||||||||
7.902% VRN 7/03/28 | 557,811 | 557,365 | ||||||
Medical Solutions Holdings, Inc., 2021 2nd Lien Term Loan, 3 mo. USD Term SOFR + 7.000% | ||||||||
12.522% VRN 11/01/29 | 294,737 | 263,053 | ||||||
Midwest Physician Administrative Services LLC, 2021 Term Loan, 3 mo. USD LIBOR + 3.250% | ||||||||
8.902% VRN 3/12/28 | 992,366 | 928,964 | ||||||
NAPA Management Services Corp., Term Loan B, 1 mo. USD Term SOFR + 5.250% | ||||||||
10.666% VRN 2/23/29 | 822,352 | 659,938 | ||||||
Radiology Partners, Inc., 2018 1st Lien Term Loan B, 1 mo. USD Term SOFR + 4.250% | ||||||||
10.179% VRN 7/09/25 | 1,746,310 | 1,308,545 | ||||||
RegionalCare Hospital Partners Holdings, Inc., 2018 Term Loan B, 3 mo. USD Term SOFR + 3.750% | ||||||||
9.072% VRN 11/16/25 | 1,165,152 | 1,161,272 | ||||||
Principal | Value | |||||||
Select Medical Corp., 2023 Term Loan B1, 1 mo. USD Term SOFR + 3.000% | ||||||||
8.316% VRN 3/06/27 | $ | 997,500 | $ | 993,759 | ||||
Team Health Holdings, Inc., 2022 Term Loan B, 1 mo. USD Term SOFR + 5.250% | ||||||||
10.566% VRN 3/02/27 | 521,841 | 393,990 | ||||||
Tunstall Group Holdings Limited | ||||||||
2023 EUR Reinstated Term Loan B (Acquired 6/23/23, Cost $314,153), 3 mo. EUR EURIBOR + 0.100% | ||||||||
3.894% VRN 12/20/27 EUR (b) (d) (e) (g) | 321,190 | 305,620 | ||||||
2023 EUR Super Senior Term Loan (Acquired 6/23/23, Cost $107,052), 3 mo. EUR EURIBOR + 3.000% | ||||||||
6.794% VRN 12/18/26 EUR (b) (d) (e) (g) | 104,512 | 103,865 | ||||||
US Anesthesia Partners, Inc., 2021 Term Loan, 1 mo. USD Term SOFR + 4.250% | ||||||||
9.694% VRN 10/01/28 | 722,639 | 661,728 | ||||||
US Radiology Specialists, Inc., 2020 Term Loan, 1 mo. USD Term SOFR + 5.250% | ||||||||
10.740% VRN 12/15/27 | 525,721 | 508,898 | ||||||
| 8,990,424 | ||||||||
Holding Company – Diversified — 0.6% | ||||||||
CEP IV Investment 16 Sarl, USD 2nd Lien Term Loan, 3 mo. USD Term SOFR + 9.250% | ||||||||
14.526% VRN 10/01/27 | 1,000,872 | 850,741 | ||||||
Hilding Anders International AB | ||||||||
2023 EUR Super Senior Term Loan (Acquired 10/04/22-7/21/23, Cost $310,980), 6 mo. EUR EURIBOR + 5.000% | ||||||||
8.648% VRN 2/28/26 EUR (d) (g) | 405,304 | 170,974 | ||||||
2022 EUR PIK Reorg Holdco, 3 mo. EUR EURIBOR + 12.000% | ||||||||
12.000% VRN 2/28/27 EUR (b) (e) (g) | 376,844 | — | ||||||
2023 EUR Reinstated Term Loan B (Acquired 9/29/23, Cost $58,670), 6 mo. EUR EURIBOR + 10.000% | ||||||||
13.616% VRN 1/31/26 EUR (d) (g) | 56,092 | 56,338 | ||||||
| 1,078,053 | ||||||||
The accompanying notes are an integral part of the financial statements.
21
MassMutual Global Floating Rate Fund – Portfolio of Investments (Continued) |
Principal | Value | |||||||
Home Furnishing — 0.2% | ||||||||
Mattress Firm, Inc., 2021 Term Loan B, 6 mo. USD LIBOR + 4.250% | ||||||||
10.146% VRN 9/25/28 | $ | 464,366 | $ | 460,052 | ||||
Housewares — 0.3% | ||||||||
Solis IV BV, USD Term Loan B1, 3 mo. USD Term SOFR + 3.500% | ||||||||
8.891% VRN 2/26/29 | 643,208 | 625,359 | ||||||
Insurance — 2.1% | ||||||||
AmWINS Group, Inc., 2023 Incremental Term Loan B, 1 mo. USD Term SOFR + 2.750% | ||||||||
8.181% VRN 2/19/28 | 271,175 | 270,668 | ||||||
AssuredPartners, Inc., 2020 Term Loan B, | ||||||||
0.000% 2/12/27 (f) | 997,416 | 994,613 | ||||||
Asurion LLC | ||||||||
2020 Term Loan B8, 3 mo. USD Term SOFR + 3.250% | ||||||||
8.681% VRN 12/23/26 | 1,180,184 | 1,153,630 | ||||||
2021 Second Lien Term Loan B4, 1 mo. USD Term SOFR + 5.250% | ||||||||
10.681% VRN 1/20/29 | 1,551,724 | 1,372,438 | ||||||
Hub International Ltd., 2023 Term Loan B, 3 mo. USD Term SOFR + 4.250% | ||||||||
9.584% VRN 6/20/30 | 224,719 | 225,094 | ||||||
| 4,016,443 | ||||||||
Internet — 2.7% | ||||||||
Endure Digital, Inc., Term Loan, 3 mo. USD LIBOR + 3.500% | ||||||||
8.792% VRN 2/10/28 | 688,403 | 667,180 | ||||||
Hunter Holdco 3 Ltd., USD Term Loan B, 3 mo. USD Term SOFR + 4.250% | ||||||||
9.740% VRN 8/19/28 | 751,360 | 748,543 | ||||||
ION Trading Technologies Sarl, 2021 EUR Term Loan B, 3 mo. EUR EURIBOR + 4.250% | ||||||||
8.222% VRN 4/03/28 EUR (g) | 879,750 | 913,625 | ||||||
MH Sub I LLC | ||||||||
2023 Term Loan, 1 mo. USD Term SOFR + 4.250% | ||||||||
9.566% VRN 5/03/28 | 498,750 | 481,837 | ||||||
2021 2nd Lien Term Loan, 1 mo. USD Term SOFR + 6.250% | ||||||||
11.566% VRN 2/23/29 | 500,000 | 441,720 | ||||||
Proofpoint, Inc., 1st Lien Term Loan, 1 mo. USD Term SOFR + 3.250% | ||||||||
8.681% VRN 8/31/28 | 437,984 | 433,906 | ||||||
Principal | Value | |||||||
PUG LLC, 2021 Incremental Term Loan B, 1 mo. USD LIBOR + 4.250% | ||||||||
9.681% VRN 2/12/27 | $ | 899,908 | $ | 852,663 | ||||
Voyage Australia Pty Ltd., USD Term Loan B, 3 mo. USD Term SOFR + 3.500% | ||||||||
9.088% VRN 7/20/28 | 32,091 | 31,770 | ||||||
W3 Topco LLC, 2019 Term Loan B (Acquired 8/30/21, Cost $655,765), 1 mo. USD Term SOFR + 6.000% | ||||||||
11.652% VRN 8/16/25 (d) | 659,155 | 623,930 | ||||||
| 5,195,174 | ||||||||
Investment Companies — 0.7% | ||||||||
GIP Pilot Acquisition Partners LP, Term Loan, | ||||||||
0.000% 10/04/30 (f) | 218,808 | 217,987 | ||||||
Triley Midco 2 Ltd., EUR Term Loan B, 1 mo. EUR EURIBOR + 4.750% | ||||||||
8.608% VRN 4/09/29 EUR (g) | 1,000,000 | 1,051,086 | ||||||
| 1,269,073 | ||||||||
Leisure Time — 1.7% | ||||||||
Carnival Corp., 2021 Incremental Term Loan B, 1 mo. USD Term SOFR + 3.250% | ||||||||
8.681% VRN 10/18/28 | 984,962 | 978,806 | ||||||
City Football Group Ltd., Term Loan, 1 mo. USD Term SOFR + 3.000% | ||||||||
8.439% VRN 7/21/28 | 911,598 | 905,900 | ||||||
Recess Holdings, Inc., 2023 Term Loan, 3 mo. USD Term SOFR + 4.000% | ||||||||
9.383% VRN 3/17/27 | 165,017 | 164,502 | ||||||
Silk Bidco AS, EUR Term Loan B, 6 mo. EUR EURIBOR + 6.500% | ||||||||
10.451% VRN 2/28/27 EUR (g) | 1,000,000 | 825,681 | ||||||
Topgolf Callaway Brands Corp., Term Loan B, 1 mo. USD Term SOFR + 3.500% | ||||||||
8.916% VRN 3/15/30 | 309,728 | 307,727 | ||||||
| 3,182,616 | ||||||||
Lodging — 1.8% | ||||||||
Alpha Group Sarl, EUR Term Loan B, 3 mo. EUR EURIBOR + 3.750% | ||||||||
7.722% VRN 1/31/25 EUR (g) | 1,000,000 | 1,045,166 | ||||||
Casper BidCo SAS, 2020 EUR Term Loan B3A, 6 mo. EUR EURIBOR + 3.375% | ||||||||
7.569% VRN 7/31/26 EUR (g) | 1,000,000 | 1,041,391 | ||||||
The accompanying notes are an integral part of the financial statements.
22
MassMutual Global Floating Rate Fund – Portfolio of Investments (Continued) |
Principal | Value | |||||||
Hilton Grand Vacations Borrower LLC, 2021 Term Loan B, 1 mo. USD Term SOFR + 3.000% | ||||||||
8.431% VRN 8/02/28 | $ | 527,354 | $ | 527,602 | ||||
Motel 6, Term Loan B, 1 mo. USD Term SOFR + 5.000%, 3 mo. U.S. (Fed) Prime Rate + 4.000% VRN | ||||||||
10.424% - 12.500% 9/09/26 | 837,424 | 832,718 | ||||||
| 3,446,877 | ||||||||
Machinery – Diversified — 0.7% | ||||||||
ASP Blade Holdings, Inc., Initial Term Loan, 1 mo. USD Term SOFR + 4.000% | ||||||||
9.652% VRN 10/13/28 | 983,529 | 865,201 | ||||||
Titan Acquisition Ltd., 2018 Term Loan B, 3 mo. USD LIBOR + 3.000% | ||||||||
8.652% VRN 3/28/25 | 453,785 | 449,587 | ||||||
| 1,314,788 | ||||||||
Media — 4.9% | ||||||||
A-L Parent LLC, 2023 Take Back Term Loan, 3 mo. USD Term SOFR + 5.550% | ||||||||
10.828% VRN 6/30/28 | 558,352 | 540,206 | ||||||
Altice Financing SA, 2022 EUR Term Loan, 3 mo. EUR EURIBOR + 5.000% | ||||||||
8.663% VRN 10/31/27 EUR (g) | 974,485 | 995,688 | ||||||
CSC Holdings LLC, 2017 Term Loan B1, 1 mo. USD LIBOR + 2.250% | ||||||||
7.697% VRN 7/17/25 | 621,357 | 601,163 | ||||||
Cumulus Media New Holdings, Inc., Term Loan B, 3 mo. USD Term SOFR + 3.750% | ||||||||
9.434% VRN 3/31/26 | 1,092,779 | 904,963 | ||||||
DirecTV Financing LLC, Term Loan, 1 mo. USD Term SOFR + 5.000% | ||||||||
10.431% VRN 8/02/27 | 957,800 | 934,918 | ||||||
iHeartCommunications, Inc., 2020 Term Loan, 1 mo. USD Term SOFR + 3.000% | ||||||||
8.431% VRN 5/01/26 | 314,808 | 282,188 | ||||||
McGraw-Hill Global Education Holdings LLC, 2021 Term Loan, 1 mo. USD Term SOFR + 4.750% | ||||||||
10.181% VRN 7/28/28 | 445,403 | 435,845 | ||||||
Univision Communications, Inc., 2022 Term Loan B, 1 mo. USD LIBOR + 3.250% | ||||||||
8.681% VRN 1/31/29 | 464,717 | 458,444 | ||||||
Principal | Value | |||||||
UPC Financing Partnership, 2021 USD Term Loan AX, | ||||||||
0.000% 1/31/29 (f) | $ | 1,000,000 | $ | 983,750 | ||||
Virgin Media SFA Finance Ltd. | ||||||||
GBP Term Loan L, 1 mo. SONIA + 3.250% | ||||||||
8.468% VRN 1/15/27 GBP (g) | 1,000,000 | 1,200,273 | ||||||
GBP Term Loan M, 1 mo. SONIA + 3.250% | ||||||||
8.468% VRN 11/15/27 GBP (g) | 1,000,000 | 1,200,529 | ||||||
VMED O2 UK Holdco 4 Ltd., 2023 EUR Term Loan Z, | ||||||||
0.000% 10/15/31 EUR (f) (g) | 700,000 | 732,060 | ||||||
| 9,270,027 | ||||||||
Metal Fabricate & Hardware — 0.6% | ||||||||
Grinding Media, Inc., 2021 Term Loan B, 3 mo. USD Term SOFR + 4.000% | ||||||||
9.530% VRN 10/12/28 | 1,221,540 | 1,209,324 | ||||||
Mining — 0.1% | ||||||||
Arsenal AIC Parent LLC, Term Loan, 3 mo. USD Term SOFR + 4.500% | ||||||||
9.879% VRN 8/18/30 | 288,647 | 287,804 | ||||||
Miscellaneous - Manufacturing — 0.8% | ||||||||
Gates Global LLC, 2021 Term Loan B3, 1 mo. USD Term SOFR + 2.500% | ||||||||
7.816% VRN 3/31/27 | 727,482 | 724,994 | ||||||
Gemini HDPE LLC, 2020 Term Loan B, 3 mo. USD Term SOFR + 3.000% | ||||||||
8.631% VRN 12/31/27 | 736,097 | 733,336 | ||||||
| 1,458,330 | ||||||||
Oil & Gas — 0.6% | ||||||||
Gulf Finance LLC, 2021 Term Loan, 1 mo. USD Term SOFR + 6.750%, 6 mo. USD Term SOFR + 6.750%, | ||||||||
12.194% - 12.631% VRN 8/25/26 | 1,142,644 | 1,143,661 | ||||||
Packaging & Containers — 2.2% | ||||||||
Altium Packaging LLC, 2021 Term Loan B, | ||||||||
0.000% 2/03/28 (f) | 498,721 | 493,804 | ||||||
Charter NEX US, Inc., 2021 Term Loan, | ||||||||
0.000% 12/01/27 (f) | 650,000 | 643,500 | ||||||
Clydesdale Acquisition Holdings, Inc., Term Loan B, 1 mo. USD Term SOFR + 4.175% | ||||||||
9.591% VRN 4/13/29 | 1,303,202 | 1,284,032 | ||||||
The accompanying notes are an integral part of the financial statements.
23
MassMutual Global Floating Rate Fund – Portfolio of Investments (Continued) |
Principal | Value | |||||||
Mauser Packaging Solutions Holding Co., Term Loan B, 1 mo. USD Term SOFR + 4.000% | ||||||||
9.330% VRN 8/14/26 | $ | 423,199 | $ | 422,670 | ||||
Pretium PKG Holdings, Inc. | ||||||||
2021 1st Lien Term Loan, 1 mo. USD Term SOFR + 4.000%, 3 mo. USD Term SOFR + 4.000% | ||||||||
9.441% VRN 10/02/28 | 422,649 | 255,216 | ||||||
2021 2nd Lien Term Loan, 1 mo. USD Term SOFR + 6.750%, 3 mo. USD Term SOFR + 6.750% | ||||||||
12.191% VRN 10/01/29 | 254,237 | 75,544 | ||||||
Proampac PG Borrower LLC, 2023 Term Loan, | ||||||||
0.000% 9/15/28 (f) | 1,000,000 | 993,500 | ||||||
| 4,168,266 | ||||||||
Pharmaceuticals — 5.3% | ||||||||
Aenova Holding GmbH, 2021 EUR Term Loan B, 3 mo. EUR EURIBOR + 4.500% | ||||||||
8.205% VRN 3/06/26 EUR (g) | 500,000 | 525,982 | ||||||
Amneal Pharmaceuticals LLC, 2018 Term Loan B (Acquired 12/14/21, Cost $1,093,627), 1 mo. USD Term SOFR + 3.500% | ||||||||
8.931% VRN 5/04/25 (d) | 1,100,993 | 1,078,973 | ||||||
Elanco Animal Health, Inc., Term Loan B, 1 mo. USD Term SOFR + 1.750% | ||||||||
7.180% VRN 8/01/27 | 994,477 | 974,448 | ||||||
Financiere Verdi I SAS, 2021 GBP Term Loan B, 3 mo. SONIA + 4.500% | ||||||||
9.686% VRN 4/17/28 GBP (g) | 1,000,000 | 1,081,972 | ||||||
Gainwell Acquisition Corp., Term Loan B, 3 mo. USD Term SOFR + 4.000% | ||||||||
9.490% VRN 10/01/27 | 1,088,662 | 1,060,422 | ||||||
Grifols Worldwide Operations USA, Inc., USD 2019 Term Loan B, 1 mo. USD Term SOFR + 2.000% | ||||||||
7.416% VRN 11/15/27 | 1,000,000 | 982,250 | ||||||
Horizon Therapeutics USA, Inc., Term Loan B1, | ||||||||
7.434% 5/22/26 | 494,267 | 493,802 | ||||||
IVC Acquisition Ltd. | ||||||||
2021 EUR Term Loan B5, 6 mo. EUR EURIBOR + 4.000% | ||||||||
7.687% VRN 2/13/26 EUR (g) | 587,000 | 616,795 | ||||||
Principal | Value | |||||||
2021 GBP Term Loan B3, 3 mo. SONIA + 4.500% | ||||||||
9.204% VRN 2/13/26 GBP (g) | $ | 500,000 | $ | 603,949 | ||||
Jazz Financing Lux Sarl, USD Term Loan, 1 mo. USD Term SOFR + 3.500% | ||||||||
8.931% VRN 5/05/28 | 528,145 | 527,633 | ||||||
Nidda Healthcare Holding AG | ||||||||
2020 EUR Term Loan F, 3 mo. EUR EURIBOR + 3.500% | ||||||||
7.306% VRN 8/21/26 EUR (g) | 925,000 | 969,311 | ||||||
2020 GBP Term Loan F, 3 mo. SONIA + 4.500% | ||||||||
9.704% VRN 8/21/26 GBP (g) | 500,000 | 603,419 | ||||||
Organon & Co., USD Term Loan, 1 mo. USD Term SOFR + 3.000% | ||||||||
8.442% VRN 6/02/28 | 342,814 | 341,786 | ||||||
PRA Health Sciences, Inc., US Term Loan, 3 mo. USD Term SOFR + 2.250% | ||||||||
7.902% VRN 7/03/28 | 138,979 | 138,868 | ||||||
| 9,999,610 | ||||||||
Pipelines — 1.2% | ||||||||
Buckeye Partners LP, 2021 Term Loan B, 3 mo. USD Term SOFR + 2.250% | ||||||||
7.666% VRN 11/01/26 | 383,885 | 383,310 | ||||||
Freeport LNG Investments LLLP, Term Loan B, 3 mo. USD Term SOFR + 3.500% | ||||||||
9.088% VRN 12/21/28 | 1,076,682 | 1,065,582 | ||||||
Oryx Midstream Services Permian Basin LLC, 2023 Incremental Term Loan, 1 mo. USD Term SOFR + 3.250% | ||||||||
8.692% VRN 10/05/28 | 764,368 | 763,175 | ||||||
| 2,212,067 | ||||||||
Private Equity — 0.3% | ||||||||
GTCR W Merger Sub LLC, USD Term Loan B, | ||||||||
0.000% 9/20/30 (f) | 551,687 | 551,284 | ||||||
Real Estate — 0.0% | ||||||||
Cushman & Wakefield U.S. Borrower LLC, 2020 Term Loan B, 3 mo. USD Term SOFR + 2.750% | ||||||||
8.181% VRN 8/21/25 | 50,868 | 50,753 | ||||||
The accompanying notes are an integral part of the financial statements.
24
MassMutual Global Floating Rate Fund – Portfolio of Investments (Continued) |
Principal | Value | |||||||
Retail — 5.3% | ||||||||
1011778 BC Unlimited Liability Co., 2023 Term Loan B5, 1 mo. USD Term SOFR + 2.250% | ||||||||
7.566% VRN 9/23/30 | $ | 1,095,308 | $ | 1,090,522 | ||||
Constellation Automotive Ltd., GBP 2nd Lien Term Loan B, 6 mo. SONIA + 7.500% | ||||||||
12.684% VRN 7/27/29 GBP (g) | 500,000 | 420,745 | ||||||
Foundation Building Materials Holding Co. LLC, 2021 Term Loan, 3 mo. USD Term SOFR + 3.250% | ||||||||
8.881% VRN 1/31/28 | 535,132 | 529,016 | ||||||
Great Outdoors Group LLC, 2021 Term Loan B1, 1 mo. USD Term SOFR + 3.750% | ||||||||
9.402% VRN 3/06/28 | 957,888 | 954,641 | ||||||
Harbor Freight Tools USA, Inc., 2021 Term Loan B, 1 mo. USD Term SOFR + 2.750% | ||||||||
8.181% VRN 10/19/27 | 952,282 | 944,054 | ||||||
IRB Holding Corp., 2022 Term Loan B, 1 mo. USD Term SOFR + 3.000% | ||||||||
8.416% VRN 12/15/27 | 615,913 | 613,067 | ||||||
Kodiak Building Partners, Inc. ., Term Loan B, 3 mo. USD Term SOFR + 3.250% | ||||||||
8.902% VRN 3/12/28 (f) | 499,604 | 498,250 | ||||||
LBM Acquisition LLC, Term Loan B, 1 mo. USD Term SOFR + 3.750% | ||||||||
9.181% VRN 12/17/27 | 461,971 | 450,159 | ||||||
Medical Solutions Holdings, Inc., 2021 1st Lien Term Loan, 3 mo. USD Term SOFR + 3.250% | ||||||||
8.772% VRN 11/01/28 | 10,129 | 9,783 | ||||||
Michaels Cos., Inc., 2021 Term Loan B, 3 mo. USD Term SOFR + 4.250% | ||||||||
9.902% VRN 4/15/28 | 701,367 | 638,560 | ||||||
Park River Holdings, Inc., Term Loan, 6. mo. USD LIBOR + 3.250% | ||||||||
8.522% VRN 12/28/27 | 540,411 | 520,762 | ||||||
Petco Health and Wellness Co., Inc., 2021 Term Loan B, 3 mo. USD Term SOFR + 3.250% | ||||||||
8.902% VRN 3/03/28 | 671,173 | 662,783 | ||||||
PetSmart, Inc., 2021 Term Loan B, 1 mo. USD Term SOFR + 3.750% | ||||||||
9.166% VRN 2/11/28 | 225,142 | 224,217 | ||||||
Principal | Value | |||||||
Serta Simmons Bedding LLC, 2023 New Term Loan, 3 mo. USD Term SOFR + 7.500% | ||||||||
12.900% VRN 6/29/28 | $ | 894 | $ | 891 | ||||
SRS Distribution, Inc., 2021 Term Loan B, 1 mo. USD Term SOFR + 3.500% | ||||||||
8.931% VRN 6/02/28 | 1,070,180 | 1,058,140 | ||||||
Staples, Inc., 7 Year Term Loan, 3 mo. USD LIBOR + 5.000% | ||||||||
10.634% VRN 4/16/26 | 586,025 | 501,590 | ||||||
White Cap Buyer LLC, Term Loan B, 1 mo. USD Term SOFR + 3.750% | ||||||||
9.066% VRN 10/19/27 | 1,022,211 | 1,019,420 | ||||||
| 10,136,600 | ||||||||
Software — 9.7% | ||||||||
AppLovin Corp., 2021 Term Loan B, 1 mo. USD Term SOFR + 3.100% | ||||||||
8.416% VRN 10/25/28 | 679,762 | 678,545 | ||||||
Ascend Learning LLC | ||||||||
2021 Term Loan, 1 mo. USD Term SOFR + 3.500% | ||||||||
8.916% VRN 12/11/28 | 865,094 | 823,596 | ||||||
2021 2nd Lien Term Loan, 1 mo. USD Term SOFR + 5.750% | ||||||||
11.166% VRN 12/10/29 | 454,545 | 386,173 | ||||||
Athenahealth Group, Inc., 2022 Term Loan B, 1 mo. USD Term SOFR + 3.250% | ||||||||
8.568% VRN 2/15/29 (f) | 1,497,729 | 1,467,310 | ||||||
Banff Merger Sub, Inc. | ||||||||
2021 USD Term Loan, 1 mo. USD Term SOFR + 3.750% | ||||||||
9.181% VRN 10/02/25 | 826,311 | 825,055 | ||||||
2021 USD 2nd Lien Term Loan, 1 mo. USD Term SOFR + 5.500% | ||||||||
10.931% VRN 2/27/26 | 283,962 | 282,289 | ||||||
CDK Global, Inc., 2022 USD Term Loan B, 3 mo. USD Term SOFR + 4.250% | ||||||||
9.640% VRN 7/06/29 | 689,501 | 689,129 | ||||||
Cloud Software Group, Inc., 2022 USD Term Loan A, 3 mo. USD Term SOFR + 4.500% | ||||||||
9.990% VRN 9/29/28 | 162,306 | 155,588 | ||||||
Cloudera, Inc. | ||||||||
2021 Term Loan, 1 mo. USD Term SOFR + 3.750% | ||||||||
9.166% VRN 10/08/28 | 1,255,581 | 1,230,470 | ||||||
The accompanying notes are an integral part of the financial statements.
25
MassMutual Global Floating Rate Fund – Portfolio of Investments (Continued) |
Principal | Value | |||||||
2021 Second Lien Term Loan, 1 mo. USD Term SOFR + 6.000% | ||||||||
11.416% VRN 10/08/29 | $ | 566,667 | $ | 535,500 | ||||
Iris Bidco Ltd., 2018 GBP Term Loan B, 1 mo. SONIA + 4.250% | ||||||||
9.463% VRN 9/03/25 GBP (g) | 1,000,000 | 1,213,999 | ||||||
Ivanti Software, Inc., 2021 Term Loan B, 3 mo. USD Term SOFR + 4.250% | ||||||||
9.758% VRN 12/01/27 | 472,127 | 406,917 | ||||||
Loyalty Ventures, Inc., Term Loan B, 3 mo. U.S. (Fed) Prime Rate + 5.500% | ||||||||
14.000% VRN 11/03/27 | 1,440,555 | 7,203 | ||||||
MedAssets Software Intermediate Holdings, Inc. | ||||||||
2021 Term Loan, 1 mo. USD Term SOFR + 4.000% | ||||||||
9.431% VRN 12/18/28 | 929,290 | 755,513 | ||||||
2021 2nd Lien Term Loan, 1 mo. USD Term SOFR + 6.750% | ||||||||
12.181% VRN 12/17/29 | 308,219 | 191,096 | ||||||
Mitchell International, Inc. | ||||||||
2021 Term Loan B, 1 mo. USD Term SOFR 4.000% | ||||||||
9.181% VRN 10/15/28 | 725,787 | 712,875 | ||||||
2021 2nd Lien Term Loan, 1 mo. USD Term SOFR + 6.500% | ||||||||
11.931% VRN 10/15/29 | 400,000 | 366,252 | ||||||
Playtika Holding Corp., 2021 Term Loan, 1 mo. USD Term SOFR + 2.750% | ||||||||
8.181% VRN 3/13/28 | 480,639 | 479,740 | ||||||
Polaris Newco LLC, USD Term Loan B, 1 mo. USD Term SOFR + 4.000% | ||||||||
9.431% VRN 6/02/28 | 874,653 | 836,229 | ||||||
Project Boost Purchaser, LLC, 2021 Incremental Term Loan, | ||||||||
0.000% 5/30/26 (f) | 575,230 | 573,550 | ||||||
Project Ruby Ultimate Parent Corp., 2021 Term Loan, 1 mo. USD Term SOFR + 3.250% | ||||||||
8.681% VRN 3/10/28 (f) | 748,082 | 737,639 | ||||||
Quest Software US Holdings, Inc. | ||||||||
2022 Term Loan, 3 mo. USD Term SOFR + 4.250% | ||||||||
9.769% VRN 2/01/29 | 534,327 | 443,828 | ||||||
2022 2nd Lien Term Loan, 3 mo. USD Term SOFR + 7.500% | ||||||||
13.019% VRN 2/01/30 | 1,604,636 | 1,091,152 | ||||||
Principal | Value | |||||||
Skopima Merger Sub, Inc., Term Loan B, 1 mo. USD Term SOFR + 4.000% | ||||||||
9.431% VRN 5/12/28 | $ | 1,181,518 | $ | 1,148,920 | ||||
Sovos Compliance LLC, 2021 Term Loan, | ||||||||
0.000% 8/11/28 (f) | 748,098 | 735,178 | ||||||
SS&C Technologies, Inc., 2018 Term Loan B5, 1 mo. USD Term SOFR + 1.750% | ||||||||
7.181% VRN 4/16/25 | 425,006 | 424,760 | ||||||
Ultimate Software Group, Inc., 2021 2nd Lien Term Loan, 3 mo. USD Term SOFR + 5.250% | ||||||||
10.618% VRN 5/03/27 | 195,332 | 194,844 | ||||||
Veritas US, Inc. | ||||||||
2021 EUR Term Loan B, 3 mo. EUR EURIBOR + 4.750% | ||||||||
8.348% VRN 9/01/25 EUR (g) | 729,422 | 673,288 | ||||||
2021 USD Term Loan B, 1 mo. USD Term SOFR + 5.000% | ||||||||
10.431% VRN 9/01/25 | 325,620 | 281,254 | ||||||
| 18,347,892 | ||||||||
Telecommunications — 3.5% | ||||||||
Consolidated Communications, Inc., 2021 Term Loan B, 1 mo. USD Term SOFR + 3.500% | ||||||||
8.931% VRN 10/02/27 | 275,793 | 243,732 | ||||||
Delta TopCo, Inc., 2020 Term Loan B, 6 mo. USD Term SOFR + 3.750% | ||||||||
9.069% VRN 12/01/27 | 482,567 | 477,225 | ||||||
GoTo Group, Inc., Term Loan B, 3 mo. USD Term SOFR + 4.750% | ||||||||
10.269% VRN 8/31/27 | 557,735 | 367,726 | ||||||
Intelsat Jackson Holdings SA, 2021 Exit Term Loan B, 3 mo. USD Term SOFR + 4.250% | ||||||||
9.772% VRN 2/01/29 | 896,887 | 894,034 | ||||||
Iridium Satellite LLC, 2023 Term Loan B, | ||||||||
0.000% 9/20/30 (f) | 206,595 | 206,165 | ||||||
Level 3 Financing, Inc., 2019 Term Loan B, 1 mo. USD Term SOFR + 1.750% | ||||||||
7.181% VRN 3/01/27 | 774,956 | 730,590 | ||||||
Lorca Holdco Ltd., 2021 EUR Term Loan B2, 6 mo. EUR EURIBOR + 3.700% | ||||||||
7.522% VRN 9/17/27 EUR (g) | 1,000,000 | 1,048,951 | ||||||
The accompanying notes are an integral part of the financial statements.
26
MassMutual Global Floating Rate Fund – Portfolio of Investments (Continued) |
Principal | Value | |||||||
Nuuday A S, EUR Term Loan B, 3 mo. EUR EURIBOR + 6.500% | ||||||||
10.448% VRN 2/03/28 EUR (g) | $ | 1,000,000 | $ | 1,055,928 | ||||
Venga Finance Sarl, 2021 USD Term Loan B, 3 mo. USD Term SOFR + 4.750% | ||||||||
10.434% VRN 6/28/29 | 913,846 | 904,708 | ||||||
Zayo Group Holdings, Inc., USD Term Loan, 1 mo. USD Term SOFR + 3.000% | ||||||||
8.431% VRN 3/09/27 | 870,123 | 708,550 | ||||||
| 6,637,609 | ||||||||
Transportation — 1.4% | ||||||||
Anarafe SLU | ||||||||
2023 EUR PIK New Money Facility F, 3 mo. EUR EURIBOR + 10.000 | ||||||||
13.597% VRN 6/30/25 EUR (b) (e) (g) | 262 | 263 | ||||||
2023 EUR New Money Delayed Draw Term Loan, 3 mo. EUR EURIBOR + 10.000% | ||||||||
13.597% VRN 6/30/25 EUR (b) (e) (g) | 64,403 | 59,034 | ||||||
2023 EUR New Money Facility C, 3 mo. EUR EURIBOR + 10.000% | ||||||||
13.597% VRN 6/30/25 EUR (b) (e) (g) | 13,207 | 13,265 | ||||||
First Student Bidco, Inc. | ||||||||
Term Loan B, 3 mo. USD Term SOFR + 3.000% | ||||||||
8.400% VRN 7/21/28 | 1,157,208 | 1,126,473 | ||||||
Term Loan C, 3 mo. USD LIBOR + 3.000% | ||||||||
8.652% VRN 7/21/28 | 433,755 | 422,235 | ||||||
Kenan Advantage Group, Inc., 2021 Term Loan B1, 3 mo. USD Term SOFR + 3.750% | ||||||||
9.477% VRN 3/24/26 | 258,728 | 257,326 | ||||||
PODS, LLC, 2021 Term Loan B, 1 mo. USD Term SOFR + 3.000% | ||||||||
8.446% VRN 3/31/28 | 107,168 | 103,668 | ||||||
Worldwide Express Operations LLC, 2021 1st Lien Term Loan, 3 mo. USD Term SOFR + 4.000% | ||||||||
9.652% VRN 7/26/28 | 725,668 | 712,816 | ||||||
| 2,695,080 | ||||||||
TOTAL BANK LOANS (Cost $179,283,940) | 166,487,618 | |||||||
Principal | Value | |||||||
CORPORATE DEBT — 3.9% | ||||||||
Building Materials — 0.1% | ||||||||
Emerald Debt Merger Sub LLC | ||||||||
6.375% 12/15/30 EUR (g) (h) | $ | 100,000 | $ | 105,338 | ||||
Commercial Services — 1.5% | ||||||||
ADT Security Corp. | ||||||||
4.125% 8/01/29 (h) | 1,250,000 | 1,056,887 | ||||||
Albion Financing 1 Sarl/Aggreko Holdings, Inc. | ||||||||
5.250% 10/15/26 EUR (g) (h) | 260,000 | 259,766 | ||||||
Travelex Issuerco Ltd. | ||||||||
12.500% 8/05/25 GBP (g) (h) | 635,292 | 910,766 | ||||||
Verisure Holding AB | ||||||||
3.250% 2/15/27 EUR (g) (h) | 500,000 | 474,441 | ||||||
7.125% 2/01/28 EUR (g) (h) | 200,000 | 213,565 | ||||||
| 2,915,425 | ||||||||
Diversified Financial Services — 0.0% | ||||||||
Travelex Financing PLC | ||||||||
8.000% 5/15/22 EUR (g) (h) (i) | 250,000 | 991 | ||||||
Entertainment — 0.4% | ||||||||
CPUK Finance Ltd. | ||||||||
4.875% 2/28/47 GBP (g) (h) | 600,000 | 692,712 | ||||||
6.500% 8/28/26 GBP (g) (h) | 100,000 | 116,211 | ||||||
| 808,923 | ||||||||
Forest Products & Paper — 0.1% | ||||||||
WEPA Hygieneprodukte GmbH 3 mo. EUR EURIBOR + 2.875% | ||||||||
6.720% FRN 12/15/26 EUR (g) (h) | 200,000 | 205,635 | ||||||
Insurance — 0.3% | ||||||||
Alliant Holdings Intermediate LLC/Alliant Holdings Co-Issuer | ||||||||
6.750% 4/15/28 (h) | 500,000 | 482,527 | ||||||
Internet — 0.2% | ||||||||
United Group BV | ||||||||
4.000% 11/15/27 EUR (g) (h) | 500,000 | 459,904 | ||||||
Lodging — 0.1% | ||||||||
TVL Finance PLC | ||||||||
3 mo. EUR EURIBOR + 5.500% 9.214% FRN 4/28/28 EUR (g) (h) | 100,000 | 105,863 | ||||||
10.250% 4/28/28 GBP (g) (h) | 100,000 | 122,376 | ||||||
| 228,239 | ||||||||
Machinery – Diversified — 0.1% | ||||||||
Galapagos SA 3 mo. EUR EURIBOR + 4.750% | ||||||||
1.000% VRN 6/15/21 EUR (g) (h) (i) | 20,000 | 106 | ||||||
Mangrove Luxco III Sarl | ||||||||
7.775% 10/09/25 EUR (g) (h) | 277,027 | 267,950 | ||||||
| 268,056 | ||||||||
The accompanying notes are an integral part of the financial statements.
27
MassMutual Global Floating Rate Fund – Portfolio of Investments (Continued) |
Principal | Value | |||||||
Media — 0.2% | ||||||||
Tele Columbus AG | ||||||||
3.875% 5/02/25 EUR (g) (h) | $ | 700,000 | $ | 425,543 | ||||
Oil & Gas — 0.2% | ||||||||
KCA Deutag Pikco PLC | ||||||||
15.000% 12/01/27 | 291,561 | 294,112 | ||||||
Oil & Gas Services — 0.2% | ||||||||
KCA Deutag UK Finance PLC Secured Overnight Financing Rate + 9.000% | ||||||||
14.300% FRN 12/01/25 | 411,567 | 415,889 | ||||||
Packaging & Containers — 0.4% | ||||||||
Ardagh Packaging Finance PLC/Ardagh Holdings USA, Inc. | ||||||||
2.125% 8/15/26 EUR (g) (h) | 500,000 | 468,520 | ||||||
Mauser Packaging Solutions Holding Co. | ||||||||
7.875% 8/15/26 (h) | 203,000 | 195,841 | ||||||
| 664,361 | ||||||||
Retail — 0.0% | ||||||||
House of Fraser Funding PLC 1 mo. GBP LIBOR + 4.250% | ||||||||
1.000% VRN 9/15/20 GBP (g) (h) (i) | 300,000 | 366 | ||||||
Transportation — 0.1% | ||||||||
Anarafe SL | ||||||||
3 mo. EUR EURIBOR + 11.750% 15.702% VRN 3/31/26 EUR (g) (h) | 188,488 | 97,647 | ||||||
3 mo. EUR EURIBOR + 11.750% 15.702% VRN 3/31/26 EUR (g) (h) | 194,732 | 100,881 | ||||||
| 198,528 | ||||||||
TOTAL CORPORATE DEBT (Cost $9,123,077) | 7,473,837 | |||||||
TOTAL BONDS & NOTES (Cost $188,407,017) | 173,961,455 | |||||||
Number of | Value | |||||||
WARRANTS — 0.0% | ||||||||
Technology — 0.0% | ||||||||
Software — 0.0% | ||||||||
TCS BSA, N.V. (Acquired 6/08/23, Cost $0) (a) (b) (d) (e) | 923,221 | $ | — | |||||
Travelex Ltd. (a) | 285 | 14,257 | ||||||
| 14,257 | ||||||||
| 14,257 | ||||||||
TOTAL WARRANTS (Cost $0) | 14,257 | |||||||
TOTAL LONG-TERM INVESTMENTS (Cost $190,311,159) | 175,842,225 | |||||||
SHORT-TERM INVESTMENTS — 5.4% | ||||||||
Investment of Cash Collateral from Securities Loaned — 0.0% | ||||||||
State Street Navigator Securities Lending Government Money Market Portfolio (j) | 14,521 | 14,521 | ||||||
Principal | ||||||||
Repurchase Agreement — 5.4% | ||||||||
Fixed Income Clearing Corp., Repurchase Agreement, dated 9/29/23, 1.600%, due 10/02/23 (k) | $ | 10,242,246 | 10,242,246 | |||||
TOTAL SHORT-TERM INVESTMENTS (Cost $10,256,767) | 10,256,767 | |||||||
TOTAL INVESTMENTS — 98.0% (Cost $200,567,926) (l) | 186,098,992 | |||||||
Other Assets/(Liabilities) — 2.0% | 3,775,042 | |||||||
NET ASSETS — 100.0% | $ | 189,874,034 | ||||||
Abbreviation Legend
FRN | Floating Rate Note |
LIBOR | London InterBank Offered Rate |
SOFR | Secured overnight Financing Rate |
SONIA | Sterling Overnight Index Average |
VRN | Variable Rate Note |
The accompanying notes are an integral part of the financial statements.
28
MassMutual Global Floating Rate Fund – Portfolio of Investments (Continued) |
Notes to Portfolio of Investments
Percentages are stated as a percent of net assets.
(a) | Non-income producing security. |
(b) | This security is fair valued in good faith in accordance with procedures approved by the Board of Trustees. At September 30, 2023, these securities amounted to a value of $1,899,985 or 1.00% of net assets. |
(c) | Denotes all or a portion of security on loan. The total value of securities on loan as of September 30, 2023, was $11,828 or 0.01% of net assets. (Note 2). |
(d) | Restricted security. Certain securities are restricted to resale. At September 30, 2023, these securities amounted to a value of $3,675,364 or 1.94% of net assets. The Fund generally bears the costs, if any, associated with the disposition of restricted securities. |
(e) | Investment is valued using significant unobservable inputs. |
(f) | All or a portion of the security represents unsettled bank loan commitments at September 30, 2023 where the rate will be determined at time of settlement. |
(g) | The principal amount of the security is in foreign currency. The market value is in U.S. dollars. |
(h) | Security is exempt from registration under Regulation S or Rule 144A of the Securities Act of 1933. These securities are considered restricted and may be resold in transactions exempt from registration. At September 30, 2023, the aggregate market value of these securities amounted to $6,763,836 or 3.56% of net assets. |
(i) | Security is currently in default due to bankruptcy or failure to make payment of principal or interest of the issuer. Income is not being accrued. At September 30, 2023, these securities amounted to a value of $1,463 or 0.00% of net assets. |
(j) | Represents investment of security lending cash collateral. (Note 2). |
(k) | Maturity value of $10,243,612. Collateralized by U.S. Government Agency obligations with a rate of 0.375%, maturity date of 1/31/26, and an aggregate market value, including accrued interest, of $10,447,149. |
(l) | See Note 6 for aggregate cost for federal tax purposes. |
Country weightings, as a percentage of net assets, is as follows:
United States | 64.4 | % | ||
United Kingdom | 9.8 | % | ||
Luxembourg | 4.6 | % | ||
Germany | 2.8 | % | ||
France | 2.0 | % | ||
Jersey, Channel Islands | 1.8 | % | ||
Canada | 1.5 | % | ||
Sweden | 1.2 | % | ||
Denmark | 1.1 | % | ||
Spain | 1.0 | % | ||
Singapore | 0.6 | % | ||
Ireland | 0.5 | % | ||
Belgium | 0.4 | % | ||
Norway | 0.4 | % | ||
Netherlands | 0.3 | % | ||
Slovenia | 0.2 | % | ||
Australia | 0.1 | % | ||
Switzerland | 0.0 | % | ||
Total Long-Term Investments | 92.7 | % | ||
Short-Term Investments and Other Assets and Liabilities | 7.3 | % | ||
Net Assets | 100.0 | % |
Forward contracts
Counterparty | Settlement | Currency Purchased | Currency Sold | Unrealized | ||||||||||||||||||||
Morgan Stanley & Co. LLC* | 10/18/23 | GBP | 463,160 | USD | 577,902 | $ | (12,749 | ) | ||||||||||||||||
Morgan Stanley & Co. LLC* | 10/18/23 | USD | 11,093,855 | GBP | 8,891,181 | 244,744 | ||||||||||||||||||
Morgan Stanley & Co. LLC* | 10/18/23 | USD | 35,737,389 | EUR | 33,260,258 | 551,411 | ||||||||||||||||||
| $ | 783,406 | |||||||||||||||||||||||
* | Contracts are subject to a master netting agreement or similar agreement. |
Currency Legend
EUR | Euro |
GBP | British Pound |
USD | U.S. Dollar |
The accompanying notes are an integral part of the financial statements.
29
MassMutual Global Credit Income Opportunities Fund – Portfolio of Investments |
September 30, 2023 |
Number of | Value | |||||||
EQUITIES — 0.5% | ||||||||
COMMON STOCK — 0.5% | ||||||||
France — 0.0% | ||||||||
Technicolor Creative Studios SA (Acquired 6/08/23, Cost $26,150) (a) (b) | 9,832 | $ | 16,926 | |||||
Vantiva SA (a) | 14,662 | 2,385 | ||||||
| 19,311 | ||||||||
Germany — 0.0% | ||||||||
Campfire Topco Ltd. (a) (c) (d) | 448,154 | — | ||||||
Spain — 0.0% | ||||||||
Bahia De Las Isletas SL, Class A2 (a) (c) (d) | 349 | — | ||||||
Bahia De Las Isletas SL, Class A3 (a) (c) (d) | 49 | — | ||||||
Bahia De Las Isletas SL, Class B2 (a) (c) (d) | 445 | — | ||||||
Bahia De Las Isletas SL, Class B3 (a) (c) (d) | 62 | — | ||||||
| — | ||||||||
United Kingdom — 0.2% | ||||||||
Don Jersey Topco Ltd. (Acquired 8/03/20-1/11/22, Cost $205,530) (a) (b) (c) (d) | 292,774 | 125,025 | ||||||
Innovation Group PLC (a) (c) (d) | 21,315 | — | ||||||
Innovation Group PLC (a) (c) (d) | 83,667 | — | ||||||
Jubilee Topco Ltd. (a) (c) (d) | 746,865 | — | ||||||
KCA Deutag International Ltd. (a) | 2,731 | 152,936 | ||||||
Travelex Topco Ltd. (a) (c) (d) | 9,573 | — | ||||||
| 277,961 | ||||||||
United States — 0.3% | ||||||||
Learfield Communications, Inc. (a) (c) | 4,698 | 178,524 | ||||||
Serta Simmons, Inc. (a) (c) | 14,736 | 221,040 | ||||||
| 399,564 | ||||||||
TOTAL COMMON STOCK (Cost $723,991) | 696,836 | |||||||
TOTAL EQUITIES (Cost $723,991) | 696,836 | |||||||
Principal | Value | |||||||
BONDS & NOTES — 91.9% | ||||||||
BANK LOANS — 41.0% | ||||||||
Australia — 0.0% | ||||||||
Voyage Australia Pty Ltd., USD Term Loan B, 3 mo. USD Term SOFR + 3.500%, VRN | ||||||||
9.088% 7/20/28 | $ | 47,495 | $ | 47,020 | ||||
Belgium — 0.8% | ||||||||
CEP IV Investment 16 Sarl, USD 2nd Lien Term Loan, 3 mo. USD Term SOFR + 9.250%, VRN | ||||||||
14.526% 10/01/27 | 1,167,684 | 992,531 | ||||||
Canada — 0.3% | ||||||||
Air Canada, 2021 Term Loan B, 3 mo. USD Term SOFR + 3.500%, VRN | ||||||||
9.128% 8/11/28 | 349,293 | 349,219 | ||||||
Denmark — 0.4% | ||||||||
Auris Luxembourg III Sarl, EUR Term Loan B1A, 6 mo. EUR EURIBOR + 4.000%, VRN | ||||||||
7.781% 2/27/26 EUR (e) | 500,000 | 513,670 | ||||||
France — 0.9% | ||||||||
Casper BidCo SAS, 2020 EUR Term Loan B3A, 6 mo. EUR EURIBOR + 3.375%, VRN | ||||||||
7.569% 7/31/26 EUR (e) | 500,000 | 520,696 | ||||||
Cerba Healthcare SAS, 2021 EUR Term Loan B | ||||||||
0.000% 6/30/28 EUR (e) (f) | 500,000 | 509,272 | ||||||
Technicolor Creative Studios Inc. | ||||||||
2023 EUR PIK Reinstated Term Loan B (Acquired 6/08/23, Cost $162,768), 6 mo. EUR EURIBOR + 0.500%, VRN | ||||||||
4.294% 9/15/26 EUR (b) (e) | 203,359 | 111,493 | ||||||
2023 EUR PIK Term Loan (Acquired 6/08/23, Cost $2,814), 3 mo.EUR EURIBOR + 0.500%, VRN | ||||||||
13.597% 6/08/33 EUR (b) (c) (d) (e) | 82,145 | — | ||||||
| 1,141,461 | ||||||||
Germany — 1.3% | ||||||||
Aenova Holding GmbH, 2021 EUR Term Loan B, 3 mo. EUR EURIBOR + 4.500%, VRN | ||||||||
8.205% 3/06/26 EUR (e) | 500,000 | 525,982 | ||||||
Campfire Bidco Ltd., EUR Super Senior Term Loan, 3 mo. EUR EURIBOR + 8.000%, VRN | ||||||||
11.770% 6/30/26 EUR (e) | 101,113 | 107,202 | ||||||
The accompanying notes are an integral part of the financial statements.
30
MassMutual Global Credit Income Opportunities Fund – Portfolio of Investments (Continued) |
Principal | Value | |||||||
Iris BidCo GmbH, EUR Term Loan B, 3 mo. EUR EURIBOR + 5.000%, VRN | ||||||||
8.714% 6/29/28 EUR (e) | $ | 500,000 | $ | 515,119 | ||||
Nidda Healthcare Holding AG, 2020 EUR Term Loan F | ||||||||
0.000% VRN 8/21/26 EUR (e) (f) | 500,000 | 523,952 | ||||||
| 1,672,255 | ||||||||
Ireland — 0.8% | ||||||||
ION Trading Technologies Sarl, 2021 EUR Term Loan B, 3 mo. EUR EURIBOR + 4.250%, VRN | ||||||||
8.222% 4/03/28 EUR (e) | 989,811 | 1,027,924 | ||||||
Jersey, Channel Islands — 0.2% | ||||||||
Campfire Bidco Ltd., USD Opco Term Loan, 3 mo. USD Term SOFR + 4.250%, VRN | ||||||||
9.856% 12/31/26 | 174,444 | 162,124 | ||||||
Campfire TopCo Ltd. | ||||||||
USD First Lien HoldCo Facility, 3 mo. USD Term SOFR + 0.100%, VRN | ||||||||
5.706% 12/31/27 | 82,611 | 58,241 | ||||||
USD Second Lien HoldCo Facility, 3 mo. USD Term SOFR + 0.100%, VRN | ||||||||
5.706% 12/31/27 | 110,166 | 22,217 | ||||||
| 242,582 | ||||||||
Luxembourg — 3.7% | ||||||||
Albion Financing 3 Sarl, 2023 EUR Term Loan, 3 mo. EUR EURIBOR + 5.250%, VRN | ||||||||
8.948% 8/17/26 EUR (e) | 510,000 | 539,273 | ||||||
Alpha Group Sarl, EUR Term Loan B, 3 mo. EUR EURIBOR + 3.750%, VRN | ||||||||
7.722% 1/31/25 EUR (e) | 500,000 | 522,583 | ||||||
Altice Financing SA, 2023 EUR Term Loan, | ||||||||
0.000% 10/31/27 EUR (e) (f) | 500,000 | 507,480 | ||||||
Arvos BidCo Sarl | ||||||||
USD 1st Lien Term Loan B1 (Acquired 7/31/23, Cost $327,548), 3 mo. USD LIBOR + 5.762%, VRN | ||||||||
11.131% 8/29/24 (b) | 329,913 | 131,965 | ||||||
USD 1st Lien Term Loan B2 (Acquired 7/31/23, Cost $327,548), 3 mo. USD LIBOR + 5.762%, VRN | ||||||||
11.131% 8/29/24 (b) | 329,913 | 131,965 | ||||||
Principal | Value | |||||||
CCP Lux Holding Sarl, 2023 EUR Term Loan B, 3 mo. EUR EURIBOR + 4.750%, VRN | ||||||||
8.390% 1/05/28 EUR (e) | $ | 500,000 | $ | 524,000 | ||||
CEP IV Investment 16 Sarl, EUR Term Loan B, 3 mo. EUR EURIBOR + 4.750%, VRN | ||||||||
8.545% 10/03/26 EUR (e) | 500,000 | 486,113 | ||||||
Ineos Finance PLC, 2022 EUR Term Loan B, 1 mo. EUR EURIBOR + 4.000%, VRN | ||||||||
7.858% 11/08/27 EUR (e) | 500,000 | 522,963 | ||||||
Intelsat Jackson Holdings SA, 2021 Exit Term Loan B, 3 mo. USD Term SOFR + 4.250%, VRN | ||||||||
9.772% 2/01/29 | 597,925 | 596,023 | ||||||
Parques Reunidos SAU, 2019 EUR Term Loan B1, 6 mo. EUR EURIBOR + 3.750%, VRN | ||||||||
7.655% 9/16/26 EUR (e) | 500,000 | 522,514 | ||||||
Venga Finance Sarl, 2021 USD Term Loan B, 3 mo. USD Term SOFR + 4.750%, VRN | ||||||||
10.434% 6/28/29 | 299,244 | 296,252 | ||||||
| 4,781,131 | ||||||||
Netherlands — 0.4% | ||||||||
Median BV, 2021 EUR Term Loan B, 6 mo. EUR EURIBOR + 4.925%, VRN | ||||||||
9.061% 10/14/27 EUR (e) | 500,000 | 483,840 | ||||||
Norway — 0.3% | ||||||||
Silk Bidco AS, EUR Term Loan B, 6 mo. EUR EURIBOR + 6.500%, VRN | ||||||||
10.451% 2/28/27 EUR (e) | 500,000 | 412,840 | ||||||
Singapore — 0.6% | ||||||||
Fugue Finance BV, EUR Term Loan, 2 mo. EUR EURIBOR + 4.750%, VRN | ||||||||
8.114% 1/31/28 EUR (e) | 750,000 | 792,613 | ||||||
Spain — 1.5% | ||||||||
Anarafe SLU | ||||||||
2023 EUR New Money Delayed Draw Term Loan, 3 mo. EUR EURIBOR + 10.000%, VRN | ||||||||
13.597% 6/30/25 EUR (c) (d) (e) | 32,726 | 29,998 | ||||||
2023 EUR New Money Facility C, 3 mo. EUR EURIBOR + 10.000%, VRN | ||||||||
13.597% 6/30/25 EUR (c) (d) (e) | 6,711 | 6,741 | ||||||
The accompanying notes are an integral part of the financial statements.
31
MassMutual Global Credit Income Opportunities Fund – Portfolio of Investments (Continued) |
Principal | Value | |||||||
2023 EUR PIK New Money Facility F, 3 mo. EUR EURIBOR + 10.000%,VRN | ||||||||
13.597% 6/30/25 EUR (c) (d) (e) | $ | 133 | $ | 134 | ||||
Deoleo Financial, Ltd., EUR Senior Term Loan (Acquired 6/24/20, Cost $62,999), 3 mo. EUR EURIBOR + 5.500%, VRN | ||||||||
9.441% 6/24/25 EUR (b) (c) (e) | 55,872 | 56,117 | ||||||
Grifols SA, EUR 2019 Term Loan B, 1 mo. EUR EURIBOR + 2.250%, VRN | ||||||||
6.084% 11/15/27 EUR (e) | 1,000,000 | 1,038,421 | ||||||
Grifols Worldwide Operations USA, Inc., USD 2019 Term Loan B, 1 mo. USD Term SOFR + 2.000%, VRN | ||||||||
7.416% 11/15/27 | 300,000 | 294,675 | ||||||
International Park Holdings BV, 2023 EUR Term Loan B, 6 mo. EUR EURIBOR + 5.000%, VRN | ||||||||
8.794% 12/14/26 EUR (e) | 500,000 | 528,128 | ||||||
| 1,954,214 | ||||||||
Sweden — 0.1% | ||||||||
Hilding Anders International AB | ||||||||
2022 EUR PIK Reorg Opco Term Loan (Acquired 10/04/22-7/21/23, Cost $224,959), 3 mo. EUR EURIBOR + 5.000%, VRN | ||||||||
8.648% 2/28/26 EUR (b) (e) | 293,170 | 123,671 | ||||||
2022 EUR PIK Reorg Holdco, 3 mo. EUR EURIBOR + 12.000%, VRN | ||||||||
12.000% 2/28/27 EUR (c) (d) (e) | 272,583 | — | ||||||
2023 EUR New Money Facility (Acquired 9/29/23, Cost $44,231), 6 mo. EUR EURIBOR + 10.000%, VRN | ||||||||
13.616% 1/31/26 EUR (b) (e) | 42,190 | 42,375 | ||||||
| 166,046 | ||||||||
United Kingdom — 4.0% | ||||||||
BCP V Modular Services Holdings IV Ltd., EUR Term Loan B | ||||||||
0.000% VRN 12/15/28 EUR (e) (f) | 500,000 | 495,406 | ||||||
City Football Group Ltd., Term Loan, 1 mo. USD Term SOFR + 3.000%, VRN | ||||||||
8.439% 7/21/28 | 911,598 | 905,901 | ||||||
IVC Acquisition Ltd., 2022 EUR Term Loan B6, 6 mo. EUR EURIBOR + 4.750%, VRN | ||||||||
8.437% 2/13/26 EUR (e) | 500,000 | 526,764 | ||||||
Principal | Value | |||||||
Lernen Bidco Ltd., 2023 EUR Extended Term Loan B, 3 mo. EUR EURIBOR + 4.750%, VRN | ||||||||
8.482% 4/25/29 EUR (e) | $ | 500,000 | $ | 526,146 | ||||
Tunstall Group Holdings Limited, 2023 EUR Reinstated Term Loan B(Acquired 6/23/23, Cost $307,228), 3 mo. EUR EURIBOR + 0.100%, VRN | ||||||||
3.894% 12/20/27 EUR (b) (c) (d) (e) | 282,314 | 268,629 | ||||||
Virgin Media SFA Finance Ltd., GBP Term Loan L, 1 mo. SONIA + 3.250%, VRN | ||||||||
8.468% 1/15/27 GBP (e) | 1,000,000 | 1,200,273 | ||||||
VMED O2 UK Holdco 4 Ltd., 2023 EUR Term Loan Z | ||||||||
0.000% 10/15/31 EUR (e) (f) | 700,000 | 732,060 | ||||||
Vue International Bidco PLC | ||||||||
2023 EUR PIK Term Loan, 6 mo. EUR EURIBOR + 2.000%, VRN | ||||||||
4.859% 12/31/27 EUR (e) | 756,305 | 369,153 | ||||||
2022 EUR Term Loan, 6 mo. EUR EURIBOR + 8.000%, VRN | ||||||||
12.072% 6/30/27 EUR (e) | 157,822 | 160,600 | ||||||
| 5,184,932 | ||||||||
United States — 25.7% | ||||||||
8th Avenue Food & Provisions, Inc. | ||||||||
2018 1st Lien Term Loan, 1 mo. USD Term SOFR + 3.750%, VRN | ||||||||
9.181% 10/01/25 | 408,241 | 391,826 | ||||||
2021 Incremental Term Loan, 1 mo. USD Term SOFR + 4.750%, VRN | ||||||||
10.181% 10/01/25 | 115,914 | 111,229 | ||||||
A-L Parent LLC, 2023 Take Back Term Loan, 1 mo. USD Term SOFR + 5.550%, VRN | ||||||||
10.828% 6/30/28 (f) | 573,237 | 554,607 | ||||||
AlixPartners LLP, 2021 USD Term Loan B | ||||||||
0.000% 2/04/28 (f) | 212,500 | 212,181 | ||||||
AqGen Ascensus, Inc., 2021 2nd Lien Term Loan, 3 mo. USD Term SOFR + 6.500%, VRN | ||||||||
12.030% 8/02/29 | 250,358 | 236,746 | ||||||
Arsenal AIC Parent LLC, Term Loan, 3 mo. USD Term SOFR + 4.500%, VRN | ||||||||
9.879% 8/18/30 | 173,188 | 172,682 | ||||||
Ascend Learning LLC, 2021 Term Loan | ||||||||
0.000% VRN 12/11/28 (f) | 648,350 | 617,249 | ||||||
The accompanying notes are an integral part of the financial statements.
32
MassMutual Global Credit Income Opportunities Fund – Portfolio of Investments (Continued) |
Principal | Value | |||||||
ASP Blade Holdings, Inc., Initial Term Loan | ||||||||
0.000% VRN 10/13/28 (f) | $ | 498,810 | $ | 438,798 | ||||
AssuredPartners, Inc. | ||||||||
2023 Term Loan B4 | ||||||||
0.000% 2/12/27 (f) | 156,863 | 156,766 | ||||||
2020 Term Loan B | ||||||||
0.000% 2/12/27 (f) | 148,316 | 147,899 | ||||||
Asurion LLC | ||||||||
2022 Term Loan B10, 1 mo. USD Term SOFR + 4.000%, VRN | ||||||||
9.416% 8/19/28 | 496,241 | 480,629 | ||||||
2021 Second Lien Term Loan B4, 1 mo. USD Term SOFR + 5.250%, VRN | ||||||||
10.681% 1/20/29 | 375,862 | 332,435 | ||||||
Athenahealth Group, Inc., 2022 Term Loan B, 1 mo. USD Term SOFR + 3.250%, VRN | ||||||||
8.568% 2/15/29 | 659,512 | 646,118 | ||||||
AVSC Holding Corp., 2020 Term Loan B1, 1 mo. USD Term SOFR + 3.250%, VRN | ||||||||
8.568% 3/03/25 | 306,993 | 295,026 | ||||||
Barnes Group, Inc., Term Loan B | ||||||||
0.000% VRN 9/03/30 (f) | 193,273 | 193,369 | ||||||
Bausch & Lomb Corp., 2023 Incremental Term Loan | ||||||||
0.000% 9/14/28 (f) | 512,349 | 505,304 | ||||||
BCPE North Star US HoldCo 2, Inc., Term Loan, 3 mo. USD LIBOR + 4.000%, 3 mo. U.S. (Fed) Prime Rate + 3.000%, VRN | ||||||||
11.500% 6/09/28 | 241,216 | 214,683 | ||||||
Broadstreet Partners, Inc. | ||||||||
2020 Term Loan B | ||||||||
0.000% 1/27/27 (f) | 150,000 | 149,148 | ||||||
2023 Term Loan B3, 1 mo. USD Term SOFR + 4.000%, VRN | ||||||||
9.316% 1/27/29 | 143,673 | 143,493 | ||||||
Carnival Corp., 2021 Incremental Term Loan B, 1 mo. USD Term SOFR + 3.250%, VRN | ||||||||
8.681% 10/18/28 | 877,232 | 871,749 | ||||||
CDK Global, Inc., 2022 USD Term Loan B, 3 mo. USD Term SOFR + 4.250%, VRN | ||||||||
9.640% 7/06/29 | 360,418 | 360,223 | ||||||
Principal | Value | |||||||
Clear Channel Outdoor Holdings, Inc., Term Loan B, 1 mo. USD Term SOFR + 3.500%, 3 mo. USD Term SOFR + 3.500%, VRN | ||||||||
8.818% - 9.131% 8/21/26 | $ | 380,537 | $ | 368,961 | ||||
Cloud Software Group, Inc., 2022 USD Term Loan A, 3 mo. USD Term SOFR + 4.500%, VRN | ||||||||
9.990% 9/29/28 | 162,306 | 155,588 | ||||||
Cloudera, Inc. | ||||||||
2021 Term Loan, 1 mo. USD Term SOFR + 3.750%, VRN | ||||||||
9.166% 10/08/28 | 54,658 | 53,564 | ||||||
2021 Second Lien Term Loan, 1 mo. USD Term SOFR + 6.000%, VRN | ||||||||
11.416% 10/08/29 | 266,667 | 252,000 | ||||||
Clydesdale Acquisition Holdings, Inc., Term Loan B, 1 mo. USD Term SOFR + 4.175%, VRN | ||||||||
9.591% 4/13/29 | 329,051 | 324,210 | ||||||
CoreLogic, Inc. | ||||||||
Term Loan, 1 mo. USD Term SOFR + 3.500%, VRN | ||||||||
8.931% 6/02/28 | 297,722 | 274,523 | ||||||
2nd Lien Term Loan, 1 mo. USD Term SOFR + 6.500%, VRN | ||||||||
11.931% 6/04/29 | 233,375 | 195,645 | ||||||
Cyanco Intermediate 2 Corp., 2023 Term Loan B | ||||||||
0.000% 7/10/28 (f) | 200,000 | 200,062 | ||||||
First Student Bidco, Inc. | ||||||||
Term Loan C | ||||||||
0.000% VRN 7/21/28 (f) | 81,800 | 79,627 | ||||||
Term Loan B | ||||||||
0.000% VRN 7/21/28 (f) | 218,200 | 212,405 | ||||||
Five Star Intermediate Holding LLC, Term Loan, 6 mo. USD Term SOFR + 4.250%, VRN | ||||||||
9.648% 5/05/29 | 324,389 | 305,130 | ||||||
Flint Group Packaging INKS North America Holdings LLC | ||||||||
EUR PIK 2nd lien Holdco Term Loan, 3 mo. EUR EURIBOR + 0.100%, VRN | ||||||||
3.793% 12/31/27 EUR (e) | 348,586 | 73,709 | ||||||
EUR PIK Holdco Term Loan, 3 mo. EUR EURIBOR + 0.100%, VRN | ||||||||
3.794% 12/31/27 EUR (e) | 261,396 | 193,914 | ||||||
The accompanying notes are an integral part of the financial statements.
33
MassMutual Global Credit Income Opportunities Fund – Portfolio of Investments (Continued) |
Principal | Value | |||||||
EUR Opco Term Loan, 3 mo. EUR EURIBOR + 4.250%, VRN | ||||||||
7.944% 12/31/26 EUR (e) | $ | 551,971 | $ | 540,971 | ||||
Fluid-Flow Products, Inc., Term Loan | ||||||||
0.000% VRN 3/31/28 (f) | 200,000 | 197,938 | ||||||
Freeport LNG Investments LLLP, Term Loan B, 3 mo. USD Term SOFR + 3.500%, VRN | ||||||||
9.088% 12/21/28 | 750,000 | 742,267 | ||||||
Gainwell Acquisition Corp., Term Loan B, 3 mo. USD Term SOFR + 4.000%, VRN | ||||||||
9.490% 10/01/27 | 297,704 | 289,982 | ||||||
GHX Ultimate Parent Corp., 2023 Term Loan, 3 mo. USD Term SOFR + 4.750%, VRN | ||||||||
10.117% 6/30/27 | 299,250 | 298,876 | ||||||
Great Outdoors Group LLC, 2021 Term Loan B1, 1 mo. USD Term SOFR + 3.750%, VRN | ||||||||
9.402% 3/06/28 | 600,642 | 598,606 | ||||||
Grinding Media, Inc., 2021 Term Loan B, 3 mo. USD Term SOFR + 4.000%, VRN | ||||||||
9.530% 10/12/28 | 293,035 | 290,104 | ||||||
GTCR W Merger Sub LLC, USD Term Loan B, | ||||||||
0.000% 9/20/30 (f) | 514,908 | 514,532 | ||||||
Gulf Finance LLC, 2021 Term Loan, 1 mo. USD Term SOFR + 6.750%, 6 mo. USD Term SOFR + 6.750%, VRN, | ||||||||
12.194% - 12.631% 8/25/26 | 446,068 | 446,465 | ||||||
Hanesbrands, Inc., 2023 Term Loan B, 1 mo. USD Term SOFR + 3.750%, VRN | ||||||||
9.066% 3/08/30 | 103,121 | 100,800 | ||||||
Hub International Ltd., 2023 Term Loan B, 3 mo. USD Term SOFR + 4.250%, VRN | ||||||||
9.584% 6/20/30 | 175,000 | 175,292 | ||||||
IPS Corp. | ||||||||
2021 Term Loan, | ||||||||
0.000% 10/02/28 (f) | 340,965 | 329,457 | ||||||
2021 Delayed Draw Term Loan, | ||||||||
0.000% 10/02/28 (f) | 5,792 | 5,597 | ||||||
IRB Holding Corp., 2022 Term Loan B, 1 mo. USD Term SOFR + 3.000%, VRN | ||||||||
8.416% 12/15/27 | 299,242 | 297,860 | ||||||
Principal | Value | |||||||
Ivanti Software, Inc., 2021 Term Loan B, 3 mo. USD Term SOFR + 4.250%, VRN | ||||||||
9.758% 12/01/27 | $ | 345,781 | $ | 298,022 | ||||
Journey Personal Care Corp., 2021 Term Loan B, 6 mo. USD LIBOR + 4.250%, VRN | ||||||||
9.981% 3/01/28 | 564,172 | 530,322 | ||||||
LBM Acquisition LLC, Term Loan B, 1 mo. USD Term SOFR + 3.750%, VRN | ||||||||
9.181% 12/17/27 | 242,387 | 236,189 | ||||||
Lifescan Global Corp., 2023 Term Loan, 3 mo. USD Term SOFR + 6.500%, VRN | ||||||||
11.747% 12/31/26 | 125,384 | 98,844 | ||||||
LSF11 A5 Holdco LLC, Term Loan, 1 mo. USD Term SOFR + 3.500%, VRN | ||||||||
8.810% 10/15/28 | 299,241 | 291,834 | ||||||
Magenta Buyer LLC, 2021 USD 1st Lien Term Loan, 3 mo. USD Term SOFR + 5.000%, VRN | ||||||||
10.631% 7/27/28 | 528,136 | 391,407 | ||||||
Mattress Firm, Inc., 2021 Term Loan B | ||||||||
0.000% VRN 9/25/28 (f) | 200,000 | 198,142 | ||||||
McAfee LLC, 2022 USD Term Loan B, 1 mo. USD Term SOFR + 3.750%, VRN | ||||||||
9.180% 3/01/29 | 230,851 | 225,151 | ||||||
MedAssets Software Intermediate Holdings, Inc. | ||||||||
2021 Term Loan, 1 mo. USD Term SOFR + 4.000%, VRN | ||||||||
9.431% 12/18/28 | 198,489 | 161,371 | ||||||
2021 2nd Lien Term Loan, 1 mo. USD Term SOFR + 6.750%, VRN | ||||||||
12.181% 12/17/29 | 205,479 | 127,397 | ||||||
Medical Solutions Holdings, Inc., 2021 2nd Lien Term Loan, 3 mo. USD Term SOFR + 7.000%, VRN | ||||||||
12.522% 11/01/29 | 147,368 | 131,526 | ||||||
Medline Borrower LP, USD Term Loan B, 1 mo. USD Term SOFR + 3.250%, VRN | ||||||||
8.681% 10/23/28 | 903,824 | 900,842 | ||||||
MH Sub I LLC, 2023 Term Loan, 1 mo. USD Term SOFR + 4.250%, VRN | ||||||||
9.566% 5/03/28 | 498,750 | 481,837 | ||||||
The accompanying notes are an integral part of the financial statements.
34
MassMutual Global Credit Income Opportunities Fund – Portfolio of Investments (Continued) |
Principal | Value | |||||||
Midwest Physician Administrative Services LLC, 2021 Term Loan, 3 mo. USD LIBOR + 3.250%, VRN | ||||||||
8.902% 3/12/28 (f) | $ | 199,744 | $ | 186,983 | ||||
Mitchell International, Inc., 2021 Term Loan B | ||||||||
0.000% VRN 10/15/28 (f) | 648,354 | 636,820 | ||||||
Motel 6, Term Loan B, 1 mo. USD Term SOFR + 5.000%, VRN | ||||||||
10.424% 9/09/26 | 141,687 | 140,890 | ||||||
NAPA Management Services Corp., Term Loan B, 1 mo. USD Term SOFR + 5.250%, VRN | ||||||||
10.666% 2/23/29 (f) | 212,120 | 170,227 | ||||||
Neptune Bidco US, Inc., 2022 USD Term Loan B, 3 mo. USD Term SOFR + 5.000%, VRN | ||||||||
10.398% 4/11/29 | 547,940 | 492,006 | ||||||
Nouryon Finance BV, 2023 USD Term Loan B, 1 mo. USD Term SOFR + 4.000%, VRN | ||||||||
9.427% 4/03/28 | 253,435 | 249,844 | ||||||
Padagis LLC, Term Loan B, 3 mo. USD Term SOFR + 4.750%, VRN | ||||||||
10.280% 7/06/28 | 607,211 | 588,490 | ||||||
PECF USS Intermediate Holding III Corp., Term Loan B, 1 mo. USD Term SOFR + 4.250%, 3 mo. USD Term SOFR + 4.250%, VRN | ||||||||
9.568% 12/15/28 | 847,095 | 676,541 | ||||||
Peraton Corp., Term Loan B, 1 mo. USD Term SOFR + 3.750%, VRN | ||||||||
9.166% 2/01/28 | 651,282 | 649,250 | ||||||
Petco Health and Wellness Co., Inc., 2021 Term Loan B, 3 mo. USD Term SOFR + 3.250%, VRN | ||||||||
8.902% 3/03/28 | 238,168 | 235,191 | ||||||
PMHC II, Inc., 2022 Term Loan B, 3 mo. USD Term SOFR + 4.250%, VRN | ||||||||
9.698% 4/23/29 | 339,689 | 319,848 | ||||||
Polaris Newco LLC, USD Term Loan B, 1 mo. USD Term SOFR + 4.000%, VRN | ||||||||
9.431% 6/02/28 | 199,491 | 190,727 | ||||||
Pretium PKG Holdings, Inc., 2021 1st Lien Term Loan, 1 mo. USD Term SOFR + 4.000%, 3 mo. USD Term SOFR + 4.000%, VRN | ||||||||
9.318% - 9.530% 10/02/28 | 82,603 | 49,880 | ||||||
Proampac PG Borrower LLC | ||||||||
2023 Term Loan, | ||||||||
0.000% 11/03/28 (f) | 500,000 | 496,750 | ||||||
Principal | Value | |||||||
2020 Term Loan, 3 mo. USD Term SOFR + 3.750%, 3 mo. U.S. (Fed) Prime Rate + 2.750%, VRN | ||||||||
9.258% 11/03/25 | $ | 494,962 | $ | 491,745 | ||||
Project Ruby Ultimate Parent Corp., 2021 Term Loan, 1 mo. USD Term SOFR + 3.250%, VRN | ||||||||
8.681% 3/10/28 (f) | 398,341 | 392,780 | ||||||
PUG LLC, USD Term Loan, 1 mo. USD Term SOFR + 3.500%, VRN | ||||||||
8.931% 2/12/27 | 128,756 | 121,223 | ||||||
Quest Software US Holdings, Inc. | ||||||||
2022 Term Loan, 3 mo. USD Term SOFR + 4.250%, VRN | ||||||||
9.769% 2/01/29 | 712,190 | 591,566 | ||||||
2022 2nd Lien Term Loan, 3 mo. USD Term SOFR + 7.500%, VRN | ||||||||
13.019% 2/01/30 | 900,831 | 612,565 | ||||||
Radiology Partners, Inc., 2018 1st Lien Term Loan B, 1 mo. USD Term SOFR + 4.250%, VRN | ||||||||
10.179% 7/09/25 | 369,031 | 276,523 | ||||||
Recess Holdings, Inc., 2023 Term Loan, 3 mo. USD Term SOFR + 4.000%, VRN | ||||||||
9.383% 3/17/27 (f) | 300,000 | 299,064 | ||||||
Redstone Holdco 2 LP, 2021 Term Loan, 1 mo. USD Term SOFR + 4.750%, VRN | ||||||||
10.184% 4/27/28 | 184,277 | 156,982 | ||||||
RegionalCare Hospital Partners Holdings, Inc., 2018 Term Loan B, 3 mo. USD Term SOFR + 3.750%, VRN | ||||||||
9.072% 11/16/25 | 387,562 | 386,271 | ||||||
RelaDyne, Inc., 2023 Incremental Term Loan, 1 mo. USD Term SOFR + 5.000%, VRN | ||||||||
10.316% 12/22/28 | 148,438 | 148,252 | ||||||
Scientific Games Holdings LP, 2022 USD Term Loan B, 3 mo. USD Term SOFR + 3.500%, VRN | ||||||||
8.768% 4/04/29 | 495,000 | 491,698 | ||||||
Sedgwick Claims Management Services, Inc., 2023 Term Loan B, | ||||||||
0.000% 2/24/28 (f) | 325,000 | 324,149 | ||||||
Select Medical Corp., 2023 Term Loan B1, 1 mo. USD Term SOFR + 3.000%, VRN | ||||||||
8.316% 3/06/27 | 361,197 | 359,843 | ||||||
The accompanying notes are an integral part of the financial statements.
35
MassMutual Global Credit Income Opportunities Fund – Portfolio of Investments (Continued) |
Principal | Value | |||||||
Skopima Merger Sub, Inc., Term Loan B, 1 mo. USD Term SOFR + 4.000%, VRN | ||||||||
9.431% 5/12/28 (f) | $ | 498,731 | $ | 484,971 | ||||
Sovos Compliance LLC, 2021 Term Loan, 1 mo. USD Term SOFR + 4.500%, VRN | ||||||||
9.931% 8/11/28 (f) | 349,112 | 343,083 | ||||||
Spin Holdco, Inc., 2021 Term Loan, 3 mo. USD Term SOFR + 4.000%, VRN | ||||||||
9.664% 3/04/28 | 199,488 | 171,997 | ||||||
SRS Distribution, Inc., 2021 Term Loan B, 1 mo. USD Term SOFR + 3.500%, VRN | ||||||||
8.931% 6/02/28 | 494,949 | 489,381 | ||||||
Starfruit Finco BV, 2023 Term Loan B, 3 mo. USD Term SOFR + 4.000%, VRN | ||||||||
9.347% 4/03/28 | 116,327 | 114,776 | ||||||
Tiger Acquisition LLC, 2021 Term Loan, 1 mo. USD Term SOFR + 3.250%, VRN | ||||||||
8.666% 6/01/28 (f) | 255,292 | 251,741 | ||||||
Trident TPI Holdings, Inc., 2023 USD Term Loan, 3 mo. USD Term SOFR + 4.500%, VRN | ||||||||
9.890% 9/15/28 | 359,867 | 358,719 | ||||||
Triton Water Holdings, Inc., Term Loan, 3 mo. USD Term SOFR + 3.250%, VRN | ||||||||
8.902% 3/31/28 | 1,725 | 1,679 | ||||||
United Airlines, Inc., 2021 Term Loan B, 1 mo. USD Term SOFR + 3.750%, VRN | ||||||||
9.182% 4/21/28 | 271,241 | 271,303 | ||||||
UPC Financing Partnership, 2021 USD Term Loan AX | ||||||||
0.000% 1/31/29 (f) | 500,000 | 491,875 | ||||||
US Anesthesia Partners, Inc., 2021 Term Loan, 1 mo. USD Term SOFR + 3.500%, VRN | ||||||||
8.931% 5/12/28 | 199,491 | 196,000 | ||||||
USIC Holdings, Inc., 2021 2nd Lien Term Loan, 1 mo. USD Term SOFR + 6.500%, VRN | ||||||||
11.931% 5/14/29 | 147,059 | 136,397 | ||||||
Verscend Holding Corp., 2021 Term Loan B, 1 mo. USD Term SOFR + 4.000%, VRN | ||||||||
9.431% 8/27/25 | 742,405 | 741,611 | ||||||
VFH Parent LLC, 2022 Term Loan B | ||||||||
0.000% VRN 1/13/29 (f) | 250,000 | 247,760 | ||||||
Principal | Value | |||||||
WeddingWire, Inc., 2023 Term Loan, | ||||||||
0.000% 1/26/28 (f) | $ | 250,000 | $ | 248,750 | ||||
| 33,109,280 | ||||||||
TOTAL BANK LOANS (Cost $55,308,285) | 52,871,558 | |||||||
CORPORATE DEBT — 41.5% | ||||||||
Austria — 0.2% | ||||||||
ams-OSRAM AG | ||||||||
6.000% 7/31/25 EUR (e) (h) | 250,000 | 261,057 | ||||||
Belgium — 0.3% | ||||||||
Azelis Finance NV | ||||||||
5.750% 3/15/28 EUR (e) (h) | 150,000 | 158,587 | ||||||
Elia Group SA 5 yr. EURIBOR ICE Swap + 2.506%, VRN | ||||||||
5.850% EUR (e) (h) (i) | 200,000 | 210,954 | ||||||
| 369,541 | ||||||||
Brazil — 1.1% | ||||||||
Acu Petroleo Luxembourg Sarl | ||||||||
7.500% 7/13/35 (h) | 531,056 | 485,535 | ||||||
Embraer Netherlands Finance BV | ||||||||
7.000% 7/28/30 (h) | 400,000 | 396,782 | ||||||
Minerva Luxembourg SA | ||||||||
8.875% 9/13/33 (h) | 500,000 | 496,010 | ||||||
| 1,378,327 | ||||||||
Canada — 0.6% | ||||||||
1375209 BC Ltd. | ||||||||
9.000% 1/30/28 (h) | 281,000 | 277,761 | ||||||
Enbridge, Inc., Series NC5, 5 yr. CMT + 3.785%, VRN | ||||||||
8.250% 1/15/84 | 551,000 | 540,474 | ||||||
| 818,235 | ||||||||
Cayman Islands — 1.0% | ||||||||
Global Aircraft Leasing Co. Ltd. | ||||||||
6.500% 9/15/24 (h) | 1,325,479 | 1,262,519 | ||||||
Chile — 0.3% | ||||||||
Kenbourne Invest SA | ||||||||
4.700% 1/22/28 (h) | 593,000 | 369,143 | ||||||
China — 0.2% | ||||||||
Shimao Group Holdings Ltd. | ||||||||
(Acquired 7/06/22, Cost $278,983), 3.450% 1/11/31 (b) (h) (j) | 857,000 | 30,724 | ||||||
(Acquired 2/28/23, Cost $201,775), 5.600% 7/15/26 (b) (h) (j) | 1,153,000 | 34,590 | ||||||
(Acquired 2/28/23, Cost $646,955), 6.125% 2/21/24 (b) (h) (j) | 1,568,000 | 54,174 | ||||||
The accompanying notes are an integral part of the financial statements.
36
MassMutual Global Credit Income Opportunities Fund – Portfolio of Investments (Continued) |
Principal | Value | |||||||
Sunac China Holdings Ltd. | ||||||||
5.950% 4/26/24 (h) (j) | $ | 556,000 | $ | 86,180 | ||||
7.950% 10/11/23 (h) (j) | 352,000 | 52,800 | ||||||
| 258,468 | ||||||||
France — 2.1% | ||||||||
Accor SA | ||||||||
2.375% 11/29/28 EUR (e) (h) | 100,000 | 94,360 | ||||||
5 yr. EUR Swap + 3.252%, VRN 2.625% EUR (e) (h) (i) | 200,000 | 200,032 | ||||||
5 yr. EUR Swap + 4.561%, VRN 4.375% EUR (e) (h) (i) | 200,000 | 209,329 | ||||||
Banijay Group SAS | ||||||||
6.500% 3/01/26 EUR (e) (h) | 750,000 | 783,636 | ||||||
Electricite de France SA 5 yr. EUR Swap + 3.970%, VRN | ||||||||
3.375% EUR (e) (h) (i) | 800,000 | 651,161 | ||||||
iliad SA | ||||||||
5.625% 2/15/30 EUR (e) (h) | 300,000 | 302,109 | ||||||
Orange SA 5 yr. EUR Swap + 2.659%, VRN | ||||||||
5.375% EUR (e) (h) (i) | 400,000 | 416,284 | ||||||
| 2,656,911 | ||||||||
Georgia — 0.3% | ||||||||
Silknet JSC | ||||||||
8.375% 1/31/27 (h) | 426,000 | 420,675 | ||||||
Germany — 1.8% | ||||||||
APCOA Parking Holdings GmbH 3 mo. EUR EURIBOR + 5.000%, FRN | ||||||||
8.663% 1/15/27 EUR (e) (h) | 169,000 | 178,452 | ||||||
Bayer AG | ||||||||
5 yr. EUR Swap + 3.108%, VRN 3.125% 11/12/79 EUR (e) (h) | 400,000 | 367,394 | ||||||
5 yr. EUR Swap + 4.458%, VRN 5.375% 3/25/82 EUR (e) (h) | 200,000 | 193,741 | ||||||
IHO Verwaltungs GmbH | ||||||||
8.750% 5/15/28 EUR (e) (h) | 350,000 | 381,560 | ||||||
ProGroup AG | ||||||||
3.000% 3/31/26 EUR (e) (h) | 250,000 | 243,138 | ||||||
Volkswagen International Finance NV 5 yr. EUR Swap + 2.924%, VRN | ||||||||
3.748% EUR (e) (h) (i) | 300,000 | 272,837 | ||||||
Wintershall Dea Finance 2 BV 5 yr. EUR Swap + 2.924%, VRN | ||||||||
2.499% EUR (e) (h) (i) | 300,000 | 275,974 | ||||||
ZF Europe Finance BV | ||||||||
2.500% 10/23/27 EUR (e) (h) | 300,000 | 276,339 | ||||||
3.000% 10/23/29 EUR (e) (h) | 100,000 | 88,310 | ||||||
| 2,277,745 | ||||||||
Principal | Value | |||||||
Ghana — 1.4% | ||||||||
Tullow Oil PLC | ||||||||
7.000% 3/01/25 (h) | $ | 1,350,000 | $ | 1,042,281 | ||||
10.250% 5/15/26 (h) | 882,000 | 766,458 | ||||||
| 1,808,739 | ||||||||
Greece — 0.2% | ||||||||
Piraeus Financial Holdings SA 5 yr. EUR Swap + 9.195%, VRN | ||||||||
8.750% EUR (e) (h) (i) | 302,000 | 286,562 | ||||||
India — 0.1% | ||||||||
Future Retail Ltd. | ||||||||
5.600% 1/22/25 (h) (j) | 950,000 | 7,125 | ||||||
UPL Corp. Ltd. 5 yr. CMT + 3.865%, VRN | ||||||||
5.250% (h) (i) | 222,000 | 170,940 | ||||||
| 178,065 | ||||||||
Ireland — 0.3% | ||||||||
Energia Group Roi Financeco DAC | ||||||||
6.875% 7/31/28 EUR (e) (h) | 350,000 | 362,477 | ||||||
Italy — 0.5% | ||||||||
Castor SpA 3 mo. EUR EURIBOR + 5.250%, FRN | ||||||||
9.095% 2/15/29 EUR (e) (h) | 199,000 | 199,370 | ||||||
Marcolin SpA | ||||||||
6.125% 11/15/26 EUR (e) (h) | 400,000 | 396,086 | ||||||
| 595,456 | ||||||||
Jersey, Channel Islands — 0.1% | ||||||||
KCA Deutag Pikco PLC | ||||||||
15.000% 12/01/27 | 101,641 | 102,530 | ||||||
Luxembourg — 0.8% | ||||||||
INEOS Finance PLC | ||||||||
6.625% 5/15/28 EUR (e) (h) | 300,000 | 310,632 | ||||||
Mangrove Luxco III Sarl | ||||||||
7.775% 10/09/25 EUR (e) (h) | 313,125 | 302,866 | ||||||
Matterhorn Telecom SA | ||||||||
3.125% 9/15/26 EUR (e) (h) | 250,000 | 245,811 | ||||||
Summer BC Holdco A Sarl | ||||||||
9.250% 10/31/27 EUR (e) (h) | 180,211 | 154,965 | ||||||
| 1,014,274 | ||||||||
Mexico — 0.3% | ||||||||
Sixsigma Networks Mexico SA de CV | ||||||||
7.500% 5/02/25 (h) | 500,000 | 439,589 | ||||||
Netherlands — 0.8% | ||||||||
Nobian Finance BV | ||||||||
3.625% 7/15/26 EUR (e) (h) | 500,000 | 476,737 | �� | |||||
Titan Holdings II BV | ||||||||
5.125% 7/15/29 EUR (e) (h) | 367,000 | 316,035 | ||||||
The accompanying notes are an integral part of the financial statements.
37
MassMutual Global Credit Income Opportunities Fund – Portfolio of Investments (Continued) |
Principal | Value | |||||||
Wp/ap Telecom Holdings III BV | ||||||||
5.500% 1/15/30 EUR (e) (h) | $ | 345,000 | $ | 297,018 | ||||
| 1,089,790 | ||||||||
Russia — 0.0% | ||||||||
Sovcombank Via SovCom Capital DAC 5 year CMT + 6.380%, VRN | ||||||||
7.750% (h) (i) (j) | 500,000 | 14,063 | ||||||
Spain — 1.1% | ||||||||
Anarafe SL 3 mo. EUR EURIBOR + 11.750%, FRN | ||||||||
15.702% 3/31/26 EUR (e) (h) | 194,732 | 100,881 | ||||||
Kaixo Bondco Telecom SA | ||||||||
5.125% 9/30/29 EUR (e) (h) | 705,000 | 652,382 | ||||||
Telefonica Europe BV | ||||||||
6 yr. EUR Swap + 2.866%, VRN 2.880% EUR (e) (h) (i) | 100,000 | 89,998 | ||||||
7 yr. EUR Swap + 3.347%, VRN 6.135% EUR (e) (h) (i) | 500,000 | 507,544 | ||||||
| 1,350,805 | ||||||||
Sweden — 0.8% | ||||||||
Verisure Holding AB | ||||||||
7.125% 2/01/28 EUR (e) (h) | 250,000 | 266,955 | ||||||
Verisure Midholding AB | ||||||||
5.250% 2/15/29 EUR (e) (h) | 800,000 | 741,745 | ||||||
| 1,008,700 | ||||||||
Turkey — 0.9% | ||||||||
Arcelik AS | ||||||||
8.500% 9/25/28 (h) | 535,000 | 534,331 | ||||||
WE Soda Investments Holding PLC | ||||||||
9.500% 10/06/28 (h) (k) | 613,000 | 617,598 | ||||||
| 1,151,929 | ||||||||
United Arab Emirates — 0.4% | ||||||||
DP World Salaam 5 yr. CMT + 5.750%, VRN | ||||||||
6.000% (h) (i) | 555,000 | 546,675 | ||||||
United Kingdom — 5.1% | ||||||||
Ashtead Capital, Inc. | ||||||||
4.000% 5/01/28 (h) | 1,000,000 | 909,139 | ||||||
5.500% 8/11/32 (h) | 750,000 | 692,963 | ||||||
Connect Finco Sarl/Connect US Finco LLC | ||||||||
6.750% 10/01/26 (h) | 521,000 | 485,935 | ||||||
House of Fraser Funding PLC 1 mo. GBP LIBOR + 4.250%, VRN | ||||||||
1.000% 9/15/20 GBP (e) (h) (j) | 150,000 | 183 | ||||||
INEOS Quattro Finance 1 PLC | ||||||||
3.750% 7/15/26 EUR (e) (h) | 400,000 | 376,712 | ||||||
KCA Deutag UK Finance PLC | ||||||||
9.875% 12/01/25 (h) | 349,977 | 352,164 | ||||||
Principal | Value | |||||||
Secured Overnight Financing Rate + 9.000%, FRN 14.300% 12/01/25 | $ | 143,476 | $ | 144,983 | ||||
Macquarie Airfinance Holdings Ltd. | ||||||||
8.375% 5/01/28 (h) | 131,000 | 132,801 | ||||||
Motion Bondco DAC | ||||||||
4.500% 11/15/27 EUR (e) (h) | 225,000 | 206,005 | ||||||
Ocado Group PLC | ||||||||
Convertible, 0.750% 1/18/27 GBP (e) (h) | 100,000 | 88,696 | ||||||
3.875% 10/08/26 GBP (e) (h) | 200,000 | 200,899 | ||||||
Travelex Financing PLC | ||||||||
8.000% 5/15/22 EUR (e) (h) (j) | 1,050,000 | 4,163 | ||||||
Travelex Issuerco Ltd. | ||||||||
12.500% 8/05/25 GBP (e) (h) | 1,685,047 | 2,415,713 | ||||||
TVL Finance PLC | ||||||||
10.250% 4/28/28 GBP (e) (h) | 100,000 | 122,376 | ||||||
Vodafone Group PLC | ||||||||
5 yr. EUR Swap + 3.477%, VRN 3.000% 8/27/80 EUR (e) (h) | 375,000 | 321,219 | ||||||
5 yr. EUR Swap + 3.489%, VRN 6.500% 8/30/84 EUR (e) (h) | 150,000 | 159,759 | ||||||
| 6,613,710 | ||||||||
United States — 20.4% | ||||||||
AdaptHealth LLC | ||||||||
4.625% 8/01/29 (h) | 500,000 | 383,753 | ||||||
American Airlines, Inc. | ||||||||
11.750% 7/15/25 (h) | 500,000 | 537,496 | ||||||
American Airlines, Inc./AAdvantage Loyalty IP Ltd. | ||||||||
5.500% 4/20/26 (h) | 545,417 | 532,688 | ||||||
5.750% 4/20/29 (h) | 114,000 | 106,026 | ||||||
Ardagh Metal Packaging Finance USA LLC/Ardagh Metal Packaging Finance PLC | ||||||||
4.000% 9/01/29 (h) (l) | 300,000 | 234,771 | ||||||
Ardagh Packaging Finance PLC/Ardagh Holdings USA, Inc. | ||||||||
2.125% 8/15/26 EUR (e) (h) | 100,000 | 93,837 | ||||||
2.125% 8/15/26 EUR (e) (h) | 100,000 | 93,704 | ||||||
4.750% 7/15/27 GBP (e) (h) | 125,000 | 120,261 | ||||||
Arsenal AIC Parent LLC | ||||||||
8.000% 10/01/30 (h) | 312,000 | 310,446 | ||||||
AthenaHealth Group, Inc. | ||||||||
6.500% 2/15/30 (h) | 156,000 | 130,495 | ||||||
Avient Corp. | ||||||||
7.125% 8/01/30 (h) | 140,000 | 137,534 | ||||||
Bath & Body Works, Inc. | ||||||||
6.875% 11/01/35 | 251,000 | 224,164 | ||||||
The accompanying notes are an integral part of the financial statements.
38
MassMutual Global Credit Income Opportunities Fund – Portfolio of Investments (Continued) |
Principal | Value | |||||||
Bausch Health Cos., Inc. | ||||||||
5.500% 11/01/25 (h) (l) | $ | 149,000 | $ | 131,956 | ||||
9.000% 12/15/25 (h) | 165,000 | 150,089 | ||||||
11.000% 9/30/28 (h) | 144,000 | 97,697 | ||||||
Carnival Corp. | ||||||||
5.750% 3/01/27 (h) | 406,000 | 367,521 | ||||||
CCO Holdings LLC/CCO Holdings Capital Corp. | ||||||||
6.375% 9/01/29 (h) | 325,000 | 303,051 | ||||||
CHS/Community Health Systems, Inc. | ||||||||
4.750% 2/15/31 (h) | 1,000,000 | 707,720 | ||||||
Clydesdale Acquisition Holdings, Inc. | ||||||||
6.625% 4/15/29 (h) | 155,000 | 144,117 | ||||||
8.750% 4/15/30 (h) | 437,000 | 374,797 | ||||||
CommScope, Inc. | ||||||||
4.750% 9/01/29 (h) | 444,000 | 326,582 | ||||||
Coty, Inc./HFC Prestige Products, Inc./HFC Prestige International US LLC | ||||||||
4.750% 1/15/29 (h) | 450,000 | 405,797 | ||||||
CVR Energy, Inc. | ||||||||
5.250% 2/15/25 (h) | 561,000 | 547,272 | ||||||
5.750% 2/15/28 (h) | 379,000 | 342,994 | ||||||
Directv Financing LLC/Directv Financing Co.-Obligor, Inc. | ||||||||
5.875% 8/15/27 (h) | 756,000 | 668,440 | ||||||
DISH Network Corp. | ||||||||
3.375% 8/15/26 | 300,000 | 180,300 | ||||||
Emerald Debt Merger Sub LLC | ||||||||
6.375% 12/15/30 EUR (e) (h) | 275,000 | 289,680 | ||||||
6.625% 12/15/30 (h) | 417,000 | 401,435 | ||||||
EnLink Midstream Partners LP | ||||||||
5.600% 4/01/44 | 206,000 | 170,980 | ||||||
EQM Midstream Partners LP | ||||||||
4.500% 1/15/29 (h) | 170,000 | 151,293 | ||||||
4.750% 1/15/31 (h) | 354,000 | 304,702 | ||||||
ESC Briggs & Stratton, Inc. | ||||||||
6.875% 12/15/49 (c) (d) (j) | 514,000 | — | ||||||
Ford Motor Credit Co. LLC | ||||||||
7.200% 6/10/30 | 250,000 | 251,250 | ||||||
7.350% 11/04/27 | 300,000 | 305,900 | ||||||
Frontier Communications Holdings LLC | ||||||||
6.000% 1/15/30 (h) (l) | 500,000 | 365,694 | ||||||
Garden Spinco Corp. | ||||||||
8.625% 7/20/30 (h) | 413,000 | 431,112 | ||||||
Genesis Energy LP/Genesis Energy Finance Corp. | ||||||||
8.000% 1/15/27 | 1,000,000 | 963,939 | ||||||
Principal | Value | |||||||
Getty Images, Inc. | ||||||||
9.750% 3/01/27 (h) | $ | 650,000 | $ | 649,278 | ||||
Global Infrastructure Solutions, Inc. | ||||||||
5.625% 6/01/29 (h) | 218,000 | 179,684 | ||||||
GoTo Group, Inc. | ||||||||
5.500% 9/01/27 (h) | 175,000 | 97,248 | ||||||
Graham Packaging Co., Inc. | ||||||||
7.125% 8/15/28 (h) | 427,000 | 357,720 | ||||||
Hughes Satellite Systems Corp. | ||||||||
6.625% 8/01/26 (l) | 250,000 | 213,750 | ||||||
JBS USA LUX SA/JBS USA Food Co./JBS USA Finance, Inc. | ||||||||
3.750% 12/01/31 | 150,000 | 120,156 | ||||||
5.500% 1/15/30 | 586,000 | 547,053 | ||||||
Life Time, Inc. | ||||||||
8.000% 4/15/26 (h) | 450,000 | 442,125 | ||||||
LifePoint Health, Inc. | ||||||||
9.875% 8/15/30 (h) | 515,000 | 498,587 | ||||||
11.000% 10/15/30 (h) (k) | 301,000 | 301,000 | ||||||
Live Nation Entertainment, Inc. | ||||||||
4.750% 10/15/27 (h) (l) | 250,000 | 228,906 | ||||||
Mauser Packaging Solutions Holding Co. | ||||||||
9.250% 4/15/27 (h) (l) | 611,000 | 534,066 | ||||||
Mileage Plus Holdings LLC/Mileage Plus Intellectual Property Assets Ltd. | ||||||||
6.500% 6/20/27 (h) | 177,515 | 175,882 | ||||||
Nabors Industries, Inc. | ||||||||
7.375% 5/15/27 (h) | 195,000 | 188,638 | ||||||
NGL Energy Operating LLC/NGL Energy Finance Corp. | ||||||||
7.500% 2/01/26 (h) | 850,000 | 840,682 | ||||||
Nordstrom, Inc. | ||||||||
5.000% 1/15/44 | 679,000 | 400,678 | ||||||
Novelis Corp. | ||||||||
3.875% 8/15/31 (h) | 700,000 | 559,009 | ||||||
Occidental Petroleum Corp. | ||||||||
6.125% 1/01/31 | 452,000 | 445,512 | ||||||
6.375% 9/01/28 | 407,000 | 410,036 | ||||||
OI European Group BV | ||||||||
6.250% 5/15/28 EUR (e) (h) | 130,000 | 139,697 | ||||||
Olympus Water US Holding Corp. | ||||||||
4.250% 10/01/28 (h) | 210,000 | 171,195 | ||||||
7.125% 10/01/27 (h) | 285,000 | 263,614 | ||||||
Pactiv Evergreen Group Issuer LLC/Pactiv Evergreen Group Issuer, Inc. | ||||||||
4.375% 10/15/28 (h) | 204,000 | 177,003 | ||||||
The accompanying notes are an integral part of the financial statements.
39
MassMutual Global Credit Income Opportunities Fund – Portfolio of Investments (Continued) |
Principal | Value | |||||||
PECF USS Intermediate Holding III Corp. | ||||||||
8.000% 11/15/29 (h) | $ | 610,000 | $ | 330,925 | ||||
Pentair Finance Sarl | ||||||||
5.900% 7/15/32 | 750,000 | 732,555 | ||||||
Permian Resources Operating LLC | ||||||||
7.000% 1/15/32 (h) | 124,000 | 122,290 | ||||||
PetSmart, Inc./PetSmart Finance Corp. | ||||||||
7.750% 2/15/29 (h) | 500,000 | 465,944 | ||||||
PRA Group, Inc. | ||||||||
7.375% 9/01/25 (h) (l) | 250,000 | 243,439 | ||||||
Prime Security Services Borrower LLC/Prime Finance, Inc. | ||||||||
6.250% 1/15/28 (h) (l) | 500,000 | 463,084 | ||||||
PROG Holdings, Inc. | ||||||||
6.000% 11/15/29 (h) | 317,000 | 276,583 | ||||||
Sonic Automotive, Inc. | ||||||||
4.625% 11/15/29 (h) (l) | 573,000 | 474,991 | ||||||
4.875% 11/15/31 (h) (l) | 289,000 | 230,097 | ||||||
Spirit Loyalty Cayman Ltd./Spirit IP Cayman Ltd. | ||||||||
8.000% 9/20/25 (h) | 447,000 | 446,775 | ||||||
T-Mobile USA, Inc. | ||||||||
3.375% 4/15/29 | 750,000 | 659,655 | ||||||
Targa Resources Partners LP/Targa Resources Partners Finance Corp. | ||||||||
4.875% 2/01/31 | 251,000 | 224,808 | ||||||
TransDigm, Inc. | ||||||||
6.750% 8/15/28 (h) | 258,000 | 253,998 | ||||||
Trident TPI Holdings, Inc. | ||||||||
12.750% 12/31/28 (h) | 418,000 | 436,810 | ||||||
Triumph Group, Inc. | ||||||||
7.750% 8/15/25 (l) | 100,000 | 95,000 | ||||||
9.000% 3/15/28 (h) | 300,000 | 296,642 | ||||||
UGI International LLC | ||||||||
2.500% 12/01/29 EUR (e) (h) | 350,000 | 305,203 | ||||||
Upbound Group, Inc. | ||||||||
6.375% 2/15/29 (h) (l) | 800,000 | 710,000 | ||||||
Veritas US, Inc./Veritas Bermuda Ltd. | ||||||||
7.500% 9/01/25 (h) | 225,000 | 187,991 | ||||||
Viasat, Inc. | ||||||||
6.500% 7/15/28 (h) | 100,000 | 69,250 | ||||||
Vibrantz Technologies, Inc. | ||||||||
9.000% 2/15/30 (h) | 150,000 | 119,376 | ||||||
| 26,376,428 | ||||||||
Principal | Value | |||||||
Zambia — 0.4% | ||||||||
First Quantum Minerals Ltd. | ||||||||
8.625% 6/01/31 (h) | $ | 500,000 | $ | 498,706 | ||||
TOTAL CORPORATE DEBT (Cost $62,193,164) | 53,511,119 | |||||||
NON-U.S. GOVERNMENT AGENCY OBLIGATIONS — 9.4% | ||||||||
Cayman Islands — 7.6% | ||||||||
Alinea CLO Ltd., Series 2018-1A, Class E, 3 mo. USD Term SOFR + 6.262%, FRN | ||||||||
11.588% 7/20/31 (h) | 1,250,000 | 1,137,744 | ||||||
Ares XLVIII CLO Ltd., Series 2018-48A, Class E, 3 mo. USD Term SOFR + 5.462%, FRN | ||||||||
10.788% 7/20/30 (h) | 800,000 | 682,239 | ||||||
Cedar Funding IV CLO Ltd., Series 2014-4A, Class ERR, 3 mo. USD Term SOFR + 6.872%, FRN | ||||||||
12.217% 7/23/34 (h) | 1,000,000 | 888,800 | ||||||
CIFC Funding Ltd., Series 2017-5A, Class D, 3 mo. USD Term SOFR + 6.362%, FRN | ||||||||
11.670% 11/16/30 (h) | 500,000 | 445,113 | ||||||
Galaxy XXIV CLO Ltd., Series 2017-24A, Class E, 3 mo. USD Term SOFR + 5.762%, FRN | ||||||||
11.070% 1/15/31 (h) | 700,000 | 635,295 | ||||||
Madison Park Funding XIII Ltd., Series 2014-13A, Class SUB, VRN | ||||||||
0.000% 4/19/30 (h) (m) | 500,000 | 149,226 | ||||||
Madison Park Funding XXVII Ltd., Series 2018-27A, Class D, 3 mo. USD Term SOFR + 5.262%, FRN | ||||||||
10.588% 4/20/30 (h) | 500,000 | 449,857 | ||||||
Madison Park Funding XXVIII Ltd., Series 2018-28A, Class F, 3 mo. USD Term SOFR + 7.862%, FRN | ||||||||
13.170% 7/15/30 (h) | 500,000 | 448,206 | ||||||
Magnetite VII Ltd., Series 2012-7A, Class SUB, VRN | ||||||||
0.000% 1/15/28 (h) (m) | 2,000,000 | 529,856 | ||||||
Oak Hill Credit Partners X Ltd., Series 2014-10RA, Class SUB, VRN | ||||||||
0.000% 7/20/26 (h) (m) | 1,400,000 | 645,198 | ||||||
Steele Creek CLO Ltd., Series 2018-2A, Class E, 3 mo. USD Term SOFR + 6.462%, FRN | ||||||||
11.841% 8/18/31 (h) | 850,000 | 686,613 | ||||||
The accompanying notes are an integral part of the financial statements.
40
MassMutual Global Credit Income Opportunities Fund – Portfolio of Investments (Continued) |
Principal | Value | |||||||
THL Credit Wind River CLO Ltd. | ||||||||
Series 2018-2A, Class E, 3 mo. USD Term SOFR + 6.012%, FRN 11.320% 7/15/30 (h) | $ | 1,450,000 | $ | 1,183,565 | ||||
Series 2017-4A, Class E, 3 mo. USD Term SOFR + 6.062%, FRN 11.441% 11/20/30 (h) | 500,000 | 442,304 | ||||||
Wellfleet CLO Ltd. | ||||||||
Series 2018-1A, Class E, 3 mo. USD Term SOFR + 5.762%, FRN 11.070% 7/17/31 (h) | 1,000,000 | 773,753 | ||||||
Series 2017-3A, Class D, 3 mo. USD Term SOFR + 5.812%, FRN 11.120% 1/17/31 (h) | 1,000,000 | 724,291 | ||||||
| 9,822,060 | ||||||||
Ireland — 1.8% | ||||||||
Bain Capital Euro CLO DAC, Series 2021-2A, Class E, 3 mo. EUR EURIBOR + 6.220%, FRN | ||||||||
9.883% 7/17/34 EUR (e) (h) | 800,000 | 721,476 | ||||||
BlackRock European CLO VII DAC, Series 7X, Class E, 3 mo. EUR EURIBOR + 5.170%, FRN | ||||||||
8.833% 10/15/31 EUR (e) (h) | 725,000 | 661,567 | ||||||
Tymon Park CLO DAC, Series 1A, Class DRR, 3 mo. EUR EURIBOR + 6.160%, FRN | ||||||||
9.806% 7/21/34 EUR (e) (h) | 1,000,000 | 952,423 | ||||||
| 2,335,466 | ||||||||
TOTAL NON-U.S. GOVERNMENT AGENCY OBLIGATIONS (Cost $16,233,322) | 12,157,526 | |||||||
TOTAL BONDS & NOTES (Cost $133,734,771) | 118,540,203 | |||||||
Number of | ||||||||
WARRANTS — 0.0% | ||||||||
United Kingdom — 0.0% | ||||||||
Travelex Ltd. (a) | 837 | 41,870 | ||||||
TOTAL WARRANTS (Cost $0) | 41,870 | |||||||
TOTAL LONG-TERM INVESTMENTS (Cost $134,458,762) | 119,278,909 | |||||||
Number of | Value | |||||||
SHORT-TERM INVESTMENTS — 15.3% | ||||||||
Investment of Cash Collateral from Securities Loaned — 2.7% | ||||||||
State Street Navigator Securities Lending Government Money Market Portfolio (n) | 3,538,785 | $ | 3,538,785 | |||||
Principal | ||||||||
Repurchase Agreement — 12.6% | ||||||||
Fixed Income Clearing Corp., Repurchase Agreement, dated 9/29/23, 1.600%, due 10/02/23 (o) | $ | 16,191,670 | 16,191,670 | |||||
TOTAL SHORT-TERM INVESTMENTS (Cost $19,730,455) | 19,730,455 | |||||||
TOTAL INVESTMENTS — 107.7% (Cost $154,189,217) (p) | 139,009,364 | |||||||
Other Assets/(Liabilities) — (7.7)% | (9,943,964 | ) | ||||||
NET ASSETS — 100.0% | $ | 129,065,400 | ||||||
Abbreviation Legend
CLO | Collateralized Loan Obligation |
FRN | Floating Rate Note |
LIBOR | London Inter-Bank Offered Rate |
SOFR | Secured Overnight Financing Rate |
SONIA | Sterling Overnight Index Average |
VRN | Variable Rate Note |
Notes to Portfolio of Investments
Percentages are stated as a percent of net assets.
(a) | Non-income producing security. |
(b) | Restricted security. Certain securities are restricted to resale. At September 30, 2023, these securities amounted to a value of $1,127,654 or 0.87% of net assets. The Fund generally bears the costs, if any, associated with the disposition of restricted securities. |
(c) | This security is fair valued in good faith in accordance with procedures approved by the Board of Trustees. At September 30, 2023, these securities amounted to a value of $886,208 or 0.69% of net assets. |
(d) | Investment is valued using significant unobservable inputs. |
(e) | The principal amount of the security is in foreign currency. The market value is in U.S. dollars. |
(f) | All or a portion of the security represents unsettled bank loan commitments at September 30, 2023 where the rate will be determined at time of settlement. |
The accompanying notes are an integral part of the financial statements.
41
MassMutual Global Credit Income Opportunities Fund – Portfolio of Investments (Continued) |
Notes to Portfolio of Investments (Continued)
(h) | Security is exempt from registration under Regulation S or Rule 144A of the Securities Act of 1933. These securities are considered restricted and may be resold in transactions exempt from registration. At September 30, 2023, the aggregate market value of these securities amounted to $58,934,922 or 45.66% of net assets. |
(i) | Security is perpetual and has no stated maturity date. |
(j) | Security is currently in default due to bankruptcy or failure to make payment of principal or interest of the issuer. Income is not being accrued. At September 30, 2023, these securities amounted to a value of $284,002 or 0.22% of net assets. |
(k) | A portion of this security is purchased on a when-issued, delayed-delivery or forward commitment basis. (Note 2). |
(l) | Denotes all or a portion of security on loan. The total value of securities on loan as of September 30, 2023, was $3,463,689 or 2.68% of net assets. (Note 2). |
(m) | Certain variable rate securities are not based on a published reference rate and spread but are determined by the issuer or agent and are based on current market conditions. These securities do not indicate a reference rate and spread in their description above. The rates shown are the current interest rates at September 30, 2023. |
(n) | Represents investment of security lending cash collateral. (Note 2). |
(o) | Maturity value of $16,193,829. Collateralized by U.S. Government Agency obligations with a rate of 0.625%, maturity date of 1/15/26, and an aggregate market value, including accrued interest, of $16,515,565. |
(p) | See Note 6 for aggregate cost for federal tax purposes. |
Forward contracts
Counterparty | Settlement | Currency Purchased | Currency Sold | Unrealized | ||||||||||||||||||||
Barclays Bank PLC* | 10/18/23 | USD | 98,737 | CAD | 133,770 | $ | 229 | |||||||||||||||||
Citibank N.A.* | 10/18/23 | USD | 5,095,778 | GBP | 4,082,846 | 113,847 | ||||||||||||||||||
Morgan Stanley & Co. LLC* | 10/18/23 | USD | 30,720,961 | EUR | 28,591,277 | 474,293 | ||||||||||||||||||
| $ | 588,369 | |||||||||||||||||||||||
* | Contracts are subject to a master netting agreement or similar agreement. |
Currency Legend
CAD | Canadian Dollar |
EUR | Euro |
GBP | British Pound |
USD | U.S. Dollar |
The accompanying notes are an integral part of the financial statements.
42
MassMutual Emerging Markets Debt Blended Total Return Fund – Portfolio of Investments |
September 30, 2023 |
Principal | Value | |||||||
BONDS & NOTES — 93.7% | ||||||||
CORPORATE DEBT — 34.8% | ||||||||
Azerbaijan — 1.3% | ||||||||
Southern Gas Corridor CJSC | ||||||||
6.875% 3/24/26 (a) | $ | 600,000 | $ | 596,389 | ||||
Brazil — 4.9% | ||||||||
Acu Petroleo Luxembourg Sarl | ||||||||
7.500% 7/13/35 (a) | 531,056 | 485,536 | ||||||
Braskem Netherlands Finance BV | ||||||||
7.250% 2/13/33 (a) | 444,000 | 409,089 | ||||||
BRF SA | ||||||||
5.750% 9/21/50 (a) | 500,000 | 335,135 | ||||||
Embraer Netherlands Finance BV | ||||||||
7.000% 7/28/30 (a) | 250,000 | 247,989 | ||||||
Minerva Luxembourg SA | ||||||||
4.375% 3/18/31 (a) | 425,000 | 328,886 | ||||||
8.875% 9/13/33 (a) | 429,000 | 425,576 | ||||||
| 2,232,211 | ||||||||
Chile — 0.7% | ||||||||
Kenbourne Invest SA | ||||||||
4.700% 1/22/28 (a) | 510,000 | 317,475 | ||||||
China — 0.9% | ||||||||
Prosus NV | ||||||||
3.832% 2/08/51 (a) | 706,000 | 389,922 | ||||||
Georgia — 2.3% | ||||||||
Silknet JSC | ||||||||
8.375% 1/31/27 (a) | 597,000 | 589,537 | ||||||
TBC Bank JSC 5 yr. USD ICE Swap + 8.995% | ||||||||
10.775% VRN (a) (b) | 445,000 | 431,312 | ||||||
| 1,020,849 | ||||||||
Ghana — 1.7% | ||||||||
Tullow Oil PLC | ||||||||
7.000% 3/01/25 (a) | 340,000 | 262,501 | ||||||
10.250% 5/15/26 (a) | 581,000 | 504,889 | ||||||
| 767,390 | ||||||||
India — 4.2% | ||||||||
Future Retail Ltd. | ||||||||
5.600% 1/22/25 (a) (c) | 794,000 | 5,955 | ||||||
India Cleantech Energy | ||||||||
4.700% 8/10/26 (a) | 728,416 | 631,172 | ||||||
JSW Steel Ltd. | ||||||||
5.050% 4/05/32 (a) | 375,000 | 301,270 | ||||||
UPL Corp. Ltd. 5 yr. CMT + 3.865% | ||||||||
5.250% VRN (a) (b) | 1,250,000 | 962,500 | ||||||
| 1,900,897 | ||||||||
Principal | Value | |||||||
Indonesia — 1.8% | ||||||||
Indonesia Asahan Aluminium PT/Mineral Industri Indonesia Persero PT | ||||||||
4.750% 5/15/25 (a) | $ | 500,000 | $ | 488,500 | ||||
Medco Laurel Tree Pte. Ltd. | ||||||||
6.950% 11/12/28 (a) | 350,000 | 323,861 | ||||||
| 812,361 | ||||||||
Mexico — 6.3% | ||||||||
Banco Mercantil del Norte SA 10 yr. CMT + 5.034% | ||||||||
6.625% VRN (a) (b) | 984,000 | 771,210 | ||||||
Cemex SAB de CV 5 yr. CMT + 5.157% | ||||||||
9.125% VRN (a) (b) | 209,000 | 217,570 | ||||||
Infraestructura Energetica Nova SAPI de CV | ||||||||
4.750% 1/15/51 (a) | 312,000 | 220,446 | ||||||
Orbia Advance Corp. SAB de CV | ||||||||
5.500% 1/15/48 (a) | 300,000 | 231,718 | ||||||
Petroleos Mexicanos | ||||||||
6.950% 1/28/60 | 754,000 | 446,286 | ||||||
Sixsigma Networks Mexico SA de CV | ||||||||
7.500% 5/02/25 (a) | 500,000 | 439,588 | ||||||
Tierra Mojada Luxembourg II Sarl | ||||||||
5.750% 12/01/40 (a) | 639,777 | 531,971 | ||||||
| 2,858,789 | ||||||||
Morocco — 1.3% | ||||||||
OCP SA | ||||||||
5.125% 6/23/51 (a) | 912,000 | 601,920 | ||||||
Paraguay — 1.0% | ||||||||
Rutas 2 & 7 Finance Ltd. | ||||||||
0.000% 9/30/36 (a) | 736,667 | 469,993 | ||||||
Russia — 0.2% | ||||||||
Sovcombank Via SovCom Capital DAC | ||||||||
5 year CMT + 6.380% 7.750% VRN (a) (b) (c) | 1,450,000 | 40,781 | ||||||
5 year CMT + 6.427% 8.000% VRN 4/07/30 (a) (c) | 1,165,000 | 58,250 | ||||||
| 99,031 | ||||||||
Saudi Arabia — 2.8% | ||||||||
Almarai Co. JSC | ||||||||
5.233% 7/25/33 (a) | 446,000 | 434,569 | ||||||
Greensaif Pipelines Bidco Sarl | ||||||||
6.510% 2/23/42 (a) | 521,000 | 510,805 | ||||||
Saudi Arabian Oil Co. | ||||||||
3.500% 11/24/70 (a) | 529,000 | 314,094 | ||||||
| 1,259,468 | ||||||||
The accompanying notes are an integral part of the financial statements.
43
MassMutual Emerging Markets Debt Blended Total Return Fund – Portfolio of Investments (Continued) |
Principal | Value | |||||||
South Africa — 0.7% | ||||||||
Anglo American Capital PLC | ||||||||
3.950% 9/10/50 (a) | $ | 500,000 | $ | 339,841 | ||||
Turkey — 1.0% | ||||||||
WE Soda Investments Holding PLC | ||||||||
9.500% 10/06/28 (a) (d) | 429,000 | 432,218 | ||||||
United Arab Emirates — 1.7% | ||||||||
Adib Capital Invest 3 Ltd. 5 yr. CMT + 3.059% | ||||||||
7.250% VRN (a) (b) | 464,000 | 484,550 | ||||||
First Abu Dhabi Bank PJSC 5 yr. CMT + 1.700% | ||||||||
6.320% VRN 4/04/34 (a) (d) | 291,000 | 292,534 | ||||||
| 777,084 | ||||||||
United States — 1.1% | ||||||||
Gabon Blue Bond Master Trust | ||||||||
6.097% 8/01/38 (a) | 500,000 | 486,813 | ||||||
Zambia — 0.9% | ||||||||
First Quantum Minerals Ltd. | ||||||||
8.625% 6/01/31 (a) | 392,000 | 390,111 | ||||||
TOTAL CORPORATE DEBT (Cost $20,550,628) | 15,752,762 | |||||||
SOVEREIGN DEBT OBLIGATIONS — 58.9% | ||||||||
Albania — 1.6% | ||||||||
Albania Government International Bond | ||||||||
5.900% 6/09/28 EUR (e) | 720,000 | 740,286 | ||||||
Angola — 2.7% | ||||||||
Angolan Government International Bond | ||||||||
8.250% 5/09/28 (a) | 850,000 | 734,873 | ||||||
9.375% 5/08/48 (a) | 660,000 | 485,298 | ||||||
| 1,220,171 | ||||||||
Armenia — 1.2% | ||||||||
Republic of Armenia International Bond | ||||||||
3.600% 2/02/31 (a) | 740,000 | 556,258 | ||||||
Bahamas — 1.5% | ||||||||
Bahamas Government International Bond | ||||||||
8.950% 10/15/32 (a) | 540,000 | 463,050 | ||||||
9.000% 6/16/29 (a) | 230,000 | 205,965 | ||||||
| 669,015 | ||||||||
Principal | Value | |||||||
Brazil — 1.0% | ||||||||
Brazilian Government International Bond | ||||||||
4.750% 1/14/50 | $ | 200,000 | $ | 138,109 | ||||
5.625% 2/21/47 | 370,000 | 292,862 | ||||||
| 430,971 | ||||||||
Costa Rica — 0.7% | ||||||||
Costa Rica Government International Bond | ||||||||
6.125% 2/19/31 (a) | 350,000 | 337,574 | ||||||
Czech Republic — 5.9% | ||||||||
Czech Republic Government International Bond | ||||||||
0.950% 5/15/30 CZK (a) (e) | 20,000,000 | 681,495 | ||||||
1.500% 4/24/40 CZK (e) | 36,650,000 | 988,987 | ||||||
2.500% 8/25/28 CZK (a) (e) | 26,000,000 | 1,016,559 | ||||||
| 2,687,041 | ||||||||
Dominican Republic — 1.9% | ||||||||
Dominican Republic International Bond | ||||||||
5.500% 2/22/29 (a) | 365,000 | 333,579 | ||||||
6.000% 2/22/33 (a) | 590,000 | 520,239 | ||||||
| 853,818 | ||||||||
Guatemala — 0.8% | ||||||||
Guatemala Government International Bond | ||||||||
4.650% 10/07/41 (a) | 490,000 | 361,186 | ||||||
Hungary — 5.5% | ||||||||
Hungary Government International Bond | ||||||||
3.000% 4/25/41 HUF (e) | 710,000,000 | 1,103,610 | ||||||
4.500% 3/23/28 HUF (e) | 300,000,000 | 719,731 | ||||||
6.250% 9/22/32 (a) | 480,000 | 467,477 | ||||||
Magyar Export-Import Bank Zrt | ||||||||
6.125% 12/04/27 (a) | 200,000 | 196,600 | ||||||
| 2,487,418 | ||||||||
Ivory Coast — 2.6% | ||||||||
Ivory Coast Government International Bond | ||||||||
5.750% STEP 12/31/32 (a) | 1,017,666 | 905,784 | ||||||
5.875% 10/17/31 EUR (a) (e) | 300,000 | 261,606 | ||||||
| 1,167,390 | ||||||||
Jamaica — 0.5% | ||||||||
Jamaica Government International Bond | ||||||||
7.875% 7/28/45 | 200,000 | 219,997 | ||||||
The accompanying notes are an integral part of the financial statements.
44
MassMutual Emerging Markets Debt Blended Total Return Fund – Portfolio of Investments (Continued) |
Principal | Value | |||||||
Mexico — 5.4% | ||||||||
Mexican Bonos | ||||||||
5.750% 3/05/26 MXN (e) | $ | 5,210,000 | $ | 268,035 | ||||
7.750% 5/29/31 MXN (e) | 12,000,000 | 606,180 | ||||||
8.000% 11/07/47 MXN (e) | 20,000,000 | 943,738 | ||||||
Mexican Udibonos | ||||||||
4.500% 12/04/25 MXN (e) | 3,148,665 | 174,813 | ||||||
Mexico Government International Bond | ||||||||
6.338% 5/04/53 | 270,000 | 245,718 | ||||||
6.350% 2/09/35 | 200,000 | 195,518 | ||||||
| 2,434,002 | ||||||||
Morocco — 1.5% | ||||||||
Morocco Government International Bond | ||||||||
5.500% 12/11/42 (a) | 570,000 | 460,867 | ||||||
6.500% 9/08/33 (a) | 230,000 | 225,400 | ||||||
| 686,267 | ||||||||
Oman — 1.8% | ||||||||
Oman Government International Bond | ||||||||
6.250% 1/25/31 (a) | 350,000 | 345,201 | ||||||
6.750% 1/17/48 (a) | 200,000 | 183,514 | ||||||
7.375% 10/28/32 (a) | 270,000 | 285,152 | ||||||
| 813,867 | ||||||||
Paraguay — 1.5% | ||||||||
Paraguay Government International Bond | ||||||||
5.400% 3/30/50 (a) | 330,000 | 259,998 | ||||||
5.600% 3/13/48 (a) | 245,000 | 197,693 | ||||||
6.100% 8/11/44 (a) | 245,000 | 214,909 | ||||||
| 672,600 | ||||||||
Peru — 2.1% | ||||||||
Peru Government International Bond | ||||||||
6.850% 2/12/42 PEN (e) | 3,909,000 | 965,675 | ||||||
Philippines — 0.5% | ||||||||
Philippines Government International Bond | ||||||||
5.500% 1/17/48 | 240,000 | 225,903 | ||||||
Poland — 1.9% | ||||||||
Bank Gospodarstwa Krajowego | ||||||||
5.375% 5/22/33 (a) | 200,000 | 188,500 | ||||||
Poland Government International Bond | ||||||||
6.000% 10/25/33 PLN (e) | 3,000,000 | 691,592 | ||||||
| 880,092 | ||||||||
Principal | Value | |||||||
Republic of Korea — 2.8% | ||||||||
Korea Treasury Bond | ||||||||
2.375% 12/10/28 KRW (e) | $ | 163,000,000 | $ | 111,851 | ||||
3.250% 3/10/53 KRW (e) | 1,760,000,000 | 1,152,064 | ||||||
| 1,263,915 | ||||||||
Romania — 1.9% | ||||||||
Romania Government International Bond | ||||||||
4.625% 4/03/49 EUR (a) (e) | 600,000 | 469,909 | ||||||
6.625% 9/27/29 EUR (a) (e) | 340,000 | 369,450 | ||||||
| 839,359 | ||||||||
Serbia — 2.6% | ||||||||
Senegal Government International Bond | ||||||||
2.050% 9/23/36 EUR (a) (e) | 1,899,000 | 1,185,557 | ||||||
South Africa — 3.8% | ||||||||
Republic of South Africa Government International Bond | ||||||||
8.750% 1/31/44 ZAR (e) | 20,850,000 | 769,524 | ||||||
10.500% 12/21/26 ZAR (e) | 17,690,000 | 961,079 | ||||||
| 1,730,603 | ||||||||
Sri Lanka — 3.0% | ||||||||
Sri Lanka Government International Bond | ||||||||
6.200% 5/11/27 (a) (c) | 400,000 | 184,316 | ||||||
6.750% 4/18/28 (a) (c) | 200,000 | 92,642 | ||||||
6.825% 7/18/26 (a) (c) | 400,000 | 190,465 | ||||||
6.850% 3/14/24 (a) (c) | 320,000 | 151,544 | ||||||
6.850% 11/03/25 (a) (c) | 610,000 | 290,587 | ||||||
7.550% 3/28/30 (a) (c) | 200,000 | 92,154 | ||||||
7.850% 3/14/29 (a) (c) | 750,000 | 347,432 | ||||||
| 1,349,140 | ||||||||
Tajikistan — 1.8% | ||||||||
Republic of Tajikistan International Bond | ||||||||
7.125% 9/14/27 (a) | 1,015,000 | 825,195 | ||||||
Uruguay — 0.7% | ||||||||
Uruguay Government International Bond | ||||||||
5.750% 10/28/34 | 300,000 | 305,332 | ||||||
Yugoslavia — 1.7% | ||||||||
North Macedonia Government International Bond | ||||||||
1.625% 3/10/28 EUR (a) (e) | 350,000 | 299,730 | ||||||
The accompanying notes are an integral part of the financial statements.
45
MassMutual Emerging Markets Debt Blended Total Return Fund – Portfolio of Investments (Continued) |
Principal | Value | |||||||
3.675% 6/03/26 EUR (a) (e) | $ | 450,000 | $ | 446,622 | ||||
| 746,352 | ||||||||
TOTAL SOVEREIGN DEBT OBLIGATIONS (Cost $29,997,342) | 26,654,984 | |||||||
TOTAL BONDS & NOTES (Cost $50,547,970) | 42,407,746 | |||||||
TOTAL PURCHASED OPTIONS(#) — 0.1% (Cost $135,555) | 15,885 | |||||||
TOTAL LONG-TERM INVESTMENTS (Cost $50,683,525) | 42,423,631 | |||||||
SHORT-TERM INVESTMENTS — 4.9% | ||||||||
Repurchase Agreement — 4.9% | ||||||||
Fixed Income Clearing Corp., Repurchase Agreement, dated 9/29/23, 1.600%, due 10/02/23 (f) | 2,215,095 | 2,215,095 | ||||||
TOTAL SHORT-TERM INVESTMENTS (Cost $2,215,095) | 2,215,095 | |||||||
TOTAL INVESTMENTS — 98.7% (Cost $52,898,620) (g) | 44,638,726 | |||||||
Other Assets/(Liabilities) — 1.3% | 592,871 | |||||||
NET ASSETS — 100.0% | $ | 45,231,597 | ||||||
Abbreviation Legend
STEP | Step Up Bond |
VRN | Variable Rate Note |
Notes to Portfolio of Investments
Percentages are stated as a percent of net assets.
(a) | Security is exempt from registration under Regulation S or Rule 144A of the Securities Act of 1933. These securities are considered restricted and may be resold in transactions exempt from registration. At September 30, 2023, the aggregate market value of these securities amounted to $30,140,856 or 66.64% of net assets. |
(b) | Security is perpetual and has no stated maturity date. |
(c) | Security is currently in default due to bankruptcy or failure to make payment of principal or interest of the issuer. Income is not being accrued. At September 30, 2023, these securities amounted to a value of $1,454,126 or 3.21% of net assets. |
(d) | A portion of this security is purchased on a when-issued, delayed-delivery or forward commitment basis. (Note 2). |
(e) | The principal amount of the security is in foreign currency. The market value is in U.S. dollars. |
(f) | Maturity value of $2,215,390. Collateralized by U.S. Government Agency obligations with a rate of 0.625%, maturity date of 1/15/26 , and an aggregate market value, including accrued interest, of $2,259,417. |
(g) | See Note 6 for aggregate cost for federal tax purposes. |
(#) OTC Options Purchased
Description | Counterparty | Expiration | Exercise | No. of | Notional | Value | Premiums | Unrealized | |||||||||||||||||||||||||
Call | |||||||||||||||||||||||||||||||||
USD Call ILS Put | Bank of America N.A* | 10/03/23 | 3.79 | 1,175,000 | USD | 1,175,000 | $ | 9,459 | $ | 5,644 | $ | 3,815 | |||||||||||||||||||||
AUD Call USD Put | Goldman Sachs International* | 12/29/23 | 0.68 | 3,925,822 | AUD | 3,925,822 | 6,376 | 38,279 | (31,903 | ) | |||||||||||||||||||||||
| $ | 15,835 | $ | 43,923 | $ | (28,088 | ) | |||||||||||||||||||||||||||
The accompanying notes are an integral part of the financial statements.
46
MassMutual Emerging Markets Debt Blended Total Return Fund – Portfolio of Investments (Continued) |
Description | Counterparty | Expiration | Exercise | No. of | Notional | Value | Premiums | Unrealized | |||||||||||||||||||||||||
Put | |||||||||||||||||||||||||||||||||
USD Put ILS Call | Goldman Sachs International* | 10/03/23 | 3.62 | 3,600,000 | USD | 3,600,000 | $ | 7 | $ | 43,283 | $ | (43,276 | ) | ||||||||||||||||||||
USD Put NOK Call | Goldman Sachs International* | 10/17/23 | 9.89 | 2,550,000 | USD | 2,550,000 | 43 | 48,349 | (48,306 | ) | |||||||||||||||||||||||
| $ | 50 | $ | 91,632 | $ | (91,582 | ) | |||||||||||||||||||||||||||
| $ | 15,885 | $ | 135,555 | $ | (119,670 | ) | |||||||||||||||||||||||||||
OTC Options Written
Description | Counterparty | Expiration | Exercise | No. of | Notional | Value | Premiums | Unrealized | |||||||||||||||||||||||||
Call | |||||||||||||||||||||||||||||||||
USD Call ILS Put | Goldman Sachs International* | 10/03/23 | 3.79 | 3,600,000 | USD | 3,600,000 | $ | (28,980 | ) | $ | (45,443 | ) | $ | 16,463 | |||||||||||||||||||
USD Call NOK Put | Goldman Sachs International* | 10/17/23 | 10.82 | 2,550,000 | USD | 2,550,000 | (12,995 | ) | (50,893 | ) | 37,898 | ||||||||||||||||||||||
| $ | (41,975 | ) | $ | (96,336 | ) | $ | 54,361 | ||||||||||||||||||||||||||
Put | |||||||||||||||||||||||||||||||||
USD Put ILS Call | Bank of America N.A. * | 10/03/23 | 3.62 | 1,175,000 | USD | 1,175,000 | $ | (2 | ) | $ | (30,029 | ) | $ | 30,027 | |||||||||||||||||||
AUD Put USD Call | Goldman Sachs International* | 12/29/23 | 0.64 | 3,925,822 | AUD | 3,925,822 | (41,224 | ) | (36,593 | ) | (4,631 | ) | |||||||||||||||||||||
| $ | (41,226 | ) | $ | (66,622 | ) | $ | 25,396 | ||||||||||||||||||||||||||
| $ | (83,201 | ) | $ | (162,958 | ) | $ | 79,757 | ||||||||||||||||||||||||||
Forward contracts
Counterparty | Settlement | Currency Purchased | Currency Sold | Unrealized | ||||||||||||||||||||
Bank of America N.A.* | 11/14/23 | PLN | 8,634,308 | USD | 2,112,576 | $ | (138,393 | ) | ||||||||||||||||
Bank of America N.A.* | 11/14/23 | USD | 6,746,970 | EUR | 6,138,365 | 245,811 | ||||||||||||||||||
Bank of America N.A.* | 11/14/23 | USD | 599,882 | CZK | 13,757,717 | 4,612 | ||||||||||||||||||
Barclays Bank PLC* | 10/17/23 | USD | 1,901,293 | PLN | 8,100,852 | 47,648 | ||||||||||||||||||
Barclays Bank PLC* | 11/14/23 | USD | 2,074,242 | PLN | 8,634,308 | 100,059 | ||||||||||||||||||
BNP Paribas SA* | 10/17/23 | PLN | 8,100,852 | USD | 2,034,000 | (180,355 | ) | |||||||||||||||||
BNP Paribas SA* | 10/17/23 | ILS | 2,980,767 | USD | 809,398 | (27,400 | ) | |||||||||||||||||
BNP Paribas SA* | 10/24/23 | THB | 34,178,095 | USD | 1,013,105 | (72,811 | ) | |||||||||||||||||
BNP Paribas SA* | 11/14/23 | USD | 924,000 | CZK | 20,489,367 | 37,464 | ||||||||||||||||||
BNP Paribas SA* | 11/14/23 | EUR | 614,026 | USD | 669,275 | (18,958 | ) | |||||||||||||||||
BNP Paribas SA* | 11/21/23 | USD | 2,454,223 | JPY | 352,916,060 | 74,086 | ||||||||||||||||||
Citibank N.A.* | 10/10/23 | CLP | 412,971,900 | USD | 506,000 | (41,439 | ) | |||||||||||||||||
Citibank N.A.* | 10/10/23 | BRL | 7,326,288 | USD | 1,499,000 | (43,162 | ) | |||||||||||||||||
Citibank N.A.* | 10/10/23 | COP | 6,345,246,920 | USD | 1,517,000 | 35,667 | ||||||||||||||||||
Citibank N.A.* | 10/24/23 | JPY | 349,247,500 | USD | 2,556,835 | (211,957 | ) | |||||||||||||||||
Citibank N.A.* | 10/24/23 | IDR | 25,048,342,000 | USD | 1,668,499 | (50,820 | ) | |||||||||||||||||
The accompanying notes are an integral part of the financial statements.
47
MassMutual Emerging Markets Debt Blended Total Return Fund – Portfolio of Investments (Continued) |
Counterparty | Settlement | Currency Purchased | Currency Sold | Unrealized | ||||||||||||||||||||
Citibank N.A.* | 10/24/23 | USD | 1,622,472 | IDR | 25,048,342,000 | $ | 4,792 | |||||||||||||||||
Citibank N.A.* | 11/14/23 | HUF | 356,755,666 | USD | 1,003,000 | (41,799 | ) | |||||||||||||||||
Citibank N.A.* | 11/14/23 | USD | 442,314 | CZK | 10,080,125 | 6,166 | ||||||||||||||||||
Citibank N.A.* | 11/21/23 | JPY | 352,916,060 | USD | 2,464,094 | (83,957 | ) | |||||||||||||||||
Citibank N.A.* | 11/21/23 | USD | 1,050,168 | PHP | 59,796,548 | (6,371 | ) | |||||||||||||||||
Goldman Sachs International* | 10/10/23 | USD | 588,951 | BRL | 2,915,202 | 9,659 | ||||||||||||||||||
Goldman Sachs International* | 10/10/23 | BRL | 1,140,388 | USD | 228,000 | (1,389 | ) | |||||||||||||||||
Goldman Sachs International* | 10/10/23 | MXN | 82,510,904 | USD | 4,713,272 | 15,879 | ||||||||||||||||||
Goldman Sachs International* | 10/10/23 | USD | 1,145,540 | MXN | 19,912,959 | 4,220 | ||||||||||||||||||
Goldman Sachs International* | 10/17/23 | RON | 4,470,475 | USD | 1,011,000 | (61,078 | ) | |||||||||||||||||
Goldman Sachs International* | 11/14/23 | USD | 1,931,661 | HUF | 701,667,773 | 41,169 | ||||||||||||||||||
Goldman Sachs International* | 11/14/23 | USD | 1,365,203 | CZK | 30,370,981 | 51,108 | ||||||||||||||||||
Goldman Sachs International* | 11/21/23 | USD | 949,000 | CNH | 6,903,009 | 1,650 | ||||||||||||||||||
Goldman Sachs International* | 2/13/24 | TRY | 13,367,984 | USD | 472,000 | (48,563 | ) | |||||||||||||||||
HSBC Bank PLC* | 10/17/23 | USD | 4,502,860 | CHF | 3,931,289 | 201,680 | ||||||||||||||||||
HSBC Bank PLC* | 11/14/23 | EUR | 2,205,024 | USD | 2,378,000 | (42,654 | ) | |||||||||||||||||
HSBC Bank PLC* | 11/14/23 | ILS | 11,496,003 | USD | 3,118,342 | (98,572 | ) | |||||||||||||||||
HSBC Bank PLC* | 11/21/23 | KRW | 1,503,360,580 | USD | 1,131,410 | (17,109 | ) | |||||||||||||||||
HSBC Bank PLC* | 11/21/23 | THB | 53,448,528 | USD | 1,525,270 | (51,271 | ) | |||||||||||||||||
HSBC Bank USA* | 11/21/23 | USD | 1,525,270 | THB | 53,448,528 | 51,271 | ||||||||||||||||||
HSBC Bank USA* | 11/21/23 | USD | 1,131,410 | KRW | 1,503,360,580 | 17,109 | ||||||||||||||||||
JP Morgan Chase Bank N.A.* | 10/10/23 | BRL | 578,493 | USD | 116,596 | (1,641 | ) | |||||||||||||||||
Morgan Stanley & Co. LLC* | 10/10/23 | USD | 998,000 | MXN | 17,113,755 | 17,117 | ||||||||||||||||||
Morgan Stanley & Co. LLC* | 10/17/23 | USD | 2,850,979 | ZAR | 53,661,122 | 20,219 | ||||||||||||||||||
Morgan Stanley & Co. LLC* | 11/14/23 | EUR | 2,306,544 | USD | 2,525,000 | (82,133 | ) | |||||||||||||||||
Morgan Stanley & Co. LLC* | 11/14/23 | USD | 2,603,880 | CHF | 2,260,959 | 122,774 | ||||||||||||||||||
Morgan Stanley & Co. LLC* | 11/14/23 | USD | 477,000 | CZK | 10,502,667 | 22,569 | ||||||||||||||||||
Morgan Stanley & Co. LLC* | 11/14/23 | USD | 1,037,000 | EUR | 936,696 | 44,943 | ||||||||||||||||||
Morgan Stanley & Co. LLC* | 11/21/23 | MYR | 9,122,307 | USD | 1,987,864 | (34,507 | ) | |||||||||||||||||
Morgan Stanley & Co. LLC* | 11/21/23 | USD | 2,680,022 | SGD | 3,619,444 | 26,512 | ||||||||||||||||||
Morgan Stanley & Co. LLC* | 2/06/24 | BRL | 4,666,536 | USD | 940,000 | (25,312 | ) | |||||||||||||||||
| $ | (177,467 | ) | ||||||||||||||||||||||
Futures contracts
| Expiration | Number of | Notional | Value/ Net | ||||||||||||
Short | ||||||||||||||||
U.S. Treasury Note 10 Year | 12/19/23 | 89 | $ | (9,795,312 | ) | $ | 177,749 | |||||||||
U.S. Treasury Ultra Bond | 12/19/23 | 1 | (127,857 | ) | 9,169 | |||||||||||
| $ | 186,918 | ||||||||||||||
The accompanying notes are an integral part of the financial statements.
48
MassMutual Emerging Markets Debt Blended Total Return Fund – Portfolio of Investments (Continued) |
OTC Credit Default Swaps-Sell Protection†
Reference | Rate | Payment | Counterparty | Credit | Termination | Notional | Value | Upfront | Unrealized | ||||||||||||||||||||||||||||
Malaysia Sovereign | 1.000% | Quarterly | Bank of America N.A.* | A** | 12/20/28 | USD | 1,000,000 | $ | 23,042 | $ | 23,600 | $ | (558 | ) | |||||||||||||||||||||||
Republic of Indonesia | 1.000% | Quarterly | Bank of America N.A.* | BBB** | 12/20/28 | USD | 1,280,000 | 4,883 | 7,170 | (2,287 | ) | ||||||||||||||||||||||||||
Republic of Chile | 1.000% | Quarterly | BNP Paribas SA* | A** | 12/20/28 | USD | 1,300,000 | 16,823 | 18,830 | (2,007 | ) | ||||||||||||||||||||||||||
Republic of Philippines | 1.000% | Quarterly | Goldman Sachs International* | BBB** | 12/20/28 | USD | 1,000,000 | 7,625 | 10,426 | (2,801 | ) | ||||||||||||||||||||||||||
Republic of Peru | 1.000% | Quarterly | Morgan Stanley & Co. LLC* | BBB** | 12/20/28 | USD | 1,300,000 | 9,905 | 11,689 | (1,784 | ) | ||||||||||||||||||||||||||
United Mexican States | 1.000% | Quarterly | Morgan Stanley & Co. LLC* | BBB** | 12/20/28 | USD | 1,345,000 | (14,443 | ) | (9,669 | ) | (4,774 | ) | ||||||||||||||||||||||||
| $ | 47,835 | $ | 62,046 | $ | (14,211 | ) | |||||||||||||||||||||||||||||||
Centrally Cleared Interest Rate Swaps
Paid by the Fund | Received by the Fund | ||||||||||||||||||||||||||||||||
Rate/ Reference | Frequency | Rate/ Reference | Frequency | Termination | Notional | Value | Upfront | Unrealized | |||||||||||||||||||||||||
BRL CDI | Maturity | 11.215% | Maturity | 1/02/29 | BRL | 7,351,584 | $ | (31,296 | ) | $ | — | $ | (31,296 | ) | |||||||||||||||||||
BRL CDI | Maturity | 11.280% | Maturity | 1/02/29 | BRL | 2,672,803 | (9,100 | ) | — | (9,100 | ) | ||||||||||||||||||||||
BRL CDI | Maturity | 13.165% | Maturity | 1/02/29 | BRL | 2,539,758 | 56,422 | — | 56,422 | ||||||||||||||||||||||||
BRL CDI | Maturity | 13.020% | Maturity | 1/02/29 | BRL | 2,607,099 | 52,741 | — | 52,741 | ||||||||||||||||||||||||
3-Month TELBOR | Quarterly | 3.685% | Annually | 6/19/33 | ILS | 11,390,000 | (153,719 | ) | — | (153,719 | ) | ||||||||||||||||||||||
| $ | (84,952 | ) | $ | — | $ | (84,952 | ) | ||||||||||||||||||||||||||
OTC Currency Swaps
Paid by the Fund | Received by the Fund | |||||||||||||||||||||||||||||||||||||||||||||||
Rate/ | No. of | Frequency | Rate/ | No. of | Frequency | Counterparty | Termination | Value | Upfront | Unrealized | ||||||||||||||||||||||||||||||||||||||
Fixed 3.675% | EUR | 550,000 | Annually | Fixed 4.793% | USD | 604,450 | Semi-Annually | Citibank N.A.* | 6/03/26 | $ | 16,382 | $ | (467 | ) | $ | 16,849 | ||||||||||||||||||||||||||||||||
Fixed 5.875% | EUR | 300,000 | Annually | Fixed 8.460% | USD | 330,000 | Semi-Annually | Citibank N.A.* | 10/17/31 | 38,390 | (270 | ) | 38,660 | |||||||||||||||||||||||||||||||||||
| $ | 54,772 | $ | (737 | ) | $ | 55,509 | ||||||||||||||||||||||||||||||||||||||||||
* | Contracts are subject to a master netting agreement or similar agreement. |
** | Rating represents a weighted average of the ratings of all securities included in the underlying index for the credit default swap. Ratings used in the weighted average are from Moody’s Investors Service, Inc., S&P Global Ratings, or Fitch Ratings, whichever is the highest for each constituent. All ratings are as of the report date and do not reflect subsequent changes. |
The accompanying notes are an integral part of the financial statements.
49
MassMutual Emerging Markets Debt Blended Total Return Fund – Portfolio of Investments (Continued) |
† | For each credit derivative with sold protection, the credit ratings of the entities referenced, as rated by any rating organization, are included in the equivalent S&P Global Ratings. The reference entity rating represents the creditworthiness of the underlying issuer. As the credit rating declines, the likelihood of payment by the fund increases. Notional amounts represent the maximum potential amount of future payments (undiscounted) the Fund could be required to make under the credit derivatives with sold protection. |
Currency Legend
AUD | Australian Dollar |
BRL | Brazilian Real |
CHF | Swiss Franc |
CLP | Chilean Peso |
CNH | Offshore Chinese Yuan |
COP | Colombian Peso |
CZK | Czech Koruna |
EUR | Euro |
HUF | Hungarian Forint |
IDR | Indonesian Rupiah |
ILS | Israeli Shekel |
JPY | Japanese Yen |
KRW | South Korean Won |
MXN | Mexican Peso |
MYR | Malaysian Ringgit |
NOK | Norwegian Krone |
PEN | Peruvian New Sol |
PHP | Philippine Peso |
PLN | Polish Zloty |
RON | New Romanian Leu |
SGD | Singapore Dollar |
THB | Thai Baht |
TRY | New Turkish Lira |
USD | U.S. Dollar |
ZAR | South African Rand |
The accompanying notes are an integral part of the financial statements.
50
MassMutual Global Emerging Markets Equity Fund – Portfolio of Investments |
September 30, 2023 |
Number of | Value | |||||||
EQUITIES — 98.8% | ||||||||
COMMON STOCK — 97.8% | ||||||||
Brazil — 3.8% | ||||||||
BB Seguridade Participacoes SA | 21,700 | $ | 134,736 | |||||
Localiza Rent a Car SA | 9,700 | 113,006 | ||||||
Rumo SA | 10,500 | 47,669 | ||||||
Vamos Locacao de Caminhoes Maquinas e Equipamentos SA | 37,600 | 72,933 | ||||||
| 368,344 | ||||||||
China — 31.8% | ||||||||
Alibaba Group Holding Ltd. (a) | 38,488 | 417,264 | ||||||
Baidu, Inc. Class A (a) | 7,400 | 124,739 | ||||||
China Construction Bank Corp. Class H | 262,000 | 147,628 | ||||||
China Longyuan Power Group Corp. Ltd. Class H | 110,000 | 96,297 | ||||||
China Resources Land Ltd. | 36,000 | 141,876 | ||||||
ENN Natural Gas Co. Ltd. Class A | 41,900 | 99,978 | ||||||
JD.com, Inc. Class A | 8,562 | 124,448 | ||||||
Li Auto, Inc. ADR (a) | 3,667 | 130,728 | ||||||
Li Ning Co. Ltd. | 19,500 | 81,898 | ||||||
Luxshare Precision Industry Co. Ltd. Class A | 21,900 | 89,642 | ||||||
Meituan Class B (a) (b) | 13,350 | 193,806 | ||||||
NARI Technology Co. Ltd. Class A | 36,108 | 109,745 | ||||||
Ping An Bank Co. Ltd. Class A | 87,800 | 134,380 | ||||||
Ping An Insurance Group Co. of China Ltd. Class H | 35,000 | 198,247 | ||||||
Tencent Holdings Ltd. | 14,500 | 561,948 | ||||||
Topsports International Holdings Ltd. (b) | 178,000 | 135,153 | ||||||
Warom Technology, Inc. Co. Class A | 29,000 | 86,552 | ||||||
WuXi AppTec Co. Ltd. Class H (b) | 10,600 | 126,142 | ||||||
Yum China Holdings, Inc. | 1,800 | 100,296 | ||||||
| 3,100,767 | ||||||||
Hong Kong — 2.0% | ||||||||
AIA Group Ltd. | 15,000 | 121,336 | ||||||
Hong Kong Exchanges & Clearing Ltd. | 2,000 | 74,564 | ||||||
| 195,900 | ||||||||
India — 12.1% | ||||||||
Axis Bank Ltd. GDR (b) | 4,245 | 266,161 | ||||||
HDFC Bank Ltd. ADR | 5,780 | 341,078 | ||||||
Infosys Ltd. ADR (c) | 9,197 | 157,361 | ||||||
Larsen & Toubro Ltd. GDR (b) | 1,982 | 71,946 | ||||||
Reliance Industries Ltd. GDR (b) | 6,072 | 339,425 | ||||||
| 1,175,971 | ||||||||
Number of | Value | |||||||
Indonesia — 3.1% | ||||||||
Bank Negara Indonesia Persero Tbk PT | 221,000 | $ | 147,583 | |||||
Telkom Indonesia Persero Tbk PT | 654,500 | �� | 158,742 | |||||
| 306,325 | ||||||||
Mexico — 2.3% | ||||||||
Grupo Financiero Banorte SAB de CV Class O | 17,227 | 144,389 | ||||||
Wal-Mart de Mexico SAB de CV | 20,000 | 75,490 | ||||||
| 219,879 | ||||||||
Poland — 0.9% | ||||||||
Powszechna Kasa Oszczednosci Bank Polski SA (a) | 11,053 | 87,351 | ||||||
Republic of Korea — 15.3% | ||||||||
Cheil Worldwide, Inc. | 6,345 | 94,255 | ||||||
Hana Financial Group, Inc. | 8,102 | 254,795 | ||||||
Hyundai Motor Co. | 1,450 | 205,269 | ||||||
LG Chem Ltd. | 511 | 187,874 | ||||||
Samsung Electronics Co. Ltd. | 14,738 | 746,700 | ||||||
| 1,488,893 | ||||||||
Russia — 0.0% | ||||||||
X5 Retail Group N.V. GDR (a) (b) (d) (e) | 4,250 | — | ||||||
Saudi Arabia — 2.9% | ||||||||
Al Rajhi Bank | 8,885 | 160,878 | ||||||
Saudi Tadawul Group Holding Co. | 2,391 | 123,097 | ||||||
| 283,975 | ||||||||
South Africa — 3.1% | ||||||||
Anglo American PLC | 4,181 | 115,644 | ||||||
FirstRand Ltd. | 34,594 | 116,588 | ||||||
Mr Price Group Ltd. | 9,348 | 68,377 | ||||||
| 300,609 | ||||||||
Taiwan — 15.1% | ||||||||
CTBC Financial Holding Co. Ltd. | 153,000 | 116,331 | ||||||
Hon Hai Precision Industry Co. Ltd. | 58,000 | 186,973 | ||||||
MediaTek, Inc. | 8,000 | 182,764 | ||||||
Powertech Technology, Inc. | 44,000 | 138,614 | ||||||
Taiwan Semiconductor Manufacturing Co. Ltd. | 52,000 | 843,861 | ||||||
| 1,468,543 | ||||||||
Thailand — 1.5% | ||||||||
CP ALL PCL NVDR | 89,200 | 148,088 | ||||||
United Arab Emirates — 1.3% | ||||||||
Emaar Properties PJSC | 59,959 | 131,262 | ||||||
United Kingdom — 0.8% | ||||||||
Anglogold Ashanti PLC (a) | 5,072 | 80,138 | ||||||
The accompanying notes are an integral part of the financial statements.
51
MassMutual Global Emerging Markets Equity Fund – Portfolio of Investments (Continued) |
Number of | Value | |||||||
United States — 1.8% | ||||||||
Samsonite International SA (a) (b) | 50,700 | $ | 173,492 | |||||
TOTAL COMMON STOCK (Cost $10,067,017) | 9,529,537 | |||||||
PREFERRED STOCK — 1.0% | ||||||||
Brazil — 1.0% | ||||||||
Gerdau SA | 20,895 | 100,306 | ||||||
TOTAL PREFERRED STOCK (Cost $102,676) | 100,306 | |||||||
TOTAL EQUITIES (Cost $10,169,693) | 9,629,843 | |||||||
RIGHTS — 0.0% | ||||||||
Brazil — 0.0% | ||||||||
Localiza Rent a Car SA (a) | 71 | 226 | ||||||
TOTAL RIGHTS (Cost $0) | 226 | |||||||
TOTAL LONG-TERM INVESTMENTS (Cost $10,169,693) | 9,630,069 | |||||||
SHORT-TERM INVESTMENTS — 2.3% | ||||||||
Investment of Cash Collateral from Securities Loaned — 0.1% | ||||||||
State Street Navigator Securities Lending Government Money Market Portfolio (f) | 10,500 | 10,500 | ||||||
Principal | ||||||||
Repurchase Agreement — 2.2% | ||||||||
Fixed Income Clearing Corp., Repurchase Agreement, dated 9/29/23, 1.600%, due 10/02/23 (g) | $ | 213,523 | 213,523 | |||||
TOTAL SHORT-TERM INVESTMENTS (Cost $224,023) | 224,023 | |||||||
TOTAL INVESTMENTS — 101.1% (Cost $10,393,716) (h) | 9,854,092 | |||||||
Other Assets/(Liabilities) — (1.1)% | (103,653 | ) | ||||||
NET ASSETS — 100.0% | $ | 9,750,439 | ||||||
Abbreviation Legend
ADR | American Depositary Receipt |
GDR | Global Depositary Receipt |
Notes to Portfolio of Investments
Percentages are stated as a percent of net assets.
(a) | Non-income producing security. |
(b) | Security is exempt from registration under Regulation S or Rule 144A of the Securities Act of 1933. These securities are considered restricted and may be resold in transactions exempt from registration. At September 30, 2023, the aggregate market value of these securities amounted to $1,306,125 or 13.40% of net assets. |
(c) | Denotes all or a portion of security on loan. The total value of securities on loan as of September 30, 2023, was $10,266 or 0.11% of net assets. (Note 2). |
(d) | This security is fair valued in good faith in accordance with procedures approved by the Board of Trustees. At September 30, 2023, these securities amounted to a value of $0 or 0.00% of net assets. |
(e) | Investment is valued using significant unobservable inputs. |
(f) | Represents investment of security lending cash collateral. (Note 2). |
(g) | Maturity value of $213,551. Collateralized by U.S. Government Agency obligations with a rate of 0.625%, maturity date of 1/15/26, and an aggregate market value, including accrued interest, of $217,819. |
(h) | See Note 6 for aggregate cost for federal tax purposes. |
Sector weightings, as a percentage of net assets, is as follows:
Financial | 29.1 | % | ||
Technology | 21.2 | % | ||
Communications | 17.2 | % | ||
Consumer, Cyclical | 12.2 | % | ||
Industrial | 6.1 | % | ||
Basic Materials | 5.0 | % | ||
Energy | 3.5 | % | ||
Consumer, Non-cyclical | 2.5 | % | ||
Utilities | 2.0 | % | ||
Total Long-Term Investments | 98.8 | % | ||
Short-Term Investments and Other Assets and Liabilities | 1.2 | % | ||
Net Assets | 100.0 | % |
The accompanying notes are an integral part of the financial statements.
52
[THIS PAGE INTENTIONALLY LEFT BLANK]
MassMutual Funds – Financial Statements |
MassMutual | MassMutual | MassMutual | MassMutual | |||||||||||||
Assets: | ||||||||||||||||
Investments, at value (Note 2) (a) | $ | 175,856,746 | $ | 122,817,694 | $ | 42,423,631 | $ | 9,640,569 | ||||||||
Repurchase agreements, at value (Note 2) (b) | 10,242,246 | 16,191,670 | 2,215,095 | 213,523 | ||||||||||||
Total investments (c) | 186,098,992 | 139,009,364 | 44,638,726 | 9,854,092 | ||||||||||||
Cash | — | — | 34,334 | 3 | ||||||||||||
Foreign currency, at value (d) | 1,614,416 | 1,257,503 | — | 11,938 | ||||||||||||
Receivables from: | ||||||||||||||||
Investments sold | ||||||||||||||||
Regular delivery | 9,391,466 | 2,288,738 | — | — | ||||||||||||
Delayed delivery | 167 | — | — | — | ||||||||||||
Open forward contracts (Note 2) | 796,155 | 588,369 | 1,204,184 | — | ||||||||||||
Fund shares sold | 141,277 | 56 | 11,765 | — | ||||||||||||
Cash collateral pledged for open derivatives (Note 2) | — | — | 1,171,000 | — | ||||||||||||
Investment adviser (Note 3) | 30,762 | 8,320 | — | 12,031 | ||||||||||||
Variation margin on open derivative instruments (Note 2) | — | — | 69,055 | — | ||||||||||||
Interest and dividends | 2,957,041 | 2,022,763 | 714,775 | 11,722 | ||||||||||||
Foreign tax reclaims | 3,906 | 91,885 | 28,157 | 2,774 | ||||||||||||
Open swap agreements, at value (Note 2) | — | — | 117,050 | — | ||||||||||||
Prepaid expenses | 8,778 | 5,830 | 6,249 | 5,267 | ||||||||||||
Unrealized appreciation on: | ||||||||||||||||
Unfunded bank loan commitments | — | 45,826 | — | — | ||||||||||||
Total assets | 201,042,960 | 145,318,654 | 47,995,295 | 9,897,827 | ||||||||||||
Liabilities: | ||||||||||||||||
Payables for: | ||||||||||||||||
Investments purchased | ||||||||||||||||
Regular delivery | 9,645,131 | 10,766,595 | — | — | ||||||||||||
Delayed delivery | — | 914,000 | 720,000 | — | ||||||||||||
Written options outstanding, at value (Note 2) (e) | — | — | 83,201 | — | ||||||||||||
Distributions (Note 2) | 101,291 | 219,049 | 99,455 | — | ||||||||||||
Open forward contracts (Note 2) | 12,749 | — | 1,381,651 | — | ||||||||||||
Foreign currency overdraft | — | — | 27,300 | — | ||||||||||||
Interest and dividends | — | — | 25,285 | — | ||||||||||||
Fund shares repurchased | 277,243 | 46,520 | 8,173 | — | ||||||||||||
Cash collateral held for open derivatives (Note 2) | — | — | 140,000 | — | ||||||||||||
Cash collateral held for securities on loan (Note 2) | 14,521 | 3,538,785 | — | 10,500 | ||||||||||||
Open swap agreements, at value (Note 2) | — | — | 14,443 | — | ||||||||||||
Trustees’ fees and expenses (Note 3) | 246 | 396 | 110 | 39 | ||||||||||||
Affiliates (Note 3): | ||||||||||||||||
Administration fees | 58,447 | 45,910 | 33,835 | 26,713 | ||||||||||||
Investment advisory fees | 103,114 | 79,543 | 49,441 | 7,386 | ||||||||||||
Distribution fees | 24,076 | 53,639 | 2,190 | 316 | ||||||||||||
Variation margin on open derivative instruments (Note 2) | — | — | 18,402 | — | ||||||||||||
Due to custodian | 619,629 | 355,331 | — | — | ||||||||||||
Accrued expense and other liabilities | 310,357 | 233,486 | 160,212 | 102,434 | ||||||||||||
Unrealized depreciation on: | ||||||||||||||||
Unfunded bank loan commitments | 2,122 | — | — | — | ||||||||||||
Total liabilities | 11,168,926 | 16,253,254 | 2,763,698 | 147,388 | ||||||||||||
Net assets | $ | 189,874,034 | $ | 129,065,400 | $ | 45,231,597 | $ | 9,750,439 | ||||||||
Net assets consist of: | ||||||||||||||||
Paid-in capital | $ | 233,463,920 | $ | 172,523,917 | $ | 86,530,333 | $ | 10,088,693 | ||||||||
Accumulated earnings (loss) | (43,589,886 | ) | (43,458,517 | ) | (41,298,736 | ) | (338,254 | ) | ||||||||
Net assets | $ | 189,874,034 | $ | 129,065,400 | $ | 45,231,597 | $ | 9,750,439 | ||||||||
(a) | Cost of investments: | $ | 190,325,680 | $ | 137,997,547 | $ | 50,683,525 | $ | 10,180,193 | ||||||||
(b) | Cost of repurchase agreements: | $ | 10,242,246 | $ | 16,191,670 | $ | 2,215,095 | $ | 213,523 | ||||||||
(c) | Securities on loan with market value of: | $ | 11,828 | $ | 3,463,689 | $ | — | $ | 10,266 | ||||||||
(d) | Cost of foreign currency: | $ | 1,630,521 | $ | 1,265,152 | $ | 191 | $ | 11,937 | ||||||||
(e) | Premiums on written options: | $ | — | $ | — | $ | 162,958 | $ | — |
The accompanying notes are an integral part of the financial statements.
54
MassMutual Funds – Financial Statements (Continued) |
Statements of Assets and Liabilities |
MassMutual | MassMutual | MassMutual | MassMutual | |||||||||||||
Class I shares: | ||||||||||||||||
Net assets | $ | 54,919,680 | $ | 3,074,737 | $ | 1,800,167 | $ | 4,749,269 | ||||||||
Shares outstanding (a) | 6,229,484 | 405,552 | 249,503 | 490,000 | ||||||||||||
Net asset value, offering price and redemption price per share | $ | 8.82 | $ | 7.58 | $ | 7.22 | $ | 9.69 | ||||||||
Class Y shares: | ||||||||||||||||
Net assets | $ | 110,307,998 | $ | 47,253,703 | $ | 40,949,685 | $ | 4,809,647 | ||||||||
Shares outstanding (a) | 12,525,567 | 6,230,067 | 5,693,443 | 496,183 | ||||||||||||
Net asset value, offering price and redemption price per share | $ | 8.81 | $ | 7.58 | $ | 7.19 | $ | 9.69 | ||||||||
Class L shares: | ||||||||||||||||
Net assets | $ | 20,319,134 | $ | 75,808,481 | $ | 2,185,738 | $ | 96,453 | ||||||||
Shares outstanding (a) | 2,311,764 | 9,995,443 | 303,893 | 10,000 | ||||||||||||
Net asset value, offering price and redemption price per share | $ | 8.79 | $ | 7.58 | $ | 7.19 | $ | 9.65 | ||||||||
Offering price per share (100/[100-maximum sales charge] of net asset value) | $ | 9.06 | $ | 7.90 | $ | 7.49 | $ | 10.05 | ||||||||
Class C shares: | ||||||||||||||||
Net assets | $ | 4,327,222 | $ | 2,928,479 | $ | 296,007 | $ | 95,070 | ||||||||
Shares outstanding (a) | 493,915 | 386,224 | 41,142 | 10,000 | ||||||||||||
Net asset value, offering price and redemption price per share | $ | 8.76 | $ | 7.58 | $ | 7.19 | $ | 9.51 | ||||||||
(a) Authorized unlimited number of shares with no par value.
The accompanying notes are an integral part of the financial statements.
55
MassMutual Funds – Financial Statements (Continued) |
Statements of Operations |
MassMutual | MassMutual | MassMutual | MassMutual | |||||||||||||
Investment income (Note 2): | ||||||||||||||||
Dividends (a) | $ | — | $ | 6,141 | $ | — | $ | 274,113 | ||||||||
Interest (b) | 21,088,730 | 11,824,599 | 3,840,990 | 4,485 | ||||||||||||
Securities lending net income | 57 | 9,760 | 606 | 13 | ||||||||||||
Non-cash income | — | — | — | 35,059 | ||||||||||||
Total investment income | 21,088,787 | 11,840,500 | 3,841,596 | 313,670 | ||||||||||||
Expenses (Note 3): | ||||||||||||||||
Investment advisory fees | 1,500,620 | 953,067 | 385,692 | 91,202 | ||||||||||||
Custody fees | 226,843 | 104,248 | 55,133 | 43,740 | ||||||||||||
Interest expense (Note 7) | 40,533 | — | — | — | ||||||||||||
Trustee reporting | 43,861 | 17,284 | 6,532 | 1,054 | ||||||||||||
Audit and tax fees | 10,043 | 10,043 | 9,731 | 9,731 | ||||||||||||
Commitment & Service Expenses | 93,927 | 53,885 | 9,373 | 2,050 | ||||||||||||
Legal fees | 24,048 | 1,846 | 1,331 | 139 | ||||||||||||
Proxy fees | 1,497 | 1,497 | 1,497 | 1,497 | ||||||||||||
Accounting & Administration fees | 3,185 | 18,061 | 10,967 | 1,602 | ||||||||||||
Shareholder reporting fees | 41,229 | 19,701 | 13,837 | 8,221 | ||||||||||||
Trustees’ fees | 19,236 | 8,339 | 4,400 | 612 | ||||||||||||
Registration and filing fees | 71,810 | 44,235 | 39,999 | 39,895 | ||||||||||||
Transfer agent fees | 30,174 | 28,934 | 23,765 | 24,088 | ||||||||||||
| 2,107,006 | 1,261,140 | 562,257 | 223,831 | |||||||||||||
Administration fees: | ||||||||||||||||
Class Y | 96,398 | 26,759 | 27,971 | 1,509 | ||||||||||||
Class L | 11,102 | 39,141 | 509 | 20 | ||||||||||||
Class C | 1,460 | 1,024 | — | — | ||||||||||||
Distribution and Service fees: | ||||||||||||||||
Class L | 69,386 | 163,088 | 6,361 | 249 | ||||||||||||
Class C | 48,681 | 34,144 | 4,327 | 986 | ||||||||||||
Total expenses | 2,334,033 | 1,525,296 | 601,425 | 226,595 | ||||||||||||
Expenses waived (Note 3): | ||||||||||||||||
Class I fees reimbursed by adviser | (100,915 | ) | (7,206 | ) | (2,301 | ) | (63,237 | ) | ||||||||
Class Y fees reimbursed by adviser | (318,291 | ) | (74,931 | ) | (86,102 | ) | (66,299 | ) | ||||||||
Class L fees reimbursed by adviser | (55,726 | ) | (94,050 | ) | (3,855 | ) | (1,307 | ) | ||||||||
Class C fees reimbursed by adviser | (9,542 | ) | (2,396 | ) | (557 | ) | (1,264 | ) | ||||||||
Net expenses: | 1,849,559 | 1,346,713 | 508,610 | 94,488 | ||||||||||||
Net investment income (loss) | 19,239,228 | 10,493,787 | 3,332,986 | 219,182 | ||||||||||||
The accompanying notes are an integral part of the financial statements.
56
MassMutual Funds – Financial Statements (Continued) |
Statements of Operations |
MassMutual | MassMutual | MassMutual | MassMutual | |||||||||||||
Realized and unrealized gain (loss): | ||||||||||||||||
Net realized gain (loss) on: | ||||||||||||||||
Investment transactions | $ | (24,442,992 | ) | $ | (12,098,080 | ) | $ | (15,114,982 | ) | $ | 43,660 | |||||
Futures contracts | — | — | 1,004,614 | — | ||||||||||||
Written options | — | — | 32,126 | — | ||||||||||||
Swap agreements | — | — | 287,567 | — | ||||||||||||
Foreign currency transactions | 748,551 | 321,716 | (25,404 | ) | (1,157 | ) | ||||||||||
Forward contracts | (4,808,754 | ) | (1,780,704 | ) | (1,892,819 | ) | — | |||||||||
Net realized gain (loss) | (28,503,195 | ) | (13,557,068 | ) | (15,708,898 | ) | 42,503 | |||||||||
Net change in unrealized appreciation (depreciation) on: | ||||||||||||||||
Investment transactions | 39,595,568 | 17,765,135 | 20,124,469 | 795,939 | ||||||||||||
Futures contracts | — | — | (267,338 | ) | — | |||||||||||
Unfunded bank loan commitments | (2,122 | ) | 45,826 | — | — | |||||||||||
Written options | — | — | 108,905 | — | ||||||||||||
Swap agreements | — | — | (153,776 | ) | — | |||||||||||
Translation of assets and liabilities in foreign currencies | 396,537 | 16,941 | 6,770 | 30 | ||||||||||||
Forward contracts | (845,396 | ) | (57,891 | ) | (398,099 | ) | — | |||||||||
Net change in unrealized appreciation (depreciation) | 39,144,587 | 17,770,011 | 19,420,931 | 795,969 | ||||||||||||
Net realized gain (loss) and change in unrealized appreciation (depreciation) | 10,641,392 | 4,212,943 | 3,712,033 | 838,472 | ||||||||||||
Net increase (decrease) in net assets resulting from operations | $ | 29,880,620 | $ | 14,706,730 | $ | 7,045,019 | $ | 1,057,654 | ||||||||
(a) Net of foreign withholding tax of: | $ | — | $ | — | $ | — | $ | 40,450 | ||||||||
(b) Net of foreign withholding tax of: | $ | — | $ | — | $ | 20,167 | $ | — | ||||||||
The accompanying notes are an integral part of the financial statements.
57
MassMutual Funds – Financial Statements (Continued) |
MassMutual Global | MassMutual Global Credit | |||||||||||||||
Year | Year | Year | Year | |||||||||||||
Increase (Decrease) in Net Assets: | ||||||||||||||||
Operations: | ||||||||||||||||
Net investment income (loss) | $ | 19,239,228 | $ | 16,918,746 | $ | 10,493,787 | $ | 8,936,921 | ||||||||
Net realized gain (loss) | (28,503,195 | ) | 10,353,988 | (13,557,068 | ) | 2,642,876 | ||||||||||
Net change in unrealized appreciation (depreciation) | 39,144,587 | (52,877,210 | ) | 17,770,011 | (31,902,007 | ) | ||||||||||
Net increase (decrease) in net assets resulting from operations | 29,880,620 | (25,604,476 | ) | 14,706,730 | (20,322,210 | ) | ||||||||||
Distributions to shareholders (Note 2): | ||||||||||||||||
Class I | (5,090,797 | ) | (3,199,216 | ) | (404,830 | ) | (390,617 | ) | ||||||||
Class Y | (11,457,208 | ) | (11,570,943 | ) | (4,417,151 | ) | (5,279,435 | ) | ||||||||
Class L | (2,222,854 | ) | (2,117,862 | ) | (5,273,992 | ) | (3,569,242 | ) | ||||||||
Class C | (361,573 | ) | (222,878 | ) | (246,158 | ) | (268,433 | ) | ||||||||
Total distributions | (19,132,432 | ) | (17,110,899 | ) | (10,342,131 | ) | (9,507,727 | ) | ||||||||
Tax return of capital: | ||||||||||||||||
Class I | (178,421 | ) | — | (4,252 | ) | — | ||||||||||
Class Y | (401,549 | ) | — | (46,391 | ) | — | ||||||||||
Class L | (77,906 | ) | — | (55,390 | ) | — | ||||||||||
Class C | (12,672 | ) | — | (2,585 | ) | — | ||||||||||
Total tax return of capital | (670,548 | ) | — | (108,618 | ) | — | ||||||||||
Net fund share transactions (Note 5): | ||||||||||||||||
Class I | (16,929,786 | ) | 4,113,746 | (2,607,266 | ) | 373,111 | ||||||||||
Class Y | (90,220,996 | ) | (70,227,783 | ) | (17,568,890 | ) | (36,625,741 | ) | ||||||||
Class L | (27,695,008 | ) | (886,943 | ) | 15,228,855 | 17,269,403 | ||||||||||
Class C | (1,686,240 | ) | (248,965 | ) | (1,180,733 | ) | (920,668 | ) | ||||||||
Increase (decrease) in net assets from fund share transactions | (136,532,030 | ) | (67,249,945 | ) | (6,128,034 | ) | (19,903,895 | ) | ||||||||
Total increase (decrease) in net assets | (126,454,390 | ) | (109,965,320 | ) | (1,872,053 | ) | (49,733,832 | ) | ||||||||
Net assets | ||||||||||||||||
Beginning of year | 316,328,424 | 426,293,744 | 130,937,453 | 180,671,285 | ||||||||||||
End of year | $ | 189,874,034 | $ | 316,328,424 | $ | 129,065,400 | $ | 130,937,453 | ||||||||
(1) | On December 13, 2021, the Barings Global Floating Rate Fund, Barings Global Credit Income Opportunities Fund, Barings Emerging Markets Debt Blended Total Return Fund, and Barings Global Emerging Markets Equity Fund (each, a “Predecessor Fund”) were reorganized into the MassMutual Global Floating Rate Fund, MassMutual Global Credit Income Opportunities Fund, MassMutual Emerging Markets Debt Blended Total Return Fund, and MassMutual Global Emerging Markets Equity Fund (each, a “Fund”), respectively, and shareholders of each Predecessor Fund received a proportional distribution of the same class of shares, or Class L shares in the case of Class A shares, of the corresponding Fund. Information shown prior to December 13, 2021 is that of each applicable Predecessor Fund, and is that of each applicable Fund after December 13, 2021. Each Predecessor Fund changed its fiscal year end to September 30th prior to the reorganization. |
The accompanying notes are an integral part of the financial statements.
58
MassMutual Funds – Financial Statements (Continued) |
Statements of Changes in Net Assets |
MassMutual Emerging Markets | MassMutual Global Emerging | |||||||||||||||
Year | Year | Year | Year | |||||||||||||
Increase (Decrease) in Net Assets: | ||||||||||||||||
Operations: | ||||||||||||||||
Net investment income (loss) | $ | 3,332,986 | $ | 5,676,457 | $ | 219,182 | $ | 173,585 | ||||||||
Net realized gain (loss) | (15,708,898 | ) | (21,883,040 | ) | 42,503 | 17,819 | ||||||||||
Net change in unrealized appreciation (depreciation) | 19,420,931 | (23,649,004 | ) | 795,969 | (3,532,953 | ) | ||||||||||
Net increase (decrease) in net assets resulting from operations | 7,045,019 | (39,855,587 | ) | 1,057,654 | (3,341,549 | ) | ||||||||||
Distributions to shareholders (Note 2): | ||||||||||||||||
Class I | — | (65,064 | ) | (74,810 | ) | (153,174 | ) | |||||||||
Class Y | — | (7,132,638 | ) | (76,757 | ) | (157,506 | ) | |||||||||
Class L | — | (684,551 | ) | (1,268 | ) | (3,126 | ) | |||||||||
Class C | — | (37,233 | ) | (503 | ) | (3,126 | ) | |||||||||
Total distributions | — | (7,919,486 | ) | (153,338 | ) | (316,932 | ) | |||||||||
Tax return of capital: | ||||||||||||||||
Class I | (115,347 | ) | (12,456 | ) | — | — | ||||||||||
Class Y | (2,953,589 | ) | (1,365,466 | ) | — | — | ||||||||||
Class L | (155,975 | ) | (131,050 | ) | — | — | ||||||||||
Class C | (23,170 | ) | (7,128 | ) | — | — | ||||||||||
Total tax return of capital | (3,248,081 | ) | (1,516,100 | ) | — | — | ||||||||||
Net fund share transactions (Note 5): | ||||||||||||||||
Class I | — | 1,937,926 | — | — | ||||||||||||
Class Y | (14,835,978 | ) | (31,475,200 | ) | (65,426 | ) | (10,194 | ) | ||||||||
Class L | (1,231,324 | ) | (9,511,106 | ) | — | — | ||||||||||
Class C | (214,452 | ) | 162,184 | — | — | |||||||||||
Increase (decrease) in net assets from fund share transactions | (16,281,754 | ) | (38,886,196 | ) | (65,426 | ) | (10,194 | ) | ||||||||
Total increase (decrease) in net assets | (12,484,816 | ) | (88,177,369 | ) | 838,890 | (3,668,675 | ) | |||||||||
Net assets | ||||||||||||||||
Beginning of year | 57,716,413 | 145,893,782 | 8,911,549 | 12,580,224 | ||||||||||||
End of year | $ | 45,231,597 | $ | 57,716,413 | $ | 9,750,439 | $ | 8,911,549 | ||||||||
The accompanying notes are an integral part of the financial statements.
59
MassMutual Global Floating Rate Fund – Financial Statements (Continued) |
Financial Highlights (For a share outstanding throughout each period) |
Income (loss) from investment | Less distributions to shareholders | Ratios / Supplemental Data | ||||||||||||||||||||||||||||||||||||||||||||||||||||||||||
Net | Net | Net | Total | From net | From net | Tax | Total | Net | Total | Net | Ratio of | Ratio of | Ratio of | Net | ||||||||||||||||||||||||||||||||||||||||||||||
Class I* | ||||||||||||||||||||||||||||||||||||||||||||||||||||||||||||
9/30/23 | $ | 8.45 | $ | 0.73 | $ | 0.40 | $ | 1.13 | $ | (0.73 | ) | $ | — | $ | (0.03 | ) | $ | (0.76 | ) | $ | 8.82 | 13.86 | % | $ | 54,920 | 0.92 | % | 0.75 | % | 0.73 | % | 8.46 | % | |||||||||||||||||||||||||||
9/30/22 | 9.43 | 0.39 | (0.98 | ) | (0.59 | ) | (0.39 | ) | — | — | (0.39 | ) | 8.45 | (6.44 | %) | 69,071 | 0.88 | % | 0.77 | % | 0.77 | % | 4.26 | % | ||||||||||||||||||||||||||||||||||||
9/30/21 | 9.43 | 0.08 | — | 0.08 | (0.08 | ) | — | — | (0.08 | ) | 9.43 | 0.90 | %b | 72,615 | 0.90 | %a | N/A | 0.75 | %a | 3.39 | %a | |||||||||||||||||||||||||||||||||||||||
6/30/21 | 8.58 | 0.38 | 0.83 | 1.21 | (0.36 | ) | — | — | (0.36 | ) | 9.43 | 14.19 | % | 64,969 | 0.92 | % | N/A | 0.75 | % | 4.15 | % | |||||||||||||||||||||||||||||||||||||||
6/30/20 | 9.28 | 0.43 | (0.66 | ) | (0.23 | ) | (0.36 | ) | (0.03 | ) | (0.08 | ) | (0.47 | ) | 8.58 | (2.47 | %) | 39,483 | 0.92 | % | N/A | 0.75 | % | 4.87 | % | |||||||||||||||||||||||||||||||||||
6/30/19 | 9.50 | 0.47 | (0.18 | ) | 0.29 | (0.47 | ) | (0.04 | ) | — | (0.51 | ) | 9.28 | 3.04 | % | 32,531 | 0.94 | % | N/A | 0.75 | % | 5.01 | % | |||||||||||||||||||||||||||||||||||||
Class Y* | ||||||||||||||||||||||||||||||||||||||||||||||||||||||||||||
9/30/23 | $ | 8.44 | $ | 0.72 | $ | 0.40 | $ | 1.12 | $ | (0.72 | ) | $ | — | $ | (0.03 | ) | $ | (0.75 | ) | $ | 8.81 | 13.86 | % | $ | 110,308 | 0.98 | % | 0.75 | % | 0.73 | % | 8.37 | % | |||||||||||||||||||||||||||
9/30/22 | 9.42 | 0.38 | (0.97 | ) | (0.59 | ) | (0.39 | ) | — | — | (0.39 | ) | 8.44 | (6.45 | %) | 194,665 | 0.94 | % | 0.77 | % | 0.77 | % | 4.12 | % | ||||||||||||||||||||||||||||||||||||
9/30/21 | 9.42 | 0.08 | — | 0.08 | (0.08 | ) | — | — | (0.08 | ) | 9.42 | 0.89 | %b | 293,545 | 0.93 | %a | N/A | 0.75 | %a | 3.39 | %a | |||||||||||||||||||||||||||||||||||||||
6/30/21 | 8.58 | 0.37 | 0.83 | 1.20 | (0.36 | ) | — | — | (0.36 | ) | 9.42 | 14.19 | % | 256,020 | 0.95 | % | N/A | 0.75 | % | 4.08 | % | |||||||||||||||||||||||||||||||||||||||
6/30/20 | 9.27 | 0.44 | (0.66 | ) | (0.22 | ) | (0.36 | ) | (0.03 | ) | (0.08 | ) | (0.47 | ) | 8.58 | (2.54 | %) | 131,302 | 0.99 | % | N/A | 0.75 | % | 4.89 | % | |||||||||||||||||||||||||||||||||||
6/30/19 | 9.50 | 0.47 | (0.19 | ) | 0.28 | (0.47 | ) | (0.04 | ) | — | (0.51 | ) | 9.27 | 3.03 | % | 187,887 | 0.96 | % | N/A | 0.75 | % | 4.99 | % | |||||||||||||||||||||||||||||||||||||
Class L* | ||||||||||||||||||||||||||||||||||||||||||||||||||||||||||||
9/30/23 | $ | 8.42 | $ | 0.69 | $ | 0.41 | $ | 1.10 | $ | (0.71 | ) | $ | — | $ | (0.02 | ) | $ | (0.73 | ) | $ | 8.79 | 13.61 | % | $ | 20,319 | 1.20 | % | 1.00 | % | 0.99 | % | 8.02 | % | |||||||||||||||||||||||||||
9/30/22 | 9.41 | 0.36 | (0.98 | ) | (0.62 | ) | (0.37 | ) | — | — | (0.37 | ) | 8.42 | (6.76 | %) | 46,797 | 1.17 | % | 1.02 | % | 1.02 | % | 3.99 | % | ||||||||||||||||||||||||||||||||||||
9/30/21 | 9.40 | 0.07 | 0.01 | 0.08 | (0.07 | ) | — | — | (0.07 | ) | 9.41 | 0.83 | %b | 53,368 | 1.20 | %a | N/A | 1.00 | %a | 3.13 | %a | |||||||||||||||||||||||||||||||||||||||
6/30/21 | 8.56 | 0.36 | 0.81 | 1.17 | (0.33 | ) | — | — | (0.33 | ) | 9.40 | 13.90 | % | 45,630 | 1.25 | % | N/A | 1.00 | % | 3.93 | % | |||||||||||||||||||||||||||||||||||||||
6/30/20 | 9.26 | 0.41 | (0.66 | ) | (0.25 | ) | (0.34 | ) | (0.03 | ) | (0.08 | ) | (0.45 | ) | 8.56 | (2.79 | %) | 37,431 | 1.22 | % | N/A | �� | 1.00 | % | 4.63 | % | ||||||||||||||||||||||||||||||||||
6/30/19 | 9.48 | 0.44 | (0.18 | ) | 0.26 | (0.44 | ) | (0.04 | ) | — | (0.48 | ) | 9.26 | 2.77 | % | 45,213 | 1.25 | % | N/A | 1.00 | % | 4.72 | % | |||||||||||||||||||||||||||||||||||||
Class C* | ||||||||||||||||||||||||||||||||||||||||||||||||||||||||||||
9/30/23 | $ | 8.40 | $ | 0.64 | $ | 0.39 | $ | 1.03 | $ | (0.65 | ) | $ | — | $ | (0.02 | ) | $ | (0.67 | ) | $ | 8.76 | 12.64 | % | $ | 4,327 | 1.95 | % | 1.75 | % | 1.73 | % | 7.45 | % | |||||||||||||||||||||||||||
9/30/22 | 9.37 | 0.29 | (0.96 | ) | (0.67 | ) | (0.30 | ) | — | — | (0.30 | ) | 8.40 | (7.35 | %) | 5,795 | 1.93 | % | 1.77 | % | 1.77 | % | 3.21 | % | ||||||||||||||||||||||||||||||||||||
9/30/21 | 9.37 | 0.06 | (0.01 | ) | 0.05 | (0.05 | ) | — | — | (0.05 | ) | 9.37 | 0.64 | %b | 6,766 | 1.99 | %a | N/A | 1.75 | %a | 2.39 | %a | ||||||||||||||||||||||||||||||||||||||
6/30/21 | 8.53 | 0.29 | 0.81 | 1.10 | (0.26 | ) | — | — | (0.26 | ) | 9.37 | 13.08 | % | 6,714 | 2.05 | % | N/A | 1.75 | % | 3.20 | % | |||||||||||||||||||||||||||||||||||||||
6/30/20 | 9.22 | 0.35 | (0.66 | ) | (0.31 | ) | (0.29 | ) | (0.03 | ) | (0.06 | ) | (0.38 | ) | 8.53 | (3.52 | %) | 6,494 | 2.04 | % | N/A | 1.75 | % | 3.88 | % | |||||||||||||||||||||||||||||||||||
6/30/19 | 9.45 | 0.37 | (0.19 | ) | 0.18 | (0.37 | ) | (0.04 | ) | — | (0.41 | ) | 9.22 | 2.02 | % | 8,005 | 2.05 | % | N/A | 1.74 | % | 4.00 | % | |||||||||||||||||||||||||||||||||||||
Year ended | Year ended June 30 | |||||
2023 | 2022 | Period Ended | 2021 | 2020 | 2019 | |
Portfolio turnover rate | 20% | 40% | 9% | 43% | 37% | 47% |
* | On December 13, 2021, the Barings Global Floating Rate Fund (the “Predecessor Fund”) was reorganized into the MassMutual Global Floating Rate Fund (the “Fund”) and shareholders of the Predecessor Fund received a proportional distribution of the same class of shares, or Class L shares in the case of Class A shares, of the Fund. Information shown prior to December 13, 2021 is that of the Predecessor Fund, and is that of the Fund after December 13, 2021. The Predecessor Fund changed its fiscal year end to September 30th prior to the reorganization. |
a | Annualized. |
b | Percentage represents the results for the period and is not annualized. |
c | Per share amount calculated on the average shares method. |
j | Computed after giving effect to agreements by MML Advisers and Barings LLC to waive certain fees and expenses of the Fund and the Predecessor Fund (Note 1), respectively. |
m | Total return excludes sales charges, if any, and would be lower for the period presented if it reflected these charges. |
p | Interest expense incurred as a result of entering into line of credit transactions is included in the Fund’s net expenses in the Statements of Operations. |
The accompanying notes are an integral part of the financial statements.
60
MassMutual Global Credit Income Opportunities Fund – Financial Statements (Continued) |
Financial Highlights (For a share outstanding throughout each period) |
Income (loss) from investment | Less distributions to shareholders | Ratios / Supplemental Data | ||||||||||||||||||||||||||||||||||||||||||||||||||||||||||
Net | Net | Net | Total | From net | From net | Tax | Total | Net | Total | Net | Ratio of | Ratio of | Ratio of | Net | ||||||||||||||||||||||||||||||||||||||||||||||
Class I* | ||||||||||||||||||||||||||||||||||||||||||||||||||||||||||||
9/30/23 | $ | 7.35 | $ | 0.64 | $ | 0.23 | $ | 0.87 | $ | (0.63 | ) | $ | — | $ | (0.01 | ) | $ | (0.64 | ) | $ | 7.58 | 12.17 | % | $ | 3,075 | 1.00 | % | NA | 0.85 | % | 8.48 | % | ||||||||||||||||||||||||||||
9/30/22 | 9.04 | 0.51 | (1.66 | ) | (1.15 | ) | (0.54 | ) | — | — | (0.54 | ) | 7.35 | (13.23 | %) | 5,536 | 1.14 | % | 0.89 | % | 0.89 | % | 6.10 | % | ||||||||||||||||||||||||||||||||||||
9/30/21 | 9.08 | 0.11 | (0.04 | ) | 0.07 | (0.11 | ) | — | — | (0.11 | ) | 9.04 | 0.81 | %b | 6,405 | 1.15 | %a | NA | 0.95 | %a | 4.96 | %a | ||||||||||||||||||||||||||||||||||||||
6/30/21 | 8.14 | 0.48 | 0.92 | 1.40 | (0.46 | ) | — | — | (0.46 | ) | 9.08 | 17.51 | % | 21,492 | 1.08 | % | NA | 0.95 | % | 5.50 | % | |||||||||||||||||||||||||||||||||||||||
6/30/20 | 8.93 | 0.48 | (0.79 | ) | (0.31 | ) | (0.41 | ) | — | (0.07 | ) | (0.48 | ) | 8.14 | (3.45 | %) | 21,606 | 1.07 | % | NA | 0.95 | % | 5.60 | % | ||||||||||||||||||||||||||||||||||||
6/30/19 | 9.32 | 0.52 | (0.29 | ) | 0.23 | (0.51 | ) | (0.10 | ) | (0.01 | ) | (0.62 | ) | 8.93 | 2.65 | % | 23,203 | 1.09 | % | NA | 0.95 | % | 5.69 | % | ||||||||||||||||||||||||||||||||||||
Class Y* | ||||||||||||||||||||||||||||||||||||||||||||||||||||||||||||
9/30/23 | $ | 7.35 | $ | 0.63 | $ | 0.23 | $ | 0.86 | $ | (0.62 | ) | $ | — | $ | (0.01 | ) | $ | (0.63 | ) | $ | 7.58 | 12.11 | % | $ | 47,254 | 1.04 | % | NA | 0.90 | % | 8.36 | % | ||||||||||||||||||||||||||||
9/30/22 | 9.04 | 0.50 | (1.66 | ) | (1.16 | ) | (0.53 | ) | — | — | (0.53 | ) | 7.35 | (13.26 | %) | 62,827 | 1.17 | % | 0.93 | % | 0.93 | % | 6.01 | % | ||||||||||||||||||||||||||||||||||||
9/30/21 | 9.08 | 0.11 | (0.04 | ) | 0.07 | (0.11 | ) | — | — | (0.11 | ) | 9.04 | 0.80 | %b | 115,478 | 1.20 | %a | NA | 0.95 | %a | 5.01 | %a | ||||||||||||||||||||||||||||||||||||||
6/30/21 | 8.14 | 0.47 | 0.93 | 1.40 | (0.46 | ) | — | — | (0.46 | ) | 9.08 | 17.52 | % | 173,113 | 1.12 | % | NA | 0.95 | % | 5.35 | % | |||||||||||||||||||||||||||||||||||||||
6/30/20 | 8.93 | 0.48 | (0.79 | ) | (0.31 | ) | (0.41 | ) | — | (0.07 | ) | (0.48 | ) | 8.14 | (3.44 | %) | 90,254 | 1.10 | % | NA | 0.95 | % | 5.60 | % | ||||||||||||||||||||||||||||||||||||
6/30/19 | 9.31 | 0.52 | (0.28 | ) | 0.24 | (0.51 | ) | (0.10 | ) | (0.01 | ) | (0.62 | ) | 8.93 | 2.64 | % | 129,621 | 1.12 | % | NA | 0.95 | % | 5.71 | % | ||||||||||||||||||||||||||||||||||||
Class L* | ||||||||||||||||||||||||||||||||||||||||||||||||||||||||||||
9/30/23 | $ | 7.35 | $ | 0.62 | $ | 0.22 | $ | 0.84 | $ | (0.60 | ) | $ | — | $ | (0.01 | ) | $ | (0.61 | ) | $ | 7.58 | 11.82 | % | $ | 75,808 | 1.30 | % | NA | 1.16 | % | 8.21 | % | ||||||||||||||||||||||||||||
9/30/22 | 9.04 | 0.48 | (1.66 | ) | (1.18 | ) | (0.51 | ) | — | — | (0.51 | ) | 7.35 | (13.48 | %) | 58,591 | 1.42 | % | 1.19 | % | 1.19 | % | 5.81 | % | ||||||||||||||||||||||||||||||||||||
9/30/21 | 9.08 | 0.10 | (0.03 | ) | 0.07 | (0.11 | ) | — | — | (0.11 | ) | 9.04 | 0.79 | %b | 52,875 | 1.37 | %a | NA | 1.20 | %a | 4.56 | %a | ||||||||||||||||||||||||||||||||||||||
6/30/21 | 8.14 | 0.48 | 0.90 | 1.38 | (0.44 | ) | — | — | (0.44 | ) | 9.08 | 17.18 | % | 9,795 | 1.39 | % | NA | 1.20 | % | 5.65 | % | |||||||||||||||||||||||||||||||||||||||
6/30/20 | 8.93 | 0.46 | (0.79 | ) | (0.33 | ) | (0.40 | ) | — | (0.06 | ) | (0.46 | ) | 8.14 | (3.69 | %) | 44,860 | 1.32 | % | NA | 1.20 | % | 5.35 | % | ||||||||||||||||||||||||||||||||||||
6/30/19 | 9.32 | 0.50 | (0.30 | ) | 0.20 | (0.48 | ) | (0.10 | ) | (0.01 | ) | (0.59 | ) | 8.93 | 2.39 | % | 51,205 | 1.36 | % | NA | 1.20 | % | 5.46 | % | ||||||||||||||||||||||||||||||||||||
Class C* | ||||||||||||||||||||||||||||||||||||||||||||||||||||||||||||
9/30/23 | $ | 7.34 | $ | 0.55 | $ | 0.24 | $ | 0.79 | $ | (0.54 | ) | $ | — | $ | (0.01 | ) | $ | (0.55 | ) | $ | 7.58 | 11.10 | % | $ | 2,928 | 2.02 | % | NA | 1.95 | % | 7.32 | % | ||||||||||||||||||||||||||||
9/30/22 | 9.04 | 0.42 | (1.67 | ) | (1.25 | ) | (0.45 | ) | — | — | (0.45 | ) | 7.34 | (14.25 | %) | 3,983 | 2.18 | % | 1.97 | % | 1.97 | % | 5.00 | % | ||||||||||||||||||||||||||||||||||||
9/30/21 | 9.08 | 0.09 | (0.04 | ) | 0.05 | (0.09 | ) | — | — | (0.09 | ) | 9.04 | 0.56 | %b | 5,914 | 2.24 | %a | NA | 1.95 | %a | 3.96 | %a | ||||||||||||||||||||||||||||||||||||||
6/30/21 | 8.13 | 0.39 | 0.93 | 1.32 | (0.37 | ) | — | — | (0.37 | ) | 9.08 | 16.42 | % | 5,846 | 2.19 | % | NA | 1.95 | % | 4.49 | % | |||||||||||||||||||||||||||||||||||||||
6/30/20 | 8.92 | 0.39 | (0.78 | ) | (0.39 | ) | (0.35 | ) | — | (0.05 | ) | (0.40 | ) | 8.13 | (4.41 | %) | 7,421 | 2.18 | % | NA | 1.95 | % | 4.60 | % | ||||||||||||||||||||||||||||||||||||
6/30/19 | 9.31 | 0.43 | (0.29 | ) | 0.14 | (0.42 | ) | (0.10 | ) | (0.01 | ) | (0.53 | ) | 8.92 | 1.63 | % | 8,462 | 2.21 | % | NA | 1.95 | % | 4.73 | % | ||||||||||||||||||||||||||||||||||||
Year ended | Year ended June 30 | |||||
2023 | 2022 | Period Ended | 2021 | 2020 | 2019 | |
Portfolio turnover rate | 53% | 44% | 15% | 71% | 64% | 59% |
* | On December 13, 2021, the Barings Global Credit Income Opportunities Fund (the “Predecessor Fund”) was reorganized into the MassMutual Global Credit Income Opportunities Fund (the “Fund”) and shareholders of the Predecessor Fund received a proportional distribution of the same class of shares, or Class L shares in the case of Class A shares, of the Fund. Information shown prior to December 13, 2021 is that of the Predecessor Fund, and is that of the Fund after December 13, 2021. The Predecessor Fund changed its fiscal year end to September 30th prior to the reorganization. |
a | Annualized. |
b | Percentage represents the results for the period and is not annualized. |
c | Per share amount calculated on the average shares method. |
j | Computed after giving effect to agreements by MML Advisers and Barings LLC to waive certain fees and expenses of the Fund and the Predecessor Fund (Note 1), respectively. |
m | Total return excludes sales charges, if any, and would be lower for the period presented if it reflected these charges. |
p | Interest expense incurred as a result of entering into line of credit transactions is included in the Fund’s net expenses in the Statements of Operations. |
The accompanying notes are an integral part of the financial statements.
61
MassMutual Emerging Markets Debt Blended Total Return Fund – Financial Statements (Continued) |
Financial Highlights (For a share outstanding throughout each period) |
Income (loss) from investment | Less distributions to shareholders | Ratios / Supplemental Data | ||||||||||||||||||||||||||||||||||||||||||||||||||||||
Net | Net | Net | Total | From net | From net | Tax | Total | Net | Total | Net | Ratio of | Ratio of | Net | |||||||||||||||||||||||||||||||||||||||||||
Class I* | ||||||||||||||||||||||||||||||||||||||||||||||||||||||||
9/30/23 | $ | 6.78 | $ | 0.47 | $ | 0.43 | $ | 0.90 | $ | — | $ | — | $ | (0.46 | ) | $ | (0.46 | ) | $ | 7.22 | 13.40 | % | $ | 1,800 | 1.09 | % | 0.97 | % | 6.47 | % | ||||||||||||||||||||||||||
9/30/22 | 10.61 | 0.44 | (3.54 | ) | (3.10 | ) | (0.47 | ) | (0.17 | ) | (0.09 | ) | (0.73 | ) | 6.78 | (30.40 | %) | 1,691 | 1.67 | % | 1.00 | % | 5.90 | % | ||||||||||||||||||||||||||||||||
9/30/21 | 11.00 | 0.11 | (0.37 | ) | (0.26 | ) | (0.13 | ) | — | — | (0.13 | ) | 10.61 | (2.44 | %)b | 1 | 706.64 | %a | 0.95 | %a | 3.98 | %a | ||||||||||||||||||||||||||||||||||
6/30/21 | 10.43 | 0.57 | 0.80 | 1.37 | (0.60 | ) | (0.20 | ) | — | (0.80 | ) | 11.00 | 13.70 | % | 1 | 1.29 | % | 0.95 | % | 5.26 | % | |||||||||||||||||||||||||||||||||||
6/30/20 | 10.06 | 0.69 | 0.32 | 1.01 | (0.64 | ) | — | — | (0.64 | ) | 10.43 | 10.39 | % | 14,563 | 1.40 | % | 0.95 | % | 6.99 | % | ||||||||||||||||||||||||||||||||||||
6/30/19 | 9.51 | 0.59 | 0.58 | 1.17 | (0.57 | ) | — | (0.05 | ) | (0.62 | ) | 10.06 | 12.86 | % | 23,964 | 1.44 | % | 0.73 | %cc | 6.18 | % | |||||||||||||||||||||||||||||||||||
Class Y* | ||||||||||||||||||||||||||||||||||||||||||||||||||||||||
9/30/23 | $ | 6.75 | $ | 0.47 | $ | 0.43 | $ | 0.90 | $ | — | $ | — | $ | (0.46 | ) | $ | (0.46 | ) | $ | 7.19 | 13.42 | % | $ | 40,950 | 1.15 | % | 0.97 | % | 6.50 | % | ||||||||||||||||||||||||||
9/30/22 | 10.59 | 0.48 | (3.59 | ) | (3.11 | ) | (0.47 | ) | (0.17 | ) | (0.09 | ) | (0.73 | ) | 6.75 | (30.59 | )% | 52,350 | 1.31 | % | 0.97 | % | 5.55 | % | ||||||||||||||||||||||||||||||||
9/30/21 | 10.99 | 0.12 | (0.38 | ) | (0.26 | ) | (0.14 | ) | — | — | (0.14 | ) | 10.59 | (2.38 | %)b | 127,650 | 1.26 | %a | 0.95 | %a | 4.48 | %a | ||||||||||||||||||||||||||||||||||
6/30/21 | 10.42 | 0.53 | 0.84 | 1.37 | (0.60 | ) | (0.20 | ) | — | (0.80 | ) | 10.99 | 13.61 | % | 111,221 | 1.34 | % | 0.95 | % | 4.90 | % | |||||||||||||||||||||||||||||||||||
6/30/20 | 10.06 | 0.67 | 0.33 | 1.00 | (0.64 | ) | — | — | (0.64 | ) | 10.42 | 10.33 | % | 33,429 | 1.42 | % | 0.95 | % | 6.84 | % | ||||||||||||||||||||||||||||||||||||
6/30/19 | 9.51 | 0.59 | 0.58 | 1.17 | (0.57 | ) | — | (0.05 | ) | (0.62 | ) | 10.06 | 12.86 | % | 25,805 | 1.44 | % | 0.72 | %cc | 6.19 | % | |||||||||||||||||||||||||||||||||||
Class L* | ||||||||||||||||||||||||||||||||||||||||||||||||||||||||
9/30/23 | $ | 6.76 | $ | 0.46 | $ | 0.41 | $ | 0.87 | $ | — | $ | — | $ | (0.44 | ) | $ | (0.44 | ) | $ | 7.19 | 12.97 | % | $ | 2,186 | 1.37 | % | 1.22 | % | 6.29 | % | ||||||||||||||||||||||||||
9/30/22 | 10.59 | 0.47 | (3.59 | ) | (3.12 | ) | (0.45 | ) | (0.17 | ) | (0.09 | ) | (0.71 | ) | 6.76 | (30.66 | %) | 3,199 | 1.53 | % | 1.21 | % | 5.19 | % | ||||||||||||||||||||||||||||||||
9/30/21 | 10.99 | 0.12 | (0.39 | ) | (0.27 | ) | (0.13 | ) | — | — | (0.13 | ) | 10.59 | (2.44 | %)b | 17,660 | 1.60 | %a | 1.20 | %a | 4.24 | %a | ||||||||||||||||||||||||||||||||||
6/30/21 | 10.42 | 0.51 | 0.84 | 1.35 | (0.58 | ) | (0.20 | ) | — | (0.78 | ) | 10.99 | 13.32 | % | 17,491 | 1.73 | % | 1.20 | % | 4.71 | % | |||||||||||||||||||||||||||||||||||
6/30/20 | 10.06 | 0.60 | 0.38 | 0.98 | (0.62 | ) | — | — | (0.62 | ) | 10.42 | 10.11 | % | 6,443 | 2.08 | % | 1.20 | % | 6.21 | % | ||||||||||||||||||||||||||||||||||||
6/30/19 | 9.51 | 0.55 | 0.60 | 1.15 | (0.55 | ) | — | (0.05 | ) | (0.60 | ) | 10.06 | 12.59 | % | 405 | 3.19 | % | 1.02 | %cc | 5.74 | % | |||||||||||||||||||||||||||||||||||
Class C* | ||||||||||||||||||||||||||||||||||||||||||||||||||||||||
9/30/23 | $ | 6.76 | $ | 0.40 | $ | 0.42 | $ | 0.82 | $ | — | $ | — | $ | (0.39 | ) | $ | (0.39 | ) | $ | 7.19 | 12.14 | % | $ | 296 | 2.10 | % | 1.97 | % | 5.47 | % | ||||||||||||||||||||||||||
9/30/22 | 10.59 | 0.39 | (3.58 | ) | (3.19 | ) | (0.39 | ) | (0.17 | ) | (0.08 | ) | (0.64 | ) | 6.76 | (31.20 | %) | 477 | 2.64 | % | 1.98 | % | 4.68 | % | ||||||||||||||||||||||||||||||||
9/30/21 | 10.99 | 0.09 | (0.38 | ) | (0.29 | ) | (0.11 | ) | — | — | (0.11 | ) | 10.59 | (2.62 | %)b | 583 | 3.43 | %a | 1.95 | %a | 3.48 | %a | ||||||||||||||||||||||||||||||||||
6/30/21 | 10.42 | 0.43 | 0.83 | 1.26 | (0.49 | ) | (0.20 | ) | — | (0.69 | ) | 10.99 | 12.51 | % | 463 | 4.40 | % | 1.95 | % | 3.98 | % | |||||||||||||||||||||||||||||||||||
6/30/20 | 10.06 | 0.60 | 0.31 | 0.91 | (0.55 | ) | — | — | (0.55 | ) | 10.42 | 9.28 | % | 225 | 5.29 | % | 1.95 | % | 6.09 | % | ||||||||||||||||||||||||||||||||||||
6/30/19 | 9.51 | 0.49 | 0.59 | 1.08 | (0.48 | ) | — | (0.05 | ) | (0.53 | ) | 10.06 | 11.78 | % | 261 | 5.02 | % | 1.71 | %cc | 5.14 | % | |||||||||||||||||||||||||||||||||||
Year ended | Year ended June 30 | |||||
2023 | 2022 | Period Ended | 2021 | 2020 | 2019 | |
Portfolio turnover rate | 43% | 55% | 10% | 52% | 127% | 90% |
* | On December 13, 2021, the Barings Emerging Markets Debt Blended Total Return Fund (the “Predecessor Fund���) was reorganized into the MassMutual Emerging Markets Debt Blended Total Return Fund (the “Fund”) and shareholders of the Predecessor Fund received a proportional distribution of the same class of shares, or Class L shares in the case of Class A shares, of the Fund. Information shown prior to December 13, 2021 is that of the Predecessor Fund, and is that of the Fund after December 13, 2021. The Predecessor Fund changed its fiscal year end to September 30th prior to the reorganization. |
a | Annualized. |
b | Percentage represents the results for the period and is not annualized. |
c | Per share amount calculated on the average shares method. |
j | Computed after giving effect to agreements by MML Advisers and Barings LLC to waive certain fees and expenses of the Fund and the Predecessor Fund (Note 1), respectively. |
m | Total return excludes sales charges, if any, and would be lower for the period presented if it reflected these charges. |
cc | Net expenses reflect a voluntary expense reimbursement to prevent a negative yield. |
The accompanying notes are an integral part of the financial statements.
62
MassMutual Global Emerging Markets Equity Fund – Financial Statements (Continued) |
Financial Highlights (For a share outstanding throughout each period) |
Income (loss) from investment | Less distributions to shareholders | Ratios / Supplemental Data | ||||||||||||||||||||||||||||||||||||||||||||||||||||||
Net | Net | Net | Total | From net | From net | Tax | Total | Net | Total | Net | Ratio of | Ratio of | Net | |||||||||||||||||||||||||||||||||||||||||||
Class I* | ||||||||||||||||||||||||||||||||||||||||||||||||||||||||
9/30/23 | $ | 8.80 | $ | 0.22 | $ | 0.82 | $ | 1.04 | $ | (0.15 | ) | $ | — | $ | — | $ | (0.15 | ) | $ | 9.69 | 11.84 | % | $ | 4,749 | 2.21 | % | 0.92 | % | 2.18 | % | ||||||||||||||||||||||||||
9/30/22 | 12.41 | 0.17 | (3.47 | ) | (3.30 | ) | (0.06 | ) | (0.25 | ) | — | (0.31 | ) | 8.80 | (27.26 | %) | 4,313 | 2.71 | % | 0.89 | % | 1.55 | % | |||||||||||||||||||||||||||||||||
9/30/21 | 13.65 | 0.06 | (1.17 | ) | (1.11 | ) | (0.13 | ) | — | — | (0.13 | ) | 12.41 | (8.21 | %)b | 6,080 | 5.49 | %a | 0.90 | %a | 2.00 | %a | ||||||||||||||||||||||||||||||||||
6/30/21 | 10.38 | 0.18 | 3.20 | 3.38 | (0.11 | ) | — | — | (0.11 | ) | 13.65 | 32.74 | % | 6,689 | 3.17 | % | 0.99 | % | 1.39 | % | ||||||||||||||||||||||||||||||||||||
6/30/20 | 11.13 | 0.18 | (0.58 | ) | (0.40 | ) | (0.22 | ) | (0.11 | ) | (0.02 | ) | (0.35 | ) | 10.38 | (3.78 | %) | 5,085 | 2.96 | % | 1.20 | %s | 1.71 | % | ||||||||||||||||||||||||||||||||
6/30/19g | 10.00 | 0.08 | 1.05 | 1.13 | — | — | — | — | 11.13 | 11.26 | %b | 5,452 | 2.94 | %a | 1.20 | %a,s | 0.98 | %a | ||||||||||||||||||||||||||||||||||||||
Class Y* | ||||||||||||||||||||||||||||||||||||||||||||||||||||||||
9/30/23 | $ | 8.80 | $ | 0.22 | $ | 0.82 | $ | 1.04 | $ | (0.15 | ) | $ | — | $ | — | $ | (0.15 | ) | $ | 9.69 | 11.83 | % | $ | 4,810 | 2.24 | % | 0.92 | % | 2.18 | % | ||||||||||||||||||||||||||
9/30/22 | 12.41 | 0.17 | (3.47 | ) | (3.30 | ) | (0.06 | ) | (0.25 | ) | — | (0.31 | ) | 8.80 | (27.26 | %) | 4,425 | 2.74 | % | 0.89 | % | 1.55 | % | |||||||||||||||||||||||||||||||||
9/30/21 | 13.65 | 0.06 | (1.17 | ) | (1.11 | ) | (0.13 | ) | — | — | (0.13 | ) | 12.41 | (8.21 | %)b | 6,253 | 5.49 | %a | 0.90 | %a | 2.00 | %a | ||||||||||||||||||||||||||||||||||
6/30/21 | 10.38 | 0.18 | 3.20 | 3.38 | (0.11 | ) | — | — | (0.11 | ) | 13.65 | 32.74 | % | 6,765 | 3.17 | % | 0.99 | % | 1.40 | % | ||||||||||||||||||||||||||||||||||||
6/30/20 | 11.13 | 0.18 | (0.58 | ) | (0.40 | ) | (0.22 | ) | (0.11 | ) | (0.02 | ) | (0.35 | ) | 10.38 | (3.78 | %) | 5,085 | 2.96 | % | 1.20 | %s | 1.71 | % | ||||||||||||||||||||||||||||||||
6/30/19g | 10.00 | 0.08 | 1.05 | 1.13 | — | — | — | — | 11.13 | 11.26 | %b | 5,452 | 2.94 | %a | 1.20 | %a,s | 0.98 | %a | ||||||||||||||||||||||||||||||||||||||
Class L* | ||||||||||||||||||||||||||||||||||||||||||||||||||||||||
9/30/23 | $ | 8.76 | $ | 0.19 | $ | 0.83 | $ | 1.02 | $ | (0.13 | ) | $ | — | $ | — | $ | (0.13 | ) | $ | 9.65 | 11.63 | % | $ | 96 | 2.48 | % | 1.17 | % | 1.92 | % | ||||||||||||||||||||||||||
9/30/22 | 12.38 | 0.14 | (3.45 | ) | (3.31 | ) | (0.06 | ) | (0.25 | ) | — | (0.31 | ) | 8.76 | (27.45 | %) | 88 | 3.90 | % | 1.17 | % | 1.26 | % | |||||||||||||||||||||||||||||||||
9/30/21 | 13.61 | 0.06 | (1.18 | ) | (1.12 | ) | (0.11 | ) | — | — | (0.11 | ) | 12.38 | (8.27 | %)b | 124 | 18.61 | %a | 1.15 | %a | 1.75 | %a | ||||||||||||||||||||||||||||||||||
6/30/21 | 10.36 | 0.15 | 3.19 | 3.34 | (0.09 | ) | — | — | (0.09 | ) | 13.61 | 32.40 | % | 136 | 6.21 | % | 1.24 | % | 1.14 | % | ||||||||||||||||||||||||||||||||||||
6/30/20 | 11.10 | 0.15 | (0.57 | ) | (0.42 | ) | (0.20 | ) | (0.11 | ) | (0.01 | ) | (0.32 | ) | 10.36 | (4.02 | %) | 104 | 9.06 | % | 1.45 | %s | 1.46 | % | ||||||||||||||||||||||||||||||||
6/30/19g | 10.00 | 0.06 | 1.04 | 1.10 | — | — | — | — | 11.10 | 11.04 | %b | 111 | 7.43 | %a | 1.45 | %a,s | 0.73 | %a | ||||||||||||||||||||||||||||||||||||||
Class C* | ||||||||||||||||||||||||||||||||||||||||||||||||||||||||
9/30/23 | $ | 8.63 | $ | 0.12 | $ | 0.81 | $ | 0.93 | $ | (0.05 | ) | $ | — | $ | — | $ | (0.05 | ) | $ | 9.51 | 10.74 | % | $ | 95 | 3.20 | % | 1.92 | % | 1.18 | % | ||||||||||||||||||||||||||
9/30/22 | 12.30 | 0.06 | (3.42 | ) | (3.36 | ) | (0.06 | ) | (0.25 | ) | — | (0.31 | ) | 8.63 | (28.00 | %) | 86 | 4.94 | % | 1.92 | % | 0.51 | % | |||||||||||||||||||||||||||||||||
9/30/21 | 13.50 | 0.03 | (1.17 | ) | (1.14 | ) | (0.06 | ) | — | — | (0.06 | ) | 12.30 | (8.45 | %)b | 123 | 10.21 | %a | 1.90 | %a | 1.00 | %a | ||||||||||||||||||||||||||||||||||
6/30/21 | 10.32 | 0.05 | 3.18 | 3.23 | (0.05 | ) | — | — | (0.05 | ) | 13.50 | 31.41 | % | 135 | 7.30 | % | 1.99 | % | 0.39 | % | ||||||||||||||||||||||||||||||||||||
6/30/20 | 11.04 | 0.07 | (0.57 | ) | (0.50 | ) | (0.10 | ) | (0.11 | ) | (0.01 | ) | (0.22 | ) | 10.32 | (4.74 | %) | 103 | 9.82 | % | 2.20 | %s | 0.71 | % | ||||||||||||||||||||||||||||||||
6/30/19g | 10.00 | (0.00 | )d | 1.04 | 1.04 | — | — | — | — | 11.04 | 10.39 | %b | 110 | 8.19 | %a | 2.20 | %a,s | (0.03 | %)a | |||||||||||||||||||||||||||||||||||||
Year ended | Year ended June 30 | |||||
2023 | 2022 | Period Ended | 2021 | 2020 | Period ended | |
Portfolio turnover rate | 17% | 22% | 8% | 37% | 19% | 8% |
* | On December 13, 2021, the Barings Global Emerging Markets Equity Fund (the “Predecessor Fund”) was reorganized into the MassMutual Global Emerging Markets Equity Fund (the “Fund”) and shareholders of the Predecessor Fund received a proportional distribution of the same class of shares, or Class L shares in the case of Class A shares, of the Fund. Information shown prior to December 13, 2021 is that of the Predecessor Fund changed its fiscal year end to September 30th prior to the reorganization. |
a | Annualized. |
b | Percentage represents the results for the period and is not annualized. |
c | Per share amount calculated on the average shares method. |
d | Amount is less than $0.005 per share. |
g | For the period September 17, 2018 (commencement of operations) through June 30, 2019. |
m | Total return excludes sales charges, if any, and would be lower for the period presented if it reflected these charges. |
j | Computed after giving effect to agreements by MML Advisers and Barings LLC to waive certain fees and expenses of the Fund and the Predecessor Fund (Note 1), respectively. |
s | Ratio of net expenses to average net assets does not include expenses of the underlying fund in which the Fund invests. |
The accompanying notes are an integral part of the financial statements.
63
1. The Funds
MassMutual Advantage Funds (the “Trust”) is registered under the Investment Company Act of 1940, as amended (the “1940 Act”), as an open-end management investment company. The Trust is organized under the laws of the Commonwealth of Massachusetts as a Massachusetts business trust pursuant to an Agreement and Declaration of Trust dated April 26, 2021. The Trust consists of the following series (each individually referred to as a “Fund” or collectively as the “Funds”):
MassMutual Global Floating Rate Fund (“Global Floating Rate Fund”)
MassMutual Global Credit Income Opportunities Fund (“Global Credit Income Opportunities Fund”)
MassMutual Emerging Markets Debt Blended Total Return Fund (“Emerging Markets Debt Blended Total Return Fund”)
MassMutual Global Emerging Markets Equity Fund (“Global Emerging Markets Equity Fund”)
On December 13, 2021, the assets of each of the Barings Global Floating Rate Fund, Barings Global Credit Income Opportunities Fund, Barings Emerging Markets Debt Blended Total Return Fund, and Barings Global Emerging Markets Equity Fund (each, a “Predecessor Fund,” and together the “Predecessor Funds”) were transferred to the Global Floating Rate Fund, Global Credit Income Opportunities Fund, Emerging Markets Debt Blended Total Return Fund, and Global Emerging Markets Equity Fund, respectively, in exchange for shares of the corresponding Fund and the assumption by that Fund of all of the liabilities of the corresponding Predecessor Fund. Shareholders of the Predecessor Funds received a proportional distribution of the same class of shares, or Class L shares in the case of Class A shares, of the corresponding Fund. At the time of this reorganization, each of the Funds was a newly formed series of the Trust, which at the time, was itself a newly created Massachusetts business trust. Each of the Predecessor Funds was the accounting and performance survivor in its respective reorganization, and each corresponding Fund, as the corporate survivor in its respective reorganization, adopted the accounting and performance history of the corresponding Predecessor Fund.
Each share class of a Fund represents an interest in the same portfolio of assets. The principal difference among the classes is the level of service and administration fees, and shareholder and distribution service expenses borne by the classes. Because each class will have different fees and expenses, performance and share prices will vary between the classes. The classes of shares are offered to different types of investors, as outlined in the Funds’ Prospectus.
2. Significant Accounting Policies
The following is a summary of significant accounting policies followed consistently by each Fund in the preparation of the financial statements in conformity with accounting principles generally accepted in the United States of America (“generally accepted accounting principles”). The preparation of the financial statements in accordance with generally accepted accounting principles requires management to make estimates and assumptions that affect the reported amounts and disclosures in the financial statements. Actual results could differ from those estimates.
Each Fund is an investment company and accordingly follows the investment company accounting and reporting guidance of the Financial Accounting Standards Board (“FASB”) Accounting Standards Codification Topic 946, Financial Services – Investment Companies.
Investment Valuation
The net asset value of each Fund’s shares is determined once daily as of the close of regular trading on the New York Stock Exchange (“NYSE”), on each day the NYSE is open for trading (a “business day”). The NYSE normally closes at 4:00 p.m. Eastern Time, but may close earlier on some days. If the NYSE is scheduled to close early, the business day will be considered to end as of the time of the NYSE’s scheduled close. A Fund will not treat an intraday disruption in NYSE trading or other event that causes an unscheduled closing of the NYSE as a close of business of the NYSE for these purposes; instead, MML Investment Advisers, LLC (“MML Advisers”) will determine the fair value of a Fund’s securities in accordance with MML Advisers’ fair valuation policy and procedures. On holidays and other days when the NYSE is closed, each Fund’s net asset value generally is not calculated and the Funds do not anticipate accepting buy or sell orders. However, the value of each Fund’s assets may still be affected on such days to the extent that a Fund holds foreign securities that trade on days that foreign securities markets are open.
64
Notes to Financial Statements (Continued) |
Equity securities and derivative contracts that are actively traded on a national securities exchange or contract market are valued on the basis of information furnished by a pricing service, which provides the last reported sale price, or, in the case of futures contracts, the settlement price, for securities or derivatives listed on the exchange or contract market or the official closing price on the NASDAQ National Market System (“NASDAQ System”), or in the case of over-the-counter (“OTC”) securities for which an official closing price is unavailable or not reported on the NASDAQ System, the last reported bid price. Portfolio securities traded on more than one national securities exchange are valued at the last price at the close of the exchange representing the principal market for such securities. Debt securities are valued on the basis of valuations furnished by a pricing service, which generally determines valuations taking into account factors such as institutional-size trading in similar securities, yield, quality, coupon rate, maturity, type of issue, trading characteristics, and other market data. Shares of other open-end mutual funds are valued at their closing net asset values as reported on each business day.
Investments for which market quotations are readily available are marked to market daily based on those quotations. Market quotations may be provided by third-party vendors or market makers, and may be determined on the basis of a variety of factors, such as broker quotations, financial modeling, and other market data, such as market indexes and yield curves, counterparty information, and foreign exchange rates. U.S. Government and agency securities may be valued on the basis of market quotations or using a model that may incorporate market observable data such as reported sales of similar securities, broker quotes, yields, bids, offers, quoted market prices, and reference data. The fair values of OTC derivative contracts, including forward, swap, and option contracts related to interest rates, foreign currencies, credit standing of reference entities, equity prices, or commodity prices, may be based on market quotations or may be modeled using a series of techniques, including simulation models, depending on the contract and the terms of the transaction. The fair values of asset-backed securities and mortgage-backed securities are estimated based on models that consider the estimated cash flows of each debt tranche of the issuer, established benchmark yield, and estimated tranche-specific spread to the benchmark yield based on the unique attributes of the tranche, including, but not limited to, prepayment speed assumptions and attributes of the collateral.
The Board of Trustees (“Trustees”) have designated MML Advisers as the Funds’ “valuation designee,” responsible for determining the fair value, in good faith, of securities and other instruments held by the Funds for which market quotations are not readily available or for which such market quotations or values are considered by MML Advisers or a subadviser to be unreliable (including, for example, certain foreign securities, thinly-traded securities, certain restricted securities, certain initial public offerings, or securities whose values may have been affected by a significant event). It is possible that a significant amount of a Fund’s assets will be subject to fair valuation in accordance with MML Advisers’ fair valuation policy and procedures. The fair value determined for an investment by MML Advisers may differ from recent market prices for the investment and may be significantly different from the value realized upon the sale of such investment.
The Funds may invest in securities that are traded principally in foreign markets and that trade on weekends and other days when the Funds do not price their shares. As a result, the values of the Funds’ portfolio securities may change on days when the prices of the Funds’ shares are not calculated. The prices of the Funds’ shares will reflect any such changes when the prices of the Funds’ shares are next calculated, which is the next business day. The Funds may use fair value pricing more frequently for securities primarily traded in foreign markets because, among other things, most foreign markets close well before the Funds value their securities. The earlier close of these foreign markets gives rise to the possibility that significant events, including broad market moves, may have occurred in the interim. The Funds’ investments may be priced based on fair values provided by a third-party vendor, based on certain factors and methodologies applied by such vendor, in the event that there is movement in the U.S. market, between the close of the foreign market and the time the Funds calculate their net asset values. All assets and liabilities expressed in foreign currencies are converted into U.S. dollars at the mean between the buying and selling rates of such currencies against the U.S. dollar at the end of each business day.
Investments in equity or debt issued by privately held companies or funds (“Private Company” or collectively, the “Private Companies”) and any other investments fair valued using significant unobservable inputs may be fair valued using one or a combination of, but not limited to, the following inputs:
Market approach: (i) recent market transactions, including subsequent rounds of financing, in the underlying investment or comparable issuers; (ii) recapitalizations and other transactions across the capital structure; and (iii) market multiples of comparable issuers.
65
Notes to Financial Statements (Continued) |
Income approach: (i) future cash flows discounted to present value and adjusted as appropriate for liquidity, credit, and/or market risks; (ii) quoted prices for similar investments or assets in active markets; and (iii) other risk factors, such as interest rates, yield curves, volatilities, prepayment speeds, loss severities, credit risks, recovery rates, liquidation amounts, and/or default rates.
Cost approach: (i) audited or unaudited financial statements, investor communications, and financial or operational metrics issued by the Private Company; (ii) changes in the valuation of relevant indexes or publicly traded companies comparable to the Private Company; (iii) relevant news and other public sources; and (iv) known secondary market transactions in the Private Company’s interests and merger or acquisition activity in companies comparable to the Private Company.
Investments in series of preferred stock issued by Private Companies are typically valued utilizing the Market approach in determining the enterprise value of the company. Such investments often contain rights and preferences that differ from other series of preferred and common stock of the same issuer. Valuation techniques such as the current value method (“CVM”), an option pricing model (“OPM”), a probability weighted expected return model (“PWERM”), or a hybrid of those techniques are used in allocating enterprise value of the company, as deemed appropriate under the circumstances. The CVM allocates value among the various parts of a company’s capital structure assuming that the value of convertible preferred stock is represented by the most favorable claim the preferred stockholders have on the enterprise value as of the valuation date. The use of OPM and PWERM techniques involve a determination of the exit scenarios of the investment in order to appropriately allocate the enterprise value of the company among the various parts of its capital structure.
The Private Companies are not subject to the public company disclosure, timing, and reporting standards as other investments held by a Fund. Typically, the most recently available information for a Private Company is as of a date that is earlier than the date a Fund is calculating its net asset value. This factor may result in a difference between the value of the investment and the price a Fund could receive upon the sale of the investment.
Fair value is defined as the price that would be received to sell an asset or paid to transfer a liability in an orderly transaction between market participants at the measurement date. A three-tier hierarchy is utilized to maximize the use of observable market data inputs and minimize the use of unobservable inputs and to establish classification of fair value measurements for disclosure purposes. Inputs refer broadly to the assumptions that market participants would use in pricing the asset or liability, including assumptions about risk, for example, the risk inherent in a particular valuation technique used to measure fair value (such as a pricing model) and/or the risk inherent in the inputs to the valuation technique. Inputs may be observable or unobservable. Observable inputs are inputs that reflect the assumptions market participants would use in pricing the asset or liability and are developed based on market data obtained from sources independent of the reporting entity. Unobservable inputs are inputs that reflect the reporting entity’s own assumptions about the assumptions market participants would use in pricing the asset or liability and are developed based on the best information available in the circumstances. The three-tier hierarchy of inputs is summarized in the three broad Levels listed below. The inputs or methodology used for valuing investments are not necessarily an indication of the risk associated with investing in those investments and the determination of the significance of a particular input to the fair value measurement in its entirety requires judgment and consideration of factors specific to each security.
Level 1 – quoted prices (unadjusted) in active markets for identical investments that the Funds can access at the measurement date
Level 2 – other significant observable inputs (including quoted prices for similar investments, interest rates, prepayment speeds, credit risk, etc.)
Level 3 – significant unobservable inputs, to the extent observable inputs are not available (including the Funds’ own assumptions in determining the fair value of investments)
The availability of observable inputs can vary from security to security and is affected by a wide variety of factors, including, for example, the type of security, whether the security is new and not yet established in the marketplace, the liquidity of markets, and other characteristics particular to the security. To the extent that valuation is based on models or inputs that are less observable or unobservable in the market, the determination of fair value requires more judgment. Accordingly, the degree of judgment exercised in determining fair value is greatest for instruments categorized in Level 3.
66
Notes to Financial Statements (Continued) |
Changes in valuation techniques may result in transfers in or out of an investment’s assigned Level within the hierarchy. In addition, in periods of market dislocation, the observability of prices and inputs may be reduced for many instruments. This condition, as well as changes related to liquidity of investments, could cause a security to be reclassified between Levels.
In certain cases, the inputs used to measure fair value may fall into different Levels of the fair value hierarchy. In such cases, for disclosure purposes, the Level in the fair value hierarchy within which the fair value measurement falls is determined based on the lowest Level input that is significant to the overall fair value measurement.
The following is the aggregate value by input level, as of September 30, 2023, for the Funds’ investments:
Level 1 | Level 2 | Level 3 | Total | |||||||||||||
Global Floating Rate Fund | ||||||||||||||||
Asset Investments | ||||||||||||||||
Common Stock | $ | 438,704 | $ | 760,885 | * | $ | 666,924 | $ | 1,866,513 | |||||||
Bank Loans | — | 166,005,571 | 482,047 | 166,487,618 | ||||||||||||
Corporate Debt | — | 7,473,837 | — | 7,473,837 | ||||||||||||
Warrants | — | 14,257 | — | + | 14,257 | |||||||||||
Short-Term Investments | 14,521 | 10,242,246 | — | 10,256,767 | ||||||||||||
Unfunded Bank Loan Commitments** | — | 237 | — | 237 | ||||||||||||
Total Investments | $ | 453,225 | $ | 184,497,033 | $ | 1,148,971 | $ | 186,099,229 | ||||||||
Liability Investments | ||||||||||||||||
Unfunded Bank Loan Commitments** | $ | — | $ | — | $ | (2,359 | ) | $ | (2,359 | ) | ||||||
Asset Derivatives | ||||||||||||||||
Forward Contracts | $ | — | $ | 796,155 | $ | — | $ | 796,155 | ||||||||
Liability Derivatives | ||||||||||||||||
Forward Contracts | $ | — | $ | (12,749 | ) | $ | — | $ | (12,749 | ) | ||||||
Global Credit Income Opportunities Fund | ||||||||||||||||
Asset Investments | ||||||||||||||||
Common Stock* | ||||||||||||||||
France | $ | — | $ | 19,311 | $ | — | $ | 19,311 | ||||||||
Germany | — | — | — | + | — | |||||||||||
Spain | — | — | — | + | — | |||||||||||
United Kingdom | 152,936 | — | 125,025 | 277,961 | ||||||||||||
United States | ��� | 399,564 | — | 399,564 | ||||||||||||
Bank Loans | — | 52,566,056 | 305,502 | 52,871,558 | ||||||||||||
Corporate Debt | — | 53,511,119 | — | + | 53,511,119 | |||||||||||
Non-U.S. Government Agency Obligations | — | 12,157,526 | — | 12,157,526 | ||||||||||||
Warrants | — | 41,870 | — | 41,870 | ||||||||||||
Short-Term Investments | 3,538,785 | 16,191,670 | — | 19,730,455 | ||||||||||||
Unfunded Bank Loan Commitments** | — | 47,025 | — | 47,025 | ||||||||||||
Total Investments | $ | 3,691,721 | $ | 134,934,141 | $ | 430,527 | $ | 139,056,389 | ||||||||
Liability Investments | ||||||||||||||||
Unfunded Bank Loan Commitments** | $ | — | $ | — | $ | (1,199 | ) | $ | (1,199 | ) | ||||||
Asset Derivatives | ||||||||||||||||
Forward Contracts | $ | — | $ | 588,369 | $ | — | $ | 588,369 | ||||||||
Emerging Markets Debt Blended Total Return Fund | ||||||||||||||||
Asset Investments | ||||||||||||||||
Corporate Debt | $ | — | $ | 15,752,762 | $ | — | $ | 15,752,762 | ||||||||
Sovereign Debt Obligations | — | 26,654,984 | — | 26,654,984 | ||||||||||||
Purchased Options | — | 15,885 | — | 15,885 | ||||||||||||
Short-Term Investments | — | 2,215,095 | — | 2,215,095 | ||||||||||||
Total Investments | $ | — | $ | 44,638,726 | $ | — | $ | 44,638,726 | ||||||||
67
Notes to Financial Statements (Continued) |
Level 1 | Level 2 | Level 3 | Total | |||||||||||||
Emerging Markets Debt Blended Total Return Fund (Continued) | ||||||||||||||||
Asset Derivatives | ||||||||||||||||
Forward Contracts | $ | — | $ | 1,204,184 | $ | — | $ | 1,204,184 | ||||||||
Futures Contracts | 186,918 | — | — | 186,918 | ||||||||||||
Swap Agreements | — | 226,213 | — | 226,213 | ||||||||||||
Total | $ | 186,918 | $ | 1,430,397 | $ | — | $ | 1,617,315 | ||||||||
Liability Derivatives | ||||||||||||||||
Forward Contracts | $ | — | $ | (1,381,651 | ) | $ | — | $ | (1,381,651 | ) | ||||||
Swap Agreements | — | (208,558 | ) | — | (208,558 | ) | ||||||||||
Written Options | — | (83,201 | ) | — | (83,201 | ) | ||||||||||
Total | $ | — | $ | (1,673,410 | ) | $ | — | $ | (1,673,410 | ) | ||||||
Global Emerging Markets Equity Fund | ||||||||||||||||
Asset Investments | ||||||||||||||||
Common Stock* | ||||||||||||||||
Brazil | $ | 368,344 | $ | — | $ | — | $ | 368,344 | ||||||||
China | 231,024 | 2,869,743 | — | 3,100,767 | ||||||||||||
Hong Kong | — | 195,900 | — | 195,900 | ||||||||||||
India | 1,175,971 | — | — | 1,175,971 | ||||||||||||
Indonesia | — | 306,325 | — | 306,325 | ||||||||||||
Mexico | 219,879 | — | — | 219,879 | ||||||||||||
Poland | — | 87,351 | — | 87,351 | ||||||||||||
Republic of Korea | — | 1,488,893 | — | 1,488,893 | ||||||||||||
Russia | — | — | — | + | — | |||||||||||
Saudi Arabia | — | 283,975 | — | 283,975 | ||||||||||||
South Africa | — | 300,609 | — | 300,609 | ||||||||||||
Taiwan | — | 1,468,543 | — | 1,468,543 | ||||||||||||
Thailand | — | 148,088 | — | 148,088 | ||||||||||||
United Arab Emirates | — | 131,262 | — | 131,262 | ||||||||||||
United Kingdom | 80,138 | — | — | 80,138 | ||||||||||||
United States | — | 173,492 | — | 173,492 | ||||||||||||
Preferred Stock | ||||||||||||||||
Brazil | 100,306 | — | — | 100,306 | ||||||||||||
Rights | ||||||||||||||||
Brazil | 226 | — | — | 226 | ||||||||||||
Short-Term Investments | 10,500 | 213,523 | — | 224,023 | ||||||||||||
Total Investments | $ | 2,186,388 | $ | 7,667,704 | $ | — | $ | 9,854,092 | ||||||||
* | Includes foreign equity securities whose values were adjusted to reflect market trading of comparable securities or other correlated instruments after the close of trading in their respective foreign markets, as applicable. |
** | Unfunded bank loan commitments are valued at the unrealized appreciation (depreciation) on the commitment. |
+ | Represents a security at $0 value as of September 30, 2023. |
For certain Fund(s) the Statement of Assets and Liabilities shows receivables from investments sold on a delayed delivery basis and cash collateral pledged for open derivatives, as well as any applicable liabilities for investments purchased on a delayed delivery basis, amounts due to custodian, cash collateral held for open derivatives, foreign currency overdraft, and cash collateral held for securities on loan. These amounts approximate fair value and would be categorized at Level 2 for each applicable Fund as of September 30, 2023.
The Funds, with the exception of the Global Floating Rate Fund and Global Credit Income Opportunities Fund, had no Level 3 transfers during the year ended September 30, 2023. The Global Floating Rate Fund and Global Credit Income Opportunities Fund had Level 3 transfers during the year ended September 30, 2023; however, none of the transfers individually or collectively had a material impact on the Global Floating Rate Fund or Global Credit Income Opportunities Fund.
68
Notes to Financial Statements (Continued) |
Derivative Instruments
Derivatives are financial instruments whose values are based on the values of one or more underlying indicators, such as a security, asset, currency, interest rate, or index. Derivative transactions can create investment leverage and may be highly volatile. Losses from derivatives can be substantially greater than the derivatives’ original cost and can sometimes be unlimited. A Fund may not be able to close out a derivative transaction at a favorable time or price.
At September 30, 2023, and during the year then ended, the Fund(s) had the following derivatives and transactions in derivatives, grouped into the indicated risk categories:
Credit | Equity Risk | Foreign | Interest/ | Total | ||||||||||||||||
Global Floating Rate Fund | ||||||||||||||||||||
Asset Derivatives | ||||||||||||||||||||
Forward Contracts* | $ | — | $ | — | $ | 796,155 | $ | — | $ | 796,155 | ||||||||||
Liability Derivatives | ||||||||||||||||||||
Forward Contracts^ | $ | — | $ | — | $ | (12,749 | ) | $ | — | $ | (12,749 | ) | ||||||||
Realized Gain (Loss)# | ||||||||||||||||||||
Forward Contracts | $ | — | $ | — | $ | (4,808,754 | ) | $ | — | $ | (4,808,754 | ) | ||||||||
Change in Appreciation (Depreciation)## | ||||||||||||||||||||
Forward Contracts | $ | — | $ | — | $ | (845,396 | ) | $ | — | $ | (845,396 | ) | ||||||||
Global Credit Income Opportunities Fund | ||||||||||||||||||||
Asset Derivatives | ||||||||||||||||||||
Forward Contracts* | $ | — | $ | — | $ | 588,369 | $ | — | $ | 588,369 | ||||||||||
Realized Gain (Loss)# | ||||||||||||||||||||
Purchased Options | $ | — | $ | (653,124 | ) | $ | — | $ | — | $ | (653,124 | ) | ||||||||
Forward Contracts | — | — | (1,780,704 | ) | — | (1,780,704 | ) | |||||||||||||
Total Realized Gain (Loss) | $ | — | $ | (653,124 | ) | $ | (1,780,704 | ) | $ | — | $ | (2,433,828 | ) | |||||||
Change in Appreciation (Depreciation)## | ||||||||||||||||||||
Purchased Options | $ | — | $ | (199,632 | ) | $ | — | $ | — | $ | (199,632 | ) | ||||||||
Forward Contracts | — | — | (57,891 | ) | — | (57,891 | ) | |||||||||||||
Total Change in Appreciation (Depreciation) | $ | — | $ | (199,632 | ) | $ | (57,891 | ) | $ | — | $ | (257,523 | ) | |||||||
Emerging Markets Debt Blended Total Return Fund | ||||||||||||||||||||
Asset Derivatives | ||||||||||||||||||||
Purchased Options* | $ | — | $ | — | $ | 15,885 | $ | — | $ | 15,885 | ||||||||||
Forward Contracts* | — | — | 1,204,184 | — | 1,204,184 | |||||||||||||||
Futures Contracts^^ | — | — | — | 186,918 | 186,918 | |||||||||||||||
Swap Agreements* | 62,278 | — | 54,772 | — | 117,050 | |||||||||||||||
Swap Agreements^^,^^^ | — | — | — | 109,163 | 109,163 | |||||||||||||||
Total Value | $ | 62,278 | $ | — | $ | 1,274,841 | $ | 296,081 | $ | 1,633,200 | ||||||||||
Liability Derivatives | ||||||||||||||||||||
Forward Contracts^ | $ | — | $ | — | $ | (1,381,651 | ) | $ | — | $ | (1,381,651 | ) | ||||||||
Swap Agreements^ | (14,443 | ) | — | — | — | (14,443 | ) | |||||||||||||
Swap Agreements^^,^^^ | — | — | — | (194,115 | ) | (194,115 | ) | |||||||||||||
Written Options^ | — | — | (83,201 | ) | — | (83,201 | ) | |||||||||||||
Total Value | $ | (14,443 | ) | $ | — | $ | (1,464,852 | ) | $ | (194,115 | ) | $ | (1,673,410 | ) | ||||||
69
Notes to Financial Statements (Continued) |
Credit | Equity Risk | Foreign | Interest/ | Total | ||||||||||||||||
Emerging Markets Debt Blended Total Return Fund (Continued) | ||||||||||||||||||||
Realized Gain (Loss)# | ||||||||||||||||||||
Purchased Options | $ | — | $ | — | $ | (31,957 | ) | $ | — | $ | (31,957 | ) | ||||||||
Forward Contracts | — | — | (1,892,819 | ) | — | (1,892,819 | ) | |||||||||||||
Futures Contracts | — | — | — | 1,004,614 | 1,004,614 | |||||||||||||||
Swap Agreements | 263,609 | — | 311,326 | (287,368 | ) | 287,567 | ||||||||||||||
Written Options | — | — | 32,126 | — | 32,126 | |||||||||||||||
Total Realized Gain (Loss) | $ | 263,609 | $ | — | $ | (1,581,324 | ) | $ | 717,246 | $ | (600,469 | ) | ||||||||
Change in Appreciation (Depreciation)## | ||||||||||||||||||||
Purchased Options | $ | — | $ | — | $ | (100,105 | ) | $ | — | $ | (100,105 | ) | ||||||||
Forward Contracts | — | — | (398,099 | ) | — | (398,099 | ) | |||||||||||||
Futures Contracts | — | — | — | (267,338 | ) | (267,338 | ) | |||||||||||||
Swap Agreements | 137,092 | — | (506,477 | ) | 215,609 | (153,776 | ) | |||||||||||||
Written Options | — | — | 108,905 | — | 108,905 | |||||||||||||||
Total Change in Appreciation (Depreciation) | $ | 137,092 | $ | — | $ | (895,776 | ) | $ | (51,729 | ) | $ | (810,413 | ) | |||||||
* | Statements of Assets and Liabilities location: Investments, at value, or Receivables from: open forward contracts or open swap agreements, at value, as applicable. |
^ | Statements of Assets and Liabilities location: Payables for: open forward contracts, open swap agreements, at value, or written options outstanding, at value, as applicable. |
^^ | Cumulative appreciation (depreciation) on futures contracts and centrally cleared swaps is reported in “Futures Contracts” and “Swap Agreements” in each applicable Fund’s Portfolio of Investments. Only current day’s variation margin, if any, is reported within the Statements of Assets and Liabilities. |
^^^ | Represents centrally cleared swaps, which are not subject to a master netting agreement or similar agreement. |
# | Statements of Operations location: Amounts are included in net realized gain (loss) on: investment transactions, forward contracts, futures contracts, swap agreements, or written options, as applicable. |
## | Statements of Operations location: Amounts are included in net change in unrealized appreciation (depreciation) on investment transactions, forward contracts, futures contracts, swap agreements, or written options, as applicable. |
For the year ended September 30, 2023, the average number of contracts, notional amounts, or shares/units outstanding for each derivative type was as follows:
Average Number of Contracts, Notional Amounts, or Shares/Units† | ||||||||||||||||||||
Fund Name | Futures | Forward | Swap | Purchased | Written | |||||||||||||||
Global Floating Rate Fund | $ | — | $ | 66,262,188 | $ | — | — | — | ||||||||||||
Global Credit Income Opportunities Fund | — | 35,460,822 | — | 35 | — | |||||||||||||||
Emerging Markets Debt Blended Total Return Fund | 97 | 80,596,978 | 1,912,623,077 | 8,036,036 | 8,036,036 | |||||||||||||||
† | As applicable, amount(s) disclosed represent average number of contracts for futures contracts, notional amounts for forward contracts and swap agreements, or shares/units outstanding for purchased options and written options, based on absolute values, which is indicative of volume of this derivative type, for the months that the Fund held such derivatives during the year ended September 30, 2023. |
70
Notes to Financial Statements (Continued) |
The Portfolio of Investments included in a Fund’s financial statements shows the assets or liabilities of the Fund associated with individual derivatives transactions. The terms of many of those transactions contemplate that derivatives receivables and payables between the same two parties may be netted and that the parties will collateralize certain obligations. The following tables provide an illustration of the possible effect of netting provisions and of collateral (delivered or received) on a Fund’s derivatives exposure as of September 30, 2023. Netting arrangements vary among different counterparties, and the actual disposition of derivatives receivables and payables, and of collateral, in a bankruptcy or insolvency can be complicated and difficult to predict.
The following table presents derivative assets by counterparty net of amounts available for offset under a master netting agreement (“MNA”) or similar agreement and net of the related collateral received by the Fund(s) as of September 30, 2023.
Counterparty | Derivative | Financial | Collateral | Net Amount* | ||||||||||||
Global Floating Rate Fund | ||||||||||||||||
Morgan Stanley & Co. LLC | $ | 796,155 | $ | (12,749 | ) | $ | — | $ | 783,406 | |||||||
Global Credit Income Opportunities Fund | ||||||||||||||||
Barclays Bank PLC | $ | 229 | $ | — | $ | — | $ | 229 | ||||||||
Citibank N.A. | 113,847 | — | — | 113,847 | ||||||||||||
Morgan Stanley & Co. LLC | 474,291 | — | — | 474,291 | ||||||||||||
| $ | 588,367 | $ | — | $ | — | $ | 588,367 | |||||||||
Emerging Market Debt Blend Total Return Fund | ||||||||||||||||
Bank of America N.A. | $ | 287,807 | $ | (138,395 | ) | $ | — | $ | 149,412 | |||||||
Barclays Bank PLC | 147,707 | — | — | 147,707 | ||||||||||||
BNP Paribas SA | 128,373 | (128,373 | ) | — | — | |||||||||||
Citibank N.A. | 101,397 | (101,397 | ) | — | — | |||||||||||
Goldman Sachs International | 137,736 | (137,736 | ) | — | — | |||||||||||
HSBC Bank PLC | 201,680 | (201,680 | ) | — | — | |||||||||||
HSBC Bank USA | 68,380 | — | — | 68,380 | ||||||||||||
Morgan Stanley & Co. LLC | 264,039 | (156,395 | ) | (107,644 | ) | — | ||||||||||
| $ | 1,337,119 | $ | (863,976 | ) | $ | (107,644 | ) | $ | 365,499 | |||||||
71
Notes to Financial Statements (Continued) |
The following table presents derivative liabilities by counterparty net of amounts available for offset under an MNA or similar agreement and net of the related collateral pledged by the Fund(s) as of September 30, 2023.
Counterparty | Derivative | Financial | Collateral | Net Amount** | ||||||||||||
Global Floating Rate Fund | ||||||||||||||||
Morgan Stanley & Co. LLC | $ | (12,749 | ) | $ | 12,749 | $ | — | $ | — | |||||||
Emerging Market Debt Blend Total Return Fund | ||||||||||||||||
Bank of America N.A. | $ | (138,395 | ) | $ | 138,395 | $ | — | $ | — | |||||||
BNP Paribas SA | (299,524 | ) | 128,373 | — | (171,151 | ) | ||||||||||
Citibank N.A. | (479,505 | ) | 101,397 | 296,000 | (82,108 | ) | ||||||||||
Goldman Sachs International | (194,229 | ) | 137,736 | 56,493 | — | |||||||||||
HSBC Bank PLC | (209,606 | ) | 201,680 | — | (7,926 | ) | ||||||||||
JP Morgan Chase Bank N.A. | (1,641 | ) | — | — | (1,641 | ) | ||||||||||
Morgan Stanley & Co. LLC | (156,395 | ) | 156,395 | — | — | |||||||||||
| $ | (1,479,295 | ) | $ | 863,976 | $ | 352,493 | $ | (262,826 | ) | |||||||
* | Represents the net amount receivable from the counterparty in the event of default. |
** | Represents the net amount payable to the counterparty in the event of default. |
*** | The amount presented here may be less than the total amount of collateral received/pledged as the net amount of derivative assets and liabilities for a counterparty cannot be less than $0. |
† | The amount presented here may be less than the total amount shown in the Statements of Assets and Liabilities as some derivatives held by the counterparty are not covered within an MNA or similar agreement. |
Such agreements typically permit a single net payment in the event of default, including the bankruptcy or insolvency of the counterparty. The Fund(s) and counterparties may not be permitted to sell, re-pledge, or use the collateral they receive. In the event that cash collateral is restricted for use, the balance will be reflected as restricted cash within the Statement of Assets and Liabilities.
Further details regarding the derivatives and other investments held by the Fund(s) during the year ended September 30, 2023, are discussed below.
Foreign Currency Exchange Transactions
A Fund may enter into foreign currency exchange transactions for hedging purposes in order to protect against uncertainty in the level of future foreign currency exchange rates, or for other, non-hedging purposes.
Forward Foreign Currency Contracts and Foreign Currency Options. A Fund may enter into foreign currency exchange transactions, including foreign currency forward contracts. These contracts call for the Fund to deliver in the future an amount of one currency in return for an amount of another currency, at an exchange rate determined at the time the contract is entered into. Forward contracts are private contractual arrangements and a Fund is subject to the risk that its counterparty will not, or will not be able to, perform its obligations. This type of arrangement may require the Fund to post margin. A Fund may also buy and sell options on currencies. When the Fund buys an option, its loss should generally be limited to the amount of the premium paid and any transaction costs. If a Fund sells an option on a currency, it is subject generally to the same risks as if it had entered into a futures contract or forward contract with respect to that currency. A Fund may enter into foreign currency exchange transactions in order to hedge against changes in the values of the assets or liabilities denominated in one or more foreign currencies, or otherwise to increase or reduce a Fund’s exposure to various foreign currencies. The use of foreign currency exchange transactions may create investment leverage.
72
Notes to Financial Statements (Continued) |
Whenever a Fund enters into a foreign currency exchange transaction, it is subject to the risk that the value of the transaction will move in a direction unfavorable to it. When the Fund uses the transactions for hedging purposes, it is likely that the Fund will have an asset or liability that will offset any loss (or gain) on the transactions, at least in part. If a Fund enters into foreign currency exchange transactions other than for hedging purposes (for example, seeking to profit from an anticipated change in the values of currencies by creating directional exposures in the portfolio with respect to one or more currencies), it will generally be subject to the same risks, but is less likely to have assets or liabilities that will offset any losses on the transactions. There can be no assurance that a Fund will be able to terminate any foreign currency exchange transaction prior to its maturity in order to limit its loss on the transaction.
Forward foreign currency contracts are marked to market daily and the change in their value is recorded by the Funds as an unrealized gain or loss. Forward foreign currency contracts are valued at the settlement price established through dealers or other market sources on the day which they are traded. When a forward foreign currency contract is extinguished, through delivery or offset by entering into another forward foreign currency contract, the Funds record a realized gain or loss equal to the difference between the value of the contract at the time it was opened and the value of the contract at the time it was extinguished or offset. The notional or contractual amounts of these instruments do not necessarily represent the amounts potentially subject to risk. The measurement of the risk associated with these instruments is meaningful only when all related and offsetting transactions and counterparty risks are considered. For information regarding the accounting treatment of options, see “Options, Rights, and Warrants” below.
Foreign Currency Swaps. A Fund may also enter into currency swaps, as an alternative to the transactions described above. Currency swaps involve the individually negotiated exchange by a Fund with another party of a series of payments in specified currencies in amounts determined pursuant to the terms of the swap agreement. For a description of risks associated with swap transactions and the accounting treatment, see “Swap Agreements” below.
A Fund’s current exposure to a counterparty is the unrealized appreciation (depreciation) on the contract.
Futures Contracts
A Fund may seek to manage a variety of different risks, such as interest rate risk, equity price risk, and currency risk, through the use of futures contracts. A Fund may use interest rate futures contracts to adjust the interest rate sensitivity (duration) of its portfolio or the credit exposure of the portfolio. Interest rate futures contracts obligate the long or short holder to take or make delivery of a specified quantity of a financial instrument, such as a specific fixed income security, during a specified future period at a specified price. A Fund may use index futures contracts to hedge against broad market risks to its portfolio or to gain broad market exposure when it holds uninvested cash or as an inexpensive substitute for cash investments directly in securities or other assets, including commodities and precious metals. Securities index futures contracts are contracts to buy or sell units of a securities index at a specified future date at a price agreed upon when the contract is made and are settled in cash. Positions in futures contracts may be closed out only on an exchange or board of trade which provides a market for such futures. Because futures contracts are exchange-traded, they typically have minimal exposure to counterparty risk.
Parties to a futures contract are not required to post the entire notional amount of the contract, but rather a small percentage of that amount (by way of margin), both at the time they enter into futures transactions, and then on a daily basis if their positions decline in value; as a result, futures contracts are highly leveraged. Such payments are known as variation margin and are recorded by the Funds as unrealized gains or losses. Because futures markets are highly leveraged, they can be extremely volatile, and there can be no assurance that the pricing of a futures contract will correlate precisely with the pricing of the asset or index underlying it or the asset or liability of the Fund that is the subject of the hedge. It may not always be possible for a Fund to enter into a closing transaction with respect to a futures contract it has entered into, at a favorable time or price. When a Fund enters into a futures transaction, it is subject to the risk that the value of the futures contract will move in a direction unfavorable to it. When a Fund uses futures contracts for hedging purposes, it is likely that the Fund will have an asset or liability that will offset any loss (or gain) on the transactions, at least in part.
73
Notes to Financial Statements (Continued) |
When a futures contract is closed, the Fund records a realized gain or loss equal to the difference between the value of the contract at the time it was opened and the value at the time it was closed. Futures contracts are valued at the settlement price established each day by the board of trade or exchange on which they are traded.
Swap Agreements
Swap agreements are typically two-party contracts entered into primarily by institutional investors. In a standard “swap” transaction, two parties agree to exchange the returns (or differentials in rates of return) earned or realized on particular predetermined investments or instruments or rates, which may be adjusted for an interest factor. The gross returns to be exchanged or “swapped” between the parties are generally calculated with respect to a “notional amount,” (i.e., the return on or increase in value of a particular dollar amount invested at a particular interest rate or in a “basket” of securities representing a particular index).
Interest Rate Swaps. When a Fund enters into an interest rate swap, it typically agrees to make payments to its counterparty based on a specified long- or short-term interest rate, and will receive payments from its counterparty based on another interest rate. Other forms of interest rate swap agreements include, among others, interest rate caps, under which, in return for a specified payment stream, one party agrees to make payments to the other to the extent that interest rates exceed a specified rate, or “cap”; interest rate floors, under which, in return for a specified payment stream, one party agrees to make payments to the other to the extent that interest rates fall below a specified rate, or “floor”; and interest rate collars, under which a party sells a cap and purchases a floor or vice versa in an attempt to protect itself against interest rate movements exceeding given minimum or maximum levels. A Fund may enter into an interest rate swap in order, for example, to hedge against the effect of interest rate changes on the value of specific securities in its portfolio, or to adjust the interest rate sensitivity (duration) or the credit exposure of its portfolio overall, or otherwise as a substitute for a direct investment in debt securities.
Credit Default Swaps. A Fund also may enter into credit default swap transactions, as a “buyer” or “seller” of credit protection. In a credit default swap, one party provides what is in effect insurance against a default or other adverse credit event affecting an issuer of debt securities (typically referred to as a “reference entity”). In general, the buyer of credit protection is obligated to pay the protection seller an upfront amount or a periodic stream of payments over the term of the swap. If a “credit event” occurs, the buyer has the right to deliver to the seller bonds or other obligations of the reference entity (with a value up to the full notional value of the swap), and to receive a payment equal to the par value of the bonds or other obligations. Credit events that would trigger a request that the seller make payment are specific to each credit default swap agreement, but generally include bankruptcy, failure to pay, restructuring, acceleration, default, or repudiation/moratorium. When a Fund buys protection, it may or may not own securities of the reference entity. If it does own securities of the reference entity, the swap serves as a hedge against a decline in the value of the securities due to the occurrence of a credit event involving the issuer of the securities. If the Fund does not own securities of the reference entity, the credit default swap may be seen to create a short position in the reference entity. If a Fund is a buyer and no credit event occurs, the Fund will typically recover nothing under the swap, but will have had to pay the required upfront payment and stream of continuing payments under the swap. When a Fund sells protection under a credit default swap, the position may have the effect of creating leverage in the Fund’s portfolio through the Fund’s indirect long exposure to the issuer or securities on which the swap is written. When a Fund sells protection, it may do so either to earn additional income or to create a “synthetic” long position.
Whenever a Fund enters into a swap agreement, it takes on counterparty risk — the risk that its counterparty will be unable or unwilling to meet its obligations under the swap agreement. The Fund also takes the risk that the market will move against its position in the swap agreement. In the case of an interest rate swap, the value of the swap may increase or decrease depending on changes in interest rates. In the case of a credit default swap, the swap will become more or less valuable depending on the credit of the issuer of the underlying security, and, if a credit event occurs under a swap where the Fund is the seller of credit protection, the Fund could be required to purchase the security at par value, resulting in a significant loss to the Fund. When the Fund enters into any type of swap for hedging purposes, it is likely that the Fund will have an asset or liability that will offset any loss (or gain) on the swap, at least in part. Swap agreements may be non-transferable or otherwise highly illiquid, and a Fund may not be able to terminate or transfer a swap agreement at any particular time or at an acceptable price.
74
Notes to Financial Statements (Continued) |
Centrally Cleared Swaps. Certain clearinghouses currently offer clearing for limited types of derivatives transactions, principally certain interest rate swaps, certain index swaps, and credit derivatives. In a cleared derivative transaction, a Fund typically enters into the transaction with a financial institution counterparty, and performance of the transaction is effectively guaranteed by a central clearinghouse, thereby reducing or eliminating the Fund’s exposure to the credit risk of its original counterparty. The Fund will be required to post amounts (“initial margin”) with the clearinghouse or at the instruction of the clearinghouse. The initial margin required by a clearinghouse may be greater than the initial margin the Fund would be required to post in an uncleared transaction. If cash is deposited as the initial margin, it is shown as collateral on a Fund’s Statement of Assets and Liabilities. Swap agreements are marked to market daily and subsequent payments (“variation margin”) are made or received by a Fund depending on whether unrealized gains or losses are incurred. These amounts are reflected as receivables or payables on a Fund’s Statement of Assets and Liabilities (“Variation margin on open derivative instruments”) and as a component of net change in unrealized appreciation (depreciation) on a Fund’s Statement of Operations. Only a limited number of transaction types are currently eligible for clearing.
During the term of a swap transaction, changes in the value of the swap are recognized as unrealized gains or losses by marking to market to reflect the market value of the swap. When the swap is terminated, a Fund will record a realized gain or loss equal to the difference, if any, between the proceeds from (or cost of) the closing transaction and a Fund’s basis in the agreement. Upfront swap premium payments paid or received by a Fund, if any, are recorded within the value of the open swap agreement on the Fund’s Statement of Assets and Liabilities and represent payments paid or received upon entering into the swap agreement to compensate for differences between stated terms of the swap agreement and prevailing market conditions (credit spreads, currency exchange rates, and other relevant factors). These upfront payments are recorded as realized gain or loss on the Fund’s Statement of Operations upon termination or maturity of the swap agreement.
During the term of a swap transaction, the periodic net payments can be made for a set period of time or may be triggered by a predetermined credit event. The net periodic payments may be based on a fixed or variable interest rate, the change in market value of a specified security, basket of securities or index, or the return generated by a security. These periodic payments received or made by the Funds are recorded in the accompanying Statements of Operations as realized gains and losses, respectively.
A Fund’s current exposure to a counterparty is the fair value of the transaction.
Options, Rights, and Warrants
A Fund may purchase and sell put and call options on portfolio securities or an index of securities to enhance investment performance or to protect against changes in market prices. A Fund that invests in debt securities may also purchase and sell put and call options to adjust the interest rate sensitivity of its portfolio or the credit exposure of the portfolio.
Call Options. A call option gives the holder the right to purchase, and obligates the writer to sell, a security at the strike price at any time before the expiration date in the case of an American-style option or only on the expiration date in the case of a European-style option.
Put Options. A put option gives the holder the right to sell, and obligates the writer to buy, a security at the exercise price.
Writing put and call options. A Fund may write call options on a security it owns, in a “directional” strategy hoping to realize a greater current return through the receipt of premiums. In return for the option premium, the Fund takes the risk that it will have to forego any increase in the value of the security over the strike price. When a Fund has written a call option on a security it does not own, its exposure on such an option is theoretically unlimited. A Fund may enter into closing purchase transactions in order to realize a profit or limit a loss on a previously written call option or, in the case of a call option on a security it owns, to free itself to sell the underlying security or to write another call on the security, or protect a security from being called in an unexpected market rise. Any profits from a closing purchase transaction in the case of a call option on a security a Fund owns may be offset by a decline in the value of the underlying security. Conversely, because increases in the market price of a call option will generally reflect increases in the market price of the underlying security, any loss resulting from a closing purchase transaction relating to a call option on a security a Fund owns is likely to be offset in whole or in part by unrealized appreciation of the underlying security owned by the Fund. A Fund may not be able to close out a call option that it has previously written. A Fund may write put options in order to enhance its current return by taking a long directional position as to a security or index of
75
Notes to Financial Statements (Continued) |
securities. By writing a put option, the Fund assumes the risk that it may be required to purchase the underlying security for an exercise price higher than its then current market value, resulting in a potential capital loss unless the security later appreciates in value. A Fund may terminate a put option that it has written before it expires by entering into a closing purchase transaction. Any loss from this transaction may be partially or entirely offset by the premium received on the terminated option. A Fund may not be able to close out a put option that it has previously written.
When a Fund writes a call or put option, an amount equal to the premium received is recorded as a liability. Premiums received from writing options which expire are treated as realized gains. Premiums received from writing options which are exercised or closed are added to the proceeds or offset against the amount paid on the underlying investment to determine the realized gain or loss.
Purchasing put and call options. A Fund may purchase put options to protect portfolio holdings against a decline in market value of a security or securities held by it. A Fund may also purchase a put option hoping to profit from an anticipated decline in the value of the underlying security. If the Fund holds the security underlying the option, the option premium and any transaction costs will reduce any profit the Fund might have realized had it sold the underlying security instead of buying the put option. A Fund may purchase call options to hedge against an increase in the price of securities that the Fund wants ultimately to buy. A Fund may also purchase a call option as a long directional investment hoping to profit from an anticipated increase in the value of the underlying security. In order for a call option to be profitable, the market price of the underlying security must rise sufficiently above the exercise price to cover the premium and transaction costs. These costs will reduce any profit the Fund might have realized had it bought the underlying security at the time it purchased the call option.
When a Fund purchases an option, it runs the risk that it will lose its entire investment in the option in a relatively short period of time, unless the Fund exercises the option or enters into a closing sale transaction before the option’s expiration. If the price of the underlying security does not rise (in the case of a call) or fall (in the case of a put) to an extent sufficient to cover the option premium and transaction costs, the Fund will lose part or all of its investment in the option. This contrasts with an investment by a Fund in the underlying security, since the Fund will not realize a loss if the security’s price does not change. Premiums paid for purchasing options that expire are treated as realized losses.
Exchange Traded Options. Exchange traded options purchased or sold by a Fund may be traded on a securities or options exchange or market. Such options typically have minimal exposure to counterparty risk. However, an exchange or market may at times find it necessary to impose restrictions on particular types of options transactions, such as opening transactions. If an underlying security ceases to meet qualifications imposed by the market or the Options Clearing Corporation, new series of options on that security will no longer be opened to replace expiring series, and opening transactions in existing series may be prohibited. Exchange traded options are valued at the last sale price, or if no sales are reported, the last bid price.
OTC Options. OTC options purchased or sold by a Fund are not traded on securities or options exchanges or backed by clearinghouses. Rather, they are entered into directly between a Fund and the counterparty to the option. In the case of an OTC option purchased by the Fund, the value of the option to the Fund will depend on the willingness and ability of the option writer to perform its obligations to the Fund. In addition, OTC options may not be transferable and there may be little or no secondary market for them, so they may be considered illiquid. It may not be possible to enter into closing transactions with respect to OTC options or otherwise to terminate such options, and as a result a Fund may be required to remain obligated on an unfavorable OTC option until its expiration. OTC options are valued using prices supplied by a primary pricing source, selected pursuant to procedures approved by the Trustees.
Rights and Warrants. A Fund may purchase or hold warrants or rights in order to gain exposure to the underlying security without owning the security, including, for example, cases where the Fund hopes to lock in the price today of a security it may wish to purchase in the future. Warrants generally give the holder the right, but not the obligation, to buy a security at a stated price. In order for a warrant to be profitable, the market price of the underlying security must rise sufficiently above the exercise price to cover any premium and transaction costs. Rights may similarly confer on the holder the right to purchase or acquire securities, including through participation in a so-called rights offering. Bonds may be issued with warrants or other rights attached to purchase or acquire equity or other debt securities, typically of the bond issuer. The market prices of bonds with warrants or rights attached to purchase equity securities or bonds may, to some degree, reflect changes in the values of the underlying securities.
76
Notes to Financial Statements (Continued) |
When a Fund purchases or otherwise acquires warrants or other rights, it runs the risk that it will lose its entire investment in the warrants or rights, unless the Fund exercises the warrant or right, acquires the underlying securities, or enters into a closing transaction before expiration. If the price of the underlying security does not rise to an extent sufficient to cover any premium and transaction costs, the Fund will lose part or all of its investment. Any premiums or purchase price paid for warrants or other rights that expire are treated as realized losses. Warrants and similar rights differ from options in that they are typically written by the issuer of the security underlying the warrant or right. Although some warrants and rights may be non-transferable, others may be traded over-the-counter or on an exchange.
Hybrid Instruments
A hybrid instrument may be a debt security, preferred stock, warrant, convertible security, certificate of deposit, or other evidence of indebtedness on which a portion of or all interest payments, and/or the principal or stated amount payable at maturity, redemption, or retirement, is determined by reference to one or more underlying assets, indexes, economic factors, or other benchmarks. Because hybrid instruments may be designed to provide indirect exposures to virtually any type of derivative instrument, a Fund may invest in a hybrid instrument for any purpose it might engage in derivatives transactions. Hybrid instruments may take a number of forms, including, for example, debt instruments with interest or principal payments or redemption terms determined by reference to the value of an index, security, or other measure at a future time, preferred stock with dividend rates determined by reference to the value of a currency, or convertible securities where the conversion terms relate to a particular commodity. The risks of investing in a hybrid instrument may, depending on the nature of the instrument, reflect a combination of the risks of investing in securities, options, futures, currencies or other types of investments, and will depend upon the terms of the instrument. Such risks generally depend upon factors unrelated to the operations or credit quality of the issuer of the hybrid instrument, and may not be foreseen by the purchaser, such as financial or market developments, economic and political events, the supply and demand of the underlying assets, and interest rate movements. Hybrid instruments may be highly volatile and their use by a Fund may not be successful. The terms of a hybrid instrument may create investment leverage. Hybrid instruments are typically privately issued, presenting credit risk of the issuer, and may be highly illiquid and difficult to value.
Bank Loans
A Fund may invest in bank loans including, for example, corporate loans, loan participations, direct debt, bank debt, and bridge debt. A Fund may invest in a loan by lending money to a borrower directly as part of a syndicate of lenders. In a syndicated loan, the agent that originated and structured the loan typically administers and enforces the loan on behalf of the syndicate. Failure by the agent to fulfill its obligations may delay or adversely affect receipt of payment by a Fund. A Fund may also invest in loans through novations, assignments, and participation interests. In a novation, a Fund typically assumes all of the rights of a lending institution in a loan, including the right to receive payments of principal and interest and other amounts directly from the borrower and to enforce its rights as a lender directly against the borrower. When a Fund takes an assignment of a loan, the Fund acquires some or all of the interest of another lender (or assignee) in the loan. In such cases, the Fund may be required generally to rely upon the assignor to demand payment and enforce rights under the loan. If a Fund acquires a participation in the loan, the Fund purchases an indirect interest in a loan held by a third party and the Fund typically will have a contractual relationship only with the third-party loan investor, not with the borrower. As a result, a Fund may have the right to receive payments of principal, interest, and any fees to which it is entitled only from the loan investor selling the participation and only upon receipt by such loan investor of such payments from the borrower. In such cases, a Fund assumes the credit risk of both the borrower and the loan investor selling the participation, and the Fund may be unable to realize some or all of the value of its interest in the loan in the event of the insolvency of the third party.
Changes in the financial condition of the borrower or economic conditions or other circumstances may reduce the capacity of the borrower to make principal and interest payments on such instruments and may lead to defaults. The value of any collateral securing a bank loan may decline after the Fund invests, and there is a risk that the value of the collateral may not be sufficient to cover the amount owed to the Fund.
77
Notes to Financial Statements (Continued) |
The Global Floating Rate Fund and Global Credit Income Opportunities Fund entered into certain bank loan agreements which are unfunded (“commitments”). The Global Floating Rate Fund and Global Credit Income Opportunities Fund are obligated to fund these commitments at the borrower’s discretion. At September 30, 2023, the Global Floating Rate Fund and Global Credit Income Opportunities Fund had sufficient cash and/or securities to cover these commitments.
Commitment interest is marked to market daily, and any unrealized appreciation (depreciation) is included in the Statement of Assets and Liabilities. Any change in the unrealized appreciation (depreciation) is shown in the Statement of Operations. At September 30, 2023, the Global Floating Rate Fund and Global Credit Income Opportunities Fund had the following commitments:
Borrower | Par | Commitment | Value | Unrealized | |||||||||||||
Global Floating Rate Fund | Anarafe SLU 2023 EUR PIK New Money Facility F | $ | 28,778 | $ | 31,263 | $ | 28,904 | $ | (2,359 | ) | |||||||
OMNIA Partners LLC, Term Loan | 23,757 | 23,525 | 23,762 | 237 | |||||||||||||
| $ | 52,535 | $ | 54,788 | $ | 52,666 | $ | (2,122 | ) | |||||||||
Global Credit Income Opportunities Fund | Anarafe SLU 2023 EUR PIK New Money Facility F | $ | 14,623 | $ | 15,886 | $ | 14,687 | $ | (1,199 | ) | |||||||
IPS Corp. 2021 Delayed Draw Term Loan | 53,243 | 4,421 | 51,446 | 47,025 | |||||||||||||
| $ | 67,866 | $ | 20,307 | $ | 66,133 | $ | 45,826 | ||||||||||
Certain Funds may receive or pay fees associated with investments in bank loans. These fees are included as interest income on a Fund’s Statement of Operations. These fees include all income and expenses associated with the processing and maintenance of these types of loans, including but not limited to consent fee income, amendment fees, and closing fees.
Repurchase Agreements
Each Fund may enter into repurchase agreements with certain banks and broker-dealers whereby a Fund acquires a security for cash and obtains a simultaneous commitment from the seller to repurchase the security at an agreed upon price and date. A Fund, through its custodian, takes possession of the securities collateralizing the repurchase agreement in a segregated account. Repurchase agreements must be fully collateralized at all times, but involve some risk to a Fund if the other party should default on its obligation and the Fund is delayed or prevented from recovering the collateral, or if the Fund is required to return collateral to a borrower at a time when it may realize a loss on the investment of that collateral.
When-Issued, Delayed-Delivery, Forward Commitment, and To-Be-Announced Transactions
A Fund may enter into when-issued, delayed-delivery, forward commitment, or to-be-announced (“TBA”) transactions (collectively, the “Forward Transactions”) in order to lock in the purchase price of the underlying security, or in order to adjust the interest rate exposure of the Fund’s existing portfolio. In Forward Transactions, a Fund commits to purchase or sell particular securities, with payment and delivery to take place at a future date. In the case of TBA purchase commitments, the unit price and the estimated principal amount are established when the Fund enters into a commitment, with the actual principal amount being within a specified range of the estimate. Although a Fund does not typically pay for the securities in these types of transactions until they are delivered, it immediately assumes the risks of ownership, including the risk of price fluctuation. As a result, each of these types of transactions may create investment leverage in a Fund’s portfolio and increase the volatility of the Fund. If a Fund’s counterparty fails to deliver a security purchased in a Forward Transaction, there may be a loss, and the Fund may have missed an opportunity to make an alternative investment.
These securities are valued on the basis of valuations furnished by a pricing service, selected pursuant to procedures approved by the Trustees, which determines valuations taking into account appropriate factors such as institutional-size trading in similar groups of securities, yield, quality, coupon rate, maturity, type of issue, trading characteristics, and other market data. Securities for which no market quotation is available are valued at fair value by MML Advisers. A Fund records on a daily basis the
78
Notes to Financial Statements (Continued) |
unrealized appreciation (depreciation) based upon changes in the values of these securities. When a Forward Transaction is closed, a Fund records a realized gain or loss equal to the difference between the value of the transaction at the time it was opened and the value of the transaction at the time it was closed.
Securities Lending
Each Fund may lend its securities; however, lending cannot exceed 33% of the total assets of the Fund taken at current value. The Funds’ securities lending activities are governed by a Securities Lending Agency Agreement (“Lending Agreement”) between each Fund and the lending agent (“Agent”). The Lending Agreement authorizes the Agent to lend portfolio securities held by a Fund to approved borrowers (each, a “Borrower”).
Each Fund expects that in connection with any securities on loan, the loan will be secured continuously by collateral consisting of cash (U.S. currency) and/or securities (U.S. Treasury and Agency obligations) adjusted daily to have value at least equal to the current market value of the securities loaned. The market value of the loaned securities is determined at the close of business of a Fund and any additional collateral is delivered to the Fund the next business day. The Funds bear the risk of loss with respect to the investment of cash collateral. As with other extensions of credit, the Funds may bear the risk of delay in recovery of the loaned securities or even loss of rights in the collateral should the Borrower of the securities fail financially. Pursuant to the Lending Agreement, the Agent has provided indemnification to the Funds in the event of default by a Borrower with respect to a loan. The Funds receive compensation for lending their securities in the form of a securities loan fee paid by the Borrower, as well as a share of the income earned on investment of the cash collateral received for the loaned securities. At September 30 2023, the Funds’ collateral was equal to or greater than 100% of the market value of securities on loan, and all of the Funds’ cash collateral was invested in the State Street Navigator Securities Lending Government Money Market Portfolio.
Subject to the terms of the Lending Agreement and the agreement between the Agent and the applicable Borrower (“Borrowing Agreement”), security loans can be terminated by the Agent, the Fund, or the Borrower and the related securities must be returned within the earlier of the customary settlement period for such securities or the period of time specified in the Borrowing Agreement.
The Funds employ the Agent to implement their securities lending program and the Agent receives a fee from the Funds for its services. In addition, the Funds may be required to pay a rebate to the Borrower. Accordingly, a Fund’s compensation for lending its securities is reduced by any such fees or rebate paid to the Agent or Borrower, respectively. Income received by the Funds in securities lending transactions during the year ended September 30, 2023, is reflected as securities lending income on the Statement of Operations.
Accounting for Investment Transactions
Investment transactions are accounted for on the trade date. Realized gains and losses on sales of investments and unrealized appreciation and depreciation of investments are computed by the specific identification cost method. Proceeds received from litigation, if any, are included in realized gains on investment transactions for any investments that are no longer held in the portfolio and as a reduction in cost for investments that continue to be held in the portfolio. Interest income, adjusted for amortization of discounts and premiums on debt securities, is earned from the settlement date and is recorded on the accrual basis. Dividend income and realized capital gain distributions are recorded on the ex-dividend date. Withholding taxes on foreign interest, dividends, and capital gains have been provided for in accordance with the applicable country’s tax rules and rates. Foreign dividend income is recorded on the ex-dividend date or as soon as practicable after the Fund determines the existence of a dividend declaration after exercising reasonable due diligence. Distributions received on securities that represent a return of capital or capital gains are recorded as a reduction of cost of investments and/or as a realized gain.
Foreign Currency Translation
The books and records of the Funds are maintained in U.S. dollars. The market values of foreign currencies, foreign securities, and other assets and liabilities denominated in foreign currencies are translated into U.S. dollars at the mean of the buying and selling rates of such currencies against the U.S. dollar at the end of each business day. Purchases and sales of foreign securities and income and expense items are translated at the rates of exchange prevailing on the respective dates of such transactions.
79
Notes to Financial Statements (Continued) |
The Funds do not isolate that portion of the results of operations arising from changes in the exchange rates from that portion arising from changes in the market prices of securities. Net realized foreign currency gains and losses resulting from changes in exchange rates include foreign currency gains and losses between trade date and settlement date on investment securities transactions, foreign currency transactions, and the difference between the amounts of dividends or interest recorded on the books of the Funds and the amount actually received.
Allocation of Operating Activity
In maintaining the records for the Funds, the income and expense accounts are allocated daily to each class of shares. Investment income and loss, and unrealized and realized gains or losses are prorated among the classes of shares based on the relative net assets of each. Expenses are allocated to each class of shares depending on the nature of the expenditures. Administration and service fees, if any, which are directly attributable to a class of shares, are charged to that class’s operations. Expenses of a Fund not directly attributable to the operations of any specific class of shares of the Fund are prorated among the classes to which the expense relates based on relative net assets.
Foreign Securities
The Global Credit Income Opportunities Fund invests a significant amount of its assets in foreign securities and each of the Emerging Markets Debt Blended Total Return Fund and Global Emerging Markets Equity Fund invests substantially all of its assets in foreign securities. The Global Floating Rate Fund may also invest in foreign securities. Foreign securities, including American Depositary Receipts, are subject to additional risks compared to securities of U.S. issuers, including international trade, currency, political, regulatory, public health, and diplomatic risks. In addition, fluctuations in currency exchange rates may favorably or unfavorably affect the values of foreign securities and the price of a Fund’s shares. Emerging markets securities are subject to greater risks than securities issued in developed foreign markets, including less liquidity, less stringent investor protection and disclosure standards, less reliable settlement practices, greater price volatility, higher relative rates of inflation, greater political, economic, and social instability, greater custody and operational risks, greater risk of new or inconsistent government treatment of or restrictions on issuers and instruments, and greater volatility in currency exchange rates, and are more susceptible to environmental problems.
Federal Income Tax
It is each Fund’s intent to continue to comply with the provisions of Subchapter M of the Internal Revenue Code of 1986, as amended (the “Code”), applicable to a regulated investment company. Under such provisions, the Funds would not be subject to U.S. federal income taxes on their ordinary income and net realized capital gains to the extent they are distributed or deemed to have been distributed to their shareholders. Therefore, the Funds have not made any provision for U.S. federal income tax.
Dividends and Distributions to Shareholders
Dividends from net investment income are either declared daily and paid monthly or declared and paid annually depending on the requirements of each Fund. Dividends from net investment income may also be distributed at other times throughout the year as required to satisfy tax or regulatory requirements. Distributions of any net realized capital gains of each Fund are declared and paid annually and at other times as may be required to satisfy tax or regulatory requirements.
Distributions to shareholders are recorded on the ex-dividend date. Income and capital gain distributions are determined in accordance with income tax regulations, which may differ from generally accepted accounting principles. As a result, net investment income and net realized capital gains on investment transactions for a reporting period may differ significantly from distributions during such period.
80
Notes to Financial Statements (Continued) |
3. | Investment Advisory Fees and Other Transactions |
Investment Advisory Fees and Investment Subadvisers
MML Advisers, a wholly-owned subsidiary of Massachusetts Mutual Life Insurance Company (“MassMutual”), serves as investment adviser to each Fund. Under the investment advisory agreements between MML Advisers and the Trust on behalf of each Fund, MML Advisers is responsible for providing investment management services for each Fund. In return for these services, MML Advisers receives investment advisory fees, based upon each Fund’s average daily net assets, computed and accrued daily and payable monthly, at the following annual rates:
Fund | Investment Advisory Fee |
Global Floating Rate Fund | 0.65% |
Global Credit Income Opportunities Fund | 0.75% |
Emerging Markets Debt Blended Total Return Fund | 0.75% |
Global Emerging Markets Equity Fund | 0.90% |
MML Advisers has entered into investment subadvisory agreements with Barings LLC (“Barings”), a wholly-owned subsidiary of MM Asset Management Holding LLC, itself a wholly-owned subsidiary of MassMutual Holding LLC, a controlled subsidiary of MassMutual, on behalf of each Fund. These agreements provide that Barings manage the investment and reinvestment of assets of each Fund. Barings receives a subadvisory fee from MML Advisers, based upon each Fund’s average daily net assets, at the following annual rates:
Global Floating Rate Fund* | 0.30% |
Global Credit Income Opportunities Fund* | 0.30% |
Emerging Markets Debt Blended Total Return Fund* | 0.35% |
Global Emerging Markets Equity Fund* | 0.35% |
* | Baring International Investment Limited (“BIIL”), a wholly-owned subsidiary of Barings, serves as a sub-subadviser of the Fund. BIIL receives a sub-subadvisory fee from Barings, based upon a portion of the subadvisory fee Barings receives from MML Advisers, in an amount equal to the following percentage of the subadvisory fee received by Barings: 35% of the subadvisory fee for Global Floating Rate Fund, 35% of the subadvisory fee for Global Credit Income Opportunities Fund, 50% of the subadvisory fee for Emerging Markets Debt Blended Total Return Fund, and 50% of the subadvisory fee for Global Emerging Markets Equity Fund. |
The Funds’ subadvisory fees are paid monthly by MML Advisers out of the investment advisory fees previously disclosed above.
Administration Fees
Under an Administrative and Shareholder Services Agreement between the Trust and MML Advisers, on behalf of each Fund, MML Advisers is obligated to provide certain administrative and shareholder services. In return for these services, MML Advisers receives an administrative services fee, based upon the average daily net assets of the applicable class of shares of the Funds, at the following annual rates:
Class I | Class Y | Class L | Class C | |
Global Floating Rate Fund | None | 0.07% | 0.04% | 0.03% |
Global Credit Income Opportunities Fund | None | 0.05% | 0.06% | 0.03% |
Emerging Markets Debt Blended Total Return Fund | None | 0.06% | 0.02% | None |
Global Emerging Markets Equity Fund | None | 0.03% | 0.02% | None |
81
Notes to Financial Statements (Continued) |
Distribution and Service Fees
On and after May 1, 2023, MML Distributors, LLC (“MML Distributors”) acts as distributor to each Fund. Pursuant to a 12b-1 Plan adopted by the Trust, Class L shares of each Fund pay an annual fee of 0.25% of the average daily net assets of the class; and Class C shares of each Fund pay an annual fee of 1.00% of the average daily net assets of the class, to MML Distributors. Such payments compensate MML Distributors for services provided and expenses incurred by it for purposes of promoting the sale of the relevant class of shares, reducing redemptions of shares, or maintaining or improving services provided to each Fund’s shareholders. MML Distributors is a wholly-owned subsidiary of MassMutual.
Prior to May 1, 2023, ALPS Distributors, Inc. (“ALPS Distributor”) acted as distributor to each Fund. Pursuant to a 12b-1 Plan adopted by the Trust, Class L shares of each Fund paid an annual fee of 0.25% of the average daily net assets of the class; and Class C shares of each Fund paid an annual fee of 1.00% of the average daily net assets of the class, to ALPS Distributor. Such payments compensated ALPS Distributor for services provided and expenses incurred by it for purposes of promoting the sale of the relevant class of shares, reducing redemptions of shares, or maintaining or improving services provided to each Fund’s shareholders.
Expense Caps and Waivers
MML Advisers has agreed to cap the fees and expenses of the Funds noted below (other than extraordinary legal and other expenses, Acquired Fund Fees and Expenses#, interest expense, expenses related to borrowings (as of July 1, 2023, with the exception of interest and borrowing expenses related to the Fund’s dedicated line of credit for the Global Floating Rate Fund and Global Credit Income Opportunities Fund), securities lending, leverage, taxes, and brokerage, short sale dividend and loan expense, or other non-recurring or unusual expenses such as organizational expenses and shareholder meeting expenses, as applicable), based upon the average daily net assets of the applicable class of shares of the Funds, as follows:
Class I | Class Y | Class L | Class C | |
Global Floating Rate Fund** | 0.75% | 0.75% | 1.00% | 1.75% |
Global Credit Income Opportunities Fund** | 0.85% | 0.90% | 1.16% | 1.95% |
Emerging Markets Debt Blended Total Return Fund* | 0.95% | 0.95% | 1.20% | 1.95% |
Global Emerging Markets Equity Fund * | 0.90% | 0.90% | 1.15% | 1.90% |
# | Acquired Fund Fees and Expenses are borne indirectly by a Fund through investments in other pooled investment vehicles. |
* | Expense caps in effect through January 31, 2024. |
** | Expense caps in effect through January 31, 2025. |
Expense caps and waiver amounts are reflected as a reduction of expenses on the Statements of Operations.
Deferred Compensation
Trustees of the Funds who are not officers or employees of MassMutual may elect to defer receipt of their annual fees in accordance with terms of a Non-Qualified Deferred Compensation Plan. Amounts deferred shall accrue interest or earnings and shall be recorded on the Funds’ books as other liabilities. Deferred compensation is included within Trustees’ fees and expenses in the Statements of Assets and Liabilities.
Other
Certain officers and trustees of the Funds may also be employees of MassMutual. The compensation of a trustee who is not an employee of MassMutual is borne by the Funds.
82
Notes to Financial Statements (Continued) |
The following table shows beneficial ownership of Funds’ shares by related parties at September 30, 2023:
Total % Ownership | |
Global Floating Rate Fund | 84.6% |
Global Credit Income Opportunities Fund | 86.9% |
Emerging Markets Debt Blended Total Return Fund | 88.4% |
Global Emerging Markets Equity Fund | 99.4% |
4. | Purchases and Sales of Investments |
Cost of purchases and proceeds from sales of investment securities (excluding short-term investments) for the year ended September 30, 2023, were as follows:
Purchases | Sales | |||||||||||||||
Long-Term U.S. | Other Long- | Long-Term U.S. | Other Long- | |||||||||||||
Global Floating Rate Fund | $ | — | $ | 44,037,605 | $ | — | $ | 182,288,095 | ||||||||
Global Credit Income Opportunities Fund | — | 62,008,994 | — | 66,096,326 | ||||||||||||
Emerging Markets Debt Blended Total Return Fund | — | 21,225,266 | — | 39,933,406 | ||||||||||||
Global Emerging Markets Equity Fund | — | 1,694,591 | — | 1,666,224 | ||||||||||||
The Funds may purchase from, or sell securities to, other affiliated Funds under procedures adopted by the Trustees. These procedures have been designed to ensure that cross trades conducted by the Funds comply with Rule 17a-7 under the 1940 Act. The Funds did not have any cross trade activity during the period.
5. | Capital Share Transactions |
Changes in shares outstanding for each Fund were as follows:
Year Ended | Year Ended | |||||||||||||||
Shares | Amount | Shares | Amount | |||||||||||||
Global Floating Rate Fund Class I | ||||||||||||||||
Sold | 1,621 | $ | 14,073 | 2,911,037 | $ | 26,421,866 | ||||||||||
Issued as reinvestment of dividends | 607,368 | 5,259,627 | 355,527 | 3,205,556 | ||||||||||||
Redeemed | (2,555,829 | ) | (22,203,486 | ) | (2,788,790 | ) | (25,513,676 | ) | ||||||||
Net increase (decrease) | (1,946,840 | ) | $ | (16,929,786 | ) | 477,774 | $ | 4,113,746 | ||||||||
Global Floating Rate Fund Class Y | ||||||||||||||||
Sold | 2,748,368 | $ | 23,886,652 | 14,760,618 | $ | 136,924,075 | ||||||||||
Issued as reinvestment of dividends | 1,228,132 | 10,609,440 | 1,097,214 | 9,919,058 | ||||||||||||
Redeemed | (14,521,701 | ) | (124,717,088 | ) | (23,944,874 | ) | (217,070,916 | ) | ||||||||
Net increase (decrease) | (10,545,201 | ) | $ | (90,220,996 | ) | (8,087,042 | ) | $ | (70,227,783 | ) | ||||||
Global Floating Rate Fund Class L | ||||||||||||||||
Sold | 476,446 | $ | 4,103,604 | 1,960,568 | $ | 17,937,042 | ||||||||||
Issued as reinvestment of dividends | 261,060 | 2,247,597 | 232,505 | 2,089,576 | ||||||||||||
Redeemed | (3,980,884 | ) | (34,046,209 | ) | (2,312,074 | ) | (20,913,561 | ) | ||||||||
Net increase (decrease) | (3,243,378 | ) | $ | (27,695,008 | ) | (119,001 | ) | $ | (886,943 | ) | ||||||
83
Notes to Financial Statements (Continued) |
Year Ended | Year Ended | |||||||||||||||
Shares | Amount | Shares | Amount | |||||||||||||
Global Floating Rate Fund Class C | ||||||||||||||||
Sold | 2,951 | $ | 25,149 | 122,519 | $ | 1,130,071 | ||||||||||
Issued as reinvestment of dividends | 43,389 | 373,362 | 24,642 | 220,649 | ||||||||||||
Redeemed | (242,746 | ) | (2,084,751 | ) | (178,754 | ) | (1,599,685 | ) | ||||||||
Net increase (decrease) | (196,406 | ) | $ | (1,686,240 | ) | (31,593 | ) | $ | (248,965 | ) | ||||||
Global Credit Income Opportunities Fund Class I | ||||||||||||||||
Sold | — | $ | — | — | $ | — | ||||||||||
Issued as reinvestment of dividends | 54,318 | 409,082 | 47,680 | 390,558 | ||||||||||||
Redeemed | (402,360 | ) | (3,016,348 | ) | (2,236 | ) | (17,447 | ) | ||||||||
Net increase (decrease) | (348,042 | ) | $ | (2,607,266 | ) | 45,444 | $ | 373,111 | ||||||||
Global Credit Income Opportunities Fund Class Y | ||||||||||||||||
Sold | 990,553 | $ | 7,493,074 | 2,459,813 | $ | 20,167,719 | ||||||||||
Issued as reinvestment of dividends | 229,376 | 1,726,010 | 343,791 | 2,853,996 | ||||||||||||
Redeemed | (3,542,818 | ) | (26,787,974 | ) | (7,020,232 | ) | (59,647,456 | ) | ||||||||
Net increase (decrease) | (2,322,889 | ) | $ | (17,568,890 | ) | (4,216,628 | ) | $ | (36,625,741 | ) | ||||||
Global Credit Income Opportunities Fund Class L | ||||||||||||||||
Sold | 2,453,939 | $ | 18,589,975 | 2,127,658 | $ | 17,434,048 | ||||||||||
Issued as reinvestment of dividends | 696,363 | 5,253,285 | 429,033 | 3,503,323 | ||||||||||||
Redeemed | (1,131,734 | ) | (8,614,405 | ) | (426,122 | ) | (3,667,968 | ) | ||||||||
Net increase (decrease) | 2,018,568 | $ | 15,228,855 | 2,130,569 | $ | 17,269,403 | ||||||||||
Global Credit Income Opportunities Fund Class C | ||||||||||||||||
Sold | 17,472 | $ | 134,258 | 1,567 | $ | 14,044 | ||||||||||
Issued as reinvestment of dividends | 31,079 | 234,160 | 31,091 | 255,771 | ||||||||||||
Redeemed | (204,738 | ) | (1,549,151 | ) | (144,401 | ) | (1,190,483 | ) | ||||||||
Net increase (decrease) | (156,187 | ) | $ | (1,180,733 | ) | (111,743 | ) | $ | (920,668 | ) | ||||||
Emerging Markets Debt Blended Total Return Fund Class I | ||||||||||||||||
Sold | — | $ | — | 249,411 | $ | 1,937,926 | ||||||||||
Issued as reinvestment of dividends | — | — | — | — | ||||||||||||
Redeemed | — | — | — | — | ||||||||||||
Net increase (decrease) | — | $ | — | 249,411 | $ | 1,937,926 | ||||||||||
Emerging Markets Debt Blended Total Return Fund Class Y | ||||||||||||||||
Sold | 1,003,749 | $ | 7,363,524 | 5,949,977 | $ | 57,732,680 | ||||||||||
Issued as reinvestment of dividends | 238,394 | 1,739,158 | 701,256 | 6,206,374 | ||||||||||||
Redeemed | (3,299,366 | ) | (23,938,660 | ) | (10,953,363 | ) | (95,414,254 | ) | ||||||||
Net increase (decrease) | (2,057,223 | ) | $ | (14,835,978 | ) | (4,302,130 | ) | $ | (31,475,200 | ) | ||||||
Emerging Markets Debt Blended Total Return Fund Class L | ||||||||||||||||
Sold | 268,794 | $ | 1,830,900 | 305,182 | $ | 2,865,616 | ||||||||||
Issued as reinvestment of dividends | 19,811 | 144,470 | 84,710 | 768,582 | ||||||||||||
Redeemed | (458,136 | ) | (3,206,694 | ) | (1,583,816 | ) | (13,145,304 | ) | ||||||||
Net increase (decrease) | (169,531 | ) | $ | (1,231,324 | ) | (1,193,924 | ) | $ | (9,511,106 | ) | ||||||
Emerging Markets Debt Blended Total Return Fund Class C | ||||||||||||||||
Sold | 3,403 | $ | 25,000 | 23,219 | $ | 231,627 | ||||||||||
Issued as reinvestment of dividends | 2,628 | 19,194 | 3,920 | 33,180 | ||||||||||||
Redeemed | (35,508 | ) | (258,646 | ) | (11,536 | ) | (102,623 | ) | ||||||||
Net increase (decrease) | (29,477 | ) | $ | (214,452 | ) | 15,603 | $ | 162,184 | ||||||||
84
Notes to Financial Statements (Continued) |
Year Ended | Year Ended | |||||||||||||||
Shares | Amount | Shares | Amount | |||||||||||||
Global Emerging Markets Equity Fund Class Y | ||||||||||||||||
Sold | — | $ | — | 1,563 | $ | 18,750 | ||||||||||
Issued as reinvestment of dividends | 201 | 1,946 | 358 | 4,332 | ||||||||||||
Redeemed | (6,761 | ) | (67,372 | ) | (3,036 | ) | (33,276 | ) | ||||||||
Net increase (decrease) | (6,560 | ) | $ | (65,426 | ) | (1,115 | ) | $ | (10,194 | ) | ||||||
* | On December 13, 2021, the Predecessor Fund was reorganized into the Fund and shareholders of the Predecessor Fund received a proportional distribution of the same class of shares, or Class L shares in the case of Class A shares, of the Fund. Information shown prior to December 13, 2021 is that of the Predecessor Fund, and is that of the Fund after December 13, 2021. The Predecessor Fund changed its fiscal year end to September 30th prior to the reorganization. |
Unless waived, purchases of Class L shares are subject to a front-end sales charge of up to 4.00% of the amount purchased. A portion of the front-end sales charge may be retained by ALPS Distributor (prior to May 1, 2023) or MML Distributors (on and after May 1, 2023). For the year ended September 30, 2023, no amounts have been retained by ALPS Distributor or MML Distributors.
Unless waived, redemptions of Class L shares made within 18 months of purchase from initial investments of $500,000 or more and redemptions of Class C shares made within 12 months of purchase are subject to a contingent deferred sales charge of 1.00% of the amount redeemed. ALPS Distributor (prior to May 1, 2023) or MML Distributors (on and after May 1, 2023) receives all contingent deferred sales charges. ALPS Distributor and/or MML Distributors retained the following amounts during the year ended September 30, 2023:
Contingent | ||||
Global Floating Rate Fund | $ | 48 | ||
Emerging Markets Debt Blended Total Return Fund | 246 | |||
With respect to Class L and Class C shares, ALPS Distributor (prior to May 1, 2023) or MML Distributors (on and after May 1, 2023) may pay an up-front commission to financial intermediaries through which sales are made as described in the Funds’ Prospectus.
Class A and Class C shares of each Predecessor Fund had the same front-end and contingent-deferred sales charges as Class L and Class C of shares of the corresponding Fund. Effective December 13, 2021, Class A shares of each Predecessor Fund were reorganized into the corresponding Fund’s Class L shares.
85
Notes to Financial Statements (Continued) |
6. | Federal Income Tax Information |
At September 30, 2023, the aggregate cost of investments and the unrealized appreciation (depreciation) in the value of all investments owned by the Fund(s), as computed on a federal income tax basis, were as follows:
Federal Income | Tax Basis | Tax Basis | Net Unrealized | |||||||||||||
Global Floating Rate Fund | $ | 201,526,604 | $ | 1,024,867 | $ | (15,669,073 | ) | $ | (14,644,206 | ) | ||||||
Global Credit Income Opportunities Fund | 155,259,590 | 1,060,194 | (16,722,051 | ) | (15,661,857 | ) | ||||||||||
Emerging Markets Debt Blended Total Return Fund | 53,466,332 | 858,340 | (9,760,062 | ) | (8,901,722 | ) | ||||||||||
Global Emerging Markets Equity Fund | 10,393,716 | 1,379,503 | (1,919,127 | ) | (539,624 | ) | ||||||||||
Net capital loss carryforwards may be applied against any net realized taxable gains in succeeding years, subject to the carryforward period limitations, where applicable. Capital losses may be carried forward indefinitely, and retain the character of the original loss.
At September 30, 2023, the following Fund(s) had accumulated capital loss carryforwards:
Short Term | Long Term | |||||||
Global Floating Rate Fund | $ | 6,239,154 | $ | 18,800,848 | ||||
Global Credit Income Opportunities Fund | 4,965,069 | 22,157,294 | ||||||
Emerging Markets Debt Blended Total Return Fund | 8,444,057 | 23,956,339 | ||||||
Global Emerging Markets Equity Fund | 15,797 | — | ||||||
The following Fund(s) elected to defer to the fiscal year beginning October 1, 2023, late year ordinary losses:
Amount | ||||
Global Floating Rate Fund | $ | 3,732,170 | ||
Global Credit Income Opportunities Fund | 596,822 | |||
Generally accepted accounting principles in the United States of America require that only distributions in excess of tax basis earnings and profits be reported in the financial statements as a return of capital.
The tax character of distributions (including capital gain dividends, if any, designated pursuant to Section 852 of the Code) paid during the year ended September 30, 2023, was as follows:
Ordinary | Long Term | Return of | ||||||||||
Global Floating Rate Fund | $ | 19,132,432 | $ | — | $ | 670,548 | ||||||
Global Credit Income Opportunities Fund | 10,342,131 | — | 108,618 | |||||||||
Emerging Markets Debt Blended Total Return Fund | — | — | 3,284,964 | |||||||||
Global Emerging Markets Equity Fund | 153,338 | — | — | |||||||||
86
Notes to Financial Statements (Continued) |
The tax character of distributions (including capital gain dividends, if any, designated pursuant to Section 852 of the Code) paid during the year ended September 30, 2022, was as follows:
Ordinary | Long Term | Return of | ||||||||||
Global Floating Rate Fund | $ | 17,110,899 | $ | — | $ | — | ||||||
Global Credit Income Opportunities Fund | 9,507,727 | — | — | |||||||||
Emerging Markets Debt Blended Total Return Fund | 6,686,673 | 1,232,813 | 1,516,100 | |||||||||
Global Emerging Markets Equity Fund | 60,491 | 256,441 | — | |||||||||
The following Fund(s) have elected to pass through the foreign tax credit for the year ended September 30, 2023:
Amount | ||||
Global Emerging Markets Equity Fund | $ | 38,293 | ||
Capital accounts within the financial statements are periodically adjusted for permanent differences between book and tax accounting. These adjustments have no impact on net assets or the results of operations. Temporary book and tax accounting differences will reverse in subsequent periods. At September 30, 2023, temporary book and tax accounting differences were primarily attributable to the deferral of wash sale losses, deferred Trustee compensation, and other temporary basis adjustments.
At September 30, 2023, the components of distributable earnings on a tax basis were as follows:
Undistributed | Undistributed | Other | Unrealized | Total | ||||||||||||||||
Global Floating Rate Fund | $ | — | $ | (28,772,172 | ) | $ | (100,350 | ) | $ | (14,717,364 | ) | $ | (43,589,886 | ) | ||||||
Global Credit Income Opportunities Fund | — | (27,719,185 | ) | (219,049 | ) | (15,520,283 | ) | (43,458,517 | ) | |||||||||||
Emerging Markets Debt Blended Total Return Fund | — | (32,400,396 | ) | (99,455 | ) | (8,798,885 | ) | (41,298,736 | ) | |||||||||||
Global Emerging Markets Equity Fund | 217,266 | (15,797 | ) | — | (539,723 | ) | (338,254 | ) | ||||||||||||
During the year ended September 30, 2023, the following amounts were reclassified due to permanent differences between book and tax accounting:
Paid-in Capital | Accumulated | Undistributed | ||||||||||
Global Floating Rate Fund | $ | (1 | ) | $ | 3,832,364 | $ | (3,832,363 | ) | ||||
Global Credit Income Opportunities Fund | 1 | 70,826 | (70,827 | ) | ||||||||
Emerging Markets Debt Blended Total Return Fund | (120,399 | ) | (526,856 | ) | 647,255 | |||||||
Global Emerging Markets Equity Fund | — | 1,157 | (1,157 | ) | ||||||||
The Funds did not have any unrecognized tax benefits at September 30, 2023, nor were there any increases or decreases in unrecognized tax benefits for the year then ended. The Funds recognize interest and penalties, if any, related to unrecognized tax benefits as an income tax expense in the Statements of Operations. During the year ended September 30, 2023, the Funds did
87
Notes to Financial Statements (Continued) |
not incur any such interest or penalties. The Funds are subject to examination by U.S. federal and state tax authorities for returns filed for the prior three fiscal years. Foreign taxes are provided for based on the Funds’ understanding of the tax rules and rates that exist in the foreign markets in which they invest.
7. | Line of Credit |
The Trust (the “Borrower”) on behalf of each of the Funds has entered into a Credit Agreement (the “Credit Agreement”) with State Street Bank and Trust Company (the “Bank”). The Credit Agreement provides for a revolving credit facility of $150,000,000 (the “Facility Amount”) to be utilized for temporary or emergency purposes to fund shareholder redemptions or for other short-term liquidity purposes. Per the Credit Agreement, outstanding principal on the loan shall bear interest at a variable rate per annum equal to the higher of (a) the Federal Funds Rate as in effect on the day of the borrowing plus 1.25% and (b) the Overnight Bank Funding Rate as in effect on the day of the borrowing plus 1.25%. In addition, the Borrower shall pay to the Bank a commitment fee at the rate of 0.25% per annum on the daily unused portion of the Facility Amount. Effective July 12, 2023, the Emerging Markets Debt Blended Total Return Fund and Global Emerging Markets Equity Fund were removed from the Credit Agreement.
The Global Floating Rate Fund utilized a portion of the Facility Amount on multiple dates from the period December 2, 2022 through December 30, 2022 with an average borrowing amount of $13,035,714. The average interest rate during the period was 4.00% and total interest paid amounted to $40,523. The commitment fees made by the Funds are recorded in the accompanying Statement of Operations as Commitment & Service Expenses.
8. | Indemnifications |
Under the Funds’ organizational documents, current and former Trustees and Officers are provided with specified rights to indemnification against liabilities arising in connection with the performance of their duties to the Funds, and shareholders are indemnified against personal liability for obligations of the Funds. In the normal course of business, the Funds may also enter into contracts that provide general indemnifications. The Funds’ maximum exposure under these arrangements is unknown as this would be dependent on future claims that may be made against the Funds. The risk of material loss from such claims is considered remote.
9. | New Accounting Pronouncements |
In June 2022, FASB issued Accounting Standards Update 2022-03 — Fair Value Measurement (Topic 820) — Fair Value Measurement of Equity Securities Subject to Contractual Sale Restrictions (“ASU 2022-03”). ASU 2022-03 clarifies the guidance in Topic 820 to indicate that a contractual sale restriction should not be considered in the fair value of an equity security subject to such a restriction, and requires entities with investments in equity securities subject to contractual sale restrictions to disclose certain qualitative and quantitative information about such securities. ASU 2022-03 is effective for fiscal years, and interim periods within those fiscal years, beginning after December 15, 2023, and allows for early adoption. ASU 2022-03 will only be applicable to an equity security in which the contractual arrangement that restricts its sale is executed or modified on or after the adoption date. Management is currently evaluating the impact of applying this update.
In December 2022, FASB issued Accounting Standards Update 2022-06, “Reference Rate Reform (Topic 848): Deferral of the Sunset Date of Topic 848” (“ASU 2022-06”). ASU 2022-06 is an update of ASU 2020-04, which responded to concerns about structural risks of interbank offered rates, and particularly the risk of cessation of LIBOR. ASU 2020-04 provides optional guidance for a limited period of time to ease the potential burden in accounting for (or recognizing the effects of) reference rate reform on financial reporting. ASU 2020-04 is elective and applies to all entities, subject to meeting certain criteria, that have contracts, hedging relationships, and other transactions that reference LIBOR or another reference rate expected to be discontinued because of reference rate reform. ASU 2022-06 defers the sunset date provision included in Topic 848. The amendments in this update are effective immediately through December 31, 2024, for all entities. Management does not expect ASU 2022-06 to have a material impact on the financial statements.
88
Notes to Financial Statements (Continued) |
10. | Coronavirus (COVID-19) Pandemic |
The global pandemic outbreak of the novel coronavirus known as COVID-19 and efforts to contain its spread have produced, and may continue to produce, substantial market volatility, severe market dislocations and liquidity constraints in many markets, exchange trading suspensions and closures, higher default rates, and global business disruption, and they may result in future significant adverse effects. Such factors, and the effects of other infectious illness outbreaks, epidemics, or pandemics, may have a significant adverse effect on a Fund’s performance and have the potential to impair the ability of a Fund’s investment adviser, subadviser, or other service providers to serve the Fund and could lead to disruptions that negatively impact the Fund.
11. | Russia-Ukraine War |
In February 2022, Russia commenced a large-scale military attack on Ukraine. The outbreak of hostilities between the two countries could result in more widespread conflict and could have a severe adverse effect on the regional and the global financial markets and economies. One or more of the Funds hold positions in securities or other instruments that are economically tied to Russia. Investments in Russia are subject to political, economic, legal, market, and currency risks, as well as the risks related to the economic sanctions on Russia, Russian individuals, and Russian corporate and banking entities imposed by the United States, other countries, and certain international organizations. Such sanctions — which affect companies in many sectors, including energy, financial services, and defense, among others — could adversely affect the global energy and financial markets and, thus, could affect the value of a Fund’s investments, even beyond any direct exposure the Fund may have to Russian issuers or the adjoining geographic regions. These sanctions and any other intergovernmental actions (including retaliatory actions by the Russian government) may also result in a decline in the value and liquidity of Russian securities and a weakening of the ruble, and will impair a Fund’s ability to buy, sell, receive, or deliver Russian securities. In addition, certain transactions have been or may be prohibited and/or existing investments have or may become illiquid (e.g., because transacting in certain existing investments is prohibited), which could cause a Fund to sell other portfolio holdings at a disadvantageous time or price in order to meet shareholder redemptions.
89
To the Board of Trustees of MassMutual Advantage Funds and Shareholders of MassMutual Global Floating Rate Fund, MassMutual Global Credit Income Opportunities Fund, MassMutual Emerging Markets Debt Blended Total Return Fund, and MassMutual Global Emerging Markets Equity Fund (collectively, the “Funds”):
Opinion on the Financial Statements and Financial Highlights
We have audited the accompanying statements of assets and liabilities of the Funds, including the portfolios of investments, as of September 30, 2023, the related statements of operations for the year then ended, the statements of changes in net assets for each of the two years in the period then ended, and the financial highlights for the periods indicated in the table below, and the related notes. In our opinion, the financial statements and financial highlights present fairly, in all material respects, the financial position of each of the Funds as of September 30, 2023, and the results of their operations for the year then ended, the changes in their net assets for each of the two years in the period then ended, and the financial highlights for the periods listed in the table below, in conformity with accounting principles generally accepted in the United States of America.
Individual Fund Comprising the MassMutual | Financial Highlights |
MassMutual Global Floating Rate Fund, MassMutual Global Credit Income Opportunities Fund, and MassMutual Emerging Markets Debt Blended Total Return Fund | For each of the two years in the period ended September 30, 2023, the period from July 1, 2021 through September 30, 2021, and each of the three years in the period ended June 30, 2021. |
MassMutual Global Emerging Markets Equity Fund | For each of the two years in the period ended September 30, 2023, the period from July 1, 2021 through September 30, 2021, each of the two years in the period ended June 30, 2021, and for the period from September 17, 2018 (commencement of operations) through June 30, 2019. |
Basis for Opinion
These financial statements and financial highlights are the responsibility of the Funds’ management. Our responsibility is to express an opinion on the Funds’ financial statements and financial highlights based on our audits. We are a public accounting firm registered with the Public Company Accounting Oversight Board (United States) (PCAOB) and are required to be independent with respect to the Funds in accordance with the U.S. federal securities laws and the applicable rules and regulations of the Securities and Exchange Commission and the PCAOB.
We conducted our audits in accordance with the standards of the PCAOB. Those standards require that we plan and perform the audit to obtain reasonable assurance about whether the financial statements and financial highlights are free of material misstatement, whether due to error or fraud. The Funds are not required to have, nor were we engaged to perform, an audit of their internal control over financial reporting. As part of our audits we are required to obtain an understanding of internal control over financial reporting but not for the purpose of expressing an opinion on the effectiveness of the Funds’ internal control over financial reporting. Accordingly, we express no such opinion.
Our audits included performing procedures to assess the risks of material misstatement of the financial statements and financial highlights, whether due to error or fraud, and performing procedures that respond to those risks. Such procedures included examining, on a test basis, evidence regarding the amounts and disclosures in the financial statements and financial highlights. Our audits also included evaluating the accounting principles used and significant estimates made by management, as well as evaluating the overall presentation of the financial statements and financial highlights. Our procedures included confirmation
90
Report of Independent Registered Public Accounting Firm (Continued) |
of securities owned as of September 30, 2023, by correspondence with the custodian, brokers and agent banks; when replies were not received from brokers or agent banks, we performed other auditing procedures. We believe that our audits provide a reasonable basis for our opinion.
/s/ Deloitte & Touche LLP
Boston, Massachusetts
November 21, 2023
We have served as the auditor of one or more MassMutual investment companies since 1995.
91
The following table lists the Trust’s Trustees and Principal Officers; their address and year of birth; their position with the Trust; the length of time holding that position with the Trust; their principal occupation(s) during at least the past five years; the number of portfolios in the fund complex they oversee; and other directorships they hold in companies subject to registration or reporting requirements of the Securities Exchange Act of 1934 (generally called “public companies”) or in registered investment companies. The Trust’s Statement of Additional Information includes additional information about the Trust’s Trustees and is available, without charge, upon request by calling 1-888-309-3539 or by writing the MassMutual Funds, c/o Massachusetts Mutual Life Insurance Company, 1295 State Street, Springfield, Massachusetts 01111-0001, Attention: Investment Management Solutions.
Independent Trustees
Name, Address*, | Position(s) | Term of | Principal Occupation(s) | Number of | Other Directorships |
Allan W. Blair Year of birth: 1948 | Trustee | Since 2021 | Retired. | 110 | Trustee (since 2003), MassMutual Select Funds (open-end investment company); Trustee (since 2012), MassMutual Premier Funds (open-end investment company); Trustee (since 2003), MML Series Investment Fund (open-end investment company); Trustee (since 2012), MML Series Investment Fund II (open-end investment company). |
Nabil N. El-Hage Year of birth: 1958 | Trustee | Since 2021 | Founder and CEO (since 2018), AEE International LLC (a Puerto Rico LLC); Founder and sole member (2016-2018), PR Academy of Executive Education LLC (a Puerto Rico LLC). | 110 | Trustee (since 2012), MassMutual Select Funds (open-end investment company); Trustee (since 2003), Chairman (2006-2012), MassMutual Premier Funds (open-end investment company); Trustee (since 2012), MML Series Investment Fund (open-end investment company); Trustee (since 2005), Chairman (2006-2012), MML Series Investment Fund II (open-end investment company). |
Maria D. Furman Year of birth: 1954 | Trustee | Since 2021 | Retired. | 110 | Trustee (since 2012), MassMutual Select Funds (open-end investment company); Trustee (since 2004), MassMutual Premier Funds (open-end investment company); Trustee (since 2012), MML Series Investment Fund (open-end investment company); Trustee (since 2005), MML Series Investment Fund II (open-end investment company). |
R. Bradford Malt Year of birth: 1954 | Trustee | Since 2022 | Chairman (2004-2019), Management Committee (1993-2019), Partner (1987-2019), Associate (1979-1987), Ropes & Gray LLP (counsel to the Trust and MML Advisers). | 110 | Trustee (since 2022), MassMutual Select Funds (open-end investment company); Trustee (since 2022), MassMutual Premier Funds (open-end investment company); Trustee (since 2022), MML Series Investment Fund (open-end investment company); Trustee (since 2022), MML Series Investment Fund II (open-end investment company). |
92
Trustees and Principal Officers (Unaudited) (Continued) |
Name, Address*, | Position(s) | Term of | Principal Occupation(s) | Number of | Other Directorships |
C. Ann Merrifield Year of birth: 1951 | Trustee | Since 2021 | Retired. | 110 | Director (since 2020), Lead Director (2020-2022), Chairperson (since 2020) of the Nominating and Governance Committee, Member (since 2020) and Chairperson (2020-2022) of the Compensation Committee, and Member (2020-2022) of the Audit Committee, Lyra Therapeutics (a clinical-stage specialty pharmaceutical company); Director (since 2014), Chairperson (since 2017), Lead Director (2015-2017), Member (since 2014) and Chairperson (since 2015) of the Nominating and Governance Committee, Member (since 2019) of the Compensation Committee, and Member (2014-2019) of the Audit Committee, InVivo Therapeutics (research and clinical-stage biomaterials and biotechnology company); Trustee (since 2012), MassMutual Select Funds (open-end investment company); Trustee (since 2004), MassMutual Premier Funds (open-end investment company); Trustee (since 2012), MML Series Investment Fund (open-end investment company); Trustee (since 2005), MML Series Investment Fund II (open-end investment company). |
Cynthia R. Plouché Year of birth: 1957 | Trustee | Since 2022 | Retired; Assessor (2014-2018), Moraine Township (property assessment). | 110 | Trustee (since 2014), Northern Trust Funds (open-end investment companies); Trustee (since 2022), MassMutual Select Funds (open-end investment company); Trustee (since 2022), MassMutual Premier Funds (open-end investment company); Trustee (since 2022), MML Series Investment Fund (open-end investment company); Trustee (since 2022), MML Series Investment Fund II (open-end investment company). |
Jason J. Price Year of birth: 1973 | Trustee | Since 2022 | Co-Founder and Chairman of the Board (2017-2021), NXTHVN (arts organization). | 110 | Trustee (since 2022), MassMutual Select Funds (open-end investment company); Trustee (since 2022), MassMutual Premier Funds (open-end investment company); Trustee (since 2022), MML Series Investment Fund (open-end investment company); Trustee (since 2022), MML Series Investment Fund II (open-end investment company). |
93
Trustees and Principal Officers (Unaudited) (Continued) |
Name, Address*, | Position(s) | Term of | Principal Occupation(s) | Number of | Other Directorships |
Susan B. Sweeney Year of birth: 1952 | Chairperson
Trustee | Since 2022
Since 2021 | Retired. | 112^ | Trustee (since 2012), Barings Corporate Investors (closed-end investment company); Trustee (since 2012), Barings Participation Investors (closed-end investment company); Chairperson (since 2022), Trustee (since 2009), MassMutual Select Funds (open-end investment company); Chairperson (since 2022), Trustee (since 2012), MassMutual Premier Funds (open-end investment company); Chairperson (since 2022), Trustee (since 2009), MML Series Investment Fund (open-end investment company); Chairperson (since 2022), Trustee (since 2012), MML Series Investment Fund II (open-end investment company). |
Interested Trustees
Name, Address*, | Position(s) | Term of | Principal Occupation(s) | Number of | Other Directorships |
Paul LaPiana^^ | Trustee
President | Since 2023
2021- 2023 | Head of Brand, Product, and Affiliated Distribution (since 2023), Head of MassMutual U.S. Product (2019-2023), Head of Field Management (2016-2019), MassMutual. | 110 | Director (since 2023), President (2021-2023), MML Advisers; Trustee (since 2023), President (2021-2023), MassMutual Select Funds (open-end investment company); Trustee (since 2023), President (2021-2023), MassMutual Premier Funds (open-end investment company); Trustee (since 2023), President (2021-2023), MML Series Investment Fund (open-end investment company); Trustee (since 2023), President (2021-2023), MML Series Investment Fund II (open-end investment company). |
Clifford M. Noreen^^^ | Trustee | Since 2021 | Head of Global Investment Strategy (since 2019), Deputy Chief Investment Officer and Managing Director (2016-2018), MassMutual. | 112^ | Chairman (since 2009), Trustee (since 2005), President (2005-2009), CI Subsidiary Trust and PI Subsidiary Trust; Chairman and Trustee (since 2009), President (2005-2009), Vice President (1993-2005), Barings Corporate Investors (closed-end investment company); Chairman and Trustee (since 2009), President (2005-2009), Vice President (1993-2005),Vice President (1993-2005), Barings Participation Investors (closed-end investment company); Trustee (since 2021), MassMutual Select Funds (open-end investment company); Trustee (since 2021), MassMutual Premier Funds (open-end investment company); Trustee (since 2021), MML Series Investment Fund (open-end investment company); Trustee (since 2021), MML Series Investment Fund II (open-end investment company). |
94
Trustees and Principal Officers (Unaudited) (Continued) |
Principal Officers
Name, Address*, | Position(s) | Term of | Principal Occupation(s) | Number of |
Andrea Anastasio Year of birth: 1974 | President
Vice President
| Since 2023
2021- 2023 | President (since 2023), Vice President (2021-2023), MML Advisers; Head of Investment Management Solutions (since 2021), MassMutual; Head of Investment Strategy and Research, North America (2019-2021), Head of Investment Product Management (2016-2019), State Street Global Advisors; President (since 2023), Vice President (2021-2023), MassMutual Select Funds (open-end investment company); President (since 2023), Vice President (2021-2023), MassMutual Premier Funds (open-end investment company); President (since 2023), Vice President (2021-2023), MML Series Investment Fund (open-end investment company); President (since 2023), Vice President (2021-2023), MML Series Investment Fund II (open-end investment company). | 110 |
Andrew M. Goldberg Year of birth: 1966 | Vice President, Secretary, and Chief Legal Officer | Since 2021 | Lead Counsel, Investment Adviser & Mutual Funds (since 2018), Assistant Vice President and Counsel (2004-2018), MassMutual; Secretary (since 2015), Assistant Secretary (2013-2015), MML Advisers; Vice President, Secretary, and Chief Legal Officer (since 2008), Assistant Secretary (2001-2008), MassMutual Select Funds (open-end investment company); Vice President, Secretary (formerly known as “Clerk”), and Chief Legal Officer (since 2008), Assistant Clerk (2004-2008), MassMutual Premier Funds (open-end investment company); Vice President, Secretary, and Chief Legal Officer (since 2008), Assistant Secretary (2001-2008), MML Series Investment Fund (open-end investment company); Vice President, Secretary (formerly known as “Clerk”), and Chief Legal Officer (since 2008), Assistant Clerk (2005-2008), MML Series Investment Fund II (open-end investment company). | 110 |
Renee Hitchcock Year of birth: 1970 | Chief Financial Officer and Treasurer | Since 2021 | Head of Mutual Fund Administration (since 2018), Assistant Vice President (2015-2018), MassMutual; Chief Financial Officer and Treasurer (since 2016), Assistant Treasurer (2007-2016), MassMutual Select Funds (open-end investment company); Chief Financial Officer and Treasurer (since 2016), Assistant Treasurer (2007-2016), MassMutual Premier Funds (open-end investment company); Chief Financial Officer and Treasurer (since 2016), Assistant Treasurer (2007-2016), MML Series Investment Fund (open-end investment company); Chief Financial Officer and Treasurer (since 2016), Assistant Treasurer (2007-2016), MML Series Investment Fund II (open-end investment company). | 110 |
Jill Nareau Robert Year of birth: 1972 | Vice President and Assistant Secretary | Since 2021 | Lead Counsel, Investment Adviser & Mutual Funds (since 2018), Assistant Vice President and Counsel (2009-2018), MassMutual; Assistant Secretary (since 2015), MML Advisers; Vice President and Assistant Secretary (since 2017), Assistant Secretary (2008-2017), MassMutual Select Funds (open-end investment company); Vice President and Assistant Secretary (since 2017), Assistant Secretary (formerly known as “Assistant Clerk”) (2008-2017), MassMutual Premier Funds (open-end investment company); Vice President and Assistant Secretary (since 2017), Assistant Secretary (2008-2017), MML Series Investment Fund (open-end investment company); Vice President and Assistant Secretary (since 2017), Assistant Secretary (formerly known as “Assistant Clerk”) (2008-2017), MML Series Investment Fund II (open-end investment company). | 110 |
Douglas Steele Year of birth: 1975 | Vice President | Since 2021 | Head of Product Management (since 2021), Vice President (since 2017), Head of Manager Research (2021), Head of Investment Management (2017-2021), MML Advisers; Head of Product Management (since 2021), Head of Manager Research (2021), Head of Investment Management (2017-2021), MassMutual; Vice President (since 2016), MassMutual Select Funds (open-end investment company); Vice President (since 2016), MassMutual Premier Funds (open-end investment company); Vice President (since 2016), MML Series Investment Fund (open-end investment company); Vice President (since 2016), MML Series Investment Fund II (open-end investment company). | 110 |
95
Trustees and Principal Officers (Unaudited) (Continued) |
Name, Address*, | Position(s) | Term of | Principal Occupation(s) | Number of |
Philip S. Wellman Year of birth: 1964 | Vice President and Chief Compliance Officer | Since 2021 | Vice President and Chief Compliance Officer (since 2013), MML Advisers; Head of Mutual Funds & RIA Compliance (since 2018), Vice President, Associate General Counsel, and Chief Compliance Officer (Mutual Funds) (2014-2018), MassMutual; Vice President and Chief Compliance Officer (since 2007), MassMutual Select Funds (open-end investment company); Vice President and Chief Compliance Officer (since 2007), MassMutual Premier Funds (open-end investment company); Vice President and Chief Compliance Officer (since 2007), MML Series Investment Fund (open-end investment company); Vice President and Chief Compliance Officer (since 2007), MML Series Investment Fund II (open-end investment company). | 110 |
* | The address of each Trustee and Principal Officer is the same as that for the Trust; 1295 State Street, Springfield, Massachusetts 01111-0001. |
** | Each Trustee of the Trust serves until the next meeting of shareholders called for the purpose of electing Trustees and until the election and qualification of his or her successor or until he or she dies, resigns, or is removed. Notwithstanding the foregoing, unless the Trustees determine that it is desirable and in the best interest of the Trust that an exception to the retirement policy of the Trust be made, a Trustee shall retire and cease to serve as a Trustee upon the conclusion of the calendar year in which such Trustee attains the age of seventy-five years, however, an interested Trustee of the Trust shall no longer serve as a Trustee if or when they are no longer an employee of MassMutual or an affiliate. |
The Chairperson is elected to hold such office for a term of three years or until their successor is elected and qualified to carry out the duties and responsibilities of their office, or until he or she retires, dies, resigns, is removed, or becomes disqualified, and any such Chairperson may not serve more than two consecutive terms. The Chairperson shall hold office at the pleasure of the Trustees. |
^ | Barings Participation Investors and Barings Corporate Investors are deemed to be a part of the Fund Complex, because they are managed by Barings LLC, an affiliate of MML Advisers. |
^^ | Mr. LaPiana is an “Interested Person,” as that term is defined in the 1940 Act, as an employee of MassMutual. |
^^^ | Mr. Noreen is an “Interested Person,” as that term is defined in the 1940 Act, as an employee of MassMutual. |
# | The President, Treasurer, and Secretary and such other officers as the Trustees may in their discretion from time to time elect are elected to hold such office until their successor is elected and qualified to carry out the duties and responsibilities of their office, or until he or she dies, resigns, is removed, or becomes disqualified. Each officer shall hold office at the pleasure of the Trustees. |
96
For the year ended September 30, 2023, the following Fund(s) earned the following foreign sources of income:
Amount | ||||
Global Emerging Markets Equity Fund | $ | 252,219 | ||
Under Section 854(b)(2) of the Code, the Fund(s) hereby designate the maximum amounts as qualified dividends for purposes of the maximum rate under Section 1(h)(11) of the Code for the year ended September 30, 2023.
The Fund(s) intend to pass through the maximum amount allowable as Section 163(j) Interest Dividends as defined in the Treasury Regulations §1.163(j)-1(b).
97
A description of the policies and procedures that each Fund’s investment adviser and subadviser use to vote proxies relating to the Fund’s portfolio securities is available, without charge, upon request, by calling 1-888-309-3539, and on the Securities and Exchange Commission’s (“SEC”) EDGAR database on its website at http://www.sec.gov.
Information regarding how the Funds voted proxies relating to portfolio securities during the most recent 12-month period ended June 30 is available, without charge, upon request, on the MassMutual website at https://www.massmutual.com/funds and on the SEC’s EDGAR database on its website at http://www.sec.gov.
The Funds file their complete schedule of portfolio holdings with the SEC for the first and third quarters of each fiscal year as an exhibit to their reports on Form N-PORT. The Funds’ Forms N-PORT are available on the SEC’s EDGAR database on its website at http://www.sec.gov. In addition, the Funds make the complete schedule of portfolio holdings from their filings on Form N-PORT available to shareholders at https://www.massmutual.com/funds.
Trustees’ Approval of Investment Advisory Contracts
At their meetings in May and June 2023, the Contract Committee (the “Committee”) and the Trustees, including the Trustees who are not “interested persons” (as such term is defined in the 1940 Act) of the Trust, MML Advisers, or the subadvisers (the “Independent Trustees”), re-approved the existing advisory and subadvisory agreements (collectively, the “Contracts”) for each of the Global Floating Rate Fund, Global Credit Income Opportunities Fund, Emerging Markets Debt Blended Total Return Fund, and Global Emerging Markets Equity Fund. In preparation for the meetings, the Trustees requested, and MML Advisers and the subadvisers provided in advance, certain materials relevant to the consideration of the Contracts (the “Meeting Materials”). In all of their deliberations, the Trustees were advised by independent counsel.
The Committee received in advance of the meetings (i) a memorandum from MML Advisers discussing the nature and quality of the services it provides as investment adviser to the Funds; (ii) a profitability analysis prepared by MML Advisers; and (iii) a fee and performance study report (the “Third-Party Report”) with respect to each Fund prepared by an independent third-party vendor (the “Third-Party”). The Third-Party Report provided detailed comparative advisory fee, total expense, and performance information for each Fund to assist the Committee in its evaluation of the Contracts. The Committee also considered information presented to it throughout the year regarding MML Advisers and each of the subadvisers.
The Committee considered the nature, scope, and quality of services MML Advisers provides to the Funds, including: (i) the financial condition, stability, and business strategy of MML Advisers; (ii) the capabilities of MML Advisers with respect to regulatory compliance and its ability to monitor compliance with the investment policies of the Funds; (iii) MML Advisers’ ability to provide investment oversight and provide for administrative and shareholder services to the Funds; and (iv) the experience and qualifications of the personnel of MML Advisers that perform, or oversee the performance of, the services provided to the Funds, and the needs of the Funds for administrative and shareholder services. The Committee noted that it had received in the Meeting Materials or during the course of the past year: (i) detailed information regarding MML Advisers’ ability to provide investment oversight and provide for administrative and shareholder services to the Funds; and (ii) a wide range of information about the subadvisers and their personnel with responsibility for providing services to the Funds and the fees payable to each subadviser by MML Advisers. MML Advisers reviewed with the Committee in detail the work MML Advisers does in its oversight roles, the expertise it brings to these roles, the size of its teams, and the financial commitment it has made to provide those services.
The Committee then reviewed and considered, for each Fund separately, the detailed information presented in the Third-Party Report regarding: (i) Fund expenses, including, among other things, both the Fund’s net advisory fee and total net expense ratio against peer funds; and (ii) the Fund’s relative performance (over various time periods against funds in its “category” and a benchmark index). In connection with the Committee’s review, MML Advisers provided commentary and analysis regarding each Fund’s expenses and performance and a recommendation as to the action to be taken by the Committee. Throughout the discussion, MML Advisers responded to Committee members’ questions and provided additional information concerning each Fund.
98
Other Information (Unaudited) (Continued) |
The Committee reviewed the expense and performance information for each Fund. (References to any performance periods are to periods ended December 31, 2022, except as otherwise noted. In all cases, the comparative expense information is that of a Fund’s “peer group” and the comparative performance information is that of a Fund’s “performance category.”)
The Committee considered that the total net expense ratios for the Global Floating Rate Fund and Global Emerging Markets Equity Fund were within the top fifty and twenty percent of their peer groups, respectively. Both of the Funds had net advisory fees below the medians of their peer groups.
As to the Global Credit Income Opportunities Fund, the Committee considered MML Advisers’ statement that the Fund’s total net expense ratio and net advisory fee were each at the 70th comparative percentile of the Fund’s peer group, and that they were nine basis points and five basis points above median, respectively. The Committee further considered that MML Advisers waived twenty-five basis points during the year due to the Fund’s expense cap. The Committee considered MML Advisers’ view that the Fund’s investment strategy is unique and that the Fund has generally performed favorably, improving to the 28th comparative percentile of its performance category in the one-year period.
As to the Emerging Markets Debt Blended Total Return Fund, the Committee considered MML Advisers’ statements that the Fund’s total net expense ratio position at the 100th comparative percentile of its peer group is largely attributable to the Fund’s small size compared to the peer group, and that MML Advisers waived twenty-nine basis points during the year due to the Fund’s expense cap. The Committee considered that the Fund’s net advisory fee was in the 19th comparative percentile of its peer group and MML Advisers’ expectation that, in light of the Fund’s favorable performance, the Fund may be expected to achieve improved scale and reduced expenses with future asset growth.
The Committee determined on the basis of these factors that the levels of the Funds’ net advisory fees, in light of the total net expenses of the Funds generally, were consistent with the continuation of the Contracts.
The Committee considered that each of the Emerging Markets Debt Blended Total Return Fund and Global Floating Rate Fund achieved three-year investment performance above the median of its performance category, and the Global Credit Income Opportunities Fund was within the top sixty percent of its performance category.
As to the Global Emerging Markets Equity Fund, the Committee considered that, although the Fund had experienced three-year performance less favorable than the top sixty percent of its performance category, the Fund’s relative performance had improved for the one-year period so as to be within the top sixty percent.
The Committee determined on the basis of these factors and on other factors and information considered by the Committee that the Funds’ performance, for the various periods presented, were generally consistent with the continuation of the Contracts.
The Committee also reviewed and considered information included in the Meeting Materials, or discussed at the meeting and during the course of the year, concerning economies of scale and the profitability of MML Advisers’ advisory relationship with the various Funds, including: (i) a description of MML Advisers’ revenues from the Funds (including advisory fees and administrative and shareholder services fees, as applicable) and the expense allocation methodology employed by MML Advisers; and (ii) profitability information for each individual Fund. The discussions included consideration of the intangible benefits derived by MML Advisers and its affiliates resulting from their relationships with the Funds and any so-called “fallout benefits” to MML Advisers (which were not considered to be substantial in any event), such as any reputational value derived from serving as investment adviser to the Funds, and benefits accruing to subadvisers due to so-called “soft-dollar arrangements.”
Prior to the votes being taken to approve the Contracts, the Committee met separately in executive session to discuss the appropriateness of such contracts. The Committee weighed the foregoing matters in light of the advice given to them by their independent legal counsel as to the law applicable to the review of investment advisory contracts. In arriving at a decision, the Committee did not identify any single matter as all-important or controlling. The foregoing summary does not detail all of the matters considered.
99
Other Information (Unaudited) (Continued) |
As to each of the Funds, the Committee concluded that: (i) overall, it was satisfied with the nature, extent, and quality of services provided, and expected to be provided in the future, under the Contracts, including the level of MML Advisers’ oversight of each Fund and the subadvisory process; (ii) MML Advisers’ levels of profitability from its relationship with the various Funds are not excessive and the advisory fees payable under the advisory agreements and each Fund’s total net expenses are fair and reasonable; (iii) the investment processes, research capabilities, and philosophies of the subadvisers generally appear well suited to the Funds, given their investment objectives and policies; (iv) either the relative or absolute performance of a Fund (in each case, taking into account the applicable investment strategy and risk profile of the Fund), or the steps MML Advisers has proposed in respect of the underperformance of a Fund, are sufficient to warrant continuation of the Contracts for each of the Funds; and (v) the terms of the Contracts are fair and reasonable with respect to each Fund and are in the best interests of each Fund’s shareholders.
100
Other Information (Unaudited) (Continued) |
Fund Expenses September 30, 2023
Expense Examples:
The following information is in regards to expenses for the six months ended September 30, 2023:
As a shareholder of the Funds, you may incur two types of costs: (1) transaction costs, including sales charges (loads) on purchase payments or redemptions; and (2) ongoing costs, including investment advisory fees, distribution and/or service (12b-1) fees, and other Fund expenses. These examples are intended to help you understand your ongoing costs (in dollars) of investing in the Funds and to compare these costs with the ongoing costs of investing in other mutual funds. These examples are based on an investment of $1,000 invested for the six months ended September 30, 2023.
Actual Expenses:
The first four columns of the table below provide information about actual account values and actual expenses. You may use this information, together with the amount you invested, to estimate the expenses that you paid over the period. Simply divide your account value by $1,000 (for example, an $8,600 account value divided by $1,000 = 8.6), then multiply the result by the number under the heading entitled “Operating Expenses Incurred” to estimate the expenses you paid on your account during this period.
Hypothetical Example for Comparison Purposes:
The last two columns of the table below provide information about hypothetical account values and hypothetical expenses based on the Fund’s actual expense ratio and an assumed rate of return of 5% per year before expenses, which is not the Fund’s actual return. The hypothetical account values and expenses may not be used to estimate the actual ending account balance or expenses you paid for the period. You may use this information to compare the ongoing costs of investing in the Fund and other funds. To do so, compare this 5% hypothetical example with the 5% hypothetical examples that appear in the shareholder reports of the other funds.
Please note that the expenses shown in the table are meant to highlight your ongoing costs only and do not reflect any transactional costs. Therefore, the last two columns of the table are useful in comparing ongoing costs only, and will not help you determine the relative total costs of owning different funds. In addition, if these transactional costs were included, your costs would have been higher.
| Beginning | Annualized | Ending | Operating | Ending Value | Operating |
Global Floating Rate Fund | ||||||
Class I | $ 1,000 | 0.72% | $ 1,068.10 | $ 3.73 | $ 1,021.50 | $ 3.65 |
Class Y | 1,000 | 0.72% | 1,068.00 | 3.73 | 1,021.50 | 3.65 |
Class L | 1,000 | 0.97% | 1,066.90 | 5.03 | 1,020.20 | 4.91 |
Class C | 1,000 | 1.72% | 1,063.00 | 8.90 | 1,016.40 | 8.69 |
Global Credit Income Opportunities Fund | ||||||
Class I | 1,000 | 0.82% | 1,056.40 | 4.23 | 1,021.00 | 4.15 |
Class Y | 1,000 | 0.88% | 1,056.10 | 4.54 | 1,020.70 | 4.46 |
Class L | 1,000 | 1.14% | 1,054.70 | 5.87 | 1,019.40 | 5.77 |
Class C | 1,000 | 1.93% | 1,050.60 | 9.92 | 1,015.40 | 9.75 |
Emerging Markets Debt Blended Total Return Fund | ||||||
Class I | 1,000 | 0.96% | 1,021.70 | 4.87 | 1,020.30 | 4.86 |
Class Y | 1,000 | 0.96% | 1,021.70 | 4.87 | 1,020.30 | 4.86 |
Class L | 1,000 | 1.22% | 1,020.30 | 6.18 | 1,019.00 | 6.17 |
Class C | 1,000 | 1.96% | 1,016.60 | 9.91 | 1,015.20 | 9.90 |
101
Other Information (Unaudited) (Continued) |
| Beginning | Annualized | Ending | Operating | Ending Value | Operating |
Global Emerging Markets Equity Fund | ||||||
Class I | $ 1,000 | 0.92% | $ 939.90 | $ 4.47 | $ 1,020.50 | $ 4.66 |
Class Y | 1,000 | 0.92% | 939.90 | 4.47 | 1,020.50 | 4.66 |
Class L | 1,000 | 1.17% | 938.70 | 5.69 | 1,019.20 | 5.92 |
Class C | 1,000 | 1.93% | 935.10 | 9.36 | 1,015.40 | 9.75 |
* | Expenses are calculated using the annualized expense ratio for the six months ended September 30, 2023, multiplied by the average account value over the period, multiplied by 183 days in the period, divided by 365 days in the year, unless stated otherwise. |
102
[THIS PAGE INTENTIONALLY LEFT BLANK]
Underwriter:
MML Distributors, LLC
1295 State Street
Springfield, Massachusetts 01111-0001

© 2023 Massachusetts Mutual Life Insurance Company (MassMutual®), Springfield, MA 01111-0001. | MM202410-307187 |
| (b) | Not applicable to this filing. |
Item 2. Code of Ethics.
As of September 30, 2023, the Registrant adopted a Code of Ethics that applies to the Principal Executive Officer, Principal Financial Officer, and other senior financial officers pursuant to the Sarbanes-Oxley Act of 2002. For the year ended September 30, 2023, there were no reportable amendments to any provision of the Code of Ethics and the Registrant did not grant any waivers, including implicit waivers, from any provisions of the Code of Ethics. A copy of its Code of Ethics is filed with this Form N-CSR under Item 13(a)(1).
Item 3. Audit Committee Financial Expert.
The Registrant’s Board of Trustees has determined that Nabil N. El-Hage, a member of the Audit Committee, is an audit committee financial expert as defined by the Securities and Exchange Commission (the “SEC”). Mr. El-Hage is “independent” as defined by the SEC for purposes of audit committee financial expert determinations.
Item 4. Principal Accountant Fees and Services.
References below to Deloitte & Touche LLP include its affiliates where applicable.
On December 13, 2021, the Barings Global Floating Rate Fund, Barings Global Credit Income Opportunities Fund, Barings Emerging Markets Debt Blended Total Return Fund, and Barings Global Emerging Markets Equity Fund, each a series of the Barings Funds Trust (each, a “Predecessor Barings Fund”), were reorganized into the Registrant. The information provided below for the fiscal year ended 2022 includes fees billed by Deloitte & Touche LLP with respect to the Predecessor Barings Funds from October 1, 2021 to December 13, 2021, as applicable. The policies of the Barings Funds Trust’s audit committee applied during this period.
| (a) | AUDIT FEES: The aggregate fees billed to the Registrant for professional services rendered by its independent auditors, Deloitte & Touche LLP, for the audit of the Registrant’s annual financial statements for the fiscal years ended 2023 and 2022 were $233,560 and $65,070, respectively. |
| (b) | AUDIT RELATED FEES: No such fees were billed to the Registrant by Deloitte & Touche LLP for the fiscal years ended 2023 and 2022. The aggregate fees billed to the Registrant’s adviser and any entity controlling, controlled by, or under common control with the adviser that provides ongoing services to the Registrant by Deloitte & Touche LLP* for the fiscal years ended 2023 and 2022 were $0 and $279,879, respectively. These fees were billed to Barings LLC, the adviser to the Predecessor Barings Funds, and related to the reorganization of the Predecessor Baring Funds into the Registrant. |
| (c) | TAX FEES: The aggregate fees billed to the Registrant for professional services rendered by Deloitte & Touche LLP for the review of Form 1120-RIC, Form 8613, excise distribution projections, distribution calculation and reasonable out of pocket expenses for the fiscal years ended 2023 and 2022 were $0 and $28,020, respectively. No such fees were billed to the Registrant’s adviser and any entity controlling, controlled by, or under common control with the adviser that provides ongoing services to the Registrant by Deloitte & Touche LLP* for the fiscal years ended 2023 and 2022. |
| (d) | ALL OTHER FEES: No such fees were billed to the Registrant by Deloitte & Touche LLP for the fiscal years ended 2023 and 2022. No such fees were billed to the Registrant’s adviser and any entity controlling, controlled by, or under common control with the adviser that provides ongoing services to the Registrant by Deloitte & Touche LLP* for the fiscal years ended 2023 and 2022. |
| (e) | (1) AUDIT COMMITTEE PRE-APPROVAL POLICY: All services to be performed for the Registrant by Deloitte & Touche LLP must be pre-approved by the audit committee. All services performed during the fiscal years ended 2023 and 2022 were pre-approved by the committee. The Barings Funds Trust had its own pre-approval policy. |
(2) Not applicable.
| (f) | Not applicable. |
| (g) | The aggregate non-audit fees billed by Deloitte & Touche LLP for services rendered to the Registrant, the Registrant’s adviser and any entity controlling, controlled by, or under common control with the adviser that provides ongoing services to the Registrant, for the fiscal years ended 2023 and 2022 were $692,517 and $1,245,682, respectively. |
| (h) | The Registrant’s audit committee considers whether the provision of non-audit services by Deloitte & Touche LLP to the Registrant's adviser and any entity controlling, controlled by, or under common control with the adviser that provides ongoing services to the Registrant that were not pre-approved pursuant to paragraph (c)(7)(ii) of Rule 2-01 of Regulation S-X is compatible with maintaining Deloitte & Touche LLP's independence. |
| (i) | Not applicable. |
| (j) | Not applicable. |
| * | Refers to fees that were required to be approved by the audit committee for services that relate directly to the operations and financial reporting of the Registrant. |
Item 5. Audit Committee of Listed Registrants.
Not applicable to this filing.
Item 6. Investments.
(a) Please see portfolio of investments contained in the Report to Stockholders included under Item 1 of this form N-CSR.
(b) Not applicable to this filing.
Item 7. Disclosure of Proxy Voting Policies and Procedures for Closed-End Management Investment Companies.
Not applicable to this filing.
Item 8. Portfolio Managers of Closed-End Management Investment Companies.
Not applicable to this filing.
Item 9. Purchases of Equity Securities by Closed-End Management Investment Company and Affiliated Purchasers.
Not applicable to this filing.
Item 10. Submission of Matters to a Vote of Security Holders.
Not applicable to this filing.
Item 11. Controls and Procedures.
(a) The Registrant’s Principal Executive Officer and Principal Financial Officer have concluded that the Registrant’s disclosure controls and procedures (as defined in Rule 30a-3(c) under the Investment Company Act of 1940, as amended (the “1940 Act”) (17 CFR 270.30a-3(c))) are effective, as of a date within 90 days of the filing date of this Form N-CSR, to provide reasonable assurance that the information required to be disclosed by the Registrant on Form N-CSR is recorded, processed, summarized, and reported within the time periods specified in the SEC’s rules and forms, based on their evaluation of these disclosure controls and procedures required by Rule 30a-3(b) under the 1940 Act (17 CFR 270.30a-3(b)) and Rules 13a-15(b) or 15d-15(b) under the Securities Exchange Act of 1934 (17 CFR 240.13a-15(b) or 240.15d-15(b)).
(b) There were no changes in the Registrant’s internal control over financial reporting (as defined in Rule 30a-3(d) under the 1940 Act (17 CFR 270.30a-3(d))) that occurred during the period covered by this report that has materially affected, or is reasonably likely to materially affect, the Registrant’s internal control over financial reporting.
Item 12. Disclosure of Securities Lending Activities for Closed-End Management Investment Companies
Not applicable to this filing.
Item 13. Exhibits.
(a)(1) Code of Ethics (Item 2) is attached.
(a)(3) Not applicable to this filing.
(a)(4) Not applicable to this filing.
SIGNATURES
Pursuant to the requirements of the Securities Exchange Act of 1934 and the Investment Company Act of 1940, the registrant has duly caused this report to be signed on its behalf by the undersigned, thereunto duly authorized.
| (Registrant) | MassMutual Advantage Funds | |
| By (Signature and Title) | /s/Andrea Anastasio | |
| Andrea Anastasio, President and Principal Executive Officer | ||
| Date | 11/21/2023 |
Pursuant to the requirements of the Securities Exchange Act of 1934 and the Investment Company Act of 1940, this report has been signed below by the following persons on behalf of the registrant and in the capacities and on the dates indicated.
| By (Signature and Title) | /s/Andrea Anastasio | |
| Andrea Anastasio, President and Principal Executive Officer | ||
| Date | 11/21/2023 | |
| By (Signature and Title) | /s/ Renee Hitchcock | |
| Renée Hitchcock, Treasurer and Principal Financial Officer | ||
| Date | 11/21/2023 |