UNITED STATES
SECURITIES AND EXCHANGE COMMISSION
Washington, D.C. 20549
FORM N-CSR
CERTIFIED SHAREHOLDER REPORT OF REGISTERED
MANAGEMENT INVESTMENT COMPANIES
Investment Company Act file number 811-23665
Invesco Dynamic Credit Opportunity Fund
(Exact name of registrant as specified in charter)
1555 Peachtree Street, N.E., Suite 1800 Atlanta, Georgia 30309
(Address of principal executive offices) (Zip code)
Sheri Morris 1555 Peachtree Street, N.E., Suite 1800 Atlanta, Georgia 30309
(Name and address of agent for service)
Registrant’s telephone number, including area code: (713) 626-1919
Date of fiscal year end: 2/28
Date of reporting period: 2/28/22
| ITEM 1. | REPORTS TO STOCKHOLDERS. |
(a) The Registrant’s annual report transmitted to shareholders pursuant to Rule 30e-1 under the Investment Company Act of 1940 is as follows:
(b) Not applicable.

| | |
| | |
| Annual Report to Shareholders | | February 28, 2022 |
Invesco Dynamic Credit Opportunity Fund*
*On November 1, 2021, Common Shares of Invesco Dynamic Credit Opportunities Fund (the predecessor fund), a listed closed-end fund, were reorganized into Class AX shares of the Fund.
Nasdaq:
A: XCRTX ∎ AX: XAXCX ∎ Y: XCRRX ∎ R6: XCYOX
Management’s Discussion of Fund Performance
| | | | |
Performance summary | |
For the fiscal year ended February 28, 2022, Class A shares of Invesco Dynamic Credit Opportunity Fund (the Fund), at net asset value (NAV), outperformed the Credit Suisse Leveraged Loan Index, the Fund’s style-specific benchmark. Your Fund’s long-term performance appears later in this report. | |
Fund vs. Indexes | |
Total returns, 2/28/21 to 2/28/22, at net asset value (NAV). Performance shown does not include applicable contingent deferred sales charges (CDSC) or front-end sales charges, which would have reduced performance. | |
| |
Class A Shares | | | 10.52 | % |
| |
Class AX Shares | | | 10.80 | |
| |
Class Y Shares | | | 10.80 | |
| |
Class R6 Shares | | | 10.82 | |
Credit Suisse Leveraged Loan Index▼ (Style-Specific Index) | | | 3.24 | |
| |
Source(s): ▼Bloomberg LP | | | | |
|
The returns shown prior to November 1, 2021 are those of Invesco Dynamic Credit Opportunities Fund (the predecessor fund), a listed closed-end fund. Common Shares of the predecessor fund were reorganized into Class AX shares of the Fund on November 1, 2021. | |
Market conditions and your Fund
For the fiscal year ended February 28, 2022, the broadly syndicated loan market, as represented by the Credit Suisse Leveraged Loan Index, returned 3.24%.1 Prices briefly weakened in late November 2021 as investors first became aware of the highly transmissible coronavirus (COVID-19) Omicron variant and naturally eschewed risk assets of all stripes. However, concerns eased in December as consensus emerged that Omicron posed lower risk of severity and, thus, lowered the risk of lasting economic disruption. In late February, Russia’s invasion of Ukraine roiled investor sentiment and cast a shadow of uncertainty over markets. While loans did not entirely escape the resulting broad market volatility, loans did outperform other risk assets, like stocks and high yield bonds for the first two months of 2022 and exhibited lower relative volatility.2
Relative stability in loan prices was aided by highly supportive demand in technicals throughout the fiscal year. Demand from retail/institutional buyers and even more impactfully from record CLO formation provided a steady bid for loan assets despite the choppy macro backdrop. Ascending interest rates remained at the forefront of market discussion amid rising inflation and an increasingly hawkish US Federal Reserve (the Fed) intent on managing that inflation through tighter financial conditions. We believe rising rates would likely bode well for continued loan appetite among income-oriented investors also seeking low interest rate sensitivity in the year ahead.
Fundamentally speaking, we observed that company issuers continued to exhibit healthy balance sheets, still improving earnings and high accessibility to capital markets during the fiscal year. Collectively, these trends minimized restructuring activity in the syndicated loan market over the fiscal year. We expect much of this to continue in what we expect to
be a fairly benign default backdrop go forward.
Direct lending proved to be resilient in 2021. Performance in the asset class returned to pre-pandemic levels on the heels of a strengthening economy. As the market found its footing, deal activity accelerated while yields held to historic levels.
As we begin 2022, we remain constructive on the direct lending asset class. Although we anticipate greater volatility in the broader markets, we believe that several dynamics should work in the asset class’s favor. On the demand side, private equity continues to amass meaningful capital which should support an active and robust M&A pipeline. Against a backdrop of likely Fed policy changes and continued inflationary pressure, the floating rate structure of the asset class offers protection in a rising rate environment. Lastly, as the broader equity and credit markets continue to encounter increased volatility, direct lending’s low correlation may create needed diversification for income seeking investors.
In the near-term, we can expect supply chain constraints and labor dynamics to continue to challenge business operating models, but we anticipate these dynamics abating in the second half of the fiscal year as global supply chains ramp up production.
With inflation and rates on the move, we believe that direct lending represents an asset class with stable risk-adjusted returns, low correlation to more volatile, liquid asset classes and protection against a rising rate environment.
Within stressed and distressed credit, our primary focus is on private companies where we believe significant inefficiencies exist. Our target companies, given their size, have less access to capital than larger companies and therefore offer a more robust, evergreen opportunity set. We have found this lack of cyclicality to be true over several decades of experience
and in stark contrast to how the cycle-dependent large capitalization distressed market operates. To that end, as the economy recovers, we continue to find event-driven stressed credit opportunities globally. Distressed-for-control opportunities continue to be episodic, which is not unusual for the asset class; and special situations opportunities remain robust.
In terms of 2022 and beyond, we expect global economies to continue to recover and grow with impacts from current inflationary pressures, labor and supply shortages, commodity price increases and rising rates to abate ultimately over the long-term horizon. We are cautious in the near to medium term around these risks as well as the continued potential for COVID-19 variants to impact economic growth through exacerbation of these trends as well as the potential for lock-downs in certain geographies.
During the fiscal year, the Fund employed leverage, which allowed us to enhance the Fund’s yield while keeping credit standards high relative to the benchmark. As of the close of the fiscal year, leverage accounted for 25% of the Fund’s NAV plus borrowings. Leverage involves borrowing at a floating short-term rate and reinvesting the proceeds at a higher rate. The common thread across the Fund’s strategies (broadly syndicated loans, direct lending and stressed & distressed credit) is its focus on senior secured, floating rating loans. Unlike other fixed-income asset classes, using leverage in conjunction with loans typically does not involve the same degree of risk from rising short-term interest rates since the income from loans generally adjusts to changes in interest rates, as do the rates which determine the Fund’s borrowing costs. (Similarly, should short-term rates fall, borrowing costs also would decline.) For more information about the Fund’s use of leverage, see the Notes to Financial Statements later in this report.
The loan asset class behaves differently from many traditional fixed-income investments. The interest income generated by a portfolio of loans is usually determined by a fixed credit spread over the base rate. Because loans generally have a very short duration due to its coupons or interest rates adjusting every 30 to 90 days as the base rate changes, the yield on the portfolio adjusts. Interest rate risk refers to the tendency for traditional fixed-income prices to decline when interest rates rise. For loans, however, interest rates and income are variable and the prices of loans are therefore less sensitive to interest rate changes than traditional fixed-income bonds. If interest rates rise faster than expected, markets may experience increased volatility, which may affect the value and/or liquidity of certain of the Fund’s investments or the market price of the Fund’s shares. We are monitoring interest rates, the market and economic and geopolitical factors that may impact the direction, speed and
| | |
| 2 | | Invesco Dynamic Credit Opportunity Fund |
magnitude of changes to interest rates across the maturity spectrum, including the potential impact of monetary policy changes by the Fed and certain central banks.
Looking ahead to what we anticipate will be a multi-year period of ascending interest rates, we believe that loans can continue to offer high-income with low duration risk. If the case for loans at the start of 2021 was built on strong coupon plus upside potential from pandemic recovery, then we believe the case for loans in 2022 will be predicated upon strong coupon plus low duration sensitivity. In our view, exposure to loans can help investors not only generate strong yields for their portfolios, but also provide insulation to what we believe to be one of the key macroeconomic risks in 2022 – that of potentially significant inflation that could force the Fed to raise rates sooner and with greater magnitude than expected. For this reason, we believe loans continue to merit a core role in investors’ portfolios.
As always, we appreciate your continued participation in Invesco Dynamic Credit Opportunity Fund.
1 Source: Credit Suisse
| 2 | Source: Standard & Poor’s Leveraged Loan Index |
Portfolio manager(s):
Scott Baskind
Nuno Caetano
Thomas Ewald
Ron Kantowitz
Philip Yarrow
The views and opinions expressed in management’s discussion of Fund performance are those of Invesco Advisers, Inc. and its affiliates. These views and opinions are subject to change at any time based on factors such as market and economic conditions. These views and opinions may not be relied upon as investment advice or recommendations, or as an offer for a particular security. The information is not a complete analysis of every aspect of any market, country, industry, security or the Fund. Statements of fact are from sources considered reliable, but Invesco Advisers, Inc. makes no representation or warranty as to their completeness or accuracy. Although historical performance is no guarantee of future results, these insights may help you understand our investment management philosophy.
See important Fund and, if applicable, index disclosures later in this report.
| | |
| 3 | | Invesco Dynamic Credit Opportunity Fund |
Your Fund’s Long-Term Performance
Results of a $10,000 Investment – Oldest Share Class(es)
Fund and index data from 2/29/12
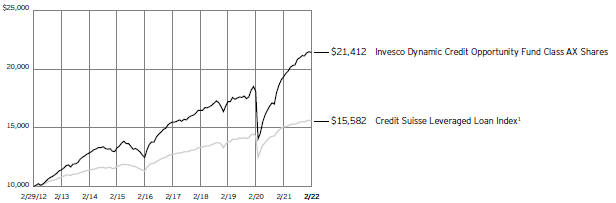
Past performance cannot guarantee future results.
The data shown in the chart include reinvested distributions, applicable sales charges and Fund expenses including management fees. Index results include reinvested dividends, but they do not reflect sales charges. Performance of the peer group, if applicable, reflects Fund expenses and management fees; performance of a market index does not.
Performance shown in the chart does not reflect deduction of taxes a shareholder would pay on Fund distributions or sale of Fund shares.
The returns shown prior to November 1, 2021 are those of Invesco Dynamic Credit Opportunities Fund (the predecessor fund), a listed closed-end fund. Common Shares of the predecessor fund were reorganized into Class AX shares of the Fund on November 1, 2021.
| | |
| 4 | | Invesco Dynamic Credit Opportunity Fund |
| | | | |
| |
Average Annual Total Returns | |
As of 2/28/22, including maximum applicable sales charges | |
Class A Shares | | | | |
10 Years | | | 7.64 | % |
5 Years | | | 6.42 | |
1 Year | | | 10.52 | |
Class AX Shares | | | | |
Inception (6/26/07) | | | 5.62 | % |
10 Years | | | 7.91 | |
5 Years | | | 6.69 | |
1 Year | | | 10.80 | |
Class Y Shares | | | | |
10 Years | | | 7.91 | % |
5 Years | | | 6.69 | |
1 Year | | | 10.80 | |
Class R6 Shares | | | | |
10 Years | | | 7.91 | % |
5 Years | | | 6.69 | |
1 Year | | | 10.82 | |
The performance data quoted represent past performance and cannot guarantee future results; current performance may be lower or higher. Please visit invesco.com/performance for the most recent month-end performance. Performance figures reflect reinvested distributions, changes in net asset value and the effect of the maximum sales charge unless otherwise stated. Performance figures do not reflect deduction of taxes a shareholder would pay on Fund distributions or sale of Fund shares. Investment return and principal value will fluctuate so that you may have a gain or loss when you sell shares.
The returns shown prior to November 1, 2021 are those of Invesco Dynamic Credit Opportunities Fund (the predecessor fund), a listed closed-end fund. Common Shares of the predecessor fund were reorganized into Class AX shares of the Fund on November 1, 2021.
Class A share performance reflects the maximum 3.25% sales charge. Class A shares, Class AX shares, Class Y shares and Class R6 shares have no early withdrawal charges, except that an early withdrawal charge of 1.00% may be imposed on certain repurchases of Class A shares made by the Fund within eighteen months of purchase upon which a sales charge was not paid; such charge is not reflected in the returns shown above. Class Y shares and Class R6 shares do not have a front-end sales charge or a CDSC, therefore performance is at net asset value.
The performance of the Fund’s share classes will differ primarily due to different sales charge structures and class expenses.
Fund performance reflects any applicable fee waivers and/or expense reimbursements. Had the adviser not waived fees and/or reimbursed expenses currently or in the past, returns would have been lower.
See current prospectus for more information.
| | |
| 5 | | Invesco Dynamic Credit Opportunity Fund |
Supplemental Information
Invesco Dynamic Credit Opportunity Fund’s investment objective is to seek a high level of current income, with a secondary objective of capital appreciation.
| ∎ | Unless otherwise stated, information presented in this report is as of February 28, 2022, and is based on total net assets. |
| ∎ | Unless otherwise noted, all data is provided by Invesco. |
| ∎ | To access your Fund’s reports/prospectus, visit invesco.com/fundreports. |
About indexes used in this report
| ∎ | The Credit Suisse Leveraged Loan Index represents tradable, senior-secured, US dollar-denominated, non-investment grade loans. |
| ∎ | The Fund is not managed to track the performance of any particular index, including the index(es) described here, and consequently, the performance of the Fund may deviate significantly from the performance of the index(es). |
| ∎ | A direct investment cannot be made in an index. Unless otherwise indicated, index results include reinvested dividends, and they do not reflect sales charges. Performance of the peer group, if applicable, reflects fund expenses; performance of a market index does not. |
| | |
This report must be accompanied or preceded by a currently effective Fund prospectus, which contains more complete information, including sales charges and expenses. Investors should read it carefully before investing. | | |
| |
NOT FDIC INSURED | MAY LOSE VALUE | NO BANK GUARANTEE | | |
| | |
| 6 | | Invesco Dynamic Credit Opportunity Fund |
Fund Information
Portfolio Composition†
| | |
| By credit quality | | % of total investments |
| |
BBB- | | 1.92% |
| |
BB | | 0.39 |
| |
BB- | | 2.32 |
| |
B+ | | 4.35 |
| |
B | | 12.70 |
| |
B- | | 17.80 |
| |
CCC+ | | 7.97 |
| |
CCC | | 3.03 |
| |
CCC- | | 1.21 |
| |
CC | | 0.18 |
| |
C | | 0.35 |
| |
D | | 1.51 |
| |
Non-Rated | | 37.94 |
| |
Equity | | 8.33 |
†Source: Standard & Poor’s. A credit rating is an assessment provided by a nationally recognized statistical rating organization (NRSRO) of the creditworthiness of an issuer with respect to debt obligations, including specific securities, money market instruments or other debts. Ratings are measured on a scale that generally ranges from AAA (highest) to D (lowest); ratings are subject to change without notice. “Non- Rated” indicates the debtor was not rated, and should not be interpreted as indicating low quality. For more information on Standard & Poor’s rating methodology, please visit standardandpoors.com and select “Understanding Ratings” under Rating Resources on the homepage.
| | |
| Top Five Debt Issuers* | | |
| |
| | | % of total net assets |
| |
1. Groundworks LLC | | 3.83% |
| |
2. Keg Logistics, LLC | | 3.70 |
| |
3. FDH Group Acquisition, Inc. | | 3.57 |
| |
4. PrimeFlight Aviation Services, Inc. | | 3.52 |
5. MB2 Dental Solutions, LLC | | 3.33 |
The Fund’s holdings are subject to change, and there is no assurance that the Fund will continue to hold any particular security.
* Excluding money market fund holdings, if any.
Data presented here are as of February 28, 2022.
| | |
| 7 | | Invesco Dynamic Credit Opportunity Fund |
Consolidated Schedule of Investments
February 28, 2022
| | | | | | | | | | | | | | | | |
| | | Interest
Rate | | | Maturity
Date | | | Principal Amount (000)(a) | | | Value | |
|
| |
Variable Rate Senior Loan Interests–116.79%(b)(c)(d) | | | | | | | | | | | | | | | | |
Aerospace & Defense–7.89% | | | | | | | | | | | | | | | | |
Aernnova Aerospace S.A.U. (Spain) | | | | | | | | | | | | | | | | |
Term Loan B-1 (3 mo. EURIBOR + 3.00%) | | | 3.00% | | | | 02/26/2027 | | | EUR | 726 | | | $ | 771,294 | |
|
| |
Term Loan B-2 (3 mo. EURIBOR + 3.00%) | | | 3.00% | | | | 02/26/2027 | | | EUR | 183 | | | | 194,735 | |
|
| |
Boeing Co., Revolver Loan(e)(f) | | | 0.00% | | | | 10/30/2022 | | | $ | 17,325 | | | | 17,195,627 | |
|
| |
Dynasty Acquisition Co., Inc. | | | | | | | | | | | | | | | | |
Term Loan B-1 (1 mo. USD LIBOR + 3.50%) | | | 3.72% | | | | 04/08/2026 | | | | 713 | | | | 693,277 | |
|
| |
Term Loan B-2 (1 mo. USD LIBOR + 3.50%) | | | 3.72% | | | | 04/08/2026 | | | | 382 | | | | 371,227 | |
|
| |
FDH Group Acquisition, Inc., Term Loan A (3 mo. USD
LIBOR + 7.00%)(e) | | | 8.00% | | | | 04/01/2024 | | | | 22,660 | | | | 22,206,671 | |
|
| |
IAP Worldwide Services, Inc.
Revolver Loan | | | | | | | | | | | | | | | | |
(Acquired 07/22/2014; Cost $1,444,403)(e)(f)(g) | | | 0.00% | | | | 07/18/2023 | | | | 1,444 | | | | 1,444,403 | |
|
| |
Second Lien Term Loan (3 mo. USD LIBOR + 6.50%)
(Acquired 07/22/2014-08/18/2014; Cost $1,551,891)(e)(g) | | | 8.00% | | | | 07/18/2023 | | | | 1,576 | | | | 1,576,247 | |
|
| |
KKR Apple Bidco LLC, Second Lien Term Loan (1 mo. USD LIBOR + 5.75%) | | | 6.25% | | | | 09/21/2029 | | | | 348 | | | | 350,697 | |
|
| |
Peraton Corp. | | | | | | | | | | | | | | | | |
First Lien Term Loan B (1 mo. USD LIBOR + 3.75%) | | | 4.50% | | | | 02/01/2028 | | | | 11 | | | | 11,238 | |
|
| |
Second Lien Term Loan (1 mo. USD LIBOR + 7.75%) | | | 8.50% | | | | 02/01/2029 | | | | 2,064 | | | | 2,090,859 | |
|
| |
Propulsion (BC) Finco S.a.r.l. (Spain), Term Loan B(e)(h) | | | - | | | | 02/10/2029 | | | | 607 | | | | 606,570 | |
|
| |
Spirit AeroSystems, Inc., Term Loan B (1 mo. USD LIBOR + 3.75%) | | | 4.25% | | | | 01/15/2025 | | | | 1,396 | | | | 1,393,227 | |
|
| |
Vectra Co., First Lien Term Loan (3 mo. USD LIBOR + 3.25%) | | | 3.46% | | | | 03/08/2025 | | | | 196 | | | | 186,272 | |
|
| |
| | | | | | | | | | | | | | | 49,092,344 | |
|
| |
| | | | |
Air Transport–3.52% | | | | | | | | | | | | | | | | |
PrimeFlight Aviation Services, Inc. | | | | | | | | | | | | | | | | |
Delayed Draw Term Loan (1 mo. USD LIBOR + 6.25%)(e) | | | 7.25% | | | | 05/09/2024 | | | | 3,194 | | | | 3,149,804 | |
|
| |
Incremental Delayed Draw Term Loan (1 mo. USD LIBOR + 6.25%)(e) | | | 7.25% | | | | 05/09/2024 | | | | 9,433 | | | | 9,300,761 | |
|
| |
Term Loan (1 mo. USD LIBOR + 6.25%)(e) | | | 7.25% | | | | 05/09/2024 | | | | 9,584 | | | | 9,449,412 | |
|
| |
| | | | | | | | | | | | | | | 21,899,977 | |
|
| |
| | | | |
Automotive–6.36% | | | | | | | | | | | | | | | | |
BCA Marketplace (United Kingdom) | | | | | | | | | | | | | | | | |
Second Lien Term Loan B (1 mo. GBP SONIA + 7.50%) | | | 7.94% | | | | 07/30/2029 | | | GBP | 4,668 | | | | 6,241,590 | |
|
| |
Term Loan B (6 mo. GBP SONIA + 4.75%) | | | 5.12% | | | | 06/30/2028 | | | GBP | 1,055 | | | | 1,396,342 | |
|
| |
DexKo Global, Inc. | | | | | | | | | | | | | | | | |
Delayed Draw Term Loan (1 mo. USD LIBOR + 3.75%) | | | 3.75% | | | | 09/30/2028 | | | | 12 | | | | 12,042 | |
|
| |
Delayed Draw Term Loan(f) | | | 0.00% | | | | 09/30/2028 | | | | 7 | | | | 6,569 | |
|
| |
Driven Holdings LLC, Term Loan B (1 mo. USD LIBOR + 3.25%)(e) | | | 3.52% | | | | 11/20/2028 | | | | 541 | | | | 537,045 | |
|
| |
Muth Mirror Systems LLC | | | | | | | | | | | | | | | | |
Revolver Loan(e)(f) | | | 0.00% | | | | 04/23/2025 | | | | 1,677 | | | | 1,620,175 | |
|
| |
Term Loan (3 mo. USD LIBOR + 5.25%)(e) | | | 6.25% | | | | 04/23/2025 | | | | 19,319 | | | | 18,662,389 | |
|
| |
Panther BF Aggregator 2 L.P. (Canada), Term Loan (1 mo. USD LIBOR + 3.25%) | | | 3.46% | | | | 04/30/2026 | | | | 25 | | | | 25,020 | |
|
| |
PowerStop LLC, Term Loan B (1 mo. USD LIBOR + 4.75%) | | | 5.25% | | | | 01/24/2029 | | | | 1,022 | | | | 1,015,926 | |
|
| |
Transtar Industries, Inc.
Delayed Draw Term Loan | | | | | | | | | | | | | | | | |
(Acquired 01/22/2021; Cost $1,196,907)(e)(f)(g) | | | 0.00% | | | | 01/22/2027 | | | | 1,224 | | | | 1,223,616 | |
|
| |
Term Loan A (3 mo. USD LIBOR + 7.00%) (Acquired 01/22/2021; Cost $8,632,432)(e)(g) | | | 8.00% | | | | 01/22/2027 | | | | 8,782 | | | | 8,825,769 | |
|
| |
| | | | | | | | | | | | | | | 39,566,483 | |
|
| |
| | | | |
Beverage & Tobacco–1.03% | | | | | | | | | | | | | | | | |
AI Aqua Merger Sub, Inc. | | | | | | | | | | | | | | | | |
Delayed Draw Term Loan(h) | | | - | | | | 07/31/2028 | | | | 488 | | | | 485,085 | |
|
| |
Incremental Term Loan(h) | | | - | | | | 07/30/2028 | | | | 2,147 | | | | 2,134,375 | |
|
| |
Arctic Glacier U.S.A., Inc., Term Loan (3 mo. USD LIBOR + 3.50%) | | | 4.50% | | | | 03/20/2024 | | | | 517 | | | | 482,267 | |
|
| |
City Brewing Co. LLC, Term Loan B (1 mo. USD LIBOR + 3.50%) | | | 4.25% | | | | 03/31/2028 | | | | 1,837 | | | | 1,740,026 | |
|
| |
See accompanying Notes to Consolidated Financial Statements which are an integral part of the financial statements.
| | |
| 8 | | Invesco Dynamic Credit Opportunity Fund |
| | | | | | | | | | | | | | | | |
| | | Interest
Rate | | | Maturity
Date | | | Principal Amount (000)(a) | | | Value | |
|
| |
Beverage & Tobacco–(continued) | | | | | | | | | | | | | | | | |
Waterlogic Holdings Ltd. (United Kingdom) | | | | | | | | | | | | | | | | |
Term Loan B (1 mo. USD LIBOR + 4.75%) | | | 5.25% | | | | 08/04/2028 | | | $ | 1,308 | | | $ | 1,303,060 | |
|
| |
Term Loan B (3 mo. EURIBOR + 4.25%) | | | 4.25% | | | | 08/04/2028 | | | EUR | 249 | | | | 279,013 | |
|
| |
| | | | | | | | | | | | | | | 6,423,826 | |
|
| |
| | | | |
Brokers, Dealers & Investment Houses–0.14% | | | | | | | | | | | | | | | | |
AqGen Island Intermediate Holdings, Inc. | | | | | | | | | | | | | | | | |
First Lien Term Loan B(h) | | | - | | | | 08/02/2028 | | | | 825 | | | | 816,969 | |
|
| |
Second Lien Term Loan B(h) | | | - | | | | 08/05/2029 | | | | 33 | | | | 32,382 | |
|
| |
| | | | | | | | | | | | | | | 849,351 | |
|
| |
| | | | |
Building & Development–1.47% | | | | | | | | | | | | | | | | |
CRH Europe Distribution (Netherlands), Term Loan A (3 mo. EURIBOR + 4.50%) | | | 4.50% | | | | 11/29/2025 | | | EUR | 773 | | | | 868,502 | |
|
| |
Icebox Holdco III, Inc. | | | | | | | | | | | | | | | | |
Delayed Draw Term Loan(f) | | | 0.00% | | | | 12/15/2028 | | | | 305 | | | | 303,310 | |
|
| |
Second Lien Term Loan (1 mo. USD LIBOR + 6.75%) | | | 7.25% | | | | 12/21/2029 | | | | 489 | | | | 489,404 | |
|
| |
Term Loan B(h) | | | - | | | | 12/22/2028 | | | | 1,476 | | | | 1,466,001 | |
|
| |
LHS Borrow LLC (Leaf Home Solutions), Term Loan B(e)(h) | | | - | | | | 02/17/2029 | | | | 2,119 | | | | 2,098,324 | |
|
| |
Mayfair Mall LLC, Term Loan(e)(h) | | | - | | | | 04/20/2023 | | | | 1,258 | | | | 1,150,974 | |
|
| |
Modulaire (United Kingdom), Term Loan B (3 mo. EURIBOR + 4.50%) | | | 4.50% | | | | 10/08/2028 | | | EUR | 1,295 | | | | 1,412,703 | |
|
| |
SRS Distribution, Inc., Incremental Term Loan(h) | | | - | | | | 06/04/2028 | | | | 392 | | | | 387,992 | |
|
| |
Werner FinCo L.P., Term Loan (3 mo. USD LIBOR + 4.00%) | | | 5.00% | | | | 07/24/2024 | | | | 972 | | | | 970,935 | |
|
| |
| | | | | | | | | | | | | | | 9,148,145 | |
|
| |
| | | | |
Business Equipment & Services–15.52% | | | | | | | | | | | | | | | | |
Aegion Corp., Term Loan B (1 mo. USD LIBOR + 4.75%) | | | 5.50% | | | | 05/17/2028 | | | | 922 | | | | 924,226 | |
|
| |
Allied Universal Holdco LLC | | | | | | | | | | | | | | | | |
Term Loan (1 mo. USD LIBOR + 3.75%) | | | 4.25% | | | | 05/12/2028 | | | | 1,201 | | | | 1,186,466 | |
|
| |
Term Loan B(h) | | | - | | | | 05/12/2028 | | | EUR | 96 | | | | 105,672 | |
|
| |
AutoScout24 (Speedster Bidco GmbH) (Germany), Second Lien Term Loan (3 mo. EURIBOR + 6.00%) | | | 6.00% | | | | 03/31/2028 | | | EUR | 3,053 | | | | 3,393,973 | |
|
| |
Blackhawk Network Holdings, Inc., Second Lien Term Loan (3 mo. USD LIBOR + 7.00%) | | | 7.13% | | | | 06/15/2026 | | | | 384 | | | | 382,536 | |
|
| |
Blucora, Inc., Term Loan (1 mo. USD LIBOR + 4.00%)(e) | | | 5.00% | | | | 05/22/2024 | | | | 718 | | | | 718,186 | |
|
| |
Checkout Holding Corp. | | | | | | | | | | | | | | | | |
PIK Term Loan, 9.50% PIK Rate, 2.00% Cash Rate (Acquired 02/15/2019-02/28/2022; Cost $ 701,280)(g)(i) | | | 9.50% | | | | 08/15/2023 | | | | 702 | | | | 299,622 | |
|
| |
Term Loan (1 mo. USD LIBOR + 7.50%) (Acquired 02/15/2019-11/12/2020; Cost $ 443,446)(g) | | | 8.50% | | | | 02/15/2023 | | | | 463 | | | | 423,536 | |
|
| |
Constant Contact, Second Lien Term Loan (1 mo. USD LIBOR +
7.50%)(e) | | | 8.25% | | | | 02/15/2029 | | | | 1,513 | | | | 1,483,184 | |
|
| |
CRCI Longhorn Holdings, Inc., Second Lien Term Loan (3 mo. USD LIBOR + 7.25%) | | | 7.43% | | | | 08/08/2026 | | | | 86 | | | | 85,919 | |
|
| |
Creation Technologies, Inc., Term Loan B (1 mo. USD LIBOR + 5.50%)(e) | | | 6.00% | | | | 10/05/2028 | | | | 1,392 | | | | 1,376,486 | |
|
| |
CV Intermediate Holdco Corp. | | | | | | | | | | | | | | | | |
Delayed Draw Term Loan (1 mo. USD LIBOR + 5.75%)(e) | | | 6.75% | | | | 03/31/2026 | | | | 8,208 | | | | 8,125,078 | |
|
| |
Revolver Loan(e)(f) | | | 0.00% | | | | 03/31/2026 | | | | 1,262 | | | | 1,248,964 | |
|
| |
Term Loan B (1 mo. USD LIBOR + 5.75%)(e) | | | 6.75% | | | | 03/31/2026 | | | | 8,453 | | | | 8,367,279 | |
|
| |
Dakota Holding Corp., Second Lien Term Loan (1 mo. USD LIBOR + 6.75%)(e) | | | 7.50% | | | | 04/07/2028 | | | | 1,249 | | | | 1,261,705 | |
|
| |
Dun & Bradstreet Corp. (The) | | | | | | | | | | | | | | | | |
Revolver Loan(e)(f) | | | 0.00% | | | | 09/11/2025 | | | | 3,814 | | | | 3,470,445 | |
|
| |
Term Loan (1 mo. USD LIBOR + 3.25%) | | | 3.46% | | | | 02/06/2026 | | | | 11 | | | | 10,864 | |
|
| |
Ensono L.P., Term Loan B (1 mo. USD LIBOR + 4.00%) | | | 4.75% | | | | 05/19/2028 | | | | 222 | | | | 220,339 | |
|
| |
Garda World Security Corp. (Canada) | | | | | | | | | | | | | | | | |
Incremental Term Loan(h) | | | - | | | | 02/11/2029 | | | | 1,508 | | | | 1,495,660 | |
|
| |
Term Loan (1 mo. USD LIBOR + 4.25%) | | | 4.43% | | | | 10/30/2026 | | | | 1,023 | | | | 1,014,531 | |
|
| |
GI Revelation Acquisition LLC, First Lien Term Loan (1 mo. USD LIBOR + 4.00%) | | | 4.50% | | | | 05/12/2028 | | | | 2,099 | | | | 2,076,372 | |
|
| |
INDIGOCYAN Midco Ltd. (Jersey), Term Loan B (3 mo. GBP LIBOR + 4.75%) | | | 5.31% | | | | 06/23/2024 | | | GBP | 8,170 | | | | 10,819,631 | |
|
| |
Karman Buyer Corp., Term Loan (1 mo. USD LIBOR + 4.50%) | | | 5.25% | | | | 10/28/2027 | | | | 2,249 | | | | 2,229,128 | |
|
| |
See accompanying Notes to Consolidated Financial Statements which are an integral part of the financial statements.
| | |
| 9 | | Invesco Dynamic Credit Opportunity Fund |
| | | | | | | | | | | | | | | | |
| | | Interest
Rate | | | Maturity
Date | | | Principal Amount (000)(a) | | | Value | |
|
| |
Business Equipment & Services–(continued) | | | | | | | | | | | | | | | | |
Lamark Media Group LLC | | | | | | | | | | | | | | | | |
Delayed Draw Term Loan(e)(f) | | | 0.00% | | | | 10/14/2027 | | | $ | 1,528 | | | $ | 1,527,935 | |
|
| |
Revolver Loan (3 mo. USD LIBOR + 5.75%)(e) | | | 6.75% | | | | 10/14/2027 | | | | 458 | | | | 453,797 | |
|
| |
Revolver Loan(e)(f) | | | 0.00% | | | | 10/14/2027 | | | | 560 | | | | 554,640 | |
|
| |
Term Loan B(e) | | | 6.75% | | | | 10/14/2027 | | | | 7,130 | | | | 7,059,061 | |
|
| |
Monitronics International, Inc. | | | | | | | | | | | | | | | | |
Term Loan (1 mo. USD LIBOR + 7.50%) | | | 8.75% | | | | 03/29/2024 | | | | 7,941 | | | | 6,671,622 | |
|
| |
Term Loan (1 mo. USD LIBOR + 5.00%) | | | 7.50% | | | | 07/03/2024 | | | | 5,859 | | | | 5,888,462 | |
|
| |
NAS LLC | | | | | | | | | | | | | | | | |
Incremental Term Loan(e) | | | 5.25% | | | | 06/03/2024 | | | | 2,815 | | | | 2,828,955 | |
|
| |
Revolver Loan (3 mo. USD LIBOR + 5.50%)(e) | | | 8.75% | | | | 06/01/2024 | | | | 184 | | | | 184,822 | |
|
| |
Revolver Loan(e)(f) | | | 0.00% | | | | 06/01/2024 | | | | 739 | | | | 739,291 | |
|
| |
Term Loan(e) | | | 7.00% | | | | 06/03/2024 | | | | 8,988 | | | | 9,032,984 | |
|
| |
Orchid Merger Sub II LLC, Term Loan B(e)(h) | | | - | | | | 05/15/2027 | | | | 2,742 | | | | 2,646,099 | |
|
| |
Protect America, Revolver Loan (1 mo. USD LIBOR + 3.00%)(e) | | | 3.18% | | | | 09/01/2024 | | | | 2,782 | | | | 2,656,738 | |
|
| |
Solera | | | | | | | | | | | | | | | | |
Term Loan B(h) | | | - | | | | 06/02/2028 | | | | 168 | | | | 166,816 | |
|
| |
Term Loan B (1 mo. GBP SONIA + 5.25%) | | | 5.69% | | | | 06/05/2028 | | | GBP | 1,393 | | | | 1,851,915 | |
|
| |
Spin Holdco, Inc., Term Loan B (1 mo. USD LIBOR + 4.00%) | | | 4.75% | | | | 03/04/2028 | | | | 20 | | | | 19,862 | |
|
| |
Thevelia (US) LLC, First Lien Term Loan B(h) | | | - | | | | 02/10/2029 | | | | 1,208 | | | | 1,196,209 | |
|
| |
UnitedLex Corp., Term Loan (1 mo. USD LIBOR + 5.75%)(e) | | | 8.00% | | | | 03/20/2027 | | | | 949 | | | | 953,925 | |
|
| |
Virtusa Corp., Incremental Term Loan B(h) | | | - | | | | 02/08/2029 | | | | 1,398 | | | | 1,386,121 | |
|
| |
| | | | | | | | | | | | | | | 96,539,056 | |
|
| |
| | | | |
Cable & Satellite Television–3.35% | | | | | | | | | | | | | | | | |
CSC Holdings LLC, Incremental Term Loan (3 mo. USD LIBOR + 2.25%) | | | 2.44% | | | | 01/15/2026 | | | | 1 | | | | 344 | |
|
| |
Lightning Finco Ltd. (United Kingdom) | | | | | | | | | | | | | | | | |
Term Loan B-1 (6 mo. USD LIBOR + 5.75%)(e) | | | 6.50% | | | | 09/01/2028 | | | | 18,375 | | | | 18,007,643 | |
|
| |
Term Loan B-2 (6 mo. USD LIBOR + 5.75%)(e) | | | 5.18% | | | | 09/01/2028 | | | | 2,227 | | | | 2,182,744 | |
|
| |
ORBCOMM, Inc., Term Loan B (1 mo. USD LIBOR + 4.25%) | | | 5.00% | | | | 09/01/2028 | | | | 684 | | | | 679,604 | |
|
| |
| | | | | | | | | | | | | | | 20,870,335 | |
|
| |
| | | | |
Chemicals & Plastics–1.67% | | | | | | | | | | | | | | | | |
Aruba Investments, Inc. | | | | | | | | | | | | | | | | |
First Lien Term Loan (1 mo. USD LIBOR + 3.75%) | | | 4.50% | | | | 11/24/2027 | | | | 127 | | | | 127,134 | |
|
| |
Second Lien Term Loan (1 mo. USD LIBOR + 7.75%) | | | 8.50% | | | | 11/24/2028 | | | | 1,459 | | | | 1,458,812 | |
|
| |
Arxada (Switzerland), Term Loan B(h) | | | - | | | | 07/03/2028 | | | | 197 | | | | 195,748 | |
|
| |
BASF Construction Chemicals (Germany), Term Loan B-3(h) | | | - | | | | 09/29/2027 | | | | 125 | | | | 125,243 | |
|
| |
Caldic B.V. (Netherlands), Term Loan B(h) | | | - | | | | 02/04/2029 | | | | 676 | | | | 671,430 | |
|
| |
Colouroz Investment LLC (Germany) | | | | | | | | | | | | | | | | |
PIK First Lien Term Loan B-2, 0.75% PIK Rate, 5.25% Cash Rate(i) | | | 0.75% | | | | 09/21/2023 | | | | 1,738 | | | | 1,724,974 | |
|
| |
PIK First Lien Term Loan C, 0.75% PIK Rate, 5.25% Cash Rate(i) | | | 0.75% | | | | 09/21/2023 | | | | 259 | | | | 256,767 | |
|
| |
PIK First Lien Term Loan, 0.75% PIK Rate, 5.00% Cash Rate(i) | | | 0.75% | | | | 09/21/2023 | | | EUR | 27 | | | | 29,958 | |
|
| |
PIK Second Lien Term Loan B-2, 5.75% PIK Rate, 5.25% Cash Rate(i) | | | 5.75% | | | | 09/21/2024 | | | | 30 | | | | 29,562 | |
|
| |
Eastman Tire Additives, Term Loan B (1 mo. USD LIBOR + 5.25%)(e) | | | 6.00% | | | | 11/01/2028 | | | | 1,293 | | | | 1,292,583 | |
|
| |
Fusion | | | | | | | | | | | | | | | | |
Term Loan (1 mo. USD LIBOR + 6.50%)(e) | | | 7.50% | | | | 12/30/2026 | | | | 1,181 | | | | 1,210,165 | |
|
| |
Term Loan B(e)(h) | | | - | | | | 02/01/2029 | | | | 784 | | | | 779,992 | |
|
| |
ICP Group Holdings LLC, Second Lien Term Loan (1 mo. USD LIBOR + 7.75%) | | | 8.50% | | | | 12/29/2028 | | | | 304 | | | | 299,807 | |
|
| |
Perstorp Holding AB (Sweden), Term Loan B (3 mo. USD LIBOR + 4.75%) | | | 4.91% | | | | 02/27/2026 | | | | 1,776 | | | | 1,775,635 | |
|
| |
Proampac PG Borrower LLC, First Lien Term Loan (1 mo. USD LIBOR + 3.75%) | | | 4.50% | | | | 11/03/2025 | | | | 428 | | | | 425,723 | |
|
| |
| | | | | | | | | | | | | | | 10,403,533 | |
|
| |
| | | | |
Clothing & Textiles–0.16% | | | | | | | | | | | | | | | | |
ABG Intermediate Holdings 2 LLC, Second Lien Term Loan (h) | | | - | | | | 12/10/2029 | | | | 654 | | | | 657,799 | |
|
| |
Gloves Buyer, Inc., Term Loan (1 mo. USD LIBOR + 4.00%) | | | 4.75% | | | | 12/29/2027 | | | | 184 | | | | 183,348 | |
|
| |
International Textile Group, Inc., First Lien Term Loan (3 mo. USD LIBOR + 5.00%) | | | 5.21% | | | | 05/01/2024 | | | | 191 | | | | 176,931 | |
|
| |
| | | | | | | | | | | | | | | 1,018,078 | |
|
| |
See accompanying Notes to Consolidated Financial Statements which are an integral part of the financial statements.
| | |
| 10 | | Invesco Dynamic Credit Opportunity Fund |
| | | | | | | | | | | | | | | | |
| | | Interest
Rate | | | Maturity
Date | | | Principal Amount (000)(a) | | | Value | |
|
| |
Conglomerates–0.32% | | | | | | | | | | | | | | | | |
APi Group DE, Inc., Incremental Term Loan (h) | | | - | | | | 01/01/2029 | | | $ | 1,280 | | | $ | 1,274,553 | |
|
| |
Safe Fleet Holdings LLC | | | | | | | | | | | | | | | | |
Second Lien Term Loan (3 mo. USD LIBOR + 6.75%) | | | 7.75% | | | | 02/02/2026 | | | | 298 | | | | 296,003 | |
|
| |
Term Loan B(h) | | | - | | | | 02/17/2029 | | | | 395 | | | | 392,005 | |
|
| |
| | | | | | | | | | | | | | | 1,962,561 | |
|
| |
| | | | |
Containers & Glass Products–6.54% | | | | | | | | | | | | | | | | |
Berlin Packaging LLC, Term Loan B-5 (1 mo. USD LIBOR + 3.75%) | | | 4.25% | | | | 03/11/2028 | | | | 1,029 | | | | 1,024,133 | |
|
| |
Brook & Whittle Holding Corp. | | | | | | | | | | | | | | | | |
Delayed Draw Term Loan (1 mo. USD LIBOR + 3.00%) | | | 6.25% | | | | 12/05/2028 | | | | 14 | | | | 14,377 | |
|
| |
Delayed Draw Term Loan(f) | | | 0.00% | | | | 12/05/2028 | | | | 138 | | | | 136,963 | |
|
| |
Term Loan B (1 mo. USD LIBOR + 4.00%) | | | 4.50% | | | | 12/05/2028 | | | | 575 | | | | 572,066 | |
|
| |
Hoffmaster Group, Inc., First Lien Term Loan B-1 (1 mo. USD LIBOR + 4.00%) | | | 5.00% | | | | 11/21/2023 | | | | 3,616 | | | | 3,382,522 | |
|
| |
Keg Logistics LLC | | | | | | | | | | | | | | | | |
Revolver Loan(e)(f) | | | 0.00% | | | | 11/23/2027 | | | | 1,862 | | | | 1,834,042 | |
|
| |
Term Loan A (1 mo. USD LIBOR + 6.00%)(e) | | | 7.00% | | | | 11/23/2027 | | | | 21,462 | | | | 21,139,765 | |
|
| |
Keter Group B.V. (Netherlands), Term Loan B-5(h) | | | - | | | | 10/01/2023 | | | EUR | 1,763 | | | | 1,943,657 | |
|
| |
Klockner Pentaplast of America, Inc. | | | | | | | | | | | | | | | | |
Term Loan B (3 mo. EURIBOR + 4.75%) | | | 4.75% | | | | 02/12/2026 | | | EUR | 2,070 | | | | 2,168,936 | |
|
| |
Term Loan B (1 mo. USD LIBOR + 4.75%) | | | 5.55% | | | | 02/12/2026 | | | | 295 | | | | 277,463 | |
|
| |
LABL, Inc. | | | | | | | | | | | | | | | | |
Term Loan B(h) | | | - | | | | 10/31/2028 | | | EUR | 2,621 | | | | 2,934,486 | |
|
| |
Term Loan B (1 mo. USD LIBOR + 5.00%) | | | 5.50% | | | | 10/31/2028 | | | | 3,199 | | | | 3,187,306 | |
|
| |
Libbey Glass, Inc., PIK Term Loan, 6.00% PIK Rate, 5.00% Cash Rate (Acquired 11/13/2020-01/13/2022; Cost $1,204,396)(g)(i) | | | 6.00% | | | | 11/12/2025 | | | | 1,301 | | | | 1,350,946 | |
|
| |
Mold-Rite Plastics LLC | | | | | | | | | | | | | | | | |
First Lien Term Loan (1 mo. USD LIBOR + 3.75%)(e) | | | 4.25% | | | | 10/04/2028 | | | | 12 | | | | 11,963 | |
|
| |
Second Lien Term Loan (1 mo. USD LIBOR + 7.00%)(e) | | | 7.50% | | | | 10/04/2029 | | | | 405 | | | | 398,735 | |
|
| |
Pretium Packaging, Second Lien Term Loan B (1 mo. USD LIBOR + 6.75%) | | | 7.25% | | | | 09/30/2029 | | | | 345 | | | | 344,412 | |
|
| |
| | | | | | | | | | | | | | | 40,721,772 | |
|
| |
| | | | |
Cosmetics & Toiletries–0.67% | | | | | | | | | | | | | | | | |
Anastasia Parent LLC, Term Loan (3 mo. USD LIBOR + 3.75%) | | | 3.97% | | | | 08/11/2025 | | | | 554 | | | | 482,902 | |
|
| |
KDC/One (Canada), Term Loan (3 mo. EURIBOR + 5.00%) | | | 5.00% | | | | 12/22/2025 | | | EUR | 692 | | | | 772,830 | |
|
| |
Rodenstock (Germany), Term Loan B (3 mo. EURIBOR + 5.00%) | | | 5.00% | | | | 06/29/2028 | | | EUR | 2,601 | | | | 2,907,582 | |
|
| |
| | | | | | | | | | | | | | | 4,163,314 | |
|
| |
| | | | |
Drugs–0.55% | | | | | | | | | | | | | | | | |
Endo LLC, Term Loan (1 mo. USD LIBOR + 5.00%) | | | 5.75% | | | | 03/27/2028 | | | | 3,504 | | | | 3,397,496 | |
|
| |
| | | | |
Ecological Services & Equipment–4.18% | | | | | | | | | | | | | | | | |
Anticimex (Sweden), Incremental Term Loan B (e)(h) | | | - | | | | 11/16/2028 | | | | 671 | | | | 666,346 | |
|
| |
Groundworks LLC | | | | | | | | | | | | | | | | |
First Lien Delayed Draw Term Loan(e) | | | 6.00% | | | | 01/17/2026 | | | | 5,797 | | | | 5,786,799 | |
|
| |
First Lien Incremental Revover Loan(e)(f) | | | 0.00% | | | | 01/17/2026 | | | | 520 | | | | 518,804 | |
|
| |
First Lien Incremental Term Loan (3 mo. USD LIBOR + 5.00%)(e) | | | 6.00% | | | | 01/17/2026 | | | | 13,160 | | | | 13,137,496 | |
|
| |
Second Lien Delayed Draw Term Loan(e) | | | 6.00% | | | | 01/17/2026 | | | | 4,404 | | | | 4,397,023 | |
|
| |
Patriot Container Corp., First Lien Term Loan (1 mo. USD LIBOR + 3.75%)(e) | | | 4.75% | | | | 03/20/2025 | | | | 1 | | | | 1,241 | |
|
| |
TruGreen L.P., Second Lien Term Loan (1 mo. USD LIBOR + 7.50%)(e) | | | 9.25% | | | | 11/02/2028 | | | | 1,509 | | | | 1,520,539 | |
|
| |
| | | | | | | | | | | | | | | 26,028,248 | |
|
| |
| | | | |
Electronics & Electrical–10.64% | | | | | | | | | | | | | | | | |
Barracuda Networks, Inc., Second Lien Term Loan (1 mo. USD LIBOR + 6.75%) | | | 7.50% | | | | 10/30/2028 | | | | 200 | | | | 200,032 | |
|
| |
Boxer Parent Co., Inc., Term Loan B (3 mo. EURIBOR + 4.00%) | | | 4.00% | | | | 10/02/2025 | | | EUR | 132 | | | | 146,641 | |
|
| |
Civica (United Kingdom), Term Loan B-1 (3 mo. GBP LIBOR + 4.75%) | | | 5.01% | | | | 10/14/2024 | | | GBP | 2,188 | | | | 2,886,632 | |
|
| |
Delta Topco, Inc., Second Lien Term Loan (1 mo. USD LIBOR + 7.25%) | | | 8.00% | | | | 12/01/2028 | | | | 637 | | | | 636,838 | |
|
| |
Devoteam (Castillon S.A.S. - Bidco) (France), Term Loan B (3 mo. EURIBOR + 4.50%) | | | 4.50% | | | | 12/09/2027 | | | EUR | 1,113 | | | | 1,245,813 | |
|
| |
Digi International, Inc., Term Loan B(h) | | | - | | | | 12/01/2028 | | | | 1,548 | | | | 1,549,989 | |
|
| |
Emerald Technologies AcquisitionCo, Inc., Term Loan B(e)(h) | | | - | | | | 12/29/2027 | | | | 313 | | | | 311,950 | |
|
| |
Hyland Software, Inc., Second Lien Term Loan (1 mo. USD LIBOR + 6.25%) | | | 7.00% | | | | 07/07/2025 | | | | 372 | | | | 375,306 | |
|
| |
See accompanying Notes to Consolidated Financial Statements which are an integral part of the financial statements.
| | |
| 11 | | Invesco Dynamic Credit Opportunity Fund |
| | | | | | | | | | | | | | |
| | | Interest
Rate | | | Maturity
Date | | | Principal Amount (000)(a) | | | Value |
Electronics & Electrical–(continued) | | | | | | | | | | | | | | |
Imperva, Inc. | | | | | | | | | | | | | | |
Second Lien Term Loan (3 mo. USD LIBOR + 7.75%) | | | 8.75% | | | | 01/11/2027 | | | $ | 1,768 | | | $ 1,771,023 |
Term Loan (3 mo. USD LIBOR + 4.00%) | | | 5.00% | | | | 01/10/2026 | | | | 106 | | | 105,637 |
| | | | |
Infinite Electronics, Second Lien Term Loan (1 mo. USD LIBOR + 7.00%) | | | 7.51% | | | | 03/02/2029 | | | | 552 | | | 552,279 |
Learning Pool (United Kingdom) | | | | | | | | | | | | | | |
Term Loan (Acquired 01/07/2022; Cost $642,046)(e)(g)(h) | | | - | | | | 08/17/2028 | | | GBP | 479 | | | 633,383 |
Term Loan 2 (Acquired 01/07/2022; Cost $623,956)(e)(g)(h) | | | - | | | | 08/17/2028 | | | | 633 | | | 623,797 |
| | | | |
LogMeIn, Term Loan B (1 mo. USD LIBOR + 4.75%) | | | 4.89% | | | | 08/28/2027 | | | | 4,185 | | | 4,123,297 |
| | | | |
Mavenir Systems, Inc., Term Loan B (1 mo. USD LIBOR + 4.75%) | | | 5.25% | | | | 08/13/2028 | | | | 2,229 | | | 2,212,573 |
| | | | |
Maverick Bidco, Inc., Second Lien Term Loan (1 mo. USD LIBOR + 6.75%)(e) | | | 7.50% | | | | 05/18/2029 | | | | 92 | | | 92,417 |
McAfee Enterprise | | | | | | | | | | | | | | |
Second Lien Term Loan (1 mo. USD LIBOR + 8.25%) | | | 9.00% | | | | 07/27/2029 | | | | 1,138 | | | 1,128,295 |
Term Loan B (1 mo. USD LIBOR + 5.00%) | | | 5.75% | | | | 07/27/2028 | | | | 3,001 | | | 2,977,789 |
McAfee LLC | | | | | | | | | | | | | | |
First Lien Term Loan B(h) | | | - | | | | 02/03/2029 | | | | 4,105 | | | 4,055,415 |
Term Loan B(h) | | | - | | | | 02/02/2029 | | | EUR | 2,658 | | | 2,949,536 |
| | | | |
Mediaocean LLC, Term Loan B (1 mo. USD LIBOR + 3.50%) | | | 4.00% | | | | 12/15/2028 | | | | 1,064 | | | 1,059,568 |
| | | | |
Natel Engineering Co., Inc., Term Loan (3 mo. USD LIBOR + 6.25%) | | | 7.25% | | | | 04/29/2026 | | | | 3,758 | | | 3,679,457 |
| | | | |
Native Instruments (Germany), Term Loan (3 mo. EURIBOR + 6.00%)(e) | | | 6.25% | | | | 03/03/2028 | | | EUR | 1,267 | | | 1,398,915 |
Oberthur Tech (France) | | | | | | | | | | | | | | |
Term Loan B-4 (3 mo. EURIBOR + 4.50%) | | | 4.50% | | | | 01/10/2026 | | | EUR | 2,899 | | | 3,237,156 |
Term Loan B-4 (3 mo. EURIBOR + 4.50%) | | | | | | | | | | | | | | |
(Acquired 07/23/2021; Cost $1,122,283)(g) | | | 4.50% | | | | 01/10/2026 | | | EUR | 956 | | | 1,066,977 |
| | | | |
Oberthur Technologies of America Corp., Term Loan B (3 mo. USD LIBOR + 4.50%) | | | | | | | | | | | | | | |
(Acquired 04/01/2021; Cost $1,071,117)(g) | | | 5.25% | | | | 01/09/2026 | | | | 1,081 | | | 1,076,784 |
Optiv, Inc. | | | | | | | | | | | | | | |
Second Lien Term Loan (3 mo. USD LIBOR + 7.25%) | | | 8.25% | | | | 01/31/2025 | | | | 773 | | | 767,423 |
Term Loan (3 mo. USD LIBOR + 3.25%) | | | 4.25% | | | | 02/01/2024 | | | | 6,455 | | | 6,389,151 |
Project Leopard Holdings, Inc. | | | | | | | | | | | | | | |
Incremental Term Loan (3 mo. USD LIBOR + 4.75%) | | | 5.75% | | | | 07/05/2024 | | | | 2,849 | | | 2,846,300 |
Term Loan (3 mo. USD LIBOR + 4.75%) | | | 5.75% | | | | 07/05/2024 | | | | 819 | | | 817,997 |
Quest Software US Holdings, Inc. | | | | | | | | | | | | | | |
Second Lien Term Loan (3 mo. SOFR + 7.50%) | | | 8.15% | | | | 01/20/2030 | | | | 219 | | | 214,583 |
Term Loan B(h) | | | - | | | | 01/19/2029 | | | | 5,063 | | | 4,999,044 |
| | | | |
RealPage, Inc., Term Loan B (1 mo. USD LIBOR + 3.25%) | | | 3.75% | | | | 04/24/2028 | | | | 269 | | | 266,894 |
| | | | |
Renaissance Holding Corp., Second Lien Term Loan (3 mo. USD LIBOR + 7.00%) | | | 7.21% | | | | 05/29/2026 | | | | 632 | | | 630,784 |
| | | | |
Riverbed Technology, Inc., PIK Term Loan, 2.00% PIK Rate, 7.00% Cash Rate | | | | | | | | | | | | | | |
(Acquired 12/06/2021-12/30/2021; Cost $7,157,207)(g)(i) | | | 2.00% | | | | 12/08/2026 | | | | 5,722 | | | 5,274,327 |
| | | | |
Sandvine Corp., Second Lien Term Loan (1 mo. USD LIBOR + 8.00%) | | | 8.21% | | | | 11/02/2026 | | | | 322 | | | 320,278 |
| | | | |
Ultimate Software Group, Inc., Second Lien Term Loan (1 mo. USD LIBOR + 5.25%) | | | 5.75% | | | | 05/03/2027 | | | | 242 | | | 241,388 |
| | | | |
UST Holdings Ltd., Term Loan B(h) | | | - | | | | 10/15/2028 | | | | 1,084 | | | 1,073,033 |
| | | | |
Veritas US, Inc., Term Loan B (1 mo. USD LIBOR + 5.00%) | | | 6.00% | | | | 09/01/2025 | | | | 707 | | | 698,927 |
| | | | |
WebPros, Term Loan (1 mo. USD LIBOR + 5.25%) | | | 5.75% | | | | 02/18/2027 | | | | 1,582 | | | 1,584,389 |
| | | | |
| | | | | | | | | | | | | | | 66,222,017 |
| | | | |
Financial Intermediaries–0.50% | | | | | | | | | | | | | | |
| | | | |
Edelman Financial Center LLC (The), Second Lien Term Loan (3 mo. USD LIBOR + 6.75%) | | | 6.96% | | | | 07/20/2026 | | | | 207 | | | 207,637 |
| | | | |
GEO Group, Inc. (The), Term Loan (3 mo. USD LIBOR + 2.00%) | | | 2.75% | | | | 03/22/2024 | | | | 108 | | | 100,203 |
| | | | |
TMF Group Holdco B.V. (Netherlands), Incremental Second Lien Term Loan (3 mo. EURIBOR + 6.88%) | | | 6.88% | | | | 05/04/2026 | | | EUR | 2,518 | | | 2,822,422 |
| | | | |
| | | | | | | | | | | | | | | 3,130,262 |
| | | | |
Food Products–6.50% | | | | | | | | | | | | | | |
Biscuit Intl (Cookie Acq S.A.S., De Banketgroep Holding) (France) | | | | | | | | | | | | | | |
First Lien Term Loan (3 mo. EURIBOR + 4.00%) | | | 4.00% | | | | 02/15/2027 | | | EUR | 2,609 | | | 2,791,689 |
Term Loan B(h) | | | - | | | | 02/14/2027 | | | EUR | 1,403 | | | 1,496,530 |
See accompanying Notes to Consolidated Financial Statements which are an integral part of the financial statements.
| | |
| 12 | | Invesco Dynamic Credit Opportunity Fund |
| | | | | | | | | | | | | | |
| | | Interest
Rate | | | Maturity
Date | | | Principal Amount (000)(a) | | | Value |
Food Products–(continued) | | | | | | | | | | | | | | |
BrightPet | | | | | | | | | | | | | | |
Delayed Draw Term Loan(e)(f) | | | 0.00% | | | | 10/05/2026 | | | $ | 1,206 | | | $ 1,206,025 |
Incremental Term Loan B (3 mo. USD LIBOR + 6.25%)(e) | | | 7.25% | | | | 10/05/2026 | | | | 4,282 | | | 4,296,294 |
Revolver Loan (3 mo. USD LIBOR + 6.25%)(e) | | | 7.25% | | | | 10/05/2026 | | | | 519 | | | 520,763 |
Revolver Loan (3 mo. USD LIBOR + 6.25%)(e) | | | 7.25% | | | | 10/05/2026 | | | | 557 | | | 558,923 |
Revolver Loan(e)(f) | | | 0.00% | | | | 10/05/2026 | | | | 347 | | | 347,175 |
Revolver Loan(e)(f) | | | 0.00% | | | | 10/05/2026 | | | | 44 | | | 44,090 |
Term Loan B (3 mo. USD LIBOR + 6.25%)(e) | | | 7.25% | | | | 10/05/2026 | | | | 4,165 | | | 4,178,877 |
Florida Food Products LLC | | | | | | | | | | | | | | |
First Lien Term Loan (1 mo. USD LIBOR + 5.00%) | | | 5.75% | | | | 10/18/2028 | | | | 4,908 | | | 4,810,379 |
Second Lien Term Loan (1 mo. USD LIBOR + 8.00%) | | | 8.75% | | | | 10/08/2029 | | | | 1,028 | | | 1,000,733 |
H-Food Holdings LLC | | | | | | | | | | | | | | |
Incremental Term Loan B-3 (1 mo. USD LIBOR + 5.00%) | | | 6.00% | | | | 05/23/2025 | | | | 164 | | | 162,205 |
Term Loan (3 mo. USD LIBOR + 3.69%) | | | 3.90% | | | | 05/23/2025 | | | | 20 | | | 19,287 |
| | | | |
Shearer’s Foods LLC, Second Lien Term Loan (1 mo. USD LIBOR + 7.75%) | | | 8.75% | | | | 09/22/2028 | | | | 223 | | | 222,650 |
| | | | |
Teasdale Foods, Inc., Term Loan B (3 mo. USD LIBOR + 6.00%)(e) | | | 7.00% | | | | 12/18/2025 | | | | 16,438 | | | 15,075,593 |
| | | | |
Valeo Foods (Jersey) Ltd. (United Kingdom), First Lien Term Loan B (6 mo. GBP SONIA + 5.00%) | | | 5.05% | | | | 06/28/2028 | | | GBP | 2,805 | | | 3,715,519 |
| | | | |
| | | | | | | | | | | | | | | 40,446,732 |
| | | | |
Food Service–0.34% | | | | | | | | | | | | | | |
| | | | |
Financiere Pax S.A.S., Term Loan B (3 mo. EURIBOR + 4.75%) | | | 4.75% | | | | 07/01/2026 | | | EUR | 2,011 | | | 2,083,134 |
| | | | |
NPC International, Inc., Second Lien Term Loan(j)(k) | | | 0.00% | | | | 04/18/2025 | | | | 344 | | | 6,878 |
| | | | |
| | | | | | | | | | | | | | | 2,090,012 |
| | | | |
Health Care–8.11% | | | | | | | | | | | | | | |
Acacium (United Kingdom) | | | | | | | | | | | | | | |
Term Loan (6 mo. GBP SONIA + 5.25%) | | | 5.69% | | | | 05/19/2028 | | | GBP | 3,083 | | | 4,112,360 |
Term Loan(e)(h) | | | - | | | | 06/08/2028 | | | | 955 | | | 945,660 |
Ascend Learning LLC | | | | | | | | | | | | | | |
First Lien Term Loan(h) | | | - | | | | 11/18/2028 | | | | 190 | | | 187,394 |
Second Lien Term Loan (1 mo. USD LIBOR + 5.75%) | | | 6.25% | | | | 12/10/2029 | | | | 646 | | | 646,758 |
athenahealth, Inc. | | | | | | | | | | | | | | |
Delayed Draw Term Loan B(f) | | | 0.00% | | | | 02/15/2029 | | | | 898 | | | 891,209 |
Term Loan B(h) | | | - | | | | 01/26/2029 | | | | 5,300 | | | 5,258,132 |
| | | | |
Curium BidCo S.a.r.l. (Luxembourg), Term Loan (1 mo. USD LIBOR + 4.25%) | | | 5.00% | | | | 12/02/2027 | | | | 315 | | | 312,743 |
| | | | |
Ethypharm (France), Term Loan B (3 mo. GBP SONIA + 4.50%) | | | 4.79% | | | | 04/17/2028 | | | GBP | 2,270 | | | 2,920,674 |
Global Medical Response, Inc. | | | | | | | | | | | | | | |
Term Loan (3 mo. USD LIBOR + 4.25%) | | | 5.25% | | | | 03/14/2025 | | | | 1,134 | | | 1,130,545 |
Term Loan (1 mo. USD LIBOR + 4.25%) | | | 5.25% | | | | 10/02/2025 | | | | 738 | | | 735,346 |
| | | | |
ICU Medical, Inc., Term Loan B(h) | | | - | | | | 12/15/2028 | | | | 183 | | | 181,762 |
MB2 Dental Solutions LLC | | | | | | | | | | | | | | |
Delayed Draw Term Loan (3 mo. USD LIBOR + 6.00%)(e) | | | 7.00% | | | | 01/29/2027 | | | | 8,731 | | | 8,739,303 |
Delayed Draw Term Loan (3 mo. USD LIBOR + 6.00%)(e) | | | 7.00% | | | | 01/29/2027 | | | | 3,151 | | | 3,153,680 |
Term Loan B (3 mo. USD LIBOR + 6.00%)(e) | | | 7.00% | | | | 01/29/2027 | | | | 8,761 | | | 8,769,216 |
MedAssets Software Intermediate Holdings, Inc. | | | | | | | | | | | | | | |
First Lien Term Loan (1 mo. USD LIBOR + 4.00%) | | | 4.50% | | | | 11/19/2028 | | | | 1,695 | | | 1,686,642 |
Second Lien Term Loan (1 mo. USD LIBOR + 6.75%) | | | 7.25% | | | | 11/22/2029 | | | | 638 | | | 632,704 |
| | | | |
MJH Healthcare Holdings LLC, Term Loan B(e)(h) | | | - | | | | 01/25/2029 | | | | 735 | | | 730,351 |
| | | | |
Nidda Healthcare Holding AG (Germany), Term Loan F (3 mo. GBP SONIA + 4.50%) | | | 4.95% | | | | 08/21/2026 | | | GBP | 2,088 | | | 2,730,621 |
| | | | |
Revint Intermediate II LLC, Term Loan (1 mo. USD LIBOR + 4.25%) | | | 4.75% | | | | 10/15/2027 | | | | 1,924 | | | 1,921,202 |
| | | | |
Sharp Midco LLC, Term Loan B (1 mo. USD LIBOR + 4.00%)(e) | | | 4.50% | | | | 12/15/2028 | | | | 550 | | | 548,368 |
| | | | |
Stamina BidCo B.V. (Netherlands), Term Loan B (3 mo. EURIBOR + 4.50%) | | | 4.50% | | | | 11/02/2028 | | | EUR | 631 | | | 704,219 |
| | | | |
Summit Behavioral Healthcare LLC, First Lien Term Loan (1 mo. USD LIBOR + 4.75%)(e) | | | 5.50% | | | | 11/24/2028 | | | | 2,112 | | | 2,072,277 |
| | | | |
TTF Holdings LLC, Term Loan B (1 mo. USD LIBOR + 4.25%)(e) | | | 5.00% | | | | 03/31/2028 | | | | 411 | | | 409,745 |
| | | | |
Unified Womens Healthcare L.P., Term Loan B (1 mo. USD LIBOR + 4.25%) | | | 5.00% | | | | 12/17/2027 | | | | 583 | | | 581,868 |
| | | | |
Women’s Care Holdings, Inc. LLC, Second Lien Term Loan (1 mo. USD LIBOR + 8.25%) | | | 9.00% | | | | 01/15/2029 | | | | 431 | | | 430,159 |
| | | | |
| | | | | | | | | | | | | | | 50,432,938 |
See accompanying Notes to Consolidated Financial Statements which are an integral part of the financial statements.
| | |
| 13 | | Invesco Dynamic Credit Opportunity Fund |
| | | | | | | | | | | | | | |
| | | Interest
Rate | | | Maturity
Date | | | Principal Amount (000)(a) | | | Value |
Home Furnishings–2.39% | | | | | | | | | | | | | | |
Hilding Anders AB (Sweden) | | | | | | | | | | | | | | |
PIK Term Loan, 12.00% PIK Rate(i) | | | 12.00% | | | | 12/31/2024 | | | EUR | 34 | | | $ 7,947 |
Term Loan | | | 0.00% | | | | 12/31/2024 | | | EUR | 5,480 | | | 61,527 |
Term Loan B (3 mo. EURIBOR + 5.00%) | | | 5.00% | | | | 11/29/2024 | | | EUR | 9,013 | | | 7,516,067 |
| | | | |
Hunter Douglas, Inc., First Lien Term Loan(h) | | | - | | | | 02/09/2029 | | | EUR | 2,060 | | | 2,295,850 |
Serta Simmons Bedding LLC | | | | | | | | | | | | | | |
First Lien Term Loan (1 mo. USD LIBOR + 7.50%) | | | 7.69% | | | | 08/10/2023 | | | $ | 1,281 | | | 1,293,116 |
Second Lien Term Loan (1 mo. USD LIBOR + 7.50%) | | | 8.50% | | | | 08/10/2023 | | | | 3,200 | | | 3,087,547 |
| | | | |
VC GB Holdings, Inc., Second Lien Term Loan (1 mo. USD LIBOR + 6.75%) | | | 7.25% | | | | 07/01/2029 | | | | 566 | | | 551,380 |
| | | | |
Weber-Stephen Products LLC, Incremental Term Loan(e)(h) | | | - | | | | 10/30/2027 | | | | 74 | | | 71,833 |
| | | | |
| | | | | | | | | | | | | | | 14,885,267 |
| | | | |
Industrial Equipment–3.39% | | | | | | | | | | | | | | |
| | | | |
Apex Tool Group LLC, Term Loan B (1 mo. SOFR + 5.50%) | | | 5.75% | | | | 02/08/2029 | | | | 1,280 | | | 1,276,211 |
Brush (United Kingdom) | | | | | | | | | | | | | | |
Term Loan (3 mo. EURIBOR + 7.00%)(e) | | | 7.00% | | | | 06/09/2028 | | | EUR | 4,208 | | | 4,618,165 |
Term Loan A (1 mo. GBP SONIA +7.00%)(e) | | | 7.27% | | | | 06/09/2028 | | | GBP | 3,621 | | | 4,760,905 |
| | | | |
CIRCOR International, Inc., Term Loan(h) | | | - | | | | 12/20/2028 | | | | 1,187 | | | 1,180,430 |
| | | | |
DXP Enterprises, Inc., Term Loan (1 mo. USD LIBOR + 4.75%) | | | 5.75% | | | | 12/16/2027 | | | | 616 | | | 613,293 |
| | | | |
Engineered Machinery Holdings, Inc., Second Lien Incremental Term Loan (1 mo. USD LIBOR + 6.00%) | | | 6.75% | | | | 05/21/2029 | | | | 207 | | | 208,663 |
Kantar (United Kingdom) | | | | | | | | | | | | | | |
Revolver Loan(e)(f) | | | 0.00% | | | | 06/04/2026 | | | | 2,500 | | | 2,300,000 |
Term Loan B (1 mo. USD LIBOR + 5.00%) | | | 5.18% | | | | 12/04/2026 | | | | 1,474 | | | 1,469,079 |
Term Loan B-2 (1 mo. USD LIBOR + 4.50%) | | | 5.25% | | | | 12/04/2026 | | | | 1,380 | | | 1,374,351 |
| | | | |
New VAC US LLC, Term Loan B (3 mo. USD LIBOR + 4.00%) | | | 5.00% | | | | 03/08/2025 | | | | 1,265 | | | 1,241,438 |
| | | | |
Robertshaw US Holding Corp., Second Lien Term Loan (3 mo. USD LIBOR + 8.00%) | | | 9.00% | | | | 02/28/2026 | | | | 613 | | | 482,759 |
| | | | |
S2P Acquisiton Borrower, Inc., First Lien Term Loan (3 mo. USD LIBOR + 4.00%) | | | 4.21% | | | | 08/14/2026 | | | | 488 | | | 485,716 |
| | | | |
Thyssenkrupp Elevators (Vertical Midco GmbH) (Germany), Term Loan B (1 mo. USD LIBOR + 3.50%) | | | 4.00% | | | | 07/31/2027 | | | | 860 | | | 855,811 |
| | | | |
Victory Buyer LLC, Second Lien Term Loan B(e)(h) | | | - | | | | 11/15/2029 | | | | 259 | | | 255,867 |
| | | | |
| | | | | | | | | | | | | | | 21,122,688 |
| | | | |
Leisure Goods, Activities & Movies–11.80% | | | | | | | | | | | | | | |
| | | | |
AMC Entertainment, Inc., Term Loan B-1 (3 mo. USD LIBOR + 3.00%) | | | 3.12% | | | | 04/22/2026 | | | | 4,693 | | | 4,268,954 |
| | | | |
Carnival Corp., Incremental Term Loan (1 mo. USD LIBOR + 3.25%) | | | 4.00% | | | | 10/18/2028 | | | | 4,760 | | | 4,714,162 |
Crown Finance US, Inc. | | | | | | | | | | | | | | |
Incremental Term Loan (1 mo. USD LIBOR + 8.25%) | | | 9.25% | | | | 05/23/2024 | | | | 429 | | | 457,134 |
Revolver Loan (3 mo. USD LIBOR + 5.00%) | | | 5.49% | | | | 05/23/2024 | | | | 796 | | | 770,245 |
Term Loan (3 mo. EURIBOR + 2.63%) | | | 2.63% | | | | 02/28/2025 | | | EUR | 457 | | | 398,779 |
Term Loan (1 mo. USD LIBOR + 2.50%) | | | 3.50% | | | | 02/28/2025 | | | | 3,205 | | | 2,490,169 |
Term Loan (1 mo. USD LIBOR + 2.75%) | | | 3.75% | | | | 09/30/2026 | | | | 2,733 | | | 2,066,640 |
Term Loan B-1 (3 mo. USD LIBOR + 7.00%) | | | 7.00% | | | | 05/23/2024 | | | | 4,071 | | | 4,826,157 |
| | | | |
Dorna Sports S.L. (Spain), Term Loan B-2 (3 mo. USD LIBOR + 3.00%) | | | | | | | | | | | | | | |
(Acquired 01/28/2021; Cost $875,838)(g) | | | 3.22% | | | | 04/12/2024 | | | | 890 | | | 889,846 |
| | | | |
Fitness International LLC, Term Loan B (3 mo. USD LIBOR + 3.25%) | | | 4.25% | | | | 04/18/2025 | | | | 1,106 | | | 1,033,183 |
| | | | |
Hornblower Holdings LLC, Term Loan(h) | | | - | | | | 11/25/2025 | | | | 440 | | | 456,557 |
Invictus Media S.L.U. (Spain) | | | | | | | | | | | | | | |
Revolver Loan (Acquired 04/30/2021; Cost $1,141,475)(e)(g)(k) | | | 0.00% | | | | 06/28/2024 | | | EUR | 1,079 | | | 1,190,729 |
Second Lien Term Loan (Acquired 05/17/2021-06/28/2021; Cost $2,692,619)(g)(k) | | | 0.00% | | | | 12/26/2025 | | | EUR | 3,197 | | | 3,136,050 |
Term Loan A-1 (Acquired 07/24/2019-06/28/2021; Cost $2,667,494)(g)(k) | | | 0.00% | | | | 06/26/2024 | | | EUR | 2,386 | | | 2,640,950 |
Term Loan A-2 (Acquired 07/24/2019-06/28/2021; Cost $649,817)(g)(k) | | | 0.00% | | | | 06/26/2024 | | | EUR | 582 | | | 644,136 |
Term Loan B-1 (Acquired 05/31/2018-07/28/2021; Cost $3,038,283)(g)(k) | | | 0.00% | | | | 06/26/2025 | | | EUR | 2,676 | | | 2,962,283 |
Term Loan B-2 (Acquired 05/31/2018-07/28/2021; Cost $1,824,544)(g)(k) | | | 0.00% | | | | 06/26/2025 | | | EUR | 1,603 | | | 1,774,290 |
See accompanying Notes to Consolidated Financial Statements which are an integral part of the financial statements.
| | |
| 14 | | Invesco Dynamic Credit Opportunity Fund |
| | | | | | | | | | | | | | |
| | | Interest
Rate | | | Maturity
Date | | | Principal
Amount (000)(a) | | | Value |
Leisure Goods, Activities & Movies–(continued) | | | | | | | | | | | | | | |
Merlin (Motion Finco S.a.r.l. and LLC) (United Kingdom) | | | | | | | | | | | | | | |
Term Loan B-1 (1 mo. USD LIBOR + 3.25%) | | | 3.47% | | | | 11/12/2026 | | | $ | 161 | | | $ 158,326 |
Term Loan B-2 (1 mo. USD LIBOR + 3.25%) | | | 3.47% | | | | 11/12/2026 | | | | 19 | | | 18,760 |
Parques Reunidos (Spain) | | | | | | | | | | | | | | |
Incremental Term Loan B-2 (3 mo. EURIBOR + 7.50%) | | | 7.50% | | | | 09/17/2026 | | | EUR | 9,376 | | | 10,579,799 |
Revolver Loan(e)(h) | | | - | | | | 03/16/2026 | | | EUR | 529 | | | 530,783 |
Revolver Loan(e)(f) | | | 0.00% | | | | 03/16/2026 | | | EUR | 1,930 | | | 1,936,679 |
Term Loan B (3 mo. EURIBOR + 3.75%) | | | 3.75% | | | | 09/16/2026 | | | EUR | 1,442 | | | 1,579,090 |
Royal Caribbean Cruises | | | | | | | | | | | | | | |
Revolver Loan(f) | | | 0.00% | | | | 10/12/2022 | | | | 1,886 | | | 1,850,714 |
Revolver Loan(f) | | | 0.00% | | | | 04/05/2024 | | | | 3,562 | | | 3,281,750 |
Revolver Loan(e)(f) | | | 0.00% | | | | 04/12/2024 | | | | 1,213 | | | 1,125,101 |
Term Loan(h) | | | - | | | | 04/05/2022 | | | | 1,136 | | | 1,130,726 |
Scenic (Columbus Capital B.V.) (Australia), Term Loan B (3 mo. EURIBOR + 3.75%) | | | 3.75% | | | | 02/27/2027 | | | EUR | 1,200 | | | 1,263,496 |
USF S&H Holdco LLC | | | | | | | | | | | | | | |
Term Loan A (3 mo. USD LIBOR + 15.00%)(e) | | | 15.00% | | | | 06/30/2025 | | | | 667 | | | 666,853 |
Term Loan A(e)(f) | | | 0.00% | | | | 06/30/2025 | | | | 1,000 | | | 1,000,278 |
Term Loan B (3 mo. USD LIBOR + 3.00%)(e) | | | 8.50% | | | | 06/30/2025 | | | | 10,678 | | | 10,677,541 |
Vue International Bidco PLC (United Kingdom), Term Loan B-1 (3 mo. EURIBOR + 4.75%) | | | 4.75% | | | | 07/03/2026 | | | EUR | 2,791 | | | 2,918,729 |
| | | | | | | | | | | | | | | 73,438,889 |
| | | | |
Lodging & Casinos–4.49% | | | | | | | | | | | | | | |
Aimbridge Acquisition Co., Inc., First Lien Term Loan (1 mo. USD LIBOR + 4.75%) | | | 5.50% | | | | 02/02/2026 | | | | 1,971 | | | 1,959,994 |
B&B Hotels S.A.S. (France) | | | | | | | | | | | | | | |
Second Lien Term Loan A-1 (3 mo. EURIBOR + 8.50%) | | | 8.50% | | | | 07/31/2027 | | | EUR | 2,217 | | | 2,371,042 |
Term Loan B-3-A (3 mo. EURIBOR + 3.88%) | | | 3.88% | | | | 07/31/2026 | | | EUR | 2,821 | | | 3,049,261 |
Term Loan B-4 (6 mo. EURIBOR + 5.50%) | | | 5.50% | | | | 07/31/2026 | | | EUR | 2,619 | | | 2,930,814 |
Caesars Resort Collection LLC, Incremental Term Loan (1 mo. USD LIBOR + 3.50%) | | | 3.71% | | | | 07/21/2025 | | | | 68 | | | 67,602 |
Everi Payments, Inc., Term Loan (1 mo. USD LIBOR + 2.50%) | | | 3.01% | | | | 07/31/2028 | | | | 180 | | | 178,542 |
Fertitta Entertainment LLC, Term Loan (SOFR + 4.00%) | | | 4.50% | | | | 01/31/2029 | | | | 456 | | | 454,294 |
HotelBeds (United Kingdom) | | | | | | | | | | | | | | |
Term Loan B (6 mo. EURIBOR + 4.25%) | | | 4.25% | | | | 09/12/2025 | | | EUR | 6,321 | | | 6,555,026 |
Term Loan C (6 mo. EURIBOR + 4.50%) | | | 4.50% | | | | 09/12/2027 | | | EUR | 937 | | | 972,933 |
Term Loan D (3 mo. EURIBOR + 5.50%) | | | 5.50% | | | | 09/12/2027 | | | EUR | 5,774 | | | 6,061,072 |
Scientific Games Lottery | | | | | | | | | | | | | | |
Term Loan B(h) | | | - | | | | 01/31/2029 | | | EUR | 1,354 | | | 1,509,129 |
Term Loan B(h) | | | - | | | | 02/04/2029 | | | | 1,814 | | | 1,805,367 |
| | | | | | | | | | | | | | | 27,915,076 |
| | | | |
Nonferrous Metals & Minerals–0.76% | | | | | | | | | | | | | | |
American Rock Salt Co. LLC, Second Lien Term Loan (1 mo. USD LIBOR +
7.25%)(e) | | | 8.00% | | | | 06/11/2029 | | | | 96 | | | 96,669 |
Corialis Group Ltd. (United Kingdom), Term Loan B (1 mo. GBP SONIA + 4.40%) | | | 4.66% | | | | 05/24/2028 | | | GBP | 678 | | | 890,682 |
Form Technologies LLC | | | | | | | | | | | | | | |
Term Loan (1 mo. USD LIBOR + 4.50%) | | | 5.50% | | | | 07/19/2025 | | | | 2,584 | | | 2,577,987 |
Term Loan (1 mo. USD LIBOR + 9.00%)(e) | | | 10.00% | | | | 10/22/2025 | | | | 1,137 | | | 1,150,850 |
| | | | | | | | | | | | | | | 4,716,188 |
| | | | |
Oil & Gas–3.16% | | | | | | | | | | | | | | |
Glass Mountain Pipeline Holdings LLC, Term Loan (1 mo. USD LIBOR + 4.50%) | | | 5.50% | | | | 10/28/2027 | | | | 284 | | | 252,520 |
Gulf Finance LLC, Term Loan (1 mo. USD LIBOR + 6.75%) | | | 7.75% | | | | 08/25/2026 | | | | 2,090 | | | 1,941,964 |
HGIM Corp., Term Loan (3 mo. USD LIBOR + 6.00%)
(Acquired 07/02/2018; Cost $3,232,960)(g) | | | 7.00% | | | | 07/02/2023 | | | | 1,469 | | | 1,424,571 |
McDermott International Ltd. | | | | | | | | | | | | | | |
LOC(f) | | | 0.00% | | | | 06/30/2024 | | | | 4,083 | | | 3,368,716 |
LOC (3 mo. USD LIBOR + 4.00%) (Acquired 12/31/2020; Cost $1,782,599)(e)(g) | | | 4.09% | | | | 06/30/2024 | | | | 1,801 | | | 1,504,073 |
PIK Term Loan, 3.00% PIK Rate, 1.21% Cash Rate (Acquired 04/04/2018-02/28/2022; Cost $1,821,728)(g)(i) | | | 3.00% | | | | 06/30/2025 | | | | 927 | | | 443,870 |
Term Loan (1 mo. USD LIBOR + 3.00%) (Acquired 06/30/2020; Cost $183,612)(e)(g) | | | 3.21% | | | | 06/30/2024 | | | | 180 | | | 112,599 |
See accompanying Notes to Consolidated Financial Statements which are an integral part of the financial statements.
| | |
| 15 | | Invesco Dynamic Credit Opportunity Fund |
| | | | | | | | | | | | | | |
| | | Interest
Rate | | | Maturity
Date | | | Principal
Amount (000)(a) | | | Value |
Oil & Gas–(continued) | | | | | | | | | | | | | | |
Petroleum GEO-Services ASA (Norway), Term Loan (1 mo. USD LIBOR + 7.50%) | | | 7.72% | | | | 03/19/2024 | | | $ | 5,643 | | | $ 4,916,116 |
QuarterNorth Energy, Inc., Second Lien Term Loan (1 mo. USD LIBOR + 8.00%)
(Acquired 08/03/2021; Cost $5,449,641)(g) | | | 9.00% | | | | 08/27/2026 | | | | 5,552 | | | 5,593,279 |
Southcross Energy Partners L.P., Revolver Loan(f) | | | 0.00% | | | | 01/31/2025 | | | | 78 | | | 76,270 |
| | | | | | | | | | | | | | | 19,633,978 |
| | | | |
Publishing–2.30% | | | | | | | | | | | | | | |
Adtalem Global Education, Inc., Term Loan B (1 mo. USD LIBOR + 4.50%) | | | 5.25% | | | | 08/12/2028 | | | | 812 | | | 805,354 |
Cengage Learning, Inc., Term Loan B (1 mo. USD LIBOR + 4.75%) | | | 5.75% | | | | 06/29/2026 | | | | 3,393 | | | 3,392,296 |
Dotdash Meredith, Inc., Term Loan B (1 mo. SOFR + 4.00%) | | | 4.50% | | | | 11/25/2028 | | | | 3,489 | | | 3,475,414 |
McGraw-Hill Education, Inc., Term Loan B (1 mo. USD LIBOR + 4.75%) | | | 5.55% | | | | 07/30/2028 | | | | 3,612 | | | 3,582,951 |
Micro Holding L.P., Term Loan (1 mo. USD LIBOR + 3.75%) | | | 4.75% | | | | 09/13/2024 | | | | 3,052 | | | 3,035,686 |
| | | | | | | | | | | | | | | 14,291,701 |
| | | | |
Radio & Television–0.16% | | | | | | | | | | | | | | |
Diamond Sports Holdings LLC, Term Loan B (1 mo. USD LIBOR + 3.25%) | | | 5.50% | | | | 08/24/2026 | | | | 2,608 | | | 990,295 |
Nexstar Broadcasting, Inc., Term Loan B-4 (1 mo. USD LIBOR + 2.50%) | | | 2.61% | | | | 09/18/2026 | | | | 1 | | | 537 |
| | | | | | | | | | | | | | | 990,832 |
| | | | |
Retailers (except Food & Drug)–1.89% | | | | | | | | | | | | | | |
Bass Pro Group LLC, Term Loan B-2 (1 mo. USD LIBOR + 3.75%) | | | 4.50% | | | | 03/06/2028 | | | | 285 | | | 284,059 |
Claire’s Stores, Inc., Term Loan (1 mo. USD LIBOR + 6.50%) | | | 6.71% | | | | 12/18/2026 | | | | 733 | | | 727,566 |
CNT Holdings I Corp. (1-800 Contacts), Second Lien Term Loan (1 mo. USD LIBOR + 6.75%) | | | 7.50% | | | | 11/06/2028 | | | | 712 | | | 710,857 |
Kirk Beauty One GmbH (Germany) | | | | | | | | | | | | | | |
Term Loan B-1 (3 mo. EURIBOR + 5.50%) | | | 5.50% | | | | 04/08/2026 | | | EUR | 1,621 | | | 1,769,806 |
Term Loan B-2 (3 mo. EURIBOR + 5.50%) | | | 5.50% | | | | 04/08/2026 | | | EUR | 933 | | | 1,018,967 |
Term Loan B-3 (3 mo. EURIBOR + 5.50%) | | | 5.50% | | | | 04/08/2026 | | | EUR | 1,351 | | | 1,474,599 |
Term Loan B-4 (3 mo. EURIBOR + 5.50%) | | | 5.50% | | | | 04/08/2026 | | | EUR | 2,863 | | | 3,126,289 |
Term Loan B-5 (3 mo. EURIBOR + 5.50%) | | | 5.50% | | | | 04/08/2026 | | | EUR | 637 | | | 695,461 |
PetSmart, Inc., Term Loan (1 mo. USD LIBOR+ 3.75%) | | | 4.50% | | | | 02/11/2028 | | | | 89 | | | 88,346 |
Savers, Inc., Term Loan B (1 mo. USD LIBOR + 5.50%) | | | 6.25% | | | | 04/21/2028 | | | | 1,884 | | | 1,874,786 |
| | | | | | | | | | | | | | | 11,770,736 |
| | | | |
Surface Transport–0.68% | | | | | | | | | | | | | | |
ASP LS Acquisition Corp., Incremental Term Loan B (1 mo. USD LIBOR + 4.50%) | | | 5.25% | | | | 05/07/2028 | | | | 491 | | | 490,279 |
Hurtigruten (Explorer II AS) (Norway), Term Loan B (3 mo. EURIBOR + 3.50%) | | | 4.00% | | | | 02/24/2025 | | | EUR | 2,370 | | | 2,470,834 |
Novae LLC | | | | | | | | | | | | | | |
Delayed Draw Term Loan(f) | | | 0.00% | | | | 02/03/2029 | | | | 286 | | | 284,437 |
Term Loan B (3 mo. SOFR+ 5.00%) | | | 5.75% | | | | 02/03/2029 | | | | 1,001 | | | 995,531 |
| | | | | | | | | | | | | | | 4,241,081 |
| | | | |
Telecommunications–4.36% | | | | | | | | | | | | | | |
CCI Buyer, Inc., Term Loan (1 mo. USD LIBOR + 3.75%) | | | 4.50% | | | | 12/13/2027 | | | | 4,462 | | | 4,421,700 |
Cincinnati Bell, Inc., Term Loan B-2 (3 mo. SOFR + 3.25%) | | | 3.75% | | | | 11/17/2028 | | | | 29 | | | 28,676 |
Colorado Buyer, Inc. | | | | | | | | | | | | | | |
First Lien Incremental Term Loan (6 mo. USD LIBOR + 4.00%) | | | 5.00% | | | | 05/01/2024 | | | | 2,475 | | | 2,450,603 |
Term Loan (3 mo. USD LIBOR + 3.00%) | | | 4.00% | | | | 05/01/2024 | | | | 7 | | | 7,309 |
Crown Subsea Communications Holding, Inc., Term Loan B (1 mo. USD LIBOR + 4.75%) | | | 5.50% | | | | 04/27/2027 | | | | 721 | | | 723,890 |
Eagle Broadband Investments LLC (Mega Broadband), Term Loan (1 mo. USD LIBOR + 3.00%) | | | 3.75% | | | | 11/12/2027 | | | | 166 | | | 164,745 |
Intelsat Jackson Holdings S.A. (Luxembourg) | | | | | | | | | | | | | | |
Term Loan B(h) | | | - | | | | 01/27/2029 | | | | 7,204 | | | 7,114,070 |
Term Loan B-3 | | | 0.00% | | | | 11/27/2023 | | | | 36 | | | 36,364 |
Term Loan B-4 (1 mo. PRIME + 5.50%) | | | 8.75% | | | | 01/02/2024 | | | | 4 | | | 4,052 |
MLN US HoldCo LLC | | | | | | | | | | | | | | |
First Lien Term Loan B (3 mo. USD LIBOR + 4.50%) | | | 4.61% | | | | 11/30/2025 | | | | 3,598 | | | 3,495,060 |
Second Lien Term Loan B (3 mo. USD LIBOR + 8.75%) | | | 8.86% | | | | 11/30/2026 | | | | 2,202 | | | 2,036,874 |
Telesat LLC, Term Loan B-5 (1 mo. USD LIBOR + 2.75%) | | | 2.96% | | | | 12/07/2026 | | | | 2,338 | | | 1,685,717 |
U.S. Telepacific Corp.(e) | | | 9.25% | | | | 05/01/2026 | | | | 1,815 | | | 1,337,256 |
ViaSat, Inc., First Lien Term Loan B(e)(h) | | | - | | | | 02/23/2029 | | | | 1,000 | | | 984,111 |
See accompanying Notes to Consolidated Financial Statements which are an integral part of the financial statements.
| | |
| 16 | | Invesco Dynamic Credit Opportunity Fund |
| | | | | | | | | | | | | | | | |
| | | Interest
Rate | | | Maturity
Date | | | Principal Amount (000)(a) | | | Value | |
|
| |
Telecommunications–(continued) | | | | | | | | | | | | | | | | |
Windstream Services LLC, Term Loan B (1 mo. USD LIBOR + 6.25%) | | | 7.25 | % | | | 09/21/2027 | | | $ | 2,651 | | | $ | 2,649,726 | |
|
| |
| | | | | | | | | | | | | | | 27,140,153 | |
|
| |
| | | | |
Utilities–1.95% | | | | | | | | | | | | | | | | |
Eastern Power LLC, Term Loan (1 mo. USD LIBOR + 3.75%) | | | 4.75 | % | | | 10/02/2025 | | | | 3,956 | | | | 2,625,190 | |
|
| |
Generation Bridge LLC | | | | | | | | | | | | | | | | |
Term Loan B (1 mo. USD LIBOR + 5.00%)(e) | | | 5.75 | % | | | 12/01/2028 | | | | 1,404 | | | | 1,404,836 | |
|
| |
Term Loan C (1 mo. USD LIBOR + 5.00%)(e) | | | 5.75 | % | | | 12/01/2028 | | | | 29 | | | | 29,267 | |
|
| |
Heritage Power LLC, Term Loan (1 mo. USD LIBOR + 6.00%) | | | 7.00 | % | | | 07/30/2026 | | | | 2,919 | | | | 1,922,300 | |
|
| |
Lightstone Holdco LLC | | | | | | | | | | | | | | | | |
Term Loan B (3 mo. USD LIBOR + 3.75%) (Acquired 02/07/2018; Cost $4,361,267)(g) | | | 4.75 | % | | | 01/30/2024 | | | | 4,311 | | | | 3,616,888 | |
|
| |
Term Loan C (3 mo. USD LIBOR + 3.75%) (Acquired 02/07/2018; Cost $245,982)(g) | | | 4.75 | % | | | 01/30/2024 | | | | 243 | | | | 203,998 | |
|
| |
Nautilus Power LLC, Term Loan (3 mo. USD LIBOR + 4.25%) | | | 5.25 | % | | | 05/16/2024 | | | | 2,383 | | | | 2,009,684 | |
|
| |
USIC Holding, Inc., Second Lien Term Loan (1 mo. USD LIBOR + 6.50%) | | | 7.25 | % | | | 05/07/2029 | | | | 325 | | | | 324,174 | |
|
| |
| | | | | | | | | | | | | | | 12,136,337 | |
|
| |
Total Variable Rate Senior Loan Interests (Cost $748,090,193) | | | | | | | | | | | | | | | 726,689,406 | |
|
| |
| | | | |
| | | | | | | | | Shares | | | | |
Common Stocks & Other Equity Interests–11.04%(l) | | | | | | | | | | | | | | | | |
Aerospace & Defense–0.73% | | | | | | | | | | | | | | | | |
IAP Worldwide Services, Inc. (Acquired 07/18/2014-08/18/2014; Cost $239,759)(e)(g) | | | | 221 | | | | 4,527,246 | |
|
| |
| | | | |
Automotive–0.00% | | | | | | | | | | | | | | | | |
ThermaSys Corp. | | | | | | | | | | | 980,474 | | | | 29,414 | |
|
| |
| | | | |
Building & Development–0.00% | | | | | | | | | | | | | | | | |
Lake at Las Vegas Joint Venture LLC, Class A(e) | | | | | | | | | | | 2,338 | | | | 0 | |
|
| |
Lake at Las Vegas Joint Venture LLC, Class B(e) | | | | | | | | | | | 28 | | | | 0 | |
|
| |
| | | | | | | | | | | | | | | 0 | |
|
| |
| | | | |
Business Equipment & Services–1.22% | | | | | | | | | | | | | | | | |
Checkout Holding Corp. (Acquired 02/15/2019; Cost $2,863,607)(g) | | | | | | | | | | | 8,573 | | | | 6,966 | |
|
| |
My Alarm Center LLC, Class A (Acquired 03/09/2021-12/03/2021;
Cost $6,303,839)(e)(g) | | | | | | | | | | | 47,742 | | | | 7,614,948 | |
|
| |
| | | | | | | | | | | | | | | 7,621,914 | |
|
| |
| | | | |
Containers & Glass Products–0.03% | | | | | | | | | | | | | | | | |
Libbey Glass, Inc. (Acquired 11/13/2020-02/10/2022; Cost $57,040)(e)(g) | | | | | | | | | | | 13,883 | | | | 159,654 | |
|
| |
| | | | |
Electronics & Electrical–0.05% | | | | | | | | | | | | | | | | |
Riverbed Technology, Inc. | | | | | | | | | | | 32,799 | | | | 323,890 | |
|
| |
| | | | |
Financial Intermediaries–0.00% | | | | | | | | | | | | | | | | |
RJO Holdings Corp.(e) | | | | | | | | | | | 2,144 | | | | 2,144 | |
|
| |
RJO Holdings Corp., Class A(e) | | | | | | | | | | | 1,142 | | | | 1,142 | |
|
| |
RJO Holdings Corp., Class B(e) | | | | | | | | | | | 3,334 | | | | 34 | |
|
| |
| | | | | | | | | | | | | | | 3,320 | |
|
| |
| | | | |
Health Care–0.02% | | | | | | | | | | | | | | | | |
Envigo RMS Holding Corp.(e) | | | | | | | | | | | 4,854 | | | | 121,877 | |
|
| |
| | | | |
Industrial Equipment–0.18% | | | | | | | | | | | | | | | | |
North American Lifting Holdings, Inc. | | | | | | | | | | | 62,889 | | | | 1,092,696 | |
|
| |
| | | | |
Leisure Goods, Activities & Movies–1.63% | | | | | | | | | | | | | | | | |
Crown Finance US, Inc., Wts., expiring 11/23/2025 (Acquired 12/09/2020; Cost $0)(g) | | | | 173,934 | | | | 42,700 | |
|
| |
USF S&H Holdco LLC(e)(m) | | | | | | | | | | | 11,114 | | | | 10,075,244 | |
|
| |
| | | | | | | | | | | | | | | 10,117,944 | |
|
| |
See accompanying Notes to Consolidated Financial Statements which are an integral part of the financial statements.
| | |
| 17 | | Invesco Dynamic Credit Opportunity Fund |
| | | | | | | | | | | | | | | | |
| | | | | | | | | Shares | | | Value | |
|
| |
Lodging & Casinos–0.88% | | | | | | | | | | | | | | | | |
Bally’s Corp.(n) | | | | | | | | | | | 134,154 | | | $ | 4,832,227 | |
|
| |
Caesars Entertainment, Inc.(n) | | | | | | | | | | | 7,897 | | | | 664,848 | |
|
| |
| | | | | | | | | | | | | | | 5,497,075 | |
|
| |
| | | | |
Oil & Gas–4.39% | | | | | | | | | | | | | | | | |
Aquadrill LLC(e) | | | | | | | | | | | 94,427 | | | | 3,611,833 | |
|
| |
HGIM Corp. (Acquired 07/02/2018-08/31/2021; Cost $1,044,725)(g) | | | | | | | | | | | 11,834 | | | | 88,755 | |
|
| |
HGIM Corp., Wts., expiring 07/02/2043 (Acquired 07/02/2018; Cost $662,459)(g) | | | | | | | | | | | 7,505 | | | | 56,288 | |
|
| |
McDermott International Ltd. (Acquired 04/04/2018-05/03/2019;
Cost $3,542,906)(g)(n) | | | | | | | | | | | 392,579 | | | | 242,418 | |
|
| |
McDermott International Ltd. (Acquired 12/30/2020; Cost $592,812)(e)(g) | | | | | | | | | | | 1,185,624 | | | | 732,123 | |
|
| |
NexTier Oilfield Solutions, Inc.(n) | | | | | | | | | | | 46,442 | | | | 369,678 | |
|
| |
Noble Corp.(n) | | | | | | | | | | | 1,528 | | | | 39,438 | |
|
| |
Paragon Offshore Finance Co., Class B(e) | | | | | | | | | | | 1,280 | | | | 9,997 | |
|
| |
QuarterNorth Energy, Inc. (Acquired 06/02/2021-08/27/2021; Cost $6,786,339)(g) | | | | | | | | | | | 104,769 | | | | 12,834,202 | |
|
| |
QuarterNorth Energy, Inc., Wts., expiring 08/27/2028 (Acquired 08/27/2021;
Cost $3,872,447)(g) | | | | | | | | | | | 58,854 | | | | 7,209,615 | |
|
| |
QuarterNorth Energy, Inc., Wts., expiring 08/27/2029 (Acquired 08/27/2021;
Cost $238,869)(g) | | | | | | | | | | | 26,541 | | | | 302,567 | |
|
| |
QuarterNorth Energy, Inc., Wts., expiring 08/27/2029 (Acquired 08/27/2021;
Cost $306,696)(e)(g) | | | | | | | | | | | 51,116 | | | | 410,206 | |
|
| |
Samson Investment Co., Class A | | | | | | | | | | | 163,748 | | | | 102,342 | |
|
| |
Southcross Energy Partners L.P. (Acquired 07/29/2014-10/29/2020;
Cost $749,269)(e)(g) | | | | | | | | | | | 72,413 | | | | 5,431 | |
|
| |
Transocean Ltd.(n) | | | | | | | | | | | 232,965 | | | | 824,696 | |
|
| |
Tribune Resources, Inc.(e) | | | | | | | | | | | 376,237 | | | | 470,295 | |
|
| |
Tribune Resources, Inc., Wts., expiring 04/03/2023(e) | | | | | | | | | | | 97,410 | | | | 2,435 | |
|
| |
| | | | | | | | | | | | | | | 27,312,319 | |
|
| |
| | | | |
Radio & Television–0.60% | | | | | | | | | | | | | | | | |
iHeartMedia, Inc., Class A(n) | | | | | | | | | | | 175,479 | | | | 3,764,025 | |
|
| |
iHeartMedia, Inc., Class B(e) | | | | | | | | | | | 42 | | | | 777 | |
|
| |
| | | | | | | | | | | | | | | 3,764,802 | |
|
| |
| | | | |
Retailers (except Food & Drug)–0.15% | | | | | | | | | | | | | | | | |
Claire’s Stores, Inc. | | | | | | | | | | | 420 | | | | 137,550 | |
|
| |
Toys ’R’ Us-Delaware, Inc. | | | | | | | | | | | 14 | | | | 34,372 | |
|
| |
Vivarte S.A.S.(e) | | | | | | | | | | | 1,181,133 | | | | 735,674 | |
|
| |
| | | | | | | | | | | | | | | 907,596 | |
|
| |
| | | | |
Surface Transport–0.10% | | | | | | | | | | | | | | | | |
Commercial Barge Line Co. (Acquired 02/15/2018-02/06/2020; Cost $743,133)(g) | | | | | | | | | | | 8,956 | | | | 230,617 | |
|
| |
Commercial Barge Line Co., Series A, Wts., expiring 08/18/2030
(Acquired 02/15/2018-02/03/2022; Cost $0)(g) | | | | | | | | | | | 245,210 | | | | 77,905 | |
|
| |
Commercial Barge Line Co., Series B, Wts., expiring 04/30/2045
(Acquired 02/05/2020-02/17/2022; Cost $0)(g) | | | | | | | | | | | 206,752 | | | | 87,582 | |
|
| |
Commercial Barge Line Co., Wts., expiring 04/27/2045
(Acquired 02/15/2018-02/06/2020; Cost $781,183)(g) | | | | | | | | | | | 9,414 | | | | 242,411 | |
|
| |
| | | | | | | | | | | | | | | 638,515 | |
|
| |
| | | | |
Utilities–1.06% | | | | | | | | | | | | | | | | |
Bicent Power LLC, Series A, Wts., expiring 08/22/2022 (Acquired 08/21/2012;
Cost $0)(e)(g) | | | | | | | | | | | 2,024 | | | | 0 | |
|
| |
Bicent Power LLC, Series B, Wts., expiring 08/22/2022 (Acquired 08/21/2012;
Cost $0)(e)(g) | | | | | | | | | | | 3,283 | | | | 0 | |
|
| |
Vistra Corp. | | | | | | | | | | | 262,754 | | | | 5,996,046 | |
|
| |
Vistra Operations Co. LLC, Rts., expiring 12/31/2046 | | | | | | | | | | | 422,054 | | | | 575,049 | |
|
| |
| | | | | | | | | | | | | | | 6,571,095 | |
|
| |
Total Common Stocks & Other Equity Interests (Cost $92,170,955) | | | | | | | | | | | | | | | 68,689,357 | |
|
| |
See accompanying Notes to Consolidated Financial Statements which are an integral part of the financial statements.
| | |
| 18 | | Invesco Dynamic Credit Opportunity Fund |
| | | | | | | | | | | | | | | | |
| | | Interest
Rate | | | Maturity
Date | | | Principal Amount (000)(a) | | | Value | |
|
| |
Non-U.S. Dollar Denominated Bonds & Notes–10.48%(o) | | | | | | | | | | | | | | | | |
Automotive–0.24% | | | | | | | | | | | | | | | | |
Leather 2 S.p.A. (Italy) (3 mo. EURIBOR + 4.50%)(p)(q) | | | 4.50 | % | | | 09/30/2028 | | | EUR | 1,346 | | | $ | 1,484,745 | |
|
| |
| | | | |
Building & Development–1.04% | | | | | | | | | | | | | | | | |
APCOA Parking Holdings GmbH (Germany) (3 mo. EURIBOR +
5.00%)(p)(q) | | | 5.00 | % | | | 01/15/2027 | | | EUR | 1,690 | | | | 1,869,130 | |
|
| |
Haya Real Estate S.A. (Spain)(p) | | | 5.25 | % | | | 11/15/2022 | | | EUR | 1,336 | | | | 1,138,791 | |
|
| |
Haya Real Estate S.A. (Spain) (3 mo. EURIBOR + 5.13%)(p)(q) | | | 5.13 | % | | | 11/15/2022 | | | EUR | 4,086 | | | | 3,491,047 | |
|
| |
| | | | | | | | | | | | | | | 6,498,968 | |
|
| |
| | | | |
Business Equipment & Services–0.09% | | | | | | | | | | | | | | | | |
Bach Bidco S.p.A. (Italy) (3 mo. EURIBOR + 4.25%)(p)(q) | | | 4.25 | % | | | 10/15/2028 | | | EUR | 522 | | | | 582,528 | |
|
| |
| | | | |
Cable & Satellite Television–0.47% | | | | | | | | | | | | | | | | |
Altice Finco S.A. (Luxembourg)(p) | | | 4.75 | % | | | 01/15/2028 | | | EUR | 2,932 | | | | 2,919,284 | |
|
| |
| | | | |
Chemicals & Plastics–0.51% | | | | | | | | | | | | | | | | |
Herens Midco S.a.r.l. (Luxembourg)(p) | | | 5.25 | % | | | 05/15/2029 | | | EUR | 3,345 | | | | 3,192,738 | |
|
| |
| | | | |
Electronics & Electrical–0.26% | | | | | | | | | | | | | | | | |
Castor S.p.A. (Italy) (3 mo. EURIBOR + 5.25%)(p)(q) | | | 5.25 | % | | | 02/15/2029 | | | EUR | 1,444 | | | | 1,610,989 | |
|
| |
| | | | |
Financial Intermediaries–4.69% | | | | | | | | | | | | | | | | |
AnaCap Financial Europe S.A. SICAV-RAIF (Italy) (3 mo. EURIBOR + 5.00%)(p)(q) | | | 5.00 | % | | | 08/01/2024 | | | EUR | 8,976 | | | | 9,557,467 | |
|
| |
Garfunkelux Holdco 3 S.A. (Luxembourg) (3 mo. EURIBOR +
6.25%)(p)(q) | | | 6.25 | % | | | 05/01/2026 | | | EUR | 4,278 | | | | 4,804,280 | |
|
| |
Kane Bidco Ltd. (United Kingdom)(p) | | | 5.00 | % | | | 02/15/2027 | | | EUR | 791 | | | | 877,712 | |
|
| |
Kane Bidco Ltd. (United Kingdom)(p) | | | 6.50 | % | | | 02/15/2027 | | | GBP | 989 | | | | 1,313,092 | |
|
| |
Newday Bondco PLC (United Kingdom)(p) | | | 7.38 | % | | | 02/01/2024 | | | GBP | 5,895 | | | | 7,897,271 | |
|
| |
Sherwood Financing PLC (United Kingdom)(p) | | | 6.00 | % | | | 11/15/2026 | | | GBP | 1,082 | | | | 1,380,593 | |
|
| |
Sherwood Financing PLC (United Kingdom) (3 mo. EURIBOR +
4.63%)(p)(q) | | | 4.63 | % | | | 11/15/2027 | | | EUR | 3,000 | | | | 3,321,703 | |
|
| |
| | | | | | | | | | | | | | | 29,152,118 | |
|
| |
| | | | |
Home Furnishings–1.42% | | | | | | | | | | | | | | | | |
Ideal Standard International S.A. (Belgium)(p) | | | 6.38 | % | | | 07/30/2026 | | | EUR | 1,828 | | | | 1,752,571 | |
|
| |
Very Group Funding PLC (The) (United Kingdom)(p) | | | 6.50 | % | | | 08/01/2026 | | | GBP | 5,493 | | | | 7,082,581 | |
|
| |
| | | | | | | | | | | | | | | 8,835,152 | |
|
| |
| | | | |
Lodging & Casinos–1.00% | | | | | | | | | | | | | | | | |
TVL Finance PLC (United Kingdom) (3 mo. GBP LIBOR + 5.38%)(p)(r) | | | 5.78 | % | | | 07/15/2025 | | | GBP | 4,783 | | | | 6,198,239 | |
|
| |
| | | | |
Retailers (except Food & Drug)–0.76% | | | | | | | | | | | | | | | | |
Kirk Beauty SUN GmbH (Germany)(p) | | | 8.25 | % | | | 10/01/2026 | | | EUR | 4,565 | | | | 4,725,211 | |
|
| |
Total Non-U.S. Dollar Denominated Bonds & Notes (Cost $67,971,928) | | | | | | | | 65,199,972 | |
|
| |
| | | | |
U.S. Dollar Denominated Bonds & Notes–2.43% | | | | | | | | | | | | | | | | |
Air Transport–0.17% | | | | | | | | | | | | | | | | |
Mesa Airlines, Inc., Class B (e) | | | 5.75 | % | | | 07/15/2025 | | | $ | 968 | | | | 1,068,758 | |
|
| |
| | | | |
Containers & Glass Products–0.03% | | | | | | | | | | | | | | | | |
LABL, Inc. (p) | | | 5.88 | % | | | 11/01/2028 | | | | 200 | | | | 191,805 | |
|
| |
| | | | |
Electronics & Electrical–0.23% | | | | | | | | | | | | | | | | |
Diebold Nixdorf, Inc. (p) | | | 9.38 | % | | | 07/15/2025 | | | | 1,380 | | | | 1,430,384 | |
|
| |
| | | | |
Food Products–0.25% | | | | | | | | | | | | | | | | |
Teasdale Foods, Inc. (e) | | | 16.25 | % | | | 06/18/2026 | | | | 1,837 | | | | 1,555,572 | |
|
| |
| | | | |
Industrial Equipment–0.70% | | | | | | | | | | | | | | | | |
F-Brasile S.p.A./F-Brasile US LLC, Series XR (Italy) (p) | | | 7.38 | % | | | 08/15/2026 | | | | 3,835 | | | | 3,709,261 | |
|
| |
TK Elevator Holdco GmbH (Germany) (Acquired 06/30/2020;
Cost $622,000)(g)(p) | | | 7.63 | % | | | 07/15/2028 | | | | 622 | | | | 633,507 | |
|
| |
| | | | | | | | | | | | | | | 4,342,768 | |
|
| |
| | | | |
Leisure Goods, Activities & Movies–0.11% | | | | | | | | | | | | | | | | |
AMC Entertainment Holdings, Inc. (p) | | | 7.50 | % | | | 02/15/2029 | | | | 705 | | | | 695,218 | |
|
| |
See accompanying Notes to Consolidated Financial Statements which are an integral part of the financial statements.
| | |
| 19 | | Invesco Dynamic Credit Opportunity Fund |
| | | | | | | | | | | | | | | | |
| | | Interest
Rate | | | Maturity
Date | | | Principal Amount (000)(a) | | | Value | |
Publishing–0.54% | | | | | | | | | | | | | | | | |
McGraw-Hill Education, Inc. (p) | | | 5.75 | % | | | 08/01/2028 | | | $ | 3,536 | | | $ | 3,362,117 | |
|
| |
| | | | |
Radio & Television–0.11% | | | | | | | | | | | | | | | | |
Diamond Sports Group LLC/Diamond Sports Finance Co. (p) | | | 5.38 | % | | | 08/15/2026 | | | | 1,631 | | | | 664,649 | |
|
| |
| | | | |
Telecommunications–0.29% | | | | | | | | | | | | | | | | |
Windstream Escrow LLC/Windstream Escrow Finance Corp. (p) | | | 7.75 | % | | | 08/15/2028 | | | | 1,758 | | | | 1,776,529 | |
|
| |
Total U.S. Dollar Denominated Bonds & Notes (Cost $15,849,317) | | | | | | | | | | | | | | | 15,087,800 | |
|
| |
| | | | |
| | | | | | | | | Shares | | | | |
| | | | |
Preferred Stocks–0.98%(l) | | | | | | | | | | | | | | | | |
Automotive–0.00% | | | | | | | | | | | | | | | | |
ThermaSys Corp., Series A, Pfd.(e) | | | | | | | | | | | 208,860 | | | | 6,266 | |
|
| |
| | | | |
Containers & Glass Products–0.08% | | | | | | | | | | | | | | | | |
Libbey Glass, Inc., Pfd. (Acquired 11/13/2020; Cost $322,313)(e)(g) | | | | | | | | | | | 3,955 | | | | 476,548 | |
|
| |
| | | | |
Electronics & Electrical–0.14% | | | | | | | | | | | | | | | | |
Riverbed Technology, Inc., Pfd. | | | | | | | | | | | 50,381 | | | | 667,548 | |
|
| |
Riverbed Technology, Inc., Pfd. | | | | | | | | | | | 14,219 | | | | 188,402 | |
|
| |
| | | | | | | | | | | | | | | 855,950 | |
|
| |
| | | | |
Financial Intermediaries–0.00% | | | | | | | | | | | | | | | | |
RJO Holdings Corp., Series A-2, Pfd.(e) | | | | | | | | | | | 649 | | | | 3,245 | |
|
| |
| | | | |
Oil & Gas–0.16% | | | | | | | | | | | | | | | | |
McDermott International Ltd., Pfd. (Acquired 12/30/2020; Cost $0)(e)(g) | | | | | | | | | | | 1,017,283 | | | | 661,234 | |
|
| |
Southcross Energy Partners L.P., Series A, Pfd. (Acquired 05/07/2019-05/09/2019;
Cost $285,287)(e)(g) | | | | | | | | 288,393 | | | | 194,665 | |
|
| |
Southcross Energy Partners L.P., Series B, Pfd. (Acquired 01/31/2020; Cost $0)(e)(g) | | | | 69,977 | | | | 146,952 | |
|
| |
| | | | | | | | | | | | | | | 1,002,851 | |
|
| |
| | | | |
Surface Transport–0.60% | | | | | | | | | | | | | | | | |
Commercial Barge Line Co., Series A, Pfd. (Acquired 02/15/2018-02/06/2020; Cost $1,659,232)(g) | | | | | | | | | | | 33,324 | | | | 858,093 | |
|
| |
Commercial Barge Line Co., Series A, Pfd., Wts., expiring 04/27/2045 (Acquired 02/15/2018-02/06/2020; Cost $1,744,101)(g) | | | | | | | | | | | 35,030 | | | | 902,022 | |
|
| |
Commercial Barge Line Co., Series B, Pfd. (Acquired 02/05/2020-10/27/2020; Cost $978,436)(g) | | | | | | | | | | | 42,058 | | | | 1,156,595 | |
|
| |
Commercial Barge Line Co., Series B, Pfd., Wts., expiring 04/27/2045 (Acquired 02/05/2020-10/27/2020; Cost $687,140)(g) | | | | | | | | | | | 29,536 | | | | 812,241 | |
|
| |
| | | | | | | | | | | | | | | 3,728,951 | |
|
| |
Total Preferred Stocks (Cost $6,321,741) | | | | | | | | | | | | | | | 6,073,811 | |
|
| |
| | | | |
| | | Interest
Rate | | | Maturity
Date | | | Principal Amount (000)(a) | | | | |
Asset-Backed Securities–0.87% | | | | | | | | | | | | | | | | |
Structured Products–0.87% | | | | | | | | | | | | | | | | |
Adagio V CLO DAC, Series V-X, Class E-R (Ireland) (3 mo. EURIBOR +
5.15%) (p)(r) | | | 5.15 | % | | | 10/15/2031 | | | EUR | 263 | | | | 274,656 | |
|
| |
Babson Euro CLO B.V., Series 2019-1A, Class ER (Ireland) (3 mo. EURIBOR + 7.21%)(p)(r) | | | 7.21 | % | | | 04/15/2036 | | | EUR | 1,750 | | | | 1,888,614 | |
|
| |
Babson Euro CLO B.V., Series 2021-1A, Class E (Ireland) (3 mo. EURIBOR + 7.05%)(p)(r) | | | 7.05 | % | | | 04/24/2034 | | | EUR | 1,023 | | | | 1,120,525 | |
|
| |
Jubilee CLO, Series 2018-21A, Class E-R (Ireland) (3 mo. EURIBOR +
6.07%)(p)(r) | | | 6.07 | % | | | 04/15/2035 | | | EUR | 2,041 | | | | 2,145,530 | |
|
| |
Total Asset-Backed Securities (Cost $5,790,721) | | | | | | | | | | | | | | | 5,429,325 | |
|
| |
| | | | |
Municipal Obligations–0.49% | | | | | | | | | | | | | | | | |
Arizona–0.49% | | | | | | | | | | | | | | | | |
Arizona (State of) Industrial Development Authority, Series 2022, RB
(Acquired 02/22/2022; Cost $3,035,381) (Cost $3,035,381)(g)(p) | | | 9.00 | % | | | 01/01/2028 | | | $ | 3,372 | | | | 3,053,470 | |
|
| |
| | | | |
| | | | | | | | | Shares | | | | |
| | | | |
Money Market Funds–3.26% | | | | | | | | | | | | | | | | |
Invesco Government & Agency Portfolio, Institutional Class, 0.03%(m)(s) | | | | | | | | | | | 12,170,719 | | | | 12,170,719 | |
|
| |
See accompanying Notes to Consolidated Financial Statements which are an integral part of the financial statements.
| | |
| 20 | | Invesco Dynamic Credit Opportunity Fund |
| | | | | | | | |
| | | Shares | | | Value | |
|
| |
Invesco Treasury Portfolio, Institutional Class, 0.01%(m)(s) | | | 8,113,813 | | | $ | 8,113,813 | |
|
| |
Total Money Market Funds (Cost $20,284,532) | | | | 20,284,532 | |
|
| |
TOTAL INVESTMENTS IN SECURITIES–146.34% (Cost $959,514,768) | | | | 910,507,673 | |
|
| |
BORROWINGS–(34.88)% | | | | (217,000,000 | ) |
|
| |
OTHER ASSETS LESS LIABILITIES–(11.46)% | | | | (71,300,980 | ) |
|
| |
NET ASSETS–100.00% | | | $ | 622,206,693 | |
|
| |
Investment Abbreviations:
| | |
| CLO | | - Collateralized Loan Obligation |
| DAC | | - Designated Activity Co. |
| EUR | | - Euro |
| EURIBOR | | - Euro Interbank Offered Rate |
| GBP | | - British Pound Sterling |
| LIBOR | | - London Interbank Offered Rate |
| LOC | | - Letter of Credit |
| Pfd. | | - Preferred |
| PIK | | - Pay-in-Kind |
| RB | | - Revenue Bonds |
| Rts. | | - Rights |
| SOFR | | - Secured Overnight Financing Rate |
| SONIA | | - Sterling Overnight Index Average |
| USD | | - U.S. Dollar |
| Wts. | | - Warrants |
Notes to Consolidated Schedule of Investments:
| (a) | Principal amounts are denominated in U.S. dollars unless otherwise noted. |
| (b) | Variable rate senior loan interests often require prepayments from excess cash flow or permit the borrower to repay at its election. The degree to which borrowers repay, whether as a contractual requirement or at their election, cannot be predicted with any accuracy. As a result, the actual remaining maturity may be substantially less than the stated maturities shown. However, it is anticipated that the variable rate senior loan interests will have an expected average life of three to five years. |
| (c) | Variable rate senior loan interests are, at present, not readily marketable, not registered under the Securities Act of 1933, as amended (the “1933 Act”) and may be subject to contractual and legal restrictions on sale. Variable rate senior loan interests in the Fund’s portfolio generally have variable rates which adjust to a base, such as the London Interbank Offered Rate (“LIBOR”), on set dates, typically every 30 days, but not greater than one year, and/or have interest rates that float at margin above a widely recognized base lending rate such as the Prime Rate of a designated U.S. bank. |
| (d) | Calculated as a percentage of net assets. Amounts in excess of 100% are due to the Fund’s use of leverage. |
| (e) | Security valued using significant unobservable inputs (Level 3). See Note 3. |
| (f) | All or a portion of this holding is subject to unfunded loan commitments. Interest rate will be determined at the time of funding. See Note 7. |
| (g) | Restricted security. The aggregate value of these securities at February 28, 2022 was $93,723,930, which represented 15.06% of the Fund’s Net Assets. |
| (h) | This variable rate interest will settle after February 28, 2022, at which time the interest rate will be determined. |
| (i) | All or a portion of this security is Pay-in-Kind. Pay-in-Kind securities pay interest income in the form of securities. |
| (j) | The borrower has filed for protection in federal bankruptcy court. |
| (k) | Defaulted security. Currently, the issuer is in default with respect to principal and/or interest payments. The aggregate value of these securities at February 28, 2022 was $12,355,316, which represented 1.99% of the Fund’s Net Assets. |
| (l) | Securities acquired through the restructuring of senior loans. |
| (m) | Affiliated issuer. The issuer is affiliated by having an investment adviser that is under common control of Invesco Ltd. and/or the Investment Company Act of 1940, as amended (the “1940 Act”), defines “affiliated person” to include an issuer of which a fund holds 5% or more of the outstanding voting securities. The Fund has not owned enough of the outstanding voting securities of the issuer to have control (as defined in the 1940 Act) of that issuer. The table below shows the Fund’s transactions in, and earnings from, its investments in affiliates for the fiscal year ended February 28, 2022. |
| | | | | | | | | | | | | | | | | | | | | | | | |
| | | Value
February 28, 2021 | | Purchases
at Cost | | | Proceeds
from Sales | | | Change in
Unrealized
Appreciation
(Depreciation) | | | Realized
Gain | | | Value
February 28, 2022 | | Dividend Income | |
| Investments in Affiliated Money Market Funds: | | | | | | | | | | | | | | | | | | | | | | | | |
Invesco Government & Agency Portfolio, Institutional Class | | $ 8,449,079 | | $ | 293,159,320 | | | $ | (289,437,680 | ) | | $ | - | | | $ | - | | | $12,170,719 | | | $ 2,462 | |
Invesco Treasury Portfolio, Institutional Class | | 5,632,719 | | | 195,439,547 | | | | (192,958,453 | ) | | | - | | | | - | | | 8,113,813 | | | 603 | |
| Investments in Other Affiliates: | | | | | | | | | | | | | | | | | | | | | | | | |
Nobina AB | | 26,474,819 | | | - | | | | (34,779,710 | ) | | | (26,474,819 | ) | | | 34,779,710 | | | - | | | 1,330,802 | |
USF S&H Holdco LLC | | 6,550,710 | | | - | | | | - | | | | 3,524,534 | | | | - | | | 10,075,244 | | | - | |
Total | | $47,107,327 | | $ | 488,598,867 | | | $ | (517,175,843 | ) | | $ | (22,950,285 | ) | | $ | 34,779,710 | | | $30,359,776 | | | $1,333,867 | |
See accompanying Notes to Consolidated Financial Statements which are an integral part of the financial statements.
| | |
| 21 | | Invesco Dynamic Credit Opportunity Fund |
| (n) | Non-income producing security. |
| (o) | Foreign denominated security. Principal amount is denominated in the currency indicated. |
| (p) | Security purchased or received in a transaction exempt from registration under the 1933 Act. The security may be resold pursuant to an exemption from registration under the 1933 Act, typically to qualified institutional buyers. The aggregate value of these securities at February 28, 2022 was $86,146,237, which represented 13.85% of the Fund’s Net Assets. |
| (q) | Interest or dividend rate is redetermined periodically. Rate shown is the rate in effect on February 28, 2022. |
| (r) | Interest rate is redetermined periodically based on the cash flows generated by the pool of assets backing the security, less any applicable fees. The rate shown is the rate in effect on February 28, 2022. |
| (s) | The rate shown is the 7-day SEC standardized yield as of February 28, 2022. |
The aggregate value of securities considered illiquid at February 28, 2022 was $301,437,710, which represented 48.45% of the Fund’s Net Assets.
| | | | | | | | | | | | | | | | | | | | | | |
Open Forward Foreign Currency Contracts | |
|
| |
| Settlement | | | | Contract to | | | Unrealized
Appreciation | |
| Date | | Counterparty | | | | | Deliver | | | | | | Receive | | | (Depreciation) | |
|
| |
Currency Risk | |
|
| |
04/20/2022 | | Bank of America, N.A. | | | SEK | | | | 47,098,249 | | | | USD | | | | 5,191,212 | | | $ | 212,602 | |
|
| |
03/14/2022 | | Barclays Bank PLC | | | GBP | | | | 22,057,907 | | | | USD | | | | 29,845,409 | | | | 251,781 | |
|
| |
03/14/2022 | | Barclays Bank PLC | | | NOK | | | | 68,017 | | | | USD | | | | 7,736 | | | | 22 | |
|
| |
03/14/2022 | | Barclays Bank PLC | | | SEK | | | | 1,127,814 | | | | USD | | | | 123,901 | | | | 4,799 | |
|
| |
03/14/2022 | | Barclays Bank PLC | | | USD | | | | 57,525 | | | | NOK | | | | 518,073 | | | | 1,238 | |
|
| |
04/20/2022 | | Barclays Bank PLC | | | NOK | | | | 409,039 | | | | USD | | | | 46,470 | | | | 91 | |
|
| |
04/20/2022 | | Barclays Bank PLC | | | USD | | | | 2,410 | | | | NOK | | | | 21,517 | | | | 29 | |
|
| |
03/14/2022 | | BNP Paribas S.A. | | | GBP | | | | 20,938,277 | | | | USD | | | | 28,328,132 | | | | 236,638 | |
|
| |
04/20/2022 | | BNP Paribas S.A. | | | GBP | | | | 19,297,025 | | | | USD | | | | 26,113,467 | | | | 220,335 | |
|
| |
04/20/2022 | | Canadian Imperial Bank of Commerce | | | EUR | | | | 48,719,483 | | | | USD | | | | 55,746,635 | | | | 1,015,299 | |
|
| |
03/14/2022 | | Goldman Sachs International | | | EUR | | | | 48,890,685 | | | | USD | | | | 55,294,435 | | | | 449,799 | |
|
| |
03/14/2022 | | Goldman Sachs International | | | NOK | | | | 12,319 | | | | USD | | | | 1,410 | | | | 13 | |
|
| |
03/14/2022 | | J.P. Morgan Chase Bank, N.A. | | | SEK | | | | 115,970,435 | | | | USD | | | | 12,684,672 | | | | 437,665 | |
|
| |
03/14/2022 | | Morgan Stanley and Co. International PLC | | | EUR | | | | 57,320,294 | | | | USD | | | | 64,849,886 | | | | 549,074 | |
|
| |
03/14/2022 | | Morgan Stanley and Co. International PLC | | | GBP | | | | 20,625,766 | | | | USD | | | | 27,907,583 | | | | 235,365 | |
|
| |
03/14/2022 | | Morgan Stanley and Co. International PLC | | | USD | | | | 3,759 | | | | NOK | | | | 33,205 | | | | 7 | |
|
| |
04/20/2022 | | Morgan Stanley and Co. International PLC | | | NOK | | | | 50,122 | | | | USD | | | | 5,700 | | | | 16 | |
|
| |
04/20/2022 | | Morgan Stanley and Co. International PLC | | | SEK | �� | | | 128,344 | | | | USD | | | | 13,835 | | | | 268 | |
|
| |
04/20/2022 | | Morgan Stanley and Co. International PLC | | | USD | | | | 10,087 | | | | NOK | | | | 89,904 | | | | 106 | |
|
| |
03/14/2022 | | Royal Bank of Canada | | | EUR | | | | 48,160,973 | | | | USD | | | | 54,413,568 | | | | 387,508 | |
|
| |
03/14/2022 | | Royal Bank of Canada | | | GBP | | | | 412,538 | | | | USD | | | | 558,250 | | | | 4,775 | |
|
| |
04/20/2022 | | Royal Bank of Canada | | | EUR | | | | 3,286,026 | | | | USD | | | | 3,762,687 | | | | 71,174 | |
|
| |
04/20/2022 | | Royal Bank of Canada | | | GBP | | | | 19,296,951 | | | | USD | | | | 26,114,005 | | | | 220,971 | |
|
| |
04/20/2022 | | State Street Bank & Trust Co. | | | EUR | | | | 48,718,752 | | | | USD | | | | 55,775,664 | | | | 1,045,148 | |
|
| |
04/20/2022 | | State Street Bank & Trust Co. | | | GBP | | | | 19,296,951 | | | | USD | | | | 26,114,657 | | | | 221,623 | |
|
| |
04/20/2022 | | Toronto Dominion Bank | | | EUR | | | | 48,719,483 | | | | USD | | | | 55,786,244 | | | | 1,054,908 | |
|
| |
03/14/2022 | | UBS AG | | | NOK | | | | 170,682 | | | | USD | | | | 19,453 | | | | 93 | |
|
| |
03/14/2022 | | UBS AG | | | USD | | | | 5,533 | | | | NOK | | | | 49,273 | | | | 56 | |
|
| |
04/20/2022 | | UBS AG | | | SEK | | | | 795,922 | | | | USD | | | | 85,659 | | | | 1,525 | |
|
| |
Subtotal–Appreciation | | | | | | | | | | | | | | | | | | | 6,622,928 | |
|
| |
| | | | | |
Currency Risk | | | | | | | | | | | | | | | | | | | | |
|
| |
03/14/2022 | | Bank of America, N.A. | | | USD | | | | 5,187,801 | | | | SEK | | | | 47,098,250 | | | | (214,011 | ) |
|
| |
04/20/2022 | | Bank of America, N.A. | | | USD | | | | 1,706,959 | | | | EUR | | | | 1,517,212 | | | | (2,527 | ) |
|
| |
04/20/2022 | | Bank of America, N.A. | | | USD | | | | 5,411,719 | | | | GBP | | | | 4,000,000 | | | | (44,439 | ) |
|
| |
03/14/2022 | | Barclays Bank PLC | | | NOK | | | | 9,819 | | | | USD | | | | 1,109 | | | | (5 | ) |
|
| |
03/14/2022 | | Barclays Bank PLC | | | USD | | | | 41,676 | | | | NOK | | | | 366,611 | | | | (92 | ) |
|
| |
03/14/2022 | | BNP Paribas S.A. | | | NOK | | | | 767,930 | | | | USD | | | | 86,462 | | | | (641 | ) |
|
| |
03/14/2022 | | BNP Paribas S.A. | | | USD | | | | 26,382,708 | | | | GBP | | | | 19,491,207 | | | | (232,653 | ) |
|
| |
04/20/2022 | | BNP Paribas S.A. | | | USD | | | | 4,859,034 | | | | SEK | | | | 45,000,000 | | | | (102,223 | ) |
|
| |
03/14/2022 | | Canadian Imperial Bank of Commerce | | | USD | | | | 55,686,369 | | | | EUR | | | | 48,719,483 | | | | (1,033,783 | ) |
|
| |
See accompanying Notes to Consolidated Financial Statements which are an integral part of the financial statements.
| | |
| 22 | | Invesco Dynamic Credit Opportunity Fund |
| | | | | | | | | | | | | | | | | | | | | | |
| Open Forward Foreign Currency Contracts–(continued) | |
|
| |
| Settlement | | | | Contract to | | | Unrealized
Appreciation | |
| Date | | Counterparty | | | | | Deliver | | | | | | Receive | | | (Depreciation) | |
|
| |
04/20/2022 | | Citibank N.A. | | | USD | | | | 18,420 | | | | SEK | | | | 171,125 | | | $ | (331 | ) |
|
| |
03/14/2022 | | Goldman Sachs International | | | USD | | | | 914 | | | | NOK | | | | 8,034 | | | | (3 | ) |
|
| |
03/14/2022 | | Goldman Sachs International | | | USD | | | | 7,853,319 | | | | SEK | | | | 70,000,000 | | | | (461,000 | ) |
|
| |
03/14/2022 | | J.P. Morgan Chase Bank, N.A. | | | USD | | | | 4,789,479 | | | | EUR | | | | 4,214,232 | | | | (62,034 | ) |
|
| |
03/14/2022 | | J.P. Morgan Chase Bank, N.A. | | | USD | | | | 8,108,537 | | | | GBP | | | | 6,000,000 | | | | (58,736 | ) |
|
| |
03/14/2022 | | Morgan Stanley and Co. International PLC | | | USD | | | | 5,745 | | | | NOK | | | | 50,000 | | | | (74 | ) |
|
| |
04/20/2022 | | Morgan Stanley and Co. International PLC | | | NOK | | | | 37,619 | | | | USD | | | | 4,226 | | | | (40 | ) |
|
| |
03/14/2022 | | Royal Bank of Canada | | | USD | | | | 26,086,170 | | | | GBP | | | | 19,271,641 | | | | (230,691 | ) |
|
| |
03/14/2022 | | State Street Bank & Trust Co. | | | USD | | | | 55,715,253 | | | | EUR | | | | 48,718,752 | | | | (1,063,486 | ) |
|
| |
03/14/2022 | | State Street Bank & Trust Co. | | | USD | | | | 26,086,868 | | | | GBP | | | | 19,271,641 | | | | (231,389 | ) |
|
| |
03/14/2022 | | Toronto Dominion Bank | | | USD | | | | 55,725,589 | | | | EUR | | | | 48,719,483 | | | | (1,073,002 | ) |
|
| |
03/14/2022 | | UBS AG | | | NOK | | | | 112,826 | | | | USD | | | | 12,642 | | | | (156 | ) |
|
| |
03/14/2022 | | UBS AG | | | USD | | | | 4,543,876 | | | | EUR | | | | 4,000,000 | | | | (56,752 | ) |
|
| |
03/14/2022 | | UBS AG | | | USD | | | | 13,429 | | | | NOK | | | | 116,397 | | | | (227 | ) |
|
| |
04/20/2022 | | UBS AG | | | USD | | | | 41,830 | | | | SEK | | | | 385,032 | | | | (1,130 | ) |
|
| |
Subtotal-Depreciation | | | | | | | | | | | | | | | | | | | (4,869,425 | ) |
|
| |
Total Forward Foreign Currency Contracts | | | | | | | | | | | | | | | | | | $ | 1,753,503 | |
|
| |
Abbreviations:
EUR - Euro
GBP - British Pound Sterling
NOK - Norwegian Krone
SEK - Swedish Krona
USD - U.S. Dollar
See accompanying Notes to Consolidated Financial Statements which are an integral part of the financial statements.
| | |
| 23 | | Invesco Dynamic Credit Opportunity Fund |
Consolidated Statement of Assets and Liabilities
February 28, 2022
| | |
Assets: | | |
| |
Investments in unaffiliated securities, at value
(Cost $931,213,527) | | $880,147,897 |
Investments in affiliates, at value
(Cost $28,301,241) | | 30,359,776 |
Other investments: | | |
Unrealized appreciation on forward foreign currency contracts outstanding | | 6,622,928 |
Cash | | 14,288,510 |
Foreign currencies, at value (Cost $10,512,768) | | 10,413,331 |
Receivable for: | | |
Investments sold | | 110,027,827 |
Fund shares sold | | 9,071 |
Dividends | | 1,638 |
Interest and fees | | 10,925,582 |
Investments matured, at value (Cost $12,332,217) | | 3,735,036 |
| |
Investment for trustee deferred compensation and retirement plans | | 40,471 |
Other assets | | 278,723 |
Total assets | | 1,066,850,790 |
| |
Liabilities: | | |
| |
Other investments: | | |
Unrealized depreciation on forward foreign currency contracts outstanding | | 4,869,425 |
Payable for: | | |
Borrowings | | 217,000,000 |
Investments purchased | | 164,289,759 |
Dividends | | 7,611,503 |
Accrued fees to affiliates | | 198,752 |
Accrued interest expense | | 3,624 |
Accrued trustees’ and officers’ fees and benefits | | 4,156 |
Accrued other operating expenses | | 572,279 |
Trustee deferred compensation and retirement plans | | 40,471 |
Unfunded loan commitments | | 50,054,128 |
Total liabilities | | 444,644,097 |
Net assets applicable to shares outstanding | | $622,206,693 |
| | | | |
Net assets consist of: | | | | |
| |
Shares of beneficial interest | | $ | 741,181,862 | |
|
| |
Distributable earnings (loss) | | | (118,975,169 | ) |
|
| |
| |
| | $ | 622,206,693 | |
|
| |
| |
Net Assets: | | | | |
| |
Class A | | $ | 11,833 | |
|
| |
Class AX | | $ | 622,174,137 | |
|
| |
| |
Class Y | | $ | 10,859 | |
| |
Class R6 | | $ | 9,864 | |
|
| |
|
Shares outstanding, no par value, with an unlimited number of shares authorized: | |
| |
Class A | | | 964 | |
|
| |
Class AX | | | 50,687,117 | |
|
| |
Class Y | | | 885 | |
|
| |
Class R6 | | | 804 | |
|
| |
| |
Class A: | | | | |
Net asset value per share | | $ | 12.27 | |
|
| |
Maximum offering price per share
(Net asset value of $12.27 ÷ 96.75%) | | $ | 12.68 | |
|
| |
Class AX: | | | | |
Net asset value and offering price per share | | $ | 12.27 | |
|
| |
Class Y: | | | | |
Net asset value and offering price per share | | $ | 12.27 | |
|
| |
Class R6: | | | | |
Net asset value and offering price per share | | $ | 12.27 | |
|
| |
See accompanying Notes to Consolidated Financial Statements which are an integral part of the financial statements.
| | |
| 24 | | Invesco Dynamic Credit Opportunity Fund |
Consolidated Statement of Operations
For the year ended February 28, 2022
| | | | |
Investment income: | | | | |
Interest | | $ | 53,577,169 | |
|
| |
Dividends | | | 359,141 | |
|
| |
Dividends from affiliates (net of foreign withholding taxes of $ 234,847) | | | 1,333,867 | |
|
| |
Other income | | | 244,610 | |
|
| |
Total investment income | | | 55,514,787 | |
|
| |
| |
Expenses: | | | | |
| |
Advisory fees | | | 11,983,354 | |
|
| |
Administrative services fees | | | 104,333 | |
|
| |
Custodian fees | | | 85,372 | |
|
| |
Distribution fees: | | | | |
Class A | | | 9 | |
|
| |
Interest, facilities and maintenance fees | | | 4,025,263 | |
|
| |
Transfer agent fees | | | 208,815 | |
|
| |
Transfer agent fees – R6 | | | 1 | |
|
| |
Trustees’ and officers’ fees and benefits | | | 29,268 | |
|
| |
Registration and filing fees | | | 1,343 | |
|
| |
Reports to shareholders | | | 180,061 | |
|
| |
Professional services fees | | | 1,290,318 | |
|
| |
Other | | | 44,860 | |
|
| |
Total expenses | | | 17,952,997 | |
|
| |
Less: Fees waived | | | (215 | ) |
|
| |
Net expenses | | | 17,952,782 | |
|
| |
Net investment income | | | 37,562,005 | |
|
| |
| |
Realized and unrealized gain (loss) from: | | | | |
| |
Net realized gain (loss) from: | | | | |
Unaffiliated investment securities | | | (3,733,541 | ) |
|
| |
Affiliated investment securities | | | 34,779,710 | |
|
| |
Foreign currencies | | | (941,058 | ) |
|
| |
Forward foreign currency contracts | | | 21,002,589 | |
|
| |
| | | 51,107,700 | |
|
| |
Change in net unrealized appreciation (depreciation) of: | | | | |
Unaffiliated investment securities | | | 1,063,439 | |
|
| |
Affiliated investment securities | | | (22,950,285 | ) |
|
| |
Foreign currencies | | | (269,931 | ) |
|
| |
Forward foreign currency contracts | | | 1,244,664 | |
|
| |
| |
| | | (20,912,113 | ) |
|
| |
Net realized and unrealized gain | | | 30,195,587 | |
|
| |
Net increase in net assets resulting from operations | | $ | 67,757,592 | |
|
| |
See accompanying Notes to Consolidated Financial Statements which are an integral part of the financial statements.
| | |
| 25 | | Invesco Dynamic Credit Opportunity Fund |
Consolidated Statement of Changes in Net Assets
For the years ended February 28, 2022 and 2021
| | | | | | | | |
| | | 2022 | | | 2021 | |
|
| |
Operations: | | | | | | | | |
| | |
Net investment income | | $ | 37,562,005 | | | $ | 38,957,073 | |
|
| |
Net realized gain (loss) | | | 51,107,700 | | | | (30,223,471 | ) |
|
| |
Change in net unrealized appreciation (depreciation) | | | (20,912,113 | ) | | | 27,202,402 | |
|
| |
Net increase in net assets resulting from operations | | | 67,757,592 | | | | 35,936,004 | |
|
| |
| | |
Distributions to shareholders from distributable earnings: | | | | | | | | |
| | |
Class A1 | | | (252 | ) | | | - | |
|
| |
Class AX | | | (52,019,960 | ) | | | (46,568,722 | ) |
|
| |
Class Y1 | | | (265 | ) | | | - | |
|
| |
Class R61 | | | (243 | ) | | | - | |
|
| |
Total distributions from distributable earnings | | | (52,020,720 | ) | | | (46,568,722 | ) |
|
| |
| | |
Return of capital: | | | | | | | | |
Class AX | | | - | | | | (10,113,405 | ) |
|
| |
Total distributions | | | (52,020,720 | ) | | | (56,682,127 | ) |
|
| |
| | |
Share transactions–net: | | | | | | | | |
| | |
Class A1 | | | 12,014 | | | | - | |
|
| |
Class AX | | | (150,443,857 | ) | | | (17,730 | ) |
|
| |
Class Y1 | | | 11,024 | | | | - | |
|
| |
Class R61 | | | 10,012 | | | | - | |
|
| |
Net increase (decrease) in net assets resulting from share transactions | | | (150,410,807 | ) | | | (17,730 | ) |
|
| |
Net increase (decrease) in net assets | | | (134,673,935 | ) | | | (20,763,853 | ) |
|
| |
| | |
Net assets: | | | | | | | | |
| | |
Beginning of year | | | 756,880,628 | | | | 777,644,481 | |
|
| |
End of year | | $ | 622,206,693 | | | $ | 756,880,628 | |
|
| |
| 1 | Commencement date of November 1, 2021. |
See accompanying Notes to Consolidated Financial Statements which are an integral part of the financial statements.
| | |
| 26 | | Invesco Dynamic Credit Opportunity Fund |
Consolidated Statement of Cash Flows
For the year ended February 28, 2022
| | | | |
Cash provided by operating activities: | | | | |
| |
Net increase in net assets resulting from operations | | $ | 67,757,592 | |
|
| |
| |
Adjustments to reconcile the change in net assets from operations to net cash provided by operating activities: | | | | |
| |
Purchases of investments | | | (1,006,970,252 | ) |
|
| |
Proceeds from sales of investments | | | 1,247,385,497 | |
| |
Purchases of short-term investments, net | | | (37,902,392 | ) |
| |
Amortization of premium on investment securities | | | 2,135,845 | |
| |
Accretion of discount on investment securities | | | (5,619,191 | ) |
| |
Net realized gain from investment securities | | | (31,046,169 | ) |
| |
Net change in unrealized depreciation on investment securities | | | 21,886,846 | |
| |
Net change in unrealized appreciation of forward foreign currency contracts | | | (1,244,664 | ) |
| |
Change in operating assets and liabilities: | | | | |
| |
Increase in receivables and other assets | | | (127,199 | ) |
| |
Decrease in accrued expenses and other payables | | | (544,364 | ) |
| |
Net cash provided by operating activities | | | 255,711,549 | |
|
| |
| |
Cash provided by (used in) financing activities: | | | | |
| |
Dividends paid to shareholders from distributable earnings | | | (41,992,938 | ) |
|
| |
Decrease in VRDP Shares, at liquidation value | | | (100,000,000 | ) |
| |
Proceeds from shares of beneficial interest sold | | | 1,229,132 | |
| |
Proceeds from borrowings | | | 231,000,000 | |
| |
Repayment of borrowings | | | (205,000,000 | ) |
| |
Disbursements from shares of beneficial interest reacquired | | | (154,216,383 | ) |
| |
Net cash provided by (used in) financing activities | | | (268,980,189 | ) |
| |
Net decrease in cash and cash equivalents | | | (13,268,640 | ) |
| |
Cash and cash equivalents at beginning of period | | | 58,255,013 | |
| |
Cash and cash equivalents at end of period | | $ | 44,986,373 | |
|
| |
| |
Non-cash financing activities: | | | | |
| |
Value of shares of beneficial interest issued in reinvestment of dividends paid to shareholders | | $ | 2,567,373 | |
|
| |
| |
Supplemental disclosure of cash flow information: | | | | |
| |
Cash paid during the period for taxes | | $ | 28,583 | |
|
| |
Cash paid during the period for interest, facilities and maintenance fees | | $ | 4,266,759 | |
|
| |
See accompanying Notes to Consolidated Financial Statements which are an integral part of the financial statements.
| | |
| 27 | | Invesco Dynamic Credit Opportunity Fund |
Consolidated Financial Highlights
The following schedule presents financial highlights for a share of the Fund outstanding throughout the periods indicated.
| | | | | |
| | | Period ended February 28, |
| Class A | | 2022(a) |
| |
Net asset value, beginning of period | | | $ | 12.46 | |
| |
Net investment income(b) | | | | 0.85 | |
| |
Net gains (losses) on securities (both realized and unrealized) | | | | (0.90 | ) |
| |
Total from investment operations | | | | (0.05 | ) |
| |
Less: Dividends from net investment income | | | | (0.14 | ) |
| |
Net asset value, end of period | | | $ | 12.27 | |
| |
Total return at net asset value(c) | | | | (0.38 | )% |
| |
Net assets, end of period (000’s omitted) | | | $ | 12 | |
| |
Portfolio turnover rate(d) | | | | 96 | % |
| |
Ratios/supplemental data based on average net assets: | | | | | |
| |
Ratio of expenses: | | | | | |
| |
With fee waivers and/or expense reimbursements(e) | | | | 2.84 | %(f) |
| |
With fee waivers and/or expense reimbursements excluding interest, facilities and maintenance fees | | | | 2.32 | %(f) |
| |
Without fee waivers and/or expense reimbursements | | | | 2.84 | %(f) |
| |
Ratio of net investment income | | | | 4.91 | %(f) |
| |
Senior indebtedness: | | | | | |
| |
Total borrowings (000’s omitted) | | | $ | 217,000 | |
| |
Asset coverage per $1,000 unit of senior indebtedness(g) | | | $ | 3,867 | |
| (a) | Commencement date of November 1, 2021. |
| (b) | Calculated using average shares outstanding. |
| (c) | Includes adjustments in accordance with accounting principles generally accepted in the United States of America and as such, the net asset value for financial reporting purposes and the returns based upon those net asset values may differ from the net asset value and returns for shareholder transactions. Does not include sales charges and is not annualized for periods less than one year, if applicable. |
| (d) | Portfolio turnover is calculated at the fund level and is not annualized for periods less than one year, if applicable. Calculation includes the proceeds from principal repayments and sales of variable rate senior loan interests. |
| (e) | Includes fee waivers which were less than 0.005% per share. |
| (g) | Calculated by subtracting the Fund’s total liabilities (not including the Borrowings) from the Fund’s total assets and dividing by the total number of senior indebtedness units, where one unit equals $1,000 of senior indebtedness. |
See accompanying Notes to Consolidated Financial Statements which are an integral part of the financial statements.
| | |
| 28 | | Invesco Dynamic Credit Opportunity Fund |
Consolidated Financial Highlights–(continued)
| | | | | | | | | | | | | | | | | | | | |
| | | Years ended February 28, | | | Year Ended
February 29, | | | Years ended February 28, | |
| Class AX(a) | | 2022 | | | 2021 | | | 2020 | | | 2019 | | | 2018 | |
|
| |
| | | | | |
Net asset value, beginning of period | | | $ 12.02 | | | | $ 12.35 | | | | $ 12.66 | | | | $ 13.15 | | | | $ 13.25 | |
|
| |
Net investment income(b) | | | 0.65 | | | | 0.62 | | | | 0.72 | | | | 0.61 | | | | 0.71 | |
| |
Net gains (losses) on securities (both realized and unrealized) | | | 0.38 | | | | (0.05 | ) | | | (0.21 | ) | | | (0.19 | ) | | | 0.02 | |
| |
Total from investment operations | | | 1.03 | | | | 0.57 | | | | 0.51 | | | | 0.42 | | | | 0.73 | |
| |
Less: | | | | | | | | | | | | | | | | | | | | |
Dividends from net investment income | | | (0.78 | ) | | | (0.74 | ) | | | (0.82 | ) | | | (0.91 | ) | | | (0.62 | ) |
| |
Return of capital | | | - | | | | (0.16 | ) | | | - | | | | - | | | | (0.21 | ) |
| |
Total distributions | | | (0.78 | ) | | | (0.90 | ) | | | (0.82 | ) | | | (0.91 | ) | | | (0.83 | ) |
| |
Net asset value, end of period | | | $ 12.27 | | | | $ 12.02 | | | | $ 12.35 | | | | $ 12.66 | | | | $ 13.15 | |
| |
Market value per common share, end of period | | | N/A | | | | $ 11.00 | | | | $ 10.83 | | | | $ 11.06 | | | | $ 11.59 | |
| |
Total return at net asset value(c) | | | 8.75 | % | | | 7.11 | % | | | 4.99 | % | | | 4.44 | % | | | 6.33 | % |
| |
Total return at market value(d) | | | N/A | | | | 11.77 | % | | | 5.39 | % | | | 3.52 | % | | | 0.14 | % |
| |
Net assets, end of period (000’s omitted) | | | $622,174 | | | | $756,881 | | | | $777,644 | | | | $937,973 | | | | $ 974,593 | |
| |
Portfolio turnover rate(e) | | | 96 | % | | | 83 | % | | | 83 | % | | | 69 | % | | | 89 | % |
|
| |
| | | | | |
Ratios/supplemental data based on average net assets: | | | | | | | | | | | | | | | | | | | | |
| | | | | |
Ratio of expenses: | | | | | | | | | | | | | | | | | | | | |
With fee waivers and/or expense reimbursements(f) | | | 2.52 | % | | | 2.68 | % | | | 3.59 | % | | | 3.50 | % | | | 3.07 | % |
| |
With fee waivers and/or expense reimbursements excluding interest, facilities and maintenance fees | | | 1.96 | % | | | 1.92 | % | | | 1.99 | % | | | 1.97 | % | | | 1.96 | % |
| |
Without fee waivers and/or expense reimbursements | | | 2.52 | % | | | 2.68 | % | | | 3.59 | % | | | 3.50 | % | | | 3.07 | % |
| |
Ratio of net investment income | | | 5.23 | % | | | 5.66 | % | | | 5.76 | % | | | 4.72 | % | | | 5.45 | % |
|
| |
| | | | | |
Senior indebtedness: | | | | | | | | | | | | | | | | | | | | |
| | | | | |
Total borrowings (000’s omitted) | | | $217,000 | | | | $191,000 | | | | $300,000 | | | | $327,000 | | | | $ 385,000 | |
|
| |
Asset coverage per $1,000 unit of senior indebtedness(g) | | | $ 3,867 | | | | $ 5,486 | | | | $ 4,010 | | | | $ 4,249 | | | | $ 3,725 | |
| |
Total amount of preferred shares outstanding (000’s omitted) | | | N/A | | | | $100,000 | | | | $125,000 | | | | $125,000 | | | | $ 75,000 | |
| |
Asset coverage per preferred share(h) | | | N/A | | | | $856,881 | | | | $722,116 | | | | $850,378 | | | | $1,398,919 | |
| |
Liquidating preference per preferred share | | | N/A | | | | $100,000 | | | | $100,000 | | | | $100,000 | | | | $ 100,000 | |
|
| |
| (a) | Prior to November 1, 2021, the Fund operated as a Closed-End non-interval fund. On such date, holders of common shares of Closed-End Fund received Class AX shares of the Fund equal to the number of Closed-End Fund common shares they owned prior to Reorganization. |
| (b) | Calculated using average shares outstanding. |
| (c) | Includes adjustments in accordance with accounting principles generally accepted in the United States of America and as such, the net asset value for financial reporting purposes and the returns based upon those net asset values may differ from the net asset value and returns for shareholder transactions. Does not include sales charges and is not annualized for periods less than one year, if applicable. |
| (d) | Total return assumes an investment at the common share market price at the beginning of the period indicated, reinvestment of all distributions for the period in accordance with the Fund’s dividend reinvestment plan, and sale of all shares at the closing common share market price at the end of the period indicated. Not annualized for periods less than one year, if applicable. |
| (e) | Portfolio turnover is calculated at the fund level and is not annualized for periods less than one year, if applicable. Calculation includes the proceeds from principal repayments and sales of variable rate senior loan interests. |
| (f) | Includes fee waivers which were less than 0.005% per share. |
| (g) | Calculated by subtracting the Fund’s total liabilities (not including the Borrowings) from the Fund’s total assets and dividing by the total number of senior indebtedness units, where one unit equals $1,000 of senior indebtedness. |
| (h) | Calculated by subtracting the Fund’s total liabilities (not including the preferred shares, at liquidation value) from the Fund’s total assets and dividing by the total number of preferred shares outstanding. |
See accompanying Notes to Consolidated Financial Statements which are an integral part of the financial statements.
| | |
| 29 | | Invesco Dynamic Credit Opportunity Fund |
Consolidated Financial Highlights–(continued)
| | | | | |
| | | Period ended February 28, |
| Class Y | | 2022(a) |
| |
Net asset value, beginning of period | | | $ | 12.46 | |
| |
Net investment income(b) | | | | 0.86 | |
| |
Net gains (losses) on securities (both realized and unrealized) | | | | (0.90 | ) |
| |
Total from investment operations | | | | (0.04 | ) |
| |
Less: Dividends from net investment income | | | | (0.15 | ) |
| |
Net asset value, end of period | | | $ | 12.27 | |
| |
Total return at net asset value(c) | | | | (0.34 | )% |
| |
Net assets, end of period (000’s omitted) | | | $ | 11 | |
| |
Portfolio turnover rate(d) | | | | 96 | % |
| |
Ratios/supplemental data based on average net assets: | | | | | |
| |
Ratio of expenses: | | | | | |
| |
With fee waivers and/or expense reimbursements(e) | | | | 2.59 | %(f) |
| |
With fee waivers and/or expense reimbursements excluding interest, facilities and maintenance fees | | | | 2.07 | %(f) |
| |
Without fee waivers and/or expense reimbursements | | | | 2.59 | %(f) |
| |
Ratio of net investment income | | | | 5.16 | %(f) |
| |
Senior indebtedness: | | | | | |
| |
Total borrowings (000’s omitted) | | | $ | 217,000 | |
| |
Asset coverage per $1,000 unit of senior indebtedness(g) | | | $ | 3,867 | |
| (a) | Commencement date of November 1, 2021. |
| (b) | Calculated using average shares outstanding. |
| (c) | Includes adjustments in accordance with accounting principles generally accepted in the United States of America and as such, the net asset value for financial reporting purposes and the returns based upon those net asset values may differ from the net asset value and returns for shareholder transactions. Does not include sales charges and is not annualized for periods less than one year, if applicable. |
| (d) | Portfolio turnover is calculated at the fund level and is not annualized for periods less than one year, if applicable. Calculation includes the proceeds from principal repayments and sales of variable rate senior loan interests. |
| (e) | Includes fee waivers which were less than 0.005% per share. |
| (g) | Calculated by subtracting the Fund’s total liabilities (not including the Borrowings) from the Fund’s total assets and dividing by the total number of senior indebtedness units, where one unit equals $1,000 of senior indebtedness. |
See accompanying Notes to Consolidated Financial Statements which are an integral part of the financial statements.
| | |
| 30 | | Invesco Dynamic Credit Opportunity Fund |
Consolidated Financial Highlights–(continued)
| | | | | |
| | | Period ended February 28, |
| Class R6 | | 2022(a) |
| |
Net asset value, beginning of period | | | $ | 12.46 | |
| |
Net investment income(b) | | | | 0.86 | |
| |
Net gains (losses) on securities (both realized and unrealized) | | | | (0.90 | ) |
| |
Total from investment operations | | | | (0.04 | ) |
| |
Less: Dividends from net investment income | | | | (0.15 | ) |
| |
Net asset value, end of period | | | $ | 12.27 | |
| |
Total return at net asset value(c) | | | | (0.33 | )% |
| |
Net assets, end of period (000’s omitted) | | | $ | 10 | |
| |
Portfolio turnover rate(d) | | | | 96 | % |
| |
Ratios/supplemental data based on average net assets: | | | | | |
| |
Ratio of expenses: | | | | | |
| |
With fee waivers and/or expense reimbursements(e) | | | | 2.55 | %(f) |
| |
With fee waivers and/or expense reimbursements excluding interest, facilities and maintenance fees | | | | 2.03 | %(f) |
| |
Without fee waivers and/or expense reimbursements | | | | 2.55 | %(f) |
| |
Ratio of net investment income | | | | 5.20 | %(f) |
| |
Senior indebtedness: | | | | | |
| |
Total borrowings (000’s omitted) | | | $ | 217,000 | |
| |
Asset coverage per $1,000 unit of senior indebtedness(g) | | | $ | 3,867 | |
| (a) | Commencement date of November 1, 2021. |
| (b) | Calculated using average shares outstanding. |
| (c) | Includes adjustments in accordance with accounting principles generally accepted in the United States of America and as such, the net asset value for financial reporting purposes and the returns based upon those net asset values may differ from the net asset value and returns for shareholder transactions. Does not include sales charges and is not annualized for periods less than one year, if applicable. |
| (d) | Portfolio turnover is calculated at the fund level and is not annualized for periods less than one year, if applicable. Calculation includes the proceeds from principal repayments and sales of variable rate senior loan interests. |
| (e) | Includes fee waivers which were less than 0.005% per share. |
| (g) | Calculated by subtracting the Fund’s total liabilities (not including the Borrowings) from the Fund’s total assets and dividing by the total number of senior indebtedness units, where one unit equals $1,000 of senior indebtedness. |
See accompanying Notes to Consolidated Financial Statements which are an integral part of the financial statements.
| | |
| 31 | | Invesco Dynamic Credit Opportunity Fund |
Notes to Consolidated Financial Statements
February 28, 2022
NOTE 1–Significant Accounting Policies
Invesco Dynamic Credit Opportunity Fund (the “Fund”) is a Delaware statutory trust registered under the Investment Company Act of 1940, as amended (the “1940 Act”), as a non-diversified, closed-end management investment company that is operated as an interval fund and periodically offers its shares for repurchase. On November 1, 2021, Invesco Dynamic Credit Opportunities Fund (the “Predecessor Fund”) was reorganized into the Fund (the “Reorganization”). The Fund assumed the assets and liabilities of the Predecessor Fund, which had the same investment objectives and substantially the same principal investment strategies as the Fund, but operated as an exchange-traded closed-end management investment company.
The Fund may participate in direct lending opportunities through its indirect investment in the Invesco Dynamic Credit Opportunities Loan Origination LLC (the “LLC”), a Delaware limited liability company. The Fund owns all beneficial and economic interests in the Invesco Dynamic Credit Opportunities Loan Origination Trust, a Massachusetts Business Trust (the “Loan Origination Trust”), which in turn owns all beneficial and economic interests in the LLC. Effective April 27, 2021, the Predecessor Fund and the Fund may invest up to 60% of its total net assets in the Loan Origination Trust. Prior to April 27, 2021, the Predecessor Fund could invest up to 25% of its total net assets in the Loan Origination Trust. The accompanying consolidated financial statements reflect the financial position of the Fund and its Loan Origination Trust and the results of operations on a consolidated basis.
The Fund’s investment objective is to seek a high level of current income, with a secondary objective of capital appreciation. The Fund seeks to achieve its objectives by investing primarily in a portfolio of interests in floating or fixed rate senior loans to corporations, partnerships, and other entities which operate in a variety of industries and geographic regions. The Fund borrows money for investment purposes which may create the opportunity for enhanced return, but also should be considered a speculative technique and may increase the Fund’s volatility.
The Fund currently consists of four different classes of shares: Class A, Class AX, Class Y and Class R6 shares. Upon the closing of the Reorganization, the Fund began offering Class A, Class Y and Class R6 shares. In addition, shareholders of the Predecessor Fund’s common shares received Class AX shares of the Fund in exchange for their common shares. Information for the common shares of the Predecessor Fund, prior to the Reorganization, is included with Class AX shares throughout this report. Class AX shares are closed to new investors. Only investors who were invested in shares of the Predecessor Fund may continue to purchase Class AX shares as described in the Fund’s prospectus. Class Y shares are available only to certain investors. Class A shares are sold with a front-end sales charge unless certain waiver criteria are met. Under certain circumstances, load waived shares may be subject to contingent deferred sales charges (“CDSC”). Class AX, Class Y and Class R6 shares are sold at net asset value.
The Fund is an investment company and accordingly follows the investment company accounting and reporting guidance in accordance with Financial Accounting Standards Board Accounting Standards Codification Topic 946, Financial Services – Investment Companies.
The following is a summary of the significant accounting policies followed by the Fund in the preparation of its consolidated financial statements.
| A. | Security Valuations – Variable rate senior loan interests are fair valued using quotes provided by an independent pricing service. Quotes provided by the pricing service may reflect appropriate factors such as ratings, tranche type, industry, company performance, spread, individual trading characteristics, institution-size trading in similar groups of securities and other market data. |
Securities, including restricted securities, are valued according to the following policy. A security listed or traded on an exchange (except convertible securities) is valued at its last sales price as of the close of the customary trading session on the exchange where the security is principally traded, or lacking any sales on a particular day, the security may be valued at the closing bid price on that day. Securities traded in the over-the-counter market (but not securities reported on the NASDAQ Stock Exchange) are valued based on the prices furnished by independent pricing services, in which case the securities may be considered fair valued, or by market makers. Each security reported on the NASDAQ Stock Exchange is valued at the NASDAQ Official Closing Price (“NOCP”) as of the close of the customary trading session on the valuation date or absent a NOCP, at the closing bid price.
Futures contracts are valued at the final settlement price set by an exchange on which they are principally traded. Listed options are valued at the mean between the last bid and the asked prices from the exchange on which they are principally traded. Options not listed on an exchange are valued by an independent source at the mean between the last bid and asked prices. For purposes of determining net asset value (“NAV”) per share, futures and option contracts generally are valued 15 minutes after the close of the customary trading session of the New York Stock Exchange (“NYSE”).
Investments in open-end and closed-end registered investment companies that do not trade on an exchange are valued at the end-of-day net asset value per share. Investments in open-end and closed-end registered investment companies that trade on an exchange are valued at the last sales price or official closing price as of the close of the customary trading session on the exchange where the security is principally traded.
Debt obligations (including convertible securities) and unlisted equities are fair valued using an evaluated quote provided by an independent pricing service. Evaluated quotes provided by the pricing service may be determined without exclusive reliance on quoted prices, and may reflect appropriate factors such as institution-size trading in similar groups of securities, developments related to specific securities, dividend rate (for unlisted equities), yield (for debt obligations), quality, type of issue, coupon rate (for debt obligations), maturity (for debt obligations), individual trading characteristics and other market data. Pricing services generally value debt obligations assuming orderly transactions of institutional round lot size, but a fund may hold or transact in the same securities in smaller, odd lot sizes. Odd lots often trade at lower prices than institutional round lots. Debt obligations are subject to interest rate and credit risks. In addition, all debt obligations involve some risk of default with respect to interest and/or principal payments.
Swap agreements are fair valued using an evaluated quote, if available, provided by an independent pricing service. Evaluated quotes provided by the pricing service are valued based on a model which may include end-of-day net present values, spreads, ratings, industry, company performance and returns of referenced assets. Centrally cleared swap agreements are valued at the daily settlement price determined by the relevant exchange or clearinghouse.
Foreign securities’ (including foreign exchange contracts) prices are converted into U.S. dollar amounts using the applicable exchange rates as of the close of the NYSE. If market quotations are available and reliable for foreign exchange-traded equity securities, the securities will be valued at the market quotations. Because trading hours for certain foreign securities end before the close of the NYSE, closing market quotations may become unreliable. If between the time trading ends on a particular security and the close of the customary trading session on the NYSE, events occur that the investment adviser determines are significant and make the closing price unreliable, the Fund may fair value the security. If the event is likely to have affected the closing price of the security, the security will be valued at fair value in good faith using procedures approved by the Board of Trustees. Adjustments to closing prices to reflect fair value may also be based on a screening process of an independent pricing service to indicate the degree of certainty, based on historical data, that the closing price in the principal market where a foreign security trades is not the current value as of the close of the NYSE. Foreign securities’ prices meeting the approved degree of certainty that the price is not reflective of current value will be priced at the indication of fair value from the independent pricing service. Multiple factors may be considered by the independent pricing service in determining adjustments to reflect fair value and may include information relating to sector indices, American Depositary Receipts and domestic and foreign index futures. Foreign securities may have additional risks including exchange rate changes, potential for sharply devalued currencies and high inflation, political and economic upheaval, the relative lack of issuer information, relatively low market liquidity and the potential lack of strict financial and accounting controls and standards.
Securities for which market prices are not provided by any of the above methods may be valued based upon quotes furnished by independent sources. The last bid price may be used to value equity securities. The mean between the last bid and asked prices is used to value debt obligations, including corporate loans.
| | |
| 32 | | Invesco Dynamic Credit Opportunity Fund |
Securities for which market quotations are not readily available or became unreliable are valued at fair value as determined in good faith by or under the supervision of the Fund’s officers following procedures approved by the Board of Trustees. Issuer specific events, market trends, bid/asked quotes of brokers and information providers and other market data may be reviewed in the course of making a good faith determination of a security’s fair value.
The Fund may invest in securities that are subject to interest rate risk, meaning the risk that the prices will generally fall as interest rates rise and, conversely, the prices will generally rise as interest rates fall. Specific securities differ in their sensitivity to changes in interest rates depending on their individual characteristics. Changes in interest rates may result in increased market volatility, which may affect the value and/or liquidity of certain Fund investments.
Valuations change in response to many factors including the historical and prospective earnings of the issuer, the value of the issuer’s assets, general market conditions which are not specifically related to the particular issuer, such as real or perceived adverse economic conditions, changes in the general outlook for revenues or corporate earnings, changes in interest or currency rates, regional or global instability, natural or environmental disasters, widespread disease or other public health issues, war, acts of terrorism or adverse investor sentiment generally and market liquidity. Because of the inherent uncertainties of valuation, the values reflected in the consolidated financial statements may materially differ from the value received upon actual sale of those investments.
| B. | Securities Transactions and Investment Income – Securities transactions are accounted for on a trade date basis. Realized gains or losses on sales are computed on the basis of specific identification of the securities sold. Interest income (net of withholding tax, if any) is recorded on an accrual basis from settlement date and includes coupon interest and amortization of premium and accretion of discount on debt securities as applicable. Pay-in-kind interest income and non-cash dividend income received in the form of securities in-lieu of cash are recorded at the fair value of the securities received. Facility fees received may be amortized over the life of the loan. Dividend income (net of withholding tax, if any) is recorded on the ex-dividend date. |
The Fund may periodically participate in litigation related to Fund investments. As such, the Fund may receive proceeds from litigation settlements. Any proceeds received are included in the Consolidated Statement of Operations as realized gain (loss) for investments no longer held and as unrealized gain (loss) for investments still held.
Other income is comprised primarily of amendment fees which are recorded when received. Amendment fees are received in return for changes in the terms of the loan or note.
Brokerage commissions and mark ups are considered transaction costs and are recorded as an increase to the cost basis of securities purchased and/or a reduction of proceeds on a sale of securities. Such transaction costs are included in the determination of net realized and unrealized gain (loss) from investment securities reported in the Consolidated Statement of Operations and the Consolidated Statement of Changes in Net Assets and the net realized and unrealized gains (losses) on securities per share in the Consolidated Financial Highlights. Transaction costs are included in the calculation of the Fund’s net asset value and, accordingly, they reduce the Fund’s total returns. These transaction costs are not considered operating expenses and are not reflected in net investment income reported in the Consolidated Statement of Operations and the Consolidated Statement of Changes in Net Assets, or the net investment income per share and the ratios of expenses and net investment income reported in the Consolidated Financial Highlights, nor are they limited by any expense limitation arrangements between the Fund and the investment adviser.
| C. | Country Determination – For the purposes of making investment selection decisions and presentation in the Consolidated Schedule of Investments, the investment adviser may determine the country in which an issuer is located and/or credit risk exposure based on various factors. These factors include the laws of the country under which the issuer is organized, where the issuer maintains a principal office, the country in which the issuer derives 50% or more of its total revenues and the country that has the primary market for the issuer’s securities, as well as other criteria. Among the other criteria that may be evaluated for making this determination are the country in which the issuer maintains 50% or more of its assets, the type of security, financial guarantees and enhancements, the nature of the collateral and the sponsor organization. Country of issuer and/or credit risk exposure has been determined to be the United States of America, unless otherwise noted. |
| D. | Distributions – Distributions from net investment income, if any, are declared daily and paid quarterly. Distributions from net realized capital gain, if any, are generally declared and paid annually and recorded on the ex-dividend date. The Fund may elect to treat a portion of the proceeds from redemptions as distributions for federal income tax purposes. |
Prior to the Reorganization, the Predecessor Fund had adopted a Managed Distribution Plan whereby the Predecessor Fund paid a monthly dividend to common shareholders at a stated fixed monthly distribution amount of $0.075 per share. The Managed Distribution Plan was intended to provide shareholders with a consistent, but not guaranteed, periodic cash payment from the Predecessor Fund, regardless of when or whether income was earned or capital gains were realized. If sufficient income was not available for a monthly distribution, the Predecessor Fund distributed long-term capital gains and/or return of capital in order to maintain its managed distribution level under the Managed Distribution Plan.
| E. | Federal Income Taxes – The Fund intends to comply with the requirements of Subchapter M of the Internal Revenue Code of 1986, as amended (the “Internal Revenue Code”), necessary to qualify as a regulated investment company and to distribute substantially all of the Fund’s taxable earnings to shareholders. As such, the Fund will not be subject to federal income taxes on otherwise taxable income (including net realized capital gain) that is distributed to shareholders. Therefore, no provision for federal income taxes is recorded in the consolidated financial statements. |
The Fund recognizes the tax benefits of uncertain tax positions only when the position is more likely than not to be sustained. Management has analyzed the Fund’s uncertain tax positions and concluded that no liability for unrecognized tax benefits should be recorded related to uncertain tax positions. Management is not aware of any tax positions for which it is reasonably possible that the total amounts of unrecognized tax benefits will change materially in the next 12 months.
The Fund files tax returns in the U.S. Federal jurisdiction and certain other jurisdictions. Generally, the Fund is subject to examinations by such taxing authorities for up to three years after the filing of the return for the tax period.
| F. | Interest, Facilities and Maintenance Fees – Interest, Facilities and Maintenance Fees include interest and related borrowing costs such as commitment fees, rating and bank agent fees and other expenses associated with lines of credit and Variable Rate Demand Preferred Shares (“VRDP Shares”), and interest and administrative expenses related to establishing and maintaining floating rate note obligations, if any. |
| G. | Accounting Estimates – The preparation of financial statements in conformity with accounting principles generally accepted in the United States of America (“GAAP”) requires management to make estimates and assumptions that affect the reported amounts of assets and liabilities at the date of the financial statements and the reported amounts of revenues and expenses during the reporting period including estimates and assumptions related to taxation. Actual results could differ from those estimates by a significant amount. In addition, the Fund monitors for material events or transactions that may occur or become known after the period-end date and before the date the consolidated financial statements are released to print. |
| H. | Indemnifications – Under the Fund’s organizational documents, each Trustee, officer, employee or other agent of the Fund is indemnified against certain liabilities that may arise out of the performance of their duties to the Fund. Additionally, in the normal course of business, the Fund enters into contracts, including the Fund’s servicing agreements, that contain a variety of indemnification clauses. The Fund’s maximum exposure under these arrangements is unknown as this would involve future claims that may be made against the Fund that have not yet occurred. The risk of material loss as a result of such indemnification claims is considered remote. |
| I. | Cash and Cash Equivalents – For the purposes of the Consolidated Statement of Cash Flows, the Fund defines Cash and Cash Equivalents as cash (including foreign currency), money market funds and other investments held in lieu of cash and excludes investments made with cash collateral received. |
| J. | Securities Purchased on a When-Issued and Delayed Delivery Basis – The Fund may purchase and sell interests in corporate loans and corporate debt securities and other portfolio securities on a when-issued and delayed delivery basis, with payment and delivery scheduled for a future date. No income accrues to the Fund on such interests or securities in connection with such transactions prior to the date the Fund actually takes delivery of such interests or securities. These transactions are subject to market fluctuations and are subject to the risk that the value at delivery may be more or less than the trade date |
| | |
| 33 | | Invesco Dynamic Credit Opportunity Fund |
| | purchase price. Although the Fund will generally purchase these securities with the intention of acquiring such securities, they may sell such securities prior to the settlement date. |
| K. | Foreign Currency Translations – Foreign currency is valued at the close of the NYSE based on quotations posted by banks and major currency dealers. Portfolio securities and other assets and liabilities denominated in foreign currencies are translated into U.S. dollar amounts at the date of valuation. Purchases and sales of portfolio securities (net of foreign taxes withheld on disposition) and income items denominated in foreign currencies are translated into U.S. dollar amounts on the respective dates of such transactions. The Fund does not separately account for the portion of the results of operations resulting from changes in foreign exchange rates on investments and the fluctuations arising from changes in market prices of securities held. The combined results of changes in foreign exchange rates and the fluctuation of market prices on investments (net of estimated foreign tax withholding) are included with the net realized and unrealized gain or loss from investments in the Consolidated Statement of Operations. Reported net realized foreign currency gains or losses arise from (1) sales of foreign currencies, (2) currency gains or losses realized between the trade and settlement dates on securities transactions, and (3) the difference between the amounts of dividends, interest, and foreign withholding taxes recorded on the Fund’s books and the U.S. dollar equivalent of the amounts actually received or paid. Net unrealized foreign currency gains and losses arise from changes in the fair values of assets and liabilities, other than investments in securities at fiscal period end, resulting from changes in exchange rates. |
The Fund may invest in foreign securities, which may be subject to foreign taxes on income, gains on investments or currency repatriation, a portion of which may be recoverable. Foreign taxes, if any, are recorded based on the tax regulations and rates that exist in the foreign markets in which the Fund invests and are shown in the Consolidated Statement of Operations.
| L. | Forward Foreign Currency Contracts – The Fund may engage in foreign currency transactions either on a spot (i.e. for prompt delivery and settlement) basis, or through forward foreign currency contracts, to manage or minimize currency or exchange rate risk. |
The Fund may also enter into forward foreign currency contracts for the purchase or sale of a security denominated in a foreign currency in order to “lock in” the U.S. dollar price of that security, or the Fund may also enter into forward foreign currency contracts that do not provide for physical settlement of the two currencies, but instead are settled by a single cash payment calculated as the difference between the agreed upon exchange rate and the spot rate at settlement based upon an agreed upon notional amount (non-deliverable forwards). The Fund will set aside liquid assets in an amount equal to the daily mark-to-market obligation for forward foreign currency contracts.
A forward foreign currency contract is an obligation between two parties (“Counterparties”) to purchase or sell a specific currency for an agreed-upon price at a future date. The use of forward foreign currency contracts does not eliminate fluctuations in the price of the underlying securities the Fund owns or intends to acquire but establishes a rate of exchange in advance. Fluctuations in the value of these contracts are measured by the difference in the contract date and reporting date exchange rates and are recorded as unrealized appreciation (depreciation) until the contracts are closed. When the contracts are closed, realized gains (losses) are recorded. Realized and unrealized gains (losses) on the contracts are included in the Consolidated Statement of Operations. The primary risks associated with forward foreign currency contracts include failure of the Counterparty to meet the terms of the contract and the value of the foreign currency changing unfavorably. These risks may be in excess of the amounts reflected in the Consolidated Statement of Assets and Liabilities.
| M. | Industry Focus – To the extent that the Fund invests a greater amount of its assets in securities of issuers in the banking and financial services industries, the Fund’s performance will depend to a greater extent on the overall condition of those industries. The value of these securities can be sensitive to changes in government regulation, interest rates and economic downturns in the U.S. and abroad. |
| N. | Bank Loan Risk – Although the resale, or secondary market for floating rate loans has grown substantially over the past decade, both in overall size and number of market participants, there is no organized exchange or board of trade on which floating rate loans are traded. Instead, the secondary market for floating rate loans is a private, unregulated interdealer or interbank resale market. Such a market may therefore be subject to irregular trading activity, wide bid/ask spreads, and extended trade settlement periods, which may impair the Fund’s ability to sell bank loans within its desired time frame or at an acceptable price and its ability to accurately value existing and prospective investments. Extended trade settlement periods may result in cash not being immediately available to the Fund. As a result, the Fund may have to sell other investments or engage in borrowing transactions to raise cash to meet its obligations. Similar to other asset classes, bank loan funds may be exposed to counterparty credit risk, or the risk than an entity with which the Fund has unsettled or open transactions may fail to or be unable to perform on its commitments. The Fund seeks to manage counterparty credit risk by entering into transactions only with counterparties that it believes have the financial resources to honor their obligations and by monitoring the financial stability of those counterparties. |
| O. | LIBOR Risk – The Fund may have investments in financial instruments that utilize the London Interbank Offered Rate (“LIBOR”) as the reference or benchmark rate for variable interest rate calculations. LIBOR is intended to measure the rate generally at which banks can lend and borrow from one another in the relevant currency on an unsecured basis. The UK Financial Conduct Authority (FCA), the regulator that oversees LIBOR, announced that the majority of LIBOR rates would cease to be published or would no longer be representative on January 1, 2022. Although the publication of most LIBOR rates ceased at the end of 2021, a selection of widely used USD LIBOR rates continues to be published until June 2023 to allow for an orderly transition away from these rates. |
There remains uncertainty and risks relating to the continuing LIBOR transition and its effects on the Fund and the instruments in which the Fund invests. There can be no assurance that the composition or characteristics of any alternative reference rates (“ARRs”) or financial instruments in which the Fund invests that utilize ARRs will be similar to or produce the same value or economic equivalence as LIBOR or that these instruments will have the same volume or liquidity. Additionally, there remains uncertainty and risks relating to certain “legacy” USD LIBOR instruments that were issued or entered into before December 31, 2021 and the process by which a replacement interest rate will be identified and implemented into these instruments when USD LIBOR is ultimately discontinued. The effects of such uncertainty and risks in “legacy” USD LIBOR instruments held by the Fund could result in losses to the Fund.
| P. | Foreign Risk – The Fund may invest in senior loans to borrowers that are organized or located in countries other than the United States. Investment in non-U.S. issuers involves special risks, including that non-U.S. issuers may be subject to less rigorous accounting and reporting requirements than U.S. issuers, less rigorous regulatory requirements, different legal systems and laws relating to creditors’ rights, the potential inability to enforce legal judgments and the potential for political, social and economic adversity. Investments by the Fund in non-U.S. dollar denominated investments will be subject to currency risk. The Fund also may hold non-U.S. dollar denominated senior loans or other securities received as part of a reorganization or restructuring. Trading in many foreign securities may be less liquid and more volatile than U.S. securities due to the size of the market or other factors. |
| Q. | Leverage Risk – The Fund may utilize leverage to seek to enhance the yield of the Fund by borrowing or issuing preferred shares. There are risks associated with borrowing or issuing preferred shares in an effort to increase the yield and distributions on the common shares, including that the costs of the financial leverage may exceed the income from investments made with such leverage, the higher volatility of the net asset value of the common shares, and that fluctuations in the interest rates on the borrowing or dividend rates on preferred shares may affect the yield and distributions to the common shareholders. There can be no assurance that the Fund’s leverage strategy will be successful. |
| R. | Other Risks – The Fund may invest all or substantially all of its assets in senior secured floating rate loans and senior secured debt securities that are determined to be rated below investment grade. These securities are generally considered to have speculative characteristics and are subject to greater risk of loss of principal and interest than higher rated securities. The value of lower quality debt securities and floating rate loans can be more volatile due to increased sensitivity to adverse issuer, political, regulatory, market or economic developments. |
The Fund invests in corporate loans from U.S. or non-U.S. companies (the “Borrowers”). The investment of the Fund in a corporate loan may take the form of participation interests or assignments. If the Fund purchases a participation interest from a syndicate of lenders (“Lenders”) or one of the participants in the syndicate (“Participant”), one or more of which administers the loan on behalf of all the Lenders (the “Agent Bank”), the Fund would be required to rely on the Lender that sold the participation interest not only for the enforcement of the Fund’s rights against the Borrower but also for the receipt and processing of
| | |
| 34 | | Invesco Dynamic Credit Opportunity Fund |
payments due to the Fund under the corporate loans. As such, the Fund is subject to the credit risk of the Borrower and the Participant. Lenders and Participants interposed between the Fund and a Borrower, together with Agent Banks, are referred to as “Intermediate Participants”.
The current low interest rate environment was created in part by the Federal Reserve Board (FRB) and certain foreign central banks keeping the federal funds and equivalent foreign rates near historical lows. Increases in the federal funds and equivalent foreign rates may expose fixed income markets to heightened volatility and reduced liquidity for certain fixed income investments, particularly those with longer maturities. In addition, decreases in fixed income dealer market-making capacity may also potentially lead to heightened volatility and reduced liquidity in the fixed income markets. As a result, the value of the Fund’s investments and share price may decline. Changes in central bank policies could also result in higher than normal shareholder redemptions, which could potentially increase portfolio turnover and the Fund’s transaction costs. Additionally, from time to time, uncertainty regarding the status of negotiations in the U.S. Government to increase the statutory debt limit, commonly called the “debt ceiling”, could increase the risk that the U.S. Government may default on payments on certain U.S. Government securities, cause the credit rating of the U.S. Government to be downgraded, increase volatility in the stock and bond markets, result in higher interest rates, reduce prices of U.S. Treasury securities, and/or increase the costs of various kinds of debt. If a U.S. Government-sponsored entity is negatively impacted by legislative or regulatory action, is unable to meet its obligations, or its creditworthiness declines, the performance of a Fund that holds securities of that entity will be adversely impacted.
In making a direct loan, the Fund is exposed to the risk that the borrower may default or become insolvent and, consequently, that the Fund will lose money on the loan. Furthermore, direct loans may subject the Fund to liquidity and interest rate risk and certain direct loans may be deemed illiquid. Direct loans are not publicly traded and may not have a secondary market. The lack of a secondary market for direct loans may have an adverse impact on the ability of the Fund to dispose of a direct loan and/or to value the direct loan. When engaging in direct lending, the Fund’s performance may depend, in part, on the ability of the Fund to originate loans on advantageous terms. In originating and purchasing loans, the Fund will compete with a broad spectrum of lenders. Increased competition for, or a decrease in the available supply of, qualifying loans could result in lower yields on such loans, which could adversely affect Fund performance.
The Fund is non-diversified and may invest in securities of fewer issuers than if it were diversified. Thus, the value of the Fund’s shares may vary more widely and the Fund may be subject to greater market and credit risk than if the Fund invested more broadly.
| S. | COVID-19 Risk – The COVID-19 strain of coronavirus has resulted in instances of market closures and dislocations, extreme volatility, liquidity constraints and increased trading costs. Efforts to contain its spread have resulted in travel restrictions, disruptions of healthcare systems, business operations (including business closures) and supply chains, layoffs, lower consumer demand and employee availability, and defaults and credit downgrades, among other significant economic impacts that have disrupted global economic activity across many industries. Such economic impacts may exacerbate other pre-existing political, social and economic risks locally or globally and cause general concern and uncertainty. |
The full economic impact and ongoing effects of COVID-19 (or other future epidemics or pandemics) at the macro-level and on individual businesses are unpredictable and may result in significant and prolonged effects on the Fund’s performance.
NOTE 2–Advisory Fees and Other Fees Paid to Affiliates
The Fund has entered into an investment advisory agreement with Invesco Advisers, Inc. (the “Adviser” or “Invesco”) Under the terms of the investment advisory agreement, the Fund accrues daily and pays monthly an advisory fee to the Adviser based on the annual rate of 1.25% of the Fund’s average daily managed assets. Managed assets for this purpose means the Fund’s net assets, plus assets attributable to outstanding preferred shares and the amount of any borrowings incurred for the purpose of leverage (whether or not such borrowed amounts are reflected in the Fund’s consolidated financial statements for purposes of GAAP.)
For the year ended February 28, 2022, the effective advisory fee rate incurred by the Fund was 1.67%.
Under the terms of a master sub-advisory agreement between the Adviser and each of Invesco Asset Management Deutschland GmbH, Invesco Asset Management Limited, Invesco Asset Management (Japan) Limited, Invesco Hong Kong Limited, Invesco Senior Secured Management, Inc. and Invesco Canada Ltd. and separate sub-advisory agreements with Invesco Capital Management LLC and Invesco Asset Management (India) Private Limited (collectively, the “Affiliated Sub-Advisers”) the Adviser, not the Fund, will pay 40% of the fees paid to the Adviser to any such Affiliated Sub-Adviser(s) that provide(s) discretionary investment management services to the Fund based on the percentage of assets allocated to such Affiliated Sub-Adviser(s).
The Adviser has contractually agreed, through at least June 30, 2023, to waive the advisory fee payable by the Fund in an amount equal to 100% of the net advisory fees the Adviser receives from the affiliated money market funds on investments by the Fund of uninvested cash in such affiliated money market funds.
For the year ended February 28, 2022, the Adviser waived advisory fees of $215.
The Fund has entered into a master administrative services agreement with Invesco pursuant to which the Fund has agreed to pay Invesco for certain administrative costs incurred in providing accounting services to the Fund. For the year ended February 28, 2022, expenses incurred under this agreement are shown in the Consolidated Statement of Operations as Administrative services fees. Invesco has entered into a sub-administration agreement whereby State Street Bank and Trust Company (“SSB”) serves as fund accountant and provides certain administrative services to the Fund. Pursuant to a custody agreement with the Fund, SSB also serves as the Fund’s custodian.
The Fund has entered into a transfer agency and service agreement with Invesco Investment Services, Inc. (“IIS”) pursuant to which the Fund has agreed to pay IIS a fee for providing transfer agency and shareholder services to the Fund and reimburse IIS for certain expenses incurred by IIS in the course of providing such services. For the year ended February 28, 2022, expenses incurred under these agreements are shown in the Consolidated Statement of Operations as Transfer agent fees.
The Fund has entered into master distribution agreements with Invesco Distributors, Inc. (“IDI”) to serve as the distributor for the Class A, Class AX, Class Y and Class R6 shares of the Fund. The Fund has adopted a plan pursuant to Rule 12b-1 under the 1940 Act with respect to the Fund’s Class A shares (the “Plan”). The Fund, pursuant to the Plan, pays IDI compensation at the annual rate of 0.25% of the Fund’s average daily net assets of Class A shares. The fees are accrued daily and paid monthly. Of the Plan payments, up to 0.25% of the Fund’s average daily net assets of Class A shares may be paid to furnish continuing personal shareholder services to customers who purchase and own Class A shares. Any amounts not paid as a service fee under the Plan would constitute an asset-based sales charge. Rules of the Financial Industry Regulatory Authority (“FINRA”) also impose a cap on the total sales charges, including asset-based sales charges, that may be paid by Class A shares of the Fund. For the year ended February 28, 2022, expenses incurred under the Plan are shown in the Consolidated Statement of Operations as Distribution fees.
Front-end sales commissions and CDSC (collectively, the “sales charges”) are not recorded as expenses of the Fund. Front-end sales commissions are deducted from proceeds from the sales of Fund shares prior to investment in Class A shares of the Fund. CDSC are deducted from redemption proceeds prior to remittance to the shareholder. During the year ended February 28, 2022, IDI advised the Fund that IDI retained $0 in front-end sales commissions from the sale of Class A shares and $0 from Class A shares for CDSC imposed upon redemptions by shareholders.
Certain officers and trustees of the Fund are officers and directors of the Adviser, IIS and/or IDI.
NOTE 3–Additional Valuation Information
GAAP defines fair value as the price that would be received to sell an asset or paid to transfer a liability in an orderly transaction between market participants at the measurement date, under current market conditions. GAAP establishes a hierarchy that prioritizes the inputs to valuation methods, giving the highest priority to readily available unadjusted quoted prices in an active market for identical assets (Level 1) and the lowest priority to significant unobservable inputs (Level 3), generally when market prices are not readily available or are unreliable. Based on the valuation inputs, the securities or other investments are tiered into one of three levels. Changes in valuation methods may result in transfers in or out of an investment’s assigned level:
| | |
| Level 1 - | | Prices are determined using quoted prices in an active market for identical assets. |
| | |
| 35 | | Invesco Dynamic Credit Opportunity Fund |
| | |
| Level 2 - | | Prices are determined using other significant observable inputs. Observable inputs are inputs that other market participants may use in pricing a security. These may include quoted prices for similar securities, interest rates, prepayment speeds, credit risk, yield curves, loss severities, default rates, discount rates, volatilities and others. |
| Level 3 - | | Prices are determined using significant unobservable inputs. In situations where quoted prices or observable inputs are unavailable (for example, when there is little or no market activity for an investment at the end of the period), unobservable inputs may be used. Unobservable inputs reflect the Fund’s own assumptions about the factors market participants would use in determining fair value of the securities or instruments and would be based on the best available information. |
The following is a summary of the tiered valuation input levels, as of February 28, 2022. The level assigned to the securities valuations may not be an indication of the risk or liquidity associated with investing in those securities. Because of the inherent uncertainties of valuation, the values reflected in the consolidated financial statements may materially differ from the value received upon actual sale of those investments.
| | | | | | | | | | | | | | | | |
| | | Level 1 | | | Level 2 | | | Level 3 | | | Total | |
|
| |
Investments in Securities | | | | | | | | | | | | | | | | |
|
| |
Variable Rate Senior Loan Interests | | $ | – | | | $ | 409,585,494 | | | $ | 317,103,912 | | | $ | 726,689,406 | |
|
| |
Common Stocks & Other Equity Interests | | | 16,733,376 | | | | 23,474,921 | | | | 28,481,060 | | | | 68,689,357 | |
|
| |
Non-U.S. Dollar Denominated Bonds & Notes | | | – | | | | 65,199,972 | | | | – | | | | 65,199,972 | |
|
| |
U.S. Dollar Denominated Bonds & Notes | | | – | | | | 12,463,470 | | | | 2,624,330 | | | | 15,087,800 | |
|
| |
Preferred Stocks | | | – | | | | 4,584,901 | | | | 1,488,910 | | | | 6,073,811 | |
|
| |
Asset-Backed Securities | | | – | | | | 5,429,325 | | | | – | | | | 5,429,325 | |
|
| |
Municipal Obligations | | | – | | | | 3,053,470 | | | | – | | | | 3,053,470 | |
|
| |
Money Market Funds | | | 20,284,532 | | | | – | | | | – | | | | 20,284,532 | |
|
| |
Total Investments in Securities | | | 37,017,908 | | | | 523,791,553 | | | | 349,698,212 | | | | 910,507,673 | |
|
| |
| | | | |
Other Investments - Assets* | | | | | | | | | | | | | | | | |
|
| |
Investments Matured | | | – | | | | 1,076,400 | | | | 2,658,636 | | | | 3,735,036 | |
|
| |
Forward Foreign Currency Contracts | | | – | | | | 6,622,928 | | | | – | | | | 6,622,928 | |
|
| |
| | | – | | | | 7,699,328 | | | | 2,658,636 | | | | 10,357,964 | |
|
| |
| | | | |
Other Investments - Liabilities* | | | | | | | | | | | | | | | | |
|
| |
Forward Foreign Currency Contracts | | | – | | | | (4,869,425 | ) | | | – | | | | (4,869,425 | ) |
|
| |
Total Other Investments | | | – | | | | 2,829,903 | | | | 2,658,636 | | | | 5,488,539 | |
|
| |
Total Investments | | $ | 37,017,908 | | | $ | 526,621,456 | | | $ | 352,356,848 | | | $ | 915,996,212 | |
|
| |
| * | Forward foreign currency contracts are valued at unrealized appreciation (depreciation). Investments matured are shown at value. |
A reconciliation of Level 3 investments is presented when the Fund had a significant amount of Level 3 investments at the beginning and/or end of the reporting period in relation to net assets.
The following is a reconciliation of the fair valuations using significant unobservable inputs (Level 3) during the year ended February 28, 2022:
| | | | | | | | | | | | | | | | | | | | | | | | | | | | | | | | | | | | |
| | | Value 02/28/21 | | | Purchases at Cost | | | Proceeds
from Sales | | | Accrued
Discounts/
Premiums | | | Realized Gain (Loss) | | | Change in Unrealized
Appreciation (Depreciation) | | | Transfers
into Level 3* | | | Transfers
out of
Level 3* | | | Value 02/28/22 | |
|
| |
Variable Rate Senior Loan Interests | | $ | 208,090,001 | | | $ | 178,527,377 | | | $ | (62,967,512 | ) | | $ | 770,346 | | | $ | (4,117,207 | ) | | $ | 3,903,595 | | | $ | 2,753,396 | | | $ | (9,856,084 | ) | | $ | 317,103,912 | |
|
| |
Common Stocks & Other Equity Interests | | | 13,193,366 | | | | 10,134,772 | | | | (2,503,359 | ) | | | – | | | | (440,602 | ) | | | 7,890,608 | | | | 270,062 | | | | (63,787 | ) | | | 28,481,060 | |
|
| |
Investments Matured | | | 450,576 | | | | 3,235,803 | | | | (77,226 | ) | | | 6,613 | | | | – | | | | (957,130 | ) | | | – | | | | – | | | | 2,658,636 | |
|
| |
U.S. Dollar Denominated Bonds & Notes | | | 3,182,330 | | | | 279,566 | | | | (553,200 | ) | | | – | | | | – | | | | (284,366 | ) | | | – | | | | – | | | | 2,624,330 | |
|
| |
Preferred Stocks | | | 258,788 | | | | – | | | | (15,706 | ) | | | – | | | | 14,503 | | | | 220,309 | | | | 1,011,016 | | | | – | | | | 1,488,910 | |
|
| |
Total | | $ | 225,175,061 | | | $ | 192,177,518 | | | $ | (66,117,003 | ) | | $ | 776,959 | | | $ | (4,543,306 | ) | | $ | 10,773,016 | | | $ | 4,034,474 | | | $ | (9,919,871 | ) | | $ | 352,356,848 | |
|
| |
* Transfers into and out of level 3 are due to increases or decreases in market activity impacting the available market inputs to determine the price.
Securities determined to be Level 3 at the end of the reporting period were valued primarily by utilizing quotes from a third-party vendor pricing service. A significant change in third-party pricing information could result in a significantly lower or higher value in Level 3 investments.
| | |
| 36 | | Invesco Dynamic Credit Opportunity Fund |
The following table summarizes the valuation techniques and significant unobservable inputs used in determining fair value measurements for those investments classified as level 3 at period end:
| | | | | | | | | | | | | | | | | | | | | | | | |
| | | Fair Value
at 02/28/22 | | | Valuation Technique | | | Unobservable
Inputs | | | Range of
Unobservable | | | Unobservable
Input Used | | | | |
|
| |
Variable Rate Senior Loan Interests | | | | | | | | | | | | | | | | | | | | | | | | |
FDH Group Acquisition, Inc., Term Loan A | | $ | 22,206,671 | | | | Loan Origination Value | | | | Original Cost | | | | N/A | | | | 98% of par | | | | (a | ) |
|
| |
Keg Logistics LLC, Term Loan A | | | 21,139,765 | | | | Loan Origination Value | | | | Original Cost | | | | N/A | | | | 98.5% of par | | | | (b | ) |
|
| |
Muth Mirror Systems LLC, Term Loan | | | 18,662,389 | | | | Valuation Service | | | | N/A | | | | N/A | | | | N/A | | | | (b | ) |
|
| |
Lightning Finco Ltd., Term Loan B-1 | | | 18,007,643 | | | | Loan Origination Value | | | | Original Cost | | | | N/A | | | | N/A | | | | (a | ) |
|
| |
Boeing Co., Revolver Loan | | | 17,195,627 | | | | Valuation Service | | | | N/A | | | | N/A | | | | N/A | | | | (c | ) |
|
| |
Teasdale Foods, Inc., Term Loan B | | | 15,075,593 | | | | Valuation Service | | | | N/A | | | | N/A | | | | N/A | | | | (b | ) |
|
| |
Groundworks LLC, First Lien Incremental Term Loan | | | 13,137,496 | | | | Valuation Service | | | | N/A | | | | N/A | | | | N/A | | | | (b | ) |
|
| |
USF S&H Holdco LLC, Term Loan B | | | 10,677,541 | | | | Valuation Service | | | | N/A | | | | N/A | | | | N/A | | | | (b | ) |
|
| |
USF S&H Holdco LLC | | | 10,075,244 | | | | Valuation Service | | | | N/A | | | | N/A | | | | N/A | | | | (b | ) |
|
| |
PrimeFlight Aviation Services, Inc., Term Loan | | | 9,449,412 | | | | Valuation Service | | | | N/A | | | | N/A | | | | N/A | | | | (b | ) |
|
| |
PrimeFlight Aviation Services, Inc., Incremental Delayed Draw | | | 9,300,761 | | | | Valuation Service | | | | N/A | | | | N/A | | | | N/A | | | | (b | ) |
|
| |
| (a) | The Fund fair values certain investments in direct loan financings at the loan origination price. The Adviser periodically reviews the consolidated financial statements and monitors such investments for additional market information or the occurrence of a significant event which would warrant a re-evaluation of the security’s fair valuation. |
| (b) | Securities classified as Level 3 whose unadjusted values were provided by a pricing service and for which such inputs are unobservable. The valuations are based on certain methods used to determine market yields in order to establish a discount rate of return given market conditions and prevailing lending standards. Future expected cash flows are discounted back to the present value using these discount rates in the discounted cash flow analysis. The Adviser reviews the valuation reports provided by the valuation service on an on-going basis and monitors such investments for additional information or the occurrence of a market event which would warrant a re-evaluation of the security’s fair valuation. |
| (c) | Securities classified as Level 3 whose unadjusted values were provided by a pricing service and for which such inputs are unobservable. The Adviser periodically reviews pricing vendor methodologies and inputs to confirm they are determined using unobservable inputs and have been appropriately classified. Such securities’ fair valuations could change significantly based on changes in unobservable inputs used by the pricing service. |
NOTE 4–Derivative Investments
The Fund may enter into an International Swaps and Derivatives Association Master Agreement (“ISDA Master Agreement”) under which a fund may trade OTC derivatives. An OTC transaction entered into under an ISDA Master Agreement typically involves a collateral posting arrangement, payment netting provisions and close-out netting provisions. These netting provisions allow for reduction of credit risk through netting of contractual obligations. The enforceability of the netting provisions of the ISDA Master Agreement depends on the governing law of the ISDA Master Agreement, among other factors.
For financial reporting purposes, the Fund does not offset OTC derivative assets or liabilities that are subject to ISDA Master Agreements in the Consolidated Statement of Assets and Liabilities.
Value of Derivative Investments at Period-End
The table below summarizes the value of the Fund’s derivative investments, detailed by primary risk exposure, held as of February 28, 2022:
| | | | |
| | | Value | |
| Derivative Assets | | Currency
Risk | |
|
| |
Unrealized appreciation on forward foreign currency contracts outstanding | | $ | 6,622,928 | |
|
| |
Derivatives not subject to master netting agreements | | | - | |
|
| |
Total Derivative Assets subject to master netting agreements | | $ | 6,622,928 | |
|
| |
| | | | |
| | | Value | |
| Derivative Liabilities | | Currency
Risk | |
|
| |
Unrealized depreciation on forward foreign currency contracts outstanding | | $ | (4,869,425 | ) |
|
| |
Derivatives not subject to master netting agreements | | | - | |
|
| |
Total Derivative Liabilities subject to master netting agreements | | $ | (4,869,425 | ) |
|
| |
| | |
| 37 | | Invesco Dynamic Credit Opportunity Fund |
Offsetting Assets and Liabilities
| | | | | | | | | | | | | | | | | | |
| | | Financial
Derivative
Assets | | Financial
Derivative
Liabilities | | | | | | Collateral
(Received)/Pledged | | | |
| Counterparty | | Forward Foreign
Currency Contracts | | Forward Foreign
Currency Contracts | | | Net Value of
Derivatives | | | Non-Cash | | Cash | | Net
Amount | |
|
| |
Bank of America, N.A. | | $ 212,602 | | | $ (260,977 | ) | | $ | (48,375 | ) | | $– | | $– | | $ | (48,375 | ) |
|
| |
Barclays Bank PLC | | 257,960 | | | (97 | ) | | | 257,863 | | | – | | – | | | 257,863 | |
|
| |
BNP Paribas S.A. | | 456,973 | | | (335,517 | ) | | | 121,456 | | | – | | – | | | 121,456 | |
|
| |
Canadian Imperial Bank of Commerce | | 1,015,299 | | | (1,033,783 | ) | | | (18,484 | ) | | – | | – | | | (18,484 | ) |
|
| |
Citibank N.A. | | – | | | (331 | ) | | | (331 | ) | | – | | – | | | (331 | ) |
|
| |
Goldman Sachs International | | 449,812 | | | (461,003 | ) | | | (11,191 | ) | | – | | – | | | (11,191 | ) |
|
| |
J.P. Morgan Chase Bank, N.A. | | 437,665 | | | (120,770 | ) | | | 316,895 | | | – | | – | | | 316,895 | |
|
| |
Morgan Stanley and Co. International PLC | | 784,836 | | | (114 | ) | | | 784,722 | | | – | | – | | | 784,722 | |
|
| |
Royal Bank of Canada | | 684,428 | | | (230,691 | ) | | | 453,737 | | | – | | – | | | 453,737 | |
|
| |
State Street Bank & Trust Co. | | 1,266,771 | | | (1,294,875 | ) | | | (28,104 | ) | | – | | – | | | (28,104 | ) |
|
| |
Toronto Dominion Bank | | 1,054,908 | | | (1,073,002 | ) | | | (18,094 | ) | | – | | – | | | (18,094 | ) |
|
| |
UBS AG | | 1,674 | | | (58,265 | ) | | | (56,591 | ) | | – | | – | | | (56,591 | ) |
|
| |
Total | | $6,622,928 | | | $(4,869,425 | ) | | $ | 1,753,503 | | | $– | | $– | | $ | 1,753,503 | |
|
| |
Effect of Derivative Investments for the year ended February 28, 2022
The table below summarizes the gains (losses) on derivative investments, detailed by primary risk exposure, recognized in earnings during the period:
| | |
| | | Location of Gain on
Consolidated Statement of Operations |
| | | Currency Risk |
Realized Gain:
Forward foreign currency contracts | | $21,002,589 |
Change in Net Unrealized Appreciation:
Forward foreign currency contracts | | 1,244,664 |
Total | | $22,247,253 |
The table below summarizes the average notional value of derivatives held during the period.
| | | | |
| | | Forward
Foreign Currency
Contracts | |
Average notional value | | $ | 1,020,315,280 | |
NOTE 5–Trustees’ and Officers’ Fees and Benefits
Trustees’ and Officers’ Fees and Benefits include amounts accrued by the Fund to pay remuneration to certain Trustees and Officers of the Fund. Trustees have the option to defer compensation payable by the Fund, and Trustees’ and Officers’ Fees and Benefits also include amounts accrued by the Fund to fund such deferred compensation amounts. Those Trustees who defer compensation have the option to select various Invesco Funds in which their deferral accounts shall be deemed to be invested. Finally, certain current Trustees were eligible to participate in a retirement plan that provided for benefits to be paid upon retirement to Trustees over a period of time based on the number of years of service. The Fund may have certain former Trustees who also participate in a retirement plan and receive benefits under such plan. Trustees’ and Officers’ Fees and Benefits include amounts accrued by the Fund to fund such retirement benefits. Obligations under the deferred compensation and retirement plans represent unsecured claims against the general assets of the Fund.
NOTE 6–Cash Balances and Borrowings
The Fund has entered into a $290 million revolving credit and security agreement, which will expire on October 31, 2022. Prior to the Reorganization, the Predecessor Fund had entered into a $325 million revolving credit and security agreement. The revolving credit and security agreement is secured by the assets of the Fund. The Fund is subject to certain covenants relating to the revolving credit and security agreement. Failure to comply with these restrictions could cause the acceleration of the repayment of the amount outstanding under the revolving credit and security agreement.
During the year ended February 28, 2022, the average daily balance of borrowing under the revolving credit and security agreement was $218,969,863 with an average interest rate of 1.05%. The carrying amount of the Fund’s payable for borrowings as reported on the Consolidated Statement of Assets and Liabilities approximates its fair value. Expenses under the revolving credit and security agreement are shown in the Consolidated Statement of Operations as Interest, facilities and maintenance fees.
Additionally, the Fund is permitted to temporarily carry a negative or overdrawn balance in its account with SSB, the custodian bank. Such balances, if any at period-end, are shown in the Consolidated Statement of Assets and Liabilities under the payable caption Amount due custodian. To compensate the custodian bank for such overdrafts, the overdrawn Fund may either (1) leave funds as a compensating balance in the account so the custodian bank can be compensated by earning the additional interest; or (2) compensate by paying the custodian bank at a rate agreed upon by the custodian bank and Invesco, not to exceed the contractually agreed upon rate.
| | |
| 38 | | Invesco Dynamic Credit Opportunity Fund |
NOTE 7–Unfunded Loan Commitments
Pursuant to the terms of certain Senior Loan agreements, the Fund held the following unfunded loan commitments as of February 28, 2022. The Fund intends to reserve against such contingent obligations by designating cash, liquid securities and liquid Senior Loans as a reserve. Unfunded loan commitments are reflected as a liability on the Consolidated Statement of Assets and Liabilities.
| | | | | | | | | | |
| Borrower | | Type | | Unfunded Loan
Commitment | | | Unrealized
Appreciation
(Depreciation) | |
athenahealth, Inc. | | Delayed Draw Term Loan B | | $ | 893,791 | | | | $ (2,582 | ) |
Boeing Co. | | Revolver Loan | | | 17,059,495 | | | | 136,132 | |
BrightPet | | Delayed Draw Term Loan | | | 1,183,173 | | | | 22,852 | |
BrightPet | | Revolver Loan | | | 340,283 | | | | 6,892 | |
BrightPet | | Revolver Loan | | | 43,254 | | | | 836 | |
Brook & Whittle Holding Corp. | | Delayed Draw Term Loan | | | 136,887 | | | | 76 | |
CV Intermediate Holdco Corp. | | Revolver Loan | | | 1,242,782 | | | | 6,182 | |
DexKo Global, Inc. | | Delayed Draw Term Loan | | | 6,638 | | | | (69 | ) |
Dun & Bradstreet Corp. (The) | | Revolver Loan | | | 3,470,445 | | | | 0 | |
Groundworks LLC | | First Lien Incremental Revover Loan | | | 513,070 | | | | 5,734 | |
IAP Worldwide Services, Inc. | | Revolver Loan | | | 1,444,403 | | | | 0 | |
Icebox Holdco III, Inc. | | Delayed Draw Term Loan | | | 303,883 | | | | (573 | ) |
Kantar | | Revolver Loan | | | 2,221,660 | | | | 78,340 | |
Keg Logistics LLC | | Revolver Loan | | | 1,835,276 | | | | (1,234 | ) |
Lamark Media Group LLC | | Delayed Draw Term Loan | | | 1,527,935 | | | | 0 | |
Lamark Media Group LLC | | Revolver Loan | | | 555,006 | | | | (366 | ) |
McDermott International Ltd. | | LOC | | | 4,083,292 | | | | (714,576 | ) |
Muth Mirror Systems LLC | | Revolver Loan | | | 1,672,751 | | | | (52,576 | ) |
NAS LLC | | Revolver Loan | | | 728,611 | | | | 10,680 | |
Novae LLC | | Delayed Draw Term Loan | | | 286,046 | | | | (1,609 | ) |
Parques Reunidos | | Revolver Loan | | | 2,023,315 | | | | (86,636 | ) |
Royal Caribbean Cruises | | Revolver Loan | | | 1,821,311 | | | | 29,403 | |
Royal Caribbean Cruises | | Revolver Loan | | | 1,109,938 | | | | 15,163 | |
Royal Caribbean Cruises | | Revolver Loan | | | 3,275,473 | | | | 6,277 | |
Southcross Energy Partners L.P. | | Revolver Loan | | | 78,225 | | | | (1,955 | ) |
Transtar Industries, Inc. | | Delayed Draw Term Loan | | | 1,196,907 | | | | 26,709 | |
USF S&H Holdco LLC | | Term Loan A | | | 1,000,278 | | | | 0 | |
| | | | | $ | 50,054,128 | | | | $(516,900 | ) |
NOTE 8–Distributions to Shareholders and Tax Components of Net Assets
| | | | | | | | |
Tax Character of Distributions to Shareholders Paid During the Fiscal Years Ended February 28, 2022 and 2021: | |
| | |
| | | 2022 | | | 2021 | |
Ordinary income* | | $ | 52,020,720 | | | $ | 46,568,722 | |
Ordinary income-tax-exempt VRDP shares | | | 65,334 | | | | 598,417 | |
Return of capital | | | – | | | | 10,113,405 | |
Total distributions | | $ | 52,086,054 | | | $ | 57,280,544 | |
| * | Includes short-term capital gain distributions, if any. |
| | | | |
Tax Components of Net Assets at Period-End: | | | |
| |
| | | 2022 | |
|
| |
Undistributed ordinary income | | $ | 4,175,323 | |
|
| |
Net unrealized appreciation (depreciation) - investments | | | (60,921,111 | ) |
|
| |
Net unrealized appreciation (depreciation) - foreign currencies | | | (1,552,385 | ) |
|
| |
Temporary book/tax differences | | | (23,161 | ) |
|
| |
Capital loss carryforward | | | (60,653,835 | ) |
|
| |
Shares of beneficial interest | | | 741,181,862 | |
|
| |
Total net assets | | $ | 622,206,693 | |
|
| |
| | |
| 39 | | Invesco Dynamic Credit Opportunity Fund |
The difference between book-basis and tax-basis unrealized appreciation (depreciation) is due to differences in the timing of recognition of gains and losses on investments for tax and book purposes. The Fund’s net unrealized appreciation (depreciation) difference is attributable primarily to derivative instruments, amortization and accretion on debt securities.
The temporary book/tax differences are a result of timing differences between book and tax recognition of income and/or expenses. The Fund’s temporary book/tax differences are the result of the trustee deferral of compensation and retirement plan benefits.
Capital loss carryforward is calculated and reported as of a specific date. Results of transactions and other activity after that date may affect the amount of capital loss carryforward actually available for the Fund to utilize. The ability to utilize capital loss carryforward in the future may be limited under the Internal Revenue Code and related regulations based on the results of future transactions.
The Fund has a capital loss carryforward as of February 28, 2022, as follows:
| | | | | | | | |
| Capital Loss Carryforward* |
|
|
| Expiration | | | | Short-Term | | Long-Term | | Total |
|
|
Not subject to expiration | | $11,177,131 | | $49,476,704 | | $60,653,835 |
|
|
| * | Capital loss carryforward is reduced for limitations, if any, to the extent required by the Internal Revenue Code and may be further limited depending upon a variety of factors, including the realization of net unrealized gains or losses as of the date of any reorganization. |
NOTE 9–Investment Transactions
The aggregate amount of investment securities (other than short-term securities, U.S. Government obligations and money market funds, if any) purchased and sold by the Fund during the year ended February 28, 2022 was $957,723,892 and $1,266,976,442, respectively. Cost of investments, including any derivatives, on a tax basis includes the adjustments for financial reporting purposes as of the most recently completed federal income tax reporting period-end.
| | | | |
Unrealized Appreciation (Depreciation) of Investments on a Tax Basis | |
Aggregate unrealized appreciation of investments | | | $ 41,597,777 | |
|
| |
Aggregate unrealized (depreciation) of investments | | | (102,518,888 | ) |
|
| |
Net unrealized appreciation (depreciation) of investments | | | $ (60,921,111 | ) |
|
| |
Cost of investments for tax purposes is $976,917,323.
NOTE 10–Reclassification of Permanent Differences
Primarily as a result of differing book/tax treatment of foreign currency transactions, on February 28, 2022, undistributed net investment income was increased by $27,395,138, undistributed net realized gain (loss) was decreased by $27,394,935 and shares of beneficial interest was decreased by $203. This reclassification had no effect on the net assets of the Fund.
NOTE 11–Senior Loan Participation Commitments
The Fund invests in participations, assignments, or acts as a party to the primary lending syndicate of a Senior Loan interest to corporations, partnerships, and other entities. When the Fund purchases a participation of a Senior Loan interest, the Fund typically enters into a contractual agreement with the lender or other third party selling the participation, but not with the borrower directly. As such, the Fund assumes the credit risk of the borrower, selling participant or other persons interpositioned between the Fund and the borrower.
At the year ended February 28, 2022, the following sets forth the selling participants with respect to interest in Senior Loans purchased by the Fund on a participation basis.
| | | | |
| | | Principal | | |
| Selling Participant | | Amount | | Value |
|
|
Barclays Bank PLC | | $4,083,292 | | $3,368,716 |
|
|
NOTE 12–Variable Rate Demand Preferred Shares
On June 7, 2021, the Predecessor Fund redeemed all of its outstanding Variable Rate Demand Preferred Shares (“VRDP Shares”) at their liquidation preference.
Dividends paid on the VRDP Shares (which are treated as interest expense for financial reporting purposes) were declared daily and paid monthly. As of June 6, 2021, the dividend rate was equal to the USD LIBOR interest rate plus a spread of 0.15%, which is based on the short-term credit rating assigned to the VRDP Shares by Moody’s Investors Service, Inc. The average aggregate liquidation preference outstanding and the average annualized dividend rate of the VRDP Shares during the period ended, March 1, 2021 through June 6, 2021, were $100,000,000 and 0.24%, respectively.
The Predecessor Fund was subject to certain restrictions relating to the VRDP Shares, such as maintaining certain asset coverage and leverage ratio requirements. Failure to comply with these restrictions would have precluded the Predecessor Fund from declaring any distributions to common shareholders or purchasing common shares and/or would have triggered an increased rate which, if not cured, would have caused the mandatory redemption of VRDP Shares at the maximum liquidation preference plus any accumulated but unpaid dividends.
Dividends paid on VRDP Shares are recognized as a component of Interest, facilities and maintenance fees on the Consolidated Statement of Operations.
NOTE 13–Dividends
The Fund declared the following quarterly dividends from net investment income subsequent to February 28, 2022.
| | | | |
| | | | | Amount Per Share |
| Share Class | | Record Date | | Payable March 31, 2022 |
Class A | | Daily | | $0.2172 |
|
|
Class AX | | Daily | | $0.2250 |
|
|
Class Y | | Daily | | $0.2250 |
|
|
Class R6 | | Daily | | $0.2268 |
|
|
| | |
| 40 | | Invesco Dynamic Credit Opportunity Fund |
NOTE 14–Repurchase of Shares
The Fund has a policy of making quarterly repurchase offers (“Repurchase Offers”) for the Fund’s common shares pursuant to Rule 23c-3(b) of the 1940 Act.
The Repurchase Offers will be for between 5% and 25% of the Fund’s outstanding shares; however, the Fund’s present intent for the offers is for the minimum amount of 5% (The Board of Trustees may authorize an additional 2%, if necessary, without extending the Repurchase Offers). The Fund expects its initial Repurchase Offer to commence in the first quarter of 2022.
The Predecessor Fund conducted a tender offer for cash of up to twenty percent of the Predecessor Fund’s outstanding common shares of beneficial interest (12,596,028 shares), which commenced on September 8, 2021 and expired on October 7, 2021 (the “Expiration Date”). Approximately 32,779,030 common shares, or approximately 52.05% of the Predecessor Fund’s common shares outstanding, were tendered by shareholders through the Expiration Date. The Predecessor Fund accepted 12,596,028 shares for cash payment at a price equal to $12.24 per share. Following the purchase of the tendered shares, the Predecessor Fund had approximately 50,384,113 common shares outstanding.
NOTE 15–Share Information
| | | | | | | | | | | | | | | | |
| | | Summary of Share Activity | |
|
| |
| | | Year ended | | | Year ended | |
| | | February 28, 2022(a) | | | February 28, 2021 | |
| | | Shares | | | Amount | | | Shares | | | Amount | |
|
| |
Sold: | | | | | | | | | | | | | | | | |
Class A(b) | | | 964 | | | $ | 12,014 | | | | - | | | $ | - | |
|
| |
Class AX | | | 96,790 | | | | 1,205,165 | | | | - | | | | - | |
|
| |
Class Y(b) | | | 884 | | | | 11,012 | | | | - | | | | - | |
|
| |
Class R6(b) | | | 804 | | | | 10,012 | | | | - | | | | - | |
|
| |
| | | | |
Issued as reinvestment of dividends: | | | | | | | | | | | | | | | | |
Class AX | | | 206,214 | | | | 2,567,361 | | | | - | | | | - | |
|
| |
Class Y(b) | | | 1 | | | | 12 | | | | - | | | | - | |
|
| |
| | | | |
Reacquired: | | | | | | | | | | | | | | | | |
Class AX | | | (12,596,028 | )(c) | | | (154,216,383 | )(c) | | | (0) | | | | (17,730 | ) |
|
| |
Net increase (decrease) in share activity | | | (12,290,371 | ) | | $ | (150,410,807 | ) | | | (0) | | | $ | (17,730 | ) |
|
| |
| (a) | There are entities that are record owners of more than 5% of the outstanding shares of the Fund and in the aggregate own 47% of the outstanding shares of the Fund. IDI has an agreement with these entities to sell Fund shares. The Fund, Invesco and/or Invesco affiliates may make payments to these entities, which are considered to be related to the Fund, for providing services to the Fund, Invesco and/or Invesco affiliates including but not limited to services such as securities brokerage, distribution, third party record keeping and account servicing. The Fund has no knowledge as to whether all or any portion of the shares owned of record by these entities are also owned beneficially. |
| (b) | Commencement date of November 1, 2021. |
| (c) | Closed-End Fund repurchased and retired Common Shares. See Note 14. |
| | |
| 41 | | Invesco Dynamic Credit Opportunity Fund |
Report of Independent Registered Public Accounting Firm
To the Board of Trustees and Shareholders of Invesco Dynamic Credit Opportunity Fund
Opinion on the Financial Statements
We have audited the accompanying consolidated statement of assets and liabilities, including the consolidated schedule of investments, of Invesco Dynamic Credit Opportunity Fund and its subsidiaries (the “Fund”) as of February 28, 2022, the related consolidated statements of operations and cash flows for the year ended February 28, 2022, the consolidated statement of changes in net assets for each of the two years in the period ended February 28, 2022, including the related notes, and the consolidated financial highlights for each of the periods indicated therein (collectively referred to as the consolidated “financial statements”). In our opinion, the consolidated financial statements present fairly, in all material respects, the financial position of the Fund as of February 28, 2022, the results of its operations and its cash flows for the year then ended, the changes in its net assets for each of the two years in the period ended February 28, 2022 and the financial highlights for each of the periods indicated therein in conformity with accounting principles generally accepted in the United States of America.
Basis for Opinion
These consolidated financial statements are the responsibility of the Fund’s management. Our responsibility is to express an opinion on the Fund’s consolidated financial statements based on our audits. We are a public accounting firm registered with the Public Company Accounting Oversight Board (United States) (PCAOB) and are required to be independent with respect to the Fund in accordance with the U.S. federal securities laws and the applicable rules and regulations of the Securities and Exchange Commission and the PCAOB.
We conducted our audits of these consolidated financial statements in accordance with the standards of the PCAOB. Those standards require that we plan and perform the audit to obtain reasonable assurance about whether the consolidated financial statements are free of material misstatement, whether due to error or fraud.
Our audits included performing procedures to assess the risks of material misstatement of the consolidated financial statements, whether due to error or fraud, and performing procedures that respond to those risks. Such procedures included examining, on a test basis, evidence regarding the amounts and disclosures in the consolidated financial statements. Our audits also included evaluating the accounting principles used and significant estimates made by management, as well as evaluating the overall presentation of the consolidated financial statements. Our procedures included confirmation of securities owned as of February 28, 2022 by correspondence with the custodian, transfer agent, brokers, and agent banks; when replies were not received from brokers or agent banks, we performed other auditing procedures. We believe that our audits provide a reasonable basis for our opinion.
/s/PricewaterhouseCoopers LLP
Houston, Texas
April 28, 2022
We have served as the auditor of one or more of the investment companies in the Invesco group of investment companies since at least 1995. We have not been able to determine the specific year we began serving as auditor.
| | |
| 42 | | Invesco Dynamic Credit Opportunity Fund |
Calculating your ongoing Fund expenses
Example
As a shareholder of the Fund, you incur two types of costs: (1) transaction costs, which may include sales charges (loads) on purchase payments or contingent deferred sales charges on redemptions, if any; and (2) ongoing costs, including management fees, distribution and/or service (12b-1) fees, and other Fund expenses. This example is intended to help you understand your ongoing costs (in dollars) of investing in the Fund and to compare these costs with ongoing costs of investing in other mutual funds. The example is based on an investment of $1,000 invested at the beginning of the period and held for the entire period September 1, 2021 through February 28, 2022.
Actual expenses
The table below provides information about actual account values and actual expenses. You may use the information in this table, together with the amount you invested, to estimate the expenses that you paid over the period. Simply divide your account value by $1,000 (for example, an $8,600 account value divided by $1,000 = 8.6), then multiply the result by the number in the table under the heading entitled “Actual Expenses Paid During Period” to estimate the expenses you paid on your account during this period.
Hypothetical example for comparison purposes
The table below also provides information about hypothetical account values and hypothetical expenses based on the Fund’s actual expense ratio and an assumed rate of return of 5% per year before expenses, which is not the Fund’s actual return.
The hypothetical account values and expenses may not be used to estimate the actual ending account balance or expenses you paid for the period. You may use this information to compare the ongoing costs of investing in the Fund and other funds. To do so, compare this 5% hypothetical example with the 5% hypothetical examples that appear in the shareholder reports of the other funds.
Please note that the expenses shown in the table are meant to highlight your ongoing costs only and do not reflect any transaction costs, such as sales charges (loads) on purchase payments or contingent deferred sales charges on redemptions, if any. Therefore, the hypothetical information is useful in comparing ongoing costs only, and will not help you determine the relative total costs of owning different funds. In addition, if these transaction costs were included, your costs would have been higher.
| | | | | | | | | | | | |
| | | | | ACTUAL | | HYPOTHETICAL (5% annual return before expenses) | | |
| | | Beginning
Account Value
(09/01/21) | | Ending
Account Value
(02/28/22)1 | | Expenses
Paid During
Period2 | | Ending
Account Value
(02/28/22) | | Expenses
Paid During
Period3 | | Annualized Expense Ratio2 |
Class A | | $1,000.00 | | $1,010.40 | | $9.35 | | $1,010.76 | | $14.11 | | 2.83% |
Class AX | | 1,000.00 | | 1,027.70 | | 12.42 | | 1,012.55 | | 12.33 | | 2.47 |
Class Y | | 1,000.00 | | 1,011.20 | | 8.56 | | 1,011.95 | | 12.92 | | 2.59 |
Class R6 | | 1,000.00 | | 1,011.40 | | 8.37 | | 1,012.25 | | 12.62 | | 2.53 |
| 1 | The actual ending account value is based on the actual total return of the Funds for the period September 1, 2021, through February 28, 2022 (effective November 1, 2021, through February 28, 2022 for Class A, Y and R6 shares), after actual expenses and will differ from the hypothetical ending account value which is based on the Fund’s expense ratio and a hypothetical annual return of 5% before expenses. |
| 2 | Expenses are equal to each Fund’s annualized expense ratio as indicated above multiplied by the average account value over the period, multiplied by 181/365 to reflect the most recent fiscal half year. For Class A, Y and R6 shares actual expenses are equal to the annualized expense ratio indicated above multiplied by the average account value over the period, multiplied by 120 (effective November 1, 2021, through February 28, 2022)/365. Because Class A, Y and R6 shares have not been in existence for a full six month period, the actual ending account value and expense information shown may not provide a meaningful comparison to fund expense information of classes that show such data for a full six month period and, because the actual ending account value and expense information in the expense example covers a short time period, return and expense data may not be indicative of return and expense data for longer time periods. |
| 3 | Hypothetical expenses are equal to the annualized expense ratio indicated above multiplied by the average account value over the period, multiplied by 181/365 to reflect a one-half year period. The hypothetical ending account value and expenses may be used to compare ongoing costs of investing in Class A, Y and R6 shares of each Fund and other funds because such data is based on a full six months period. |
| | |
| 43 | | Invesco Dynamic Credit Opportunity Fund |
Tax Information
Form 1099-DIV, Form 1042-S and other year–end tax information provide shareholders with actual calendar year amounts that should be included in their tax returns. Shareholders should consult their tax advisers.
The following distribution information is being provided as required by the Internal Revenue Code or to meet a specific state’s requirement.
The Fund designates the following amounts or, if subsequently determined to be different, the maximum amount allowable for its fiscal year ended February 28, 2022:
| | | | | | |
| | | | | | |
Federal and State Income Tax | | | | |
Qualified Dividend Income* | | | 5.01 | % |
Corporate Dividends Received Deduction* | | | 2.23 | % |
U.S. Treasury Obligations* | | | 0.00 | % |
Qualified Business Income* | | | 0.00 | % |
Business Interest Income* | | | 74.51 | % |
| | * | | The above percentages are based on ordinary income dividends paid to shareholders during the Fund’s fiscal year. |
| | | | | | |
| | | | | | |
Non-Resident Alien Shareholders | | | | |
Qualified Interest Income** | | | 37.45 | % |
**The above percentage is based on income dividends paid to shareholders during the Fund’s fiscal year.
| | |
| 44 | | Invesco Dynamic Credit Opportunity Fund |
Trustees and Officers
The address of each trustee and officer is 1555 Peachtree Street, N.E., Atlanta, Georgia 30309. Generally, each trustee serves for a three year term or until his or her successor has been duly elected and qualified, and each officer serves for a one year term or until his or her successor has been duly elected and qualified. Column two below includes length of time served with predecessor entities, if any.
| | | | | | | | |
Name, Year of Birth and Position(s) Held with the Trust | | Trustee and/or Officer Since | | Principal Occupation(s) During Past 5 Years | | Number of Funds in
Fund Complex Overseen by
Trustee | | Other
Directorship(s)
Held by Trustee
During Past 5
Years |
| Interested Trustee | | | | | | | | |
| Martin L. Flanagan1 – 1960 Trustee and Vice Chair | | 2021 | | Executive Director, Chief Executive Officer and President, Invesco Ltd. (ultimate parent of Invesco and a global investment management firm); Trustee and Vice Chair, The Invesco Funds; Vice Chair, Investment Company Institute; and Member of Executive Board, SMU Cox School of Business Formerly: Advisor to the Board, Invesco Advisers, Inc. (formerly known as Invesco Institutional (N.A.), Inc.); Chairman and Chief Executive Officer, Invesco Advisers, Inc. (registered investment adviser); Director, Chairman, Chief Executive Officer and President, Invesco Holding Company (US), Inc. (formerly IVZ Inc.) (holding company), Invesco Group Services, Inc. (service provider) and Invesco North American Holdings, Inc. (holding company); Director, Chief Executive Officer and President, Invesco Holding Company Limited (parent of Invesco and a global investment management firm); Director, Invesco Ltd.; Chairman, Investment Company Institute and President, Co-Chief Executive Officer, Co-President, Chief Operating Officer and Chief Financial Officer, Franklin Resources, Inc. (global investment management organization) | | 188 | | None |
| 1 | Mr. Flanagan is considered an interested person (within the meaning of Section 2(a)(19) of the 1940 Act) of the Trust because he is an officer of the Adviser to the Trust, and an officer and a director of Invesco Ltd., ultimate parent of the Adviser. |
| | |
| T-1 | | Invesco Dynamic Credit Opportunity Fund |
Trustees and Officers–(continued)
| | | | | | | | |
Name, Year of Birth and Position(s) Held with the Trust | | Trustee and/or Officer Since | | Principal Occupation(s) During Past 5 Years | | Number of Funds in
Fund Complex
Overseen by
Trustee | | Other
Directorship(s)
Held by Trustee
During Past 5
Years |
| Independent Trustees |
| Christopher L. Wilson – 1957 Trustee and Chair | | 2021 | | Retired Formerly: Director, TD Asset Management USA Inc. (mutual fund complex) (22 portfolios); Managing Partner, CT2, LLC (investing and consulting firm); President/Chief Executive Officer, Columbia Funds, Bank of America Corporation; President/Chief Executive Officer, CDC IXIS Asset Management Services, Inc.; Principal & Director of Operations, Scudder Funds, Scudder, Stevens & Clark, Inc.; Assistant Vice President, Fidelity Investments | | 188 | | Formerly: enaible, Inc. (artificial intelligence technology) Director, ISO New England, Inc. (non-profit organization managing regional electricity market) |
Beth Ann Brown – 1968 Trustee | | 2021 | | Independent Consultant Formerly: Head of Intermediary Distribution, Managing Director, Strategic Relations, Managing Director, Head of National Accounts, Senior Vice President, National Account Manager and Senior Vice President, Key Account Manager, Columbia Management Investment Advisers LLC; Vice President, Key Account Manager, Liberty Funds Distributor, Inc.; and Trustee of certain Oppenheimer Funds | | 188 | | Director, Board of Directors of Caron Engineering Inc.; Advisor, Board of Advisors of Caron Engineering Inc.; President and Director, Acton Shapleigh Youth Conservation Corps (non-profit) Formerly: President and Director of Grahamtastic Connection (non-profit) |
Cynthia Hostetler –1962 Trustee | | 2021 | | Non-Executive Director and Trustee of a number of public and private business corporations Formerly: Director, Aberdeen Investment Funds (4 portfolios); Director, Artio Global Investment LLC (mutual fund complex); Director, Edgen Group, Inc. (specialized energy and infrastructure products distributor); Director, Genesee & Wyoming, Inc. (railroads); Head of Investment Funds and Private Equity, Overseas Private Investment Corporation; President, First Manhattan Bancorporation, Inc.; Attorney, Simpson Thacher & Bartlett LLP | | 188 | | Resideo Technologies, Inc. (smart home technology); Vulcan Materials Company (construction materials company); Trilinc Global Impact Fund; Textainer Group Holdings, (shipping container leasing company); Investment Company Institute (professional organization); Independent Directors Council (professional organization) |
Eli Jones – 1961 Trustee | | 2021 | | Professor and Dean Emeritus, Mays Business School - Texas A&M University Formerly: Dean of Mays Business School-Texas A&M University; Professor and Dean, Walton College of Business, University of Arkansas and E.J. Ourso College of Business, Louisiana State University; Director, Arvest Bank | | 188 | | Insperity, Inc. (formerly known as Administaff) (human resources provider); Member of Regional Board of Directors and Board of Directors, First Financial Bancorp (regional bank) |
| Elizabeth Krentzman – 1959 Trustee | | 2021 | | Formerly: Principal and Chief Regulatory Advisor for Asset Management Services and U.S. Mutual Fund Leader of Deloitte & Touche LLP; General Counsel of the Investment Company Institute (trade association); National Director of the Investment Management Regulatory Consulting Practice, Principal, Director and Senior Manager of Deloitte & Touche LLP; Assistant Director of the Division of Investment Management - Office of Disclosure and Investment Adviser Regulation of the U.S. Securities and Exchange Commission and various positions with the Division of Investment Management – Office of Regulatory Policy of the U.S. Securities and Exchange Commission; Associate at Ropes & Gray LLP; and Trustee of certain Oppenheimer Funds | | 188 | | Trustee of the University of Florida National Board Foundation; Member of the Cartica Funds Board of Directors (private investment funds) Formerly: Member of the University of Florida Law Center Association, Inc. Board of Trustees, Audit Committee and Membership Committee |
| Anthony J. LaCava, Jr. – 1956 Trustee | | 2021 | | Formerly: Director and Member of the Audit Committee, Blue Hills Bank (publicly traded financial institution) and Managing Partner, KPMG LLP | | 188 | | Blue Hills Bank; Chairman, Bentley University; Member, Business School Advisory Council; and Nominating Committee, KPMG LLP |
| Prema Mathai-Davis – 1950 Trustee | | 2021 | | Retired Formerly: Co-Founder & Partner of Quantalytics Research, LLC, (a FinTech Investment Research Platform for the Self-Directed Investor); Trustee of YWCA Retirement Fund; CEO of YWCA of the USA; Board member of the NY Metropolitan Transportation Authority; Commissioner of the NYC Department of Aging; Board member of Johns Hopkins Bioethics Institute | | 188 | | Member of Board of Positive Planet US (non-profit) and HealthCare Chaplaincy Network (non-profit) |
| | |
| T-2 | | Invesco Dynamic Credit Opportunity Fund |
Trustees and Officers–(continued)
| | | | | | | | |
Name, Year of Birth and Position(s) Held with the Trust | | Trustee and/or Officer Since | | Principal Occupation(s) During Past 5 Years | | Number of Funds in Fund Complex
Overseen by Trustee | | Other Directorship(s) Held by Trustee During Past 5 Years |
| Independent Trustees–(continued) |
Joel W. Motley – 1952 Trustee | | 2021 | | Director of Office of Finance, Federal Home Loan Bank System; Managing Director of Carmona Motley Inc. (privately held financial advisor); Member of the Council on Foreign Relations and its Finance and Budget Committee; Chairman Emeritus of Board of Human Rights Watch and Member of its Investment Committee; and Member of Investment Committee Board of Historic Hudson Valley (non-profit cultural organization); and Member of the Board, Blue Ocean Acquisition Corp. Formerly: Managing Director of Public Capital Advisors, LLC (privately held financial advisor); Managing Director of Carmona Motley Hoffman, Inc. (privately held financial advisor); Trustee of certain Oppenheimer Funds; Director of Columbia Equity Financial Corp. (privately held financial advisor); and Member of the Vestry of Trinity Church Wall Street | | 188 | | Member of Board of Trust for Mutual Understanding (non-profit promoting the arts and environment); Member of Board of Greenwall Foundation (bioethics research foundation) and its Investment Committee; Member of Board of Friends of the LRC (non-profit legal advocacy); Board Member and Investment Committee Member of Pulitzer Center for Crisis Reporting (non-profit journalism)Positive Planet US |
Teresa M. Ressel – 1962 Trustee | | 2021 | | Non-executive director and trustee of a number of public and private business corporations Formerly: Chief Executive Officer, UBS Securities LLC (investment banking); Chief Operating Officer, UBS AG Americas (investment banking); Sr. Management Team Olayan America, The Olayan Group (international investor/commercial/industrial); Assistant Secretary for Management & Budget and Designated Chief Financial Officer, U.S. Department of Treasury; Director, Atlantic Power Corporation (power generation company) and ON Semiconductor Corporation (semiconductor manufacturing) | | 188 | | None |
Ann Barnett Stern – 1957 Trustee | | 2021 | | President, Chief Executive Officer and Board Member, Houston Endowment, Inc. a private philanthropic institution Formerly: Executive Vice President, Texas Children’s Hospital; Vice President, General Counsel and Corporate Compliance Officer, Texas Children’s Hospital; Attorney at Beck, Redden and Secrest, LLP and Andrews and Kurth LLP | | 188 | | Trustee and Board Vice Chair of Holdsworth Center Trustee and Chair of Nomination/Governance Committee, Good Reason Houston, (non-profit); Trustee and Investment Committee member of University of Texas Law School Foundation (non-profit); Board Member of Greater Houston Partnership (non-profit); Advisory Board member, Baker Institute for Public Policy at Rice University (non-profit) Formerly: Director and Audit Committee Member of Federal Reserve Bank of Dallas |
| Robert C. Troccoli – 1949 Trustee | | 2021 | | Retired Formerly: Adjunct Professor, University of Denver – Daniels College of Business; and Managing Partner, KPMG LLP | | 188 | | None |
| Daniel S. Vandivort –1954 Trustee | | 2021 | | President, Flyway Advisory Services LLC (consulting and property management) | | 188 | | Formerly: Trustee, Board of Trustees, Treasurer and Chairman of the Audit and Committee, Huntington Disease Foundation of America; Trustee and Governance Chair, of certain Oppenheimer Funds |
| | |
| T-3 | | Invesco Dynamic Credit Opportunity Fund |
Trustees and Officers–(continued)
| | | | | | | | |
Name, Year of Birth and Position(s) Held with the Trust | | Trustee and/or Officer Since | | Principal Occupation(s) During Past 5 Years | | Number of Funds in Fund Complex
Overseen by Trustee | | Other Directorship(s) Held by Trustee During Past 5 Years |
| Officers |
Sheri Morris – 1964 President and Principal Executive Officer | | 2021 | | Head of Global Fund Services, Invesco Ltd.; President and Principal Executive Officer, The Invesco Funds; Vice President, Invesco Exchange-Traded Fund Trust, Invesco Exchange-Traded Fund Trust II, Invesco India Exchange-Traded Fund Trust, Invesco Actively Managed Exchange-Traded Fund Trust, Invesco Actively Managed Exchange-Traded Commodity Fund Trust and Invesco Exchange-Traded Self-Indexed Fund Trust; and Vice President, OppenheimerFunds, Inc. Formerly: Vice President, Treasurer and Principal Financial Officer, The Invesco Funds; Vice President, Invesco AIM Advisers, Inc., Invesco AIM Capital Management, Inc. and Invesco AIM Private Asset Management, Inc.; Assistant Vice President and Assistant Treasurer, The Invesco Funds; Vice President and Assistant Vice President, Invesco Advisers, Inc.; Assistant Vice President, Invesco AIM Capital Management, Inc. and Invesco AIM Private Asset Management, Inc.; Treasurer, Invesco Exchange-Traded Fund Trust, Invesco Exchange-Traded Fund Trust II, Invesco India Exchange-Traded Fund Trust and Invesco Actively Managed Exchange-Traded Fund Trust and Senior Vice President, Invesco Advisers, Inc. (formerly known as Invesco Institutional (N.A.), Inc.) (registered investment adviser) | | N/A | | N/A |
Jeffrey H. Kupor – 1968 Senior Vice President, Chief Legal Officer and Secretary | | 2021 | | Head of Legal of the Americas, Invesco Ltd.; Senior Vice President and Secretary, Invesco Advisers, Inc. (formerly known as Invesco Institutional (N.A.), Inc.) (registered investment adviser); Senior Vice President and Secretary, Invesco Distributors, Inc. (formerly known as Invesco AIM Distributors, Inc.); Vice President and Secretary, Invesco Investment Services, Inc. (formerly known as Invesco AIM Investment Services, Inc.) Senior Vice President, Chief Legal Officer and Secretary, The Invesco Funds; Secretary and General Counsel, Invesco Investment Advisers LLC (formerly known as Van Kampen Asset Management); Secretary and General Counsel, Invesco Capital Markets, Inc. (formerly known as Van Kampen Funds Inc.) and Chief Legal Officer, Invesco Exchange-Traded Fund Trust, Invesco Exchange-Traded Fund Trust II, Invesco India Exchange-Traded Fund Trust, Invesco Actively Managed Exchange-Traded Fund Trust, Invesco Actively Managed Exchange-Traded Commodity Fund Trust and Invesco Exchange-Traded Self-Indexed Fund Trust;; Secretary and Vice President, Harbourview Asset Management Corporation; Secretary and Vice President, OppenheimerFunds, Inc. and Invesco Managed Accounts, LLC; Secretary and Senior Vice President, OFI Global Institutional, Inc.; Secretary and Vice President, OFI SteelPath, Inc.; Secretary and Vice President, Oppenheimer Acquisition Corp.; Secretary and Vice President, Shareholder Services, Inc.; Secretary and Vice President, Trinity Investment Management Corporation Formerly: Secretary and Vice President, Jemstep, Inc.; Head of Legal, Worldwide Institutional, Invesco Ltd.; Secretary and General Counsel, INVESCO Private Capital Investments, Inc.; Senior Vice President, Secretary and General Counsel, Invesco Management Group, Inc. (formerly known as Invesco AIM Management Group, Inc.); Assistant Secretary, INVESCO Asset Management (Bermuda) Ltd.; Secretary and General Counsel, Invesco Private Capital, Inc.; Assistant Secretary and General Counsel, INVESCO Realty, Inc.; Secretary and General Counsel, Invesco Senior Secured Management, Inc.; Secretary, Sovereign G./P. Holdings Inc.; and Secretary, Invesco Indexing LLC; Secretary, W.L. Ross & Co., LLC | | N/A | | N/A |
| Andrew R. Schlossberg – 1974 Senior Vice President | | 2021 | | Head of the Americas and Senior Managing Director, Invesco Ltd.; Director and Senior Vice President, Invesco Advisers, Inc. (formerly known as Invesco Institutional (N.A.), Inc.) (registered investment adviser); Director and Chairman, Invesco Investment Services, Inc. (formerly known as Invesco AIM Investment Services, Inc.) (registered transfer agent); Senior Vice President, The Invesco Funds; Director, Invesco Investment Advisers LLC (formerly known as Van Kampen Asset Management) Formerly: Director, President and Chairman, Invesco Insurance Agency, Inc.; Director, Invesco UK Limited; Director and Chief Executive, Invesco Asset Management Limited and Invesco Fund Managers Limited; Assistant Vice President, The Invesco Funds; Senior Vice President, Invesco Advisers, Inc. (formerly known as Invesco Institutional (N.A.), Inc.) (registered investment adviser); Director and Chief Executive, Invesco Administration Services Limited and Invesco Global Investment Funds Limited; Director, Invesco Distributors, Inc.; Head of EMEA, Invesco Ltd.; President, Invesco Actively Managed Exchange-Traded Commodity Fund Trust, Invesco Actively Managed Exchange-Traded Fund Trust, Invesco Exchange-Traded Fund Trust, Invesco Exchange-Traded Fund Trust II and Invesco India Exchange-Traded Fund Trust; Managing Director and Principal Executive Officer, Invesco Capital Management LLC | | N/A | | N/A |
| | |
| T-4 | | Invesco Dynamic Credit Opportunity Fund |
Trustees and Officers–(continued)
| | | | | | | | |
Name, Year of Birth and Position(s) Held with the Trust | | Trustee and/or Officer Since | | Principal Occupation(s) During Past 5 Years | | Number of Funds in Fund Complex
Overseen by Trustee | | Other Directorship(s) Held by Trustee During Past 5 Years |
| Officers–(continued) |
John M. Zerr – 1962 Senior Vice President | | 2021 | | Chief Operating Officer of the Americas; Senior Vice President, Invesco Advisers, Inc. (formerly known as Invesco Institutional (N.A.), Inc.) (registered investment adviser); Senior Vice President, Invesco Distributors, Inc. (formerly known as Invesco AIM Distributors, Inc.); Director and Vice President, Invesco Investment Services, Inc. (formerly known as Invesco AIM Investment Services, Inc.) Senior Vice President, The Invesco Funds; Managing Director, Invesco Capital Management LLC; Director, Invesco Investment Advisers LLC (formerly known as Van Kampen Asset Management); Senior Vice President, Invesco Capital Markets, Inc. (formerly known as Van Kampen Funds Inc.); Manager, Invesco Indexing LLC; Manager, Invesco Specialized Products, LLC; Member, Invesco Canada Funds Advisory Board; Director, President and Chief Executive Officer, Invesco Corporate Class Inc. (corporate mutual fund company); and Director, Chairman, President and Chief Executive Officer, Invesco Canada Ltd. (formerly known as Invesco Trimark Ltd./Invesco Trimark Ltèe) (registered investment adviser and registered transfer agent); President, Invesco, Inc.; President, Invesco Global Direct Real Estate Feeder GP Ltd.; President, Invesco IP Holdings (Canada) Ltd; President, Invesco Global Direct Real Estate GP Ltd.; President, Invesco Financial Services Ltd. / Services Financiers Invesco Ltée; and Director and Chairman, Invesco Trust Company Formerly: President, Trimark Investments Ltd/Services Financiers Invesco Ltee; Director and Senior Vice President, Invesco Insurance Agency, Inc.; Director and Senior Vice President, Invesco Management Group, Inc. (formerly known as Invesco AIM Management Group, Inc.); Secretary and General Counsel, Invesco Management Group, Inc. (formerly known as Invesco AIM Management Group, Inc.); Secretary, Invesco Investment Services, Inc. (formerly known as Invesco AIM Investment Services, Inc.); Chief Legal Officer and Secretary, The Invesco Funds; Secretary and General Counsel, Invesco Investment Advisers LLC (formerly known as Van Kampen Asset Management); Secretary and General Counsel, Invesco Capital Markets, Inc. (formerly known as Van Kampen Funds Inc.); Chief Legal Officer, Invesco Exchange-Traded Fund Trust, Invesco Exchange-Traded Fund Trust II, Invesco India Exchange-Traded Fund Trust, Invesco Actively Managed Exchange-Traded Fund Trust, Invesco Actively Managed Exchange-Traded Commodity Fund Trust and Invesco Exchange-Traded Self-Indexed Fund Trust; Secretary, Invesco Indexing LLC; Director, Secretary, General Counsel and Senior Vice President, Van Kampen Exchange Corp.; Director, Vice President and Secretary, IVZ Distributors, Inc. (formerly known as INVESCO Distributors, Inc.); Director and Vice President, INVESCO Funds Group, Inc.; Director and Vice President, Van Kampen Advisors Inc.; Director, Vice President, Secretary and General Counsel, Van Kampen Investor Services Inc.;Director and Secretary, Invesco Distributors, Inc. (formerly known as Invesco AIM Distributors, Inc.); Director, Senior Vice President, General Counsel and Secretary, Invesco AIM Advisers, Inc. and Van Kampen Investments Inc.; Director, Vice President and Secretary, Fund Management Company; Director, Senior Vice President, Secretary, General Counsel and Vice President, Invesco AIM Capital Management, Inc.; Chief Operating Officer and General Counsel, Liberty Ridge Capital, Inc. (an investment adviser) | | N/A | | N/A |
| Gregory G. McGreevey – 1962 Senior Vice President | | 2021 | | Senior Managing Director, Invesco Ltd.; Director, Chairman, President, and Chief Executive Officer, Invesco Advisers, Inc. (formerly known as Invesco Institutional (N.A.), Inc.) (registered investment adviser); Director, Invesco Mortgage Capital, Inc. and Invesco Senior Secured Management, Inc.; Senior Vice President, The Invesco Funds; President, SNW Asset Management Corporation and Invesco Managed Accounts, LLC; Chairman and Director, Invesco Private Capital, Inc.; Chairman and Director, INVESCO Private Capital Investments, Inc.; Chairman and Director, INVESCO Realty, Inc.; and Senior Vice President, Invesco Group Services, Inc. Formerly: Senior Vice President, Invesco Management Group, Inc. and Invesco Advisers, Inc.; Assistant Vice President, The Invesco Funds | | N/A | | N/A |
| Adrien Deberghes – 1967 Principal Financial Officer, Treasurer and Vice President | | 2021 | | Head of the Fund Office of the CFO and Fund Administration; Vice President, Invesco Advisers, Inc.; Principal Financial Officer, Treasurer and Vice President, The Invesco Funds; Vice President, Invesco Exchange-Traded Fund Trust, Invesco Exchange-Traded Fund Trust II, Invesco India Exchange-Traded Fund Trust, Invesco Actively Managed Exchange-Traded Fund Trust, Invesco Actively Managed Exchange-Traded Commodity Fund Trust and Invesco Exchange-Traded Self-Indexed Fund Trust Formerly: Senior Vice President and Treasurer, Fidelity Investments | | N/A | | N/A |
Crissie M. Wisdom – 1969 Anti-Money Laundering Compliance Officer | | 2021 | | Anti-Money Laundering and OFAC Compliance Officer for Invesco U.S. entities including: Invesco Advisers, Inc. and its affiliates, Invesco Capital Markets, Inc., Invesco Distributors, Inc., Invesco Investment Services, Inc., The Invesco Funds, Invesco Capital Management, LLC, Invesco Trust Company; and Fraud Prevention Manager for Invesco Investment Services, Inc. | | N/A | | N/A |
| | |
| T-5 | | Invesco Dynamic Credit Opportunity Fund |
Trustees and Officers–(continued)
| | | | | | | | |
Name, Year of Birth and Position(s) Held with the Trust | | Trustee and/or Officer Since | | Principal Occupation(s) During Past 5 Years | | Number of Funds in Fund Complex
Overseen by Trustee | | Other Directorship(s) Held by Trustee During Past 5 Years |
| Officers–(continued) | | | | | | | | |
Todd F. Kuehl – 1969 Chief Compliance Officer and Senior Vice President | | 2021 | | Chief Compliance Officer, Invesco Advisers, Inc. (registered investment adviser); and Chief Compliance Officer, The Invesco Funds and Senior Vice President Formerly: Managing Director and Chief Compliance Officer, Legg Mason (Mutual Funds); Chief Compliance Officer, Legg Mason Private Portfolio Group (registered investment adviser) | | N/A | | N/A |
Michael McMaster – 1962 Chief Tax Officer, Vice President and Assistant Treasurer | | 2021 | | Head of Global Fund Services Tax; Chief Tax Officer, Vice President and Assistant Treasurer, The Invesco Funds; Vice President, Invesco Advisers, Inc.; Assistant Treasurer, Invesco Capital Management LLC, Assistant Treasurer and Chief Tax Officer, Invesco Exchange-Traded Fund Trust, Invesco Exchange-Traded Fund Trust II, Invesco India Exchange-Traded Fund Trust, Invesco Actively Managed Exchange-Traded Fund Trust, Invesco Actively Managed Exchange-Traded Commodity Fund Trust and Invesco Exchange-Traded Self-Indexed Fund Trust; Assistant Treasurer, Invesco Specialized Products, LLC Formerly: Senior Vice President – Managing Director of Tax Services, U.S. Bank Global Fund Services (GFS) | | N/A | | N/A |
| | | | | | |
Office of the Fund 1555 Peachtree Street, N.E. Atlanta, GA 30309 | | Investment Adviser Invesco Advisers, Inc. 1555 Peachtree Street, N.E. Atlanta, GA 30309 | | Auditors PricewaterhouseCoopers LLP 1000 Louisiana Street, Suite 5800 Houston, TX 77002-5021 | | Custodian State Street Bank and Trust Company 225 Franklin Street Boston, MA 02110-2801 |
| | | |
Counsel to the Fund Stradley Ronon Stevens & Young, LLP 2005 Market Street, Suite 2600 Philadelphia, PA 19103-7018 | | Investment Sub-Adviser Invesco Senior Secured Management, Inc. 225 Liberty Street New York, NY 10281 | | Transfer Agent Invesco Investment Services, Inc. 11 Greenway Plaza, Suite 1000 Houston, TX 77046-1173 | | |
| | | |
Counsel to the Independent Trustees Goodwin Procter LLP 901 New York Avenue, N.W. Washington, D.C. 20001 | | Invesco Asset Management Limited Perpetual Park Perpetual Park Drive Henley-on-Thames Oxfordshire RG9 1HH United Kingdom | | | | |
| | |
| T-6 | | Invesco Dynamic Credit Opportunity Fund |
(This page intentionally left blank)

Go paperless with eDelivery
Visit invesco.com/edelivery to enjoy the convenience and security of anytime electronic access to your investment documents.
With eDelivery, you can elect to have any or all of the following materials delivered straight to your inbox to download, save and print from your own computer:
∎ Fund reports and prospectuses
∎ Quarterly statements
∎ Daily confirmations
∎ Tax forms
Invesco mailing information
Send general correspondence to Invesco Investment Services, Inc., P.O. Box 219078, Kansas City, MO 64121-9078.
Important notice regarding delivery of security holder documents
To reduce Fund expenses, only one copy of most shareholder documents may be mailed to shareholders with multiple accounts at the same address (Householding). Mailing of your shareholder documents may be householded indefinitely unless you instruct us otherwise. If you do not want the mailing of these documents to be combined with those for other members of your household, please contact Invesco Investment Services, Inc. at 800 959 4246 or contact your financial institution. We will begin sending you individual copies for each account within 30 days after receiving your request.
Fund holdings and proxy voting information
The Fund provides a complete list of its portfolio holdings four times each year, at the end of each fiscal quarter. For the second and fourth quarters, the list appears, respectively, in the Fund’s semiannual and annual reports to shareholders. For the first and third quarters, the Fund files the list with the Securities and Exchange Commission (SEC) as an exhibit to its reports on Form N-PORT. The most recent list of portfolio holdings is available at invesco.com/completeqtrholdings. Shareholders can also look up the Fund’s Form N-PORT filings on the SEC website, sec.gov. The SEC file numbers for the Fund are shown below.
A description of the policies and procedures that the Fund uses to determine how to vote proxies relating to portfolio securities is available without charge, upon request, from our Client Services department at 800 959 4246, or at invesco.com/corporate/about-us/esg. The information is also available on the SEC website, sec.gov.
Information regarding how the Fund voted proxies related to its portfolio securities during the most recent 12-month period ended June 30 is available at invesco.com/proxysearch. This information is also available on the SEC website, sec.gov.
Invesco Advisers, Inc. is an investment adviser; it provides investment advisory services to individual and institutional clients and does not sell securities. Invesco Distributors, Inc. is the US distributor for Invesco Ltd.’s retail mutual funds, exchange-traded funds and institutional money market funds. Both are wholly owned, indirect subsidiaries of Invesco Ltd.

| | | | |
| SEC file number(s): 811-23665 and 333-255932 | | Invesco Distributors, Inc. | | VK-CE-DCO-AR-1 |
There were no amendments to the Code of Ethics (the “Code”) that applies to the Registrant’s Principal Executive Officer (“PEO”) and Principal Financial Officer (“PFO”) during the period covered by the report. The Registrant did not grant any waivers, including implicit waivers, from any provisions of the Code to the PEO or PFO during the period covered by this report.
| ITEM 3. | AUDIT COMMITTEE FINANCIAL EXPERT. |
The Board of Trustees has determined that the Registrant has at least one audit committee financial expert serving on its Audit Committee. The Audit Committee financial experts are Cynthia Hostetler, Anthony J. LaCava, Jr., and Robert C. Troccoli. Cynthia Hostetler, Anthony J. LaCava, Jr., and Robert C. Troccoli are “independent” within the meaning of that term as used in Form N-CSR.
| ITEM 4. | PRINCIPAL ACCOUNTANT FEES AND SERVICES. |
Pursuant to PCAOB Rule 3526, PricewaterhouseCoopers LLC (“PwC”) advised the Registrant’s Audit Committee of the following matters identified since the previous annual Form N-CSR filing that may be reasonably thought to bear on PwC’s independence. PwC advised the Audit Committee that one PwC Senior Associate held a financial interest directly in an investment company within the Invesco Funds Investment Company Complex that was inconsistent with the requirements of Rule 2-01(c)(1) of Regulation S-X. In reporting the matters to the Audit Committee, PwC noted, among other things, that the impermissible holding was disposed of by the individual, the individual was not in the chain of command of the audit or the audit partners of the Funds, the audit services performed by the individual were reviewed by team members at least two levels higher than the individual and the individual did not have any decision making responsibility for matters that materially affected the audit, the financial interest was not material to the net worth of the individual or his respective immediate family members and senior leadership of the Funds’ audit engagement team was unaware of the impermissible holdings until after the matters were confirmed to be independence exceptions or the individual ceased providing services. Based on the mitigating factors noted above, PwC advised the Audit Committee that it concluded that its objectivity and impartiality with respect to all issues encompassed within the audit engagement has not been impaired and it believes that a reasonable investor with knowledge of all relevant facts and circumstances for the violations would conclude PwC is capable of exercising objective and impartial judgment on all issues encompassed within the audits of the financial statements of the Funds in the Registrant for the impacted periods.
(a) to (d)
Fees Billed by PwC Related to the Registrant
PwC billed the Registrant and the predecessor Registrant which was reorganized into the Registrant on November 1, 2021 (together herein, the “Registrant”) aggregate fees for services rendered to the Registrant for the last two fiscal years as shown in the following table. The Audit Committee pre-approved all audit and non-audit services provided to the Registrant.
| | | | | | | | |
| | | Fees Billed for Services
Rendered to the
Registrant for fiscal
year end 2022 | | | Fees Billed for Services
Rendered to the
Registrant for fiscal year
end 2021 | |
Audit Fees | | $ | 111,666 | | | $ | 103,075 | |
Audit-Related Fees(1) | | $ | 13,500 | | | $ | 0 | |
Tax Fees(2) | | $ | 36,420 | | | $ | 31,398 | |
All Other Fees | | $ | 0 | | | $ | 0 | |
| | | | | | | | |
Total Fees | | $ | 161,586 | | | $ | 134,473 | |
| | (1) | Tax Fees for the fiscal years ended February 28, 2022 includes fees billed for reviewing regulatory filings. |
| | (2) | Tax Fees for the fiscal years ended February 28, 2022 and February 28, 2021 includes fees billed for preparation of U.S. Tax Returns and Taxable Income calculations, including excise tax and year-to-date estimates for various book-to-tax differences. |
Fees Billed by PwC Related to Invesco and Invesco Affiliates
PwC billed Invesco Advisers, Inc. (“Invesco”), the Registrant’s adviser, and any entity controlling, controlled by or under common control with Invesco that provides ongoing services to the Registrant (“Invesco Affiliates”) aggregate fees for pre-approved non-audit services rendered to Invesco and Invesco Affiliates for the last two fiscal years as shown in the following table. The Audit Committee pre-approved all non-audit services provided to Invesco and Invesco Affiliates that were required to be pre-approved.
| | | | | | | | |
| | | Fees Billed for Non-Audit
Services Rendered to
Invesco and Invesco
Affiliates for fiscal year end
2022 That Were Required
to be Pre-Approved
by the Registrant’s
Audit Committee | | | Fees Billed for Non-Audit
Services Rendered to
Invesco and Invesco
Affiliates for fiscal year end
2021 That Were Required
to be Pre-Approved
by the Registrant’s
Audit Committee | |
Audit-Related Fees(1) | | $ | 801,000 | | | $ | 701,000 | |
Tax Fees | | $ | 0 | | | $ | 0 | |
All Other Fees | | $ | 0 | | | $ | 0 | |
| | | | | | | | |
Total Fees | | $ | 801,000 | | | $ | 701,000 | |
| (1) | Audit-Related Fees for the fiscal years ended 2022 and 2021 include fees billed related to reviewing controls at a service organization. |
(e)(1)
PRE-APPROVAL OF AUDIT AND NON-AUDIT SERVICES
POLICIES AND PROCEDURES
As adopted by the Audit Committees
of the Invesco Funds (the “Funds”)
Last Amended March 29, 2017
| | I. | Statement of Principles |
The Audit Committees (the “Audit Committee”) of the Boards of Trustees of the Funds (the “Board”) have adopted these policies and procedures (the “Procedures”) with respect to the pre-approval of audit and non-audit services to be provided by the Funds’ independent auditor (the “Auditor”) to the Funds, and to the Funds’ investment adviser(s) and any entity controlling, controlled by, or under common control with the investment adviser(s) that provides ongoing services to the Funds (collectively, “Service Affiliates”).
Under Section 202 of the Sarbanes-Oxley Act of 2002, all audit and non-audit services provided to the Funds by the Auditor must be preapproved by the Audit Committee. Rule 2-01 of Regulation S-X requires that the Audit Committee also pre-approve a Service Affiliate’s engagement of the Auditor for non-audit services if the engagement relates directly to the operations and financial reporting of the Funds (a “Service Affiliate’s Covered Engagement”).
These Procedures set forth the procedures and the conditions pursuant to which the Audit Committee may pre-approve audit and non-audit services for the Funds and a Service Affiliate’s Covered Engagement pursuant to rules and regulations of the Securities and Exchange Commission (“SEC”) and other organizations and regulatory bodies applicable to the Funds (“Applicable Rules”).1 They address both general pre-approvals without consideration of specific case-by-case services (“general pre-approvals”) and pre-approvals on a case-by-case basis (“specific pre-approvals”). Any services requiring pre-approval that are not within the scope of general pre-approvals hereunder are subject to specific pre-approval. These Procedures also address the delegation by the Audit Committee of pre-approval authority to the Audit Committee Chair or Vice Chair.
| | II. | Pre-Approval of Fund Audit Services |
The annual Fund audit services engagement, including terms and fees, is subject to specific pre-approval by the Audit Committee. Audit services include the annual financial statement audit and other procedures required to be performed by an independent auditor to be able to form an opinion on the Funds’ financial statements. The Audit Committee will receive, review and consider sufficient information concerning a proposed Fund audit engagement to make a reasonable evaluation of the Auditor’s qualifications and independence. The Audit Committee will oversee the Fund audit services engagement as necessary, including approving any changes in terms, audit scope, conditions and fees.
In addition to approving the Fund audit services engagement at least annually and specifically approving any changes, the Audit Committee may generally or specifically pre-approve engagements for other audit services, which are those services that only an independent auditor reasonably can provide. Other audit services may include services associated with SEC registration statements, periodic reports and other documents filed with the SEC.
| 1 | Applicable Rules include, for example, New York Stock Exchange (“NYSE”) rules applicable to closed-end funds managed by Invesco and listed on NYSE. |
| | III. | General and Specific Pre-Approval of Non-Audit Fund Services |
The Audit Committee will consider, at least annually, the list of General Pre-Approved Non-Audit Services which list may be terminated or modified at any time by the Audit Committee. To inform the Audit Committee’s review and approval of General Pre-Approved Non-Audit Services, the Funds’ Treasurer (or his or her designee) and Auditor shall provide such information regarding independence or other matters as the Audit Committee may request.
Any services or fee ranges that are not within the scope of General Pre-Approved Non-Audit Services have not received general pre-approval and require specific pre-approval. Each request for specific pre-approval by the Audit Committee for services to be provided by the Auditor to the Funds must be submitted to the Audit Committee by the Funds’ Treasurer (or his or her designee) and must include detailed information about the services to be provided, the fees or fee ranges to be charged, and other relevant information sufficient to allow the Audit Committee to consider whether to pre-approve such engagement, including evaluating whether the provision of such services will impair the independence of the Auditor and is otherwise consistent with Applicable Rules.
| | IV. | Non-Audit Service Types |
The Audit Committee may provide either general or specific pre-approval of audit-related, tax or other services, each as described in more detail below.
“Audit-related services” are assurance and related services that are reasonably related to the performance of the audit or review of the Fund’s financial statements or that are traditionally performed by an independent auditor. Audit-related services include, among others, accounting consultations related to accounting, financial reporting or disclosure matters not classified as “Audit services”; assistance with understanding and implementing new accounting and financial reporting guidance from rulemaking authorities; services related to mergers, acquisitions or dispositions; compliance with ratings agency requirements and interfund lending activities; and assistance with internal control reporting requirements.
“Tax services” include, but are not limited to, the review and signing of the Funds’ federal tax returns, the review of required distributions by the Funds and consultations regarding tax matters such as the tax treatment of new investments or the impact of new regulations. The Audit Committee will not approve proposed services of the Auditor which the Audit Committee believes are to be provided in connection with a service or transaction initially recommended by the Auditor, the sole business purpose of which may be tax avoidance and the tax treatment of which may not be supported in the Internal Revenue Code and related regulations. The Audit Committee will consult with the Funds’ Treasurer (or his or her designee) and may consult with outside counsel or advisers as necessary to ensure the consistency of tax services rendered by the Auditor with the foregoing policy. The Auditor shall not represent any Fund or any Service Affiliate before a tax court, district court or federal court of claims.
Each request to provide tax services under either the general or specific pre-approval of the Audit Committee will include a description from the Auditor in writing of (i) the scope of the service, the fee structure for the engagement, and any side letter or other amendment to the engagement letter, or any other
agreement (whether oral, written, or otherwise) between the Auditor and the Funds, relating to the service; and (ii) any compensation arrangement or other agreement, such as a referral agreement, a referral fee or fee-sharing arrangement, between the Auditor (or an affiliate of the Auditor) and any person (other than the Funds or Service Affiliates receiving the services) with respect to the promoting, marketing, or recommending of a transaction covered by the service. The Auditor will also discuss with the Audit Committee the potential effects of the services on the independence of the Auditor, and document the substance of its discussion with the Audit Committee.
The Audit Committee may pre-approve other non-audit services so long as the Audit Committee believes that the service will not impair the independence of the Auditor. Appendix I includes a list of services that the Auditor is prohibited from performing by the SEC rules. Appendix I also includes a list of services that would impair the Auditor’s independence unless the Audit Committee reasonably concludes that the results of the services will not be subject to audit procedures during an audit of the Funds’ financial statements.
| | V. | Pre-Approval of Service Affiliate’s Covered Engagements |
Rule 2-01 of Regulation S-X requires that the Audit Committee pre-approve a Service Affiliate’s engagement of the Auditor for non-audit services if the engagement relates directly to the operations and financial reporting of the Funds, defined above as a “Service Affiliate’s Covered Engagement”.
The Audit Committee may provide either general or specific pre-approval of any Service Affiliate’s Covered Engagement, including for audit-related, tax or other services, as described above, if the Audit Committee believes that the provision of the services to a Service Affiliate will not impair the independence of the Auditor with respect to the Funds. Any Service Affiliate’s Covered Engagements that are not within the scope of General Pre-Approved Non-Audit Services have not received general pre-approval and require specific pre-approval.
Each request for specific pre-approval by the Audit Committee of a Service Affiliate’s Covered Engagement must be submitted to the Audit Committee by the Funds’ Treasurer (or his or her designee) and must include detailed information about the services to be provided, the fees or fee ranges to be charged, a description of the current status of the pre-approval process involving other audit committees in the Invesco investment company complex (as defined in Rule 2-201 of Regulation S-X) with respect to the proposed engagement, and other relevant information sufficient to allow the Audit Committee to consider whether the provision of such services will impair the independence of the Auditor from the Funds. Additionally, the Funds’ Treasurer (or his or her designee) and the Auditor will provide the Audit Committee with a statement that the proposed engagement requires pre-approval by the Audit Committee, the proposed engagement, in their view, will not impair the independence of the Auditor and is consistent with Applicable Rules, and the description of the proposed engagement provided to the Audit Committee is consistent with that presented to or approved by the Invesco audit committee.
Information about all Service Affiliate engagements of the Auditor for non-audit services, whether or not subject to pre-approval by the Audit Committee, shall be provided to the Audit Committee at least quarterly, to allow the Audit Committee to consider whether the provision of such services is compatible with maintaining the Auditor’s independence from the Funds. The Funds’ Treasurer and Auditor shall provide the Audit Committee with sufficiently detailed information about the scope of services provided and the fees for such services, to ensure that the Audit Committee can adequately consider whether the provision of such services is compatible with maintaining the Auditor’s independence from the Funds.
| | VI. | Pre-Approved Fee Levels or Established Amounts |
Pre-approved fee levels or ranges for audit and non-audit services to be provided by the Auditor to the Funds, and for a Service Affiliate’s Covered Engagement, under general pre-approval or specific pre-approval will be set periodically by the Audit Committee. Any proposed fees exceeding 110% of the maximum pre-approved fee levels or ranges for such services or engagements will be promptly presented to the Audit Committee and will require specific pre-approval by the Audit Committee before payment of any additional fees is made.
The Audit Committee hereby delegates, subject to the dollar limitations set forth below, specific authority to its Chair, or in his or her absence, Vice Chair, to pre-approve audit and non-audit services proposed to be provided by the Auditor to the Funds and/or a Service Affiliate’s Covered Engagement, between Audit Committee meetings. Such delegation does not preclude the Chair or Vice Chair from declining, on a case by case basis, to exercise his or her delegated authority and instead convening the Audit Committee to consider and pre-approve any proposed services or engagements.
Notwithstanding the foregoing, the Audit Committee must pre-approve: (a) any non-audit services to be provided to the Funds for which the fees are estimated to exceed $500,000; (b) any Service Affiliate’s Covered Engagement for which the fees are estimated to exceed $500,000; or (c) any cost increase to any previously approved service or engagement that exceeds the greater of $250,000 or 50% of the previously approved fees up to a maximum increase of $500,000.
| | VIII. | Compliance with Procedures |
Notwithstanding anything herein to the contrary, failure to pre-approve any services or engagements that are not required to be pre-approved pursuant to the de minimis exception provided for in Rule 2-01(c)(7)(i)(C) of Regulation S-X shall not constitute a violation of these Procedures. The Audit Committee has designated the Funds’ Treasurer to ensure services and engagements are pre-approved in compliance with these Procedures. The Funds’ Treasurer will immediately report to the Chair of the Audit Committee, or the Vice Chair in his or her absence, any breach of these Procedures that comes to the attention of the Funds’ Treasurer or any services or engagements that are not required to be pre-approved pursuant to the de minimis exception provided for in Rule 2-01(c)(7)(i)(C) of Regulation S-X.
On at least an annual basis, the Auditor will provide the Audit Committee with a summary of all non-audit services provided to any entity in the investment company complex (as defined in section 2-01(f)(14) of Regulation S-X, including the Funds and Service Affiliates) that were not pre-approved, including the nature of services provided and the associated fees.
| | IX. | Amendments to Procedures |
All material amendments to these Procedures must be approved in advance by the Audit Committee. Non-material amendments to these Procedures may be made by the Legal and Compliance Departments and will be reported to the Audit Committee at the next regularly scheduled meeting of the Audit Committee.
Appendix I
Non-Audit Services That May Impair the Auditor’s Independence
The Auditor is not independent if, at any point during the audit and professional engagement, the Auditor provides the following non-audit services:
| | • | | Broker-dealer, investment adviser, or investment banking services ; |
| | • | | Expert services unrelated to the audit; |
| | • | | Any service or product provided for a contingent fee or a commission; |
| | • | | Services related to marketing, planning, or opining in favor of the tax treatment of confidential transactions or aggressive tax position transactions, a significant purpose of which is tax avoidance; |
| | • | | Tax services for persons in financial reporting oversight roles at the Fund; and |
| | • | | Any other service that the Public Company Oversight Board determines by regulation is impermissible. |
An Auditor is not independent if, at any point during the audit and professional engagement, the Auditor provides the following non-audit services unless it is reasonable to conclude that the results of the services will not be subject to audit procedures during an audit of the Funds’ financial statements:
| | • | | Bookkeeping or other services related to the accounting records or financial statements of the audit client; |
| | • | | Financial information systems design and implementation; |
| | • | | Appraisal or valuation services, fairness opinions, or contribution-in-kind reports; |
| | • | | Actuarial services; and |
| | • | | Internal audit outsourcing services. |
(e)(2) There were no amounts that were pre-approved by the Audit Committee pursuant to the de minimus exception under Rule 2-01 of Regulation S-X.
(f) Not applicable.
(g) In addition to the amounts shown in the tables above, PwC billed Invesco and Invesco Affiliates aggregate fees of $5,931,000 for the fiscal year ended February 28, 2022 and $6,219,000 for the fiscal year ended February 28, 2021. In total, PwC billed the Registrant, Invesco and Invesco Affiliates aggregate non-audit fees of $6,768,420 for the fiscal year ended February 28, 2022 and $6,951,398 for the fiscal year ended February 28, 2021.
PwC provided audit services to the Investment Company complex of approximately $30 million.
(h) The Audit Committee also has considered whether the provision of non-audit services that were rendered to Invesco and Invesco Affiliates that were not required to be pre-approved pursuant to SEC regulations, if any, is compatible with maintaining PwC’s independence.
| ITEM 5. | AUDIT COMMITTEE OF LISTED REGISTRANTS. |
Not applicable.
| ITEM 6. | SCHEDULE OF INVESTMENTS. |
Investments in securities of unaffiliated issuers is included as part of the reports to stockholders filed under Item 1 of this Form.
| ITEM 7. | DISCLOSURE OF PROXY VOTING POLICIES AND PROCEDURES FOR CLOSED-END MANAGEMENT INVESTMENT COMPANIES. |
| | |
Invesco’s Policy Statement on Global Corporate Governance and Proxy Voting | |  |
|
I. Introduction Invesco Ltd. and its affiliated investment advisers (collectively, “Invesco”, the “Company”, “our” or “we”) has adopted and implemented this Policy Statement on Global Corporate Governance and Proxy Voting (“Policy”) which it believes describes policies and procedures reasonably designed to ensure that proxies are voted in the best interests of its clients. This Policy is intended to help Invesco’s clients understand our commitment to responsible investing and proxy voting, as well as the good governance principles that inform our approach to engagement and voting at shareholder meetings. A. Our Commitment to Environmental, Social and Governance Investment Stewardship and Proxy Voting Our commitment to environmental, social and governance (ESG) principles is a core element of our ambition to be the most client centric asset manager. We aspire to incorporate ESG considerations into all of our investment capabilities in the context of financial materiality and in the best interest of our clients. In our role as stewards of our clients’ investments, we regard our stewardship activities, including engagement and the exercise of proxy voting rights as an essential component of our fiduciary duty to maximize long-term shareholder value. Our Global ESG team functions as a center of excellence, providing specialist insights on research, engagement, voting, integration, tools, and client and product solutions with investment teams implementing ESG approaches appropriate to asset class and investment style. Much of our work is rooted in fundamental research and frequent dialogue with companies during due diligence and monitoring of our investments. Invesco views proxy voting as an integral part of its investment management responsibilities. The proxy voting process at Invesco focuses on protecting clients’ rights and promoting governance structures and practices that reinforce the accountability of corporate management and boards of directors to shareholders. The voting decision lies with our portfolio managers and analysts with input and support from our Global ESG team and Proxy Operations functions. Our proprietary proxy voting platform (“PROXYintel”) facilitates implementation of voting decisions and rationales across global investment teams. Our good governance principles, governance structure and processes are designed to ensure that proxy votes are cast in accordance with clients’ best interests. As a large active investor, Invesco is well placed to use our ESG expertise and beliefs to engage directly with portfolio companies or by collaborative means in ways which drive corporate change that we believe will enhance shareholder value. We take our responsibility as active owners very seriously and see engagement as an opportunity to encourage continual improvement and ensure that our clients’ interests are represented and protected. Dialogue with portfolio companies is a core part of the investment process. Invesco may engage with investee companies to discuss environmental, social and governance issues throughout the year or on specific ballot items to be voted on. Our passive strategies and certain other client accounts managed in accordance with fixed income, money market and index strategies (including exchange traded funds) will typically vote in line with the majority holder of the active-equity shares held by Invesco outside of those strategies. Invesco refers to this approach as “Majority Voting”. This process of Majority Voting ensures that our passive strategies benefit from the engagement and deep dialogue of our active investors, which Invesco believes benefits shareholders in passively-managed accounts. In the absence of overlap between the active and passive holders, the passive holders vote in line with our internally developed voting guidelines (as defined below). Portfolio managers and |
analysts for accounts employing Majority Voting retain full discretion to override Majority Voting and to vote the shares as they determine to be in the best interest of those accounts, absent certain types of conflicts of interest, which are discussed elsewhere in this Policy.
| | B. | Applicability of Policy |
Invesco may be granted by its clients the authority to vote the proxies of securities held in client portfolios. Invesco’s investment teams vote proxies on behalf of Invesco-sponsored funds and both fund and non-fund advisory clients that have explicitly granted Invesco authority in writing to vote proxies on their behalf. In the case of institutional or sub-advised clients, Invesco will vote
the proxies in accordance with this Policy unless the client agreement specifies that the client retains the right to vote or has designated a named fiduciary to direct voting.
This Policy applies to all entities in Exhibit A. Due to regional or asset-class specific considerations, there may be certain entities that have local proxy voting guidelines or policies and procedures that differ from this Policy. In the event that local policies and the Global Policy differ, the local policy will apply. These entities are also listed in Exhibit A and include proxy voting guidelines specific to: Invesco Asset Management (Japan) Limited, Invesco Asset Management (India) Pvt. Ltd, Invesco Taiwan Ltd and Invesco Capital Markets, Inc. for Invesco Unit Investment Trusts. In Europe, we comply with the Shareholder Rights Directive and publish our disclosures and voting practices in this regard.
| II. | Global Proxy Voting Operational Procedures |
Invesco’s global proxy voting operational procedures are in place to implement the provisions of this Policy (the “Procedures”). At Invesco, proxy voting is conducted by our investment teams through PROXYintel. Our investment teams globally are supported by Invesco’s centralized team of ESG professionals and proxy voting specialists. Invesco’s Global ESG team oversees the proxy policy, operational procedures, inputs to analysis and research and leads the Global Invesco Proxy Advisory Committee (“Global IPAC”). Invesco’s global proxy services team is responsible for operational implementation, including vote execution oversight.
Invesco aims to vote all proxies where we have been granted voting authority in accordance with this Policy as implemented by the Procedures. Our portfolio managers and analysts review voting items based on their individual merits and retain full discretion on vote execution conducted through our proprietary proxy voting platform. Invesco may supplement its internal research with information from independent third-parties, such as proxy advisory firms.
| | A. | Proprietary Proxy Voting Platform |
Invesco’s proprietary proxy voting platform is supported by a dedicated team of internal proxy specialists. PROXYintel streamlines the proxy voting process by providing our investment teams globally with direct access to meeting information and proxies, external proxy research and ESG ratings, as well as related functions, such as management of conflicts of interest issues, significant votes, global reporting and record-keeping capabilities. Managing these processes internally, as opposed to relying on third parties, is designed to provide Invesco greater quality control, oversight and independence in the proxy administration process.
Historical proxy voting information is stored to build institutional knowledge across the Invesco complex with respect to individual companies and proxy issues. Certain investment teams also use PROXYintel to access third-party proxy research and ESG ratings.
Our proprietary systems facilitate internal control and oversight of the voting process. Invesco may choose to leverage this capability to automatically vote proxies based on its internally developed custom voting guidelines and in circumstances where Majority Voting applies.
| | B. | Oversight of Voting Operations |
Invesco’s Proxy Governance and Voting Manager provides oversight of the proxy voting verification processes facilitated by a dedicated global proxy services team which include: (i) the monthly global vote audit review of votes cast containing documented rationales of conflicts of interest votes, market and operational limitations; (ii) the quarterly sampling of proxy votes cast to determine that (a) Invesco is voting consistently with this Policy and (b) third-party proxy advisory firms’ methodologies in formulating the vote recommendation are consistent with their publicly disclosed guidelines; and (iii) quarterly review of rationales with the Global IPAC of occasions where a portfolio manager may take a position that may not be in accordance with Invesco’s good governance principles and our internally developed voting guidelines.
To the extent material errors are identified in the proxy voting process, such errors are reviewed and reported to, as appropriate, the Global Head of ESG, Global Proxy Governance and Voting Manager, legal and compliance, the Global IPAC and relevant boards and clients, where applicable. Invesco’s Global Head of ESG and Proxy Governance and Voting Manager provide proxy voting updates and reporting to the Global IPAC, various boards and clients. Invesco’s
proxy voting administration and operations are subject to periodic review by Internal Audit and Compliance groups.
| | C. | Disclosures and Record Keeping |
Unless otherwise required by local or regional requirements, Invesco maintains voting records in either electronic format or hard copy for at least 6 years. Invesco makes available its proxy voting records publicly in compliance with regulatory requirements and industry best practices in the regions below:
| | • | | In accordance with the US Securities and Exchange Commission regulations, Invesco will file a record of all proxy voting activity for the prior 12 months ending June 30th for each U.S. registered fund. That filing is made on or before August 31st of each year. Each year, the proxy voting records are made available on Invesco’s website here. Moreover, and to the extent applicable, the U.S. Employee Retirement Income Security Act of 1974, as amended (“ERISA”), including Department of Labor regulations and guidance thereunder, provide that the named fiduciary generally should be able to review not only the investment manager’s voting procedure with respect to plan-owned stock, but also to review the actions taken in individual proxy voting situations. In the case of institutional and sub-advised Clients, Clients may contact their client service representative to request information about how Invesco voted proxies on their behalf. Absent specific contractual guidelines, such requests may be made on a semi-annual basis. |
| | • | | In the UK and Europe, Invesco publicly discloses our proxy votes monthly in compliance with the UK Stewardship Code and for the European Shareholder Rights Directive annually here. |
| | • | | In Canada, Invesco publicly discloses our annual proxy votes each year here by August 31st, covering the 12-month period ending June 30th in compliance with the National Instrument 81-106 Investment Fund Continuous Disclosure. |
| | • | | In Japan, Invesco publicly discloses our proxy votes annually in compliance with the Japan Stewardship Code. |
| | • | | In India, Invesco publicly discloses our proxy votes quarterly in compliance with The Securities and Exchange Board of India (“SEBI”) Circular on stewardship code for all mutual funds and all categories of Alternative Investment Funds in relation to their investment in listed equities. SEBI has implemented principles on voting for Mutual Funds through circulars dated March 15, 2010 and March 24, 2014, which prescribed detailed mandatory requirements for Mutual Funds in India to disclose their voting policies and actual voting by Mutual Funds on different resolutions of investee companies. |
| | • | | In Hong Kong, Invesco Hong Kong Limited will provide proxy voting records upon request in compliance with the Securities and Futures Commission (“SFC”) Principles of Responsible Ownership. |
| | • | | In Taiwan, Invesco publicly discloses our proxy voting policy and proxy votes annually in compliance with Taiwan’s Stewardship Principles for Institutional Investors. |
| | • | | In Australia, Invesco publicly discloses a summary of its proxy voting record annually here. |
| | D. | Global Invesco Proxy Advisory Committee |
Guided by its philosophy that investment teams should manage proxy voting, Invesco has created the Global IPAC. The Global IPAC is an investments-driven committee comprised of representatives from various investment management teams globally, Invesco’s Global Head of ESG and chaired by its Global Proxy Governance and Voting Manager. The Global IPAC provides a forum for investment teams to monitor, understand and discuss key proxy issues and voting trends within the Invesco complex, to assist Invesco in meeting regulatory obligations, to review votes not aligned with our good governance principles and to consider conflicts of interest in the proxy voting process, all in accordance with this Policy.
In fulfilling its responsibilities, the Global IPAC meets as necessary, but no less than semi-annually, and has the following responsibilities and functions: (i) acts as a key liaison between the Global ESG team and local proxy voting practices to ensure compliance with this Policy; (ii)
provides insight on market trends as it relates to stewardship practices; (iii) monitors proxy votes that present potential conflicts of interest; (iv) the Conflict of Interest sub-committee will make voting decisions on submissions made by portfolio managers on conflict of interest issues to override the Policy; and (v) reviews and provides input, at least annually, on this Policy and related internal procedures and recommends any changes to the Policy based on, but not limited to, Invesco’s experience, evolving industry practices, or developments in applicable laws or regulations.
In addition to the Global IPAC, for some clients, third parties (e.g., U.S. fund boards) provide oversight of the proxy voting process.
| | E. | Market and Operational Limitations |
In the great majority of instances, Invesco will vote proxies. However, in certain circumstances, Invesco may refrain from voting where the economic or other opportunity costs of voting exceeds any benefit to clients. Moreover, ERISA fiduciaries, in voting proxies or exercising other shareholder rights, must not subordinate the economic interests of plan participants and beneficiaries to unrelated objectives. These matters are left to the discretion of the relevant portfolio manager. Such circumstances could include, for example:
| | • | | In some countries the exercise of voting rights imposes temporary transfer restrictions on the related securities (“share blocking”). Invesco generally refrains from voting proxies in share blocking countries unless Invesco determines that the benefit to the client(s) of voting a specific proxy outweighs the client’s temporary inability to sell the security. |
| | • | | Some companies require a representative to attend meetings in person to vote a proxy, additional documentation or the disclosure of beneficial owner details to vote. Invesco may determine that the costs of sending a representative, signing a power-of-attorney or submitting additional disclosures outweigh the benefit of voting a particular proxy. |
| | • | | Invesco may not receive proxy materials from the relevant fund or client custodian with sufficient time and information to make an informed independent voting decision. |
| | • | | Invesco held shares on the record date but has sold them prior to the meeting date. |
In some non-U.S. jurisdictions, although Invesco uses reasonable efforts to vote a proxy, proxies may not be accepted or may be rejected due to changes in the agenda for a shareholder meeting for which Invesco does not have sufficient notice, due to a proxy voting service not being offered by the custodian in the local market or due to operational issues experienced by third-parties involved in the process or by the issuer or sub-custodian. In addition, despite the best efforts of Invesco and its proxy voting agent, there may be instances where our votes may not be received or properly tabulated by an issuer or the issuer’s agent.
Invesco’s funds may participate in a securities lending program. In circumstances where shares are on loan, the voting rights of those shares are transferred to the borrower. If the security in question is on loan as part of a securities lending program, Invesco may determine that the benefit to the client of voting a particular proxy outweighs the benefits of securities lending. In those instances, Invesco may determine to recall securities that are on loan prior to the meeting record date, so that we will be entitled to vote those shares. There may be instances where Invesco may be unable to recall shares or may choose not to recall shares. The relevant portfolio manager will make these determinations.
There may be occasions where voting proxies may present a perceived or actual conflict of interest between Invesco, as investment manager, and one or more of Invesco’s clients or vendors.
Firm-Level Conflicts of Interest
A conflict of interest may exist if Invesco has a material business relationship with either the company soliciting a proxy or a third party that has a material interest in the outcome of a proxy vote or that is actively lobbying for a particular outcome of a proxy vote. Such relationships may include, among others, a client relationship, serving as a vendor whose products / services are material or significant to Invesco, serving as a distributor of Invesco’s products, a significant research provider or broker to Invesco.
Invesco identifies potential conflicts of interest based on a variety of factors, including but not limited to the materiality of the relationship between the issuer or its affiliates to Invesco.
Material firm-level conflicts of interests are identified by individuals and groups within Invesco globally based on criteria established by the global proxy services team. These criteria are monitored and updated periodically by the global proxy services team so as to seek to ensure an updated view is available when conducting conflicts checks. Operating procedures and associated governance are designed to seek to ensure conflicts of interest are appropriately considered ahead of voting proxies. The Global IPAC Conflict of Interest Sub-committee maintains oversight of the process. Companies identified as conflicted will be voted in line with the principles below as implemented by Invesco’s internally developed voting guidelines. To the extent a portfolio manager disagrees with the Policy, our processes and procedures seek to ensure justification and rationales are fully documented and presented to the Global IPAC Conflict of Interest Sub-committee for approval by a majority vote.
As an additional safeguard, persons from Invesco’s marketing, distribution and other customer-facing functions may not serve on the Global IPAC. For the avoidance of doubt, Invesco may not consider Invesco Ltd.’s pecuniary interest when voting proxies on behalf of clients. To avoid any appearance of a conflict of interest, Invesco will not vote proxies issued by Invesco Ltd. that may be held in client accounts.
Personal Conflicts of Interest
A conflict also may exist where an Invesco employee has a known personal or business relationship with other proponents of proxy proposals, participants in proxy contests, corporate directors, or candidates for directorships. Under Invesco’s Global Code of Conduct, Invesco entities and individuals must act in the best interests of clients and must avoid any situation that gives rise to an actual or perceived conflict of interest.
All Invesco personnel with proxy voting responsibilities are required to report any known personal or business conflicts of interest regarding proxy issues with which they are involved. In such instances, the individual(s) with the conflict will be excluded from the decision-making process relating to such issues.
Voting Fund of Funds
There may be conflicts that can arise from Invesco voting on matters when shares of Invesco-sponsored funds are held by other Invesco funds or entities. The scenarios below set out how Invesco votes in these instances.
| | • | | In the United States, as required by law, proportional voting applies. |
| | • | | Shares of an Invesco-sponsored fund held by other Invesco funds will be voted in the same proportion as the votes of external shareholders of the underlying fund, where required by law. |
| | • | | Shares of an unaffiliated registered fund held by one or more Invesco funds will be voted in the same proportion as the votes of external shareholders of the underlying fund where the thresholds are met as required by federal securities law or any exemption therefrom. |
| | • | | To the extent proportional voting is required by law but not operationally possible, Invesco will not vote the shares. |
| | • | | For US fund of funds where proportional voting is not required by law, Invesco will still apply proportional voting. In the event this is not operationally possible, Invesco will vote in line with our internally developed voting guidelines (as defined below). |
| | • | | For non-US fund of funds Invesco will vote in line with our above-mentioned firm-level conflicts of interest process unless local policies are in place as per Exhibit A. |
| | H. | Use of Proxy Advisory Services |
Invesco may supplement its internal research with information from independent third-parties, such as proxy advisory firms, to assist us in assessing the corporate governance of investee companies. Globally, Invesco leverages research from Institutional Shareholder Services Inc. (“ISS”) and Glass Lewis (“GL”). Invesco generally retains full and independent discretion with respect to proxy voting decisions.
ISS and GL both provide research reports, including vote recommendations, to Invesco and its portfolio managers and analysts. Invesco retains ISS to provide written analysis and recommendations based on Invesco’s internally developed custom voting guidelines. Updates to previously issued proxy research reports may be provided to incorporate newly available information or additional disclosure provided by the issuer regarding a matter to be voted on, or to correct factual errors that may result in the issuance of revised proxy vote recommendations. Invesco’s global proxy services team may periodically monitor for these research alerts issued by ISS and GL that are shared with our investment teams. Invesco will generally endeavor to consider such information where such information is considered material provided it is delivered in a timely manner ahead of the vote deadline.
Invesco also retains ISS to assist in the implementation of certain proxy voting-related functions, including, but not limited to, operational and reporting services. These administrative services include receipt of proxy ballots, vote execution through PROXYintel and vote disclosure in Canada, the UK and Europe to meet regulatory reporting obligations.
As part of its fiduciary obligation to clients, Invesco performs extensive initial and ongoing due diligence on the proxy advisory firms it engages globally. This includes reviews of information regarding the capabilities of their research staff, methodologies for formulating voting recommendations, the adequacy and quality of personnel and technology, as applicable, and internal controls, policies and procedures, including those relating to possible conflicts of interest.
The proxy advisory firms Invesco engages globally complete an annual due diligence questionnaire submitted by Invesco, and Invesco conducts annual due diligence meetings in part to discuss their responses to the questionnaire. In addition, Invesco monitors and communicates with these firms and monitors their compliance with Invesco’s performance and policy standards. ISS and GL disclose conflicts to Invesco through a review of their policies, procedures and practices regarding potential conflicts of interests (including inherent internal conflicts) as well as disclosure of the work ISS and GL perform for corporate issuers and the payments they receive from such issuers. As part of our annual policy development process, Invesco engages with external proxy and governance experts to understand market trends and developments and to weigh in on the development of these policies at these firms, where appropriate. These meetings provide Invesco with an opportunity to assess the firms’ capabilities, conflicts of interest and service levels, as well as provide investment professionals with direct insight into the advisory firms’ stances on key governance and proxy topics and their policy framework/methodologies.
Invesco completes a review of the System and Organizational Controls (“SOC”) Reports for each proxy advisory firm to ensure the related controls operated effectively to provide reasonable assurance.
In addition to ISS and GL, Invesco may use regional third-party research providers to access regionally specific research.
The Global IPAC and Invesco’s Global ESG team, global proxy services team, compliance and legal teams annually communicate and review this Policy and our internally developed custom voting guidelines to seek to ensure that they remain consistent with clients’ best interests, regulatory requirements, investment team considerations, governance trends and industry best practices. At least annually, this Policy and our internally developed voting guidelines are reviewed by various groups within Invesco to ensure that they remain consistent with Invesco’s views on best practice in corporate governance and long-term investment stewardship.
| III. | Our Good Governance Principles |
Invesco’s good governance principles outline our views on best practice in corporate governance and long-term investment stewardship. These principles have been developed by our global investment teams in collaboration with the Global ESG team. The broad philosophy and guiding principles in this section inform our approach to long-term investment stewardship and proxy voting. These principles are not intended to be exhaustive or prescriptive.
Our portfolio managers and analysts retain full discretion on vote execution in the context of our good governance principles and internally developed custom voting guidelines, except where otherwise specified in this Policy. The final voting decisions may consider the unique circumstances affecting companies, regional best practices and any dialogue we have had with company management. As a result, different Portfolio Management Teams may vote differently on particular votes for the same company. To the extent a portfolio manager chooses to vote a proxy in a way that is not aligned with the principles below, such manager’s rationales are fully documented.
The following guiding principles apply to operating companies. We apply a separate approach to open-end and closed-end investment companies and unit investment trusts. Where appropriate, these guidelines are supplemented by additional internal guidance that considers regional variations in best practices, disclosure and region-specific voting items.
Our good governance principles are divided into six key themes that Invesco endorses:
We expect companies to provide accurate, timely and complete information that enables investors to make informed investment decisions and effectively carry out their stewardship activities. Invesco supports the highest standards in corporate transparency and believes that these disclosures should be made available ahead of the voting deadlines for the Annual
General Meeting or Extraordinary General Meeting to allow for timely decision-making.
Financial reporting: Company accounts and reporting must accurately reflect the underlying economic position of a company. Arrangements that may constitute an actual or perceived conflict with this objective should be avoided.
| | • | | We will generally support proposals to accept the annual financial statements, statutory accounts and similar proposals unless these reports are not presented in a timely manner or significant issues are identified regarding the integrity of these disclosures. |
| | • | | We will generally vote against the incumbent audit committee chair, or nearest equivalent, where the non-audit fees paid to the independent auditor exceed audit fees for two consecutive years or other problematic accounting practices are identified such as fraud, misapplication of audit standards or persistent material weaknesses/deficiencies in internal controls over financial reporting. |
| | • | | We will generally not support the ratification of the independent auditor and/or ratification of their fees payable if non-audit fees exceed audit and audit related fees or there are significant auditing controversies or questions regarding the independence of the external auditor. We will consider an auditor’s length of service as a company’s independent auditor in applying this policy. |
Robust shareholder rights and strong board oversight help ensure that management adhere to the highest standards of ethical conduct, are held to account for poor performance and responsibly deliver value creation for stakeholders over the long-term. We therefore encourage companies to adopt governance features that ensure board and management accountability. In particular, we consider the following as key mechanisms for enhancing accountability to investors:
One share one vote: Voting rights are an important tool for investors to hold boards and management teams accountable. Unequal voting rights may limit the ability of investors to exercise their stewardship obligations.
| | • | | We generally do not support proposals that establish or perpetuate dual classes of voting shares, double voting rights or other means of differentiated voting or disproportionate board nomination rights. |
| | • | | We generally support proposals to decommission differentiated voting rights. |
| | • | | Where unequal voting rights are established, we expect these to be accompanied by reasonable safeguards to protect minority shareholders’ interests. |
Anti-takeover devices: Mechanisms designed to prevent or unduly delay takeover attempts may unduly limit the accountability of boards and management teams to shareholders.
| | • | | We generally will not support proposals to adopt antitakeover devices such as poison pills. Exceptions may be warranted at entities without significant operations and to preserve the value of net operating losses carried forward or where the applicability of the pill is limited in scope and duration. |
| | • | | In addition, we will generally not support capital authorizations or amendments to corporate articles or bylaws at operating companies that may be utilized for antitakeover purposes, for example, the authorization of classes of shares of preferred stock with unspecified voting, dividend, conversion or other rights (“blank check” authorizations). |
Shareholder rights: We support the rights of shareholders to hold boards and management teams accountable for company performance. We generally support best practice aligned proposals to enhance shareholder rights, including but not limited to the following:
| | • | | Adoption of proxy access rights |
| | • | | Rights to call special meetings |
| | • | | Rights to act by written consent |
| | • | | Reduce supermajority vote requirements |
| | • | | Remove antitakeover provisions |
| | • | | Requirement that directors are elected by a majority vote |
In addition, we oppose practices that limit shareholders’ ability to express their views at a general meeting such as bundling unrelated proposals or several significant article or bylaw amendments into a single voting item. We will generally vote against these proposals unless we are satisfied that all the underlying components are aligned with our views on best practice.
Director Indemnification: Invesco recognizes that individuals may be reluctant to serve as corporate directors if they are personally liable for all related lawsuits and legal costs. As a result, reasonable limitations on directors’ liability can benefit a company and its shareholders by helping to attract and retain qualified directors while preserving recourse for shareholders in the event of misconduct by directors. Accordingly, unless there is insufficient information to make a decision about the nature of the proposal, Invesco will generally support proposals to limit directors’ liability and provide indemnification and/or exculpation, provided that the arrangements are reasonably limited in scope to directors acting in good faith and, in relation to criminal
matters, limited in scope to directors having reasonable grounds for believing the conduct was lawful.
Responsiveness: Boards should respond to investor concerns in a timely fashion, including reasonable requests to engage with company representatives regarding such concerns, and address matters that receive significant voting dissent at general meetings of shareholders.
| | • | | We will generally vote against the lead independent director and/or the incumbent chair of the governance committee, or nearest equivalent, in cases where the board has not adequately responded to items receiving significant voting opposition from shareholders at an annual or extraordinary general meeting. |
| | • | | We will generally vote against the lead independent director and/or incumbent chair of the governance committee, or nearest equivalent, where the board has not adequately responded to a shareholder proposal which has received significant support from shareholders. |
| | • | | We will generally vote against the incumbent chair of the compensation committee if there are significant ongoing concerns with a company’s compensation practices that have not been addressed by the committee or egregious concerns with the company’s compensation practices for two years consecutively. |
| | • | | We will generally vote against the incumbent compensation committee chair where there are ongoing concerns with a company’s compensation practices and there is no opportunity to express dissatisfaction by voting against an advisory vote on executive compensation, remuneration report (or policy) or nearest equivalent. |
| | • | | Where a company has not adequately responded to engagement requests from Invesco or satisfactorily addressed issues of concern, we may oppose director nominations, including, but not limited to, nominations for the lead independent director and/or committee chairs. |
| | C. | Board Composition and Effectiveness |
Director election process: Board members should generally stand for election annually and individually.
| | • | | We will generally support proposals requesting that directors stand for election |
annually.
| | • | | We will generally vote against the incumbent governance committee chair or lead independent director if a company has a classified board structure that is not being phased out. We may make exceptions to this policy for non-operating companies (e.g., open-end and closed-end funds) or in regions where market practice is for directors to stand for election on a staggered basis. |
| | • | | When a board is presented for election as a slate (e.g., shareholders are unable to vote against individual nominees and must vote for or against the entire nominated slate of directors) and this approach is not aligned with local market practice, we will generally vote against the slate in cases where we otherwise would vote against an individual nominee. |
| | • | | Where market practice is to elect directors as a slate we will generally support the nominated slate unless there are governance concerns with several of the individuals included on the slate or we have broad concerns with the composition of the board such as a lack independence. |
Board size: We will generally defer to the board with respect to determining the optimal number of board members given the size of the company and complexity of the business, provided that the proposed board size is sufficiently large to represent shareholder interests and sufficiently limited to remain effective.
Board assessment and succession planning: When evaluating board effectiveness, Invesco considers whether periodic performance reviews and skills assessments are conducted to ensure the board represents the interests of shareholders. In addition, boards should have a robust succession plan in place for key management and board personnel.
Definition of independence: Invesco considers local market definitions of director independence but applies a proprietary standard for assessing director independence considering a director’s status as a current or former employee of the business, any commercial or consulting relationships with the company, the level of shares beneficially owned or represented and familial relationships, among others.
Board and committee independence: The board of directors, board committees and regional equivalents should be sufficiently independent from management, substantial shareholders and conflicts of interest. We consider local market practices in this regard and in general we look for a balance across the board of directors. Above all, we like to see signs of robust challenge and discussion in the boardroom.
| | • | | We will generally vote against one or more non-independent directors when a board is less than majority independent, but we will take into account local market practice with regards to board independence in limited circumstances where this standard is not appropriate. |
| | • | | We will generally vote against non-independent directors serving on the audit committee. |
| | • | | We will generally vote against non-independent directors serving on the compensation committee. |
| | • | | We will generally vote against non-independent directors serving on the nominating committee. |
| | • | | In relation to the board, compensation committee and nominating committee we will consider the appropriateness of significant shareholder representation in applying this policy. This exception will generally not apply to the audit committee. |
Separation of Chair and CEO roles: We believe that independent board leadership generally enhances management accountability to investors. Companies deviating from this best practice should provide a strong justification and establish safeguards to ensure that there is independent oversight of a board’s activities (e.g., by appointing a lead or senior independent director with clearly defined powers and responsibilities).
| | • | | We will generally vote against the incumbent nominating committee chair where the board chair is not independent unless a lead independent or senior director is appointed. |
| | • | | We will generally support shareholder proposals requesting that the board chair be an independent director. |
| | • | | We will generally not vote against a CEO or executive serving as board chair solely on the basis of this issue, however, we may do so in instances where we have significant concerns regarding a company’s corporate governance, capital allocation decisions and/or compensation practices. |
Attendance and over boarding: Director attendance at board and committee meetings is a fundamental part of their responsibilities and provides efficient oversight for the company and its investors. In addition, directors should not have excessive external board or managerial commitments that may interfere with their ability to execute the duties of a director.
| | • | | We will generally vote against directors who attend less than 75% of board and committee meetings held in the previous year unless an acceptable extenuating circumstance is disclosed, such as health matters or family emergencies. |
| | • | | We will generally vote against directors who have more than four total mandates at public operating companies. We apply a lower threshold for directors with significant commitments such as executive positions and chairmanships. |
Diversity: We encourage companies to continue to evolve diversity and inclusion practices. Boards should be comprised of directors with a variety of relevant skills and industry expertise together with a diverse profile of individuals of different genders, ethnicities, race, skills, tenures and backgrounds in order to provide robust challenge and debate. We consider diversity at the board level, within the executive management team and in the succession pipeline.
| | • | | We will generally vote against the incumbent nominating committee chair of a board where women constitute less than two board members or 25% of the board, whichever is lower, for two or more consecutive years, unless incremental improvements are being made to diversity practices. |
| | • | | In addition, we will consider a company’s performance on broader types of diversity which may include diversity of skills, non-executive director tenure, ethnicity, race or other factors where appropriate and reasonably determinable. We will generally vote against the incumbent nominating committee chair if there are multiple concerns on diversity issues. |
| | • | | We generally believe that an individual board’s nominating committee is best positioned to determine whether director term limits would be an appropriate measure to help achieve these goals and, if so, the nature of such limits. Invesco generally opposes proposals to limit the tenure of outside directors through mandatory retirement ages. |
| | D. | Long Term Stewardship of Capital |
Capital allocation: Invesco expects companies to responsibly raise and deploy capital towards the long-term, sustainable success of the business. In addition, we expect capital allocation authorizations and decisions to be made with due regard to shareholder dilution, rights of shareholders to ratify significant corporate actions and pre-emptive rights, where applicable.
Share issuance and repurchase authorizations: We generally support authorizations to issue shares up to 20% of a company’s issued share capital for general corporate purposes. Shares should not be issued at a substantial discount to the market price or be repurchased at a substantial premium to the market price.
Stock splits: We generally support management proposals to implement a forward or reverse stock split, provided that a reverse stock split is not being used to take a company private. In
addition, we will generally support requests to increase a company’s common stock authorization if requested in order to facilitate a stock split.
Increases in authorized share capital: We will generally support proposals to increase a company’s number of authorized common and/or preferred shares, provided we have not identified concerns regarding a company’s historical share issuance activity or the potential to use these authorizations for antitakeover purposes. We will consider the amount of the request in relation to the company’s current authorized share capital, any proposed corporate transactions contingent on approval of these requests and the cumulative impact on a company’s authorized share capital, for example, if a reverse stock split is concurrently submitted for shareholder consideration.
Mergers, acquisitions, proxy contests, disposals and other corporate transactions: Invesco’s investment teams will review proposed corporate transactions including mergers, acquisitions, reorganizations, proxy contests, private placements, dissolutions and divestitures based on a proposal’s individual investment merits. In addition, we broadly approach voting on other corporate transactions as follows:
| | • | | We will generally support proposals to approve different types of restructurings that provide the necessary financing to save the company from involuntary bankruptcy. |
| | • | | We will generally support proposals to enact corporate name changes and other proposals related to corporate transactions that we believe are in shareholders’ best interests. |
| | • | | We will generally support reincorporation proposals, provided that management have provided a compelling rationale for the change in legal jurisdiction and provided further that the proposal will not significantly adversely impact shareholders’ rights. |
| | • | | With respect to contested director elections, we consider the following factors, among others, when evaluating the merits of each list of nominees: the long term performance of the company relative to its industry, management’s track record, any relevant background information related to the contest, the qualifications of the respective lists of director nominees, the strategic merits of the approaches proposed by both sides including the likelihood that the proposed goals can be met, positions of stock ownership in the company. |
| | E. | Environmental, Social and Governance Risk Oversight |
Director responsibility for risk oversight: The board of directors are ultimately responsible for overseeing management and ensuring that proper governance, oversight and control mechanisms are in place at the companies they oversee. Invesco may take voting action against director nominees in response to material governance or risk oversight failures that adversely affect shareholder value.
Invesco considers the adequacy of a company’s response to material oversight failures when determining whether any voting action is warranted. In addition, Invesco will consider the responsibilities delegated to board subcommittees when determining if it is appropriate to hold certain director nominees accountable for these material failures.
Material governance or risk oversight failures at a company may include, without limitation:
| | i. | significant bribery, corruption or ethics violations; |
| | ii. | events causing significant climate-related risks; |
| | iii. | significant health and safety incidents; or |
| | iv. | failure to ensure the protection of human rights. |
Reporting of financially material ESG information: Companies should report on their environmental, social and governance opportunities and risks where material to their business
operations.
| | • | | Where Invesco finds significant gaps in terms of management and disclosure of environmental, social and governance risk policies, we will generally vote against the annual reporting and accounts or an equivalent resolution. |
Shareholder proposals addressing environmental and social issues: Invesco may support shareholder resolutions requesting that specific actions be taken to address environmental and social (“E&S”) issues or mitigate exposure to material E&S risks, including reputational risk, related to these issues. When considering such proposals, we will consider a company’s track record on E&S issues, the efficacy of the proposal’s request, whether the requested action is unduly burdensome, and whether we consider the adoption of such a proposal would promote long-term shareholder value. We will also consider company responsiveness to the proposal and any engagement on the issue when casting votes.
| | • | | We generally do not support resolutions where insufficient information has been provided in advance of the vote or a lack of disclosure inhibits our ability to make fully informed voting decisions. |
| | • | | We will generally support shareholder resolutions requiring additional disclosure on material environmental, social and governance risks facing their businesses, provided that such requests are not unduly burdensome or duplicative with a company’s existing reporting. These may include, but are not limited to, reporting on the following: gender and racial diversity issues, political contributions and lobbying disclosure, information on data security, privacy, and internet practices, human capital and labor issues and the use of natural capital, and reporting on climate change-related risks. |
Ratification of board and/or management acts: We will generally support proposals to ratify the actions of the board of directors, supervisory board and/or executive decision-making bodies, provided there are no material oversight failures as described above. When such oversight concerns are identified, we will consider a company’s response to any issues raised and may vote against ratification proposals instead of, or in addition to, director nominees.
| | F. | Executive Compensation and Alignment |
Invesco supports compensation polices and equity incentive plans that promote alignment between management incentives and shareholders’ long-term interests. We pay close attention to local market practice and may apply stricter or modified criteria where appropriate.
Advisory votes on executive compensation, remuneration policy and remuneration reports: We will generally not support compensation related proposals where more than one of the following is present:
| | i. | there is an unmitigated misalignment between executive pay and company performance for at least two consecutive years; |
| | ii. | there are problematic compensation practices which may include among others incentivizing excessive risk taking or circumventing alignment between management and shareholders’ interests via repricing of underwater options; |
| | iii. | vesting periods for long term incentive awards are less than three years; |
| | iv. | the company “front loads” equity awards; |
| | v. | there are inadequate risk mitigating features in the program such as clawback provisions; |
| | vi. | excessive, discretionary one-time equity grants are awarded to executives; |
| | vii. | less than half of variable pay is linked to performance targets, except where prohibited by law. |
Invesco will consider company reporting on pay ratios as part of our evaluation of compensation
proposals, where relevant.
Equity plans: Invesco generally supports equity compensation plans that promote the proper alignment of incentives with shareholders’ long-term interests, and generally votes against plans that are overly dilutive to existing shareholders, plans that contain objectionable structural features which may include provisions to reprice options without shareholder approval, plans that include evergreen provisions or plans that provide for automatic accelerated vesting upon a change in control.
Employee stock purchase plans: We generally support employee stock purchase plans that are reasonably designed to provide proper incentives to a broad base of employees, provided that the price at which employees may acquire stock represents a reasonable discount from the market price.
Severance Arrangements: Invesco considers proposed severance arrangements (sometimes known as “golden parachute” arrangements) on a case-by-case basis due to the wide variety among their terms. Invesco acknowledges that in some cases such arrangements, if reasonable, may be in shareholders’ best interests as a method of attracting and retaining high-quality executive talent. We generally vote in favor of proposals requiring shareholder ratification of senior executives’ severance agreements where the proposed terms and disclosure align with good market practice.
Exhibit A
|
|
| Harbourview Asset Management Corporation |
|
| Invesco Advisers, Inc. |
|
| Invesco Asset Management (India) Pvt. Ltd*1 |
|
| Invesco Asset Management (Japan) Limited*1 |
|
| Invesco Asset Management (Schweiz) AG |
|
| Invesco Asset Management Deutschland GmbH |
|
| Invesco Asset Management Limited1 |
|
| Invesco Asset Management Singapore Ltd |
|
| Invesco Asset Management Spain |
|
| Invesco Australia Ltd |
|
| Invesco European RR L.P |
|
| Invesco Canada Ltd.1 |
|
| Invesco Capital Management LLC |
|
| Invesco Capital Markets, Inc.*1 |
|
| Invesco Hong Kong Limited |
|
| Invesco Investment Advisers LLC |
|
| Invesco Investment Management (Shanghai) Limited |
|
| Invesco Investment Management Limited |
|
| Invesco Loan Manager, LLC |
|
| Invesco Managed Accounts, LLC |
|
| Invesco Management S.A |
|
| Invesco Overseas Investment Fund Management (Shanghai) Limited |
|
| Invesco Pensions Limited |
|
| Invesco Private Capital, Inc. |
|
| Invesco Real Estate Management S.a.r.l1 |
|
| Invesco RR Fund L.P. |
|
| Invesco Senior Secured Management, Inc. |
|
| Invesco Taiwan Ltd*1 |
|
| Invesco Trust Company |
|
| Oppenheimer Funds, Inc. |
|
| WL Ross & Co. LLC |
| * | Invesco entities with specific proxy voting guidelines |
| 1 | Invesco entities with specific conflicts of interest policies |
| ITEM 8. | PORTFOLIO MANAGERS OF CLOSED-END MANAGEMENT COMPANIES. |
As of February 28, 2022, the following individuals are jointly and primarily responsible for the day-to-day management of the Trust:
| | • | | Scott Baskind (lead manager), Portfolio Manager, who has been responsible for the Fund since 2021 and has been associated with Invesco Senior Secured and/or its affiliates since 1999. Prior to the commencement of the Fund’s operations, Mr. Baskind managed the Predecessor Fund since 2010. |
| | • | | Nuno Caetano, Portfolio Manager, who has been responsible for the Fund since 2021 and has been associated with Invesco Asset Management and/or its affiliates since 2010. Prior to the commencement of the Fund’s operations, Mr. Caetano managed the Predecessor Fund since 2013. |
| | • | | Thomas Ewald, Portfolio Manager, who has been responsible for the Fund since 2021 and has been associated with Invesco Senior Secured and/or its affiliates since 2000. |
| | • | | Ron Kantowitz, Portfolio Manager, who has been responsible for the Fund since 2021 and has been associated with Invesco Senior Secured and/or its affiliates since 2018. From 2013 to 2018, he was employed with Benefit Street Partners, an alternative credit asset manager, where he served as managing director. |
| | • | | Philip Yarrow, Portfolio Manager, who has been responsible for the Fund since 2021 and has been associated with Invesco Senior Secured and/or its affiliates since 2010. Prior to the commencement of the Fund’s operations, Mr. Yarrow managed the Predecessor Fund since 2007. |
Portfolio Manager Fund Holdings and Information on Other Managed Accounts
Invesco’s portfolio managers develop investment models which are used in connection with the management of certain Invesco Funds as well as other mutual funds for which Invesco or an affiliate acts as sub-adviser, other pooled investment vehicles that are not registered mutual funds, and other accounts managed for organizations and individuals. The ‘Investments’ chart reflects the portfolio managers’ investments in the Fund(s) that they manage and includes investments in the Fund’s shares beneficially owned by a portfolio manager, as determined in accordance with Rule 16a-1(a)(2) under the Securities Exchange Act of 1934, as amended (beneficial ownership includes ownership by a portfolio manager’s immediate family members sharing the same household). The ‘Assets Managed’ chart reflects information regarding accounts other than the Funds for which each portfolio manager has day-to-day management responsibilities. Accounts are grouped into three categories: (i) other registered investment companies; (ii) other pooled investment vehicles; and (iii) other accounts. To the extent that any of these accounts pay advisory fees that are based on account performance (performance-based fees), information on those accounts is specifically noted. In addition, any assets denominated in foreign currencies have been converted into U.S. dollars using the exchange rates as of the applicable date.
Investments
The following information is as of February 28, 2022(unless otherwise noted):
| | |
Portfolio Managers | | Dollar Range of Investments
in the Fund |
| Invesco Dynamic Credit Opportunity Fund |
Scott Baskind | | None |
Nuno Caetano | | None |
Thomas Ewald | | None |
Ron Kantowitz | | None |
Philip Yarrow | | None |
Assets Managed
The following information is as of February 28, 2022 (unless otherwise noted):
| | | | | | | | | | | | | | | | | | | | | | | | |
Portfolio Managers | | Other Registered Investment
Companies Managed | | | Other Pooled Investment
Vehicles Managed | | | Other
Accounts
Managed | |
| | | Number of
Accounts | | | Assets
(in millions) | | | Number of
Accounts | | | Assets
(in millions) | | | Number of
Accounts | | | Assets
(in millions) | |
| Invesco Dynamic Credit Opportunity Fund | |
Scott Baskind | | | 4 | | | $ | 10,664.3 | | | | 6 | | | $ | 8,746.5 | | | | 18 | | | $ | 7,178.8 | |
Nuno Caetano | | | None | | | | None | | | | None | | | | None | | | | None | | | | None | |
Thomas Ewald | | | 5 | | | $ | 9,192.7 | | | | 5 | | | $ | 8,435.9 | | | | 17 | | | $ | 6,972.3 | |
Ron Kantowitz | | | None | | | | None | | | | None | | | | None | | | | None | | | | None | |
Philip Yarrow | | | 5 | | | $ | 9,192.7 | | | | 5 | | | $ | 8,435.9 | | | | 18 | | | $ | 7,178.8 | |
Potential Conflicts of Interest
Actual or apparent conflicts of interest may arise when a portfolio manager has day-to-day management responsibilities with respect to more than one Fund or other account. More specifically, portfolio managers who manage multiple Funds and/or other accounts may be presented with one or more of the following potential conflicts:
| | • | | The management of multiple Funds and/or other accounts may result in a portfolio manager devoting unequal time and attention to the management of each Fund and/or other account. The Adviser and each Sub-Adviser seek to manage such competing interests for the time and attention of portfolio managers by having portfolio managers focus on a particular investment discipline. Most other accounts managed by a portfolio manager are managed using the same investment models that are used in connection with the management of the Funds. |
| | • | | If a portfolio manager identifies a limited investment opportunity which may be suitable for more than one Fund or other account, a Fund may not be able to take full advantage of that opportunity due to an allocation of filled purchase or sale orders across all eligible Funds and other accounts. To deal with these situations, the Adviser, each Sub-Adviser and the Funds have adopted procedures for allocating portfolio transactions across multiple accounts. |
| | • | | The Adviser and each Sub-Adviser determine which broker to use to execute each order for securities transactions for the Funds, consistent with its duty to seek best execution of the transaction. However, for certain other accounts (such as mutual funds for which Invesco or an affiliate acts as sub-adviser, other pooled investment vehicles that are not registered mutual funds, and other accounts managed for organizations and individuals), the Adviser and each Sub-Adviser may be limited by the client with respect to the selection of brokers or may be instructed to direct trades through a particular broker. In these cases, trades for a Fund in a particular security may be placed separately from, rather than aggregated with, such other accounts. Having separate transactions with respect to a security may temporarily affect the market price of the security or the execution of the transaction, or both, to the possible detriment of the Fund or other account(s) involved. |
| | • | | Finally, the appearance of a conflict of interest may arise where the Adviser or Sub-Adviser has an incentive, such as a performance-based management fee, which relates to the management of one Fund or account but not all Funds and accounts for which a portfolio manager has day-to-day management responsibilities. None of the Invesco Fund accounts managed have a performance fee. |
The Adviser, each Sub-Adviser, and the Funds have adopted certain compliance procedures which are designed to address these types of conflicts. However, there is no guarantee that such procedures will detect each and every situation in which a conflict arises.
Description of Compensation Structure
For the Adviser and each Sub-Adviser
The Adviser and each Sub-Adviser seek to maintain a compensation program that is competitively positioned to attract and retain high-caliber investment professionals. Portfolio managers receive a base salary, an incentive cash bonus opportunity and a deferred compensation opportunity. Portfolio manager compensation is reviewed and may be modified each year as appropriate to reflect changes in the market, as well as to adjust the factors used to determine bonuses to promote competitive Fund performance. The Adviser and each Sub-Adviser evaluate competitive market compensation by reviewing compensation survey results conducted by an independent third party of investment industry compensation. Each portfolio manager’s compensation consists of the following three elements:
Base Salary. Each portfolio manager is paid a base salary. In setting the base salary, the Adviser and each Sub-Adviser’s intention is to be competitive in light of the particular portfolio manager’s experience and responsibilities.
Annual Bonus. The portfolio managers are eligible, along with other employees of the Adviser and each Sub-Adviser, to participate in a discretionary year-end bonus pool. The Compensation Committee of Invesco Ltd. reviews and approves the firm-wide bonus pool based upon progress against strategic objectives and annual operating plan, including investment performance and financial results. In addition, while having no direct impact on individual bonuses, assets under management are considered when determining the starting bonus funding levels. Each portfolio manager is eligible to receive an annual cash bonus which is based on quantitative (i.e. investment performance) and non-quantitative factors (which may include, but are not limited to, individual performance, risk management and teamwork).
Each portfolio manager’s compensation is linked to the pre-tax investment performance of the Funds/accounts managed by the portfolio manager as described in Table 1 below.
Table 1
| | |
Sub-Adviser | | Performance time period1 |
Invesco 2 Invesco Canada2 Invesco Deutschland2 Invesco Hong Kong2 Invesco Asset Management2 Invesco India2 Invesco Listed Real Assets Division2 | | One-, Three- and Five-year performance against Fund peer group |
| |
Invesco Senior Secured2, 3 Invesco Capital2,4 | | Not applicable |
| |
| Invesco Japan | | One-, Three- and Five-year performance |
High investment performance (against applicable peer group and/or benchmarks) would deliver compensation generally associated with top pay in the industry (determined by reference to the third-party provided compensation survey information) and poor investment performance (versus applicable peer group) would result in low bonus compared to the applicable peer group or no bonus at all. These decisions are reviewed and approved collectively by senior leadership which has responsibility for executing the compensation approach across the organization.
With respect to Invesco Capital, there is no policy regarding, or agreement with, the Portfolio Managers or any other senior executive of the Adviser to receive bonuses or any other compensation in connection with the performance of any of the accounts managed by the Portfolio Managers.
| 1 | Rolling time periods based on calendar year-end. |
| 2 | Portfolio Managers may be granted an annual deferral award that vests on a pro-rata basis over a four-year period. |
| 3 | Invesco Senior Secured’s bonus is based on annual measures of equity return and standard tests of collateralization performance. |
| 4 | Portfolio Managers for Invesco Capital base their bonus on Invesco results as well as overall performance of Invesco Capital. |
Deferred / Long Term Compensation. Portfolio managers may be granted a deferred compensation award based on a firm-wide bonus pool approved by the Compensation Committee of Invesco Ltd. Deferred compensation awards may take the form of annual deferral awards or long-term equity awards. Annual deferral awards may be granted as an annual stock deferral award or an annual fund deferral award. Annual stock deferral awards are settled in Invesco Ltd. common shares. Annual fund deferral awards are notionally invested in certain Invesco Funds selected by the Portfolio Manager and are settled in cash. Long-term equity awards are settled in Invesco Ltd. common shares. Both annual deferral awards and long-term equity awards have a four-year ratable vesting schedule. The vesting period aligns the interests of the Portfolio Managers with the long-term interests of clients and shareholders and encourages retention.
Retirement and health and welfare arrangements. Portfolio managers are eligible to participate in retirement and health and welfare plans and programs that are available generally to all employees.
| ITEM 9. | PURCHASES OF EQUITY SECURITIES BY CLOSED-END MANAGEMENT INVESTMENT COMPANY AND AFFILIATED PURCHASERS. |
Not applicable.
| ITEM 10. | SUBMISSION OF MATTERS TO A VOTE OF SECURITY HOLDERS. |
None.
| ITEM 11. | CONTROLS AND PROCEDURES. |
| | (a) | As of April 19, 2022, an evaluation was performed under the supervision and with the participation of the officers of the Registrant, including the Principal Executive Officer (“PEO”) and Principal Financial Officer (“PFO”), to assess the effectiveness of the Registrant’s disclosure controls and procedures, as that term is defined in Rule 30a-3(c) under the Investment Company Act of 1940 (“Act”), as amended. Based on that evaluation, the Registrant’s officers, including the PEO and PFO, concluded that, as of April 19, 2022, the Registrant’s disclosure controls and procedures were reasonably designed so as to ensure: (1) that information required to be disclosed by the Registrant on Form N-CSR is recorded, processed, summarized and reported within the time periods specified by the rules and forms of the Securities and Exchange Commission; and (2) that material information relating to the Registrant is made known to the PEO and PFO as appropriate to allow timely decisions regarding required disclosure. |
| | (b) | There have been no changes in the Registrant’s internal control over financial reporting (as defined in Rule 30a-3(d) under the Act) that occurred during the period covered by this report that have materially affected, or are reasonably likely to materially affect, the Registrant’s internal control over financial reporting. |
| ITEM 12. | DISCLOSURE OF SECURITIES LENDING ACTIVITIES FOR CLOSED-END MANAGEMENT INVESTMENT COMPANIES. |
Not applicable.
SIGNATURES
Pursuant to the requirements of the Securities Exchange Act of 1934 and the Investment Company Act of 1940, the Registrant has duly caused this report to be signed on its behalf by the undersigned, thereunto duly authorized.
Registrant: Invesco Dynamic Credit Opportunity Fund
| | |
| By: | | /s/ Sheri Morris |
| | Sheri Morris |
| | Principal Executive Officer |
| |
| Date: | | May 6, 2022 |
Pursuant to the requirements of the Securities and Exchange Act of 1934 and the Investment Company Act of 1940, this report has been signed below by the following persons on behalf of the Registrant and in the capacities and on the dates indicated.
| | |
| By: | | /s/ Sheri Morris |
| | Sheri Morris |
| | Principal Executive Officer |
| |
| Date: | | May 6, 2022 |
| | |
| By: | | /s/ Adrien Deberghes |
| | Adrien Deberghes |
| | Principal Financial Officer |
| |
| Date: | | May 6, 2022 |