UNITED STATES
SECURITIES AND EXCHANGE COMMISSION
Washington, D.C. 20549
FORM N-CSR
CERTIFIED SHAREHOLDER REPORT OF REGISTERED
MANAGEMENT INVESTMENT COMPANIES
| | |
| Investment Company Act file number | | 811-23665 |
Invesco Dynamic Credit Opportunity Fund
(Exact name of registrant as specified in charter)
1555 Peachtree Street, N.E., Suite 1800 Atlanta, Georgia 30309
(Address of principal executive offices) (Zip code)
Sheri Morris 1555 Peachtree Street, N.E., Suite 1800 Atlanta, Georgia 30309
(Name and address of agent for service)
| | | | |
| Registrant’s telephone number, including area code: | | (713) 626‑1919 | | |
| | | | |
| Date of fiscal year end: | | 2/28 | | |
| | |
| Date of reporting period: | | 2/28/23 | | |
| ITEM 1. | REPORTS TO STOCKHOLDERS. |
(a) The Registrant’s annual report transmitted to shareholders pursuant to Rule 30e‑1 under the Investment Company Act of 1940 is as follows:
| | |
| | |
| Annual Report to Shareholders | | February 28, 2023 |
Invesco Dynamic Credit Opportunity Fund
Nasdaq:
A: XCRTX ∎ AX: XAXCX ∎ Y: XCYOX ∎ R6: XCRRX
Management’s Discussion of Fund Performance
| | | | |
Performance summary | |
For the fiscal year ended February 28, 2023, Class A shares of Invesco Dynamic Credit Opportunity Fund (the Fund), at net asset value (NAV), underperformed the Credit Suisse Leveraged Loan Index, the Fund’s style-specific benchmark. Your Fund’s long-term performance appears later in this report. | |
Fund vs. Indexes | |
| Total returns, 2/28/22 to 2/28/23, at net asset value (NAV). Performance shown does not include applicable contingent deferred sales charges (CDSC) or front-end sales charges, which would have reduced performance. | |
| |
| Class A Shares | | | -1.03 | % |
| Class AX Shares | | | -0.86 | |
| Class Y Shares | | | -0.86 | |
| Class R6 Shares | | | -0.70 | |
Credit Suisse Leveraged Loan Index▼ (Style-Specific Index) | | | 2.26 | |
| |
Source(s): ▼Bloomberg LP | | | | |
Market conditions and your Fund
During the fiscal year covered by this report, the senior loan market was characterized by risk aversion in reaction to escalating geopolitical turmoil in Ukraine, persistent inflation, rapidly increasing interest rates and interest rate expectations, rising energy prices and a softening economic growth outlook. The confluence of these various pressures drove flows out of capital markets and caused risk premia to widen. Despite these circumstances, loans outperformed other risk assets through the end of the fiscal year including over the past several months of the end of the fiscal year where broad loan market performance solidly improved from their second quarter of 2022 lows. Senior loans’ defensive positioning at the top of the capital structure and floating rate feature benefited the asset class during this period of risk aversion and higher inflation, while its current, relatively high coupon levels helped the asset class outperform traditional asset classes.
Senior loans, as represented by the Credit Suisse Leveraged Loan Index, returned 2.26% during the Fund’s fiscal year.1 The asset class returned -4.35%1 over the second quarter of 2022, driven largely by technical factors rather than fundamentals. In particular, risk-off sentiment in other markets led to retail outflows and more importantly, a lack of new collateralized loan obligation (CLO) creation in May 2022 and June 2022. At the end of the second quarter, loan prices reached their low point, implying a 7.9%1 market default rate – well above that forecasted for 2023 and the trailing twelve-month default rate.2 This sort of overshoot of implied versus actual default rates has been fairly typical in previous risk-off markets only then for loan prices to rally back as buyers step in.
During the second half of 2022 as well as the fiscal year, CLO creation resumed in earnest, a key supportive technical, as opportunistic CLO managers sought to buy assets for new structures despite a dearth of new issue supply. This increase in CLO demand along
with healthy fundamentals and other technical drivers enabled the loan market to produce positive returns in all but one month between June 2022 and February 2023, with the average loan price improving from $91.96 to $93.49 as of fiscal year-end.1 During the fiscal year, BB-, B- and CCC-rated† loans returned 5.06%, 2.66% and -8.72%, respectively.1 Energy was the best performing sector, returning 9.38%, while consumer durables struggled most among sectors, returning -3.62% for the same period.1
In terms of fundamentals, loans held up well over the fiscal year. The third quarter of 2022 marked the sixth consecutive quarter that overall loan issuer leverage declined, while corporate profits have remained relatively robust.3 Meanwhile, interest coverage ratios reached record highs in the second quarter of 2022 before decreasing modestly the rest of the year as interest rates continued to rise.5 Despite remaining low, default activity is expected to moderately increase with most forecasted default rates ranging between 3.0% to 3.5% by year-end 2023 – on par with the long-term historical average default rate levels of roughly 3.0%.3 We continue to believe loans are quite attractive yielding 10.52% on average (represented by the yield to three-year life)1 outpacing high-yield bonds.4
Direct lending proved to be resilient over the fiscal year in spite of the broader public market volatility that took place. Looking ahead, we expect the opportunity is set to remain robust and attractive. Private equity continues to seek out opportunities to deploy their record levels of dry powder while public market volatility continues to drive down purchase price multiples. Meanwhile, tighter monetary policy and the prospect of broader US economic challenges we believe should provide a backdrop for continued conservative structures and protective documentation.
Lastly, as a floating rate asset class with the Secured Overnight Financing Rate now higher by over 400 basis points from the beginning of the fiscal year,6 direct lending has
“enjoyed the ride”. Moderately wider credit spreads and original issue discounts have added to the overall yield opportunity. As a result, the 8% yields historically offered within direct lending, were pricing in the 12% context during the fourth quarter of 2022.
Within distressed credit and special situations, we primarily focus on private companies where we believe significant inefficiencies to exist. Our target companies, given their size, have less access to capital than larger companies and therefore offer a more robust evergreen opportunity set. We have found this lack of cyclicality to be true over several decades of experience and in stark contrast to how the cycle-dependent large capitalization distressed market operates.
The opportunity set within distressed credit and special situations as well as catalyst-driven stressed credit has continued to meaningfully increase during the fiscal year – becoming larger and more geographically diverse than during the depths of the COVID-19 pandemic. The non-investment grade credit markets at the end of the fiscal year are approximately two to three times larger than they were going into the global financial crisis in 2008. Additionally, the last several years have seen a significant amount of overall issuance specifically in B3/B- rated (one notch away from a CCC rating)† and unrated debt. Should the economy soften over the next several quarters, we believe downgrades may ensue accompanied by forced selling by original or “par” debt investors. We believe this will provide a sustained robust opportunity set for us to invest in good companies, primarily through senior secured debt at attractive valuations.
In managing the Fund, we take a multi-strategy approach to private credit allocating across direct lending, broadly syndicated loans, distressed credit and special situations and CLOs and adjusting those allocations based on market environment. In doing so, we employ a proprietary, forward-looking quantitative framework that weighs private credit sector valuations against expected volatilities to identify relative value and the most efficient allocations that balance income/ return potential with risk.
The common thread across the Fund’s strategies (broadly syndicated loans, direct lending and distressed credit and special situations) is its focus on senior secured floating rate loans. We believe this aspect provides capital preservation potential given these loans are senior and secured in the capital structure which has historically resulted in lower volatility with higher recovery rates versus unsecured high-yield bonds and equity. Meanwhile, the loan coupons are floating rate, meaning they have very little interest rate risk relative to traditional fixed income investments and sensitivity in rising rate environments, as was the case during the fiscal year.
| | |
| 2 | | Invesco Dynamic Credit Opportunity Fund |
During the fiscal year ending February 28, 2023, QuarterNorth Energy, USF S&H Holdco and Groundworks were the largest contributors to the Fund’s absolute performance, while Riverbed Technology, Crown Finance US and Hilding Anders AB were the largest detractors from absolute returns. The Fund employs leverage, which allows us to enhance the Fund’s yield while keeping credit standards high relative to the benchmark. As of the close of the fiscal year, leverage accounted for approximately 22% of the Fund’s total assets. For more information about the Fund’s use of leverage and the associated risks, see the Notes to Financial Statements later in this report.
Over the course of the fiscal year, the Fund’s exposure to direct lending increased relative to broadly syndicated loans, while its exposure to distressed credit and special situations only increased modestly. As of February 28, 2023, the Fund was well diversified across direct lending, broadly syndicated loans and distressed credit and special situations. We believe the Fund’s current composition balances income/return potential with ex-ante volatility relative to the broader syndicated loan market.
As always, we appreciate your continued participation in Invesco Dynamic Credit Opportunity Fund.
| 1 | Source: Credit Suisse Leveraged Loan Index |
| 2 | Source: Morningstar LSTA US Leveraged Loan Index |
| 4 | Source: Credit Suisse High Yield Index |
† A credit rating is an assessment provided by a nationally recognized statistical rating organization (NRSRO) of the creditworthiness of an issuer with respect to debt obligations, including specific securities, money market instruments or other debts. Ratings are measured on a scale that generally ranges from AAA (highest) to D (lowest); ratings are subject to change without notice. Not Rated indicates the debtor was not rated and should not be interpreted as indicating low quality. For more information on S&P Global Ratings’ rating methodology, please visit www.spglobal.com and select ’Understanding Credit Ratings’ under About Ratings on the homepage.
Portfolio manager(s):
Scott Baskind - Lead
Nuno Caetano
Thomas Ewald
Ron Kantowitz
Philip Yarrow
The views and opinions expressed in management’s discussion of Fund performance are those of Invesco Advisers, Inc. and its affiliates. These views and opinions are subject to change at any time based on factors such as market and economic conditions. These views and opinions may not be relied upon as investment advice or recommendations, or as an offer for a particular security. The information is not a complete analysis of every aspect of any market, country, industry, security or
the Fund. Statements of fact are from sources considered reliable, but Invesco Advisers, Inc. makes no representation or warranty as to their completeness or accuracy. Although historical performance is no guarantee of future results, these insights may help you understand our investment management philosophy.
See important Fund and, if applicable, index disclosures later in this report.
| | |
| 3 | | Invesco Dynamic Credit Opportunity Fund |
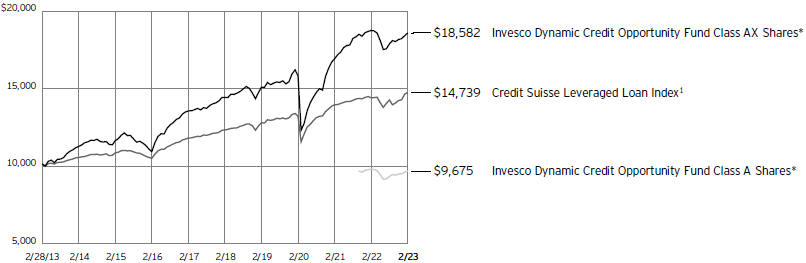
Your Fund’s Long-Term Performance
Results of a $10,000 Investment – Oldest Share Class(es)
Fund and index data from 2/28/13
| * | The Fund’s oldest share class (AX shares) does not have a sales charge; therefore, the second-oldest share class with a sales charge (Class A) is also included in the chart. |
Past performance cannot guarantee future results.
The data shown in the chart include reinvested distributions, applicable sales charges and Fund expenses including management fees. Index results include reinvested dividends, but they do not reflect sales charges. Performance of the peer group, if applicable, reflects Fund expenses and management fees; performance of a market index does not.
Performance shown in the chart does not reflect deduction of taxes a shareholder would pay on Fund distributions or sale of Fund shares.
The returns shown prior to November 1, 2021 are those of Invesco Dynamic Credit Opportunities Fund (the predecessor fund), a listed closed-end fund. Common Shares of the predecessor fund were reorganized into Class AX shares of the Fund on November 1, 2021.
Returns shown for Class AX shares prior to November 1, 2021 are those of the Common Shares of the predecessor fund. Returns shown for Class A shares prior to November 1, 2021 are those of the Common Shares of the predecessor fund restated to reflect applicable Rule 12b-1 fees and sales charges.
| | |
| 4 | | Invesco Dynamic Credit Opportunity Fund |
| | | | |
| |
| Average Annual Total Returns | |
| As of 2/28/23, including maximum applicable sales charges | |
| Class A Shares | | | | |
| 10 Years | | | 5.79 | % |
| 5 Years | | | 4.26 | |
| 1 Year | | | -4.21 | |
| |
| Class AX Shares | | | | |
| Inception (6/26/07) | | | 5.19 | % |
| 10 Years | | | 6.39 | |
| 5 Years | | | 5.19 | |
| 1 Year | | | -0.86 | |
| |
| Class Y Shares | | | | |
| 10 Years | | | 6.39 | % |
| 5 Years | | | 5.19 | |
| 1 Year | | | -0.86 | |
| |
| Class R6 Shares | | | | |
| 10 Years | | | 6.41 | % |
| 5 Years | | | 5.23 | |
| 1 Year | | | -0.70 | |
The performance data quoted represent past performance and cannot guarantee future results; current performance may be lower or higher. Please visit invesco.com/performance for the most recent month-end performance. Performance figures reflect reinvested distributions, changes in net asset value and the effect of the maximum sales charge unless otherwise stated. Performance figures do not reflect deduction of taxes a shareholder would pay on Fund distributions or sale of Fund shares. Investment return and principal value will fluctuate so that you may have a gain or loss when you sell shares.
The returns shown prior to November 1, 2021 are those of Invesco Dynamic Credit Opportunities Fund (the predecessor fund), a listed closed-end fund. Common Shares of the predecessor fund were reorganized into Class AX shares of the Fund on November 1, 2021.
Returns shown for Class AX shares prior to November 1, 2021 are those of the Common Shares of the predecessor fund. Returns shown for Class A, Class Y and Class R6 shares prior to November 1, 2021 are those of the Common Shares of the predecessor fund restated to reflect any applicable Rule 12b-1 fees and sales charges of the respective class.
Class A share performance reflects the maximum 3.25% sales charge. Class A shares, Class AX shares, Class Y shares and Class R6 shares have no early withdrawal charges, except that an early withdrawal charge of 1.00% may be imposed on certain repurchases of Class A shares made by the Fund within eighteen months of purchase upon which a sales charge was not paid; such charge is not reflected in the returns shown above. Class Y shares and Class R6 shares do not have a front-end
sales charge or a CDSC, therefore performance is at net asset value.
The performance of the Fund’s share classes will differ primarily due to different sales charge structures and class expenses.
Fund performance reflects any applicable fee waivers and/or expense reimbursements. Had the adviser not waived fees and/or reimbursed expenses currently or in the past, returns would have been lower. See current prospectus for more information.
| | |
| 5 | | Invesco Dynamic Credit Opportunity Fund |
Supplemental Information
Invesco Dynamic Credit Opportunity Fund’s investment objective is to seek a high level of current income, with a secondary objective of capital appreciation.
| ∎ | Unless otherwise stated, information presented in this report is as of February 28, 2023, and is based on total net assets. |
| ∎ | Unless otherwise noted, all data is provided by Invesco. |
| ∎ | To access your Fund’s reports/prospectus, visit invesco.com/fundreports. |
About indexes used in this report
| ∎ | The Credit Suisse Leveraged Loan Index represents tradable, senior-secured, US dollar-denominated, non-investment grade loans. |
| ∎ | The Fund is not managed to track the performance of any particular index, including the index(es) described here, and consequently, the performance of the Fund may deviate significantly from the performance of the index(es). |
| ∎ | A direct investment cannot be made in an index. Unless otherwise indicated, index results include reinvested dividends, and they do not reflect sales charges. Performance of the peer group, if applicable, reflects fund expenses; performance of a market index does not. |
|
|
This report must be accompanied or preceded by a currently effective Fund prospectus, which contains more complete information, including sales
charges and expenses. Investors should read it carefully before investing. |
|
| NOT FDIC INSURED | MAY LOSE VALUE | NO BANK GUARANTEE |
| | |
| 6 | | Invesco Dynamic Credit Opportunity Fund |
Fund Information
Portfolio Composition†
| | | | |
| By credit quality | | % of total investments |
| |
| BB | | | 0.16 | % |
| |
| BB- | | | 1.19 | |
| |
| B+ | | | 2.67 | |
| |
| B | | | 7.81 | |
| |
| B- | | | 8.33 | |
| |
| CCC+ | | | 5.97 | |
| |
| CCC | | | 2.76 | |
| |
| CCC- | | | 0.33 | |
| |
| CC | | | 0.04 | |
| |
| D | | | 0.51 | |
| |
| Non-Rated | | | 58.00 | |
| |
| Equity | | | 12.23 | |
†Source: Standard & Poor’s. A credit rating is an assessment provided by a nationally recognized statistical rating organization (NRSRO) of the creditworthiness of an issuer with respect to debt obligations, including specific securities, money market instruments or other debts. Ratings are measured on a scale that generally ranges from AAA (highest) to D (lowest); ratings are subject to change without notice. “Non- Rated” indicates the debtor was not rated, and should not be interpreted as indicating low quality. For more information on Standard & Poor’s rating methodology, please visit standardandpoors.com and select “Understanding Ratings” under Rating Resources on the homepage.
| | | | |
| Top Five Debt Issuers* | | |
| |
| | | % of total net assets |
| |
| 1. Groundworks LLC | | | 5.55 | % |
| |
| 2. Keg Logistics LLC | | | 5.22 | |
| |
| 3. FDH Group Acquisition, Inc. | | | 5.17 | |
| |
| 4. Lightning Finco Ltd. (LiveU) | | | 4.73 | |
| 5. MB2 Dental Solutions LLC | | | 4.68 | |
The Fund’s holdings are subject to change, and there is no assurance that the Fund will continue to hold any particular security.
| * | Excluding money market fund holdings, if any. |
Data presented here are as of February 28, 2023.
| | |
| 7 | | Invesco Dynamic Credit Opportunity Fund |
Consolidated Schedule of Investments
February 28, 2023
| | | | | | | | | | | | | | |
| | | Interest
Rate | | | Maturity
Date | | | Principal Amount (000)(a) | | | Value |
Variable Rate Senior Loan Interests–94.93%(b)(c)(d) | | | | | | | | | | | | | | |
| Aerospace & Defense–6.73% | | | | | | | | | | | | | | |
| | | | |
| Brown Group Holding LLC (Signature Aviation US Holdings, Inc.), Incremental Term Loan B-2 (1 mo. SOFR + 3.75%) | | | 8.43% | | | | 07/01/2029 | | | $ | 1,192 | | | $ 1,193,395 |
| | | | |
FDH Group Acquisition, Inc., Term Loan A (3 mo. SOFR + 7.00%)(e)(f) | | | 11.73% | | | | 04/01/2024 | | | | 22,416 | | | 22,034,657 |
| | | | |
IAP Worldwide Services, Inc., Second Lien Term Loan (3 mo. USD LIBOR + 6.50%) (Acquired 07/22/2014-08/18/2014; Cost $1,550,982)(f)(g) | | | 11.23% | | | | 07/18/2023 | | | | 1,558 | | | 1,557,609 |
| NAC Aviation 8 Ltd. (Ireland) | | | | | | | | | | | | | | |
Revolver Loan(f)(h) | | | 0.00% | | | | 12/31/2026 | | | | 1,642 | | | 1,642,458 |
Term Loan (1 mo. USD LIBOR + 4.11%)(f) | | | 8.68% | | | | 12/31/2026 | | | | 1,749 | | | 1,119,620 |
Term Loan (1 mo. USD LIBOR + 4.11%)(f) | | | 8.68% | | | | 12/31/2026 | | | | 1,787 | | | 1,143,765 |
| | | | |
| | | | | | | | | | | | | | | 28,691,504 |
| | | | |
| Air Transport–4.42% | | | | | | | | | | | | | | |
| | | | |
| PrimeFlight Aviation Services, Inc. | | | | | | | | | | | | | | |
Delayed Draw Term Loan (3 mo. SOFR + 6.25%)(e)(f) | | | 11.05% | | | | 05/09/2024 | | | | 3,162 | | | 3,161,767 |
Incremental Delayed Draw Term Loan (3 mo. SOFR + 6.25%)(e)(f) | | | 10.93% | | | | 05/09/2024 | | | | 6,199 | | | 6,199,438 |
Term Loan (3 mo. SOFR + 6.25%)(e)(f) | | | 10.93% | | | | 05/09/2024 | | | | 9,485 | | | 9,485,302 |
| | | | |
| | | | | | | | | | | | | | | 18,846,507 |
| | | | |
| Automotive–7.46% | | | | | | | | | | | | | | |
| | | | |
| BCA Marketplace (United Kingdom) | | | | | | | | | | | | | | |
| Second Lien Term Loan B (6 mo. SONIA + 7.50%) | | | 11.43% | | | | 07/27/2029 | | | GBP | 4,668 | | | 2,966,702 |
| Term Loan B (6 mo. SONIA + 4.75%) | | | 8.18% | | | | 07/28/2028 | | | GBP | 1,054 | | | 1,023,007 |
| Muth Mirror Systems LLC | | | | | | | | | | | | | | |
Revolver Loan (3 mo. USD LIBOR + 6.75%)(e)(f) | | | 11.48% | | | | 04/23/2025 | | | | 839 | | | 782,413 |
Revolver Loan(e)(f)(h) | | | 0.00% | | | | 04/23/2025 | | | | 839 | | | 782,414 |
Term Loan (3 mo. USD LIBOR + 6.75%)(e)(f) | | | 11.86% | | | | 04/23/2025 | | | | 18,913 | | | 17,645,383 |
Transtar Industries, Inc., Term Loan A (3 mo. USD LIBOR + 7.00%)(e)(f) | | | 12.29% | | | | 01/22/2027 | | | | 8,610 | | | 8,593,280 |
| | | | |
| | | | | | | | | | | | | | | 31,793,199 |
| | | | |
| Beverage & Tobacco–0.21% | | | | | | | | | | | | | | |
| City Brewing Co. LLC, Term Loan B (1 mo. USD LIBOR + 3.50%) | | | 8.33% | | | | 03/31/2028 | | | | 1,818 | | | 899,160 |
| | | | |
| Building & Development–1.25% | | | | | | | | | | | | | | |
| | | | |
| CRH Europe Distribution (Netherlands), Term Loan A (3 mo. EURIBOR + 4.25%) | | | 6.32% | | | | 11/29/2025 | | | EUR | 773 | | | 796,803 |
| | | | |
| Empire Today LLC, Term Loan B (1 mo. USD LIBOR + 5.00%) | | | 9.60% | | | | 04/01/2028 | | | | 535 | | | 433,813 |
| | | | |
| LBM Holdings LLC, First Lien Term Loan (1 mo. USD LIBOR + 3.75%) | | | 8.38% | | | | 12/17/2027 | | | | 126 | | | 115,981 |
| | | | |
| LHS Borrow LLC (Leaf Home Solutions), Term Loan (1 mo. SOFR + 4.75%) | | | 9.47% | | | | 02/16/2029 | | | | 2,104 | | | 1,738,118 |
| | | | |
Mayfair Mall LLC, Term Loan (1 mo. USD LIBOR + 3.25%)(f) | | | 7.82% | | | | 04/20/2023 | | | | 990 | | | 905,590 |
| Modulaire (BCP-V Modular/Algeco) (United Kingdom), Term Loan B (1 mo. USD LIBOR + 3.25%) | | | 6.70% | | | | 12/15/2028 | | | | 1,294 | | | 1,319,592 |
| | | | |
| | | | | | | | | | | | | | | 5,309,897 |
| | | | |
| Business Equipment & Services–13.84% | | | | | | | | | | | | | | |
| | | | |
| Allied Universal Holdco LLC (USAGM Holdco LLC/UNSEAM), Term Loan B (3 mo. EURIBOR + 3.75%) | | | 6.18% | | | | 05/12/2028 | | | EUR | 95 | | | 95,592 |
| | | | |
| Checkout Holding Corp., Term Loan (3 mo. USD LIBOR + 10.00%) | | | 10.00% | | | | 06/30/2023 | | | | 24 | | | 24,457 |
| | | | |
| CRCI Longhorn Holdings, Inc., Second Lien Term Loan (1 mo. USD LIBOR + 7.25%) | | | 11.88% | | | | 08/08/2026 | | | | 86 | | | 80,846 |
| CV Intermediate Holdco Corp. (Class Valuation) | | | | | | | | | | | | | | |
Delayed Draw Term Loan (3 mo. SOFR + 6.25%)(e)(f) | | | 11.08% | | | | 03/31/2026 | | | | 8,126 | | | 7,703,061 |
Revolver Loan (3 mo. USD LIBOR + 6.25%)(e)(f) | | | 11.11% | | | | 03/31/2026 | | | | 852 | | | 807,367 |
Revolver Loan(e)(f)(h) | | | 0.00% | | | | 03/31/2026 | | | | 410 | | | 388,732 |
Term Loan B (3 mo. USD LIBOR + 6.25%)(e)(f) | | | 11.08% | | | | 03/31/2026 | | | | 8,368 | | | 7,932,376 |
| Dun & Bradstreet Corp. (The) | | | | | | | | | | | | | | |
Revolver Loan (1 mo. USD LIBOR + 3.00%)(f) | | | 7.75% | | | | 09/11/2025 | | | | 561 | | | 555,024 |
Revolver Loan(f)(h) | | | 0.00% | | | | 09/11/2025 | | | | 3,253 | | | 3,219,142 |
See accompanying Notes to Consolidated Financial Statements which are an integral part of the financial statements.
| | |
| 8 | | Invesco Dynamic Credit Opportunity Fund |
| | | | | | | | | | | | | | |
| | | Interest
Rate | | | Maturity
Date | | | Principal Amount (000)(a) | | | Value |
| Business Equipment & Services–(continued) | | | | | | | | | | | | | | |
| Lamark Media Group LLC | | | | | | | | | | | | | | |
Delayed Draw Term Loan(e)(f)(h) | | | 0.00% | | | | 10/14/2027 | | | $ | 1,528 | | | $ 1,483,625 |
Revolver Loan (3 mo. USD LIBOR + 5.75%) (Acquired 10/14/2021; Cost $1,010,499)(e)(f)(g) | | | 10.61% | | | | 10/14/2027 | | | | 458 | | | 445,087 |
Revolver Loan(e)(f)(h) | | | 0.00% | | | | 10/14/2027 | | | | 560 | | | 543,996 |
Term Loan B (3 mo. USD LIBOR + 5.75%)(e)(f) | | | 10.48% | | | | 10/14/2027 | | | | 7,059 | | | 6,854,348 |
| Monitronics International, Inc. | | | | | | | | | | | | | | |
Term Loan (3 mo. USD LIBOR + 7.50%) (Acquired 08/30/2019-01/28/2021; Cost $7,596,777)(g) | | | 12.33% | | | | 03/29/2024 | | | | 7,860 | | | 5,148,198 |
Term Loan (1 mo. USD LIBOR + 6.00%) (Acquired 06/27/2019-04/27/2022; Cost $6,020,705)(f)(g) | | | 10.83% | | | | 07/03/2024 | | | | 6,013 | | | 5,712,463 |
| NAS LLC (d.b.a. Nationwide Marketing Group) | | | | | | | | | | | | | | |
Incremental Term Loan (3 mo. SOFR + 6.50%)(e)(f) | | | 11.23% | | | | 06/03/2024 | | | | 2,787 | | | 2,744,691 |
Revolver Loan (3 mo. SOFR + 6.50%)(e)(f) | | | 11.23% | | | | 06/03/2024 | | | | 184 | | | 181,145 |
Revolver Loan(e)(f)(h) | | | 0.00% | | | | 06/03/2024 | | | | 736 | | | 724,577 |
Term Loan (3 mo. SOFR + 6.50%)(e)(f) | | | 11.23% | | | | 06/03/2024 | | | | 8,897 | | | 8,763,927 |
Term Loan (3 mo. SOFR + 6.50%)(e)(f) | | | 11.23% | | | | 06/03/2024 | | | | 1,690 | | | 1,664,904 |
Protect America, Revolver Loan(f)(i) | | | - | | | | 09/01/2024 | | | GBP | 1,563 | | | 1,453,616 |
| Solera (Polaris Newco LLC), Term Loan B (1 mo. SONIA + 5.25%) | | | 9.18% | | | | 06/05/2028 | | | GBP | 1,379 | | | 1,550,334 |
UnitedLex Corp., Term Loan (1 mo. USD LIBOR + 5.75%)(f) | | | 10.35% | | | | 03/20/2027 | | | | 940 | | | 864,357 |
| Verra Mobility Corp., Term Loan B (6 mo. USD LIBOR + 3.25%) | | | 7.88% | | | | 03/19/2028 | | | | 2 | | | 2,393 |
| | | | |
| | | | | | | | | | | | | | | 58,944,258 |
| | | | |
| Cable & Satellite Television–4.73% | | | | | | | | | | | | | | |
| CSC Holdings LLC, Term Loan B (1 mo. SOFR + 4.50%) | | | 9.06% | | | | 01/15/2028 | | | | 1 | | | 272 |
| Lightning Finco Ltd. (LiveU) (United Kingdom) | | | | | | | | | | | | | | |
Term Loan B-1 (3 mo. USD LIBOR + 5.50%)(e)(f) | | | 10.45% | | | | 09/01/2028 | | | | 18,600 | | | 18,004,588 |
Term Loan B-2 (3 mo. USD LIBOR + 5.75%)(e)(f) | | | 11.45% | | | | 09/01/2028 | | | | 2,227 | | | 2,140,426 |
| | | | |
| | | | | | | | | | | | | | | 20,145,286 |
| | | | |
| Chemicals & Plastics–1.71% | | | | | | | | | | | | | | |
Colouroz Investment LLC (Germany), PIK Second Lien Term Loan B-2, 5.75% PIK Rate, 9.07% Cash Rate (3 mo. USD LIBOR + 4.25%)(j) | | | 5.75% | | | | 09/21/2024 | | | | 32 | | | 16,650 |
| Vertellus | | | | | | | | | | | | | | |
Revolver Loan (1 mo. SOFR + 5.75%)(e)(f) | | | 10.42% | | | | 12/22/2025 | | | | 132 | | | 123,823 |
Revolver Loan(e)(f)(h) | | | 0.00% | | | | 12/22/2025 | | | | 564 | | | 529,687 |
Term Loan B (6 mo. SOFR + 5.75%(e)(f) | | | 10.87% | | | | 12/22/2027 | | | | 6,896 | | | 6,599,330 |
| | | | |
| | | | | | | | | | | | | | | 7,269,490 |
| | | | |
| Clothing & Textiles–0.03% | | | | | | | | | | | | | | |
| International Textile Group, Inc., First Lien Term Loan (3 mo. USD LIBOR + 5.00%) | | | 9.75% | | | | 05/01/2024 | | | | 186 | | | 118,926 |
| | | | |
| Conglomerates–0.12% | | | | | | | | | | | | | | |
| Safe Fleet Holdings LLC | | | | | | | | | | | | | | |
Incremental First Lien Term Loan (1 mo. SOFR + 5.00%)(f) | | | 9.66% | | | | 02/23/2029 | | | | 246 | | | 244,189 |
| Second Lien Term Loan (3 mo. USD LIBOR + 6.75%) | | | 11.39% | | | | 02/02/2026 | | | | 297 | | | 270,631 |
| | | | |
| | | | | | | | | | | | | | | 514,820 |
| | | | |
| Containers & Glass Products–5.59% | | | | | | | | | | | | | | |
| Keg Logistics LLC | | | | | | | | | | | | | | |
Revolver Loan (1 mo. USD LIBOR + 6.00%)(e)(f) | | | 10.58% | | | | 11/23/2027 | | | | 1,366 | | | 1,315,700 |
Revolver Loan(e)(f)(h) | | | 0.00% | | | | 11/23/2027 | | | | 496 | | | 477,378 |
Term Loan A (1 mo. USD LIBOR + 6.00%)(e)(f) | | | 10.93% | | | | 11/23/2027 | | | | 21,247 | | | 20,460,931 |
Keter Group B.V. (Netherlands), Term Loan B-1 (3 mo. EURIBOR + 4.25%) (Acquired 04/29/2022; Cost $1,828,882)(g) | | | 6.74% | | | | 10/31/2023 | | | EUR | 1,763 | | | 1,469,747 |
Mold-Rite Plastics LLC (Valcour Packaging LLC), Second Lien Term Loan (6 mo. USD LIBOR + 7.00%)(f) | | | 11.23% | | | | 10/04/2029 | | | | 123 | | | 86,340 |
| | | | |
| | | | | | | | | | | | | | | 23,810,096 |
See accompanying Notes to Consolidated Financial Statements which are an integral part of the financial statements.
| | |
| 9 | | Invesco Dynamic Credit Opportunity Fund |
| | | | | | | | | | | | | | |
| | | Interest
Rate | | | Maturity
Date | | | Principal Amount (000)(a) | | | Value |
| Ecological Services & Equipment–5.80% | | | | | | | | | | | | | | |
| Groundworks LLC | | | | | | | | | | | | | | |
First Lien Delayed Draw Term Loan (3 mo. USD LIBOR + 4.75%)(e)(f) | | | 9.48% | | | | 01/17/2026 | | | $ | 5,738 | | | $ 5,738,102 |
First Lien Incremental Revover Loan(e)(f)(h) | | | 0.00% | | | | 01/17/2026 | | | | 520 | | | 519,687 |
First Lien Incremental Term Loan (3 mo. USD LIBOR + 4.75%)(e)(f) | | | 9.48% | | | | 01/17/2026 | | | | 13,027 | | | 13,026,603 |
Second Lien Delayed Draw Term Loan (3 mo. USD LIBOR + 4.75%)(e)(f) | | | 9.48% | | | | 01/17/2026 | | | | 4,360 | | | 4,360,289 |
TruGreen L.P., Second Lien Term Loan (1 mo. USD LIBOR + 8.50%)(f) | | | 13.33% | | | | 11/02/2028 | | | | 1,509 | | | 1,086,638 |
| | | | |
| | | | | | | | | | | | | | | 24,731,319 |
| | | | |
| Electronics & Electrical–4.84% | | | | | | | | | | | | | | |
| Boxer Parent Co., Inc., Term Loan B (1 mo. EURIBOR + 4.00%) | | | 6.43% | | | | 10/02/2025 | | | EUR | 131 | | | 136,759 |
| Emerald Technologies AcquisitionCo, Inc., Term Loan B (1 mo. SOFR + 6.25%) | | | 10.97% | | | | 12/29/2027 | | | | 307 | | | 287,689 |
| GoTo Group, Inc. (LogMeIn), First Lien Term Loan (1 mo. USD LIBOR + 4.75%) | | | 9.38% | | | | 08/31/2027 | | | | 2,985 | | | 1,656,259 |
| Imperva, Inc., Second Lien Term Loan (3 mo. USD LIBOR + 7.75%) | | | 12.65% | | | | 01/11/2027 | | | | 1,502 | | | 1,125,911 |
| Infinite Electronics, Second Lien Term Loan (3 mo. USD LIBOR + 7.00%) | | | 11.73% | | | | 03/02/2029 | | | | 473 | | | 427,315 |
| Learning Pool (Brook Bidco Ltd.) (United Kingdom) | | | | | | | | | | | | | | |
Term Loan (3 mo. SONIA + 6.75%)(f) | | | 10.72% | | | | 08/17/2028 | | | GBP | 515 | | | 605,766 |
Term Loan 2 (3 mo. USD LIBOR + 6.75%)(f) | | | 11.58% | | | | 08/17/2028 | | | | 663 | | | 636,035 |
| Mavenir Systems, Inc., Term Loan B (3 mo. USD LIBOR + 4.75%) | | | 9.65% | | | | 08/13/2028 | | | | 2,207 | | | 1,489,717 |
Natel Engineering Co., Inc., Term Loan (3 mo. USD LIBOR + 6.25%)
(Acquired 04/25/2019-03/24/2021; Cost $3,510,823)(g) | | | 10.42% | | | | 04/29/2026 | | | | 3,563 | | | 3,197,712 |
Native Instruments (Germany), Term Loan (3 mo. EURIBOR + 6.00%)(f) | | | 7.98% | | | | 03/03/2028 | | | EUR | 1,267 | | | 1,263,359 |
| Optiv, Inc., Term Loan (3 mo. USD LIBOR + 3.25%) | | | 7.42% | | | | 02/01/2024 | | | | 2,185 | | | 2,173,018 |
| Quest Software US Holdings, Inc., Second Lien Term Loan (3 mo. SOFR + 7.50%) | | | 12.33% | | | | 01/20/2030 | | | | 219 | | | 141,841 |
Riverbed Technology, Inc., PIK Term Loan, 2.00% PIK Rate, 10.83% Cash Rate (Acquired 12/06/2021-02/07/2023; Cost $7,294,269)(g)(j) | | | 2.00% | | | | 12/08/2026 | | | | 5,859 | | | 2,134,988 |
| Sandvine Corp., Second Lien Term Loan (1 mo. USD LIBOR + 8.00%) | | | 12.83% | | | | 11/02/2026 | | | | 322 | | | 287,104 |
| Utimaco (Germany) | | | | | | | | | | | | | | |
Term Loan B (3 mo. EURIBOR + 6.25%)(f) | | | 8.95% | | | | 05/31/2029 | | | EUR | 2,932 | | | 2,970,776 |
Term Loan B (3 mo. SOFR + 6.25%)(f) | | | 11.06% | | | | 05/31/2029 | | | | 1,645 | | | 1,589,537 |
| Veritas US, Inc., Term Loan B (3 mo. USD LIBOR + 5.00%) | | | 9.73% | | | | 09/01/2025 | | | | 616 | | | 484,466 |
| | | | |
| | | | | | | | | | | | | | | 20,608,252 |
| | | | |
| Food Products–6.69% | | | | | | | | | | | | | | |
| Biscuit Intl (Cookie Acq S.A.S., De Banketgroep Holding) (France), First Lien Term Loan (6 mo. EURIBOR + 4.00%) | | | 5.86% | | | | 02/15/2027 | | | EUR | 4,013 | | | 3,332,871 |
| BrightPet (AMCP Pet Holdings, Inc.) | | | | | | | | | | | | | | |
Incremental Term Loan B (3 mo. USD LIBOR + 6.25%)(e)(f) | | | 10.98% | | | | 10/05/2026 | | | | 4,239 | | | 4,098,616 |
Revolver Loan (3 mo. USD LIBOR + 6.25%)(e)(f) | | | 11.00% | | | | 10/05/2026 | | | | 1,346 | | | 1,301,363 |
Revolver Loan(e)(f)(h) | | | 0.00% | | | | 10/05/2026 | | | | 120 | | | 116,227 |
Term Loan B (3 mo. USD LIBOR + 6.25%)(e)(f) | | | 10.98% | | | | 10/05/2026 | | | | 4,123 | | | 3,986,602 |
| Florida Food Products LLC, Second Lien Term Loan (1 mo. USD LIBOR + 8.00%) | | | 12.63% | | | | 10/08/2029 | | | | 1,028 | | | 924,939 |
| H-Food Holdings LLC | | | | | | | | | | | | | | |
| Incremental Term Loan B-3 (1 mo. USD LIBOR + 5.00%) | | | 9.63% | | | | 05/23/2025 | | | | 156 | | | 141,641 |
| Term Loan (3 mo. USD LIBOR + 3.69%) | | | 8.32% | | | | 05/23/2025 | | | | 19 | | | 17,092 |
| Shearer’s Foods LLC, Second Lien Term Loan (1 mo. USD LIBOR + 7.75%) | | | 12.39% | | | | 09/22/2028 | | | | 214 | | | 200,352 |
| Sigma Bidco B.V. (Netherlands), Term Loan B-2 (3 mo. USD LIBOR + 3.00%) | | | 7.46% | | | | 07/02/2025 | | | | 156 | | | 146,614 |
Teasdale Foods, Inc., Term Loan B (3 mo. USD LIBOR + 6.25%)(e)(f) | | | 1.00% | | | | 12/18/2025 | | | | 15,957 | | | 13,180,761 |
| Valeo Foods (Jersey) Ltd. (United Kingdom), First Lien Term Loan B (6 mo. EURIBOR + 4.00%) | | | 5.16% | | | | 09/29/2028 | | | EUR | 1,162 | | | 1,046,485 |
| | | | |
| | | | | | | | | | | | | | | 28,493,563 |
| | | | |
| Food Service–0.46% | | | | | | | | | | | | | | |
| Financiere Pax S.A.S., Term Loan B (6 mo. EURIBOR + 4.75%) | | | 7.19% | | | | 07/01/2026 | | | EUR | 2,012 | | | 1,944,119 |
| | | | |
| Health Care–8.01% | | | | | | | | | | | | | | |
Acacium (Impala Bidco Ltd./ICS US, Inc.) (United Kingdom), Term Loan (1 mo. SOFR + 5.25%)(f) | | | 9.15% | | | | 06/08/2028 | | | | 955 | | | 893,124 |
| Ethypharm (Financiere Verdi, Orphea Ltf) (France), Term Loan B (3 mo. SONIA + 4.50%) | | | 7.93% | | | | 04/17/2028 | | | GBP | 2,270 | | | 2,431,750 |
See accompanying Notes to Consolidated Financial Statements which are an integral part of the financial statements.
| | |
| 10 | | Invesco Dynamic Credit Opportunity Fund |
| | | | | | | | | | | | | | |
| | | Interest
Rate | | | Maturity
Date | | | Principal Amount (000)(a) | | | Value |
| Health Care–(continued) | | | | | | | | | | | | | | |
| MB2 Dental Solutions LLC | | | | | | | | | | | | | | |
Delayed Draw Term Loan (1 mo. SOFR + 6.00%)(e)(f) | | | 10.72% | | | | 01/29/2027 | | | $ | 3,119 | | | $ 3,041,204 |
Delayed Draw Term Loan (1 mo. SOFR + 6.00%)(e)(f) | | | 10.72% | | | | 01/29/2027 | | | | 8,656 | | | 8,439,690 |
Term Loan B (1 mo. SOFR + 6.00%)(e)(f) | | | 10.72% | | | | 01/29/2027 | | | | 8,673 | | | 8,456,229 |
| MedAssets Software Intermediate Holdings, Inc. (nThrive TSG), Second Lien Term Loan (1 mo. USD LIBOR + 6.75%) | | | 11.38% | | | | 12/17/2029 | | | | 638 | | | 456,486 |
| Nidda Healthcare Holding AG (Germany), Term Loan F (3 mo. SONIA + 4.50%) | | | 8.45% | | | | 08/21/2026 | | | GBP | 2,088 | | | 2,391,897 |
SDB Holdco LLC, Delayed Draw Term Loan (1 mo. SOFR + 7.00%)(e)(f) | | | 11.43% | | | | 03/18/2027 | | | | 7,682 | | | 7,604,697 |
| Women’s Care Holdings, Inc. LLC, Second Lien Term Loan (1 mo. USD LIBOR + 8.25%) | | | 13.08% | | | | 01/15/2029 | | | | 431 | | | 391,348 |
| | | | |
| | | | | | | | | | | | | | | 34,106,425 |
| | | | |
| Home Furnishings–1.46% | | | | | | | | | | | | | | |
| Hilding Anders AB (Sweden) | | | | | | | | | | | | | | |
PIK Term Loan; 12.00% PIK Rate, 2.84% Cash Rate (Acquired 01/01/2020-11/23/2022; Cost $12,229)(f)(g)(j) | | | 12.00% | | | | 12/31/2024 | | | EUR | 38 | | | 4 |
Term Loan (Acquired 01/01/2020; Cost $61,527)(f)(g) | | | 0.00% | | | | 12/31/2024 | | | EUR | 5,480 | | | 580 |
Term Loan (6 mo. EURIBOR + 5.00%) (Acquired 10/04/2022-10/31/2022; Cost $3,557,752)(f)(g) | | | 7.12% | | | | 02/28/2026 | | | EUR | 4,882 | | | 3,382,336 |
Term Loan (6 mo. EURIBOR + 12.00%) (Acquired 10/04/2022-10/31/2022; Cost $39,091)(f)(g) | | | 12.00% | | | | 02/26/2027 | | | EUR | 4,437 | | | 0 |
| Serta Simmons Bedding LLC | | | | | | | | | | | | | | |
First Lien Term Loan(k)(l) | | | 0.00% | | | | 08/10/2023 | | | | 1,269 | | | 1,254,796 |
Second Lien Term Loan(k)(l) | | | 0.00% | | | | 08/10/2023 | | | | 2,706 | | | 1,517,042 |
| Weber-Stephen Products LLC, Incremental Term Loan B (1 mo. SOFR + 4.25%) | | | 8.97% | | | | 10/30/2027 | | | | 73 | | | 64,409 |
| | | | |
| | | | | | | | | | | | | | | 6,219,167 |
| | | | |
| Industrial Equipment–2.48% | | | | | | | | | | | | | | |
| Deliver Buyer, Inc. (MHS Holdings), Term Loan B (3 mo. SOFR + 5.50%) | | | 10.08% | | | | 06/08/2029 | | | | 1,674 | | | 1,448,007 |
| DXP Enterprises, Inc., Term Loan (3 mo. SOFR + 5.25%) | | | 9.95% | | | | 12/23/2027 | | | | 610 | | | 600,362 |
Engineered Machinery Holdings, Inc., Second Lien Incremental Term Loan (3 mo. USD LIBOR + 6.00%)(f) | | | 10.73% | | | | 05/21/2029 | | | | 207 | | | 193,888 |
| Kantar (Summer BC Bidco) (United Kingdom) | | | | | | | | | | | | | | |
Revolver Loan(f)(h) | | | 0.00% | | | | 06/04/2026 | | | | 2,500 | | | 2,275,000 |
Term Loan B (3 mo. USD LIBOR + 5.00%)(f) | | | 9.77% | | | | 12/04/2026 | | | | 1,557 | | | 1,479,455 |
| MKS Instruments, Inc., Term Loan B (1 mo. SOFR + 2.75%) | | | 7.41% | | | | 08/17/2029 | | | | 59 | | | 58,046 |
| New VAC US LLC, Term Loan B (3 mo. USD LIBOR + 4.00%) | | | 8.73% | | | | 03/08/2025 | | | | 1,252 | | | 1,126,813 |
| Robertshaw US Holding Corp. | | | | | | | | | | | | | | |
| First Lien Term Loan (3 mo. USD LIBOR + 3.50%) | | | 8.25% | | | | 02/28/2025 | | | | 450 | | | 251,825 |
| Second Lien Term Loan (3 mo. USD LIBOR + 8.00%) | | | 12.75% | | | | 02/28/2026 | | | | 613 | | | 212,261 |
| Tank Holding Corp. | | | | | | | | | | | | | | |
Revolver Loan (1 mo. SOFR + 6.00%)(f) | | | 12.25% | | | | 03/31/2028 | | | | 38 | | | 35,509 |
Revolver Loan(f)(h) | | | 0.00% | | | | 03/31/2028 | | | | 138 | | | 128,378 |
| Term Loan (1 mo. SOFR + 5.75%) | | | 10.47% | | | | 03/31/2028 | | | | 2,635 | | | 2,531,444 |
Victory Buyer LLC (Vantage Elevator), Second Lien Term Loan B (1 mo. USD LIBOR + 7.00%)(f) | | | 11.59% | | | | 11/19/2029 | | | | 259 | | | 208,053 |
| | | | |
| | | | | | | | | | | | | | | 10,549,041 |
| | | | |
| Leisure Goods, Activities & Movies–6.60% | | | | | | | | | | | | | | |
| Crown Finance US, Inc. | | | | | | | | | | | | | | |
DIP Term Loan (1 mo. SOFR + 10.00%) (Acquired 09/14/2022-09/23/2022; Cost $21,244,074)(g)(k) | | | 14.93% | | | | 09/07/2023 | | | | 4,217 | | | 4,311,854 |
First Lien Term Loan (Acquired 10/18/2019-09/13/2021; Cost $2,585,895)(g)(k)(l) | | | 0.00% | | | | 09/30/2026 | | | | 2,719 | | | 444,311 |
Term Loan (Acquired 08/28/2020-03/01/2022; Cost $407,802)(g)(k)(l) | | | 0.00% | | | | 02/28/2025 | | | EUR | 455 | | | 78,627 |
Term Loan (Acquired 09/13/2021-01/05/2022; Cost $2,338,477)(g)(k)(l) | | | 0.00% | | | | 02/28/2025 | | | | 2,849 | | | 468,625 |
| Fitness International LLC, Term Loan B (3 mo. USD LIBOR + 3.25%) | | | 8.08% | | | | 04/18/2025 | | | | 1,106 | | | 1,062,891 |
| Parques Reunidos (Piolin Bidco s.a.u) (Spain) | | | | | | | | | | | | | | |
Revolver Loan (1 mo. EURIBOR + 3.50%)(f) | | | 6.07% | | | | 03/16/2026 | | | EUR | 1,148 | | | 1,086,842 |
Revolver Loan(f)(h) | | | 0.00% | | | | 03/16/2026 | | | EUR | 1,311 | | | 1,240,769 |
See accompanying Notes to Consolidated Financial Statements which are an integral part of the financial statements.
| | |
| 11 | | Invesco Dynamic Credit Opportunity Fund |
| | | | | | | | | | | | | | |
| | | Interest
Rate | | | Maturity
Date | | | Principal Amount (000)(a) | | | Value |
| Leisure Goods, Activities & Movies–(continued) | | | | | | | | | | | | | | |
| Royal Caribbean Cruises | | | | | | | | | | | | | | |
Revolver Loan(f)(i) | | | - | | | | 04/05/2024 | | | $ | 3,313 | | | $ 3,172,227 |
Revolver Loan(i) | | | - | | | | 04/12/2024 | | | | 949 | | | 907,619 |
Revolver Loan(f)(h) | | | 0.00% | | | | 04/05/2024 | | | | 249 | | | 238,655 |
Revolver Loan(h) | | | 0.00% | | | | 04/12/2024 | | | | 265 | | | 253,115 |
| | | | |
| Scenic (Columbus Capital B.V.) (Australia), Term Loan B (3 mo. EURIBOR + 3.75%) | | | 5.95% | | | | 02/27/2027 | | | EUR | 1,200 | | | 1,039,726 |
| USF S&H Holdco LLC | | | | | | | | | | | | | | |
Term Loan A (3 mo. USD LIBOR + 8.00%)(e)(f) | | | 8.00% | | | | 06/30/2025 | | | | 808 | | | 808,166 |
Term Loan A(e)(f)(h) | | | 0.00% | | | | 06/30/2025 | | | | 1,028 | | | 1,028,329 |
Term Loan B (3 mo. USD LIBOR + 4.75%)(e)(f) | | | 9.51% | | | | 06/30/2025 | | | | 10,571 | | | 10,570,766 |
| Vue International Bidco PLC (United Kingdom), Term Loan (3 mo. EURIBOR + 8.00%) | | | 10.35% | | | | 12/31/2027 | | | EUR | 2,084 | | | 1,389,932 |
| | | | |
| | | | | | | | | | | | | | | 28,102,454 |
| | | | |
| Lodging & Casinos–1.90% | | | | | | | | | | | | | | |
| HotelBeds (United Kingdom) | | | | | | | | | | | | | | |
| Term Loan B (3 mo. EURIBOR + 4.25%) | | | 6.71% | | | | 09/12/2025 | | | EUR | 2,321 | | | 2,307,014 |
| Term Loan D (6 mo. EURIBOR + 5.50%) | | | 7.75% | | | | 09/12/2027 | | | EUR | 5,774 | | | 5,803,008 |
| | | | |
| | | | | | | | | | | | | | | 8,110,022 |
| | | | |
| Nonferrous Metals & Minerals–0.37% | | | | | | | | | | | | | | |
| | | | |
| Corialis (United Kingdom), Term Loan B (1 mo. SONIA + 4.40%) | | | 8.36% | | | | 07/06/2028 | | | GBP | 677 | | | 733,945 |
Form Technologies LLC, First Lien Term Loan (3 mo. USD LIBOR + 9.00%)(f) | | | 13.96% | | | | 10/22/2025 | | | | 1,058 | | | 856,593 |
| | | | |
| | | | | | | | | | | | | | | 1,590,538 |
| | | | |
| Oil & Gas–3.31% | | | | | | | | | | | | | | |
| | | | |
| Glass Mountain Pipeline Holdings LLC, Term Loan (3 mo. USD LIBOR + 4.50%) | | | 9.14% | | | | 10/28/2027 | | | | 198 | | | 167,597 |
| McDermott International Ltd. | | | | | | | | | | | | | | |
LOC(h) | | | 0.00% | | | | 06/30/2024 | | | | 4,083 | | | 3,327,883 |
LOC (3 mo. USD LIBOR + 4.40%)(f) | | | 4.75% | | | | 06/30/2024 | | | | 1,801 | | | 1,260,900 |
PIK Term Loan, 3.00% PIK Rate, 5.63% Cash Rate(j) | | | 3.00% | | | | 06/30/2025 | | | | 956 | | | 634,234 |
| Term Loan (1 mo. USD LIBOR + 3.00%) | | | 7.63% | | | | 06/30/2024 | | | | 180 | | | 109,446 |
Petroleum GEO-Services ASA (Norway), Term Loan (1 mo. USD LIBOR + 7.50%) (Acquired 02/03/2021-02/09/2021; Cost $2,735,636)(g) | | | 12.14% | | | | 03/19/2024 | | | | 3,094 | | | 3,047,936 |
QuarterNorth Energy, Inc., Second Lien Term Loan (1 mo. USD LIBOR + 8.00%) (Acquired 08/03/2021; Cost $5,468,802)(g) | | | 12.63% | | | | 08/27/2026 | | | | 5,552 | | | 5,542,398 |
| | | | |
| | | | | | | | | | | | | | | 14,090,394 |
| | | | |
| Publishing–1.36% | | | | | | | | | | | | | | |
| | | | |
| Cengage Learning, Inc., Term Loan B (6 mo. USD LIBOR + 4.75%) | | | 9.88% | | | | 06/29/2026 | | | | 2,340 | | | 2,218,817 |
| Harbor Purchaser, Inc. (Houghton Mifflin Harcourt), Term Loan B (1 mo. SOFR + 5.25%) | | | 9.97% | | | | 04/09/2029 | | | | 3,876 | | | 3,566,100 |
| | | | |
| | | | | | | | | | | | | | | 5,784,917 |
| | | | |
| Radio & Television–0.10% | | | | | | | | | | | | | | |
Diamond Sports Holdings LLC, Second Lien Term Loan (1 mo. SOFR + 3.25%) (Acquired 03/01/2022; Cost $1,703,915)(g) | | | 8.03% | | | | 08/24/2026 | | | | 2,582 | | | 303,622 |
| | | | |
| Nexstar Broadcasting, Inc., Term Loan B-4 (1 mo. USD LIBOR + 2.50%) | | | 7.13% | | | | 09/18/2026 | | | | 1 | | | 318 |
| Univision Communications, Inc., Term Loan B (3 mo. SOFR + 4.25%) | | | 8.83% | | | | 06/10/2029 | | | | 114 | | | 114,527 |
| | | | |
| | | | | | | | | | | | | | | 418,467 |
| | | | |
| Retailers (except Food & Drug)–1.39% | | | | | | | | | | | | | | |
| Kirk Beauty One GmbH (Germany) | | | | | | | | | | | | | | |
| Term Loan B-1 (3 mo. EURIBOR + 5.50%) | | | 7.70% | | | | 04/08/2026 | | | EUR | 1,235 | | | 1,248,550 |
| Term Loan B-2 (3 mo. EURIBOR + 5.50%) | | | 7.70% | | | | 04/08/2026 | | | EUR | 711 | | | 719,102 |
| Term Loan B-3 (3 mo. EURIBOR + 5.50%) | | | 7.70% | | | | 04/08/2026 | | | EUR | 1,250 | | | 1,263,722 |
| Term Loan B-4 (3 mo. EURIBOR + 5.50%) | | | 7.70% | | | | 04/08/2026 | | | EUR | 2,181 | | | 2,204,935 |
| Term Loan B-5 (3 mo. EURIBOR + 5.50%) | | | 7.70% | | | | 04/08/2026 | | | EUR | 486 | | | 490,662 |
| | | | |
| | | | | | | | | | | | | | | 5,926,971 |
| | | | |
| Surface Transport–0.53% | | | | | | | | | | | | | | |
| | | | |
Hurtigruten (Explorer II AS) (Norway), Term Loan B (3 mo. EURIBOR + 4.00%) (Acquired 04/16/2021-05/25/2021; Cost $2,753,551)(g) | | | 7.20% | | | | 02/24/2025 | | | EUR | 2,370 | | | 2,284,610 |
See accompanying Notes to Consolidated Financial Statements which are an integral part of the financial statements.
| | |
| 12 | | Invesco Dynamic Credit Opportunity Fund |
| | | | | | | | | | | | | | |
| | | Interest
Rate | | | Maturity
Date | | | Principal Amount (000)(a) | | | Value |
| Telecommunications–2.40% | | | | | | | | | | | | | | |
| Cincinnati Bell, Inc., Term Loan B-2 (1 mo. SOFR + 3.25%) | | | 7.97% | | | | 11/22/2028 | | | $ | 29 | | | $ 28,484 |
| MLN US HoldCo LLC (dba Mitel) | | | | | | | | | | | | | | |
First Lien Term Loan (6 mo. SOFR + 6.70%)(f) | | | 11.15% | | | | 11/01/2027 | | | | 3,739 | | | 2,710,707 |
| First Lien Term Loan (6 mo. SOFR + 9.25%) | | | 13.70% | | | | 11/01/2027 | | | | 1,874 | | | 1,433,996 |
| Term Loan (6 mo. SOFR + 6.44%) | | | 10.89% | | | | 11/01/2027 | | | | 1,591 | | | 1,559,034 |
| | | | |
| Telesat LLC, Term Loan B-5 (1 mo. USD LIBOR + 2.75%) | | | 7.58% | | | | 12/07/2026 | | | | 2,338 | | | 1,264,469 |
| | | | |
| U.S. Telepacific Corp., Term Loan (3 mo. SOFR + 1.15%) | | | 5.91% | | | | 05/01/2026 | | | | 1,952 | | | 624,522 |
| Zayo Group LLC, Incremental Term Loan (1 mo. SOFR + 4.25%) | | | 8.87% | | | | 03/09/2027 | | | | 3,021 | | | 2,586,090 |
| | | | |
| | | | | | | | | | | | | | | 10,207,302 |
| | | | |
| Utilities–1.14% | | | | | | | | | | | | | | |
| | | | |
| Eastern Power LLC, Term Loan (3 mo. USD LIBOR + 3.75%) | | | 8.48% | | | | 10/02/2025 | | | | 1,319 | | | 1,204,017 |
| Lightstone Holdco LLC | | | | | | | | | | | | | | |
| Term Loan B (1 mo. SOFR + 5.75%) | | | 10.37% | | | | 02/01/2027 | | | | 2,133 | | | 1,821,817 |
| Term Loan C (1 mo. SOFR + 5.75%) | | | 10.37% | | | | 02/01/2027 | | | | 121 | | | 103,041 |
Nautilus Power LLC, Term Loan (3 mo. USD LIBOR + 4.25%) (Acquired 04/28/2017-09/29/2017; Cost $2,312,541)(g) | | | 8.88% | | | | 05/16/2024 | | | | 2,302 | | | 1,711,905 |
| | | | | | | | | | | | | | | 4,840,780 |
| | | | |
| Total Variable Rate Senior Loan Interests (Cost $450,004,100) | | | | | | | | | | | | | | 404,351,484 |
| | | | |
| | | | | | | | | Shares | | | |
Common Stocks & Other Equity Interests–13.89%(m) | | | | | | | | | | | | | | |
| Aerospace & Defense–0.50% | | | | | | | | | | | | | | |
| | |
IAP Worldwide Services, Inc. (Acquired 07/18/2014-08/18/2014; Cost $239,759)(f)(g) | | | | 221 | | | 2,132,134 |
NAC Aviation 8 Ltd. (Acquired 06/01/2022; Cost $0)(f)(g) | | | | | | | | | | | 51,776 | | | 0 |
| | | | |
| | | | | | | | | | | | | | | 2,132,134 |
| | | | |
| Automotive–0.01% | | | | | | | | | | | | | | |
| | | | |
ThermaSys Corp. (Acquired 12/31/2018; Cost $687,748)(f)(g) | | | | | | | | | | | 980,474 | | | 29,414 |
| | | | |
| Building & Development–0.00% | | | | | | | | | | | | | | |
| | |
Haya (Holdco2 PLC/Real Estate SAU) (Acquired 06/14/2022; Cost $0)(f)(g) | | | | 5,422 | | | 0 |
| | |
Lake at Las Vegas Joint Venture LLC, Class A (Acquired 07/15/2010; Cost $24,140,508)(f)(g) | | | | 2,338 | | | 0 |
Lake at Las Vegas Joint Venture LLC, Class B (Acquired 07/15/2010; Cost $285,788)(f)(g) | | | | 28 | | | 0 |
| | | | |
| | | | | | | | | | | | | | | 0 |
| | | | |
| Business Equipment & Services–1.76% | | | | | | | | | | | | | | |
| | |
Checkout Holding Corp. (Acquired 02/15/2019; Cost $2,863,607)(g) | | | | 8,573 | | | 2,679 |
My Alarm Center LLC, Class A (Acquired 03/09/2021-12/03/2021; Cost $6,303,839)(f)(g) | | | | 47,742 | | | 7,519,463 |
| | | | |
| | | | | | | | | | | | | | | 7,522,142 |
| | | | |
| Containers & Glass Products–0.03% | | | | | | | | | | | | | | |
| | | | |
Libbey Glass, Inc. (Acquired 11/13/2020-02/10/2022; Cost $56,094)(g) | | | | | | | | | | | 13,797 | | | 118,999 |
| | | | |
| Electronics & Electrical–0.00% | | | | | | | | | | | | | | |
| | | | |
Riverbed Technology, Inc. (Acquired 12/06/2021; Cost $549,383)(f)(g) | | | | | | | | | | | 32,799 | | | 8,364 |
| | | | |
| Financial Intermediaries–0.04% | | | | | | | | | | | | | | |
| | | | |
RJO Holdings Corp.(f) | | | | | | | | | | | 2,144 | | | 102,915 |
| | | | |
RJO Holdings Corp., Class A(f) | | | | | | | | | | | 1,142 | | | 54,830 |
RJO Holdings Corp., Class B(f) | | | | | | | | | | | 3,334 | | | 33 |
| | | | |
| | | | | | | | | | | | | | | 157,778 |
| | | | |
| Health Care–0.01% | | | | | | | | | | | | | | |
| | |
Envigo RMS Holding Corp. (Acquired 04/29/2014; Cost $0)(f)(g) | | | | 4,854 | | | 34,585 |
| | | | |
| Industrial Equipment–0.11% | | | | | | | | | | | | | | |
| | | | |
| North American Lifting Holdings, Inc. | | | | | | | | | | | 62,889 | | | 479,529 |
| | | | |
| Leisure Goods, Activities & Movies–2.89% | | | | | | | | | | | | | | |
| | |
Crown Finance US, Inc., Wts., expiring 11/23/2025 (Acquired 12/09/2020; Cost $0)(g) | | | | 173,934 | | | 0 |
See accompanying Notes to Consolidated Financial Statements which are an integral part of the financial statements.
| | |
| 13 | | Invesco Dynamic Credit Opportunity Fund |
| | | | | | | | | | | | | | |
| | | | | | | | | Shares | | | Value |
| Leisure Goods, Activities & Movies–(continued) | | | | | | | | | | | | | | |
| | | | |
USF S&H Holdco LLC (Acquired 12/02/2019; Cost $8,016,709)(e)(f)(g) | | | | | | | | | | | 11,114 | | | $ 12,311,421 |
Vue International Bidco PLC(f) | | | | | | | | | | | 2,084,496 | | | 0 |
| | | | |
| | | | | | | | | | | | | | | 12,311,421 |
| | | | |
| Oil & Gas–8.22% | | | | | | | | | | | | | | |
| | | | |
McDermott International Ltd.(f) | | | | | | | | | | | 190,859 | | | 74,340 |
| | |
QuarterNorth Energy, Inc. (Acquired 06/02/2021-10/29/2021; Cost $6,786,339)(f)(g) | | | | 163,623 | | | 32,641,152 |
QuarterNorth Energy, Inc., Wts., expiring 08/27/2029 (Acquired 08/27/2021; Cost $238,869)(f)(g) | | | | 26,541 | | | 886,469 |
QuarterNorth Energy, Inc., Wts., expiring 08/27/2029 (Acquired 08/27/2021; Cost $306,696)(f)(g) | | | | 51,116 | | | 514,738 |
| | |
Samson Investment Co., Class A (Acquired 03/01/2017; Cost $2,932,743)(f)(g) | | | | 163,748 | | | 102,343 |
| | |
Southcross Energy Partners L.P. (Acquired 07/29/2014-10/29/2020; Cost $749,269)(f)(g) | | | | 72,413 | | | 543 |
| | |
Tribune Resources LLC (Acquired 04/03/2018; Cost $1,915,487)(g) | | | | 376,237 | | | 787,840 |
Tribune Resources LLC, Wts., expiring 04/03/2023 (Acquired 04/03/2018; Cost $8,064)(f)(g) | | | | 97,410 | | | 2,435 |
| | | | |
| | | | | | | | | | | | | | | 35,009,860 |
| | | | |
| Radio & Television–0.00% | | | | | | | | | | | | | | |
| | | | |
iHeartMedia, Inc., Class B(f) | | | | | | | | | | | 42 | | | 304 |
| | | | |
| Retailers (except Food & Drug)–0.19% | | | | | | | | | | | | | | |
| | | | |
Claire’s Stores, Inc. (Acquired 10/12/2018; Cost $675,080)(g) | | | | | | | | | | | 420 | | | 208,250 |
| | | | |
Toys ’R’ Us-Delaware, Inc.(f) | | | | | | | | | | | 14 | | | 34,372 |
Vivarte S.A.S.(f) | | | | | | | | | | | 1,181,133 | | | 555,232 |
| | | | |
| | | | | | | | | | | | | | | 797,854 |
| | | | |
| Surface Transport–0.13% | | | | | | | | | | | | | | |
| | |
Commercial Barge Line Co. (Acquired 02/15/2018-02/06/2020; Cost $743,133)(g) | | | | 8,956 | | | 264,202 |
| | |
Commercial Barge Line Co., Series A, Wts., expiring 08/18/2030 (Acquired 02/03/2023; Cost $0)(g) | | | | 35,030 | | | 16,420 |
| | |
Commercial Barge Line Co., Series B, Wts., expiring 04/30/2045 (Acquired 02/03/2023; Cost $0)(g) | | | | 29,536 | | | 18,460 |
Commercial Barge Line Co., Wts., expiring 04/27/2045 (Acquired 02/15/2018-02/06/2020;
Cost $781,183)(g) | | | | 9,414 | | | 277,713 |
| | | | | | | | | | | | | | | 576,795 |
| | | | |
| Total Common Stocks & Other Equity Interests (Cost $70,904,162) | | | | | | | | | | | | | | 59,179,179 |
| | | | |
| | | Interest
Rate | | | Maturity
Date | | | Principal Amount (000)(a) | | | |
Non-U.S. Dollar Denominated Bonds & Notes–8.81%(n) | | | | | | | | | | | | | | |
| Automotive–0.58% | | | | | | | | | | | | | | |
| | | | |
Cabonline Group Holding AB (Sweden) (3 mo. STIBOR + 9.50%)(o)(p) | | | 12.37% | | | | 04/19/2026 | | | SEK | 15,000 | | | 1,318,303 |
Leather 2 S.p.A. (Italy) (3 mo. EURIBOR + 4.50%)(o)(p) | | | 6.70% | | | | 09/30/2028 | | | EUR | 1,346 | | | 1,145,117 |
| | | | |
| | | | | | | | | | | | | | | 2,463,420 |
| | | | |
| Building & Development–0.44% | | | | | | | | | | | | | | |
| | | | |
Haya (Holdco2 PLC/Real Estate SAU) (Spain) (Acquired 06/14/2022;
Cost $3,274,485)(g) | | | 10.95% | | | | 11/30/2025 | | | EUR | 4,471 | | | 1,856,074 |
| | | | |
| Cable & Satellite Television–0.56% | | | | | | | | | | | | | | |
| | | | |
Altice Finco S.A. (Luxembourg)(o) | | | 4.75% | | | | 01/15/2028 | | | EUR | 2,932 | | | 2,406,388 |
| | | | |
| Chemicals & Plastics–0.57% | | | | | | | | | | | | | | |
| | | | |
Herens Midco S.a.r.l. (Luxembourg)(o) | | | 5.25% | | | | 05/15/2029 | | | EUR | 3,345 | | | 2,445,646 |
| | | | |
| Financial Intermediaries–4.20% | | | | | | | | | | | | | | |
| | | | |
AnaCap Financial Europe S.A. SICAV-RAIF (Italy) (3 mo. EURIBOR +
5.00%)(o)(p) | | | 7.48% | | | | 08/01/2024 | | | EUR | 8,976 | | | 7,923,429 |
| | | | |
Garfunkelux Holdco 3 S.A. (Luxembourg) (3 mo. EURIBOR + 6.25%)(o)(p) | | | 8.73% | | | | 05/01/2026 | | | EUR | 4,278 | | | 3,991,587 |
| | | | |
Kane Bidco Ltd. (United Kingdom)(o) | | | 5.00% | | | | 02/15/2027 | | | EUR | 791 | | | 781,780 |
| | | | |
Kane Bidco Ltd. (United Kingdom)(o) | | | 6.50% | | | | 02/15/2027 | | | GBP | 989 | | | 1,086,026 |
| | | | |
Sherwood Financing PLC (United Kingdom)(o) | | | 6.00% | | | | 11/15/2026 | | | GBP | 1,082 | | | 1,085,437 |
Sherwood Financing PLC (United Kingdom) (3 mo. EURIBOR + 4.63%)(o)(p) | | | 7.28% | | | | 11/15/2027 | | | EUR | 3,000 | | | 3,021,980 |
| | | | |
| | | | | | | | | | | | | | | 17,890,239 |
See accompanying Notes to Consolidated Financial Statements which are an integral part of the financial statements.
| | |
| 14 | | Invesco Dynamic Credit Opportunity Fund |
| | | | | | | | | | | | | | |
| | | Interest
Rate | | | Maturity
Date | | | Principal
Amount (000)(a) | | | Value |
| Home Furnishings–1.51% | | | | | | | | | | | | | | |
| | | | |
Ideal Standard International S.A. (Belgium)(o) | | | 6.38% | | | | 07/30/2026 | | | EUR | 1,828 | | | $ 1,092,228 |
Very Group Funding PLC (The) (United Kingdom)(o) | | | 6.50% | | | | 08/01/2026 | | | GBP | 5,493 | | | 5,327,098 |
| | | | |
| | | | | | | | | | | | | | | 6,419,326 |
| | | | |
| Retailers (except Food & Drug)–0.95% | | | | | | | | | | | | | | |
Kirk Beauty SUN GmbH (Germany)(o) | | | 8.25% | | | | 10/01/2026 | | | EUR | 4,984 | | | 4,026,619 |
| | | | |
| Total Non-U.S. Dollar Denominated Bonds & Notes (Cost $51,951,120) | | | | | | | | | | | | | | 37,507,712 |
| | | | |
| Asset-Backed Securities–2.35% | | | | | | | | | | | | | | |
| Structured Products–2.35% | | | | | | | | | | | | | | |
| | | | |
Adagio V CLO DAC, Series V-X, Class E-R (Ireland) (3 mo. EURIBOR +
5.15%) (o)(q) | | | 7.44% | | | | 10/15/2031 | | | EUR | 263 | | | 229,825 |
| | | | |
Babson Euro CLO B.V., Series 2019-1A, Class ER (Ireland) (3 mo. EURIBOR + 7.21%)(o)(q) | | | 9.50% | | | | 10/15/2034 | | | EUR | 1,750 | | | 1,575,929 |
| | | | |
Babson Euro CLO B.V., Series 2021-1A, Class E (Ireland) (3 mo. EURIBOR + 7.05%)(o)(q) | | | 9.47% | | | | 04/24/2034 | | | EUR | 1,023 | | | 961,498 |
| | | | |
CVC Cordatus Loan Fund XXIII, Series 23A, Class E (Ireland) (3 mo. EURIBOR + 7.26%)(o)(q) | | | 9.71% | | | | 04/25/2036 | | | EUR | 2,127 | | | 2,120,843 |
| | | | |
Jubilee CLO, Series 2018-21A, Class E-R (Ireland) (3 mo. EURIBOR + 6.07%)(o)(q) | | | 8.36% | | | | 04/15/2035 | | | EUR | 2,041 | | | 1,938,884 |
Madison Park Euro Funding XV, Series 15A, Class ER (Ireland) (3 mo. EURIBOR + 7.29%)(o)(q) | | | 9.58% | | | | 07/15/2036 | | | EUR | 3,215 | | | 3,178,676 |
| | | | |
| Total Asset-Backed Securities (Cost $11,316,536) | | | | | | | | | | | | | | 10,005,655 |
| | | | |
| | | | | | | | | Shares | | | |
Preferred Stocks–1.25%(m) | | | | | | | | | | | | | | |
| Automotive–0.00% | | | | | | | | | | | | | | |
| | | | |
ThermaSys Corp., Series A, Pfd. (Acquired 12/31/2018; Cost $218,662)(f)(g) | | | | | | | | | | | 208,860 | | | 6,266 |
| | | | |
| Electronics & Electrical–0.00% | | | | | | | | | | | | | | |
| | | | |
Riverbed Technology, Inc., Pfd. (Acquired 12/06/2021; Cost $0)(f)(g) | | | | | | | | | | | 50,381 | | | 12,847 |
Riverbed Technology, Inc., Pfd.(f) | | | | | | | | | | | 14,219 | | | 3,626 |
| | | | |
| | | | | | | | | | | | | | | 16,473 |
| | | | |
| Financial Intermediaries–0.06% | | | | | | | | | | | | | | |
| | | | |
RJO Holdings Corp., Series A-2, Pfd.(f) | | | | | | | | | | | 649 | | | 231,657 |
| | | | |
| Oil & Gas–0.16% | | | | | | | | | | | | | | |
| | | | |
McDermott International Ltd., Pfd.(f) | | | | | | | | | | | 1,017 | | | 661,234 |
Southcross Energy Partners L.P., Series A, Pfd. (Acquired 05/07/2019-05/09/2019; Cost $285,287)(f)(g) | | | | | | | | | | | 288,393 | | | 15,862 |
| | | | |
| | | | | | | | | | | | | | | 677,096 |
| | | | |
| Surface Transport–1.03% | | | | | | | | | | | | | | |
Commercial Barge Line Co., Series A, Pfd. (Acquired 02/15/2018-02/06/2020; Cost $1,659,232)(g) | | | | 33,324 | | | 716,466 |
Commercial Barge Line Co., Series A, Pfd., Wts., expiring 04/27/2045 (Acquired 02/15/2018-02/06/2020; Cost $1,744,101)(g) | | | | 35,030 | | | 753,145 |
Commercial Barge Line Co., Series B, Pfd. (Acquired 02/05/2020-10/27/2020; Cost $978,436)(g) | | | | 42,058 | | | 1,724,378 |
Commercial Barge Line Co., Series B, Pfd., Wts., expiring 04/27/2045 (Acquired 02/05/2020-10/27/2020; Cost $687,140)(g) | | | | 29,536 | | | 1,210,976 |
| | | | | | | | | | | | | | | 4,404,965 |
| | | | |
| Total Preferred Stocks (Cost $5,999,428) | | | | | | | | | | | | | | 5,336,457 |
| | | | |
| | | Interest
Rate | | | Maturity
Date | | | Principal
Amount (000)(a) | | | |
| U.S. Dollar Denominated Bonds & Notes–0.74% | | | | | | | | | | | | | | |
| Aerospace & Defense–0.19% | | | | | | | | | | | | | | |
| | | | |
Rand Parent LLC (o) | | | 8.50% | | | | 02/15/2030 | | | $ | 820 | | | 788,225 |
| | | | |
| Air Transport–0.09% | | | | | | | | | | | | | | |
| | | | |
Mesa Airlines, Inc., Class B (Acquired 11/25/2015; Cost $691,829)(f)(g) | | | 5.75% | | | | 07/15/2025 | | | | 415 | | | 402,315 |
| | | | |
| Food Products–0.08% | | | | | | | | | | | | | | |
| | | | |
Teasdale Foods, Inc. (Acquired 12/18/2020-12/30/2022; Cost $2,153,692)(e)(f)(g) | | | 16.25% | | | | 06/18/2026 | | | | 2,154 | | | 355,359 |
See accompanying Notes to Consolidated Financial Statements which are an integral part of the financial statements.
| | |
| 15 | | Invesco Dynamic Credit Opportunity Fund |
| | | | | | | | | | | | | | | | |
| | | Interest
Rate | | | Maturity
Date | | | Principal
Amount (000)(a) | | | Value | |
| Radio & Television–0.04% | | | | | | | | | | | | | | | | |
| | | | |
Diamond Sports Group LLC/Diamond Sports Finance Co. (Acquired 11/05/2020; Cost $1,266,400)(g)(o) | | | 5.38% | | | | 08/15/2026 | | | $ | 1,631 | | | $ | 185,037 | |
|
| | |
| | | | |
| Telecommunications–0.34% | | | | | | | | | | | | | | | | |
Windstream Escrow LLC/Windstream Escrow Finance Corp. (o) | | | 7.75% | | | | 08/15/2028 | | | | 1,758 | | | | 1,438,721 | |
|
| | |
| Total U.S. Dollar Denominated Bonds & Notes (Cost $6,413,321) | | | | | | | | | | | | | | | 3,169,657 | |
|
| | |
| | | | |
| Municipal Obligations–0.66% | | | | | | | | | | | | | | | | |
| Arizona–0.66% | | | | | | | | | | | | | | | | |
| | | | |
Arizona (State of) Industrial Development Authority, (NewLife Forest Restoration, LLC), Series 2022, RB
(Acquired 02/22/2022; Cost $3,078,993) (Cost $3,078,993)(g)(o) | | | 9.00% | | | | 01/01/2028 | | | | 3,372 | | | | 2,808,903 | |
|
| | |
| | | | |
| | | | | | | | | Shares | | | | |
| Money Market Funds–1.21% | | | | | | | | | | | | | | | | |
| | | | |
Invesco Government & Agency Portfolio, Institutional Class, 4.51%(r)(s) | | | | | | | | | | | 3,078,901 | | | | 3,078,901 | |
|
| | |
| | | | |
Invesco Treasury Portfolio, Institutional Class, 4.50%(r)(s) | | | | | | | | | | | 2,052,601 | | | | 2,052,601 | |
|
| | |
| | | | |
| Total Money Market Funds (Cost $5,131,502) | | | | | | | | | | | | | | | 5,131,502 | |
|
| | |
| | | | |
| TOTAL INVESTMENTS IN SECURITIES-123.84% (Cost $604,799,162) | | | | | | | | | | | | | | | 527,490,549 | |
|
| | |
| | | | |
| BORROWINGS-31.93% | | | | | | | | | | | | | | | 136,000,000 | |
|
| | |
| | | | |
| OTHER ASSETS LESS LIABILITIES-(55.77)% | | | | | | | | | | | | | | | (237,548,006 | ) |
|
| | |
| | | | |
| NET ASSETS-100.00% | | | | | | | | | | | | | | $ | 425,942,543 | |
|
| | |
| | |
| Investment Abbreviations: |
| |
| DIP | | - Debtor-in-Possession |
| EUR | | - Euro |
| EURIBOR | | - Euro Interbank Offered Rate |
| GBP | | - British Pound Sterling |
| LIBOR | | - London Interbank Offered Rate |
| LOC | | - Letter of Credit |
| Pfd. | | - Preferred |
| PIK | | - Pay-in-Kind |
| RB | | - Revenue Bonds |
| SEK | | - Swedish Krona |
| SOFR | | - Secured Overnight Financing Rate |
| SONIA | | - Sterling Overnight Index Average |
| STIBOR | | - Stockholm Interbank Offered Rate |
| USD | | - U.S. Dollar |
| Wts. | | - Warrants |
See accompanying Notes to Consolidated Financial Statements which are an integral part of the financial statements.
| | |
| 16 | | Invesco Dynamic Credit Opportunity Fund |
Notes to Consolidated Schedule of Investments:
| (a) | Principal amounts are denominated in U.S. dollars unless otherwise noted. |
| (b) | Variable rate senior loan interests often require prepayments from excess cash flow or permit the borrower to repay at its election. The degree to which borrowers repay, whether as a contractual requirement or at their election, cannot be predicted with any accuracy. As a result, the actual remaining maturity may be substantially less than the stated maturities shown. However, it is anticipated that the variable rate senior loan interests will have an expected average life of three to five years. |
| (c) | Variable rate senior loan interests are, at present, not readily marketable, not registered under the Securities Act of 1933, as amended (the “1933 Act”) and may be subject to contractual and legal restrictions on sale. Variable rate senior loan interests in the Fund’s portfolio generally have variable rates which adjust to a base, such as the London Interbank Offered Rate (“LIBOR”), on set dates, typically every 30 days, but not greater than one year, and/or have interest rates that float at margin above a widely recognized base lending rate such as the Prime Rate of a designated U.S. bank. |
| (d) | Calculated as a percentage of net assets. Amounts in excess of 100% are due to the Fund’s use of leverage. |
| (e) | Acquired through direct lending. Direct loans may be subject to liquidity and interest rate risk and certain direct loans may be deemed illiquid. |
| (f) | Security valued using significant unobservable inputs (Level 3). See Note 3. |
| (g) | Restricted security. The aggregate value of these securities at February 28, 2023 was $109,167,864, which represented 25.63% of the Fund’s Net Assets. |
| (h) | All or a portion of this holding is subject to unfunded loan commitments. Interest rate will be determined at the time of funding. See Note 7. |
| (i) | This variable rate interest will settle after February 28, 2023, at which time the interest rate will be determined. |
| (j) | All or a portion of this security is Pay-in-Kind. Pay-in-Kind securities pay interest income in the form of securities. |
| (k) | The borrower has filed for protection in federal bankruptcy court. |
| (l) | Defaulted security. Currently, the issuer is in default with respect to principal and/or interest payments. The aggregate value of these securities at February 28, 2023 was $3,763,401, which represented less than 1% of the Fund’s Net Assets. |
| (m) | Securities acquired through the restructuring of senior loans. |
| (n) | Foreign denominated security. Principal amount is denominated in the currency indicated. |
| (o) | Security purchased or received in a transaction exempt from registration under the 1933 Act. The security may be resold pursuant to an exemption from registration under the 1933 Act, typically to qualified institutional buyers. The aggregate value of these securities at February 28, 2023 was $50,878,179, which represented 11.94% of the Fund’s Net Assets. |
| (p) | Interest or dividend rate is redetermined periodically. Rate shown is the rate in effect on February 28, 2023. |
| (q) | Interest rate is redetermined periodically based on the cash flows generated by the pool of assets backing the security, less any applicable fees. The rate shown is the rate in effect on February 28, 2023. |
| (r) | Affiliated issuer. The issuer is affiliated by having an investment adviser that is under common control of Invesco Ltd. and/or is an “affiliated person” under the Investment Company Act of 1940, as amended (the “1940 Act”), which defines “affiliated person” to include an issuer of which a fund holds 5% or more of the outstanding voting securities. For the Investments in Other Affiliates below, the Fund has not owned enough of the outstanding voting securities of the issuer to have control (as defined in the 1940 Act) of that issuer. The table below shows the Fund’s transactions in, and earnings from, its investments in affiliates for the fiscal year ended February 28, 2023. |
| | | | | | | | | | | | | | | | | | | | | | | | | | | | |
| | | Value February 28, 2022 | | | Purchases at Cost | | | Proceeds from Sales | | | Change in Unrealized Appreciation | | | Realized Gain | | | Value February 28, 2023 | | Dividend Income |
| Investments in Affiliated Money Market Funds: | | | | | | | | | | | | | | | | | | | | | | | | | | | | |
| Invesco Government & Agency Portfolio, Institutional Class | | | $12,170,719 | | | $ | 255,992,242 | | | $ | (265,084,060 | ) | | | $ - | | | | $- | | | | $ 3,078,901 | | | | $328,042 | |
| Invesco Treasury Portfolio, Institutional Class | | | 8,113,813 | | | | 170,661,494 | | | | (176,722,706 | ) | | | - | | | | - | | | | 2,052,601 | | | | 216,947 | |
| Investments in Other Affiliates: | | | | | | | | | | | | | | | | | | | | | | | | | | | | |
| USF S&H Holdco LLC* | | | 10,075,244 | | | | 8,016,709 | | | | (8,016,709 | ) | | | 2,236,177 | | | | - | | | | 12,311,421 | | | | - | |
| Total | | | $30,359,776 | | | $ | 434,670,445 | | | $ | (449,823,475 | ) | | | $2,236,177 | | | | $- | | | | $17,442,923 | | | | $544,989 | |
| | * | At February 28, 2023, this security was was no longer an affiliate of the Fund. |
| (s) | The rate shown is the 7-day SEC standardized yield as of February 28, 2023. |
The aggregate value of securities considered illiquid at February 28, 2023 was $332,657,426, which represented 78.10% of the Fund’s Net Assets.
| | | | | | | | | | | | | | | | | | | | | | |
Open Forward Foreign Currency Contracts | |
|
| | |
| Settlement | | | | Contract to | | | Unrealized
Appreciation | |
| Date | | Counterparty | | Deliver | | | Receive | | | (Depreciation) | |
|
| | |
| Currency Risk | | | | | | | | | | | | | | | | | | | | | | |
|
| | |
| 03/31/2023 | | Bank of America, N.A. | | | NOK | | | | 1,711 | | | | USD | | | | 173 | | | $ | 9 | |
|
| | |
| 04/28/2023 | | Barclays Bank PLC | | | EUR | | | | 896,778 | | | | USD | | | | 960,266 | | | | 8,572 | |
|
| | |
| 04/28/2023 | | Barclays Bank PLC | | | GBP | | | | 7,420,448 | | | | USD | | | | 8,992,020 | | | | 56,931 | |
|
| | |
| 03/31/2023 | | BNP Paribas S.A. | | | EUR | | | | 28,004,714 | | | | USD | | | | 30,592,064 | | | | 920,033 | |
|
| | |
| 03/31/2023 | | BNP Paribas S.A. | | | GBP | | | | 7,040,969 | | | | USD | | | | 8,691,129 | | | | 217,440 | |
|
| | |
| 04/28/2023 | | BNP Paribas S.A. | | | EUR | | | | 26,828,891 | | | | USD | | | | 28,682,389 | | | | 210,587 | |
|
| | |
| 04/28/2023 | | Canadian Imperial Bank of Commerce | | | GBP | | | | 7,532,879 | | | | USD | | | | 9,141,643 | | | | 71,174 | |
|
| | |
| 03/31/2023 | | J.P. Morgan Chase Bank, N.A. | | | GBP | | | | 220,701 | | | | USD | | | | 271,805 | | | | 6,195 | |
|
| | |
| 03/31/2023 | | Morgan Stanley and Co. International PLC | | | EUR | | | | 28,429,028 | | | | USD | | | | 31,087,000 | | | | 965,392 | |
|
| | |
| 03/31/2023 | | Morgan Stanley and Co. International PLC | | | GBP | | | | 800,141 | | | | USD | | | | 976,792 | | | | 13,836 | |
|
| | |
See accompanying Notes to Consolidated Financial Statements which are an integral part of the financial statements.
| | |
| 17 | | Invesco Dynamic Credit Opportunity Fund |
| | | | | | | | | | | | | | | | | | | | | | |
Open Forward Foreign Currency Contracts–(continued) | |
|
| | |
| Settlement | | | | Contract to | | | Unrealized
Appreciation | |
| Date | | Counterparty | | Deliver | | | Receive | | | (Depreciation) | |
|
| | |
| 04/28/2023 | | Morgan Stanley and Co. International PLC | | | EUR | | | | 26,677,920 | | | | USD | | | | 28,525,001 | | | | $ 213,414 | |
|
| | |
| 04/28/2023 | | Morgan Stanley and Co. International PLC | | | SEK | | | | 13,740,945 | | | | USD | | | | 1,334,470 | | | | 17,807 | |
|
| | |
| 03/31/2023 | | Royal Bank of Canada | | | EUR | | | | 29,292,619 | | | | USD | | | | 31,993,182 | | | | 956,567 | |
|
| | |
| 03/31/2023 | | Royal Bank of Canada | | | GBP | | | | 6,935,880 | | | | USD | | | | 8,540,704 | | | | 193,488 | |
|
| | |
| 04/28/2023 | | Royal Bank of Canada | | | EUR | | | | 26,828,891 | | | | USD | | | | 28,704,284 | | | | 232,482 | |
|
| | |
| 04/28/2023 | | Royal Bank of Canada | | | NOK | | | | 1,711 | | | | USD | | | | 167 | | | | 2 | |
|
| | |
| 03/31/2023 | | State Street Bank & Trust Co. | | | EUR | | | | 306,885 | | | | USD | | | | 335,428 | | | | 10,273 | |
|
| | |
| 03/31/2023 | | State Street Bank & Trust Co. | | | SEK | | | | 13,963,801 | | | | USD | | | | 1,368,146 | | | | 32,175 | |
|
| | |
| 03/31/2023 | | Toronto Dominion Bank (The) | | | GBP | | | | 7,040,969 | | | | USD | | | | 8,687,947 | | | | 214,258 | |
|
| | |
| 04/28/2023 | | Toronto Dominion Bank (The) | | | GBP | | | | 7,532,879 | | | | USD | | | | 9,152,520 | | | | 82,051 | |
|
| | |
| Subtotal–Appreciation | | | | | | | | | | | | | | | | | | | 4,422,686 | |
|
| | |
| | | | | | |
| Currency Risk | | | | | | | | | | | | | | | | | | | | | | |
|
| | |
| 03/31/2023 | | Bank of America, N.A. | | | USD | | | | 42,450 | | | | SEK | | | | 431,404 | | | | (1,176 | ) |
|
| | |
| 03/31/2023 | | Barclays Bank PLC | | | USD | | | | 8,916,541 | | | | GBP | | | | 7,362,452 | | | | (55,953 | ) |
|
| | |
| 03/31/2023 | | BNP Paribas S.A. | | | USD | | | | 28,636,109 | | | | EUR | | | | 26,828,891 | | | | (209,906 | ) |
|
| | |
| 03/31/2023 | | Canadian Imperial Bank of Commerce | | | USD | | | | 9,064,943 | | | | GBP | | | | 7,474,004 | | | | (70,104 | ) |
|
| | |
| 03/31/2023 | | Morgan Stanley and Co. International PLC | | | GBP | | | | 341,880 | | | | USD | | | | 411,139 | | | | (308 | ) |
|
| | |
| 03/31/2023 | | Morgan Stanley and Co. International PLC | | | SEK | | | | 143,556 | | | | USD | | | | 13,549 | | | | (186 | ) |
|
| | |
| 03/31/2023 | | Morgan Stanley and Co. International PLC | | | USD | | | | 34,770,157 | | | | EUR | | | | 32,375,464 | | | | (467,154 | ) |
|
| | |
| 03/31/2023 | | Morgan Stanley and Co. International PLC | | | USD | | | | 1,326,159 | | | | SEK | | | | 13,675,953 | | | | (17,727 | ) |
|
| | |
| 03/31/2023 | | Royal Bank of Canada | | | USD | | | | 28,658,085 | | | | EUR | | | | 26,828,891 | | | | (231,881 | ) |
|
| | |
| 03/31/2023 | | Royal Bank of Canada | | | USD | | | | 167 | | | | NOK | | | | 1,711 | | | | (2 | ) |
|
| | |
| 03/31/2023 | | Toronto Dominion Bank (The) | | | USD | | | | 9,075,728 | | | | GBP | | | | 7,474,004 | | | | (80,889 | ) |
|
| | |
| 03/31/2023 | | UBS | | | USD | | | | 86,815 | | | | GBP | | | | 70,079 | | | | (2,476 | ) |
|
| | |
| Subtotal–Depreciation | | | | | | | | | | | | | | | | | | | (1,137,762 | ) |
|
| | |
| Total Forward Foreign Currency Contracts | | | | | | | | | | | | | | | | | | | $3,284,924 | |
|
| | |
| | |
| Abbreviations: |
| |
| EUR | | - Euro |
| GBP | | - British Pound Sterling |
| NOK | | - Norwegian Krone |
| SEK | | - Swedish Krona |
| USD | | - U.S. Dollar |
See accompanying Notes to Consolidated Financial Statements which are an integral part of the financial statements.
| | |
| 18 | | Invesco Dynamic Credit Opportunity Fund |
Consolidated Statement of Assets and Liabilities
February 28, 2023
| | | | |
| Assets: | | | | |
Investments in unaffiliated securities, at value
(Cost $599,667,660) | | $ | 522,359,047 | |
|
| | |
| Investments in affiliated money market funds, at value (Cost $5,131,502) | | | 5,131,502 | |
|
| | |
| Other investments: | | | | |
| Unrealized appreciation on forward foreign currency contracts outstanding | | | 4,422,686 | |
|
| | |
| Cash | | | 25,889,879 | |
|
| | |
| Foreign currencies, at value (Cost $9,441,424) | | | 8,731,054 | |
|
| | |
| Cash from broker | | | 664,232 | |
|
| | |
| Receivable for: | | | | |
| Investments sold | | | 23,533,755 | |
|
| | |
| Dividends | | | 62,266 | |
|
| | |
| Interest and fees | | | 11,321,229 | |
|
| | |
Investments matured, at value
(Cost $9,349,453) | | | 1,581,977 | |
|
| | |
| Investment for trustee deferred compensation and retirement plans | | | 29,239 | |
|
| | |
| Other assets | | | 55,684 | |
|
| | |
| Total assets | | | 603,782,550 | |
|
| | |
| |
| Liabilities: | | | | |
| Other investments: | | | | |
| Unrealized depreciation on forward foreign currency contracts outstanding | | | 1,137,762 | |
|
| | |
| Payable for: | | | | |
| Borrowings | | | 136,000,000 | |
|
| | |
| Investments purchased | | | 12,554,236 | |
|
| | |
| Dividends | | | 6,822,185 | |
|
| | |
| Accrued fees to affiliates | | | 146,820 | |
|
| | |
| Accrued interest expense | | | 1,223,923 | |
|
| | |
| Accrued trustees’ and officers’ fees and benefits | | | 1,712 | |
|
| | |
| Accrued other operating expenses | | | 189,088 | |
|
| | |
| Trustee deferred compensation and retirement plans | | | 29,239 | |
|
| | |
| Unfunded loan commitments | | | 19,735,042 | |
|
| | |
| Total liabilities | | | 177,840,007 | |
|
| | |
| Net assets applicable to shares outstanding | | $ | 425,942,543 | |
|
| | |
| | | | |
| Net assets consist of: | | | | |
| Shares of beneficial interest | | $ | 592,296,528 | |
|
| | |
| Distributable earnings (loss) | | | (166,353,985 | ) |
|
| | |
| | $ | 425,942,543 | |
|
| | |
| |
| Net Assets: | | | | |
| Class A | | $ | 90,541 | |
|
| | |
| Class AX | | $ | 425,832,940 | |
|
| | |
| Class Y | | $ | 10,025 | |
|
| | |
| Class R6 | | $ | 9,037 | |
|
| | |
|
| Shares outstanding, no par value, with an unlimited number of shares authorized: | |
| Class A | | | 8,056 | |
|
| | |
| Class AX | | | 37,912,680 | |
|
| | |
| Class Y | | | 892 | |
|
| | |
| Class R6 | | | 804 | |
|
| | |
| Class A: | | | | |
| Net asset value per share | | $ | 11.24 | |
|
| | |
Maximum offering price per share
(Net asset value of $11.24 ÷ 96.75%) | | $ | 11.62 | |
|
| | |
| Class AX: | | | | |
| Net asset value and offering price per share | | $ | 11.23 | |
|
| | |
| Class Y: | | | | |
| Net asset value and offering price per share | | $ | 11.24 | |
|
| | |
| Class R6: | | | | |
| Net asset value and offering price per share | | $ | 11.24 | |
|
| | |
See accompanying Notes to Consolidated Financial Statements which are an integral part of the financial statements.
| | |
| 19 | | Invesco Dynamic Credit Opportunity Fund |
Consolidated Statement of Operations
For the year ended February 28, 2023
| | | | |
| Investment income: | | | | |
| |
| Interest | | $ | 51,804,582 | |
|
| | |
| Dividends | | | 2,157,554 | |
|
| | |
| Dividends from affiliated money market funds | | | 544,989 | |
|
| | |
| Other income | | | 179,742 | |
|
| | |
| Total investment income | | | 54,686,867 | |
|
| | |
| |
| Expenses: | | | | |
| Advisory fees | | | 8,424,845 | |
|
| | |
| Administrative services fees | | | 69,053 | |
|
| | |
| Custodian fees | | | 111,163 | |
|
| | |
| Distribution fees: | | | | |
| Class A | | | 154 | |
|
| | |
| Interest, facilities and maintenance fees | | | 7,512,213 | |
|
| | |
| Transfer agent fees | | | 613,165 | |
|
| | |
| Transfer agent fees – R6 | | | 3 | |
|
| | |
| Trustees’ and officers’ fees and benefits | | | 18,838 | |
|
| | |
| Registration and filing fees | | | 28,810 | |
|
| | |
| Reports to shareholders | | | 86,356 | |
|
| | |
| Professional services fees | | | 776,414 | |
|
| | |
| Other | | | 49,215 | |
|
| | |
| Total expenses | | | 17,690,229 | |
|
| | |
| Less: Fees waived | | | (19,492 | ) |
|
| | |
| Net expenses | | | 17,670,737 | |
|
| | |
| Net investment income | | | 37,016,130 | |
|
| | |
| |
| Realized and unrealized gain (loss) from: | | | | |
| Net realized gain (loss) from: | | | | |
| Unaffiliated investment securities | | | (37,425,658 | ) |
|
| | |
| Foreign currencies | | | (1,545,370 | ) |
|
| | |
| Forward foreign currency contracts | | | 20,054,986 | |
|
| | |
| | | (18,916,042 | ) |
|
| | |
| Change in net unrealized appreciation (depreciation) of: | | | | |
| Unaffiliated investment securities | | | (29,707,990 | ) |
|
| | |
| Affiliated investment securities | | | 2,236,177 | |
|
| | |
| Foreign currencies | | | 538,821 | |
|
| | |
| Forward foreign currency contracts | | | 1,531,421 | |
|
| | |
| | | (25,401,571 | ) |
|
| | |
| Net realized and unrealized gain (loss) | | | (44,317,613 | ) |
|
| | |
| Net increase (decrease) in net assets resulting from operations | | $ | (7,301,483 | ) |
|
| | |
See accompanying Notes to Consolidated Financial Statements which are an integral part of the financial statements.
| | |
| 20 | | Invesco Dynamic Credit Opportunity Fund |
Consolidated Statement of Changes in Net Assets
For the years ended February 28, 2023 and 2022
| | | | | | | | |
| | | 2023 | | | 2022 | |
|
| | |
| Operations: | | | | | | | | |
| Net investment income | | $ | 37,016,130 | | | $ | 37,562,005 | |
|
| | |
| Net realized gain (loss) | | | (18,916,042 | ) | | | 51,107,700 | |
|
| | |
| Change in net unrealized appreciation (depreciation) | | | (25,401,571 | ) | | | (20,912,113 | ) |
|
| | |
| Net increase (decrease) in net assets resulting from operations | | | (7,301,483 | ) | | | 67,757,592 | |
|
| | |
| | |
| Distributions to shareholders from distributable earnings: | | | | | | | | |
| Class A | | | (5,250 | ) | | | (252 | ) |
|
| | |
| Class AX | | | (40,070,451 | ) | | | (52,019,960 | ) |
|
| | |
| Class Y | | | (853 | ) | | | (265 | ) |
|
| | |
| Class R6 | | | (779 | ) | | | (243 | ) |
|
| | |
| Total distributions from distributable earnings | | | (40,077,333 | ) | | | (52,020,720 | ) |
|
| | |
| | |
| Share transactions–net: | | | | | | | | |
| Class A | | | 80,910 | | | | 12,014 | |
|
| | |
| Class AX | | | (148,966,322 | ) | | | (150,443,857 | ) |
|
| | |
| Class Y | | | 78 | | | | 11,024 | |
|
| | |
| Class R6 | | | – | | | | 10,012 | |
|
| | |
| Net increase (decrease) in net assets resulting from share transactions | | | (148,885,334 | ) | | | (150,410,807 | ) |
|
| | |
| Net increase (decrease) in net assets | | | (196,264,150 | ) | | | (134,673,935 | ) |
|
| | |
| | |
| Net assets: | | | | | | | | |
| Beginning of year | | | 622,206,693 | | | | 756,880,628 | |
|
| | |
| End of year | | $ | 425,942,543 | | | $ | 622,206,693 | |
|
| | |
See accompanying Notes to Consolidated Financial Statements which are an integral part of the financial statements.
| | |
| 21 | | Invesco Dynamic Credit Opportunity Fund |
Consolidated Statement of Cash Flows
For the year ended February 28, 2023
| | | | |
| Cash provided by operating activities: | | | | |
| Net increase (decrease) in net assets resulting from operations | | $ | (7,301,483 | ) |
|
| | |
| |
| Adjustments to reconcile the change in net assets from operations to net cash provided by operating activities: | | | | |
| |
| Purchases of investments | | | (322,842,553 | ) |
|
| | |
| Proceeds from sales of investments | | | 548,119,351 | |
|
| | |
| Purchases of short-term investments, net | | | (13,958,481 | ) |
|
| | |
| Amortization of premium on investment securities | | | 1,989,880 | |
|
| | |
| Accretion of discount on investment securities | | | (3,749,052 | ) |
|
| | |
| Net realized loss from investment securities | | | 37,425,658 | |
|
| | |
| Net change in unrealized depreciation on investment securities | | | 27,471,813 | |
|
| | |
| Net change in unrealized appreciation of forward foreign currency contracts | | | (1,531,421 | ) |
|
| | |
| Change in operating assets and liabilities: | | | | |
|
| | |
| Increase in receivables and other assets | | | (886,236 | ) |
|
| | |
| Increase in accrued expenses and other payables | | | 771,500 | |
|
| | |
| Net cash provided by operating activities | | | 265,508,976 | |
|
| | |
| Cash provided by (used in) financing activities: | | | | |
| |
| Dividends paid to shareholders from distributable earnings | | | (30,339,318 | ) |
|
| | |
| Proceeds from shares of beneficial interest sold | | | 650,140 | |
|
| | |
| Proceeds from borrowings | | | 130,000,000 | |
|
| | |
| Repayment of borrowings | | | (211,000,000 | ) |
|
| | |
| Disbursements from shares of beneficial interest reacquired | | | (160,053,736 | ) |
|
| | |
| Net cash provided by (used in) financing activities | | | (270,742,914 | ) |
|
| | |
| Net decrease in cash and cash equivalents | | | (5,233,938 | ) |
|
| | |
| Cash and cash equivalents at beginning of period | | | 44,986,373 | |
|
| | |
| Cash and cash equivalents at end of period | | $ | 39,752,435 | |
|
| | |
| |
| Non-cash financing activities: | | | | |
| |
| Value of shares of beneficial interest issued in reinvestment of dividends paid to shareholders | | $ | 10,527,333 | |
|
| | |
| |
| Supplemental disclosure of cash flow information: | | | | |
| |
| Cash paid during the period for taxes | | $ | 29,537 | |
|
| | |
| Cash paid during the period for interest, facilities and maintenance fees | | $ | 6,291,914 | |
|
| | |
See accompanying Notes to Consolidated Financial Statements which are an integral part of the financial statements.
| | |
| 22 | | Invesco Dynamic Credit Opportunity Fund |
Consolidated Financial Highlights
The following schedule presents financial highlights for a share of the Fund outstanding throughout the periods indicated.
| | | | | | | | |
| Class A | | Year Ended February 28, 2023 | | | Period Ended February 28, 2022(a) | |
|
| | |
| Net asset value, beginning of period | | | $ 12.27 | | | | $ 12.46 | |
|
| | |
Net investment income(b) | | | 0.79 | | | | 0.85 | |
|
| | |
| Net gains (losses) on securities (both realized and unrealized) | | | (0.92 | ) | | | (0.90 | ) |
|
| | |
| Total from investment operations | | | (0.13 | ) | | | (0.05 | ) |
|
| | |
| Less: Dividends from net investment income | | | (0.90 | ) | | | (0.14 | ) |
|
| | |
| Net asset value, end of period | | | $ 11.24 | | | | $ 12.27 | |
|
| | |
Total return at net asset value(c) | | | (1.03 | )% | | | (0.38 | )% |
|
| | |
| Net assets, end of period (000’s omitted) | | | $ 91 | | | | $ 12 | |
|
| | |
Portfolio turnover rate(d) | | | 22 | % | | | 96 | % |
|
| | |
| | |
| Ratios/supplemental data based on average net assets: | | | | | | | | |
| Ratio of expenses: | | | | | | | | |
With fee waivers and/or expense reimbursements(e) | | | 4.27 | % | | | 2.84 | %(f) |
|
| | |
| With fee waivers and/or expense reimbursements excluding interest, facilities and maintenance fees | | | 2.37 | % | | | 2.32 | %(f) |
|
| | |
| Without fee waivers and/or expense reimbursements | | | 4.27 | % | | | 2.84 | %(f) |
|
| | |
| Ratio of net investment income | | | 7.06 | % | | | 4.91 | %(f) |
|
| | |
| | |
| Senior indebtedness: | | | | | | | | |
| Total borrowings (000’s omitted) | | | $136,000 | | | | $217,000 | |
|
| | |
Asset coverage per $1,000 unit of senior indebtedness(g) | | | $ 4,132 | | | | $ 3,867 | |
|
| | |
| (a) | Commencement date of November 1, 2021. |
| (b) | Calculated using average shares outstanding. |
| (c) | Includes adjustments in accordance with accounting principles generally accepted in the United States of America and as such, the net asset value for financial reporting purposes and the returns based upon those net asset values may differ from the net asset value and returns for shareholder transactions. Does not include sales charges and is not annualized for periods less than one year, if applicable. |
| (d) | Portfolio turnover is calculated at the fund level and is not annualized for periods less than one year, if applicable. Calculation includes the proceeds from principal repayments and sales of variable rate senior loan interests. |
| (e) | Includes fee waivers which were less than 0.005% per share. |
| (g) | Calculated by subtracting the Fund’s total liabilities (not including the Borrowings) from the Fund’s total assets and dividing by the total number of senior indebtedness units, where one unit equals $1,000 of senior indebtedness. |
See accompanying Notes to Consolidated Financial Statements which are an integral part of the financial statements.
| | |
| 23 | | Invesco Dynamic Credit Opportunity Fund |
Consolidated Financial Highlights–(continued)
| | | | | | | | | | | | | | | | | | | | |
| | | Years Ended February 28, | | | Year Ended February 29, | | | Year Ended February 28, |
| Class AX(a) | | 2023 | | | 2022 | | | 2021 | | | 2020 | | | 2019 |
| | | | | |
| Net asset value, beginning of period | | | $ 12.27 | | | | $ 12.02 | | | | $ 12.35 | | | | $ 12.66 | | | | $ 13.15 | |
Net investment income(b) | | | 0.88 | | | | 0.65 | | | | 0.62 | | | | 0.72 | | | | 0.61 | |
| Net gains (losses) on securities (both realized and unrealized) | | | (0.99 | ) | | | 0.38 | | | | (0.05 | ) | | | (0.21 | ) | | | (0.19 | ) |
| Total from investment operations | | | (0.11 | ) | | | 1.03 | | | | 0.57 | | | | 0.51 | | | | 0.42 | |
| Less: | | | | | | | | | | | | | | | | | | | | |
| Dividends from net investment income | | | (0.93 | ) | | | (0.78 | ) | | | (0.74 | ) | | | (0.82 | ) | | | (0.91 | ) |
| Return of capital | | | - | | | | - | | | | (0.16 | ) | | | - | | | | - | |
| Total distributions | | | (0.93 | ) | | | (0.78 | ) | | | (0.90 | ) | | | (0.82 | ) | | | (0.91 | ) |
| Net asset value, end of period | | | $ 11.23 | | | | $ 12.27 | | | | $ 12.02 | | | | $ 12.35 | | | | $ 12.66 | |
| Market value per common share, end of period | | | N/A | | | | N/A | | | | $ 11.00 | | | | $ 10.83 | | | | $ 11.06 | |
Total return at net asset value(c) | | | (0.86 | )% | | | 8.75 | % | | | 7.11 | % | | | 4.99 | % | | | 4.44 | % |
Total return at market value(d) | | | N/A | | | | N/A | | | | 11.77 | % | | | 5.39 | % | | | 3.52 | % |
| Net assets, end of period (000’s omitted) | | | $425,833 | | | | $622,174 | | | | $756,881 | | | | $777,644 | | | | $937,973 | |
Portfolio turnover rate(e) | | | 22 | % | | | 96 | % | | | 83 | % | | | 83 | % | | | 69 | % |
| | | | | |
| Ratios/supplemental data based on average net assets: | | | | | | | | | | | | | | | | | | | | |
| | | | | |
| Ratio of expenses: | | | | | | | | | | | | | | | | | | | | |
With fee waivers and/or expense reimbursements(f) | | | 3.68 | % | | | 2.52 | % | | | 2.68 | % | | | 3.59 | % | | | 3.50 | % |
| With fee waivers and/or expense reimbursements excluding interest, facilities and maintenance fees | | | 2.12 | % | | | 1.96 | % | | | 1.92 | % | | | 1.99 | % | | | 1.97 | % |
| Without fee waivers and/or expense reimbursements | | | 3.68 | % | | | 2.52 | % | | | 2.68 | % | | | 3.59 | % | | | 3.50 | % |
| Ratio of net investment income | | | 7.65 | % | | | 5.23 | % | | | 5.66 | % | | | 5.76 | % | | | 4.72 | % |
| | | | | |
| Senior indebtedness: | | | | | | | | | | | | | | | | | | | | |
| | | | | |
| Total borrowings (000’s omitted) | | | $136,000 | | | | $217,000 | | | | $191,000 | | | | $300,000 | | | | $327,000 | |
Asset coverage per $1,000 unit of senior indebtedness(g) | | | $ 4,132 | | | | $ 3,867 | | | | $ 5,486 | | | | $ 4,010 | | | | $ 4,249 | |
| Total amount of preferred shares outstanding (000’s omitted) | | | N/A | | | | N/A | | | | $100,000 | | | | $125,000 | | | | $125,000 | |
Asset coverage per preferred share(h) | | | N/A | | | | N/A | | | | $856,881 | | | | $722,116 | | | | $850,378 | |
| Liquidating preference per preferred share | | | N/A | | | | N/A | | | | $100,000 | | | | $100,000 | | | | $100,000 | |
| (a) | Prior to November 1, 2021, the Fund operated as a Closed-End non-interval fund. On such date, holders of common shares of Closed-End Fund received Class AX shares of the Fund equal to the number of Closed-End Fund common shares they owned prior to Reorganization. |
| (b) | Calculated using average shares outstanding. |
| (c) | Includes adjustments in accordance with accounting principles generally accepted in the United States of America and as such, the net asset value for financial reporting purposes and the returns based upon those net asset values may differ from the net asset value and returns for shareholder transactions. Does not include sales charges and is not annualized for periods less than one year, if applicable. |
| (d) | Total return assumes an investment at the common share market price at the beginning of the period indicated, reinvestment of all distributions for the period in accordance with the Fund’s dividend reinvestment plan, and sale of all shares at the closing common share market price at the end of the period indicated. Not annualized for periods less than one year, if applicable. |
| (e) | Portfolio turnover is calculated at the fund level and is not annualized for periods less than one year, if applicable. Calculation includes the proceeds from principal repayments and sales of variable rate senior loan interests. |
| (f) | Includes fee waivers which were less than 0.005% per share. |
| (g) | Calculated by subtracting the Fund’s total liabilities (not including the Borrowings) from the Fund’s total assets and dividing by the total number of senior indebtedness units, where one unit equals $1,000 of senior indebtedness. |
| (h) | Calculated by subtracting the Fund’s total liabilities (not including the preferred shares, at liquidation value) from the Fund’s total assets and dividing by the total number of preferred shares outstanding. |
See accompanying Notes to Consolidated Financial Statements which are an integral part of the financial statements.
| | |
| 24 | | Invesco Dynamic Credit Opportunity Fund |
Consolidated Financial Highlights–(continued)
| | | | | | | | |
| | | Year Ended | | | Period Ended | |
| | | February 28, | | | February 28, | |
| Class Y | | 2023 | | | 2022(a) | |
|
| | |
| Net asset value, beginning of period | | | $ 12.27 | | | | $ 12.46 | |
|
| | |
Net investment income(b) | | | 0.87 | | | | 0.86 | |
|
| | |
| Net gains (losses) on securities (both realized and unrealized) | | | (0.97 | ) | | | (0.90 | ) |
|
| | |
| Total from investment operations | | | (0.10 | ) | | | (0.04 | ) |
|
| | |
| Less: Dividends from net investment income | | | (0.93 | ) | | | (0.15 | ) |
|
| | |
| Net asset value, end of period | | | $ 11.24 | | | | $ 12.27 | |
|
| | |
Total return at net asset value(c) | | | (0.75 | )% | | | (0.34 | )% |
|
| | |
| Net assets, end of period (000’s omitted) | | | $ 10 | | | | $ 11 | |
|
| | |
Portfolio turnover rate(d) | | | 22 | % | | | 96 | % |
|
| | |
| | |
| Ratios/supplemental data based on average net assets: | | | | | | | | |
| | |
| Ratio of expenses: | | | | | | | | |
With fee waivers and/or expense reimbursements(e) | | | 3.68 | % | | | 2.59 | %(f) |
|
| | |
| With fee waivers and/or expense reimbursements excluding interest, facilities and maintenance fees | | | 2.12 | % | | | 2.07 | %(f) |
|
| | |
| Without fee waivers and/or expense reimbursements | | | 3.68 | % | | | 2.59 | %(f) |
|
| | |
| Ratio of net investment income | | | 7.65 | % | | | 5.16 | %(f) |
|
| | |
| | |
| Senior indebtedness: | | | | | | | | |
| | |
| Total borrowings (000’s omitted) | | | $136,000 | | | | $217,000 | |
|
| | |
Asset coverage per $1,000 unit of senior indebtedness(g) | | | $ 4,132 | | | | $ 3,867 | |
|
| | |
| (a) | Commencement date of November 1, 2021. |
| (b) | Calculated using average shares outstanding. |
| (c) | Includes adjustments in accordance with accounting principles generally accepted in the United States of America and as such, the net asset value for financial reporting purposes and the returns based upon those net asset values may differ from the net asset value and returns for shareholder transactions. Does not include sales charges and is not annualized for periods less than one year, if applicable. |
| (d) | Portfolio turnover is calculated at the fund level and is not annualized for periods less than one year, if applicable. Calculation includes the proceeds from principal repayments and sales of variable rate senior loan interests. |
| (e) | Includes fee waivers which were less than 0.005% per share. |
| (g) | Calculated by subtracting the Fund’s total liabilities (not including the Borrowings) from the Fund’s total assets and dividing by the total number of senior indebtedness units, where one unit equals $1,000 of senior indebtedness. |
See accompanying Notes to Consolidated Financial Statements which are an integral part of the financial statements.
| | |
| 25 | | Invesco Dynamic Credit Opportunity Fund |
Consolidated Financial Highlights–(continued)
| | | | | | | | |
| | | Year Ended | | | Period Ended | |
| | | February 28, | | | February 28, | |
| Class R6 | | 2023 | | | 2022(a) | |
|
| | |
| Net asset value, beginning of period | | | $ 12.27 | | | | $ 12.46 | |
|
| | |
Net investment income(b) | | | 0.89 | | | | 0.86 | |
|
| | |
| Net gains (losses) on securities (both realized and unrealized) | | | (0.98 | ) | | | (0.90 | ) |
|
| | |
| Total from investment operations | | | (0.09 | ) | | | (0.04 | ) |
|
| | |
| Less: Dividends from net investment income | | | (0.94 | ) | | | (0.15 | ) |
|
| | |
| Net asset value, end of period | | | $ 11.24 | | | | $ 12.27 | |
|
| | |
Total return at net asset value(c) | | | (0.70 | )% | | | (0.33 | )% |
|
| | |
| Net assets, end of period (000’s omitted) | | | $ 9 | | | | $ 10 | |
|
| | |
Portfolio turnover rate(d) | | | 22 | % | | | 96 | % |
|
| | |
| | |
| Ratios/supplemental data based on average net assets: | | | | | | | | |
| | |
| Ratio of expenses: | | | | | | | | |
With fee waivers and/or expense reimbursements(e) | | | 3.58 | % | | | 2.55 | %(f) |
|
| | |
| With fee waivers and/or expense reimbursements excluding interest, facilities and maintenance fees | | | 2.02 | % | | | 2.03 | %(f) |
|
| | |
| Without fee waivers and/or expense reimbursements | | | 3.58 | % | | | 2.55 | %(f) |
|
| | |
| Ratio of net investment income | | | 7.75 | % | | | 5.20 | %(f) |
|
| | |
| | |
| Senior indebtedness: | | | | | | | | |
| | |
| Total borrowings (000’s omitted) | | | $136,000 | | | | $217,000 | |
|
| | |
Asset coverage per $1,000 unit of senior indebtedness(g) | | | $ 4,132 | | | | $ 3,867 | |
|
| | |
| (a) | Commencement date of November 1, 2021. |
| (b) | Calculated using average shares outstanding. |
| (c) | Includes adjustments in accordance with accounting principles generally accepted in the United States of America and as such, the net asset value for financial reporting purposes and the returns based upon those net asset values may differ from the net asset value and returns for shareholder transactions. Does not include sales charges and is not annualized for periods less than one year, if applicable. |
| (d) | Portfolio turnover is calculated at the fund level and is not annualized for periods less than one year, if applicable. Calculation includes the proceeds from principal repayments and sales of variable rate senior loan interests. |
| (e) | Includes fee waivers which were less than 0.005% per share. |
| (g) | Calculated by subtracting the Fund’s total liabilities (not including the Borrowings) from the Fund’s total assets and dividing by the total number of senior indebtedness units, where one unit equals $1,000 of senior indebtedness. |
See accompanying Notes to Consolidated Financial Statements which are an integral part of the financial statements.
| | |
| 26 | | Invesco Dynamic Credit Opportunity Fund |
Notes to Consolidated Financial Statements
February 28, 2023
NOTE 1–Significant Accounting Policies
Invesco Dynamic Credit Opportunity Fund (the “Fund”) is a Delaware statutory trust registered under the Investment Company Act of 1940, as amended (the “1940 Act”), as a non-diversified, closed-end management investment company that is operated as an interval fund and periodically offers its shares for repurchase.
The Fund may participate in direct lending opportunities through its indirect investment in the Invesco Dynamic Credit Opportunities Loan Origination LLC (the “LLC”), a Delaware limited liability company. The Fund owns all beneficial and economic interests in the Invesco Dynamic Credit Opportunities Loan Origination Trust, a Massachusetts Business Trust (the “Loan Origination Trust”), which in turn owns all beneficial and economic interests in the LLC. The Fund may invest up to 60% of its total net assets in the Loan Origination Trust. The accompanying consolidated financial statements reflect the financial position of the Fund and its Loan Origination Trust and the results of operations on a consolidated basis.
The Fund’s investment objective is to seek a high level of current income, with a secondary objective of capital appreciation. The Fund seeks to achieve its objectives by investing primarily in a portfolio of interests in floating or fixed rate senior loans to corporations, partnerships, and other entities which operate in a variety of industries and geographic regions. The Fund borrows money for investment purposes which may create the opportunity for enhanced return, but also should be considered a speculative technique and may increase the Fund’s volatility.
The Fund currently consists of four different classes of shares: Class A, Class AX, Class Y and Class R6 shares. Class AX shares are closed to new investors. Class Y shares are available only to certain investors. Class A shares are sold with a front-end sales charge unless certain waiver criteria are met. Under certain circumstances, load waived shares may be subject to contingent deferred sales charges (“CDSC”). Class AX, Class Y and Class R6 shares are sold at net asset value.
The Fund is an investment company and accordingly follows the investment company accounting and reporting guidance in accordance with Financial Accounting Standards Board Accounting Standards Codification Topic 946, Financial Services - Investment Companies.
The following is a summary of the significant accounting policies followed by the Fund in the preparation of its consolidated financial statements.
| A. | Security Valuations - Variable rate senior loan interests are fair valued using quotes provided by an independent pricing service. Quotes provided by the pricing service may reflect appropriate factors such as ratings, tranche type, industry, company performance, spread, individual trading characteristics, institution-size trading in similar groups of securities and other market data. |
Securities, including restricted securities, are valued according to the following policy. A security listed or traded on an exchange is generally valued at its trade price or official closing price that day as of the close of the exchange where the security is principally traded, or lacking any trades or official closing price on a particular day, the security may be valued at the closing bid price on that day. Securities traded in the over-the-counter market (but not securities reported on the NASDAQ Stock Exchange) are valued based on the prices furnished by independent pricing services, in which case the securities may be considered fair valued, or by market makers. Each security reported on the NASDAQ Stock Exchange is valued at the NASDAQ Official Closing Price (“NOCP”) as of the close of the customary trading session on the valuation date or absent a NOCP, at the closing bid price.
Futures contracts are valued at the daily settlement price set by an exchange on which they are principally traded. U.S. exchange-traded options are valued at the mean between the last bid and the asked prices from the exchange on which they are principally traded. Non-U.S. exchange-traded options are valued at the final settlement price set by the exchange on which they trade. Options not listed on an exchange and swaps generally are valued using pricing provided from independent pricing services.
Securities of investment companies that are not exchange-traded (e.g., open-end mutual funds) are valued using such company’s end-of-business-day net asset value per share.
Fixed income securities (including convertible debt securities) generally are valued on the basis of prices provided by independent pricing services. Prices provided by the pricing service may be determined without exclusive reliance on quoted prices, and may reflect appropriate factors such as institution-size trading in similar groups of securities, developments related to specific securities, dividend rate (for unlisted equities), yield (for debt obligations), quality, type of issue, coupon rate (for debt obligations), maturity (for debt obligations), individual trading characteristics and other market data. Pricing services generally value debt obligations assuming orderly transactions of institutional round lot size, but a fund may hold or transact in the same securities in smaller, odd lot sizes. Odd lots often trade at lower prices than institutional round lots, and their value may be adjusted accordingly. Debt obligations are subject to interest rate and credit risks. In addition, all debt obligations involve some risk of default with respect to interest and/or principal payments.
Swap agreements are fair valued using an evaluated quote, if available, provided by an independent pricing service. Evaluated quotes provided by the pricing service are valued based on a model which may include end-of-day net present values, spreads, ratings, industry, company performance and returns of referenced assets. Centrally cleared swap agreements are valued at the daily settlement price determined by the relevant exchange or clearinghouse.
Deposits, other obligations of U.S. and non-U.S. banks and financial institutions are valued at their daily account value.
Foreign securities’ (including foreign exchange contracts) prices are converted into U.S. dollar amounts using the applicable exchange rates as of the close of the New York Stock Exchange (“NYSE”). If market quotations are available and reliable for foreign exchange-traded equity securities, the securities will be valued at the market quotations. Invesco Advisers, Inc. (the “Adviser” or “Invesco”) may use various pricing services to obtain market quotations as well as fair value prices. Because trading hours for certain foreign securities end before the close of the NYSE, closing market quotations may become not representative of market value in the Adviser’s judgment (“unreliable”). If, between the time trading ends on a particular security and the close of the customary trading session on the NYSE, a significant event occurs that makes the closing price of the security unreliable, the Adviser may fair value the security. If the event is likely to have affected the closing price of the security, the security will be valued at fair value in good faith in accordance with Board-approved policies and related Adviser procedures (“Valuation Procedures”). Adjustments to closing prices to reflect fair value may also be based on a screening process of an independent pricing service to indicate the degree of certainty, based on historical data, that the closing price in the principal market where a foreign security trades is not the current value as of the close of the NYSE. Foreign securities’ prices meeting the degree of certainty that the price is not reflective of current value will be priced at the indication of fair value from the independent pricing service. Multiple factors may be considered by the independent pricing service in determining adjustments to reflect fair value and may include information relating to sector indices, American Depositary Receipts and domestic and foreign index futures. Foreign securities may have additional risks including exchange rate changes, potential for sharply devalued currencies and high inflation, political and economic upheaval, the relative lack of issuer information, relatively low market liquidity and the potential lack of strict financial and accounting controls and standards.
Unlisted securities will be valued using prices provided by independent pricing services or by another method that the Adviser, in its judgment, believes better reflects the security’s fair value in accordance with the Valuation Procedures.
Securities for which market prices are not provided by any of the above methods may be valued based upon quotes furnished by independent sources. The last bid price may be used to value equity securities. The mean between the last bid and asked prices may be used to value debt obligations, including corporate loans.
Securities for which market quotations are not readily available are fair valued by the Adviser in accordance with the Valuation Procedures. If a fair value price provided by a pricing service is unreliable, the Adviser will fair value the security using the Valuation Procedures. Issuer specific events, market trends, bid/asked quotes of brokers and information providers and other market data may be reviewed in the course of making a good faith determination of a security’s fair value.
The Fund may invest in securities that are subject to interest rate risk, meaning the risk that the prices will generally fall as interest rates rise and, conversely, the prices will generally rise as interest rates fall. Specific securities differ in their sensitivity to changes in interest rates depending on their individual characteristics. Changes in interest rates may result in increased market volatility, which may affect the value and/or liquidity of certain Fund investments.
| | |
| 27 | | Invesco Dynamic Credit Opportunity Fund |
Valuations change in response to many factors including the historical and prospective earnings of the issuer, the value of the issuer’s assets, general market conditions which are not specifically related to the particular issuer, such as real or perceived adverse economic conditions, changes in the general outlook for revenues or corporate earnings, changes in interest or currency rates, regional or global instability, natural or environmental disasters, widespread disease or other public health issues, war, acts of terrorism, significant governmental actions or adverse investor sentiment generally and market liquidity. Because of the inherent uncertainties of valuation, the values reflected in the consolidated financial statements may materially differ from the value received upon actual sale of those investments.
The price the Fund could receive upon the sale of any investment may differ from the Adviser’s valuation of the investment, particularly for securities that are valued using a fair valuation technique. When fair valuation techniques are applied, the Adviser uses available information, including both observable and unobservable inputs and assumptions, to determine a methodology that will result in a valuation that the Adviser believes approximates market value. Fund securities that are fair valued may be subject to greater fluctuation in their value from one day to the next than would be the case if market quotations were used. Because of the inherent uncertainties of valuation, and the degree of subjectivity in such decisions, the Fund could realize a greater or lesser than expected gain or loss upon the sale of the investment.
| B. | Securities Transactions and Investment Income - Securities transactions are accounted for on a trade date basis. Realized gains or losses on sales are computed on the basis of specific identification of the securities sold. Interest income (net of withholding tax, if any) is recorded on an accrual basis from settlement date and includes coupon interest and amortization of premium and accretion of discount on debt securities as applicable. Pay-in-kind interest income and non-cash dividend income received in the form of securities in-lieu of cash are recorded at the fair value of the securities received. Facility fees received may be amortized over the life of the loan. Dividend income (net of withholding tax, if any) is recorded on the ex-dividend date. |
The Fund may periodically participate in litigation related to Fund investments. As such, the Fund may receive proceeds from litigation settlements. Any proceeds received are included in the Consolidated Statement of Operations as realized gain (loss) for investments no longer held and as unrealized gain (loss) for investments still held.
Other income is comprised primarily of amendment fees which are recorded when received. Amendment fees are received in return for changes in the terms of the loan or note.
Brokerage commissions and mark ups are considered transaction costs and are recorded as an increase to the cost basis of securities purchased and/or a reduction of proceeds on a sale of securities. Such transaction costs are included in the determination of net realized and unrealized gain (loss) from investment securities reported in the Consolidated Statement of Operations and the Consolidated Statement of Changes in Net Assets and the net realized and unrealized gains (losses) on securities per share in the Consolidated Financial Highlights. Transaction costs are included in the calculation of the Fund’s net asset value and, accordingly, they reduce the Fund’s total returns. These transaction costs are not considered operating expenses and are not reflected in net investment income reported in the Consolidated Statement of Operations and the Consolidated Statement of Changes in Net Assets, or the net investment income per share and the ratios of expenses and net investment income reported in the Consolidated Financial Highlights, nor are they limited by any expense limitation arrangements between the Fund and the investment adviser.
| C. | Country Determination - For the purposes of making investment selection decisions and presentation in the Consolidated Schedule of Investments, the investment adviser may determine the country in which an issuer is located and/or credit risk exposure based on various factors. These factors include the laws of the country under which the issuer is organized, where the issuer maintains a principal office, the country in which the issuer derives 50% or more of its total revenues, the country that has the primary market for the issuer’s securities and its “country of risk” as determined by a third party service provider, as well as other criteria. Among the other criteria that may be evaluated for making this determination are the country in which the issuer maintains 50% or more of its assets, the type of security, financial guarantees and enhancements, the nature of the collateral and the sponsor organization. Country of issuer and/or credit risk exposure has been determined to be the United States of America, unless otherwise noted. |
| D. | Distributions - Distributions from net investment income, if any, are declared daily and paid quarterly. Distributions from net realized capital gain, if any, are generally declared and paid annually and recorded on the ex-dividend date. The Fund may elect to treat a portion of the proceeds from redemptions as distributions for federal income tax purposes. |
| E. | Federal Income Taxes - The Fund intends to comply with the requirements of Subchapter M of the Internal Revenue Code of 1986, as amended (the “Internal Revenue Code”), necessary to qualify as a regulated investment company and to distribute substantially all of the Fund’s taxable earnings to shareholders. As such, the Fund will not be subject to federal income taxes on otherwise taxable income (including net realized capital gain) that is distributed to shareholders. Therefore, no provision for federal income taxes is recorded in the consolidated financial statements. |
The Fund recognizes the tax benefits of uncertain tax positions only when the position is more likely than not to be sustained. Management has analyzed the Fund’s uncertain tax positions and concluded that no liability for unrecognized tax benefits should be recorded related to uncertain tax positions. Management is not aware of any tax positions for which it is reasonably possible that the total amounts of unrecognized tax benefits will change materially in the next 12 months.
The Fund files tax returns in the U.S. Federal jurisdiction and certain other jurisdictions. Generally, the Fund is subject to examinations by such taxing authorities for up to three years after the filing of the return for the tax period.
| F. | Accounting Estimates - The preparation of financial statements in conformity with accounting principles generally accepted in the United States of America (“GAAP”) requires management to make estimates and assumptions that affect the reported amounts of assets and liabilities at the date of the financial statements and the reported amounts of revenues and expenses during the reporting period including estimates and assumptions related to taxation. Actual results could differ from those estimates by a significant amount. In addition, the Fund monitors for material events or transactions that may occur or become known after the period-end date and before the date the consolidated financial statements are released to print. |
| G. | Indemnifications - Under the Fund’s organizational documents, each Trustee, officer, employee or other agent of the Fund is indemnified against certain liabilities that may arise out of the performance of their duties to the Fund. Additionally, in the normal course of business, the Fund enters into contracts, including the Fund’s servicing agreements, that contain a variety of indemnification clauses. The Fund’s maximum exposure under these arrangements is unknown as this would involve future claims that may be made against the Fund that have not yet occurred. The risk of material loss as a result of such indemnification claims is considered remote. |
| H. | Cash and Cash Equivalents - For the purposes of the Consolidated Statement of Cash Flows, the Fund defines Cash and Cash Equivalents as cash (including foreign currency), money market funds and other investments held in lieu of cash and excludes investments made with cash collateral received. |
| I. | Securities Purchased on a When-Issued and Delayed Delivery Basis - The Fund may purchase and sell interests in corporate loans and corporate debt securities and other portfolio securities on a when-issued and delayed delivery basis, with payment and delivery scheduled for a future date. No income accrues to the Fund on such interests or securities in connection with such transactions prior to the date the Fund actually takes delivery of such interests or securities. These transactions are subject to market fluctuations and are subject to the risk that the value at delivery may be more or less than the trade date purchase price. Although the Fund will generally purchase these securities with the intention of acquiring such securities, they may sell such securities prior to the settlement date. |
| J. | Foreign Currency Translations - Foreign currency is valued at the close of the NYSE based on quotations posted by banks and major currency dealers. Portfolio securities and other assets and liabilities denominated in foreign currencies are translated into U.S. dollar amounts at the date of valuation. Purchases and sales of portfolio securities (net of foreign taxes withheld on disposition) and income items denominated in foreign currencies are translated into U.S. dollar amounts on the respective dates of such transactions. The Fund does not separately account for the portion of the results of operations resulting from changes in foreign exchange rates on investments and the fluctuations arising from changes in market prices of securities held. The combined results of changes in foreign |
| | |
| 28 | | Invesco Dynamic Credit Opportunity Fund |
| | exchange rates and the fluctuation of market prices on investments (net of estimated foreign tax withholding) are included with the net realized and unrealized gain or loss from investments in the Consolidated Statement of Operations. Reported net realized foreign currency gains or losses arise from (1) sales of foreign currencies, (2) currency gains or losses realized between the trade and settlement dates on securities transactions, and (3) the difference between the amounts of dividends, interest, and foreign withholding taxes recorded on the Fund’s books and the U.S. dollar equivalent of the amounts actually received or paid. Net unrealized foreign currency gains and losses arise from changes in the fair values of assets and liabilities, other than investments in securities at fiscal period end, resulting from changes in exchange rates. |
The Fund may invest in foreign securities, which may be subject to foreign taxes on income, gains on investments or currency repatriation, a portion of which may be recoverable. Foreign taxes, if any, are recorded based on the tax regulations and rates that exist in the foreign markets in which the Fund invests and are shown in the Consolidated Statement of Operations.
| K. | Forward Foreign Currency Contracts - The Fund may engage in foreign currency transactions either on a spot (i.e. for prompt delivery and settlement) basis, or through forward foreign currency contracts, to manage or minimize currency or exchange rate risk. |
The Fund may also enter into forward foreign currency contracts for the purchase or sale of a security denominated in a foreign currency in order to “lock in” the U.S. dollar price of that security, or the Fund may also enter into forward foreign currency contracts that do not provide for physical exchange of the two currencies on the settlement date, but instead are settled by a single cash payment calculated as the difference between the agreed upon exchange rate and the spot rate at settlement based upon an agreed upon notional amount (non-deliverable forwards).
A forward foreign currency contract is an obligation between two parties (“Counterparties”) to purchase or sell a specific currency for an agreed-upon price at a future date. The use of forward foreign currency contracts for hedging does not eliminate fluctuations in the price of the underlying securities the Fund owns or intends to acquire but establishes a rate of exchange in advance. Fluctuations in the value of these contracts are measured by the difference in the contract date and reporting date exchange rates and are recorded as unrealized appreciation (depreciation) until the contracts are closed. When the contracts are closed, realized gains (losses) are recorded. Realized and unrealized gains (losses) on the contracts are included in the Consolidated Statement of Operations. The primary risks associated with forward foreign currency contracts include failure of the Counterparty to meet the terms of the contract and the value of the foreign currency changing unfavorably. These risks may be in excess of the amounts reflected in the Consolidated Statement of Assets and Liabilities.
| L. | Industry Focus - To the extent that the Fund invests a greater amount of its assets in securities of issuers in the banking and financial services industries, the Fund’s performance will depend to a greater extent on the overall condition of those industries. The value of these securities can be sensitive to changes in government regulation, interest rates and economic downturns in the U.S. and abroad. |
| M. | Bank Loan Risk - Although the resale, or secondary market for floating rate loans has grown substantially over the past decade, both in overall size and number of market participants, there is no organized exchange or board of trade on which floating rate loans are traded. Instead, the secondary market for floating rate loans is a private, unregulated interdealer or interbank resale market. Such a market may therefore be subject to irregular trading activity, wide bid/ask spreads, and extended trade settlement periods, which may impair the Fund’s ability to sell bank loans within its desired time frame or at an acceptable price and its ability to accurately value existing and prospective investments. Extended trade settlement periods may result in cash not being immediately available to the Fund. As a result, the Fund may have to sell other investments or engage in borrowing transactions to raise cash to meet its obligations. Similar to other asset classes, bank loan funds may be exposed to counterparty credit risk, or the risk than an entity with which the Fund has unsettled or open transactions may fail to or be unable to perform on its commitments. The Fund seeks to manage counterparty credit risk by entering into transactions only with counterparties that it believes have the financial resources to honor their obligations and by monitoring the financial stability of those counterparties. |
| N. | LIBOR Risk - The Fund may have investments in financial instruments that utilize the London Interbank Offered Rate (“LIBOR”) as the reference or benchmark rate for variable interest rate calculations. LIBOR is intended to measure the rate generally at which banks can lend and borrow from one another in the relevant currency on an unsecured basis. The UK Financial Conduct Authority (“FCA”), the regulator that oversees LIBOR, announced that the majority of LIBOR rates would cease to be published or would no longer be representative on January 1, 2022. Although the publication of most LIBOR rates ceased at the end of 2021, a selection of widely used USD LIBOR rates continues to be published until June 2023 to allow for an orderly transition away from these rates. |
There remains uncertainty and risks relating to the continuing LIBOR transition and its effects on the Fund and the instruments in which the Fund invests. There can be no assurance that the composition or characteristics of any alternative reference rates (“ARRs”) or financial instruments in which the Fund invests that utilize ARRs will be similar to or produce the same value or economic equivalence as LIBOR or that these instruments will have the same volume or liquidity. Additionally, there remains uncertainty and risks relating to certain “legacy” USD LIBOR instruments that were issued or entered into before December 31, 2021 and the process by which a replacement interest rate will be identified and implemented into these instruments when USD LIBOR is ultimately discontinued. The effects of such uncertainty and risks in “legacy” USD LIBOR instruments held by the Fund could result in losses to the Fund.
| O. | Foreign Risk - The Fund may invest in senior loans to borrowers that are organized or located in countries other than the United States. Investment in non-U.S. issuers involves special risks, including that non-U.S. issuers may be subject to less rigorous accounting and reporting requirements than U.S. issuers, less rigorous regulatory requirements, different legal systems and laws relating to creditors’ rights, the potential inability to enforce legal judgments and the potential for political, social and economic adversity. Investments by the Fund in non-U.S. dollar denominated investments will be subject to currency risk. The Fund also may hold non-U.S. dollar denominated senior loans or other securities received as part of a reorganization or restructuring. Trading in many foreign securities may be less liquid and more volatile than U.S. securities due to the size of the market or other factors. |
| P. | Leverage Risk - The Fund may utilize leverage to seek to enhance the yield of the Fund by borrowing or issuing preferred shares. There are risks associated with borrowing or issuing preferred shares in an effort to increase the yield and distributions on the common shares, including that the costs of the financial leverage may exceed the income from investments made with such leverage, the higher volatility of the net asset value of the common shares, and that fluctuations in the interest rates on the borrowing or dividend rates on preferred shares may affect the yield and distributions to the common shareholders. There can be no assurance that the Fund’s leverage strategy will be successful. |
| Q. | Other Risks - The Fund may invest all or substantially all of its assets in senior secured floating rate loans and senior secured debt securities that are determined to be rated below investment grade. These securities are generally considered to have speculative characteristics and are subject to greater risk of loss of principal and interest than higher rated securities. The value of lower quality debt securities and floating rate loans can be more volatile due to increased sensitivity to adverse issuer, political, regulatory, market or economic developments. |
The Fund invests in corporate loans from U.S. or non-U.S. companies (the “Borrowers”). The investment of the Fund in a corporate loan may take the form of participation interests or assignments. If the Fund purchases a participation interest from a syndicate of lenders (“Lenders”) or one of the participants in the syndicate (“Participant”), one or more of which administers the loan on behalf of all the Lenders (the “Agent Bank”), the Fund would be required to rely on the Lender that sold the participation interest not only for the enforcement of the Fund’s rights against the Borrower but also for the receipt and processing of payments due to the Fund under the corporate loans. As such, the Fund is subject to the credit risk of the Borrower and the Participant. Lenders and Participants interposed between the Fund and a Borrower, together with Agent Banks, are referred to as “Intermediate Participants”.
Increases in the federal funds and equivalent foreign rates or other changes to monetary policy or regulatory actions may expose fixed income markets to heightened volatility and reduced liquidity for certain fixed income investments, particularly those with longer maturities. It is difficult to predict the impact of interest rate changes on various markets. In addition, decreases in fixed income dealer market-making capacity may also potentially lead to heightened volatility and reduced liquidity in the fixed income markets. As a result, the value of the Fund’s investments and share price may decline. Changes in central bank policies could also result in higher than normal redemptions by shareholders, which could potentially increase the Fund’s portfolio turnover rate and transaction costs.
| | |
| 29 | | Invesco Dynamic Credit Opportunity Fund |
Policy changes by the U.S. government or its regulatory agencies and political events within the U.S. and abroad may, among other things, affect investor and consumer confidence and increase volatility in the financial markets, perhaps suddenly and to a significant degree, which may adversely impact the Fund’s operations, universe of potential investment options, and return potential.
In making a loan directly to the borrower (“direct loan”), the Fund is exposed to the credit risk that the borrower may default or become insolvent and, consequently, that the Fund will lose money on the loan. Furthermore, direct loans may subject the Fund to liquidity and interest rate risk and certain direct loans may be deemed illiquid. Direct loans are not publicly traded and may not have a secondary market. The lack of a secondary market for direct loans may have an adverse impact on the ability of the Fund to dispose of a direct loan and/or to value the direct loan. When engaging in direct lending, the Fund’s performance may depend, in part, on the ability of the Fund to originate loans on advantageous terms. In originating and purchasing loans, the Fund will compete with a broad spectrum of lenders. Increased competition for, or a decrease in the available supply of, qualifying loans could result in lower yields on such loans, which could adversely affect Fund performance.
The Fund is non-diversified and may invest in securities of fewer issuers than if it were diversified. Thus, the value of the Fund’s shares may vary more widely and the Fund may be subject to greater market and credit risk than if the Fund invested more broadly.
| R. | COVID-19 Risk - The COVID-19 strain of coronavirus has resulted in instances of market closures and dislocations, extreme volatility, liquidity constraints and increased trading costs. Efforts to contain its spread have resulted in travel restrictions, disruptions of healthcare systems, business operations (including business closures) and supply chains, layoffs, lower consumer demand and employee availability, and defaults and credit downgrades, among other significant economic impacts that have disrupted global economic activity across many industries. Such economic impacts may exacerbate other pre-existing political, social and economic risks locally or globally and cause general concern and uncertainty. The full economic impact and ongoing effects of COVID-19 (or other future epidemics or pandemics) at the macro-level and on individual businesses are unpredictable and may result in significant and prolonged effects on the Fund’s performance. |
NOTE 2–Advisory Fees and Other Fees Paid to Affiliates
The Fund has entered into an investment advisory agreement with the Adviser. Under the terms of the investment advisory agreement, the Fund accrues daily and pays monthly an advisory fee to the Adviser based on the annual rate of 1.25% of the Fund’s average daily managed assets. Managed assets for this purpose means the Fund’s net assets, plus assets attributable to outstanding preferred shares and the amount of any borrowings incurred for the purpose of leverage (whether or not such borrowed amounts are reflected in the Fund’s consolidated financial statements for purposes of GAAP.)
For the year ended February 28, 2023, the effective advisory fee rate incurred by the Fund was 1.75%.
Under the terms of a master sub-advisory agreement between the Adviser and each of Invesco Asset Management Deutschland GmbH, Invesco Asset Management Limited, Invesco Asset Management (Japan) Limited, Invesco Hong Kong Limited, Invesco Senior Secured Management, Inc. and Invesco Canada Ltd. and separate sub-advisory agreements with Invesco Capital Management LLC and Invesco Asset Management (India) Private Limited (collectively, the “Affiliated Sub-Advisers”) the Adviser, not the Fund, will pay 40% of the fees paid to the Adviser to any such Affiliated Sub-Adviser(s) that provide(s) discretionary investment management services to the Fund based on the percentage of assets allocated to such Affiliated Sub-Adviser(s).
The Adviser has contractually agreed, through at least June 30, 2024, to waive the advisory fee payable by the Fund in an amount equal to 100% of the net advisory fees the Adviser receives from the affiliated money market funds on investments by the Fund of uninvested cash in such affiliated money market funds.
For the year ended February 28, 2023, the Adviser waived advisory fees of $19,492.
The Fund has entered into a master administrative services agreement with Invesco pursuant to which the Fund has agreed to pay Invesco for certain administrative costs incurred in providing accounting services to the Fund. For the year ended February 28, 2023, expenses incurred under this agreement are shown in the Consolidated Statement of Operations as Administrative services fees. Invesco has entered into a sub-administration agreement whereby State Street Bank and Trust Company (“SSB”) serves as fund accountant and provides certain administrative services to the Fund. Pursuant to a custody agreement with the Fund, SSB also serves as the Fund’s custodian.
The Fund has entered into a transfer agency and service agreement with Invesco Investment Services, Inc. (“IIS”) pursuant to which the Fund has agreed to pay IIS a fee for providing transfer agency and shareholder services to the Fund and reimburse IIS for certain expenses incurred by IIS in the course of providing such services. For the year ended February 28, 2023, expenses incurred under these agreements are shown in the Consolidated Statement of Operations as Transfer agent fees.
The Fund has entered into master distribution agreements with Invesco Distributors, Inc. (“IDI”) to serve as the distributor for the Class A, Class AX, Class Y and Class R6 shares of the Fund. The Fund has adopted a plan pursuant to Rule 12b-1 under the 1940 Act with respect to the Fund’s Class A shares (the “Plan”). The Fund, pursuant to the Plan, pays IDI compensation at the annual rate of 0.25% of the Fund’s average daily net assets of Class A shares. The fees are accrued daily and paid monthly. Of the Plan payments, up to 0.25% of the Fund’s average daily net assets of Class A shares may be paid to furnish continuing personal shareholder services to customers who purchase and own Class A shares. Any amounts not paid as a service fee under the Plan would constitute an asset-based sales charge. Rules of the Financial Industry Regulatory Authority (“FINRA”) also impose a cap on the total sales charges, including asset-based sales charges, that may be paid by Class A shares of the Fund. For the year ended February 28, 2023, expenses incurred under the Plan are shown in the Consolidated Statement of Operations as Distribution fees.
Certain officers and trustees of the Fund are officers and directors of the Adviser, IIS and/or IDI.
NOTE 3–Additional Valuation Information
GAAP defines fair value as the price that would be received to sell an asset or paid to transfer a liability in an orderly transaction between market participants at the measurement date, under current market conditions. GAAP establishes a hierarchy that prioritizes the inputs to valuation methods, giving the highest priority to readily available unadjusted quoted prices in an active market for identical assets (Level 1) and the lowest priority to significant unobservable inputs (Level 3), generally when market prices are not readily available. Based on the valuation inputs, the securities or other investments are tiered into one of three levels. Changes in valuation methods may result in transfers in or out of an investment’s assigned level:
| | |
| Level 1 - | | Prices are determined using quoted prices in an active market for identical assets. |
| Level 2 - | | Prices are determined using other significant observable inputs. Observable inputs are inputs that other market participants may use in pricing a security. These may include quoted prices for similar securities, interest rates, prepayment speeds, credit risk, yield curves, loss severities, default rates, discount rates, volatilities and others. |
| Level 3 - | | Prices are determined using significant unobservable inputs. In situations where quoted prices or observable inputs are unavailable (for example, when there is little or no market activity for an investment at the end of the period), unobservable inputs may be used. Unobservable inputs reflect the Adviser’s assumptions about the factors market participants would use in determining fair value of the securities or instruments and would be based on the best available information. |
| | |
| 30 | | Invesco Dynamic Credit Opportunity Fund |
The following is a summary of the tiered valuation input levels, as of February 28, 2023. The level assigned to the securities valuations may not be an indication of the risk or liquidity associated with investing in those securities. Because of the inherent uncertainties of valuation, the values reflected in the consolidated financial statements may materially differ from the value received upon actual sale of those investments.
| | | | | | | | | | | | | | | | | | | | | | | | | | | | |
| | | Level 1 | | | | | | Level 2 | | | | | | Level 3 | | | | | | Total | |
|
| | |
| Investments in Securities | | | | | | | | | | | | | | | | | | | | | | | | | | | | |
|
| | |
| Variable Rate Senior Loan Interests | | $ | – | | | | | | | $ | 113,680,496 | | | | | | | $ | 290,670,988 | | | | | | | $ | 404,351,484 | |
|
| | |
| Common Stocks & Other Equity Interests | | | – | | | | | | | | 2,174,092 | | | | | | | | 57,005,087 | | | | | | | | 59,179,179 | |
|
| | |
| Non-U.S. Dollar Denominated Bonds & Notes | | | – | | | | | | | | 37,507,712 | | | | | | | | – | | | | | | | | 37,507,712 | |
|
| | |
| Asset-Backed Securities | | | – | | | | | | | | 10,005,655 | | | | | | | | – | | | | | | | | 10,005,655 | |
|
| | |
| Preferred Stocks | | | – | | | | | | | | 4,404,965 | | | | | | | | 931,492 | | | | | | | | 5,336,457 | |
|
| | |
| U.S. Dollar Denominated Bonds & Notes | | | – | | | | | | | | 2,411,983 | | | | | | | | 757,674 | | | | | | | | 3,169,657 | |
|
| | |
| Municipal Obligations | | | – | | | | | | | | 2,808,903 | | | | | | | | – | | | | | | | | 2,808,903 | |
|
| | |
| Money Market Funds | | | 5,131,502 | | | | | | | | – | | | | | | | | – | | | | | | | | 5,131,502 | |
|
| | |
| Total Investments in Securities | | | 5,131,502 | | | | | | | | 172,993,806 | | | | | | | | 349,365,241 | | | | | | | | 527,490,549 | |
|
| | |
| | | | | | | |
| Other Investments - Assets* | | | | | | | | | | | | | | | | | | | | | | | | | | | | |
|
| | |
| Investments Matured | | | – | | | | | | | | 1,227,693 | | | | | | | | 354,284 | | | | | | | | 1,581,977 | |
|
| | |
| Forward Foreign Currency Contracts | | | – | | | | | | | | 4,422,686 | | | | | | | | – | | | | | | | | 4,422,686 | |
|
| | |
| | | – | | | | | | | | 5,650,379 | | | | | | | | 354,284 | | | | | | | | 6,004,663 | |
|
| | |
| | | | | | | |
| Other Investments - Liabilities* | | | | | | | | | | | | | | | | | | | | | | | | | | | | |
|
| | |
| Forward Foreign Currency Contracts | | | – | | | | | | | | (1,137,762 | ) | | | | | | | – | | | | | | | | (1,137,762 | ) |
|
| | |
| Total Other Investments | | | – | | | | | | | | 4,512,617 | | | | | | | | 354,284 | | | | | | | | 4,866,901 | |
|
| | |
| Total Investments | | $ | 5,131,502 | | | | | | | $ | 177,506,423 | | | | | | | $ | 349,719,525 | | | | | | | $ | 532,357,450 | |
|
| | |
| * | Forward foreign currency contracts are valued at unrealized appreciation (depreciation). Investments matured are shown at value. |
A reconciliation of Level 3 investments is presented when the Fund had a significant amount of Level 3 investments at the beginning and/or end of the reporting period in relation to net assets.
The following is a reconciliation of the fair valuations using significant unobservable inputs (Level 3) during the year ended February 28, 2023:
| | | | | | | | | | | | | | | | | | | | | | | | | | | | | | | | | | | | |
| | | | | | | | | | | | | | | | | | Change in | | | | | | | | | | |
| | | | | | | | | | | | Accrued | | | Realized | | | Unrealized | | | Transfers | | | Transfers | | | | |
| | | Value | | | Purchases | | | Proceeds | | | Discounts/ | | | Gain | | | Appreciation | | | into | | | out of | | | Value | |
| | | 02/28/22 | | | at Cost | | | from Sales | | | Premiums | | | (Loss) | | | (Depreciation) | | | Level 3* | | | Level 3* | | | 02/28/23 | |
|
| | |
| Variable Rate Senior Loan Interests | | $ | 317,103,912 | | | $ | 89,427,051 | | | $ | (116,691,920 | ) | | $ | 1,457,026 | | | $ | (2,228,720 | ) | | $ | (9,454,766 | ) | | $ | 16,115,467 | | | $ | (5,057,062 | ) | | $ | 290,670,988 | |
|
| | |
| Common Stocks & Other Equity Interests | | | 28,481,060 | | | | 8,016,709 | | | | (12,313,490 | ) | | | – | | | | 735,945 | | | | 19,088,025 | | | | 13,626,789 | | | | (629,951 | ) | | | 57,005,087 | |
|
| | |
| Preferred Stocks | | | 1,488,910 | | | | 268,675 | | | | (1,001,535 | ) | | | – | | | | 410,548 | | | | (1,091,056 | ) | | | 855,950 | | | | – | | | | 931,492 | |
|
| | |
| U.S. Dollar Denominated Bonds & Notes | | | 2,624,330 | | | | 317,125 | | | | (553,200 | ) | | | – | | | | – | | | | (1,630,581 | ) | | | – | | | | – | | | | 757,674 | |
|
| | |
| Investments Matured | | | 2,658,636 | | | | 147,615 | | | | (3,393,179 | ) | | | (2,189 | ) | | | (9,311 | ) | | | 952,712 | | | | – | | | | – | | | | 354,284 | |
|
| | |
| Total | | $ | 352,356,848 | | | $ | 98,177,175 | | | $ | (133,953,324 | ) | | $ | 1,454,837 | | | $ | (1,091,538 | ) | | $ | 7,864,334 | | | $ | 30,598,206 | | | $ | (5,687,013 | ) | | $ | 349,719,525 | |
|
| | |
*Transfers into and out of level 3 are due to increases or decreases in market activity impacting the available market inputs to determine the price.
Securities determined to be Level 3 at the end of the reporting period were valued primarily by utilizing evaluated prices from a third-party vendor pricing service. A significant change in third-party pricing information could result in a lower or higher value in Level 3 investments.
| | |
| 31 | | Invesco Dynamic Credit Opportunity Fund |
The following table summarizes the valuation techniques and significant unobservable inputs used in determining fair value measurements for those investments classified as level 3 at period end:
| | | | | | | | | | | | | | | | |
| | | | | | | | | | Range of | | | | | |
| | | Fair Value | | | Valuation | | Unobservable | | Unobservable | | Unobservable | | | |
| | | at 02/28/23 | | | Technique | | Inputs | | Inputs | | Input Used | | | |
|
| | |
| QuarterNorth Energy, Inc. | | $ | 32,641,152 | | | Bid Offer | | Bid Offer Price | | N/A | | $199.49 | | | (a) | |
|
| | |
| FDH Group Acquisition, Inc., Term Loan A | | | 22,034,656 | | | Valuation Service | | N/A | | N/A | | N/A | | | (b) | |
|
| | |
| Keg Logistics LLC, Term Loan A | | | 20,460,931 | | | Valuation Service | | N/A | | N/A | | N/A | | | (b) | |
|
| | |
| Lightning Finco Ltd. (LiveU), Term Loan B-1 | | | 18,004,588 | | | Valuation Service | | N/A | | N/A | | N/A | | | (b) | |
|
| | |
| Muth Mirror Systems LLC, Term Loan | | | 17,645,383 | | | Valuation Service | | N/A | | N/A | | N/A | | | (b) | |
|
| | |
| Teasdale Foods, Inc., Term Loan B | | | 13,180,761 | | | Valuation Service | | N/A | | N/A | | N/A | | | (b) | |
|
| | |
| Groundworks LLC, First Lien Incremental Term Loan | | | 13,026,603 | | | Valuation Service | | N/A | | N/A | | N/A | | | (b) | |
|
| | |
| USF S&H Holdco LLC | | | 12,311,421 | | | Valuation Service | | N/A | | N/A | | N/A | | | (b) | |
|
| | |
| USF S&H Holdco LLC, Term Loan B | | | 10,570,766 | | | Valuation Service | | N/A | | N/A | | N/A | | | (b) | |
|
| | |
| PrimeFlight Aviation Services, Inc., Term Loan | | | 9,485,302 | | | Valuation Service | | N/A | | N/A | | N/A | | | (b) | |
|
| | |
| NAS LLC (d.b.a. Nationwide Marketing Group), Term Loan | | | 8,763,927 | | | Valuation Service | | N/A | | N/A | | N/A | | | (b) | |
|
| | |
| Transtar Industries, Inc., Term Loan A | | | 8,593,280 | | | Valuation Service | | N/A | | N/A | | N/A | | | (b) | |
|
| | |
| MB2 Dental Solutions LLC, Term Loan B | | | 8,456,229 | | | Valuation Service | | N/A | | N/A | | N/A | | | (b) | |
|
| | |
| MB2 Dental Solutions LLC, Delayed Draw Term Loan | | | 8,439,690 | | | Valuation Service | | N/A | | N/A | | N/A | | | (b) | |
|
| | |
| CV Intermediate Holdco Corp. (Class Valuation), Term Loan B | | | 7,932,376 | | | Valuation Service | | N/A | | N/A | | N/A | | | (b) | |
|
| | |
| CV Intermediate Holdco Corp. (Class Valuation), Delayed Draw Term Loan | | | 7,703,061 | | | Valuation Service | | N/A | | N/A | | N/A | | | (b) | |
|
| | |
| SDB Holdco LLC, Delayed Draw Term Loan | | | 7,604,697 | | | Valuation Service | | N/A | | N/A | | N/A | | | (b) | |
|
| | |
| My Alarm Center LLC, Class A | | | 7,519,463 | | | Broker Quote | | N/A | | N/A | | N/A | | | (c) | |
|
| | |
| Lamark Media Group LLC, Term Loan B | | | 6,854,348 | | | Valuation Service | | N/A | | N/A | | N/A | | | (b) | |
|
| | |
| Vertellus, Term Loan B | | | 6,599,330 | | | Valuation Service | | N/A | | N/A | | N/A | | | (d) | |
|
| | |
| PrimeFlight Aviation Services, Inc., Incremental Delayed Draw Term Loan | | | 6,199,438 | | | Valuation Service | | N/A | | N/A | | N/A | | | (b) | |
|
| | |
| Groundworks LLC, First Lien Delayed Draw Term Loan | | | 5,738,102 | | | Valuation Service | | N/A | | N/A | | N/A | | | (b) | |
|
| | |
| Monitronics International, Inc., Term Loan | | | 5,712,463 | | | Valuation Service | | N/A | | N/A | | N/A | | | (d) | |
|
| | |
| (a) | QuarterNorth Energy, Inc. publicly announced that it has engaged a financial advisor to pursue a sale of the company. The Adviser values the common shares at the first round of bids for the sale of the business. The Adviser periodically reviews the financial statements and monitors such investments for additional market information of the occurrence of a significant event which would warrant a re-evaluation of the security’s fair valuation. |
| (b) | Securities classified as Level 3 whose unadjusted values were provided by a pricing service and for which such inputs are unobservable. The valuations are based on certain methods used to determine market yields in order to establish a discount rate of return given market conditions and prevailing lending standards. Future expected cash flows are discounted back to the present value using these discount rates in the discounted cash flow analysis. The Adviser reviews the valuation reports provided by the valuation service on an on-going basis and monitors such investments for additional information or the occurrence of a market event which would warrant a re-evaluation of the security’s fair valuation. |
| (c) | Securities classified as Level 3 whose unadjusted values were provided by a broker and for which the inputs used in the broker quote supplied are unobservable. The Adviser reviews the broker statements and monitors such investments for additional market information of the occurrence of a significant event which would warrant a re-evaluation of the security’s fair valuation. |
| (d) | Securities classified as Level 3 whose unadjusted values were provided by a pricing service and for which such inputs are unobservable. The Adviser periodically reviews pricing vendor methodologies and inputs to confirm they are determined using unobservable inputs and have been appropriately classified. Such securities’ fair valuations could change significantly based on changes in unobservable inputs used by the pricing service. |
NOTE 4–Derivative Investments
The Fund may enter into an International Swaps and Derivatives Association Master Agreement (“ISDA Master Agreement”) under which a fund may trade OTC derivatives. An OTC transaction entered into under an ISDA Master Agreement typically involves a collateral posting arrangement, payment netting provisions and close-out netting provisions. These netting provisions allow for reduction of credit risk through netting of contractual obligations. The enforceability of the netting provisions of the ISDA Master Agreement depends on the governing law of the ISDA Master Agreement, among other factors.
For financial reporting purposes, the Fund does not offset OTC derivative assets or liabilities that are subject to ISDA Master Agreements in the Consolidated Statement of Assets and Liabilities.
Value of Derivative Investments at Period-End
The table below summarizes the value of the Fund’s derivative investments, detailed by primary risk exposure, held as of February 28, 2023:
| | | | |
| | | Value | |
| | | Currency | |
| Derivative Assets | | Risk | |
| |
| Unrealized appreciation on forward foreign currency contracts outstanding | | $ | 4,422,686 | |
| |
| Derivatives not subject to master netting agreements | | | – | |
| |
| Total Derivative Assets subject to master netting agreements | | $ | 4,422,686 | |
| | |
| 32 | | Invesco Dynamic Credit Opportunity Fund |
| | | | |
| | | Value | |
| | | Currency | |
| Derivative Liabilities | | Risk | |
|
| | |
| Unrealized depreciation on forward foreign currency contracts outstanding | | $ | (1,137,762 | ) |
|
| | |
| Derivatives not subject to master netting agreements | | | – | |
|
| | |
| Total Derivative Liabilities subject to master netting agreements | | $ | (1,137,762 | ) |
|
| | |
Offsetting Assets and Liabilities
| | | | | | | | | | | | | | | | | | | | | | | | | | | | | | | | | | | | | | | | | | | | |
| | | Financial | | | Financial | | | | | | | | | | | | | | | | | |
| | | Derivative | | | Derivative | | | | | | | | | | | | Collateral | | | |
| | | Assets | | | Liabilities | | | | | | | | | | | | (Received)/Pledged | | | |
| | | Forward Foreign | | | Forward Foreign | | | Net Value of | | | | | | | Net | |
| Counterparty | | Currency Contracts | | | Currency Contracts | | | Derivatives | | | Non-Cash | | Cash | | Amount | |
| Bank of America, N.A. | | | | | | | $ 9 | | | | | | | | | | | | $ (1,176 | ) | | | | | | | | | | $ | (1,167 | ) | | | | | | $– | | $– | | $ | (1,167 | ) |
|
| | |
| Barclays Bank PLC | | | | | | | 65,503 | | | | | | | | | | | | (55,953 | ) | | | | | | | | | | | 9,550 | | | | | | | – | | – | | | 9,550 | |
|
| | |
| BNP Paribas S.A. | | | | | | | 1,348,060 | | | | | | | | | | | | (209,906 | ) | | | | | | | | | | | 1,138,154 | | | | | | | – | | – | | | 1,138,154 | |
|
| | |
| Canadian Imperial Bank of Commerce | | | | | | | 71,174 | | | | | | | | | | | | (70,104 | ) | | | | | | | | | | | 1,070 | | | | | | | – | | – | | | 1,070 | |
|
| | |
| J.P. Morgan Chase Bank, N.A. | | | | | | | 6,195 | | | | | | | | | | | | – | | | | | | | | | | | | 6,195 | | | | | | | – | | – | | | 6,195 | |
|
| | |
| Morgan Stanley and Co. International PLC | | | | | | | 1,210,449 | | | | | | | | | | | | (485,375 | ) | | | | | | | | | | | 725,074 | | | | | | | – | | – | | | 725,074 | |
|
| | |
| Royal Bank of Canada | | | | | | | 1,382,539 | | | | | | | | | | | | (231,883 | ) | | | | | | | | | | | 1,150,656 | | | | | | | – | | – | | | 1,150,656 | |
|
| | |
| State Street Bank & Trust Co. | | | | | | | 42,448 | | | | | | | | | | | | – | | | | | | | | | | | | 42,448 | | | | | | | – | | – | | | 42,448 | |
|
| | |
| Toronto Dominion Bank (The) | | | | | | | 296,309 | | | | | | | | | | | | (80,889 | ) | | | | | | | | | | | 215,420 | | | | | | | – | | – | | | 215,420 | |
|
| | |
| UBS | | | | | | | – | | | | | | | | | | | | (2,476 | ) | | | | | | | | | | | (2,476 | ) | | | | | | – | | – | | | (2,476 | ) |
|
| | |
| Total | | | | | | | $4,422,686 | | | | | | | | | | | | $(1,137,762 | ) | | | | | | | | | | $ | 3,284,924 | | | | | | | $– | | $– | | $ | 3,284,924 | |
|
| | |
Effect of Derivative Investments for the year ended February 28, 2023
The table below summarizes the gains (losses) on derivative investments, detailed by primary risk exposure, recognized in earnings during the period:
| | | | |
| | | Location of Gain on | |
| | | Consolidated Statement of Operations | |
| | | Currency | |
| | | Risk | |
| Realized Gain: | | | | |
| Forward foreign currency contracts | | | $20,054,986 | |
| Change in Net Unrealized Appreciation: | | | | |
| Forward foreign currency contracts | | | 1,531,421 | |
| |
| Total | | | $21,586,407 | |
The table below summarizes the average notional value of derivatives held during the period.
| | |
| | | Forward |
| | | Foreign Currency |
| | | Contracts |
| |
| Average notional value | | $523,872,039 |
NOTE 5–Trustees’ and Officers’ Fees and Benefits
Trustees’ and Officers’ Fees and Benefits include amounts accrued by the Fund to pay remuneration to certain Trustees and Officers of the Fund. Trustees have the option to defer compensation payable by the Fund, and “Trustees’ and Officers’ Fees and Benefits” includes amounts accrued by the Fund to fund such deferred compensation amounts.
NOTE 6–Cash Balances and Borrowings
Effective November 18, 2022, the Fund had entered into a $100 million revolving credit and security agreement with SSB, The Bank of Nova Scotia and The Toronto-Dominion Bank (the “SSB Credit Agreement”), which terminated on April 10, 2023. The Fund paid off all fees and no longer has any outstanding obligations under the SSB Credit Agreement as of April 10, 2023. From August 31, 2022 to November 17, 2022, the Fund’s SSB Credit Agreement permitted borrowings up to $207 million. Prior to August 31, 2022, the Fund’s SSB Credit Agreement permitted borrowings up to $290 million.
Effective April 10, 2023, the Fund entered into a $80 million revolving credit and security agreement with BNP Paribas (the “BNP Credit Agreement”), which will expire on April 8, 2024.
Effective November 18, 2022, the LLC entered into a $60 million revolving credit and security agreement with Natixis (the “Natixis Credit Agreement”), which will expire on November 17, 2023.
The revolving credit and security agreements are secured by the assets of the Fund and the LLC, respectively. The Fund and the LLC are subject to certain covenants relating to their respective revolving credit and security agreements. Failure to comply with these restrictions could cause the acceleration of the repayment of the amount outstanding under the revolving credit and security agreements.
During the year ended February 28, 2023, the average daily balance of borrowing under the Fund’s SSB Credit Agreement was $174,668,493 with an average interest rate of 3.30%.
| | |
| 33 | | Invesco Dynamic Credit Opportunity Fund |
For the period November 18, 2022 through February 28, 2023, the average daily balance of borrowing under the LLC’s Natixis Credit Agreement was $60,000,000 with an average interest rate of 7.05%.
The combined carrying amount of the Fund’s and LLC’s payables for borrowings as reported on the Consolidated Statement of Assets and Liabilities approximates their fair value. Expenses under the revolving credit and security agreements are shown in the Consolidated Statement of Operations as Interest, facilities and maintenance fees.
Additionally, the Fund is permitted to temporarily carry a negative or overdrawn balance in its account with SSB, the custodian bank. Such balances, if any at period-end, are shown in the Consolidated Statement of Assets and Liabilities under the payable caption Amount due custodian. To compensate the custodian bank for such overdrafts, the overdrawn Fund may either (1) leave funds as a compensating balance in the account so the custodian bank can be compensated by earning the additional interest; or (2) compensate by paying the custodian bank at a rate agreed upon by the custodian bank and Invesco, not to exceed the contractually agreed upon rate.
NOTE 7–Unfunded Loan Commitments
Pursuant to the terms of certain Senior Loan agreements, the Fund held the following unfunded loan commitments as of February 28, 2023. The Fund intends to reserve against such contingent obligations by designating cash, liquid securities and liquid Senior Loans as a reserve. Unfunded loan commitments are reflected as a liability on the Consolidated Statement of Assets and Liabilities.
| | | | | | | | | | | | | | | | | | |
| | | | | | | | | | | | | | Unrealized | |
| | | | | Unfunded Loan | | | Appreciation | |
| Borrower | | Type | | Commitment | | | (Depreciation) | |
| BrightPet (AMCP Pet Holdings, Inc.) | | Revolver Loan | | | | | | $ | 118,638 | | | | | | | | $ (2,412) | |
|
| | |
| CV Intermediate Holdco Corp. (Class Valuation) | | Revolver Loan | | | | | | | 405,187 | | | | | | | | (16,455) | |
|
| | |
| Dun & Bradstreet Corp. (The) | | Revolver Loan | | | | | | | 3,038,623 | | | | | | | | 180,519 | |
|
| | |
| Groundworks LLC | | First Lien Incremental Revover Loan | | | | | | | 514,576 | | | | | | | | 5,111 | |
|
| | |
| Kantar (Summer BC Bidco) | | Revolver Loan | | | | | | | 2,280,682 | | | | | | | | (5,682) | |
|
| | |
| Keg Logistics LLC | | Revolver Loan | | | | | | | 489,831 | | | | | | | | (12,453) | |
|
| | |
| Lamark Media Group LLC | | Delayed Draw Term Loan | | | | | | | 1,527,935 | | | | | | | | (44,310) | |
|
| | |
| Lamark Media Group LLC | | Revolver Loan | | | | | | | 555,774 | | | | | | | | (11,779) | |
|
| | |
| McDermott International Ltd. | | LOC | | | | | | | 4,083,292 | | | | | | | | (755,409) | |
|
| | |
| Muth Mirror Systems LLC | | Revolver Loan | | | | | | | 837,076 | | | | | | | | (54,663) | |
|
| | |
| NAC Aviation 8 Ltd. | | Revolver Loan | | | | | | | 1,642,458 | | | | | | | | 0 | |
|
| | |
| NAS LLC (d.b.a. Nationwide Marketing Group) | | Revolver Loan | | | | | | | 731,659 | | | | | | | | (7,080) | |
|
| | |
| Parques Reunidos (Piolin Bidco s.a.u) | | Revolver Loan | | | | | | | 1,405,694 | | | | | | | | (164,925) | |
|
| | |
| Royal Caribbean Cruises | | Revolver Loan | | | | | | | 238,164 | | | | | | | | 492 | |
|
| | |
| Royal Caribbean Cruises | | Revolver Loan | | | | | | | 246,003 | | | | | | | | 7,112 | |
|
| | |
| Tank Holding Corp. | | Revolver Loan | | | | | | | 135,111 | | | | | | | | (6,732) | |
|
| | |
| USF S&H Holdco LLC | | Term Loan A | | | | | | | 929,319 | | | | | | | | 99,011 | |
|
| | |
| Vertellus | | Revolver Loan | | | | | | | 555,020 | | | | | | | | (25,333) | |
|
| | |
| | | | | | | | $ | 19,735,042 | | | | | | | | $(814,988) | |
|
| | |
NOTE 8–Distributions to Shareholders and Tax Components of Net Assets
Tax Character of Distributions to Shareholders Paid During the Fiscal Years Ended February 28, 2023 and 2022:
| | | | | | | | | | | | |
| | | 2023 | | | | | | 2022 | |
| | | |
| Ordinary income* | | $ | 40,077,333 | | | | | | | $ | 52,020,720 | |
| | | |
| Ordinary income-tax-exempt VRDP shares | | | – | | | | | | | | 65,334 | |
| | | |
| Total distributions | | $ | 40,077,333 | | | | | | | $ | 52,086,054 | |
| * | Includes short-term capital gain distributions, if any. |
| | | | |
| Tax Components of Net Assets at Period-End: | | | |
| | | 2023 | |
| Undistributed ordinary income | | $ | 15,545,801 | |
|
| | |
| Net unrealized appreciation (depreciation) – investments | | | (87,111,858 | ) |
|
| | |
| Net unrealized appreciation (depreciation) – foreign currencies | | | (1,013,564 | ) |
|
| | |
| Temporary book/tax differences | | | (6,847,747 | ) |
|
| | |
| Capital loss carryforward | | | (86,926,617 | ) |
|
| | |
| Shares of beneficial interest | | | 592,296,528 | |
|
| | |
| Total net assets | | $ | 425,942,543 | |
|
| | |
The difference between book-basis and tax-basis unrealized appreciation (depreciation) is due to differences in the timing of recognition of gains and losses on investments for tax and book purposes. The Fund’s net unrealized appreciation (depreciation) difference is attributable primarily to derivative instruments, amortization and accretion on debt securities.
| | |
| 34 | | Invesco Dynamic Credit Opportunity Fund |
The temporary book/tax differences are a result of timing differences between book and tax recognition of income and/or expenses. The Fund’s temporary book/tax differences are the result of the trustee deferral of compensation and retirement plan benefits.
Capital loss carryforward is calculated and reported as of a specific date. Results of transactions and other activity after that date may affect the amount of capital loss carryforward actually available for the Fund to utilize. The ability to utilize capital loss carryforward in the future may be limited under the Internal Revenue Code and related regulations based on the results of future transactions.
The Fund has a capital loss carryforward as of February 28, 2023, as follows:
| | | | | | | | | | | | | | | | | | | | |
| Capital Loss Carryforward* | |
| Expiration | | Short-Term | | | | | | Long-Term | | | | | | Total | |
| | | | | |
| Not subject to expiration | | $ | 17,915,839 | | | | | | | $ | 69,010,778 | | | | | | | $ | 86,926,617 | |
| * | Capital loss carryforward is reduced for limitations, if any, to the extent required by the Internal Revenue Code and may be further limited depending upon a variety of factors, including the realization of net unrealized gains or losses as of the date of any reorganization. |
NOTE 9–Investment Transactions
The aggregate amount of investment securities (other than short-term securities, U.S. Government obligations and money market funds, if any) purchased and sold by the Fund during the year ended February 28, 2023 was $140,787,944 and $461,625,279, respectively. Cost of investments, including any derivatives, on a tax basis includes the adjustments for financial reporting purposes as of the most recently completed federal income tax reporting period-end.
| | | | |
| Unrealized Appreciation (Depreciation) of Investments on a Tax Basis | |
| Aggregate unrealized appreciation of investments | | $ | 44,773,350 | |
|
| | |
| Aggregate unrealized (depreciation) of investments | | | (131,885,208 | ) |
|
| | |
| Net unrealized appreciation (depreciation) of investments | | $ | (87,111,858 | ) |
|
| | |
Cost of investments for tax purposes is $619,469,308.
NOTE 10–Reclassification of Permanent Differences
Primarily as a result of differing book/tax treatment of foreign currency transactions, amortization and accretion on debt securities, on February 28, 2023, undistributed net investment income was increased by $7,441,629 and undistributed net realized gain (loss) was decreased by $7,441,629. This reclassification had no effect on the net assets or the distributable earnings (loss) of the Fund.
NOTE 11–Senior Loan Participation Commitments
The Fund invests in participations, assignments, or acts as a party to the primary lending syndicate of a Senior Loan interest to corporations, partnerships, and other entities. When the Fund purchases a participation of a Senior Loan interest, the Fund typically enters into a contractual agreement with the lender or other third party selling the participation, but not with the borrower directly. As such, the Fund assumes the credit risk of the borrower, selling participant or other persons interpositioned between the Fund and the borrower.
At the year ended February 28, 2023, the following sets forth the selling participants with respect to interest in Senior Loans purchased by the Fund on a participation basis.
| | | | | | | | | | | | |
| | | Principal | | | | | | | |
| Selling Participant | | Amount | | | | | | Value | |
| | | |
| Bank of America, N.A. | | $ | 6,014,277 | | | | | | | $ | 5,806,783 | |
| | | |
| Barclays Bank PLC | | $ | 4,083,292 | | | | | | | $ | 3,389,132 | |
NOTE 12–Dividends
The Fund declared the following quarterly dividends from net investment income subsequent to February 28, 2023.
| | | | | | |
| | | | | | | Amount Per Share |
| Share Class | | Record Date | | | | Payable March 31, 2023 |
| | | |
| Class A | | Daily | | | | $0.2631 |
| | | |
| Class AX | | Daily | | | | $0.2700 |
| | | |
| Class Y | | Daily | | | | $0.2702 |
| | | |
| Class R6 | | Daily | | | | $0.2737 |
NOTE 13–Repurchase of Shares
The Fund has a policy of making quarterly repurchase offers (“Repurchase Offers”) for the Fund’s common shares pursuant to Rule 23c-3(b) of the 1940 Act.
The Repurchase Offers will be for between 5% and 25% of the Fund’s outstanding shares at net asset value (The Board of Trustees may authorize an additional 2%, if necessary, without extending the Repurchase Offers). Written notification of each quarterly repurchase offer is sent to shareholders no less than 21 days and no more than 42 days before each repurchase request deadline. During the year ended February 28, 2023, the Fund had Repurchase Offers as follows:
| | | | | | | | | | |
| | | Percentage of | | | | | | | | |
| | | outstanding shares the | | | | | | | | Percentage of |
| | | Fund offered to | | | | Number of shares | | | | outstanding shares |
| Repurchase request deadlines | | repurchase | | | | tendered (all classes) | | | | tendered (all classes) |
| | | | | |
| March 18, 2022 | | 10.0% | | | | 5,073,440 | | | | 10.0% |
| | | | | |
| June 17, 2022 | | 10.0 | | | | 4,589,308 | | | | 10.0 |
| | | | | |
| September 16, 2022 | | 5.0 | | | | 2,076,968 | | | | 5.0 |
| December 16, 2022 | | 5.0 | | | | 1,984,220 | | | | 5.0 |
| | |
| 35 | | Invesco Dynamic Credit Opportunity Fund |
NOTE 14–Share Information
| | | | | | | | | | | | | | | | |
| | | Summary of Share Activity | |
|
| | |
| | | Year ended | | | Year ended | |
| | | February 28, 2023(a) | | | February 28, 2022 | |
| | | Shares | | | Amount | | | Shares | | | Amount | |
|
| | |
| Sold: | | | | | | | | | | | | | | | | |
Class A(b) | | | 6,804 | | | $ | 77,660 | | | | 964 | | | $ | 12,014 | |
|
| | |
| Class AX | | | 46,098 | | | | 563,409 | | | | 96,790 | | | | 1,205,165 | |
|
| | |
Class Y(b) | | | - | | | | - | | | | 884 | | | | 11,012 | |
|
| | |
Class R6(b) | | | - | | | | - | | | | 804 | | | | 10,012 | |
|
| | |
| | | | |
| Issued as reinvestment of dividends: | | | | | | | | | | | | | | | | |
Class A(b) | | | 288 | | | | 3,250 | | | | - | | | | - | |
|
| | |
| Class AX | | | 913,559 | | | | 10,524,005 | | | | 206,214 | | | | 2,567,361 | |
|
| | |
Class Y(b) | | | 7 | | | | 78 | | | | 1 | | | | 12 | |
|
| | |
| | | | |
| Reacquired: | | | | | | | | | | | | | | | | |
| Class AX | | | (13,734,094 | ) | | | (160,053,736 | ) | | | (12,596,028 | )(c) | | | (154,216,383 | )(c) |
|
| | |
| Net increase (decrease) in share activity | | | (12,767,338 | ) | | $ | (148,885,334 | ) | | | (12,290,371 | ) | | $ | (150,410,807 | ) |
|
| | |
| (a) | There are entities that are record owners of more than 5% of the outstanding shares of the Fund and in the aggregate own 22% of the outstanding shares of the Fund. IDI has an agreement with these entities to sell Fund shares. The Fund, Invesco and/or Invesco affiliates may make payments to these entities, which are considered to be related to the Fund, for providing services to the Fund, Invesco and/or Invesco affiliates including but not limited to services such as securities brokerage, distribution, third party record keeping and account servicing. The Fund has no knowledge as to whether all or any portion of the shares owned of record by these entities are also owned beneficially. |
| (b) | Commencement date of November 1, 2021. |
| (c) | Closed-End Fund repurchased and retired Common Shares. |
| | |
| 36 | | Invesco Dynamic Credit Opportunity Fund |
Report of Independent Registered Public Accounting Firm
To the Board of Trustees and Shareholders of Invesco Dynamic Credit Opportunity Fund
Opinion on the Consolidated Financial Statements
We have audited the accompanying consolidated statement of assets and liabilities, including the consolidated schedule of investments, of Invesco Dynamic Credit Opportunity Fund and its subsidiaries (the “Fund”) as of February 28, 2023, the related consolidated statements of operations and cash flows for the year ended February 28, 2023, the consolidated statement of changes in net assets for each of the two years in the period ended February 28, 2023, including the related notes, and the consolidated financial highlights for each of the periods indicated therein (collectively referred to as the consolidated “financial statements”). In our opinion, the consolidated financial statements present fairly, in all material respects, the financial position of the Fund as of February 28, 2023, the results of its operations and its cash flows for the year then ended, the changes in its net assets and the financial highlights for each of the periods indicated therein in conformity with accounting principles generally accepted in the United States of America.
Basis for Opinion
These consolidated financial statements are the responsibility of the Fund’s management. Our responsibility is to express an opinion on the Fund’s consolidated financial statements based on our audits. We are a public accounting firm registered with the Public Company Accounting Oversight Board (United States) (PCAOB) and are required to be independent with respect to the Fund in accordance with the U.S. federal securities laws and the applicable rules and regulations of the Securities and Exchange Commission and the PCAOB.
We conducted our audits of these consolidated financial statements in accordance with the standards of the PCAOB. Those standards require that we plan and perform the audit to obtain reasonable assurance about whether the consolidated financial statements are free of material misstatement, whether due to error or fraud.
Our audits included performing procedures to assess the risks of material misstatement of the consolidated financial statements, whether due to error or fraud, and performing procedures that respond to those risks. Such procedures included examining, on a test basis, evidence regarding the amounts and disclosures in the consolidated financial statements. Our audits also included evaluating the accounting principles used and significant estimates made by management, as well as evaluating the overall presentation of the consolidated financial statements. Our procedures included confirmation of securities owned as of February 28, 2023 by correspondence with the custodian, transfer agent, portfolio company investees, brokers and agent banks; when replies were not received from portfolio company investees, brokers or agent banks, we performed other auditing procedures. We believe that our audits provide a reasonable basis for our opinion.
/s/PricewaterhouseCoopers LLP
Houston, Texas
April 26, 2023
We have served as the auditor of one or more of the investment companies in the Invesco group of investment companies since at least 1995. We have not been able to determine the specific year we began serving as auditor.
| | |
| 37 | | Invesco Dynamic Credit Opportunity Fund |
Calculating your ongoing Fund expenses
Example
As a shareholder of the Fund, you incur two types of costs: (1) transaction costs, which may include sales charges (loads) on purchase payments or contingent deferred sales charges on redemptions, if any; and (2) ongoing costs, including management fees, distribution and/or service (12b-1) fees, and other Fund expenses. This example is intended to help you understand your ongoing costs (in dollars) of investing in the Fund and to compare these costs with ongoing costs of investing in other mutual funds. The example is based on an investment of $1,000 invested at the beginning of the period and held for the entire period September 1, 2022 through February 28, 2023.
Actual expenses
The table below provides information about actual account values and actual expenses. You may use the information in this table, together with the amount you invested, to estimate the expenses that you paid over the period. Simply divide your account value by $1,000 (for example, an $8,600 account value divided by $1,000 = 8.6), then multiply the result by the number in the table under the heading entitled “Actual Expenses Paid During Period” to estimate the expenses you paid on your account during this period.
Hypothetical example for comparison purposes
The table below also provides information about hypothetical account values and hypothetical expenses based on the Fund’s actual expense ratio and an assumed rate of return of 5% per year before expenses, which is not the Fund’s actual return.
The hypothetical account values and expenses may not be used to estimate the actual ending account balance or expenses you paid for the period. You may use this information to compare the ongoing costs of investing in the Fund and other funds. To do so, compare this 5% hypothetical example with the 5% hypothetical examples that appear in the shareholder reports of the other funds.
Please note that the expenses shown in the table are meant to highlight your ongoing costs only and do not reflect any transaction costs, such as sales charges (loads) on purchase payments or contingent deferred sales charges on redemptions, if any. Therefore, the hypothetical information is useful in comparing ongoing costs only, and will not help you determine the relative total costs of owning different funds. In addition, if these transaction costs were included, your costs would have been higher.
| | | | | | | | | | | | |
| | | | | ACTUAL | | HYPOTHETICAL (5% annual return before expenses) | | |
| | | Beginning Account Value (09/01/22) | | Ending Account Value (02/28/23)1 | | Expenses Paid During Period2 | | Ending Account Value (02/28/23) | | Expenses Paid During Period2 | | Annualized Expense Ratio |
| Class A | | $1,000.00 | | $1,038.30 | | $22.59 | | $1,002.63 | | $22.20 | | 4.47% |
| Class AX | | 1,000.00 | | 1,038.60 | | 21.33 | | 1,003.87 | | 20.97 | | 4.22 |
| Class Y | | 1,000.00 | | 1,007.50 | | 21.01 | | 1,003.87 | | 20.97 | | 4.22 |
| Class R6 | | 1,000.00 | | 1,039.20 | | 20.78 | | 1,004.41 | | 20.43 | | 4.11 |
| 1 | The actual ending account value is based on the actual total return of the Fund for the period September 1, 2022 through February 28, 2023, after actual expenses and will differ from the hypothetical ending account value which is based on the Fund’s expense ratio and a hypothetical annual return of 5% before expenses. |
| 2 | Expenses are equal to the Fund’s annualized expense ratio as indicated above multiplied by the average account value over the period, multiplied by 181/365 to reflect the most recent fiscal half year. |
| | |
| 38 | | Invesco Dynamic Credit Opportunity Fund |
Tax Information
Form 1099-DIV, Form 1042-S and other year–end tax information provide shareholders with actual calendar year amounts that should be included in their tax returns. Shareholders should consult their tax advisers.
The following distribution information is being provided as required by the Internal Revenue Code or to meet a specific state’s requirement.
The Fund designates the following amounts or, if subsequently determined to be different, the maximum amount allowable for its fiscal year ended February 28, 2023:
| | | | | | |
| Federal and State Income Tax | | | | | |
| Qualified Dividend Income* | | | 5.11 | % |
| Corporate Dividends Received Deduction* | | | 4.47 | % |
| U.S. Treasury Obligations* | | | 0.00 | % |
| Qualified Business Income* | | | 0.00 | % |
| Business Interest Income* | | | 82.01 | % |
| | * | | The above percentages are based on ordinary income dividends paid to shareholders during the Fund’s fiscal year. |
| | | | | | |
| Non-Resident Alien Shareholders | | | | | |
| Qualified Interest Income** | | | 43.93 | % |
| | ** | | The above percentage is based on income dividends paid to shareholders during the Fund’s fiscal year. |
| | |
| 39 | | Invesco Dynamic Credit Opportunity Fund |
Trustees and Officers
The address of each trustee and officer is 1331 Spring Street NW, Suite 2500, Atlanta, Georgia 30309. Generally, each trustee serves for a three year term or until his or her successor has been duly elected and qualified, and each officer serves for a one year term or until his or her successor has been duly elected and qualified. Column two below includes length of time served with predecessor entities, if any.
| | | | | | | | |
Name, Year of Birth and Position(s) Held with the Trust | | Trustee and/or Officer Since | | Principal Occupation(s) During Past 5 Years | | Number of Funds in
Fund Complex Overseen by
Trustee | | Other Directorship(s) Held by Trustee During Past 5 Years |
| Interested Trustee | | | | | | | | |
Martin L. Flanagan1 - 1960 Trustee and Vice Chair | | 2021 | | Executive Director, Chief Executive Officer and President, Invesco Ltd. (ultimate parent of Invesco and a global investment management firm); Trustee and Vice Chair, The Invesco Funds; Vice Chair, Investment Company Institute; and Member of Executive Board, SMU Cox School of Business Formerly: Advisor to the Board, Invesco Advisers, Inc. (formerly known as Invesco Institutional (N.A.), Inc.); Chairman and Chief Executive Officer, Invesco Advisers, Inc. (registered investment adviser); Director, Chairman, Chief Executive Officer and President, Invesco Holding Company (US), Inc. (formerly IVZ Inc.) (holding company), Invesco Group Services, Inc. (service provider) and Invesco North American Holdings, Inc. (holding company); Director, Chief Executive Officer and President, Invesco Holding Company Limited (parent of Invesco and a global investment management firm); Director, Invesco Ltd.; Chairman, Investment Company Institute and President, Co-Chief Executive Officer, Co-President, Chief Operating Officer and Chief Financial Officer, Franklin Resources, Inc. (global investment management organization) | | 175 | | None |
| 1 | Mr. Flanagan is considered an interested person (within the meaning of Section 2(a)(19) of the 1940 Act) of the Trust because he is an officer of the Adviser to the Trust, and an officer and a director of Invesco Ltd., ultimate parent of the Adviser. |
| | |
| T-1 | | Invesco Dynamic Credit Opportunity Fund |
Trustees and Officers–(continued)
| | | | | | | | |
Name, Year of Birth and Position(s) Held with the Trust | | Trustee and/or Officer Since | | Principal Occupation(s) During Past 5 Years | | Number of Funds in
Fund Complex Overseen by
Trustee | | Other Directorship(s) Held by Trustee During Past 5 Years |
| Independent Trustees |
Beth Ann Brown - 1968 Trustee (2019) and Chair (August 2022) | | 2021 | | Independent Consultant Formerly: Head of Intermediary Distribution, Managing Director, Strategic Relations, Managing Director, Head of National Accounts, Senior Vice President, National Account Manager and Senior Vice President, Key Account Manager, Columbia Management Investment Advisers LLC; Vice President, Key Account Manager, Liberty Funds Distributor, Inc.; and Trustee of certain Oppenheimer Funds | | 175 | | Director, Board of Directors of Caron Engineering Inc.; Advisor, Board of Advisors of Caron Engineering Inc.; President and Director, Acton Shapleigh Youth Conservation Corps (non-profit) Formerly: President and Director Director of Grahamtastic Connection (non-profit) |
Cynthia Hostetler - 1962 Trustee | | 2021 | | Non-Executive Director and Trustee of a number of public and private business corporations Formerly: Director, Aberdeen Investment Funds (4 portfolios); Director, Artio Global Investment LLC (mutual fund complex); Director, Edgen Group, Inc. (specialized energy and infrastructure products distributor); Director, Genesee & Wyoming, Inc. (railroads); Head of Investment Funds and Private Equity, Overseas Private Investment Corporation; President, First Manhattan Bancorporation, Inc.; and Attorney, Simpson Thacher & Bartlett LLP | | 175 | | Resideo Technologies, Inc. (smart home technology); Vulcan Materials Company (construction materials company); Trilinc Global Impact Fund; Textainer Group Holdings, (shipping container leasing company); Investment Company Institute (professional organization); and Independent Directors Council (professional organization) |
Eli Jones - 1961 Trustee | | 2021 | | Professor and Dean Emeritus, Mays Business School - Texas A&M University Formerly: Dean of Mays Business School-Texas A&M University; Professor and Dean, Walton College of Business, University of Arkansas and E.J. Ourso College of Business, Louisiana State University; and Director, Arvest Bank | | 175 | | Insperity, Inc. (formerly known as Administaff) (human resources provider); Board Member of the regional board, First Financial Bank Texas; and Boad Member, First Financial Bankshares, Inc. Texas (FFIN) |
Elizabeth Krentzman - 1959 Trustee | | 2021 | | Formerly: Principal and Chief Regulatory Advisor for Asset Management Services and U.S. Mutual Fund Leader of Deloitte & Touche LLP; General Counsel of the Investment Company Institute (trade association); National Director of the Investment Management Regulatory Consulting Practice, Principal, Director and Senior Manager of Deloitte & Touche LLP; Assistant Director of the Division of Investment Management - Office of Disclosure and Investment Adviser Regulation of the U.S. Securities and Exchange Commission and various positions with the Division of Investment Management – Office of Regulatory Policy of the U.S. Securities and Exchange Commission; Associate at Ropes & Gray LLP; and Trustee of certain Oppenheimer Funds | | 175 | | Formerly: Member of the Cartica Funds Board of Directors (private investment fund); Trustee of the University of Florida National Board Foundation; and Member of the University of Florida Law Center Association, Inc. Board of Trustees, Audit Committee and Membership Committee |
Anthony J. LaCava, Jr. - 1956 Trustee | | 2021 | | Formerly: Director and Member of the Audit Committee, Blue Hills Bank (publicly traded financial institution) and Managing Partner, KPMG LLP | | 175 | | Blue Hills Bank; Member and Chairman, Bentley University, Business School Advisory Council; and Nominating Committee, KPMG LLP |
Prema Mathai-Davis - 1950 Trustee | | 2021 | | Retired Formerly: Co-Founder & Partner of Quantalytics Research, LLC, (a FinTech Investment Research Platform for the Self-Directed Investor); Trustee of YWCA Retirement Fund; CEO of YWCA of the USA; Board member of the NY Metropolitan Transportation Authority; Commissioner of the NYC Department of Aging; and Board member of Johns Hopkins Bioethics Institute | | 175 | | Member of Board of Positive Planet US (non-profit) and HealthCare Chaplaincy Network (non-profit) |
| | |
| T-2 | | Invesco Dynamic Credit Opportunity Fund |
Trustees and Officers–(continued)
| | | | | | | | |
Name, Year of Birth and Position(s) Held with the Trust | | Trustee and/or Officer Since | | Principal Occupation(s) During Past 5 Years | | Number of Funds in
Fund Complex Overseen by
Trustee | | Other Directorship(s) Held by Trustee During Past 5 Years |
| Independent Trustees–(continued) |
Joel W. Motley - 1952 Trustee | | 2021 | | Director of Office of Finance, Federal Home Loan Bank System; Managing Director of Carmona Motley Inc. (privately held financial advisor); Member of the Council on Foreign Relations and its Finance and Budget Committee; Chairman Emeritus of Board of Human Rights Watch and Member of its Investment Committee; and Member of Investment Committee Board of Historic Hudson Valley (non-profit cultural organization); Member of the Board, Blue Ocean Acquisition Corp.; and Member of the Vestry and the Investment Committee of Trinity Church Wall Street. Formerly: Managing Director of Public Capital Advisors, LLC (privately held financial advisor); Managing Director of Carmona Motley Hoffman, Inc. (privately held financial advisor); Trustee of certain Oppenheimer Funds; and Director of Columbia Equity Financial Corp. (privately held financial advisor) | | 175 | | Member of Board of Trust for Mutual Understanding (non-profit promoting the arts and environment); Member of Board of Greenwall Foundation (bioethics research foundation) and its Investment Committee; Member of Board of Friends of the LRC (non-profit legal advocacy); and Board Member and Investment Committee Member of Pulitzer Center for Crisis Reporting (non-profit journalism) |
Teresa M. Ressel - 1962 Trustee | | 2021 | | Non-executive director and trustee of a number of public and private business corporations Formerly: Chief Executive Officer, UBS Securities LLC (investment banking); Chief Operating Officer, UBS AG Americas (investment banking); Sr. Management Team Olayan America, The Olayan Group (international investor/commercial/industrial); and Assistant Secretary for Management & Budget and Designated Chief Financial Officer, U.S. Department of Treasury | | 175 | | None |
Robert C. Troccoli - 1949 Trustee | | 2021 | | Retired Formerly: Adjunct Professor, University of Denver – Daniels College of Business; and Managing Partner, KPMG LLP | | 175 | | None |
Daniel S. Vandivort -1954 Trustee | | 2021 | | President, Flyway Advisory Services LLC (consulting and property management) Formerly: President and Chief Investment Officer, previously Head of Fixed Income, Weiss Peck and Greer/Robeco Investment Management; Trustee and Chair, Weiss Peck and Greer Funds Board; and various capacities at CS First Boston including Head of Fixed Income at First Boston Asset Management. | | 175 | | Formerly: Trustee and Governance Chair, Oppenheimer Funds; Treasurer, Chairman of the Audit and Finance Committee, Huntington Disease Foundation of America |
| | |
| T-3 | | Invesco Dynamic Credit Opportunity Fund |
Trustees and Officers–(continued)
| | | | | | | | |
Name, Year of Birth and Position(s) Held with the Trust | | Trustee and/or Officer Since | | Principal Occupation(s) During Past 5 Years | | Number of Funds in
Fund Complex Overseen by
Trustee | | Other Directorship(s) Held by Trustee During Past 5 Years |
| Officers |
Sheri Morris - 1964 President and Principal Executive Officer | | 2021 | | Director, Invesco Trust Company; Head of Global Fund Services, Invesco Ltd.; President and Principal Executive Officer, The Invesco Funds; Vice President, Invesco Exchange-Traded Fund Trust, Invesco Exchange-Traded Fund Trust II, Invesco India Exchange-Traded Fund Trust, Invesco Actively Managed Exchange-Traded Fund Trust, Invesco Actively Managed Exchange-Traded Commodity Fund Trust and Invesco Exchange-Traded Self-Indexed Fund Trust; and Vice President, OppenheimerFunds, Inc. Formerly: Vice President, Treasurer and Principal Financial Officer, The Invesco Funds; Vice President, Invesco AIM Advisers, Inc., Invesco AIM Capital Management, Inc. and Invesco AIM Private Asset Management, Inc.; Assistant Vice President and Assistant Treasurer, The Invesco Funds; Vice President and Assistant Vice President, Invesco Advisers, Inc.; Assistant Vice President, Invesco AIM Capital Management, Inc. and Invesco AIM Private Asset Management, Inc.; Treasurer, Invesco Exchange-Traded Fund Trust, Invesco Exchange-Traded Fund Trust II, Invesco India Exchange-Traded Fund Trust and Invesco Actively Managed Exchange-Traded Fund Trust; and Senior Vice President, Invesco Advisers, Inc. (formerly known as Invesco Institutional (N.A.), Inc.) (registered investment adviser) | | N/A | | N/A |
Melanie Ringold - 1975 Senior Vice President, Chief Legal Officer and Secretary | | 2023 | | Head of Legal of the Americas, Invesco Ltd.; Senior Vice President and Secretary, Invesco Advisers, Inc. (formerly known as Invesco Institutional (N.A.), Inc.) (registered investment adviser); Secretary, Invesco Distributors, Inc. (formerly known as Invesco AIM Distributors, Inc.); Secretary, Invesco Investment Services, Inc. (formerly known as Invesco AIM Investment Services, Inc.); Senior Vice President, Chief Legal Officer and Secretary, The Invesco Funds; Secretary, Invesco Investment Advisers LLC, Invesco Capital Markets, Inc.; Chief Legal Officer, Invesco Exchange-Traded Fund Trust, Invesco Exchange-Traded Fund Trust II, Invesco India Exchange-Traded Fund Trust, Invesco Actively Managed Exchange-Traded Fund Trust, Invesco Actively Managed Exchange-Traded Commodity Fund Trust and Invesco Exchange-Traded Self-Indexed Fund Trust; Secretary and Vice President, Harbourview Asset Management Corporation; Secretary and Senior Vice President, OppenheimerFunds, Inc. and Invesco Managed Accounts, LLC; Secretary and Senior Vice President, OFI SteelPath, Inc.; Secretary and Senior Vice President, Oppenheimer Acquisition Corp.; Secretary, SteelPath Funds Remediation LLC; and Secretary and Senior Vice President, Trinity Investment Management Corporation Formerly: Assistant Secretary, Invesco Distributors, Inc.; Invesco Advisers, Inc. Invesco Investment Services, Inc., Invesco Capital Markets, Inc., Invesco Capital Management LLC and Invesco Investment Advisers LLC; and Assistant Secretary and Investment Vice President, Invesco Funds | | N/A | | N/A |
Andrew R. Schlossberg - 1974 Senior Vice President | | 2021 | | Senior Vice President, Invesco Group Services, Inc.; Head of the Americas and Senior Managing Director, Invesco Ltd.; Director and Senior Vice President, Invesco Advisers, Inc. (formerly known as Invesco Institutional (N.A.), Inc.) (registered investment adviser); Director and Chairman, Invesco Investment Services, Inc. (formerly known as Invesco AIM Investment Services, Inc.) (registered transfer agent); Senior Vice President, The Invesco Funds; and Director, Invesco Investment Advisers LLC (formerly known as Van Kampen Asset Management) Formerly: Director, President and Chairman, Invesco Insurance Agency, Inc.; Director, Invesco UK Limited; Director and Chief Executive, Invesco Asset Management Limited and Invesco Fund Managers Limited; Assistant Vice President, The Invesco Funds; Senior Vice President, Invesco Advisers, Inc. (formerly known as Invesco Institutional (N.A.), Inc.) (registered investment adviser); Director and Chief Executive, Invesco Administration Services Limited and Invesco Global Investment Funds Limited; Director, Invesco Distributors, Inc.; Head of EMEA, Invesco Ltd.; President, Invesco Actively Managed Exchange-Traded Commodity Fund Trust, Invesco Actively Managed Exchange-Traded Fund Trust, Invesco Exchange-Traded Fund Trust, Invesco Exchange-Traded Fund Trust II and Invesco India Exchange-Traded Fund Trust; and Managing Director and Principal Executive Officer, Invesco Capital Management LLC | | N/A | | N/A |
| | |
| T-4 | | Invesco Dynamic Credit Opportunity Fund |
Trustees and Officers–(continued)
| | | | | | | | |
Name, Year of Birth and Position(s) Held with the Trust | | Trustee and/or Officer Since | | Principal Occupation(s) During Past 5 Years | | Number of Funds in
Fund Complex Overseen by
Trustee | | Other Directorship(s) Held by Trustee During Past 5 Years |
| Officers–(continued) |
John M. Zerr - 1962 Senior Vice President | | 2021 | | Chief Operating Officer of the Americas; Senior Vice President, Invesco Advisers, Inc. (formerly known as Invesco Institutional (N.A.), Inc.) (registered investment adviser); Senior Vice President, Invesco Distributors, Inc. (formerly known as Invesco AIM Distributors, Inc.); Director and Vice President, Invesco Investment Services, Inc. (formerly known as Invesco AIM Investment Services, Inc.) Senior Vice President, The Invesco Funds; Managing Director, Invesco Capital Management LLC; Director, Invesco Investment Advisers LLC (formerly known as Van Kampen Asset Management); Senior Vice President, Invesco Capital Markets, Inc. (formerly known as Van Kampen Funds Inc.); Manager, Invesco Indexing LLC; Manager, Invesco Specialized Products, LLC; Member, Invesco Canada Funds Advisory Board; Director, President and Chief Executive Officer, Invesco Corporate Class Inc. (corporate mutual fund company); and Director, Chairman, President and Chief Executive Officer, Invesco Canada Ltd. (formerly known as Invesco Trimark Ltd./Invesco Trimark Ltèe) (registered investment adviser and registered transfer agent); President, Invesco, Inc.; President, Invesco Global Direct Real Estate Feeder GP Ltd.; President, Invesco IP Holdings (Canada) Ltd; President, Invesco Global Direct Real Estate GP Ltd.; President, Invesco Financial Services Ltd. / Services Financiers Invesco Ltée; and Director and Chairman, Invesco Trust Company Formerly: President, Trimark Investments Ltd/Services Financiers Invesco Ltee; Director and Senior Vice President, Invesco Insurance Agency, Inc.; Director and Senior Vice President, Invesco Management Group, Inc. (formerly known as Invesco AIM Management Group, Inc.); Secretary and General Counsel, Invesco Management Group, Inc. (formerly known as Invesco AIM Management Group, Inc.); Secretary, Invesco Investment Services, Inc. (formerly known as Invesco AIM Investment Services, Inc.); Chief Legal Officer and Secretary, The Invesco Funds; Secretary and General Counsel, Invesco Investment Advisers LLC (formerly known as Van Kampen Asset Management); Secretary and General Counsel, Invesco Capital Markets, Inc. (formerly known as Van Kampen Funds Inc.); Chief Legal Officer, Invesco Exchange-Traded Fund Trust, Invesco Exchange-Traded Fund Trust II, Invesco India Exchange-Traded Fund Trust, Invesco Actively Managed Exchange-Traded Fund Trust, Invesco Actively Managed Exchange-Traded Commodity Fund Trust and Invesco Exchange-Traded Self-Indexed Fund Trust; Secretary, Invesco Indexing LLC; Director, Secretary, General Counsel and Senior Vice President, Van Kampen Exchange Corp.; Director, Vice President and Secretary, IVZ Distributors, Inc. (formerly known as INVESCO Distributors, Inc.); Director and Vice President, INVESCO Funds Group, Inc.; Director and Vice President, Van Kampen Advisors Inc.; Director, Vice President, Secretary and General Counsel, Van Kampen Investor Services Inc.; Director and Secretary, Invesco Distributors, Inc. (formerly known as Invesco AIM Distributors, Inc.); Director, Senior Vice President, General Counsel and Secretary, Invesco AIM Advisers, Inc. and Van Kampen Investments Inc.; Director, Vice President and Secretary, Fund Management Company; Director, Senior Vice President, Secretary, General Counsel and Vice President, Invesco AIM Capital Management, Inc.; and Chief Operating Officer and General Counsel, Liberty Ridge Capital, Inc. (an investment adviser) | | N/A | | N/A |
Gregory G. McGreevey - 1962 Senior Vice President | | 2021 | | Senior Managing Director, Invesco Ltd.; Director, Chairman, President, and Chief Executive Officer, Invesco Advisers, Inc. (formerly known as Invesco Institutional (N.A.), Inc.) (registered investment adviser); Director, Invesco Mortgage Capital, Inc. and Invesco Senior Secured Management, Inc.; Senior Vice President, The Invesco Funds; President, SNW Asset Management Corporation and Invesco Managed Accounts, LLC; Chairman and Director, Invesco Private Capital, Inc.; Chairman and Director, INVESCO Private Capital Investments, Inc.; Chairman and Director, INVESCO Realty, Inc.; and Senior Vice President, Invesco Group Services, Inc. Formerly: Senior Vice President, Invesco Management Group, Inc. and Invesco Advisers, Inc.; Assistant Vice President, The Invesco Funds | | N/A | | N/A |
Adrien Deberghes - 1967 Principal Financial Officer, Treasurer and Vice President | | 2021 | | Head of the Fund Office of the CFO and Fund Administration; Vice President, Invesco Advisers, Inc.; Principal Financial Officer, Treasurer and Vice President, The Invesco Funds; Vice President, Invesco Exchange-Traded Fund Trust, Invesco Exchange-Traded Fund Trust II, Invesco India Exchange-Traded Fund Trust, Invesco Actively Managed Exchange-Traded Fund Trust, Invesco Actively Managed Exchange-Traded Commodity Fund Trust and Invesco Exchange-Traded Self-Indexed Fund Trust Formerly: Senior Vice President and Treasurer, Fidelity Investments | | N/A | | N/A |
Crissie M. Wisdom - 1969 Anti-Money Laundering Compliance Officer | | 2021 | | Anti-Money Laundering and OFAC Compliance Officer for Invesco U.S. entities including: Invesco Advisers, Inc. and its affiliates, Invesco Capital Markets, Inc., Invesco Distributors, Inc., Invesco Investment Services, Inc., The Invesco Funds, Invesco Capital Management, LLC, Invesco Trust Company; and Fraud Prevention Manager for Invesco Investment Services, Inc. | | N/A | | N/A |
| | |
| T-5 | | Invesco Dynamic Credit Opportunity Fund |
Trustees and Officers–(continued)
| | | | | | | | |
Name, Year of Birth and Position(s) Held with the Trust | | Trustee and/or Officer Since | | Principal Occupation(s) During Past 5 Years | | Number of Funds in
Fund Complex Overseen by
Trustee | | Other Directorship(s) Held by Trustee During Past 5 Years |
| Officers–(continued) |
Todd F. Kuehl - 1969 Chief Compliance Officer and Senior Vice President | | 2021 | | Chief Compliance Officer, Invesco Advisers, Inc. (registered investment adviser); and Chief Compliance Officer and Senior Vice President, The Invesco Funds Formerly: Managing Director and Chief Compliance Officer, Legg Mason (Mutual Funds); Chief Compliance Officer, Legg Mason Private Portfolio Group (registered investment adviser) | | N/A | | N/A |
James Bordewick, Jr. - 1959 Senior Vice President and Senior Officer | | 2022 | | Senior Vice President and Senior Officer, The Invesco Funds Formerly: Chief Legal Officer, KingsCrowd, Inc. (research and analytical platform for investment in private capital markets); Chief Operating Officer and Head of Legal and Regulatory, Netcapital (private capital investment platform); Managing Director, General Counsel of asset management and Chief Compliance Officer for asset management and private banking, Bank of America Corporation; Chief Legal Officer, Columbia Funds and BofA Funds; Senior Vice President and Associate General Counsel, MFS Investment Management; Chief Legal Officer, MFS Funds; Associate, Ropes & Gray; and Associate, Gaston Snow & Ely Bartlett | | N/A | | N/A |
| | | | | | |
Office of the Fund 1331 Spring Street NW, Suite 2500 Atlanta, GA 30309 | | Investment Adviser Invesco Advisers, Inc. 1331 Spring Street NW, Suite 2500 Atlanta, GA 30309 | | Auditors PricewaterhouseCoopers LLP 1000 Louisiana Street, Suite 5800 Houston, TX 77002-5021 | | Custodian State Street Bank and Trust Company 225 Franklin Street Boston, MA 02110-2801 |
| | | |
Counsel to the Fund Stradley Ronon Stevens & Young, LLP 2005 Market Street, Suite 2600 Philadelphia, PA 19103-7018 | | Investment Sub-Adviser Invesco Senior Secured Management, Inc. 225 Liberty Street New York, NY 10281 | | Transfer Agent Invesco Investment Services, Inc. 11 Greenway Plaza, Suite 1000 Houston, TX 77046-1173 | | |
| | | |
Counsel to the Independent Trustees Sidley Austin LLP 787 Seventh Avenue New York, NY 10019 | | Invesco Asset Management Limited Perpetual Park Perpetual Park Drive Henley-on-Thames Oxfordshire RG9 1HH United Kingdom | | | | |
| | |
| T-6 | | Invesco Dynamic Credit Opportunity Fund |
Go paperless with eDelivery
Visit invesco.com/edelivery to enjoy the convenience and security of anytime electronic access to your investment documents.
With eDelivery, you can elect to have any or all of the following materials delivered straight to your inbox to download, save and print from your own computer:
∎ Fund reports and prospectuses
∎ Quarterly statements
∎ Daily confirmations
∎ Tax forms
Invesco mailing information
Send general correspondence to Invesco Investment Services, Inc., P.O. Box 219078, Kansas City, MO 64121-9078.
Important notice regarding delivery of security holder documents
To reduce Fund expenses, only one copy of most shareholder documents may be mailed to shareholders with multiple accounts at the same address (Householding). Mailing of your shareholder documents may be householded indefinitely unless you instruct us otherwise. If you do not want the mailing of these documents to be combined with those for other members of your household, please contact Invesco Investment Services, Inc. at 800 959 4246 or contact your financial institution. We will begin sending you individual copies for each account within 30 days after receiving your request.
Fund holdings and proxy voting information
The Fund provides a complete list of its portfolio holdings four times each year, at the end of each fiscal quarter. For the second and fourth quarters, the list appears, respectively, in the Fund’s semiannual and annual reports to shareholders. For the first and third quarters, the Fund files the list with the Securities and Exchange Commission (SEC) as an exhibit to its reports on Form N-PORT. The most recent list of portfolio holdings is available at invesco.com/completeqtrholdings. Shareholders can also look up the Fund’s Form N-PORT filings on the SEC website, sec.gov. The SEC file numbers for the Fund are shown below.
A description of the policies and procedures that the Fund uses to determine how to vote proxies relating to portfolio securities is available without charge, upon request, from our Client Services department at 800 959 4246, or at invesco.com/corporate/about-us/esg. The information is also available on the SEC website, sec.gov.
Information regarding how the Fund voted proxies related to its portfolio securities during the most recent 12-month period ended June 30 is available at invesco.com/proxysearch. This information is also available on the SEC website, sec.gov.
Invesco Advisers, Inc. is an investment adviser; it provides investment advisory services to individual and institutional clients and does not sell securities. Invesco Distributors, Inc. is the US distributor for Invesco Ltd.’s retail mutual funds, exchange-traded funds and institutional money market funds. Both are wholly owned, indirect subsidiaries of Invesco Ltd.
| | | | |
| SEC file number(s): 811-23665 and 333-255932 | | Invesco Distributors, Inc. | | VK-CE-DCO-AR-1 |