| | | FREE WRITING PROSPECTUS |
| | | FILED PURSUANT TO RULE 433 |
| | | REGISTRATION FILE NO.: 333-255934-03 |
| Dated September 14, 2022 | BMO 2022-C3 |
Structural and Collateral Term Sheet |
BMO 2022-C3 Mortgage Trust |
$726,702,946 (Approximate Mortgage Pool Balance) |
| |
$627,847,000 (Approximate Offered Certificates) |
| |
BMO Commercial Mortgage Securities LLC Depositor |
| |
Commercial Mortgage Pass-Through Certificates, Series 2022-C3 |
Bank of Montreal Citi Real Estate Funding Inc. UBS AG Starwood Mortgage Capital LLC LMF Commercial, LLC ReadyCap Commercial, LLC and Sutherland Asset I, LLC 3650 Real Estate Investment Trust 2 LLC Sabal Capital II, LLC Mortgage Loan Sellers |
BMO Capital
Markets | UBS Securities
LLC | Citigroup |
| Co-Lead Managers and Joint Bookrunners |
Regions Securities LLC
Co-Manager | Bancroft Capital, LLC Co-Manager | Drexel Hamilton
Co-Manager |
| THE INFORMATION IN THIS STRUCTURAL AND COLLATERAL TERM SHEET IS NOT COMPLETE AND MAY BE AMENDED PRIOR TO THE TIME OF SALE. THIS TERM SHEET IS NOT AN OFFER TO SELL THESE SECURITIES AND IT IS NOT A SOLICITATION OF AN OFFER TO BUY THESE SECURITIES IN ANY JURISDICTION WHERE THE OFFER OR SALE IS NOT PERMITTED. |
| Dated September 14, 2022 | BMO 2022-C3 |
This material is for your information, and none of BMO Capital Markets Corp., Citigroup Global Markets Inc., UBS Securities LLC, Regions Securities LLC, Bancroft Capital, LLC and Drexel Hamilton, LLC (the “Underwriters”) are soliciting any action based upon it. This material is not to be construed as an offer to sell or the solicitation of any offer to buy any security in any jurisdiction where such an offer or solicitation would be illegal.
The depositor has filed a registration statement (including the prospectus) with the Securities and Exchange Commission (File No. 333-255934) for the offering to which this communication relates. Before you invest, you should read the prospectus in the registration statement and other documents the depositor has filed with the Securities and Exchange Commission for more complete information about the depositor, the issuing entity and this offering. You may get these documents for free by visiting EDGAR on the SEC website at www.sec.gov. Alternatively, the depositor or BMO Capital Markets Corp., any other underwriter, or any dealer participating in this offering will arrange to send you the prospectus if you request it by calling 1-866-864-7760. The Offered Certificates referred to in these materials, and the asset pool backing them, are subject to modification or revision (including the possibility that one or more Classes of Certificates may be split, combined or eliminated at any time prior to issuance or availability of a final prospectus) and are offered on a “when, as and if issued” basis. You understand that, when you are considering the purchase of these Certificates, a contract of sale will come into being no sooner than the date on which the relevant Class has been priced and we have verified the allocation of Certificates to be made to you; any “indications of interest” expressed by you, and any “soft circles” generated by us, will not create binding contractual obligations for you or us.
Neither this document nor anything contained in this document shall form the basis for any contract or commitment whatsoever. The information contained in this document is preliminary as of the date of this document, supersedes any previous such information delivered to you and will be superseded by any such information subsequently delivered prior to the time of sale. These materials are subject to change, completion or amendment from time to time. The information should be reviewed only in conjunction with the entire offering document relating to the Commercial Mortgage Pass-Through Certificates, Series 2022-C3 (the “Offering Document”). All of the information contained herein is subject to the same limitations and qualifications contained in the Offering Document. The information contained herein does not contain all relevant information relating to the underlying mortgage loans or mortgaged properties. Such information is described elsewhere in the Offering Document. The information contained herein will be more fully described elsewhere in the Offering Document. The information contained herein should not be viewed as projections, forecasts, predictions or opinions with respect to value. Prior to making any investment decision, prospective investors are strongly urged to read the Offering Document its entirety. Neither the Securities and Exchange Commission nor any state securities commission has approved or disapproved of these securities or determined if this free writing prospectus is truthful or complete. Any representation to the contrary is a criminal offense.
This document has been prepared by the Underwriters for information purposes only and does not constitute, in whole or in part, a prospectus for the purposes of Regulation (EU) 2017/1129 (as amended or superseded) and/or Part VI of the Financial Services and Markets Act 2000 (as amended) or other offering document.
The attached information contains certain tables and other statistical analyses (the “Computational Materials”) which have been prepared in reliance upon information furnished by the Mortgage Loan Sellers. Numerous assumptions were used in preparing the Computational Materials, which may or may not be reflected herein. As such, no assurance can be given as to the Computational Materials’ accuracy, appropriateness or completeness in any particular context; or as to whether the Computational Materials and/or the assumptions upon which they are based reflect present market conditions or future market performance. The Computational Materials should not be construed as either projections or predictions or as legal, tax, financial or accounting advice. You should consult your own counsel, accountant and other advisors as to the legal, tax, business, financial and related aspects of a purchase of these Certificates. Any weighted average lives, yields and principal payment periods shown in the Computational Materials are based on prepayment and/or loss assumptions, and changes in such prepayment and/or loss assumptions may dramatically affect such weighted average lives, yields and principal payment periods. In addition, it is possible that prepayments or losses on the underlying assets will occur at rates higher or lower than the rates shown in the attached Computational Materials. The specific characteristics of the Certificates may differ from those shown in the Computational Materials due to differences between the final underlying assets and the preliminary underlying assets used in preparing the Computational Materials. The principal amount and designation of any security described in the Computational Materials are subject to change prior to issuance. None of the Underwriters or any of their respective affiliates make any representation or warranty as to the actual rate or timing of payments or losses on any of the underlying assets or the payments or yield on the Certificates. The information in this presentation is based upon management forecasts and reflects prevailing conditions and management’s views as of this date, all of which are subject to change. In preparing this presentation, we have relied upon and assumed, without independent verification, the accuracy and completeness of all information available from public sources or which was provided to us by or on behalf of the Mortgage Loan Sellers or which was otherwise reviewed by us.
This document contains forward-looking statements. If and when included in this document, the words “expects”, “intends”, “anticipates”, “estimates” and analogous expressions and all statements that are not historical facts, including statements about our beliefs or expectations, are intended to identify forward-looking statements. Any forward-looking statements are made subject to risks and uncertainties which could cause actual results to differ materially from those stated. Those risks and uncertainties include, among other things, declines in general economic and business conditions, increased competition, changes in demographics, changes in political and social conditions, regulatory initiatives and changes in consumer preferences, many of which are beyond our control and the control of any other person or entity related to this offering. The forward-looking statements made in this document are made as of the date hereof. We have no obligation to update or revise any forward-looking statement.
BMO Capital Markets is a trade name used by BMO Financial Group for the wholesale banking businesses of Bank of Montreal, BMO Harris Bank N.A. (member FDIC), Bank of Montreal Europe p.l.c, and Bank of Montreal (China) Co. Ltd, the institutional broker dealer business of BMO Capital Markets Corp. (Member FINRA and SIPC) and the agency broker dealer business of Clearpool Execution Services, LLC (Member FINRA and SIPC) in the U.S., and the institutional broker dealer businesses of BMO Nesbitt Burns Inc. (Member Investment Industry Regulatory Organization of Canada and Member Canadian Investor Protection Fund) in Canada and Asia, Bank of Montreal Europe p.l.c. (authorized and regulated by the Central Bank of Ireland) in Europe and BMO Capital Markets Limited (authorized and regulated by the Financial Conduct Authority) in the UK and Australia.
IMPORTANT NOTICE RELATING TO AUTOMATICALLY-GENERATED EMAIL DISCLAIMERS
Any legends, disclaimers or other notices that may appear at the bottom of any email communication to which this document is attached relating to (1) these materials not constituting an offer (or a solicitation of an offer), (2) no representation that these materials are accurate or complete and may not be updated or (3) these materials possibly being confidential, are not applicable to these materials and should be disregarded. Such legends, disclaimers or other notices have been automatically generated as a result of these materials having been sent via Bloomberg or another system.
THE CERTIFICATES REFERRED TO IN THESE MATERIALS ARE SUBJECT TO MODIFICATION OR REVISION (INCLUDING THE POSSIBILITY THAT ONE OR MORE CLASSES OF CERTIFICATES MAY BE SPLIT, COMBINED OR ELIMINATED AT ANY TIME PRIOR TO ISSUANCE OR AVAILABILITY OF A FINAL PROSPECTUS) AND ARE OFFERED ON A “WHEN, AS AND IF ISSUED” BASIS.
THE UNDERWRITERS MAY FROM TIME TO TIME PERFORM INVESTMENT BANKING SERVICES FOR, OR SOLICIT INVESTMENT BANKING BUSINESS FROM, ANY COMPANY NAMED IN THESE MATERIALS. THE UNDERWRITERS AND/OR THEIR AFFILIATES OR RESPECTIVE EMPLOYEES MAY FROM TIME TO TIME HAVE A LONG OR SHORT POSITION IN ANY CERTIFICATE OR CONTRACT DISCUSSED IN THESE MATERIALS.
| THE INFORMATION IN THIS STRUCTURAL AND COLLATERAL TERM SHEET IS NOT COMPLETE AND MAY BE AMENDED PRIOR TO THE TIME OF SALE. THIS TERM SHEET IS NOT AN OFFER TO SELL THESE SECURITIES AND IT IS NOT A SOLICITATION OF AN OFFER TO BUY THESE SECURITIES IN ANY JURISDICTION WHERE THE OFFER OR SALE IS NOT PERMITTED. |
| | | |
| | 2 | |
| Structural and Collateral Term Sheet | | BMO 2022-C3 |
| |
| Indicative Capital Structure |
| Offered Certificates | | | | | | | |
Classes of Certificates | Expected Ratings (Fitch/S&P/KBRA)(1) | Approximate Initial Certificate Balance or Notional Amount(2) | Approximate Initial Credit Support(3) | Initial
Pass-
Through Rate(4) | Pass-Through
Rate Description | Expected Weighted Avg. Life (yrs.)(5) | Expected Principal Window(5) |
| Class A-1 | AAAsf/AAA(sf)/AAA(sf) | $7,733,000 | | 30.000% | % | (6) | 2.31 | 11/22-11/26 |
| Class A-2 | AAAsf/AAA(sf)/AAA(sf) | $98,048,000 | | 30.000% | % | (6) | 4.65 | 11/26-8/27 |
| Class A-3 | AAAsf/AAA(sf)/AAA(sf) | $13,327,000 | | 30.000% | % | (6) | 7.84 | 3/30-11/30 |
| Class A-4 | AAAsf/AAA(sf)/AAA(sf) | (7 | ) | 30.000% | % | (6) | (7) | (7) |
| Class A-5 | AAAsf/AAA(sf)/AAA(sf) | (7 | ) | 30.000% | % | (6) | (7) | (7) |
| Class A-SB | AAAsf/AAA(sf)/AAA(sf) | $11,207,000 | | 30.000% | % | (6) | 6.86 | 8/27-6/31 |
| Class X-A | AAAsf/AAA(sf)/AAA(sf) | $498,009,000 | (8) | N/A | % | Variable IO(9) | N/A | N/A |
| Class X-B | A-sf/NR/AAA(sf) | $129,838,000 | (8) | N/A | % | Variable IO(9) | N/A | N/A |
| Class A-S | AAAsf/AA-(sf)/AAA(sf) | $65,808,000 | | 20.750% | % | (6) | 9.94 | 9/32-9/32 |
| Class B | AA-sf/NR/AA-(sf) | $32,905,000 | | 16.125% | % | (6) | 9.94 | 9/32-9/32 |
| Class C | A-sf/NR/A-(sf) | $31,125,000 | | 11.750% | % | (6) | 9.94 | 9/32-9/32 |
| Non-Offered Certificates(10) | | | | | |
Classes of Certificates | Expected Ratings (Fitch/S&P/KBRA)(1) | Approximate Initial Certificate Balance or Notional Amount(2) | Approximate Initial Credit Support(3) | Initial Pass-
Through Rate(4) | Pass-Through Rate Description | Expected Weighted Avg. Life (yrs.)(5) | Expected Principal Window(5) |
| Class X-D | BBBsf/NR/BBB(sf) | $19,565,000 | (8) | N/A | % | Variable IO(9) | N/A | N/A |
| Class X-E | BBB-sf/NR/BBB-(sf) | $15,118,000 | (8) | N/A | % | Variable IO(9) | N/A | N/A |
| Class D | BBBsf/NR/BBB(sf) | $19,565,000 | | 9.000% | % | (6) | 9.94 | 9/32-9/32 |
| Class E | BBB-sf/NR/BBB-(sf) | $15,118,000 | | 6.875% | % | (6) | 9.96 | 9/32-10/32 |
| Class F-RR(11) | BB+sf/NR/BB+(sf) | $8,893,000 | | 5.625% | % | (6) | 10.02 | 10/32-10/32 |
| Class G-RR(11) | BB-sf/NR/BB-(sf) | $7,114,000 | | 4.625% | % | (6) | 10.02 | 10/32-10/32 |
| Class J-RR(11) | B-sf/NR/B(sf) | $7,115,000 | | 3.625% | % | (6) | 10.02 | 10/32-10/32 |
| Class K-RR(11) | NR/NR/NR | $25,790,184 | | 0.000% | % | (6) | 10.02 | 10/32-10/32 |
| Class R(12) | N/A | N/A | | N/A | N/A | N/A | N/A | N/A |
| Non-Offered Vertical Risk Retention Interest(10)(13) | | | | | |
Non-Offered Eligible Vertical Interest | Expected Ratings (Fitch/S&P/KBRA)(1) | Approximate Initial Combined VRR Interest Balance(2) | Approximate Initial Credit Support(3) | Initial Effective Interest Rate (4) | Effective Interest Rate Description | Expected Weighted Avg. Life (yrs.)(5) | Expected Principal Window(5) |
| Combined VRR Interest(13) | NR/NR/NR | $15,260,762 | (14) | N/A(15) | %(16) | (16) | 8.92 | 11/22-10/32 |
| (1) | It is a condition of issuance that the offered certificates and certain classes of non-offered certificates receive the ratings set forth above. The anticipated ratings shown are those of Fitch Ratings, Inc. (“Fitch”), S&P Global Ratings (“S&P”) and Kroll Bond Rating Agency, LLC (“KBRA”), as indicated. Subject to the discussion under “Ratings” in the Preliminary Prospectus, the ratings on the certificates address the likelihood of the timely receipt by holders of all payments of interest to which they are entitled on each distribution date and, except in the case of the interest only certificates, the ultimate receipt by holders of all payments of principal to which they are entitled on or before the applicable rated final distribution date. Certain nationally recognized statistical rating organizations, as defined in Section 3(a)(62) of the Securities Exchange Act of 1934, as amended, that were not hired by the depositor may use information they receive pursuant to Rule 17g-5 under the Securities Exchange Act of 1934, as amended, or otherwise to rate the offered certificates. We cannot assure you as to what ratings a non-hired nationally recognized statistical rating organization would assign. See “Risk Factors—Other Risks Relating to the Certificates—Nationally Recognized Statistical Rating Organizations May Assign Different Ratings to the Certificates; Ratings of the Certificates Reflect Only the Views of the Applicable Rating Agencies as of the Dates Such Ratings Were Issued; Ratings May Affect ERISA Eligibility; Ratings May Be Downgraded” in the Preliminary Prospectus. Fitch, S&P and KBRA have informed us that the “sf” designation in the ratings represents an identifier of structured finance product ratings. For additional information about this identifier, prospective investors can go to the related rating agency’s website. The depositor and the underwriters have not verified, do not adopt and do not accept responsibility for any statements made by the rating agencies on those websites. Credit ratings referenced throughout this Term Sheet are forward-looking opinions about credit risk and express a rating agency’s opinion about the willingness and ability of an issuer of securities to meet its financial obligations in full and on time. Ratings are not indications of investment merit and are not buy, sell or hold recommendations, a measure of asset value or an indication of the suitability of an investment. |
| (2) | Approximate, subject to a variance of plus or minus 5% and further subject to any additional variances described in the footnotes below. In addition, the notional amounts of the Class X-A, Class X-B, Class X-D and Class X-E certificates (the “Class X certificates”) may vary depending upon the final pricing of the classes of non-vertically retained principal balance certificates (as defined in footnote (6) below) whose certificate balances comprise such notional amounts, and, if as a result of such pricing (a) the pass-through rate of any class of Class X certificates, would be equal to zero at all times, such class of certificates will not be issued on the closing date of this securitization or (b) the pass-through rate of any class of principal balance certificates whose certificate balance comprises such notional amount is at all times equal to the weighted average of the net interest rates on the mortgage loans (in each case, adjusted, if necessary, to accrue on the basis of a 360-day year consisting of twelve 30-day months) as in effect from time to time, the certificate balance of such class of principal balance certificates may not be part of, and there would be a corresponding reduction in, such notional amount of the related class of Class X certificates. |
| (3) | "Approximate Initial Credit Support" means, with respect to any class of non-vertically retained principal balance certificates, the quotient, expressed as a percentage, of (i) the aggregate of the initial certificate balances of all classes of non-vertically retained principal balance certificates, if any, junior to the subject class of non-vertically retained principal balance certificates, divided by (ii) the aggregate of the initial certificate balances of all classes of non-vertically retained principal balance certificates. The approximate initial credit support percentages set forth for the Class A-1, Class A-2, Class A-3, Class A-4, Class A-5 and Class A-SB certificates are represented in the aggregate. The approximate initial credit support percentages shown in the table above with respect to the non-vertically retained principal balance certificates do not take into account the Combined VRR Interest (as defined in footnote (13) below). |
| (4) | Approximate per annum rate as of the closing date. |
| (5) | Determined assuming no prepayments prior to the maturity date or any anticipated repayment date, as applicable, for any mortgage loan and based on the modeling assumptions described under “Yield, Prepayment and Maturity Considerations” in the Preliminary Prospectus. |
| (6) | For any distribution date, the pass-through rate for each class of the Class A-1, Class A-2, Class A-3, Class A-4, Class A-5, Class A-SB, Class A-S, Class B, Class C, Class D, Class E, Class F-RR, Class G-RR, Class J-RR and Class K-RR certificates (collectively, the “non-vertically retained principal balance certificates”, and |
| THE INFORMATION IN THIS STRUCTURAL AND COLLATERAL TERM SHEET IS NOT COMPLETE AND MAY BE AMENDED PRIOR TO THE TIME OF SALE. THIS TERM SHEET IS NOT AN OFFER TO SELL THESE SECURITIES AND IT IS NOT A SOLICITATION OF AN OFFER TO BUY THESE SECURITIES IN ANY JURISDICTION WHERE THE OFFER OR SALE IS NOT PERMITTED. |
| | | |
| | 3 | |
| Structural and Collateral Term Sheet | | BMO 2022-C3 |
| |
| Indicative Capital Structure |
collectively with the Class X certificates and the Class R certificates, the “non-vertically retained certificates”) will generally be equal to one of (i) a fixed per annum rate, (ii) the weighted average of the net interest rates on the mortgage loans (in each case, adjusted, if necessary, to accrue on the basis of a 360-day year consisting of twelve 30-day months) as in effect from time to time, (iii) a rate equal to the lesser of a specified per annum rate and the weighted average rate described in clause (ii), or (iv) the weighted average rate described in clause (ii) less a specified percentage, but no less than 0.000%. See “Description of the Certificates—Distributions—Pass-Through Rates” in the Preliminary Prospectus.
| (7) | The exact initial certificate balances of the Class A-4 and Class A-5 certificates are unknown and will be determined based on the final pricing of those classes of certificates. However, the respective initial certificate balances, weighted average lives and principal windows of the Class A-4 and Class A-5 certificates are expected to be within the applicable ranges reflected in the following chart. The aggregate initial certificate balance of the Class A-4 and Class A-5 certificates is expected to be approximately $367,694,000 subject to a variance of plus or minus 5%. |
Class of Certificates | Expected Range of Initial Certificate Balances | Expected Range of Weighted Avg. Lives (Yrs) | Expected Range of Principal Windows |
| Class A-4 | $0 - $165,000,000 | N/A - 9.47 | N/A - 6/31-8/32 |
| Class A-5 | $202,694,000 - $367,694,000 | 9.89 - 9.71 | 8/32-9/32 - 6/31-9/32 |
| (8) | The Class X certificates will not have certificate balances and will not be entitled to receive distributions of principal. Interest will accrue on each class of Class X certificates at the related pass-through rate based upon the related notional amount. The notional amount of each class of the Class X certificates will be equal to the certificate balance or the aggregate of the certificate balances, as applicable, from time to time of the class or classes of the non-vertically retained principal balance certificates identified in the same row as such class of Class X certificates in the chart below (as to such class of Class X certificates, the “corresponding principal balance certificates”): |
| Class of Class X Certificates | Class(es) of Corresponding
Principal Balance Certificates |
| Class X-A | Class A-1, Class A-2, Class A-3, Class A-4, Class A-5 and Class A-SB |
| Class X-B | Class A-S, Class B and Class C |
| Class X-D | Class D |
| Class X-E | Class E |
| (9) | The pass-through rate for each class of Class X certificates will generally be a per annum rate equal to the excess, if any, of (i) the weighted average of the net interest rates on the mortgage loans (in each case, adjusted, if necessary, to accrue on the basis of a 360-day year consisting of twelve 30-day months) as in effect from time to time, over (ii) the pass-through rate (or, if applicable, the weighted average of the pass-through rates) of the class or classes of corresponding principal balance certificates as in effect from time to time, as described in the Preliminary Prospectus. |
| (10) | The classes of certificates and uncertificated interests set forth below “Non-Offered Certificates” and “Non-Offered Vertical Risk Retention Interest” in the table are not offered hereby. |
| (11) | In partial satisfaction of Bank of Montreal’s risk retention obligations as retaining sponsor for this securitization transaction, all of the Class F-RR, Class G-RR, Class J-RR and Class K-RR certificates (collectively, the “HRR Certificates”), with an aggregate fair value expected to represent at least 2.9286% of the fair value, as of the closing date, of all of the “ABS interests” (i.e. all of the certificates (other than the Class R certificates) and the Uncertificated VRR Interest) issued by the issuing entity, will collectively constitute an “eligible horizontal residual interest” that is to be purchased and retained by KKR CMBS II Aggregator Type 1 L.P., a Delaware limited partnership, or its affiliate in accordance with the credit risk retention rules applicable to this securitization transaction. “Retaining sponsor,” “ABS interests” and “eligible horizontal residual interest” have the meanings given to such terms in Regulation RR. See “Credit Risk Retention” in the Preliminary Prospectus. |
| (12) | The Class R certificates will not have a certificate balance, notional amount, pass-through rate, rating or rated final distribution date. The Class R certificates will represent the residual interests in each of three separate REMICs, as further described in the Preliminary Prospectus. The Class R certificates will not be entitled to distributions of principal or interest. |
| (13) | In satisfaction of Bank of Montreal’s remaining risk retention obligations as retaining sponsor for this securitization transaction, Bank of Montreal is expected to acquire from the depositor, on the closing date for this transaction, an “eligible vertical interest” in the form of a “single vertical security” with an initial principal balance of approximately $15,260,762 (the “Combined VRR Interest”), which is expected to represent approximately 2.1000% of the aggregate principal balance of all the “ABS interests” (i.e., the sum of the aggregate initial certificate balance of all of the certificates (other than the Class R certificates) and the initial principal balance of the Uncertificated VRR Interest) issued by the issuing entity on the closing date for this transaction, subject to any variation in the initial principal balance of the Combined VRR Interest following calculation of the actual fair value of the HRR Certificates, all of the other classes of certificates (other than the Class R certificates) and the Uncertificated VRR Interest, as described under “Credit Risk Retention”. The Combined VRR Interest will consist of the “Uncertificated VRR Interest” (as defined under “Credit Risk Retention”). The Combined VRR Interest will be retained by the retaining sponsor in accordance with the credit risk retention rules applicable to this securitization transaction. “Eligible vertical interest” and “single vertical security” will have the meanings given to such terms in Regulation RR. See “Credit Risk Retention”. The Combined VRR Interest is not offered hereby. |
| (14) | Constitutes the Combined VRR Interest Balance, which consists of the principal balance of the Uncertificated VRR Interest. |
| (15) | Although the approximate initial credit support percentages shown in the table above with respect to the non-vertically retained principal balance certificates do not take into account the Combined VRR Interest, losses incurred on the mortgage loans will be allocated between the Combined VRR Interest, on the one hand, and the non-vertically retained principal balance certificates, on the other hand, pro rata in accordance with the principal balance of the Combined VRR Interest and the aggregate outstanding certificate balance of the non-vertically retained principal balance certificates. See “Credit Risk Retention” and “Description of the Certificates” in the Preliminary Prospectus. The non-vertically retained principal balance certificates are also collectively referred to as the “principal balance certificates”, and the non-vertically retained certificates are also collectively referred to as the “Certificates”. |
| (16) | Although it does not have a specified pass-through rate (other than for tax reporting purposes), the effective interest rate for the Combined VRR Interest will be the weighted average of the net mortgage interest rates on the mortgage loans (in each case, adjusted, if necessary, to accrue on the basis of a 360-day year consisting of twelve 30-day months) as in effect from time to time. |
| THE INFORMATION IN THIS STRUCTURAL AND COLLATERAL TERM SHEET IS NOT COMPLETE AND MAY BE AMENDED PRIOR TO THE TIME OF SALE. THIS TERM SHEET IS NOT AN OFFER TO SELL THESE SECURITIES AND IT IS NOT A SOLICITATION OF AN OFFER TO BUY THESE SECURITIES IN ANY JURISDICTION WHERE THE OFFER OR SALE IS NOT PERMITTED. |
| | | |
| | 4 | |
| Structural and Collateral Term Sheet | | BMO 2022-C3 |
| |
| Summary of Transaction Terms |
| Publicly Offered Certificates: | $627,847,000 monthly pay, multi-class, commercial mortgage REMIC Pass-Through Certificates. |
| Co-Lead Managers and Joint Bookrunners: | BMO Capital Markets Corp., UBS Securities LLC and Citigroup Global Markets Inc. |
| Co-Managers: | Regions Securities LLC, Bancroft Capital, LLC and Drexel Hamilton, LLC |
| Mortgage Loan Sellers: | Bank of Montreal (“BMO”) (31.5%); Citi Real Estate Funding Inc. (“CREFI”) (14.3%); 3650 Real Estate Investment Trust 2 LLC (“3650 REIT”) (11.5%); LMF Commercial, LLC (“LMF”) (10.7%); Starwood Mortgage Capital LLC (“SMC”) (9.7%); UBS AG (“UBS”) (9.2%); Sabal Capital II, LLC (“Sabal”) (6.6%); and ReadyCap Commercial, LLC and Sutherland Asset I, LLC (collectively, “ReadyCap”) (6.5%). |
| Master Servicer: | Midland Loan Services, a Division of PNC Bank, National Association. |
| Special Servicer: | Midland Loan Services, a Division of PNC Bank, National Association. |
Directing Holder/Controlling Class
Representative: | KKR Real Estate Credit Opportunity Partners II L.P. |
| Trustee: | Computershare Trust Company, National Association. |
| Certificate Administrator: | Computershare Trust Company, National Association. |
| Operating Advisor: | Park Bridge Lender Services LLC. |
| Asset Representations Reviewer: | Park Bridge Lender Services LLC. |
| Rating Agencies: | Standard and Poor’s (“S&P”), Fitch Ratings, Inc. (“Fitch”), and Kroll Bond Rating Agency, LLC (“KBRA”). |
| U.S. Credit Risk Retention: | For a discussion on the manner in which BMO as retaining sponsor, intends to satisfy the U.S. credit risk retention requirements, see “Credit Risk Retention” in the Preliminary Prospectus. |
| EU Credit Risk Retention: | The transaction is not structured to satisfy the EU risk retention and due diligence requirements. |
| Closing Date: | On or about October 7, 2022. |
| Cut-off Date: | With respect to each mortgage loan, the related due date in October 2022, or in the case of any mortgage loan that has its first due date after October 2022, the date that would have been its due date in October 2022 under the terms of that mortgage loan if a monthly debt service payment were scheduled to be due in that month. |
| Distribution Date: | The 4th business day after the Determination Date in each month, commencing in November 2022. |
| Determination Date: | 11th day of each month, or if the 11th day is not a business day, the next succeeding business day, commencing in November 2022. |
| Assumed Final Distribution Date: | The Distribution Date in October 2032 which is the latest anticipated repayment date of the Certificates. |
| Rated Final Distribution Date: | The Distribution Date in September 2054. |
| Tax Treatment: | The Publicly Offered Certificates are expected to be treated as REMIC “regular interests” for U.S. federal income tax purposes. |
| Form of Offering: | The Class A-1, Class A-2, Class A-3, Class A-4, Class A-5, Class A-SB, Class X-A, Class X-B, Class A-S, Class B and Class C Certificates (the “Publicly Offered Certificates”) will be offered publicly. The Class X-D, Class X-E, Class D, Class E, Class F-RR, Class G-RR, Class J-RR, Class K-RR and Class R Certificates (the “Privately Offered Certificates”) will be offered domestically to Qualified Institutional Buyers and to Institutional Accredited Investors (other than the Class R Certificates) and to institutions that are not U.S. Persons pursuant to Regulation S (other than the Class R Certificates). |
| SMMEA Status: | The Certificates will not constitute “mortgage related securities” for purposes of SMMEA. |
| ERISA: | The Publicly Offered Certificates are expected to be ERISA eligible. |
| Optional Termination: | On any Distribution Date on which the aggregate principal balance of the pool of mortgage loans is less than 1% of the aggregate principal balance of the mortgage loans as of the cut-off date, certain entities specified in the Preliminary Prospectus will have the option to purchase all of the remaining mortgage loans (and all property acquired through exercise of remedies in respect of any mortgage loan) at the price specified in the Preliminary Prospectus. Refer to “Pooling and Servicing Agreement—Termination; Retirement of Certificates” in the Preliminary Prospectus. |
| Minimum Denominations: | The Publicly Offered Certificates (other than the Class X-A and Class X-B Certificates) will be issued in minimum denominations of $10,000 and integral multiples of $1 in excess of $10,000. The Class X-A and Class X-B will be issued in minimum denominations of $1,000,000 and in integral multiples of $1 in excess of $1,000,000. |
| Settlement Terms: | DTC, Euroclear and Clearstream Banking. |
| Analytics: | The transaction is expected to be modeled by Bloomberg, L.P., Trepp, LLC, Intex Solutions, Inc., BlackRock Financial Management, Inc., CMBS.com, Inc., Moody’s Analytics, Markit Group Limited, RealINSIGHT, Thompson Reuters Corporation, Intercontinental Exchange | ICE Data Services, KBRA Analytics, LLC and DealView Technologies Ltd. |
| Risk Factors: | THE CERTIFICATES INVOLVE CERTAIN RISKS AND MAY NOT BE SUITABLE FOR ALL INVESTORS. REFER TO THE “SUMMARY OF RISK FACTORS” AND “RISK FACTORS” SECTIONS OF THE PRELIMINARY PROSPECTUS. |
| THE INFORMATION IN THIS STRUCTURAL AND COLLATERAL TERM SHEET IS NOT COMPLETE AND MAY BE AMENDED PRIOR TO THE TIME OF SALE. THIS TERM SHEET IS NOT AN OFFER TO SELL THESE SECURITIES AND IT IS NOT A SOLICITATION OF AN OFFER TO BUY THESE SECURITIES IN ANY JURISDICTION WHERE THE OFFER OR SALE IS NOT PERMITTED. |
| | | |
| | 5 | |
| Structural and Collateral Term Sheet | | BMO 2022-C3 |
| |
| Collateral Characteristics |
Mortgage Loan Seller | Number of Mortgage Loans | Number of Mortgaged Properties | Aggregate
Cut-off Date Balance | | Roll-up Aggregate Cut-off Date Balance | Roll-up Aggregate % of Cut-off Date Balance |
| BMO | 13 | 22 | $223,911,085 | 30.8% | $228,911,085 | 31.5% |
| CREFI | 4 | 6 | $103,800,000 | 14.3% | $103,800,000 | 14.3% |
| 3650 REIT | 6 | 18 | $83,898,574 | 11.5% | $83,898,574 | 11.5% |
| LMF | 4 | 4 | $77,666,340 | 10.7% | $77,666,340 | 10.7% |
| SMC | 2 | 8 | $37,985,415 | 5.2% | $70,485,415 | 9.7% |
| UBS AG | 2 | 6 | $67,000,000 | 9.2% | $67,000,000 | 9.2% |
| Sabal | 8 | 16 | $47,970,000 | 6.6% | $47,970,000 | 6.6% |
| ReadyCap(1) | 8 | 8 | $46,971,532 | 6.5% | $46,971,532 | 6.5% |
| BMO, SMC | 1 | 1 | $37,500,000 | 5.2% | - | - |
| Total: | 48 | 89 | $726,702,946 | 100.0% | $726,702,946 | 100.0% |
| Loan Pool | |
| | Initial Pool Balance (“IPB”): | $726,702,946 |
| | Number of Mortgage Loans: | 48 |
| | Number of Mortgaged Properties: | 89 |
| | Average Cut-off Date Balance per Mortgage Loan: | $15,139,645 |
| | Weighted Average Current Mortgage Rate: | 5.35217% |
| | 10 Largest Mortgage Loans as % of IPB: | 46.7% |
| | Weighted Average Remaining Term to Maturity: | 108 months |
| | Weighted Average Seasoning: | 3 months |
| | | |
| Credit Statistics | |
| | Weighted Average UW NCF DSCR(2)(3): | 1.88x |
| | Weighted Average UW NOI Debt Yield(2)(4): | 10.8% |
| | Weighted Average Cut-off Date Loan-to-Value Ratio (“LTV”)(2)(4)(5): | 53.7% |
| | Weighted Average Maturity Date/ARD LTV(2)(4)(5): | 51.7% |
| | | |
| Other Statistics | |
| | % of Mortgage Loans with Additional Debt: | 11.6% |
| | % of Mortgage Loans with Single Tenants(6): | 18.0% |
| % of Mortgage Loans secured by Multiple Properties: | 29.4% |
| | |
| Amortization | |
| | Weighted Average Original Amortization Term(7): | 353 months |
| | Weighted Average Remaining Amortization Term(7): | 352 months |
| | % of Mortgage Loans with Interest-Only: | 73.2% |
| | % of Mortgage Loans with Amortizing Balloon: | 13.8% |
| | % of Mortgage Loans with Partial Interest-Only followed by Amortizing Balloon: | 12.9% |
| | | |
| Lockboxes(8) | |
| | % of Mortgage Loans with Hard Lockboxes: | 41.9% |
| | % of Mortgage Loans with Springing Lockboxes: | 35.7% |
| | % of Mortgage Loans with Soft (Residential); Hard (Commercial) Lockboxes: | 13.4% |
| | % of Mortgage Loans with Soft Springing Lockboxes: | 5.2% |
| | % of Mortgage Loans with No Lockboxes: | 2.1% |
| | % of Mortgage Loans with Soft Lockboxes: | 1.8% |
| | | |
| Reserves | |
| | % of Mortgage Loans Requiring Monthly Tax Reserves: | 85.7% |
| | % of Mortgage Loans Requiring Monthly Insurance Reserves: | 38.3% |
| | % of Mortgage Loans Requiring Monthly CapEx Reserves: | 70.3% |
| | % of Mortgage Loans Requiring Monthly TI/LC Reserves(9): | 51.2% |
(See footnotes on following page)
| THE INFORMATION IN THIS STRUCTURAL AND COLLATERAL TERM SHEET IS NOT COMPLETE AND MAY BE AMENDED PRIOR TO THE TIME OF SALE. THIS TERM SHEET IS NOT AN OFFER TO SELL THESE SECURITIES AND IT IS NOT A SOLICITATION OF AN OFFER TO BUY THESE SECURITIES IN ANY JURISDICTION WHERE THE OFFER OR SALE IS NOT PERMITTED. |
| | | |
| | 6 | |
| Structural and Collateral Term Sheet | | BMO 2022-C3 |
| |
| Collateral Characteristics |
| (1) | “ReadyCap” refers to affiliated entities ReadyCap Commercial, LLC (seller of Loan Nos. 21, 27, 34, 37, 46 and 47) (6 mortgage loans representing 5.3% of IPB) and Sutherland Asset I, LLC (seller of Loan Nos. 39 and 45) (2 mortgage loans representing 1.2% of IPB). |
| (2) | In the case of Loan Nos. 1, 2, 3, 4, 8, 9, 10, 16, 17, 19, 20, 22, 23, 24, 25 and 30, the UW NCF DSCR, UW NOI Debt Yield, Cut-off Date Loan-to-Value Ratio and Maturity Date/ARD Loan-to-Value Ratio calculations include the related Pari Passu Companion Loan(s). In the case of Loan Nos. 1, 3 and 23, the UW NCF DSCR, UW NOI Debt Yield, Cut-off Date Loan-to-Value Ratio and Maturity Date/ARD Loan-to-Value Ratio calculations exclude the related Subordinate Companion Loans and/or mezzanine loans. |
| (3) | For the mortgage loans that are interest-only for the entire term and accrue interest on an Actual/360 basis, the Monthly Debt Service Amount ($) was calculated as 1/12th of the product of (i) the Original Balance ($), (ii) the Interest Rate % and (iii) 365/360. |
| (4) | In the case of Loan No. 4, the UW NOI Debt Yield is based on Cut-off Date Principal Balance after netting out a $5,000,000 holdback reserve. UW NOI Debt Yield based on Cut-off Date Principal Balance without netting out the holdback reserve is 9.8%. In the case of Loan No. 7, the Cut-off Date Loan-to-Value Ratio, Maturity Date/ARD LTV and UW NOI Debt Yield are based on Cut-off Date Principal Balance after netting out a $2,500,000 holdback reserve. The Cut-off Date Loan-to-Value Ratio, Maturity Date/ARD Loan-to-Value Ratio and UW NOI Debt Yield based on Cut-off Date Principal Balance without netting out the holdback reserve are 55.2%, 46.9% and 9.2%, respectively. In the case of Loan No. 14, the UW NOI Debt Yield is based on Cut-off Date Principal Balance after netting out a $920,000 holdback reserve. UW NOI Debt Yield based on Cut-off Date Principal Balance without netting out the holdback reserve is 8.7%. In the case of Loan No. 24, the Cut-off Date Loan-to-Value Ratio, Maturity Date/ARD LTV and UW NOI Debt Yield are based on Cut-off Date Principal Balance after netting out a $12,000,000 holdback reserve. The Cut-off Date Loan-to-Value Ratio, Maturity Date/ARD LTV and UW NOI Debt Yield based on Cut-off Date Principal Balance without netting out the holdback reserve are 64.2%, 56.8% and 11.6%, respectively. |
| (5) | In the case of Loan Nos. 17 and 31, the Cut-off Date Loan-to-Value Ratio and Maturity/ARD Loan-to-Value Ratio are calculated by using an appraised value based on an as portfolio assumption. In the case of Loan No. 20, the Cut-off Date Loan-to-Value Ratio and the Maturity Date/ARD Loan-to-Value Ratio are calculated by using an as-is appraised value assuming a $500,000 capital reserve. In the case of Loan No. 26, the Cut-off Date Loan-to-Value Ratio and Maturity/ARD Loan-to-Value Ratio are calculated by using an appraised value based on an as complete assumption. In the case of Loan No. 28, the Cut-off Date Loan-to-Value Ratio and Maturity Date/ARD Loan-to-Value Ratio are calculated by using an appraised value based on a prospective leased fee appraised value for three of the mortgaged properties and a prospective as market appraised value for one of the mortgaged properties. Refer to “Description of the Mortgage Pool—Certain Calculations and Definitions—Appraised Value” in the Preliminary Prospectus for additional details. |
| (6) | Excludes mortgage loans that are secured by multiple properties with multiple tenants and includes two mortgage loans that are secured by both single-tenant properties and multi-tenant properties. |
| (7) | Excludes 32 mortgage loans that are interest-only for the entire term or until the anticipated repayment date. |
| (8) | For a more detailed description of lockboxes, refer to “Description of the Mortgage Pool—Certain Calculations and Definitions” and “—Certain Terms of the Mortgage Loans—Mortgaged Property Accounts” in the Preliminary Prospectus. |
| (9) | Calculated only with respect to the Cut-off Date Balance of mortgage loans secured or partially secured by office, industrial, retail, and mixed use properties. |
| THE INFORMATION IN THIS STRUCTURAL AND COLLATERAL TERM SHEET IS NOT COMPLETE AND MAY BE AMENDED PRIOR TO THE TIME OF SALE. THIS TERM SHEET IS NOT AN OFFER TO SELL THESE SECURITIES AND IT IS NOT A SOLICITATION OF AN OFFER TO BUY THESE SECURITIES IN ANY JURISDICTION WHERE THE OFFER OR SALE IS NOT PERMITTED. |
| | | |
| | 7 | |
| Structural and Collateral Term Sheet | | BMO 2022-C3 |
| |
| Collateral Characteristics |
| Ten Largest Mortgage Loans |
| |
| No. | Loan Name | City, State | Mortgage Loan Seller | No.
of Prop. | Cut-off Date Balance | % of IPB | Square Feet / Rooms / Units | Property Type | UW
NCF DSCR(1) | UW NOI Debt Yield(1)(2) | Cut-off Date LTV(1)(2) | Maturity Date/ARD LTV(1)(2) |
| 1 | Park West Village | New York, NY | BMO, SMC | 1 | $37,500,000 | 5.2% | 850 | Multifamily | 2.60x | 12.3% | 32.6% | 32.6% |
| 2 | Kingston Square Apartments | Indianapolis, IN | BMO | 1 | $37,000,000 | 5.1% | 523 | Multifamily | 1.53x | 9.2% | 59.5% | 59.5% |
| 3 | Yorkshire & Lexington Towers | New York, NY | BMO | 2 | $37,000,000 | 5.1% | 808 | Multifamily | 3.61x | 11.1% | 33.3% | 33.3% |
| 4 | Phoenix Industrial Portfolio IX | Various, Various | UBS AG | 5 | $37,000,000 | 5.1% | 3,760,303 | Industrial | 1.48x | 10.6% | 41.2% | 41.2% |
| 5 | 50 Tice Corporate Center | Woodcliff Lake, NJ | LMF | 1 | $36,500,000 | 5.0% | 256,459 | Office | 1.68x | 12.3% | 56.8% | 53.0% |
| 6 | Center Pointe Plaza I | Newark, DE | LMF | 1 | $34,966,340 | 4.8% | 238,348 | Retail | 1.27x | 9.6% | 66.2% | 56.5% |
| 7 | Bayou City Portfolio | Various, TX | SMC | 3 | $32,191,295 | 4.4% | 633 | Multifamily | 1.21x | 10.0% | 50.9% | 42.7% |
| 8 | 469 7th Avenue | New York, NY | UBS AG | 1 | $30,000,000 | 4.1% | 269,233 | Office | 1.41x | 9.4% | 52.4% | 52.4% |
| 9 | Wells Fargo Center Tampa | Tampa, FL | CREFI | 1 | $30,000,000 | 4.1% | 389,624 | Office | 1.60x | 10.2% | 59.4% | 59.4% |
| 10 | Saks Fulfillment Center | Wilkes Barre, PA | BMO | 1 | $27,500,000 | 3.8% | 822,771 | Industrial | 1.71x | 10.7% | 53.1% | 53.1% |
| | | | | | | | | | | | | |
| | Top 3 Total/Weighted Average | 4 | $111,500,000 | 15.3% | | | 2.58x | 10.9% | 41.8% | 41.8% |
| | Top 5 Total/Weighted Average | 10 | $185,000,000 | 25.5% | | | 2.18x | 11.1% | 44.6% | 43.9% |
| | Top 10 Total/Weighted Average | 17 | $339,657,635 | 46.7% | | | 1.84x | 10.6% | 50.1% | 47.9% |
| | Non-Top 10 Total/Weighted Average(2) | 72 | $387,045,312 | 53.3% | | | 1.92x | 11.0% | 56.8% | 55.1% |
| (1) | In the case of Loan Nos. 1, 2, 3, 4, 8, 9, 10, 16, 17, 19, 20, 22, 23, 24, 25 and 30, the UW NCF DSCR, UW NOI Debt Yield, Cut-off Date LTV and Maturity Date/ARD LTV calculations include the related Pari Passu Companion Loan(s). In the case of Loan Nos. 1, 3 and 23, the UW NCF DSCR, UW NOI Debt Yield, Cut-off Date LTV and Maturity Date/ARD LTV calculations exclude the related Subordinate Companion Loans and/or subordinate mezzanine loan. |
| (2) | In the case of Loan No. 4, the UW NOI Debt Yield is based on Cut-off Date Principal Balance after netting out a $5,000,000 holdback reserve. UW NOI Debt Yield based on Cut-off Date Principal Balance without netting out the holdback reserve is 9.8%. In the case of Loan No. 7, the Cut-off Date Loan-to-Value Ratio, Maturity Date/ARD LTV and UW NOI Debt Yield are based on Cut-off Date Principal Balance after netting out a $2,500,000 holdback reserve. The Cut-off Date Loan-to-Value Ratio, Maturity Date/ARD Loan-to-Value Ratio and UW NOI Debt Yield based on Cut-off Date Principal Balance without netting out the holdback reserve are 55.2%, 46.9% and 9.2%, respectively. In the case of Loan No. 14, the UW NOI Debt Yield is based on Cut-off Date Principal Balance after netting out a $920,000 holdback reserve. UW NOI Debt Yield based on Cut-off Date Principal Balance without netting out the holdback reserve is 8.7%. In the case of Loan No. 24, the Cut-off Date Loan-to-Value Ratio, Maturity Date/ARD LTV and UW NOI Debt Yield are based on Cut-off Date Principal Balance after netting out a $12,000,000 holdback reserve. The Cut-off Date Loan-to-Value Ratio, Maturity Date/ARD LTV and UW NOI Debt Yield based on Cut-off Date Principal Balance without netting out the holdback reserve are 64.2%, 56.8% and 11.6%, respectively. |
| THE INFORMATION IN THIS STRUCTURAL AND COLLATERAL TERM SHEET IS NOT COMPLETE AND MAY BE AMENDED PRIOR TO THE TIME OF SALE. THIS TERM SHEET IS NOT AN OFFER TO SELL THESE SECURITIES AND IT IS NOT A SOLICITATION OF AN OFFER TO BUY THESE SECURITIES IN ANY JURISDICTION WHERE THE OFFER OR SALE IS NOT PERMITTED. |
| | | |
| | 8 | |
| Structural and Collateral Term Sheet | | BMO 2022-C3 |
| |
| Collateral Characteristics |
| Pari Passu Companion Loan Summary |
| |
No. | Loan Name | | Trust Cut-off Date Balance | Aggregate Pari Passu Loan Cut-off Date Balance(1) | Controlling Pooling/Trust & Servicing Agreement | Master Servicer | Special Servicer | Related Pari Passu Loan(s) Securitizations | Related Pari Passu Loan(s) Original Balance |
| 1 | Park West Village | BMO, SMC | $37,500,000 | $150,000,000 | BBCMS 2022-C17 | KeyBank | KeyBank | BBCMS 2022-C17 Future Securitization(s) | $47,500,000 $102,500,000 |
| 2 | Kingston Square Apartments | BMO | $37,000,000 | $14,000,000 | BMO 2022-C3 | Midland | Midland | Future Securitization(s) | $14,000,000 |
| 3 | Yorkshire & Lexington Towers | BMO | $37,000,000 | $281,000,000 | CGCMT 2022-GC48 | Midland | Rialto | BBCMS 2022-C16 BMO 2022-C2 CGCMT 2022-GC48 BMARK 2022-B36 BBCMS 2022-C17 | $65,000,000 $70,000,000 $60,000,000 $66,000,000 $20,000,000 |
| 4 | Phoenix Industrial Portfolio IX | UBS AG | $37,000,000 | $38,000,000 | BMO 2022-C3 | Midland | Midland | Future Securitizations(s) | $38,000,000 |
| 8 | 469 7th Avenue | UBS AG | $30,000,000 | $68,000,000 | BMO 2022-C3(2) | Midland(2) | Midland(2) | Future Securitizations(s) | $68,000,000 |
| 9 | Wells Fargo Center Tampa | CREFI | $30,000,000 | $43,000,000 | BMO 2022-C3 (2) | Midland(2) | Midland(2) | Future Securitizations(s) | $43,000,000 |
| 10 | Saks Fulfillment Center | BMO | $27,500,000 | $32,500,000 | BMO 2022-C3 | Midland | Midland | BBCMS 2022-C17 Future Securitizations(s) | $22,500,000 $10,000,000 |
| 16 | La Habra Marketplace | 3650 REIT | $20,000,000 | $75,000,000 | BMO 2022-C3 (2) | Midland(2) | Midland(2) | Future Securitizations(s) | $75,000,000 |
| 17 | Central States Industrial Portfolio | 3650 REIT | $20,000,000 | $39,900,000 | BMO 2022-C3 (2) | Midland(2) | Midland(2) | Future Securitizations(s) | $39,900,000 |
| 19 | Icon One Daytona | 3650 REIT | $15,000,000 | $35,000,000 | 3650R 2021-PF1 | Midland | 3650 REIT | 3650 2021-PF1 Future Securitizations(s) | $25,000,000 $10,000,000 |
| 20 | Lakeshore Marketplace | 3650 REIT | $11,848,574 | $9,656,588 | BMO 2022-C3 (2) | Midland(2) | Midland(2) | Future Securitizations(s) | $9,780,000 |
| 22 | Bell Works | BMO | $10,000,000 | $200,000,000 | BMARK 2022-B35 | KeyBank | KeyBank | BMARK 2022-B35 BBCMS 2022-C16 BMO 2022-C2 CGCMT 2022-GC48 BBCMS 2022-C17 Future Securitization(s) | $50,000,000 $40,000,000 $30,000,000 $40,000,000 $25,000,000 $15,000,000 |
| 23 | 111 River Street | BMO | $10,000,000 | $67,500,000 | BMO 2022-C1 | KeyBank | KeyBank | BMO 2022-C1 BMO 2022-C2 CGCMT 2022-GC48 | $37,500,000 $22,000,000 $8,000,000 |
| 24 | Art Ovation Hotel | 3650 REIT | $10,000,000 | $47,500,000 | BMO 2022-C3 (2) | Midland(2) | Midland(2) | Future Securitizations(s) | $47,500,000 |
| 25 | 3455 Veterans Hwy | BMO | $10,000,000 | $20,000,000 | BMO 2022-C3 | Midland | Midland | BBCMS 2022-C17 | $20,000,000 |
| 30 | A&R Hospitality Portfolio | BMO | $7,250,000 | $55,750,000 | BBCMS 2022-C17 | KeyBank | Argentic | BBCMS 2022-C17 Future Securitizations(s) | $40,000,000 $15,750,000 |
| (1) | In the case of Loan Nos. 1, 3 and 23, the Aggregate Pari Passu Loan Cut-off Date Balance excludes the related Subordinate Companion Loan(s) and one or more subordinate mezzanine loans. |
| (2) | In the case of Loan Nos. 8, 9, 16, 17, 20 and 24, until the securitization of the related controlling pari passu companion loan, the related whole loan will be serviced and administered pursuant to the pooling and servicing agreement for the BMO 2022-C3 securitization transaction by the parties thereto. Upon the securitization of the related controlling pari-passu companion loan, servicing of the related whole loan will shift to the servicers under the servicing agreement with respect to such future securitization transaction, which servicing agreement will become the Controlling Pooling/Trust & Servicing Agreement. |
| THE INFORMATION IN THIS STRUCTURAL AND COLLATERAL TERM SHEET IS NOT COMPLETE AND MAY BE AMENDED PRIOR TO THE TIME OF SALE. THIS TERM SHEET IS NOT AN OFFER TO SELL THESE SECURITIES AND IT IS NOT A SOLICITATION OF AN OFFER TO BUY THESE SECURITIES IN ANY JURISDICTION WHERE THE OFFER OR SALE IS NOT PERMITTED. |
| | | |
| | 9 | |
| Structural and Collateral Term Sheet | | BMO 2022-C3 |
| |
| Collateral Characteristics |
No. | Loan Name | Trust
Cut-off Date Balance | Pari Passu Loan(s) Cut-off Date Balance | Subordinate Debt Cut-off Date Balance(1)(2) | Total Debt Cut-off Date Balance | Mortgage Loan UW NCF DSCR(3) | Total Debt UW NCF DSCR | Mortgage Loan
Cut-off Date LTV(3) | Total Debt Cut-off Date LTV | Mortgage Loan UW NOI Debt Yield(3) | Total Debt UW NOI Debt Yield |
| 1 | Park West Village | $37,500,000 | $150,000,000 | $177,500,000 | $365,000,000 | 2.60x | 1.34x | 32.6% | 63.5% | 12.3% | 6.3% |
| 3 | Yorkshire & Lexington Towers | $37,000,000 | $281,000,000 | $396,000,000 | $714,000,000 | 3.61x | 1.20x | 33.3% | 74.8% | 11.1% | 5.0% |
| 23 | 111 River Street | $10,000,000 | $67,500,000 | $76,250,000 | $153,750,000 | 5.08x | 2.56x | 31.8% | 63.0% | 16.9% | 8.5% |
| (1) | In the case of Loans Nos. 1 and 23, subordinate debt represents one or more Subordinate Companion Loans. |
| (2) | In the case of Loan No. 3, subordinate debt represents one or more Subordinate Companion Loans and one or more subordinate mezzanine loans. |
| (3) | Mortgage Loan UW NCF DSCR, Mortgage Loan Cut-off Date LTV and Mortgage Loan UW NOI Debt Yield calculations include any related Pari Passu Companion Loans (if applicable), but exclude the related Subordinate Companion Loans and one or more subordinate mezzanine loans. |
| THE INFORMATION IN THIS STRUCTURAL AND COLLATERAL TERM SHEET IS NOT COMPLETE AND MAY BE AMENDED PRIOR TO THE TIME OF SALE. THIS TERM SHEET IS NOT AN OFFER TO SELL THESE SECURITIES AND IT IS NOT A SOLICITATION OF AN OFFER TO BUY THESE SECURITIES IN ANY JURISDICTION WHERE THE OFFER OR SALE IS NOT PERMITTED. |
| | | |
| | 10 | |
| Structural and Collateral Term Sheet | | BMO 2022-C3 |
| |
| Collateral Characteristics |
| Mortgaged Properties by Type(1) |
| | | | | | Weighted Average |
| Property Type | Property Subtype | Number of Properties | Cut-off Date Principal Balance | % of IPB | UW
NCF DSCR(2)(3) | UW
NOI Debt Yield(2)(4) | Cut-off Date LTV(2)(4)(5) | Maturity Date/ARD LTV(2)(4)(5) |
| Multifamily | Garden | 14 | $110,147,594 | 15.2 | % | 1.53x | 9.2% | 58.0% | 54.5% |
| | High Rise | 3 | 74,500,000 | 10.3 | | 3.10x | 11.7% | 32.9% | 32.9% |
| | Age Restricted | 1 | 5,450,000 | 0.7 | | 2.28x | 9.3% | 64.9% | 64.9% |
| | Townhomes | 1 | 3,251,125 | 0.4 | | 1.22x | 7.8% | 68.4% | 63.4% |
| | Mid Rise | 1 | 1,644,107 | 0.2 | | 1.54x | 8.7% | 60.9% | 60.9% |
| | Subtotal: | 20 | $194,992,827 | 26.8 | % | 2.14x | 10.1% | 48.8% | 46.7% |
| Office | CBD | 3 | $70,000,000 | 9.6 | % | 2.02x | 10.8% | 52.5% | 52.5% |
| | Suburban | 4 | 64,400,000 | 8.9 | | 1.64x | 11.0% | 59.0% | 55.9% |
| | Medical | 1 | 27,000,000 | 3.7 | | 1.57x | 10.2% | 56.3% | 56.3% |
| | Subtotal: | 8 | $161,400,000 | 22.2 | % | 1.79x | 10.8% | 55.7% | 54.5% |
| Industrial | Warehouse/Distribution | 14 | $42,333,161 | 5.8 | % | 1.58x | 10.5% | 49.1% | 49.1% |
| | Flex | 3 | 28,831,653 | 4.0 | | 1.56x | 10.1% | 50.1% | 49.4% |
| | Warehouse | 1 | 27,500,000 | 3.8 | | 1.71x | 10.7% | 53.1% | 53.1% |
| | Manufacturing | 4 | 26,041,998 | 3.6 | | 1.43x | 10.8% | 40.2% | 36.5% |
| | Cold Storage | 1 | 4,570,952 | 0.6 | | 1.59x | 9.4% | 68.1% | 68.1% |
| | Manufacturing/Warehouse/Distribution | 1 | 1,282,137 | 0.2 | | 1.59x | 9.4% | 68.1% | 68.1% |
| | Subtotal: | 24 | $130,559,900 | 18.0 | % | 1.57x | 10.5% | 49.2% | 48.4% |
| Retail | Anchored | 5 | $89,749,914 | 12.4 | % | 1.66x | 10.1% | 65.0% | 60.1% |
| | Single Tenant | 3 | 31,320,100 | 4.3 | | 2.21x | 11.5% | 51.2% | 51.2% |
| | Unanchored | 1 | 6,500,000 | 0.9 | | 2.06x | 11.9% | 54.2% | 54.2% |
| | Subtotal: | 9 | $127,570,014 | 17.6 | % | 1.82x | 10.5% | 61.0% | 57.6% |
| Hospitality | Limited Service | 8 | $23,583,319 | 3.2 | % | 2.21x | 16.1% | 57.3% | 52.7% |
| | Extended Stay | 4 | 15,857,766 | 2.2 | | 2.54x | 16.6% | 50.8% | 50.2% |
| | Full Service | 1 | 10,000,000 | 1.4 | | 1.45x | 14.7% | 50.8% | 43.4% |
| | Subtotal: | 13 | $49,441,085 | 6.8 | % | 2.16x | 16.0% | 53.9% | 50.0% |
| Mixed Use | Multifamily/Retail | 3 | $28,720,000 | 4.0 | % | 1.38x | 9.0% | 66.2% | 66.2% |
| | Subtotal: | 3 | $28,720,000 | 4.0 | % | 1.38x | 9.0% | 66.2% | 66.2% |
| Self Storage | Self Storage | 7 | $28,225,000 | 3.9 | % | 2.34x | 10.3% | 50.0% | 50.0% |
| Manufactured Housing | Manufactured Housing | 5 | $5,794,120 | 0.8 | % | 1.63x | 11.8% | 50.8% | 43.0% |
| Total / Weighted Average: | 89 | $726,702,946 | 100.0 | % | 1.88x | 10.8% | 53.7% | 51.7% |
| (1) | Because this table presents information relating to the mortgaged properties and not mortgage loans, the information for mortgage loans secured by more than one mortgaged property is based on allocated loan amounts, individual appraised values, net cash flow or net operating income with respect to such individual mortgaged properties, as applicable. |
| (2) | In the case of Loan Nos. 1, 2, 3, 4, 8, 9, 10, 16, 17, 19, 20, 22, 23, 24, 25 and 30, the UW NCF DSCR, UW NOI Debt Yield, Cut-off Date LTV and Maturity Date/ARD LTV calculations include the related Pari Passu Companion Loan(s). In the case of Loan Nos. 1, 3 and 23, the UW NCF DSCR, UW NOI Debt Yield, Cut-off Date LTV and Maturity Date/ARD LTV calculations exclude the related Subordinate Companion Loans and/or related mezzanine loan. |
| (3) | For the mortgage loans that are interest-only for the entire term or until the anticipated repayment date and accrue interest on an Actual/360 basis, the Monthly Debt Service Amount ($) was calculated as 1/12th of the product of (i) the Original Balance ($), (ii) the Interest Rate % and (iii) 365/360. |
| (4) | In the case of Loan No. 4, the UW NOI Debt Yield is based on Cut-off Date Principal Balance after netting out a $5,000,000 holdback reserve. UW NOI Debt Yield based on Cut-off Date Principal Balance without netting out the holdback reserve is 9.8%. In the case of Loan No. 7, the Cut-off Date Loan-to-Value Ratio, Maturity Date/ARD LTV and UW NOI Debt Yield are based on Cut-off Date Principal Balance after netting out a $2,500,000 holdback reserve. The Cut-off Date Loan-to-Value Ratio, Maturity Date/ARD Loan-to-Value Ratio and UW NOI Debt Yield based on Cut-off Date Principal Balance without netting out the holdback reserve are 55.2%, 46.9% and 9.2%, respectively. In the case of Loan No. 14, the UW NOI Debt Yield is based on Cut-off Date Principal Balance after netting out a $920,000 holdback reserve. UW NOI Debt Yield based on Cut-off Date Principal Balance without netting out the holdback reserve is 8.7%. In the case of Loan No. 24, the Cut-off Date Loan-to-Value Ratio, Maturity Date/ARD LTV and UW NOI Debt Yield are based on Cut-off Date Principal Balance after netting out a $12,000,000 holdback reserve. The Cut-off Date Loan-to-Value Ratio, Maturity Date/ARD LTV and UW NOI Debt Yield based on Cut-off Date Principal Balance without netting out the holdback reserve are 64.2%, 56.8% and 11.6%, respectively. |
| (5) | In the case of Loan Nos. 17 and 31, the Cut-off Date Loan-to-Value Ratio and Maturity/ARD Loan-to-Value Ratio are calculated by using an appraised value based on an as portfolio assumption. In the case of Loan No. 20, the Cut-off Date Loan-to-Value Ratio and the Maturity Date/ARD Loan-to-Value Ratio are calculated by using an as-is appraised value assuming a $500,000 capital reserve. In the case of Loan No. 26, the Cut-off Date Loan-to-Value Ratio and Maturity/ARD Loan-to-Value Ratio are calculated by using an appraised value based on an as complete assumption. In the case of Loan No. 28, the Cut-off Date Loan-to-Value Ratio and Maturity Date/ARD Loan-to-Value Ratio are calculated by using an appraised value based on a prospective leased fee appraised value for three of the mortgaged properties and a prospective as market appraised value for one of the mortgaged properties. Refer to “Description of the Mortgage Pool—Certain Calculations and Definitions—Appraised Value” in the Preliminary Prospectus for additional details. |
| THE INFORMATION IN THIS STRUCTURAL AND COLLATERAL TERM SHEET IS NOT COMPLETE AND MAY BE AMENDED PRIOR TO THE TIME OF SALE. THIS TERM SHEET IS NOT AN OFFER TO SELL THESE SECURITIES AND IT IS NOT A SOLICITATION OF AN OFFER TO BUY THESE SECURITIES IN ANY JURISDICTION WHERE THE OFFER OR SALE IS NOT PERMITTED. |
| | | |
| | 11 | |
| Structural and Collateral Term Sheet | | BMO 2022-C3 |
| |
| Collateral Characteristics |
| Mortgaged Properties by Location(1) |
| | | | | Weighted Average |
State | Number of Properties | Cut-off Date Principal Balance | % of IPB | UW
NCF DSCR(2)(3) | UW
NOI Debt Yield(2)(4) | Cut-off Date LTV(2)(4)(5) | Maturity Date/ARD LTV(2)(4)(5) |
| New York | 6 | $118,000,000 | 16.2 | % | 2.49x | 10.8% | 41.3% | 41.3% |
| New Jersey | 4 | 79,500,000 | 10.9 | | 2.28x | 12.3% | 52.9% | 51.2% |
| Florida | 6 | 66,061,299 | 9.1 | | 1.65x | 10.2% | 60.6% | 58.1% |
| Michigan | 13 | 57,659,144 | 7.9 | | 1.63x | 10.6% | 61.8% | 59.9% |
| Arizona | 5 | 54,579,900 | 7.5 | | 2.06x | 13.0% | 50.2% | 49.9% |
| Illinois | 8 | 45,745,483 | 6.3 | | 1.59x | 9.6% | 60.3% | 60.3% |
| Texas | 8 | 44,031,295 | 6.1 | | 1.35x | 9.8% | 52.8% | 46.8% |
| California | 4 | 39,895,000 | 5.5 | | 2.04x | 10.1% | 49.0% | 46.5% |
| Indiana | 1 | 37,000,000 | 5.1 | | 1.53x | 9.2% | 59.5% | 59.5% |
| Delaware | 1 | 34,966,340 | 4.8 | | 1.27x | 9.6% | 66.2% | 56.5% |
| Pennsylvania | 3 | 30,618,177 | 4.2 | | 1.69x | 10.6% | 54.3% | 54.3% |
| Virginia | 3 | 25,566,085 | 3.5 | | 2.36x | 12.0% | 57.0% | 53.4% |
| Tennessee | 6 | 19,730,787 | 2.7 | | 1.52x | 11.0% | 44.0% | 41.7% |
| Alabama | 9 | 18,382,440 | 2.5 | | 1.69x | 12.7% | 43.3% | 41.9% |
| Maryland | 1 | 17,750,000 | 2.4 | | 1.52x | 9.7% | 66.7% | 66.7% |
| North Carolina | 2 | 8,751,125 | 1.2 | | 1.40x | 8.6% | 57.8% | 51.5% |
| Louisiana | 2 | 8,005,100 | 1.1 | | 1.59x | 11.9% | 53.9% | 49.3% |
| Kentucky | 2 | 5,976,334 | 0.8 | | 1.56x | 9.8% | 60.1% | 60.1% |
| New Mexico | 1 | 5,500,000 | 0.8 | | 2.21x | 11.8% | 52.4% | 52.4% |
| Iowa | 1 | 3,774,000 | 0.5 | | 1.48x | 10.6% | 41.2% | 41.2% |
| Minnesota | 1 | 3,051,753 | 0.4 | | 1.59x | 9.4% | 68.1% | 68.1% |
| Nebraska | 1 | 1,437,482 | 0.2 | | 1.84x | 11.4% | 54.8% | 54.8% |
| Arkansas | 1 | 721,202 | 0.1 | | 1.59x | 9.4% | 68.1% | 68.1% |
| Total / Weighted Average: | 89 | $726,702,946 | 100.0 | % | 1.88x | 10.8% | 53.7% | 51.7% |
| (1) | Because this table presents information relating to the mortgaged properties and not mortgage loans, the information for mortgage loans secured by more than one mortgaged property is based on allocated loan amounts, individual appraised values, net cash flow or net operating income with respect to such individual mortgaged properties, as applicable. |
| (2) | In the case of Loan Nos. 1, 2, 3, 4, 8, 9, 10, 16, 17, 19, 20, 22, 23, 24, 25 and 30, the UW NCF DSCR, UW NOI Debt Yield, Cut-off Date LTV and Maturity Date/ARD LTV calculations include the related Pari Passu Companion Loan(s). In the case of Loan Nos. 1, 3 and 23, the UW NCF DSCR, UW NOI Debt Yield, Cut-off Date LTV and Maturity Date/ARD LTV calculations exclude the related Subordinate Companion Loans and/or related mezzanine loan. |
| (3) | For the mortgage loans that are interest-only for the entire term or until the anticipated repayment date and accrue interest on an Actual/360 basis, the Monthly Debt Service Amount ($) was calculated as 1/12th of the product of (i) the Original Balance ($), (ii) the Interest Rate % and (iii) 365/360. |
| (4) | In the case of Loan No. 4, the UW NOI Debt Yield is based on Cut-off Date Principal Balance after netting out a $5,000,000 holdback reserve. UW NOI Debt Yield based on Cut-off Date Principal Balance without netting out the holdback reserve is 9.8%. In the case of Loan No. 7, the Cut-off Date Loan-to-Value Ratio, Maturity Date/ARD LTV and UW NOI Debt Yield are based on Cut-off Date Principal Balance after netting out a $2,500,000 holdback reserve. The Cut-off Date Loan-to-Value Ratio, Maturity Date/ARD Loan-to-Value Ratio and UW NOI Debt Yield based on Cut-off Date Principal Balance without netting out the holdback reserve are 55.2%, 46.9% and 9.2%, respectively. In the case of Loan No. 14, the UW NOI Debt Yield is based on Cut-off Date Principal Balance after netting out a $920,000 holdback reserve. UW NOI Debt Yield based on Cut-off Date Principal Balance without netting out the holdback reserve is 8.7%. In the case of Loan No. 24, the Cut-off Date Loan-to-Value Ratio, Maturity Date/ARD LTV and UW NOI Debt Yield are based on Cut-off Date Principal Balance after netting out a $12,000,000 holdback reserve. The Cut-off Date Loan-to-Value Ratio, Maturity Date/ARD LTV and UW NOI Debt Yield based on Cut-off Date Principal Balance without netting out the holdback reserve are 64.2%, 56.8% and 11.6%, respectively. |
| (5) | In the case of Loan Nos. 17 and 31, the Cut-off Date Loan-to-Value Ratio and Maturity/ARD Loan-to-Value Ratio are calculated by using an appraised value based on an as portfolio assumption. In the case of Loan No. 20, the Cut-off Date Loan-to-Value Ratio and the Maturity Date/ARD Loan-to-Value Ratio are calculated by using an as-is appraised value assuming a $500,000 capital reserve. In the case of Loan No. 26, the Cut-off Date Loan-to-Value Ratio and Maturity/ARD Loan-to-Value Ratio are calculated by using an appraised value based on an as complete assumption. In the case of Loan No. 28, the Cut-off Date Loan-to-Value Ratio and Maturity Date/ARD Loan-to-Value Ratio are calculated by using an appraised value based on a prospective leased fee appraised value for three of the mortgaged properties and a prospective as market appraised value for one of the mortgaged properties. Refer to “Description of the Mortgage Pool—Certain Calculations and Definitions—Appraised Value” in the Preliminary Prospectus for additional details.
|
| THE INFORMATION IN THIS STRUCTURAL AND COLLATERAL TERM SHEET IS NOT COMPLETE AND MAY BE AMENDED PRIOR TO THE TIME OF SALE. THIS TERM SHEET IS NOT AN OFFER TO SELL THESE SECURITIES AND IT IS NOT A SOLICITATION OF AN OFFER TO BUY THESE SECURITIES IN ANY JURISDICTION WHERE THE OFFER OR SALE IS NOT PERMITTED. |
| | | |
| | 12 | |
| Structural and Collateral Term Sheet | | BMO 2022-C3 |
| |
| Collateral Characteristics |
| Cut-off Date Principal Balance |
| | | | | Weighted Average |
| Range of Cut-off Date Principal Balances | Number of Loans | Cut-off Date Principal Balance | % of IPB | Mortgage Rate | Remaining Loan Term | UW
NCF DSCR(1)(2) | UW
NOI
DY(1)(3) | Cut-off
Date LTV(1)(3)(4) | Maturity Date/ARD LTV(1)(3)(4) |
| $2,700,000 | - | $4,999,999 | 7 | | $24,186,532 | 3.3 | % | 4.97926% | 105 | 1.53x | 8.6% | 62.9% | 60.1% |
| $5,000,000 | - | $9,999,999 | 16 | | 107,690,205 | 14.8 | | 5.18881% | 114 | 1.94x | 11.4% | 55.8% | 52.6% |
| $10,000,000 | - | $19,999,999 | 8 | | 95,848,574 | 13.2 | | 4.90866% | 99 | 2.02x | 11.2% | 56.4% | 54.0% |
| $20,000,000 | - | $29,999,999 | 8 | | 186,820,000 | 25.7 | | 5.53587% | 118 | 1.87x | 10.9% | 56.2% | 56.2% |
| $30,000,000 | - | $37,500,000 | 9 | | 312,157,635 | 43.0 | | 5.46367% | 104 | 1.85x | 10.6% | 49.8% | 47.5% |
| Total / Weighted Average: | 48 | | $726,702,946 | 100.0 | % | 5.35217% | 108 | 1.88x | 10.8% | 53.7% | 51.7% |
| | | | | Weighted Average |
Range of
Mortgage Interest Rates | Number of Loans | Cut-off Date Principal Balance | % of IPB | Mortgage Rate | Remaining Loan Term | UW
NCF DSCR(1)(2) | UW
NOI
DY(1)(3) | Cut-off
Date LTV(1)(3)(4) | Maturity Date/ARD LTV(1)(3)(4) |
| 3.04000% | - | 3.49999% | 2 | $47,000,000 | 6.5 | % | 3.09106% | 55 | 3.92x | 12.3% | 33.0% | 33.0% |
| 3.50000% | - | 3.99999% | 7 | 64,770,000 | 8.9 | | 3.71691% | 107 | 2.26x | 8.9% | 59.3% | 58.7% |
| 4.00000% | - | 4.49999% | 4 | 22,590,106 | 3.1 | | 4.17401% | 70 | 1.76x | 10.6% | 64.8% | 60.0% |
| 4.50000% | - | 4.99999% | 2 | 45,400,000 | 6.2 | | 4.67262% | 68 | 2.41x | 11.8% | 37.8% | 36.5% |
| 5.00000% | - | 5.49999% | 6 | 60,365,000 | 8.3 | | 5.15334% | 113 | 1.95x | 11.1% | 49.5% | 47.9% |
| 5.50000% | - | 5.99999% | 17 | 279,479,120 | 38.5 | | 5.78836% | 119 | 1.67x | 11.0% | 57.6% | 56.3% |
| 6.00000% | - | 6.60000% | 10 | 207,098,720 | 28.5 | | 6.12356% | 119 | 1.46x | 10.5% | 54.8% | 51.3% |
| Total / Weighted Average: | 48 | $726,702,946 | 100.0 | % | 5.35217% | 108 | 1.88x | 10.8% | 53.7% | 51.7% |
| Original Term to Maturity in Months |
| | | | | Weighted Average |
Original Term to
Maturity in Months | Number of Loans | Cut-off Date Principal Balance | % of IPB | Mortgage Rate | Remaining Loan Term | UW
NCF DSCR(1)(2) | UW
NOI
DY(1)(3) | Cut-off
Date LTV(1)(3)(4) | Maturity Date/ARD LTV(1)(3)(4) |
| 60 | 5 | $99,599,700 | 13.7 | % | 3.83512% | 56 | 3.10x | 12.2% | 37.9% | 37.1% |
| 120 | 43 | 627,103,246 | 86.3 | | 5.59312% | 117 | 1.69x | 10.6% | 56.2% | 54.1% |
| Total / Weighted Average: | 48 | $726,702,946 | 100.0 | % | 5.35217% | 108 | 1.88x | 10.8% | 53.7% | 51.7% |
| Remaining Term to Maturity in Months |
| | | | | Weighted Average |
| Range of Remaining Term to Maturity in Months | Number of Loans | Cut-off Date Principal Balance | % of IPB | Mortgage Rate | Remaining Loan Term | UW
NCF DSCR(1)(2) | UW
NOI
DY(1)(3) | Cut-off
Date LTV(1)(3)(4) | Maturity Date/ARD LTV(1)(3)(4) |
| 49 | - | 60 | 5 | $99,599,700 | 13.7 | % | 3.83512% | 56 | 3.10x | 12.2% | 37.9% | 37.1% |
| 61 | - | 114 | 11 | 91,410,407 | 12.6 | | 4.04398% | 106 | 2.04x | 9.2% | 56.3% | 53.8% |
| 115 | - | 120 | 32 | 535,692,840 | 73.7 | | 5.85747% | 119 | 1.63x | 10.8% | 56.1% | 54.1% |
| Total / Weighted Average: | 48 | $726,702,946 | 100.0 | % | 5.35217% | 108 | 1.88x | 10.8% | 53.7% | 51.7% |
| (1) | In the case of Loan Nos. 1, 2, 3, 4, 8, 9, 10, 16, 17, 19, 20, 22, 23, 24, 25 and 30, the UW NCF DSCR, UW NOI Debt Yield, Cut-off Date LTV and Maturity Date/ARD LTV calculations include the related Pari Passu Companion Loan(s). In the case of Loan Nos. 1, 3 and 23, the UW NCF DSCR, UW NOI Debt Yield, Cut-off Date LTV and Maturity Date/ARD LTV calculations exclude the related Subordinate Companion Loans and/or mezzanine loans. |
| (2) | For the mortgage loans that are interest-only for the entire term or until the anticipated repayment date and accrue interest on an Actual/360 basis, the Monthly Debt Service Amount ($) was calculated as 1/12th of the product of (i) the Original Balance ($), (ii) the Interest Rate % and (iii) 365/360. |
| (3) | In the case of Loan No. 4, the UW NOI Debt Yield is based on Cut-off Date Principal Balance after netting out a $5,000,000 holdback reserve. UW NOI Debt Yield based on Cut-off Date Principal Balance without netting out the holdback reserve is 9.8%. In the case of Loan No. 7, the Cut-off Date Loan-to-Value Ratio, Maturity Date/ARD LTV and UW NOI Debt Yield are based on Cut-off Date Principal Balance after netting out a $2,500,000 holdback reserve. The Cut-off Date Loan-to-Value Ratio, Maturity Date/ARD Loan-to-Value Ratio and UW NOI Debt Yield based on Cut-off Date Principal Balance without netting out the holdback reserve are 55.2%, 46.9% and 9.2%, respectively. In the case of Loan No. 14, the UW NOI Debt Yield is based on Cut-off Date Principal Balance after netting out a $920,000 holdback reserve. UW NOI Debt Yield based on Cut-off Date Principal Balance without netting out the holdback reserve is 8.7%. In the case of Loan No. 24, the Cut-off Date Loan-to-Value Ratio, Maturity Date/ARD LTV and UW NOI Debt Yield are based on Cut-off Date Principal Balance after netting out a $12,000,000 holdback reserve. The Cut-off Date Loan-to-Value Ratio, Maturity Date/ARD LTV and UW NOI Debt Yield based on Cut-off Date Principal Balance without netting out the holdback reserve are 64.2%, 56.8% and 11.6%, respectively. |
| (4) | In the case of Loan Nos. 17 and 31, the Cut-off Date Loan-to-Value Ratio and Maturity/ARD Loan-to-Value Ratio are calculated by using an appraised value based on an as portfolio assumption. In the case of Loan No. 20, the Cut-off Date Loan-to-Value Ratio and the Maturity Date/ARD Loan-to-Value Ratio are calculated by using an as-is appraised value assuming a $500,000 capital reserve. In the case of Loan No. 26, the Cut-off Date Loan-to-Value Ratio and Maturity/ARD Loan-to-Value Ratio are calculated by using an appraised value based on an as complete assumption. In the case of Loan No. 28, the Cut-off Date Loan-to-Value Ratio and Maturity Date/ARD Loan-to-Value Ratio are calculated by using an appraised value based on a prospective leased fee appraised value for three of the mortgaged properties and a prospective as market appraised value for one of the mortgaged properties. Refer to “Description of the Mortgage Pool—Certain Calculations and Definitions—Appraised Value” in the Preliminary Prospectus for additional details. |
| THE INFORMATION IN THIS STRUCTURAL AND COLLATERAL TERM SHEET IS NOT COMPLETE AND MAY BE AMENDED PRIOR TO THE TIME OF SALE. THIS TERM SHEET IS NOT AN OFFER TO SELL THESE SECURITIES AND IT IS NOT A SOLICITATION OF AN OFFER TO BUY THESE SECURITIES IN ANY JURISDICTION WHERE THE OFFER OR SALE IS NOT PERMITTED. |
| | | |
| | 13 | |
| Structural and Collateral Term Sheet | | BMO 2022-C3 |
| |
| Collateral Characteristics |
Original Amortization Term in Months |
| | | | | Weighted Average |
Original
Amortization
Term in Months | Number of Loans | Cut-off Date Principal Balance | % of IPB | Mortgage Rate | Remaining Loan Term | UW
NCF DSCR(1)(2) | UW
NOI
DY(1)(3) | Cut-off
Date LTV(1)(3)(4) | Maturity Date/ARD LTV(1)(3)(4) |
| Interest Only | 32 | $532,025,000 | 73.2 | % | 5.23045% | 107 | 2.02x | 10.6% | 52.3% | 52.3% |
| 240 | 1 | 11,250,000 | 1.5 | | 5.26100% | 97 | 1.33x | 11.5% | 31.3% | 22.7% |
| 360 | 15 | 183,427,946 | 25.2 | | 5.71083% | 112 | 1.50x | 11.4% | 58.8% | 51.8% |
| Total / Weighted Average: | 48 | $726,702,946 | 100.0 | % | 5.35217% | 108 | 1.88x | 10.8% | 53.7% | 51.7% |
| Remaining Amortization Term in Months |
| | | | | Weighted Average |
| Range of Remaining Amortization Term in Months | Number of Loans | Cut-off Date Principal Balance | % of IPB | Mortgage Rate | Remaining Loan Term | UW
NCF DSCR(1)(2) | UW
NOI
DY(1)(3) | Cut-off
Date LTV(1)(3)(4) | Maturity Date/ARD LTV(1)(3)(4) |
| Interest Only | 32 | $532,025,000 | 73.2 | % | 5.23045% | 107 | 2.02x | 10.6% | 52.3% | 52.3% |
| 240 | 1 | 11,250,000 | 1.5 | | 5.26100% | 97 | 1.33x | 11.5% | 31.3% | 22.7% |
| 344 | - | 360 | 15 | 183,427,946 | 25.2 | | 5.71083% | 112 | 1.50x | 11.4% | 58.8% | 51.8% |
| Total / Weighted Average: | 48 | $726,702,946 | 100.0 | % | 5.35217% | 108 | 1.88x | 10.8% | 53.7% | 51.7% |
| | | | | Weighted Average |
| Amortization Types | Number of Loans | Cut-off Date Principal Balance | % of IPB | Mortgage Rate | Remaining Loan Term | UW
NCF DSCR(1)(2) | UW
NOI
DY(1)(3) | Cut-off
Date LTV(1)(3)(4) | Maturity Date/ARD LTV(1)(3)(4) |
| Interest Only | 32 | $532,025,000 | 73.2 | % | 5.23045% | 107 | 2.02x | 10.6% | 52.3% | 52.3% |
| Amortizing Balloon | 7 | 100,642,946 | 13.8 | | 5.78800% | 108 | 1.41x | 10.7% | 60.5% | 52.1% |
| Interest Only, Amortizing Balloon | 9 | 94,035,000 | 12.9 | | 5.57442% | 115 | 1.58x | 12.1% | 53.8% | 48.0% |
| Total / Weighted Average: | 48 | $726,702,946 | 100.0 | % | 5.35217% | 108 | 1.88x | 10.8% | 53.7% | 51.7% |
| Underwritten Net Cash Flow Debt Service Coverage Ratios(1)(2) |
| | | | | Weighted Average |
| Range of Underwritten Net Cash Flow Debt Service Coverage Ratios | Number of Loans | Cut-off Date Principal Balance | % of IPB | Mortgage Rate | Remaining Loan Term | UW
NCF DSCR(1)(2) | UW
NOI
DY(1)(3) | Cut-off
Date LTV(1)(3)(4) | Maturity Date/ARD LTV(1)(3)(4) |
| 1.21x | - | 1.59x | 22 | $333,029,167 | 45.8 | % | 5.84327% | 117 | 1.43x | 9.9% | 57.0% | 53.9% |
| 1.60x | - | 1.69x | 6 | 116,794,120 | 16.1 | | 5.76330% | 119 | 1.63x | 10.8% | 55.3% | 53.8% |
| 1.70x | - | 1.79x | 1 | 27,500,000 | 3.8 | | 6.17000% | 118 | 1.71x | 10.7% | 53.1% | 53.1% |
| 1.80x | - | 1.89x | 2 | 18,921,085 | 2.6 | | 6.04275% | 118 | 1.85x | 13.5% | 61.3% | 56.4% |
| 1.90x | - | 1.99x | 2 | 16,638,574 | 2.3 | | 4.12894% | 69 | 1.94x | 11.6% | 64.2% | 60.5% |
| 2.00x | - | 2.99x | 13 | 166,820,000 | 23.0 | | 4.62986% | 101 | 2.40x | 11.7% | 49.9% | 49.7% |
| 3.00x | - | 3.99x | 1 | 37,000,000 | 5.1 | | 3.04000% | 56 | 3.61x | 11.1% | 33.3% | 33.3% |
| 4.00x | - | 5.08x | 1 | 10,000,000 | 1.4 | | 3.28000% | 52 | 5.08x | 16.9% | 31.8% | 31.8% |
| Total / Weighted Average: | 48 | $726,702,946 | 100.0 | % | 5.35217% | 108 | 1.88x | 10.8% | 53.7% | 51.7% |
| (1) | In the case of Loan Nos. 1, 2, 3, 4, 8, 9, 10, 16, 17, 19, 20, 22, 23, 24, 25 and 30, the UW NCF DSCR, UW NOI Debt Yield, Cut-off Date LTV and Maturity Date/ARD LTV calculations include the related Pari Passu Companion Loan(s). In the case of Loan Nos. 1, 3 and 23, the UW NCF DSCR, UW NOI Debt Yield, Cut-off Date LTV and Maturity Date/ARD LTV calculations exclude the related Subordinate Companion Loans and/or mezzanine loans. |
| (2) | For the mortgage loans that are interest-only for the entire term or until the anticipated repayment date and accrue interest on an Actual/360 basis, the Monthly Debt Service Amount ($) was calculated as 1/12th of the product of (i) the Original Balance ($), (ii) the Interest Rate % and (iii) 365/360. |
| (3) | In the case of Loan No. 4, the UW NOI Debt Yield is based on Cut-off Date Principal Balance after netting out a $5,000,000 holdback reserve. UW NOI Debt Yield based on Cut-off Date Principal Balance without netting out the holdback reserve is 9.8%. In the case of Loan No. 7, the Cut-off Date Loan-to-Value Ratio, Maturity Date/ARD LTV and UW NOI Debt Yield are based on Cut-off Date Principal Balance after netting out a $2,500,000 holdback reserve. The Cut-off Date Loan-to-Value Ratio, Maturity Date/ARD Loan-to-Value Ratio and UW NOI Debt Yield based on Cut-off Date Principal Balance without netting out the holdback reserve are 55.2%, 46.9% and 9.2%, respectively. In the case of Loan No. 14, the UW NOI Debt Yield is based on Cut-off Date Principal Balance after netting out a $920,000 holdback reserve. UW NOI Debt Yield based on Cut-off Date Principal Balance without netting out the holdback reserve is 8.7%. In the case of Loan No. 24, the Cut-off Date Loan-to-Value Ratio, Maturity Date/ARD LTV and UW NOI Debt Yield are based on Cut-off Date Principal Balance after netting out a $12,000,000 holdback reserve. The Cut-off Date Loan-to-Value Ratio, Maturity Date/ARD LTV and UW NOI Debt Yield based on Cut-off Date Principal Balance without netting out the holdback reserve are 64.2%, 56.8% and 11.6%, respectively. |
| (4) | In the case of Loan Nos. 17 and 31, the Cut-off Date Loan-to-Value Ratio and Maturity/ARD Loan-to-Value Ratio are calculated by using an appraised value based on an as portfolio assumption. In the case of Loan No. 20, the Cut-off Date Loan-to-Value Ratio and the Maturity Date/ARD Loan-to-Value Ratio are calculated by using an as-is appraised value assuming a $500,000 capital reserve. In the case of Loan No. 26, the Cut-off Date Loan-to-Value Ratio and Maturity/ARD Loan-to-Value Ratio are calculated by using an appraised value based on an as complete assumption. In the case of Loan No. 28, the Cut-off Date Loan-to-Value Ratio and Maturity Date/ARD Loan-to-Value Ratio are calculated by using an appraised value based on a prospective leased fee appraised value for three of the mortgaged properties and a prospective as market appraised value for one of the mortgaged properties. Refer to “Description of the Mortgage Pool—Certain Calculations and Definitions—Appraised Value” in the Preliminary Prospectus for additional details. |
| THE INFORMATION IN THIS STRUCTURAL AND COLLATERAL TERM SHEET IS NOT COMPLETE AND MAY BE AMENDED PRIOR TO THE TIME OF SALE. THIS TERM SHEET IS NOT AN OFFER TO SELL THESE SECURITIES AND IT IS NOT A SOLICITATION OF AN OFFER TO BUY THESE SECURITIES IN ANY JURISDICTION WHERE THE OFFER OR SALE IS NOT PERMITTED. |
| | | |
| | 14 | |
| Structural and Collateral Term Sheet | | BMO 2022-C3 |
| |
| Collateral Characteristics |
| LTV Ratios as of the Cut-off Date(1)(3)(4) |
| | | | | Weighted Average |
Range of
Cut-off Date LTVs | Number of Loans | Cut-off Date Principal Balance | % of IPB | Mortgage Rate | Remaining Loan Term | UW
NCF DSCR(1)(2) | UW
NOI
DY(1)(3) | Cut-off
Date LTV(1)(3)(4) | Maturity Date/ARD LTV(1)(3)(4) |
| 31.3% | - | 49.9% | 9 | $173,145,000 | 23.8 | % | 4.82380% | 87 | 2.46x | 11.7% | 37.1% | 36.4% |
| 50.0% | - | 59.9% | 20 | 340,515,415 | 46.9 | | 5.65415% | 118 | 1.74x | 11.0% | 54.6% | 52.9% |
| 60.0% | - | 64.9% | 7 | 61,165,407 | 8.4 | | 4.57871% | 111 | 1.88x | 9.1% | 62.2% | 60.7% |
| 65.0% | - | 68.6% | 12 | 151,877,125 | 20.9 | | 5.58898% | 111 | 1.53x | 9.9% | 66.9% | 63.1% |
| Total / Weighted Average: | 48 | $726,702,946 | 100.0 | % | 5.35217% | 108 | 1.88x | 10.8% | 53.7% | 51.7% |
| LTV Ratios as of the Maturity Date(1)(3)(4) |
| | | | | Weighted Average |
Range of
Maturity Date LTVs | Number of Loans | Cut-off Date Principal Balance | % of IPB | Mortgage Rate | Remaining Loan Term | UW
NCF DSCR(1)(2) | UW
NOI
DY(1)(3) | Cut-off
Date LTV(1)(3)(4) | Maturity Date/ARD LTV(1)(3)(4) |
| 22.7% | - | 49.9% | 13 | $226,630,415 | 31.2 | % | 5.04351% | 94 | 2.19x | 11.6% | 40.4% | 38.0% |
| 50.0% | - | 59.9% | 21 | 348,837,831 | 48.0 | | 5.68727% | 118 | 1.75x | 10.9% | 57.2% | 55.0% |
| 60.0% | - | 64.9% | 8 | 69,764,700 | 9.6 | | 4.53022% | 98 | 1.89x | 9.7% | 63.4% | 62.0% |
| 65.0% | - | 68.6% | 6 | 81,470,000 | 11.2 | | 5.47985% | 116 | 1.58x | 9.1% | 67.2% | 67.2% |
| Total / Weighted Average: | 48 | $726,702,946 | 100.0 | % | 5.35217% | 108 | 1.88x | 10.8% | 53.7% | 51.7% |
| | | | | Weighted Average |
| Prepayment Protection | Number of Loans | Cut-off Date Principal Balance | % of IPB | Mortgage Rate | Remaining Loan Term | UW
NCF DSCR(1)(2) | UW
NOI
DY(1)(3) | Cut-off
Date LTV(1)(3)(4) | Maturity Date/ARD LTV(1)(3)(4) |
| Defeasance | 32 | $599,886,545 | 82.5 | % | 5.41441% | 109 | 1.93x | 10.9% | 53.6% | 52.3% |
| Yield Maintenance | 14 | 109,566,401 | 15.1 | | 4.93916% | 103 | 1.63x | 10.0% | 53.8% | 48.6% |
| Defeasance or Yield Maintenance | 2 | 17,250,000 | 2.4 | | 5.81114% | 118 | 1.79x | 12.2% | 54.8% | 53.3% |
| Total / Weighted Average: | 48 | $726,702,946 | 100.0 | % | 5.35217% | 108 | 1.88x | 10.8% | 53.7% | 51.7% |
| | | | | Weighted Average |
| Loan Purpose | Number of Loans | Cut-off Date Principal Balance | % of IPB | Mortgage Rate | Remaining Loan Term | UW
NCF DSCR(1)(2) | UW
NOI
DY(1)(3) | Cut-off
Date LTV(1)(3)(4) | Maturity Date/ARD LTV(1)(3)(4) |
| Refinance | 35 | $525,653,965 | 72.3 | % | 5.30616% | 108 | 1.92x | 11.0% | 51.7% | 49.4% |
| Acquisition | 10 | 131,528,981 | 18.1 | | 5.28613% | 106 | 1.91x | 10.8% | 57.4% | 55.9% |
| Recapitalization | 3 | 69,520,000 | 9.6 | | 5.82506% | 119 | 1.49x | 9.2% | 61.7% | 61.7% |
| Total / Weighted Average: | 48 | $726,702,946 | 100.0 | % | 5.35217% | 108 | 1.88x | 10.8% | 53.7% | 51.7% |
| (1) | In the case of Loan Nos. 1, 2, 3, 4, 8, 9, 10, 16, 17, 19, 20, 22, 23, 24, 25 and 30, the UW NCF DSCR, UW NOI Debt Yield, Cut-off Date LTV and Maturity Date/ARD LTV calculations include the related Pari Passu Companion Loan(s). In the case of Loan Nos. 1, 3 and 23, the UW NCF DSCR, UW NOI Debt Yield, Cut-off Date LTV and Maturity Date/ARD LTV calculations exclude the related Subordinate Companion Loans and/or mezzanine loans. |
| (2) | For the mortgage loans that are interest-only for the entire term or until the anticipated repayment date and accrue interest on an Actual/360 basis, the Monthly Debt Service Amount ($) was calculated as 1/12th of the product of (i) the Original Balance ($), (ii) the Interest Rate % and (iii) 365/360. |
| (3) | In the case of Loan No. 4, the UW NOI Debt Yield is based on Cut-off Date Principal Balance after netting out a $5,000,000 holdback reserve. UW NOI Debt Yield based on Cut-off Date Principal Balance without netting out the holdback reserve is 9.8%. In the case of Loan No. 7, the Cut-off Date Loan-to-Value Ratio, Maturity Date/ARD LTV and UW NOI Debt Yield are based on Cut-off Date Principal Balance after netting out a $2,500,000 holdback reserve. The Cut-off Date Loan-to-Value Ratio, Maturity Date/ARD Loan-to-Value Ratio and UW NOI Debt Yield based on Cut-off Date Principal Balance without netting out the holdback reserve are 55.2%, 46.9% and 9.2%, respectively. In the case of Loan No. 14, the UW NOI Debt Yield is based on Cut-off Date Principal Balance after netting out a $920,000 holdback reserve. UW NOI Debt Yield based on Cut-off Date Principal Balance without netting out the holdback reserve is 8.7%. In the case of Loan No. 24, the Cut-off Date Loan-to-Value Ratio, Maturity Date/ARD LTV and UW NOI Debt Yield are based on Cut-off Date Principal Balance after netting out a $12,000,000 holdback reserve. The Cut-off Date Loan-to-Value Ratio, Maturity Date/ARD LTV and UW NOI Debt Yield based on Cut-off Date Principal Balance without netting out the holdback reserve are 64.2%, 56.8% and 11.6%, respectively. |
| (4) | In the case of Loan Nos. 17 and 31, the Cut-off Date Loan-to-Value Ratio and Maturity/ARD Loan-to-Value Ratio are calculated by using an appraised value based on an as portfolio assumption. In the case of Loan No. 20, the Cut-off Date Loan-to-Value Ratio and the Maturity Date/ARD Loan-to-Value Ratio are calculated by using an as-is appraised value assuming a $500,000 capital reserve. In the case of Loan No. 26, the Cut-off Date Loan-to-Value Ratio and Maturity/ARD Loan-to-Value Ratio are calculated by using an appraised value based on an as complete assumption. In the case of Loan No. 28, the Cut-off Date Loan-to-Value Ratio and Maturity Date/ARD Loan-to-Value Ratio are calculated by using an appraised value based on a prospective leased fee appraised value for three of the mortgaged properties and a prospective as market appraised value for one of the mortgaged properties. Refer to “Description of the Mortgage Pool—Certain Calculations and Definitions—Appraised Value” in the Preliminary Prospectus for additional details. |
| THE INFORMATION IN THIS STRUCTURAL AND COLLATERAL TERM SHEET IS NOT COMPLETE AND MAY BE AMENDED PRIOR TO THE TIME OF SALE. THIS TERM SHEET IS NOT AN OFFER TO SELL THESE SECURITIES AND IT IS NOT A SOLICITATION OF AN OFFER TO BUY THESE SECURITIES IN ANY JURISDICTION WHERE THE OFFER OR SALE IS NOT PERMITTED. |
| | | |
| | 15 | |
| Structural and Collateral Term Sheet | | BMO 2022-C3 |
| |
| Collateral Characteristics |
| Previous Securitization History(1) |
| No. | Mortgage Loan Seller | Loan/Property Name | Location | Property Type | Cut-off Date Principal Balance | % of IPB | Previous Securitization |
| 1 | BMO, SMC | Park West Village | New York, NY | Multifamily | $37,500,000 | 5.2% | UBS 2017-C2, UBS 2017-C3, UBS 2017-C4 |
| 2 | BMO | Kingston Square Apartments | Indianapolis, IN | Multifamily | $37,000,000 | 5.1% | ARCLO 2021-FL2 |
| 3.01 | BMO | Yorkshire Towers | New York, NY | Multifamily | $31,841,719 | 4.4% | CSAIL 2017-CX10, UBSCM 2017-C5, UBSCM 2017-C6, CCUBS 2017-C1, UBSCM 2018-C8, CSAIL 2018-CX11 |
| 3.02 | BMO | Lexington Towers | New York, NY | Multifamily | $5,158,281 | 0.7% | CSAIL 2017-CX10, UBSCM 2017-C5, UBSCM 2017-C6, CCUBS 2017-C1, UBSCM 2018-C8, CSAIL 2018-CX11 |
| 6 | LMF | Center Pointe Plaza I | Newark, DE | Retail | $34,966,340 | 4.8% | COMM 2013-CR10 |
| 9 | CREFI | Wells Fargo Center Tampa | Tampa, FL | Office | $30,000,000 | 4.1% | JPMBB 2014-C26 |
| 11 | CREFI | Lakes Medical Center | West Bloomfield, MI | Office | $27,000,000 | 3.7% | COMM 2014-CR19 |
| 13 | BMO | ACME Mahwah | Mahwah, NJ | Retail | $23,000,000 | 3.2% | GSMS 2013-GC12 |
| 15.01 | CREFI | Home2 Suites by Hilton Phoenix Airport North | Phoenix, AZ | Hospitality | $13,000,000 | 1.8% | LMREC 2021-CRE4 |
| 18 | BMO | Rising Sun Towne Centre | Rising Sun, MD | Retail | $17,750,000 | 2.4% | CCUBS 2017-C1 |
| 23 | BMO | 111 River Street | Hoboken, NJ | Office | $10,000,000 | 1.4% | HAMLET 2020-CRE1 |
| 32 | BMO | Bella Vista Village | San Tan Valley, AZ | Retail | $6,500,000 | 0.9% | UBSBB 2012-C4 |
| 36 | Sabal | Super Mini Storage | Sacramento, CA | Self Storage | $5,500,000 | 0.8% | WFCM 2014-LC18 |
| (1) | The table above represents the properties for which the previously existing debt was most recently securitized, based on information provided by the related borrower or obtained through searches of a third-party database. |
| THE INFORMATION IN THIS STRUCTURAL AND COLLATERAL TERM SHEET IS NOT COMPLETE AND MAY BE AMENDED PRIOR TO THE TIME OF SALE. THIS TERM SHEET IS NOT AN OFFER TO SELL THESE SECURITIES AND IT IS NOT A SOLICITATION OF AN OFFER TO BUY THESE SECURITIES IN ANY JURISDICTION WHERE THE OFFER OR SALE IS NOT PERMITTED. |
| | | |
| | 16 | |
| Structural and Collateral Term Sheet | | BMO 2022-C3 |
| |
| Class A-2 and Class A-3(1) |
Class A-2
No. | Loan Name | Location | Cut-off Date Balance | % of IPB | Maturity Date Balance | % of Certificate Class(2) | Original Loan Term | Remaining Loan Term | UW NCF DSCR | UW NOI Debt Yield | Cut-off Date LTV | Maturity Date/ARD LTV |
| 1 | Park West Village | New York, NY | $37,500,000 | 5.2% | $37,500,000 | 38.2% | 60 | 58 | 2.60x | 12.3% | 32.6% | 32.6% |
| 3 | Yorkshire & Lexington Towers | New York, NY | $37,000,000 | 5.1% | $37,000,000 | 37.7% | 60 | 56 | 3.61x | 11.1% | 33.3% | 33.3% |
| 20 | Lakeshore Marketplace | Norton Shores, MI | $11,848,574 | 1.6% | $10,904,861 | 11.1% | 60 | 51 | 1.93x | 12.8% | 66.0% | 60.8% |
| 23 | 111 River Street | Hoboken, NJ | $10,000,000 | 1.4% | $10,000,000 | 10.2% | 60 | 52 | 5.08x | 16.9% | 31.8% | 31.8% |
| 45 | Greenhaven Townhouses | Charlotte, NC | $3,251,125 | 0.4% | $3,009,867 | 3.1% | 60 | 49 | 1.22x | 7.8% | 68.4% | 63.4% |
| Total / Weighted Average: | | $99,599,700 | 13.7% | $98,414,728 | 100.4% | 60 | 56 | 3.10x | 12.2% | 37.9% | 37.1% |
| (1) | The table above presents the mortgage loans whose balloon payments would be applied to pay down the certificate balances of the Class A-2 Certificates, assuming a 0% CPR and applying the “Modeling Assumptions” described in the Preliminary Prospectus, including the assumptions that (i) none of the mortgage loans in the pool experience prepayments, defaults or losses; (ii) there are no extensions of maturity dates of any mortgage loans in the pool; and (iii) each mortgage loan in the pool is paid in full on its stated maturity date. Each Class of Certificates, including the Class A-2 Certificates, evidences undivided ownership interests in the entire pool of mortgage loans. Debt service coverage ratio, debt yield and loan-to-value ratio information does not take into account subordinate debt (whether or not secured by the mortgaged property), if any, that is allowed under the terms of any mortgage loans. See Annex A-1 to the Preliminary Prospectus. |
| (2) | Reflects the percentage equal to the Percentage of the Maturity Date Balance divided by the initial Class A-2 Certificate Balance. |
Class A-3
No. | Loan Name | Location | Cut-off Date Balance | % of IPB | Maturity Date Balance | % of Certificate Class(2) | Original Loan Term | Remaining Loan Term | UW NCF DSCR | UW NOI Debt Yield | Cut-off Date LTV | Maturity Date/ARD LTV |
| 21 | Union and Chapin Industrial | Montebello, CA | $11,250,000 | 1.5% | $8,163,908 | 61.3% | 120 | 97 | 1.33x | 11.5% | 31.3% | 22.7% |
| 39 | LaGrange Pointe | La Grange, IL | $5,450,000 | 0.7% | $5,450,000 | 40.9% | 120 | 89 | 2.28x | 9.3% | 64.9% | 64.9% |
| Total / Weighted Average: | | $16,700,000 | 2.3% | $13,613,908 | 102.2% | 120 | 94 | 1.64x | 10.8% | 42.3% | 36.5% |
| (1) | The table above presents the mortgage loan whose balloon payment would be applied to pay down the certificate balance of the Class A-3 Certificates, assuming a 0% CPR and applying the “Modeling Assumptions” described in the Preliminary Prospectus, including the assumptions that (i) none of the mortgage loans in the pool experience prepayments, defaults or losses; (ii) there are no extensions of maturity dates of any mortgage loans in the pool; and (iii) each mortgage loan in the pool is paid in full on its stated maturity date. Each Class of Certificates, including the Class A-3 Certificates, evidences undivided ownership interests in the entire pool of mortgage loans. Debt service coverage ratio, debt yield and loan-to-value ratio information does not take into account subordinate debt (whether or not secured by the mortgaged property), if any, that is allowed under the terms of any mortgage loan. See Annex A-1 to the Preliminary Prospectus. |
| (2) | Reflects the percentage equal to the Percentage of the Maturity Date Balance divided by the initial Class A-3 Certificate Balance. |
| THE INFORMATION IN THIS STRUCTURAL AND COLLATERAL TERM SHEET IS NOT COMPLETE AND MAY BE AMENDED PRIOR TO THE TIME OF SALE. THIS TERM SHEET IS NOT AN OFFER TO SELL THESE SECURITIES AND IT IS NOT A SOLICITATION OF AN OFFER TO BUY THESE SECURITIES IN ANY JURISDICTION WHERE THE OFFER OR SALE IS NOT PERMITTED. |
| | | |
| | 17 | |
| Structural and Collateral Term Sheet | | BMO 2022-C3 |
| |
| Structural Overview |
| ■ Certificates: | | The “Certificates” will consist of the Class A-1, Class A-2, Class A-3, Class A-4, Class A-5, Class A-SB, Class X-A, Class X-B, Class X-D, Class X-E, Class A-S, Class B, Class C, Class D, Class E, Class F-RR, Class G-RR, Class J-RR, Class K-RR and Class R certificates. The Certificates are also referred to as the “Non-Vertically Retained Certificates”. The Class A-1, Class A-2, Class A-3, Class A-4, Class A-5, Class A-SB, Class A-S, Class B, Class C, Class D, Class E, Class F-RR, Class G-RR, Class J-RR and Class K-RR certificates are collectively referred to as the “Principal Balance Certificates” or the “Non-Vertically Retained Principal Balance Certificates”. The Class X-A, Class X-B, Class X-D and Class X-E certificates are collectively referred to as the “Class X Certificates”. |
| ■ Accrual: | | Each Class of Certificates (other than the Class R Certificates) will accrue interest on a 30/360 basis. The Class R Certificates will not accrue interest. |
| ■ Allocation Between Combined VRR Interest and Non-Vertically Retained Certificates: | | The aggregate amount available for distribution to holders of the Non-Vertically Retained Certificates and the Combined VRR Interest on each distribution date will be: (i) the gross amount of interest, principal, yield maintenance charges and prepayment premiums collected with respect to the mortgage loans in the applicable one-month collection period, net of specified expenses of the issuing entity, including fees payable therefrom to, and losses, liabilities, advances (with interest thereon), costs and expenses reimbursable or indemnifiable therefrom to, the master servicer, the special servicer, the certificate administrator, the trustee, the operating advisor, the asset representations reviewer and CREFC®; and (ii) allocated to amounts available for distribution to the holders of the Combined VRR Interest, on the one hand, and amounts available for distribution to the holders of the Non-Vertically Retained Certificates (exclusive of the Class R certificates), on the other hand. On each distribution date, the portion of such aggregate available funds allocable to: (a) the Combined VRR Interest will be the product of such aggregate available funds multiplied by the Vertically Retained Percentage; and (b) the Non-Vertically Retained Certificates (exclusive of the Class R certificates) will at all times be the product of such aggregate available funds multiplied by the Non-Vertically Retained Percentage. See “Credit Risk Retention” and “Description of the Certificates” in the Preliminary Prospectus. The “Vertically Retained Percentage” is a fraction, expressed as a percentage, the numerator of which is the initial principal balance of the Combined VRR Interest, and the denominator of which is the sum of (x) the aggregate initial certificate balance of all classes of Non-Vertically Retained Principal Balance Certificates and (y) the initial principal balance of the Combined VRR Interest. The “Non-Vertically Retained Percentage” is the difference between 100% and the Vertically Retained Percentage. |
| ■ Distributions: | | On each Distribution Date, funds available for distribution to holders of the Non-Vertically Retained Certificates (exclusive of any portion thereof that represents the Non-Vertically Retained Percentage of (i) any yield maintenance charges and prepayment premiums collected on the mortgage loans and/or (ii) any excess interest accrued after the related anticipated repayment date on any mortgage loan with an anticipated repayment date) (“Non-Vertically Retained Available Funds”) will be distributed in the following amounts and order of priority (in each case to the extent of remaining available funds): 1. Class A-1, Class A-2, Class A-3, Class A-4, Class A-5, Class A-SB, Class X-A, Class X-B, Class X-D and Class X-E certificates: to interest on the Class A-1, Class A-2, Class A-3, Class A-4, Class A-5, Class A-SB, Class X-A, Class X-B, Class X-D and Class X-E certificates, up to, and pro rata in accordance with, their respective interest entitlements. 2. Class A-1, Class A-2, Class A-3, Class A-4, Class A-5 and Class A-SB certificates: to the extent of Non-Vertically Retained Available Funds allocable to principal received or advanced on the mortgage loans, (i) to principal on the Class A-SB certificates until their certificate balance is reduced to the Class A-SB scheduled principal balance set forth in Annex F to the Preliminary Prospectus for the relevant Distribution Date, then (ii) to principal on the Class A-1 certificates until their certificate balance is reduced to zero, all funds available for distribution of principal remaining after the distributions to the Class A-SB certificates in clause (i) above, then (iii) to principal on the Class A-2 certificates until their certificate balance is reduced to zero, all funds available for distribution of principal remaining after the distributions to the Class A-1 certificates in clause (ii) above, then (iv) to principal on the Class A-3 certificates until their certificate balance is reduced to zero, all funds available for distribution of principal remaining after the distributions to the Class A-2 certificates in clause (iii) above, then (v) to principal on the Class A-4 certificates until their certificate balance is reduced to zero, all funds available for distribution of principal remaining after the distributions to the Class A-3 certificates in clause (iv) above, then (vi) to principal on the Class A-5 certificates until their certificate balance is reduced to zero, all funds available for distribution of principal remaining after the distributions to the Class A-4 certificates in clause (v) above and then (vii) to principal on the Class A-SB certificates until their certificate |
| THE INFORMATION IN THIS STRUCTURAL AND COLLATERAL TERM SHEET IS NOT COMPLETE AND MAY BE AMENDED PRIOR TO THE TIME OF SALE. THIS TERM SHEET IS NOT AN OFFER TO SELL THESE SECURITIES AND IT IS NOT A SOLICITATION OF AN OFFER TO BUY THESE SECURITIES IN ANY JURISDICTION WHERE THE OFFER OR SALE IS NOT PERMITTED. |
| | | |
| | 18 | |
| Structural and Collateral Term Sheet | | BMO 2022-C3 |
| |
| Structural Overview |
| | balance is reduced to zero, all funds available for distribution of principal remaining after the distributions to the Class A-5 certificates in clause (vi) above. However, if the certificate balances of each and every class of the Class A-S, Class B, Class C, Class D, Class E, Class F-RR, Class G-RR, Class J-RR and Class K-RR certificates have been reduced to zero as a result of the allocation of mortgage loan losses and other unanticipated expenses to those certificates, then Non-Vertically Retained Available Funds allocable to principal will be distributed to the Class A-1, Class A-2, Class A-3, Class A-4, Class A-5 and Class A-SB certificates, pro rata, based on their respective certificate balances (and the schedule for the Class A-SB principal distributions will be disregarded). 3. Class A-1, Class A-2, Class A-3, Class A-4, Class A-5 and Class A-SB certificates: to reimburse the Class A-1, Class A-2, Class A-3, Class A-4, Class A-5 and Class A-SB certificates, pro rata, for any unreimbursed losses on the mortgage loans that were previously allocated to reduce the certificate balances of those classes, together with interest at their respective pass-through rates. 4. Class A-S certificates: (i) first, to interest on the Class A-S certificates in the amount of their interest entitlement; (ii) next, to the extent of Non-Vertically Retained Available Funds allocable to principal remaining after distributions in respect of principal to each class of Non-Vertically Retained Principal Balance Certificates with a higher principal payment priority (in this case, the Class A-1, Class A-2, Class A-3, Class A-4, Class A-5 and Class A-SB certificates), to principal on the Class A-S certificates until their certificate balance is reduced to zero; and (iii) next, to reimburse the Class A-S certificates for any unreimbursed losses on the mortgage loans that were previously allocated to reduce the certificate balance of that class, together with interest at its pass-through rate. 5. Class B certificates: (i) first, to interest on the Class B certificates in the amount of their interest entitlement; (ii) next, to the extent of Non-Vertically Retained Available Funds allocable to principal remaining after distributions in respect of principal to each class of Non-Vertically Retained Principal Balance Certificates with a higher principal payment priority (in this case, the Class A-1, Class A-2, Class A-3, Class A-4, Class A-5, Class A-SB and Class A-S certificates), to principal on the Class B certificates until their certificate balance is reduced to zero; and (iii) next, to reimburse Class B certificates for any unreimbursed losses on the mortgage loans that were previously allocated to reduce the certificate balance of that class, together with interest at its pass-through rate. 6. Class C certificates: (i) first, to interest on the Class C certificates in the amount of their interest entitlement; (ii) next, to the extent of Non-Vertically Retained Available Funds allocable to principal remaining after distributions in respect of principal to each class of Non-Vertically Retained Principal Balance Certificates with a higher principal payment priority (in this case, the Class A-1, Class A-2, Class A-3, Class A-4, Class A-5, Class A-SB, Class A-S and Class B certificates), to principal on the Class C certificates until their certificate balance is reduced to zero; and (iii) next, to reimburse the Class C certificates for any unreimbursed losses on the mortgage loans that were previously allocated to reduce the certificate balance of that class, together with interest at its pass-through rate. 7. After the Class A-1, Class A-2, Class A-3, Class A-4, Class A-5, Class A-SB, Class X-A, Class X-B, Class X-D, Class X-E, Class A-S, Class B and Class C certificates are paid all amounts to which they are entitled on such Distribution Date, the remaining Non-Vertically Retained Available Funds will be used to pay interest and principal and to reimburse (with interest) any unreimbursed losses to the Class D, Class E, Class F-RR, Class G-RR, Class J-RR and Class K-RR certificates, sequentially in that order and with respect to each such class in a manner analogous to the Class C certificates pursuant to clause 6 above. |
■ Realized Losses: | | The certificate balances of the Non-Vertically Retained Principal Balance Certificates will each be reduced without distribution on any Distribution Date as a write-off to the extent of any loss realized on the mortgage loans allocated to the related class on such Distribution Date. On each Distribution Date, the Non-Vertically Retained Percentage of any such losses will be applied to the respective classes of Non-Vertically Retained Principal Balance Certificates in the following order, in each case until the related certificate balance is reduced to zero: first to the Class K-RR certificates, second, to the Class J-RR certificates; third, to the Class G-RR certificates; fourth, to the Class F-RR certificates; fifth, to the Class E certificates; sixth, to the Class D certificates; seventh, to the Class C certificates; eighth, to the Class B certificates; ninth, to the Class A-S certificates; and, finally pro rata, to the Class A-1, Class A-2, Class A-3, Class A-4, Class A-5 and Class A-SB certificates, based on their then current respective certificate balances. The notional amount of each class of Class X Certificates will be reduced to reflect reductions in the certificate balance(s) of the class (or classes, as applicable) of Corresponding Principal Balance Certificates as a result of allocations of losses realized on the mortgage loans to such class(es) of Non-Vertically Retained Principal Balance Certificates. |
| THE INFORMATION IN THIS STRUCTURAL AND COLLATERAL TERM SHEET IS NOT COMPLETE AND MAY BE AMENDED PRIOR TO THE TIME OF SALE. THIS TERM SHEET IS NOT AN OFFER TO SELL THESE SECURITIES AND IT IS NOT A SOLICITATION OF AN OFFER TO BUY THESE SECURITIES IN ANY JURISDICTION WHERE THE OFFER OR SALE IS NOT PERMITTED. |
| | | |
| | 19 | |
| Structural and Collateral Term Sheet | | BMO 2022-C3 |
| |
| Structural Overview |
| ■ Prepayment Premiums and Yield Maintenance Charges: | | On each Distribution Date, until the notional amounts of the Class X-A, Class X-B, Class X-D and Class X-E certificates and the certificate balances of the Class A-1, Class A-2, Class A-3, Class A-4, Class A-5, Class A-SB, Class A-S, Class B, Class C, Class D and Class E certificates have been reduced to zero, the Non-Vertically Retained Percentage of each yield maintenance charge collected on the mortgage loans during the related one-month collection period (or, in the case of an outside serviced mortgage loan, that accompanied a principal prepayment included in the aggregate available funds for such Distribution Date) is required to be distributed to holders of the Non-Vertically Retained Regular Certificates (excluding holders of the Class F-RR, Class G-RR, Class J-RR and Class K-RR certificates) as follows: (a) first the Non-Vertically Retained Percentage of such yield maintenance charge will be allocated between (i) the group (the “YM Group A”) of the Class A-1, Class A-2, Class A-3, Class A-4, Class A-5, Class A-SB and Class X-A certificates, (ii) the group (the “YM Group A-S/B/C”) comprised of the Class A-S, Class B, Class C and Class X-B certificates, (iii) the group (the “YM Group D”) comprised of the Class X-D and Class D certificates, and (iv) the group (the “YM Group E”, and the YM Group A, the YM Group A-S/B/C, the YM Group D and the YM Group E, together, the “YM Groups”) comprised of the Class X-E and Class E certificates, pro rata, based upon the aggregate amount of principal distributed to the class or classes of Non-Vertically Retained Principal Balance Certificates in each YM Group on such Distribution Date, and (b) then the portion of such yield maintenance charge allocated to each YM Group will be further allocated as among the classes of Non-Vertically Retained Regular Certificates in such YM Group, in the following manner: (i) each class of Non-Vertically Retained Principal Balance Certificates in such YM Group will entitle the applicable certificateholders to receive on the applicable Distribution Date that portion of such yield maintenance charge equal to the product of (X) a fraction whose numerator is the amount of principal distributed to such class of Non-Vertically Retained Principal Balance Certificates on such Distribution Date and whose denominator is the total amount of principal distributed to all of the Non-Vertically Retained Principal Balance Certificates in that YM Group on such Distribution Date, (Y) the Base Interest Fraction (as defined in the Preliminary Prospectus) for the related principal prepayment and such class of Non-Vertically Retained Principal Balance Certificates, and (Z) the portion of such yield maintenance charge allocated to such YM Group, and (ii) the portion of such yield maintenance charge allocated to such YM Group and remaining after such distributions with respect to the Non-Vertically Retained Principal Balance Certificates in such YM Group will be distributed to the class of Class X Certificates in such YM Group. If there is more than one class of Non-Vertically Retained Principal Balance Certificates in any YM Group entitled to distributions of principal on any particular Distribution Date on which yield maintenance charges are distributable to such classes, the aggregate portion of such yield maintenance charges allocated to such YM Group will be allocated among all such classes of Non-Vertically Retained Principal Balance Certificates up to, and on a pro rata basis in accordance with, their respective entitlements in those yield maintenance charges in accordance with the prior sentence of this paragraph. If a prepayment premium (calculated as a percentage of the amount prepaid) is imposed in connection with a prepayment rather than a yield maintenance charge, then the prepayment premium so collected will be allocated as described above. For this purpose, the discount rate used to calculate the Base Interest Fraction will be the discount rate used to determine the yield maintenance charge for mortgage loans that require payment at the greater of a yield maintenance charge or a minimum amount equal to a fixed percentage of the principal balance of the mortgage loan or, for mortgage loans that only have a prepayment premium based on a fixed percentage of the principal balance of the mortgage loan, such other discount rate as may be specified in the related loan documents. After the notional amounts of the Class X-A, Class X-B, Class X-D and Class X-E certificates and the certificate balances of the Class A-1, Class A-2, Class A-3, Class A-4, Class A-5, Class A-SB, Class A-S, Class B, Class C, Class D and Class E certificates have been reduced to zero, the Non-Vertically Retained Percentage of all prepayment premiums and yield maintenance charges with respect to the mortgage loans will be allocated among the holders of the Class F-RR, Class G-RR, Class K-RR and Class J-RR certificates as provided in the BMO 2022-C3 pooling and servicing agreement. No yield maintenance charges or prepayment premiums will be distributed to the holders of the Class R certificates. For a description of prepayment premiums and yield maintenance charges required on the mortgage loans, see Annex A to the Preliminary Prospectus. See also “Certain Legal Aspects of the Mortgage Loans—Default Interest and Limitations on Prepayments” in the Preliminary Prospectus. |
| ■ Advances: | | The master servicer and, if it fails to do so, the trustee, will be obligated to make P&I advances with respect to each mortgage loan in the issuing entity and, with respect to all of the mortgage loans serviced under the BMO 2022-C3 pooling and servicing agreement, servicing advances, including paying delinquent property taxes, condominium assessments, insurance premiums and ground lease rents, but only to the extent that those advances are not deemed non-recoverable from collections on the related mortgage loan and, in the case of servicing advances, any related companion loans as described below. P&I advances are subject to reduction in connection with any appraisal reductions that may occur. The special servicer will have no obligation to make any advances, provided that, in an urgent or emergency situation requiring the making of a property protection advance, the special servicer may, in its sole discretion, make a property protection advance and will be entitled to |
| THE INFORMATION IN THIS STRUCTURAL AND COLLATERAL TERM SHEET IS NOT COMPLETE AND MAY BE AMENDED PRIOR TO THE TIME OF SALE. THIS TERM SHEET IS NOT AN OFFER TO SELL THESE SECURITIES AND IT IS NOT A SOLICITATION OF AN OFFER TO BUY THESE SECURITIES IN ANY JURISDICTION WHERE THE OFFER OR SALE IS NOT PERMITTED. |
| | | |
| | 20 | |
| Structural and Collateral Term Sheet | | BMO 2022-C3 |
| |
| Structural Overview |
| | reimbursement from the master servicer for such advance. The master servicer, the special servicer and the trustee will each be entitled to receive interest on advances they make at the prime rate (and, solely in the case of the master servicer, subject to a floor of 2.0% per annum), compounded annually. |
■ Serviced Mortgage Loans/Outside Serviced Mortgage Loans: | | One or more whole loans may each constitute an “outside serviced whole loan”, in which case (as identified under “Collateral Characteristics—Pari Passu Companion Loan Summary” above), the BMO 2022-C3 pooling and servicing agreement is not the Controlling PSA, and each related mortgage loan constitutes an “outside serviced mortgage loan,” each related companion loan constitutes an “outside serviced companion loan,” and each related Controlling PSA constitutes an “outside servicing agreement.” One or more whole loans may be identified in the Preliminary Prospectus as a “servicing shift whole loan”, in which case the related mortgage loan constitutes a “servicing shift mortgage loan” and each related companion loan constitutes a “servicing shift companion loan”. Any servicing shift whole loan will initially be serviced pursuant to the BMO 2022-C3 pooling and servicing agreement during which time such mortgage loan, such whole loan and each related companion loan will be a serviced mortgage loan, a serviced whole loan and a serviced companion loan (each as defined below), respectively. However, upon the inclusion of the related controlling pari passu companion loan in a future securitization transaction, the servicing of such mortgage loan will shift to the servicing agreement governing such securitization transaction, and such mortgage loan, such whole loan and each related companion loan will be an outside serviced mortgage loan, an outside serviced whole loan and an outside serviced companion loan, respectively. All of the mortgage loans transferred to the issuing entity (other than any outside serviced mortgage loan) are sometimes referred to in this Term Sheet as the “serviced mortgage loans” and, together with any related companion loans, as the “serviced loans” (which signifies that they are being serviced by the master servicer and the special servicer under the BMO 2022-C3 pooling and servicing agreement); each related whole loan constitutes a “serviced whole loan”; and each related companion loan constitutes a “serviced companion loan.” See “Description of the Mortgage Pool—The Whole Loans” in the Preliminary Prospectus. |
| ■ Appraisal Reduction Amounts: | | An Appraisal Reduction Amount generally will be created with respect to a required appraisal loan (which is a serviced loan as to which certain defaults, modifications or insolvency events have occurred (as further described in the Preliminary Prospectus)) in the amount, if any, by which the principal balance of such required appraisal loan, plus other amounts overdue or advanced in connection with such required appraisal loan, exceeds 90% of the appraised value of the related mortgaged property (subject to certain downward adjustments permitted under the BMO 2022-C3 pooling and servicing agreement) plus certain escrows and reserves (including letters of credit) held with respect to such required appraisal loan; provided that, if so provided in the related co-lender agreement, the holder of a subordinate companion loan may be permitted to post cash or a letter of credit to offset some or all of an Appraisal Reduction Amount. In the case of an outside serviced mortgage loan, any Appraisal Reduction Amounts will be calculated pursuant to, and by a party to, the related outside servicing agreement. In general, any Appraisal Reduction Amount calculated with respect to a whole loan will be allocated first, to any related subordinate companion loan(s) (up to the outstanding principal balance(s) thereof), and then, to the related mortgage loan and any related pari passu companion loan(s) on a pro rata basis in accordance with their respective outstanding principal balances. As a result of an Appraisal Reduction Amount being calculated for and/or allocated to a given mortgage loan, the interest portion of any P&I advance for such mortgage loan will be reduced, which (to the extent of the Non-Vertically Retained Percentage of the reduction in such P&I advance) will have the effect of reducing the amount of interest available to the most subordinate class(es) of Certificates then outstanding (i.e., first, to the Class K-RR certificates, then, to the Class J-RR certificates, then, to the Class G-RR certificates, then, to the Class F-RR certificates, then, to the Class E certificates, then, to the Class D certificates, then, to the Class C certificates, then, to the Class B certificates, then, to the Class A-S certificates, and then, pro rata based on interest entitlements, to the Class A-1, Class A-2, Class A-3, Class A-4, Class A-5, Class A-SB, Class X-A, Class X-B, Class X-D and Class X-E certificates). In general, a serviced loan will cease to be a required appraisal loan, and no longer be subject to an Appraisal Reduction Amount, when the same has ceased to be a specially serviced loan (if applicable), has been brought current for at least three consecutive months and no other circumstances exist that would cause such serviced loan to be a required appraisal loan. For various purposes under the BMO 2022-C3 pooling and servicing agreement (including, with respect to the Non-Vertically Retained Principal Balance Certificates, for purposes of determining the Non-Reduced Certificates and the Controlling Class, as well as the occurrence of a Control Termination Event and an Operating Advisor Consultation Trigger Event), the Vertically Retained Percentage of any Appraisal Reduction Amounts in respect of or allocated to the mortgage loans will be allocated to notionally reduce the certificate balance of the Combined VRR Interest, and the Non-Vertically Retained Percentage of any Appraisal Reduction Amounts in respect of or allocated to the mortgage loans will be allocated to notionally reduce the certificate balances of the Non-Vertically |
| THE INFORMATION IN THIS STRUCTURAL AND COLLATERAL TERM SHEET IS NOT COMPLETE AND MAY BE AMENDED PRIOR TO THE TIME OF SALE. THIS TERM SHEET IS NOT AN OFFER TO SELL THESE SECURITIES AND IT IS NOT A SOLICITATION OF AN OFFER TO BUY THESE SECURITIES IN ANY JURISDICTION WHERE THE OFFER OR SALE IS NOT PERMITTED. |
| | | |
| | 21 | |
| Structural and Collateral Term Sheet | | BMO 2022-C3 |
| |
| Structural Overview |
| | Retained Principal Balance Certificates as follows: first, to the Class K-RR, Class J-RR, Class G-RR, Class F-RR, Class E, Class D, Class C, Class B and Class A-S certificates, in that order, in each case until the related certificate balance is notionally reduced to zero; and then to the Class A-1, Class A-2, Class A-3, Class A-4, Class A-5 and Class A-SB certificates, pro rata based on certificate balance. |
■ Cumulative Appraisal Reduction Amounts: | | A “Cumulative Appraisal Reduction Amount”, as of any date of determination, is equal to the sum of (i) all Appraisal Reduction Amounts then in effect, and (ii) with respect to any AB Modified Loans, any Collateral Deficiency Amounts then in effect. “Collateral Deficiency Amount” means, with respect to any AB Modified Loan as of any date of determination, the excess of (i) the stated principal balance of such AB Modified Loan (taking into account the related junior note(s) included therein), over (ii) the sum of (in the case of a whole loan, solely to the extent allocable to the subject mortgage loan) (x) the most recent appraised value for the related mortgaged property or mortgaged properties, plus (y) solely to the extent not reflected or taken into account in such appraised value and to the extent on deposit with, or otherwise under the control of, the lender as of the date of such determination, any capital or additional collateral contributed by the related borrower at the time the mortgage loan became (and as part of the modification related to) such AB Modified Loan for the benefit of the related mortgaged property or mortgaged properties (provided, that in the case of an outside serviced mortgage loan, the amounts set forth in this clause (y) will be taken into account solely to the extent relevant information is received), plus (z) any other escrows or reserves (in addition to any amounts set forth in the immediately preceding clause (y)) held by the lender in respect of such AB Modified Loan as of the date of such determination. For purposes of determining the identity of the Controlling Class and the existence of a Control Termination Event and an Operating Advisor Consultation Trigger Event, the Non-Vertically Retained Percentage of Collateral Deficiency Amounts will be allocable to the respective classes of Control Eligible Certificates (as defined below), in reverse alphabetical order of class designation, in a manner similar to the allocation of Appraisal Reduction Amounts to such classes. “AB Modified Loan” means any corrected mortgage loan (1) that became a corrected mortgage loan (which includes for purposes of this definition any outside serviced mortgage loan that became a “corrected” mortgage loan (or any term substantially similar thereto) pursuant to the related outside servicing agreement) due to a modification thereto that resulted in the creation of an A/B note structure (or similar structure) and as to which the new junior note(s) did not previously exist or the principal amount of the new junior note(s) was previously part of either an A note held by the trust or the original unmodified mortgage loan and (2) as to which an Appraisal Reduction Amount is not in effect. |
| ■ Age of Appraisals: | | Appraisals (which can be an update of a prior appraisal) with respect to a serviced loan are required to be no older than 9 months for purposes of determining appraisal reductions (other than the annual re-appraisal), market value, and other calculations as described in the Preliminary Prospectus. |
| ■ Sale of Defaulted Loans: | | There will be no “Fair Market Value Purchase Option”. Instead, defaulted mortgage loans will be sold in a process similar to the sale process for REO property. With respect to an outside serviced whole loan, the party acting as special servicer with respect to such outside serviced whole loan pursuant to the related outside servicing agreement (the “outside special servicer”) may offer to sell to any person (or may offer to purchase) for cash such outside serviced whole loan in accordance with the terms of the related outside servicing agreement during such time as such outside serviced whole loan constitutes a defaulted mortgage loan qualifying for sale thereunder and, in connection with any such sale, the related outside special servicer is required to sell both the applicable outside serviced mortgage loan and the related outside serviced pari passu companion loan(s) and, if so provided in the related co-lender agreement or the Controlling PSA, any related subordinate companion loan(s), together as one defaulted loan. |
| ■ Directing Holder: | | The “Directing Holder” with respect to any mortgage loan or whole loan serviced under the BMO 2022-C3 pooling and servicing agreement will be: ● except (i) with respect to an excluded mortgage loan, (ii) with respect to a serviced whole loan as to which the Controlling Note is held outside the issuing entity (sometimes referred to in this Term Sheet as a “serviced outside controlled whole loan”), and (iii) during any period that a Control Termination Event has occurred and is continuing, the Controlling Class Representative; ● with respect to any serviced outside controlled whole loan (which may include a servicing shift whole loan or any other serviced whole loan with a controlling companion loan held outside the issuing entity), if and for so long as such holder is entitled under the related co-lender agreement to exercise consent rights similar to those entitled to be exercised by the Controlling Class Representative, the holder of the related Controlling Note (during any such period, the “outside controlling note holder”); |
| THE INFORMATION IN THIS STRUCTURAL AND COLLATERAL TERM SHEET IS NOT COMPLETE AND MAY BE AMENDED PRIOR TO THE TIME OF SALE. THIS TERM SHEET IS NOT AN OFFER TO SELL THESE SECURITIES AND IT IS NOT A SOLICITATION OF AN OFFER TO BUY THESE SECURITIES IN ANY JURISDICTION WHERE THE OFFER OR SALE IS NOT PERMITTED. |
| | | |
| | 22 | |
| Structural and Collateral Term Sheet | | BMO 2022-C3 |
| |
| Structural Overview |
| | The applicable directing holder (or equivalent party) with respect to any outside serviced mortgage loan will be, in general, (i) in the event the related Controlling Note is included in the subject outside securitization transaction, the controlling class representative (or equivalent entity) under the related outside servicing agreement, and (ii) in all other cases, the third party holder of the related Controlling Note or its representative (which may be a controlling class representative (or equivalent entity) under a separate securitization transaction to which such note has been transferred (if any)), as provided in the related co-lender agreement. An “excluded mortgage loan” is, if the Controlling Class Representative is the Directing Holder with respect to the subject mortgage loan, a mortgage loan or related whole loan with respect to which the Controlling Class Representative or the holder(s) of more than 50% of the Controlling Class (by certificate balance) is (or are) a Borrower Party (as defined in the Preliminary Prospectus). |
| ■ Controlling Class Representative: | | The “Controlling Class Representative” will be the controlling class certificateholder or other representative designated by at least a majority of the controlling class certificateholders by certificate balance. The “Controlling Class” is, as of any time of determination, the most subordinate class of the Control Eligible Certificates that has an outstanding certificate balance as notionally reduced by any Cumulative Appraisal Reduction Amount allocable to such class, at least equal to 25% of the initial certificate balance of that class of certificates; provided that (except under the circumstances set forth in the next proviso) if no such class meets the preceding requirement, then the Class F-RR certificates will be the controlling class; provided, further, however, that if, at any time, the aggregate outstanding certificate balance of the classes of Non-Vertically Retained Principal Balance Certificates senior to the Control Eligible Certificates has been reduced to zero (without regard to the allocation of any Cumulative Appraisal Reduction Amounts), then the “Controlling Class” will be the most subordinate class of Control Eligible Certificates with an outstanding certificate balance greater than zero (without regard to the allocation of any Cumulative Appraisal Reduction Amounts). The “Control Eligible Certificates” consist of the Class F-RR, Class G-RR, Class J-RR and Class K-RR certificates. See “The Pooling and Servicing Agreement—Directing Holder” in the Preliminary Prospectus. No other class of certificates will be eligible to act as the controlling class or appoint a Controlling Class Representative. No person may exercise any of the rights and powers of the Controlling Class Representative with respect to an excluded mortgage loan. On the Closing Date, KKR CMBS II Aggregator Type 1 L.P. or its affiliate, is expected to (i) purchase the Class F-RR, Class G-RR, Class J-RR and Class K-RR certificates, and (ii) to appoint KKR Real Estate Credit Opportunity Partners II L.P. or an affiliate as the initial Controlling Class Representative. |
■ Control Termination Event: | | A “Control Termination Event” will: with respect to any mortgage loan either (a) occur when none of the classes of the Control Eligible Certificates has an outstanding certificate balance (as notionally reduced by any Cumulative Appraisal Reduction Amount then allocable to such class) that is at least equal to 25% of the initial certificate balance of that class of certificates or (b) be deemed to occur as described below; provided, however, that a Control Termination Event will in no event exist at any time that the certificate balance of each class of the Non-Vertically Retained Principal Balance Certificates senior to the Control Eligible Certificates (without regard to the allocation of Cumulative Appraisal Reduction Amounts) has been reduced to zero. With respect to excluded mortgage loans as to which the Controlling Class Representative would otherwise be the Directing Holder, a Control Termination Event will be deemed to exist. The holders of Certificates representing the majority of the certificate balance of the most senior class of Control Eligible Certificates whose certificate balance is notionally reduced to less than 25% of the initial certificate balance of that class as a result of an allocation of an Appraisal Reduction Amount or a Collateral Deficiency Amount, as applicable, to such class will have the right to challenge the Special Servicer’s Appraisal Reduction Amount determination or a Collateral Deficiency Amount determination, as applicable, and, at their sole expense, obtain a second appraisal for any serviced loan for which an Appraisal Reduction Event has occurred or as to which there exists a Collateral Deficiency Amount, under the circumstances described in the Preliminary Prospectus. |
■ Consultation Termination Event: | | A “Consultation Termination Event” with respect to any mortgage loan, (a) when none of the classes of Control Eligible Certificates has an outstanding certificate balance, without regard to the allocation of any Cumulative Appraisal Reduction Amount, that is equal to or greater than 25% of the initial certificate balance of that class of certificates or (b) be deemed to occur as described below; provided, however, that a Consultation Termination Event will in no event exist at any time that the certificate balance of each class of the Non-Vertically Retained Principal Balance Certificates senior to the Control Eligible Certificates (without regard to the allocation of Cumulative Appraisal Reduction Amounts) has been reduced to zero. With respect to excluded mortgage loans as to which the Controlling Class Representative would otherwise be a Consulting Party, a Consultation Termination Event will be deemed to exist. |
| THE INFORMATION IN THIS STRUCTURAL AND COLLATERAL TERM SHEET IS NOT COMPLETE AND MAY BE AMENDED PRIOR TO THE TIME OF SALE. THIS TERM SHEET IS NOT AN OFFER TO SELL THESE SECURITIES AND IT IS NOT A SOLICITATION OF AN OFFER TO BUY THESE SECURITIES IN ANY JURISDICTION WHERE THE OFFER OR SALE IS NOT PERMITTED. |
| | | |
| | 23 | |
| Structural and Collateral Term Sheet | | BMO 2022-C3 |
| |
| Structural Overview |
■ Control/Consultation Rights: | | With respect to any Serviced Loan, the applicable Directing Holder will be entitled to have consent and/or consultation rights under the BMO 2022-C3 pooling and servicing agreement with respect to certain major decisions (including with respect to assumptions, waivers, certain loan modifications and workouts) and other matters with respect to each serviced loan. After the occurrence and during the continuance of a Control Termination Event, the consent rights of the Controlling Class Representative will terminate, and the Controlling Class Representative will retain non-binding consultation rights under the BMO 2022-C3 pooling and servicing agreement with respect to certain major decisions and other matters with respect to the serviced mortgage loans, other than (i) any excluded mortgage loan and (ii) any serviced outside controlled whole loan. After the occurrence and during the continuance of a Consultation Termination Event, all of these rights of the Controlling Class Representative with respect to the applicable serviced loans will terminate. With respect to any serviced outside controlled whole loan (including any servicing shift whole loan for so long as it is serviced under the BMO 2022-C3 pooling and servicing agreement), the holder of the related Controlling Note or its representative (which holder or representative will not be the Controlling Class Representative) will instead be entitled to exercise the above-described consent and consultation rights, to the extent provided under the related co-lender agreement. With respect to each outside serviced whole loan, the applicable outside controlling class representative or other related controlling noteholder pursuant to, and subject to the limitations set forth in, the related outside servicing agreement and the related co-lender agreement will have consent, consultation, approval and direction rights with respect to certain major decisions (including with respect to assumptions, waivers, loan modifications and workouts) regarding such outside serviced whole loan, as provided for in the related co-lender agreement and in the related outside servicing agreement. To the extent permitted under the related co-lender agreement, the Controlling Class Representative (so long as a Consultation Termination Event does not exist) may have certain consultation rights with respect to each outside serviced whole loan. See “Description of the Mortgage Pool—The Whole Loans” in the Preliminary Prospectus. |
| ■ Risk Retention Consultation Party: | | The “risk retention consultation party”, with respect to any serviced mortgage loan or, if applicable, serviced whole loan will be the party selected by Bank of Montreal. The risk retention consultation party will have certain non-binding consultation rights in certain circumstances, (i) for so long as no Consultation Termination Event is continuing, with respect to any specially serviced loan (other than any outside serviced mortgage loan), and (ii) during the continuance of a Consultation Termination Event, with respect to any mortgage loan (other than any outside serviced mortgage loan), as further described in the Preliminary Prospectus. Notwithstanding the foregoing, the risk retention consultation party will not have any consultation rights with respect to any mortgage loan that is an excluded RRCP mortgage loan with respect to such party. Bank of Montreal is expected to be appointed as the initial risk retention consultation party. With respect to any risk retention consultation party, an “excluded RRCP mortgage loan” is a mortgage loan or whole loan with respect to which such risk retention consultation party, or the person(s) entitled to appoint such risk retention consultation party, is a Borrower Party. |
| ■ Termination of Special Servicer: | | At any time, the special servicer (but not any outside special servicer for any outside serviced whole loan) may be removed and replaced by the applicable Directing Holder, if any, with or without cause upon satisfaction of certain conditions specified in the BMO 2022-C3 pooling and servicing agreement. After the occurrence and during the continuance of a Control Termination Event, the holders of at least 25% of the voting rights of the Certificates (without regard to the application of any Appraisal Reduction Amounts) may request a vote to replace the special servicer (with respect to all of the serviced loans other than any serviced outside controlled whole loan). The subsequent vote may result in the termination and replacement of the special servicer if, within 180 days of the initial request for that vote, the holders of (a) at least 66-2/3% of the voting rights allocable to the Certificates of those holders that voted on the matter (provided that holders representing the applicable Certificateholder Quorum voted on the matter), or (b) more than 50% of the voting rights of each class of Certificates that are Non-Reduced Certificates vote affirmatively to so replace. “Non-Reduced Certificates” means each class of Principal Balance Certificates that has an outstanding certificate balance as may be notionally reduced by any Appraisal Reduction Amounts allocated to that class, equal to or greater than 25% of an amount equal to the initial certificate balance of that class of certificates minus all principal payments made on such class of certificates. |
| THE INFORMATION IN THIS STRUCTURAL AND COLLATERAL TERM SHEET IS NOT COMPLETE AND MAY BE AMENDED PRIOR TO THE TIME OF SALE. THIS TERM SHEET IS NOT AN OFFER TO SELL THESE SECURITIES AND IT IS NOT A SOLICITATION OF AN OFFER TO BUY THESE SECURITIES IN ANY JURISDICTION WHERE THE OFFER OR SALE IS NOT PERMITTED. |
| | | |
| | 24 | |
| Structural and Collateral Term Sheet | | BMO 2022-C3 |
| |
| Structural Overview |
| | Notwithstanding the foregoing, but subject to the discussion in the next paragraph, solely with respect to a serviced outside controlled whole loan (including any servicing shift whole loan, for so long as it is serviced pursuant to the BMO 2022-C3 pooling and servicing agreement), only the holder of the related Controlling Note or its representative may terminate the special servicer without cause (solely with respect to the related whole loan) and appoint a replacement special servicer for that whole loan. If the operating advisor determines, in its sole discretion exercised in good faith, that (1) the special servicer has failed to comply with the servicing standard and (2) a replacement of the special servicer would be in the best interest of the certificateholders (as a collective whole), the operating advisor will have the right to recommend the replacement of the special servicer with respect to the serviced loans, resulting in a solicitation of a certificateholder vote. The subsequent vote may result in the termination and replacement of the special servicer if, within 180 days of the initial request for that vote, the holders of at least a majority of the aggregate outstanding principal balance of the Certificates of those holders that voted on the matter (provided that holders representing the applicable Certificateholder Quorum vote on the matter) vote affirmatively to so replace. “Certificateholder Quorum” means a quorum that: (a) for purposes of a vote to terminate and replace the special servicer or the asset representations reviewer at the request of the holders of Certificates evidencing not less than 25% of the voting rights (without regard to the application of any Appraisal Reduction Amounts), consists of the holders of Certificates evidencing at least 50% of the voting rights (taking into account the allocation of any Appraisal Reduction Amounts to notionally reduce the certificate balances of the respective classes of Non-Vertically Retained Principal Balance Certificates) of all of the Certificates, on an aggregate basis; and (b) for purposes of a vote to terminate and replace the special servicer based on a recommendation of the operating advisor, consists of the holders of Certificates evidencing at least 20% of the aggregate of the outstanding principal balances of all Certificates, with such quorum including at least (3) holders and/or beneficial owners of Certificates that are not “affiliated” (as defined in Regulation RR) with each other. The related outside special servicer under each outside servicing agreement generally may be (or, if the applicable outside servicing agreement has not yet been executed, it is anticipated that such outside special servicer may be) replaced by the related outside controlling class representative (or an equivalent party), or the vote of the requisite holders of certificates issued, under the applicable outside servicing agreement (depending on whether or not the equivalent of a control termination event or a consultation termination event exists under that outside servicing agreement) or by any applicable other controlling noteholder under the related co-lender agreement in a manner generally similar to the manner in which the special servicer may be replaced under the BMO 2022-C3 pooling and servicing agreement as described above in this “Termination of Special Servicer” section (although there will be differences, in particular as regards certificateholder votes and the timing of when an outside special servicer may be terminated based on the recommendation of an operating advisor). If the special servicer, to its knowledge, becomes a Borrower Party with respect to a mortgage loan, the special servicer will not be permitted to act as special servicer with respect to that mortgage loan. Subject to certain limitations described in the Preliminary Prospectus, any applicable Directing Holder will be entitled to appoint a replacement special servicer for that mortgage loan. If there is no applicable Directing Holder or if the applicable Directing Holder does not take action to appoint a replacement special servicer within the requisite time period, a replacement special servicer will be appointed in the manner specified in the BMO 2022-C3 pooling and servicing agreement. |
| ■ Voting Rights: | | At all times during the term of the BMO 2022-C3 pooling and servicing agreement, the voting rights for the Certificates (the “voting rights”) will be allocated among the respective classes of certificateholders in the following percentages: (1) 1% in the aggregate in the case of the respective classes of the Class X Certificates, allocated pro rata based upon their respective notional amounts as of the date of determination (for so long as the notional amount of at least one class of the Class X Certificates is greater than zero), and (2) in the case of any class of Non-Vertically Retained Principal Balance Certificates, a percentage equal to the product of 99% (or, if the notional amounts of all classes of the Class X Certificates have been reduced to zero, 100%) and a fraction, the numerator of which is equal to the certificate balance of such class of Non-Vertically Retained Principal Balance Certificates as of the date of determination, and the denominator of which is equal to the aggregate of the certificate balances of all classes of the Non-Vertically Retained Principal Balance Certificates, in each case, as of the date of determination, |
| THE INFORMATION IN THIS STRUCTURAL AND COLLATERAL TERM SHEET IS NOT COMPLETE AND MAY BE AMENDED PRIOR TO THE TIME OF SALE. THIS TERM SHEET IS NOT AN OFFER TO SELL THESE SECURITIES AND IT IS NOT A SOLICITATION OF AN OFFER TO BUY THESE SECURITIES IN ANY JURISDICTION WHERE THE OFFER OR SALE IS NOT PERMITTED. |
| | | |
| | 25 | |
| Structural and Collateral Term Sheet | | BMO 2022-C3 |
| |
| Structural Overview |
| | provided, that in certain circumstances described under “The Pooling and Servicing Agreement” in the Preliminary Prospectus, voting rights will only be exercisable by holders of Certificates that are Non-Reduced Certificates and/or may otherwise be exercisable or allocated in a manner that takes into account the allocation of Appraisal Reduction Amounts. The voting rights of any class of certificates are required to be allocated among certificateholders of such class in proportion to their respective percentage interests. The Class R certificates and the Uncertificated VRR Interest will not be entitled to any voting rights. |
| ■ Servicing Compensation: | | Modification Fees: Certain fees resulting from modifications, amendments, waivers or other changes to the terms of the loan documents, as more fully described in the Preliminary Prospectus, will be used to offset expenses on the related serviced mortgage loan (i.e. reimburse the trust for certain expenses, including unreimbursed advances and interest on unreimbursed advances previously incurred (other than special servicing fees, workout fees and liquidation fees) on the related serviced mortgage loan but not yet reimbursed to the trust or servicers or to pay expenses (other than special servicing fees, workout fees and liquidation fees) that are still outstanding in each case unless as part of the written modification the related borrower is required to pay these amounts on a going forward basis or in the future). Any excess modification fees not so applied to offset expenses will be available as compensation to the master servicer and/or special servicer. Within any prior 12-month period, all such excess modification fees earned by the master servicer or by the special servicer (after taking into account the offset described below applied during such 12-month period) with respect to any serviced mortgage loan will be subject to a cap equal to the greater of (i) 1% of the outstanding principal balance of such mortgage loan after giving effect to such transaction and (ii) $25,000. All excess modification fees earned by the special servicer will be required to offset any future workout fees or liquidation fees payable with respect to the related serviced mortgage loan or related REO property; provided, that if the serviced mortgage loan ceases being a corrected loan, and is subject to a subsequent modification, any excess modification fees earned by the special servicer prior to such serviced mortgage loan ceasing to be a corrected loan will no longer be offset against future liquidation fees and workout fees unless such serviced mortgage loan ceased to be a corrected loan within 18 months of it becoming a modified mortgage loan. Penalty Fees: All late fees and default interest will first be used to reimburse certain expenses previously incurred with respect to the related mortgage loan (including special servicing fees, workout fees and liquidation fees) but not yet reimbursed to the trust, the master servicer or the special servicer or to pay certain expenses (including special servicing fees, workout fees and liquidation fees) that are still outstanding on the related mortgage loan, and any excess received with respect to a serviced loan will be paid to the master servicer (for penalty fees accrued while a non-specially serviced loan) and the special servicer (for penalty fees accrued while a specially serviced loan). To the extent any amounts reimbursed out of penalty charges are subsequently recovered on a related serviced loan, they will be paid to the master servicer or special servicer who would have been entitled to the related penalty charges that were previously used to reimburse such expense. Liquidation / Workout Fees: Liquidation fees will be calculated at the lesser of (a) 1.0% or (b) with respect to any serviced mortgage loan (or related serviced whole loan, if applicable) or related REO Property, such lesser rate as would result in a liquidation fee of $1,000,000, for each serviced loan that is a specially serviced loan and any REO property, subject in any case to a minimum liquidation fee of $25,000. For any serviced loan that is a corrected loan, workout fees will be calculated at the lesser of (a) 1.0% and (b) such lower rate as would result in a workout fee of $1,000,000 when applied to each expected payment of principal and interest (other than (i) default interest and (ii) any “excess interest” accrued after the related anticipated repayment date on any mortgage loan with an anticipated repayment date) on the related serviced loan (or related serviced whole loan, if applicable) from the date such serviced loan becomes a corrected loan through and including the then related maturity date, subject in any case to a minimum workout fee of $25,000. Notwithstanding the foregoing, in connection with a maturity default, no liquidation or workout fee will be payable in connection with a payoff or refinancing of the related serviced loan within 90 days of the maturity default, but the special servicer may collect and retain appropriate fees from the related borrower in connection with the subject liquidation or workout. In the case of an outside serviced whole loan, calculation of the foregoing amounts payable to the related outside servicer or outside special servicer may be different than as described above. For example, the extent to which modification fees and penalty fees are applied to offset expenses may be different and liquidation fees and workout fees may be subject to different caps or no caps. |
| THE INFORMATION IN THIS STRUCTURAL AND COLLATERAL TERM SHEET IS NOT COMPLETE AND MAY BE AMENDED PRIOR TO THE TIME OF SALE. THIS TERM SHEET IS NOT AN OFFER TO SELL THESE SECURITIES AND IT IS NOT A SOLICITATION OF AN OFFER TO BUY THESE SECURITIES IN ANY JURISDICTION WHERE THE OFFER OR SALE IS NOT PERMITTED. |
| | | |
| | 26 | |
| Structural and Collateral Term Sheet | | BMO 2022-C3 |
| |
| Structural Overview |
| ■ Operating Advisor: | | The operating advisor will, in general and under certain circumstances described in the Preliminary Prospectus, have the following rights and responsibilities with respect to the serviced mortgage loans: ● are viewing the actions of the special servicer with respect to specially serviced loans and with respect to certain major decisions regarding non-specially serviced loans as to which the operating advisor has consultation rights; ● reviewing reports provided by the special servicer to the extent set forth in the BMO 2022-C3 pooling and servicing agreement; ● reviewing for accuracy certain calculations made by the special servicer; ● issuing an annual report generally setting forth, among other things, its assessment of whether the special servicer is performing its duties in compliance with the servicing standard and the BMO 2022-C3 pooling and servicing agreement and identifying any material deviations therefrom; ● recommending the replacement of the special servicer if the operating advisor determines, in its sole discretion exercised in good faith, that (1) the special servicer has failed to comply with the servicing standard and (2) a replacement of the special servicer would be in the best interest of the certificateholders and the owners of the Uncertificated VRR Interest (as a collective whole); and ● after the occurrence and during the continuance of an Operating Advisor Consultation Trigger Event, consulting on a non-binding basis with the special servicer with respect to certain major decisions (and such other matters as are set forth in the BMO 2022-C3 pooling and servicing agreement) in respect of the applicable serviced mortgage loan(s) and/or related companion loan(s). An “Operating Advisor Consultation Trigger Event” will occur when the aggregate outstanding certificate balance of the HRR Certificates (as notionally reduced by any Cumulative Appraisal Reduction Amounts then allocable to the HRR Certificates) is 25% or less of the initial aggregate certificate balance of the HRR Certificates. With respect to excluded mortgage loans, an Operating Advisor Consultation Trigger Event will be deemed to exist. Notwithstanding the foregoing, the operating advisor will generally have no obligations or consultation rights as operating advisor under the BMO 2022-C3 pooling and servicing agreement with respect to any outside serviced mortgage loan or any related REO property. The operating advisor will be subject to termination and replacement if the holders of at least 15% of the voting rights of Non-Reduced Certificates vote to terminate and replace the operating advisor and such termination and replacement is affirmatively voted for by the holders of more than 50% of the voting rights allocable to the Non-Reduced Certificates of those holders that exercise their right to vote (provided that holders entitled to exercise at least 50% of the voting rights allocable to the Non-Reduced Certificates exercise their right to vote within 180 days of the initial request for a vote). The holders initiating such vote will be responsible for the fees and expenses in connection with the vote and replacement. See “The Pooling and Servicing Agreement—Operating Advisor” in the Preliminary Prospectus. |
| ■ Asset Representations Reviewer: | | The asset representations reviewer will be required to review certain delinquent mortgage loans after a specified delinquency threshold has been exceeded and the required percentage of certificateholders vote to direct a review of such delinquent mortgage loans. An asset review will occur when either (1) mortgage loans with an aggregate outstanding principal balance of 25% or more of the aggregate outstanding principal balance of all of the mortgage loans (including any REO mortgage loans) held by the issuing entity as of the end of the applicable collection period are at least 60 days delinquent in respect of their related monthly payments or balloon payment, if any (for purposes of this paragraph, “delinquent loans”) or (2) at least 15 mortgage loans are delinquent loans as of the end of the applicable collection period and the aggregate outstanding principal balance of such delinquent loans constitutes at least 20% of the aggregate outstanding principal balance of all of the mortgage loans (including any REO mortgage loans) held by the issuing entity as of the end of the applicable collection period. The asset representations reviewer may be terminated and replaced without cause. Upon (i) the written direction of certificateholders evidencing not less than 25% of the voting rights requesting a vote to terminate and replace the asset representations reviewer with a proposed successor asset representations reviewer that is an eligible asset representations reviewer, and (ii) payment by such holders to the certificate administrator of the reasonable fees and expenses to be incurred by the |
| THE INFORMATION IN THIS STRUCTURAL AND COLLATERAL TERM SHEET IS NOT COMPLETE AND MAY BE AMENDED PRIOR TO THE TIME OF SALE. THIS TERM SHEET IS NOT AN OFFER TO SELL THESE SECURITIES AND IT IS NOT A SOLICITATION OF AN OFFER TO BUY THESE SECURITIES IN ANY JURISDICTION WHERE THE OFFER OR SALE IS NOT PERMITTED. |
| | | |
| | 27 | |
| Structural and Collateral Term Sheet | | BMO 2022-C3 |
| |
| Structural Overview |
| | certificate administrator in connection with administering such vote, the certificate administrator will promptly provide notice of such request to all certificateholders and the asset representations reviewer by posting such notice on its internet website, and by mailing such notice to all certificateholders and the asset representations reviewer. Upon the affirmative vote of certificateholders evidencing at least 75% of the voting rights allocable to those holders that exercise their right to vote (provided that holders representing the applicable Certificateholder Quorum exercise their right to vote within 180 days of the initial request for a vote), the trustee will be required to terminate all of the rights and obligations of the asset representations reviewer under the BMO 2022-C3 pooling and servicing agreement by written notice to the asset representations reviewer, and the proposed successor asset representations reviewer will be appointed. See “The Pooling and Servicing Agreement—The Asset Representations Reviewer” in the Preliminary Prospectus. |
| ■ Dispute Resolution Provisions: | | The mortgage loan sellers will be subject to the dispute resolution provisions set forth in the BMO 2022-C3 pooling and servicing agreement to the extent those provisions are triggered with respect to any mortgage loan sold to the depositor by a mortgage loan seller and such mortgage loan seller will be obligated under the related mortgage loan purchase agreement to comply with all applicable provisions and to take part in any mediation or arbitration proceedings that may result. Generally, in the event that a Repurchase Request (as defined in the Preliminary Prospectus) with respect to a mortgage loan is not “Resolved” (as defined below) within 180 days after the related mortgage loan seller receives such Repurchase Request, then the enforcing servicer will be required to send a notice to the “Initial Requesting Certificateholder” (if any) indicating the enforcing servicer’s intended course of action with respect to the Repurchase Request. If (a) the enforcing servicer’s intended course of action with respect to the Repurchase Request does not involve pursuing further action to exercise rights against the applicable mortgage loan seller with respect to the Repurchase Request and the Initial Requesting Certificateholder, if any, or any other certificateholder or certificate owner of Certificates wishes to exercise its right to refer the matter to mediation (including nonbinding arbitration) or arbitration, or (b) the enforcing servicer’s intended course of action is to pursue further action to exercise rights against the related mortgage loan seller with respect to the Repurchase Request but the Initial Requesting Certificateholder, if any, or any other certificateholder or certificate owner of Certificates does not agree with the dispute resolution method selected by the enforcing servicer, then the Initial Requesting Certificateholder, if any, or such other certificateholder or certificate owner may deliver a written notice to the enforcing servicer indicating its intent to exercise its right to refer the matter to either mediation or arbitration. In addition, any other certificateholder or certificate owner of Certificates may deliver, within the time frame provided in the BMO 2022-C3 pooling and servicing agreement, a written notice requesting the right to participate in any dispute resolution consultation that is conducted by the enforcing servicer following the enforcing servicer’s receipt of the notice described in the preceding sentence. “Resolved” means, with respect to a Repurchase Request, (i) that any material breach of representations and warranties or a material document defect has been cured, (ii) the related mortgage loan has been repurchased in accordance with the related mortgage loan purchase agreement, (iii) a mortgage loan has been substituted for the related mortgage loan in accordance with the related mortgage loan purchase agreement, (iv) the applicable mortgage loan seller has made a “loss of value payment”, (v) a contractually binding agreement has been entered into between the enforcing servicer, on behalf of the issuing entity, and the related mortgage loan seller that settles the related mortgage loan seller’s obligations under the related mortgage loan purchase agreement, or (vi) the related mortgage loan is no longer property of the issuing entity as a result of a sale or other disposition in accordance with the BMO 2022-C3 pooling and servicing agreement. See “The Pooling and Servicing Agreement—Dispute Resolution Provisions” in the Preliminary Prospectus. |
| ■ Liquidated Loan Waterfall: | | Upon liquidation of any mortgage loan, all net liquidation proceeds related to the mortgage loan (but not any related companion loan) will be applied (after allocation to offset certain advances and expenses) so that amounts allocated as a recovery of accrued and unpaid interest will not, in the first instance, include any delinquent interest that was not advanced as a result of Appraisal Reduction Amounts or interest that accrued on any junior note(s) if such mortgage loan is an AB Modified Loan. After the adjusted interest amount is so allocated, any remaining liquidation proceeds will be allocated to pay principal on the mortgage loan until the unpaid principal amount of the mortgage loan has been reduced to zero. Any remaining liquidation proceeds will then be allocated to pay delinquent interest that was not advanced as a result of Appraisal Reduction Amounts and any interest that accrued on any junior note(s) if such mortgage loan is an AB Modified Loan. |
| THE INFORMATION IN THIS STRUCTURAL AND COLLATERAL TERM SHEET IS NOT COMPLETE AND MAY BE AMENDED PRIOR TO THE TIME OF SALE. THIS TERM SHEET IS NOT AN OFFER TO SELL THESE SECURITIES AND IT IS NOT A SOLICITATION OF AN OFFER TO BUY THESE SECURITIES IN ANY JURISDICTION WHERE THE OFFER OR SALE IS NOT PERMITTED. |
| | | |
| | 28 | |
| Structural and Collateral Term Sheet | | BMO 2022-C3 |
| |
| Structural Overview |
| ■ Credit Risk Retention: | | This securitization transaction will be subject to the credit risk retention rules of Section 15G of the Securities Exchange Act of 1934, as amended. An economic interest in the credit risk of the mortgage loans in this transaction is expected to be retained pursuant to risk retention regulations (as codified at 12 CFR Part 244) promulgated under Section 15G (“Regulation RR”), as a combination of (A) an “eligible vertical interest” in the form of the Combined VRR Interest and (B) an “eligible horizontal residual interest” in the form of the HRR Certificates. Bank of Montreal will act as retaining sponsor under Regulation RR for this securitization transaction and is expected, on the Closing Date, to partially satisfy its risk retention obligation through the purchase by a third party purchaser of the HRR Certificates. For a further discussion of the manner in which the credit risk retention requirements are expected to be satisfied by Bank of Montreal, as retaining sponsor for this securitization transaction, see “Credit Risk Retention” in the Preliminary Prospectus. |
| ■ The Combined VRR Interest Prepayment Premiums and Yield Maintenance Charges: | | On each Distribution Date, the Vertically Retained Percentage of each yield maintenance charge and prepayment premium collected on the mortgage loans during the related collection period (or, in the case of an outside serviced mortgage loan, that accompanied a principal prepayment included in the aggregate available funds for such Distribution Date) will be required to be distributed to the holders of the Combined VRR Interest. |
| ■ Appraisal Reduction Amounts: | | On each Distribution Date, the Vertically Retained Percentage of any Appraisal Reduction Amounts will be allocated to the Combined VRR Interest to notionally reduce (to not less than zero) the principal balance thereof. |
| ■ Investor Communications: | | The certificate administrator is required to include on any Form 10–D any request received from a certificateholder to communicate with other certificateholders related to certificateholders exercising their rights under the terms of the BMO 2022-C3 pooling and servicing agreement. Any certificateholder wishing to communicate with other certificateholders regarding the exercise of its rights under the terms of the BMO 2022-C3 pooling and servicing agreement will be able to deliver a written request signed by an authorized representative of the requesting investor to the certificate administrator. |
| ■ Deal Website: | | The certificate administrator will maintain a deal website including, but not limited to: ● all special notices delivered. ● summaries of final asset status reports. ● all appraisals in connection with an appraisal reduction plus any subsequent appraisal updates. ● an “Investor Q&A Forum” and a voluntary investor registry. |
| ■ Cleanup Call: | | On any Distribution Date on which the aggregate unpaid principal balance of the mortgage loans (including mortgage loans as to which the related mortgaged properties have become REO properties) remaining in the issuing entity is less than 1% of the aggregate principal balance of the pool of mortgage loans as of the Cut-off Date, certain specified persons will have the option to purchase all of the remaining mortgage loans (and all property acquired through exercise of remedies in respect of any mortgage loan) at the price specified in the Preliminary Prospectus. Exercise of the option will terminate the issuing entity and retire the then outstanding certificates. If the aggregate certificate balances of the Class A-1, Class A-2, Class A-3, Class A-4, Class A-5, Class A-SB, Class A-S, Class B, Class C, Class D and Class E certificates and the notional amounts of the Class X-A, Class X-B, Class X-D and Class X-E certificates have been reduced to zero and if the master servicer has received from the remaining certificateholders the payment specified in the BMO 2022-C3 pooling and servicing agreement, the issuing entity could also be terminated in connection with an exchange of all the then-outstanding certificates (excluding the Class R certificates) and the Uncertificated VRR Interest for the mortgage loans remaining in the issuing entity, as further described under “The Pooling and Servicing Agreement—Optional Termination; Optional Mortgage Loan Purchase” in the Preliminary Prospectus. |
The Offered Certificates involve certain risks and may not be suitable for all investors. For information regarding certain risks associated with an investment in the Offered Certificates, see “Summary of Risk Factors” and “Risk Factors” in the Preliminary Prospectus. Capitalized terms used but not otherwise defined in this Term Sheet have the respective meanings assigned to those terms in the Preliminary Prospectus.
| THE INFORMATION IN THIS STRUCTURAL AND COLLATERAL TERM SHEET IS NOT COMPLETE AND MAY BE AMENDED PRIOR TO THE TIME OF SALE. THIS TERM SHEET IS NOT AN OFFER TO SELL THESE SECURITIES AND IT IS NOT A SOLICITATION OF AN OFFER TO BUY THESE SECURITIES IN ANY JURISDICTION WHERE THE OFFER OR SALE IS NOT PERMITTED. |
| | | |
| | 29 | |
| Structural and Collateral Term Sheet | | BMO 2022-C3 |
| |
| No. 1 – Park West Village |
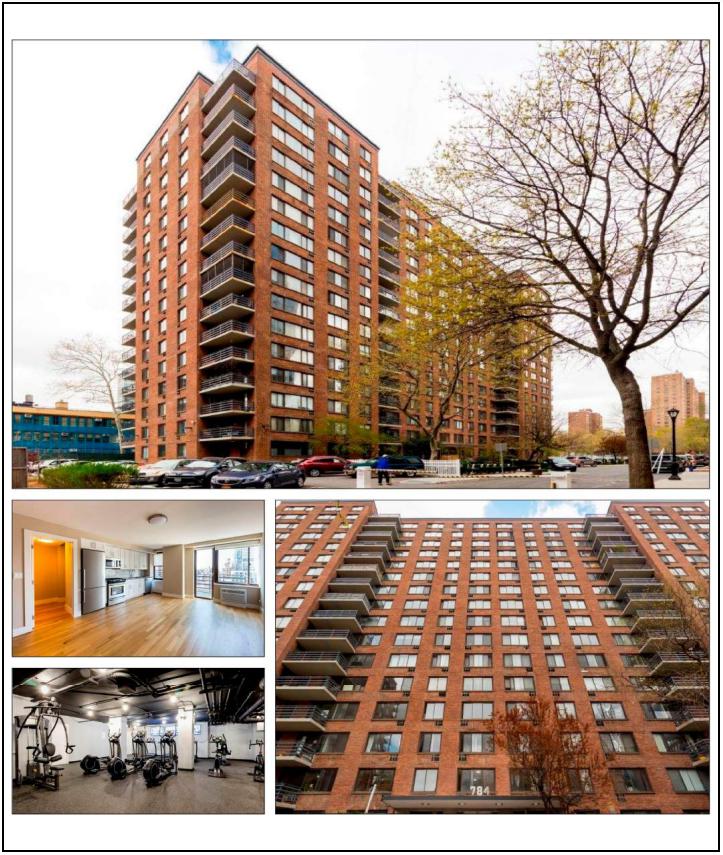
THE INFORMATION IN THIS STRUCTURAL AND COLLATERAL TERM SHEET IS NOT COMPLETE AND MAY BE AMENDED PRIOR TO THE TIME OF SALE. THIS TERM SHEET IS NOT AN OFFER TO SELL THESE SECURITIES AND IT IS NOT A SOLICITATION OF AN OFFER TO BUY THESE SECURITIES IN ANY JURISDICTION WHERE THE OFFER OR SALE IS NOT PERMITTED. |
| | 30 | |
| Structural and Collateral Term Sheet | | BMO 2022-C3 |
| |
| No. 1 – Park West Village |
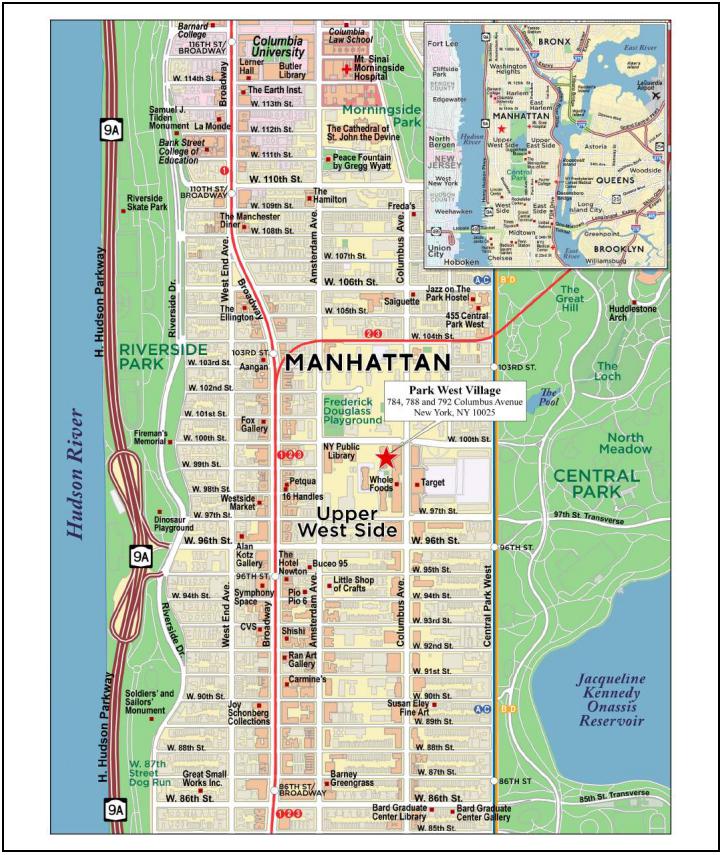
THE INFORMATION IN THIS STRUCTURAL AND COLLATERAL TERM SHEET IS NOT COMPLETE AND MAY BE AMENDED PRIOR TO THE TIME OF SALE. THIS TERM SHEET IS NOT AN OFFER TO SELL THESE SECURITIES AND IT IS NOT A SOLICITATION OF AN OFFER TO BUY THESE SECURITIES IN ANY JURISDICTION WHERE THE OFFER OR SALE IS NOT PERMITTED. |
| | 31 | |
| Structural and Collateral Term Sheet | | BMO 2022-C3 |
| |
| No. 1 – Park West Village |
| Mortgage Loan Information | | Property Information |
| Mortgage Loan Seller: | BMO, SMC | | Single Asset / Portfolio: | Single Asset |
| Original Principal Balance(1): | $37,500,000 | | Title: | Fee |
| Cut-off Date Principal Balance(1): | $37,500,000 | | Property Type – Subtype: | Multifamily – High Rise |
| % of IPB: | 5.2% | | Net Rentable Area (Units): | 850 |
| Loan Purpose: | Refinance | | Location: | New York, NY |
| Borrowers: | CF PWV LLC and SM PWV LLC | | Year Built / Renovated: | 1950, 1958, 1963 / 2014 |
| Borrower Sponsors: | Meyer Chetrit and | | Occupancy: | 94.7% |
| | Amended and Restated 2013 | | Occupancy Date: | 7/22/2022 |
| | LG Revocable Trust | | 4th Most Recent NOI (As of): | $16,725,571 (12/31/2019) |
| Interest Rate: | 4.65000% | | 3rd Most Recent NOI (As of): | $14,592,031 (12/31/2020) |
| Note Date: | 8/3/2022 | | 2nd Most Recent NOI (As of): | $13,357,008 (12/31/2021) |
| Maturity Date: | 8/6/2027 | | Most Recent NOI (As of)(5): | $15,491,417 (TTM 5/31/2022) |
| Interest-only Period: | 60 months | | UW Economic Occupancy: | 91.3% |
| Original Term: | 60 months | | UW Revenues: | $32,787,176 |
| Original Amortization Term: | None | | UW Expenses: | $9,786,898 |
| Amortization Type: | Interest Only | | UW NOI(5): | $23,000,278 |
| Call Protection(2): | L(26),D(29),O(5) | | UW NCF(5): | $23,000,278 |
| Lockbox / Cash Management: | Soft (Residential); Hard | | Appraised Value / Per Unit: | $575,000,000 / $676,471 |
| | (Commercial) / In Place | | Appraisal Date: | 1/20/2022 |
| Additional Debt(1): | Yes | | | |
| Additional Debt Balance(1)(3): | $150,000,000 / $177,500,000 | | | |
| Additional Debt Type(1)(3): | Pari Passu / Subordinate | | | |
| | | | | |
| Escrows and Reserves(4) | | Financial Information(1) |
| | Initial | Monthly | Initial Cap | | | Senior Loan | Whole Loan |
| Taxes: | $919,476 | $459,738 | N/A | | Cut-off Date Loan / Unit: | $220,588 | $429,412 |
| Insurance: | $0 | Springing | N/A | | Maturity Date Loan / Unit: | $220,588 | $429,412 |
| Replacement Reserves: | $850,000 | $0 | N/A | | Cut-off Date LTV: | 32.6% | 63.5% |
| Other Reserves: | $12,778,500 | Springing | N/A | | Maturity Date LTV: | 32.6% | 63.5% |
| | | | | | UW NCF DSCR(5): | 2.60x | 1.34x |
| | | | | | UW NOI Debt Yield(5): | 12.3% | 6.3% |
| | | | | | | | |
| Sources and Uses |
| Sources | Proceeds | % of Tot | al | | Uses | Proceeds | % of Tot | al |
| Senior Loan | $187,500,000 | 49.2 | % | | Loan Payoff | $321,864,741 | 84.5 | % |
| Subordinate Notes | 177,500,000 | 46.6 | | | Closing Costs | 44,400,316 | 11.7 | |
| Sponsor Equity | 15,813,033 | 4.2 | | | Upfront Reserves | 14,547,976 | 3.8 | |
| Total Sources | $380,813,033 | 100.0 | % | | Total Uses | $380,813,033 | 100.0 | % |
| (1) | The Park West Village Senior Loan (as defined below), with an original aggregate principal balance of $187,500,000, is part of the Park West Village Whole Loan (as defined below). The Financial Information in the chart above reflects the Park West Village Senior Loan and the Park West Village Whole Loan. For additional information, see “The Loan” below. |
| (2) | Defeasance of the Park West Village Whole Loan is permitted at any time after the earlier to occur of (a) the end of the two-year period commencing on the closing date of the securitization of the last promissory note representing a portion of the Park West Village Whole Loan to be securitized and (b) September 6, 2025. The assumed defeasance lockout period of 26 payments is based on the closing date of this transaction in October 2022. The actual lockout period may be longer. |
| (3) | The subordinate notes consist of (i) the B-A Note with an original principal balance of $66,500,000 and (ii) the B-B note with an original principal balance of $111,000,000, which is junior to the B-A Note in right of payment. The B-A note was contributed to the BBCMS 2022-C17 trust and backs only the related loan-specific certificates issued by the BBCMS 2022-C17 trust. For additional information, see “The Loan” below. |
| (4) | For a full description of Escrows and Reserves, please refer to “Escrows and Reserves” below. |
| (5) | UW NOI is greater than Most Recent NOI due in part to the borrower sponsors recently renovating 29 units, which has increased rents at the Park West Village Property (as defined below). Additionally, the UW NOI and UW NCF include disbursements from a Supplemental Income Reserve (as defined below) of $4,920,000. The Park West Village Senior Loan UW NCF DSCR and Park West Village Whole Loan UW NCF DSCR excluding credit for the upfront Supplemental Income Reserve are 2.05x and 1.05x respectively. The Park West Village Senior Loan UW NOI Debt Yield and Park West Village Whole Loan UW NOI Debt Yield excluding credit for the upfront Supplemental Income Reserve are 9.6% and 5.0%, respectively. Please refer to “Escrows and Reserves” below. |
THE INFORMATION IN THIS STRUCTURAL AND COLLATERAL TERM SHEET IS NOT COMPLETE AND MAY BE AMENDED PRIOR TO THE TIME OF SALE. THIS TERM SHEET IS NOT AN OFFER TO SELL THESE SECURITIES AND IT IS NOT A SOLICITATION OF AN OFFER TO BUY THESE SECURITIES IN ANY JURISDICTION WHERE THE OFFER OR SALE IS NOT PERMITTED. |
| | 32 | |
| Structural and Collateral Term Sheet | | BMO 2022-C3 |
| |
| No. 1 – Park West Village |
The Loan. The Park West Village mortgage loan (the “Park West Village Mortgage Loan”) is part of a whole loan (the “Park West Village Whole Loan”) that is evidenced by 12 pari passu senior promissory notes in the aggregate original principal amount of $187,500,000 (collectively, the “Park West Village Senior Loan”), one subordinate promissory Note B-A in the original principal amount of $66,500,000 (the “Park West Village Note B-A” or the “Park West Village Note B-A Subordinate Companion Loan”) and one further subordinate promissory Note B-B in the original principal amount of $111,000,000 (the “Park West Village Note B-B” or the “Park West Village Note B-B Subordinate Companion Loan” and together with the Park West Village Note B-A, the “Park West Village Subordinate Companion Notes” or “Park West Village Subordinate Companion Loans”). The Park West Village Senior Loan was co-originated on August 3, 2022 by Bank of Montreal (“BMO”), Starwood Mortgage Capital LLC (“SMC”) and Citi Real Estate Funding Inc. (“CREFI”). The Park West Village Note B-A Subordinate Companion Loan was originated on August 3, 2022 by BMO. The Park West Village Note B-B Subordinate Companion Loan was originated on August 3, 2022 by Park West Village Grand Avenue Partners, LLC, an affiliate of Oaktree Capital Management (“PWV Grand Avenue”). The Park West Village Whole Loan is secured by a first lien mortgage on the borrowers’ fee simple interest in three, 16-story multifamily buildings consisting of 850 residential units and one commercial unit located in the Upper West Side neighborhood of New York, New York (collectively, the “Park West Village Property”).
The Park West Village Mortgage Loan is evidenced by the non-controlling Notes A-4, A-9 and A-10, with an aggregate principal balance as of the Cut-off Date of $37,500,000. The remaining Park West Village pari passu senior promissory notes and the Park West Village Note B-A were contributed to or are expected to be contributed to other securitization trusts, as set forth in the table below, and the Park West Village Note B-B is currently held by PWV Grand Avenue. The Park West Village Senior Loan is senior in right of payment to the Park West Village Subordinate Companion Loans, and the Park West Village Note B-A Subordinate Companion Loan is senior in right of payment to the Park West Village Note B-B Subordinate Companion Loan. The Park West Village Note B-B will be the initial controlling note and PWV Grand Avenue, as the holder of such initial controlling note, will be entitled to exercise certain control rights with respect to the Park West Village Whole Loan under the related co-lender agreement. The Park West Village Note B-A will become the controlling note if the Note B-B Control Appraisal Period (as defined in the related co-lender agreement) has occurred and is continuing, and the Note A-1 will become the controlling note if both the Note B-B Control Appraisal Period and the Note B-A Control Appraisal Period (as defined in the related co-lender agreement) have occurred and are continuing, as further described in the table below. The Park West Village Whole Loan will be serviced pursuant to the pooling and servicing agreement for the BBCMS 2022-C17 securitization into which the Note A-1, which is the lead note, was contributed. For additional information, see “Subordinate Debt” below. The relationship between the holders of the Park West Village Whole Loan is governed by a co-lender agreement as described under “Description of the Mortgage Pool—The Whole Loans—The Park West Village Pari Passu-AB Whole Loan” in the Preliminary Prospectus.
| Whole Loan Summary |
| Note | Original Balance | Cut-off Date Balance | | Note Holder | Controlling Piece |
| A-1(1) | $17,500,000 | $17,500,000 | | BBCMS 2022-C17 | Yes |
| A-2(2) | $32,500,000 | $32,500,000 | | BMO | No |
| A-3(2) | $7,500,000 | $7,500,000 | | BMO | No |
| A-4 | $5,000,000 | $5,000,000 | | BMO 2022-C3 | No |
| A-5(2) | $17,500,000 | $17,500,000 | | CREFI | No |
| A-6(2) | $15,000,000 | $15,000,000 | | CREFI | No |
| A-7(2) | $15,000,000 | $15,000,000 | | CREFI | No |
| A-8(2) | $15,000,000 | $15,000,000 | | CREFI | No |
| A-9 | $17,500,000 | $17,500,000 | | BMO 2022-C3 | No |
| A-10 | $15,000,000 | $15,000,000 | | BMO 2022-C3 | No |
| A-11 | $15,000,000 | $15,000,000 | | BBCMS 2022-C17 | No |
| A-12 | $15,000,000 | $15,000,000 | | BBCMS 2022-C17 | No |
| Total Senior Loan | $187,500,000 | $187,500,000 | | | |
| B-A(1) | $66,500,000 | $66,500,000 | | BBCMS 2022-C17 (Loan Specific) | Yes |
| B-B(1) | $111,000,000 | $111,000,000 | | PWV Grand Avenue | Yes |
| Whole Loan | $365,000,000 | $365,000,000 | | | |
| (1) | The initial controlling note is Note B-B, but if a Note B-B Control Appraisal Period (as defined in the related co-lender agreement), for the Park West Village Whole Loan is continuing, the controlling note will be Note B-A. If a Note B-A Control Appraisal Period and a Note B-B Control Appraisal Period (each, as defined in the related co-lender agreement) are continuing, the controlling note will be Note A-1. Note B-A was contributed to the BBCMS 2022-C17 securitization trust and backs only the related loan-specific certificates issued by the BBCMS 2022-C17 securitization trust. The loan-specific controlling class representative designated pursuant to the pooling and servicing agreement for the BBCMS 2022-C17 securitization will be entitled to exercise the rights of the controlling note if Note B-A becomes the controlling note, and the directing certificateholder for the pooled certificates issued by the BBCMS 2022-C17 securitization trust will be entitled to exercise the rights of the controlling note if Note |
THE INFORMATION IN THIS STRUCTURAL AND COLLATERAL TERM SHEET IS NOT COMPLETE AND MAY BE AMENDED PRIOR TO THE TIME OF SALE. THIS TERM SHEET IS NOT AN OFFER TO SELL THESE SECURITIES AND IT IS NOT A SOLICITATION OF AN OFFER TO BUY THESE SECURITIES IN ANY JURISDICTION WHERE THE OFFER OR SALE IS NOT PERMITTED. |
| | 33 | |
| Structural and Collateral Term Sheet | | BMO 2022-C3 |
| |
| No. 1 – Park West Village |
A-1 becomes the controlling note, in each case to the extent provided in the related co-lender agreement and the pooling and servicing agreement for the BBCMS 2022-C17 securitization. See “Description of the Mortgage Pool—The Whole Loans—The Park West Village Pari Passu-AB Whole Loan” in the Preliminary Prospectus.
| (2) | Expected to be contributed to one or more future securitization(s). |
The Property. The Park West Village Property consists of three, 16-story multifamily buildings comprised of 850 residential units totaling 643,708 square feet and one commercial unit totaling 1,039 square feet. The commercial tenant at the Park West Village Property has a remaining weighted average lease term of approximately 0.8 years. The Park West Village Property is located in the Upper West Side neighborhood and is situated approximately 0.5 miles from the 96th Street and 103rd Street subway stations with access to the A, B, and C subway lines. The Park West Village Property was built in 1950, 1958, and 1963 and renovated in 2014, and features a range of studio, one-bedroom, two-bedroom, three-bedroom, and four-bedroom residential units. Of the 850 residential units, 418 of the units are rent-stabilized. The Park West Village Property units all feature hardwood flooring, nearly nine-foot ceiling heights, full kitchen appliances, and certain units include a private balcony. Renovated units feature granite or marble countertop kitchens, stainless steel appliances including a refrigerator, dishwasher, microwave, and gas-fired stove and oven, and washer and dryer. Community spaces include an outdoor children’s playground, dog run, valet services, and onsite surface parking.
The sole commercial tenant, Carol Maryan Architect, P.C. (“Carol Maryan Architect”), occupies 1,039 square feet (100.0% of the commercial NRA and 0.2% of the total NRA, 100.0% of the underwritten commercial base rent and 0.3% of the total underwritten base rent) with a lease expiration of July 31, 2023. Carol Maryan Architect is a boutique architectural firm founded by Carol Maryan in 1983. Carol Maryan Architect provides architectural and interior designs to an array of clients, including private individuals, corporations, developers, creative services firms, and public entities.
Borrower Sponsors’ Renovation Plan. The information set forth below regarding the borrower sponsors’ renovation plans reflects forward-looking statements and certain projections provided by the borrower sponsors, assuming, among other things, that the borrowers will complete certain projected renovations by December 1, 2024 and that all of the newly renovated and currently unoccupied units will be leased at current market rate rent and all of the currently occupied units will continue to be leased at the current contractual rental rates. We cannot assure you that such assumptions and projections provided by the borrower sponsors will materialize in the future as expected or at all.
The borrower sponsors have identified 325 units that will be renovated, which consist of 270 units that are projected to receive a light renovation and 55 units that are projected to receive a major renovation. The 55 major renovation units will be combined into 27 units post-renovation. Of the 55 units projected to receive major renovations, 28 units are rent-stabilized, all of which are currently vacant. Major renovations will feature the combination of two or three units into one larger unit or a significant floor plan alteration and are expected to take approximately four to six months to complete. Light renovation units will feature aesthetic and systems upgrades, such as new appliances, countertops, lighting upgrades and removal of carpeting. At origination, the borrowers deposited $7,858,500 into a unit upgrade reserve with the lender, to be disbursed to pay or reimburse the borrowers for unit renovation costs pursuant to the Park West Village Whole Loan documents. See “Escrows and Reserves” below.
The major renovation units are projected to receive an average renovation of approximately $48,109 per unit and are anticipated to increase rent from $46.18 per square foot in-place to $81.00 per square foot. The borrower sponsors have completed 12 major renovations to date, which have been combined into a total of seven units. These major renovations have achieved average annual rent increases from $29.39 per square foot to $72.82 per square foot.
The light renovation units are projected to receive an average renovation of $19,306 per unit and are anticipated to increase rent from $65.31 per square foot in-place to $81.00 per square foot. The borrower sponsors have completed 17 light renovations to date. These light renovations have achieved average annual rent increases from $38.24 per square foot to $85.59 per square foot.
THE INFORMATION IN THIS STRUCTURAL AND COLLATERAL TERM SHEET IS NOT COMPLETE AND MAY BE AMENDED PRIOR TO THE TIME OF SALE. THIS TERM SHEET IS NOT AN OFFER TO SELL THESE SECURITIES AND IT IS NOT A SOLICITATION OF AN OFFER TO BUY THESE SECURITIES IN ANY JURISDICTION WHERE THE OFFER OR SALE IS NOT PERMITTED. |
| | 34 | |
| Structural and Collateral Term Sheet | | BMO 2022-C3 |
| |
| No. 1 – Park West Village |
The following table presents detailed information with respect to the current market rate units at the Park West Village Property:
| As Is Market Rate Unit Summary |
| Unit Type | No. of Units(1) | % of Total | Average Unit Size (SF)(1) | Average Monthly Rental Rate(1) | Average Monthly Rental Rate per SF(1) | Average Monthly Market Rental Rate(2) | Average Monthly Market Rental Rate per SF(2) |
| Studio | 166 | 38.4 | % | 464 | $2,869 | $6.19 | $3,243 | $5.85 |
| 1 Bedroom | 164 | 38.0 | | 836 | $4,505 | $5.39 | $4,768 | $5.08 |
| 2 Bedroom | 89 | 20.6 | | 918 | $5,140 | $5.62 | $5,355 | $5.39 |
| 3 Bedroom | 12 | 2.8 | | 1,264 | $7,708 | $6.05 | $8,977 | $5.74 |
| 4 Bedroom | 1 | 0.2 | | 1,832 | $7,500 | $4.09 | $7,500 | $4.09 |
| Total/Wtd. Avg. | 432 | 100.0 | % | 724 | $4,091 | $5.67 | $4,477 | $5.37 |
| (1) | Based on the underwritten rent roll as of July 22, 2022. |
The following table presents detailed information with respect to the current rent-stabilized units at the Park West Village Property:
| As Is Rent-Stabilized Unit Summary |
| Unit Type | No. of Units(1) | % of Total | Average Unit Size (SF)(1) | Average Monthly Rental Rate(1) | Average Monthly Rental Rate per SF(1) | Average Monthly Market Rental Rate(2) | Average Monthly Market Rental Rate per SF(2) |
| Studio | 115 | 27.5 | % | 469 | $1,175 | $2.52 | $1,318 | $2.49 |
| 1 Bedroom | 225 | 53.8 | | 842 | $1,337 | $1.58 | $1,417 | $1.60 |
| 2 Bedroom | 77 | 18.4 | | 1,119 | $1,779 | $1.58 | $1,843 | $1.51 |
| 3 Bedroom | 1 | 0.2 | | 1,153 | $3,000 | $2.60 | $3,000 | $2.60 |
| Total/Wtd. Avg. | 418 | 100.0 | % | 791 | $1,378 | $1.73 | $1,473 | $1.72 |
| (1) | Based on the underwritten rent roll as of July 22, 2022. |
The following table presents detailed information with respect to the projected post-renovation market rate units at the Park West Village Property:
| Projected Post-Renovation Market Rate Unit Summary |
| Unit Type | No. of Units(1) | % of Total | Average Unit Size (SF)(1) | Average Monthly Rental Rate(1) | Average Monthly Rental Rate per SF(1) | Average Monthly Market Rental Rate(2) | Average Monthly Market Rental Rate per SF(2) |
| Studio | 155 | 38.3 | % | 464 | $3,085 | $6.66 | $3,243 | $5.85 |
| 1 Bedroom | 153 | 37.8 | | 837 | $5,450 | $6.51 | $4,768 | $5.08 |
| 2 Bedroom | 85 | 21.0 | | 910 | $6,108 | $6.71 | $5,355 | $5.39 |
| 3 Bedroom | 11 | 2.7 | | 1,298 | $8,835 | $6.80 | $8,977 | $5.74 |
| 4 Bedroom | 1 | 0.2 | | 1,832 | $12,366 | $6.75 | $7,500 | $4.09 |
| 5 Bedroom | NAP | NA | P | NAP | NAP | NAP | NAP | NAP |
| Total/Wtd. Avg. | 405 | 100.0 | % | 724 | $4,792 | $6.62 | $4,477 | $5.37 |
| (1) | Based on the underwritten rent roll as of July 22, 2022. |
THE INFORMATION IN THIS STRUCTURAL AND COLLATERAL TERM SHEET IS NOT COMPLETE AND MAY BE AMENDED PRIOR TO THE TIME OF SALE. THIS TERM SHEET IS NOT AN OFFER TO SELL THESE SECURITIES AND IT IS NOT A SOLICITATION OF AN OFFER TO BUY THESE SECURITIES IN ANY JURISDICTION WHERE THE OFFER OR SALE IS NOT PERMITTED. |
| | 35 | |
| Structural and Collateral Term Sheet | | BMO 2022-C3 |
| |
| No. 1 – Park West Village |
The following table presents detailed information with respect to the projected post-renovation rent-stabilized units at the Park West Village Property:
| Projected Post-Renovation Rent-Stabilized Unit Summary |
| Unit Type | No. of Units(1) | % of Total | Average Unit Size (SF)(1) | Average Monthly Rental Rate(1) | Average Monthly Rental Rate per SF(1) | Average Monthly Market Rental Rate(2) | Average Monthly Market Rental Rate per SF(2) |
| Studio | 105 | 25.2 | % | 465 | $1,292 | $2.78 | $1,318 | $2.49 |
| 1 Bedroom | 212 | 50.8 | | 847 | $1,468 | $1.73 | $1,417 | $1.60 |
| 2 Bedroom | 88 | 21.1 | | 1,163 | $3,241 | $2.79 | $1,843 | $1.51 |
| 3 Bedroom | 10 | 2.4 | | 1,529 | $9,872 | $6.46 | $3,000 | $2.60 |
| 4 Bedroom | 1 | 0.2 | | 1,700 | $11,473 | $6.75 | NAP | NAP |
| 5 Bedroom | 1 | 0.2 | | 2,642 | $17,831 | $6.75 | NAP | NAP |
| Total/Wtd. Avg. | 417 | 100.0 | % | 840 | $2,063 | $2.46 | $1,473 | $1.72 |
| (1) | Based on the underwritten rent roll as of July 22, 2022. |
COVID-19 Update. As of July 22, 2022, the Park West Village Property is open and operating. As of the date of this term sheet, the Park West Village Whole Loan is not subject to any forbearance, modification or debt service relief request. The first payment date of the Park West Village Whole Loan was September 6, 2022.
Environmental. According to the Phase I report dated January 20, 2022, there was no evidence of any recognized environmental conditions at the Park West Village Property. The Phase I environmental assessment, however, identified historical recognized environmental conditions at the Park West Village Property.
The following table presents certain information relating to the historical and current occupancy of the Park West Village Property:
| Historical and Current Multifamily Occupancy(1) |
| 2019 | 2020 | 2021 | Current(2) |
| 94.2% | 91.2% | 87.9% | 94.7% |
| (1) | Historical occupancies are as of July 31 of each respective year. |
| (2) | Current occupancy is as of July 22, 2022. |
THE INFORMATION IN THIS STRUCTURAL AND COLLATERAL TERM SHEET IS NOT COMPLETE AND MAY BE AMENDED PRIOR TO THE TIME OF SALE. THIS TERM SHEET IS NOT AN OFFER TO SELL THESE SECURITIES AND IT IS NOT A SOLICITATION OF AN OFFER TO BUY THESE SECURITIES IN ANY JURISDICTION WHERE THE OFFER OR SALE IS NOT PERMITTED. |
| | 36 | |
| Structural and Collateral Term Sheet | | BMO 2022-C3 |
| |
| No. 1 – Park West Village |
The following table presents certain information relating to the operating history and underwritten cash flows of the Park West Village Property:
| Operating History and Underwritten Net Cash Flow |
| | 2019 | 2020 | 2021 | TTM(1) | Underwritten | Per Unit | %(2) |
| Residential Base Rent | $24,956,720 | $22,792,744 | $22,129,703 | $24,536,542 | $28,419,283 | $33,434 | 83.9 | % |
| Commercial Base Rent | 71,777 | 70,353 | 75,268 | 74,908 | 79,852 | 94 | 0.2 | |
| Gross Potential Rent | $25,028,497 | $22,863,097 | $22,204,971 | $24,611,451 | $28,499,136 | $33,528 | 84.2 | % |
| Total Reimbursements | 2,945 | 17,850 | 0 | 0 | 11,355 | 13 | 0.0 | |
| Supplemental Income Reserve(3) | 0 | 0 | 0 | 0 | 4,919,913 | 5,788 | 14.5 | |
| Total Other Income | 567,004 | 760,807 | 477,438 | 424,187 | 424,187 | 499 | 1.3 | |
| Net Rental Income | $25,598,446 | $23,641,754 | $22,682,409 | $25,035,638 | $33,854,591 | $39,829 | 100.0 | % |
| (Vacancy/Credit Loss) | (2,062) | (2,942) | 0 | 0 | (1,067,415) | (1,256) | (3.2 | ) |
| Effective Gross Income | $25,596,385 | $23,638,812 | $22,682,409 | $25,035,638 | $32,787,176 | $38,573 | 96.8 | % |
| Total Expenses | $8,870,813 | $9,046,781 | $9,325,401 | $9,544,221 | $9,786,898 | $11,514 | 29.8 | % |
| Net Operating Income(3) | $16,725,571 | $14,592,031 | $13,357,008 | $15,491,417 | $23,000,278 | $27,059 | 70.2 | % |
| Total Capex/RR(4) | 0 | 0 | 0 | 0 | 0 | 0 | 0 | |
| Net Cash Flow | $16,725,571 | $14,592,031 | $13,357,008 | $15,491,417 | $23,000,278 | $27,059 | 70.2 | % |
| (1) | TTM represents the trailing 12 months ending May 2022. |
| (2) | % column represents percent of Net Rental Income for all revenue lines and represents percent of Effective Gross Income for the remainder of the fields. |
| (3) | The Underwritten Net Operating Income is greater than the TTM Net Operating Income due in part to (i) the borrower sponsors recently renovating 29 units, which has increased rents at the Park West Village Property and (ii) disbursements from the Supplemental Income Reserve. Please refer to “Escrows and Reserves” below. |
| (4) | The borrower sponsors funded five years’ worth of Capex/RR at origination. |
The Market. The Park West Village Property is located in New York, New York, within the New York, NY-NJ-PA Metropolitan Statistical Area. According to the appraisal, the unemployment rate from 2011 through 2021 in New York City increased at an average annual rate of 0.3% and is expected to decrease at an average annual rate of 4.7% between 2022 and 2026. The estimated 2021 median annual household income in New York City was $68,261. The leading industries in New York City are education and health, professional and business, government, and trade, transportation and utilities. The largest employer in New York City is Northwell Health, which employs 68,088 people. The Park West Village Property is located on the blocks bound by Columbus Avenue, Amsterdam Avenue, West 97th Street and West 100th Street. The buildings at 784 Columbus Avenue and 792 Columbus Avenue have street frontage on West 97th and 100th Streets, respectively. The building at 788 Columbus Avenue does not have street frontage; however, all three of the Park West Village Property buildings are accessible from Columbus Avenue via a breezeway through the development to the east of the subject buildings, which comprises the entire blockfront of Columbus Avenue from West 97th Street to West 100th Street. The Upper West Side is primarily residential in nature, with adequate retail to support the area. Manhattan’s central business district is located to the southeast of the Upper West Side. Immediately to the south is the Clinton area, which is characterized by a wide range of uses including residential, office buildings and the Theater District. The neighborhood bordering the Upper West Side to the north is known as Morningside Heights, which is primarily residential and home to Columbia University. The Park West Village Property benefits from its proximity to Columbus Avenue, as well as Broadway, which is dense with prime retail and commercial space.
The Park West Village Property is situated in the Upper West Side multifamily submarket. According to CoStar, as of February 2022, the Upper West Side multifamily submarket had an overall vacancy rate of 2.2%, with net absorption totaling 11 units. The vacancy rate decreased 1.7% over the past 12 months. Rental rates increased by 5.9% for the past 12 months and ended at $4,760 per unit per month. A total of 336 units are still under construction at the end of the first quarter of 2022.
According to the appraisal, the 2021 population for New York City was approximately 8,305,600 and is forecasted to grow to approximately 8,317,700 in 2022, and approximately 8,335,900 in 2026.
THE INFORMATION IN THIS STRUCTURAL AND COLLATERAL TERM SHEET IS NOT COMPLETE AND MAY BE AMENDED PRIOR TO THE TIME OF SALE. THIS TERM SHEET IS NOT AN OFFER TO SELL THESE SECURITIES AND IT IS NOT A SOLICITATION OF AN OFFER TO BUY THESE SECURITIES IN ANY JURISDICTION WHERE THE OFFER OR SALE IS NOT PERMITTED. |
| | 37 | |
| Structural and Collateral Term Sheet | | BMO 2022-C3 |
| |
| No. 1 – Park West Village |
The following table presents certain information relating to comparable multifamily rental property to the Park West Village Property:
| Comparable Rental Summary(1) |
| Property / Location | Year Built | Occupancy | # of Units | Unit Mix | Average SF per Unit | Average Rent per SF | Average Rent per Unit |
| Park West Village(2) | 1950, 1958, 1963 | 94.7% | 850 | Studio | 466 | $4.79 | $2,226 |
| 784, 788 and 792 Columbus Avenue | 1 Bed | 840 | $3.22 | $2,711 |
| New York, NY | 2 Bed | 1,011 | $3.63 | $3,663 |
| | 3 Bed | 1,255 | $5.79 | $7,316 |
| | 4 Bed | 1,832 | $4.09 | $7,500 |
| West 96th Apartments | 1987 | 95.2% | 207 | 1 Bed | 733 | $6.28 | $4,606 |
| 750 Columbus Avenue | | | | 2 Bed | 1,006 | $6.25 | $6,287 |
| New York, NY | | | | 3 Bed | 1,421 | $6.23 | $8,853 |
| The Westmont Apartments | 1986 | 100.0% | 163 | Studio | 610 | $5.75 | $3,509 |
| 730 Columbus Avenue | | | | 1 Bed | 802 | $5.59 | $4,479 |
| New York, NY | | | | 2 Bed | 1095 | $5.81 | $6,360 |
| | | | | 3 Bed | 1,403 | $5.67 | $7,951 |
| Stonehenge Village | 1930 | 94.5% | 414 | Studio | 515 | $5.92 | $3,050 |
| 160 West 97th Street | | | | 1 Bed | 686 | $6.41 | $4,400 |
| New York, NY | | | | 2 Bed | 951 | $5.96 | $5,667 |
| | | | | 3 Bed | 1,123 | $5.79 | $6,500 |
| The Greystone | 1923 | 98.6% | 366 | Studio | 321 | $9.14 | $2,938 |
| 212 West 91st Street | | | | 1 Bed | 583 | $6.53 | $3,809 |
| New York, NY | | | | 2 Bed | 955 | $6.13 | $5,850 |
| Columbus Square | 2009 | 93.7% | 710 | Studio | 445 | $8.13 | $3,616 |
| 808 Columbus Avenue | | | | 1 Bed | 649 | $7.67 | $4,979 |
| New York, NY | | | | 2 Bed | 970 | $7.46 | $7,235 |
| | | | | 3 Bed | 1,376 | $6.28 | $8,640 |
| The Paris New York | 1931 | 98.9% | 176 | Studio | 516 | $6.19 | $3,195 |
| 752 West End Avenue | | | | 1 Bed | 501 | $6.13 | $3,070 |
| New York, NY | | | | 2 Bed | 1,065 | $5.97 | $6,362 |
| | | | | 3 Bed | 1,894 | $5.33 | $10,095 |
| The Lyric | 1996 | 98.6% | 285 | Studio | 527 | $6.86 | $3,618 |
| 255 West 94th Street | | | | 1 Bed | 677 | $6.95 | $4,701 |
| New York, NY | | | | 2 Bed | 1,077 | $6.80 | $7,320 |
| (1) | Source: Appraisal, unless otherwise indicated. |
| (2) | Based on underwritten rent roll dated as of July 22, 2022. Average Rent per SF and Average Rent per Unit reflect average monthly in-place rent for occupied units. |
The Borrowers. The borrowers under the Park West Village Whole Loan are CF PWV LLC and SM PWV LLC, as tenants-in-common, each a single-purpose Delaware limited liability company with two independent directors. Legal counsel to the borrowers delivered a non-consolidation opinion in connection with the origination of the Park West Village Whole Loan.
The Borrower Sponsors. The borrower sponsors and non-recourse carveout guarantors are Meyer Chetrit and Amended and Restated 2013 LG Revocable Trust, a trust established by Laurance Gluck. Meyer Chetrit is one of the controllers of The Chetrit Group. The Chetrit Group is an experienced, privately held New York City real estate development firm controlled by two brothers: Joseph and Meyer Chetrit. The Chetrit Group, which is headquartered in Manhattan, has ownership interests in over 14 million square feet of commercial and residential real estate across the United States, including New York, Chicago, Miami, and Los Angeles, as well as internationally.
Laurence Gluck is the founder of Stellar Management, a real estate development and management firm founded in 1985. Based in New York City, Stellar Management owns and manages a portfolio of over 13,000 apartments in 100 buildings located across New York City and over three million square feet of office space. Prior to founding Stellar Management, Laurence Gluck served as a real estate attorney at Proskauer, Rose, Goetz & Mendelsohn and later as a partner at Dreyer & Traub. Laurence Gluck also formerly served as a member of the Board of Governors of the Real Estate Board of New York.
Property Management. The Park West Village Property is managed by PWV Management LLC, an affiliate of the borrowers.
THE INFORMATION IN THIS STRUCTURAL AND COLLATERAL TERM SHEET IS NOT COMPLETE AND MAY BE AMENDED PRIOR TO THE TIME OF SALE. THIS TERM SHEET IS NOT AN OFFER TO SELL THESE SECURITIES AND IT IS NOT A SOLICITATION OF AN OFFER TO BUY THESE SECURITIES IN ANY JURISDICTION WHERE THE OFFER OR SALE IS NOT PERMITTED. |
| | 38 | |
| Structural and Collateral Term Sheet | | BMO 2022-C3 |
| |
| No. 1 – Park West Village |
Escrows and Reserves. At origination of the Park West Village Whole Loan, the borrowers deposited approximately (i) $919,476 into a real estate tax reserve account, (ii) $850,000 into a replacement reserve account, (iii) $7,858,500 into a unit upgrade reserve account and (iv) $4,920,000 into a supplemental income reserve account.
Tax Escrows – The borrowers are required to deposit into a real estate tax reserve, on a monthly basis, 1/12th of the taxes that the lender estimates will be payable over the next-ensuing 12-month period (initially estimated to be approximately $459,738).
Insurance Escrows – The borrowers are required to deposit into an insurance reserve, on a monthly basis, 1/12th of the amount which will be sufficient to pay the insurance premiums due for the renewal of coverage afforded by such policies; provided, however, such insurance reserve has been conditionally waived so long as (i) no event of default under the Park West Village Whole Loan is continuing and (ii) the borrowers maintain a blanket policy meeting the requirements of the Park West Village Whole Loan documents. The borrowers are currently maintaining a blanket policy.
Supplemental Income Reserve – The borrowers deposited $4,920,000 into a supplemental income reserve account (the “Supplemental Income Reserve”) at origination of the Park West Village Whole Loan. Unless and until the Park West Village Property (excluding the amount on deposit in the Supplemental Income Reserve) achieves a 6.25% “transient” Park West Village Whole Loan debt yield (calculated on the basis of annualized net cash flow for a three-month period ending with the most recently completed month), the lender may require the borrowers to make additional Supplemental Income Reserve deposits if and to the extent the lender determines, in its reasonable discretion on a quarterly basis after July 6, 2023 during the Park West Village Whole Loan term, that additional supplemental income reserve deposits are required in order to achieves (when the additional deposit and all other deposits in the Supplemental Income Reserve account are added to net cash flow for the Park West Village Property) a 6.25% transient Park West Village Whole Loan debt yield for the following 12, 9, 6 or 3 months (such applicable 12-, 9-, 6- or 3- month period depending on the quarter with respect to which such determination by the lender is made). The guarantors provided a related carry guaranty of certain carry costs, including real estate taxes, insurance premiums, debt service and operating expenses, for any period until the Park West Village Property achieves a 6.25% transient Park West Village Whole Loan debt yield (excluding the amount on deposit in the Supplemental Income Reserve). The obligations of the guarantors under such carry guaranty are limited to the additional Supplemental Income Reserve deposit amounts as and when due.
So long as no event of default under the Park West Village Whole Loan is continuing, on each payment date, the lender is required to transfer the Monthly Supplemental Income Reserve Disbursement Amount (as defined below) from the Supplemental Income Reserve to the cash management account. Such funds deposited into the cash management account will be required to be applied with all other funds then on deposit in the cash management account in the order of priority set forth in the Park West Village Whole Loan documents, as described under “Lockbox / Cash Management” below. So long as no event of default under the Park West Village Whole Loan is continuing, upon such time as the lender has reasonably determined that the Park West Village Property (excluding the amount on deposit in the Supplemental Income Reserve) has achieved a 6.25% or higher for one calendar quarter “transient” Park West Village Whole Loan debt yield (calculated on the basis of annualized net cash flow for a three-month period ending with the most recently completed month), then upon the borrowers’ written request, all of the funds in the Supplemental Income Reserve will be required to be disbursed to the borrowers; provided, however, if a Cash Trap Period (as defined below) is then continuing, then such funds will not be disbursed to the borrowers, and such funds will instead be deposited into the excess cash reserve account, to be applied in accordance with the terms of the Park West Village Whole Loan documents.
“Monthly Supplemental Income Reserve Disbursement Amount” means 1/12th of (x) the initial Supplemental Income Reserve deposit with respect to the first 12 payment dates occurring during the term of the Park West Village Whole Loan, and (y) each Supplemental Income Reserve additional deposit amount with respect to the 12 payment dates following the date that the borrowers are required to deposit such Supplemental Income Reserve additional deposit amount pursuant to the terms of the Park West Village Whole Loan documents; provided that, if at any time the lender reassesses the Supplemental Income Reserve additional deposit amount in accordance with the terms of the Park West Village Whole Loan documents, the Monthly Supplemental Income Reserve Disbursement Amount will be adjusted so that all of funds in the Supplemental Income Reserve will be disbursed in equal monthly installments ending on such Supplemental Income Reserve reassessment date (i.e., so that there will be no funds in the Supplemental Income Reserve on deposit on such Supplemental Income Reserve reassessment date).
THE INFORMATION IN THIS STRUCTURAL AND COLLATERAL TERM SHEET IS NOT COMPLETE AND MAY BE AMENDED PRIOR TO THE TIME OF SALE. THIS TERM SHEET IS NOT AN OFFER TO SELL THESE SECURITIES AND IT IS NOT A SOLICITATION OF AN OFFER TO BUY THESE SECURITIES IN ANY JURISDICTION WHERE THE OFFER OR SALE IS NOT PERMITTED. |
| | 39 | |
| Structural and Collateral Term Sheet | | BMO 2022-C3 |
| |
| No. 1 – Park West Village |
Lockbox / Cash Management. The Park West Village Whole Loan is structured with a hard lockbox for commercial tenants and a soft lockbox for residential tenants, and in place cash management. The borrowers are required to deposit all rents collected from residential tenants into the lockbox account within three days of receipt. The borrowers are required to deliver a tenant direction letter to commercial tenants to deposit all rents directly to the lockbox account. The borrowers are required to cause all amounts deposited into the lockbox account to be transferred on each business day to a cash management account controlled by the lender. Absent an event of default under the Park West Village Whole Loan documents, funds on deposit in the cash management account are applied on each monthly payment date in amounts and in the order of priority set forth in the Park West Village Whole Loan Documents, including any required tax and insurance reserve deposits, deposit account bank fees, monthly debt service on the Park West Village Whole Loan, other amounts payable to the lender under the Park West Village Whole Loan, operating expenses and extraordinary expenses reflected in the annual budget or otherwise approved by lender, with the remaining funds in the cash management account to be disbursed to the borrowers unless a Cash Trap Period is then continuing, in which event the remaining funds will be deposited into an excess cash reserve account under the lender’s control, and released to the borrower when the Cash Trap Period ends. Upon an event of default under the Park West Village Whole Loan documents, the lender will apply funds in such priority as it may determine.
A “Cash Trap Period” means a period commencing upon the earliest to occur of (i) an event of default; (ii) any bankruptcy action of the borrowers, principal, guarantor or manager has occurred; and (iii) the failure by the borrowers, after stabilization (i.e. until a Park West Village Whole Loan debt yield of at least 6.25% has been achieved (without taking into account any disbursement of Supplemental Income Reserve funds) for one calendar quarter, provided no event of default then exists), to maintain a Park West Village Whole Loan debt service coverage ratio of at least 1.20x and will be cured upon (a) with respect to clause (i) above, the lender accepts a cure of the event of default; (b) in the case of a bankruptcy action by or against manager only, the borrowers replace the manager with a qualified replacement as defined in the Park West Village Whole Loan documents; or (c) with respect to clause (iii) above, the Park West Village Whole Loan debt service coverage ratio is equal to or greater than 1.25x for one calendar quarter.
Subordinate Debt. The Park West Village Property also secures the Park West Village Note B-A Subordinate Companion Loan, which has a Cut-off Date principal balance of $66,500,000 and the Park West Village Note B-B Subordinate Companion Loan, which has a Cut-off Date principal balance of $111,000,000. The Park West Village Subordinate Companion Loans accrue interest at 4.65000% per annum. The Park West Village Senior Loan is senior in right of payment to the Park West Village Note B-A Subordinate Companion Loan and the Park West Village Note B-B Subordinate Companion Loan, and the Park West Village Note B-A Subordinate Companion Loan is senior in right of payment to the Park West Village Note B-B Subordinate Companion Loan.
| Whole Loan Metrics |
| | % of Whole Loan | Cumulative Cut-off Date LTV | Cumulative UW NOI Debt Yield(1) | Cumulative UW NCF DSCR(1) |
| A Notes | 51.4% | 32.6% | 12.3% | 2.60x |
| B-A Note | 18.2% | 44.2% | 9.1% | 1.92x |
| B-B Note | 30.4% | 63.5% | 6.3% | 1.34x |
| (1) | The UW NOI and UW NCF includes disbursements from a Supplemental Income Reserve of $4,920,000. Please refer to “Escrows and Reserves” above. |
Mezzanine Debt. None.
Partial Release. Not permitted.
Ground Lease. None.
THE INFORMATION IN THIS STRUCTURAL AND COLLATERAL TERM SHEET IS NOT COMPLETE AND MAY BE AMENDED PRIOR TO THE TIME OF SALE. THIS TERM SHEET IS NOT AN OFFER TO SELL THESE SECURITIES AND IT IS NOT A SOLICITATION OF AN OFFER TO BUY THESE SECURITIES IN ANY JURISDICTION WHERE THE OFFER OR SALE IS NOT PERMITTED. |
| | 40 | |
| Structural and Collateral Term Sheet | | BMO 2022-C3 |
| |
| No. 2 – Kingston Square Apartments |

THE INFORMATION IN THIS STRUCTURAL AND COLLATERAL TERM SHEET IS NOT COMPLETE AND MAY BE AMENDED PRIOR TO THE TIME OF SALE. THIS TERM SHEET IS NOT AN OFFER TO SELL THESE SECURITIES AND IT IS NOT A SOLICITATION OF AN OFFER TO BUY THESE SECURITIES IN ANY JURISDICTION WHERE THE OFFER OR SALE IS NOT PERMITTED. |
| | 41 | |
| Structural and Collateral Term Sheet | | BMO 2022-C3 |
| |
| No. 2 – Kingston Square Apartments |
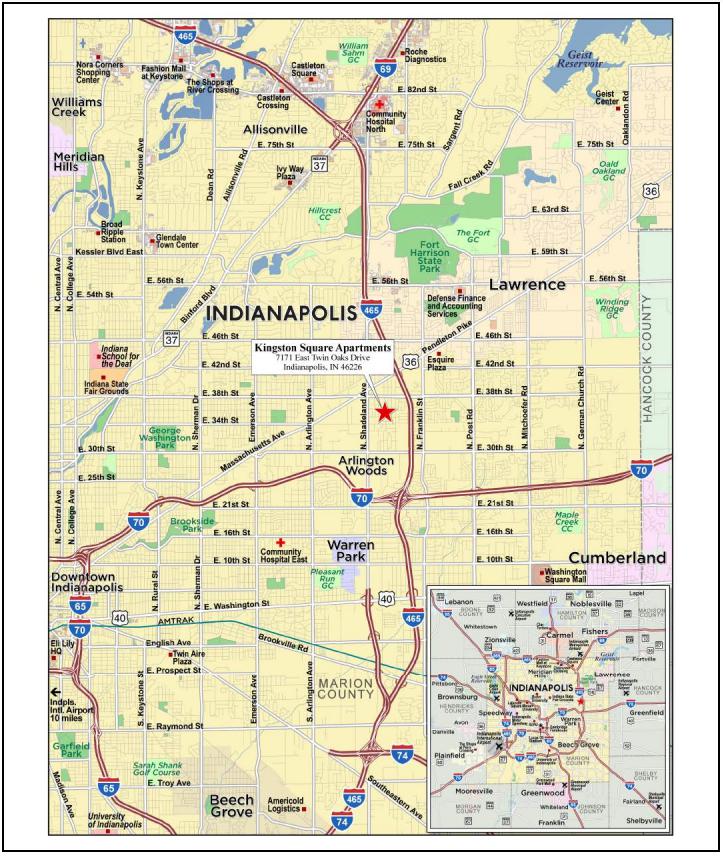
THE INFORMATION IN THIS STRUCTURAL AND COLLATERAL TERM SHEET IS NOT COMPLETE AND MAY BE AMENDED PRIOR TO THE TIME OF SALE. THIS TERM SHEET IS NOT AN OFFER TO SELL THESE SECURITIES AND IT IS NOT A SOLICITATION OF AN OFFER TO BUY THESE SECURITIES IN ANY JURISDICTION WHERE THE OFFER OR SALE IS NOT PERMITTED. |
| | 42 | |
| Structural and Collateral Term Sheet | | BMO 2022-C3 |
| |
| No. 2 – Kingston Square Apartments |
| Mortgage Loan Information | | Property Information |
| Mortgage Loan Seller: | BMO | | Single Asset / Portfolio: | Single Asset |
| Original Principal Balance(1): | $37,000,000 | | Title: | Fee |
| Cut-off Date Principal Balance(1): | $37,000,000 | | Property Type – Subtype: | Multifamily – Garden |
| % of IPB: | 5.1% | | Net Rentable Area (Units): | 523 |
| Loan Purpose: | Recapitalization | | Location: | Indianapolis, IN |
| Borrower: | Kingston Property Owner LLC | | Year Built / Renovated: | 1963, 1992, 1995 / 2020-2022 |
| Borrower Sponsor: | Joel Werzberger | | Occupancy: | 96.9% |
| Interest Rate: | 5.82000% | | Occupancy Date: | 8/18/2022 |
| Note Date: | 8/25/2022 | | 4th Most Recent NOI (As of): | $3,413,361 (12/31/2019) |
| Maturity Date: | 9/6/2032 | | 3rd Most Recent NOI (As of): | $3,414,143 (12/31/2020) |
| Interest-only Period: | 120 months | | 2nd Most Recent NOI (As of): | $4,206,794 (12/31/2021) |
| Original Term: | 120 months | | Most Recent NOI (As of): | $4,433,434 (TTM 7/31/2022) |
| Original Amortization Term: | None | | UW Economic Occupancy: | 95.0% |
| Amortization Type: | Interest Only | | UW Revenues: | $6,548,668 |
| Call Protection(2): | L(25),D(91),O(4) | | UW Expenses: | $1,853,250 |
| Lockbox / Cash Management: | Springing / Springing | | UW NOI: | $4,695,418 |
| Additional Debt(1): | Yes | | UW NCF: | $4,590,818 |
| Additional Debt Balance(1): | $14,000,000 | | Appraised Value / Per Unit: | $85,700,000 / $163,862 |
| Additional Debt Type(1): | Pari Passu | | Appraisal Date: | 8/1/2022 |
| | | | | |
| Escrows and Reserves(3) | | Financial Information(1) |
| | Initial | Monthly | Initial Cap | | Cut-off Date Loan / Unit: | $97,514 |
| Taxes: | $154,550 | $25,069 | N/A | | Maturity Date Loan / Unit: | $97,514 |
| Insurance: | $0 | Springing | N/A | | Cut-off Date LTV: | 59.5% |
| Replacement Reserves: | $0 | $8,717 | N/A | | Maturity Date LTV: | 59.5% |
| Deferred Maintenance: | $110,375 | $0 | N/A | | UW NCF DSCR: | 1.53x |
| | | | | | UW NOI Debt Yield: | 9.2% |
| | | | | | | |
| Sources and Uses |
| Sources | Proceeds | % of Tot | al | | Uses | Proceeds | % of Tot | al |
| Whole Loan | $51,000,000 | 77.3 | % | | Loan Payoff | $35,230,067 | 53.4 | % |
| Borrower Sponsor Equity(4) | 15,000,000 | 22.7 | | | Partnership Buyout(4) | 15,000,000 | 22.7 | |
| | | | | Principal Equity Distribution | 14,898,788 | 22.6 | |
| | | | | Closing Costs | 606,220 | 0.9 | |
| | | | | Upfront Reserves | 264,925 | 0.4 | |
| Total Sources | $66,000,000 | 100.0 | % | | Total Uses | $66,000,000 | 100.0 | % |
| (1) | The Kingston Square Apartments Mortgage Loan (as defined below) is part of a whole loan evidenced by four pari passu notes with an aggregate original principal balance of $51,000,000. Financial Information in the chart above reflects the Kingston Square Apartments Whole Loan (as defined below). For additional information, see “The Loan” below. |
| (2) | Defeasance of the Kingston Square Apartments Whole Loan is permitted at any time after the earlier to occur of (a) the end of the two-year period commencing on the closing date of the securitization of the last promissory note representing a portion of the Kingston Square Apartments Whole Loan to be securitized and (b) August 25, 2026. The assumed defeasance lockout period of 25 payments is based on the closing date of this transaction in October 2022. The actual lockout period may be longer. |
| (3) | For a full description of Escrows and Reserves, please refer to “Escrows and Reserves” below. |
| (4) | Borrower Sponsor Equity contributed in order to effectuate a recapitalization of the borrower by buying out a 50% owner. |
The Loan. The second largest mortgage loan (the “Kingston Square Apartments Mortgage Loan”) is part of a whole loan (the “Kingston Square Apartments Whole Loan”) that is secured by the borrower’s fee interest in a 523-unit, garden-style multifamily property located in Indianapolis, Indiana (the “Kingston Square Apartments Property”). The Kingston Square Apartments Whole Loan is comprised of four pari passu notes, with an aggregate outstanding principal balance as of the Cut-off Date of $51,000,000. The Kingston Square Apartments Mortgage Loan is evidenced by the controlling Note A-1 and the non-controlling note A-3 with an aggregate outstanding principal balance as of the Cut-off Date of $37,000,000 and represents approximately 5.1% of the Initial Pool Balance.
THE INFORMATION IN THIS STRUCTURAL AND COLLATERAL TERM SHEET IS NOT COMPLETE AND MAY BE AMENDED PRIOR TO THE TIME OF SALE. THIS TERM SHEET IS NOT AN OFFER TO SELL THESE SECURITIES AND IT IS NOT A SOLICITATION OF AN OFFER TO BUY THESE SECURITIES IN ANY JURISDICTION WHERE THE OFFER OR SALE IS NOT PERMITTED. |
| | 43 | |
| Structural and Collateral Term Sheet | | BMO 2022-C3 |
| |
| No. 2 – Kingston Square Apartments |
The Kingston Square Apartments Whole Loan will be serviced pursuant to the pooling and servicing agreement for the BMO 2022-C3 securitization. The Kingston Square Apartments Whole Loan was originated on August 25, 2022 by Bank of Montreal (“BMO”) and accrues interest at a fixed rate of 5.82000% per annum. The Kingston Square Apartments Whole Loan has an initial term of 120 months, a remaining term of 119 months and is interest-only for the full term. The scheduled maturity date of the Kingston Square Apartments Whole Loan is the due date that occurs in September 2032. The proceeds of the Kingston Square Apartments Whole Loan were used to recapitalize the Kingston Square Apartments Property, pay origination costs, fund upfront reserves and return equity to the borrower sponsors.
The table below summarizes the promissory notes that comprise the Kingston Square Apartments Whole Loan. The relationship between the holders of the Kingston Square Apartments Whole Loan is governed by a co-lender agreement as described under “Description of the Mortgage Pool—The Whole Loans—The Serviced Pari Passu Whole Loans” in the Preliminary Prospectus.
| Whole Loan Summary |
| Note | Original Balance | Cut-off Date Balance | | Note Holder | Controlling Piece |
| A-1 | $30,000,000 | $30,000,000 | | BMO 2022-C3 | Yes |
| A-2(1) | $10,000,000 | $10,000,000 | | BMO | No |
| A-3 | $7,000,000 | $7,000,000 | | BMO 2022-C3 | No |
| A-4(1) | $4,000,000 | $4,000,000 | | BMO | No |
| Whole Loan | $51,000,000 | $51,000,000 | | | |
| (1) | Expected to be contributed to one or more future securitization(s). |
The Property. The Kingston Square Apartments Property consists of 25, two-story multifamily buildings, totaling 523 residential units and four, one-to-two-story non-residential buildings. The Kingston Square Apartments Property is located in Indianapolis, Indiana and is situated approximately one mile from Interstate 465, approximately three miles from Interstate 70, approximately five miles from U.S. Route 40, and approximately eight miles from Interstates 74 and 65. The Kingston Square Apartments Property was built in 1963, 1992, and 1995, and features a range of studio, one-bedroom, two-bedroom, and three-bedroom residential units. The Kingston Square Apartments Property units all feature faux-wood vinyl, vinyl tile and carpet flooring, air conditioning, full kitchen appliances, laminate countertops and certain units include a private balcony or patio. Community spaces include a barbecue/picnic area, business center, clubhouse, fitness center, playground, and pool. The Kingston Square Apartments Property consists of 753 parking spaces resulting in a ratio of approximately 1.4 parking spaces per unit.
The following table presents detailed information with respect to the unit mix at the Kingston Square Apartments Property:
| Unit Mix Summary(1) |
| Unit Type | No. of Units | % of Total | Average Unit Size (SF) | Average Monthly Rental Rate | Average Monthly Rental Rate per SF | Average Monthly Market Rental Rate | Average Monthly Market Rental Rate per SF |
| Studio Standard | 68 | 13.0 | % | 650 | $786 | $1.21 | $788 | $1.21 |
| Studio Lavish | 4 | 0.8 | | 650 | $773 | $1.19 | $799 | $1.23 |
| 1 Bedroom Standard | 212 | 40.5 | | 700 | $859 | $1.23 | $876 | $1.25 |
| 1 Bedroom Lavish | 4 | 0.8 | | 700 | $931 | $1.33 | $876 | $1.25 |
| 2 Bedroom Standard | 140 | 26.8 | | 800 | $996 | $1.24 | $1,016 | $1.27 |
| 2 Bedroom Lavish | 4 | 0.8 | | 800 | $1,041 | $1.30 | $1,240 | $1.55 |
| 2 Bedroom Townhome | 28 | 5.4 | | 950 | $1,215 | $1.28 | $1,240 | $1.30 |
| 3 Bedroom Lavish | 63 | 12.0 | | 1,050 | $1,301 | $1.24 | $1,326 | $1.26 |
| Total/Wtd. Avg. | 523 | 100.0 | % | 776 | $963 | $1.24 | $978 | $1.26 |
| (1) | Based on the underwritten rent roll as of August 18, 2022. Average Monthly Rental Rate and Average Monthly Rental Rate per SF reflect average monthly in-place rent for occupied units. |
COVID-19 Update. As of August 15, 2022, the Kingston Square Apartments Property was open and operating. As of the date of this term sheet, the Kingston Square Apartments Whole Loan is not subject to any forbearance, modification or debt service relief request. The first payment date of the Kingston Square Apartments Whole Loan was October 6, 2022.
THE INFORMATION IN THIS STRUCTURAL AND COLLATERAL TERM SHEET IS NOT COMPLETE AND MAY BE AMENDED PRIOR TO THE TIME OF SALE. THIS TERM SHEET IS NOT AN OFFER TO SELL THESE SECURITIES AND IT IS NOT A SOLICITATION OF AN OFFER TO BUY THESE SECURITIES IN ANY JURISDICTION WHERE THE OFFER OR SALE IS NOT PERMITTED. |
| | 44 | |
| Structural and Collateral Term Sheet | | BMO 2022-C3 |
| |
| No. 2 – Kingston Square Apartments |
Environmental. According to the Phase I report dated August 4, 2022, there was no evidence of any recognized environmental conditions at the Kingston Square Apartments Property.
The following table presents certain information relating to the historical and current occupancy of the Kingston Square Apartments Property:
| Historical and Current Multifamily Occupancy(1) |
| 2019(2) | 2020 | 2021 | Current(3) |
| NAV | 97.0% | 96.0% | 96.9% |
| (1) | Historical occupancies are as of December 31 of each respective year. |
| (2) | 2019 occupancy is not available as the Kingston Square Apartments Property was acquired in 2019. |
| (3) | Current occupancy is as of August 18, 2022. |
| Operating History and Underwritten Net Cash Flow |
| | 2019 | 2020 | 2021 | TTM(1) | Underwritten | Per Unit | %(2) |
| Gross Potential Rent | $4,404,264 | $4,273,258 | $5,250,707 | $6,016,824 | $6,138,573 | $11,737 | 100.0 | % |
| (Vacancy) | 0 | 0 | 0 | (430,196) | (306,929) | (587) | (5.0 | ) |
| Net Rental Income | $4,404,264 | $4,273,258 | $5,250,707 | $5,586,628 | $5,831,644 | $11,150 | 95.0 | % |
| Other Income(3) | 592,690 | 668,064 | 661,533 | 689,603 | 717,024 | 1,371 | 11.7 | |
| Effective Gross Income | $4,996,954 | $4,941,322 | $5,912,240 | $6,276,231 | $6,548,668 | $12,521 | 106.7 | % |
| | | | | | | | |
| Total Expenses | $1,583,593 | $1,527,179 | $1,705,446 | $1,842,797 | $1,853,250 | $3,543 | 28.3 | % |
| | | | | | | | |
| Net Operating Income | $3,413,361 | $3,414,143 | $4,206,794 | $4,433,434 | $4,695,418 | $8,978 | 71.7 | % |
| | | | | | | | |
| Replacement Reserve | 0 | 0 | 0 | 0 | 104,600 | 200 | 1.6 | |
| | | | | | | | |
| Net Cash Flow | $3,413,361 | $3,414,143 | $4,206,794 | $4,433,434 | $4,590,818 | $8,778 | 70.1 | % |
| (1) | TTM reflects the trailing 12 months ending July 31, 2022. |
| (2) | % column represents percent of Gross Potential Rent for revenue fields and represents percent of Effective Gross Income for the remainder of fields. |
| (3) | Other Income includes trailing one month annualized utility reimbursements and trailing 12 months other income and pet income. |
The Market. The Kingston Square Apartments Property is located in Indianapolis, Indiana, within the Indianapolis-Carmel-Anderson, IN Metropolitan Statistical Area. According to the appraisal, the employment rate from 2011 through 2021 in Indiana increased at an average annual rate of 1.1% and the unemployment rate decreased by 3.6% between 2020 and 2021. The leading industries in Indianapolis are education, healthcare and social assistance, manufacturing, government, wholesale and trade, and transportation and warehousing. The largest employer in Indianapolis is Indiana University Health, which employs 23,187 people. The Kingston Square Apartments Property is located on East Twin Oaks Drive with approximately 65 feet of frontage. Transportation within proximity to the Kingston Square Apartments Property, including Interstate 465 and Interstate 70, provides linkage to the surrounding area. The local area is primarily occupied by industrial use land, with retail space to support the area.
The Kingston Square Apartments Property is situated in the East Indianapolis apartment submarket. According to the appraisal, as of the second quarter of 2022, the East Indianapolis apartment submarket had an overall vacancy rate of 4.3%, with net absorption totaling 18 units. The vacancy rate decreased 1.1% over the past 12 months. Rental rates increased by $58 since the fourth quarter of 2021 and ended at $938 per unit per month.
According to the appraisal, the 2021 population within a one-, three-, and five-mile radius of the Kingston Square Apartments Property was 7,795, 91,583, and 224,265, respectively. According to the appraisal, the 2021 median household income within a one-, three-, and five-mile radius of the Kingston Square Apartments Property was $33,089, $34,056, and $39,868, respectively.
THE INFORMATION IN THIS STRUCTURAL AND COLLATERAL TERM SHEET IS NOT COMPLETE AND MAY BE AMENDED PRIOR TO THE TIME OF SALE. THIS TERM SHEET IS NOT AN OFFER TO SELL THESE SECURITIES AND IT IS NOT A SOLICITATION OF AN OFFER TO BUY THESE SECURITIES IN ANY JURISDICTION WHERE THE OFFER OR SALE IS NOT PERMITTED. |
| | 45 | |
| Structural and Collateral Term Sheet | | BMO 2022-C3 |
| |
| No. 2 – Kingston Square Apartments |
The following table presents certain information relating to comparable multifamily rental property to the Kingston Square Apartments Property:
| Comparable Rental Summary(1) |
| Property / Location | Year Built / Renovated | Occupancy | # of Units | Unit Mix | Average SF per Unit | Average Rent per SF | Average Rent per Unit |
| Kingston Square Apartments(2) | 1963, 1992, 1995 / 2020-2022 | 96.9% | 68 | Studio Standard | 650 | $1.21 | $786 |
| 7171 East Twin Oaks Drive | 4 | Studio Lavish | 650 | $1.19 | $773 |
| Indianapolis, IN | 212 | 1 Standard | 700 | $1.23 | $859 |
| | 4 | 1 Lavish | 700 | $1.33 | $931 |
| | 140 | 2 Standard | 800 | $1.24 | $996 |
| | 4 | 2 Lavish | 800 | $1.30 | $1,041 |
| | 28 | 2 Townhome | 950 | $1.28 | $1,215 |
| | 63 | 3 Lavish | 1,050 | $1.24 | $1,301 |
| Lawrence Landing | 1972 / 2002 | 97.0% | 108 | 1 Bed | 847 | $1.23 | $1,039 |
| Indianapolis, IN | | | 246 | 2 Bed | 1,047 | $1.20 | $1,255 |
| 6875 Faris Avenue | | | | | | | |
| Harrison Point Apartments | 1974 / NAP | 95.6% | 6 | Studio | 550 | $1.73 | $952 |
| Indianapolis, IN | | | 79 | 1 Bed | 750 | $1.25 | $934 |
| 9093 Bourbon Street | | | 229 | 2 Bed | 850 | $1.47 | $1,247 |
| | | | 28 | 3 Bed | 1,150 | $0.85 | $977 |
| The M Club | 1979 / NAP | 96.0% | 40 | Studio | 550 | $1.48 | $815 |
| Indianapolis, IN | | | 196 | 1 Bed | 729 | $1.28 | $931 |
| 7007 Courthouse Drive | | | 152 | 2 Bed | 931 | $1.44 | $1,344 |
| Waterstone Place Apartments | 1974 / 2013 | 97.0% | 96 | 1 Bed | 759 | $1.28 | $972 |
| Indianapolis, IN | | | 93 | 2 Bed | 1,025 | $1.23 | $1,259 |
| 2755 Merlin Lake Drive | | | 3 | 3 Bed | 1,006 | $1.23 | $1,236 |
| Serenity Park | 1967 / 2003 | 94.1% | 121 | 1 Bed | 631 | $1.34 | $846 |
| Indianapolis, IN | | | 239 | 2 Bed | 991 | $0.76 | $749 |
| 9060 East 39th Street | | | 1 | 3 Bed | 1,200 | $0.83 | $991 |
| Residences on 56th Street | 1969 / 2020 | 94.1% | 186 | 1 Bed | 695 | $1.31 | $912 |
| Indianapolis, IN | | | 471 | 2 Bed | 1,380 | $0.80 | $1,105 |
| 6800 Brendon Way West | | | 98 | 3 Bed | 1,915 | $0.96 | $1,838 |
| (1) | Source: Appraisal, unless otherwise indicated. |
| (2) | Based on underwritten rent roll dated as of August 18, 2022. Average Rent per SF and Average Rent per Unit reflect average monthly in-place rent for occupied units. |
The Borrower. The borrower under the Kingston Square Apartments Whole Loan is Kingston Property Owner LLC, a single-purpose Delaware limited liability company with one independent director. Legal counsel to the borrower delivered a non-consolidation opinion in connection with the origination of the Kingston Square Apartments Whole Loan.
The Borrower Sponsor. The borrower sponsor and non-recourse carveout guarantor is Joel Werzberger. Joel Werzberger has nearly 20 years of experience in real estate and currently owns over 34 properties consisting of more than 4,369 Units. The Sponsor owns assets throughout the country with concentrations in New York, Indiana, Virginia, North Carolina, Florida and Ohio. In addition, the Sponsor owns four properties in Indiana consisting of 2,027 units.
Property Management. The Kingston Square Apartments Property is managed by A1 Management Realty LLC, an affiliate of the borrower.
Escrows and Reserves. At origination of the Kingston Square Apartments Whole Loan, the borrower deposited (i) approximately $154,550 into a real estate tax reserve account and (ii) $110,375 into an immediate repair reserve account.
THE INFORMATION IN THIS STRUCTURAL AND COLLATERAL TERM SHEET IS NOT COMPLETE AND MAY BE AMENDED PRIOR TO THE TIME OF SALE. THIS TERM SHEET IS NOT AN OFFER TO SELL THESE SECURITIES AND IT IS NOT A SOLICITATION OF AN OFFER TO BUY THESE SECURITIES IN ANY JURISDICTION WHERE THE OFFER OR SALE IS NOT PERMITTED. |
| | 46 | |
| Structural and Collateral Term Sheet | | BMO 2022-C3 |
| |
| No. 2 – Kingston Square Apartments |
Tax Escrows – The borrower is required to deposit into a real estate tax reserve, on a monthly basis, 1/12th of the taxes that the lender estimates will be payable over the next-ensuing 12-month period (initially estimated to be approximately $25,069).
Insurance Escrows – The borrower is required to deposit into an insurance reserve, on a monthly basis, 1/12th of the amount which will be sufficient to pay the insurance premiums due for the renewal of coverage afforded by such policies; provided, however, such insurance reserve has been conditionally waived so long as (i) no event of default is continuing and (ii) the borrower maintains a blanket policy meeting the requirements of the Kingston Square Apartments Whole Loan documents. The borrower is currently maintaining a blanket policy.
Replacement Reserve – The borrower is required to deposit into a replacement reserve, on a monthly basis, $200 per unit per annum (approximately $8,717).
Lockbox / Cash Management. The Kingston Square Apartments Whole Loan is structured with a springing lockbox and springing cash management. Upon the occurrence and continuance of a Trigger Period (as defined below), the borrower is required to cause all revenues relating to the Kingston Square Apartments Property to be deposited into a lender-controlled lockbox account within two business days of receipt. On each business day during the continuance of a Trigger Period, all amounts in the lockbox account are required to be remitted to a lender-controlled cash management account. On each business day that no Trigger Period is continuing, all funds in the lockbox account are required to be swept into a borrower-controlled operating account.
A “Trigger Period” means a period commencing upon the earliest to occur of (i) an event of default; and (ii) the Kingston Square Apartments Whole Loan debt service coverage ratio falls below 1.30x and will be cured upon (a) with respect to clause (i) above, the lender accepts a cure of the event of default; or (b) with respect to clause (ii) above, the Kingston Square Apartments Whole Loan debt service coverage ratio is equal to or greater than 1.30x for two consecutive calendar quarters.
Subordinate Debt. None.
Mezzanine Debt. None.
Partial Release. Not permitted.
Ground Lease. None.
THE INFORMATION IN THIS STRUCTURAL AND COLLATERAL TERM SHEET IS NOT COMPLETE AND MAY BE AMENDED PRIOR TO THE TIME OF SALE. THIS TERM SHEET IS NOT AN OFFER TO SELL THESE SECURITIES AND IT IS NOT A SOLICITATION OF AN OFFER TO BUY THESE SECURITIES IN ANY JURISDICTION WHERE THE OFFER OR SALE IS NOT PERMITTED. |
| | 47 | |
| Structural and Collateral Term Sheet | | BMO 2022-C3 |
| |
| No. 3 – Yorkshire & Lexington Towers |
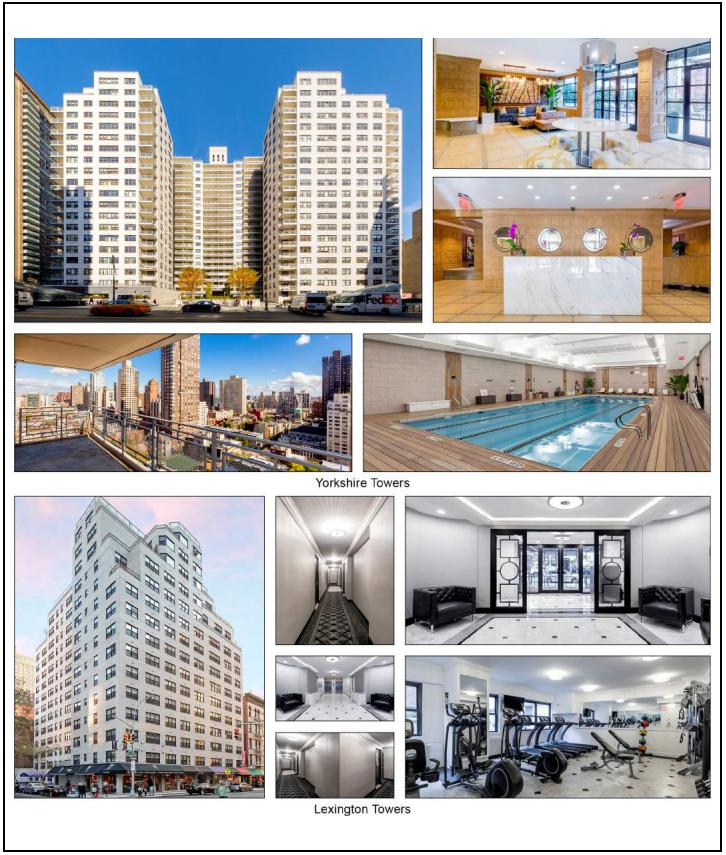
THE INFORMATION IN THIS STRUCTURAL AND COLLATERAL TERM SHEET IS NOT COMPLETE AND MAY BE AMENDED PRIOR TO THE TIME OF SALE. THIS TERM SHEET IS NOT AN OFFER TO SELL THESE SECURITIES AND IT IS NOT A SOLICITATION OF AN OFFER TO BUY THESE SECURITIES IN ANY JURISDICTION WHERE THE OFFER OR SALE IS NOT PERMITTED. |
| | 48 | |
| Structural and Collateral Term Sheet | | BMO 2022-C3 |
| |
| No. 3 – Yorkshire & Lexington Towers |
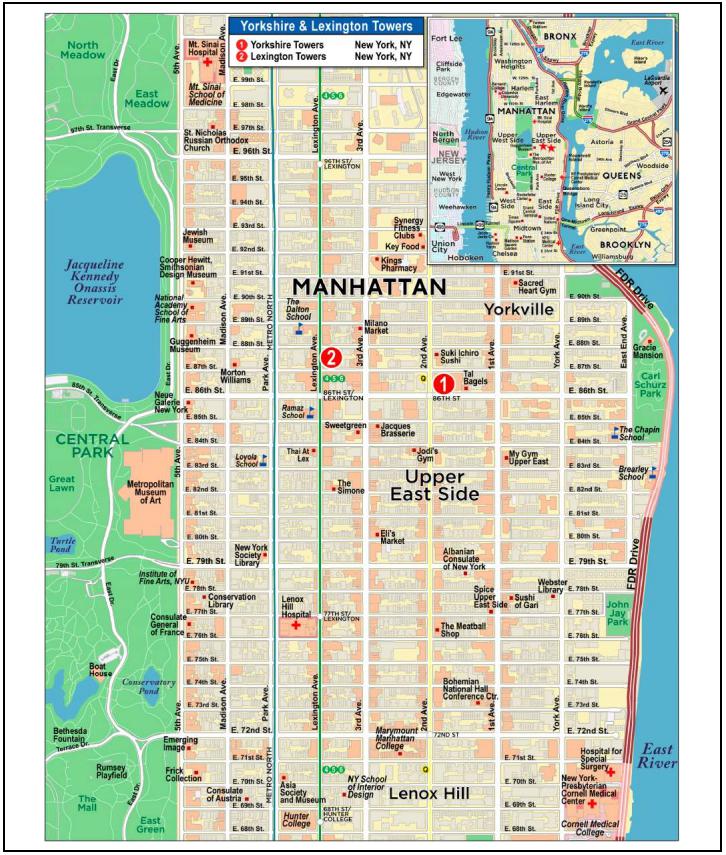
THE INFORMATION IN THIS STRUCTURAL AND COLLATERAL TERM SHEET IS NOT COMPLETE AND MAY BE AMENDED PRIOR TO THE TIME OF SALE. THIS TERM SHEET IS NOT AN OFFER TO SELL THESE SECURITIES AND IT IS NOT A SOLICITATION OF AN OFFER TO BUY THESE SECURITIES IN ANY JURISDICTION WHERE THE OFFER OR SALE IS NOT PERMITTED. |
| | 49 | |
| Structural and Collateral Term Sheet | | BMO 2022-C3 |
| |
| No. 3 – Yorkshire & Lexington Towers |
| Mortgage Loan Information | | Property Information |
| Mortgage Loan Seller: | BMO | | Single Asset / Portfolio: | Portfolio |
| Original Principal Balance(1): | $37,000,000 | | Title: | Fee |
| Cut-off Date Principal Balance(1): | $37,000,000 | | Property Type – Subtype: | Multifamily – High Rise |
| % of IPB: | 5.1% | | Net Rentable Area (Units): | 808 |
| Loan Purpose: | Refinance | | Location: | New York, NY |
| Borrowers(2): | Various | | Year Built / Renovated: | Various / Various |
| Borrower Sponsors: | Meyer Chetrit and The Gluck | | Occupancy: | 96.4% |
| | Family Trust U/A/D July 16, | | Occupancy Date: | 3/1/2022 |
| | 2009 | | 4th Most Recent NOI (As of): | $27,343,815 (12/31/2019) |
| Interest Rate: | 3.04000% | | 3rd Most Recent NOI (As of): | $25,617,949 (12/31/2020) |
| Note Date: | 5/12/2022 | | 2nd Most Recent NOI (As of): | $24,254,281 (12/31/2021) |
| Maturity Date: | 6/6/2027 | | Most Recent NOI (As of)(4): | $25,322,439 (TTM 2/28/2022) |
| Interest-only Period: | 60 months | | UW Economic Occupancy: | 97.2% |
| Original Term: | 60 months | | UW Revenues: | $51,394,888 |
| Original Amortization Term: | None | | UW Expenses: | $16,019,126 |
| Amortization Type: | Interest Only | | UW NOI(4): | $35,375,762 |
| Call Protection: | L(28),D(27),O(5) | | UW NCF(4): | $35,375,762 |
| Lockbox / Cash Management: | Soft (Residential); Hard (Commercial) / In Place | | Appraised Value / Per Unit: | $954,000,000 / $1,180,693 |
| Additional Debt(1): | Yes | | Appraisal Date: | 1/20/2022 |
| Additional Debt Balance(1): | $281,000,000 / $221,500,000 / $174,500,000 | | | |
| Additional Debt Type(1): | Pari Passu / Subordinate / Mezzanine | | | |
| | | | | |
| Escrows and Reserves(3) | | Financial Information(1) |
| | Initial | Monthly | Initial Cap | | | Senior Loan | Whole Loan | Total Debt |
| Taxes: | $5,390,917 | $898,486 | N/A | | Cut-off Date Loan / Unit: | $393,564 | $667,698 | $883,663 |
| Insurance: | $367,868 | Springing | N/A | | Maturity Date Loan / Unit: | $393,564 | $667,698 | $883,663 |
| Replacement Reserves: | $1,100,000 | $0 | N/A | | Cut-off Date LTV: | 33.3% | 56.6% | 74.8% |
| TI / LC Reserve: | $1,000,000 | $0 | N/A | | Maturity Date LTV: | 33.3% | 56.6% | 74.8% |
| Other Reserve: | $12,400,000 | Springing | N/A | | UW NCF DSCR(4): | 3.61x | 2.13x | 1.20x |
| | | | | | UW NOI Debt Yield(4): | 11.1% | 6.6% | 5.0% |
| | | | | | | | |
| Sources and Uses |
| Sources | Proceeds | % of Tot | al | | Uses | Proceeds | % of Tot | al |
| Senior Loan | $318,000,000 | 44.5 | % | | Loan Payoff | $545,268,671 | 76.4 | % |
| Subordinate Notes | 221,500,000 | 31.0 | | | Closing Costs | 93,214,219 | 13.1 | |
| Mezzanine Loans | 174,500,000 | 24.4 | | | Principal Equity Distribution | 55,258,325 | 7.7 | |
| | | | | Upfront Reserves | 20,258,785 | 2.8 | |
| Total Sources | $714,000,000 | 100.0 | % | | Total Uses | $714,000,000 | 100.0 | % |
| (1) | The Yorkshire & Lexington Towers Senior Loan (as defined below), with an original aggregate principal balance of $318,000,000, is part of the Yorkshire & Lexington Towers Whole Loan (as defined below). The Financial Information in the chart above reflects the Yorkshire & Lexington Towers Senior Loan, the Yorkshire & Lexington Towers Whole Loan and the Yorkshire & Lexington Towers Total Debt (as defined below). For additional information, see “The Loan” below. |
| (2) | The borrowers under the Yorkshire & Lexington Towers Whole Loan are CF E 88 LLC, SM E 88 LLC, CF E 86 LLC, SM E 86 LLC and LSG E 86 LLC. |
| (3) | For a full description of Escrows and Reserves, please refer to “Escrows and Reserves” below. |
| (4) | UW NOI is greater than Most Recent NOI due in part to (i) the borrower sponsors recently renovating 57 units, which has increased rents at the Yorkshire & Lexington Towers Properties (as defined below) and (ii) underwritten straight-lined rent for CVS Pharmacy. Additionally, the UW NOI and UW NCF include disbursements from a Supplemental Income Reserve (as defined below) of $5,226,004. The Yorkshire & Lexington Towers Senior Loan UW NCF DSCR, Yorkshire & Lexington Towers Whole Loan UW NCF DSCR, and Yorkshire & Lexington Towers Total Debt UW NCF DSCR excluding credit for the upfront Supplemental Income Reserve are 3.08x, 1.81x and 1.02x, respectively. The Yorkshire & Lexington Towers Senior Loan UW NOI Debt Yield, Yorkshire & Lexington Towers Whole Loan UW NOI Debt Yield, and Yorkshire & Lexington Towers Total Debt UW NOI Debt Yield excluding credit for the upfront Supplemental Income Reserve are 9.5%, 5.6% and 4.2%, respectively. Please refer to “Escrows and Reserves” below. |
THE INFORMATION IN THIS STRUCTURAL AND COLLATERAL TERM SHEET IS NOT COMPLETE AND MAY BE AMENDED PRIOR TO THE TIME OF SALE. THIS TERM SHEET IS NOT AN OFFER TO SELL THESE SECURITIES AND IT IS NOT A SOLICITATION OF AN OFFER TO BUY THESE SECURITIES IN ANY JURISDICTION WHERE THE OFFER OR SALE IS NOT PERMITTED. |
| | 50 | |
| Structural and Collateral Term Sheet | | BMO 2022-C3 |
| |
| No. 3 – Yorkshire & Lexington Towers |
The Loan. The third largest mortgage loan (the “Yorkshire & Lexington Towers Mortgage Loan”) is part of a whole loan (the “Yorkshire & Lexington Towers Whole Loan”) that is evidenced by eighteen pari passu senior promissory notes in the aggregate original principal amount of $318,000,000 (collectively, the “Yorkshire & Lexington Towers Senior Loan”) and two pari passu subordinate promissory notes in the aggregate original principal amount of $221,500,000 (collectively, the “Yorkshire & Lexington Towers Subordinate Companion Loan”). The Yorkshire & Lexington Towers Whole Loan was co-originated on May 12, 2022 by Bank of Montreal (“BMO”), Starwood Mortgage Capital LLC (“SMC”) and Citi Real Estate Funding Inc. (“CREFI”). The Yorkshire & Lexington Towers Whole Loan is secured by a first priority mortgage on the borrowers’ fee simple interest in two, high-rise multifamily properties totaling 808 units located in the Upper East Side neighborhood of New York, New York (the “Yorkshire & Lexington Towers Properties”). The Yorkshire & Lexington Towers Mortgage Loan is evidenced by the non-controlling promissory Notes A-1 and A-16, with an aggregate principal balance as of the Cut-off Date of $37,000,000. The remaining notes were contributed, or are expected to be contributed, to other securitization trusts, as set forth in the table below. The Yorkshire & Lexington Towers Whole Loan will be serviced pursuant to the pooling and servicing agreement for the CGCMT 2022-GC48 securitization. The “Yorkshire & Lexington Towers Total Debt” consists of the Yorkshire & Lexington Towers Whole Loan and four mezzanine loans with an aggregate Cut-off Date balance of $174,500,000. For additional information, see “Subordinate Debt and Mezzanine Debt” below. The relationship between the holders of the Yorkshire & Lexington Towers Whole Loan is governed by a co-lender agreement as described under “Description of the Mortgage Pool—The Whole Loans—The Yorkshire & Lexington Towers Pari Passu-AB Whole Loan” in the Preliminary Prospectus.
| Whole Loan Summary |
| Note | Original Balance | Cut-off Date Balance | | Note Holder | Controlling Piece |
| A-1 | $25,000,000 | $25,000,000 | | BMO 2022-C3 | No |
| A-2 | $25,000,000 | $25,000,000 | | BBCMS 2022-C16 | No |
| A-3 | $25,000,000 | $25,000,000 | | Benchmark 2022-B36 | No |
| A-4(1) | $20,000,000 | $20,000,000 | | CGCMT 2022-GC48 | Yes |
| A-5 | $20,000,000 | $20,000,000 | | BBCMS 2022-C16 | No |
| A-6 | $20,000,000 | $20,000,000 | | BMO 2022-C2 | No |
| A-7 | $20,000,000 | $20,000,000 | | BMO 2022-C2 | No |
| A-8 | $20,000,000 | $20,000,000 | | BBCMS 2022-C16 | No |
| A-9 | $20,000,000 | $20,000,000 | | CGCMT 2022-GC48 | No |
| A-10 | $20,000,000 | $20,000,000 | | BBCMS 2022-C17 | No |
| A-11 | $20,000,000 | $20,000,000 | | CGCMT 2022-GC48 | No |
| A-12 | $20,000,000 | $20,000,000 | | Benchmark 2022-B36 | No |
| A-13 | $10,000,000 | $10,000,000 | | BMO 2022-C2 | No |
| A-14 | $10,000,000 | $10,000,000 | | BMO 2022-C2 | No |
| A-15 | $10,000,000 | $10,000,000 | | Benchmark 2022-B36 | No |
| A-16 | $12,000,000 | $12,000,000 | | BMO 2022-C3 | No |
| A-17 | $10,000,000 | $10,000,000 | | BMO 2022-C2 | No |
| A-18 | $11,000,000 | $11,000,000 | | Benchmark 2022-B36 | No |
| Total Senior Loan | $318,000,000 | $318,000,000 | | | |
| B-1(1) | $147,666,667 | $147,666,667 | | CGCMT 2022-GC48 (Loan Specific) | Yes |
| B-2(1) | $73,833,333 | $73,833,333 | | CGCMT 2022-GC48 (Loan Specific) | Yes |
| Whole Loan | $539,500,000 | $539,500,000 | | | |
| (1) | The initial controlling note is Note B-1, but if any interest in Note B-1 is held by a borrower restricted party (as defined in the related co-lender agreement), the controlling note will be Note B-2. Following a Yorkshire & Lexington Towers Control Appraisal Period (as defined in the related co-lender agreement), the controlling note will be Note A-4, which is also the lead note. See “Description of the Mortgage Pool—The Whole Loans—The Yorkshire & Lexington Towers Pari Passu-AB Whole Loan” in the Preliminary Prospectus. |
The Properties. The Yorkshire & Lexington Towers Properties consist of (i) a multifamily building comprised of 681 residential units totaling 615,641 square feet, a 33,000 square foot parking garage with 168 parking spaces and six commercial and retail units totaling 29,451 square feet (the “Yorkshire Towers Property”) and (ii) a multifamily building comprised of 127 residential units totaling 115,188 square feet, a 8,886 square foot parking garage with 36 parking spaces and six commercial and retail units totaling 9,998 square feet (the “Lexington Towers Property”). The Yorkshire & Lexington Towers Properties have 808 residential units totaling 730,829 square feet, 204 parking spaces totaling 41,886 square feet, and 12 commercial and retail units totaling 39,449 square feet. The commercial tenants (excluding City Parking) at the Yorkshire & Lexington Towers Properties have a remaining weighted average lease term of 8.3 years excluding parking leases. The Yorkshire Towers Property is located in the Upper East Side neighborhood, proximate to the Second Avenue subway station with access to the Q subway line. The Lexington Towers Property is located in the Upper East Side
THE INFORMATION IN THIS STRUCTURAL AND COLLATERAL TERM SHEET IS NOT COMPLETE AND MAY BE AMENDED PRIOR TO THE TIME OF SALE. THIS TERM SHEET IS NOT AN OFFER TO SELL THESE SECURITIES AND IT IS NOT A SOLICITATION OF AN OFFER TO BUY THESE SECURITIES IN ANY JURISDICTION WHERE THE OFFER OR SALE IS NOT PERMITTED. |
| | 51 | |
| Structural and Collateral Term Sheet | | BMO 2022-C3 |
| |
| No. 3 – Yorkshire & Lexington Towers |
neighborhood, proximate to the Lexington Avenue/East 86th Street subway station with access to the 4, 5, and 6 subway lines.
The Yorkshire & Lexington Towers Properties were built in 1963 and 1964 and the residential portion of the Yorkshire & Lexington Towers Properties feature a range of studio, one bedroom, two bedroom, three bedroom, and four bedroom units. Of the 808 residential units, 305 of the units are rent-stabilized. The Yorkshire & Lexington Towers Properties’ residential units all feature hardwood flooring, full kitchen appliances, and many units include a private balcony. Bathrooms feature marble flooring in the renovated units and vinyl tile in the unrenovated units. Renovated units feature marble countertop kitchens, stainless steel appliances, including a refrigerator, dishwasher, microwave, and gas-fired stove and oven, and washer and dryer. Community spaces include 24-hour attended lobby lounge, health club and fitness center, children’s playroom, and outdoor seating area.
The largest tenant by underwritten base rent, CVS Pharmacy (“CVS”), occupies 15,813 square feet (19.4% of the commercial NRA, 58.1% of the underwritten commercial base rent) with a lease expiration of January 31, 2033. CVS is a consumer retail and health solutions company with over 9,900 locations in 49 states, the District of Columbia and Puerto Rico. CVS has approximately 300,000 employees in the United States. The remaining 65,522 square feet of commercial space is 98.3% occupied by ten tenants.
The following table presents certain information relating to the Yorkshire & Lexington Towers Properties:
| Portfolio Summary |
| Property Name | City | Year Built / Renovated | Units | % of Units | Allocated
Cut-off Date Whole Loan Amount (“ALA”) | % of ALA | Appraised Value | % of Appraised Value |
| Yorkshire Towers | New York | 1964 / 2014, 2022 | 681 | 84.3 | % | $464,286,688 | 86.1 | % | $821,000,0000 | 86.1 | % |
| Lexington Towers | New York | 1963 / 2014 | 127 | 15.7 | % | 75,213,312 | 13.9 | | 133,000,0000 | 13.9 | |
| | | | 808 | 100.0 | % | $539,500,000 | 100.0 | % | $954,000,000 | 100.0 | % |
Borrower Sponsors’ Renovation Plan. The information set forth below regarding the borrower sponsors’ renovation plans reflects forward-looking statements and certain projections provided by the borrower sponsors, assuming, among other things, that the borrowers will complete certain projected renovations by December 1, 2024 and that all of the newly renovated and currently unoccupied units will be leased at current market rate rent and all of the currently occupied units will continue to be leased at the current contractual rent. We cannot assure you that such assumptions and projections provided by the borrower sponsors will materialize in the future as expected or at all.
The borrower sponsors have identified 311 units that will be renovated, which consist of 283 units that are projected to receive a light renovation and 28 units that are projected to receive a major renovation. The 28 major renovation units will be combined into 13 units post-renovation. Of the 28 units projected to receive major renovations, 17 units are rent stabilized, all of which are currently vacant. Major renovations will feature the combination of two or three units into one larger unit or a significant floor plan alteration and are expected to take approximately four to six months to complete. Light renovation units will feature aesthetic and systems upgrades, such as new appliances, countertops, removal of carpeting and lighting upgrades. The borrowers deposited $6,500,000 into a unit upgrade reserve with the lender at origination of the Yorkshire & Lexington Towers Whole Loan, to be disbursed to pay or reimburse the borrowers for unit renovation costs pursuant to the Yorkshire & Lexington Towers Whole Loan documents. See “Escrows and Reserves” below.
The major renovation units are projected to receive an average renovation of approximately $37,143 per unit and are anticipated to increase rent from $53.20 per square foot in-place to $82.67 per square foot. The borrower sponsors have executed 41 major renovations to date, which have been combined into a total of 23 units. These major renovations have achieved average annual rent increases from $32.93 per square foot to $75.37 per square foot.
The light renovation units are projected to receive an average renovation of $19,382 per unit and are anticipated to increase rent from $62.01 per square foot in-place to $82.79 per square foot. The borrower sponsors have executed 16 light renovations to date. These light renovations have achieved average annual rent increases from $50.33 per square foot to $82.04 per square foot.
THE INFORMATION IN THIS STRUCTURAL AND COLLATERAL TERM SHEET IS NOT COMPLETE AND MAY BE AMENDED PRIOR TO THE TIME OF SALE. THIS TERM SHEET IS NOT AN OFFER TO SELL THESE SECURITIES AND IT IS NOT A SOLICITATION OF AN OFFER TO BUY THESE SECURITIES IN ANY JURISDICTION WHERE THE OFFER OR SALE IS NOT PERMITTED. |
| | 52 | |
| Structural and Collateral Term Sheet | | BMO 2022-C3 |
| |
| No. 3 – Yorkshire & Lexington Towers |
The following table presents detailed information with respect to the current market rate units at the Yorkshire Towers Property:
| As Is Market Rate Unit Summary |
| Unit Type | No. of Units(1) | % of Total | Average Unit Size (SF)(1) | Average Monthly Rental Rate(1) | Average Monthly Rental Rate per SF(1) | Average Monthly Market Rental Rate(2) | Average Monthly Market Rental Rate per SF(2) |
| Studio | 63 | 14.3 | % | 547 | $3,100 | $5.67 | $3,121 | $5.52 |
| 1 Bedroom | 244 | 55.2 | | 778 | $4,301 | $5.53 | $4,319 | $5.50 |
| 2 Bedroom | 81 | 18.3 | | 1,152 | $6,122 | $5.31 | $6,355 | $5.31 |
| 3 Bedroom | 53 | 12.0 | | 1,299 | $7,707 | $5.93 | $7,682 | $5.91 |
| 4 Bedroom | 1 | 0.2 | | 2,087 | $12,995 | $6.23 | $12,995 | $6.23 |
| Total/Wtd. Avg. | 442 | 100.0 | % | 879 | $4,891 | $5.56 | $4,941 | $5.54 |
| (1) | Based on the underwritten rent roll dated March 1, 2022. |
The following table presents detailed information with respect to the current market rate units at the Lexington Towers Property:
| As Is Market Rate Unit Summary |
| Unit Type | No. of Units(1) | % of Total | Average Unit Size (SF)(1) | Average Monthly Rental Rate(1) | Average Monthly Rental Rate per SF(1) | Average Monthly Market Rental Rate(2) | Average Monthly Market Rental Rate per SF(2) |
| Studio | 10 | 16.4 | % | 619 | $3,270 | $5.29 | $3,270 | $5.29 |
| 1 Bedroom | 33 | 54.1 | | 776 | $4,306 | $5.55 | $4,286 | $5.53 |
| 2 Bedroom | 10 | 16.4 | | 1,045 | $6,339 | $6.06 | $6,287 | $6.01 |
| 3 Bedroom | 6 | 9.8 | | 1,392 | $8,823 | $6.34 | $8,823 | $6.34 |
| 4 Bedroom | 2 | 3.3 | | 1,889 | $13,123 | $6.95 | $12,935 | $6.85 |
| Total/Wtd. Avg. | 61 | 100.0 | % | 892 | $5,203 | $5.83 | $5,192 | $5.81 |
| (1) | Based on the underwritten rent roll dated March 1, 2022. |
The following table presents detailed information with respect to the current rent stabilized units at the Yorkshire Towers Property:
| As Is Rent Stabilized Unit Summary |
| Unit Type | No. of Units(1) | % of Total | Average Unit Size (SF)(1) | Average Monthly Rental Rate(1) | Average Monthly Rental Rate per SF(1) | Average Monthly Market Rental Rate(2) | Average Monthly Market Rental Rate per SF(2) |
| Studio | 31 | 13.0 | % | 545 | $1,915 | $3.51 | $2,370 | $3.52 |
| 1 Bedroom | 116 | 48.5 | | 792 | $1,980 | $2.50 | $2,182 | $2.49 |
| 2 Bedroom | 81 | 33.9 | | 1,230 | $2,916 | $2.37 | $2,989 | $2.36 |
| 3 Bedroom | 8 | 3.3 | | 1,638 | $3,714 | $2.27 | $3,714 | $2.27 |
| 4 Bedroom | 3 | 1.3 | | 1,859 | $12,167 | $6.55 | $12,167 | $6.55 |
| Total/Wtd. Avg. | 239 | 100.0 | % | 950 | $2,475 | $2.60 | $2,710 | $2.59 |
| (1) | Based on the underwritten rent roll dated March 1, 2022. |
THE INFORMATION IN THIS STRUCTURAL AND COLLATERAL TERM SHEET IS NOT COMPLETE AND MAY BE AMENDED PRIOR TO THE TIME OF SALE. THIS TERM SHEET IS NOT AN OFFER TO SELL THESE SECURITIES AND IT IS NOT A SOLICITATION OF AN OFFER TO BUY THESE SECURITIES IN ANY JURISDICTION WHERE THE OFFER OR SALE IS NOT PERMITTED. |
| | 53 | |
| Structural and Collateral Term Sheet | | BMO 2022-C3 |
| |
| No. 3 – Yorkshire & Lexington Towers |
The following table presents detailed information with respect to the current rent stabilized units at the Lexington Towers Property:
| As Is Rent Stabilized Unit Summary |
| Unit Type | No. of Units(1) | % of Total | Average Unit Size (SF)(1) | Average Monthly Rental Rate(1) | Average Monthly Rental Rate per SF(1) | Average Monthly Market Rental Rate(2) | Average Monthly Market Rental Rate per SF(2) |
| Studio | 19 | 28.8 | % | 660 | $1,923 | $2.91 | $2,056 | $2.97 |
| 1 Bedroom | 31 | 47.0 | | 830 | $2,033 | $2.45 | $2,014 | $2.43 |
| 2 Bedroom | 11 | 16.7 | | 1,254 | $3,591 | $2.86 | $3,589 | $2.86 |
| 3 Bedroom | 3 | 4.5 | | 1,536 | $9,564 | $6.23 | $3,128 | $2.32 |
| 4 Bedroom | 2 | 3.0 | | 2,055 | $19,750 | $9.61 | NAV | NAV |
| Total/Wtd. Avg. | 66 | 100.0 | % | 921 | $3,140 | $3.41 | $2,500 | $2.66 |
| (1) | Based on the underwritten rent roll dated March 1, 2022. |
The following table presents detailed information with respect to the projected post-renovation market rate units at the Yorkshire Towers Property:
| Projected Post-Renovation Market Rate Unit Summary |
| Unit Type | No. of Units(1) | % of Total | Average Unit Size (SF)(1) | Average Monthly Rental Rate(1) | Average Monthly Rental Rate per SF(1) | Average Monthly Market Rental Rate(2) | Average Monthly Market Rental Rate per SF(2) |
| Studio | 61 | 14.1 | % | 547 | $3,489 | $6.38 | $3,121 | $5.52 |
| 1 Bedroom | 240 | 55.6 | | 778 | $5,108 | $6.57 | $4,319 | $5.50 |
| 2 Bedroom | 77 | 17.8 | | 1,148 | $7,784 | $6.78 | $6,355 | $5.31 |
| 3 Bedroom | 53 | 12.3 | | 1,299 | $8,582 | $6.60 | $7,682 | $5.91 |
| 4 Bedroom | 1 | 0.2 | | 2,087 | $12,995 | $6.23 | $12,995 | $6.23 |
| Total/Wtd. Avg. | 432 | 100.0 | % | 878 | $5,801 | $6.61 | $4,941 | $5.54 |
| (1) | Based on the underwritten rent roll dated March 1, 2022. |
The following table presents detailed information with respect to the projected post-renovation market rate units at the Lexington Towers Property:
| Projected Post-Renovation Market Rate Unit Summary |
| Unit Type | No. of Units(1) | % of Total | Average Unit Size (SF)(1) | Average Monthly Rental Rate(1) | Average Monthly Rental Rate per SF(1) | Average Monthly Market Rental Rate(2) | Average Monthly Market Rental Rate per SF(2) |
| Studio | 10 | 16.7 | % | 619 | $4,309 | $6.97 | $3,270 | $5.29 |
| 1 Bedroom | 32 | 53.3 | | 775 | $5,347 | $6.90 | $4,286 | $5.53 |
| 2 Bedroom | 10 | 16.7 | | 1,045 | $7,072 | $6.77 | $6,287 | $6.01 |
| 3 Bedroom | 6 | 10.0 | | 1,392 | $9,101 | $6.54 | $8,823 | $6.34 |
| 4 Bedroom | 2 | 3.3 | | 1,889 | $12,935 | $6.85 | $12,935 | $6.85 |
| Total/Wtd. Avg. | 60 | 100.0 | % | 893 | $6,090 | $6.82 | $5,192 | $5.81 |
| (1) | Based on the underwritten rent roll dated March 1, 2022. |
THE INFORMATION IN THIS STRUCTURAL AND COLLATERAL TERM SHEET IS NOT COMPLETE AND MAY BE AMENDED PRIOR TO THE TIME OF SALE. THIS TERM SHEET IS NOT AN OFFER TO SELL THESE SECURITIES AND IT IS NOT A SOLICITATION OF AN OFFER TO BUY THESE SECURITIES IN ANY JURISDICTION WHERE THE OFFER OR SALE IS NOT PERMITTED. |
| | 54 | |
| Structural and Collateral Term Sheet | | BMO 2022-C3 |
| |
| No. 3 – Yorkshire & Lexington Towers |
The following table presents detailed information with respect to the projected post-renovation rent stabilized units at the Yorkshire Towers Property:
| Projected Post-Renovation Rent Stabilized Unit Summary |
| Unit Type | No. of Units(1) | % of Total | Average Unit Size (SF)(1) | Average Monthly Rental Rate(1) | Average Monthly Rental Rate per SF(1) | Average Monthly Market Rental Rate(2) | Average Monthly Market Rental Rate per SF(2) |
| Studio | 27 | 11.5 | % | 544 | $1,925 | $3.54 | $2,370 | $3.52 |
| 1 Bedroom | 106 | 45.1 | | 793 | $1,976 | $2.49 | $2,182 | $2.49 |
| 2 Bedroom | 85 | 36.2 | | 1,246 | $3,371 | $2.71 | $2,989 | $2.36 |
| 3 Bedroom | 12 | 5.1 | | 1,729 | $6,858 | $3.97 | $3,714 | $2.27 |
| 4 Bedroom | 5 | 2.1 | | 2,167 | $14,531 | $6.71 | $12,167 | $6.55 |
| Total/Wtd. Avg. | 235 | 100.0 | % | 1005 | $2,991 | $2.97 | $2,710 | $2.59 |
| (1) | Based on the underwritten rent roll dated March 1, 2022. |
The following table presents detailed information with respect to the projected post-renovation rent stabilized units at the Lexington Towers Property:
| Projected Post-Renovation Rent Stabilized Unit Summary |
| Unit Type | No. of Units(1) | % of Total | Average Unit Size (SF)(1) | Average Monthly Rental Rate(1) | Average Monthly Rental Rate per SF(1) | Average Monthly Market Rental Rate(2) | Average Monthly Market Rental Rate per SF(2) |
| Studio | 18 | 27.3 | % | 655 | $1,898 | $2.90 | $2,056 | $2.97 |
| 1 Bedroom | 31 | 47.0 | | 830 | $2,014 | $2.42 | $2,014 | $2.43 |
| 2 Bedroom | 12 | 18.2 | | 1,281 | $4,225 | $3.30 | $3,589 | $2.86 |
| 3 Bedroom | 3 | 4.5 | | 1,536 | $8,828 | $5.75 | $3,128 | $2.32 |
| 4 Bedroom | 2 | 3.0 | | 2,055 | $14,728 | $7.17 | NAV | NAV |
| Total/Wtd. Avg. | 66 | 100.0 | % | 934 | $3,079 | $3.30 | $2,500 | $2.66 |
| (1) | Based on the underwritten rent roll dated March 1, 2022. |
COVID-19 Update. As of September 6, 2022, the Yorkshire & Lexington Towers Properties are open and operating. As of the date of this term sheet, the Yorkshire & Lexington Towers Whole Loan is not subject to any forbearance, modification or debt service relief request. The first payment date of the Yorkshire & Lexington Towers Whole Loan was July 6, 2022.
Environmental. According to the Phase I reports dated February 3, 2022 and January 19, 2022, there was no evidence of any recognized environmental conditions at the Yorkshire & Lexington Towers Properties. The Phase I environmental assessment, however, did acknowledge historical recognized environmental conditions at the Yorkshire Towers Property.
The following table presents certain information relating to the historical and current occupancy of the Yorkshire & Lexington Towers Properties:
| Historical and Current Multifamily Occupancy(1) |
| 2019 | 2020 | 2021 | Current(2) |
| 94.7% | 81.2% | 94.7% | 96.4% |
| (1) | Historical occupancies are as of December 31 of each respective year. |
| (2) | Current occupancy is as of March 1, 2022. |
THE INFORMATION IN THIS STRUCTURAL AND COLLATERAL TERM SHEET IS NOT COMPLETE AND MAY BE AMENDED PRIOR TO THE TIME OF SALE. THIS TERM SHEET IS NOT AN OFFER TO SELL THESE SECURITIES AND IT IS NOT A SOLICITATION OF AN OFFER TO BUY THESE SECURITIES IN ANY JURISDICTION WHERE THE OFFER OR SALE IS NOT PERMITTED. |
| | 55 | |
| Structural and Collateral Term Sheet | | BMO 2022-C3 |
| |
| No. 3 – Yorkshire & Lexington Towers |
| Operating History and Underwritten Net Cash Flow |
| | 2019 | 2020 | 2021 | TTM(1) | Underwritten | Per Unit | %(2) |
| Residential Base Rent | $34,429,262 | $32,908,021 | $33,023,336 | $34,184,092 | $39,497,416 | $48,883 | 74.9 | % |
| Commercial Base Rent | 6,197,568 | 5,981,339 | 5,764,022 | 5,810,592 | 6,984,828 | 8,645 | 13.3 | |
| Gross Potential Rent | $40,626,830 | $38,889,360 | $38,787,358 | $39,994,684 | $46,482,244 | $57,528 | 88.2 | % |
| Total Reimbursements | 297,713 | 410,419 | 284,498 | 324,797 | 327,568 | 405 | 0.6 | |
| Supplemental Income Reserve(3) | 0 | 0 | 0 | 0 | 5,226,004 | 6,468 | 9.9 | |
| Total Other Income | 702,657 | 863,978 | 694,304 | 675,664 | 675,664 | 836 | 1.3 | |
| Net Rental Income | $41,627,200 | $40,163,756 | $39,766,160 | $40,995,144 | $52,711,480 | $65,237 | 100.0 | % |
| (Vacancy/Credit Loss) | (99,272) | (35,705) | 0 | 0 | (1,316,592) | (1,629) | (2.5 | ) |
| Effective Gross Income | $41,527,928 | $40,128,052 | $39,766,160 | $40,995,144 | $51,394,888 | $63,608 | 97.5 | % |
| Total Expenses | $14,184,113 | $14,510,102 | $15,511,878 | $15,672,705 | $16,019,126 | $19,826 | 31.2 | % |
| Net Operating Income(3) | $27,343,815 | $25,617,949 | $24,254,281 | $25,322,439 | $35,375,762 | $43,782 | 68.8 | % |
| Total TI/LC, Capex/RR(4) | 0 | 0 | 0 | 0 | 0 | 0 | 0.0 | |
| Net Cash Flow | $27,343,815 | $25,617,949 | $24,254,281 | $25,322,439 | $35,375,762 | $43,782 | 68.8 | % |
| (1) | TTM represents the trailing 12 months ending February 2022. |
| (2) | % column represents percent of Net Rental Income for all revenue lines and represents percent of Effective Gross Income for the remainder of the fields. |
| (3) | The Underwritten Net Operating Income is greater than the TTM Net Operating Income due in part to (i) the borrower sponsors recently renovating 57 units, which has increased rents at the Yorkshire & Lexington Towers Properties, (ii) underwritten straight-lined rent for CVS and (iii) disbursements from the Supplemental Income Reserve. Please refer to “Escrows and Reserves” below. |
| (4) | The borrower sponsors funded five years’ worth of TI/LC, Capex/RR at origination. |
The Market. The Yorkshire & Lexington Towers Properties are located in New York, New York, within the New York, NY-NJ-PA Metropolitan Statistical Area. According to the appraisal, the unemployment rate from 2011 through 2021 in New York City increased at an annual rate of 0.3% and is expected to decrease at an average annual rate of 4.7% between 2022 and 2026. The estimated 2021 median annual household income in New York City was $68,261. The leading industries are education and health, professional and business, government, and trade, transportation and utilities. The largest employer in New York City is Northwell Health, which employs 68,088 people. The Yorkshire Towers Property is located on the northeast corner of Second Avenue and East 86th Street. The Lexington Towers Property is located on the southeast corner of Lexington Avenue and East 88th Street. The Upper East Side is generally considered the area that extends from East 59th to East 110th Streets, east of Central Park and Fifth Avenue to the East River. The Upper East Side is known for its many art galleries such as the Metropolitan Museum of Art, and Hunter College of the City University of New York which occupies several modern high-rise buildings at 68th Street and Lexington Avenue. The largest institutions of higher learning on the East Side are along York Avenue and the FDR Drive, including Rockefeller University and the Cornell Medical Center. The Yorkshire & Lexington Towers Properties benefit from their proximity to Fifth Avenue, which forms the eastern border of Central Park, as well as Madison Avenue, which is dense with prime retail and commercial space.
The Yorkshire & Lexington Towers Properties are situated in the Upper East Side multifamily submarket. According to CoStar, as of February 2022, the Upper East Side multifamily submarket had an overall vacancy rate of 2.0%, with net absorption totaling 17 units. The vacancy rate decreased 2.2% over the past 12 months. Rental rates increased by 3.1% for the past 12 months and ended at $4,096 per unit per month. A total of 46 units are still under construction at the end of the quarter.
According to the appraisal, the 2021 population for New York City was approximately 8,305,600 and is forecasted to grow to approximately 8,317,700 in 2022, and approximately 8,335,900 in 2026.
THE INFORMATION IN THIS STRUCTURAL AND COLLATERAL TERM SHEET IS NOT COMPLETE AND MAY BE AMENDED PRIOR TO THE TIME OF SALE. THIS TERM SHEET IS NOT AN OFFER TO SELL THESE SECURITIES AND IT IS NOT A SOLICITATION OF AN OFFER TO BUY THESE SECURITIES IN ANY JURISDICTION WHERE THE OFFER OR SALE IS NOT PERMITTED. |
| | 56 | |
| Structural and Collateral Term Sheet | | BMO 2022-C3 |
| |
| No. 3 – Yorkshire & Lexington Towers |
The following table presents certain information relating to comparable retail leases for the Yorkshire & Lexington Towers Properties:
| Comparable Retail Leases(1) |
| Property / Location | Tenant SF | Year Built / Renovated | Tenant | Rent PSF | Commencement Date | Lease Term (Mos.) | Lease Type |
Yorkshire Towers New York, NY | 15,813(2) | 1964 / 2014, 2022 | CVS Pharmacy | $252.37 | (2) | May 2017 | (2) | 189(2) | Triple Net |
201 East 86th Street New York, NY | 6,565 | 1987 / NAV | Lululemon | $240.00 | | Q4 2021 | | 120 | Triple Net |
1523 Second Avenue New York, NY | 4,488 | NAV / NAV | NY Allergy and Asthma | $100.00 | | Q4 2021 | | 144 | Triple Net |
1503 Third Avenue New York, NY | 3,200 | NAV / NAV | Cohen’s Fashion Optical | $175.00 | | Q3 2021 | | 120 | Triple Net |
1592 Third Avenue New York, NY | 400 | NAV / NAV | Marathon Coffee | $90.00 | | Q3 2021 | | 120 | Triple Net |
207 East 84th Street New York, NY | 1,340 | NAV / NAV | Glosslab | $116.00 | | Q2 2021 | | 120 | Triple Net |
| (2) | Based on underwritten rent roll dated as of March 1, 2022. |
The following table presents certain information relating to comparable multifamily rental properties to the Yorkshire & Lexington Towers Properties:
| Comparable Rental Summary(1) |
| Property Address | Year Built | Occupancy | # of Units | Unit Mix | Average SF per Unit | Average Rent per SF | Average Rent per Unit |
Yorkshire & Lexington Towers(2) 160 East 88th Street; 305 East 86th Street New York, NY | 1963, 1964 | 96.4% | 808 | Studio 1 Bed 2 Bed 3 Bed 4 Bed | 570 786 1,187 1,356 1,944 | $55.65 $53.55 $46.68 $65.75 $88.93 | $2,642 $3,505 $4,617 $7,430 $14,405 |
| The Serrano | 1986 | 92.6% | 263 | 1 Bed | 650 | $83.10 | $4,501 |
| 1735 York Avenue | | | | 2 Bed | NAV | NAV | $7,201 |
| New York, NY | | | | 3 Bed | NAV | NAV | $8,878 |
| Ventura | 1999 | 98.4% | 246 | Studio | 508 | $88.20 | $3,734 |
| 240 East 86th Street | | | | 1 Bed | 751 | $74.38 | $4,652 |
| New York, NY | | | | 2 Bed | 967 | $79.15 | $6,380 |
| | | | | 3 Bed | 1,293 | $82.79 | $8,921 |
| The Lucerne | 1989 | 98.6% | 219 | 1 Bed | 659 | $84.07 | $4,617 |
| 350 East 79th Street | | | | 2 Bed | 906 | $94.49 | $7,134 |
| New York, NY | | | | 3 Bed | NAV | NAV | $11,878 |
| | | | | 4 Bed | NAV | NAV | $17,975 |
| The Colorado | 1987 | 99.6% | 173 | Studio | 547 | $86.69 | $3,953 |
| 201 East 86th Street | | | | 1 Bed | 667 | $82.70 | $4,595 |
| New York, NY | | | | 2 Bed | 937 | $85.51 | $6,675 |
| | | | | 3 Bed | 1,254 | $95.10 | $9,938 |
| | | | | 4 Bed | 1,940 | $95.71 | $15,473 |
| The Strathmore | 1996 | 99.2% | 179 | 1 Bed | 714 | $70.05 | $4,168 |
| 400 East 84th Street | | | | 2 Bed | 1,166 | $71.28 | $6,926 |
| New York, NY | | | | 3 Bed | 1,611 | $83.55 | $11,217 |
| | | | | 4 Bed | NAV | NAV | $17,520 |
| One Carnegie Hill | 2005 | 99.6% | 455 | Studio | 484 | $83.18 | $3,355 |
| 215 East 96th Street | | | | 1 Bed | 636 | $78.13 | $4,141 |
| New York, NY | | | | 2 Bed | 879 | $85.30 | $6,248 |
| | | | | 3 Bed | 1,239 | $80.56 | $8,318 |
| | | | | 4 Bed | 1,350 | $94.44 | $10,625 |
| CONVIVIUM | 2020 | 98.6% | 140 | Studio | 638 | $80.88 | $4,300 |
| 515 East 86th Street | | | | 1 Bed | 741 | $88.67 | $5,474 |
| New York, NY | | | | 2 Bed | 1,138 | $79.33 | $7,523 |
| | | | | 3 Bed | 1,369 | $85.50 | $9,750 |
| (1) | Source: Appraisal, unless otherwise indicated. Comparables include a mix of affordable and market rate units. |
| (2) | Based on underwritten rent roll dated as of March 1, 2022. Average Rent per SF and Average Rent per Unit reflect average monthly in-place rent for occupied units. |
THE INFORMATION IN THIS STRUCTURAL AND COLLATERAL TERM SHEET IS NOT COMPLETE AND MAY BE AMENDED PRIOR TO THE TIME OF SALE. THIS TERM SHEET IS NOT AN OFFER TO SELL THESE SECURITIES AND IT IS NOT A SOLICITATION OF AN OFFER TO BUY THESE SECURITIES IN ANY JURISDICTION WHERE THE OFFER OR SALE IS NOT PERMITTED. |
| | 57 | |
| Structural and Collateral Term Sheet | | BMO 2022-C3 |
| |
| No. 3 – Yorkshire & Lexington Towers |
The Borrowers. The borrowers under the Yorkshire & Lexington Towers Whole Loan are CF E 88 LLC, SM E 88 LLC, CF E 86 LLC, SM E 86 LLC and LSG E 86 LLC, as tenants in common (the first two as tenants in common for the Lexington Towers Property, and the last three as tenants in common for the Yorkshire Towers Property), each a single-purpose Delaware limited liability company with two independent directors. Legal counsel to the borrowers delivered a non-consolidation opinion in connection with the origination the Yorkshire & Lexington Towers Whole Loan.
The Borrower Sponsors. The borrower sponsors and non-recourse carveout guarantors are Meyer Chetrit and The Gluck Family Trust U/A/D July 16, 2009. Meyer Chetrit is one of the controllers of The Chetrit Group. The Chetrit Group is an experienced, privately held New York City real estate development firm controlled by two brothers: Joseph and Meyer Chetrit. The Chetrit Group, which is headquartered in Manhattan, has ownership interests in over 14 million square feet of commercial and residential real estate across the United States, including New York, Chicago, Miami, and Los Angeles, as well as internationally. Laurence Gluck is the founder of Stellar Management, a real estate development and management firm founded in 1985. Based in New York City, Stellar Management owns and manages a portfolio of over 12,000 apartments in 100 buildings located across New York City and over two million square feet of office space. Prior to founding Stellar Management, Laurence Gluck served as a real estate attorney at Proskauer, Rose, Goetz & Mendelsohn and later as a partner at Dreyer & Traub. Laurence Gluck also formerly served as a member of the Board of Governors of the Real Estate Board of New York.
Property Management. The Yorkshire & Lexington Towers Properties are managed by Jumeaux Management LLC, an affiliate of the borrowers.
Escrows and Reserves. At origination of the Yorkshire & Lexington Towers Whole Loan, the borrowers deposited approximately (i) $5,390,917 into a real estate tax reserve account, (ii) $367,868 into an insurance premiums reserve account, (iii) $1,100,000 into a replacement reserve account, (iv) $1,000,000 into a tenant improvement and leasing commissions reserve account, (v) $6,500,000 into a unit upgrade reserve account and (vi) $5,900,000 into a supplemental income reserve account.
Tax Escrows – The borrowers are required to deposit into a real estate tax reserve, on a monthly basis, 1/12th of the taxes that the lender estimates will be payable over the next-ensuing 12-month period (initially estimated to be approximately $898,486).
Insurance Escrows – The borrowers are required to deposit into an insurance reserve, on a monthly basis, 1/12th of the amount which will be sufficient to pay the insurance premiums due for the renewal of coverage afforded by such policies; provided, however, such insurance reserve has been conditionally waived so long as (i) no event of default is continuing and (ii) the borrowers maintain a blanket policy meeting the requirements of the Yorkshire & Lexington Towers Whole Loan documents. The borrowers are currently maintaining a blanket policy.
Supplemental Income Reserve – The Yorkshire & Lexington Towers Properties are currently undergoing certain renovations, and the borrowers deposited $5,900,000 into a supplemental income reserve account (the “Supplemental Income Reserve”) at origination of the Yorkshire & Lexington Towers Whole Loan. Unless and until the Yorkshire & Lexington Towers Properties (excluding the amount on deposit in the Supplemental Income Reserve) achieve a 5.0% “transient” Yorkshire & Lexington Towers Total Debt debt yield (calculated on the basis of annualized net cash flow for a three month period ending with the most recently completed month), the lender may require the borrowers to make additional Supplemental Income Reserve deposits if and to the extent the lender determines, in its reasonable discretion on a quarterly basis after May 6, 2023 during the Yorkshire & Lexington Towers Whole Loan term, that additional supplemental income reserve deposits are required in order to achieve (when the additional deposit and all other deposits in the Supplemental Income Reserve account are added to net cash flow for the Yorkshire & Lexington Towers Properties) a 5.0% transient Yorkshire & Lexington Towers Total Debt debt yield for the following 12, 9, 6 or 3 months (such applicable 12-, 9-, 6- or 3- month period depending on the quarter with respect to which such determination by the lender is made). The guarantors provided a related carry guaranty of certain carry costs, including real estate taxes, insurance premiums, debt service and operating expenses, for any period until the Yorkshire & Lexington Towers Properties achieve a 5.0% transient Yorkshire & Lexington Towers Total Debt debt yield (excluding the amount on deposit in the Supplemental Income Reserve). The obligations of the guarantors under such carry guaranty are limited to the additional Supplemental Income Reserve deposit amount as and when due.
THE INFORMATION IN THIS STRUCTURAL AND COLLATERAL TERM SHEET IS NOT COMPLETE AND MAY BE AMENDED PRIOR TO THE TIME OF SALE. THIS TERM SHEET IS NOT AN OFFER TO SELL THESE SECURITIES AND IT IS NOT A SOLICITATION OF AN OFFER TO BUY THESE SECURITIES IN ANY JURISDICTION WHERE THE OFFER OR SALE IS NOT PERMITTED. |
| | 58 | |
| Structural and Collateral Term Sheet | | BMO 2022-C3 |
| |
| No. 3 – Yorkshire & Lexington Towers |
So long as no event of default under the Yorkshire & Lexington Towers Whole Loan is continuing, on each payment date, the lender is required to transfer the Monthly Supplemental Income Reserve Disbursement Amount (as defined below) from the Supplemental Income Reserve to the cash management account. Such funds deposited into the cash management account will be required to be applied with all other funds then on deposit in the cash management account in the order of priority set forth in the Yorkshire & Lexington Towers Whole Loan documents, as described under “Lockbox / Cash Management” below. So long as no event of default under the Yorkshire & Lexington Towers Whole Loan is continuing, upon such time as the lender has reasonably determined that the Yorkshire & Lexington Towers Properties (excluding the amount on deposit in the Supplemental Income Reserve) have achieved a 5.0% “transient” Yorkshire & Lexington Towers Total Debt debt yield (calculated on the basis of annualized net cash flow for a three month period ending with the most recently completed month), then upon the borrowers’ written request, all of the funds in the Supplemental Income Reserve will be required to be disbursed to the borrowers; provided, however, if a Cash Trap Period (as defined below) is then continuing, then such funds will not be disbursed to the borrowers, and such funds will instead be deposited into the excess cash reserve account, to be applied in accordance with the terms of the Yorkshire & Lexington Towers Whole Loan documents.
“Monthly Supplemental Income Reserve Disbursement Amount” means 1/12th of (x) the initial Supplemental Income Reserve deposit with respect to the first 12 payment dates occurring during the term of the Yorkshire & Lexington Towers Whole Loan, and (y) each Supplemental Income Reserve additional deposit amount with respect to the 12 payment dates following the date that the borrowers are required to deposit such Supplemental Income Reserve additional deposit amount pursuant to the terms of the Yorkshire & Lexington Towers Whole Loan documents; provided that, if at any time the lender reassesses the Supplemental Income Reserve additional deposit amount in accordance with the terms of the Yorkshire & Lexington Towers Whole Loan documents, the Monthly Supplemental Income Reserve Disbursement Amount will be adjusted so that all of funds in the Supplemental Income Reserve will be disbursed in equal monthly installments ending on such Supplemental Income Reserve reassessment date (i.e., so that there will be no funds in the Supplemental Income Reserve on deposit on such Supplemental Income Reserve reassessment date).
Lockbox / Cash Management. The Yorkshire & Lexington Towers Whole Loan is structured with a hard lockbox for commercial tenants and a soft lockbox for residential tenants, and in place cash management. The borrowers are required to deposit all rents collected from residential tenants into the lockbox account within three days of receipt. The borrowers are required to deliver a tenant direction letter to commercial tenants to deposit all rents directly to the lockbox account. The borrowers are required to cause all amounts deposited into the lockbox account to be transferred on each business day to a cash management account controlled by the lender. Absent an event of default under the Yorkshire & Lexington Towers Whole Loan documents, funds on deposit in the cash management account are applied on each monthly payment date in amounts and in the order of priority set forth in the Yorkshire & Lexington Towers Whole Loan Documents, including any required tax and insurance reserve deposits, deposit account bank fees, monthly debt service on the Yorkshire & Lexington Towers Whole Loan, other amounts payable to the lender under the Yorkshire & Lexington Towers Whole Loan, operating expenses reflected in the annual budget or otherwise approved by lender, and debt service under the mezzanine loans, with the remaining funds in the cash management account to be disbursed to the borrowers unless a Cash Trap Period is then continuing, in which event the remaining funds will be deposited into an excess cash reserve account under the lender’s control, and released to the borrower when the Cash Trap Period ends. Upon an event of default under the Yorkshire & Lexington Towers Whole Loan documents, the lender will apply funds in such priority as it may determine.
A “Cash Trap Period” means a period commencing upon the earliest to occur of (i) an event of default; (ii) any bankruptcy action of the borrowers, principal, guarantor or manager has occurred; (iii) the failure by the borrowers, after stabilization (i.e. until a Yorkshire & Lexington Towers Total Debt debt yield of at least 5.0% has been achieved (without taking into account any disbursement of Supplemental Income Reserve funds) for one calendar quarter, provided no event of default then exists), to maintain a Yorkshire & Lexington Towers Total Debt debt yield of at least 4.25%; or (iv) a Yorkshire & Lexington Towers Mezzanine Loan (as defined below) event of default and will be cured upon (a) with respect to clause (i) above, the lender accepts a cure of the event of default; (b) in the case of a bankruptcy action by or against manager only, the borrowers replace the manager with a qualified replacement as defined in the Yorkshire & Lexington Towers Whole Loan documents; (c) with respect to clause (iii) above, the Yorkshire & Lexington Towers Total Debt debt yield is equal to or greater than 4.75% for one calendar quarter; or (d) with respect to clause (iv) above, the applicable Yorkshire & Lexington Towers Mezzanine Loan lender accepts a cure of such Yorkshire & Lexington Towers Mezzanine Loan event of default.
THE INFORMATION IN THIS STRUCTURAL AND COLLATERAL TERM SHEET IS NOT COMPLETE AND MAY BE AMENDED PRIOR TO THE TIME OF SALE. THIS TERM SHEET IS NOT AN OFFER TO SELL THESE SECURITIES AND IT IS NOT A SOLICITATION OF AN OFFER TO BUY THESE SECURITIES IN ANY JURISDICTION WHERE THE OFFER OR SALE IS NOT PERMITTED. |
| | 59 | |
| Structural and Collateral Term Sheet | | BMO 2022-C3 |
| |
| No. 3 – Yorkshire & Lexington Towers |
Subordinate and Mezzanine Debt. The Yorkshire & Lexington Towers Properties also secure the Yorkshire & Lexington Towers Subordinate Companion Loan, which has an aggregate Cut-off Date principal balance of $221,500,000. The Yorkshire & Lexington Towers Subordinate Companion Loan accrues interest at 3.04000% per annum. The Yorkshire & Lexington Towers Senior Loan is senior in right of payment to the Yorkshire & Lexington Towers Subordinate Companion Loan.
Concurrently with the funding of the Yorkshire & Lexington Towers Whole Loan, BMO and Citigroup Global Markets Realty Corp. (“CGMRC”) co-originated a mezzanine A loan in the amount of $80,000,000 to be secured by the mezzanine A borrower’s interests in the borrower, as collateral for the mezzanine A loan (the “Mezzanine A Loan”). The Mezzanine A Loan is coterminous with the Yorkshire & Lexington Towers Whole Loan. The Mezzanine A Loan accrues interest at a rate of 5.80000% per annum and requires interest-only payments until its maturity date.
Concurrently with the funding of the Yorkshire & Lexington Towers Whole Loan, BMO and CGMRC co-originated a mezzanine B loan in the amount of $23,100,000 to be secured by the mezzanine B borrower’s interests in the mezzanine A borrower, as collateral for the mezzanine B loan (the “Mezzanine B Loan”). The Mezzanine B Loan is coterminous with the Yorkshire & Lexington Towers Whole Loan. The Mezzanine B Loan accrues interest at a rate of 7.14000% per annum and requires interest-only payments until its maturity date.
Concurrently with the funding of the Yorkshire & Lexington Towers Whole Loan, BMO and CGMRC co-originated a mezzanine C loan in the amount of $25,000,000 to be secured by the mezzanine C borrower’s interests in the mezzanine B borrower, as collateral for the mezzanine C loan (the “Mezzanine C Loan”). The Mezzanine C Loan is coterminous with the Yorkshire & Lexington Towers Whole Loan. The Mezzanine C Loan accrues interest at a rate of 8.00000% per annum and requires interest-only payments until its maturity date.
Concurrently with the funding of the Yorkshire & Lexington Towers Whole Loan, BMO and CGMRC co-originated a mezzanine D loan in the amount of $46,400,000 to be secured by the mezzanine D borrower’s interests in the mezzanine C borrower, as collateral for the mezzanine D loan (the “Mezzanine D Loan”, collectively with the Mezzanine A Loan, the Mezzanine B Loan and the Mezzanine C Loan, the “Yorkshire & Lexington Towers Mezzanine Loans”). The Mezzanine D Loan is coterminous with the Yorkshire & Lexington Towers Whole Loan. The Mezzanine D Loan accrues interest at a rate of 9.46185345% per annum and requires interest-only payments until its maturity date.
| Total Loan Metrics |
| | % of Total Loan | Cut-off Date LTV | UW NOI Debt Yield(1) | UW NCF DSCR(1) |
| A Notes | 44.5% | 33.3% | 11.1% | 3.61x |
| B Notes | 31.0% | 56.6% | 6.6% | 2.13x |
| Mezzanine Loans | 24.4% | 74.8% | 5.0% | 1.20x |
| (1) | The UW NOI and UW NCF includes disbursements from a Supplemental Income Reserve of $5,226,004. Please refer to “Escrows and Reserves” above. |
Partial Release. Not permitted.
Ground Lease. None.
THE INFORMATION IN THIS STRUCTURAL AND COLLATERAL TERM SHEET IS NOT COMPLETE AND MAY BE AMENDED PRIOR TO THE TIME OF SALE. THIS TERM SHEET IS NOT AN OFFER TO SELL THESE SECURITIES AND IT IS NOT A SOLICITATION OF AN OFFER TO BUY THESE SECURITIES IN ANY JURISDICTION WHERE THE OFFER OR SALE IS NOT PERMITTED. |
| | 60 | |
| Structural and Collateral Term Sheet | | BMO 2022-C3 |
| |
| No. 4 – Phoenix Industrial Portfolio IX |
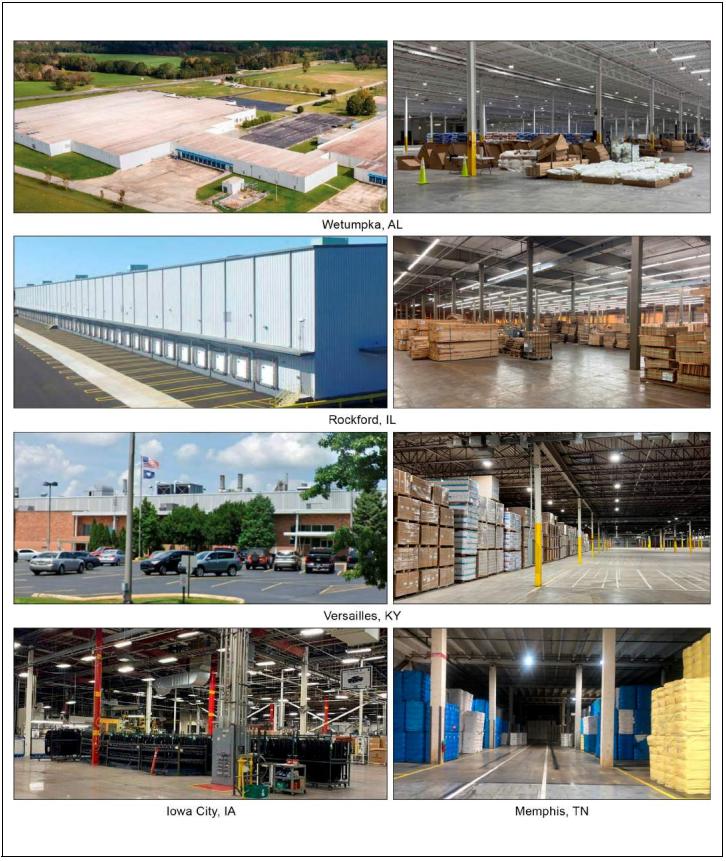
THE INFORMATION IN THIS STRUCTURAL AND COLLATERAL TERM SHEET IS NOT COMPLETE AND MAY BE AMENDED PRIOR TO THE TIME OF SALE. THIS TERM SHEET IS NOT AN OFFER TO SELL THESE SECURITIES AND IT IS NOT A SOLICITATION OF AN OFFER TO BUY THESE SECURITIES IN ANY JURISDICTION WHERE THE OFFER OR SALE IS NOT PERMITTED. |
| | 61 | |
| Structural and Collateral Term Sheet | | BMO 2022-C3 |
| |
| No. 4 – Phoenix Industrial Portfolio IX |
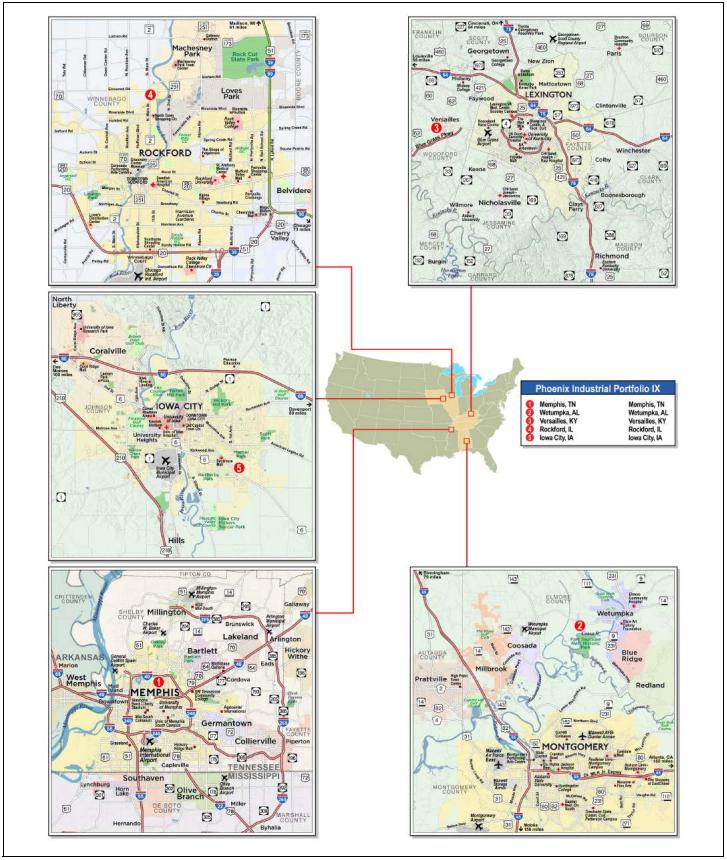
THE INFORMATION IN THIS STRUCTURAL AND COLLATERAL TERM SHEET IS NOT COMPLETE AND MAY BE AMENDED PRIOR TO THE TIME OF SALE. THIS TERM SHEET IS NOT AN OFFER TO SELL THESE SECURITIES AND IT IS NOT A SOLICITATION OF AN OFFER TO BUY THESE SECURITIES IN ANY JURISDICTION WHERE THE OFFER OR SALE IS NOT PERMITTED. |
| | 62 | |
| Structural and Collateral Term Sheet | | BMO 2022-C3 |
| |
| No. 4 – Phoenix Industrial Portfolio IX |
Mortgage Loan Information | | Property Information |
| Mortgage Loan Seller: | UBS AG | | Single Asset / Portfolio: | Portfolio |
| Original Principal Balance(1): | $37,000,000 | | Title: | Fee |
| Cut-off Date Principal Balance(1): | $37,000,000 | | Property Type – Subtype: | Industrial – Various |
| % of IPB: | 5.1% | | Net Rentable Area (SF): | 3,760,303 |
| Loan Purpose: | Refinance | | Location: | Various |
| Borrowers(2): | Various | | Year Built / Renovated: | Various / Various |
| Borrower Sponsor: | Phoenix Investors | | Occupancy: | 71.9% |
| Interest Rate: | 6.11700% | | Occupancy Date: | 9/6/2022 |
| Note Date: | 9/8/2022 | | 4th Most Recent NOI (As of)(4): | NAV |
| Maturity Date: | 10/6/2032 | | 3rd Most Recent NOI (As of)(4): | NAV |
| Interest-only Period: | 120 months | | 2nd Most Recent NOI (As of)(4): | NAV |
| Original Term: | 120 months | | Most Recent NOI (As of)(5)(6): | $1,619,979 (Various) |
| Original Amortization Term: | None | | UW Economic Occupancy: | 71.9% |
| Amortization Type: | Interest Only | | UW Revenues: | $10,984,549 |
| Call Protection(3): | L(24),D(90),O(6) | | UW Expenses: | $3,597,682 |
| Lockbox / Cash Management: | Hard / Springing | | UW NOI(6): | $7,386,867 |
| Additional Debt(1): | Yes | | UW NCF: | $6,865,446 |
| Additional Debt Balance(1): | $38,000,000 | | Appraised Value / Per SF(7): | $182,200,000 / $48 |
| Additional Debt Type(1): | Pari Passu | | Appraisal Date: | Various |
| | | | | |
| Escrows and Reserves(8) | | Financial Information(1) |
| | Initial | Monthly | Initial Cap | | Cut-off Date Loan / SF: | $20 |
| Taxes: | $257,137 | $56,408 | N/A | | Maturity Date Loan / SF: | $20 |
| Insurance: | $0 | Springing | N/A | | Cut-off Date LTV(7): | 41.2% |
| Replacement Reserves: | $0 | $31,336 | $1,130,000 | | Maturity Date LTV(7): | 41.2% |
| TI / LC Reserve: | $3,000,000 | Springing | $1,500,000 | | UW NCF DSCR: | 1.48x |
| Earn-out Reserve: | $5,000,000 | $0 | N/A | | UW NOI Debt Yield(9): | 10.6% |
| Other: | $1,671,741 | $0 | N/A | | | |
| | | | | | | |
| Sources and Uses |
| Sources | Proceeds | % of Total | | Uses | Proceeds | % of Total |
| Whole Loan | $75,000,000 | 100.0 | % | | Loan Payoff | $53,813,642 | 71.8 | % |
| | | | | Upfront Reserves | 9,928,878 | 13.2 | |
| | | | | Return of Equity | 5,815,441 | 7.8 | |
| | | | | Partnership Buyout | 4,349,545 | 5.8 | |
| | | | | Closing Costs | 1,092,493 | 1.5 | |
| Total Sources | $75,000,000 | 100.0 | % | | Total Uses | $75,000,000 | 100.0 | % |
| (1) | The Phoenix Industrial Portfolio IX Mortgage Loan (as defined below) is part of a whole loan evidenced by six pari passu notes with an aggregate outstanding principal balance as of the Cut-off Date of $75.0 million (the “Phoenix Industrial Portfolio IX Whole Loan”). The financial information in the chart above is based on the $75.0 million Phoenix Industrial Portfolio IX Whole Loan. |
| (2) | See “The Borrowers” below for more information. |
| (3) | Defeasance of the Phoenix Industrial Portfolio IX Whole Loan is permitted at any time after the date that is two years after the closing date of the securitization that includes the last note to be securitized. The assumed defeasance lockout period of 24 payments is based on the anticipated closing date of the BMO 2022-C3 securitization trust in October 2022. The actual lockout period may be longer. |
| (4) | 4th Most Recent NOI, 3rd Most Recent NOI and 2nd Most Recent NOI are unavailable as the borrower sponsor acquired the Phoenix Industrial Portfolio IX Properties (as defined below) between 2019 and 2021 with full year 2020 and 2021 operating statements not available. |
| (5) | The Most Recent NOI represents the trailing 10 months ending April 2022 for the Iowa City, IA property and the trailing 12 months ending April 2022 for the remaining properties. The Most Recent NOI only includes partial year information for the Iowa City, IA property as it was 100.0% vacant. |
| (6) | The increase from the Most Recent NOI to UW NOI is primarily attributable to (i) leasing totaling an additional approximately $4.1 million in base rent, (ii) approximately $335,509 in rent steps through October 2023, (iii) approximately $21,103 in straight-lined rent for investment-grade tenant, Amazon, and (iv) an additional approximately $1.1 million in reimbursements. Additionally, the utilities expense was underwritten approximately $671,666 less than trailing 12 months utilities expenses due to (i) the elimination of excess use charges and installation of high efficiency LED lighting at the Versailles, KY property and (ii) Amazon, the largest tenant at the Rockford, IL property, being separately metered and paying gas bills directly to the utility company. |
| (7) | The Cut-off Date LTV Ratio presented above is calculated based on the full outstanding principal balance of the Phoenix Industrial Portfolio IX Whole Loan (without netting the Earn-out Reserve (as defined below)) and the aggregate “as is” appraised value. The Cut-off Date LTV Ratio based on the Phoenix Industrial Portfolio IX Whole Loan net of the $5,000,000 Earn-out Reserve and the aggregate “as is” appraised value is 38.4%. The Maturity Date LTV presented above is calculated based on the full |
THE INFORMATION IN THIS STRUCTURAL AND COLLATERAL TERM SHEET IS NOT COMPLETE AND MAY BE AMENDED PRIOR TO THE TIME OF SALE. THIS TERM SHEET IS NOT AN OFFER TO SELL THESE SECURITIES AND IT IS NOT A SOLICITATION OF AN OFFER TO BUY THESE SECURITIES IN ANY JURISDICTION WHERE THE OFFER OR SALE IS NOT PERMITTED. |
| | 63 | |
| Structural and Collateral Term Sheet | | BMO 2022-C3 |
| |
| No. 4 – Phoenix Industrial Portfolio IX |
outstanding principal balance of the Phoenix Industrial Portfolio IX Whole Loan (without netting the Earn-out Reserve) and the “as is” appraised value of $182,200,000. The Maturity Date LTV based on the full outstanding principal balance of the Phoenix Industrial Portfolio IX Whole Loan (without netting the Earn-out Reserve) and the aggregate “as stabilized” appraised value of $191,100,000 is 39.2%.
| (8) | For a full description of Escrows and Reserves, including the Earn-out Reserve, see “Escrows and Reserves” below. |
| (9) | The UW NOI Debt Yield presented above is calculated based on the Phoenix Industrial Portfolio IX Whole Loan net of the $5,000,000 Earn-out Reserve. The UW NOI Debt Yield based on the full outstanding principal balance of the Phoenix Industrial Portfolio IV Whole Loan (without netting the Earn-out Reserve) is 9.8%. |
The Loan. The fourth largest mortgage loan (the “Phoenix Industrial Portfolio IX Mortgage Loan”) is part of a fixed rate whole loan secured by the borrowers’ fee interest in a 3,760,303 square foot portfolio of five industrial properties located in Tennessee, Alabama, Illinois, Iowa and Kentucky (each, a “Phoenix Industrial Portfolio IX Property”, and collectively, the “Phoenix Industrial Portfolio IX Properties”). The Phoenix Industrial Portfolio IX Whole Loan consists of six pari passu notes and accrues interest at a rate of 6.11700% per annum. The Phoenix Industrial Portfolio IX Whole Loan has a 10-year term and is interest only for the entire term. The controlling Note A-1, with an original principal balance of $37,000,000, will be included in the BMO 2022-C3 securitization trust. The remaining notes are expected to be contributed to other securitization trusts. The relationship between the holders of the Phoenix Industrial Portfolio IX Whole Loan will be governed by a co-lender agreement as described under “Description of the Mortgage Pool—The Whole Loans—The Serviced Pari Passu Whole Loans” in the Preliminary Prospectus.
| Whole Loan Summary |
| Note | Original Balance | Cut-off Date Balance | | Note Holder | Controlling Piece |
| A-1 | $37,000,000 | $37,000,000 | | BMO 2022-C3 | Yes |
| A-2 | $20,000,000 | $20,000,000 | | UBS AG(1) | No |
| A-3 | $10,000,000 | $10,000,000 | | UBS AG(1) | No |
| A-4 | $4,000,000 | $4,000,000 | | UBS AG(1) | No |
| A-5 | $2,000,000 | $2,000,000 | | UBS AG(1) | No |
| A-6 | $2,000,000 | $2,000,000 | | UBS AG(1) | No |
| Whole Loan | $75,000,000 | $75,000,000 | | | |
| (1) | The subject notes are expected to be contributed to one or more future securitization trust(s). |
The Properties. The Phoenix Industrial Portfolio IX Whole Loan is secured by five industrial properties totaling 3,760,303 square feet located in Tennessee (one property, 36.6% of NRA), Alabama (one property, 19.6% of NRA), Illinois (one property, 13.8% of NRA), Iowa (one property, 9.1% of NRA) and Kentucky (one property, 21.0% of NRA). The Phoenix Industrial Portfolio IX Properties were 71.9% occupied by 12 tenants as of September 6, 2022. The borrower sponsor acquired the Phoenix Industrial Portfolio IX Properties between 2019 and 2021 for an aggregate purchase price of approximately $26.2 million. Since acquisition, the borrower sponsor has invested approximately $23.1 million in capital improvements at the Phoenix Industrial Portfolio IX Properties.
Memphis, TN (36.6% of NRA; 37.7% of Whole Loan Allocated Loan Amount (“ALA”)): The Memphis, TN property is a 1,374,972 square foot industrial warehouse/distribution building located in Memphis, Tennessee. The improvements were constructed in 1973, renovated in 2020 and include approximately 4.0% of office space. The Memphis, TN property is situated on an approximately 69.2-acre site with 332 surface parking spaces (0.2 per 1,000 square feet). The Memphis, TN property has a total of 218 dock-high doors and clear heights of 23.5 feet to 31.1 feet. As of September 6, 2022, the Memphis, TN property was 65.9% occupied by three tenants. Since acquisition of the Memphis, TN property in December 2019, the borrower sponsor has invested approximately $7.9 million in capital improvements.
Wetumpka, AL (19.6% of NRA; 31.3% of ALA): The Wetumpka, AL property is a 735,231 square foot industrial manufacturing building located in Wetumpka, Alabama. The improvements were constructed in 1997, renovated between 2021 and 2022 and include approximately 2.0% of office space. The Wetumpka, AL property is situated on an approximately 101.6-acre site with 482 surface parking spaces (0.7 per 1,000 square feet). The Wetumpka, AL property has a total of 29 dock-high doors, three drive-in doors and clear heights of 21 feet to 41 feet. As of September 6, 2022, the Wetumpka, AL property was 67.9% occupied by two tenants. Since acquisition of the Wetumpka, AL property in December 2020, the borrower sponsor has invested approximately $8.6 million in capital improvements.
Rockford, IL (13.8% of NRA; 16.0% of ALA): The Rockford, IL property is a 517,574 square foot industrial warehouse/distribution building located in Rockford, Illinois. The improvements were constructed in 1980, renovated in 2019 and include approximately 5.0% of office space. The Rockford, IL property is situated on an approximately 20.8-acre site with 219 surface parking spaces (0.4 per 1,000 square feet). The Rockford, IL property has a total of 82 dock-high doors, two drive-in doors and clear heights of 20 feet to 26 feet. As of September 6, 2022, the Rockford, IL property was 55.1%
THE INFORMATION IN THIS STRUCTURAL AND COLLATERAL TERM SHEET IS NOT COMPLETE AND MAY BE AMENDED PRIOR TO THE TIME OF SALE. THIS TERM SHEET IS NOT AN OFFER TO SELL THESE SECURITIES AND IT IS NOT A SOLICITATION OF AN OFFER TO BUY THESE SECURITIES IN ANY JURISDICTION WHERE THE OFFER OR SALE IS NOT PERMITTED. |
| | 64 | |
| Structural and Collateral Term Sheet | | BMO 2022-C3 |
| |
| No. 4 – Phoenix Industrial Portfolio IX |
occupied by three tenants. Since acquisition of the Rockford, IL property in January 2019, the borrower sponsor has invested approximately $2.6 million in capital improvements.
Iowa City, IA (9.1% of NRA; 10.2% of ALA): The Iowa City, IA property is comprised of two industrial warehouse/distribution buildings totaling 341,491 square feet located in Iowa City, Iowa. The improvements were constructed in 1964, renovated in 2022 and include approximately 3.0% of office space. The Iowa City, IA property is situated on an approximately 20.3-acre site with 470 surface parking spaces (1.4 per 1,000 square feet). The Iowa City, IA property has a total of 22 dock-high doors, five drive-in doors and clear heights of 18 feet to 25 feet. As of September 6, 2022, the Iowa City, IA property was 93.0% occupied by HNI Corporation. Since acquisition of the Iowa City, IA property in June 2021, the borrower sponsor has invested approximately $2.7 million in capital improvements.
Versailles, KY (21.0% of NRA; 4.8% of ALA): The Versailles, KY property is comprised of five industrial warehouse/distribution buildings totaling 791,035 square feet located in Versailles, Kentucky. The improvements were constructed in 1964, renovated in 2011 and include approximately 5.0% of office space. The Versailles, KY property is situated on an approximately 60.6-acre site with 650 surface parking spaces (0.8 per 1,000 square feet). The Versailles, KY property has a total of 27 dock-high doors, 13 drive-in doors and clear heights of 16 feet to 33 feet. As of September 6, 2022, the Versailles, KY property was 87.8% occupied by three tenants. Since acquisition of the Versailles, KY property in June 2020, the borrower sponsor has invested approximately $1.3 million in capital improvements.
The following table presents certain information relating to the Phoenix Industrial Portfolio IX Properties:
| Portfolio Summary(1) |
| Property | State | Subtype | Net Rentable Area (SF)(2) | Year Built/ Renovated | % UW NOI(2) | ALA | % of ALA | “As-Is” Appraised Value | % Office | Clear Heights (ft.) | Dock Doors | Drive-In Doors |
| Memphis, TN | TN | Warehouse/Distribution | 1,374,972 | 1973 / 2020 | 20.4 | % | $28,250,000 | 37.7 | % | $60,000,000 | 4.0% | 23'6 - 31'1 | 218 | 0 |
| Wetumpka, AL | AL | Manufacturing | 735,231 | 1997 / 2021-2022 | 22.2 | | 23,500,000 | 31.3 | | 48,500,000 | 2.0% | 21 - 41 | 29 | 3 |
| Rockford, IL | IL | Warehouse/Distribution | 517,574 | 1980 / 2019 | 11.3 | | 12,000,000 | 16.0 | | 23,300,000 | 5.0% | 20 - 26 | 82 | 2 |
| Iowa City, IA | IA | Warehouse/Distribution | 341,491 | 1964 / 2022 | 17.6 | | 7,650,000 | 10.2 | | 19,700,000 | 3.0% | 18 - 25 | 22 | 5 |
| Versailles, KY | KY | Warehouse/Distribution | 791,035 | 1964 / 2011 | 28.6 | | 3,600,000 | 4.8 | | 30,700,000 | 5.0% | 16 - 33 | 27 | 13 |
| Total/Wtd. Avg. | 3,760,303 | | 100.0 | % | $75,000,000 | 100.0 | % | $182,200,000 | | | 378 | 23 |
| (2) | Based on the underwritten rent rolls dated September 6, 2022. |
COVID-19 Update. As of the date of this term sheet, all the Phoenix Industrial Portfolio IX Properties were open and operating. The first payment date of the Phoenix Industrial Portfolio IX Whole Loan is November 6, 2022. The Phoenix Industrial Portfolio IX Borrowers have reported that no tenant deferments were requested or granted, nor were there any lease modification requests as of September 1, 2022.
Environmental. According to Phase I environmental assessments dated June 21, 2022, there was no evidence of any recognized environmental conditions at the Phoenix Industrial Portfolio IX Properties. The Phase I environmental assessments, however, did acknowledge controlled recognized environmental conditions at the Iowa City, IA property and the Versailles, KY property.
Based on the historical use of the Iowa City, IA property as a manufacturing facility, confirmed VOC contamination, and continued groundwater monitoring under regulatory oversight, the historic use of the Iowa City, IA property is considered a controlled recognized environmental condition. The Phase I environmental assessment recommends continued groundwater monitoring and coordination with the Iowa Department of Natural Resources to obtain final regulatory closure.
The Versailles, KY property is listed in multiple databases related to industrial activities conducted by former tenants at the Versailles, KY property. Regulatory data indicates that lead-contaminated glass was located throughout the Versailles, KY property. As a result, an environmental covenant was issued on February 1, 2008, restricting residential use of portions of the Versailles, KY property due to potential elevated lead concentrations and leachate potential. Based on the regulatory status, implemented soil cover, and environmental covenant, historical lead impacts are considered a controlled recognized environmental condition.
THE INFORMATION IN THIS STRUCTURAL AND COLLATERAL TERM SHEET IS NOT COMPLETE AND MAY BE AMENDED PRIOR TO THE TIME OF SALE. THIS TERM SHEET IS NOT AN OFFER TO SELL THESE SECURITIES AND IT IS NOT A SOLICITATION OF AN OFFER TO BUY THESE SECURITIES IN ANY JURISDICTION WHERE THE OFFER OR SALE IS NOT PERMITTED. |
| | 65 | |
| Structural and Collateral Term Sheet | | BMO 2022-C3 |
| |
| No. 4 – Phoenix Industrial Portfolio IX |
The following table presents certain information relating to the historical and current occupancy of the Phoenix Industrial Portfolio IX Properties:
| Historical and Current Occupancy |
| 2019(1) | 2020(1) | 2021(1) | Current(2) |
| NAV | NAV | NAV | 71.9% |
| (1) | The borrower sponsor acquired the Phoenix Industrial Portfolio IX Properties between 2019 and 2021. As such, historical occupancy is unavailable. |
| (2) | Current occupancy is as of September 6, 2022. |
The following table presents certain information relating to the largest tenants by underwritten base rent of the Phoenix Industrial Portfolio IX Properties:
| Top Tenant Summary(1) |
| Tenant | Property | Ratings
Moody’s/S&P/ Fitch(2) | Net Rentable Area (SF) | % of
Total NRA | UW Base Rent PSF(3) | UW Base Rent(3) | % of Total
UW Base Rent(3) | Lease
Expiration Date |
| Viterra | Memphis, TN | NR/NR/NR | 569,688 | 15.2 | % | $1.74 | $991,257 | 11.9 | % | 8/31/2029 |
| Ledvance, LLC(4) | Versailles, KY | NR/NR/NR | 376,298 | 10.0 | | $3.04 | 1,145,791 | 13.8 | | Various(5) |
| Bella + Canvas, LLC | Wetumpka, AL | NR/NR/NR | 371,734 | 9.9 | | $3.94 | 1,463,216 | 17.6 | | 2/28/2029 |
| HNI Corporation(6) | Iowa City, IA | NR/NR/NR | 317,518 | 8.4 | | $4.12 | 1,308,174 | 15.8 | | 6/30/2025 |
| McLane Company, Inc. | Versailles, KY | NR/NR/NR | 303,728 | 8.1 | | $3.28 | 996,228 | 12.0 | | 1/31/2026 |
| Fedex(7) | Memphis, TN | Baa2/BBB/NR | 235,747 | 6.3 | | $2.72 | 641,232 | 7.7 | | 11/30/2026 |
| Amazon(8) | Rockford, IL | A1/AA/AA- | 138,400 | 3.7 | | $3.49 | 483,495 | 5.8 | | 3/31/2027 |
| Wynn Grain Spice | Wetumpka, AL | NR/NR/NR | 127,286 | 3.4 | | $2.17 | 276,211 | 3.3 | | 4/30/2032 |
| USPS | Memphis, TN | Aaa/NR/NR | 101,162 | 2.7 | | $3.59 | 362,916 | 4.4 | | 5/31/2023 |
| Total Major Tenants | | 2,541,561 | 67.6 | % | $3.02 | $7,668,520 | 92.4 | % | |
| | | | | | | | |
| Other Tenants | | 160,831 | 4.3 | % | $3.94 | $634,170 | 7.6 | % | |
| | | | | | | | |
| Occupied Collateral Total / Wtd. Avg. | 2,702,392 | 71.9 | % | $3.07 | $8,302,690 | 100.0 | % | |
| Vacant Space | | 1,057,911 | 28.1 | % | | | | |
| | | | | | | | |
| Collateral Total | | 3,760,303 | 100.0 | % | | | | |
| | | | | | | | |
| (1) | Based on the underwritten rent rolls dated September 6, 2022. |
| (2) | In certain instances, ratings provided are those of the parent company of the entity shown, whether or not the parent company guarantees the lease. |
| (3) | UW Base Rent PSF, UW Base Rent and % of Total UW Base Rent are inclusive of approximately $335,509 of contractual rent steps through October 2023. |
| (4) | Ledvance, LLC has the right to terminate its lease for one or both of (x) 97,062 square feet (representing approximately 25.79% of its leased space) and (y) 91,492 square feet (representing approximately 24.31% of its leased space) at any time on or after November 1, 2022 with at least 60 days’ prior written notice to the landlord, which notice identifies the space to be terminated, and Ledvance, LLC not being in default under the lease it seeks to terminate on the on the termination date specified in its termination notice. |
| (5) | Levdance, LLC leases 188,554 square feet at the Versailles, KY property expiring on April 30, 2023 and 187,744 square feet at the Versailles, KY property expiring on April 30, 2027. |
| (6) | HNI Corporation has not taken occupancy of approximately 13,081 square feet of its 317,518 square feet of leased space. At origination of the Phoenix Industrial Portfolio IX Whole Loan, $104,648 was reserved for such space and approximately $4,360 is required to be released on each monthly payment date commencing on November 6, 2022 through October 6, 2024 or until, among other conditions included in the Phoenix Industrial Portfolio IX Whole Loan documents (i) such space is delivered to HNI Corporation, (ii) HNI Corporation commences paying rent for such space and (iii) a clean estoppel confirming (i) and (ii) is delivered to and accepted by the lender. |
| (7) | Fedex may terminate on 30 days' notice if the employees of another tenant become subject to a collective bargaining unit. |
| (8) | Amazon has a lease expiration of November 30, 2026. Since the expiration is between October 1 and March 30, the lease term will extend through March 31, 2027, unless Amazon opts out of the optional holiday extension by providing 270 days’ notice. In addition, Amazon may terminate on 30 days’ notice if a material interference with Amazon’s business occurs due to lack of access or interruption of utilities caused by the landlord or the landlord’s agents and such material interference continues for 180 days, but the exercised termination option will be void if such material interference is cured within the 30 days following receipt of notice from Amazon of its intent to terminate its lease. If a material interference continues for 270 days (regardless of whether such material interference is due to the landlord or the landlord’s agents), Amazon may terminate on 30 days’ notice after such 270 day period, but the exercised termination option will be void if the material interference is cured within the 30 days following receipt of notice from Amazon of its intent to terminate its lease. |
THE INFORMATION IN THIS STRUCTURAL AND COLLATERAL TERM SHEET IS NOT COMPLETE AND MAY BE AMENDED PRIOR TO THE TIME OF SALE. THIS TERM SHEET IS NOT AN OFFER TO SELL THESE SECURITIES AND IT IS NOT A SOLICITATION OF AN OFFER TO BUY THESE SECURITIES IN ANY JURISDICTION WHERE THE OFFER OR SALE IS NOT PERMITTED. |
| | 66 | |
| Structural and Collateral Term Sheet | | BMO 2022-C3 |
| |
| No. 4 – Phoenix Industrial Portfolio IX |
The following table presents certain information relating to the tenant lease expirations of the Phoenix Industrial Portfolio IX Properties:
| Lease Rollover Schedule(1)(2) |
| Year | Number of Leases Expiring | Net Rentable Area Expiring | % of NRA Expiring | UW Base Rent Expiring(3) | % of UW Base Rent Expiring(3) | Cumulative Net Rentable Area Expiring | Cumulative % of NRA Expiring | Cumulative UW Base Rent Expiring(3) | Cumulative % of UW Base Rent Expiring |
| Vacant | NAP | 1,057,911 | 28.1 | % | NAP | NAP | 1,057,911 | 28.1% | NAP | NA | P |
| 2022 & MTM | 0 | 0 | 0.0 | | $0 | 0.0 | % | 1,057,911 | 28.1% | $0 | 0.0 | % |
| 2023 | 3 | 303,951 | 8.1 | | 985,803 | 11.9 | | 1,361,862 | 36.2% | $985,803 | 11.9 | % |
| 2024 | 1 | 52,917 | 1.4 | | 194,735 | 2.3 | | 1,414,779 | 37.6% | $1,180,537 | 14.2 | % |
| 2025 | 1 | 317,518 | 8.4 | | 1,308,174 | 15.8 | | 1,732,297 | 46.1% | $2,488,711 | 30.0 | % |
| 2026 | 2 | 539,475 | 14.3 | | 1,637,460 | 19.7 | | 2,271,772 | 60.4% | $4,126,171 | 49.7 | % |
| 2027 | 2 | 326,144 | 8.7 | | 1,063,624 | 12.8 | | 2,597,916 | 69.1% | $5,189,796 | 62.5 | % |
| 2028 | 1 | 93,679 | 2.5 | | 382,210 | 4.6 | | 2,691,595 | 71.6% | $5,572,006 | 67.1 | % |
| 2029 | 2 | 941,422 | 25.0 | | 2,454,473 | 29.6 | | 3,633,017 | 96.6% | $8,026,479 | 96.7 | % |
| 2030 | 0 | 0 | 0.0 | | 0 | 0.0 | | 3,633,017 | 96.6% | $8,026,479 | 96.7 | % |
| 2031 | 0 | 0 | 0.0 | | 0 | 0.0 | | 3,633,017 | 96.6% | $8,026,479 | 96.7 | % |
| 2032 | 1 | 127,286 | 3.4 | | 276,211 | 3.3 | | 3,760,303 | 100.0% | $8,302,690 | 100.0 | % |
| 2033 & Beyond | 0 | 0 | 0.0 | | 0 | 0.0 | | 3,760,303 | 100.0% | $8,302,690 | 100.0 | % |
| Total | 13 | 3,760,303 | 100.0 | % | $8,302,690 | 100.0 | % | | | | |
| (1) | Based on the underwritten rent rolls dated September 6, 2022. |
| (2) | Certain leases may have termination options that are exercisable prior to the originally stated expiration date of the lease and are not considered in this Lease Rollover Schedule. |
| (3) | UW Base Rent Expiring, % of UW Base Rent Expiring and Cumulative UW Base Rent Expiring are inclusive of approximately $335,509 of contractual rent steps through October 2023. |
THE INFORMATION IN THIS STRUCTURAL AND COLLATERAL TERM SHEET IS NOT COMPLETE AND MAY BE AMENDED PRIOR TO THE TIME OF SALE. THIS TERM SHEET IS NOT AN OFFER TO SELL THESE SECURITIES AND IT IS NOT A SOLICITATION OF AN OFFER TO BUY THESE SECURITIES IN ANY JURISDICTION WHERE THE OFFER OR SALE IS NOT PERMITTED. |
| | 67 | |
| Structural and Collateral Term Sheet | | BMO 2022-C3 |
| |
| No. 4 – Phoenix Industrial Portfolio IX |
The following table presents certain information relating to the operating history and underwritten cash flows of the Phoenix Industrial Portfolio IX Properties:
| Operating History and Underwritten Net Cash Flow |
| | TTM(1) | Underwritten | Per Square Foot | %(2) |
| Base Rent(3) | $3,842,384 | $7,967,181 | $2.12 | 52.2 | % |
| Rent Steps(4) | 0 | 335,509 | 0.09 | 2.2 | |
| Straight Line Rent(5) | 0 | 21,103 | 0.01 | 0.1 | |
| Vacant Income | 0 | 3,332,953 | 0.89 | 21.8 | |
| Gross Potential Rent | $3,842,384 | $11,656,746 | $3.10 | 76.3 | % |
| Total Reimbursements | 1,571,231 | 3,581,293 | 0.95 | 23.4 | |
| Total Other Income | 4,200 | 34,200 | 0.01 | 0.2 | |
| Net Rental Income | $5,417,815 | $15,272,239 | $4.06 | 100.0 | % |
| (Vacancy/Credit Loss) | 0 | (4,287,690) | (1.14) | (39.0 | ) |
| Effective Gross Income | $5,417,815 | $10,984,549 | $2.92 | 71.9 | % |
| Total Expenses | 3,797,836 | 3,597,682 | 0.96 | 32.8 | |
| Net Operating Income(6) | $1,619,979 | $7,386,867 | $1.96 | 67.2 | % |
| Total TI / LC, Capex/RR | 0 | 521,421 | 0.14 | 4.7 | |
| Net Cash Flow | $1,619,979 | $6,865,446 | $1.83 | 62.5 | % |
| (1) | TTM represents the trailing 10 months ending April 2022 for the Iowa City, IA property and the trailing 12 months ending April 2022 for the remaining properties. |
| (2) | % column represents percent of Net Rental Income for all revenue lines and represents percent of Effective Gross Income for the remainder of the fields. |
| (3) | Base Rent is based on the underwritten rent rolls dated September 6, 2022. |
| (4) | Rent Steps totaling $335,509 are taken through October 2023. |
| (5) | Straight Line Rent underwritten for investment-grade tenant, Amazon’s, average rent for the remainder of the Phoenix Industrial Portfolio IX Whole Loan term at the Rockford, IL property. |
| (6) | The increase from the TTM Net Operating Income to Underwritten Net Operating Income is primarily attributable to (i) leasing totaling an additional approximately $4.1 million in base rent, (ii) $335,509 in rent steps through October 2023, (iii) $21,103 in straight-lined rent for investment-grade tenant, Amazon, and (iv) an additional approximately $1.1 million in reimbursements. The Most Recent NOI only includes the trailing 10 months ending April 2022 for the Iowa City, IA property as it was 100.0% vacant. Additionally, the utilities expense was underwritten $671,666 less than TTM due to (i) the elimination of excess use charges and installation of high efficiency LED lighting at the Versailles, KY property and (ii) Amazon, the largest tenant at the Rockford, IL property, being separately metered and paying gas bills directly to the utility company. |
The Market. The Phoenix Industrial Portfolio IX Properties are located in Tennessee (37.7% of ALA), Alabama (31.3% of ALA), Illinois (16.0% of ALA), Iowa (10.2% of ALA) and Kentucky (4.8% of ALA).
Memphis (37.7% of ALA): The Memphis, TN property is in Shelby County, Tennessee located approximately 7.2 miles northwest of downtown Memphis and approximately 10.5 miles north of the Memphis International Airport. Primary access to the area is provided by Interstate 40, approximately 0.9 miles north of the Memphis, TN property and Interstate 69. According to a third-party market research report, the Memphis, TN property is located in the Northwest industrial submarket, which had approximately 29.7 million square feet of inventory, a vacancy rate of 4.1% and asking rent of $3.24 PSF as of August 1, 2022.
Wetumpka (31.3% of ALA): The Wetumpka, AL property is in Elmore County, Alabama located approximately 3.9 miles east of downtown Wetumpka and approximately 17.8 miles north of Montgomery. Primary access to the area is provided by State Route 14 with regional access provided by US Route 82, US Route 231 and Interstate 65. According to a third-party market research report, the Wetumpka, AL property is located in the outlying Elmore County industrial submarket, which had approximately 2.1 million square feet of inventory, a vacancy rate of 19.8% and asking rent of $4.85 PSF as of August 1, 2022.
Rockford (16.0% of ALA): The Rockford, IL property is in Winnebago County, Illinois located approximately 4.7 miles north of downtown Rockford, approximately 73.6 miles northwest of O’Hare International Airport and approximately 93.6 miles northwest of Chicago. Primary access to the area is provided by Route 20, which intersects with Interstate 90 approximately 7.0 miles southeast of the Rockford, IL property. According to a third-party market research report, the Rockford, IL property
THE INFORMATION IN THIS STRUCTURAL AND COLLATERAL TERM SHEET IS NOT COMPLETE AND MAY BE AMENDED PRIOR TO THE TIME OF SALE. THIS TERM SHEET IS NOT AN OFFER TO SELL THESE SECURITIES AND IT IS NOT A SOLICITATION OF AN OFFER TO BUY THESE SECURITIES IN ANY JURISDICTION WHERE THE OFFER OR SALE IS NOT PERMITTED. |
| | 68 | |
| Structural and Collateral Term Sheet | | BMO 2022-C3 |
| |
| No. 4 – Phoenix Industrial Portfolio IX |
is located in the I-39 Corridor/Winnebago industrial submarket, which had approximately 34.8 million square feet of inventory, a vacancy rate of 7.7% and asking rent of $4.89 PSF as of August 1, 2022.
Iowa City (10.2% of ALA): The Iowa City, IA property is in Johnson County, Iowa located approximately 3.2 miles southeast of downtown Iowa City, approximately 30.1 miles south of Cedar Rapids, and approximately 32.1 miles from the Iowa-Mississippi border. Primary access to the area is provided by Route 6 and Route 1, which intersects with Interstate 80 approximately 3.5 miles north of the Iowa City, IA property. According to a third-party market research report, the Iowa City, IA property is located in the Iowa City industrial market, which had approximately 11.3 million square feet of inventory, a vacancy rate of 1.4% and asking rent of $6.49 PSF as of August 1, 2022.
Versailles (4.8% of ALA): The Versailles, KY property is in Woodford County, Kentucky located approximately 1.4 miles west of downtown Versailles, approximately 14.6 miles west of Lexington, approximately 37.3 miles west of the Winchester property and approximately 63.4 miles southeast of Louisville. Primary access to the area is provided by Interstate 64 and Interstate 75, as well as via US Highway 60, which runs from Western Lexington to Frankfurt. According to a third-party market research report, the Versailles, KY property is located in the Woodford County industrial submarket, which had approximately 3.6 million square feet of inventory, a vacancy rate of 1.6% and asking rent of $7.39 PSF as of August 1, 2022.
The following table presents certain market information with respect to the Phoenix Industrial Portfolio IX Properties:
| Market Overview(1) |
| Property | Year Built / Renovated | Net Rentable Area (SF)(2) | Submarket | Property Vacancy(2) | Submarket Vacancy | Appraisal Concluded Vacancy | Submarket Inventory (SF) | UW Base Rent PSF(2)(3) | Submarket Rent PSF |
| Memphis, TN | 1973 / 2020 | 1,374,972 | Northwest | 34.1% | 4.1% | 7.0% | 29,737,746 | $2.20 | $3.24 |
| Wetumpka, AL | 1997 / 2021-2022 | 735,231 | Outlying Elmore County | 32.1% | 19.8% | 4.0% | 2,130,773 | $3.49 | $4.85 |
| Rockford, IL | 1980 / 2019 | 517,574 | I-39 Corridor/Winnebago | 44.9% | 7.7% | 6.0% | 34,785,201 | $3.72 | $4.89 |
| Iowa City, IA(4) | 1964 / 2022 | 341,491 | Iowa City | 7.0% | 1.4% | 0.0% | 11,334,705 | $4.12 | $6.49 |
| Versailles, KY | 1964 / 2011 | 791,035 | Woodford County | 12.2% | 1.6% | 4.0% | 3,579,554 | $3.17 | $7.39 |
| Total/Wtd. Avg. | 3,760,303 | | 28.1% | 6.9% | 5.0% | 81,567,979 | $3.07 | $4.95 |
| (1) | Source: Third-party market research reports. |
| (2) | Based on the underwritten rent rolls dated September 6, 2022. |
| (3) | UW Base Rent PSF excludes underwritten vacant space and is inclusive of approximately $335,509 of contractual rent steps through October 2023. |
| (4) | No submarket data for the Iowa City, IA property was available. Market information is presented in the table above. |
The following table presents certain demographic information with respect to the Phoenix Industrial Portfolio IX Properties:
| Demographics Overview |
| Property | Net Rentable Area (SF)(1) | ALA | % of ALA | UW NCF | % of UW NCF | Estimated 2022 Population (5-mile Radius)(2) | Estimated 2022 Average Household Income (5-mile Radius)(2) |
| Memphis, TN | 1,374,972 | $28,250,000 | 37.7 | % | $1,350,064 | 19.7 | % | 216,737 | $73,950 |
| Wetumpka, AL | 735,231 | 23,500,000 | 31.3 | | 1,546,995 | 22.5 | | 15,595 | $81,749 |
| Rockford, IL | 517,574 | 12,000,000 | 16.0 | | 762,062 | 11.1 | | 131,254 | $77,732 |
| Iowa City, IA | 341,491 | 7,650,000 | 10.2 | | 1,215,216 | 17.7 | | 86,086 | $86,659 |
| Versailles, KY | 791,035 | 3,600,000 | 4.8 | | 1,991,110 | 29.0 | | 21,477 | $88,341 |
| Total/Wtd. Avg. | 3,760,303 | $75,000,000 | 100.0 | % | $6,865,446 | 100.0 | % | 112,702 | $80,177 |
| (1) | Based on the underwritten rent rolls dated September 6, 2022. |
| (2) | Information obtained from third-party market research reports. |
The Borrowers. The borrowers are Phoenix Memphis Industrial Investors LLC, Phoenix Wetumpka Industrial Investors LLC, Phoenix Rockford Industrial Investors LLC, Phoenix Diablo Iowa City LLC and Phoenix Versailles Industrial Investors LLC (collectively, the “Phoenix Industrial Portfolio IX Borrowers”), each a Delaware limited liability company and single purpose entity with one independent director. Each Phoenix Industrial Portfolio IX Borrower owns one individual Phoenix
THE INFORMATION IN THIS STRUCTURAL AND COLLATERAL TERM SHEET IS NOT COMPLETE AND MAY BE AMENDED PRIOR TO THE TIME OF SALE. THIS TERM SHEET IS NOT AN OFFER TO SELL THESE SECURITIES AND IT IS NOT A SOLICITATION OF AN OFFER TO BUY THESE SECURITIES IN ANY JURISDICTION WHERE THE OFFER OR SALE IS NOT PERMITTED. |
| | 69 | |
| Structural and Collateral Term Sheet | | BMO 2022-C3 |
| |
| No. 4 – Phoenix Industrial Portfolio IX |
Industrial Portfolio IX Property. Legal counsel to the Phoenix Industrial Portfolio IX Borrowers delivered a non-consolidation opinion in connection with the origination of the Phoenix Industrial Portfolio IX Whole Loan.
The Borrower Sponsor. The borrower sponsor is Phoenix Investors, which is the affiliated management company for the guarantors’ investments. Phoenix Investors is a national commercial real estate firm based in Milwaukee, Wisconsin that redevelops former manufacturing facilities throughout the United States. Phoenix Investors’ affiliated companies hold interests in approximately 52 million square feet of industrial, retail, office and single tenant net-leased properties across 29 states. Phoenix Investors engages in the renovation and repositioning of large, former single tenant industrial facilities throughout the United States that were previously owned by corporate entities, real estate investment trusts or financial institutions.
The non-recourse carveout guarantors of the Phoenix Industrial Portfolio IX Whole Loan are Irrevocable Children's Trust Dated 7/22/91 and Irrevocable Children's Trust No. 2 Dated 7/22/91. The non-recourse carveout guarantors have previously had ownership interests in entities that were subject to foreclosures and bankruptcies. See “Description of the Mortgage Pool—Default History, Bankruptcy Issues and Other Proceedings” in the Preliminary Prospectus.
Property Management. The Phoenix Industrial Portfolio IX Properties are managed by the borrower sponsor.
Escrows and Reserves. At origination, the Phoenix Industrial Portfolio IX Borrowers deposited (i) approximately $257,137 for real estate taxes, (ii) $3,000,000 for tenant improvements and leasing commissions, (iii) $1,290,083 for unfunded obligations with respect to the Bella + Canvas, LLC lease ($400,000), the Wynn Grain Spice lease ($200,000), the Amazon lease ($475,435), the Timber Industries lease ($110,000) and the HNI Corporation lease ($104,648), (iv) $319,158 for deferred maintenance, (v) $62,500 for an environmental reserve and (vi) $5,000,000 for an Earn-out Reserve (as detailed below).
Tax Escrows – On a monthly basis, the Phoenix Industrial Portfolio IX Borrowers are required to deposit 1/12th of an amount which would be sufficient to pay taxes for the next ensuing 12 months (currently equivalent to approximately $56,408 a month).
Insurance Escrows – On a monthly basis, the Phoenix Industrial Portfolio IX Borrowers are required to deposit 1/12th of an amount which would be sufficient to pay insurance premiums for the renewal of coverages; provided, such monthly deposits will be waived so long as the Phoenix Industrial Portfolio IX Borrowers maintain a blanket insurance policy acceptable to the lender.
Replacement Reserve – On a monthly basis, the Phoenix Industrial Portfolio IX Borrowers are required to deposit approximately $31,336 for replacement reserves subject to a cap of $1,130,000.
Rollover Reserve – On a monthly basis, the Phoenix Industrial Portfolio IX Borrowers are required to deposit approximately $47,004 for rollover reserves if at any time the balance of the reserve falls below $250,000, until such time as the reserve is restored to a cap of $1,500,000.
Earn-out Reserve – The Phoenix Industrial Portfolio IX Whole Loan documents require an upfront Earn-out reserve (the “Earn-out Reserve”) of $5,000,000. All funds on deposit in the Earn-out Reserve will be (i) during the continuation of a Cash Management Trigger Event (as defined below), transferred to the cash management account, or (ii) in the absence of a Cash Management Trigger Event, returned to the Phoenix Industrial Portfolio IX Borrowers; provided, however, that the following conditions have been fully satisfied by the Phoenix Industrial Portfolio IX Borrowers: (i) the Phoenix Industrial Portfolio IX Borrowers have submitted a written request to the lender at least 15 business days prior to the requested release, (ii) on the date such request is made, no default, event of default or Cash Sweep Trigger Event (as defined below) has occurred and is then continuing, (iii) the Phoenix Industrial Portfolio IX Borrowers have provided written evidence that the debt service coverage ratio based on the full outstanding principal balance of the Phoenix Industrial Portfolio IX Whole Loan is at least 1.47x, (iv) the Phoenix Industrial Portfolio IX Borrowers have delivered written evidence that the debt yield based on the full outstanding principal balance of the Phoenix Industrial Portfolio IX Whole Loan is not less than 9.8% and (v) an amount equal to the total estimated cost to perform or satisfy all then outstanding landlord obligations (for tenant improvements, landlord work, tenant allowances and/or leasing commissions) for all of the Phoenix Industrial Portfolio IX Properties, if any, will be on deposit in the rollover reserve account. The release of the Earn-out Reserve will be tied to the lease-up of the Memphis, TN and Wetumpka, AL properties only, such that the funds are only released once Phoenix Industrial Portfolio IX Properties achieves an underwritten net cash flow debt yield of 9.8% on the Phoenix Industrial Portfolio
THE INFORMATION IN THIS STRUCTURAL AND COLLATERAL TERM SHEET IS NOT COMPLETE AND MAY BE AMENDED PRIOR TO THE TIME OF SALE. THIS TERM SHEET IS NOT AN OFFER TO SELL THESE SECURITIES AND IT IS NOT A SOLICITATION OF AN OFFER TO BUY THESE SECURITIES IN ANY JURISDICTION WHERE THE OFFER OR SALE IS NOT PERMITTED. |
| | 70 | |
| Structural and Collateral Term Sheet | | BMO 2022-C3 |
| |
| No. 4 – Phoenix Industrial Portfolio IX |
IX Whole Loan amount, assuming the lower of (i) $3,831,778 or (ii) the actual net operating income for all Phoenix Industrial Portfolio IX Properties other than the Memphis, TN and Wetumpka, AL properties, and the leased up net operating income for Memphis, TN and Wetumpka, AL properties.
Notwithstanding the above, if the Phoenix Industrial Portfolio IX Borrowers fail to obtain the release of the Earn-out Reserve funds prior to the date that is three years from the date of the final securitization of the Phoenix Industrial Portfolio IX Whole Loan, the Phoenix Industrial Portfolio IX Borrowers are required to partially defease the Phoenix Industrial Portfolio IX Whole Loan in an amount equal to the then remaining balance in the Earn-out Reserve account (such partial defeasance, the “Earn-out Reserve Partial Defeasance”), plus (x) all interest which would have accrued on the amount of the Phoenix Industrial Portfolio IX Whole Loan to be prepaid through and including the last day of the interest period related to the monthly payment date following the Earn-out Reserve Partial Defeasance, (y) all reasonable out-of-pocket, third party costs and expenses actually incurred by the lender in connection with such Earn-out Reserve Partial Defeasance and (z) all other sums due and payable under the Phoenix Industrial Portfolio IX Whole Loan documents. To the extent that any portion of the Earn-out Reserve remains after the Earn-out Reserve Partial Defeasance, the remaining amount will be applied as follows: (a) if a Cash Management Trigger Event has occurred and is continuing, to the cash management account or (y) if no Cash Management Trigger Event has occurred and is continuing, to the Phoenix Industrial Portfolio IX Borrowers.
Notwithstanding the above, if the Phoenix Industrial Portfolio IX Borrowers fail to obtain the release of the Earn-out Reserve funds prior to May 6, 2032 (the “Open Prepayment Commencement Date”), the Phoenix Industrial Portfolio IX Borrowers are required to partially prepay the Phoenix Industrial Portfolio IX Whole Loan in an amount equal to the then remaining balance in the Earn-out Reserve account on the Open Prepayment Commencement Date.
Lockbox / Cash Management. The Phoenix Industrial Portfolio IX Whole Loan is structured with a hard lockbox and springing cash management upon the occurrence and continuance of a Cash Management Trigger Event. Revenues from the Phoenix Industrial Portfolio IX Properties are required to be deposited directly into the lockbox account or, if received by the Phoenix Industrial Portfolio IX Borrowers or the property manager, deposited within three business days of receipt. During the continuance of a Cash Management Trigger Event, all funds in the lockbox account are required to be swept each business day to a lender-controlled cash management account and disbursed in accordance with the Phoenix Industrial Portfolio IX Whole Loan documents, and all excess funds on deposit in the cash management account (after payment of required monthly reserve deposits, debt service payment on the Phoenix Industrial Portfolio IX Whole Loan, operating expenses and cash management bank fees) will be applied as follows: (a) if a Material Tenant Trigger Event (as defined below) has occurred and is continuing, to a Material Tenant (as defined below) rollover reserve, (b) if a Cash Sweep Trigger Event (as defined below) has occurred and is continuing (but not a Material Tenant Trigger Event), to the lender-controlled excess cash flow account or (c) if no Material Tenant Trigger Event or Cash Sweep Trigger Event has occurred and is continuing, to the Phoenix Industrial Portfolio IX Borrowers.
A “Cash Management Trigger Event” means a period commencing upon the occurrence of (i) an event of default under the Phoenix Industrial Portfolio IX Whole Loan documents, (ii) any bankruptcy action involving any of the Phoenix Industrial Portfolio IX Borrowers, the guarantors, the key principal or the property manager, (iii) the trailing 12-month period debt service coverage ratio falling below 1.30x, (iv) the indictment for fraud or misappropriation of funds by any of the Phoenix Industrial Portfolio IX Borrowers, the guarantors, the key principal or an affiliated or third-party property manager (provided that, in the case of the third-party property manager, such fraud or misappropriation is related to any of the Phoenix Industrial Portfolio IX Properties), or any director or officer of the aforementioned or (v) a Material Tenant Trigger Event, and expiring upon (a) with respect to clause (i) above, the cure of such event of default, (b) with respect to clause (ii) above, the filing being discharged, stayed or dismissed within 45 days for the Phoenix Industrial Portfolio IX Borrowers, the guarantors or the key principal, or within 120 days for the property manager, and the lender’s determination that such filing does not materially affect the Phoenix Industrial Portfolio IX Borrowers’, the guarantors’, the key principal’s or the property manager’s monetary obligations, (c) with respect to clause (iii) above, the trailing 12-month debt service coverage ratio being at least 1.35x for two consecutive calendar quarters, (d) with respect to clause (iv) above, the dismissal of the applicable indictment with prejudice or acquittal of the applicable person, or the replacement of the property manager with a third-party property manager that constitutes a qualified property manager under the Phoenix Industrial Portfolio IX Whole Loan documents or (e) with respect to clause (v) above, the cure of such Material Tenant Trigger Event.
A “Cash Sweep Trigger Event” means a period commencing upon the occurrence of (i) an event of default under the Phoenix Industrial Portfolio IX Whole Loan documents, (ii) any bankruptcy action involving any of the Phoenix Industrial Portfolio IX Borrowers, the guarantors, the key principal or the property manager or (iii) the trailing 12-month period debt
THE INFORMATION IN THIS STRUCTURAL AND COLLATERAL TERM SHEET IS NOT COMPLETE AND MAY BE AMENDED PRIOR TO THE TIME OF SALE. THIS TERM SHEET IS NOT AN OFFER TO SELL THESE SECURITIES AND IT IS NOT A SOLICITATION OF AN OFFER TO BUY THESE SECURITIES IN ANY JURISDICTION WHERE THE OFFER OR SALE IS NOT PERMITTED. |
| | 71 | |
| Structural and Collateral Term Sheet | | BMO 2022-C3 |
| |
| No. 4 – Phoenix Industrial Portfolio IX |
service coverage ratio falling below 1.30x, and expiring upon (a) with respect to clause (i) above, the cure of such event of default, (b) with respect to clause (ii) above, as to an involuntary filing, the filing being discharged, stayed or dismissed within 45 days for any of the Phoenix Industrial Portfolio IX Borrowers, the guarantors or the key principal, or within 120 days for the property manager, and the lender’s determination that such filing does not materially affect the Phoenix Industrial Portfolio IX Borrowers’, the guarantors’, the key principal’s or the property manager’s monetary obligations or (c) with respect to clause (iii) above, the trailing 12-month debt service coverage ratio is at least 1.35x for two consecutive calendar quarters.
A “Material Tenant Trigger Event” means a period commencing upon the occurrence of (i) a Material Tenant giving notice of its intention to terminate or cancel or not to extend or renew its lease, (ii) on or prior to the then applicable expiration date under the applicable Material Tenant lease, if the Material Tenant does not extend or renew such Material Tenant lease, (iii) on or prior to the date a Material Tenant is required under its Material Tenant lease to notify the Phoenix Industrial Portfolio IX Borrowers of its election to extend or renew its lease, if such Material Tenant does not give notice, (iv) an event of default under a Material Tenant lease occurring and continuing beyond any applicable notice and/or cure period, (v) a bankruptcy action of a Material Tenant or a lease guarantor of any Material Tenant lease occurring, (vi) a Material Tenant lease being terminated in whole or in part; provided that, with respect to any partial termination of a Material Tenant lease, such partial termination relates to no less than 20% of the total net rentable square footage at the applicable property or (vii) a Material Tenant “going dark”, vacating, ceasing to occupy or ceasing to conduct business in the ordinary course at the applicable property or a portion thereof constituting no less than 20% of the total net rentable square footage at the applicable property (other than temporary cessation of operations in connection with remodeling, renovation or restoration of its leased premises) and expiring upon (a) with respect to clause (i) above, the date that (1) the applicable Material Tenant revokes or rescinds all termination or cancellation notices, (2) the applicable Material Tenant lease is extended on terms satisfying the requirements of the Phoenix Industrial Portfolio IX Whole Loan documents or (3) all or substantially all of the applicable Material Tenant space is leased to a replacement tenant, (b) with respect to clause (ii) above, the date that (1) the applicable Material Tenant lease is extended on terms satisfying the requirements of the Phoenix Industrial Portfolio IX Whole Loan documents or (2) all or substantially all of the applicable Material Tenant space is leased to a replacement tenant, (c) with respect to clause (iii) above, the date that (1) the applicable Material Tenant lease is extended on terms satisfying the requirements of the Phoenix Industrial Portfolio IX Whole Loan documents or (2) all or substantially all of the applicable Material Tenant space is leased to a replacement tenant, (d) with respect to clause (iv) above, a cure of the applicable event of default, (e) with respect to clause (v) above, the affirmation of the Material Tenant lease in the applicable bankruptcy proceeding and confirmation that the Material Tenant is actually paying all rents and other amounts under its lease (or, if applicable, the discharge or dismissal of the applicable Material Tenant lease guarantor from the applicable bankruptcy proceeding; provided that such bankruptcy (after dismissal or discharge) does not have an adverse effect on such Material Tenant lease guarantor’s ability to perform its obligations under its lease guaranty), (f) with respect to clause (vi) above, all or substantially all of the applicable Material Tenant space being leased to a replacement tenant or (g) with respect to clause (vii) above, the Material Tenant re-commencing its normal business operations at the applicable property or a portion thereof constituting more than 20% of the total net rentable square footage at the applicable property.
A “Material Tenant” means any tenant at the Phoenix Industrial Portfolio IX Properties that, together with its affiliates, either (a) leases no less than 21% of the total rentable square footage of the Phoenix Industrial Portfolio IX Properties or (b) accounts for (or would account for) no less than 21% of the total in-place base rent at the Phoenix Industrial Portfolio IX Properties.
Subordinate Debt. None.
Mezzanine Debt. The borrowers are permitted a one-time right to incur a future mezzanine loan, subject to the satisfaction of the requirements set forth in the Phoenix Industrial Portfolio IX Whole Loan documents, which include, but are not limited to: (i) no event of default under the Phoenix Industrial Portfolio IX Whole Loan documents is continuing, (ii) the aggregate loan-to-value ratio based on the Phoenix Industrial Portfolio IX Whole Loan and the mezzanine loan is no greater than 41.2%, (iii) the actual combined debt service coverage ratio based on the Phoenix Industrial Portfolio IX Whole Loan and the mezzanine loan is no less than 1.47x, (iv) the actual combined net cash flow debt yield based on the Phoenix Industrial Portfolio IX Whole Loan and the mezzanine loan is no less than 9.8%, (v) the execution of an intercreditor agreement acceptable to the lender and satisfactory to the rating agencies and (vi) receipt of a rating agency confirmation.
THE INFORMATION IN THIS STRUCTURAL AND COLLATERAL TERM SHEET IS NOT COMPLETE AND MAY BE AMENDED PRIOR TO THE TIME OF SALE. THIS TERM SHEET IS NOT AN OFFER TO SELL THESE SECURITIES AND IT IS NOT A SOLICITATION OF AN OFFER TO BUY THESE SECURITIES IN ANY JURISDICTION WHERE THE OFFER OR SALE IS NOT PERMITTED. |
| | 72 | |
| Structural and Collateral Term Sheet | | BMO 2022-C3 |
| |
| No. 4 – Phoenix Industrial Portfolio IX |
Partial Release. The Phoenix Industrial Portfolio IX Whole Loan documents permit releases of outparcels located at the Wetumpka, AL and Versailles, KY properties without prepayment or defeasance, provided that, among other conditions, (i) each such outparcel is vacant, non-income producing and unimproved at the time of release and (ii) certain REMIC related conditions are satisfied.
Ground Lease. None.
THE INFORMATION IN THIS STRUCTURAL AND COLLATERAL TERM SHEET IS NOT COMPLETE AND MAY BE AMENDED PRIOR TO THE TIME OF SALE. THIS TERM SHEET IS NOT AN OFFER TO SELL THESE SECURITIES AND IT IS NOT A SOLICITATION OF AN OFFER TO BUY THESE SECURITIES IN ANY JURISDICTION WHERE THE OFFER OR SALE IS NOT PERMITTED. |
| | 73 | |
| Structural and Collateral Term Sheet | | BMO 2022-C3 |
| |
| No. 5 – 50 Tice Corporate Center |
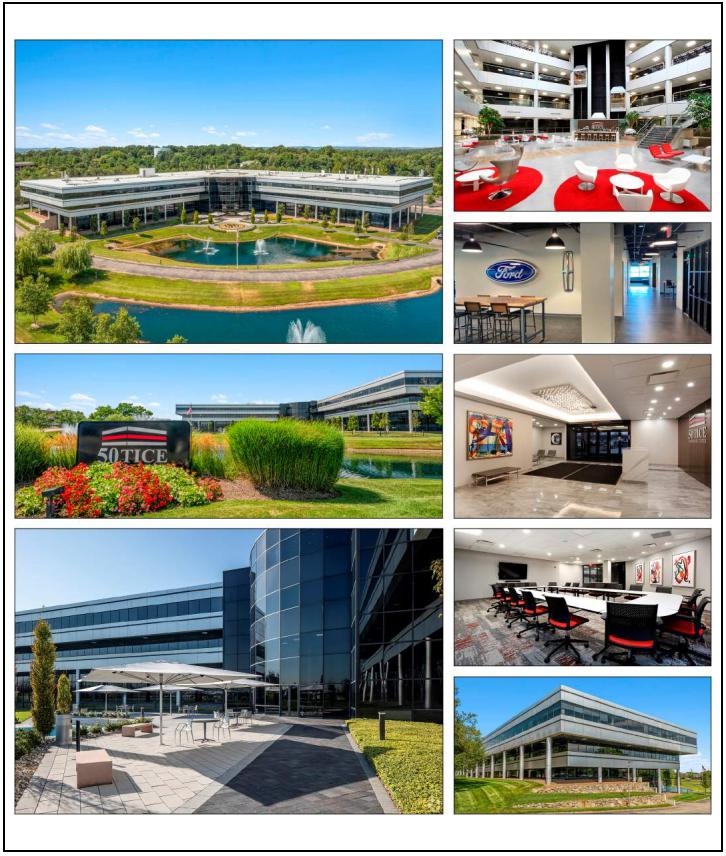
THE INFORMATION IN THIS STRUCTURAL AND COLLATERAL TERM SHEET IS NOT COMPLETE AND MAY BE AMENDED PRIOR TO THE TIME OF SALE. THIS TERM SHEET IS NOT AN OFFER TO SELL THESE SECURITIES AND IT IS NOT A SOLICITATION OF AN OFFER TO BUY THESE SECURITIES IN ANY JURISDICTION WHERE THE OFFER OR SALE IS NOT PERMITTED. |
| | 74 | |
| Structural and Collateral Term Sheet | | BMO 2022-C3 |
| |
| No. 5 – 50 Tice Corporate Center |
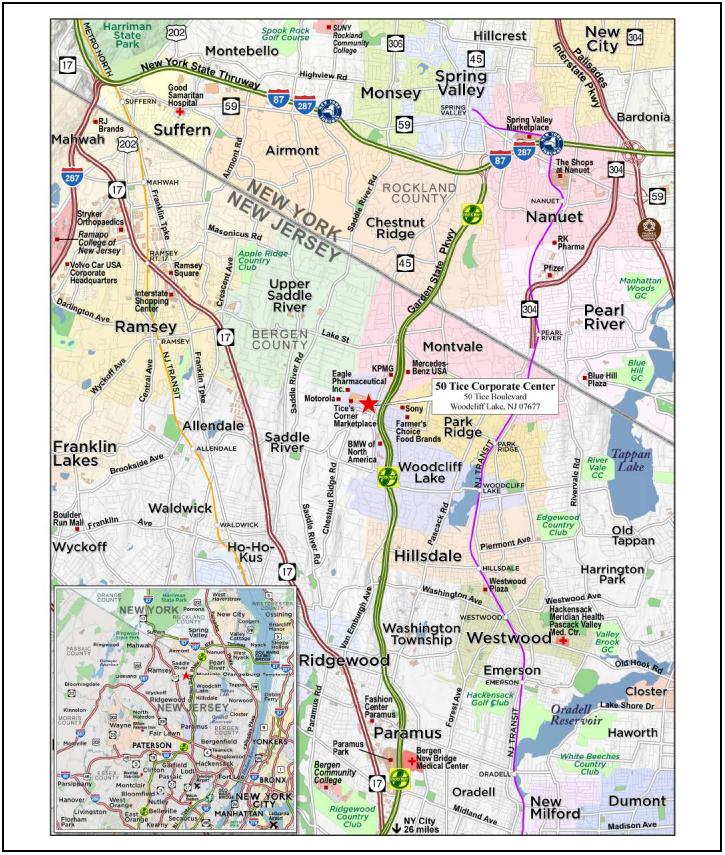
THE INFORMATION IN THIS STRUCTURAL AND COLLATERAL TERM SHEET IS NOT COMPLETE AND MAY BE AMENDED PRIOR TO THE TIME OF SALE. THIS TERM SHEET IS NOT AN OFFER TO SELL THESE SECURITIES AND IT IS NOT A SOLICITATION OF AN OFFER TO BUY THESE SECURITIES IN ANY JURISDICTION WHERE THE OFFER OR SALE IS NOT PERMITTED. |
| | 75 | |
| Structural and Collateral Term Sheet | | BMO 2022-C3 |
| |
| No. 5 – 50 Tice Corporate Center |
| Mortgage Loan Information | | Property Information |
| Mortgage Loan Seller: | LMF | | Single Asset / Portfolio: | Single Asset |
| Original Principal Balance: | $36,500,000 | | Title: | Fee |
| Cut-off Date Principal Balance: | $36,500,000 | | Property Type – Subtype: | Office – Suburban |
| % of IPB: | 5.0% | | Net Rentable Area (SF): | 256,459 |
| Loan Purpose: | Refinance | | Location: | Woodcliff Lake, NJ |
| Borrower: | Capstone Tice Blvd LLC | | Year Built / Renovated: | 1984 / 2020 |
| Borrower Sponsors: | Mitchell Adelstein, Robert Friedberg and Brad Gillman | | Occupancy(1): | 89.8% |
| Interest Rate: | 5.88000% | | Occupancy Date: | 8/31/2022 |
| Note Date: | 9/2/2022 | | 4th Most Recent NOI (As of): | NAV |
| Maturity Date: | 9/6/2032 | | 3rd Most Recent NOI (As of): | $3,012,034 (12/31/2020) |
| Interest-only Period: | 60 months | | 2nd Most Recent NOI (As of): | $2,906,494 (12/31/2021) |
| Original Term: | 120 months | | Most Recent NOI (As of)(2): | $3,208,873 (TTM 6/30/2022) |
| Original Amortization Term: | 360 months | | UW Economic Occupancy: | 91.0% |
| Amortization Type: | Interest Only, Amortizing Balloon | | UW Revenues: | $6,802,586 |
| Call Protection: | L(25),D(91),O(4) | | UW Expenses: | $2,317,771 |
| Lockbox / Cash Management: | Hard / Springing | | UW NOI(2): | $4,484,814 |
| Additional Debt: | No | | UW NCF: | $4,356,585 |
| Additional Debt Balance: | N/A | | Appraised Value / Per SF: | $64,300,000 / $251 |
| Additional Debt Type: | N/A | | Appraisal Date: | 8/10/2022 |
| | | | | |
| Escrows and Reserves(3) | | Financial Information |
| | Initial | Monthly | Initial Cap | | Cut-off Date Loan / SF: | $142 |
| Taxes: | $0 | $74,353 | N/A | | Maturity Date Loan / SF: | $133 |
| Insurance: | $11,798 | Springing | N/A | | Cut-off Date LTV: | 56.8% |
| Replacement Reserves: | $153,875 | Springing | $153,875 | | Maturity Date LTV: | 53.0% |
| TI / LC: | $3,000,000 | Springing | $3,000,000 | | UW NCF DSCR: | 1.68x |
| Other(1): | $1,722,456 | $0 | N/A | | UW NOI Debt Yield: | 12.3% |
| | | | | | | |
| Sources and Uses |
| Sources | Proceeds | % of Total | | Uses | Proceeds | % of Total |
| Mortgage Loan | $36,500,000 | 100.0 | % | | Loan Payoff | $29,410,494 | 80.6 | % |
| | | | | Upfront Reserves | 4,888,130 | 13.4 | |
| | | | | Return of Equity | 1,255,285 | 3.4 | |
| | | | | Closing Costs | 946,090 | 2.6 | |
| Total Sources | $36,500,000 | 100.0 | % | | Total Uses | $36,500,000 | 100.0 | % |
| (1) | Occupancy includes HDR (as defined below) (10.2% of net rentable area and 11.3% of underwritten base rent) and International Planning Alliance (“IPA”) (2.9% of net rentable area and 3.2% of underwritten base rent). HDR is in the process of completing its buildout and is expected to take occupancy on October 1, 2022. IPA is in the process of completing its buildout and is expected to take occupancy on November 1, 2022. At origination, the lender escrowed approximately (a) $1.3 million for HDR which includes $970,000 for outstanding tenant improvements and $288,011 for five months of rent concessions and (b) $464,445 for IPA, which includes $367,150 for outstanding tenant improvements and $97,295 for six months of rent concessions. |
| (2) | The increase in Most Recent NOI and UW NOI is primarily attributed to the increase in occupancy and recent leasing at the 50 Tice Corporate Center Property (as defined below). Since August 2022, the borrower sponsors have leased approximately 39,347 square feet (15.3% of net rentable area and 17.1% of underwritten base rent) of space at the 50 Tice Corporate Center Property. |
| (3) | For a full description of Escrows and Reserves, please refer to “Escrows and Reserves” below. |
The Loan. The 50 Tice Corporate Center mortgage loan is secured by a first lien mortgage on the borrower’s fee interest in a 256,459 square foot office property located in Woodcliff Lake, New Jersey (the “50 Tice Corporate Center Property”). The 50 Tice Corporate Center mortgage loan was originated by LMF and has an outstanding principal balance as of the Cut-off Date of $36.5 million (the “50 Tice Corporate Center Mortgage Loan”). The 50 Tice Corporate Center Mortgage Loan has a 10-year term and is interest only for the first 60 months of the loan followed by monthly payments of interest and principal sufficient to amortize the loan over a 30-year amortization schedule.
The Property. The 50 Tice Corporate Center Property is a 256,459 square feet Class A, three-story suburban office building in Woodcliff Lake, New Jersey. Situated on 20.0 acres, the 50 Tice Corporate Center Property was built in 1984 and most
THE INFORMATION IN THIS STRUCTURAL AND COLLATERAL TERM SHEET IS NOT COMPLETE AND MAY BE AMENDED PRIOR TO THE TIME OF SALE. THIS TERM SHEET IS NOT AN OFFER TO SELL THESE SECURITIES AND IT IS NOT A SOLICITATION OF AN OFFER TO BUY THESE SECURITIES IN ANY JURISDICTION WHERE THE OFFER OR SALE IS NOT PERMITTED. |
| | 76 | |
| Structural and Collateral Term Sheet | | BMO 2022-C3 |
| |
| No. 5 – 50 Tice Corporate Center |
recently renovated in 2020. Since acquisition, the borrower has invested approximately $12.3 million in capital improvements which included a new HVAC system, a new full height atrium lobby with coffee bar, exposed elevators and lounge seating, upgrades to the common areas and hallways, bathrooms, conference system and fitness center. The 50 Tice Corporate Center Property also offers outdoor patio seating and a full-service cafeteria. The 50 Tice Corporate Center Property has a total of 938 parking spaces (approximately 3.7 parking spaces per 1,000 square feet of net rentable area), which is comprised of 882 surface spaces and 56 garage spaces. As of August 31, 2022, the 50 Tice Corporate Center Property was 89.8% occupied by 38 national, regional and local tenants.
COVID-19 Update. As of September 6, 2022, the 50 Tice Corporate Center Property is open and operating. As of the date of this term sheet, the 50 Tice Corporate Center Mortgage Loan is not subject to any modification or forbearance requests. The first payment date of the 50 Tice Corporate Center Mortgage Loan is scheduled for October 6, 2022.
Major Tenants. The three largest tenants based on underwritten base rent are Eagle Pharmaceuticals, HDR and Ford.
Eagle Pharmaceuticals (27,093 square feet; 10.6% of NRA; 13.0% of underwritten base rent). Eagle Pharmaceuticals is a specialty pharmaceutical company working to advance safe and efficient injectable treatments for patients across oncology, critical care, and orphan diseases. Eagle Pharmaceuticals along with its collaborators have the capability to take a molecule from preclinical research through regulatory approval and into the marketplace, including development, manufacturing and commercialization of the products and products candidates. The 50 Tice Corporate Center Property serves as the company’s headquarters. Eagle Pharmaceuticals has been a tenant at the 50 Tice Corporate Center Property since 2013 under a lease that expires on June 30, 2025, with one, five-year renewal option remaining. Eagle Pharmaceuticals has the right to terminate its lease at any time after March 31, 2024 with a 270 day notice period, which has to be delivered no earlier than July 1, 2023.
HDR (26,084 square feet; 10.2% of NRA; 11.3% of underwritten base rent). HDR Engineering (“HDR”) is an employee-owned design firm headquartered in Omaha, Nebraska which specializes in engineering, architecture, environmental and construction services. The company has a presence in the United States, Canada, Europe, Asia Pacific and the Middle East with more than 11,000 employees spread across over 200 locations globally. In 2022, HDR ranked #3 in Top 300 Architecture Firms and #3 in the Top 100 Global Architecture Practices. The borrower is in the process of completing the build out of HDR’s space at the 50 Tice Corporate Center Property and HDR is expected to take occupancy on October 1, 2022. HDR will have five months of free rent (commencing on the earlier of the date the borrower completes the buildout work or HDR takes occupancy), which was escrowed at origination. HDR has a lease expiration date of February 28, 2033 with two, five-year renewal options. HDR has the right to terminate its lease at any time on or after February 28, 2029 with the payment of a termination fee equal to the unamortized cost of (i) all of the landlord’s work, (ii) all broker’s fees, and (iii) any abated or free rent, all of which will be amortized with a 6.0% interest rate per annum. HDR also has a right of first refusal (“ROFR”) to lease a portion of Suite 280 (7,343 square feet), which is contiguous to HDR’s space.
Ford (19,358 square feet; 7.5% of NRA; 8.4% of underwritten base rent Moody’s/S&P/Fitch: Ba2/BB+/BB+). Founded in 1919 in Delaware, Ford Motor Company (“Ford”) is a global company which designs, manufactures, markets, and services a full line of Ford trucks, utility vehicles, and cars (increasingly including electrified versions), as well as Lincoln luxury vehicles. Ford employs approximately 183,000 people globally. The 50 Tice Corporate Center Property serves as a Central Hub office that serves the east coast dealership network by providing services to dealerships in the Tristate area, New England area, and Washington D.C. Services provided include marketing and advertising, financing, sales, parts and services. Ford has been a tenant at the 50 Tice Corporate Center Property since 2019 under a lease with an expiration date of August 31, 2026 with two, five-year renewal options remaining. Ford has a right of first offer (“ROFO”) to lease the contiguous space on the second floor of the 50 Tice Corporate Center Property.
Environmental. According to the Phase I environmental assessment dated August 19, 2022, there was no evidence of any recognized environmental conditions at the 50 Tice Corporate Center Property.
The following table presents certain information relating to the historical and current occupancy of the 50 Tice Corporate Center Property. During the renovation process, the borrower sponsors converted the former second floor Syncsort space into a multi-tenant use and executed 6 new leases totaling 67,161 square feet. Also, the borrower sponsors executed various new first floor, third floor, and atrium leases and expansions totaling an additional 43,000 square feet resulting in a current occupancy of 89.8%. The approximate 110,000 square feet of new leasing activities generated approximately $3 million in additional annual revenue.
THE INFORMATION IN THIS STRUCTURAL AND COLLATERAL TERM SHEET IS NOT COMPLETE AND MAY BE AMENDED PRIOR TO THE TIME OF SALE. THIS TERM SHEET IS NOT AN OFFER TO SELL THESE SECURITIES AND IT IS NOT A SOLICITATION OF AN OFFER TO BUY THESE SECURITIES IN ANY JURISDICTION WHERE THE OFFER OR SALE IS NOT PERMITTED. |
| | 77 | |
| Structural and Collateral Term Sheet | | BMO 2022-C3 |
| |
| No. 5 – 50 Tice Corporate Center |
| Historical and Current Occupancy |
| 2020(1) | 2021(1) | Current(2) |
| 68.8% | 71.9% | 89.8% |
| (1) | Historical Occupancies are as of December 31 of each respective year. |
| (2) | Current Occupancy is as of August 31, 2022. Includes two tenants (HDR and IPA) that are in the process of completing buildouts and are expected to take occupancy on October 1, 2022 and November 1, 2022, respectively. |
The following table presents certain information relating to the largest tenants based on underwritten base rent of the 50 Tice Corporate Center Property:
| Top Tenant Summary(1) |
| Tenant | Ratings
Moody’s/S&P/Fitch(2) | Net Rentable Area (SF) | % of
Total NRA | UW Base Rent PSF(3) | UW Base Rent(3) | % of Total
UW Base Rent | Lease
Expiration Date |
| Eagle Pharmaceuticals(4) | NR/NR/NR | 27,093 | 10.6 | % | $30.00 | $812,790 | 13.0 | % | 6/30/2025 |
| HDR(5) | NR/NR/NR | 26,084 | 10.2 | | $27.00 | 704,268 | 11.3 | | 2/28/2033 |
| Ford | Ba2/BB+/BB+ | 19,358 | 7.5 | | $27.00 | 522,666 | 8.4 | | 8/31/2026 |
| HQ Global Workplaces(6) | NR/NR/NR | 15,523 | 6.1 | | $15.60 | 242,159 | 3.9 | | 9/30/2023 |
| Price Meese Shulman(7) | NR/NR/NR | 13,095 | 5.1 | | $27.00 | 353,565 | 5.7 | | 4/30/2026 |
| Catalogic Software, Inc. | NR/NR/NR | 10,614 | 4.1 | | $29.00 | 307,806 | 4.9 | | 10/31/2023 |
| Ascensus(8) | NR/NR/NR | 10,203 | 4.0 | | $29.00 | 295,887 | 4.7 | | 1/31/2024 |
| Major Tenants | | 121,970 | 47.6 | % | $26.56 | $3,239,141 | 51.8 | % | |
| Other Tenants | | 108,433 | 42.3 | % | $27.83 | $3,017,540 | 48.2 | % | |
| Occupied Collateral Total / Wtd. Avg. | | 230,403 | 89.8 | % | $27.16 | $6,256,681 | 100.0 | % | |
| | | | | | | | |
| Vacant Space | | 26,056 | 10.2 | % | | | | |
| | | | | | | | |
| Collateral Total | | 256,459 | 100.0 | % | | | | |
| | | | | | | | |
| (1) | Based on the underwritten rent roll dated August 31, 2022. |
| (2) | In certain instances, ratings provided are those of the parent company of the entity shown, whether or not the parent company guarantees the lease. |
| (3) | UW Base Rent PSF and UW Base Rent includes rent steps totaling $99,663 taken through September 1, 2023. |
| (4) | Eagle Pharmaceuticals has the right to terminate its lease at any time after March 31, 2024 with a 270 day notice period, which has to be delivered no earlier than July 1, 2023. |
| (5) | HDR is currently in the process of completing the buildout of its space and is expected to take occupancy on October 1, 2022. HDR has five months of rent concessions, which was escrowed at origination. HDR may terminate its lease at any time on or after February 28, 2029 with the payment of a termination fee equal to the unamortized cost of (i) all of the landlord’s work, (ii) all broker’s fees, (iii) any abated or free rent, all of which will be amortized with a 6.0% interest rate per annum. HDR also has a ROFR to lease a portion of Suite 280 (7,343 square feet), which is contiguous to HDR’s space. |
| (6) | HQ Global Workplaces has two, five-year renewal options remaining. HQ Global Workplaces has a ROFO to lease the contiguous space on the third floor of the 50 Tice Corporate Center Property at the expiration of the existing space lease. |
| (7) | Price Meese Shulman has one, five-year renewal option remaining. Price Meese Shulman has the right to terminate its lease at any time on or prior to December 31, 2023. |
| (8) | Ascensus has one, three-year renewal option remaining. Ascensus has a ROFO to lease the contiguous space on the first floor of the 50 Tice Corporate Center Property at the expiration of the existing space lease. |
THE INFORMATION IN THIS STRUCTURAL AND COLLATERAL TERM SHEET IS NOT COMPLETE AND MAY BE AMENDED PRIOR TO THE TIME OF SALE. THIS TERM SHEET IS NOT AN OFFER TO SELL THESE SECURITIES AND IT IS NOT A SOLICITATION OF AN OFFER TO BUY THESE SECURITIES IN ANY JURISDICTION WHERE THE OFFER OR SALE IS NOT PERMITTED. |
| | 78 | |
| Structural and Collateral Term Sheet | | BMO 2022-C3 |
| |
| No. 5 – 50 Tice Corporate Center |
The following table presents certain information relating to the tenant lease expirations of the 50 Tice Corporate Center Property:
| Lease Rollover Schedule(1)(2) |
| Year | Number of Leases Expiring | Net Rentable Area Expiring | % of NRA Expiring | UW Base Rent Expiring(3) | % of UW Base Rent Expiring(3) | Cumulative Net Rentable Area Expiring | Cumulative % of NRA Expiring | Cumulative UW Base Rent Expiring(3) | Cumulative % of UW Base Rent Expiring(3) |
| Vacant | NAP | 26,056 | 10.2 | % | NAP | NA | P | 26,056 | 10.2% | NAP | NA | P |
| 2022 & MTM(4) | 2 | 553 | 0.2 | | $14,498 | 0.2 | % | 26,609 | 10.4% | $14,498 | 0.2 | % |
| 2023(4) | 9 | 57,030 | 22.2 | | 1,237,499 | 19.8 | | 83,639 | 32.6% | $1,251,998 | 20.0 | % |
| 2024 | 8 | 27,815 | 10.8 | | 896,473 | 14.3 | | 111,454 | 43.5% | $2,148,470 | 34.3 | % |
| 2025 | 4 | 33,050 | 12.9 | | 988,961 | 15.8 | | 144,504 | 56.3% | $3,137,431 | 50.1 | % |
| 2026 | 6 | 49,252 | 19.2 | | 1,359,056 | 21.7 | | 193,756 | 75.6% | $4,496,487 | 71.9 | % |
| 2027 | 2 | 9,625 | 3.8 | | 273,174 | 4.4 | | 203,381 | 79.3% | $4,769,662 | 76.2 | % |
| 2028 | 2 | 5,679 | 2.2 | | 200,869 | 3.2 | | 209,060 | 81.5% | $4,970,531 | 79.4 | % |
| 2029 | 2 | 9,427 | 3.7 | | 258,452 | 4.1 | | 218,487 | 85.2% | $5,228,982 | 83.6 | % |
| 2030 | 0 | 0 | 0.0 | | 0 | 0.0 | | 218,487 | 85.2% | $5,228,982 | 83.6 | % |
| 2031 | 0 | 0 | 0.0 | | 0 | 0.0 | | 218,487 | 85.2% | $5,228,982 | 83.6 | % |
| 2032 | 1 | 4,545 | 1.8 | | 125,169 | 2.0 | | 223,032 | 87.0% | $5,354,152 | 85.6 | % |
| 2033 & Beyond | 2 | 33,427 | 13.0 | | 902,529 | 14.4 | | 256,459 | 100.0% | $6,256,681 | 100.0 | % |
| Total | 38 | 256,459 | 100.0 | % | $6,256,681 | 100.0 | % | | | | |
| (1) | Based on the underwritten rent roll dated August 31, 2022. |
| (2) | Certain leases may have termination options that are exercisable prior to the originally stated expiration date of the lease and that are not considered in this Lease Rollover Schedule. |
| (3) | UW Base Rent Expiring, % of UW Base Rent Expiring, Cumulative UW Base Rent Expiring and Cumulative % of UW Base Rent Expiring include rent steps totaling $99,663 taken through September 1, 2023. |
| (4) | The following spaces are included in 2022 & MTM or 2023 Net Rentable Area Expiring and have no associated UW rents: Café, Health & Wellness Center, Conference Center, Recycling, and Occupied Storage. |
The following table presents certain information relating to the underwritten cash flows of the 50 Tice Corporate Center Property:
| Operating History and Underwriting Net Cash Flow |
| | 2020 | 2021 | TTM(1) | Underwritten | Per Square Foot | %(2) |
| Rents in Place | $4,628,421 | $4,558,666 | $4,953,138 | $6,157,017 | $24.01 | 83.1 | % |
| Vacant Income | 0 | 0 | 0 | 670,143 | $2.61 | 9.0 | |
| Contractual Rent Steps | 0 | 0 | 0 | 99,663 | $0.39 | 1.3 | |
| Gross Potential Rent | $4,628,421 | $4,558,666 | $4,953,138 | $6,926,823 | $27.01 | 93.5 | % |
| Total Reimbursements | 487,700 | 466,416 | 471,952 | 478,179 | $1.86 | 6.5 | |
| Net Rental Income | $5,116,121 | $5,025,081 | $5,425,091 | $7,405,002 | $28.87 | 100.0 | % |
| Other Income | 63,251 | 64,349 | 67,726 | 67,726 | $0.26 | 0.9 | |
| (Vacancy/Credit Loss)(3) | 0 | 0 | 0 | (670,143) | ($2.61) | (9.0) | |
| Effective Gross Income | $5,179,372 | $5,089,430 | $5,492,816 | $6,802,586 | $26.53 | 91.9 | % |
| Total Expenses | 2,167,338 | 2,182,936 | 2,283,943 | 2,317,771 | $9.04 | 34.1 | |
| Net Operating Income(4) | $3,012,034 | $2,906,494 | $3,208,873 | $4,484,814 | $17.49 | 65.9 | % |
| Capital Expenditures | 0 | 0 | 0 | 51,292 | $0.20 | 0.8 | |
| TI/LC | 0 | 0 | 0 | 76,938 | $0.30 | 1.1 | |
| Net Cash Flow | $3,012,034 | $2,906,494 | $3,208,873 | $4,356,585 | $16.99 | 64.0 | % |
| (1) | TTM reflects the trailing 12-month period ending June 30, 2022. |
| (2) | % column represents percent of Net Rental Income for all revenue lines and represents percent of Effective Gross Income for the remainder of fields. |
| (3) | Underwritten Vacancy/Credit Loss represents the economic vacancy of 9.0%. |
| (4) | The increase in Underwritten Net Operating Income from TTM Net Operating income is primarily attributed to the increase in occupancy and recent leasing at the 50 Tice Corporate Center Property. Since August 2022, the borrower sponsors have leased approximately 39,347 square feet (15.3% of net rentable area and 17.1% of underwritten base rent) of space at the 50 Tice Corporate Center Property. |
THE INFORMATION IN THIS STRUCTURAL AND COLLATERAL TERM SHEET IS NOT COMPLETE AND MAY BE AMENDED PRIOR TO THE TIME OF SALE. THIS TERM SHEET IS NOT AN OFFER TO SELL THESE SECURITIES AND IT IS NOT A SOLICITATION OF AN OFFER TO BUY THESE SECURITIES IN ANY JURISDICTION WHERE THE OFFER OR SALE IS NOT PERMITTED. |
| | 79 | |
| Structural and Collateral Term Sheet | | BMO 2022-C3 |
| |
| No. 5 – 50 Tice Corporate Center |
The Market. The 50 Tice Corporate Center Property is located in Woodcliff Lake, New Jersey, within the New York-Newark-Jersey City, NY-NJ-PA Metropolitan Statistical Area (the “New York MSA”) in Bergen County. Bergen County is in the northeastern portion of New Jersey, bordered by Rockland County to the north, the Hudson River to the east, Hudson and Essex counties to the south, and Passaic County to the west. Bergen County’s largest industries include healthcare/social assistance, professional/scientific/technical services, and educational services. Major employers within Bergen County include Hackensack University Medical Center, Valley Health Systems, Inc., Bio-Reference Laboratories, Inc. and Express Scripts. Bergen County also serves as the corporate headquarters for Sharp Corporation and Benjamin Moore, with additional corporate offices for BMW, Ingersoll Rand, Pentax and KPMG.
The 50 Tice Corporate Center Property is located within the borough of Woodcliff Lake in the northern portion of Bergen County, approximately 11 miles north of Hackensack and 28 miles north of New York. Access is to the 50 Tice Corporate Center Property is provided via Interstates 80, Interstate 287, U.S. Route 202 and the New Jersey Turnpike. The immediate area surrounding the 50 Tice Corporate Center Property consists mainly of office, retail and industrial uses. Tice Corner Marketplace is located less than a mile from the 50 Tice Corporate Center Property. Tice Corner Marketplace is a lifestyle center featuring Apple, Anthropology, Pottery Barn, J. Crew, Williams-Sonoma and Panera Bread. North Market is a new mixed use district located approximately 1.8 miles northeast of the 50 Tice Corporate Center Property. North Market consists of five buildings, which include approximately 68,000 square feet of retail space, 308 apartments, a boutique hotel and approximately 90,000 square feet of Class A office space. According to a third-party market research report, the 2021 population within a one-, three- and five-mile radius of the 50 Tice Corporate Center Property was 3,234, 54,755 and 214,410, respectively. Additionally, for the same period, the average household income within the same radii was $207,953, $191,060 and $172,709, respectively.
According to the appraisal, the 50 Tice Corporate Center Property is located within the Northern New Jersey office market and the Upper Parkway office submarket. As of the second quarter of 2022, the Northern New Jersey office market contained approximately 382.9 million square feet of office space with a vacancy rate of 11.4% and an average quoted rental rate of $27.70 per square foot. As of the second quarter of 2022, the Northern New Jersey office market reported negative net absorption of 523,855 square feet and 125,200 square feet of completions. The Upper Parkway office submarket contained approximately 4.6 million square feet of office space with a vacancy rate of 18.0% and an average rental rate of $26.45 per square foot as of the second quarter of 2022. The Upper Parkway office submarket reported positive net absorption of 20,887 square feet and no new completions.
THE INFORMATION IN THIS STRUCTURAL AND COLLATERAL TERM SHEET IS NOT COMPLETE AND MAY BE AMENDED PRIOR TO THE TIME OF SALE. THIS TERM SHEET IS NOT AN OFFER TO SELL THESE SECURITIES AND IT IS NOT A SOLICITATION OF AN OFFER TO BUY THESE SECURITIES IN ANY JURISDICTION WHERE THE OFFER OR SALE IS NOT PERMITTED. |
| | 80 | |
| Structural and Collateral Term Sheet | | BMO 2022-C3 |
| |
| No. 5 – 50 Tice Corporate Center |
The following table presents certain information relating to comparable office leases for the 50 Tice Corporate Center Property:
| Comparable Office Rental Summary(1) |
| Property Name/Location | Year Built | Occ. | Size (SF) | Tenant | Suite Size (SF) | Rent PSF | Commencement | Lease Type | Lease Term (Months) |
50 Tice Corporate Center 50 Tice Boulevard Woodcliff Lake, NJ | 1984 | 89.8%(2) | 256,459 | Various | Various | $27.16(2) | Various | Mod Gross | Various |
17-17 Route 208 17-17 Route 208 Fair Lawn, NJ | 1987 | 100.0% | 150,022 | Summit Health | 70,549 | $25.25 | Jul-22 | Mod Gross | 60 |
155 Chestnut Ridge Road 155 Chestnut Ridge Road Montvale, NJ | 1976 | 91.5% | 94,172 | Confidential | 6,505 | $26.00 | Jun-21 | Mod Gross | 72 |
Overpeck Corporate Center 65 Challenger Road Ridgefield Park, NJ | 1987 | 92.0% | 185,050 | Korean Reinsurance | 2,480 | $27.50 | Jun-22 | Mod Gross | 72 |
Glenpointe Centre 300 Frank W. Burr Boulevard Teaneck, NJ | 1984 | 95.0% | 650,000 | Cognizant Technologies Solutions, Corp. | 36,577 | $37.50 | Feb-21 | Mod Gross | 120 |
Nexus 17 South 15 East Midland Avenue Paramus, NJ | 1988 | 90.5% | 272,176 | Hall Booth Law Firm | 23,339 | $34.00 | Mar-22 | Mod Gross | 156 |
| (2) | Based on the underwritten rent roll dated August 31, 2022. Occupancy includes two tenants (HDR and IPA) that are in the process of completing its buildout and are expected to take occupancy on October 1, 2022 and November 1, 2022, respectively. Rent PSF is inclusive of rent steps. |
The following table presents certain information relating to comparable sales for the 50 Tice Corporate Center Property:
| Comparable Sales(1) |
| Property Location | Sale Date | Total NRA (SF) | Total Occupancy | Sale Price | Sale Price PSF | Adjusted Sales Price PSF |
50 Tice Corporate Center 50 Tice Boulevard Woodcliff Lake, NJ | NAP | 256,459(2) | 89.8% | (2) | NAP | NAP | NAP |
222 Bruce Reynolds Boulevard 222 Bruce Reynolds Boulevard Fort Lee, NJ | Feb-2022 | 108,365 | 67.0% | | $31,000,000 | $286 | $246 |
180 Park Avenue 180 Park Avenue Florham Park, NJ | Oct-2022 | 228,350 | 75.0% | | $35,600,000 | $156 | $211 |
Executive Plaza 10 Parsonage Road Edison, NJ | Jan-2020 | 115,200 | 98.8% | | $33,000,000 | $286 | $255 |
One Bridge Plaza 1 Bridge Plaza North Fort Lee, NJ | Mar-2020 | 206,500 | 69.0% | | $36,750,000 | $178 | $224 |
85 Challenger Road 85 Challenger Road Ridgefield Park, NJ | Oct-2020 | 233,505 | 97.0% | | $59,700,000 | $256 | $266 |
Metropark Corporate Campus 194 Wood Street South Iselin, NJ | Aug-2020 | 470,692 | 100.0% | | $140,000,000 | $297 | $263 |
| (2) | Based on the underwritten rent roll dated August 31, 2022. Total Occupancy includes two tenants (HDR and IPA) that are in the process of completing buildouts and are expected to take occupancy on October 1, 2022 and November 1, 2022, respectively. |
The Borrower. The borrowing entity for the 50 Tice Corporate Center Mortgage Loan is Capstone Tice Blvd LLC, a single purpose entity whose sole member/manager is an SPE which is required to have at least one independent director. Legal
THE INFORMATION IN THIS STRUCTURAL AND COLLATERAL TERM SHEET IS NOT COMPLETE AND MAY BE AMENDED PRIOR TO THE TIME OF SALE. THIS TERM SHEET IS NOT AN OFFER TO SELL THESE SECURITIES AND IT IS NOT A SOLICITATION OF AN OFFER TO BUY THESE SECURITIES IN ANY JURISDICTION WHERE THE OFFER OR SALE IS NOT PERMITTED. |
| | 81 | |
| Structural and Collateral Term Sheet | | BMO 2022-C3 |
| |
| No. 5 – 50 Tice Corporate Center |
counsel to the borrower delivered a non-consolidation opinion in connection with the origination of the 50 Tice Corporate Center Mortgage Loan.
The Borrower Sponsors. The borrower sponsors and non-recourse carveout guarantors for the 50 Tice Corporate Center Mortgage Loan are Mitchell Adelstein, Robert Friedberg and Brad Gillman. Mr. Adelstein is a founder and managing partner of Capstone Realty Group USA (“Capstone”), and Mr. Friedberg and Mr. Gillman are each managing partners of Capstone. Capstone is a commercial real estate investment and development company focused on acquiring multifamily, self-storage, office and retail properties. Capstone’s expertise includes acquisitions, valuations, debt financing, private equity syndication, real estate management and design and development. Additionally, Capstone provides in-house asset management, construction management, property management and capital advisory services. The nonrecourse carveout guarantors have previously had ownership interests in entities that were subject to foreclosures. See “Description of the Mortgage Pool—Default History, Bankruptcy Issues and Other Proceedings” in the Preliminary Prospectus.
Property Management. The 50 Tice Corporate Center Property is managed by Capstone Realty Group LLC, an affiliate of the borrower sponsors and G&E Real Estate Management Services, Inc.
Escrows and Reserves. At origination, the borrower deposited into escrow approximately $11,798 for insurance reserves, $153,875 for replacement reserves, $3,000,000 for TI/LCs, $970,000 for outstanding tenant improvements for HDR, $367,150 for outstanding tenant improvements for IPA, $288,011 for a rent concession reserve for HDR and approximately $97,295 for a rent concession reserve for IPA.
Tax Escrows – On a monthly basis, the borrower is required to escrow 1/12th of the annual estimated tax payments, which currently equates to approximately $74,353.
Insurance Escrows – On a monthly basis, the borrower is required to escrow 1/12th of the annual estimated insurance payments. The requirement for the borrower to make monthly deposits to the insurance escrow is waived so long as (i) the 50 Tice Corporate Center Property is insured under a blanket insurance policy in accordance with the 50 Tice Corporate Center Mortgage Loan documents and (ii) the borrower provides the lender with satisfactory written evidence of the payment of the applicable insurance premiums at least 15 days prior to the expiration of any acceptable blanket policy.
Replacement Reserves – If at any time the balance in the replacement reserve falls below $153,875, the borrower is required to deposit approximately $4,274 monthly until the balance in the replacement reserve reaches $153,875.
TI/LC Reserves – If at any time the balance in the TI/LC reserve falls below $3,000,000, the borrower is required to deposit $42,753 monthly until the balance in the TI/LC reserve reaches $3,000,000. In addition, the borrower is required to deposit in the TI/LC reserve any amounts paid to the borrower in connection with a termination, cancellation, surrender, modification, sale or other disposition of any lease (or portion of the lease) other than amounts paid for rent and other charges in respect of periods prior to the date of such termination, cancellation, surrender, modification, sale or other disposition. Provided no event of default is existing, the borrower has the right to deliver to the lender a letter of credit in an amount equal to the amount (excluding any deposits to cover the letter of credit transfer fees) then required to be held in the tenant improvement and leasing commission subaccount, subject to terms of the 50 Tice Corporate Center Mortgage Loan documents.
Lockbox / Cash Management. The 50 Tice Corporate Center Mortgage Loan is structured with a hard lockbox and springing cash management. The borrower or the property managers are required to deliver to each tenant at the 50 Tice Corporate Center Property a tenant direction letter instructing each tenant to deposit rents directly into the lender-controlled lockbox account. If any of the borrower or the property managers receive any rents or other charges related to the 50 Tice Corporate Center Property, the borrower or the property managers are required to deposit such amounts into the lender-controlled lockbox within one business day of receipt. All amounts in the lockbox account are remitted on each business day to the borrower at any time other than during the continuance of a Cash Management Trigger Event (as defined below). Upon the occurrence and during the continuance of a Cash Management Trigger Event, all amounts are required to be remitted to a lender-controlled cash management account to be applied and disbursed in accordance with the 50 Tice Corporate Center Mortgage Loan documents. During the occurrence of a Cash Sweep Event, all excess cash flow funds will be held by the lender in an excess cash flow reserve account as additional collateral for the 50 Tice Corporate Center Mortgage Loan.
A “Cash Management Trigger Event” means the occurrence of (i) an event of default, (ii) a bankruptcy action of the borrower, guarantors or property managers, provided, however; if two of the guarantors are not subject to a bankruptcy
THE INFORMATION IN THIS STRUCTURAL AND COLLATERAL TERM SHEET IS NOT COMPLETE AND MAY BE AMENDED PRIOR TO THE TIME OF SALE. THIS TERM SHEET IS NOT AN OFFER TO SELL THESE SECURITIES AND IT IS NOT A SOLICITATION OF AN OFFER TO BUY THESE SECURITIES IN ANY JURISDICTION WHERE THE OFFER OR SALE IS NOT PERMITTED. |
| | 82 | |
| Structural and Collateral Term Sheet | | BMO 2022-C3 |
| |
| No. 5 – 50 Tice Corporate Center |
action and their combined net worth and liquidity satisfy the financial covenants as stated in the 50 Tice Corporate Center Mortgage Loan documents, then such bankruptcy action of one guarantor will not constitute a Cash Management Trigger Event or (iii) a Cash Management DSCR Trigger Event (as defined below). A Cash Management Trigger Event will end (a) with respect to clause (i) above, if a cure of such event of default has been accepted or the event of default has been waived by the lender, (b) with respect to clause (ii) above, when such bankruptcy action petition has been discharged, stayed, or dismissed within 90 days of such filing among other conditions with respect to the borrower and the guarantor and within 120 days for the property managers, or, with respect to the property managers, the borrower replacing the property managers with a qualified manager acceptable to the lender and (c) with respect to clause (iii) above, the date the amortizing debt service coverage ratio based on the trailing 12-month period immediately preceding the date of such determination is greater than 1.15x for two consecutive quarters.
A “Cash Management DSCR Trigger Event” will occur on any day the debt service coverage ratio, based on the trailing 12-month period immediately preceding the date of determination, is less than 1.15x.
A “Cash Sweep Event” means the occurrence of (i) an event of default, (ii) a bankruptcy action of the borrower, guarantors or property managers, provided, however; if two guarantors are not subject to a bankruptcy action and collectively satisfy the financial covenants as stated within the 50 Tice Corporate Center Mortgage Loan documents, then such bankruptcy action of one guarantor will not constitute a Cash Sweep Event or, or (iii) a Cash Sweep DSCR Trigger Event. A Cash Sweep Event will end (a) with respect to clause (i) above, a cure of such event of default has been accepted or the event of default has been waived by the lender, (b) with respect to clause (ii) above, when such bankruptcy action petition has been discharged, stayed, or dismissed within 90 days of such filing among other conditions with respect to the borrower and the guarantor and within 120 days for the property managers, or, with respect to the managers, the borrower replacing the property managers with a qualified manager acceptable to the lender and (c) with respect to clause (iii) above, the date the amortizing debt service coverage ratio based on the trailing 12-month period immediately preceding the date of such determination is greater than 1.15x for two consecutive quarters.
A “Cash Sweep DSCR Trigger Event” will occur on any day the debt service coverage ratio, based on the trailing 12-month period immediately preceding the date of determination, is less than 1.15x.
Subordinate Debt. None.
Mezzanine Debt. The borrower is permitted to incur a future mezzanine loan subject to the satisfaction of the requirements as set forth in the 50 Tice Corporate Center Mortgage Loan documents, including but not limited to: (i) no event of default is continuing, (ii) the combined loan-to-value ratio based on the 50 Tice Corporate Center Mortgage Loan and the future mezzanine loan is no greater than 56.8%, (iii) the combined debt service coverage ratio based on the 50 Tice Corporate Center Mortgage Loan and the future mezzanine loan is equal to or greater than 1.68x, (iv) the execution of an intercreditor agreement acceptable to the lender and (v) receipt of a rating agency confirmation from each of Fitch, KBRA and S&P that the mezzanine financing will not result in a downgrade, withdrawal or qualification of the respective ratings assigned to the BMO 2022-C3 certificates.
Partial Release. Not permitted.
Ground Lease. None.
THE INFORMATION IN THIS STRUCTURAL AND COLLATERAL TERM SHEET IS NOT COMPLETE AND MAY BE AMENDED PRIOR TO THE TIME OF SALE. THIS TERM SHEET IS NOT AN OFFER TO SELL THESE SECURITIES AND IT IS NOT A SOLICITATION OF AN OFFER TO BUY THESE SECURITIES IN ANY JURISDICTION WHERE THE OFFER OR SALE IS NOT PERMITTED. |
| | 83 | |
| Structural and Collateral Term Sheet | | BMO 2022-C3 |
| |
| No. 6 – Center Pointe Plaza I |
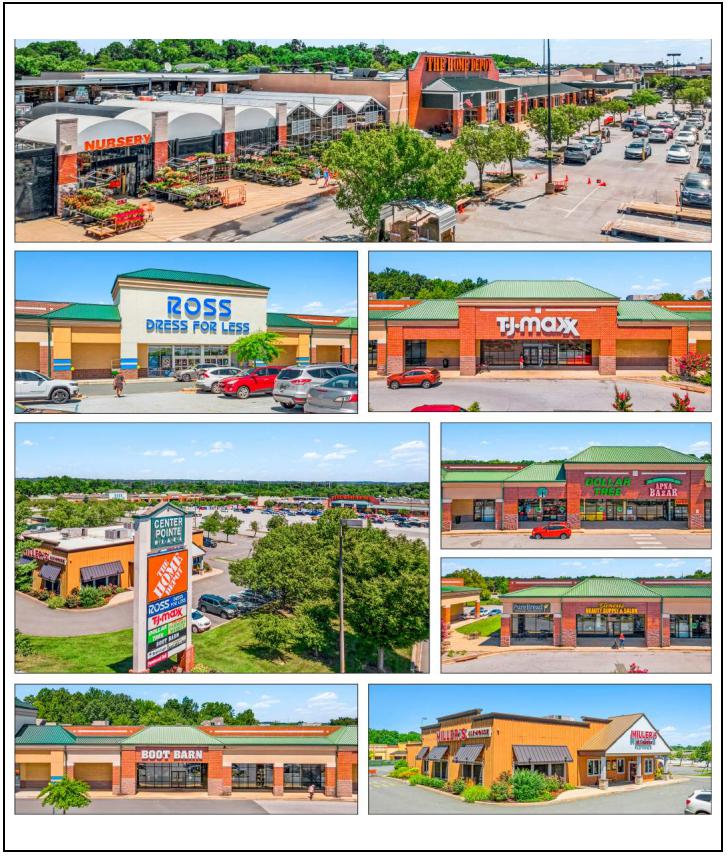
THE INFORMATION IN THIS STRUCTURAL AND COLLATERAL TERM SHEET IS NOT COMPLETE AND MAY BE AMENDED PRIOR TO THE TIME OF SALE. THIS TERM SHEET IS NOT AN OFFER TO SELL THESE SECURITIES AND IT IS NOT A SOLICITATION OF AN OFFER TO BUY THESE SECURITIES IN ANY JURISDICTION WHERE THE OFFER OR SALE IS NOT PERMITTED. |
| | 84 | |
| Structural and Collateral Term Sheet | | BMO 2022-C3 |
| |
| No. 6 – Center Pointe Plaza I |
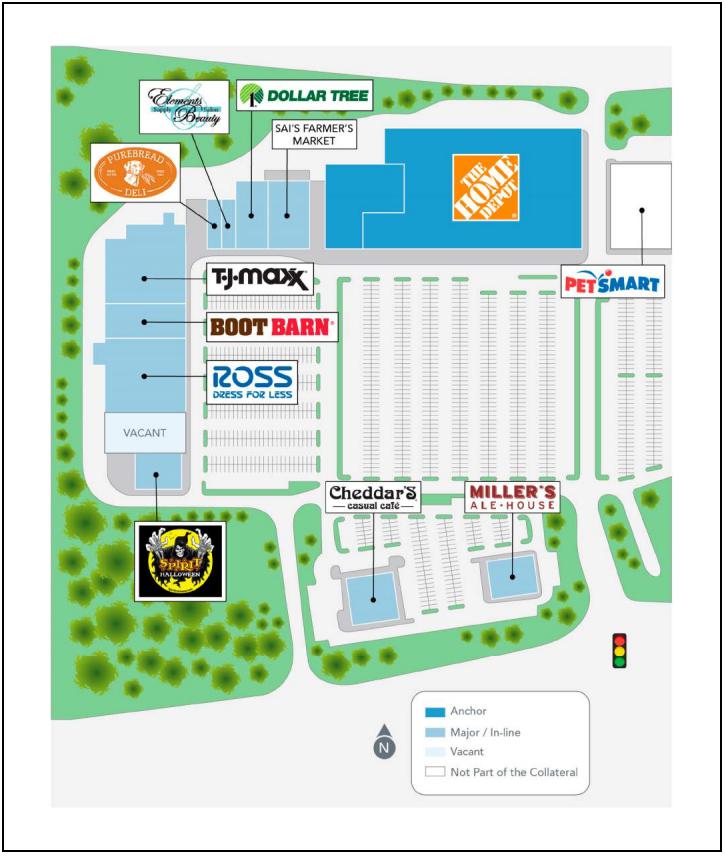
THE INFORMATION IN THIS STRUCTURAL AND COLLATERAL TERM SHEET IS NOT COMPLETE AND MAY BE AMENDED PRIOR TO THE TIME OF SALE. THIS TERM SHEET IS NOT AN OFFER TO SELL THESE SECURITIES AND IT IS NOT A SOLICITATION OF AN OFFER TO BUY THESE SECURITIES IN ANY JURISDICTION WHERE THE OFFER OR SALE IS NOT PERMITTED. |
| | 85 | |
| Structural and Collateral Term Sheet | | BMO 2022-C3 |
| |
| No. 6 – Center Pointe Plaza I |
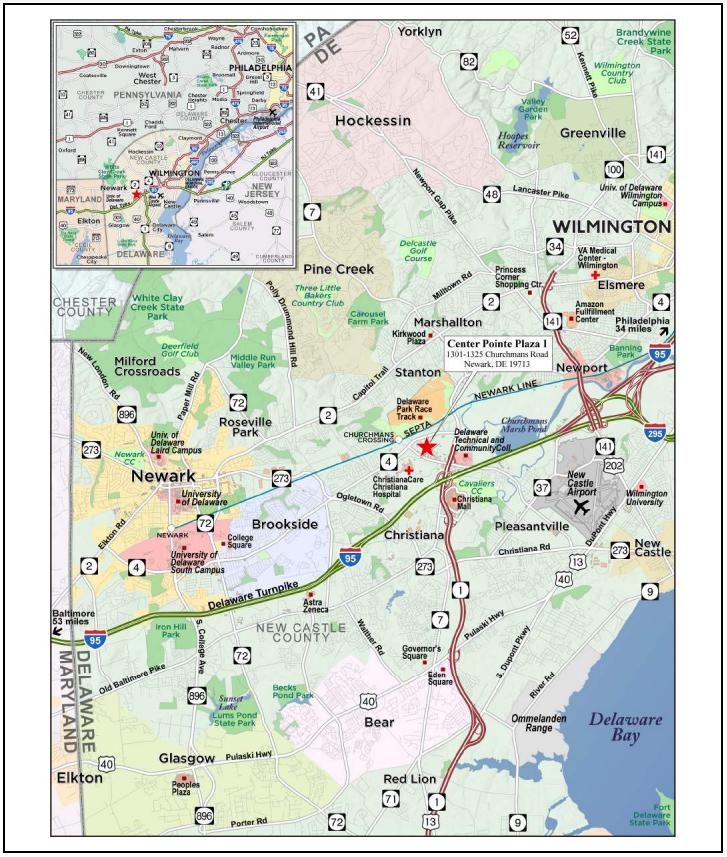
THE INFORMATION IN THIS STRUCTURAL AND COLLATERAL TERM SHEET IS NOT COMPLETE AND MAY BE AMENDED PRIOR TO THE TIME OF SALE. THIS TERM SHEET IS NOT AN OFFER TO SELL THESE SECURITIES AND IT IS NOT A SOLICITATION OF AN OFFER TO BUY THESE SECURITIES IN ANY JURISDICTION WHERE THE OFFER OR SALE IS NOT PERMITTED. |
| | 86 | |
| Structural and Collateral Term Sheet | | BMO 2022-C3 |
| |
| No. 6 – Center Pointe Plaza I |
| Mortgage Loan Information | | Property Information |
| Mortgage Loan Seller: | LMF | | Single Asset / Portfolio: | Single Asset |
| Original Principal Balance: | $35,000,000 | | Title: | Fee |
| Cut-off Date Principal Balance: | $34,966,340 | | Property Type – Subtype: | Retail - Anchored |
| % of IPB: | 4.8% | | Net Rentable Area (SF): | 238,348 |
| Loan Purpose: | Refinance | | Location: | Newark, DE |
| Borrower: | Centercap Holding LLC | | Year Built / Renovated: | 1997 / NAP |
| Borrower Sponsor: | Joanne M. Capano | | Occupancy: | 89.7% |
| Interest Rate: | 6.18000% | | Occupancy Date: | 8/1/2022 |
| Note Date: | 9/7/2022 | | 4th Most Recent NOI (As of): | NAV |
| Maturity Date: | 9/6/2032 | | 3rd Most Recent NOI (As of): | $2,965,985 (12/31/2020) |
| Interest-only Period: | None | | 2nd Most Recent NOI (As of): | $2,854,196 (12/31/2021) |
| Original Term: | 120 months | | Most Recent NOI (As of): | $2,737,310 (TTM 6/30/2022) |
| Original Amortization Term: | 360 months | | UW Economic Occupancy: | 89.2% |
| Amortization Type: | Amortizing Balloon | | UW Revenues: | $4,144,219 |
| Call Protection: | L(25),D(91),O(4) | | UW Expenses: | $786,260 |
| Lockbox / Cash Management: | Springing | | UW NOI: | $3,357,960 |
| Additional Debt: | No | | UW NCF: | $3,250,703 |
| Additional Debt Balance: | N/A | | Appraised Value / Per SF: | $52,800,000 / $222 |
| Additional Debt Type: | N/A | | Appraisal Date: | 7/22/2022 |
| | | | | |
| Escrows and Reserves(1) | | Financial Information |
| | Initial | Monthly | Initial Cap | | Cut-off Date Loan / SF: | $147 |
| Taxes: | $38,007 | $36,197 | N/A | | Maturity Date Loan / SF: | $125 |
| Insurance: | $41,369 | $3,940 | N/A | | Cut-off Date LTV: | 66.2% |
| Replacement Reserves: | $0 | $2,979 | N/A | | Maturity Date LTV: | 56.5% |
| TI/LC: | $250,000 | $5,959 | $500,000 | | UW NCF DSCR: | 1.27x |
| Deferred Maintenance: | $26,778 | $0 | N/A | | UW NOI Debt Yield: | 9.6% |
| Other Reserves(1): | $557,012 | $0 | N/A | | | |
| | | | | | | |
| Sources and Uses |
| Sources | Proceeds | % of Total | | Uses | Proceeds | % of Total |
| Mortgage Loan | $35,000,000 | 100.0 | % | | Loan Payoff | $32,267,907 | 92.2 | % |
| | | | | Return of Equity | 991,612 | 2.8 | |
| | | | | Upfront Reserves | 913,166 | 2.6 | |
| | | | | Closing Costs | 827,316 | 2.4 | |
| Total Sources | $35,000,000 | 100.0 | % | | Total Uses | $35,000,000 | 100.0 | % |
| (1) | For a full description of Escrows and Reserves, please refer to “Escrows and Reserve” below. |
The Loan. The Center Pointe Plaza I mortgage loan is secured by a first lien mortgage on the borrower’s fee interest in a 238,348 square foot anchored retail property located in Newark, Delaware (the “Center Pointe Plaza I Property”). The Center Pointe Plaza I mortgage loan was originated by LMF and has an outstanding principal balance as of the Cut-off Date of approximately $35.0 million (the “Center Pointe Plaza I Mortgage Loan”). The Center Pointe Plaza I Mortgage Loan has a 10-year term and amortizes on a 30-year amortization schedule.
The Property. The Center Pointe Plaza I Property is an anchored retail center comprised of five, one-story retail buildings, totaling 238,348 square feet on an approximately 38.8-acre site in Newark, Delaware. Built in 1997, the Center Pointe Plaza I Property provides parking via 1,393 surface parking spaces, resulting in a parking ratio of 5.8 spaces per 1,000 square feet of net rentable area. The Center Pointe Plaza I Property is anchored by Home Depot (as defined below) and junior anchored by TJ Maxx, Ross Dress for Less, Boot Barn, Sai Farmer’s Market and Dollar Tree. There is one pad ground leased to Cheddar’s Casual Café. The Center Pointe Plaza I Property sits adjacent to non-collateral Center Pointe Plaza II, which is unaffiliated with the Center Pointe Plaza I Property. Since 2018, the borrower sponsor invested approximately $3.7 million in capital improvements, including demising and fitting out the former Babies R Us (current Ross Dress for Less
THE INFORMATION IN THIS STRUCTURAL AND COLLATERAL TERM SHEET IS NOT COMPLETE AND MAY BE AMENDED PRIOR TO THE TIME OF SALE. THIS TERM SHEET IS NOT AN OFFER TO SELL THESE SECURITIES AND IT IS NOT A SOLICITATION OF AN OFFER TO BUY THESE SECURITIES IN ANY JURISDICTION WHERE THE OFFER OR SALE IS NOT PERMITTED. |
| | 87 | |
| Structural and Collateral Term Sheet | | BMO 2022-C3 |
| |
| No. 6 – Center Pointe Plaza I |
space), as well as installing multiple new roofs, electrical systems, and HVAC units. As of August 1, 2022, the Center Pointe Plaza I Property was 89.7% occupied by ten national, regional and local tenants. Occupancy excludes the temporary tenant Spirit Halloween (7,997 square feet; 3.4% of NRA) for $21.00 per square foot from August 2022 through November 2022.
COVID-19 Update. As of September 6, 2022, the Center Pointe Plaza I Property is open and operating. As of the date of this term sheet, the Center Pointe Plaza I Mortgage Loan is not subject to any modification or forbearance requests. The first payment date of the Center Pointe Plaza I Mortgage Loan is October 6, 2022.
Major Tenants. The three largest tenants based on underwritten base rent are Home Depot U.S.A., Inc., TJ Maxx and Ross Dress for Less.
Home Depot U.S.A., Inc. (109,738 square feet; 46.0% of NRA, 43.7% of underwritten base rent, Moody’s/S&P/Fitch: A2/A/A): Founded in 1977 and headquartered in Atlanta, Georgia, Home Depot U.S.A., Inc. (“Home Depot”) is a home improvement specialty retailer with approximately 2,200 retail stores in all 50 states, the District of Columbia, Puerto Rico, the U.S. Virgin Islands, Guam, Canada and Mexico. Home Depot is the anchor tenant at the Center Pointe Plaza I Property and has been a tenant at the Center Pointe Plaza I Property since 1995 under a lease expiring in June 2031, with four, five-year renewal options remaining.
TJ Maxx (29,900 square feet; 12.5% of NRA, 15.2% of underwritten base rent, Moody’s/S&P/Fitch: A2/A/NR): Founded in 1976 and headquartered in Framingham, Massachusetts, TJ Maxx is the leading off-price retailer of apparel and home fashions in the United States and worldwide. TJ Maxx operates four major divisions including Marmaxx, HomeGoods, TJX Canada and TJX International across nine countries in three continents, as well as five e-commerce businesses. TJ Maxx has been a tenant at the Center Pointe Plaza I Property since 1997 under a lease expiring in January 2033, with two, five-year renewal options remaining.
Ross Dress for Less (22,000 square feet; 9.2% of NRA, 7.9% of underwritten base rent, Moody’s/S&P/Fitch: A2/BBB+/NR): Founded in 1982 and headquartered in Dublin, California, Ross Dress for Less (“Ross”) is an off-price retail chain. Ross operates two major brands including Ross Dress for Less and dd’s Discounts. Ross operates approximately 1,669 stores in 40 states, the District of Columbia and Guam, while dd’s Discounts operates 311 stores in 21 states. Ross has been a tenant at the Center Pointe Plaza I Property since 2020 under a lease expiring in January 2031, with four, five-year renewal options remaining.
Environmental. According to the Phase I environmental assessment dated August 2, 2022, there was no evidence of any recognized environmental conditions at the Center Pointe Plaza I Property.
The following table presents certain information relating to the historical occupancy of the Center Pointe Plaza I Property:
| Historical and Current Occupancy |
| 2020(1) | 2021(1) | Current(2) |
| 80.0% | 81.5% | 89.7% |
| (1) | Historical Occupancies are as of December 31 of each respective year. |
| (2) | Current Occupancy is as of August 1, 2022. |
THE INFORMATION IN THIS STRUCTURAL AND COLLATERAL TERM SHEET IS NOT COMPLETE AND MAY BE AMENDED PRIOR TO THE TIME OF SALE. THIS TERM SHEET IS NOT AN OFFER TO SELL THESE SECURITIES AND IT IS NOT A SOLICITATION OF AN OFFER TO BUY THESE SECURITIES IN ANY JURISDICTION WHERE THE OFFER OR SALE IS NOT PERMITTED. |
| | 88 | |
| Structural and Collateral Term Sheet | | BMO 2022-C3 |
| |
| No. 6 – Center Pointe Plaza I |
The following table presents certain information relating to the largest tenants based on underwritten base rent of the Center Pointe Plaza I Property:
| Top Tenant Summary(1) |
| Tenant | Ratings
Moody’s/S&P/Fitch(2) | Net Rentable Area (SF) | % of
Total NRA | UW Base Rent PSF(3) | UW Base Rent(3) | % of Total
UW Base Rent(3) | Sales PSF(4) | Occ. Costs | Lease
Exp. Date |
| Home Depot U.S.A., Inc.(5) | A2/A/A | 109,738 | 46.0 | % | $13.91 | $1,526,023 | 43.7 | % | $570 | 2.9% | 6/30/2031 |
| TJ Maxx(6) | A2/A/NR | 29,900 | 12.5 | | $17.75 | 530,725 | 15.2 | | $332 | 6.1% | 1/31/2033 |
| Ross Dress for Less(7) | A2/BBB+/NR | 22,000 | 9.2 | | $12.50 | 275,000 | 7.9 | | NAP | NAP | 1/31/2031 |
| Boot Barn(8) | NR/NR/NR | 14,715 | 6.2 | | $15.75 | 231,761 | 6.6 | | NAP | NAP | 2/29/2032 |
| Sai Farmer’s Market | NR/NR/NR | 13,500 | 5.7 | | $16.00 | 216,000 | 6.2 | | NAP | NAP | 7/31/2029 |
| Dollar Tree | Baa2/BBB/NR | 11,100 | 4.7 | | $13.35 | 148,185 | 4.2 | | NAP | NAP | 1/31/2031 |
| Major Tenants | | 200,953 | 84.3 | % | $14.57 | $2,927,694 | 83.8 | % | | | |
| Other Tenants(9) | | 12,851 | 5.4 | % | $44.15 | $567,320 | 16.2 | % | | | |
| Occupied Collateral Total / Wtd. Avg. | | 213,804 | 89.7 | % | $16.35 | $3,495,014 | 100.0 | % | | | |
| | | | | | | | | | |
| Vacant Space(10) | | 24,544 | 10.3 | % | | | | | | |
| | | | | | | | | | |
| Collateral Total | | 238,348 | 100.0 | % | | | | | | |
| | | | | | | | | | |
| (1) | Based on the underwritten rent roll dated August 1, 2022. |
| (2) | In certain instances, ratings provided are those of the parent company of the entity shown, whether or not the parent company guarantees the lease. |
| (3) | UW Base Rent PSF, UW Base Rent and % of Total UW Base Rent include straight line rent of $43,831. |
| (4) | Sales PSF are as of the trailing 12-month period ending December 31, 2021 as provided by the borrower. |
| (5) | Home Depot has four, five-year renewal options remaining. |
| (6) | TJ Maxx has two, five-year renewal options remaining. |
| (7) | Ross Dress for Less has four, five-year renewal options remaining. |
| (8) | Boot Barn may terminate its lease with 180 days’ notice if sales during year 5 (March 2026 through February 2027) are $2.1 million or less with a 180 days’ notice period. Boot Barn has three, five-year renewal options remaining. |
| (9) | Other Tenants includes Cheddar’s Casual Café, which operates under an approximate 11-year ground lease with a lease expiration date of February 28, 2033. Cheddar’s Casual Café is not included in Net Rentable Area (SF) and % of Total NRA but the U/W Base Rent of $210,000 is included. The borrower sponsor deposited $78,912 for rent concession reserve and $110,250 for leasing commission reserve for Cheddar’s Casual Café. The % of Total UW Base Rent, UW Base Rent and UW Base Rent PSF for Other Tenants Total include the UW Base Rent associated with the Cheddar’s Casual Café pad site. |
| (10) | Vacant Space includes one temporary tenant being underwritten as vacant: Spirit Halloween has been a tenant at the Center Pointe Plaza I Property since August 2022 under an approximate four-month lease expiring November 2022. Spirit Halloween currently occupies 7,997 square feet at the Center Pointe Plaza I Property. |
THE INFORMATION IN THIS STRUCTURAL AND COLLATERAL TERM SHEET IS NOT COMPLETE AND MAY BE AMENDED PRIOR TO THE TIME OF SALE. THIS TERM SHEET IS NOT AN OFFER TO SELL THESE SECURITIES AND IT IS NOT A SOLICITATION OF AN OFFER TO BUY THESE SECURITIES IN ANY JURISDICTION WHERE THE OFFER OR SALE IS NOT PERMITTED. |
| | 89 | |
| Structural and Collateral Term Sheet | | BMO 2022-C3 |
| |
| No. 6 – Center Pointe Plaza I |
The following table presents certain information relating to the tenant lease expirations at the Center Pointe Plaza I Property:
| Lease Rollover Schedule(1)(2) |
| Year | Number of Leases Expiring | Net Rentable Area Expiring | % of NRA Expiring | UW Base Rent Expiring(3) | % of UW Base Rent Expiring(3) | Cumulative Net Rentable Area Expiring | Cumulative % of NRA Expiring | Cumulative UW Base Rent Expiring(3) | Cumulative % of UW Base Rent Expiring(3) |
| Vacant(4) | NAP | 24,544 | 10.3 | % | NAP | NA | P | 24,544 | 10.3% | NAP | NA | P |
| 2022 & MTM | 0 | 0 | 0.0 | | $0 | 0.0 | % | 24,544 | 10.3% | $0 | 0.0 | % |
| 2023 | 0 | 0 | 0.0 | | 0 | 0.0 | | 24,544 | 10.3% | $0 | 0.0 | % |
| 2024 | 0 | 0 | 0.0 | | 0 | 0.0 | | 24,544 | 10.3% | $0 | 0.0 | % |
| 2025 | 0 | 0 | 0.0 | | 0 | 0.0 | | 24,544 | 10.3% | $0 | 0.0 | % |
| 2026 | 0 | 0 | 0.0 | | 0 | 0.0 | | 24,544 | 10.3% | $0 | 0.0 | % |
| 2027 | 2 | 10,100 | 4.2 | | 302,320 | 8.7 | | 34,644 | 14.5% | $302,320 | 8.7 | % |
| 2028 | 0 | 0 | 0.0 | | 0 | 0.0 | | 34,644 | 14.5% | $302,320 | 8.7 | % |
| 2029 | 1 | 13,500 | 5.7 | | 216,000 | 6.2 | | 48,144 | 20.2% | $518,320 | 14.8 | % |
| 2030 | 0 | 0 | 0.0 | | 0 | 0.0 | | 48,144 | 20.2% | $518,320 | 14.8 | % |
| 2031 | 3 | 142,838 | 59.9 | | 1,949,208 | 55.8 | | 190,982 | 80.1% | $2,467,528 | 70.6 | % |
| 2032 & Beyond | 4 | 47,366 | 19.9 | | 1,027,486 | 29.4 | | 238,348 | 100.0% | $3,495,014 | 100.0 | % |
| Total | 10 | 238,348 | 100.0 | % | $3,495,014 | 100.0 | % | | | | |
| (1) | Based on the underwritten rent roll dated August 1, 2022. |
| (2) | Certain leases may have termination options that are exercisable prior to the originally stated expiration date of the lease and that are not considered in this Lease Rollover Schedule. |
| (3) | UW Base Rent Expiring, % of UW Base Rent Expiring, Cumulative UW Base Rent Expiring and Cumulative % of UW Base Rent Expiring includes straight line rent of $43,831. |
| (4) | Vacant space includes one temporary tenant being underwritten as vacant: Spirit Halloween has been a tenant at the Center Pointe Plaza I Property since August 2022 under an initial approximate four-month lease expiring November 2022. Spirit Halloween currently occupies 7,997 square feet at the Center Pointe Plaza I Property. |
The following table presents certain information relating to the underwritten cash flows of the Center Pointe Plaza I Property:
| Operating History and Underwriting Net Cash Flow |
| | 2020 | 2021 | TTM(1) | Underwritten | Per Square Foot | %(2) |
| Rents in Place | $3,401,248 | $3,236,853 | $3,116,290 | $3,495,014 | $14.66 | 75.4 | % |
| Vacant Income | 0 | 0 | 0 | 449,236 | $1.88 | 9.7 | |
| Straight Line Rent | 0 | 0 | 0 | 43,831 | $0.18 | 0.9 | |
| Gross Potential Rent | $3,401,248 | $3,236,853 | $3,116,290 | $3,988,082 | $16.73 | 86.0 | % |
| Total Reimbursements | 429,461 | 488,861 | 451,629 | 597,156 | $2.51 | 12.9 | |
| Other Income(3) | 0 | 2,771 | 2,771 | 52,771 | $0.22 | 1.1 | |
| Net Rental Income | $3,830,709 | $3,728,485 | $3,570,690 | $4,638,009 | $19.46 | 100.0 | % |
| (Vacancy/Credit Loss)(4) | 0 | 0 | 0 | (493,790) | ($2.07) | (10.6 | ) |
| Effective Gross Income | $3,830,709 | $3,728,485 | $3,570,690 | $4,144,219 | $17.39 | 89.4 | % |
| Total Expenses | 864,724 | 874,289 | 833,380 | 786,260 | $3.30 | 19.0 | |
| Net Operating Income | $2,965,985 | $2,854,196 | $2,737,310 | $3,357,960 | $14.09 | 81.0 | % |
| Capital Expenditures | 0 | 0 | 0 | 35,752 | $0.15 | 0.9 | |
| TI/LC | 0 | 0 | 0 | 71,504 | $0.30 | 1.7 | |
| Net Cash Flow | $2,965,985 | $2,854,196 | $2,737,310 | $3,250,703 | $13.64 | 78.4 | % |
| (1) | TTM reflects the trailing 12-month period ending June 30, 2022. |
| (2) | % column represents percent of Net Rental Income for all revenue lines and represents percent of Effective Gross Income for the remainder of fields. |
| (3) | Other Income is underwritten to the trailing-12 actual and includes $50,000 in gross rent for Spirit Halloween, which is a temporary tenant. |
| (4) | The underwritten economic vacancy is 10.8%. The Center Pointe Plaza I Property was 89.7% physically occupied as of August 1, 2022. |
THE INFORMATION IN THIS STRUCTURAL AND COLLATERAL TERM SHEET IS NOT COMPLETE AND MAY BE AMENDED PRIOR TO THE TIME OF SALE. THIS TERM SHEET IS NOT AN OFFER TO SELL THESE SECURITIES AND IT IS NOT A SOLICITATION OF AN OFFER TO BUY THESE SECURITIES IN ANY JURISDICTION WHERE THE OFFER OR SALE IS NOT PERMITTED. |
| | 90 | |
| Structural and Collateral Term Sheet | | BMO 2022-C3 |
| |
| No. 6 – Center Pointe Plaza I |
The Market. The Center Pointe Plaza I Property is located in Newark, Delaware, within the Philadelphia metropolitan statistical area (the “Philadelphia MSA”) in New Castle County, Delaware. The Philadelphia MSA economy is driven by the trade, transportation and utilities, professional and business services, education and health services, government and leisure and hospitality sectors. As of 2021, the Philadelphia MSA was home to 13 Fortune 500 companies, including but not limited to AmerisourceBergen, Comcast Corporation, DuPont, Lincoln National Corporation and Corteva. Other major employers within the Philadelphia MSA include Aramark, Crown Holdings, Universal Health Services, Campbell Soup Company and Toll Brothers.
The Center Pointe Plaza I Property is located approximately five miles east of downtown Newark and the University of Delaware. Primary access to the Center Pointe Plaza I Property is provided by State Route 4, State Route 7, State Route 58 and Interstate 95 (“I-95”). State Route 4 provides access from the North and provides access to the Atlantic City Expressway West which connects to I-95, leading to Atlantic City to the Southeast. State Route 7 provides access from the south and provides access to Dover, Delaware to the South. State Route 58 provides access from the East and provides access to Wilmington, Delaware to the Northeast. I-95 provides access from the Northwest and Northeast and provides access to Philadelphia, Pennsylvania and Trenton, New Jersey to the Northeast and Baltimore Maryland and Washington D.C. to the Southwest. The neighborhood surrounding the Center Pointe Plaza I Property is mainly comprised of commercial development. According to the appraisal, the estimated 2022 population within a one-, three- and five-mile radius of the Center Pointe Plaza I Property was 792, 72,397 and 210,283, respectively. Additionally, for the same period, the average household income within the same radii was $112,200, $96,788 and $103,056, respectively.
According to the appraisal, the Center Pointe Plaza I Property is located within the Philadelphia retail market and the South New Castle County retail submarket. As of the second quarter 2022, the Philadelphia retail market contained approximately 334.5 million square feet of retail space inventory with a vacancy rate of 4.6% and an average asking rental rate of $21.11 per square foot. As of the second quarter 2022, the Philadelphia retail market reported net negative completions of 26,551 square feet and positive net absorption of 577,350 square feet. The South New Castle County retail submarket contained approximately 17.6 million square feet of retail space with a vacancy rate of 6.4% and an average asking rental rate of $24.38 per square foot as of second quarter 2022. The South New Castle County retail submarket reported no square feet completed and positive net absorption of 68,511 square feet.
THE INFORMATION IN THIS STRUCTURAL AND COLLATERAL TERM SHEET IS NOT COMPLETE AND MAY BE AMENDED PRIOR TO THE TIME OF SALE. THIS TERM SHEET IS NOT AN OFFER TO SELL THESE SECURITIES AND IT IS NOT A SOLICITATION OF AN OFFER TO BUY THESE SECURITIES IN ANY JURISDICTION WHERE THE OFFER OR SALE IS NOT PERMITTED. |
| | 91 | |
| Structural and Collateral Term Sheet | | BMO 2022-C3 |
| |
| No. 6 – Center Pointe Plaza I |
The following table presents certain information relating to comparable retail rentals to the Center Pointe Plaza I Property:
| Comparable Retail Rental Summary(1) |
| Property Name/Location | Year Built/Renovated | NRA (SF) | Tenant | Lease Size (SF) | Rent PSF | Commencement | Lease Term (Years) | Lease Type |
Center Pointe Plaza I 1301-1325 Churchmans Road Newark, DE | 1997/NAP | 238,348(2) | Various(2) | Various(2) | $16.35(2) | Various(2) | Various(2) | Various |
| Anchor Tenants | | | | | | | | |
9900 SE Washington Street Portland, OR | NAP | NAP | Home Depot (renewal) | 134,722 | $16.08 | 2022 | 5.0 | NNN |
2600 41st Avenue Soquel, CA | NAP | NAP | Home Depot (renewal) | 96,800 | $26.00 | 2022 | 10.0 | NNN |
493 North Milwaukee Avenue Vernon Hills, IL | NAP | NAP | Home Depot (renewal) | 113,963 | $7.51 | 2019 | 5.0 | NNN |
8210-8282 Park Lane Dallas, TX | NAP | NAP | Costco | 152,035 | $8.88 | 2019 | 20.0 | NNN |
| Junior Anchor Tenants | | | | | | | | |
Eden Square SC Bear, DE | NAP | NAP | Giant LA Fitness | 64,885 34,010 | $16.24 $20.00 | 2024 2018 | 5.0 15.0 | NNN NNN |
1851 Deptford Center Road Deptford, NJ | NAP | NAP | Best Buy | 60,750 | $16.25 | 2022 | 10.0 | NNN |
East Gate Square Moorestown, NJ | NAP | NAP | Best Buy | 46,812 | $15.50 | 2021 | 8.0 | NNN |
Christiana Town Center Christiana, DE | NAP | NAP | Aldi | 20,055 | $18.00 | 2021 | 10.0 | NNN |
Center Pointe Plaza I (Not Collateral) Newark, DE | NAP | NAP | Golf Galaxy (renewal) | 15,000 | $20.00 | 2020 | 5.0 | NNN |
The Shoppes at Garden State Park Cherry Hill, NJ | NAP | NAP | Home Goods | 24,000 | $22.50 | 2020 | 10.0 | NNN |
| In-Line Tenants | | | | | | | | |
2201 Silverside Road Wilmington, DE | NAP | NAP | Confidential | 1,600 | $21.50 | 2022 | 3.0 | NNN |
Bronmar Plaza Wilmington, DE | NAP | NAP | Great Clips | 2,000 | $21.00 | 2021 | 5.0 | NNN |
Prices Corner Wilmington, DE | NAP | NAP | Tropical Smoothie Two Claws | 1,750 6,798 | $24.50 $21.00 | 2021 2021 | 10.3 10.8 | NNN NNN |
Fairfax Shopping Center Wilmington, DE | NAP | NAP | Go Health Urgent Care | 3,000 | $24.50 | 2020 | 10.0 | NNN |
Eden Square Shopping Center Bear, DE | NAP | NAP | Golden Dragon Restaurant (renewal) Capriotti’s (renewal) | 1,600 1,600 | $22.00 $19.95 | 2020 2019 | 5.0 3.0 | NNN NNN |
Newtown Square Bear, DE | NAP | NAP | Family Dentistry | 3,463 | $20.00 | 2018 | 5.0 | NNN |
| Pad Rentals | | | | | | | | |
Towamencin Shopping Village Lansdale, PA | NAP | NAP | Chipotle Mattress Warehouse | 2,380 4,000 | $50.42 $30.50 | 2022 2022 | 10.0 10.0 | NNN NNN |
Collegetown Shopping Center Glassboro, NJ | NAP | NAP | Chase Bank | 3,743 | $36.07 | 2021 | 15.0 | NNN |
Eden Square SC Bear, DE | NAP | NAP | Starbucks PNC Bank | 2,500 4,324 | $38.00 $21.51 | 2021 2019 | 10.0 5.0 | NNN NNN |
Newark Shopping Center Newark, DE | NAP | NAP | Chase Bank | 4,200 | $35.71 | 2020 | 15.0 | NNN |
The Shoppes at Brinton Lake Glen Mills, PA | NAP | NAP | White Dog Café | 6,359 | $36.00 | 2020 | 10.0 | NNN |
10 South Dupont Highway Dover, DE | NAP | NAP | Red Robin | 5,231 | $26.76 | 2019 | 20.0 | NNN |
| (2) | Based on the underwritten rent roll dated August 1, 2022. |
THE INFORMATION IN THIS STRUCTURAL AND COLLATERAL TERM SHEET IS NOT COMPLETE AND MAY BE AMENDED PRIOR TO THE TIME OF SALE. THIS TERM SHEET IS NOT AN OFFER TO SELL THESE SECURITIES AND IT IS NOT A SOLICITATION OF AN OFFER TO BUY THESE SECURITIES IN ANY JURISDICTION WHERE THE OFFER OR SALE IS NOT PERMITTED. |
| | 92 | |
| Structural and Collateral Term Sheet | | BMO 2022-C3 |
| |
| No. 6 – Center Pointe Plaza I |
The following table presents certain information relating to comparable retail center sales for the Center Pointe Plaza I Property:
| Comparable Sales(1) |
| Property Name/Location | Sale Date | Total NRA (SF) | Total Occupancy | Sale Price | Sale Price PSF | Adjusted Sales Price PSF |
Center Pointe Plaza I 1301-1325 Churchmans Road Newark, DE | NAP | 238,348(2) | 89.7%(2) | NAP | NAP | NAP |
North Dover Shopping Center 1001 North Dupont Highway Dover, DE | May-2022 | 191,973 | 97.0% | $28,750,000 | $149.76 | $149,76 |
Langhorne Plaza 1501 E Lincoln Highway Levittown, PA | Dec-2021 | 107,693 | 100.0% | $23,450,000 | $217.75 | $217.75 |
Warrington Plaza Shopping Center 644 Easton Road Warrington, PA | Dec-2021 | 87,581 | 100.0% | $22,500,000 | $256.91 | $256.91 |
Lawnside Commons 310 North White Horse Pike Lawnside, NJ | Mar-2020 | 151,076 | 100.0% | $31,550,000 | $208.84 | $208.84 |
Columbus Crossing 1851 South Columbus Boulevard Philadelphia, PA | Jul-2020 | 140,418 | 100.0% | $37,450,000 | $266.70 | $266.70 |
| (2) | Based on the underwritten rent roll dated August 1, 2022. |
The Borrower. The borrowing entity for the Center Pointe Plaza I Loan is Centercap Holding LLC, a single purpose entity with one independent director. Legal counsel to the Center Pointe Plaza I borrower delivered a non-consolidation opinion in connection with the origination of the Center Pointe Plaza I Mortgage Loan.
The Borrower Sponsor. The borrower sponsor and non-recourse carveout guarantor is Joanne M. Capano. Joanne M. Capano is the principal of JMC Properties, Inc., a privately held commercial real estate firm based in Wilmington, Delaware.
Property Management. The Center Pointe Plaza I Property is managed by JMC Property Management, Inc., an affiliate of the Center Pointe Plaza I borrower.
Escrows and Reserves. At origination, the Center Pointe Plaza I borrower was required to deposit into escrow approximately $38,006.86 for tax reserves, $41,369.16 for insurance reserves, $26,777.50 for immediate repairs, $250,000 for TI/LC obligation reserves, $367,850 for a tenant improvement reserve for Boot Barn, $110,250 for a leasing commission reserve for Cheddars Casual Café and $78,912 for a rent concession reserve for Cheddars Casual Café.
Tax Escrows – On a monthly basis, the Center Pointe Plaza I borrower is required to escrow 1/12th of the annual estimated tax payments, which currently equates to approximately $36,197.
Insurance Escrows – On a monthly basis, the Center Pointe Plaza I borrower is required to escrow 1/12th of the estimated insurance payments, which currently equates to approximately $3,940.
Replacement Reserves – On a monthly basis, the Center Pointe Plaza I borrower is required to escrow approximately $2,979 for replacement reserves.
TI/LC Reserves – On a monthly basis, the Center Pointe Plaza I borrower is required to escrow approximately $5,959 for tenant improvement and leasing commissions reserves, capped at $500,000. In addition, the borrower is required to deposit in the TI/LC reserve any amounts paid to the borrower in connection with a termination, cancellation, surrender, modification, sale or other disposition of any lease (or portion of the lease) other than amounts paid for rent and other charges in respect of periods prior to the date of such termination, cancellation, surrender, modification, sale or other disposition.
Lockbox / Cash Management. The Center Pointe Plaza I Mortgage Loan is structured with a springing lockbox and springing cash management. Upon the occurrence and continuance of a Cash Management Trigger Event (as defined below), (i) the Center Pointe Plaza I borrower is required to (A) establish a lender-controlled lockbox account and, within
THE INFORMATION IN THIS STRUCTURAL AND COLLATERAL TERM SHEET IS NOT COMPLETE AND MAY BE AMENDED PRIOR TO THE TIME OF SALE. THIS TERM SHEET IS NOT AN OFFER TO SELL THESE SECURITIES AND IT IS NOT A SOLICITATION OF AN OFFER TO BUY THESE SECURITIES IN ANY JURISDICTION WHERE THE OFFER OR SALE IS NOT PERMITTED. |
| | 93 | |
| Structural and Collateral Term Sheet | | BMO 2022-C3 |
| |
| No. 6 – Center Pointe Plaza I |
five calendar days of the Cash Management Trigger Event, (B) instruct all tenants to deposit rents into such lockbox account, (ii) with respect to any other amounts collected, the Center Pointe Plaza I borrower or the property manager is required to deposit any such amounts received into the lockbox account within one business day of receipt. Pursuant to the Center Pointe Plaza I Mortgage Loan documents, all excess funds on deposit in the cash management account (after payment of monthly amounts due under the Center Pointe Plaza I Mortgage Loan documents) are required to be applied as follows (a) if a Cash Sweep Event (as defined below) is not in effect, to the Center Pointe Plaza I borrower; and (b) if a Cash Sweep Event is in effect, to an excess cash flow account controlled by the lender, to be held by the lender as additional security for the Center Pointe Plaza I Mortgage Loan (except if a Critical Tenant Trigger Event exists, in which case sums will be deposited into a Critical Tenant reserve).
A “Cash Management Trigger Event” means the occurrence of (i) an event of default, (ii) a bankruptcy action of the Center Pointe Plaza I borrower, guarantor or property manager, (iii) a Cash Management DSCR Trigger Event (as defined below) or (iv) a Critical Tenant Trigger Event (as defined below). A Cash Management Trigger Event will end (a) with respect to the matters describe in clause (i) above, when a cure of such event of default has been accepted, or the event of default has been waived by the lender, (b) with respect to the matters described in clause (ii) above, when such bankruptcy action petition has been discharged, stayed, or dismissed within 60 days of such filing among other conditions with respect to the Center Pointe Plaza I borrower or guarantor and within 120 days with respect to the property manager or in the case of the property manager, the Center Pointe Plaza I borrower has replaced the property manager with a qualified manager acceptable to the lender, (c) with respect to matters described in clause (iii) above, the date the debt service coverage ratio based on the trailing 12-month period immediately preceding the date of such determination is greater than 1.25x for two consecutive quarters and (d) with respect to matters described in clause (iv) above, the date on which the Critical Tenant Trigger Event Cure (as defined below) occurs.
A “Cash Management DSCR Trigger Event” will occur on any date where the debt service coverage ratio, based on the trailing 12-month period immediately preceding the date of determination, is less than 1.20x.
A “Cash Sweep Event” means the occurrence of (i) an event of default, (ii) a bankruptcy action of the Center Pointe Plaza I borrower, guarantor or property manager, (iii) a Cash Sweep DSCR Trigger Event (as defined below) or (iv) a Critical Tenant Trigger Event. A Cash Sweep Event will end (a) with respect to the matters describe in clause (i) above, when the cure of such event of default has been accepted, or the event of default has been waived by the lender, (b) with respect to the matters describe in clause (ii) above, when such bankruptcy action petition has been discharged, stayed, or dismissed within 60 days of such filing among other conditions with respect to the Center Pointe Plaza I borrower or guarantor, or within 120 days with respect to the property manager or in the case of the property manager, the Center Pointe Plaza I borrower have replaced the property manager with a qualified manager acceptable to the lender, or with respect to matters described in clause (iii) above, the date the debt service coverage ratio based on the trailing 12-month period immediately preceding the date of such determination is greater than 1.20x for two consecutive quarters and (d) with respect to matters described in clause (iv) above, the date on which the Critical Tenant Trigger Event Cure occurs.
A “Cash Sweep DSCR Trigger Event” will occur on any date where the debt service coverage ratio, based on the trailing 12-month period immediately preceding the date of determination, is less than 1.15x.
A “Critical Tenant Trigger Event” will occur (i) if Home Depot, TJ Maxx or any other tenant occupying the spaces currently occupied by such tenants (each such tenant, a “Critical Tenant” and each related lease, a “Critical Tenant Lease”) gives notice of its intention to not extend or renew its lease or to terminate its lease or the applicable Critical Tenant Lease is otherwise terminated, (ii) on the date that is twelve months prior to the related lease expiration date if the Critical Tenant has failed to give notice of its election to renew its lease, (iii) on or prior to the date on which the Critical Tenant is required under its lease to notify the Center Pointe Plaza I borrower of its election to renew its lease, and the Critical Tenant fails to give such notice, (iv) an event of default under the Critical Tenant Lease occurs or is continuing, (v) if a bankruptcy action with respect to the Critical Tenant or guarantor of any Critical Tenant occurs, (vi) if the Critical Tenant elects to pay reduced rent (including, without limitation, percentage rent in lieu of fixed rent) pursuant to any right or remedy contained in the applicable Critical Tenant Lease, or (vii) if the Critical Tenant discontinues its normal business operations at its leased premises (other than a temporary cessation of business operations for permitted renovations or necessary repairs).
A “Critical Tenant Trigger Event Cure” will occur upon (a) with respect to clause (i), (ii) or (iii) the date that (1) the Critical Tenant Lease extension is executed and delivered to the lender by the borrower and the related tenant improvement costs, leasing commissions and other material costs and expenses have been satisfied or an amount sufficient to cover any costs
THE INFORMATION IN THIS STRUCTURAL AND COLLATERAL TERM SHEET IS NOT COMPLETE AND MAY BE AMENDED PRIOR TO THE TIME OF SALE. THIS TERM SHEET IS NOT AN OFFER TO SELL THESE SECURITIES AND IT IS NOT A SOLICITATION OF AN OFFER TO BUY THESE SECURITIES IN ANY JURISDICTION WHERE THE OFFER OR SALE IS NOT PERMITTED. |
| | 94 | |
| Structural and Collateral Term Sheet | | BMO 2022-C3 |
| |
| No. 6 – Center Pointe Plaza I |
and expenses as reasonably determined by the lender has been deposited into the Critical Tenant TI/LC account, or (2) a Critical Tenant Space Re-Tenanting Event (as defined below) has occurred, (b) with respect to clause (iv) above, after a cure of the applicable event of default, (c) with respect to clause (v) above, after an affirmation that the Critical Tenant is actually paying all rents and other amounts under the lease, (d) with respect to clause (vi) above, the related Critical Tenant re-commences the payment of full unabated rent, (e) with respect to clause (vii) above, the related Critical Tenant re-commences its normal business operations at its leased premises or a Critical Tenant Space Re-tenanting Event has occurred.
A “Critical Tenant Space Re-Tenanting Event” will occur on the date each of the following conditions has been satisfied: (i) the related Critical Tenant space is leased to one or more replacement tenants for a term of at least five years and on terms and conditions that are acceptable to the lender; (ii) all tenant improvement costs, leasing commissions and other material costs and expenses relating to the re-letting of the related Critical Tenant Space have been paid in full; and (iii) the replacement tenant(s) are conducting normal business operations at the related Critical Tenant space.
Subordinate Debt. None.
Mezzanine Debt. None.
Partial Release. Not permitted.
Ground Lease. None.
THE INFORMATION IN THIS STRUCTURAL AND COLLATERAL TERM SHEET IS NOT COMPLETE AND MAY BE AMENDED PRIOR TO THE TIME OF SALE. THIS TERM SHEET IS NOT AN OFFER TO SELL THESE SECURITIES AND IT IS NOT A SOLICITATION OF AN OFFER TO BUY THESE SECURITIES IN ANY JURISDICTION WHERE THE OFFER OR SALE IS NOT PERMITTED. |
| | 95 | |
| Structural and Collateral Term Sheet | | BMO 2022-C3 |
| |
| No. 7 – Bayou City Portfolio |
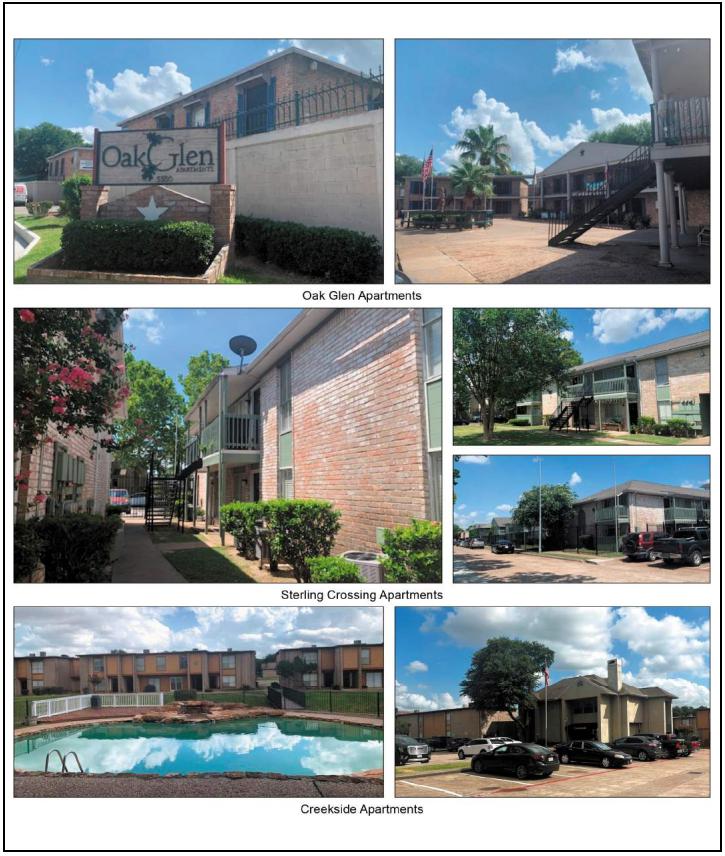
THE INFORMATION IN THIS STRUCTURAL AND COLLATERAL TERM SHEET IS NOT COMPLETE AND MAY BE AMENDED PRIOR TO THE TIME OF SALE. THIS TERM SHEET IS NOT AN OFFER TO SELL THESE SECURITIES AND IT IS NOT A SOLICITATION OF AN OFFER TO BUY THESE SECURITIES IN ANY JURISDICTION WHERE THE OFFER OR SALE IS NOT PERMITTED. |
| | 96 | |
| Structural and Collateral Term Sheet | | BMO 2022-C3 |
| |
| No. 7 – Bayou City Portfolio |
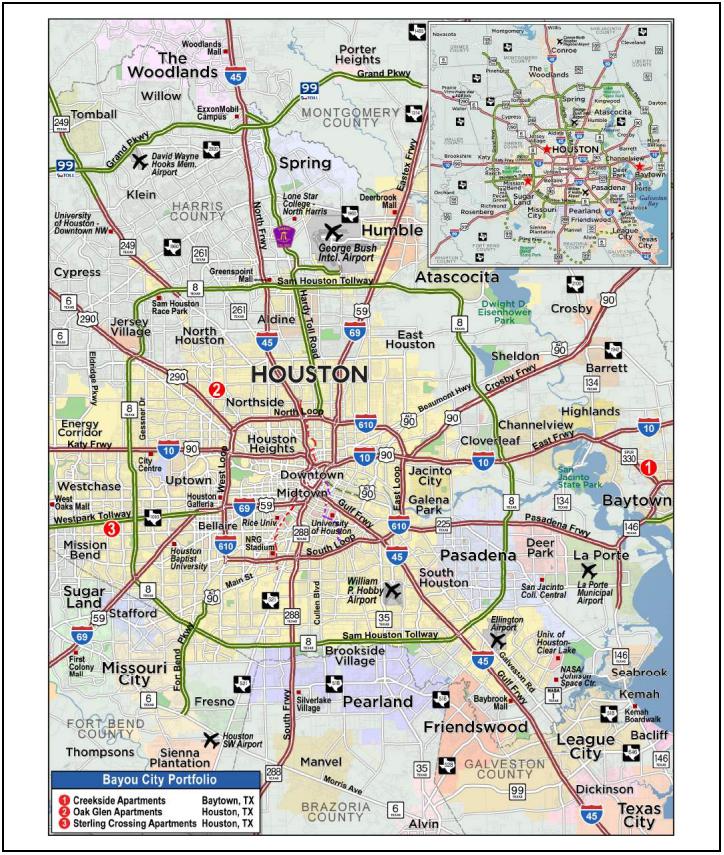
THE INFORMATION IN THIS STRUCTURAL AND COLLATERAL TERM SHEET IS NOT COMPLETE AND MAY BE AMENDED PRIOR TO THE TIME OF SALE. THIS TERM SHEET IS NOT AN OFFER TO SELL THESE SECURITIES AND IT IS NOT A SOLICITATION OF AN OFFER TO BUY THESE SECURITIES IN ANY JURISDICTION WHERE THE OFFER OR SALE IS NOT PERMITTED. |
| | 97 | |
| Structural and Collateral Term Sheet | | BMO 2022-C3 |
| |
| No. 7 – Bayou City Portfolio |
| Mortgage Loan Information | | Property Information |
| Mortgage Loan Seller: | SMC | | Single Asset / Portfolio: | Portfolio |
| Original Principal Balance: | $32,250,000 | | Title: | Fee |
| Cut-off Date Principal Balance: | $32,191,295 | | Property Type – Subtype: | Multifamily – Garden |
| % of IPB: | 4.4% | | Net Rentable Area (Units): | 633 |
| Loan Purpose: | Refinance | | Location: | Various, TX |
| Borrowers: | APTOG, LLC, APTSC, LLC and APTCS, LLC | | Year Built / Renovated: | Various / Various |
| Borrower Sponsor: | Gary W. Gates, Jr. | | Occupancy: | 97.2% |
| Interest Rate: | 6.02000% | | Occupancy Date: | 7/11/2022 |
| Note Date: | 7/21/2022 | | 4th Most Recent NOI (As of): | $2,991,757 (12/31/2019) |
| Maturity Date: | 8/6/2032 | | 3rd Most Recent NOI (As of): | $2,955,769 (12/31/2020) |
| Interest-only Period: | None | | 2nd Most Recent NOI (As of): | $3,079,257 (12/31/2021) |
| Original Term: | 120 months | | Most Recent NOI (As of): | $3,135,051 (TTM 5/31/2022) |
| Original Amortization Term: | 360 months | | UW Economic Occupancy: | 91.6% |
| Amortization Type: | Amortizing Balloon | | UW Revenues: | $5,450,459 |
| Call Protection: | L(24),YM1(92),O(4) | | UW Expenses: | $2,480,066 |
| Lockbox / Cash Management: | Springing | | UW NOI: | $2,970,393 |
| Additional Debt: | No | | UW NCF: | $2,810,921 |
| Additional Debt Balance: | N/A | | Appraised Value / Per Unit: | $58,300,000 / $92,101 |
| Additional Debt Type: | N/A | | Appraisal Date: | 6/17/2022 |
| | | | | |
| | | | | |
| Escrows and Reserves(1) | | Financial Information |
| | Initial | Monthly | Initial Cap | | Cut-off Date Loan / Unit: | $50,855 | |
| Taxes: | $355,900 | $44,488 | N/A | | Maturity Date Loan / Unit: | $43,239 | |
| Insurance: | $109,993 | $20,845 | N/A | | Cut-off Date LTV(2): | 50.9% | |
| Replacement Reserve: | $0 | $13,293 | N/A | | Maturity Date LTV(2): | 42.7% | |
| Economic Holdback(2): | $2,500,000 | $0 | N/A | | UW NCF DSCR: | 1.21x | |
| Deferred Maintenance: | $122,375 | $0 | N/A | | UW NOI Debt Yield(2): | 10.0% | |
| | | | | | | |
| Sources and Uses |
| Sources | Proceeds | % of Total | | Uses | Proceeds | % of Total | |
| Mortgage Loan | $32,250,000 | 100.0% | | Loan Payoff | $19,012,170 | 59.0 | % |
| | | | | Return of Equity | 8,843,247 | 27.4 | |
| | | | | Reserves | 3,088,268 | 9.6 | |
| | | | | Closing Costs | 1,306,315 | 4.1 | |
| Total Sources | $32,250,000 | 100.0% | | Total Uses | $32,250,000 | 100.0 | % |
| | | | | | |
| (1) | For a full description of Escrows and Reserves, see “Escrows and Reserves” below. |
| (2) | At origination of the Bayou City Portfolio Mortgage Loan (as defined below), the borrowers deposited $2,500,000 into an economic holdback reserve, to be released to the borrower upon the net operating income debt yield at the Bayou City Portfolio Properties (as defined below) being at least 9.8% based on a trailing 12-month period. Notwithstanding the foregoing, no disbursement from the economic holdback reserve is permitted prior to the payment date in June 2023. Cut-off Date LTV, Maturity Date LTV and UW NOI Debt Yield calculations are based on an assumed Bayou City Portfolio Mortgage Loan Cut-off Date Balance of approximately $29,691,295, which is net of the $2,500,000 economic holdback reserve. Assuming the gross Bayou City Portfolio Mortgage Loan Cut-off Date Balance of approximately $32,191,295, the Cut-off Date LTV, Maturity Date LTV and UW NOI Debt Yield calculations are 55.2%, 46.9% and 9.2%, respectively. |
The Loan. The Bayou City Portfolio mortgage loan has an outstanding principal balance as of the Cut-off Date of $32,191,295 (the “Bayou City Portfolio Mortgage Loan”) and is secured by a first lien mortgage on the borrowers’ fee interest in three garden-style multifamily properties located in Baytown and Houston, Texas (the “Bayou City Portfolio Properties”). The Bayou City Portfolio Mortgage Loan has a 10-year term and amortizes on a 30-year schedule.
THE INFORMATION IN THIS STRUCTURAL AND COLLATERAL TERM SHEET IS NOT COMPLETE AND MAY BE AMENDED PRIOR TO THE TIME OF SALE. THIS TERM SHEET IS NOT AN OFFER TO SELL THESE SECURITIES AND IT IS NOT A SOLICITATION OF AN OFFER TO BUY THESE SECURITIES IN ANY JURISDICTION WHERE THE OFFER OR SALE IS NOT PERMITTED. |
| | 98 | |
| Structural and Collateral Term Sheet | | BMO 2022-C3 |
| |
| No. 7 – Bayou City Portfolio |
The Properties. The Bayou City Portfolio Properties are comprised of three garden-style multifamily properties built between 1974 and 1978, and subsequently renovated between 2017 and 2019.
The following table presents certain information relating to the Bayou City Portfolio Properties:
| Portfolio Summary |
| Property Name | Year Built / Renovated | Units | Occupancy % | Allocated
Cut-off Date Loan Amount (“ALA”)(1) | % of ALA | Appraised Value | % of Appraised Value | UW NOI | % of UW NOI |
| Creekside Apartments | 1978 / 2017 | 250 | 94.8% | $13,307,208 | | 41.3 | % | $24,100,000 | | 41.3 | % | $1,215,404 | | 40.9 | % |
| Oak Glen Apartments | 1974 / 2017-2019 | 240 | 99.6% | 10,932,893 | | 34.0 | | 19,800,000 | | 34.0 | | 998,598 | | 33.6 | |
| Sterling Crossing Apartments | 1976 / 2018 | 143 | 97.2% | 7,951,195 | | 24.7 | | 14,400,000 | | 24.7 | | 756,390 | | 25.5 | |
| Total/Wtd. Avg. | | 633 | 97.2% | $32,191,295 | | 100.0 | % | $58,300,000 | | 100.0 | % | $2,970,393 | | 100.0 | % |
| (1) | The Bayou City Portfolio Mortgage Loan documents do not permit the release of any of the Bayou City Portfolio Properties. |
Creekside Apartments. As of July 11, 2022, the Creekside Apartments property was 94.8% occupied. The Creekside Apartments property is located at 3120 Decker Drive, approximately 24 miles east of downtown Houston. The 12.62-acre parcel is improved with 32 two-story apartment buildings and one leasing office. The improvements are masonry construction. The Creekside Apartments property features one-, two- and three-bedroom layouts ranging in size from 650 to 1,483 square feet. Market rents range from approximately $675 to $1,050 per month, with an average market rent of approximately $800 and an average unit size of 992 square feet. Unit features include high speed internet access, washer/dryer hookup, heating, smoke detectors, dishwasher, trash disposal and balcony. Community amenities include laundry facilities, surface parking lot and a pool.
The borrower sponsor acquired the Creekside Apartments property in 2012 for a purchase price of approximately $3.0 million. Since the acquisition, the borrower sponsor has invested approximately $4.975 million in capital improvements, which include unit upgrades, roof replacement, plumbing and electrical repairs, new HVAC units, exterior siding replacement, new appliances and ceramic tile.
| Creekside Apartments Unit Mix |
| Unit Type | Collateral Units(1) | % of Collateral Units(1) | Occupied Collateral Units(1) | % of Units Occupied(1) | Total Collateral SF(1) | Average Collateral SF(1) | Market Rent Per Unit(2) | Market Rent Per SF(2) | Average Rent Per Unit(1) | Average Rent Per SF(1) |
| 1 BR / 1 BA | 28 | 11.2 | % | 27 | 96.4% | 18,200 | 650 | $675 | $1.04 | $674 | $1.04 |
| 1 BR / 1 BA | 22 | 8.8 | | 21 | 95.5% | 15,400 | 700 | $690 | $0.99 | $700 | $1.00 |
| 1 BR / 1 BA | 8 | 3.2 | | 8 | 100.0% | 6,640 | 830 | $700 | $0.84 | $711 | $0.86 |
| 1 BR / 1 BA | 16 | 6.4 | | 15 | 93.8% | 13,648 | 853 | $700 | $0.82 | $698 | $0.82 |
| 2 BR / 1 BA | 22 | 8.8 | | 22 | 100.0% | 19,800 | 900 | $735 | $0.82 | $755 | $0.84 |
| 2 BR / 1 BA | 34 | 13.6 | | 32 | 94.1% | 31,076 | 914 | $735 | $0.80 | $755 | $0.83 |
| 2 BR / 2 BA | 16 | 6.4 | | 16 | 100.0% | 14,624 | 914 | $765 | $0.84 | $791 | $0.87 |
| 2 BR / 2 BA | 18 | 7.2 | | 18 | 100.0% | 16,452 | 914 | $765 | $0.84 | $767 | $0.84 |
| 2 BR / 2 BA | 11 | 4.4 | | 10 | 90.9% | 13,629 | 1,239 | $895 | $0.72 | $949 | $0.77 |
| 2 BR / 2.5 BA TH | 6 | 2.4 | | 5 | 83.3% | 7,452 | 1,242 | $915 | $0.74 | $924 | $0.74 |
| 2 BR / 2 BA | 20 | 8.0 | | 19 | 95.0% | 25,740 | 1,287 | $980 | $0.76 | $965 | $0.75 |
| 2 BR / 2.5 BA TH | 16 | 6.4 | | 14 | 87.5% | 20,800 | 1,300 | $905 | $0.70 | $928 | $0.71 |
| 3 BR / 2 BA | 23 | 9.2 | | 21 | 91.3% | 30,015 | 1,305 | $960 | $0.74 | $957 | $0.73 |
| 3 BR / 2.5 BA TH | 4 | 1.6 | | 4 | 100.0% | 5,728 | 1,432 | $1,050 | $0.73 | $1,009 | $0.70 |
| 3 BR / 2.5 BA TH | 6 | 2.4 | | 5 | 83.3% | 8,898 | 1,483 | $1,050 | $0.71 | $1,014 | $0.68 |
| Total/Wtd. Avg. | 250 | 100.0 | % | 237 | 94.8% | 248,102 | 992 | $800 | $0.81 | $806 | $0.81 |
| (1) | As provided by the borrowers as of July 11, 2022. |
THE INFORMATION IN THIS STRUCTURAL AND COLLATERAL TERM SHEET IS NOT COMPLETE AND MAY BE AMENDED PRIOR TO THE TIME OF SALE. THIS TERM SHEET IS NOT AN OFFER TO SELL THESE SECURITIES AND IT IS NOT A SOLICITATION OF AN OFFER TO BUY THESE SECURITIES IN ANY JURISDICTION WHERE THE OFFER OR SALE IS NOT PERMITTED. |
| | 99 | |
| Structural and Collateral Term Sheet | | BMO 2022-C3 |
| |
| No. 7 – Bayou City Portfolio |
Oak Glen Apartments. As of July 11, 2022, the Oak Glen Apartments property was 99.6% occupied. The Oak Glen Apartments property is located at 5500 Antoine Drive, approximately 12 miles northwest of downtown Houston. The 7.98-acre parcel is improved with 36 two-story apartment buildings and one two-story leasing office. The improvements are masonry construction. The Oak Glen Apartments property features efficiency, one-, two- and three-bedroom layouts ranging in size from 425 to 1,440 square feet. Market rents range from approximately $525 to $925 per month, with an average market rent of $701 and an average unit size of 868 square feet. Unit features include high speed internet access, washer/dryer hookup, heating, smoke detectors, dishwasher and trash disposal. Community amenities include laundry facilities, surface parking lot and a courtyard.
The borrower sponsor has owned the Oak Glen Apartments property for approximately 24 years. Since 2017, the borrower sponsor has invested approximately $1.3 million in capital improvements, which include unit upgrades, plumbing and electrical repairs, new HVAC units, exterior siding replacement, new appliances and ceramic tile.
| Oak Glen Apartments Unit Mix |
| Unit Type | Collateral Units(1) | % of Collateral Units(1) | Occupied Collateral Units(1) | % of Units Occupied(1) | Total Collateral SF(1) | Average Collateral SF(1) | Market Rent Per Unit(2) | Market Rent Per SF(2) | Average Rent Per Unit(1) | Average Rent Per SF(1) |
| Efficiency | 16 | 6.7 | % | 16 | 100.0% | 6,800 | 425 | $525 | $1.24 | $518 | $1.22 |
| Efficiency | 8 | 3.3 | | 8 | 100.0% | 3,904 | 488 | $530 | $1.09 | $524 | $1.07 |
| 1 BR / 1 BA | 16 | 6.7 | | 16 | 100.0% | 9,920 | 620 | $615 | $0.99 | $610 | $0.98 |
| 1 BR / 1 BA | 32 | 13.3 | | 32 | 100.0% | 20,480 | 640 | $615 | $0.96 | $609 | $0.95 |
| 1 BR / 1 BA | 4 | 1.7 | | 4 | 100.0% | 2,688 | 672 | $615 | $0.92 | $624 | $0.93 |
| 1 BR / 1 BA | 12 | 5.0 | | 12 | 100.0% | 8,640 | 720 | $615 | $0.85 | $615 | $0.85 |
| 1 BR / 1 BA TH | 4 | 1.7 | | 4 | 100.0% | 2,900 | 725 | $665 | $0.92 | $659 | $0.91 |
| 1 BR / 1 BA | 24 | 10.0 | | 24 | 100.0% | 17,664 | 736 | $620 | $0.84 | $615 | $0.84 |
| 1 BR / 1 BA | 4 | 1.7 | | 4 | 100.0% | 3,136 | 784 | $650 | $0.83 | $631 | $0.80 |
| 2 BR / 1 BA | 8 | 3.3 | | 8 | 100.0% | 6,720 | 840 | $705 | $0.84 | $668 | $0.80 |
| 2 BR / 1 BA | 8 | 3.3 | | 8 | 100.0% | 7,168 | 896 | $735 | $0.82 | $732 | $0.82 |
| 2 BR / 1 BA | 4 | 1.7 | | 4 | 100.0% | 3,840 | 960 | $745 | $0.78 | $755 | $0.79 |
| 2 BR / 2 BA | 4 | 1.7 | | 4 | 100.0% | 4,000 | 1,000 | $750 | $0.75 | $748 | $0.75 |
| 2 BR / 2 BA | 16 | 6.7 | | 16 | 100.0% | 16,320 | 1,020 | $750 | $0.74 | $757 | $0.74 |
| 2 BR / 2 BA | 12 | 5.0 | | 12 | 100.0% | 13,056 | 1,088 | $785 | $0.72 | $766 | $0.70 |
| 2 BR / 1.5 BA TH | 44 | 18.3 | | 44 | 100.0% | 50,688 | 1,152 | $810 | $0.70 | $804 | $0.70 |
| 3 BR / 2 BA | 4 | 1.7 | | 3 | 75.0% | 4,920 | 1,230 | $885 | $0.72 | $789 | $0.64 |
| 3 BR / 2 BA | 16 | 6.7 | | 16 | 100.0% | 19,712 | 1,232 | $900 | $0.73 | $883 | $0.72 |
| 3 BR / 2.5 BA TH | 4 | 1.7 | | 4 | 100.0% | 5,760 | 1,440 | $925 | $0.64 | $926 | $0.64 |
| Total/Wtd. Avg. | 240 | 100.0 | % | 239 | 99.6% | 208,316 | 868 | $701 | $0.81 | $693 | $0.80 |
| (1) | As provided by the borrowers as of July 11, 2022. |
Sterling Crossing Apartments. As of July 11, 2022, the Sterling Crossing Apartments property was 97.2% occupied. The Sterling Crossing Apartments property is located at 4503 South Kirkwood Road, approximately 16 miles west of downtown Houston. The 5.01-acre parcel is improved with nine two-story apartment buildings. The improvements are masonry construction. The Sterling Crossing Apartments property features one- and two-bedroom layouts ranging in size from 676 to 1,254 square feet. Market rents range from approximately $690 to $1,015 per month, with an average market rent of $822 and an average unit size of 948 square feet. Unit features include high speed internet access, washer/dryer hookup, heating, smoke detectors, dishwasher and trash disposal. Community amenities include laundry facilities, surface parking lot and a courtyard.
THE INFORMATION IN THIS STRUCTURAL AND COLLATERAL TERM SHEET IS NOT COMPLETE AND MAY BE AMENDED PRIOR TO THE TIME OF SALE. THIS TERM SHEET IS NOT AN OFFER TO SELL THESE SECURITIES AND IT IS NOT A SOLICITATION OF AN OFFER TO BUY THESE SECURITIES IN ANY JURISDICTION WHERE THE OFFER OR SALE IS NOT PERMITTED. |
| | 100 | |
| Structural and Collateral Term Sheet | | BMO 2022-C3 |
| |
| No. 7 – Bayou City Portfolio |
The borrower sponsor acquired the Sterling Crossing Apartments property in 2013 for a purchase price of approximately $3.76 million. Since the acquisition, the borrower sponsor has invested approximately $1.375 million in capital improvements, which include unit upgrades, plumbing and electrical repairs, new HVAC units, exterior siding replacement, new appliances and ceramic tile.
| Sterling Crossing Apartments Unit Mix |
| Unit Type | Collateral Units(1) | % of Collateral Units(1) | Occupied Collateral Units(1) | % of Units Occupied(1) | Total Collateral SF(1) | Average Collateral SF(1) | Market Rent Per Unit(2) | Market Rent Per SF(2) | Average Rent Per Unit(1) | Average Rent Per SF(1) |
| 1 BR / 1 BA | 21 | 14.7 | % | 21 | 100.0% | 14,196 | 676 | $690 | $1.02 | $694 | $1.03 |
| 1 BR / 1 BA | 14 | 9.8 | | 14 | 100.0% | 9,800 | 700 | $715 | $1.02 | $666 | $0.95 |
| 1 BR / 1 BA | 10 | 7.0 | | 9 | 90.0% | 7,530 | 753 | $720 | $0.96 | $718 | $0.95 |
| 2 BR / 1 BA | 52 | 36.4 | | 52 | 100.0% | 53,300 | 1,025 | $840 | $0.82 | $840 | $0.82 |
| 2 BR / 1 BA | 12 | 8.4 | | 12 | 100.0% | 12,600 | 1,050 | $860 | $0.82 | $852 | $0.81 |
| 1 BR / 1 BA | 8 | 5.6 | | 8 | 100.0% | 9,024 | 1,128 | $875 | $0.78 | $889 | $0.79 |
| 1 BR / 1 BA TH | 12 | 8.4 | | 10 | 83.3% | 12,144 | 1,012 | $900 | $0.89 | $865 | $0.85 |
| 1 BR / 1 BA | 4 | 2.8 | | 4 | 100.0% | 4,396 | 1,099 | $965 | $0.88 | $983 | $0.89 |
| 3 BR / 2.5 BA TH | 10 | 7.0 | | 9 | 90.0% | 12,540 | 1,254 | $1,015 | $0.81 | $970 | $0.77 |
| Total/Wtd. Avg. | 143 | 100.0 | % | 139 | 97.2% | 135,530 | 948 | $822 | $0.87 | $811 | $0.86 |
| (1) | As provided by the borrowers as of July 11, 2022. |
COVID-19 Update. As of July 22, 2022, the Bayou City Portfolio Properties were open and operating. As of the date of this term sheet, the Bayou City Portfolio Mortgage Loan is not subject to any forbearance, modification or debt service relief requests. The first payment date of the Bayou City Portfolio Mortgage Loan was September 6, 2022.
Environmental. According to the Phase I reports dated July 1, 2022, there was no evidence of any recognized environmental conditions at the Bayou City Portfolio Properties.
The Markets. According to the appraisal, the Creekside Apartments property is located in the Houston Area multifamily market. As of June 2022, the Houston Area multifamily market average monthly asking rent per square foot was $1.40 and vacancy was 8.6%. According to the appraisal, the Creekside Apartments property is located in the Baytown multifamily submarket. As of June 2022, the Baytown multifamily submarket average monthly asking rent per square foot was $1.20 and vacancy was 9.5%.
According to the appraisal, the estimated 2022 population within a one-, three- and five-mile radius of the Creekside Apartments property is 8,591, 58,307 and 105,046, respectively. The estimated 2022 median household income within the same radii is $60,961, $57,330 and $65,656, respectively.
THE INFORMATION IN THIS STRUCTURAL AND COLLATERAL TERM SHEET IS NOT COMPLETE AND MAY BE AMENDED PRIOR TO THE TIME OF SALE. THIS TERM SHEET IS NOT AN OFFER TO SELL THESE SECURITIES AND IT IS NOT A SOLICITATION OF AN OFFER TO BUY THESE SECURITIES IN ANY JURISDICTION WHERE THE OFFER OR SALE IS NOT PERMITTED. |
| | 101 | |
| Structural and Collateral Term Sheet | | BMO 2022-C3 |
| |
| No. 7 – Bayou City Portfolio |
The following table presents certain information relating to comparable multifamily rental properties to the Creekside Apartments property:
| Comparable Rental Summary(1) |
| Property Address | Year Built / Renovated | Occupancy | # of Units | Unit Mix | Average SF per Unit | Average Rent per SF | Average Rent per Unit |
Creekside Apartments(2) 3120 Decker Drive Baytown, TX | 1978 / 2017 | 94.8% | 250 | 1BR / 1BA 1BR / 1BA 1BR / 1BA 1BR / 1BA 2BR / 1BA 2BR / 1BA 2BR / 2BA 2BR / 2BA 2BR / 2BA 2BR / 2.5BA TH 2BR / 2BA 2BR / 2.5BA TH 3BR / 2BA 3BR / 2.5BA TH 3BR / 2.5BA TH | 650 700 830 853 900 914 914 914 1,239 1,242 1,287 1,300 1,305 1,432 1,438 | $1.04 $1.00 $0.86 $0.82 $0.84 $0.83 $0.87 $0.84 $0.77 $0.74 $0.75 $0.71 $0.73 $0.70 $0.68 | $674 $700 $711 $698 $755 $755 $791 $767 $949 $924 $965 $928 $957 $1,009 $1,014 |
Avalon Bay 925 Northwood Baytown, TX | 1982 / NAV | 98.0% | 220 | 1BR / 1BA 1BR / 1BA 1BR / 1BA 2BR / 2BA 2BR / 1.5BA 2BR / 1.5BA | 654 700 622 925 887 830 | $0.94 $0.94 $0.96 $0.89 $0.90 $0.90 | $615 $655 $595 $825 $795 $745 |
Oaks of Baytown Apartments 2011 Ward Baytown, TX | 1967 / 2011 | 91.0% | 248 | 1BR / 1BA 1BR / 1BA 1BR / 1BA 2BR / 1.5BA 2BR / 1.5BA 2BR / 1.5BA 2BR / 1.5BA TH 2BR / 1.5BA 2BR / 1.5BA TH 2BR / 2BA 3BR / 2BA 3BR / 2BA | 715 773 713 1,037 1,037 1,051 1,152 979 1,172 1,192 1,428 1,293 | $0.85 $0.86 $0.97 $0.67 $0.71 $0.71 $0.76 $0.77 $0.83 $1.00 $0.84 $0.89 | $605 $665 $690 $695 $735 $750 $870 $750 $970 $1,195 $1,195 $1,150 |
Bay Oaks Apartments 1700 Bob Smith Road Baytown, TX | 1978 / 2020 | 94.0% | 146 | 1BR / 1BA 1BR / 1BA 2BR / 1BA 2BR / 2BA 3BR / 2BA 3BR / 2BA | 625 700 815 900 1,297 1,112 | $1.09 $1.13 $1.08 $1.09 $0.93 $1.08 | $680 $790 $880 $980 $1,200 $1,200 |
The Ranch at Rollingbrook 3403 Garth Road Baytown, TX | 1983 / NAV | 96.0% | 219 | 1BR / 1BA 1BR / 1BA 2BR / 2BA 2BR / 2BA | 656 504 920 866 | $1.22 $1.41 $1.06 $1.10 | $799 $710 $974 $949 |
Providence at Baytown 1711 James Bowie Drive Baytown, TX | 1969 / 2020 | 99.0% | 184 | 1BR / 1BA 1BR / 1BA 2BR / 1.5BA 2BR / 1.5BA 2BR / 1BA 2BR / 1.5BA 3BR / 2BA | 715 725 1,048 1,003 885 950 1,380 | $1.03 $1.06 $0.97 $1.01 $1.06 $1.06 $0.92 | $735 $765 $1,020 $1,015 $935 $1,010 $1,265 |
| (1) | Source: Appraisal, unless otherwise indicated. |
| (2) | As provided by the borrowers as of July 11, 2022. |
According to the appraisal, the Oak Glen Apartments property is located in the Houston Area multifamily market. As of June 2022, the Houston Area multifamily market average monthly asking rent per square foot was $1.40 and vacancy was 8.6%. According to the appraisal, the Oak Glen Apartments property is located in the Brookhollow/Northwest Crossing multifamily submarket. As of June 2022, the Brookhollow/Northwest Crossing multifamily submarket average monthly asking rent per square foot was $1.26 and vacancy was 8.8%.
THE INFORMATION IN THIS STRUCTURAL AND COLLATERAL TERM SHEET IS NOT COMPLETE AND MAY BE AMENDED PRIOR TO THE TIME OF SALE. THIS TERM SHEET IS NOT AN OFFER TO SELL THESE SECURITIES AND IT IS NOT A SOLICITATION OF AN OFFER TO BUY THESE SECURITIES IN ANY JURISDICTION WHERE THE OFFER OR SALE IS NOT PERMITTED. |
| | 102 | |
| Structural and Collateral Term Sheet | | BMO 2022-C3 |
| |
| No. 7 – Bayou City Portfolio |
According to the appraisal, the estimated 2022 population within a one-, three- and five-mile radius of the Oak Glen Apartments property is 21,827, 134,376 and 354,890, respectively. The estimated 2022 median household income within the same radii is $41,492, $49,672 and $56,969, respectively.
The following table presents certain information relating to comparable multifamily rental properties to the Oak Glen Apartments property:
| Comparable Rental Summary(1) |
| Property Address | Year Built / Renovated | Occupancy | # of Units | Unit Mix | Average SF per Unit | Average Rent per SF | Average Rent per Unit |
Oak Glen Apartments(2) 5500 Antoine Drive Houston, TX | 1974 / 2017-2019 | 99.6% | 240 | Efficiency Efficiency 1BR / 1BA 1BR / 1BA 1BR / 1BA 1BR / 1BA 1BR / 1BA TH 1BR / 1BA 1BR / 1BA 2BR / 1BA 2BR / 1BA 2BR / 1BA 2BR / 2BA 2BR / 2BA 2BR / 2BA 2BR / 1.5BA TH 3BR / 2BA 3BR / 2BA 3BR / 2.5BA TH | 425 488 620 640 672 720 725 736 784 840 896 960 1,000 1,020 1,088 1,152 1,230 1,232 1,440 | $1.22 $1.07 $0.98 $0.95 $0.93 $0.85 $0.91 $0.84 $0.80 $0.80 $0.82 $0.79 $0.75 $0.74 $0.70 $0.70 $0.64 $0.72 $0.64 | $518 $524 $610 $609 $624 $615 $659 $615 $631 $668 $732 $755 $748 $757 $766 $804 $789 $883 $926 |
Casa Rosa 555 Antoine Houston, TX | 1971 / NAV | 97.0% | 168 | 1BR / 1BA 2BR / 2BA 2BR / 1BA 3BR / 2BA | 715 1,027 917 1,179 | $0.99 $0.84 $0.86 $0.87 | $710 $865 $785 $1,025 |
Casa Grande 5700 Thousand Oaks Circle Houston, TX | 1975 / 2018 | 98.0% | 319 | 1BR / 1BA 2BR / 2BA 2BR / 2BA 2BR / 1BA 2BR / 2BA 2BR / 1BA 3BR / 2BA 3BR / 2BA 3BR / 2BA | 725 1,140 1,120 1,060 1,025 936 1,360 1,421 1,400 | $0.99 $0.79 $0.80 $0.83 $0.85 $0.88 $0.79 $0.79 $0.84 | $715 $895 $895 $875 $875 $825 $1,075 $1,125 $1,175 |
Diamond Ridge 6407 Antoine Drive Houston, TX | 1982 / 2018 | 96.0% | 500 | 1BR / 1BA Den 1BR / 1BA 1BR / 1BA 1BR / 1BA 2BR / 1.5BA 2BR / 2BA 3BR / 2BA | 850 735 680 535 975 1,045 1,190 | $1.03 $1.07 $1.13 $1.36 $1.04 $1.07 $1.04 | $875 $790 $765 $725 $1,015 $1,115 $1,235 |
Aspen 6150 West Tidwell Houston, TX | 1973 / 2022 | 93.0% | 209 | 1BR / 1BA 1BR / 1BA 1BR / 1BA 2BR / 1.5BA 2BR / 1.5BA 2BR / 2BA | 736 648 723 1,296 1,134 995 | $1.18 $1.21 $1.21 $0.89 $1.00 $1.09 | $865 $785 $875 $1,150 $1,130 $1,085 |
| (1) | Source: Appraisal, unless otherwise indicated. |
| (2) | As provided by the borrowers as of July 11, 2022. |
THE INFORMATION IN THIS STRUCTURAL AND COLLATERAL TERM SHEET IS NOT COMPLETE AND MAY BE AMENDED PRIOR TO THE TIME OF SALE. THIS TERM SHEET IS NOT AN OFFER TO SELL THESE SECURITIES AND IT IS NOT A SOLICITATION OF AN OFFER TO BUY THESE SECURITIES IN ANY JURISDICTION WHERE THE OFFER OR SALE IS NOT PERMITTED. |
| | 103 | |
| Structural and Collateral Term Sheet | | BMO 2022-C3 |
| |
| No. 7 – Bayou City Portfolio |
| Comparable Rental Summary (cont’d)(1) |
| Property Address | Year Built / Renovated | Occupancy | # of Units | Unit Mix | Average SF per Unit | Average Rent per SF | Average Rent per Unit |
Oak Glen Apartments(2) 5500 Antoine Drive Houston, TX | 1974 / 2017-2019 | 99.6% | 240 | Efficiency Efficiency 1BR / 1BA 1BR / 1BA 1BR / 1BA 1BR / 1BA 1BR / 1BA TH 1BR / 1BA 1BR / 1BA 2BR / 1BA 2BR / 1BA 2BR / 1BA 2BR / 2BA 2BR / 2BA 2BR / 2BA 2BR / 1.5BA TH 3BR / 2BA 3BR / 2BA 3BR / 2.5BA TH | 425 488 620 640 672 720 725 736 784 840 896 960 1,000 1,020 1,088 1,152 1,230 1,232 1,440 | $1.22 $1.07 $0.98 $0.95 $0.93 $0.85 $0.91 $0.84 $0.80 $0.80 $0.82 $0.79 $0.75 $0.74 $0.70 $0.70 $0.64 $0.72 $0.64 | $518 $524 $610 $609 $624 $615 $659 $615 $631 $668 $732 $755 $748 $757 $766 $804 $789 $883 $926 |
Reserve at White Oak 6240 Antoine Drive Houston, TX | 1973 / 2011 | 97.0% | 339 | 1BR / 1BA 1BR / 1BA 1BR / 1BA 1BR / 1BA 2BR / 1.5BA 2BR / 2BA 2BR / 1BA 2BR / 1BA 2BR / 1BA 3BR / 2BA | 846 822 742 656 1,331 1,200 1,088 1,024 890 1,484 | $0.99 $1.02 $1.07 $1.21 $0.86 $0.88 $0.90 $1.01 $1.10 $0.91 | $840 $835 $795 $795 $1,150 $1,050 $980 $1,035 $975 $1,350 |
Kingswood Village 3233 Magnum Houston, TX | 1970 / 2017 | 94.0% | 392 | 1BR / 1BA 1BR / 1BA 1BR / 1BA 2BR / 1.5BA 2BR / 1.5BA 2BR / 1.5BA 2BR / 2BA 2BR / 2BA | 680 650 755 1,156 950 955 975 975 | $1.09 $1.11 $1.13 $0.94 $1.01 $1.02 $1.03 $1.09 | $740 $719 $850 $1,090 $960 $975 $1,000 $1,065 |
| (1) | Source: Appraisal, unless otherwise indicated. |
| (2) | As provided by the borrowers as of July 11, 2022. |
According to the appraisal, the Sterling Crossing Apartments property is located in the Houston Area multifamily market. As of June 2022, the Houston Area multifamily market average monthly asking rent per square foot was $1.40 and vacancy was 8.6%. According to the appraisal, the Sterling Crossing Apartments property is located in the Alief multifamily submarket. As of June 2022, the Alief multifamily submarket average monthly asking rent per square foot was $1.17 and vacancy was 7.1%.
According to the appraisal, the estimated 2022 population within a one-, three- and five-mile radius of the Sterling Crossing Apartments property is 19,223, 234,028 and 538,791, respectively. The estimated 2022 median household income within the same radii is $46,429, $46,564 and $53,854, respectively.
THE INFORMATION IN THIS STRUCTURAL AND COLLATERAL TERM SHEET IS NOT COMPLETE AND MAY BE AMENDED PRIOR TO THE TIME OF SALE. THIS TERM SHEET IS NOT AN OFFER TO SELL THESE SECURITIES AND IT IS NOT A SOLICITATION OF AN OFFER TO BUY THESE SECURITIES IN ANY JURISDICTION WHERE THE OFFER OR SALE IS NOT PERMITTED. |
| | 104 | |
| Structural and Collateral Term Sheet | | BMO 2022-C3 |
| |
| No. 7 – Bayou City Portfolio |
The following table presents certain information relating to comparable multifamily rental properties to the Sterling Crossing Apartments property:
| Comparable Rental Summary(1) |
| Property Address | Year Built / Renovated | Occupancy | # of Units | Unit Mix | Average SF per Unit | Average Rent per SF | Average Rent per Unit |
Sterling Crossing Apartments(2) 4503 South Kirkwood Road Houston, TX | 1976 / 2018 | 97.2% | 143 | 1BR / 1BA 1BR / 1BA 1BR / 1BA 2BR / 1BA 2BR / 1BA 2BR / 1BA 2BR / 1.5BA 2BR / 2BA 2BR / 2BA | 676 700 753 1,025 1,050 1,128 1,012 1,099 1,254 | $1.03 $0.95 $0.95 $0.82 $0.81 $0.79 $0.85 $0.89 $0.77 | $694 $666 $718 $840 $852 $889 $865 $983 $970 |
Leawood Plaza Apartments 11402 Beechnut Street Houston, TX | 1970 / NAV | 97.0% | 79 | 1BR / 1BA 2BR / 1BA 2BR / 2BA | 663 875 900 | $0.94 $0.87 $0.87 | $625 $760 $785 |
Claridge 10027 Spice Lane Houston, TX | 1983 / 2008 | 97.0% | 173 | 2BR / 2.5BA 2BR / 2BA 2BR / 2BA 2BR / 2BA 2BR / 2BA 2BR / 1BA | 1,550 1,335 1,235 1,135 1,096 960 | $0.82 $0.87 $0.91 $0.93 $0.94 $1.02 | $1,275 $1,165 $1,130 $1,060 $1,035 $980 |
Glenwood Apartments 9255 West Sam Houston Parkway Houston, TX | 1981 / NAV | 97.0% | 60 | 1BR / 1.5BA 1BR / 1BA 2BR / 2.5BA 2BR / 2BA | 1,052 750 1,300 1,140 | $0.86 $1.07 $0.86 $0.89 | $907 $805 $1,121 $1,009 |
Whispering Oaks 10010 Greenfork Drive Houston, TX | 1978 / 2016 | 96.0% | 180 | 1BR / 1BA 1BR / 1BA 2BR / 1BA | 602 644 812 | $0.92 $0.95 $0.90 | $555 $610 $730 |
SunBlossom Woods 4545 Cook Road Houston, TX | 1983 / NAV | 97.0% | 200 | 2BR / 2BA Loft TH 2BR / 2BA Loft TH 2BR / 2BA 2BR / 2BA 2BR / 1BA | 1,178 1,160 970 850 816 | $0.94 $0.96 $1.14 $1.23 $1.24 | $1,113 $1,113 $1,104 $1,043 $1,011 |
Alief Square 7500 Cook Road Houston, TX | 1970 / NAV | 96.0% | 240 | 1BR / 1BA 2BR / 1BA 2BR / 2BA | 700 900 1,000 | $1.21 $1.00 $1.00 | $850 $900 $1,000 |
| (1) | Source: Appraisal, unless otherwise indicated. |
| (2) | As provided by the borrowers as of July 11, 2022. |
The following table presents certain information relating to the historical and current occupancy of the Bayou City Portfolio Properties:
| Historical and Current Occupancy(1) |
| 2019 | 2020 | 2021 | Current(2) |
| 96.2% | 95.9% | 95.4% | 97.2% |
| (1) | Historical occupancy is as of December 31 of each respective year. |
| (2) | Current Occupancy is as of July 11, 2022. |
THE INFORMATION IN THIS STRUCTURAL AND COLLATERAL TERM SHEET IS NOT COMPLETE AND MAY BE AMENDED PRIOR TO THE TIME OF SALE. THIS TERM SHEET IS NOT AN OFFER TO SELL THESE SECURITIES AND IT IS NOT A SOLICITATION OF AN OFFER TO BUY THESE SECURITIES IN ANY JURISDICTION WHERE THE OFFER OR SALE IS NOT PERMITTED. |
| | 105 | |
| Structural and Collateral Term Sheet | | BMO 2022-C3 |
| |
| No. 7 – Bayou City Portfolio |
Operating History and Underwritten Net Cash Flow |
| | 2019 | 2020 | 2021 | TTM(1) | Underwritten | Per Unit | %(2) |
| Gross Potential Rent | $4,911,164 | | $5,038,720 | | $5,207,121 | | $5,271,277 | | $5,818,320 | | $9,192 | | 100.0 | % |
| Net Rental Income | $4,911,164 | | $5,038,720 | | $5,207,121 | | $5,271,277 | | $5,818,320 | | $9,192 | | 100.0 | % |
| (Vacancy/Credit Loss) | 0 | | 0 | | 0 | | 0 | | (489,229) | | (773) | | (8.4) | |
| Other Income | 117,258 | | 66,202 | | 96,510 | | 121,368 | | 121,368 | | 192 | | 2.1 | |
| Effective Gross Income | $5,028,422 | | $5,104,922 | | $5,303,631 | | $5,392,645 | | $5,450,459 | | $8,611 | | 93.7 | % |
| | | | | | | | |
| Total Expenses | $2,036,665 | | $2,149,153 | | $2,224,374 | | $2,257,594 | | $2,480,066 | | $3,918 | | 45.5 | % |
| | | | | | | | |
| Net Operating Income | $2,991,757 | | $2,955,769 | | $3,079,257 | | $3,135,051 | | $2,970,393 | | $4,693 | | 54.5 | % |
| | | | | | | | |
| Total TI/LC, Capex/RR | 0 | | 0 | | 0 | | 0 | | 159,472 | | 252 | | 2.9 | |
| | | | | | | | |
| Net Cash Flow | $2,991,757 | | $2,955,769 | | $3,079,257 | | $3,135,051 | | $2,810,921 | | $4,441 | | 51.6 | % |
| (1) | TTM reflects the trailing 12 months ending May 31, 2022. |
| (2) | % column represents percent of Gross Potential Rent for revenue fields and represents percent of Effective Gross Income for the remainder of fields. |
The Borrowers. The borrowers are APTOG, LLC, APTSC, LLC and APTCS, LLC, each a Delaware limited liability company and special purpose entity with one independent director for each borrower entity. Legal counsel to the borrowers provided a non-consolidation opinion in connection with the origination of the Bayou City Portfolio Mortgage Loan.
The Borrower Sponsor. The borrower sponsor and guarantor is Gary W. Gates, Jr. Mr. Gates owns and manages 46 multifamily properties totaling approximately 9,700 units primarily in the Houston, Texas area.
Additionally, the borrowers and the borrower sponsor are personally liable for a portion of the Bayou City Portfolio Mortgage Loan in an amount equal to 20% of the original principal balance of Bayou City Portfolio Mortgage Loan ($6,450,000).
Property Management. The Bayou City Portfolio Properties are managed by Gatesco, Inc., an affiliate of the borrowers.
Escrows and Reserves. At origination, the borrowers were required to deposit into escrow (i) approximately $355,900 for real estate taxes, (ii) approximately $109,993 for insurance premiums, (iii) $122,375 for deferred maintenance and (iv) $2,500,000 for an economic holdback.
Tax Escrows – On a monthly basis, the borrowers were required to escrow 1/12th of the annual estimated tax payments, which currently equates to approximately $44,488.
Insurance Escrows – On a monthly basis, the borrowers were required to escrow 1/12th of the annual estimated insurance payments, which currently equates to approximately $20,845.
Replacement Reserves – On a monthly basis, the borrowers were required to escrow $13,293 for replacement reserves (approximately $252 per unit annually).
Economic Holdback – At any point from and after June 6, 2023, provided (i) no Bayou City Portfolio Sweep Event Period (as defined below) has occurred and is continuing, and (ii) the Bayou City Portfolio Properties have achieved a debt yield of at least 9.8% based on the trailing 12 months, as determined by the lender, the lender will direct the servicer to release the economic performance reserve funds to the borrowers.
Lockbox / Cash Management. The Bayou City Portfolio Mortgage Loan is structured with a springing lockbox and springing cash management. The Bayou City Portfolio Mortgage Loan requires that during the continuance of a Bayou City Portfolio Sweep Event Period, the borrowers or property managers, as applicable, direct tenants to pay all rents directly into the lockbox account. Upon the occurrence and during the continuance of a Bayou City Portfolio Sweep Event Period, all funds in the lockbox account are required to be swept daily to a cash management account under the control of the lender to be applied and disbursed in accordance with the Bayou City Portfolio Mortgage Loan documents, and all excess cash flow funds remaining in the cash management account after the application of such funds in accordance with the Bayou City Portfolio Mortgage Loan documents are required to be held by the lender in an excess cash flow reserve account as additional collateral for the Bayou City Portfolio Mortgage Loan. To the extent that no Bayou City Portfolio Sweep Event Period is continuing, all excess cash flow funds are required to be disbursed to the borrowers.
THE INFORMATION IN THIS STRUCTURAL AND COLLATERAL TERM SHEET IS NOT COMPLETE AND MAY BE AMENDED PRIOR TO THE TIME OF SALE. THIS TERM SHEET IS NOT AN OFFER TO SELL THESE SECURITIES AND IT IS NOT A SOLICITATION OF AN OFFER TO BUY THESE SECURITIES IN ANY JURISDICTION WHERE THE OFFER OR SALE IS NOT PERMITTED. |
| | 106 | |
| Structural and Collateral Term Sheet | | BMO 2022-C3 |
| |
| No. 7 – Bayou City Portfolio |
A “Bayou City Portfolio Sweep Event Period” will commence upon the earliest of the following: (i) the occurrence of an event of default under the Bayou City Portfolio Mortgage Loan documents or (ii) the date on which the debt service coverage ratio is less than 1.15x based on the trailing 12 months.
A Bayou City Portfolio Sweep Event Period will end: (a) with regard to clause (i), upon the cure of such event of default and the lender’s acceptance of such cure in its sole and absolute discretion and (b) with regard to clause (ii), upon the debt service coverage ratio based on the trailing 12-month period being at least 1.20x for two consecutive calendar quarters.
Subordinate Debt. None.
Mezzanine Debt. None.
Partial Release. Not permitted.
Ground Lease. None.
THE INFORMATION IN THIS STRUCTURAL AND COLLATERAL TERM SHEET IS NOT COMPLETE AND MAY BE AMENDED PRIOR TO THE TIME OF SALE. THIS TERM SHEET IS NOT AN OFFER TO SELL THESE SECURITIES AND IT IS NOT A SOLICITATION OF AN OFFER TO BUY THESE SECURITIES IN ANY JURISDICTION WHERE THE OFFER OR SALE IS NOT PERMITTED. |
| | 107 | |
| Structural and Collateral Term Sheet | | BMO 2022-C3 |
| |
| No. 8 – 469 7th Avenue |
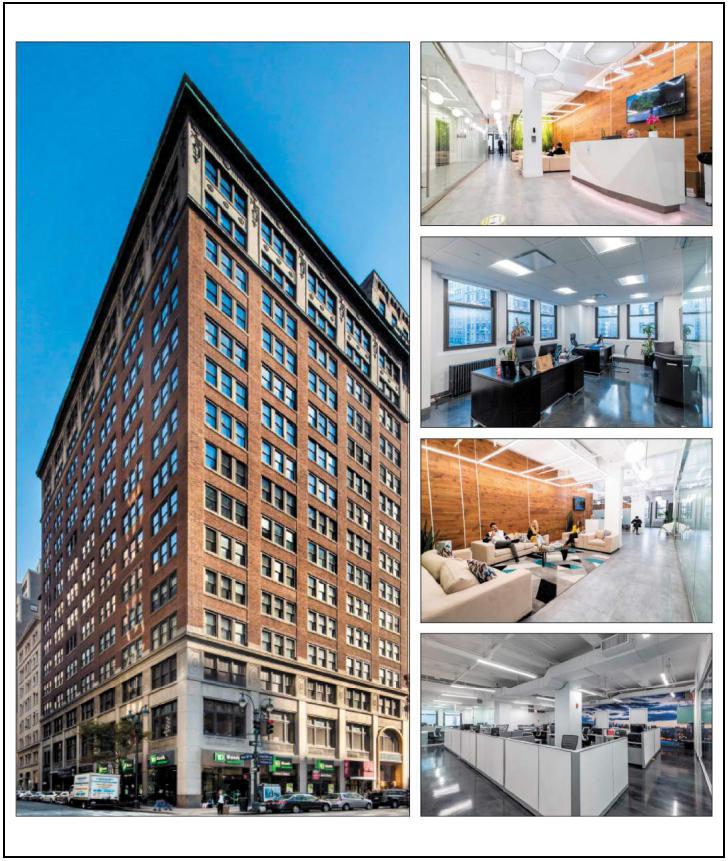
THE INFORMATION IN THIS STRUCTURAL AND COLLATERAL TERM SHEET IS NOT COMPLETE AND MAY BE AMENDED PRIOR TO THE TIME OF SALE. THIS TERM SHEET IS NOT AN OFFER TO SELL THESE SECURITIES AND IT IS NOT A SOLICITATION OF AN OFFER TO BUY THESE SECURITIES IN ANY JURISDICTION WHERE THE OFFER OR SALE IS NOT PERMITTED. |
| | 108 | |
| Structural and Collateral Term Sheet | | BMO 2022-C3 |
| |
| No. 8 – 469 7th Avenue |
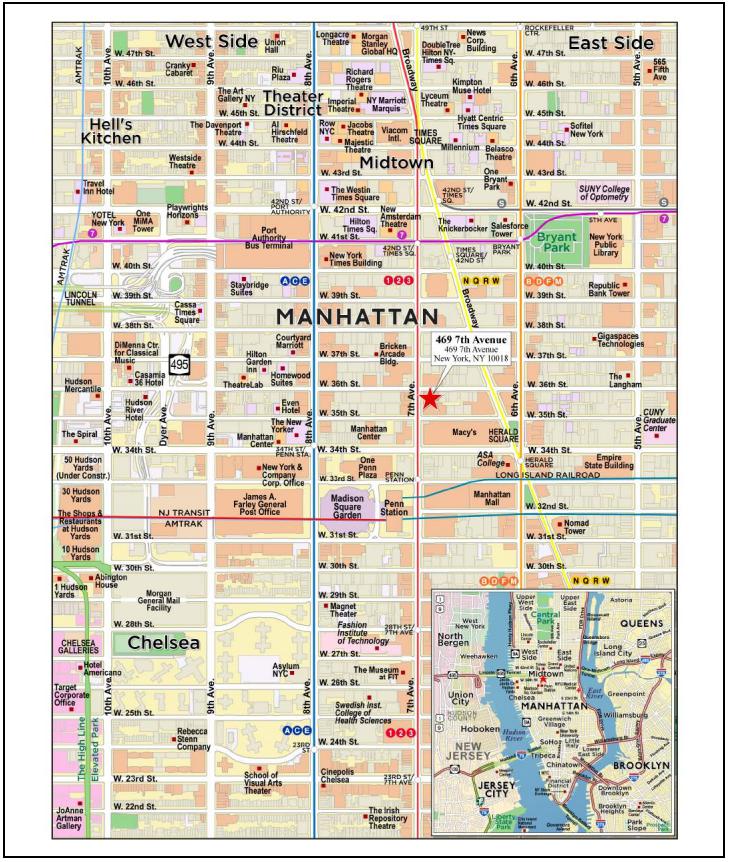
THE INFORMATION IN THIS STRUCTURAL AND COLLATERAL TERM SHEET IS NOT COMPLETE AND MAY BE AMENDED PRIOR TO THE TIME OF SALE. THIS TERM SHEET IS NOT AN OFFER TO SELL THESE SECURITIES AND IT IS NOT A SOLICITATION OF AN OFFER TO BUY THESE SECURITIES IN ANY JURISDICTION WHERE THE OFFER OR SALE IS NOT PERMITTED. |
| | 109 | |
| Structural and Collateral Term Sheet | | BMO 2022-C3 |
| |
| No. 8 – 469 7th Avenue |
| Mortgage Loan Information | | Property Information |
| Mortgage Loan Seller: | UBS AG | | Single Asset / Portfolio: | Single Asset |
| Original Principal Balance(1): | $30,000,000 | | Title: | Fee |
| Cut-off Date Principal Balance(1): | $30,000,000 | | Property Type – Subtype: | Office – CBD |
| % of IPB: | 4.1% | | Net Rentable Area (SF): | 269,233 |
| Loan Purpose: | Refinance | | Location: | New York, NY |
| Borrower: | 469 Holdings LLC | | Year Built / Renovated: | 1921 / 2012 |
| Borrower Sponsor: | Martin Meyer | | Occupancy: | 87.4% |
| Interest Rate: | 6.03000% | | Occupancy Date: | 6/23/2022 |
| Note Date: | 8/30/2022 | | 4th Most Recent NOI (As of): | $10,675,574 (12/31/2019) |
| Maturity Date: | 9/6/2032 | | 3rd Most Recent NOI (As of): | $10,851,545 (12/31/2020) |
| Interest-only Period: | 120 months | | 2nd Most Recent NOI (As of)(3): | $8,788,527 (12/31/2021) |
| Original Term: | 120 months | | Most Recent NOI (As of)(3): | $9,060,785 (TTM 5/31/2022) |
| Original Amortization Term: | None | | UW Economic Occupancy: | 87.5% |
| Amortization Type: | Interest Only | | UW Revenues: | $15,659,792 |
| Call Protection(2): | L(25),D(89),O(6) | | UW Expenses: | $6,447,392 |
| Lockbox / Cash Management: | Hard / Springing | | UW NOI(3): | $9,212,401 |
| Additional Debt(1): | Yes | | UW NCF: | $8,459,229 |
| Additional Debt Balance(1): | $68,000,000 | | Appraised Value / Per SF: | $187,000,000 / $695 |
| Additional Debt Type(1): | Pari Passu | | Appraisal Date: | 7/1/2022 |
| | | | | |
| Escrows and Reserves(4) | | Financial Information(1) |
| | Initial | Monthly | Initial Cap | | Cut-off Date Loan / SF: | $364 |
| Taxes: | $1,080,225 | $270,056 | N/A | | Maturity Date Loan / SF: | $364 |
| Insurance: | $0 | Springing | N/A | | Cut-off Date LTV: | 52.4% |
| Replacement Reserves: | $0 | $4,487 | $100,000 | | Maturity Date LTV: | 52.4% |
| TI / LC Reserve: | $0 | $22,436 | $1,346,165 | | UW NCF DSCR: | 1.41x |
| Specified Tenant Reserve: | $0 | Springing | $11,800,000 | | UW NOI Debt Yield: | 9.4% |
| | | | | | | |
| Sources and Uses |
| Sources | Proceeds | % of Total | | | Uses | Proceeds | % of Total |
| Whole Loan | $98,000,000 | 96.0 | % | | Loan Payoff | $99,766,998 | 97.7 | % |
| Sponsor Equity | 4,085,912 | 4.0 | | | Closing Costs | 1,238,689 | 1.2 | |
| | | | | Upfront Reserves | 1,080,225 | 1.1 | |
| Total Sources | $102,085,912 | 100.0 | % | | Total Uses | $102,085,912 | 100.0 | % |
| (1) | The 469 7th Avenue Mortgage Loan (as defined below) is part of a whole loan evidenced by six pari passu notes with an aggregate outstanding principal balance as of the Cut-off Date of $98.0 million (the “469 7th Avenue Whole Loan”). The financial information in the chart above reflects the 469 7th Avenue Whole Loan. |
| (2) | Defeasance of the 469 7th Avenue Whole Loan is permitted at any time after the earlier to occur of (a) the end of the two-year period commencing on the closing date of the securitization of the last promissory note representing a portion of the 469 7th Avenue Whole Loan to be securitized and (b) August 30, 2026. The assumed defeasance lockout period of 25 payments is based on the anticipated closing date of the BMO 2022-C3 securitization trust in October 2022. The actual lockout period may be longer. |
| (3) | UW NOI is greater than Most Recent NOI and 2nd Most Recent NOI due in part to approximately $849,437 comprised of (i) straight-line averaging rent over the lease term for investment grade tenants, The City of New York and TD Bank, N.A., plus (ii) contractual rent steps through August 1, 2023. |
| (4) | For a full description of Escrows and Reserves, please refer to “Escrows and Reserves” below. |
The Loan. The 469 7th Avenue mortgage loan (the “469 7th Avenue Mortgage Loan”) is part of a fixed rate whole loan secured by the borrower’s fee interest in a 269,233 square foot office property located in New York, New York (the “469 7th Avenue Property”). The 469 7th Avenue Whole Loan was co-originated by UBS AG, by and through its branch office at 1285 Avenue of the Americas, New York, New York (“UBS AG”) and Citi Real Estate Funding Inc. (“CREFI”). The 469 7th Avenue Whole Loan consists of six pari passu notes and accrues at an interest rate of 6.03000% per annum. The 469 7th Avenue Whole Loan has a 10-year term, is interest-only for the full term of the loan and accrues interest on an Actual/360 basis. The 469 7th Avenue Mortgage Loan is evidenced by the non-controlling Note A-2, with an outstanding principal balance as of the Cut-off Date of $30,000,000. The remaining notes are currently held by UBS AG and CREFI and are expected to be contributed to one or more future securitization trust(s). The 469 7th Avenue Whole Loan will be serviced pursuant to the pooling and servicing agreement for the BMO 2022-C3 securitization trust until the controlling Note A-1 is
THE INFORMATION IN THIS STRUCTURAL AND COLLATERAL TERM SHEET IS NOT COMPLETE AND MAY BE AMENDED PRIOR TO THE TIME OF SALE. THIS TERM SHEET IS NOT AN OFFER TO SELL THESE SECURITIES AND IT IS NOT A SOLICITATION OF AN OFFER TO BUY THESE SECURITIES IN ANY JURISDICTION WHERE THE OFFER OR SALE IS NOT PERMITTED. |
| | 110 | |
| Structural and Collateral Term Sheet | | BMO 2022-C3 |
| |
| No. 8 – 469 7th Avenue |
securitized, whereupon the 469 7th Avenue Whole Loan will be serviced pursuant to the pooling and servicing agreement for such future securitization trust. See “Description of the Mortgage Pool—The Whole Loans—The Serviced Pari Passu Whole Loans” and “Pooling and Servicing Agreement” in the Preliminary Prospectus.
| Whole Loan Summary |
| Note | Original Balance | Cut-off Date Balance | | Note Holder | Controlling Piece |
| A-1 | $20,000,000 | $20,000,000 | | CREFI(1) | Yes |
| A-2 | $30,000,000 | $30,000,000 | | BMO 2022-C3 | No |
| A-3 | $20,000,000 | $20,000,000 | | CREFI(1) | No |
| A-4 | $14,000,000 | $14,000,000 | | UBS AG(1) | No |
| A-5 | $9,000,000 | $9,000,000 | | CREFI(1) | No |
| A-6 | $5,000,000 | $5,000,000 | | UBS AG(1) | No |
| Whole Loan | $98,000,000 | $98,000,000 | | | |
| (1) | The subject notes are expected to be contributed to one or more future securitization trust(s). |
The Property. The 469 7th Avenue Property is a 16-story office building with a total of 269,233 square feet, which consists of 255,800 square feet of office space, 12,588 square feet of retail space and 845 square feet of storage space, located on the southeast corner of West 36th Street and 7th Avenue in New York, New York. The 469 7th Avenue Property, which sits on an approximately 0.3-acre parcel of land, was built in 1921 and renovated in 2012. The renovation featured a newly restored façade, new elevator cabs, and window replacement throughout the entire building. The 469 7th Avenue Property features an average floor plate size of 17,000 square feet, 24-hour controlled access, lobby concierge service, eight-passenger elevators, on-site property management, and an on-site conferencing facility. The 469 7th Avenue Property features 99 feet of frontage on 7th Avenue and 140 feet of frontage along West 36th Street. Two of the tenants (or their parent entity), collectively comprising 26.7% NRA and 34.4% of underwritten base rent, are investment-grade rated. As of June 23, 2022, the 469 7th Avenue Property was 87.4% leased to nine office tenants, four retail tenants and one storage tenant. The retail space within the 469 7th Avenue Property is currently 100.0% leased to TD Bank, N.A. (5,000 square feet), Shindo USA, Inc. (3,300 square feet), GFG 7th Avenue, LLC (2,288 square feet) and The City of New York (2,000 square feet), which collectively account for 4.7% of NRA.
COVID-19 Update. As of September 1, 2022, the 469 7th Avenue Property is open and operational and there were no outstanding rent relief requests. Severud Associates Consulting Engineers, P.C., EONY LLC and Penn Station Chiropractic LLC have received ongoing rent reductions due to the pandemic. The lenders underwrote the reduced rent. The first payment date of the 469 7th Avenue Mortgage Loan is October 6, 2022. See “Risk Factors—Special Risks—The Coronavirus Pandemic Has Adversely Affected the Global Economy and May Adversely Affect the Performance of the Mortgage Loans” in the Preliminary Prospectus.
Major Tenants. The three largest tenants based on underwritten base rent are The City of New York, In Touch Group, LLC (“In Touch Group”) and E-Lo Sportswear, LLC (“E-Lo Sportswear”).
The City of New York (67,000 square feet; 24.9% of NRA; 26.2% of underwritten base rent). The City of New York (rated Aa2/AA/AA- by Moody’s/S&P/Fitch) has been at the 469 7th Avenue Property since 2014 and currently occupies 67,000 square feet across the ground floor (2,000 square feet), second floor (17,000 square feet), third floor (17,000 square feet), fourth floor (17,000 square feet) and part of the sixth floor (14,000 square feet). The City of New York’s lease expires on October 14, 2029 and has one, 10-year renewal option. The City of New York may terminate its lease for the entire premises, the sixth floor or the fourth and sixth floors any time after October 15, 2024 upon at least 12 months’ notice and payment of a termination fee in an amount equal to the sum of (i) the tenant work costs based on a straight-line amortization over the first 15 years of the lease term and (ii) the tenant broker fee based on a straight-line amortization over the first 15 years of the lease term. The 469 7th Avenue Property is being utilized by The New York City Police Department.
In Touch Group (51,000 square feet; 18.9% of NRA; 21.7% of underwritten base rent). In Touch Group is a privately held full-service agency network, providing creative and media services, enterprise solutions and data analytics globally through ten affiliates in eight offices, collectively employing more than 1,400 people. In Touch Group was acquired in December 2021 by Eversana Life Science Services, LLC, a provider of global services to the life sciences industry serving more than 500 organizations, including start ups and established pharmaceutical companies. In Touch Group has been at the 469 7th Avenue Property since 2015 and leases the seventh floor (which is not fully utilized), eighth floor and tenth floor (each 17,000 square feet). In Touch Group’s lease expires on September 30, 2031. In Touch Group may terminate its lease for all three floors on September 30, 2028 upon at least 15 months’ notice, without payment of any termination fee.
THE INFORMATION IN THIS STRUCTURAL AND COLLATERAL TERM SHEET IS NOT COMPLETE AND MAY BE AMENDED PRIOR TO THE TIME OF SALE. THIS TERM SHEET IS NOT AN OFFER TO SELL THESE SECURITIES AND IT IS NOT A SOLICITATION OF AN OFFER TO BUY THESE SECURITIES IN ANY JURISDICTION WHERE THE OFFER OR SALE IS NOT PERMITTED. |
| | 111 | |
| Structural and Collateral Term Sheet | | BMO 2022-C3 |
| |
| No. 8 – 469 7th Avenue |
E-Lo Sportswear (34,000 square feet; 12.6% of NRA; 14.6% of underwritten base rent). E-Lo Sportswear is a multi-category fashion house, which manufactures, designs and markets to a consumer base throughout the United States. E-Lo Sportswear has been at the 469 7th Avenue Property since 2017 and currently occupies the 15th and 16th floors (each 17,000 square feet). E-Lo Sportswear’s lease expires on August 31, 2027. E-Lo Sportswear has no renewal options and no termination options.
Environmental. According to a Phase I environmental assessment dated June 29, 2022, there was no evidence of any recognized environmental conditions at the 469 7th Avenue Property.
The following table presents certain information relating to the historical and current occupancy of the 469 7th Avenue Property:
| Historical and Current Occupancy(1) |
| 2019 | 2020 | 2021 | Current(2) |
| 99.3% | 99.3% | 93.8% | 87.4% |
| (1) | Historical Occupancies are as of December 31 of each respective year. |
| (2) | Current Occupancy is as of June 23, 2022. |
The following table presents certain information relating to the largest tenants based on underwritten base rent of the 469 7th Avenue Property:
| Top Tenant Summary(1) |
| Tenant | Ratings Moody’s/S&P/Fitch(2) | Net Rentable Area (SF) | % of
Total
NRA | UW Base Rent PSF(3) | UW Base Rent(3) | % of Total UW Base Rent(3) | Lease Expiration Date |
| The City of New York(4)(5) | Aa2/AA/AA- | 67,000 | 24.9 | % | $53.43 | $3,579,888 | 26.2 | % | 10/14/2029 |
| In Touch Group(6) | NR/NR/NR | 51,000 | 18.9 | | $58.31 | 2,973,690 | 21.7 | | 9/30/2031 |
| E-Lo Sportswear | NR/NR/NR | 34,000 | 12.6 | | $58.83 | 2,000,330 | 14.6 | | 8/31/2027 |
| Situation Marketing, LLC | NR/NR/NR | 17,000 | 6.3 | | $64.90 | 1,103,305 | 8.1 | | 5/31/2026 |
| Severud Associates Consulting Engineers, P.C. | NR/NR/NR | 17,000 | 6.3 | | $53.16 | 903,751 | 6.6 | | 12/31/2032 |
| Eony, LLC | NR/NR/NR | 17,000 | 6.3 | | $35.00 | 595,000 | 4.4 | | 9/30/2029 |
| Benchmark Builders, LLC | NR/NR/NR | 14,300 | 5.3 | | $44.97 | 643,134 | 4.7 | | 7/31/2031 |
| TD Bank, N.A.(7) | Aa2/NR/NR | 5,000 | 1.9 | | $226.32 | 1,131,583 | 8.3 | | 2/28/2030 |
| Penn Station Chiropractic LLC | NR/NR/NR | 3,500 | 1.3 | | $34.28 | 119,976 | 0.9 | | 8/31/2028 |
| Shindo USA, Inc.(8) | NR/NR/NR | 3,300 | 1.2 | | $68.52 | 226,116 | 1.7 | | 5/31/2031 |
| Top Tenants | | 229,100 | 85.1 | % | $57.95 | $13,276,774 | 97.1 | % | |
| Remaining Tenants | | 6,133 | 2.3 | | $65.28 | 400,354 | 2.9 | | |
| Occupied Collateral Total / Wtd. Avg. | 235,233 | 87.4 | % | $58.14 | $13,677,128 | 100.0 | % | |
| Vacant Space | | 34,000 | 12.6 | | | | | |
| Collateral Total | | 269,233 | 100.0 | % | | | | |
| (1) | Based on underwritten rent roll dated June 23, 2022. |
| (2) | In certain instances, ratings provided are those of the parent company of the entity shown, whether or not the parent company guarantees the lease. |
| (3) | UW Base Rent, UW Base Rent PSF and % of Total UW Base Rent are inclusive of approximately $849,437 comprised of (i) straight-line averaging rent over the lease term for investment grade tenants, The City of New York and TD Bank, N.A., plus (ii) contractual rent steps through August 1, 2023. |
| (4) | The City of New York may terminate its lease for the entire premises, the sixth floor or the fourth and sixth floors any time after October 15, 2024 upon at least 12 months’ notice and payment of a termination fee in an amount equal to the sum of (i) the tenant work costs based on a straight-line amortization over the first 15 years of the lease term and (ii) the tenant broker fee based on a straight-line amortization over the first 15 years of the lease term. |
| (5) | The City of New York occupies 2,000 square feet of retail space on the ground floor, representing 15.9% of the retail space at the 469 7th Avenue Property. |
| (6) | In Touch Group may terminate its lease for all three floors on September 30, 2028 upon at least 15 months’ notice and no termination fee. In Touch Group is not fully utilizing its seventh floor space. |
| (7) | TD Bank, N.A. occupies 39.7% of the ground floor retail space. |
| (8) | Shindo USA, Inc. occupies 26.2% of the ground floor retail space. |
THE INFORMATION IN THIS STRUCTURAL AND COLLATERAL TERM SHEET IS NOT COMPLETE AND MAY BE AMENDED PRIOR TO THE TIME OF SALE. THIS TERM SHEET IS NOT AN OFFER TO SELL THESE SECURITIES AND IT IS NOT A SOLICITATION OF AN OFFER TO BUY THESE SECURITIES IN ANY JURISDICTION WHERE THE OFFER OR SALE IS NOT PERMITTED. |
| | 112 | |
| Structural and Collateral Term Sheet | | BMO 2022-C3 |
| |
| No. 8 – 469 7th Avenue |
The following table presents certain information relating to the tenant lease expirations of the 469 7th Avenue Property:
| Lease Rollover Schedule(1)(2) |
| Year | Number of Leases Expiring | NRA
Expiring | % of NRA
Expiring | UW Base
Rent
Expiring(3) | % of UW
Base Rent Expiring(3) | Cumulative
Net Rentable Area Expiring | Cumulative
% of NRA Expiring | Cumulative UW Base Rent Expiring(3) | Cumulative% of UW Base Rent Expiring(3) |
| Vacant | NAP | 34,000 | | 12.6 | % | NAP | NAP | 34,000 | | 12.6% | | NAP | | NAP | |
| 2022 & MTM | 1 | 845 | | 0.3 | | $15,000 | 0.1 | % | 34,845 | | 12.9% | | $15,000 | | 0.1 | % |
| 2023 | 0 | 0 | | 0.0 | | 0 | 0.0 | | 34845 | | 12.9% | | $15,000 | | 0.1 | % |
| 2024 | 0 | 0 | | 0.0 | | 0 | 0.0 | | 34,845 | | 12.9% | | $15,000 | | 0.1 | % |
| 2025 | 0 | 0 | | 0.0 | | 0 | 0.0 | | 34,845 | | 12.9% | | $15,000 | | 0.1 | % |
| 2026 | 3 | 17,000 | | 6.3 | | 1,103,305 | 8.1 | | 51,845 | | 19.3% | | $1,118,305 | | 8.2 | % |
| 2027 | 3 | 37,000 | | 13.7 | | 2,194,722 | 16.0 | | 88,845 | | 33.0% | | $3,313,028 | | 24.2 | % |
| 2028 | 1 | 3,500 | | 1.3 | | 119,976 | 0.9 | | 92,345 | | 34.3% | | $3,433,004 | | 25.1 | % |
| 2029 | 6 | 84,000 | | 31.2 | | 4,174,888 | 30.5 | | 176,345 | | 65.5% | | $7,607,892 | | 55.6 | % |
| 2030 | 2 | 7,288 | | 2.7 | | 1,322,545 | 9.7 | | 183,633 | | 68.2% | | $8,930,437 | | 65.3 | % |
| 2031 | 5 | 68,600 | | 25.5 | | 3,842,940 | 28.1 | | 252,233 | | 93.7% | | $12,773,377 | | 93.4 | % |
| 2032 | 1 | 17,000 | | 6.3 | | 903,751 | 6.6 | | 269,233 | | 100.0% | | $13,677,128 | | 100.0 | % |
| 2033 & Beyond | 0 | 0 | | 0.0 | | 0 | 0.0 | | 269,233 | | 100.0% | | $13,677,128 | | 100.0 | % |
| Total | 22 | 269,233 | 100.0 | % | $13,677,128 | 100.0 | % | | | | |
| (1) | Based on the underwritten rent roll dated June 23, 2022. |
| (2) | Certain leases may have termination options that are exercisable prior to the originally stated expiration date of the lease and that are not considered in this Lease Rollover Schedule. |
| (3) | UW Base Rent Expiring, % of UW Base Rent Expiring, Cumulative UW Base Rent Expiring and Cumulative % of UW Base Rent Expiring are inclusive of approximately $849,437 comprised of (i) straight-line rent averaging over the lease term for investment grade tenants, The City of New York and TD Bank, N.A., plus (ii) contractual rent steps through August 1, 2023. |
The following table presents certain information relating to the underwritten cash flows of the 469 7th Avenue Property:
| Operating History and Underwritten Net Cash Flow(1) |
| | 2019 | 2020 | 2021 | TTM(2) | Underwritten | Per
Square Foot | %(3) |
| Base Rent | $14,334,178 | | $14,449,534 | | $12,556,145 | | $12,879,163 | | $12,827,691 | | $47.65 | | 78.4 | % |
| Rent Steps(4) | 0 | | 0 | | 0 | | 0 | | 849,437 | | 3.16 | | 5.2 | |
| Vacant Income | 0 | | 0 | | 0 | | 0 | | 2,040,000 | | 7.58 | | 12.5 | |
| Gross Potential Rent | $14,334,178 | | $14,449,534 | | $12,556,145 | | $12,879,163 | | $15,717,128 | | $58.38 | | 96.1 | % |
| Total Reimbursements | 905,083 | | 1,090,191 | | 945,331 | | 550,642 | | 644,099 | | 2.39 | | 3.9 | |
| Net Rental Income | $15,239,261 | | $15,539,725 | | $13,501,476 | | $13,429,805 | | $16,361,227 | | $60.77 | | 100.0 | % |
| Vacancy | 0 | | 0 | | 0 | | 0 | | (2,040,000) | | (7.58 | ) | (12.5 | ) |
| Other Income(5) | 1,422,281 | | 1,440,573 | | 1,365,072 | | 1,349,467 | | 1,338,565 | | 4.97 | | 8.2 | |
| Effective Gross Income | $16,661,542 | | $16,980,298 | | $14,866,548 | | $14,779,272 | | $15,659,792 | | $58.16 | | 95.7 | % |
| Total Expenses | $5,985,968 | | $6,128,753 | | $6,078,021 | | $5,718,487 | | $6,447,392 | | $23.95 | | 41.2 | % |
| Net Operating Income(6) | $10,675,574 | | $10,851,545 | | $8,788,527 | | $9,060,785 | | $9,212,401 | | $34.22 | | 58.8 | % |
| Cap Ex, Total TI / LC | 0 | | 0 | | 0 | | 0 | | 753,172 | | 2.80 | | 4.8 | |
| Net Cash Flow | $10,675,574 | | $10,851,545 | | $8,788,527 | | $9,060,785 | | $8,459,229 | | $31.42 | | 54.0 | % |
| (1) | Based on the underwritten rent roll dated June 23, 2022. |
| (2) | TTM reflects the trailing 12 months ending May 31, 2022. |
| (3) | % column represents percent of Net Rental Income for all revenue lines and represents percent of Effective Gross Income for the remainder of the fields. |
| (4) | Rent Steps include approximately $849,437 comprised of (i) straight-line rent averaging for investment grade tenants, The City of New York and TD Bank, N.A., plus (ii) contractual rent steps through August 1, 2023. |
| (5) | Other Income includes electricity reimbursements, cleaning reimbursements and miscellaneous income. |
| (6) | Underwritten Net Operating Income is greater than TTM and 2021 Net Operating Income due in part to approximately $849,437 comprised of (i) straight-line averaging rent over the lease term for investment grade tenants, The City of New York and TD Bank, N.A., plus (ii) contractual rent steps through August 1, 2023. |
The Market. The 469 7th Avenue Property is situated in the Garment District neighborhood of New York, New York, which neighborhood is bordered by 40th Street to the north, 34th Street to the south, Avenue of the Americas to the east and Ninth
THE INFORMATION IN THIS STRUCTURAL AND COLLATERAL TERM SHEET IS NOT COMPLETE AND MAY BE AMENDED PRIOR TO THE TIME OF SALE. THIS TERM SHEET IS NOT AN OFFER TO SELL THESE SECURITIES AND IT IS NOT A SOLICITATION OF AN OFFER TO BUY THESE SECURITIES IN ANY JURISDICTION WHERE THE OFFER OR SALE IS NOT PERMITTED. |
| | 113 | |
| Structural and Collateral Term Sheet | | BMO 2022-C3 |
| |
| No. 8 – 469 7th Avenue |
Avenue to the west. The 469 7th Avenue Property is located two blocks north of the 34th Street subway and PATH stations, which services the B, D, F, M, N, Q, R and W subway lines and the PATH Train to New Jersey as well as Penn Station, which services the 1, 2, 3, A, C and E subway lines, NJ Transit and the Long Island Railroad. The recently redeveloped Moynihan Train Station is located three blocks southwest of the 469 7th Avenue Property, was completed in early 2021, and is currently open to the public. The redevelopment featured a $1.6 billion investment into the Farley Post Office and has expanded Penn Station to the west and created a brand-new transit-oriented development that comprises over 1.0 million square feet. In addition, the 469 7th Avenue Property is located just north of 34th Street, which serves as the main retail corridor within this area of Manhattan. Currently, there are over 175 retailers located within the district primarily along West 34th Street between Fifth and Ninth Avenues. The entire northern blockfront of West 34th Street between Broadway and Seventh Avenues is home to Macy’s flagship store. In addition, other major tenants include H&M, Banana Republic, Old Navy, Victoria’s Secret, Uniqlo, Zara, Aldo, Amazon, Footlocker, Desigual, Urban Outfitters, Express, Forever 21, American Eagle Outfitters, Build-A-Bear and other mid-level retailers.
According to a third-party market research report, the 469 7th Avenue Property is located in the Penn Plaza/Garment office submarket of the New York City market. As of June 2022, the Penn Plaza/Garment office submarket reported total inventory of approximately 84.6 million SF with an 11.5% vacancy rate and average asking rent of $66.94 PSF. The appraiser concluded to a market rent for the office space at the 469 7th Avenue Property of $58.00 PSF for floors 2 to 10 and $60.00 PSF for floors 11 to 16, both on a modified gross basis.
The following table presents certain information relating to the appraisal’s market rent conclusions for the 469 7th Avenue Property:
| Market Rent Summary(1) |
| | Office Floors 2-10 | Office Floors 11-16 | Retail Corner | Retail Seventh Avenue | Retail Side Street | Retail Mezzanine | Storage Lower Level |
| Market Rent (PSF) | $58.00 | $60.00 | $225.00 | $150.00 | $100.00 | $25.00 | $20.00 |
| Lease Term (Years) | 10 | 10 | 10 | 10 | 10 | 10 | 10 |
| Lease Type | MG | MG | MG | MG | MG | MG | Gross |
The following table presents information relating to comparable office property sales for the 469 7th Avenue Property:
| Comparable Sales Summary(1) |
| Property Name/Location | Sale Date | Year Built/ Renovated | Total NRA (SF) | Occupancy | Sale Price | Sale Price PSF |
469 7th Avenue New York, NY | N/A | 1921/2012 | 269,233(2) | 87.4%(2) | NAP | NAP |
475 Fifth Avenue New York, NY | May-2022 | 1965/2017 | 276,000 | 97.0% | $290,000,000 | $1,050.72 |
110 East 42nd Street New York, NY | Jan-2022 | 1876/NAP | 222,968 | 83.0% | $117,075,000 | $525.08 |
498 Seventh Avenue New York, NY | Dec-2021 | 1920/2015 | 956,069 | 90.0% | $680,000,000 | $711.25 |
One Park Avenue New York, NY | July-2021 | 1926/2000 | 947,894 | 99.0% | $875,000,000 | $923.10 |
345 Seventh Avenue New York, NY | Sept-2021 | 1928/NAP | 212,197 | 50.0% | $107,000,000 | $504.25 |
15 West 47th Street New York, NY | Dec-2020 | 1926/NAP | 133,139 | 86.0% | $110,000,000 | $826.20 |
522 Fifth Avenue New York, NY | Sept-2020 | 1919/1995 | 536,520 | 100.0% | $350,000,000 | $652.35 |
1375 Broadway New York, NY | July-2020 | 1927/NAP | 518,578 | 100.0% | $435,000,000 | $838.83 |
| (2) | Based on the underwritten rent roll dated June 23, 2022. |
THE INFORMATION IN THIS STRUCTURAL AND COLLATERAL TERM SHEET IS NOT COMPLETE AND MAY BE AMENDED PRIOR TO THE TIME OF SALE. THIS TERM SHEET IS NOT AN OFFER TO SELL THESE SECURITIES AND IT IS NOT A SOLICITATION OF AN OFFER TO BUY THESE SECURITIES IN ANY JURISDICTION WHERE THE OFFER OR SALE IS NOT PERMITTED. |
| | 114 | |
| Structural and Collateral Term Sheet | | BMO 2022-C3 |
| |
| No. 8 – 469 7th Avenue |
The following table presents information relating to comparable office properties for the 469 7th Avenue Property:
| Comparable Office Properties Summary(1) |
| Property Name/Location | Office Area | Year Built/ Renovated | Stories | Sublease SF Available | % Occupied (Direct) | Average Asking Rent |
469 7th Avenue New York, NY | 269,233 (2) | 1921/2012 | 16 | NAP | 87.4%(2) | $58.14(2)(3) |
950 Sixth Avenue New York, NY | 369,000 | 1909/NAP | 12 | 29,018 | 100.0% | NAP |
1001 Sixth Avenue New York, NY | 250,000 | 1926/NAP | 25 | 7,447 | 82.1% | $58.00 |
10 West 33rd Street New York, NY | 453,600 | 1914/NAP | 12 | NAP | 92.3% | $43.00 |
111 West 33rd Street New York, NY | 744,237 | 1954/NAP | 26 | 197,705 | 98.7% | $65.00 |
7 West 34th Street New York, NY | 477,000 | 1901/NAP | 12 | NAP | 100.0% | NAP |
330 West 34th Street New York, NY | 722,000 | 1926/NAP | 18 | 74,346 | 97.7% | $90.00 |
333 West 34th Street New York, NY | 346,728 | 1953/NAP | 10 | 274,810 | 100.0% | NAP |
114 West 41st Street New York, NY | 350,000 | 1915/NAP | 22 | 15,931 | 81.5% | $65.00 |
11 West 42nd Street New York NY | 955,559 | 1927/NAP | 32 | 19,427 | 99.3% | $67.00 |
1250 Broadway New York NY | 777,825 | 1968/NAP | 39 | 57,332 | 97.2% | $70.00 |
| (2) | Based on the underwritten rent roll dated June 23, 2022. |
| (3) | Represents Underwritten Base Rent per SF, which includes approximately $849,437 of straight-line rent averaging for investment grade tenants, The City of New York and TD Bank, N.A., plus contractual rent steps through August 1, 2023. |
The Borrower. The borrower is 469 Holdings LLC, a Delaware limited liability company. The borrower is structured to be a single purpose bankruptcy-remote entity with two independent directors in its organizational structure. Legal counsel to the borrower delivered a non-consolidation opinion in connection with the origination of the 469 7th Avenue Whole Loan.
The Borrower Sponsor. The borrower sponsor and nonrecourse carveout guarantor is Martin Meyer. Martin Meyer is a principal of Meyer Equities LLC, a privately owned real estate investment entity with ownership interests in (i) four commercial properties in Manhattan, New York and (ii) a national shopping center portfolio as well as limited partnership investments and membership shares of 17 commercial properties in New York, New York.
Property Management. The 469 7th Avenue Property is managed by Meyer Equities LLC, an affiliate of the borrower sponsor.
Escrows and Reserves. At origination of the 469 7th Avenue Whole Loan, the borrower deposited approximately $1,080,225 into a real estate tax reserve account.
Tax Escrows – The borrower is required to deposit into a real estate tax reserve, on a monthly basis, 1/12 of the taxes that the lenders reasonably estimate will be payable over the next-ensuing 12-month period (initially estimated to be approximately $270,056).
Insurance Escrows – The borrower is required to deposit into an insurance reserve, on a monthly basis, 1/12 of the amount that will be sufficient to pay the insurance premiums due for the renewal of coverage afforded by such policies; provided, however, such insurance reserve has been conditionally waived so long as the borrower maintains a blanket policy meeting the requirements of the 469 7th Avenue Whole Loan documents.
TI / LC Reserve – The borrower is required to deposit into a tenant improvement and leasing commissions reserve, on a monthly basis, an amount equal to approximately $22,436, subject to a cap of $1,346,165.
THE INFORMATION IN THIS STRUCTURAL AND COLLATERAL TERM SHEET IS NOT COMPLETE AND MAY BE AMENDED PRIOR TO THE TIME OF SALE. THIS TERM SHEET IS NOT AN OFFER TO SELL THESE SECURITIES AND IT IS NOT A SOLICITATION OF AN OFFER TO BUY THESE SECURITIES IN ANY JURISDICTION WHERE THE OFFER OR SALE IS NOT PERMITTED. |
| | 115 | |
| Structural and Collateral Term Sheet | | BMO 2022-C3 |
| |
| No. 8 – 469 7th Avenue |
Replacement Reserve – The borrower is required to deposit into a replacement reserve, on a monthly basis, an amount equal to approximately $4,487, subject to a cap of $100,000.
Specified Tenant Reserve – During the continuance of a Specified Tenant Trigger Period (as defined below), the borrower is required to deposit (a) $558,000 with respect to The City of New York lease and (b) with respect to or relating to any other Specified Tenant (as defined below), an amount equal to all Specified Tenant excess cash flow for the interest accrual period immediately prior to the applicable monthly payment date, for tenant improvements and leasing commissions that may be incurred with respect to future leases of all or any portion of the related Specified Tenant space, provided, however, such amount on deposit will not exceed $100 per square foot of the applicable Specified Tenant space.
Lockbox / Cash Management. The 469 7th Avenue Whole Loan is structured with a hard lockbox and springing cash management. At origination of the 469 7th Avenue Whole Loan, the borrower was required to deliver a notice to each tenant directing each tenant to remit all payments under the applicable lease directly to the lender-controlled lockbox. All funds received by the borrower or the property manager are required to be deposited in a lockbox account immediately following receipt. All funds deposited into the lockbox are required to be released to the borrower on each business day unless a Trigger Period (as defined below) exists. Upon the occurrence and during the continuance of a Trigger Period, all funds in the lockbox account are required to be swept on each business day to a lender-controlled cash management account to be applied and disbursed in accordance with the 469 7th Avenue Whole Loan documents, and all excess cash flow funds remaining in the cash management account after the application of such funds in accordance with the 469 7th Avenue Whole Loan documents (i) if a Sweep Period (as defined below) exists, are required to be held by the lenders in an excess cash flow reserve account as additional collateral for the 469 7th Avenue Whole Loan and (ii) if no Sweep Period exists, are required to be returned to the borrower. Upon the cure of the applicable Trigger Period, so long as no other Trigger Period exists, the lenders are required to return any amounts remaining on deposit in the excess cash flow reserve account to the borrower. Upon an event of default under the 469 7th Avenue Whole Loan documents, the lenders have the right to apply funds to the debt in such priority as it may determine.
A “Trigger Period” means a period (A) commencing upon (i) the occurrence of an event of default under the 469 7th Avenue Whole Loan documents, (ii) the debt service coverage ratio falling below 1.35x for one calendar quarter, (iii) the occurrence and continuance of a Specified Tenant Trigger Period, (iv) a conviction for fraud or misappropriation of funds by (a) the borrower, the guarantor, the borrower sponsor or an affiliated manager or (b) any director or officer of the borrower, the guarantor, the borrower sponsor or an affiliated manager (unless, in the case of this clause (b), such director or officer has been terminated and no longer has any ownership interest in the borrower or any involvement with or role in the management, administration or operation of the borrower or the 469 7th Avenue Property) or (v) a property manager other than the affiliated manager becoming the debtor in or subject of any case or proceeding (whether voluntary or involuntary) under the bankruptcy code or makes any assignment for the benefit of creditors under the bankruptcy code or other creditors’ rights laws and (B) expiring upon (v) with regard to clause (i), the cure of such event of default, (w) with regard to clause (ii), the debt service coverage ratio being equal to or greater than 1.35x for one calendar quarter or the Collateral Cure Conditions (as defined below) are satisfied and remain satisfied, (x) with regard to clause (iii), a Specified Tenant Trigger Period ceasing to exist, (y) with regard to clause (iv), the payment or defeasance in full of all principal and interest on the 469 7th Avenue Whole Loan and all other amounts payable under the 469 7th Avenue Whole Loan documents or (z) with regard to clause (v), upon either (A) the replacement of such property manager with a new property manager pursuant to a new management agreement, or (B) if such Trigger Period is solely as a result of the filing of an involuntary petition, case or proceeding against the property manager where neither the property manager or any affiliate of the property manager solicited or caused to be solicited petitioning creditors or consented to or otherwise acquiesced in writing or joined in such involuntary petition, case or proceeding, upon the same being discharged or dismissed within 120 days of such filing, provided that, in the lenders’ reasonable opinion, such filing (after discharge or dismissal) does not materially and adversely affect the property manager's ability to perform its obligations under the management agreement or any of the 469 7th Avenue Whole Loan documents to which it is a party.
A “Specified Tenant Trigger Period” means a period (A) commencing upon the occurrence of a Specified Tenant Trigger Event (as defined below), and (B) expiring upon the first to occur of (i) the monthly payment date following the applicable Specified Tenant Trigger Event Cure (as defined below), or (ii) the payment or defeasance in full of the 469 7th Avenue Whole Loan.
A “Specified Tenant Trigger Event” means (i) a Specified Tenant giving notice of its intention to terminate, cancel or not to extend or renew its lease, (ii) on or prior to the date that is 12 months prior to the earlier of (x) the 469 7th Avenue Whole
THE INFORMATION IN THIS STRUCTURAL AND COLLATERAL TERM SHEET IS NOT COMPLETE AND MAY BE AMENDED PRIOR TO THE TIME OF SALE. THIS TERM SHEET IS NOT AN OFFER TO SELL THESE SECURITIES AND IT IS NOT A SOLICITATION OF AN OFFER TO BUY THESE SECURITIES IN ANY JURISDICTION WHERE THE OFFER OR SALE IS NOT PERMITTED. |
| | 116 | |
| Structural and Collateral Term Sheet | | BMO 2022-C3 |
| |
| No. 8 – 469 7th Avenue |
Loan maturity date and (y) then applicable expiration date under the applicable Specified Tenant lease, if the Specified Tenant does not extend or renew such Specified Tenant lease, (iii) if, on or prior to the date a Specified Tenant is required to notify the borrower of its election to extend or renew its lease, such Specified Tenant does not give notice, (iv) if a monetary default or material non-monetary default under a Specified Tenant lease occurs and continues beyond any applicable notice and/or cure period under such Specified Tenant lease, (v) a bankruptcy action of a Specified Tenant or guarantor of any Specified Tenant lease occurring, (vi) a Specified Tenant lease being terminated or no longer being in full force and effect, (vii) if a Specified Tenant “goes dark” (unless the sole reason the applicable Specified Tenant is not open for business is permitted in accordance with the 469 7th Avenue Whole Loan documents with respect to such Specified Tenant), vacates, ceases to occupy or ceases to conduct business in the ordinary course at the Specified Tenant space or a portion thereof, provided, however, that (A) “going dark” will not include a temporary cessation of operations in connection with remodeling, renovation or restoration of its leased premises, (B) the Specified Tenant entering into a sublease for all or a portion of its Specified Tenant space will not, in and of itself, constitute a "go dark" event as to the Specified Tenant, provided that such sublease was entered into in accordance with the applicable terms of the Specified Tenant lease and the 469 7th Avenue Whole Loan documents, and provided further, that the applicable subtenant takes (and remains in) possession of, and does not “go dark” at all or any portion of, the space demised pursuant to such sublease and (viii) a Specified Tenant that is a governmental authority (A) fails to timely appropriate or procure sufficient funds to satisfy its obligations under its lease or the applicable lease guaranty or (B) states or acknowledges in a public forum, otherwise admits in writing or gives notice to the borrower that it does not have sufficient funds to timely satisfy its obligations under its lease or the applicable lease guaranty.
A “Specified Tenant Trigger Event Cure” means (i) with respect to clause (i) of Specified Tenant Trigger Event, the date that (x) the applicable Specified Tenant revokes or rescinds all termination or cancellation notices, (y) the applicable Specified Tenant lease is extended on terms satisfying the requirements of the 469 7th Avenue Whole Loan documents or (z) all or substantially all of the applicable Specified Tenant space is leased to a replacement tenant in accordance with the requirements of the 469 7th Avenue Whole Loan documents, (ii) with respect to clause (ii) of Specified Tenant Trigger Event, the date that (x) the applicable Specified Tenant lease is extended on terms satisfying the requirements of the 469 7th Avenue Whole Loan documents or (y) all or substantially all of the applicable Specified Tenant space is leased to a replacement tenant, (iii) with respect to clause (iii) of Specified Tenant Trigger Event, the date that (x) the applicable Specified Tenant lease is extended on terms satisfying the requirements of the 469 7th Avenue Whole Loan documents or (y) all or substantially all of the applicable Specified Tenant space is leased to a replacement tenant, (iv) with respect to clause (iv) of Specified Tenant Trigger Event, a cure of the applicable event of default, (v) with respect to clause (v) of Specified Tenant Trigger Event, the affirmation of the Specified Tenant lease in the applicable bankruptcy proceeding and confirmation that the Specified Tenant is actually paying all rents and other amounts under its lease (or, if applicable, the discharge or dismissal of the applicable Specified Tenant lease guarantor from the applicable bankruptcy proceeding; provided that such bankruptcy (after dismissal or discharge) does not have an adverse effect on such Specified Tenant lease guarantor’s ability to perform its obligations under its lease guaranty), (vi) with respect to clause (vi) of Specified Tenant Trigger Event, all or substantially all of the applicable Specified Tenant space is leased to a replacement tenant, (vii) with respect to clause (vii) of Specified Tenant Trigger Event, the Specified Tenant re-commencing its normal business operations at its Specified Tenant space or a portion thereof and (viii) with respect to clause (viii) of Specified Tenant Trigger Event, the appropriation or procurement by the applicable Specified Tenant or the applicable lease guarantor, as the case may be, of sufficient funds to timely satisfy its obligations under the related Specified Tenant lease or the related lease guaranty.
A “Specified Tenant” means, as applicable, (i) The City of New York, (ii) In Touch Group (unless and until In Touch Group is no longer deemed a Specified Tenant in accordance with the requirements of the 469 7th Avenue Whole Loan documents) and (iii) any tenant at the 469 7th Avenue Property that, together with its affiliates, either (a) leases no less than 20% of the total rentable square footage of the 469 7th Avenue Property or (b) accounts for (or would account for) no less than 20% of the total in-place base rent at the 469 7th Avenue Property.
The “Collateral Cure Conditions” means the borrower will deposit cash into the excess cash flow account or will deliver to the lenders a letter of credit which, in either case, will serve as additional collateral for the 469 7th Avenue Whole Loan, in an amount equal to the Collateral Deposit Amount (as defined below) (such deposit, a “Collateral Cure Deposit”). A Collateral Cure Deposit will be sufficient to suspend a Trigger Period and/or a Sweep Period, but in each case only to the extent arising pursuant to clause (A)(ii) of the definition thereof, for a period of one year from the date of such Collateral Cure Deposit. Thereafter, for so long as the borrower elects to satisfy the Collateral Cure Conditions in order to suspend a Trigger Period and/or Sweep Period arising pursuant to clause (A)(ii) of the definition thereof, the Collateral Cure
THE INFORMATION IN THIS STRUCTURAL AND COLLATERAL TERM SHEET IS NOT COMPLETE AND MAY BE AMENDED PRIOR TO THE TIME OF SALE. THIS TERM SHEET IS NOT AN OFFER TO SELL THESE SECURITIES AND IT IS NOT A SOLICITATION OF AN OFFER TO BUY THESE SECURITIES IN ANY JURISDICTION WHERE THE OFFER OR SALE IS NOT PERMITTED. |
| | 117 | |
| Structural and Collateral Term Sheet | | BMO 2022-C3 |
| |
| No. 8 – 469 7th Avenue |
Conditions will continue to be satisfied only if the borrower deposits additional cash collateral in the amount of the Collateral Deposit Amount or increases the amount of the letter of credit previously delivered as a Collateral Cure Deposit by an amount equal to the Collateral Deposit Amount (as applicable) on or before the date that is 30 days prior to each one year anniversary of the date the debt service coverage ratio first having fallen below a debt service coverage ratio of 1.35x.
A “Collateral Deposit Amount” means the difference between (i) the underwritten cash flow necessary to achieve a debt service coverage ratio of 1.35x over a 12-month period and (ii) the underwritten cash flow necessary to achieve a debt service coverage ratio of 1.00x over a 12-month period.
A “Sweep Period” means a period (A) commencing upon the earliest of (i) the occurrence and continuance of an event of default or (ii) the debt service coverage ratio falling below 1.30x for one calendar quarter and (B) expiring upon (x) with regard to any Sweep Period commenced in connection with clause (i) above, the cure (if applicable) of such event of default, and (y) with regard to any Sweep Period commenced in connection with clause (ii) above, the date that the debt service coverage ratio is equal to or greater than 1.35x for one calendar quarter or the Collateral Cure Conditions are satisfied and remain satisfied.
Subordinate Debt. None.
Mezzanine Debt. None.
Partial Release. Not Permitted.
Ground Lease. None.
Temporary Certificate of Occupancy. In New York City, a permanent or temporary certificate of occupancy is required for the lawful occupancy of a building that was built or significantly altered after 1938, including the 469 7th Avenue Property. A permanent certificate of occupancy had been issued by the City of New York Department of Buildings for the 469 7th Avenue Property, most recently in 1988. According to the borrower’s architect, that permanent certificate of occupancy remains in effect for the originally approved uses of the 469 7th Avenue Property. A temporary certificate of occupancy was issued on October 1, 2014, in connection with work at the 469 7th Avenue Property required under the lease with the City of New York. The temporary certificate of occupancy reflecting the alterations was not renewed when it lapsed in January 2015. Were enforcement action to be taken, the second floor of the 469 7th Avenue Property (which is a portion of the space leased to the City of New York, for occupancy by the New York City Police Department) could not be lawfully occupied until issuance of a valid temporary certificate of occupancy. The borrower has represented that (A) in connection with certain renovations to the 469 7th Avenue Property, a temporary certificate of occupancy is in the process of being issued with respect to the 469 7th Avenue Property (such temporary certificate of occupancy, together with any renewal thereof in accordance with all applicable legal requirements (including, without limitation, covering all then current uses of the 469 7th Avenue Property), as applicable, the “TCO”), and (B) it has satisfied, in all material respects, all outstanding conditions that are necessary for the legal occupancy of the 469 7th Avenue Property (other than ministerial and/or document filing conditions), has submitted evidence thereof to the New York City Department of Buildings, and has no present actual knowledge of any conditions which would result in (i) the TCO not being issued, (ii) after its issuance, of a revocation of the TCO (other than ministerial and/or document filing conditions), (iii) a non-renewal of the TCO (other than ministerial and/or document filing conditions), or (iv) non-issuance of a permanent certificate of occupancy (other than ministerial and/or document filing conditions) for the 469 7th Avenue Property. Furthermore, the borrower has covenanted to (a) use its commercially reasonable efforts and diligently and in good faith cause the TCO to be issued as promptly as possible, (b) once the TCO is issued, maintain the TCO and to cause the TCO to be continuously renewed at all times until a permanent certificate of occupancy is issued, and (c) diligently and in good faith pursue completion of all of the conditions thereto required under applicable legal requirements including, without limitation, causing any violations with respect to the 469 7th Avenue Property to be removed of record. An August 23, 2022 letter from the borrower’s architect states that an inspection of the 469 7th Avenue Property on August 15, 2022 identified three items that the borrower was required to correct before the TCO is issued, and the architect’s letter states that all such items were corrected.
THE INFORMATION IN THIS STRUCTURAL AND COLLATERAL TERM SHEET IS NOT COMPLETE AND MAY BE AMENDED PRIOR TO THE TIME OF SALE. THIS TERM SHEET IS NOT AN OFFER TO SELL THESE SECURITIES AND IT IS NOT A SOLICITATION OF AN OFFER TO BUY THESE SECURITIES IN ANY JURISDICTION WHERE THE OFFER OR SALE IS NOT PERMITTED. |
| | 118 | |
| Structural and Collateral Term Sheet | | BMO 2022-C3 |
| |
| No. 9 – Wells Fargo Center Tampa |
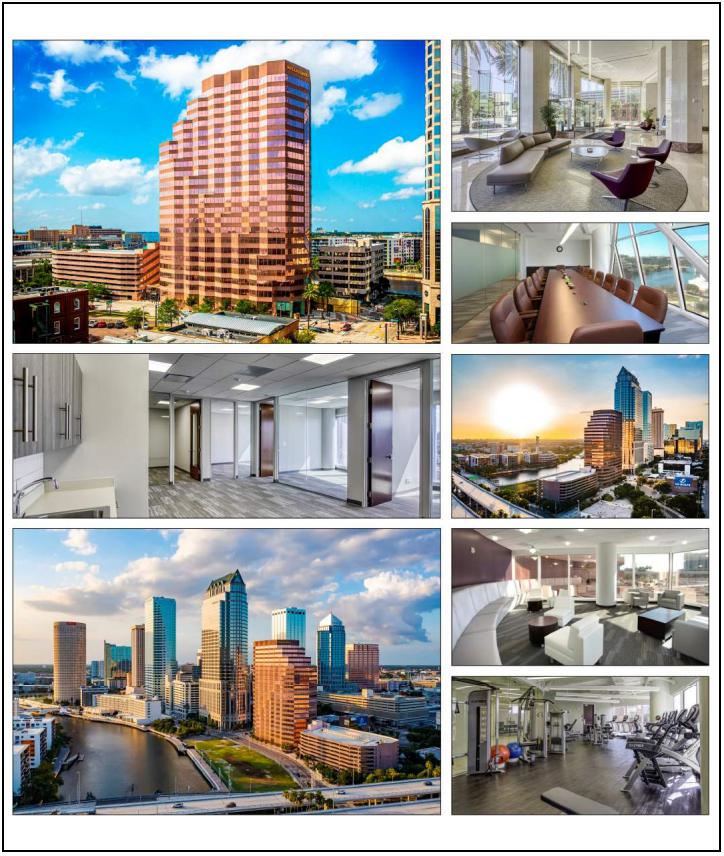
THE INFORMATION IN THIS STRUCTURAL AND COLLATERAL TERM SHEET IS NOT COMPLETE AND MAY BE AMENDED PRIOR TO THE TIME OF SALE. THIS TERM SHEET IS NOT AN OFFER TO SELL THESE SECURITIES AND IT IS NOT A SOLICITATION OF AN OFFER TO BUY THESE SECURITIES IN ANY JURISDICTION WHERE THE OFFER OR SALE IS NOT PERMITTED. |
| | 119 | |
| Structural and Collateral Term Sheet | | BMO 2022-C3 |
| |
| No. 9 – Wells Fargo Center Tampa |
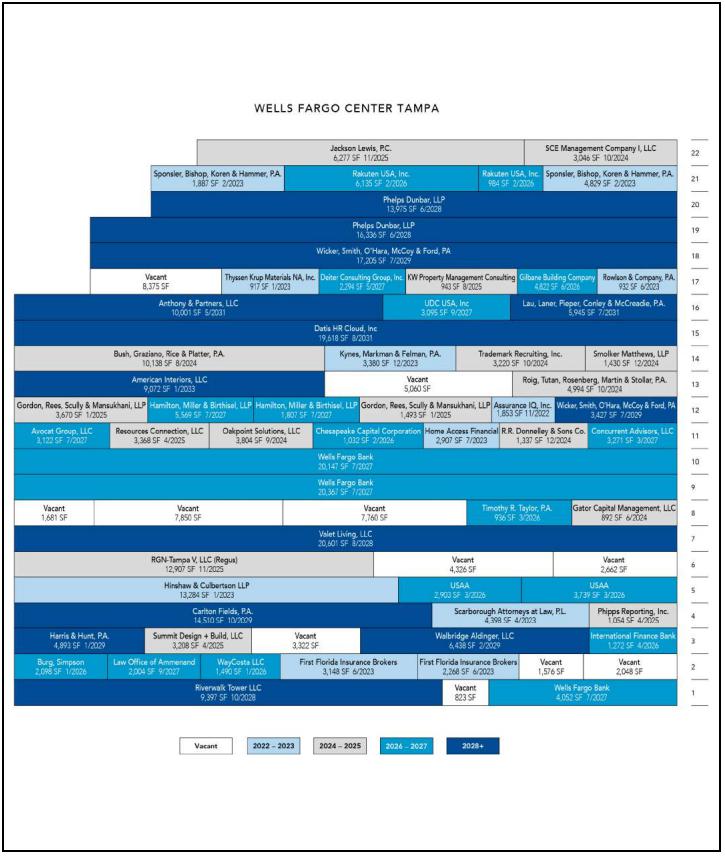
THE INFORMATION IN THIS STRUCTURAL AND COLLATERAL TERM SHEET IS NOT COMPLETE AND MAY BE AMENDED PRIOR TO THE TIME OF SALE. THIS TERM SHEET IS NOT AN OFFER TO SELL THESE SECURITIES AND IT IS NOT A SOLICITATION OF AN OFFER TO BUY THESE SECURITIES IN ANY JURISDICTION WHERE THE OFFER OR SALE IS NOT PERMITTED. |
| | 120 | |
| Structural and Collateral Term Sheet | | BMO 2022-C3 |
| |
| No. 9 – Wells Fargo Center Tampa |

THE INFORMATION IN THIS STRUCTURAL AND COLLATERAL TERM SHEET IS NOT COMPLETE AND MAY BE AMENDED PRIOR TO THE TIME OF SALE. THIS TERM SHEET IS NOT AN OFFER TO SELL THESE SECURITIES AND IT IS NOT A SOLICITATION OF AN OFFER TO BUY THESE SECURITIES IN ANY JURISDICTION WHERE THE OFFER OR SALE IS NOT PERMITTED. |
| | 121 | |
| Structural and Collateral Term Sheet | | BMO 2022-C3 |
| |
| No. 9 – Wells Fargo Center Tampa |
| Mortgage Loan Information | | Property Information |
| Mortgage Loan Seller: | CREFI | | Single Asset / Portfolio: | Single Asset |
| Original Principal Balance(1): | $30,000,000 | | Title: | Fee |
| Cut-off Date Principal Balance(1): | $30,000,000 | | Property Type – Subtype: | Office – CBD |
| % of IPB: | 4.1% | | Net Rentable Area (SF): | 389,624 |
| Loan Purpose: | Acquisition | | Location: | Tampa, FL |
| Borrowers(2): | Ashley Drive Associates LLC, | | Year Built / Renovated: | 1985 / 2022 |
| | Ashley Drive I Associates LLC, | | Occupancy: | 88.3% |
| | Ashley Drive II Associates LLC and | | Occupancy Date: | 6/30/2022 |
| | 100 South Ashley LLC | | 4th Most Recent NOI (As of): | $5,578,315 (12/31/2019) |
| Borrower Sponsors: | Jeffrey J. Feil and Abraham (Axel) | | 3rd Most Recent NOI (As of): | $5,460,306 (12/31/2020) |
| | Stawski | | 2nd Most Recent NOI (As of): | $5,168,658 (12/31/2021) |
| Interest Rate: | 5.72000% | | Most Recent NOI (As of): | $5,609,722 (TTM 6/30/2022) |
| Note Date: | 8/10/2022 | | UW Economic Occupancy: | 87.9% |
| Maturity Date: | 9/6/2032 | | UW Revenues: | $12,277,699 |
| Interest-only Period: | 120 months | | UW Expenses: | $4,842,520 |
| Original Term: | 120 months | | UW NOI: | $7,435,179 |
| Original Amortization Term: | None | | UW NCF: | $6,771,656 |
| Amortization Type: | Interest Only | | Appraised Value / Per SF: | $122,850,000 / $315 |
| Call Protection(3): | L(25),D(89),O(6) | | Appraisal Date: | 7/8/2022 |
| Lockbox / Cash Management: | Hard / Springing | | | |
| Additional Debt(1): | Yes | | | |
| Additional Debt Balance(1): | $43,000,000 | | | |
| Additional Debt Type(1): | Pari Passu | | | |
| | | | | |
| | | | | |
| Escrows and Reserves(4) | | Financial Information(1) |
| | Initial | Monthly | Initial Cap | | Cut-off Date Loan / SF: | $187 |
| Taxes: | $1,557,182 | $141,562 | N/A | | Maturity Date Loan / SF: | $187 |
| Insurance: | $0 | Springing | N/A | | Cut-off Date LTV: | 59.4% |
| Replacement Reserve: | $0 | $6,494 | N/A | | Maturity Date LTV: | 59.4% |
TI / LC: | $1,000,000 | $48,703 | N/A | | UW NCF DSCR: | 1.60x |
| Other: | $857,573 | $0 | N/A | | UW NOI Debt Yield: | 10.2% |
| | | | | | | |
| Sources and Uses |
| Sources | Proceeds | % of Total | | Uses | Proceeds | % of Total | |
| Whole Loan(1) | $73,000,000 | 58.1 | % | | Purchase Price | $120,000,000 | 95.6 | % |
| Principal’s New Cash Contribution | 49,333,167 | 39.3 | | | Upfront Reserves | 3,414,755 | 2.7 | |
| Other Sources | 3,238,840 | 2.6 | | | Closing Costs | 2,157,253 | 1.7 | |
| Total Sources | $125,572,008 | 100.0 | % | | Total Uses | $125,572,008 | 100.0 | % |
| (1) | The Wells Fargo Center Tampa Mortgage Loan (as defined below) is part of the Wells Fargo Center Tampa Whole Loan (as defined below), which is comprised of two pari passu promissory notes with an aggregate original balance of $73,000,000. The Wells Fargo Center Tampa Whole Loan was originated by Citi Real Estate Funding Inc. (“CREFI”). For additional information, see “The Loan” below. Financial information calculated based on the aggregate outstanding principal balance as of the Cut-off Date of the Wells Fargo Center Tampa Whole Loan. |
| (2) | The four entities collectively identified above as the Borrowers hold title to the Wells Fargo Center Tampa Property as tenants-in-common. |
| (3) | The lockout period will be at least 25 payment dates beginning with and including the first payment date in October 2022. Defeasance of the Wells Fargo Center Tampa Whole Loan is permitted at any time after the earlier to occur of (i) two years after the closing date of the securitization that includes the last promissory note to be securitized and (ii) August 10, 2025. The assumed lockout period of 25 payments is based on the expected BMO 2022-C3 securitization closing date in October 2022. The actual lockout period may be longer. |
| (4) | For full description of Escrows and Reserves, see “Escrows and Reserves” below. |
THE INFORMATION IN THIS STRUCTURAL AND COLLATERAL TERM SHEET IS NOT COMPLETE AND MAY BE AMENDED PRIOR TO THE TIME OF SALE. THIS TERM SHEET IS NOT AN OFFER TO SELL THESE SECURITIES AND IT IS NOT A SOLICITATION OF AN OFFER TO BUY THESE SECURITIES IN ANY JURISDICTION WHERE THE OFFER OR SALE IS NOT PERMITTED. |
| | 122 | |
| Structural and Collateral Term Sheet | | BMO 2022-C3 |
| |
| No. 9 – Wells Fargo Center Tampa |
The Loan. The ninth largest mortgage loan is part of a whole loan evidenced by two pari passu promissory notes in the aggregate original principal amount of $73,000,000 (the “Wells Fargo Center Tampa Whole Loan”) secured by a first lien mortgage on the borrowers’ fee simple interest in a 389,624 square feet office property located in Tampa, Florida (the “Wells Fargo Center Tampa Property”). The Wells Fargo Center Tampa Whole Loan was originated on August 10, 2022 by CREFI and accrues interest at a fixed rate of 5.72000% per annum. The Wells Fargo Center Tampa Whole Loan has an initial term of 120 months, a remaining term of 119 months and is interest only for the full term. The scheduled maturity date of the Wells Fargo Center Tampa Whole Loan is the due date that occurs September 6, 2032. The non-controlling Note A-2 (the “Wells Fargo Center Tampa Mortgage Loan”), with a cut-off date balance of $30,000,000, will be included in the BMO 2022-C3 securitization trust. The Wells Fargo Center Tampa Mortgage Loan will be serviced pursuant to the pooling and servicing agreement for the BMO 2022-C3 securitization until the securitization of the controlling Note A-1, after which point it will be serviced pursuant to the pooling and servicing agreement for such securitization. The table below summarizes the promissory notes that comprise the Wells Fargo Center Tampa Whole Loan. See “Description of the Mortgage Pool—The Whole Loans—The Serviced Pari Passu Whole Loans” in the Preliminary Prospectus.
| Whole Loan Summary |
| Note | Original Balance | Cut-off Date Balance | Note Holder | Controlling Piece |
| A-1(1) | $43,000,000 | $43,000,000 | CREFI | Yes |
| A-2 | $30,000,000 | $30,000,000 | BMO 2022-C3 | No |
| Whole Loan | $73,000,000 | $73,000,000 | | |
| (1) | Expected to be contributed to one or more future securitization transactions. |
The Property. The Wells Fargo Center Tampa Property is a 389,624 SF, 22-story office building located in Tampa, Florida. The Wells Fargo Center Tampa Property was constructed in 1985, renovated in 2022, and is situated on a 1.48-acre site. The Wells Fargo Center Tampa Property includes an adjacent 9-story parking garage with 519 covered and uncovered parking spaces resulting in a parking ratio of 1.33 spaces per 1,000 square feet of net rentable area. Since 2009, the Wells Fargo Center Tampa Property has received $8,400,000 in capital improvements, including a roof replacement, elevator modernizations, lobby and common area upgrades, parking garage improvements, exterior improvements and recent enhancements to the HVAC equipment. The Wells Fargo Center Tampa Property amenities include a first-class fitness center, a full menu café and tenant lounge with Wi-Fi, a state-of-the art conference center, courtesy shuttle service, and a full-service bank branch. As of June 30, 2022, the Wells Fargo Center Tampa Property was 88.3% leased to 50 tenants with no tenant accounting for more than 13.7% of the underwritten base rent and 11.4% of net rentable area.
COVID-19 Update. As of August 10, 2022, the Wells Fargo Center Tampa Property is open and operational and there were no outstanding rent relief requests. The first payment date of the Wells Fargo Center Tampa Mortgage Loan is October 6, 2022.
Major Tenants. The three largest tenants based on underwritten base rent are Wells Fargo Bank, Phelps Dunbar, LLP and Wicker, Smith, O'Hara, McCoy & Ford, PA.
The largest tenant based on underwritten base rent at the Wells Fargo Center Tampa Property is Wells Fargo Bank (44,566 square feet, 11.4% of NRA; 13.7% of underwritten base rent). Founded in 1852, and headquartered in San Francisco, Wells Fargo Bank provides banking, investment and mortgage products and services, as well as consumer and commercial finance through more than 7,200 locations, more than 13,000 ATMs, the internet, and mobile banking and has offices in 31 countries and territories to support customers who conduct business in the global economy. Wells Fargo Bank has two, five-year renewal options and the option to partially terminate its lease and give back either the entire ninth floor (20,367 square feet) or tenth floor (20,147 square feet) effective on July 31, 2025 with notice no later than August 31, 2023 and payment of a contraction fee. Wells Fargo Bank has occupied space at the Wells Fargo Center Tampa Property since 1994 and serves as the brand anchor tenant of the Wells Fargo Center Tampa Property.
The second largest tenant based on underwritten base rent at the Wells Fargo Center Tampa Property is Phelps Dunbar, LLP (30,311 square feet, 7.8% of NRA; 8.3% of underwritten base rent). Phelps Dunbar, LLP is a law firm with 11 office locations in the United States and London focusing on six core areas which are labor, employment, litigation, business, admiralty, insurance coverage and healthcare. Phelps Dunbar, LLP has occupied space at the Wells Fargo Center Tampa Property since 2017. Phelps Dunbar, LLP has two, five-year renewal options and the right to terminate its lease on October 31, 2024 with a written notice no later than October 31, 2023 and the payment of a termination fee.
THE INFORMATION IN THIS STRUCTURAL AND COLLATERAL TERM SHEET IS NOT COMPLETE AND MAY BE AMENDED PRIOR TO THE TIME OF SALE. THIS TERM SHEET IS NOT AN OFFER TO SELL THESE SECURITIES AND IT IS NOT A SOLICITATION OF AN OFFER TO BUY THESE SECURITIES IN ANY JURISDICTION WHERE THE OFFER OR SALE IS NOT PERMITTED. |
| | 123 | |
| Structural and Collateral Term Sheet | | BMO 2022-C3 |
| |
| No. 9 – Wells Fargo Center Tampa |
The third largest tenant based on underwritten base rent at the Wells Fargo Center Tampa Property is Wicker, Smith, O'Hara, McCoy & Ford, PA (20,632 square feet, 5.3% of NRA; 6.4% of underwritten base rent). Wicker, Smith, O'Hara, McCoy & Ford, PA is a law firm established in 1952 and has over 260 attorneys across 16 offices with 12 Florida locations. Wicker, Smith, O'Hara, McCoy & Ford, PA represents professionals and multinational corporations in litigation, as well as business and transactional law. Wicker, Smith, O'Hara, McCoy & Ford, PA has occupied space at the Wells Fargo Center Tampa Property since 2021.
Environmental. According to the Phase I environmental report dated May 3, 2022, there are no recognized environmental conditions or recommendations for further action at the Wells Fargo Center Tampa Property. An Asbestos O&M Plan was provided at loan origination.
The following table presents certain information relating to the historical and current occupancy of the Wells Fargo Center Tampa Property:
| Historical and Current Occupancy(1) |
| 2019 | 2020 | 2021 | Current(2) |
| 83.3% | 84.0% | 81.8% | 88.3% |
| (1) | Historical occupancies are the annual average physical occupancy of each respective year. |
| (2) | Current occupancy is as of June 30, 2022. |
The following table presents certain information relating to the largest tenants based on underwritten base rent of the Wells Fargo Center Tampa Property:
| Top Tenant Summary(1) |
| Tenant | Ratings Moody’s/S&P/Fitch(2) | Net Rentable Area (SF) | % of Total NRA | UW Base Rent PSF(3) | UW Base Rent(3) | % of Total UW Base Rent(3) | Lease Expiration Date(4)(5) |
| Wells Fargo Bank(4) | A1/BBB+/NR | 44,566 | 11.4 | % | $33.01 | $1,470,945 | 13.7 | % | 7/31/2027 |
| Phelps Dunbar, LLP(5) | NR/NR/NR | 30,311 | 7.8 | | $29.42 | 891,647 | 8.3 | | 6/30/2028 |
| Wicker, Smith, O'Hara, McCoy & Ford, PA | NR/NR/NR | 20,632 | 5.3 | | $33.48 | 690,673 | 6.4 | | 7/31/2029 |
| Valet Living, LLC | NR/NR/NR | 20,601 | 5.3 | | $30.77 | 633,893 | 5.9 | | 8/31/2028 |
| Datis HR Cloud, Inc | NR/NR/NR | 19,618 | 5.0 | | $31.14 | 610,999 | 5.7 | | 8/31/2031 |
| Hinshaw & Culbertson LLP | NR/NR/NR | 13,284 | 3.4 | | $31.52 | 418,712 | 3.9 | | 1/31/2023 |
| Carlton Fields, P.A.(6) | NR/NR/NR | 14,510 | 3.7 | | $28.00 | 406,280 | 3.8 | | 10/31/2029 |
| RGN-Tampa V, LLC (Regus) | NR/NR/NR | 12,907 | 3.3 | | $26.43 | 341,132 | 3.2 | | 11/30/2025 |
| Bush, Graziano, Rice & Platter, P.A. | NR/NR/NR | 10,138 | 2.6 | | $30.45 | 308,685 | 2.9 | | 8/31/2024 |
| Anthony & Partners, LLC | NR/NR/NR | 10,001 | 2.6 | | $30.60 | 306,031 | 2.8 | | 5/31/2031 |
| Largest Tenants | | 196,568 | 50.5 | % | $30.93 | $6,078,997 | 56.5 | % | |
| Remaining Tenants | | 147,573 | 37.9 | | $31.72 | 4,681,085 | 43.5 | % | |
| Total Occupied | | 344,141 | 88.3 | % | $31.27 | $10,760,081 | 100.0 | % | |
| Vacant Space | | 45,483 | 11.7 | | | | | |
| Total / Wtd. Avg. | | 389,624 | 100.0 | % | | | | |
| (1) | Based on underwritten rent roll dated as of June 30, 2022. |
| (2) | In certain instances, ratings are those of the parent company whether or not the parent guarantees the lease. |
| (3) | UW Base Rent, % of Total UW Base Rent and UW Base Rent $ PSF include contractual rent steps of $344,859 underwritten for various tenants through August 1, 2023. |
| (4) | Wells Fargo Bank has the option to partially terminate its lease and give back either the entire ninth floor (20,367 square feet) or tenth floor (20,147 square feet) effective on July 31, 2025 with notice no later than August 31, 2023 and payment of a contraction fee. |
| (5) | Phelps Dunbar, LLP has the right to terminate its lease on October 31, 2024 with a written notice no later than October 31, 2023 and the payment of a termination fee. |
| (6) | Carlton Fields, P.A. has the right to terminate its lease on October 31, 2026 with a written notice no later than October 31, 2025 and the payment of a termination fee. |
THE INFORMATION IN THIS STRUCTURAL AND COLLATERAL TERM SHEET IS NOT COMPLETE AND MAY BE AMENDED PRIOR TO THE TIME OF SALE. THIS TERM SHEET IS NOT AN OFFER TO SELL THESE SECURITIES AND IT IS NOT A SOLICITATION OF AN OFFER TO BUY THESE SECURITIES IN ANY JURISDICTION WHERE THE OFFER OR SALE IS NOT PERMITTED. |
| | 124 | |
| Structural and Collateral Term Sheet | | BMO 2022-C3 |
| |
| No. 9 – Wells Fargo Center Tampa |
The following table presents certain information relating to the tenant lease expirations of the Wells Fargo Center Tampa Property:
| Lease Rollover Schedule(1)(2) |
Year | Number of Leases Expiring | Net Rentable Area Expiring | % of Net Rental Area Expiring | UW Base Rent Expiring(3) | % of UW Base Rent Expiring | Cumulative Net Rentable Area Expiring | Cumulative % of NRA Expiring | Cumulative UW Base Rent Expiring(3) | Cumulative % of UW Base Rent Expiring |
| Vacant | NAP | 45,483 | 11.7% | NAP | NA | P | 45,483 | 11.7% | NAP | NAP |
| MTM | 0 | 0 | 0.0% | $0 | 0.0 | % | 45,483 | 11.7% | $0 | 0.0% |
| 2022 | 1 | 1,853 | 0.5 | 61,757 | 0.6 | | 47,336 | 12.1% | $61,757 | 0.6% |
| 2023 | 8 | 37,950 | 9.7 | 1,191,408 | 11.1 | | 85,286 | 21.9% | $1,253,166 | 11.6% |
| 2024 | 8 | 28,861 | 7.4 | 907,222 | 8.4 | | 114,147 | 29.3% | $2,160,387 | 20.1% |
| 2025 | 7 | 32,920 | 8.4 | 997,955 | 9.3 | | 147,067 | 37.7% | $3,158,343 | 29.4% |
| 2026 | 8 | 25,411 | 6.5 | 805,413 | 7.5 | | 172,478 | 44.3% | $3,963,756 | 36.8% |
| 2027 | 7 | 65,728 | 16.9 | 2,191,471 | 20.4 | | 238,206 | 61.1% | $6,155,227 | 57.2% |
| 2028 | 3 | 60,309 | 15.5 | 1,772,682 | 16.5 | | 298,515 | 76.6% | $7,927,909 | 73.7% |
| 2029 | 4 | 46,473 | 11.9 | 1,421,039 | 13.2 | | 344,988 | 88.5% | $9,348,948 | 86.9% |
| 2030 | 0 | 0 | 0.0 | 0 | 0.0 | | 344,988 | 88.5% | $9,348,948 | 86.9% |
| 2031 | 3 | 35,564 | 9.1 | 1,107,448 | 10.3 | | 380,552 | 97.7% | $10,456,396 | 97.2% |
| 2032 & Beyond | 1 | 9,072 | 2.3 | 303,685 | 2.8 | | 389,624 | 100.0% | $10,760,081 | 100.0% |
| Total | 50 | 389,624 | 100.0% | $10,760,081 | 100.0 | % | | | | |
| (1) | Based on the underwritten rent roll dated June 30, 2022. |
| (2) | Certain leases may have termination options that are exercisable prior to the originally stated expiration date of the lease and that are not considered in this Lease Rollover Schedule. |
| (3) | UW Base Rent Expiring and Cumulative UW Base Rent Expiring include contractual rent steps of $344,859 underwritten for various tenants through August 1, 2023. |
The following table presents certain information relating to the underwritten cash flows of the Wells Fargo Center Tampa Property:
Operating History and Underwritten Net Cash Flow |
| | 2019 | 2020 | 2021 | TTM(1) | Underwritten | Per Square Foot | %(2) |
| Rents in Place(3) | $8,419,217 | $8,160,568 | $8,210,474 | $8,706,908 | $10,415,223 | $26.73 | 82.6% |
| Contractual Rent Steps(4) | 0 | 0 | 0 | 0 | 344,859 | 0.89 | 2.7% |
| Gross Potential Rent | $8,419,217 | $8,160,568 | $8,210,474 | $8,706,908 | $10,760,081 | $27.62 | 85.3% |
| Potential Income from | 0 | 0 | 0 | 0 | 1,520,099 | 3.90 | 12.1% |
| Vacant Space | | | | | | 0.00 | |
| Total Reimbursements | 517,458 | 528,005 | 308,607 | 406,044 | 328,451 | 0.84 | 2.6% |
| Net Rental Income | $8,936,675 | $8,688,573 | $8,519,081 | 9,112,952 | $12,608,631 | $32.36 | 100.0% |
| (Vacancy/Credit Loss) | 0 | 0 | 0 | 0 | (1,520,099) | (3.90) | (12.1%) |
| Other Income(5) | 1,021,465 | 1,038,899 | 1,020,773 | 1,189,167 | 1,189,167 | 3.05 | 9.4% |
| Effective Gross Income | $9,958,140 | $9,727,472 | $9,539,855 | $10,302,119 | $12,277,699 | $31.51 | 97.4% |
| Total Expenses | $4,379,825 | $4,267,166 | $4,371,197 | $4,692,397 | $4,842,520 | $12.43 | 39.4% |
| Net Operating Income(6) | $5,578,315 | $5,460,306 | $5,168,658 | $5,609,722 | $7,435,179 | $19.08 | 60.6% |
| Total TI/LC, Cap Ex / RR | 0 | 0 | 0 | 0 | 663,523 | $1.70 | 5.4% |
| Net Cash Flow | $5,578,315 | $5,460,306 | $5,168,658 | $5,609,722 | $6,771,656 | $17.38 | 55.2% |
| (1) | TTM reflects the trailing 12 months ending June 30, 2022. |
| (2) | % column represents percent of Net Rental Income for all revenue fields and represents percent of Effective Gross Income for the remainder of fields. |
| (3) | Based on the underwritten rent roll dated as of June 30, 2022. |
| (4) | Contractual Rent Steps totaling $344,859 are underwritten through August 2023. |
| (5) | Other Income includes directly reimbursed expenses such as utilities and parking. |
| (6) | The increase from TTM Net Operating Income to Underwritten Net Operating Income is primarily attributable to potential income from vacant space and contractual rent steps. |
THE INFORMATION IN THIS STRUCTURAL AND COLLATERAL TERM SHEET IS NOT COMPLETE AND MAY BE AMENDED PRIOR TO THE TIME OF SALE. THIS TERM SHEET IS NOT AN OFFER TO SELL THESE SECURITIES AND IT IS NOT A SOLICITATION OF AN OFFER TO BUY THESE SECURITIES IN ANY JURISDICTION WHERE THE OFFER OR SALE IS NOT PERMITTED. |
| | 125 | |
| Structural and Collateral Term Sheet | | BMO 2022-C3 |
| |
| No. 9 – Wells Fargo Center Tampa |
The Market. The Wells Fargo Center Tampa Property is located in the Downtown Tampa submarket in Tampa, Florida, specifically near major transportation linkages such as the Selmon Expressway, Interstate 275, and Kennedy Boulevard. The Wells Fargo Center Tampa Property is located within the Central Business District of Tampa with Ashley Drive to the north, Selmon Expressway to the south, Florida Avenue to the east and Kennedy Boulevard to the west. Other local landmarks include Water Street Tampa, Tampa Riverwalk, Tampa Convention Center, Curtis Hixon Waterfront Park, Amalie Arena, and The Florida Aquarium. Tampa is part of the metropolitan area referred to as the Tampa Bay Area and is bordered by two bodies of water, Old Tampa Bay and Hillsborough Bay, both of which flow to form Tampa Bay, which in turn flows into the Gulf of Mexico. Tampa is an attractive location with a moderate climate and below-average cost of living. The Downtown Tampa submarket contains roughly 11.4 million square feet of office space and the Tampa office market has a vacancy rate of 9.0% with an average $33.33 per square feet market rent. Rents in the Downtown Tampa submarket posted a gain of 3.1% over the past 12 months. According to a third-party report there is an office inventory of approximately 18.9 million square feet, with an average vacancy rate of 6.1% and an average asking rental rate of $34.36 per square feet within a three-mile radius of the Wells Fargo Center Tampa Property as of the second quarter of 2022. The submarket exhibits a positive net absorption of 244,541 square feet as of the second quarter of 2022. Approximately 41,229 square feet in two projects are currently under construction within the vicinity of the Wells Fargo Center Tampa Property.
According to a third-party report, the estimated 2021 population within a one-, three- and five-mile radius of the Wells Fargo Center Tampa Property was 18,490, 103,900 and 235,709, respectively and the estimated 2021 average household income within the same radii was approximately $124,056, $99,208 and $96,082, respectively.
The following table presents certain information relating to the appraisal’s market rent conclusion for the Wells Fargo Center Tampa Property.
| | Market Rent Summary(1) |
| | Office Floors 1-5 | Office Floors 6-13 | Office Floors 14-20 | Office Floors 21-22 |
| Market Rent (Per Square Feet) | $32.50 | $33.50 | $33.50 / $34.00 | $35.00 |
| Lease Term (Years) | 5 | 5 | 5 | 5 |
| Lease Type (Reimbursements) | Base Year Stop | Base Year Stop | Base Year Stop | Base Year Stop |
| Contract Rent Increase Projection | 3.00% | 3.00% | 3.00% | 3.00% |
The following table presents certain information relating to comparable office sales for the Wells Fargo Center Tampa Property:
| Comparable Office Sales(1) |
Property Name / Location | NRA | Year Built / Renovated | Occupancy | Sale Date | Sale Price | Price PSF |
| Wells Fargo Center Tampa,Tampa, FL | 389,624(2) | 1985 / 2022 | 88.3 | %(2) | | | |
| Miami Tower, Miami, FL | 632,147 | 1987 / NAP | 69.0 | % | Jun-2022 | $162,500,000 | $257.06 |
| Wells Fargo Office Center, Tampa, FL | 389,624 | 1985 / NAP | 89.0 | % | May-2022 | $120,000,000 | $307.99 |
| Airport Executive Center, Tampa, FL | 238,325 | 1985 / NAP | 84.0 | % | Oct-2021 | $55,750,000 | $233.92 |
| Highwoods Preserve VII ,Tampa, FL | 115,230 | 2007 / NAP | 100.0 | % | Jun-2021 | $43,000,000 | $373.17 |
| Two Harbour Place, Tampa, FL | 187,666 | 1998 / NAP | 92.0 | % | Jun-2021 | $56,350,000 | $300.27 |
| (2) | Based on the underwritten rent roll dated as of June 30, 2022. |
The Borrowers. The borrowers comprise four tenants in common, Ashley Drive Associates LLC, Ashley Drive I Associates LLC, Ashley Drive II Associates LLC and 100 South Ashley LLC, each a Delaware limited liability company and single purpose entity with one independent director. The four entities collectively identified as the Borrowers hold title to the Wells Fargo Center Tampa Property as tenants-in-common. Legal counsel to the borrowers delivered a non-consolidation opinion in connection with the origination of the Wells Fargo Center Tampa Whole Loan.
THE INFORMATION IN THIS STRUCTURAL AND COLLATERAL TERM SHEET IS NOT COMPLETE AND MAY BE AMENDED PRIOR TO THE TIME OF SALE. THIS TERM SHEET IS NOT AN OFFER TO SELL THESE SECURITIES AND IT IS NOT A SOLICITATION OF AN OFFER TO BUY THESE SECURITIES IN ANY JURISDICTION WHERE THE OFFER OR SALE IS NOT PERMITTED. |
| | 126 | |
| Structural and Collateral Term Sheet | | BMO 2022-C3 |
| |
| No. 9 – Wells Fargo Center Tampa |
The Borrower Sponsors. The borrowers’ sponsors and non-recourse carveout guarantors are Jeffrey J. Feil and Abraham (Axel) Stawski. The Feil Organization has sponsored other loans originated by CREFI and is led by Jeffrey J. Feil, is an established family-owned investment, development and management firm based in New York City. The firm was founded by Louis Feil in the 1950s and manages 24 million SF of retail, commercial, and industrial property, 5,000 residential rental units, and thousands of acres of undeveloped land across the United States. Axel Stawski is the founder of Stawski Partners, a family-owned real estate manager and developer focusing on boutique properties and floor plans that allow resident customization and potential expansion.
Property Management. The Wells Fargo Center Tampa Property is currently managed by Jeffrey Management Corp., an affiliate of the borrower sponsors.
Escrows and Reserves. At origination of the Wells Fargo Center Tampa Whole Loan, the borrowers deposited (i) approximately $1,557,182 into a real estate tax reserve account, (ii) $1,000,000 into a tenant improvement and leasing commissions account, (iii) $622,047 into an unfunded obligation reserve account, and (iv) $235,526 into a gap rent reserve account.
Tax Escrows – The borrowers are required to deposit into a real estate tax reserve, on a monthly basis, 1/12 of the taxes that the lender reasonably estimates will be payable over the next-ensuing 12-month period (initially estimated to be approximately $141,562).
Insurance Escrows – The borrowers are required to deposit into an insurance reserve, on a monthly basis, 1/12 of the amount which will be sufficient to pay the insurance premiums due for the renewal of coverage afforded by such policies; provided, however, such insurance reserve has been conditionally waived so long as the borrowers maintain a blanket policy meeting the requirements of the Wells Fargo Center Tampa Whole Loan documents.
TI / LC Reserve – The borrowers are required to deposit into a tenant improvement and leasing commissions reserve, on a monthly basis, an amount equal to approximately $48,703.
Replacement Reserve – The borrowers are required to deposit into a replacement reserve, on a monthly basis, an amount equal to approximately $6,494.
Lockbox / Cash Management. The Wells Fargo Center Tampa Whole Loan is structured with a hard lockbox and springing cash management. At origination of the Wells Fargo Center Tampa Whole Loan, the borrowers were required to deliver a notice to each tenant directing such tenant to remit all payments under its lease directly to the lender-controlled lockbox. All funds received by the borrowers or the property manager are required to be deposited in a lockbox account promptly upon receipt. All funds deposited into the lockbox are required to be released to the borrowers on each business day unless a Trigger Period (as defined below) exists. Upon the occurrence and during the continuance of a Trigger Period, all funds in the lockbox account are required to be transferred on each business day to a lender-controlled cash management account to be applied and disbursed in accordance with the Wells Fargo Center Tampa Whole Loan documents, and all excess cash flow funds remaining in the cash management account after the application of such funds in accordance with the Wells Fargo Center Tampa Whole Loan documents are required to be held by the lender in an excess cash flow reserve account as additional collateral for the Wells Fargo Center Tampa Whole Loan. Upon the cure of the applicable Trigger Period, so long as no other Trigger Period exists, the lender is required to return any amounts remaining on deposit in the excess cash flow reserve account to the borrowers. Upon an event of default under the Wells Fargo Center Tampa Whole Loan documents, the lender will apply funds to the debt in such priority as it may determine.
A “Trigger Period” means a period (A) commencing upon (i) the occurrence and continuance of an event of default (subject to any applicable notice and cure period), (ii) the debt service coverage ratio falling below 1.25x (provided that a Trigger Period pursuant to this clause (ii) will not be deemed to exist to the extent that and for so long as the Collateral Cure Conditions (defined below) are satisfied), or (iii) the occurrence of a Specified Tenant Trigger Period (defined below); and (B) terminating upon, as applicable (i) the cure of the applicable event of default, (ii) the debt service coverage ratio remaining at or above 1.25x for two consecutive calendar quarters (calculated on an interest only basis), and (iii) a Specified Tenant Trigger Period ceasing to exist.
“Collateral Cure Conditions” mean the borrowers have deposited cash into an account with the lender or delivered a letter of credit which, in either case, serves as additional collateral for the Wells Fargo Center Tampa Whole Loan, in an amount equal to $1,043,900 (the “Collateral Deposit Amount”) and, thereafter, for so long as the borrowers elect to satisfy the
THE INFORMATION IN THIS STRUCTURAL AND COLLATERAL TERM SHEET IS NOT COMPLETE AND MAY BE AMENDED PRIOR TO THE TIME OF SALE. THIS TERM SHEET IS NOT AN OFFER TO SELL THESE SECURITIES AND IT IS NOT A SOLICITATION OF AN OFFER TO BUY THESE SECURITIES IN ANY JURISDICTION WHERE THE OFFER OR SALE IS NOT PERMITTED. |
| | 127 | |
| Structural and Collateral Term Sheet | | BMO 2022-C3 |
| |
| No. 9 – Wells Fargo Center Tampa |
Collateral Cure Conditions in order to avoid a Trigger Period, on each one year anniversary of the date the borrowers made said deposit (or delivered said letter of credit), the borrowers deposit additional cash collateral in the amount of the Collateral Deposit Amount or shall increase the amount of the letter of credit by an amount equal to the Collateral Deposit Amount. The collateral referenced in this definition will be returned to the borrowers, provided that no event of default is ongoing under the Wells Fargo Center Tampa Whole Loan documents, upon the full repayment of the debt or at such time as the Trigger Period that the Collateral Cure Conditions relate to would have been cured had the borrowers not satisfied the Collateral Cure Conditions (i.e. at such time as the debt service coverage ratio (without taking into account the cash deposit and/or letter of credit) equals or is greater than 1.30x for two consecutive calendar quarters).
A “Specified Tenant Trigger Period” means a period (A) commencing upon the first to occur of (i) an event of default under the applicable Specified Tenant (defined below) lease has occurred beyond all applicable notice, cure and grace periods, (ii) Specified Tenant failing to be in actual, physical possession of the Specified Tenant Space (as defined below) (or applicable portion thereof), failing to be open to the public for business during customary hours and/or “going dark” in the Specified Tenant Space (a “Go Dark Trigger”), it being acknowledged that Specified Tenant will not be deemed to fail to be in occupancy or open for business solely as a result of (x) any company-wide work from home policy of any Specified Tenant implemented at the Wells Fargo Center Tampa Property due to the COVID-19 pandemic or any similar public health emergency or any governmental edict, action, declarations, quarantines, regulation or circumstance, (y) the repair, restoration or improvements of the Wells Fargo Center Tampa Property or the Specified Tenant Space, or (z) work from home flexibility consistent with other similarly situated tenants, (iii) Specified Tenant giving notice that it is terminating its lease for all or more than 30% of the Specified Tenant Space (or applicable portion thereof), (iv) any termination or cancellation of any Specified Tenant’s lease (including, without limitation, rejection in any bankruptcy or similar insolvency proceeding) and/or any Specified Tenant’s lease failing to otherwise be in full force and effect, (v) any bankruptcy or similar insolvency of Specified Tenant and (vi) Specified Tenant failing to extend or renew the applicable Specified Tenant’s lease on or prior to the date occurring on the earlier of (a) 12 months prior to the expiration of the then applicable term of the applicable Specified Tenant lease and (b) the notice period required under the applicable Specified Tenant’s lease in accordance with the applicable terms and conditions thereof for a term of five years; and (B) expiring upon the first to occur of the lender’s receipt of evidence reasonably acceptable to the lender (which such evidence may include, without limitation, a duly executed estoppel certificate from the applicable Specified Tenant in form and substance reasonably acceptable to the lender) of (1) the satisfaction of the Specified Tenant Cure Conditions (defined below) or (2) the borrowers leasing the entire Specified Tenant Space (or applicable portion thereof) in accordance with the applicable terms and conditions of the Wells Fargo Center Tampa Whole Loan documents for a minimum term of five years, the applicable tenant under such lease being in actual, physical occupancy of, and open to the public for business in, the space demised under its lease and paying the full amount of the rent due under its lease (or the borrowers have deposited any free rent with the lender).
A “Specified Tenant” means, as applicable, any tenant which, individually or when aggregated with all other leases at the Wells Fargo Center Tampa Property with the same tenant or its affiliate, either (A) accounts for 11% or more of the total rental income for the Wells Fargo Center Tampa Property, or (B) demises 11% or more of the Wells Fargo Center Tampa Property’s gross leasable area. As of August 10, 2022, Wells Fargo Bank is the sole Specified Tenant at the Wells Fargo Center Tampa Property.
“Specified Tenant Space” means the portion of the Wells Fargo Center Tampa Property demised as of the date of origination of the Wells Fargo Center Tampa Whole Loan to the initial Specified Tenant pursuant to the initial Specified Tenant’s lease.
“Specified Tenant Cure Conditions” means (i) the applicable Specified Tenant has cured all defaults under the applicable Specified Tenant lease, (ii) the applicable Specified Tenant is in actual, physical possession of the Specified Tenant Space (or applicable portion thereof), open to the public for business during customary hours and not “dark” in the Specified Tenant Space (or applicable portion thereof), (iii) the applicable Specified Tenant has revoked or rescinded all termination or cancellation notices with respect to the applicable Specified Tenant lease and has re-affirmed the applicable Specified Tenant lease as being in full force and effect, (iv) in the event the Specified Tenant Trigger Period is due to the applicable Specified Tenant’s failure to extend or renew the applicable Specified Tenant Lease, the applicable Specified Tenant has renewed or extended the applicable Specified Tenant lease in accordance with the terms of such lease and of the Wells Fargo Center Tampa Whole Loan documents for the a minimum term of 5 years, (v) with respect to any applicable bankruptcy or insolvency proceedings involving the applicable Specified Tenant and/or the applicable Specified Tenant lease, the applicable Specified Tenant is no longer insolvent or subject to any bankruptcy or insolvency proceedings or the applicable Specified Tenant lease has been assumed or affirmed pursuant to a final, non-appealable order of a court of
THE INFORMATION IN THIS STRUCTURAL AND COLLATERAL TERM SHEET IS NOT COMPLETE AND MAY BE AMENDED PRIOR TO THE TIME OF SALE. THIS TERM SHEET IS NOT AN OFFER TO SELL THESE SECURITIES AND IT IS NOT A SOLICITATION OF AN OFFER TO BUY THESE SECURITIES IN ANY JURISDICTION WHERE THE OFFER OR SALE IS NOT PERMITTED. |
| | 128 | |
| Structural and Collateral Term Sheet | | BMO 2022-C3 |
| |
| No. 9 – Wells Fargo Center Tampa |
competent jurisdiction, (vi) the applicable Specified Tenant is paying full, unabated rent under the applicable Specified Tenant lease (or any free rent is deposited with lender), (vii) the applicable Specified Tenant Space has been re-let for a minimum of five years and (viii) in the event the Specified Tenant Trigger Period is due to a Go Dark Trigger, the applicable Specified Tenant with respect to which such Go Dark Trigger occurred satisfies the Excess Cash Flow Cure Condition (defined below).
“Excess Cash Flow Cure Condition” means that the following conditions are satisfied: (i) a Trigger Period has occurred and is continuing solely as the result of the occurrence of a Go Dark Trigger and no other Trigger Period exists, and (ii) either (a) the amount of funds on deposit in the excess cash flow account equals or exceeds an amount equal to the next one year of full, unabated rent payments from the applicable Specified Tenant or (b) the borrowers have deposited cash or a letter of credit into the excess cash flow account in an amount which equals or exceeds an amount equal to the next one year of full, unabated rent payments from the applicable Specified Tenant.
Partial Release. Not Permitted.
Subordinate Debt. None.
Mezzanine Debt. None.
Ground Lease. None.
THE INFORMATION IN THIS STRUCTURAL AND COLLATERAL TERM SHEET IS NOT COMPLETE AND MAY BE AMENDED PRIOR TO THE TIME OF SALE. THIS TERM SHEET IS NOT AN OFFER TO SELL THESE SECURITIES AND IT IS NOT A SOLICITATION OF AN OFFER TO BUY THESE SECURITIES IN ANY JURISDICTION WHERE THE OFFER OR SALE IS NOT PERMITTED. |
| | 129 | |
| Structural and Collateral Term Sheet | | BMO 2022-C3 |
| |
| No. 10 – Saks Fulfillment Center |
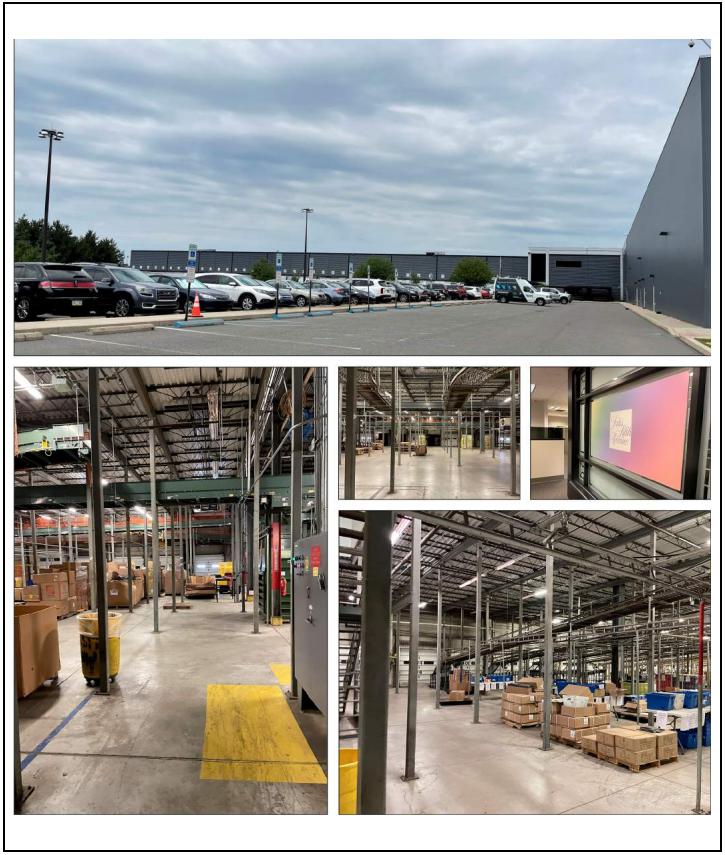
THE INFORMATION IN THIS STRUCTURAL AND COLLATERAL TERM SHEET IS NOT COMPLETE AND MAY BE AMENDED PRIOR TO THE TIME OF SALE. THIS TERM SHEET IS NOT AN OFFER TO SELL THESE SECURITIES AND IT IS NOT A SOLICITATION OF AN OFFER TO BUY THESE SECURITIES IN ANY JURISDICTION WHERE THE OFFER OR SALE IS NOT PERMITTED. |
| | 130 | |
| Structural and Collateral Term Sheet | | BMO 2022-C3 |
| |
| No. 10 – Saks Fulfillment Center |
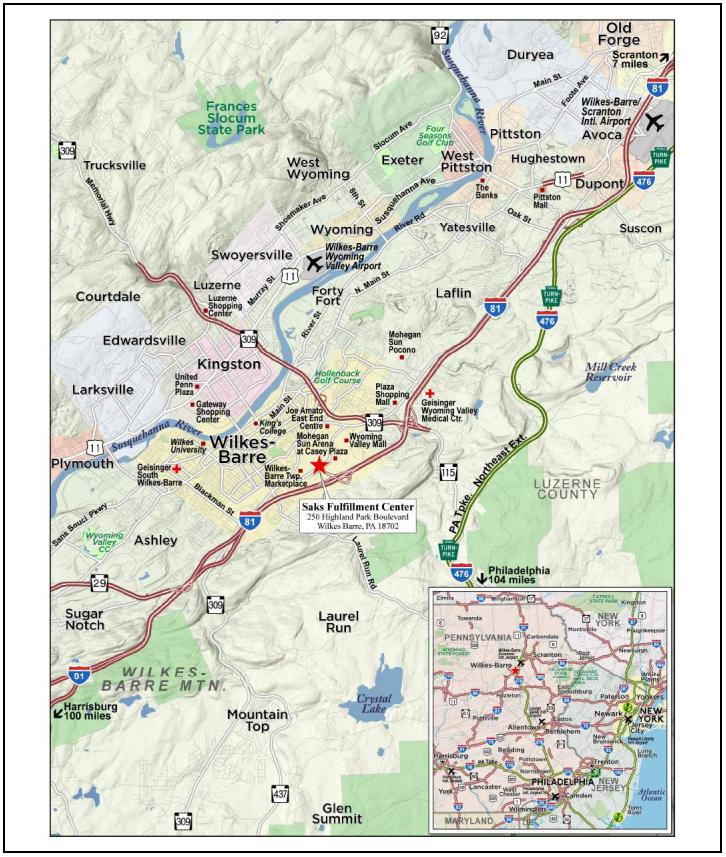
THE INFORMATION IN THIS STRUCTURAL AND COLLATERAL TERM SHEET IS NOT COMPLETE AND MAY BE AMENDED PRIOR TO THE TIME OF SALE. THIS TERM SHEET IS NOT AN OFFER TO SELL THESE SECURITIES AND IT IS NOT A SOLICITATION OF AN OFFER TO BUY THESE SECURITIES IN ANY JURISDICTION WHERE THE OFFER OR SALE IS NOT PERMITTED. |
| | 131 | |
| Structural and Collateral Term Sheet | | BMO 2022-C3 |
| |
| No. 10 – Saks Fulfillment Center |
| Mortgage Loan Information | | Property Information |
| Mortgage Loan Seller: | BMO | | Single Asset / Portfolio: | Single Asset |
| Original Principal Balance(1): | $27,500,000 | | Title: | Fee |
| Cut-off Date Principal Balance(1): | $27,500,000 | | Property Type - Subtype: | Industrial – Warehouse |
| % of IPB: | 3.8% | | Net Rentable Area (SF): | 822,771 |
| Loan Purpose: | Acquisition | | Location: | Wilkes Barre, PA |
| Borrower: | Wilkes Barre Owner LLC | | Year Built / Renovated: | 1990 / NAP |
| Borrower Sponsors: | Lee Neibart and William Mack | | Occupancy: | 100.0% |
| Interest Rate: | 6.17000% | | Occupancy Date: | 8/2/2022 |
| Note Date: | 8/2/2022 | | 4th Most Recent NOI (As of)(3): | NAV |
| Maturity Date: | 8/6/2032 | | 3rd Most Recent NOI (As of)(3): | NAV |
| Interest-only Period: | 120 months | | 2nd Most Recent NOI (As of)(3): | NAV |
| Original Term: | 120 months | | Most Recent NOI (As of)(3): | NAV |
| Original Amortization Term: | None | | UW Economic Occupancy: | 95.0% |
| Amortization Type: | Interest Only | | UW Revenues: | $6,426,750 |
| Call Protection(2): | L(26),D(90),O(4) | | UW Expenses: | $0 |
| Lockbox / Cash Management: | Hard / Springing | | UW NOI: | $6,426,750 |
| Additional Debt(1): | Yes | | UW NCF: | $6,426,750 |
| Additional Debt Balance(1): | $32,500,000 | | Appraised Value / Per SF: | $112,900,000 / $137 |
| Additional Debt Type(1): | Pari Passu | | Appraisal Date: | 8/1/2022 |
| | | | | |
| Escrows and Reserves(4) | | Financial Information(1) |
| | Initial | Monthly | Initial Cap | | Cut-off Date Loan / SF: | $73 |
| Taxes: | $117,913 | Springing | N/A | | Maturity Date Loan / SF: | $73 |
| Insurance: | $61,924 | Springing | N/A | | Cut-off Date LTV: | 53.1% |
| Replacement Reserves: | $0 | Springing | N/A | | Maturity Date LTV: | 53.1% |
| TI / LC: | $0 | Springing | N/A | | UW NCF DSCR: | 1.71x |
| | | | | | UW NOI Debt Yield: | 10.7% |
| | | | | | | |
| Sources and Uses |
| Sources | Proceeds | % of Total | | Uses | Proceeds | % of Total |
| Whole Loan(1) | $60,000,000 | 53.5 | % | | Purchase Price | $110,000,000 | 98.0 | % |
| Borrower Sponsor Equity | 47,228,686 | 42.1 | | | Closing Costs | 2,048,849 | 1.8 | |
| Preferred Equity | 5,000,000 | 4.5 | | | Upfront Reserves | 179,837 | 0.2 | |
| Total Sources | $112,228,686 | 100.0 | % | | Total Uses | $112,228,686 | 100.0 | % |
| (1) | The Saks Fulfillment Center Mortgage Loan (as defined below) is part of the Saks Fulfillment Center Whole Loan (as defined below) evidenced by five pari passu notes with an aggregate outstanding principal balance as of the Cut-off Date of $60,000,000. The Financial Information presented above is calculated based on the outstanding balance of the Saks Fulfillment Center Whole Loan. |
| (2) | Defeasance of the Saks Fulfillment Center Whole Loan is permitted at any time after the earlier to occur of (a) the end of the two-year period commencing on the closing date of the securitization of the last promissory note representing a portion of the Saks Fulfillment Center Whole Loan to be securitized and (b) August 2, 2025. The assumed defeasance lockout period of 26 payments is based on the closing date of this transaction in October 2022. The actual lockout period may be longer. |
| (3) | The Saks Fulfillment Center Property (as defined below) does not have any operating history as the borrower recently acquired the property from the prior owner and leased it back to such prior owner in a sale-leaseback transaction, and the related lease commenced on August 2, 2022. |
| (4) | For a full description of Escrows and Reserves, please refer to “Escrows and Reserves” below. |
The Loan. The tenth largest mortgage loan (the “Saks Fulfillment Center Mortgage Loan”) is part of a whole loan (the “Saks Fulfillment Center Whole Loan”) that is secured by the borrower’s fee interest in an 822,771 square foot industrial property located in Wilkes Barre, Pennsylvania (the “Saks Fulfillment Center Property”). The Saks Fulfillment Center Whole Loan is comprised of five pari passu notes, with an aggregate outstanding principal balance as of the Cut-off Date of $60,000,000. The Saks Fulfillment Center Mortgage Loan is evidenced by the controlling Note A-1 and the non-controlling Note A-4 with an aggregate outstanding principal balance as of the Cut-off Date of $27,500,000 and represents approximately 3.8% of the Initial Pool Balance.
THE INFORMATION IN THIS STRUCTURAL AND COLLATERAL TERM SHEET IS NOT COMPLETE AND MAY BE AMENDED PRIOR TO THE TIME OF SALE. THIS TERM SHEET IS NOT AN OFFER TO SELL THESE SECURITIES AND IT IS NOT A SOLICITATION OF AN OFFER TO BUY THESE SECURITIES IN ANY JURISDICTION WHERE THE OFFER OR SALE IS NOT PERMITTED. |
| | 132 | |
| Structural and Collateral Term Sheet | | BMO 2022-C3 |
| |
| No. 10 – Saks Fulfillment Center |
The Saks Fulfillment Center Whole Loan will be serviced pursuant to the pooling and servicing agreement for the BBCMS 2022-C17 securitization (into which Note A-2 and Note A-5 were contributed) until the closing date of the BMO 2022-C3 securitization. On or after the closing date of the BMO 2022-C3 securitization, the Saks Fulfillment Center Whole Loan will be serviced pursuant to the pooling and servicing agreement for the BMO 2022-C3 securitization. The Saks Fulfillment Center Whole Loan was originated on August 2, 2022 by Bank of Montreal and accrues interest at a fixed rate of 6.17000% per annum. The Saks Fulfillment Center Whole Loan has an initial term of 120 months, a remaining term of 118 months and is interest only for the full term. The scheduled maturity date of the Saks Fulfillment Center Whole Loan is the due date that occurs in August 2032. The proceeds of the Saks Fulfillment Center Whole Loan were used to acquire the Saks Fulfillment Center Property, pay origination costs and fund upfront reserves.
The table below summarizes the promissory notes that comprise the Saks Fulfillment Center Whole Loan. The relationship between the holders of the Saks Fulfillment Center Whole Loan is governed by a co-lender agreement as described under “Description of the Mortgage Pool—The Whole Loans—The Serviced Pari Passu Whole Loans” in the Preliminary Prospectus.
| Whole Loan Summary(1) |
| Note | Original Balance | Cut-off Date Balance | Note Holder | Controlling Piece |
| A-1 | $20,000,000 | $20,000,000 | BMO 2022-C3 | Yes |
| A-2 | $17,500,000 | $17,500,000 | BBCMS 2022-C17 | No |
| A-3(2) | $10,000,000 | $10,000,000 | BMO | No |
| A-4 | $7,500,000 | $7,500,000 | BMO 2022-C3 | No |
| A-5 | $5,000,000 | $5,000,000 | BBCMS 2022-C17 | No |
| Whole Loan | $60,000,000 | $60,000,000 | | |
| (1) | The Saks Fulfillment Center Whole Loan will be serviced pursuant to the pooling and servicing agreement for the BBCMS 2022-C17 until the closing date of the BMO 2022-C3 securitization. On or after the closing date of the BMO 2022-C3 securitization, the Saks Fulfillment Center Whole Loan will be serviced pursuant to the pooling and servicing agreement for the BMO 2022-C3 securitization. |
| (2) | Expected to be contributed to one or more future securitization(s). |
The Property. The Saks Fulfillment Center Property consists of an 822,771 square foot industrial warehouse situated on 61.22 acres in Wilkes Barre, Pennsylvania. The Saks Fulfillment Center Property was developed in 1990 and is comprised of one, three-story warehouse building occupied by a single tenant. The Saks Fulfillment Center Property has a total of 1,528 surface parking spaces, resulting in a ratio of approximately 1.86 spaces per 1,000 square feet. On August 2, 2022, the borrower acquired the Saks Fulfillment Center Property from The Saks Fifth Avenue Fulfillment Center (HBC) (“Saks Fifth Avenue Fulfillment Center”) and leased 100% of the property to Saks Fifth Avenue Fulfillment Center in a sale-leaseback transaction.
The Saks Fulfillment Center Property is located approximately one mile southeast of the Susquehanna River in between US Highway 81 and State Highway 11, approximately 1.1 miles from the urban core of Wilkes Barre, Pennsylvania. The immediate surroundings of the Saks Fulfillment Center Property are heavily concentrated with primarily retail and medical space. The Saks Fulfillment Center Property is located nearby the Wyoming Valley Mall and Wilkes Barre Commons which help to frame the area as a commercial center within Wilkes Barre.
COVID-19 Update. As of August 2, 2022, the Saks Fulfillment Center Property was open and operating. As of the date of this term sheet, the Saks Fulfillment Center Whole Loan is not subject to any forbearance, modification, or debt service relief requests. The first payment date of the Saks Fulfillment Center Whole Loan was September 6, 2022.
Major Tenant.
Saks Fifth Avenue Fulfillment Center (822,771 square feet; 100.0% of the NRA; 100.0% of underwritten base rent): Saks Fifth Avenue Fulfillment Center is the primary national distribution center for Saks Fifth Avenue and Saks Off Fifth. In 2021, Hudson Bay Company partnered with Insight Partners to establish Saks Fifth Avenue’s ecommerce business as a standalone company known as Saks. Saks Fifth Avenue is a luxury apparel retailer through ecommerce and 41 physical locations. Saks Fifth Avenue Fulfillment Center sold the Saks Fulfillment Center Property to the borrower and leased it back from the borrower under a triple net lease with a commencement date of August 2, 2022 and a scheduled expiration date of August 1, 2047. The tenant under the Saks Fifth Avenue Fulfillment Center lease has three, 10-year renewal options. Saks Fifth Avenue Fulfillment Center’s lease contains no early termination or contraction options.
THE INFORMATION IN THIS STRUCTURAL AND COLLATERAL TERM SHEET IS NOT COMPLETE AND MAY BE AMENDED PRIOR TO THE TIME OF SALE. THIS TERM SHEET IS NOT AN OFFER TO SELL THESE SECURITIES AND IT IS NOT A SOLICITATION OF AN OFFER TO BUY THESE SECURITIES IN ANY JURISDICTION WHERE THE OFFER OR SALE IS NOT PERMITTED. |
| | 133 | |
| Structural and Collateral Term Sheet | | BMO 2022-C3 |
| |
| No. 10 – Saks Fulfillment Center |
Environmental. According to the Phase I environmental assessment dated June 23, 2022, there was no evidence of any recognized environmental conditions at the Saks Fulfillment Center Property.
The following table presents certain information relating to the historical and current occupancy of the Saks Fulfillment Center Property:
| Historical and Current Occupancy(1) |
| 2019 | 2020 | 2021 | Current(2) |
| NAV | NAV | NAV | 100.0% |
| (1) | The historical occupancy is not available as the borrower recently acquired the property from the current sole tenant and leased it back to such tenant in a sale-leaseback transaction under a lease that commenced on August 2, 2022. |
| (2) | Current Occupancy is as of August 2, 2022. |
The following table presents certain information relating to the sole tenant for the Saks Fulfillment Center Property:
| Tenant Summary(1) |
| Tenant | Ratings
Moody’s/S&P/Fitch | Net Rentable Area (SF) | % of
Total NRA | UW Base Rent PSF | UW Base Rent | % of Total
UW Base Rent | Lease
Exp. Date |
| Saks Fifth Avenue Fulfillment Center | NR/NR/NR | 822,771 | 100.0% | $8.02 | $6,600,000 | 100.0% | 8/1/2047 |
| Occupied Collateral Total / Wtd. Avg. | | 822,771 | 100.0% | $8.02 | $6,600,000 | 100.0% | |
| | | | | | | | |
| Vacant Space | | 0 | 0.0% | | | | |
| | | | | | | | |
| Collateral Total | | 822,771 | 100.0% | | | | |
| | | | | | | | |
| (1) | Based on the underwritten rent roll dated August 2, 2022. The first rent payment date under the related lease was August 2, 2022. |
The following table presents certain information relating to the tenant lease expiration dates of the Saks Fulfillment Center Property:
| Lease Rollover Schedule(1) |
| Year | Number of Leases Expiring | Net Rentable Area Expiring | % of NRA Expiring | UW Base Rent Expiring | % of UW Base Rent Expiring | Cumulative Net Rentable Area Expiring | Cumulative % of NRA Expiring | Cumulative UW Base Rent Expiring | Cumulative % of UW Base Rent Expiring |
| Vacant | NAP | 0 | 0.0 | % | NAP | NAP | 0 | 0.0% | NAP | NAP |
| 2022 & MTM | 0 | 0 | 0.0 | | $0 | 0.0 | % | 0 | 0.0% | $0 | 0.0% |
| 2023 | 0 | 0 | 0.0 | | 0 | 0.0 | | 0 | 0.0% | $0 | 0.0% |
| 2024 | 0 | 0 | 0.0 | | 0 | 0.0 | | 0 | 0.0% | $0 | 0.0% |
| 2025 | 0 | 0 | 0.0 | | 0 | 0.0 | | 0 | 0.0% | $0 | 0.0% |
| 2026 | 0 | 0 | 0.0 | | 0 | 0.0 | | 0 | 0.0% | $0 | 0.0% |
| 2027 | 0 | 0 | 0.0 | | 0 | 0.0 | | 0 | 0.0% | $0 | 0.0% |
| 2028 | 0 | 0 | 0.0 | | 0 | 0.0 | | 0 | 0.0% | $0 | 0.0% |
| 2029 | 0 | 0 | 0.0 | | 0 | 0.0 | | 0 | 0.0% | $0 | 0.0% |
| 2030 | 0 | 0 | 0.0 | | 0 | 0.0 | | 0 | 0.0% | $0 | 0.0% |
| 2031 | 0 | 0 | 0.0 | | 0 | 0.0 | | 0 | 0.0% | $0 | 0.0% |
| 2032 | 0 | 0 | 0.0 | | 0 | 0.0 | | 0 | 0.0% | $0 | 0.0% |
| 2033 & Beyond | 1 | 822,771 | 100.0 | | 6,600,000 | 100.0 | | 822,771 | 100.0% | $6,600,000 | 100.0% |
| Total | 1 | 822,771 | 100.0 | % | $6,600,000 | 100.0 | % | | | | |
| (1) | Based on the underwritten rent roll dated August 2, 2022. |
THE INFORMATION IN THIS STRUCTURAL AND COLLATERAL TERM SHEET IS NOT COMPLETE AND MAY BE AMENDED PRIOR TO THE TIME OF SALE. THIS TERM SHEET IS NOT AN OFFER TO SELL THESE SECURITIES AND IT IS NOT A SOLICITATION OF AN OFFER TO BUY THESE SECURITIES IN ANY JURISDICTION WHERE THE OFFER OR SALE IS NOT PERMITTED. |
| | 134 | |
| Structural and Collateral Term Sheet | | BMO 2022-C3 |
| |
| No. 10 – Saks Fulfillment Center |
Underwritten Net Cash Flow(1) |
| | Underwritten | Per Square Foot | %(2) |
| Rents in Place | $6,600,000 | $8.02 | 97.6 | % |
| Rent Steps(3) | 165,000 | 0.20 | 2.4 | |
| Gross Potential Rent | $6,765,000 | $8.22 | 100.0 | % |
| Other Income | 0 | 0.00 | 0.0 | |
| Net Rental Income | $6,765,000 | $8.22 | 100.0 | % |
| (Vacancy) | (338,250) | (0.41) | (5.0 | ) |
| Effective Gross Income | $6,426,750 | $7.81 | 95.0 | % |
| | | | |
| Total Expenses | 0 | 0.00 | 0.0 | |
| | | | |
| Net Operating Income | $6,426,750 | $7.81 | 100.0 | % |
| | | | |
| Capital Expenditures | 0 | 0.00 | 0.0 | |
| TI / LC | 0 | 0.00 | 0.0 | |
| | | | |
| Net Cash Flow | $6,426,750 | $7.81 | 100.0 | % |
| (1) | The borrower acquired the Saks Fulfillment Center Property from, and leased it back to, Saks Fifth Avenue Fulfillment Center under a triple net lease that commenced on August 2, 2022 in a sale-leaseback transaction. |
| (2) | % column represents percent of Net Rental Income for all revenue lines and represents percent of Effective Gross Income for the remainder of fields. |
| (3) | Rent Steps include rent steps through August 2, 2023. |
The Market. The Saks Fulfillment Center Property is located in Wilkes Barre, Luzerne County, Pennsylvania, within the Scranton-Wilkes-Barre metropolitan statistical area (“Scranton MSA”). According to the appraisal, the Scranton MSA is roughly defined as the geographic region known as the Wyoming Valley, which lies in the northeast region of Pennsylvania between the Moosic and West mountain ranges. The Scranton MSA is approximately 117 miles northwest of New York City and 132 miles north of Philadelphia. The Scranton MSA is a region historically known for its iron production and anthracite coal mining in the nineteenth century, with its peak coal production reached in the mid-20th century. Today, the area is home to major manufacturing, distribution, and back-office centers. The Scranton MSA is also home to several colleges and universities, two of the largest include the University of Scranton and The Commonwealth Medical College, both located in the city of Scranton. According to the appraisal, the estimated 2022 population within a one-mile, three-mile and five-mile radius of the Saks Fulfillment Center Property totaled 5,916, 63,495 and 110,409 people, respectively, and estimated 2022 median household income for the same radii was $37,553, $47,889 and $50,926, respectively.
According to the appraisal, the Saks Fulfillment Center Property is situated within the I-81 Corridor Industrial submarket. As of the first quarter of 2022, the I-81 Corridor Industrial submarket contained total inventory of approximately 64.2 million square feet with a 6.0% vacancy rate and average annual NNN rental rates of $4.51 per square foot.
THE INFORMATION IN THIS STRUCTURAL AND COLLATERAL TERM SHEET IS NOT COMPLETE AND MAY BE AMENDED PRIOR TO THE TIME OF SALE. THIS TERM SHEET IS NOT AN OFFER TO SELL THESE SECURITIES AND IT IS NOT A SOLICITATION OF AN OFFER TO BUY THESE SECURITIES IN ANY JURISDICTION WHERE THE OFFER OR SALE IS NOT PERMITTED. |
| | 135 | |
| Structural and Collateral Term Sheet | | BMO 2022-C3 |
| |
| No. 10 – Saks Fulfillment Center |
The following table presents certain information relating to comparable industrial leases to the Saks Fulfillment Center Property:
| Comparable Industrial Leases(1) |
| Property Location | Year Built | NRA (SF) | Tenant | Lease Size (SF) | Rent PSF | Commencement | Lease Term (Years) | Lease Type |
250 Highland Park Boulevard Wilkes Barre, PA | 1990 | 822,771(2) | Saks Fifth Avenue Fulfillment Center(2) | 822,771(2) | $8.02(2) | Jul-2022(2) | 25.0(2) | Triple Net |
8449 Congdon Hill Drive Alburtis, PA | 2021 | NAV | NAV | 925,910 | $7.50 | Aug-2021 | 5.0 | Triple Net |
3585 South Church Street Whitehall, PA | 2021 | NAV | NAV | 504,900 | $7.25 | Sep-2021 | 5.2 | Triple Net |
250 Radar Road Northampton, PA | 2020 | NAV | NAV | 290,788 | $7.20 | July-2021 | 5.0 | Triple Net |
4275 Fritch Drive Bethlehem, PA | 2012 | NAV | NAV | 228,000 | $8.90 | May-2022 | 3.0 | Triple Net |
323 Logistics Drive Hamburg, PA | 2022/2023 | NAV | NAV | 214,563 | $7.65 | Dec-2023 | 7.2 | Triple Net |
2258 Howertown Road Northampton, PA | 2021 | NAV | NAV | 953,336 | $8.00 | Dec-2021 | 7.3 | Triple Net |
125 Stonewood Road York, PA | 2021 | NAV | NAV | 221,621 | $7.50 | Dec-2021 | 3.1 | Triple Net |
| (2) | Based on the underwritten rent roll dated August 2, 2022. |
The Borrower. The borrower is Wilkes Barre Owner LLC, a Delaware limited liability company and single purpose entity with two independent directors. Legal counsel to the borrower delivered a non-consolidation opinion in connection with the origination of the Saks Fulfillment Center Whole Loan.
The Borrower Sponsors. The borrower sponsors for the Saks Fulfillment Center Whole Loan are Lee Neibart and William Mack. The non-recourse carveout guarantor for the Saks Fulfillment Center Whole Loan is WRS Advisors IV LLC, which is controlled by the two sons of William Mack. Mr. Neibart is currently a director of Hudson Bay Company. Mr. Neibart previously served as Senior Partner and Chairman of the Real Estate Group of Ares Management LLC from 1993 to 2013 while previously acting as Global CEO of AREA Property Partners. Mr. Mack started his career in a development role within his family business which eventually became Mack-Cali. In 1993 Mr. Mack co-founded Apollo Real Estate Advisors which was eventually sold in 2013. Since then, Mr. Mack has continued his involved in the commercial real estate space through his role as co-founder of the Mack Real Estate Group. Certain affiliates and indirect equity owners of the Saks Fulfillment Center Whole Loan borrower are the borrowers and lenders of certain intercompany loans, as further described under “Intercompany Notes” below.
Property Management. The Saks Fulfillment Center Property is self-managed.
Escrows and Reserves. At loan origination, the borrower deposited approximately (i) $117,913 into a tax reserve and (ii) $61,924 into an insurance reserve.
Tax Reserve – On each due date, the borrower will be required to deposit an amount equal to 1/12th of the real estate taxes that the lender estimates will be payable during the next ensuing 12-months, provided such tax reserve will be conditionally waived so long as (i) no event of default has occurred and is continuing, (ii) the borrower or the tenant under a Lease Sweep Lease (as defined below) pays all real estate property taxes when due and payable with respect to the Saks Fulfillment Center Property directly to the applicable governmental taxing authority and the borrower delivers to the lender evidence thereof no later than 10 business days prior to the applicable due date thereof and (iii) there is on deposit in the tax account with respect to real estate property taxes an amount not less than $117,912.50.
Insurance Reserve – On each due date, the borrower will be required to deposit an amount equal to 1/12th of the annual insurance premiums that the lender estimates will be payable for the renewal of coverage if the borrower does not maintain an approved blanket or umbrella policy, provided such insurance reserve will be conditionally waived so long as (i) no event of default has occurred and is continuing, (ii) the borrower pays all insurance premiums when due and payable and the borrower delivers to the lender evidence thereof no later than 10 business days prior to the applicable due date thereof and
THE INFORMATION IN THIS STRUCTURAL AND COLLATERAL TERM SHEET IS NOT COMPLETE AND MAY BE AMENDED PRIOR TO THE TIME OF SALE. THIS TERM SHEET IS NOT AN OFFER TO SELL THESE SECURITIES AND IT IS NOT A SOLICITATION OF AN OFFER TO BUY THESE SECURITIES IN ANY JURISDICTION WHERE THE OFFER OR SALE IS NOT PERMITTED. |
| | 136 | |
| Structural and Collateral Term Sheet | | BMO 2022-C3 |
| |
| No. 10 – Saks Fulfillment Center |
(iii) there is on deposit in the insurance premium account with respect to insurance premiums an amount not less than $61,924.25.
Replacement Reserve – On a monthly basis during the continuance of a Trigger Period (as defined below), the borrower is required to escrow an amount equal to approximately $6,856 for capital expenditures.
TI / LC Reserve — On a monthly basis during the continuance of a Trigger Period, the borrower is required to escrow an amount equal to approximately $27,426 for tenant improvement and leasing costs.
Lockbox / Cash Management. The Saks Fulfillment Center Whole Loan is structured with a hard lockbox and springing cash management. The borrower is required to cause all rents to be deposited directly into the lender-controlled lockbox account. The Saks Fulfillment Center Whole Loan documents also require that all rents received by the borrower or property manager be deposited into the lockbox account within two business days of receipt. During the continuance of a Trigger Period, funds on deposit in the lockbox account are required to be swept each business day into a lender-controlled cash management account and applied on each payment date (i) to make deposits into the tax and insurance reserves, (ii) to pay debt service on the Saks Fulfillment Center Whole Loan, (iii) to make deposits into the replacement reserves and TI / LC reserves, (iv) to pay any other amounts then due and payable under the Saks Fulfillment Center Whole Loan documents (including, without limitation, to the cash management bank and servicer for fees and expenses incurred in connection with the Saks Fulfillment Center Whole Loan documents), and (v) funds in an amount equal to the monthly operating expense budgeted amount and any then-current lender-approved extraordinary expenses, if any, with any excess cash after such application required to be deposited (A) if a Lease Sweep Period (as defined below) is continuing, into a lease sweep reserve to be applied to pay the costs of re-tenanting the applicable space, or (B) if no Lease Sweep Period is continuing, and any other Trigger Period is continuing, into a lender-controlled account to be held as additional collateral for the Saks Fulfillment Center Whole Loan during such Trigger Period.
A “Trigger Period” will commence upon (i) the occurrence of an event of default under the Saks Fulfillment Center Whole Loan, (ii) the debt yield is less than 8.5% based on the Saks Fulfillment Center Whole Loan documents or (iii) the commencement of a Lease Sweep Period, and will end, if (A) with respect to a Trigger Period continuing pursuant to clause (i), the event of default commencing the Trigger Period has been cured and such cure has been accepted by the lender, (B) with respect to a Trigger Period continuing due to clause (ii), the date that the debt yield is at least 8.5% for two consecutive calendar quarters, or (C) with respect to a Trigger Period continuing due to clause (iii), termination of the Lease Sweep Period.
A “Lease Sweep Period” will commence on the first due date following the occurrence of any of the following: (i) the date that a Lease Sweep Lease (or any material portion thereof) is surrendered, cancelled or terminated prior to its then current expiration date or the receipt by the borrower or property manager of notice from any tenant under a Lease Sweep Lease of its intent to surrender, cancel or terminate the Lease Sweep Lease (or any material portion thereof) prior to its then current expiration date; (ii) the receipt by the borrower or property manager of notice from any tenant under a Lease Sweep Lease exercising any right to terminate its Lease Sweep Lease; (iii) the date that any tenant under a Lease Sweep Lease (x) discontinues its business (i.e., “goes dark”) in its Lease Sweep Space (as defined below) at the Saks Fulfillment Center Property (or any material portion thereof) for a period in excess of 90 consecutive days or (y) vacates or ceases occupying its Lease Sweep Space at the Saks Fulfillment Center Property (or any material portion thereof) for a period in excess of 90 consecutive days; provided, however, that a Lease Sweep Period will not be triggered as a result of this clause (y) for so long as the Lease Sweep Vacate Conditions (as defined below) are met; (iv) upon a default under a Lease Sweep Lease by the tenant thereunder that continues beyond any applicable notice and cure period; or (v) upon a bankruptcy or insolvency proceeding of any tenant under a Lease Sweep Lease or its parent.
A Lease Sweep Period will end (A) in the case of clauses (i), (ii), (iii) and (v) above, upon the occurrence of an Acceptable Lease Sweep Lease Event (as defined below); (B) in the case of clause (i) and (ii) above, if such termination option is not validly exercised by the tenant under the applicable Lease Sweep Lease by the latest exercise date specified in such Lease Sweep Lease or is otherwise validly and irrevocably waived in writing by the related tenant; (C) in the case of clause (iii) above, the applicable tenant under the Lease Sweep Lease has re-commenced operations at its Lease Sweep Space at the Saks Fulfillment Center Property during normal business hours, in accordance with the terms of its Lease Sweep Lease, for a period of two consecutive months following such cure; (D) in the case of clause (iv) above, the date on which the subject default has been cured, and no other default under such Lease Sweep Lease occurs for a period of two consecutive
THE INFORMATION IN THIS STRUCTURAL AND COLLATERAL TERM SHEET IS NOT COMPLETE AND MAY BE AMENDED PRIOR TO THE TIME OF SALE. THIS TERM SHEET IS NOT AN OFFER TO SELL THESE SECURITIES AND IT IS NOT A SOLICITATION OF AN OFFER TO BUY THESE SECURITIES IN ANY JURISDICTION WHERE THE OFFER OR SALE IS NOT PERMITTED. |
| | 137 | |
| Structural and Collateral Term Sheet | | BMO 2022-C3 |
| |
| No. 10 – Saks Fulfillment Center |
months following such cure; and (E) in the case of clause (v) above, either (a) the applicable bankruptcy or insolvency proceeding of any tenant under a Lease Sweep Lease or its parent has terminated and the applicable Lease Sweep Lease has been affirmed, assumed or assigned in a manner reasonably satisfactory to the lender or (b) the applicable Lease Sweep Lease has been assumed and assigned to a third party in a manner reasonably satisfactory to the lender.
An “Acceptable Lease Sweep Lease Event” means at least 80% of the gross leasable area of the Saks Fulfillment Center Property is leased pursuant to one or more Qualified Leases (as defined below) that provide, in the aggregate, rent payable by the tenant(s) thereunder that equal or exceed the full unabated rental payments under the Saks Lease (as defined below) and each of the following conditions shall have been satisfied: the borrower has delivered to the lender (A) an officer’s certificate attaching a complete copy of such Qualified Lease(s) and confirming the same to be a true, correct and complete copy thereof, and confirming that: (1) the applicable tenant(s) have accepted possession of the premises demised under such Qualified Lease(s), (2) the applicable tenant(s) are in occupancy of all of the space demised under such Qualified Lease(s) and are open for business and paying regularly scheduled payments of base rent in accordance with the Qualified Lease(s) without right of abatement, offset or credit and any free rent periods, if any, have expired, (3) the applicable tenant(s) (or its corporate parent(s)) is/are not the subject of a bankruptcy action, and (4) all leasing commissions payable in connection with any such Qualified Lease(s) have been paid in full and all tenant improvement obligations, or allowances, concessions or rebates or other landlord obligations of an inducement nature have been completed and paid in full; and (B) at the lender’s option, a tenant estoppel certificate from the applicable tenant(s) in the form prescribed by the applicable Qualified Lease or otherwise in form and substance reasonably satisfactory to the lender and substantially consistent with the tenant estoppel certificate delivered by Saks & Company LLC in connection with the origination of the Sake Fulfillment Center Whole Loan confirming the conditions set forth in clauses (1) through and including (4) above have been satisfied.
A ”Qualified Leases” means either: (A) the original Lease Sweep Lease or a modification of the Lease Sweep Lease approved or deemed approved by the lender, such approval not to be unreasonably withheld, conditioned or delayed so long as no event of default under the Saks Fulfillment Center Whole Loan documents is continuing, or (B) a replacement lease (i) with a tenant that is creditworthy in the lender’s reasonable discretion, (ii) with a term that extends at least three years beyond the end of the term of the Saks Fulfillment Center Whole Loan and with an initial term of at least 10 years, (iii) entered into in accordance with the Saks Fulfillment Center Whole Loan documents and (iv) on market terms with respect to, among other things, base rent, additional rent and recoveries and tenant improvement allowances.
A “Saks Lease” means that certain industrial lease, dated as of August 2, 2022, between the borrower, as successor landlord, and Saks & Company LLC, as tenant, as the same may be amended, modified, supplemented, restated, assigned or replaced from time to time in accordance with the Saks Fulfillment Center Whole Loan documents.
A “Lease Sweep Lease” means (i) the Saks Lease or (ii) any renewal or replacement lease with respect to all or a portion of the Lease Sweep Space.
A “Lease Sweep Space” means the space demised under the applicable Lease Sweep Lease.
A “Lease Sweep Vacate Conditions” means the satisfaction of all of the following: (a) the applicable tenant under the Lease Sweep Lease vacates or ceases to occupy its Lease Sweep Space at the Saks Fulfillment Center Property in connection with the restoration of the improvements (situated on the Saks Fulfillment Center Property) owned or leased by such tenant as a result of a casualty, which such restoration is performed in accordance with the terms of the Lease Sweep Lease and, in the lender’s reasonable judgment, there are sufficient insurance proceeds to fully complete such restoration (excluding the deductible), (b) in the lender’s reasonable judgment, the applicable tenant has commenced and is diligently pursuing completion of such restoration and (c) the lender is satisfied that such discontinuance of business does not exceed a period of 120 days.
Subordinate Debt. None.
Mezzanine Debt. None.
Preferred Equity. On the Saks Fulfillment Center Whole Loan origination date, HBC Wilkes-Barre LLC, an affiliate of Hudson’s Bay Company, which is also an affiliate of Saks Fifth Avenue Fulfillment Center, the sole tenant at the Saks Fulfillment Center Property, made a preferred equity investment of $5,000,000 (the “Preferred Equity Investment”) into a
THE INFORMATION IN THIS STRUCTURAL AND COLLATERAL TERM SHEET IS NOT COMPLETE AND MAY BE AMENDED PRIOR TO THE TIME OF SALE. THIS TERM SHEET IS NOT AN OFFER TO SELL THESE SECURITIES AND IT IS NOT A SOLICITATION OF AN OFFER TO BUY THESE SECURITIES IN ANY JURISDICTION WHERE THE OFFER OR SALE IS NOT PERMITTED. |
| | 138 | |
| Structural and Collateral Term Sheet | | BMO 2022-C3 |
| |
| No. 10 – Saks Fulfillment Center |
direct member of the borrower. The Preferred Equity Investment has a required outside redemption date that is 15 years after the Saks Fulfillment Center Whole Loan origination date. Such preferred equity investor is not under control (or common control) with the borrower sponsors and does not own any common equity in the borrower. All returns and/or repayments of the Preferred Equity Investment will be made solely to the extent of available excess cash flow after payment of all of the obligations of the borrower then due and payable under the Saks Fulfillment Center Whole Loan documents. For the first 95 months of the Preferred Equity Investment term, the preferred equity investor will be entitled to a priority return at a current pay rate of 3.0%, and, starting in month 96 and for the remainder of the Preferred Equity Investment term, the Preferred Equity Investment will also be amortized down using all available excess cash flow. The Preferred Equity Investment is not evidenced by any promissory note or secured by any assets of the borrower. The preferred equity investor has no contractual remedies under the limited liability company agreement of the borrower (including, without limitation, any forced change in control of the borrower) as a result of its failure to receive any preferred return or repayment of the Preferred Equity Investment during the term of the Saks Fulfillment Center Whole Loan.
Partial Release. Not permitted.
Ground Lease. None.
Intercompany Notes. An indirect member of the borrower is the obligor on (i) an unsecured intercompany loan with an original outstanding principal balance of $7,275,569 in favor of another affiliate of the borrower that is scheduled to mature on January 1, 2033, and (ii) 43 separate unsecured intercompany loans with an aggregate original outstanding principal balance of $60,403,899 in favor of various indirect equity owners of the borrower that are scheduled to mature on January 1, 2051 and are junior in priority to the intercompany loan described clause (i). Each intercompany loan lender has agreed with the Saks Fulfillment Center Whole Loan lender pursuant to a subordination and standstill agreement that, for so long as the Saks Fulfillment Center Whole Loan is outstanding, among other things, (i) it will not exercise remedies or commence any legal, equitable, or other proceedings against the related intercompany loan borrower in connection with the related intercompany loans, (ii) it will not amend or modify any of the related intercompany loan documents without the Saks Fulfillment Center Whole Loan lender’s consent, and (iii) subject to the following sentence, its rights are subject and subordinate in all respects to the Saks Fulfillment Center Whole Loan lender’s rights under the Saks Fulfillment Center Whole Loan documents. Pursuant to each such subordination and standstill agreement, (a) the related intercompany loan lenders are permitted to receive from the related intercompany loan borrower regular monthly interest payments and a principal paydown of the related intercompany loan in a maximum amount equal to the then-available excess cash from the Saks Fulfillment Center Property (after payment of all monthly Whole Loan debt service, reserves, and property-related expenses then due under the Saks Fulfillment Center Whole Loan documents), (b) the related intercompany loan lenders are permitted to allow certain limited transfers of the related intercompany loans in connection with the estate planning and/or death of an intercompany lender subject to, among other things, the Saks Fulfillment Center Whole Loan borrower sponsors (or Richard Mack and Stephen Mack, the two sons of William Mack (one of the borrower sponsors), the “Permitted Controlling Family Members”) continuing to own equity in and control the Saks Fulfillment Center Whole Loan borrower, and (c) the lenders of the subordinate intercompany loans described in clause (ii) above are permitted to convert all or any portion of the related intercompany loans to a corresponding equity interest in the related intercompany loan borrower at any point subject to, among other things, the Permitted Controlling Family Members continuing to own equity in and control the Saks Fulfillment Center Whole Loan borrower, the Saks Fulfillment Center Whole Loan borrower delivering an updated organizational chart confirming that the previous intercompany loan lenders continue to be direct and indirect owners of the borrower following such conversion, and the Saks Fulfillment Center Whole Loan borrower delivering evidence to the Saks Fulfillment Center Whole Loan lender that such conversion will not result in any transfer tax payable by the Saks Fulfillment Center Whole Loan borrower pursuant to applicable law. The non-recourse guarantor of the Saks Fulfillment Center Whole Loan has agreed to indemnify the Saks Fulfillment Center Whole Loan lender for any losses incurred by it in connection with transfer taxes payable as a result of such conversion of the subordinate intercompany loans into the equity interests in the related intercompany loan borrowers.
THE INFORMATION IN THIS STRUCTURAL AND COLLATERAL TERM SHEET IS NOT COMPLETE AND MAY BE AMENDED PRIOR TO THE TIME OF SALE. THIS TERM SHEET IS NOT AN OFFER TO SELL THESE SECURITIES AND IT IS NOT A SOLICITATION OF AN OFFER TO BUY THESE SECURITIES IN ANY JURISDICTION WHERE THE OFFER OR SALE IS NOT PERMITTED. |
| | 139 | |
| Structural and Collateral Term Sheet | | BMO 2022-C3 |
| |
| No. 11 – Lakes Medical Center |
| Mortgage Loan Information | | Property Information |
| Mortgage Loan Seller: | CREFI | | Single Asset / Portfolio: | Single Asset |
| Original Principal Balance: | $27,000,000 | | Title: | Fee |
| Cut-off Date Principal Balance: | $27,000,000 | | Property Type – Subtype: | Office – Medical |
| % of IPB: | 3.7% | | Net Rentable Area (SF): | 135,459 |
| Loan Purpose: | Refinance | | Location: | West Bloomfield, MI |
| Borrower: | Lakes Professional Building, L.L.C. | | Year Built / Renovated: | 2004 / NAP |
| Borrower Sponsors: | Alan Goldsmith, Ronald Lederman and Jason Golnick | | Occupancy: | 98.4% |
| Interest Rate: | 5.99000% | | Occupancy Date: | 8/29/2022 |
| Note Date: | 8/31/2022 | | 4th Most Recent NOI (As of): | $2,724,767 (12/31/2019) |
| Maturity Date: | 9/6/2032 | | 3rd Most Recent NOI (As of): | $2,820,428 (12/31/2020) |
| Interest-only Period: | 120 months | | 2nd Most Recent NOI (As of): | $2,825,525 (12/31/2021) |
| Original Term: | 120 months | | Most Recent NOI (As of): | $2,904,673 (TTM June 30, 2022) |
| Original Amortization Term: | None | | UW Economic Occupancy: | 95.0% |
| Amortization Type: | Interest Only | | UW Revenues: | $4,065,698 |
| Call Protection: | L(25),D(91),O(4) | | UW Expenses: | $1,322,803 |
| Lockbox / Cash Management: | Hard / Springing | | UW NOI: | $2,742,895 |
| Additional Debt: | No | | UW NCF: | $2,580,254 |
| Additional Debt Balance: | N/A | | Appraised Value / Per SF: | $48,000,000 / $354 |
| Additional Debt Type: | N/A | | Appraisal Date: | 7/12/2022 |
| | | | | |
| | | | | |
| Escrows and Reserves | | Financial Information |
| | Initial | Monthly | Initial Cap | | Cut-off Date Loan / SF: | $199 | |
| Taxes: | $41,485 | $41,485 | N/A | | Maturity Date Loan / SF: | $199 | |
| Insurance: | $36,963 | $3,080 | N/A | | Cut-off Date LTV: | 56.3% | |
| Replacement Reserve: | $50,000 | $2,258 | $81,276 | | Maturity Date LTV: | 56.3% | |
TI / LC(1): | $0 | $11,296 | $500,000 | | UW NCF DSCR: | 1.57x | |
| | | | | | UW NOI Debt Yield: | 10.2% | |
| | | | | | | |
| Sources and Uses |
| Sources | Proceeds | % of Total | | Uses | Proceeds | % of Total |
| Loan Amount | $27,000,000 | 100.0 | % | | Loan Payoff | $22,778,285 | 84.4 | % |
| | | | | Principal Equity Distribution | $3,213,378 | 11.9 | |
| | | | | Closing Costs | $879,889 | 3.3 | |
| | | | | Upfront Reserves | $128,448 | 0.5 | |
| Total Sources | $27,000,000 | 100.0 | % | | Total Uses | $27,000,000 | 100.0 | % |
| (1) | The TI / LC reserve cap will be in effect only upon satisfaction of the following conditions: 88% or more of the square footage at the Lakes Medical Center Property (defined below) has been leased to one or more tenants under leases reasonably acceptable to the lender and such tenants are in actual, physical occupancy of, and open to the public for business in, the space demised under such leases and paying the full amount of the rent under such leases. |
The Loan. The Lakes Medical Center loan (the “Lakes Medical Center Mortgage Loan”) is secured by a first mortgage lien on the borrower’s fee simple interest in a medical office property located in West Bloomfield, Michigan (the “Lakes Medical Center Property”). The Lakes Medical Center Mortgage Loan was originated on August 31, 2022 by CREFI and accrues interest at an interest rate of 5.99000% per annum. The Lakes Medical Center Mortgage Loan has an original term of 120 months, a remaining term of 119 months and is interest only for the entire term. The scheduled maturity date of the Lakes Medical Center Mortgage Loan is the due date that occurs September 6, 2032.
The Property. The Lakes Medical Center Property is a 135,459 square foot, two-story medical office building located in West Bloomfield, Michigan. The Lakes Medical Center Property was constructed in 2004 and is situated on a 9.38-acre site. The Lakes Medical Center Property includes 489 uncovered parking spaces resulting in a parking ratio of 3.61 per 1,000 square feet of net rentable area. As of August 29, 2022, the Lakes Medical Center Property was 98.4% leased to 22 tenants.
THE INFORMATION IN THIS STRUCTURAL AND COLLATERAL TERM SHEET IS NOT COMPLETE AND MAY BE AMENDED PRIOR TO THE TIME OF SALE. THIS TERM SHEET IS NOT AN OFFER TO SELL THESE SECURITIES AND IT IS NOT A SOLICITATION OF AN OFFER TO BUY THESE SECURITIES IN ANY JURISDICTION WHERE THE OFFER OR SALE IS NOT PERMITTED. |
| | 140 | |
| Structural and Collateral Term Sheet | | BMO 2022-C3 |
| |
| No. 11 – Lakes Medical Center |
COVID-19 Update. As of August 31, 2022, the Lakes Medical Center Property is open and operational and there were no outstanding rent relief requests. The first payment date of the Lakes Medical Center Mortgage Loan is October 6, 2022.
Major Tenants. The three largest tenants based on underwritten base rent are Shores III, L.L.C., ERJ Properties and Aperture Labs, LLC.
The largest tenant at the Lakes Medical Center Property is Shores III, L.L.C. (“Shores 3”) (30,962 square feet; 22.9% of NRA; 23.2% of underwritten base rent). Shores 3 has been occupying its space since March 2003 and has a lease expiration date of August 31, 2034. Shores 3 is subletting the premises to West Bloomfield Surgery Center, LLC (“Lakes Surgery Center”), Trinity Health, and Michigan Institute of Urology, P.C. (“MIU”). Shores 3 has two, five-year renewal options and no termination options.
Lakes Surgery Center, who subleases 20,739 square feet from Shores 3, is an ambulatory surgery center which performs outpatient surgery and surgical care. Lakes Medical Center has been occupying its space since January 1, 2004, renewed its sublease in July 2018 and has a sublease expiration of June 30, 2030. Lakes Surgery Center has three, five-year renewal options and a one-time right to terminate effective June 30, 2027. Lakes Surgery Center may only exercise a termination option with written notice on or before January 1, 2025.
Trinity Health, who subleases 5,388 square feet from Shores 3 is a not-for-profit health care system. Formed in 2013 from the combination of two national health systems, the Trinity Health System includes 88 hospitals, 131 continuing care locations, 125 urgent care locations and various health and well-being services. Based in Livonia, Michigan, its annual operating revenue is $20.2 billion. Trinity Health occupies space at Lakes Medical Center for health imaging services which includes ultrasounds, digital mammography and x-rays. Trinity Health has been occupying its space since February 15, 2011, renewed its sublease in March 2021 and has a sublease expiration of February 28, 2024. Trinity Health has no renewal options and has the right to terminate its sublease at any time. Trinity Health may only exercise a termination option with 180 days written notice.
MIU, who subleases 4,835 square feet from Shores 3, is a specialty Urology practice with 22 locations across Southeastern Michigan. MIU has been occupying its space since March 13, 2003, renewed its lease in June 2020 and has a lease expiration of July 31, 2026. MIU has three, five-year renewal options and no termination options.
The second largest tenant is ERJ Properties (15,591 square feet; 11.5% of NRA; 11.7% of underwritten base rent). ERJ Properties is a medical practice and provides comprehensive orthopedic services including on-site rehabilitation services. ERJ Properties specializes in minimally invasive arthroscopic surgery, joint replacement of the knee, hip, and shoulder, treatment options such as physical therapy, injection therapy, and regenerative medicine. ERJ Properties has been occupying its space since March 2003 and has a lease expiration of August 31, 2034. ERJ Properties has one, five-year renewal option and no termination options.
The third largest tenant is Aperture Labs, LLC (“Aperture Labs”) (10,685 square feet; 7.9% of NRA; 8.0% of underwritten base rent). Aperture Labs provides psychiatric and psychotherapy services for mental health issues. Aperture Labs’ services include depression, anxiety issues, bipolar disorder, psychotic illness, borderline personality disorder, substance abuse and addiction, trauma related issues, relationship difficulties, life transitions, and behavior problems. Aperture Labs has been occupying its space since June 2014, expanded in January 2020 and June 2021, and has a lease expiration of August 31, 2034. Aperture Labs has one, five-year renewal option and no termination options.
The following table presents certain information relating to the historical and current occupancy of the Lakes Medical Center Property:
| Historical and Current Occupancy(1) |
| 2019 | 2020 | 2021 | Current(2) |
| 97.0% | 97.0% | 98.0% | 98.4% |
| (1) | Historical occupancies are the annual average physical occupancy of each respective year. |
| (2) | Current occupancy is based on rent rolls dated August 29, 2022. |
THE INFORMATION IN THIS STRUCTURAL AND COLLATERAL TERM SHEET IS NOT COMPLETE AND MAY BE AMENDED PRIOR TO THE TIME OF SALE. THIS TERM SHEET IS NOT AN OFFER TO SELL THESE SECURITIES AND IT IS NOT A SOLICITATION OF AN OFFER TO BUY THESE SECURITIES IN ANY JURISDICTION WHERE THE OFFER OR SALE IS NOT PERMITTED. |
| | 141 | |
| Structural and Collateral Term Sheet | | BMO 2022-C3 |
| |
| No. 11 – Lakes Medical Center |
The following table presents certain information relating to the largest tenants based on underwritten base rent of the Lakes Medical Center Property:
| Top Tenant Summary(1) |
| Tenant | Ratings Moody’s/S&P/Fitch | Net Rentable Area (SF) | % of Total NRA | UW Base Rent PSF(2) | UW Base Rent(2) | % of Total UW Base Rent(2) | Lease Expiration Date(3)(4) |
| Shores 3(5) | NR/NR/NR | 30,962 | 22.9 | % | $22.00 | $681,164 | 23.2 | % | 8/31/2034 |
| ERJ Properties | NR/NR/NR | 15,591 | 11.5 | | $22.00 | 343,024 | 11.7 | | 8/31/2034 |
| Aperture Labs | NR/NR/NR | 10,685 | 7.9 | | $22.00 | 235,074 | 8.0 | | 8/31/2034 |
| MKBY | NR/NR/NR | 7,062 | 5.2 | | $22.00 | 155,364 | 5.3 | | 8/31/2034 |
| Encompass Holdings | NR/NR/NR | 6,509 | 4.8 | | $22.00 | 143,198 | 4.9 | | 8/31/2034 |
| GKF Enterprise | NR/NR/NR | 5,985 | 4.4 | | $22.00 | 131,670 | 4.5 | | 8/31/2034 |
| Dell | NR/NR/NR | 5,616 | 4.1 | | $22.00 | 123,552 | 4.2 | | 8/31/2034 |
| Lakes PM | NR/NR/NR | 5,153 | 3.8 | | $22.00 | 113,366 | 3.9 | | 8/31/2034 |
| Pediatric Care Realty | NR/NR/NR | 4,067 | 3.0 | | $22.00 | 89,474 | 3.1 | | 8/31/2034 |
| Northport Pointe Holdings | NR/NR/NR | 3,867 | 2.9 | | $22.00 | 85,074 | 2.9 | | 8/31/2034 |
| Largest Tenants | | 95,497 | 70.5 | % | $22.00 | $2,100,960 | 71.7 | % | |
| Remaining Tenants | | 37,844 | 27.9 | | $21.94 | 830,457 | 28.3 | | |
| Total Occupied | | 133,341 | 98.4 | % | $21.98 | $2,931,417 | 100.0 | % | |
| Vacant Space | | 2,118 | 1.6 | | | | | |
| Total / Wtd. Avg. All Owned Tenants | | 135,459 | 100.0 | % | | | | |
| (1) | Based on the underwritten rent roll dated August 29, 2022. |
| (2) | UW Base Rent, % of Total UW Base Rent and UW Base Rent PSF include contractual rent steps of $660 for Befitting You Medical Supplies underwritten through October 1, 2022. |
| (3) | Shores 3 has two, five-year renewal options. |
| (4) | ERJ Properties, MKBY, Encompass Holdings, GKF Enterprise, Dell, Lakes PM, Pediatric Care Realty, and Northport Pointe Holdings each have one, five-year renewal options. |
| (5) | Shores 3 subleases 20,739 SF of its premises to Lakes Surgery Center, 5,388 SF of its premises to Trinity Health, and 4,835 SF of its premises to MIU. |
The following table presents certain information relating to the tenant lease expirations of the Lakes Medical Center Property:
| Lease Rollover Schedule(1)(2) |
| Year | Number of Leases Expiring | Net Rentable Area Expiring | % of Net Rental Area Expiring | UW Base Rent Expiring(3) | % of UW Base Rent Expiring(3) | Cumulative Net Rentable Area Expiring | Cumulative % of NRA Expiring | Cumulative UW Base Rent Expiring(3) | Cumulative % of UW Base Rent Expiring(3) |
| Vacant | NAP | 2,118 | 1.6 | % | NAP | NAP | 2,118 | 1.6% | NAP | NAP |
| MTM | 2 | 2,624 | 1.9 | | $48,290 | 1.6 | % | 4,742 | 3.5% | $48,290 | 1.6% |
| 2022 | 0 | 0 | 0.0 | | 0 | 0.0 | | 4,742 | 3.5% | $48,290 | 1.6% |
| 2023 | 1 | 540 | 0.4 | | 19,200 | 0.7 | | 5,282 | 3.9% | $67,490 | 2.3% |
| 2024 | 1 | 1,179 | 0.9 | | 25,938 | 0.9 | | 6,461 | 4.8% | $93,428 | 3.2% |
| 2025 | 0 | 0 | 0.0 | | 0 | 0.0 | | 6,461 | 4.8% | $93,428 | 3.2% |
| 2026 | 0 | 0 | 0.0 | | 0 | 0.0 | | 6,461 | 4.8% | $93,428 | 3.2% |
| 2027 | 0 | 0 | 0.0 | | 0 | 0.0 | | 6,461 | 4.8% | $93,428 | 3.2% |
| 2028 | 0 | 0 | 0.0 | | 0 | 0.0 | | 6,461 | 4.8% | $93,428 | 3.2% |
| 2029 | 0 | 0 | 0.0 | | 0 | 0.0 | | 6,461 | 4.8% | $93,428 | 3.2% |
| 2030 | 0 | 0 | 0.0 | | 0 | 0.0 | | 6,461 | 4.8% | $93,428 | 3.2% |
| 2031 | 0 | 0 | 0.0 | | 0 | 0.0 | | 6,461 | 4.8% | $93,428 | 3.2% |
| 2032 & Thereafter | 31 | 128,998 | 95.2 | | 2,837,990 | 96.8 | | 135,459 | 100.0% | $2,931,417 | 100.0% |
| Total | 35 | 135,459 | 100.0 | % | $2,931,417 | 100.0 | % | | | |
| (1) | Based on the underwritten rent roll dated August 29, 2022. |
| (2) | Certain tenants may have termination options that are exercisable prior to the originally stated expiration date of the subject lease and that are not considered in the Lease Rollover Schedule. |
| (3) | UW Base Rent Expiring, % of UW Base Rent Expiring, Cumulative UW Base Rent Expiring, and Cumulative % of UW Base Rent Expiring include contractual rent steps of $660 underwritten for Befitting You Medical Supplies through October 1, 2022. |
THE INFORMATION IN THIS STRUCTURAL AND COLLATERAL TERM SHEET IS NOT COMPLETE AND MAY BE AMENDED PRIOR TO THE TIME OF SALE. THIS TERM SHEET IS NOT AN OFFER TO SELL THESE SECURITIES AND IT IS NOT A SOLICITATION OF AN OFFER TO BUY THESE SECURITIES IN ANY JURISDICTION WHERE THE OFFER OR SALE IS NOT PERMITTED. |
| | 142 | |
| Structural and Collateral Term Sheet | | BMO 2022-C3 |
| |
| No. 11 – Lakes Medical Center |
The following table presents certain information relating to the operating history and underwritten cash flows at the Lakes Medical Center Property:
| Operating History and Underwritten Net Cash Flow |
| | 2019 | 2020 | 2021 | TTM(1) | Underwritten | Per Square Foot | %(2) |
| Base Rent(3) | $2,822,138 | $2,904,676 | $2,875,822 | $2,876,398 | $2,930,757 | $21.64 | 68.5% | |
| Contractual Rent Steps(4) | 0 | 0 | 0 | 0 | 660 | $0.00 | 0.0% | |
| Potential Income from Vacant Space | 0 | 0 | 0 | 0 | 68,338 | $0.50 | 1.6% | |
| Total Reimbursements | 1,159,682 | 1,193,852 | 1,207,400 | 1,198,047 | 1,279,927 | $9.45 | 29.9% | |
| Gross Potential Rent | $3,981,819 | $4,098,529 | $4,083,222 | $4,074,444 | $4,279,682 | $31.59 | 100.0% | |
| Vacancy & Credit Loss | 0 | 0 | 0 | 0 | (213,984) | ($1.58) | (5.0%) | |
| Effective Gross Income | $3,981,819 | $4,098,529 | $4,083,222 | $4,074,444 | $4,065,698 | $30.01 | 95.0% | |
| Real Estate Taxes | 454,574 | 458,795 | 464,118 | 338,746 | 488,334 | $3.61 | 12.0% | |
| Insurance | 30,356 | 23,741 | 25,765 | 25,765 | 35,203 | $0.26 | 0.9% | |
| Management Fee | 151,200 | 148,800 | 168,618 | 163,500 | 121,971 | $0.90 | 3.0% | |
| Other Operating Expenses | 620,922 | 646,765 | 599,196 | 641,761 | 677,295 | $5.00 | 16.7% | |
| Total Expenses | $1,257,052 | $1,278,100 | $1,257,697 | $1,169,771 | $1,322,803 | $9.77 | 32.5% | |
| Net Operating Income | $2,724,767 | $2,820,428 | $2,825,525 | $2,904,673 | $2,742,895 | $20.25 | 67.5% | |
| Replacement Reserves | 0 | 0 | 0 | 0 | 27,092 | $0.20 | 0.7% | |
| TI / LC | 0 | 0 | 0 | 0 | 135,549 | $1.00 | 3.3% | |
| Net Cash Flow | $2,724,767 | $2,820,428 | $2,825,525 | $2,904,673 | $2,580,254 | $19.05 | 63.5% | |
| (1) | TTM reflects the trailing 12 months ending June 30, 2022. |
| (2) | % column represents percent of Gross Potential Rent for all revenue fields and represents percent of Effective Gross Income for the remainder of fields. |
| (3) | Base Rent is based on the underwritten rent roll dated as of August 29, 2022. |
| (4) | Contractual Rent Steps represent increases occurring through October 1, 2022 for Befitting You Medical Supplies. |
The Market. The Lakes Medical Center Property is located in West Bloomfield, Oakland County, Michigan which is part of the Warren-Troy-Farmington Hills MSA. Specifically, the Lakes Medical Property is located within the Lakes Area Medical submarket. The Lakes Medical Center Property is located 35 minutes from the Detroit Central Business District and 30 minutes from the Detroit Metropolitan Airport. Primary access to the neighborhood is provided by Michigan M-5 which is a 27.9-mile-long highway that runs through the Metro Detroit area.
In the second quarter of 2022, the Lakes Area Medical submarket reported an inventory of approximately 1.5 million square feet, and an overall vacancy rate of 11.2%. The average asking rent in the second quarter of 2022 was $23.05 per square foot compared to $23.68 per square foot in the second quarter of 2019 before the COVID-19 pandemic. According to the appraisal, the 2022 population within a one-, three- and five-mile radius of the Lakes Medical Center Property was 5,606, 58,939, and 164,367, respectively. The Lakes Area Medical Submarket features two hospitals within 2.9 miles from the Lakes Medical Center Property.
THE INFORMATION IN THIS STRUCTURAL AND COLLATERAL TERM SHEET IS NOT COMPLETE AND MAY BE AMENDED PRIOR TO THE TIME OF SALE. THIS TERM SHEET IS NOT AN OFFER TO SELL THESE SECURITIES AND IT IS NOT A SOLICITATION OF AN OFFER TO BUY THESE SECURITIES IN ANY JURISDICTION WHERE THE OFFER OR SALE IS NOT PERMITTED. |
| | 143 | |
| Structural and Collateral Term Sheet | | BMO 2022-C3 |
| |
| No. 11 – Lakes Medical Center |
The following table presents certain information relating to comparable medical office leases for the Lakes Medical Center Property:
| Comparable Medical Office Leases(1) |
| Property Names | Tenant Name | City / State | Tenant Leased Space (SF) | Lease Sign Date | Lease Term (months) | Base Rent Per / SF |
| Lakes Medical Center | Shores 3 | West Bloomfield / MI | 30,962(2) | Various(2)(3) | Various(3) | $22.00(2) |
| University Trails Medical | Confidential – Medical | Rochester / MI | 2,575 | Mar-22 | 126 | $25.00 |
| Guardian Dentistry | GD MI Management LLC | Clawson / MI | 4,283 | Sep-21 | 180 | $19.85 |
| West Bloomfield Plaza | Beaumont Urgent Care | West Bloomfield / MI | 4,971 | Jul-22 | 120 | $26.50 |
| Beaumont Health & | William Beaumont | Royal Oak / MI | 9,242 | Nov-20 | 120 | $28.50 |
| Beaumont Medical | Elite Healthcare, PLC | Lake Orion / MI | 3,080 | Aug-19 | 71 | $19.00 |
| Medical Office Building | Orthodontic Associates | Birmingham / MI | 4,322 | Jul-20 | 60 | $39.00 |
| (2) | Based on the underwritten rent roll dated August 29, 2022. |
| (3) | Shores 3 commenced its lease term on March 13, 2003 with respect to units 1000, 1050, and 1055 and March 13, 2004 with respect to unit 2000. All of the units have a lease expiration date of August 31, 2034. |
THE INFORMATION IN THIS STRUCTURAL AND COLLATERAL TERM SHEET IS NOT COMPLETE AND MAY BE AMENDED PRIOR TO THE TIME OF SALE. THIS TERM SHEET IS NOT AN OFFER TO SELL THESE SECURITIES AND IT IS NOT A SOLICITATION OF AN OFFER TO BUY THESE SECURITIES IN ANY JURISDICTION WHERE THE OFFER OR SALE IS NOT PERMITTED. |
| | 144 | |
| Structural and Collateral Term Sheet | | BMO 2022-C3 |
| |
| No. 12 – PHX Industrial & LA Retail Portfolio |
| Mortgage Loan Information | | Property Information |
| Mortgage Loan Seller: | CREFI | | Single Asset / Portfolio: | Portfolio |
| Original Principal Balance: | $24,500,000 | | Title(1): | Fee |
| Cut-off Date Principal Balance: | $24,500,000 | | Property Type – Subtype(1): | Various – Various |
| % of IPB: | 3.4% | | Net Rentable Area (SF): | 303,494 |
| Mortgage Loan Purpose: | Refinance | | Location: | Various |
| Borrowers: | Phoenix Industrial 2022, LLC and | | Year Built / Renovated(1): | Various / Various |
| | Windix Prairieville, LLC | | Occupancy: | 99.5% |
| Borrowers Sponsors: | Kenneth Levy and Kenneth Levy, | | Occupancy Date: | 8/31/2022 |
| | as Trustee of The Levy Family | | 4th Most Recent NOI (As of)(2): | ($308,778) (12/31/2019) |
| | Trust Dated February 18, 1983, as | | 3rd Most Recent NOI (As of)(2): | $26,859 (12/31/2020) |
| | Amended | | 2nd Most Recent NOI (As of): | $2,082,219 (12/31/2021) |
| Interest Rate: | 5.93000% | | Most Recent NOI (As of): | $2,441,014 (TTM 6/30/2022) |
| Note Date: | 8/31/2022 | | UW Economic Occupancy: | 95.0% |
| Maturity Date: | 9/6/2032 | | UW Revenues: | $3,872,054 |
| Interest-only Period: | 120 months | | UW Expenses: | $1,354,895 |
| Original Term: | 120 months | | UW NOI: | $2,517,160 |
| Original Amortization Term: | None | | UW NCF: | $2,357,566 |
| Amortization Type: | Interest Only | | Appraised Value / Per SF: | $55,600,000 / $183 |
| Call Protection: | L(25),D(91),O(4) | | Appraisal Date(3): | Various |
| Lockbox / Cash Management: | Springing / Springing | | | |
| Additional Debt: | No | | | |
| Additional Debt Balance: | N/A | | | |
| Additional Debt Type: | N/A | | | |
| | | | | |
| | | | | |
| Escrows and Reserves | | Financial Information |
| | Initial | Monthly | Initial Cap | | Cut-off Date Loan / SF: | $81 | |
| Taxes: | $385,698 | $55,100 | N/A | | Maturity Date Loan / SF: | $81 | |
| Insurance: | $83,971 | $7,634 | N/A | | Cut-off Date LTV: | 44.1% | |
| Replacement Reserve: | $0 | $3,457 | $82,960 | | Maturity Date LTV: | 44.1% | |
TI / LC: | $0 | Springing | $540,000(4) | | UW NCF DSCR: | 1.60x | |
| Other(5): | $89,375 | Springing(6) | N/A | | UW NOI Debt Yield: | 10.3% | |
| | | | | | | |
| Sources and Uses |
| Sources | Proceeds | % of Total | | Uses | Proceeds | % of Total |
| Mortgage Loan | $24,500,000 | 90.1 | % | | Loan Payoff | $26,193,537 | 96.3 | % |
| Sponsor Equity | 2,696,730 | 9.9 | | | Upfront Reserves | 559,045 | 2.1 | |
| | | | | Closing Costs | 444,148 | 1.6 | |
| Total Sources | $27,196,730 | 100.0 | % | | Total Uses | $27,196,730 | 100.0 | % |
| (1) | The PHX Industrial & LA Retail Portfolio is secured by the fee interest in two industrial and retail properties which were built between 1998 and 1999. One of the two mortgaged properties, the Chandler Tech Center Property (as defined below) was renovated in 2022. See “Portfolio Summary” table herein. |
| (2) | 4th and 3rd Most Recent NOI only includes financial information for the Chandler Tech Center Property. Historical financial information as of December 31, 2019 and December 31, 2020 is not available for the Winn Dixie Prairieville Property (as defined below) as the property was acquired in 2021. |
| (3) | Appraised values are as of May 21, 2022 and May 23, 2022. |
| (4) | The TI / LC reserve cap is equal to $540,000 for each applicable leasing reserve tenant; provided, however, that upon the occurrence of a Leasing Reserve Cap Reduction Event (“Leasing Reserve Cap Reduction Event”), such amount shall be reduced proportionally with respect to the applicable leasing reserve tenant based upon the portion of the applicable leasing reserve tenant space that has been leased to one or more replacement tenants (for clarity, if 65% of the applicable leasing reserve tenant space is re-leased, the new leasing reserve cap for the applicable leasing reserve tenant would be reduced to $189,000). A Leasing Reserve Cap Reduction Event shall mean that in connection with a re-tenanting of an applicable Leasing Reserve Tenant Space (“Leasing Reserve Tenant Space”), all of the following conditions have been satisfied: (i) 50% or more of the square footage of such Leasing Reserve Tenant Space shall have been leased to one or more replacement Tenants under Leases reasonably acceptable to Lender for a minimum of three years in each case, and (ii) such Tenant is paying full, unabated rent pursuant to the terms hereof. |
| (5) | Includes immediate repairs reserve of $89,375. |
| (6) | Includes a one-time payment of $315,000 for roof repair in the event of a Roof Repair Deposit Event (“Roof Repair Deposit Event”). |
THE INFORMATION IN THIS STRUCTURAL AND COLLATERAL TERM SHEET IS NOT COMPLETE AND MAY BE AMENDED PRIOR TO THE TIME OF SALE. THIS TERM SHEET IS NOT AN OFFER TO SELL THESE SECURITIES AND IT IS NOT A SOLICITATION OF AN OFFER TO BUY THESE SECURITIES IN ANY JURISDICTION WHERE THE OFFER OR SALE IS NOT PERMITTED. |
| | 145 | |
| Structural and Collateral Term Sheet | | BMO 2022-C3 |
| |
| No. 12 – PHX Industrial & LA Retail Portfolio |
The Loan. The PHX Industrial & LA Retail Portfolio Loan (the “PHX Industrial & LA Retail Portfolio Loan”) is secured by a first mortgage lien on the borrowers’ fee simple interests in an industrial property located in Chandler, Arizona and a retail property located in Prairieville, Louisiana (collectively, the “PHX Industrial & LA Retail Portfolio Properties”). The PHX Industrial & LA Retail Portfolio Loan was originated on August 31, 2022 by Citi Real Estate Funding Inc. (“CREFI”) and accrues interest at a fixed rate of 5.93000% per annum. The PHX Industrial & LA Retail Portfolio Loan has an initial term of 120 months, a remaining term of 119 months and is interest only for the full term. The scheduled maturity date of the PHX Industrial & LA Retail Portfolio Loan is the due date that occurs September 6, 2032.
The Properties. The PHX Industrial & LA Retail Portfolio Properties consist of two cross-collateralized properties located in Chandler, Arizona and Prairieville, Louisiana, totaling 303,494 square feet of net rentable area in the aggregate.
The Chandler Tech Center Property (the “Chandler Tech Center Property”) is a 241,660 square foot, two-story industrial property built in 1999 and renovated in 2022. The Chandler Tech Center Property is situated on an approximately 13.29-acre parcel and is located along the northwest corner of Detroit Street and 56th Street. As of August 31, 2022, the Chandler Tech Center Property was 99.4% occupied by three tenants ranging in size from 13,628 to 151,964 square feet under lease.
The Winn Dixie Prairieville Property (the “Winn Dixie Prairieville Property”) is a 61,834 square foot, one-story single-tenant retail property built in 1998. The Winn Dixie Prairieville Property is situated on an approximately 7.15-acre parcel. The Winn Dixie Prairieville Property has a multi-tenant design and as of August 31, 2022, the Winn Dixie Prairieville Property was 100.0% occupied by one tenant Winn-Dixie. Winn-Dixie has been at the property since 1998.
The following table presents certain information relating to the PHX Industrial & LA Retail Portfolio Properties:
Portfolio Summary |
| Property | City, State | Year Built / Renovated(2) | Net Rentable Area (SF)(1) | Occupancy %(1) | Allocated Loan Amount | % of Allocated Loan Amount | Appraised Value(2) | UW Base Rent(1) | UW NOI % |
| Chandler Tech Center | Chandler, Arizona | 1999 / 2022 | 241,660 | 99.4% | $21,679,900 | 88.5% | $49,200,000 | $2,396,795 | 83.5% |
| Winn Dixie Prairieville | Prairieville, Louisiana | 1998 / NAP | 61,834 | 100.0% | 2,820,100 | 11.5% | 6,400,000 | $450,000 | 16.5% |
| Total / Wtd. Avg. | | | 303,494 | 99.5% | $24,500,000 | 100.0% | $55,600,000 | $2,846,795 | 100.0% |
| (1) | Based on the underwritten rent rolls dated August 31, 2022. |
COVID-19 Update. As of August 31, 2022, the PHX Industrial & LA Retail Portfolio Properties are open and operating. As of the date of this term sheet, the PHX Industrial & LA Retail Portfolio Loan is not subject to any modification or forbearance requests. The first payment date of the PHX Industrial & LA Retail Portfolio Loan is the monthly due date in October 2022. See “Risk Factors—Special Risks—The Coronavirus Pandemic Has Adversely Affected the Global Economy and Will Likely Adversely Affect the Performance of the Mortgage Loans” in the Preliminary Prospectus.
Major Tenants. The three largest tenants at the PHX Industrial & LA Retail Portfolio Properties based on underwritten base rent are Comtech EF Data Corp., Compound Photonics U.S. Corporation and Winn-Dixie.
The largest tenant is Comtech EF Data Corp. (“Comtech EF”) (151,964 square foot; 50.1% of NRA; 47.8% of underwritten base rent). Comtech EF has been occupying its space since December 2020 and has a lease expiration date of July 31, 2036. Founded in 2000, Comtech EF is a subsidiary of Comtech Telecommunications Corp. Comtech EF Data Corp. develops and markets satellite communications products. The company offers modems, transceivers, terminals, converters, amplifiers, satellite routers, and support services. Comtech EF serves customers throughout the world.
The second largest tenant is Compound Photonics U.S Corporation (“Compound Photonics”) (74,568 square foot; 24.6% of NRA; 28.0% of underwritten base rent). Compound Photonics has been occupying its space since 2018 and has a lease expiration of December 31, 2024 with one termination option in the event that the borrowers determine to use the premises for other purposes and no suitable space is available to relocate in the same building. Founded in 2007, Compound Photonics specializes in providing compact high-resolution micro display solutions for AR and MR scenarios. The company offers products and services including Micro LED/LCOS displays, optical engine reference designs and micro display development kits.
THE INFORMATION IN THIS STRUCTURAL AND COLLATERAL TERM SHEET IS NOT COMPLETE AND MAY BE AMENDED PRIOR TO THE TIME OF SALE. THIS TERM SHEET IS NOT AN OFFER TO SELL THESE SECURITIES AND IT IS NOT A SOLICITATION OF AN OFFER TO BUY THESE SECURITIES IN ANY JURISDICTION WHERE THE OFFER OR SALE IS NOT PERMITTED. |
| | 146 | |
| Structural and Collateral Term Sheet | | BMO 2022-C3 |
| |
| No. 12 – PHX Industrial & LA Retail Portfolio |
The third largest tenant is Winn-Dixie (61,834 SF; 20.4% of NRA; 15.8% of underwritten base rent). Winn-Dixie is the single tenant at the Winn Dixie Prairieville Property and has been occupying its space since August 1998 with a lease expiring on August 31, 2028. Winn-Dixie was founded in 1925 and is a chain of grocery stores, liquor stores and in-stores pharmacies that serve communities throughout five southeastern states including Alabama, Florida, Georgia, Louisiana, and Mississippi. Winn-Dixie is a subsidiary of Southeastern Grocers, Inc, which is one of the largest supermarket chains based in the Southeast.
The Market. The Chandler Tech Center Property is located in Chandler, Maricopa County, Arizona within the Southeast Industrial Cluster submarket. The Southeast Industrial Cluster submarket houses major industrial employers including Intel, Motorola, Allied Signal, Microchip Technology and Hexcel. According to a third party report the average vacancy rate of the Southeast Industrial Cluster submarket is lower than the overall market area and the average rental rate for the submarket is higher than the overall Phoenix market. In the first quarter of 2022 the submarket reported an inventory of approximately 95.1 million square feet, and an overall vacancy rate of 3.1%. The average asking rent in the Phoenix market increased from $6.40 per square foot in the first quarter of 2019 to $8.26 per square foot in the first quarter of 2022.
The Winn Dixie Prairieville Property is located in Prairieville, Ascension Parish, Louisiana within the Ascension Parish submarket. The average vacancy rate of the Ascension Parish submarket is lower than the overall market area and the average rental rate for the submarket is higher than the overall Baton Rouge MSA area. The Winn Dixie Prairieville Property is considered a retail power center in the market. According to a third party report the Ascension Parish submarket reported in the first quarter of 2022 an inventory of approximately 5.9 million square feet and an overall vacancy rate of 1.6%. The average asking rent increased from $13.85 per square foot in first quarter of 2019 to $18.63 per square foot in the first quarter of 2022.
The following table presents certain market information with respect to the PHX Industrial & LA Retail Portfolio Properties:
| Market Summary(1) |
| Property Name | City/State | Market | Submarket | Submarket Inventory (SF) | Submarket Vacancy |
| Chandler Tech Center | Chandler, Arizona | Phoenix | Southeast Industrial Cluster | 95,159,589 | 3.1% |
| Winn Dixie Prairieville | Prairieville, Louisiana | Baton Rouge | Ascension Parrish | 5,855,149 | 1.6% |
The following table presents certain information relating to the historical and current occupancy of the PHX Industrial & LA Retail Portfolio Properties:
| Historical and Current Occupancy(1) |
| 2019(2) | 2020(2) | 2021 | 6/30/2022 | Current(3) |
| NAV | NAV | 95.1% | 97.0% | 99.5% |
| (1) | Historical occupancies are the annual average physical occupancy of each respective year. |
| (2) | 2019 and 2020 occupancies are not available because the Winn Dixie Prairieville Property was acquired in 2021 and the Chandler Tech Center Property was recently renovated in 2022. |
| (3) | Current Occupancy is based on rent rolls dated August 31, 2022. |
THE INFORMATION IN THIS STRUCTURAL AND COLLATERAL TERM SHEET IS NOT COMPLETE AND MAY BE AMENDED PRIOR TO THE TIME OF SALE. THIS TERM SHEET IS NOT AN OFFER TO SELL THESE SECURITIES AND IT IS NOT A SOLICITATION OF AN OFFER TO BUY THESE SECURITIES IN ANY JURISDICTION WHERE THE OFFER OR SALE IS NOT PERMITTED. |
| | 147 | |
| Structural and Collateral Term Sheet | | BMO 2022-C3 |
| |
| No. 12 – PHX Industrial & LA Retail Portfolio |
The following table presents certain information relating to the largest tenants based on the underwritten base rent of the PHX Industrial & LA Retail Portfolio Properties:
| Top Tenant Summary(1) |
| Tenant | Ratings Moody’s/S&P/Fitch(2) | Net Rentable Area (SF) | % of Total NRA | UW Base Rent PSF(3) | UW Base Rent(3) | % of Total UW Base Rent | Lease Expiration Date |
| Comtech EF(4) | NR/NR/NR | 151,964 | 50.1 | % | $8.96 | $1,361,782 | 47.8 | % | 7/31/2036 |
| Compound Photonics(5) | NR/NR/NR | 74,568 | 24.6 | | 10.68 | 796,386 | 28.0 | | 12/31/2024 |
| Winn-Dixie(6) | NR/NR/NR | 61,834 | 20.4 | | 7.28 | 450,000 | 15.8 | | 8/31/2028 |
| William Ryan Homes(7) | NR/NR/NR | 13,628 | 4.5 | | 17.51 | 238,626 | 8.4 | | 1/31/2025 |
| Largest Tenants | | 301,994 | 99.5 | % | $9.43 | $2,846,795 | 100.0 | % | |
| Remaining Tenants | | 0 | 0.0 | | 0.00 | 0 | 0.0 | | |
| Total Occupied | | 301,994 | 99.5 | % | $9.43 | $2,846,795 | 100.0 | % | |
| Vacant Space | | 1,500 | 0.5 | | | | | |
| Total / Wtd. Avg. | | 303,494 | 100.0 | % | | | | |
| (1) | Based on the underwritten rent rolls dated August 31, 2022. |
| (2) | In certain instances, ratings provided are those of the parent company of the entity shown, regardless of whether the parent company guarantees the lease. |
| (3) | UW Base Rent PSF and UW Base rent is inclusive of contractual rent steps underwritten through January 1, 2023 for Comtech EF, Compound Photonics and William Ryan Homes. |
| (4) | Comtech EF has (i) two, five-year renewal options and (ii) no unilateral termination options remaining under its lease. |
| (5) | Compound Photonics has (i) two, five-year renewal options and (ii) one unilateral termination option in the event that the borrowers determine to use the premises for other purposes and no suitable space is available to relocate in the same building for Compound Photonics. |
| (6) | Winn-Dixie has (i) five, five-year renewal options and (ii) no unilateral termination options remaining under its lease. |
| (7) | William Ryan Homes has (i) one, three-year renewal option and (ii) no unilateral termination options remaining under its lease. |
The following table presents certain information relating to the tenant lease expirations at the PHX Industrial & LA Retail Portfolio Properties:
| Lease Rollover Schedule(1)(2) |
Year | Number of Leases Expiring | Net Rentable Area Expiring | % of Net Rental Area Expiring | UW Base Rent Expiring(3) | % of UW Base Rent Expiring | Cumulative Net Rentable Area Expiring | Cumulative % of NRA Expiring | Cumulative UW Base Rent Expiring(3) | Cumulative % of UW Base Rent Expiring |
| Vacant | NAP | 1,500 | 0.5 | % | NAP | NAP | 1,500 | 0.5% | NAP | NAP |
| MTM | 0 | 0 | 0.0 | | $0 | 0.0% | 1,500 | 0.5% | $0 | 0.0% |
| 2022 | 0 | 0 | 0.0 | | 0 | 0.0 | 1,500 | 0.5% | $0 | 0.0% |
| 2023 | 0 | 0 | 0.0 | | 0 | 0.0 | 1,500 | 0.5% | $0 | 0.0% |
| 2024 | 1 | 74,568 | 24.6 | | 796,386 | 28.0 | 76,068 | 25.1% | $796,386 | 28.0% |
| 2025 | 1 | 13,628 | 4.5 | | 238,626 | 8.4 | 89,696 | 29.6% | $1,035,013 | 36.4% |
| 2026 | 0 | 0 | 0.0 | | 0 | 0.0 | 89,696 | 29.6% | $1,035,013 | 36.4% |
| 2027 | 0 | 0 | 0.0 | | 0 | 0.0 | 89,696 | 29.6% | $1,035,013 | 36.4% |
| 2028 | 1 | 61,834 | 20.4 | | 450,000 | 15.8 | 151,530 | 49.9% | $1,485,013 | 52.2% |
| 2029 | 0 | 0 | 0.0 | | 0 | 0.0 | 151,530 | 49.9% | $1,485,013 | 52.2% |
| 2030 | 0 | 0 | 0.0 | | 0 | 0.0 | 151,530 | 49.9% | $1,485,013 | 52.2% |
| 2031 | 0 | 0 | 0.0 | | 0 | 0.0 | 151,530 | 49.9% | $1,485,013 | 52.2% |
| 2032 & Beyond | 1 | 151,964 | 50.1 | | 1,361,782 | 47.8 | 303,494 | 100.0% | $2,846,795 | 100.0% |
| Total | 4 | 303,494 | 100.0 | % | $2,846,795 | 100.0% | | | | |
| (1) | Based on the underwritten rent rolls dated August 31, 2022. |
| (2) | Certain tenants may have termination options that are exercisable prior to the originally stated expiration date of the subject lease and that are not considered in the Lease Rollover Schedule. |
| (3) | UW Base Rent Expiring and Cumulative UW Base Rent Expiring includes rent steps occurring through January 1, 2023 for Comtech EF, Compound Photonics and William Ryan Homes. |
THE INFORMATION IN THIS STRUCTURAL AND COLLATERAL TERM SHEET IS NOT COMPLETE AND MAY BE AMENDED PRIOR TO THE TIME OF SALE. THIS TERM SHEET IS NOT AN OFFER TO SELL THESE SECURITIES AND IT IS NOT A SOLICITATION OF AN OFFER TO BUY THESE SECURITIES IN ANY JURISDICTION WHERE THE OFFER OR SALE IS NOT PERMITTED. |
| | 148 | |
| Structural and Collateral Term Sheet | | BMO 2022-C3 |
| |
| No. 12 – PHX Industrial & LA Retail Portfolio |
The following table presents certain information relating to the operating history and underwritten cash flows of the PHX Industrial & LA Retail Portfolio Properties:
Operating History and Underwritten Net Cash Flow |
| | 2019 | 2020 | 2021 | TTM(1) | Underwritten | Per Square Foot | %(2) |
| Rents in Place(3) | $2,161,739 | $2,309,685 | $2,667,430 | $2,729,144 | $2,779,786 | $9.16 | 68.2 | % |
| Rent Steps(4) | 0 | 0 | 0 | 0 | 67,009 | 0.22 | 1.6 | |
| Gross Potential Rent | $2,161,739 | $2,309,685 | $2,667,430 | $2,729,144 | $2,846,795 | $9.38 | 69.8 | % |
| Potential Income from | 0 | 0 | 0 | 0 | 15,000 | 0.05 | 0.4 | |
| Vacant Space | | | | | | | |
| Total Reimbursements | 1,326,001 | 998,316 | 981,711 | 1,098,046 | 1,213,978 | 4.00 | 29.8 | |
| Net Rental Income | $3,487,740 | $3,308,001 | $3,649,140 | $3,827,190 | $4,075,773 | $13.43 | 100.0 | % |
| (Vacancy/Credit Loss) | (2,569,957) | (2,065,626) | (361,528) | (143,273) | (203,789) | (0.67) | (5.0 | ) |
| Other Income(5) | 204 | 421 | 70 | 70 | 70 | 0.00 | 0.0 | |
| Effective Gross Income | $917,987 | $1,242,796 | $3,287,682 | $3,683,987 | $3,872,054 | $12.76 | 95.0 | % |
| Total Expenses | $1,226,765 | $1,215,937 | $1,205,463 | $1,242,973 | $1,354,895 | $4.46 | 35.0 | % |
| Net Operating Income | ($308,778) | 26,859 | $2,082,219 | $2,441,014 | $2,517,160 | $8.29 | 65.0 | % |
| Total TI/LC, Cap Ex / RR | 0 | 0 | 0 | 0 | 159,594 | 0.53 | 4.1 | |
| Net Cash Flow | ($308,778) | $26,859 | $2,082,219 | $2,441,014 | $2,357,566 | $7.77 | 60.9 | % |
| (1) | TTM reflects the trailing 12 months ending June 30, 2022. |
| (2) | % column represents percent of Net Rental Income for all revenue fields and represents percent of Effective Gross Income for the remainder of fields. |
| (3) | Rents in Place are based on the underwritten rent rolls dated August 31, 2022. |
| (4) | Rent Steps represent increases occurring through January 1, 2023 for Comtech EF, Compound Photonics and William Ryan Homes. |
| (5) | Other Income includes late fee and miscellaneous income. |
THE INFORMATION IN THIS STRUCTURAL AND COLLATERAL TERM SHEET IS NOT COMPLETE AND MAY BE AMENDED PRIOR TO THE TIME OF SALE. THIS TERM SHEET IS NOT AN OFFER TO SELL THESE SECURITIES AND IT IS NOT A SOLICITATION OF AN OFFER TO BUY THESE SECURITIES IN ANY JURISDICTION WHERE THE OFFER OR SALE IS NOT PERMITTED. |
| | 149 | |
| Structural and Collateral Term Sheet | | BMO 2022-C3 |
| |
| No. 13 – ACME Mahwah |
| Mortgage Loan Information | | Property Information |
| Mortgage Loan Seller: | BMO | | Single Asset / Portfolio: | Single Asset |
| Original Principal Balance: | $23,000,000 | | Title: | Fee |
| Cut-off Date Principal Balance: | $23,000,000 | | Property Type – Subtype: | Retail – Single Tenant |
| % of IPB: | 3.2% | | Net Rentable Area (SF): | 110,249 |
| Loan Purpose: | Refinance | | Location: | Mahwah, NJ |
| Borrowers: | Inwood Realty Group LLC and 615 West 173rd Street Realty LLC | | Year Built / Renovated: | 1995 / NAP |
| Borrower Sponsors: | James Nadel and Lorri Nadel | | Occupancy: | 100.0% |
| Interest Rate: | 5.01500% | | Occupancy Date: | 8/5/2022 |
| Note Date: | 8/5/2022 | | 4th Most Recent NOI (As of): | $2,772,853 (12/31/2019) |
| Maturity Date: | 8/6/2032 | | 3rd Most Recent NOI (As of): | $2,772,853 (12/31/2020) |
| Interest-only Period: | 120 months | | 2nd Most Recent NOI (As of): | $2,772,853 (12/31/2021) |
| Original Term: | 120 months | | Most Recent NOI (As of): | $2,772,853 (TTM 3/31/2022) |
| Original Amortization Term: | None | | UW Economic Occupancy: | 95.0% |
| Amortization Type: | Interest Only | | UW Revenues: | $3,259,700 |
| Call Protection: | L(26),D(90),O(4) | | UW Expenses: | $587,663 |
| Lockbox / Cash Management: | Hard / In Place | | UW NOI: | $2,672,037 |
| Additional Debt: | No | | UW NCF: | $2,672,037 |
| Additional Debt Balance: | N/A | | Appraised Value / Per SF: | $44,400,000 / $403 |
| Additional Debt Type: | N/A | | Appraisal Date: | 6/28/2022 |
| | | | | |
| Escrows and Reserves | | Financial Information |
| | Initial | Monthly | Initial Cap | | Cut-off Date Loan / SF: | $209 |
| Taxes: | $0 | Springing | N/A | | Maturity Date Loan / SF: | $209 |
| Insurance: | $992 | Springing | N/A | | Cut-off Date LTV: | 51.8% |
| Replacement Reserves: | $0 | Springing | $500,000 | | Maturity Date LTV: | 51.8% |
| TI / LC: | $0 | Springing | N/A | | UW NCF DSCR: | 2.28x |
| | | | | | UW NOI Debt Yield: | 11.6% |
| | | | | | | |
| Sources and Uses |
| Sources | Proceeds | % of Total | | Uses | Proceeds | % of Total |
| Mortgage Loan | $23,000,000 | 100.0 | % | | Loan Payoff | $20,587,676 | 89.5 | % |
| | | | | Return of Equity | 1,998,947 | 8.7 | |
| | | | | Closing Costs | 412,384 | 1.8 | |
| | | | | Upfront Reserves | 992 | 0.0 | |
| Total Sources | $23,000,000 | 100.0 | % | | Total Uses | $23,000,000 | 100.0 | % |
The Loan. The thirteenth largest mortgage loan (the “ACME Mahwah Mortgage Loan”) has an original and Cut-off Date balance of $23,000,000 and is secured by a first mortgage lien on the borrowers’ fee interest in a 110,249 square foot single tenant retail property located in Mahwah, New Jersey (the “ACME Mahwah Property”). The ACME Mahwah Mortgage Loan has a 10-year term and is interest only for the entire term.
The Property. The ACME Mahwah Property consists of a 110,249 square foot single tenant retail center situated on 14.09 acres in Mahwah, New Jersey. The ACME Mahwah Property was developed in 1995 and is comprised of two, single-story buildings. The ACME Mahwah Property has a total of 618 surface parking spaces, resulting in a ratio of approximately 5.61 spaces per 1,000 square feet. As of August 5, 2022, 100% of NRA at the ACME Mahwah Property was leased to ACME Supermarkets under a triple-net master lease with a scheduled expiration date of February 28, 2034 (subject to seven, five-year renewal options remaining). ACME Supermarkets is responsible for all operational aspects at each building including payment of repairs, leasing and leasing or subleasing costs. ACME Supermarkets subleased 42.8% of NRA to 20 third party subtenants under the related subleases.
THE INFORMATION IN THIS STRUCTURAL AND COLLATERAL TERM SHEET IS NOT COMPLETE AND MAY BE AMENDED PRIOR TO THE TIME OF SALE. THIS TERM SHEET IS NOT AN OFFER TO SELL THESE SECURITIES AND IT IS NOT A SOLICITATION OF AN OFFER TO BUY THESE SECURITIES IN ANY JURISDICTION WHERE THE OFFER OR SALE IS NOT PERMITTED. |
| | 150 | |
| Structural and Collateral Term Sheet | | BMO 2022-C3 |
| |
| No. 13 – ACME Mahwah |
The ACME Mahwah Property is positioned on Franklin Turnpike (Route 507), approximately half a mile from Route 17 and approximately 1.5 miles from Interstate 287/87, which provides regional access to the local area. The ACME Mahwah Property is serviced by the Short Line Bus with direct routes to the Port Authority Bus Terminal in mid-town Manhattan.
COVID-19 Update. As of August 5, 2022, the ACME Mahwah Property is open and operating. No tenants are currently receiving rent deferrals or abatements due to the COVID-19 pandemic. As of the date of this term sheet, the ACME Mahwah Mortgage Loan is not subject to any modification or forbearance requests and is current on its debt service payments. The first payment date of the ACME Mahwah Mortgage Loan was September 6, 2022.
Major Tenant.
ACME Supermarkets (110,249 SF, 100.0% of NRA, 100.0% of underwritten rent); rated Ba2/BB by Moody’s/S&P. ACME Supermarkets is an American grocery/supermarket chain operating in New Jersey, Pennsylvania, Delaware, New York, Maryland and Connecticut. ACME Supermarkets is a subsidiary of Albertsons Companies, a food and drug retailer operating stores across 35 states under 19 banners including Albertsons, Safeway, Jewel-Osco, Shaw’s and more. ACME Supermarkets occupies 54,598 square feet (approximately 49.5% of NRA) and subleases 47,154 square feet (approximately 42.8% of NRA) to 20 third party tenants. ACME Supermarkets has been a tenant at the ACME Mahwah Property since March 1, 2004, and has a current lease expiration of February 28, 2034, with seven, five-year renewal options remaining. During the last five years of the first lease extension period or at any time during any subsequent lease extension period, ACME Supermarkets may, within 60 days of an Event of Loss (as defined below), terminate its lease.
An “Event of Loss” will have occurred following (i) the damage, by fire or otherwise, of at least 50% of the replacement cost of the ACME Mahwah Property during the last five years of the first lease extension period or at any time during any subsequent lease extension period or (ii) the taking by condemnation, either permanently or for a period which extends beyond the then effective lease term, effecting a transfer of title to, or a termination ACME Supermarkets’ rights to (A) at least 10% of the improvements (exclusive of retail space and other non-building improvements such as parking), (B) the principal points of ingress or egress between the ACME Mahwah Property and public roadways or (C) an amount of parking area which results in at least a 20% reduction of available parking spaces for the ACME Mahwah Property.
The following table presents certain information relating to the historical and current occupancy of the ACME Mahwah Property:
| Historical and Current Occupancy |
| 2019(1) | 2020(1) | 2021(1) | 3/31/2022 | Current(2) |
| 100.0% | 100.0% | 100.0% | 100.0% | 100.0% |
| (1) | Historical Occupancies are as of December 31 of each respective year. |
| (2) | Current Occupancy is as of August 5, 2022. |
The following table presents certain information relating to the largest tenants based on underwritten base rent of the ACME Mahwah Property:
| Top Tenant Summary(1) |
| Tenant | Ratings
Moody’s/S&P/Fitch(2) | Net Rentable Area (SF) | % of
Total NRA | UW Base Rent PSF | UW Base Rent | % of Total
UW Base Rent | Lease
Exp. Date |
| ACME Supermarkets(3)(4) | Ba2/BB/NR | 110,249 | 100.0% | $25.15 | $2,772,853 | 100.0% | 2/28/2034 |
| | | | | | | | |
| Occupied Collateral Total | 110,249 | 100.0% | $25.15 | $2,772,853 | 100.0% | |
| | | | | | | | |
| Vacant Space | | 0 | 0.0% | | | | |
| | | | | | | | |
| Collateral Total | | 110,249 | 100.0% | | | | |
| | | | | | | | |
| (1) | Based on underwritten rent roll dated August 5, 2022. |
| (2) | Ratings provided are for the parent company of the entity listed in the “Tenant” field whether or not the parent company guarantees the lease. |
| (3) | ACME Supermarkets occupies 54,598 square feet (49.5% of NRA) and subleases 47,154 square feet (42.8% of NRA) to 20 third party subtenants under the related subleases having 8,497 square feet (7.7% of NRA) of vacant space, as described in the table below. |
| (4) | ACME Supermarkets may terminate its lease during the last five years of the first lease extension period and at any time during any subsequent lease extension period, terminate its lease within 60 days of an Event of Loss. |
THE INFORMATION IN THIS STRUCTURAL AND COLLATERAL TERM SHEET IS NOT COMPLETE AND MAY BE AMENDED PRIOR TO THE TIME OF SALE. THIS TERM SHEET IS NOT AN OFFER TO SELL THESE SECURITIES AND IT IS NOT A SOLICITATION OF AN OFFER TO BUY THESE SECURITIES IN ANY JURISDICTION WHERE THE OFFER OR SALE IS NOT PERMITTED. |
| | 151 | |
| Structural and Collateral Term Sheet | | BMO 2022-C3 |
| |
| No. 13 – ACME Mahwah |
The following table presents certain information relating to the sublease tenants for the ACME Mahwah Property:
| Sublease Tenant Summary(1) |
| Tenant Name | Net Rentable Area (SF) | % of Total NRA |
| Prime 7 Korean BBQ | 6,807 | 6.2% |
| Dunkin Donuts | 5,040 | 4.6% |
| Starbuck/ACME | 3,439 | 3.1% |
| Mythicos Studios | 3,200 | 2.9% |
| Wah Sing - Chinese Restaurant | 2,780 | 2.5% |
| NJ Liquor Store | 2,476 | 2.2% |
| Dry Cleaners | 1,920 | 1.7% |
| UPS Store | 1,840 | 1.7% |
| M&T Bank | 1,800 | 1.6% |
| Verizon | 1,800 | 1.6% |
| Hallmark | 1,800 | 1.6% |
| Pro Nails | 1,760 | 1.6% |
| Hairbar - Salon | 1,760 | 1.6% |
| Dairy Queen | 1,760 | 1.6% |
| Blueberry Froyo | 1,750 | 1.6% |
| El Aztecca | 1,740 | 1.6% |
| Dentist/Eye Care | 1,728 | 1.6% |
| Blimpie | 1,400 | 1.3% |
| Pizza Master | 1,234 | 1.1% |
| Laundramat | 1,120 | 1.0% |
| Vacant | 8,497 | 7.7% |
| Total | 55,651 | 50.5% |
| (1) | Based on the subtenant rent roll dated September 1, 2022. |
THE INFORMATION IN THIS STRUCTURAL AND COLLATERAL TERM SHEET IS NOT COMPLETE AND MAY BE AMENDED PRIOR TO THE TIME OF SALE. THIS TERM SHEET IS NOT AN OFFER TO SELL THESE SECURITIES AND IT IS NOT A SOLICITATION OF AN OFFER TO BUY THESE SECURITIES IN ANY JURISDICTION WHERE THE OFFER OR SALE IS NOT PERMITTED. |
| | 152 | |
| Structural and Collateral Term Sheet | | BMO 2022-C3 |
| |
| No. 13 – ACME Mahwah |
The following table presents certain information relating to the tenant lease expirations at the ACME Mahwah Property:
| Lease Rollover Schedule(1)(2) |
| Year | Number of Leases Expiring | Net Rentable Area Expiring | % of NRA Expiring | UW Base Rent Expiring | % of UW Base Rent Expiring | Cumulative Net Rentable Area Expiring | Cumulative % of NRA Expiring | Cumulative UW Base Rent Expiring | Cumulative % of UW Base Rent Expiring |
| Vacant | NAP | 0 | 0.0 | % | NAP | NAP | 0 | 0.0% | NAP | | NAP |
| 2022 & MTM | 0 | 0 | 0.0 | | $0 | 0.0 | % | 0 | 0.0% | $0 | 0.0 | % |
| 2023 | 0 | 0 | 0.0 | | 0 | 0.0 | | 0 | 0.0% | $0 | 0.0 | % |
| 2024 | 0 | 0 | 0.0 | | 0 | 0.0 | | 0 | 0.0% | $0 | 0.0 | % |
| 2025 | 0 | 0 | 0.0 | | 0 | 0.0 | | 0 | 0.0% | $0 | 0.0 | % |
| 2026 | 0 | 0 | 0.0 | | 0 | 0.0 | | 0 | 0.0% | $0 | 0.0 | % |
| 2027 | 0 | 0 | 0.0 | | 0 | 0.0 | | 0 | 0.0% | $0 | 0.0 | % |
| 2028 | 0 | 0 | 0.0 | | 0 | 0.0 | | 0 | 0.0% | $0 | 0.0 | % |
| 2029 | 0 | 0 | 0.0 | | 0 | 0.0 | | 0 | 0.0% | $0 | 0.0 | % |
| 2030 | 0 | 0 | 0.0 | | 0 | 0.0 | | 0 | 0.0% | $0 | 0.0 | % |
| 2031 | 0 | 0 | 0.0 | | 0 | 0.0 | | 0 | 0.0% | $0 | 0.0 | % |
| 2032 | 0 | 0 | 0.0 | | 0 | 0.0 | | 0 | 0.0% | $0 | 0.0 | % |
| 2033 & Beyond | 1 | 110,249 | 100.0 | | 2,772,853 | 100.0 | | 110,249 | 100.0% | $2,772,853 | 100.0 | % |
| Total | 1 | 110,249 | 100.0 | % | $2,772,853 | 100.0 | % | | | | |
| (1) | Based on the underwritten rent roll dated August 5, 2022. |
| (2) | 100% of NRA at the ACME Mahwah Property is leased to ACME Supermarkets under a triple-net master lease with a scheduled expiration date of February 28, 2034 (subject to seven, five-year renewal options remaining). ACME Supermarkets is responsible for all operational aspects at each building including payment of repairs, leasing and leasing or subleasing costs. ACME Supermarkets subleased 42.8% of NRA to 20 third party subtenants under the related subleases. |
The following table presents certain information relating to the operating history and underwritten cash flows of the ACME Mahwah Property:
| Operating History and Underwritten Net Cash Flow |
| | TTM(1) | Underwritten | Per Square Foot | %(2) |
| Rents in Place | $2,772,853 | $2,772,853 | $25.15 | 82.5 | % |
| Gross Potential Rent | $2,772,853 | $2,772,853 | $25.15 | 82.5 | % |
| Total Reimbursements(3) | 0 | 587,663 | 5.33 | 17.5 | |
| Net Rental Income | $2,772,853 | $3,360,515 | $30.48 | 100.0 | % |
| (Vacancy/Credit Loss) | 0 | (100,815) | (0.91) | (3.0 | ) |
| Effective Gross Income | $2,772,853 | $3,259,700 | $29.57 | 97.0 | % |
| | | | | |
| Total Expenses(3) | $0 | $587,663 | $5.33 | 18.0 | % |
| | | | | |
| Net Operating Income | $2,772,853 | $2,672,037 | $24.24 | 82.0 | % |
| | | | | |
| Capital Expenditures | 0 | 0 | 0.00 | 0.0 | |
| TI / LC | 0 | 0 | 0.00 | 0.0 | |
| | | | | |
| Net Cash Flow | $2,772,853 | $2,672,037 | $24.24 | 82.0 | % |
| (1) | TTM represents the trailing 12-month period ending March 31, 2022. |
| (2) | % column represents percent of Net Rental Income for all revenue lines and represents percent of Effective Gross Income for the remainder of fields. |
| (3) | The tenant pays all expenses directly under a triple-net lease. Total Expenses include real estate taxes and a management fee. |
The Market. The ACME Mahwah Property is located in Mahwah, New Jersey, approximately 30 miles north of New York City. Multiple major corporations such as Datascope, Jaguar, Stryker, Seiko, and UPS have headquarters located in Mahwah. According to the appraisal, the local area benefits from a lack of competitive grocery-anchored retail developments. According to a third-party market research report, as of 2021, the population within a one-mile, three-mile and five-mile radius totaled 12,036, 51,669 and 132,928 people, respectively, and average household income for the same radii was $126,795, $151,437 and $155,586, respectively.
THE INFORMATION IN THIS STRUCTURAL AND COLLATERAL TERM SHEET IS NOT COMPLETE AND MAY BE AMENDED PRIOR TO THE TIME OF SALE. THIS TERM SHEET IS NOT AN OFFER TO SELL THESE SECURITIES AND IT IS NOT A SOLICITATION OF AN OFFER TO BUY THESE SECURITIES IN ANY JURISDICTION WHERE THE OFFER OR SALE IS NOT PERMITTED. |
| | 153 | |
| Structural and Collateral Term Sheet | | BMO 2022-C3 |
| |
| No. 13 – ACME Mahwah |
According to the third-party market research report, the ACME Mahwah Property is situated within the Northern New Jersey retail market. As of the first quarter of 2022, the Northern New Jersey retail market contained total inventory of approximately 22.9 million square feet with a 7.9% vacancy rate and average annual rental rates of $29.56 per square foot.
The appraiser identified five comparable retail rentals to the ACME Mahwah Property:
| Comparable Retail Rental Summary(1) |
| Property Name/Location | Year Built/ Renovated | NRA (SF) | Tenant | Lease Size (SF) | Rent PSF | Commencement | Lease Term (Years) | Lease Type |
ACME Mahwah 115-117 Franklin Turnpike Mahwah, NJ | 1995 / NAP | 110,249(2) | ACME Supermarkets | 110,249(2) | $25.15(2) | Mar-2004(2) | 30.0(2) | NNN |
24 Wayne Hills Mall 24 Wayne Hills Mall Wayne, NJ | 2021 / NAP | NAV | Shop Rite | 80,147 | $23.50 | Jun-2021 | 25.0 | Net |
568 Valley Road 568 Valley Road Wayne, NJ | 1989 / NAP | 104,625 | Whole Foods Market | 40,000 | $16.50 | Sep-2020 | 11.0 | Net |
Waterview Marketplace 3440 U.S. 46 Parsippany-Troy Hills, NJ | 2019 / NAP | 145,613 | Whole Foods Market | 47,588 | $22.00 | Nov-2019 | 20.0 | Net |
ShopRite Plaza 3 Marshall Hill Road West Milford, NJ | 1975 / 2017 | 115,747 | Shop Rite | 73,766 | $22.05 | Jun-2019 | 20.0 | Net |
Waterworks at New Milford 250-270 River Road New Milford, NJ | 2019 / NAP | 90,000 | Shop Rite | 71,068 | $27.25 | May-2019 | 25.0 | Net |
| (2) | Based on the underwritten rent roll dated August 5, 2022. |
THE INFORMATION IN THIS STRUCTURAL AND COLLATERAL TERM SHEET IS NOT COMPLETE AND MAY BE AMENDED PRIOR TO THE TIME OF SALE. THIS TERM SHEET IS NOT AN OFFER TO SELL THESE SECURITIES AND IT IS NOT A SOLICITATION OF AN OFFER TO BUY THESE SECURITIES IN ANY JURISDICTION WHERE THE OFFER OR SALE IS NOT PERMITTED. |
| | 154 | |
| Structural and Collateral Term Sheet | | BMO 2022-C3 |
| |
| No. 14 – South Michigan Avenue |
| Mortgage Loan Information | | Property Information |
| Mortgage Loan Seller: | BMO | | Single Asset / Portfolio: | Single Asset |
| Original Principal Balance: | $22,520,000 | | Title: | Fee |
| Cut-off Date Principal Balance: | $22,520,000 | | Property Type – Subtype: | Mixed Use – Multifamily / Retail |
| % of IPB: | 3.1% | | Net Rentable Area (Units)(1): | 68 |
| Loan Purpose: | Recapitalization | | Location: | Chicago, IL |
| Borrower: | Studebaker Apartments LLC | | Year Built / Renovated: | 1910, 1951 / 2016 |
| Borrower Sponsor: | Milan Rubenstein | | Occupancy(1): | 97.1% |
| Interest Rate: | 5.92000% | | Occupancy Date: | 7/1/2022 |
| Note Date: | 7/29/2022 | | 4th Most Recent NOI (As of): | $1,038,718 (12/31/2019) |
| Maturity Date: | 8/6/2032 | | 3rd Most Recent NOI (As of): | $1,050,700 (12/31/2020) |
| Interest-only Period: | 120 months | | 2nd Most Recent NOI (As of): | $1,940,682 (12/31/2021) |
| Original Term: | 120 months | | Most Recent NOI (As of): | $1,996,896 (TTM 4/30/2022) |
| Original Amortization Term: | None | | UW Economic Occupancy: | 91.6% |
| Amortization Type: | Interest Only | | UW Revenues: | $2,994,244 |
| Call Protection: | L(26),D(90),O(4) | | UW Expenses: | $1,023,992 |
| Lockbox / Cash Management: | Soft (Residential); Hard (Commercial) / Springing | | UW NOI: | $1,970,253 |
| Additional Debt: | No | | UW NCF: | $1,881,465 |
| Additional Debt Balance: | N/A | | Appraised Value / Per Unit: | $34,200,000 / $502,941 |
| Additional Debt Type: | N/A | | Appraisal Date: | 5/13/2022 |
| | | | | |
| Escrows and Reserves | | Financial Information |
| | Initial | Monthly | Initial Cap | | Cut-off Date Loan / Unit: | $331,176 | | |
| Taxes: | $410,078 | $53,009 | N/A | | Maturity Date Loan / Unit: | $331,176 | | |
| Insurance: | $20,292 | $6,764 | N/A | | Cut-off Date LTV: | 65.8% | | |
| Replacement Reserves: | $0 | $2,526 | N/A | | Maturity Date LTV: | 65.8% | | |
| TI / LC Reserve: | $0 | $4,873 | N/A | | UW NCF DSCR: | 1.39x | | |
| Other Reserves(2): | $926,911 | $0 | N/A | | UW NOI Debt Yield(3): | 9.1% | | |
| | | | | | | | |
| Sources and Uses |
| Sources | Proceeds | % of Total | | Uses | Proceeds | % of Total |
| Mortgage Loan | $22,520,000 | 100.0 | % | | Loan Payoff | $15,822,790 | 70.3 | % |
| | | | | Equity Distribution | 4,932,982 | 21.9 | |
| | | | | Upfront Reserves | 1,357,281 | 6.0 | |
| | | | | Closing Costs | 406,947 | 1.8 | |
| Total Sources | $22,520,000 | 100.0 | % | | Total Uses | $22,520,000 | 100.0 | % |
| (1) | The South Michigan Avenue Property (as defined below) consists of a mixed-use building comprised of 68 residential units totaling 59,790 square feet, retail space totaling 32,164 square feet, and office space totaling 26,316 square feet. |
| (2) | Other Reserves represent an earnout reserve equal to $920,000, and a free rent reserve equal to approximately $6,911. The lender will make up to four disbursements from the earnout reserve to the borrower upon satisfaction by the borrower of each of the following conditions: (i) the borrower submits a request for disbursement to the lender at least 20 days prior to the date on which the borrower requests such disbursement to be made, indicating the requested amount of the disbursement; (ii) no event of default has occurred and is continuing, and the debt service coverage ratio for the South Michigan Avenue Property is greater than or equal to 1.15x at the time the disbursement is requested or on the date such disbursement is requested to be made, (iii) such disbursements will be requested in one of the following increments, $250,000, $500,000, $750,000 or $920,000 (or, with respect to the last disbursement, the amount then on deposit in the earnout reserve; provided that in no event will the aggregate amount of all funds disbursed by the lender exceed $920,000), (iv) in no event will the borrower be entitled to receive, and in no event will the lender be obligated to make, more than two disbursements in any South Michigan Avenue Mortgage Loan year, (v) the lender has determined that the debt yield, based on the outstanding principal balance of the South Michigan Avenue Mortgage Loan (including, for the avoidance of doubt, all amounts then on deposit in the earnout reserve) is no less than: (1) with respect to an aggregate disbursement of $250,000 (i.e. taking into account all prior disbursements of the earnout reserve), 8.4513%, (2) with respect to an aggregate disbursement of $500,000 (i.e. taking into account all prior disbursements of the earnout reserve), 8.5480%, (3) with respect to an aggregate disbursement of $750,000 (i.e. taking into account all prior disbursements of the earnout reserve), 8.6447% and (4) with respect to an aggregate disbursement of $920,000 (i.e. taking into account all prior disbursements of the earnout reserve), 8.7105%, and (vi) the borrower has delivered to the lender such evidence as is necessary for the lender to accurately calculate the debt yield. If the preceding conditions have not been satisfied on or prior to July 29, 2024, the lender will continue to hold funds remaining on deposit in the earnout reserve as additional collateral for the South Michigan Avenue Mortgage Loan (as defined below) through August 6, 2032 (notwithstanding any subsequent satisfaction of the preceding conditions for disbursement set forth above). Any amount remaining in the earnout reserve after the South Michigan Avenue Mortgage Loan has been paid in full will be returned to the borrower. |
| (3) | Underwritten NOI Debt Yield (%) calculations have been adjusted as a result of the economic holdback achievement reserve. |
THE INFORMATION IN THIS STRUCTURAL AND COLLATERAL TERM SHEET IS NOT COMPLETE AND MAY BE AMENDED PRIOR TO THE TIME OF SALE. THIS TERM SHEET IS NOT AN OFFER TO SELL THESE SECURITIES AND IT IS NOT A SOLICITATION OF AN OFFER TO BUY THESE SECURITIES IN ANY JURISDICTION WHERE THE OFFER OR SALE IS NOT PERMITTED. |
| | 155 | |
| Structural and Collateral Term Sheet | | BMO 2022-C3 |
| |
| No. 14 – South Michigan Avenue |
The Loan. The fourteenth largest mortgage loan (the “South Michigan Avenue Mortgage Loan”) has an original and Cut-off Date balance of $22,520,000 and is secured by a first mortgage lien on the borrower’s fee interest in a mixed-use property comprised of 68 residential units and 58,480 square feet of retail space and office space, located in Chicago, Illinois (the “South Michigan Avenue Property”). The South Michigan Avenue Mortgage Loan has a 10-year term and is interest only for the entire term.
The Property. The South Michigan Avenue Property consists of a mixed-use building comprised of 68 residential units totaling 58,480 square feet, 12 retail units totaling 32,164 square feet, and 10 office units totaling 26,316 square feet. The South Michigan Avenue Property has 70 parking spaces resulting in a parking ratio of approximately 1.03 parking spaces per unit with respect to residential units. The commercial tenants at the South Michigan Avenue Property (which consist of 12 retail tenants and eight office tenants) have a remaining weighted average lease term of 2.4 years excluding parking leases.
The South Michigan Avenue Property was built in 1910, 1951 and renovated in 2016. The residential portion of the South Michigan Avenue Property features a range of studio, two bedroom, and three bedroom units. The South Michigan Avenue Property’ residential units all feature a stainless steel appliance package, gas range/oven with microwave hood, modern flush cabinets with quartz counter tops, ceramic tile backsplash, plank flooring in the kitchen, and north-facing units have private balconies. Community spaces include a fitness center, rooftop terrace, common laundry on every residential floor, garage parking and outdoor surface parking.
COVID-19 Update. As of July 1, 2022, the South Michigan Avenue Mortgage Property was open and operating. The first debt service payment for the South Michigan Avenue Mortgage Loan was September 6, 2022. As of the date of this term sheet, the South Michigan Avenue Mortgage Loan is not subject to any forbearance, modification or debt service relief request.
Major Tenant. The largest commercial tenant by underwritten base rent, Once Upon A Playhouse, LLC, occupies 4,954 square feet of retail space (8.5% of the commercial NRA, 11.1% of the underwritten commercial base rent) with a lease expiration of September 30, 2024 with no renewal or early termination options.
The following table presents certain information relating to the historical and current occupancy of the South Michigan Avenue Property.
| Historical and Current Occupancy(1) |
| Property Type | 2019 | 2020 | 2021 | Current(2) |
| Multifamily | 93.6% | 93.9% | 97.4% | 97.1% |
| Total Commercial | 49.7% | 66.3% | 74.6% | 86.2% |
| Retail | NAV | NAV | NAV | 100.0% |
| Office | NAV | NAV | NAV | 69.4% |
| (1) | Historical occupancies are as of December 31 of each respective year. |
| (2) | Current Occupancy is based on the multifamily rent roll dated July 1, 2022 and the commercial rent roll dated June 30, 2022. |
The following table presents detailed information with respect to the current market rate units at the South Michigan Avenue Property:
| As Is Market Rate Multifamily Unit Summary |
| Unit Type | No. of Units(1) | % of Total | Average Unit Size (SF)(2) | In-Place Monthly Rental Rate(1) | In-Place Monthly Rental Rate per SF(1) | Average Monthly Market Rental Rate(2) | Average Monthly Market Rental Rate per SF(2) |
| Studio | 5 | 7.4 | % | 426 | $1,193 | $2.80 | $1,250 | $2.93 |
| 2 Bedroom | 46 | 67.6 | | 819 | $2,022 | $2.47 | $2,050 | $2.50 |
| 3 Bedroom | 17 | 25.0 | | 1,176 | $2,474 | $2.10 | $2,782 | $2.37 |
| Total/Wtd. Avg. | 68 | 100.0 | % | 879 | $2,076 | $2.36 | $2,178 | $2.48 |
| (1) | Based on the underwritten rent roll dated July 1, 2022. |
THE INFORMATION IN THIS STRUCTURAL AND COLLATERAL TERM SHEET IS NOT COMPLETE AND MAY BE AMENDED PRIOR TO THE TIME OF SALE. THIS TERM SHEET IS NOT AN OFFER TO SELL THESE SECURITIES AND IT IS NOT A SOLICITATION OF AN OFFER TO BUY THESE SECURITIES IN ANY JURISDICTION WHERE THE OFFER OR SALE IS NOT PERMITTED. |
| | 156 | |
| Structural and Collateral Term Sheet | | BMO 2022-C3 |
| |
| No. 14 – South Michigan Avenue |
The following table presents certain information relating to the largest tenants based on underwritten base rent at the South Michigan Avenue Property:
| Top Commercial Tenant Summary(1) |
| Tenant | Ratings
Moody’s/S&P/Fitch | Net Rentable Area (SF) | % of
Total NRA | UW Base Rent PSF(2) | UW Base Rent(2) | % of Total
UW Base Rent | Lease
Exp. Date(3) |
| Once Upon A Playhouse, LLC | NR/NR/NR | 4,954 | 8.5% | $28.84 | $142,873 | 11.1% | 9/30/2024 |
| Crab Bucket No1, LLC | NR/NR/NR | 3,172 | 5.4% | $31.82 | $100,935 | 7.8% | 3/31/2029 |
| L&A Healing Studio LLC | NR/NR/NR | 2,940 | 5.0% | $32.85 | $96,579 | 7.5% | 8/31/2024 |
| Issues Barber & Beauty Salon | NR/NR/NR | 3,391 | 5.8% | $22.08 | $74,873 | 5.8% | 9/30/2027 |
| SpeedPro Chicago Loop | NR/NR/NR | 3,458 | 5.9% | $19.32 | $66,816 | 5.2% | 3/1/2026 |
| The iCan Collective, LLC | NR/NR/NR | 3,069 | 5.2% | $18.54 | $56,899 | 4.4% | 12/31/2024 |
| Dr. Bin Yang dba Newsmile Advanced Dentistry | NR/NR/NR | 2,539 | 4.3% | $22.23 | $56,442 | 4.4% | 12/31/2028 |
| Slumber Stay, LLC | NR/NR/NR | 2,609 | 4.5% | $21.00 | $54,789 | 4.3% | 12/31/2024 |
| Happy Arts, LLC | NR/NR/NR | 3,738 | 6.4% | $14.50 | $54,201 | 4.2% | 6/30/2025 |
| Leon Korol Co. | NR/NR/NR | 2,609 | 4.5% | $18.54 | $48,371 | 3.8% | 12/31/2026 |
| Total Major Tenants | | 32,479 | 55.5% | $23.18 | $752,779 | 58.5% | |
| | | | | | | | |
| Other Tenants | | 17,938 | 30.7% | $20.62 | $369,897 | 28.7% | |
| | | | | | | | |
| Occupied Collateral Total | 50,417 | 86.2% | $22.27 | $1,122,676(4) | 87.2%(4) | |
| | | | | | | | |
| Vacant Space | | 8,063 | 13.8% | | | | |
| | | | | | | | |
| Collateral Total | | 58,480 | 100.0% | | | | |
| | | | | | | | |
| (1) | Based on underwritten commercial rent roll dated June 30, 2022. The information presented in the table above is based on the net rentable area and the underwritten base rent with respect to the retail and office tenants and the related leases only and does not include any residential space or residential rental payments. |
| (2) | UW Base Rent and UW Base Rent PSF include rent steps of approximately $21,161 through June 30, 2023. |
| (3) | None of the commercial tenants have any termination or contract option. |
| (4) | Vacant Space ($165,211 of UW Base Rent, 12.8% of Total UW Base Rent) is considered in the calculation of the UW Base Rent as potential income. |
THE INFORMATION IN THIS STRUCTURAL AND COLLATERAL TERM SHEET IS NOT COMPLETE AND MAY BE AMENDED PRIOR TO THE TIME OF SALE. THIS TERM SHEET IS NOT AN OFFER TO SELL THESE SECURITIES AND IT IS NOT A SOLICITATION OF AN OFFER TO BUY THESE SECURITIES IN ANY JURISDICTION WHERE THE OFFER OR SALE IS NOT PERMITTED. |
| | 157 | |
| Structural and Collateral Term Sheet | | BMO 2022-C3 |
| |
| No. 14 – South Michigan Avenue |
The following table presents certain information relating to the commercial tenant lease expirations at the South Michigan Avenue Property:
| Lease Rollover Schedule(1) |
| Year | Number of Leases Expiring | Net Rentable Area Expiring | % of NRA Expiring | UW Base Rent Expiring(2) | % of UW Base Rent Expiring | Cumulative Net Rentable Area Expiring | Cumulative % of NRA Expiring | Cumulative UW Base Rent Expiring(2) | Cumulative % of UW Base Rent Expiring |
| Vacant | NAP | 8,063 | 13.8 | % | NAP | NA | P | 8,063 | 13.8% | NAP | NA | P |
| 2022 & MTM | 3 | 5,402 | 9.2 | | $117,698 | 10.5 | % | 13,465 | 23.0% | $117,698 | 10.5 | % |
| 2023 | 2 | 4,145 | 7.1 | | 82,628 | 7.4 | | 17,610 | 30.1% | 200,326 | 17.8 | % |
| 2024 | 5 | 15,885 | 27.2 | | 393,931 | 35.1 | | 33,495 | 57.3% | 594,257 | 52.9 | % |
| 2025 | 4 | 8,325 | 14.2 | | 153,338 | 13.7 | | 41,820 | 71.5% | 747,595 | 66.6 | % |
| 2026 | 3 | 7,558 | 12.9 | | 142,830 | 12.7 | | 49,378 | 84.4% | 890,425 | 79.3 | % |
| 2027 | 1 | 3,391 | 5.8 | | 74,873 | 6.7 | | 52,769 | 90.2% | 965,299 | 86.0 | % |
| 2028 | 1 | 2,539 | 4.3 | | 56,442 | 5.0 | | 55,308 | 94.6% | 1,021,741 | 91.0 | % |
| 2029 | 1 | 3,172 | 5.4 | | 100,935 | 9.0 | | 58,480 | 100.0% | 1,122,676 | 100.0 | % |
| 2030 | 0 | 0 | 0 | | 0 | 0.0 | | 58,480 | 100.0% | 1,122,676 | 100.0 | % |
| 2031 | 0 | 0 | 0 | | 0 | 0.0 | | 58,480 | 100.0% | 1,122,676 | 100.0 | % |
| 2032 | 0 | 0 | 0 | | 0 | 0.0 | | 58,480 | 100.0% | 1,122,676 | 100.0 | % |
| 2033 & Beyond | 0 | 0 | 0 | | 0 | 0.0 | | 58,480 | 100.0% | 1,122,676 | 100.0 | % |
| Total | 20 | 58,480 | 100.0 | % | $1,122,676 | 100.0 | % | | | | |
| (1) | Based on the commercial rent roll dated June 30, 2022. The information presented in the table above is based on the net rentable area and the underwritten base rent with respect to the retail and office tenants and the related leases only and does not include any residential space or residential rental payments. |
| (2) | UW Base Rent Expiring and Cumulative UW Base Rent Expiring include rent steps of approximately $21,161 through June 30, 2023. |
The following table presents certain information relating to the operating history and underwritten cash flows of the South Michigan Avenue Property:
| Operating History and Underwritten Net Cash Flow |
| | 2019 | 2020 | 2021 | TTM(1) | Underwritten | Per Unit | %(2) |
| Residential Base Rent | $1,768,776 | $1,846,836 | $2,573,886 | $2,637,208 | $1,692,220 | $24,885.59 | 52.2 | % |
| Commercial Base Rent(3) | 0 | 0 | 0 | 0 | 1,287,887 | 18,939.51 | 39.7 | |
| Gross Potential Rent | $1,768,776 | $1,846,836 | $2,573,886 | $2,637,208 | $2,980,107 | $43,825.10 | 91.9 | % |
| Total Reimbursements | 0 | 0 | 0 | 0 | 0 | 0.00 | 0.0 | |
| Total Other Income(4) | 164,931 | 259,521 | 241,734 | 224,029 | 263,959 | 3,881.75 | 8.1 | |
| Net Rental Income | $1,933,708 | $2,106,357 | $2,815,620 | $2,861,237 | $3,244,066 | $47,706.85 | 100.0 | % |
| (Vacancy/Credit Loss) | (30,237) | (66,117) | 0 | 0 | (249,822) | (3,673.85) | (7.7 | ) |
| Effective Gross Income | $1,903,471 | $2,040,240 | $2,815,620 | $2,861,237 | $2,994,244 | $44,033.00 | 92.3 | % |
| Total Expenses | $864,753 | $989,540 | $874,938 | $864,341 | $1,023,992 | $15,058.70 | 34.2 | % |
| Net Operating Income | $1,038,718 | $1,050,700 | $1,940,682 | $1,996,896 | $1,970,253 | $28,974.30 | 65.8 | % |
| Total TI/LC, Capex/RR | 0 | 0 | 0 | 0 | 88,787 | 1,305.69 | 3.0 | |
| Net Cash Flow | $1,038,718 | $1,050,700 | $1,940,682 | $1,996,896 | $1,881,465 | $27,668.61 | 62.8 | % |
| (1) | TTM represents the trailing 12 months ending April 2022. |
| (2) | % column represents percent of residential and commercial Net Rental Income for all revenue lines and represents percent of Effective Gross Income for the remainder of the fields. |
| (3) | Underwritten Commercial Base Rent includes rent steps of approximately $21,161 through June 30, 2023. |
| (4) | Total Other Income includes parking and common area maintenance charges. |
THE INFORMATION IN THIS STRUCTURAL AND COLLATERAL TERM SHEET IS NOT COMPLETE AND MAY BE AMENDED PRIOR TO THE TIME OF SALE. THIS TERM SHEET IS NOT AN OFFER TO SELL THESE SECURITIES AND IT IS NOT A SOLICITATION OF AN OFFER TO BUY THESE SECURITIES IN ANY JURISDICTION WHERE THE OFFER OR SALE IS NOT PERMITTED. |
| | 158 | |
| Structural and Collateral Term Sheet | | BMO 2022-C3 |
| |
| No. 14 – South Michigan Avenue |
The Market. The South Michigan Avenue Property is located in Chicago, Illinois, within the Chicago-Naperville-Joliet, IL-IN-WI Metropolitan Statistical Area (“Chicago MSA”). The largest employer in Chicago is Walgreens Boots Alliance Inc., which employs approximately 277,000 people. The South Michigan Avenue Property is located south of The Loop, with primary roadways in a north-south direction connecting to Congress Parkway and Roosevelt Road. The South Loop is concentrated with office and commercial space in the central business district and is bounded by the Chicago River along the north and west.
The South Michigan Avenue Property is situated in The Loop multifamily submarket. According to the Appraisal, as of the first quarter of 2022, The Loop multifamily submarket had an overall vacancy rate of 4.0%, with net absorption totaling 1,067 units. The vacancy rate decreased by 7.3% since quarter one of 2021. Rental rates increased by $397 over the past 12 months and ended at $2,336 per unit per month. According to the appraisal, a total of 1,053 units are expected to be completed by the end of 2022.
According to the Appraisal, as of 2021, the population within a one-mile, three-mile and five-mile radius of the South Michigan Avenue Property totaled 44,189, 292,165 and 743,231 people, respectively, and median household income for the same radii was $88,769, $85,941 and $74,604, respectively. The Chicago MSA population in 2021 was 9,506,045 and is forecasted to decrease to approximately 9,498,830 by 2026.
The following table presents certain information relating to comparable retail leases for the South Michigan Avenue Property:
| Comparable Retail Leases(1) |
| Property / Location | Tenant SF | Year Built / Renovated | Tenant | Rent PSF | Commencement Date | Lease Term (Mos.) | Lease Type |
South Michigan Avenue Chicago, IL | 4,954(2) | 1910, 1951 / 2016 | Once Upon A Playhouse, LLC | $28.84 | (2)(3) | September 2021(2) | 37(2) | Triple Net |
1921 S. Jefferson Street Chicago, IL | 1,975 | NAV / NAV | NAV | $18.23 | | May-21 | 12 | Modified Gross |
30 E. Roosevelt Road Chicago, IL | 2,200 | NAV / NAV | NAV | $60.00 | | Jan-20 | NAV | Triple Net |
2000 S. Wabash Avenue Chicago, IL | 9,034 | NAV / NAV | NAV | $20.00 | | Dec-19 | NAV | Triple Net |
1400 S. Michigan Avenue Chicago, IL | 1,719 | NAV / NAV | NAV | $35.00 | | Jun-19 | NAV | Triple Net |
2 E. 8th Street Chicago, IL | 2,500 | NAV / NAV | NAV | $36.50 | | Apr-19 | 120 | Modified Gross |
2138 S. Indiana Avenue Chicago, IL | 1,252 | NAV / NAV | NAV | $28.00 | | Feb-22 | 36 | Triple Net |
2026 S. Clark Street Chicago, IL | 1,415 | NAV / NAV | NAV | $29.23 | | Aug-19 | 60 | Triple Net |
1727 S. Indiana Avenue Chicago, IL | 665 | NAV / NAV | NAV | $15.00 | | Nov-19 | 24 | Modified Gross |
| (2) | Based on the commercial rent roll dated June 30, 2022. |
| (3) | Rent PSF is inclusive of rent steps through June 30, 2023. |
THE INFORMATION IN THIS STRUCTURAL AND COLLATERAL TERM SHEET IS NOT COMPLETE AND MAY BE AMENDED PRIOR TO THE TIME OF SALE. THIS TERM SHEET IS NOT AN OFFER TO SELL THESE SECURITIES AND IT IS NOT A SOLICITATION OF AN OFFER TO BUY THESE SECURITIES IN ANY JURISDICTION WHERE THE OFFER OR SALE IS NOT PERMITTED. |
| | 159 | |
| Structural and Collateral Term Sheet | | BMO 2022-C3 |
| |
| No. 14 – South Michigan Avenue |
The following table presents certain information relating to comparable office leases for the South Michigan Avenue Property:
| Comparable Office Leases(1) |
| Property / Location | Tenant SF | Year Built / Renovated | Tenant | Rent PSF | Commencement Date | Lease Term (Mos.) | Lease Type |
South Michigan Avenue Chicago, IL | 3,069(2) | 1910, 1951 / 2016 | The iCan Collective, LLC | $18.54 | (2)(3) | October 2019(2) | 63(2) | Triple Net |
2325 S. Michigan Avenue Chicago, IL | 5,532 | NAV / NAV | NAV | $15.00 | | Aug-21 | 36 | Triple Net |
2229 S. Michigan Avenue Chicago, IL | 3,211 | NAV / NAV | NAV | $18.00 | | Oct-21 | 36 | Modified Gross |
1811 S. Wabash Avenue Chicago, IL | 1,638 | NAV / NAV | NAV | $19.47 | | Apr-22 | 36 | Triple Net |
1132 S. Wabash Avenue Chicago, IL | 500 | NAV / NAV | NAV | $36.00 | | Apr-19 | 12 | Gross |
329 W. 18th Street Chicago, IL | 6,363 | NAV / NAV | NAV | $12.00 | | May-19 | 36 | Modified Gross |
2210 S. Michigan Avenue Chicago, IL | 4,290 | NAV / NAV | NAV | $17.00 | | Jun-19 | 60 | Modified Gross |
2335 S. Michigan Avenue Chicago, IL | 3,000 | NAV / NAV | NAV | $30.00 | | Oct-19 | 60 | Modified Gross |
1313 S. Wabash Avenue Chicago, IL | 1,050 | NAV / NAV | NAV | $19.00 | | Sep-20 | 24 | Gross |
2600 S. Michigan Avenue Chicago, IL | 1,925 | NAV / NAV | NAV | $17.00 | | Jun-21 | 60 | Modified Gross |
1325 S. Wabash Avenue Chicago, IL | 1,008 | NAV / NAV | NAV | $24.00 | | Dec-21 | 12 | Modified Gross |
2600 S. Michigan Avenue Chicago, IL | 2,564 | NAV / NAV | NAV | $24.00 | | Sep-21 | 12 | Modified Gross |
2251 S. Michigan Avenue Chicago, IL | 700 | NAV / NAV | NAV | $20.52 | | Jul-21 | 12 | Gross |
| (2) | Based on the commercial rent roll dated June 30, 2022. |
| (3) | Rent PSF is inclusive of rent steps through June 30, 2023. |
THE INFORMATION IN THIS STRUCTURAL AND COLLATERAL TERM SHEET IS NOT COMPLETE AND MAY BE AMENDED PRIOR TO THE TIME OF SALE. THIS TERM SHEET IS NOT AN OFFER TO SELL THESE SECURITIES AND IT IS NOT A SOLICITATION OF AN OFFER TO BUY THESE SECURITIES IN ANY JURISDICTION WHERE THE OFFER OR SALE IS NOT PERMITTED. |
| | 160 | |
| Structural and Collateral Term Sheet | | BMO 2022-C3 |
| |
| No. 14 – South Michigan Avenue |
The following table presents certain information relating to comparable multifamily rental property to the South Michigan Avenue Property:
| Comparable Multifamily Rental Summary(1) |
| Property Name / Property Address | Year Built / Renovated | Occupancy | # of Units | Unit Mix | Average SF per Unit | Average Rent per SF | Average Rent per Unit |
South Michigan Avenue(2) 2014-2036 and 2100 South Michigan Avenue Chicago, IL | 1910, 1951 / 2016 | 97.1% | 68 | Studio 2 Bed 3 Bed | 426 819 1,176 | $2.80 $2.47 $2.10 | $1,193 $2,022 $2,474 |
| The Shelby | 2009 / NAP | 99.0% | 94 | 1 Bed | 672 | $3.07 | $2,062 |
| 2300 S. Michigan Avenue | | | | 2 Bed | 1,012 | $2.66 | $2,899 |
| Chicago, IL | | | | | | | |
| Uncommon Apartments | 1900 / 2019 | 100.0% | 43 | Studio | 561 | $3.10 | $1,740 |
| 2101 S. Wabash Street | | | | 1 Bed | 646 | $2.78 | $1,795 |
| Chicago, IL | | | | 2 Bed | 1,191 | $2.51 | $2,995 |
| 21st Street Lofts | 1925 / 2018 | 97.0% | 110 | Studio | 321 | $3.77 | $1,213 |
| 61 E. 21st Street | | | | 1 Bed | 457 | $3.17 | $1,450 |
| Chicago, IL | | | | 2 Bed | 713 | $2.98 | $2,124 |
| 2101 S. Michigan Avenue | 1971 / 2017 | 98.0% | 250 | Studio | 418 | $3.77 | $1,574 |
| 2101 S. Michigan Avenue | | | | 1 Bed | 570 | $3.09 | $1,762 |
| Chicago, IL | | | | 2 Bed | 824 | $2.68 | $2,211 |
| | | | | 3 Bed | 967 | $2.62 | $2,530 |
| Arrive South Loop | 2010 / NAP | 99.0% | 180 | 1 Bed | 672 | $3.07 | $2,062 |
| 1935 S. Wabash Avenue | | | | 2 Bed | 1,012 | $2.86 | $2,899 |
| Chicago, IL | | | | 3 Bed | 1,305 | $2.46 | $3,205 |
| Carriage House Lofts | 1898 / 2021 | 83.0% | 81 | 1 Bed | 907 | $2.09 | $1,894 |
| 1545 S. State Street | | | | 2 Bed | 1,197 | $2.20 | $2,634 |
| Chicago, IL | | | | 3 Bed | 1,490 | $2.20 | $3,280 |
| 2550 S. Wabash Avenue | 1913 / 2020 | 92.0% | 36 | 2 Bed | 1,400 | $1.85 | $2,596 |
| 2550 S. Wabash Avenue | | | | 3 Bed | 1,650 | $1.81 | $2,990 |
| Chicago, IL | | | | | | | |
| (1) | Source: Appraisal, unless otherwise indicated. |
| (2) | Based on commercial rent roll dated as of June 30, 2022. Average Rent per SF and Average Rent per Unit reflect average monthly in-place rent for occupied units. |
THE INFORMATION IN THIS STRUCTURAL AND COLLATERAL TERM SHEET IS NOT COMPLETE AND MAY BE AMENDED PRIOR TO THE TIME OF SALE. THIS TERM SHEET IS NOT AN OFFER TO SELL THESE SECURITIES AND IT IS NOT A SOLICITATION OF AN OFFER TO BUY THESE SECURITIES IN ANY JURISDICTION WHERE THE OFFER OR SALE IS NOT PERMITTED. |
| | 161 | |
| Structural and Collateral Term Sheet | | BMO 2022-C3 |
| |
| No. 15 – Home2 Suites & Holiday Inn Express Phoenix Portfolio |
| Mortgage Loan Information | | Property Information |
| Mortgage Loan Seller: | CREFI | | Single Asset / Portfolio: | Portfolio |
| Original Principal Balance: | $22,300,000 | | Title: | Fee |
| Cut-off Date Principal Balance: | $22,300,000 | | Property Type - Subtype: | Hospitality – Various |
| % of Pool by IPB: | 3.1% | | Net Rentable Area (Rooms): | 247 |
| Loan Purpose: | Refinance | | Location: | Phoenix, AZ |
| Borrowers: | FHI Group LLC and FHI2 Group LLC | | Year Built / Renovated: | Various / NAP |
| Borrower Sponsors: | Shawn Doyle and SKD Family Trust | | Occupancy / ADR / RevPAR: | 78.0% / $122.66 / $95.66 |
| Interest Rate: | 5.59000% | | Occupancy / ADR / RevPAR Date: | TTM 6/30/2022 |
| Note Date: | 8/26/2022 | | 4th Most Recent NOI (As of): | NAV |
| Maturity Date: | 9/6/2032 | | 3rd Most Recent NOI (As of): | NAV |
| Interest-only Period: | 120 months | | 2nd Most Recent NOI (As of): | $2,036,805 (12/31/2021) |
| Original Term: | 120 months | | Most Recent NOI (As of): | $3,820,021 (TTM 6/30/2022) |
| Original Amortization Term: | None | | UW Occupancy / ADR / RevPAR: | 78.0% / $122.66 / $95.66 |
| Amortization Type: | Interest Only | | UW Revenues: | $8,776,176 |
| Call Protection: | L(25),D(91),O(4) | | UW Expenses: | $5,079,031 |
| Lockbox / Cash Management: | Springing / Springing | | UW NOI: | $3,697,145 |
| Additional Debt: | No | | UW NCF: | $3,346,098 |
| Additional Debt Balance: | N/A | | Appraised Value / Per Room: | $43,100,000 / $174,494 |
| Additional Debt Type: | N/A | | Appraisal Date: | 7/1/2022 |
| | | | | |
| Escrows and Reserves | | Financial Information |
| | Initial | Monthly | Initial Cap | | Cut-off Date Loan / Room: | $90,283 | |
| Taxes: | $159,525 | $26,587 | N/A | | Maturity Date Loan / Room: | $90,283 | |
| Insurance: | $0 | Springing | N/A | | Cut-off Date LTV: | 51.7% | |
| FF&E Reserve(1): | $0 | $14,627 | N/A | | Maturity Date LTV: | 51.7% | |
| Other Reserve(2): | $0 | Springing | N/A | | UW NCF DSCR: | 2.65x | |
| | | | | | UW NOI Debt Yield: | 16.6% | |
| | | | | | | |
| Sources and Uses |
| Sources | Proceeds | % of Total | | Uses | Proceeds | % of Total |
| Mortgage Loan | $22,300,000 | 100.0 | % | | Loan Payoff | $21,148,031 | 94.8 | % |
| | | | | Return of Equity | 654,423 | 2.9 | |
| | | | | Closing Costs | 338,021 | 1.5 | |
| | | | | Upfront Reserves | 159,525 | 0.7 | |
| Total Sources | $22,300,000 | 100.0 | % | | Total Uses | $22,300,000 | 100.0 | % |
| (1) | The borrowers are required to deposit into an FF&E reserve, on a monthly basis, an amount equal to the greater of (i) 1/12th of the applicable FF&E Percentage (as defined below) of the annual gross revenues for the hotel related operations at the mortgaged property for the immediately preceding calendar year as reasonably determined by the lender, or (ii) the amount of the deposit (if any) then required by the applicable franchisor on account of FF&E under any franchise agreement relating to the Home2 Suites & Holiday Inn Express Phoenix Portfolio Properties. The “FF&E Percentage” means (i) from the origination date through and including the 12th monthly payment date, two percent, (ii) from the 13th monthly payment date through and including the 24th monthly payment date, three percent, and (iii) thereafter for so long as the mortgage loan is outstanding, four percent. At origination, the initial monthly FF&E reserve was approximately $14,627. |
| (2) | The Other Reserve consists of a PIP reserve, deposits into which will be required (A) in the case of any existing or renewal franchise agreement, prior to the effective date that any PIP is imposed thereunder and (B) in the case of any new franchise agreement, on or prior to the date such new franchise agreement is executed and delivered. |
The Loan. The Home2 Suites & Holiday Inn Express Phoenix Portfolio mortgage loan (the “Home2 Suites & Holiday Inn Express Phoenix Portfolio Mortgage Loan”) has an outstanding principal balance as of the Cut-off Date of $22,300,000 and is secured by a first lien mortgage on the borrowers’ fee interests in a 247-room portfolio consisting of a 119-room, extended stay Home2 Suites by Hilton Phoenix Airport North hotel (“Home2 Suites Property”) and a 128-room, limited service Holiday Inn Express & Suites Phoenix Airport North hotel (“Holiday Inn Express Property” and together with Home2 Suites Property, collectively the “Home2 Suites & Holiday Inn Express Phoenix Portfolio Properties”). The Home2 Suites & Holiday Inn Express Phoenix Portfolio Properties are located in Phoenix, Arizona. The Home2 Suites & Holiday Inn Express Phoenix Portfolio Mortgage Loan has a 10-year term and is interest-only for the entire term.
THE INFORMATION IN THIS STRUCTURAL AND COLLATERAL TERM SHEET IS NOT COMPLETE AND MAY BE AMENDED PRIOR TO THE TIME OF SALE. THIS TERM SHEET IS NOT AN OFFER TO SELL THESE SECURITIES AND IT IS NOT A SOLICITATION OF AN OFFER TO BUY THESE SECURITIES IN ANY JURISDICTION WHERE THE OFFER OR SALE IS NOT PERMITTED. |
| | 162 | |
| Structural and Collateral Term Sheet | | BMO 2022-C3 |
| |
| No. 15 – Home2 Suites & Holiday Inn Express Phoenix Portfolio |
The Properties. The Home2 Suites & Holiday Inn Express Phoenix Portfolio Properties are comprised of a 119-room, extended stay Home2 Suites by Hilton hotel and a 128-room, limited service Holiday Inn Express & Suites hotel in Phoenix, Arizona, the Home2 Suites & Holiday Inn Express Phoenix Portfolio Properties are approximately 1 mile north of the Phoenix Sky Harbor International Airport. As of June 30, 2022, the Home2 Suites & Holiday Inn Express Phoenix Portfolio Properties were 78.0% occupied.
The Home2 Suites Property is a 119-room, four-story, extended stay hotel located on a 2.55-acre parcel approximately 1 mile north of the Phoenix Sky Harbor International Airport. The Home2 Suites Property was opened in December 2020 and features 99 king suite and 20 king units. The Home2 Suites Property features 137 onsite parking spaces (1.15 spaces per room) along with an outdoor swimming pool, fitness center and a complimentary airport/local shuttle service. The Home2 Suites Property is accessible via Interstate 10 and State Highway 202/142, which are the closest major thoroughfares. The hotel is located approximately one-half mile north of the Valley Metro light rail 44th Street/Washington station, providing access to and from Phoenix Sky Harbor International Airport. As of June 30, 2022, the Home2 Suites Property was 82.7% occupied with an ADR of $122.61 and RevPAR of $101.37.
According to the appraisal, the estimated demand segmentation in 2019 for the Home2 Suites Property consisted of 75% commercial, 20% leisure, and 5% group. The Phoenix Sky Harbor International Airport reported a 38.7% increase in passenger traffic in the period year-to-date May 2022 as compared to the same time period in May 2021 as the economy continues to reopen after the pandemic. The Home2 Suites & Holiday Inn Express Phoenix Portfolio Properties also benefit from a variety of tourism and leisure attractions in the area including Chase Field and the Desert Botanical Garden. Phoenix has been selected to host the 2023 Super Bowl.
The Holiday Inn Express Property is a 128-room, four-story, limited stay hotel located on a 2.15-acre parcel approximately 1 mile north of the Phoenix Sky Harbor International Airport. The Holiday Inn Express Property was opened in December 2019 and features 76 king, 27 queen/queen, 17 queen/queen suite, and 8 king suite units. The Holiday Inn Express Property has 75 parking spaces (0.59 spaces per room) along with 350 square feet of meeting space, an outdoor pool, fitness room and complimentary airport/local shuttle service. The Holiday Inn Express Property is accessible via Interstate 10 and State Highway 202/142, which are the closest major thoroughfares. The hotel is located approximately one-half mile north of the Valley Metro light rail 44th Street/Washington station, providing access to and from Phoenix Sky Harbor International Airport. As of June 30, 2022, the Holiday Inn Express Property was 73.6% occupied and had an ADR of $122.70 and RevPAR of $90.34. According to the appraisal, the estimated demand segmentation in 2019 for the Holiday Inn Express Property consisted of 60% commercial, 35% leisure, and 5% meeting.
The following table presents certain information relating to the Home2 Suites & Holiday Inn Express Phoenix Portfolio Properties:
| Home2 Suites & Holiday Inn Express Phoenix Portfolio Properties |
| Property | Year Built / Renovated(1) | Rooms(2) | Occupancy(2) | UW NOI(2) | % of UW NOI(2) | Allocated Loan Amount | % of ALA | Appraised Value(1) |
| Home2 Suites Property | 2020 / NAP | 119 | 82.7% | $2,136,021 | 57.8% | $13,000,000 | 58.3% | $22,600,000 |
| Holiday Inn Express Property | 2019 / NAP | 128 | 73.6% | $1,561,124 | 42.2% | $9,300,000 | 41.7% | $20,500,000 |
| (2) | Based on the underwritten rent roll dated June 30, 2022. |
The following tables present certain information relating to the historical occupancy of the Home2 Suites & Holiday Inn Express Phoenix Portfolio Properties:
| Historical Occupancy, ADR, RevPAR(1) |
| | Competitive Set(2) | Home2 Suites | Penetration Factor |
| Year | Occupancy | ADR | RevPAR | Occupancy | ADR | RevPAR | Occupancy | ADR | RevPAR |
| 2021 | 74.7% | $93.76 | $70.04 | 69.3% | $96.87 | $67.17 | 92.8% | 103.3% | 95.9% |
| TTM(3) | 74.1% | $120.36 | $89.13 | 82.7% | $122.77 | $101.50 | 111.6% | 102.0% | 113.9% |
| (1) | Data obtained from STR reports. |
| (2) | The competitive set consists of the following hotels: Country Inn & Suites Phoenix Airport, Hampton Inn Phoenix-Airport North, Residence Inn Phoenix Airport, Holiday Inn Express & Suites Phoenix Airport and Holiday Inn Hotel & Suites Phoenix Airport |
THE INFORMATION IN THIS STRUCTURAL AND COLLATERAL TERM SHEET IS NOT COMPLETE AND MAY BE AMENDED PRIOR TO THE TIME OF SALE. THIS TERM SHEET IS NOT AN OFFER TO SELL THESE SECURITIES AND IT IS NOT A SOLICITATION OF AN OFFER TO BUY THESE SECURITIES IN ANY JURISDICTION WHERE THE OFFER OR SALE IS NOT PERMITTED. |
| | 163 | |
| Structural and Collateral Term Sheet | | BMO 2022-C3 |
| |
| No. 15 – Home2 Suites & Holiday Inn Express Phoenix Portfolio |
| (3) | TTM represents the trailing 12-month period ending June 30, 2022, from the STR Report. |
| Historical Occupancy, ADR, RevPAR(1) |
| | Competitive Set(2) | Holiday Inn Express | Penetration Factor |
| Year | Occupancy | ADR | RevPAR | Occupancy | ADR | RevPAR | Occupancy | ADR | RevPAR |
| 2021 | 69.2% | $100.06 | $69.26 | 55.9% | $99.76 | $55.73 | 80.7% | 99.7% | 80.5% |
| TTM(3) | 75.9% | $123.43 | $93.69 | 73.6% | $122.87 | $90.46 | 97.0% | 99.5% | 96.6% |
| (1) | Data obtained from STR reports. |
| (2) | The competitive set consists of the following hotels: Holiday Inn & Suites Phoenix Airport North, Hampton Inn Phoenix-Airport North, aloft Hotel Phoenix-Airport, Hilton Garden Inn Phoenix Airport North and Fairfield Inn & Suites Phoenix Tempe/Airport. |
| (3) | TTM represents the trailing 12-month period ending June 30, 2022, from the STR report. |
COVID-19 Update. As of the date of this term sheet, the Home2 Suites & Holiday Inn Express Phoenix Portfolio Properties is open and operating. As of August 26, 2022, the Home2 Suites & Holiday Inn Express Phoenix Portfolio Mortgage Loan was not currently subject to any modification or forbearance requests.
The Market. The Home2 Suites & Holiday Inn Express Phoenix Portfolio Properties are located in Phoenix, Arizona within Maricopa County, approximately 1 mile north of Phoenix Sky Harbor International Airport and convenient access to Downton Phoenix. Primary access to the Home2 Suites & Holiday Inn Express Phoenix Portfolio Properties is provided by Interstate 10 and State Highway 202/142, which are the closest major thoroughfares. Phoenix features a diverse economy, with presences of the healthcare industry, technology, education, finance, and government industries. Primary commercial demand generators for the Phoenix market include major corporate offices for Honeywell, General Electric, and Avnet. In 2019, prior to the onset of the COVID-19 pandemic, the Phoenix lodging market exhibited a 70.7% occupancy rate with an ADR of $133.36 and RevPAR of $94.29. As the economy has opened up, the Phoenix lodging market has seen robust growth year to date through May.
The following table presents certain information relating to the operating history and underwritten cash flows of the Home2 Suites & Holiday Inn Express Phoenix Portfolio Properties:
| Operating History and Underwritten Net Cash Flow |
| | 2021 | TTM(1) | Underwritten | Per Room | %(2) |
| Occupancy | 62.4% | 78.0% | 78.0% | | |
| ADR | $98.19 | $122.66 | $122.66 | | |
| RevPAR | $61.23 | $95.66 | $95.66 | | |
| | | | | | |
| Room Revenue | $5,519,783 | $8,624,010 | $8,624,010 | $34,915 | 98.3% |
| Other Revenue(3) | 132,809 | 152,166 | 152,166 | 616 | 1.7% |
| Total Revenue | $5,652,592 | $8,776,176 | $8,776,176 | $35,531 | 100.0% |
| | | | | | |
| Room Expense | $1,615,966 | $2,154,378 | $2,154,378 | $8,722 | 24.5% |
| Other Departmental Expenses | 72,572 | 94,279 | 94,279 | 382 | 1.1% |
| Departmental Expenses | $1,688,538 | $2,248,657 | $2,248,657 | $9,104 | 25.6% |
| | | | | | |
| Departmental Profit | $3,964,054 | $6,527,519 | $6,527,519 | $26,427 | 74.4% |
| | | | | | |
| Management Fee | $169,578 | $263,285 | $263,285 | $1,066 | 3.0% |
| Marketing and Franchise Fee | 670,833 | 1,037,671 | 1,093,990 | 4,429 | 12.5% |
| Other Undistributed Expenses | 699,166 | 942,064 | 942,064 | 3,814 | 10.7% |
| Total Undistributed Expenses | $1,539,577 | $2,243,020 | $2,299,339 | $9,309 | 26.2% |
| Gross Operating Profit | $2,424,477 | $4,284,499 | $4,228,180 | $17,118 | 48.2% |
| | | | | | ��� |
| Real Estate Taxes | $303,861 | $351,843 | $362,398 | $1,467 | 4.1% |
| Property Insurance | 83,811 | 112,635 | 168,636 | 683 | 1.9% |
| Total Other Expenses | $387,672 | $464,478 | $531,034 | $2,150 | 6.1% |
| | | | | | |
| Net Operating Income | $2,036,805 | $3,820,021 | $3,697,145 | $14,968 | 42.1% |
| FF&E | 226,104 | 351,047 | 351,047 | 1,421 | 4.0% |
| Net Cash Flow | $1,810,702 | $3,468,974 | $3,346,098 | $13,547 | 38.1% |
| (1) | TTM represents the trailing 12-month period ending June 30, 2022. |
| (2) | % column is based off Total Revenue. |
| (3) | Other Revenue includes meeting room rentals, market pantry sales, guest laundry operations and in-room internet. |
THE INFORMATION IN THIS STRUCTURAL AND COLLATERAL TERM SHEET IS NOT COMPLETE AND MAY BE AMENDED PRIOR TO THE TIME OF SALE. THIS TERM SHEET IS NOT AN OFFER TO SELL THESE SECURITIES AND IT IS NOT A SOLICITATION OF AN OFFER TO BUY THESE SECURITIES IN ANY JURISDICTION WHERE THE OFFER OR SALE IS NOT PERMITTED. |
| | 164 | |
| Structural and Collateral Term Sheet | | BMO 2022-C3 |
| |
| Contacts |
| BMO Capital Markets CMBS Capital Markets & Banking |
| Contact | E-mail | Phone Number |
| Paul Vanderslice | paul.vanderslice@bmo.com | (203) 451-4151 |
| Managing Director | | |
| | | |
| David Schell | david.schell@bmo.com | (201) 723-4872 |
| Managing Director | | |
| | | |
| Ravish Kamath | ravish.kamath@bmo.com | (860) 771-0788 |
| Director | | |
| | | |
| BMO Capital Markets CMBS Trading & Structuring |
| Contact | E-Mail | Phone Number |
| Andrew Noonan | andrew.noonan@bmo.com | (646) 658-3932 |
| Managing Director | | |
| | | |
| Mary Kunka | mary.kunka@bmo.com | (201) 247-4182 |
| Managing Director | | |
| | | |
| Kiran Manda | kiran.manda@bmo.com | (347) 831-4776 |
| Managing Director | | |
| | | |
| Michael Chen | lei4.chen@bmo.com | (718) 869-0700 |
| Director | | |
| | | |
| BMO Capital Markets Securitized Products Syndicate |
| Contact | E-Mail | Phone Number |
| Alex Smith-Constantine | alex.smithconstantine@bmo.com | (212) 702-1866 |
| Managing Director | | |
| | | |
| Trinian Donohoe | trinian.donohoe@bmo.com | (212) 702-1866 |
| Vice President | | |
| | | |
| UBS CMBS Capital Markets and Banking |
| Contact | E-Mail | Phone Number |
| Nicholas Galeone | nicholas.galeone@ubs.com | (212) 891-5702 |
| Managing Director | | |
| | | |
| Siho Ham | siho.ham@ubs.com | (212) 713-1278 |
| Executive Director | | |
| | | |
| Michael Barbieri | michael.barbieri@ubs.com | (212) 713-1181 |
| Executive Director | | |
| | | |
| UBS CMBS Trading and Syndicate |
| Contact | E-Mail | Phone Number |
| Stephen Gargiulo | stephen.gargiulo@ubs.com | (212) 713-6189 |
| Managing Director | | |
| | | |
| Citigroup CMBS Capital Markets and Securitization |
| Contact | E-Mail | Phone Number |
| Rick Simpson | richard.simpson@citi.com | (212) 816-5343 |
| Managing Director | | |
| | | |
| Jason Mercandetti | jason.mercandetti@citi.com | (212) 816-6384 |
| Director | | |
| | | |
| Citigroup Structuring, Trading & Syndicate |
| Contact | E-Mail | Phone Number |
| Raul Orozco | raul.d.orozco@citi.com | (212) 723-1295 |
| Managing Director | | |
| | | |
| Mattison Perry | mattison.perry@citi.com | (212) 723-1295 |
| Director | | |
| | | |
| | | |
| THE INFORMATION IN THIS STRUCTURAL AND COLLATERAL TERM SHEET IS NOT COMPLETE AND MAY BE AMENDED PRIOR TO THE TIME OF SALE. THIS TERM SHEET IS NOT AN OFFER TO SELL THESE SECURITIES AND IT IS NOT A SOLICITATION OF AN OFFER TO BUY THESE SECURITIES IN ANY JURISDICTION WHERE THE OFFER OR SALE IS NOT PERMITTED. |
| | | |
| | 165 | |